Preventive Nutrition, 3rd Edition
985
-
Upload
khangminh22 -
Category
Documents
-
view
0 -
download
0
Transcript of Preventive Nutrition, 3rd Edition


PREVENTIVE NUTRITION
THIRD EDITION

NUTRITION � AND � HEALTH
Adrianne Bendich, Series Editor
Calcium in Human Health, edited by Connie M. Weaver and Robert P. Heaney, 2005Preventive Nutrition: The Comprehensive Guide for Health Professionals, Third
Edition, edited by Adrianne Bendich and Richard J. Deckelbaum, 2005Nutrients, Stress, and Medical Disorders, edited by Shlomo Yehuda and David I.
Mostofsky, 2005The Management of Eating Disorders and Obesity, Second Edition, edited by David J.
Goldstein, 2005Nutrition and Oral Medicine, edited by Riva Touger-Decker, David A. Sirois, and
Connie C. Mobley, 2005IGF and Nutrition in Health and Disease, edited by M. Sue Houston, Jeffrey M. P.
Holly, and Eva L. Feldman, 2005Epilepsy and the Ketogenic Diet, edited by Carl E. Stafstrom and Jong M. Rho, 2004Handbook of Drug–Nutrient Interactions, edited by Joseph I. Boullata and Vincent T.
Armenti, 2004Nutrition and Bone Health, edited by Michael F. Holick and Bess Dawson-Hughes,
2004Diet and Human Immune Function, edited by David A. Hughes, L. Gail Darlington,
and Adrianne Bendich, 2004Beverages in Nutrition and Health, edited by Ted Wilson and Norman J. Temple, 2004Handbook of Clinical Nutrition and Aging, edited by Connie Watkins Bales and
Christine Seel Ritchie, 2004Fatty Acids: Physiological and Behavioral Functions, edited by David I. Mostofsky,
Shlomo Yehuda, and Norman Salem, Jr., 2001Nutrition and Health in Developing Countries, edited by Richard D. Semba and
Martin W. Bloem, 2001Preventive Nutrition: The Comprehensive Guide for Health Professionals, Second
Edition, edited by Adrianne Bendich and Richard J. Deckelbaum, 2001Nutritional Health: Strategies for Disease Prevention, edited by Ted Wilson
and Norman J. Temple, 2001Clinical Nutrition of the Essential Trace Elements and Minerals: The Guide for
Health Professionals, edited by John D. Bogden and Leslie M. Klevey, 2000Primary and Secondary Preventive Nutrition, edited by Adrianne Bendich
and Richard J. Deckelbaum, 2000The Management of Eating Disorders and Obesity, edited by David J. Goldstein, 1999Vitamin D: Physiology, Molecular Biology, and Clinical Applications, edited by
Michael F. Holick, 1999Preventive Nutrition: The Comprehensive Guide for Health Professionals,
edited by Adrianne Bendich and Richard J. Deckelbaum, 1997

PREVENTIVE NUTRITIONTHE COMPREHENSIVE GUIDE FOR HEALTH PROFESSIONALS
THIRD EDITION
Edited by
ADRIANNE BENDICH, PhD, FACNGlaxoSmithKline, Parsippany, NJ
and
RICHARD J. DECKELBAUM, MD, FRCP(C)College of Physicians and Surgeons, Columbia University,New York, NY
Foreword by
ALFRED SOMMER, MD, MHSJohns Hopkins Bloomberg School of Public Health,Johns Hopkins University, Baltimore, MD

© 2005 Humana Press Inc.999 Riverview Drive, Suite 208Totowa, New Jersey 07512
www.humanapr.com
All rights reserved. No part of this book may be reproduced, stored in a retrieval system, or transmitted in any form or by anymeans, electronic, mechanical, photocopying, microfilming, recording, or otherwise without written permission from the Publisher.
All papers, comments, opinions, conclusions, or recommendations are those of the author(s), and do not necessarily reflect the views of thepublisher.
Due diligence has been taken by the publishers, editors, and authors of this book to assure the accuracy of the information publishedand to describe generally accepted practices. The contributors herein have carefully checked to ensure that the drug selections anddosages set forth in this text are accurate and in accord with the standards accepted at the time of publication. Notwithstanding, asnew research, changes in government regulations, and knowledge from clinical experience relating to drug therapy and drug reactionsconstantly occurs, the reader is advised to check the product information provided by the manufacturer of each drug for any changein dosages or for additional warnings and contraindications. This is of utmost importance when the recommended drug herein is anew or infrequently used drug. It is the responsibility of the treating physician to determine dosages and treatment strategies forindividual patients. Further it is the responsibility of the health care provider to ascertain the Food and Drug Administration statusof each drug or device used in their clinical practice. The publisher, editors, and authors are not responsible for errors or omissionsor for any consequences from the application of the information presented in this book and make no warranty, express or implied, withrespect to the contents in this publication.
Cover design by Patricia F. ClearyProduction Editor: Robin B. Weisberg
For additional copies, pricing for bulk purchases, and/or information about other Humana titles,contact Humana at the above address or at any of the following numbers: Tel.: 973-256-1699;Fax: 973-256-8341; E-mail: [email protected] or visit our website at http://humanapress.com
This publication is printed on acid-free paper. �ANSI Z39.48-1984 (American National Standards Institute) Permanence of Paper for Printed Library Materials.
Photocopy Authorization Policy:Authorization to photocopy items for internal or personal use, or the internal or personal use of specific clients is granted by HumanaPress, provided that the base fee of US $30.00 per copy is paid directly to the Copyright Clearance Center (CCC), 222 Rosewood Dr.,Danvers MA 01923. For those organizations that have been granted a photocopy license from the CCC, a separate system of paymenthas been arranged and is acceptable to the Humana Press. The fee code for users of the Transactional Reporting Service is 1-58829-445-5/05 $30.00.
Printed in the United States of America. 10 9 8 7 6 5 4 3 2 1
eISBN 1-59259-880-3
Library of Congress Cataloging-in-Publication Data
Preventive nutrition : the comprehensive guide for health professionals /edited by Adrianne Bendich and Richard J. Deckelbaum ; foreword by AlfredSommer.-- 3rd ed. p. ; cm. -- (Nutrition and health) Includes bibliographical references and index. ISBN 1-58829-445-5 (alk. paper) 1. Nutrition. 2. Medicine, Preventive. 3. Nutritionally induced diseases--Prevention.4. Diet therapy. [DNLM: 1. Nutrition. 2. Diet. 3. Nutrition Therapy. 4. NutritionalStatus. 5. Primary Prevention. QU 145 P944 2005] I. Bendich, Adrianne.II. Deckelbaum, Richard J. III. Series: Nutrition and health (Totowa, N.J.) RM216.P778 2005 615.8'54--dc22
2004021931

Dedication
v
AB dedicates this volume to her husband, David Kafkewitz, PhD,wth deepest gratitude for his unconditional support and understanding.
Richard J. Deckelbaum dedicates this volume to William and Katya,and the rest of our family and friends.


vii
Series Editor’s Introduction
The Nutrition and Health Series of books has had great success because each volumehas the consistent overriding mission of providing health professionals with texts that areessential since each includes (1) a synthesis of the state of the science; (2) timely, in-depthreviews by the leading researchers in their respective fields; (3) extensive, up-to-date,fully annotated reference lists; (4) a detailed index; (5) relevant tables and figures; (6)identification of paradigm shifts and their consequences; (7) virtually no overlap ofinformation between chapters, but targeted, interchapter referrals; (8) suggestions ofareas for future research; and (9) balanced, data-driven answers to patient as well ashealth professionals’ questions that are based on the totality of evidence rather than thefindings of any single study.
The series volumes are not the outcome of a symposium. Rather, each editor has thepotential to examine a chosen area with a broad perspective, both in subject matter as wellas in the choice of chapter authors. The editors, whose trainings are both research- andpractice-oriented, have the opportunity to develop a primary objective for each book,define its scope and focus, and then invite the leading authorities to be part of theirinitiative. The authors are encouraged to provide an overview of the field, discuss theirown research and relate the research findings to potential human health consequences.Because each book is developed de novo, the chapters are coordinated so that the resultingvolume imparts greater knowledge than the sum of the information contained in theindividual chapters. Many of the books in the series come with a complementary copy ofthe book on a CD; recently published books are available as e-books and individualchapters of the e-books are also now available from Humana Press’ website,Humanapress.com
Preventive Nutrition: The Comprehensive Guide to Health Professionals, ThirdEdition, edited by me and Richard Deckelbaum remains the flagship volume of the seriesand continues to improve with each edition. The first edition, published in 1997, waswidely acclaimed for its emphasis on data-driven recommendations based on the totalityof the evidence that included the newest scientific discoveries and clinical applicationsin the key areas of preventive nutrition: cancer, cardiovascular disease, osteoporosis,age-related eye diseases, immune function, birth outcomes, and an international perspectiveon preventive nutrition strategies. The second edition, published in 2001, provided criticalupdates and also included new information on nutrition-related disease prevention strategies.In the same year, Richard and I also published a volume, Primary and SecondaryPreventive Nutrition, that reviewed several other clinical areas including obesity anddiabetes. In response to our readers and reviewers, we have combined the most relevantand timely chapters from these two volumes into the third edition of Preventive Nutrition.
Preventive Nutrition, Third Edition, which is now more than 900 pages of text,contains 37 chapters that help to define the areas where health professionals can improvehealth and reduce the risk of disease with dietary modifications. We have enhanced the
viii Series Editor’s Introduction
contents of the first two editions even further with the addition of 16 new chapters as wellas comprehensive updates of all of the chapters that are included in this edition. Chapterauthors are the most authoritative leaders in their various fields of expertise. The volumecontains cutting-edge chapters from 79 authors who provide a truly global perspective topreventive nutrition opportunities. In addition, Dr. Alfred Sommer, whose internationalresearch has been honored with the prestigious Lasker Award, has provided a thoughtfulForeword for our book. Thus, Richard and I have worked diligently to develop a thirdedition that is destined to be the benchmark in the field because of its extensive, in-depthchapters covering the most important aspects of preventive nutrition with emphasis onnormal human physiology and nutritional needs, analyses of epidemiological findings,in-depth and balanced discussions of clinical findings including the role of nutrients indisease treatment as well as primary and secondary disease prevention.
The book chapters are logically organized in nine sections to provide the reader witha basic understanding of the role of preventive nutrition strategies: I. Preventive NutritionOverview, II. Cancer Prevention, III. Cardiovascular Disease Prevention, IV. Diabetesand Obesity, V. Bone Diseases, VI. Prevention of Major Disabilities: Improvement inHealth Outcomes, VII. Optimal Pregnancy/Infancy Outcomes, VIII. Preventive Nutri-tion: Global Perspectives, and finally, IX. Critical Issues for the 21st Century. Thislogical sequence of chapters provides the latest information on the current standards ofpractice for clinicians, related health professionals including the dietitian, nurse, pharma-cist, physical therapist, behaviorist, psychologist, and others involved in the team effortrequired for successful treatments. This comprehensive volume also has great value foracademicians involved in the education of graduate students and postdoctoral fellows,medical students and allied health professionals who plan to interact with patients onquestions concerning the science behind the latest “study” presented on the evening newsbecause the chapters present a synthesis of the totality of the evidence, not a conclusionbased on a single study.
In-depth, balanced reviews of the current science behind questions related to topicssuch as soy; vitamin supplements; fat substitutes; DHA; trans-fatty acids; carotenoids,such as lycopene and lutein; and numerous other dietary components, provide health careprofessionals and students with excellent, well-referenced answers. Medically relatedprofessionals will certainly find the chapters dealing with obesity across the age span, andincluding the genetic components of related diseases, of particular importance to theirpractice. Additional chapters provide in-depth reviews of the functions of vitamins andminerals and other dietary factors in the endocrine, cardiovascular, respiratory,gastrointestinal, immune, skeletal, and ocular systems of the body. Obesity is a criticalconcern for virtually every health professional. The third edition has an expanded sectionon obesity and diabetes that includes important aspects of childhood obesity. There is aclear, data-driven message throughout the obesity section of the volume that obesity isa chronic disease. The volume is of particular importance because it includes understand-able chapters in highly technical areas written by the leading authorities who are actuallyworking in the areas of research discussed in their chapters.
Of added value to health care professionals who are interested in public health is theexceptional introductory chapter that places preventive nutrition in its historic perspec-tive and goes on to project the enormous potential for preventive strategies to reduce

human suffering. This chapter is balanced with the final book chapter that provides apractical approach to determining the economic value of adopting a number of the pre-ventive nutrition strategies discussed throughout the volume. An often-overlookeddietary component, alcohol, is critically examined in a separate chapter, as it can well bea double-edged sword and can impact diseases and conditions that would otherwise bebeneficially affected by implementing preventive nutrition strategies. Other unique chap-ters examine the national differences in the consumer messages that are permitted fordietary factors and the current status of nutrition education in medical schools. Of greatimportance, the authors have provided chapters that balance the most technical informa-tion with discussions of its importance for clients and patients as well as graduate andmedical students, health professionals, and academicians.
The third edition of Preventive Nutrition continues to serve as a major resource oninternational nutrition because the volume includes important chapters about implemen-tation strategies from leading experts about national interventions in Europe, Asia, andAfrica. Prior editions were so well accepted by those interested in the impact of nutritionon world health, in part because of this unique section on global perspectives. In thecurrent edition, this section examines the successes and consequent public health impli-cations of national preventive nutrition strategies, not only in the United States andEurope, but also in “Westernizing” nations and developing countries. Updates fromNorway and Chile that were first provided in the 1997 edition are now included in thethird edition. Also updated is the chapter that examines the potential health benefits to theUnited States with adoption of preventive nutrition strategies. There are two insightfulchapters on the growing presence of obesity in Latin America and Japan and how theWesternization of eating habits has negatively impacted the health of these nations.
Hallmarks of all chapters include bulleted key points at the beginning of each chapteras well as a detailed table of contents; complete definitions of terms with the abbrevia-tions fully defined for the reader, and consistent use of terms between chapters. There arenumerous relevant tables, graphs, and figures as well as up-to-date references; all chap-ters include a conclusion section that provides the highlights of major findings. Eachchapter ends with a recommendations section that helps to guide the reader to data-driven, balanced advice for their students, clients, and/or patients. The volume containsa highly annotated index and within chapters, readers are referred to relevant informationin other chapters.
In conclusion, Preventive Nutrition: The Comprehensive Guide for Health Professionals,Third Edition provides health professionals in many areas of research and practice withthe most up-to-date, well-referenced and easy-to-comprehend volume on the importanceof understanding the current strategies for enhancing health and preventing diseasethrough the implementation of well-accepted and highly recommended preventive nutri-tion options. This volume will serve the reader as the benchmark in the nutrition field, asit stands as the most authoritative resource to date on prevention, and is a very welcomeaddition to the Nutrition and Health Series.
Adrianne Bendich, PhD, FACN
Series Editor
Series Editor’s Introduction ix


Foreword
xi
Why a third edition of Preventive Nutrition, and only a few years after the second?Because the public has developed an insatiable appetite for advice on what foods to eatand supplements to take, a phenomenon fed in large part by the sensationalist hype everynew “study” receives from the media. And the media are being fed with tantalizing newdata and claims at an accelerating rate.
Unfortunately, although people and policymakers want definitive recommendations,the vast outpouring of new data arrives in fragmentary (and often contradictory) bites, fartoo messy for the individual health professional to assimilate. By synthesizing these latestdata and integrating them into the broad body of existing information, Preventive Nutritiongoes a long way toward orienting health professionals to the field and guiding the advicethey give their patients and the public.
No one can seriously doubt the impact that nutrition has on health—well beyond theclassical deficiency syndromes described in the past (xerophthalmia, anemia, scurvy,pellagra). Recognition of the role of saturated fats in coronary artery disease led to adramatic change in America’s dietary habits and a halving of the incidence of fatal heartattacks. Public health interventions don’t get much better than that.
More recently, the surprising discovery that preconceptional folate supplements couldsignificantly reduce the incidence of neural tube defects resulted in the mandatoryfortification of cereal flour, which led to a significant reduction in the incidence of thisdevastating congenital defect. An outpouring of new studies suggest potential benefitsfrom a host of nutritional interventions for chronic diseases—critically important, givengreater longevity and aging of virtually all the world’s populations. Some, like the needfor increased calcium to reduce the soaring rates of osteoporosis, are well established,even if the ideal formulation (and concurrent use of drugs to the same end) is still beingstudied and the recommendations refined. Others, like zinc and antioxidant supplemen-tation to retard progression of macular degeneration, the leading cause of irreversibleblindness, now have the support of a rigorous randomized trial, which also, importantly,defined the small, specific group in which this proved beneficial.
But not all the “news” is necessarily true—at least not the way it is first perceived.Many of our most important and much-ballyhooed insights arise from observationalstudies: people who eat more salads and vegetables purportedly have lower risks ofcertain cancers; those consuming more fiber appear to have a lower risk of colon cancer.Although that might be so, randomized clinical trials have failed to demonstrate thatchanging the intake of these dietary factors actually altered the risk of disease. The “bestavailable evidence” is often less than we would prefer; and, as is often the case, recom-mendations and policies are made with less than adequate data.
Of course some “truths” don’t require randomized trials, but what we do about themdo. Today’s growing epidemic of obesity, already fueling a secondary epidemic of “adult”
xii Foreword
onset of diabetes among adolescents, is clearly fueled by increased intake of calorie-dense foods coupled with a sedentary lifestyle—and not just in the developed world.But instead of reducing the amount of food they consume and getting more exercise,inaccurately referred to as “simple lifestyle changes,” the small part of the public thatactually cares at all about its nutritional health and waistline has fixated instead onelaborate new dietary fetishes, whether “Atkins,” “South Beach,” or “The Zone.” Dothese really work? Are they safe? How should health professionals and policymakersrecommend intercepting our collective corpulence in ways that are proven safe andeffective for the populace as a whole?
The plethora of information emanating from molecular biology on the one hand andepidemiological and clinical studies on the other have provided, and will ultimatelyprovide, the basis for rational, evidence-based nutritional “prescriptions” for better health.People seek (and deserve) the best advice available from their health professionals. Giventhe growing numbers of chronic diseases and the direct and indirect costs associated withthem, relatively inexpensive nutritional interventions need to be discovered, promul-gated, and actually employed. This latest edition of Preventive Nutrition provides acomprehensive integration of the best available data on the role of nutrition in health. Itis an excellent place to discover what still needs scientific inquiry and what healthprofessionals might reasonably advise their patients and the public.
Alfred Sommer, MD, MHS
Johns Hopkins Bloomberg School of Public HealthJohns Hopkins University, Baltimore, MD

Preface
xiii
Preventive Nutrition was first published in 1997; the second edition appeared in 2001.Also in 2001, we edited a volume entitled Primary and Secondary Preventive Nutrition.Both texts were very well accepted as critical resources for medical school libraries andhealth care professionals including physicians, nutritionists, dietitians, nurses, and phar-macists. The volumes were also used by many academic researchers as the basis fordeveloping graduate courses in preventive nutrition; Preventive Nutrition has beenadopted as a text in many of the most highly rated graduate nutrition programs in theUnited States, Europe, South America, and Asia. The overall goal of the third edition ofPreventive Nutrition is to combine and update chapters of excellence that were includedin the first and second editions of Preventive Nutrition, as well as critical chapters fromPrimary and Secondary Preventive Nutrition and to add new chapters that emphasize thecritical role of nutrition in a growing number of health arenas.
In the third edition we provide health professionals with up-to-date, comprehensivereviews that evaluate the dietary practices and interventions that have been shown toreduce disease risk and/or to improve health outcomes. Evidence-based nutritional inter-ventions are a critical component of preventive medicine approaches to prevent anincreasing number of diseases and diminish their consequences. Within the past decade,many studies have demonstrated the potential for optimizing macro- and micronutrientintakes to improve not only individual outcomes throughout the life cycle, from fetaldevelopment to the aging process, but also to reduce individual and national health carecosts.
This third edition is more comprehensive that the previous volumes. The averagenumber of chapters for each of the three previous volumes was 25; this edition contains37 chapters. Several chapters that first appeared in Primary and Secondary PreventiveNutrition have been revised and are therefore new subject areas for Preventive Nutrition,Third Edition. The volume is divided into the following nine sections: I. PreventiveNutrition Overview; II. Cancer Prevention; III. Cardiovascular Disease Prevention; IV.Diabetes and Obesity; V. Bone Diseases; VI. Prevention of Major Disabilities: Improve-ment in Health Outcomes; VII. Optimal Pregnancy/Infancy outcomes; VIII. PreventiveNutrition: Global Perspectives, and finally, IX. Critical Issues for the 21st Century. Thenumbers of chapters in each section are well balanced, contain numerous comprehensivetables and clearly labeled figures, and reflect the major areas of recent research importantto health professionals. Also new to this edition is the inclusion of Key Points at thebeginning of each chapter that define the chapter’s critical learning points for the reader.The third edition of Preventive Nutrition continues to include a comprehensive index aswell as helpful listings of relevant books, journals, and websites.
There is a new introductory chapter that provides an historic perspective as well asinsight into the future economic consequences of adopting a preventive nutrition strategyto improve health. In the section on cancer, there is a comprehensive updating of the

xiv Preface
components in the diet that affect cancer risk, including an overview on informationrelating to cancers of the esophagus and stomach. There are new chapters on tomatoes,lycopene and prostate cancer, soy and cancer prevention, and dietary supplement use andtheir effects on cancer risk. The “new” research on dietary components that are notconsidered to have traditional “essential nutritional value” but have been shown to haveimportant health consequences, such as fiber, specific long-chain fatty acids, non-provitaminA carotenoids, and other phytochemicals, are placed in perspective with regard to theavailable knowledge to date by expert authors who are the leaders in their fields.
In the cardiovascular disease section, there are comprehensive revisions to the chap-ters on iron, homocysteine, and the long-chain omega-3 fatty acids. Within the pastdecade, there have been several critical intervention studies that examined the potentialfor antioxidants from supplements to reduce cardiovascular disease risks as well asmyocardial infarction, vascular pathology, and ultimately mortality. A new chapterreviews the totality of the evidence on the effects of antioxidant supplements on cardio-vascular outcomes.
Diabetes and obesity are major health concerns that are significantly impacted by dietand dietary components. We have included this key section from the Primary andSecondary Preventive Nutrition volume as well as five distinctive chapters by leadingclinical authorities in obesity and diabetes research. There is a comprehensive chapter ontrans fats; another that addresses the current epidemic of childhood and adolescentobesity and insulin resistance followed by two provocative chapters on prevention ofchildhood obesity—one that examines clinical programs, the other with a more publichealth perspective. Lastly, there is a chapter on the impact of weight reduction on decreas-ing chronic disease-related risk factors.
Bone diseases affect millions of adults and not only seniors. We include separatechapters on osteoarthritis (a new chapter) and osteoporosis, and another new chapter onanti-osteoporosis medications . The latter stresses the requirements for calcium, vitaminD, and other nutrients to achieve the full efficacy of these drugs.
In the section on the prevention of major disabilities, there is a new chapter on cataractprevention and the role of antioxidants. There are updated chapters on the importance ofantioxidant nutrients in the prevention of diseases resulting from oxidative stress, anotherthat includes recent studies on the importance of micronutrients in maintaining theimmune function of healthy older adults, and an updated chapter on the impact of vitaminA on the immune function of the very young, stressing the developing countries. A newchapter reports on recent studies that explored the potential for a century-old interven-tion, cod liver oil, to reduce the risk of respiratory infections in urban children from theUnited States.
Another major objective of this volume is to examine key research linking nutritionalstatus with the prevention of birth defects and optimization of birth outcomes. This areais gaining in importance as birth weight and size are being linked to risk of chronicdiseases in adulthood. One of the critical nutrient-based discoveries of the last century isthe ability to prevent neural tube birth defects by folic acid supplementation. The updatedchapter contains the latest data that confirm and strengthen the original findings thatpericonceptional supplementation with a folic acid-containing prenatal supplementsignificantly reduced the risk of first time neural tube birth defects as well as cardiovascular

and other serious birth defects. There is a revised chapter on the significant associationbetween micronutrient status and risk of preterm delivery and low birth-weightoutcomes. This chapter is complemented by the new chapter on the relevance of measuresof maternal thinness for predicting economic crisis in a nation. The final chapter in thissection deals with an update of another of the major nutritional advances of the last fewdecades, the essentiality of long-chain omega-3 fatty acids for the optimal developmentof the brain and the retina of the fetus and the vision and intellectual capacity of thenewborn.
Preventive Nutrition has been so well accepted by those interested in the impact ofnutrition on world health in part because of the unique section on global perspectives.This section examined the successes and consequent public health implications ofnational preventive nutrition strategies, not only in the United States and Europe, but alsoin “Westernizing” nations and developing countries. A number of these chapters did notappear in the second edition. We have gone back to the authors of these valuable chapters.We are very pleased to include updates of data from Norway and Chile that were firstprovided in the 1997 edition, and are now included in the third edition. Also updated isthe chapter that examines the potential health benefits to the United States with adoptionof preventive nutrition strategies. There are two insightful chapters on the growing pres-ence of obesity in Latin America and Japan and how westernization of eating habits hasnegatively impacted the health of these nations.
The final section of this comprehensive volume is also new to Preventive Nutrition andexamines critical nutritionally related issues for the 21st century. There is an in-depthlook at the role of alcohol consumption and whether the benefits outweigh the risks.Another important addition to the volume is the comprehensive chapter that examines theeffects of drug–nutrient interactions from many different perspectives. These interac-tions become increasingly important as our society ages and uses many drugs daily, allof which have some impact on nutritional status. The last three chapters serve as veryuseful resources to many of our readers. In the United States, the government regulationof foods and dietary supplements is complex and evolving; thus we include a chapter onthe current status of the regulations and the health claims that have emerged in the lastdecade. Many of our readers are involved in the development of curricula for graduateand medical schools, and there is a chapter on the current level of nutrition educationprovided in the US medical schools. Finally, we include a chapter that examines the linkthroughout the life cycle between health and economic value of preventive nutritionstrategies in individuals, communities, and/or nations. This last chapter completes thecircle and brings us back to the very first chapter that described the historic perspectiveon nutrition strategies that prevent chronic diseases and improve human health.
The third edition provides access to practicing health professionals, includingphysicians, nutritionists, dentists, pharmacists, dietitians, health educators, policymakers,and research investigators to the considerable recent research demonstrating that theonset of major diseases can be prevented, or at least delayed, with simple nutritionalapproaches. Many health professionals are frequently asked about recent findings onvitamins or other nutrients presented in their local newspaper or on the evening news.Patients demand counseling from their health care providers on �-carotene, lycopene,antioxidants, soy, fiber, folate, calcium, and the myriad of bioactive phytochemicals,such as those found in garlic and other foods.
Preface xv

As the demographics of US and European populations change and become moremulticultural, it is increasingly important for health professionals to understand thenutritional backgrounds and diversities of their patients and clients. As important, theremay be significant national dietary initiatives that provide roadmaps for effective imple-mentation of preventive nutrition within an overall strategy of health improvement,especially for vulnerable members of the population, such as the poor. As editors, wehave endeavored to include the most compelling areas of nutritional research that canhave immediate impact on the health and education of our readers. We anticipate that thethird edition of Preventive Nutrition will be a valued resource to health professionals andstudents who are interested in reducing disease risk and enhancing health by implement-ing the well-documented preventive nutrition strategies outlined in this volume.
We thank Paul Dolgert and the staff at Humana Press for their confidence in our visionand their assistance in bringing this volume to fruition. We also thank Nicole Ticknor atGSK and Randy Weiss at Columbia University for their administrative support. Weremain grateful to our authors for their insightful chapters and to Dr. Alfred Sommer forhis eloquent Foreword.
Adrianne Bendich, PhD, FACN
Richard J. Deckelbaum, MD, FRCP(C)
xvi Preface

Contents
Series Editor’s Introduction ........................................................................................ vii
Foreword ....................................................................................................................... xi
Preface ........................................................................................................................ xiii
Contributors .................................................................................................................xxi
Value-Added eBook/PDA ......................................................................................... xxv
I Preventive Nutrition Overview1 Preventive Nutrition: A Historic Perspective
and Future Economic Outlook ..................................................... 3Nancy D. Ernst and J. Michael McGinnis
II Cancer Prevention2 Prevention of Cancers of the Esophagus and Stomach ................. 25
Elizabeth T. H. Fontham and L. Joseph Su
3 Non-Nutritive Components in Foods as Modifiersof the Cancer Process ................................................................. 55
Keith W. Singletary, Steven J. T. Jackson,and John A. Milner
4 Dietary Supplements and Cancer Risk: EpidemiologicalResearch and Recommendations ................................................ 89
Marian L. Neuhouser, Ruth E. Patterson, Alan R. Kristal,and Emily White
5 Soy Consumption and Cancer Prevention:A Critical Review ...................................................................... 123
Jin-Rong Zhou and John W. Erdman, Jr.
6 Tomato, Lycopene, and Prostate Cancer ..................................... 157Jessica K. Campbell and John W. Erdman, Jr.
III Cardiovascular Disease Prevention7 Iron and Heart Disease: A Review of the Epidemiological
Data........................................................................................... 173Christopher T. Sempos, Richard F. Gillum,
and Anne C. Looker
8 Homocysteine, Folic Acid, and Cardiovascular Disease Risk .... 191Shirley A. A. Beresford and Arno G. Motulsky
9 n-3 Fatty Acids from Fish and Plants: Primary and SecondaryPrevention of Cardiovascular Disease .................................... 221
William E. Connor and Sonja L. Connor
xvii

xviii Contents
10 Antioxidant Vitamin Supplementationand Cardiovascular Disease ..................................................... 245
Howard N. Hodis, Wendy J. Mack, and Alex Sevanian
11 Health Effects of Trans Fatty Acids ............................................. 279Ronald P. Mensink and Susanne H. F. Vermunt
IV Diabetes and Obesity12 Obesity and Insulin Resistance in Childhood
and Adolescence ....................................................................... 293Erik Bergström and Olle Hernell
13 Prevention of Pediatric Obesity: Examining the Issuesand Forecasting Research Directions...................................... 321
Myles S. Faith, Christina J. Calamaro, Angelo Pietrobelli,Meredith S. Dolan, David B. Allison,and Steven B. Heymsfield
14 Can Childhood Obesity Be Prevented?: Preschool Nutritionand Obesity ............................................................................... 345
Christine L. Williams15 Obesity and Chronic Disease: Impact of Weight Reduction ........ 383
Henry I. Frier and Harry L. Greene
V Bone Diseases16 Osteoarthritis: Role of Nutrition and Dietary Supplement
Interventions ............................................................................. 405Timothy E. McAlindon
17 Calcium Requirements During Treatment of Osteoporosisin Women .................................................................................. 425
Richard Eastell
18 Osteoporosis: Protein, Minerals, Vitamins,and Other Micronutrients ......................................................... 433
Robert P. Heaney
VI Prevention of Major Disabilities: Improvementin Health Outcomes19 Antioxidant Status and Risk for Cataract .................................... 463
Mark Siegal, Chung-Jung Chiu, and Allen Taylor
20 Antioxidant Nutrients and Preventionof Oxidant-Mediated Diseases ................................................. 505
Ronald Anderson
21 Nutritional Supplements and Upper Respiratory TractIllnesses in Young Children in the United States .................... 521
Linda A. Linday
22 Micronutrients and Immunity in Older People ............................ 551John D. Bogden and Donald B. Louria

23 Vitamin A and the Prevention of Morbidity, Mortality,and Blindness ............................................................................ 573
Richard D. Semba
VII Optimal Pregnancy/Infancy Outcomes24 Folic Acid-Containing Multivitamins and Primary Prevention
of Birth Defects ........................................................................ 603Andrew E. Czeizel
25 Maternal Nutrition and Preterm Delivery .................................... 629Theresa O. Scholl
26 Dietary Polyunsaturated Fatty Acids for OptimalNeurodevelopment: Recommendations for PerinatalNutrition .................................................................................... 665
Ricardo Uauy, Patricia Mena, Adolfo Llanos,and Patricio Peirano
27 Micronutrient Deficiencies and Maternal Thinness:First Chain in the Sequence of Nutritional and HealthEvents in Economic Crises ....................................................... 689
Martin W. Bloem, Saskia de Pee, and Ian Darnton-Hill
VIII Preventive Nutrition: Global Perspectives28 Potential Benefits of Preventive Nutrition Strategies:
Lessons for the United States ................................................... 713Walter C. Willett
29 Nutrition and Food Policy in Norway: Effects on Reductionof Coronary Heart Disease ...................................................... 735
Kaare R. Norum, Gunn-Elin A. Bjørneboe, Arne Oshaug,Grete Botten, and Lars Johansson
30 Prevention of Malnutrition in Chile ............................................. 753Fernando Mönckeberg Barros
31 Effect of Westernization of Nutritional Habitson Obesity Prevalence in Latin America: Analysisand Recommendations .............................................................. 771
Jaime Rozowski, Oscar Castillo, and Manuel Moreno
32 Effects of Western Diet on Risk Factors of ChronicDiseases in Asia ........................................................................ 791
Kaichi Kida, Koji Takemoto, Sei Won Yang,and Supawadee Likitmaskul
IX. Critical Issues for the 21st Century33 Alcohol: The Balancing Act ......................................................... 807
William E. M. Lands34 Influence of Medication on Nutritional Status ............................ 833
Joseph I. Boullata
Contents xix

xx Contents
35 Health Claims for Foods and Dietary Supplements:Current and Emerging Policies ............................................... 869
Annette Dickinson
36 Teaching Preventive Nutrition in Medical Schools ..................... 889Martin Kohlmeier and Steven H. Zeisel
37 Preventive Nutrition Throughout the Life Cycle:A Cost-Effective Approach to Improved Health ...................... 901
Adrianne Bendich and Richard J. Deckelbaum
Appendix A: Related Readings ................................................................................. 923
Appendix B: Web Sites of Interest ............................................................................ 927
Index ........................................................................................................................... 931

Contributors
DAVID B. ALLISON, PhD • Section on Statistical Genetics, Department of Biostatistics,and Clinical Nutrition Research Center, Department of Nutrition Sciences,University of Alabama at Birmingham, Birmingham, AL
RONALD ANDERSON, PhD • Medical Research Council Unit for Inflammationand Immunity Department of Immunology, Faculty of Health Sciences, Universityof Pretoria, South Africa
FERNANDO MÖNCKEBERG BARROS, MD • Faculty of Health Science, Diego Portales University,Santiago, Chile
ADRIANNE BENDICH, PhD, FACN • Medical Affairs Department, GlaxoSmithKline,Parsippany, NJ
SHIRLEY A. A. BERESFORD, PhD • Department of Epidemiology, University of Washington,Seattle, WA
ERIK BERGSTRÖM, MD • Department of Clinical Sciences, Pediatrics, Umeå University,Umeå, Sweden
GUNN-ELIN A. BJØRNEBOE, PhD, MD • Directorate for Health and Social Affairs, Oslo,Norway
MARTIN W. BLOEM, PhD • Helen Keller International Regional Office Asia Pacific,Singapore
JOHN D. BOGDEN, PhD • Department of Preventive Medicine and Community Health,UMDNJ-New Jersey Medical School, Newark, NJ
GRETE BOTTEN, PhD, MD • Center for Health Administration, University of Oslo,Norway
JOSEPH I. BOULLATA, PharmD, BCNSP • School of Pharmacy, Temple University, Philadelphia,PA
CHRISTINA J. CALAMARO, RN • University of Pennsylvania School of Medicine, Philadelphia,PA
JESSICA K. CAMPBELL, PhD • Department of Food Science and Human Nutrition,University of Illinois at Urbana-Champaign, Urbana, IL
OSCAR CASTILLO, MSc • Department of Nutrition, Pontifical Catholic University ofChile, Santiago, Chile
CHUNG-JUNG CHIU, DDS, PhD • Laboratory for Nutrition and Vision research, USDAHuman Nutrition Research Center on Aging, Tufts University, Boston, MA
SONJA L. CONNOR, MS, RD, LD • Department of Endocrinology, Diabetes and ClinicalNutrition, Oregon Health & Science University, Portland, OR
WILLIAM E. CONNOR, MD • Department of Endocrinology, Diabetes and ClinicalNutrition, Oregon Health & Science University, Portland, OR
ANDREW E. CZEIZEL, MD • Foundation for the Community Control of HeredityDiseases, Budapest, Hungary
IAN DARNTON-HILL, PhD • Nutrition Department, UNICEF New York, New York, NY
xxi

RICHARD J. DECKELBAUM, MD, FRCP(C) • Institute of Nutrition, College of Physiciansand Surgeons, Columbia University, New York, NY
SASKIA DE PEE, MD • Helen Keller International Regional Office Asia Pacific,Singapore
ANNETTE DICKINSON, PhD • Council for Responsible Nutrition, Washington, DCMEREDITH S. DOLAN, MS, RD • Weight and Eating Disorders Program, University of
Pennsylvania School of Medicine, Philadelphia, PARICHARD EASTELL, MD, FRCP, FRCPath, FMedSci • Academic Unit of Bone Metabolism,
Division of Clinical Sciences, University of Sheffield, Sheffield, EnglandJOHN W. ERDMAN, JR., PhD • Department of Food Science and Human Nutrition,
University of Illinois at Urbana-Champaign, Urbana, ILNANCY D. ERNST, PhD • Ernst Nutrition Consulting, White Stone, VAMYLES S. FAITH, PhD • Weight and Eating Disorders Program, University of Pennsylvania
School of Medicine, Philadelphia, PAELIZABETH T. H. FONTHAM, DrPH • School of Public Health, Louisiana State University
Health Science Center, New Orleans, LAHENRY I. FRIER, PhD • Slim Fast Foods Company, West Palm Beach, FLRICHARD F. GILLUM, MD • National Center for Health Statistics, Centers for Disease
Control and Prevention, Hyattsville, MDHARRY L. GREENE, MD • Division of Endocrine and Metabolism, Department
of Internal Medicine, University of Kentucky, Lexington, KYROBERT P. HEANEY, MD • John H. Creighton University Professor, Creighton
University Medical Center, Omaha, NEOLLE HERNELL, MD • Department of Clinical Sciences, Pediatrics, Umeå University,
Umeå, SwedenSTEVEN B. HEYMSFIELD, MD • St. Luke’s Roosevelt Hospital Center, Columbia University
College of Physicians & Surgeons, New York, NYHOWARD N. HODIS, MD • Atherosclerosis Research Unit, Departments of Medicine,
Preventive Medicine, and Molecular Pharmacology and Toxicology, Keck Schoolof Medicine and School of Pharmacy, University of Southern California, LosAngeles, CA
STEVEN J. T. JACKSON, PhD • Department of Food Science and Human Nutrition,University of Illinois, Urbana, IL
LARS JOHANSSON, PhD • Directorate for Health and Social Affairs, Oslo, NorwayKAICHI KIDA, MD, PhD • Department of Pediatrics, Ehime University School
of Medicine, Shigenobu, JapanMARTIN KOHLMEIER, PhD • Department of Nutrition, School of Public Health and
School of Medicine, University of North Carolina at Chapel Hill, Chapel Hill, NCALAN R. KRISTAL, DrPH • Cancer Prevention Program, Fred Hutchinson Cancer
Research Center, Seattle, WAWILLIAM E. M. LANDS, MD • National Institute on Alcohol Abuse and Alcoholism—
Retired, Bethesda, MDSUPAWADEE LIKITMASKUL, MD • Department of Pediatrics, Siriraji Hospital
Bangkok, Thailand
xxii Contributors

LINDA A. LINDAY, MD • Department of Pediatrics, The St. Luke’s-Roosevelt HospitalCenter and The College of Physicians and Surgeons, Columbia University, NewYork; Department of Otolaryngology, The New York Eye and Ear Infirmary, NewYork, and New York Medical College, Valhalla, NY
ADOLFO LLANOS, MD, MPH • Institute of Nutrition and Food Technology, University ofChile, Santiago, Chile
ANNE C. LOOKER, PhD • National Center for Health Statistics, Centers for DiseaseControl and Prevention, Hyattsville, MD
DONALD B. LOURIA, MD • Department of Preventive Medicine and Community Health,UMDNJ-New Jersey Medical School, Newark, NJ
WENDY J. MACK • Atherosclerosis Research Unit, Department of Preventive Medicine,Keck School of Medicine, University of Southern California, Los Angeles, CA
TIMOTHY E. MCALINDON, MD, MPH • Department of Rheumatology, Tufts-New EnglandMedical Center, Boston, MA
J. MICHAEL MCGINNIS, MD, MPP • Robert Wood Johnson Foundation, Princeton, NJPATRICIA MENA, MD • Institute of Nutrition and Food Technology, University of Chile,
Santiago, ChileRONALD P. MENSINK, PhD, MSC • Department of Human Biology, Maastricht University,
Maastricht, The NetherlandsJOHN A. MILNER, PhD • Nutritional Science Research Group, National Cancer Institute,
Bethesda, MDMANUEL MORENO, MD • Department of Nutrition, Pontifical Catholic University
of Chile, Santiago, ChileARNO G. MOTULKSY, MD, SCD • Departments of Medicine and Genome Science, University
of Washington, Seattle, WAMARIAN L. NEUHOUSER, PhD, RD • Cancer Prevention Program, Fred Hutchinson
Cancer Research Center, Seattle, WAKAARE R. NORUM, PhD, MD • Institute for Nutrition Research, University of Oslo,
NorwayARNE OSHAUG, PhD • Akershus University College, NorwayRUTH E. PATTERSON, PhD, RD • Fred Hutchinson Cancer Research Center, Seattle, WAPATRICIO PEIRANO, MD, PhD • Institute of Nutrition and Food Technology, University
of Chile, Santiago, ChileANGELO PIETROBELLI, MD • University of Pennsylvania School of Medicine, Philadelphia,
PAJAIME ROZOWSKI, PhD • Department of Nutrition, Pontifical Catholic University
of Chile, Santiago, ChileTHERESA O. SCHOLL, MPH, PhD, • Department of Obstetrics and Gynecology, UMDNJ
School of Medicine, Stratford, NJRICHARD D. SEMBA, MD, MPH • Department of Ophthalmology, Johns Hopkins School
of Medicine, Baltimore, MDCHRISTOPHER T. SEMPOS, PhD • Health of the Population (HOP) Integrated Review
Group, Center for Scientific Review, National Institutes of Health, Bethesda, MD
Contributors xxiii

ALEX SEVANIAN, PhD • Atherosclerosis Research Unit, Department of Molecular Pharmacologyand Toxicology, School of Pharmacy, University of Southern California, LosAngeles, CA
MARK SIEGAL, BS • Laboratory for Nutrition and Vision Research, USDA Human Nu-trition Research Center on Aging, Tufts University, Boston, MA
KEITH W. SINGLETARY, PhD • Department of Food Science and Human Nutrition,University of Illinois, Urbana, IL
ALFRED SOMMER, MD, MHS • School of Hygiene and Public Health, Johns HopkinsUniversity, Baltimore, MD
L. JOSEPH SU, PhD • School of Public Health, Louisiana State University HealthScience Center, , New Orleans, LA
ALLEN TAYLOR, PhD • Laboratory for Nutrition and Vision Research, USDA HumanNutrition Research Center on Aging, Tufts University, Boston, MA
KOJI TAKEMOTO, MD • Department of Pediatrics, Ehime University School of Medicine,Shigenobu, Japan
RICARDO UAUY, MD, PhD • Institute of Nutrition and Food Technology, Universityof Chile, Santiago, Chile
SUSANNE H. F. VERMUNT, PhD • Unilever Health Institute, Vlaardingen, The NetherlandsEMILY WHITE, PhD • Cancer Prevention Program, Fred Hutchinson Cancer Research
Center, Seattle, WAWALTER C. WILLETT, MD • Department of Nutrition, Harvard School of Public Health,
Boston, MACHRISTINE L. WILLIAMS, MD, MPH, FAAP • Department of Pediatrics & Institute
of Human Nutrition, College of Physicians and Surgeons, Columbia University,New York, NY
SEI WON YANG, PhD • Department of Pediatrics, Seoul University Children’s Hospital,Seoul, Korea
STEVEN H. ZEISEL, MD, PhD • Department of Nutrition, School of Public Health andSchool of Medicine, University of North Carolina at Chapel Hill, Chapel Hill, NC
JIN-RONG ZHOU, PhD • Beth Israel Deaconess Medical Center, Harvard MedicalSchool, Boston, MA
xxiv Contributors

*Adobe and Reader are either registered trademarks or trademarks of Adobe SystemsIncorporated in the United States and/or other countries.
Value-Added eBook/PDA
This book is accompanied by a value-added CD-ROM that contains an Adobe eBookversion of the volume you have just purchased. This eBook can be viewed on your computer,and you can synchronize it to your PDA for viewing on your handheld device. The eBookenables you to view this volume on only one computer and PDA. Once the eBook is installedon your computer, you cannot download, install, or e-mail it to another computer; it residessolely with the computer to which it is installed. The license provided is for only one com-puter. The eBook can only be read using Adobe® Reader® 6.0 software, which is availablefree from Adobe Systems Incorporated at www.Adobe.com. You may also view the eBookon your PDA using the Adobe® PDA Reader® software that is also available free fromAdobe.com.
You must follow a simple procedure when you install the eBook/PDA that will requireyou to connect to the Humana Press website in order to receive your license. Please readand follow the instructions below:
1. Download and install Adobe® Reader® 6.0 softwareYou can obtain a free copy of Adobe® Reader® 6.0 software at www.adobe.com*Note: If you already have Adobe® Reader® 6.0 software, you do not need to reinstall
it.2. Launch Adobe® Reader® 6.0 software3. Install eBook: Insert your eBook CD into your CD-ROM drive
PC: Click on the “Start” button, then click on “Run”At the prompt, type “d:\ebookinstall.pdf” and click “OK”*Note: If your CD-ROM drive letter is something other than d: change the above com-
mand accordingly.MAC: Double click on the “eBook CD” that you will see mounted on your desktop.Double click “ebookinstall.pdf”
4. Adobe® Reader® 6.0 software will open and you will receive the message“This document is protected by Adobe DRM” Click “OK”*Note: If you have not already activated Adobe® Reader® 6.0 software, you will be prompted
to do so. Simply follow the directions to activate and continue installation.Your web browser will open and you will be taken to the Humana Press eBook registrationpage. Follow the instructions on that page to complete installation. You will need the serialnumber located on the sticker sealing the envelope containing the CD-ROM.
If you require assistance during the installation, or you would like more informationregarding your eBook and PDA installation, please refer to the eBookManual.pdf locatedon your CD. If you need further assistance, contact Humana Press eBook Support by e-mail at [email protected] or by phone at 973-256-1699.
xxv


I PREVENTIVE NUTRITION OVERVIEW


From: Preventive Nutrition: The Comprehensive Guide for Health Professionals, Third EditionEdited by: A. Bendich and R. J. Deckelbaum © Humana Press Inc., Totowa, NJ
3
1 Preventive NutritionA Historic Perspective and Future EconomicOutlook
Nancy D. Ernst and J. Michael McGinnis
KEY POINTS
● Diet and physical inactivity rank first or second in actual causes of death and the onlycauses that are a daily factor for the entire US population.
● The increasing US life expectancy, which was at an all-time high of 77.2 yr in 2001,signals that prevention of heart disease, cardiac arrest, stroke, and diabetes is a societalconcern and that preventive nutrition action can help assure that aging does not predicta worsening state of economic well-being and health.
● Mathematical models (which consider federal nutrition projects such as food label-ing, food standards, and dietary guidelines) show economic benefit from dietarychanges for a healthier diet. New nutrition label reference values and recommendednutrient fortification guidelines, developed by the Institute of Medicine and soon to beconsidered by regulatory agencies in the United States and Canada, are also likely to affectdietary change.
● The food market has responded—with innovation, technology, and advertising and hasenhanced interest in, and demand for, convenience, taste, and healthful foods. In theaggregate, food purchases reflect a pattern of excess. Choice relative to individual foodproducts may not yield healthful eating patterns. A compelling public health message thataims for improved dietary patterns and increased physical activity remains a challenge.
● Research and education that helps to clarify the determinants of health and healthfuldietary patterns and that supports translation of nutrition sciences into medical educa-tion and activities that facilitate transfer of successful nutrition health strategies intopublic health endeavors and community health strategies will influence long-term nationalhealth prospects.
1. INTRODUCTION
For the two out of three adult Americans who do not smoke and do not drink exces-sively, one personal choice seems to influence long-term health prospects more thanany other: what we eat.

4 Part I / Preventive Nutrition Overview
This statement, taken from the 1988 Surgeon General’s Report on Nutrition andHealth (1), offers an indication of both the challenge and the opportunity facing thenutrition community. It is now more than 15 yr since this seminal report, which helpedlaunch a US dietary guidance policy that links dietary choices with prevention ofchronic disease. Unfortunately, since then, the weight problems and obesity have wors-ened, putting millions more at increased risk of death and disease from related chronicconditions. It has become clear that vigorous actions are important to help people eatright, exercise regularly, and take other actions to promote good heath.
This chapter discusses four major points. First, the contribution of the nutrition sci-ences will assume increasing and compelling importance in the prevention of disease inthe 21st century. Second, the greatest challenge to constructive engagement of these issuesis dealing with the uncertainty attendant to change. Third, in the face of uncertainty, therole of policy is to bring focus to the points of social and scientific convergence.Finally, in the face of change, the role of the clinician is to bring focus to the individ-ual. The underlying factors and policy implications of these points are discussed in thefollowing sections.
2. FACTORS INFLUENCING NUTRITION AND CHRONIC DISEASEPREVENTION
The factors most likely to influence the nutrition policy agenda of the next century includethe national disease profile, demographic profiles, economics, changing meal patterns,changing meal sources, public awareness, professional awareness, the development ofscientific insights, and the advent of new technologies.
2.1. National Disease ProfileFundamentally, any public health agenda is driven to a substantial extent by the pop-
ulation’s profile of disease and disability, the nature of the problems at hand, and therates at which they are changing. The most concrete indicator of the disease profile forAmericans is found in the mortality tables. In 2001, approx 2.4 million Americans died.Their death certificates state that the top five causes of death were heart disease (HD),cancer, cerebrovascular disease, chronic lung diseases, and accidents (Table 1). The next
Table 1Leading Causes of Death, 2001
Cause of death Number of deaths
Heart disease 700,142Cancer 553,768Cerebrovascular disease 163,538Chronic lung disease 123,013Accidents 101,537Diabetes 71,372Pneumonia and influenza 62,034Alzheimer’s disease 53,852Nephritis 39,480Septicemia 32,238
Adapted from ref. 2.

Chapter 1 / Historic Perspective and Economic Outlook 5
five most prevalent conditions, listed in order of magnitude, were diabetes, pneumoniaand influenza, Alzheimer’s disease, nephritis, and septicemia (2).
Currently, 4 of the 10 leading causes of death have important dietary links, includingthree—HD, cancer, and stroke—that account for almost 70% of all deaths in the UnitedStates. As a result of a generation of biomedical research, it is known that diet-relatedfactors, including relationships with physical activity and weight problems, account fora large proportion of these diseases. Studies have variously associated dietary factors orsedentary lifestyles with between one-fifth and one-third of cardiovascular deaths, 20 to60% of fatal cancers, and 50 to 80% of diabetes mellitus cases, including 30% of dia-betes deaths (3). Drawing on available studies to assign responsibility for deaths on thevital statistics ledgers to what we now know to be their root causes reveals just howimportant dietary factors are to the health of Americans (Table 2). Together, diet and theprevailing pattern of inactivity contribute some 300,000 to 500,000 deaths annually,according them the dubious distinction of either the first or second actual causes ofdeath for Americans, depending on whether one looks to the higher or lower end of theestimated range, and the only factors that are daily factors for the entire population (3).
Moving beyond the mortality tables to the issue of the aggregate burden of pre-ventable conditions (Table 3) is enlightening. Manifest here is the fact that dietary factorspredispose, to varying degrees, to many of these conditions, including contributions tothe 13 million annual cases of coronary heart disease (CHD), 1.3 million cases of cancer,700,000 strokes, 17 million cases of diabetes (almost 80% of which are maturity-onset),approx 300,000 low-weight births, and 2500 neural tube defects (NTDs) (5–9). Forsome of these contributions, solid nutrition-related risk factors have been identified, anddiscernible progress is already evident for application of the information in preventionand disease control, albeit far short of what should be possible. Some of the mostintractable contributions, such as cancers or low birth weight, have nutrition compo-nents that are suggestive; however, the mechanisms are less clear. A more extensive ren-dition of serious health challenges to the American population would also include anumber, which is growing rapidly, such as Alzheimer’s and arthritis, which are withoutclearly defined nutritional components. As new understanding is gained about the rela-tionship between dietary patterns and disease outcomes, the role of nutrition is likely togrow as a public policy priority.
Table 2Real Causes of Death, 1990
Cause of death Number of deaths
Tobacco 400,000Diet/inactivity patterns 300,000Alcohol 100,000Certain infections 90,000Toxic agents 60,000Firearms 35,000Sexual behavior 30,000Motor vehicles 25,000Drug use 20,000
Adapted from ref. 3.

6 Part I / Preventive Nutrition Overview
2.2. Demographic ProfilesPublic policy is generally more responsive to groups whose numbers are growing
rather than shrinking. Over the last half of the 20th century, the US population increasedfrom 150 million to 294 million in 2004 (6,12). Two other major changes occurred inthe demographical characteristics of the US population: the growth of the older popu-lation and increased racial and ethnic diversity.
2.2.1. GROWTH OF THE OLDER POPULATION
Life expectancy in the United States reached an all-time high of 77.2 yr in 2001 (6).Over the course of the 20th century, the median age of the population increased bynearly 12 yr, from 23 to 35 yr; the share of the population over age 85 yr grew from 0.2to 1.5%, and the share of the population under age 25 yr decreased from 54.1 to 35.3%(13). Rapid growth in the older population is expected as the Baby Boomer generationbegins to turn age 65 yr in 2011. The nutrition concerns of the elderly are going tomove up quickly on the public health agenda. The aging of the US population clearlycontributes to the sense of urgency regarding public health.
In the period from 1970 to 2020, the population over age 65 yr will more than dou-ble, growing from approx 20 million to approx 54 million (Table 4). In this period, thoseover age 65 yr will grow from 10 to more than 15% of the population (14). Those overage 85 yr will more than quadruple in that period, growing from 1.5 to almost 7 millionby 2020 (13,15). Indeed, if projected to the year 2040, the population over age 85 yrwill have nearly tripled again relative to the year 2010 and will then represent 4% of thetotal population (15).
With the cost of treatments that often accompany aging (not only the coronary bypassprocedures, chemotherapy, stroke rehabilitation, and joint replacements that can range from$25,000 to $250,000 each, but also the day-to-day management of problems such as con-gestive heart failure and diabetes), it is apparent that the aggregate cost of potentially pre-ventable conditions has already become an urgent societal concern that is likely to worsen.
2.2.2. INCREASING RACIAL AND ETHNIC DIVERSITY
Racial and ethnic diversity began to characterize the US population during the lasthalf of the 20th century, especially since 1980 (Table 5) (14). The aggregate minority
Table 3Annual Burden of Preventable Conditions
Condition Annual burden (no. of cases)
Coronary heart disease 13 million Certain cancers 1.3 million Stroke 700,000 Diabetes 17 million Many injuries 2.6 million hospitalizedChronic lung disease 28 million Alcoholic liver disease 14 million alcoholicsHIV and other STDs 16 million Low weight babies 300,000 Many neural tube defects 2500 Vaccine-preventable diseases 55,000
Adapted from refs. 4–11.

Chapter 1 / Historic Perspective and Economic Outlook 7
population (people of races other than Caucasian or Hispanic origin) increased byalmost 90% between 1980 and 2000, whereas the white, non-Hispanic population grewby about 8% during the 20-yr period. Younger age groups had a higher percentage ofminority population than did older age groups. By 2000, the proportion of minoritypopulation ranged from 16% for people age 65 yr and older to 39% for those under age25 yr (13). Changes in the racial and ethnic composition of the population will bereflected in the health of the United States because many measures of disease and disabil-ity differ significantly by race and ethnicity.
Policymakers are faced with a challenge in finding successful approaches to improvepublic health as research continues to evolve and there is too little evidence to knowwhich solutions will be effective and to what extent racial, gender, or just culturaldifferences determine approaches to success.
2.3. EconomicsEconomics is a central determinant of public policy. In fact, it is not uncommon for
advocacy organizations to define policy strictly in budgetary terms. Nutrition and diseaseprevention are influenced by several forces of economics, including the economics ofeating patterns, which influence the development of disease, and the economics of foodproduction and marketing.
Estimates of the potential effects of diet on the development of chronic diseases havebeen used to estimate the benefit of improved dietary patterns. Examples from the Foodand Drug Administration (FDA) regulations for food labeling and food standards overthe past decade are illuminating (Table 6). The economic impact analysis for theNutrition Labeling and Education Act (NLEA) estimated that the benefits of the amend-ments to require mandatory food labeling for virtually all foods would result in benefi-cial changes in food purchases that would be associated with over 39,000 fewer casesof cancer and CHD. The economic benefit of the total NLEA proposals (changes in theinformation panel, including new nutrient and ingredient information, as well aschanges such as new definitions for nutrient content claims and health claims) were
Table 4Aging of the Population
Year 1900 1920 1940 1960 1980 2000 2020Number of people age 65 yr 3.1 4.9 9.0 16.6 25.6 35.0 53.7
or older (in millions)
Adapted from refs. 13 and 14.
Table 5Percent of US Population in Selected Race and Ethnic Origin Groups, All Ages, 1980–2000
Race and ethnic origin 1980 1990 2000
Hispanic or Latino 6.4 9.0 12.5White 79.9 75.7 69.5Black 11.5 11.8 12.2Asian and Pacific Islanders 1.6 2.8 3.9American Indian and Alaskan Native 0.6 0.7 0.7
Adapted from ref. 14.

8 Part I / Preventive Nutrition Overview
estimated to be $4.4 to $26.5 billion over a 20-yr period (16,17). This analysis wasbased primarily on an estimated 1% reduction in intake of fat and saturated fatty acids(SFAs) and a 0.1% reduction in consumption of cholesterol (16,17).
Economic impact analyses, prepared for regulations that require fortification of cereal-grain products with folate at 0.14 mg/100 g, also provided estimates of economic benefit.These analyses, based on the occurrence of 2500 cases of NTDs per year, of which a pro-portion are folate-related, estimated that 116 NTDs and 25 infant deaths would be pre-vented per year and would result in economic benefits, calculated by the “willingness topay” methodology to be in the range of $651 to $788 million each year (18).
In 2003, the FDA amended its regulations on nutrition labeling to require that theamount of transfatty acids (FAs) be listed on the Nutrition Facts Food Label on a sep-arate line under the line for the content of SFAs (19). In its economic analysis, the math-ematical model used by the FDA showed that reducing the intake of trans FAs by 0.04%of energy would reduce low-density lipoprotein (LDL) cholesterol levels and thus CHDrisk by about 0.05%, thereby preventing approx 600 heart attacks, including 240 fatalheart attacks. FDA estimates the value of these averted illnesses at approx $2 billionannually ($13.1 billion discounted over 20 yr), factoring in estimates of the statisticalvalue of life, the costs of quality-adjusted life years potentially compromised by illness,and the averted direct medical cost. With slightly different assumptions, the estimatessuggest possibly even higher benefits. A mathematical model based on the assumptionthat trans FAs may increase CHD risk by lowering high-density lipoprotein (HDL) cho-lesterol showed that a reduction in trans FAs to 0.04% of energy would reduce LDLcholesterol levels, raise HDL cholesterol levels, lower CHD risk by 0.1%, preventapprox 1200 heart attacks, including 480 fatal heart attacks, valued at approx $2 billionannually ($26.8 billion discounted over 20 yr) (19).
There are no communication models that demonstrate how food labeling might be usedmore efficiently as an educational tool in control of weight problems and obesity; however,
Table 6Examples of Economic Benefit Estimated in Regulations
for Food Labeling and Food Standards
Regulation Primary change Economic benefit
NLEA (16,17) ↓Fat and SFA intake (1% of energy) $4.4–26.5 billion/yr↓cholesterol intake (0.1% of energy)↓CHD risk
Folate fortification (18) ↑intake folate $651–788 million/yr0.14 mg/100 g product↓116 NTDs and 25 infant deaths
Label trans FAs (19) ↓trans FAs intake. (.04% of energy) $1 billion/yr↓LDLC (Method 1)↓600 heart attacks; 240 fatal
↓trans FAs intake (.04% of energy) $2 billion/yr↓LDLC and ↑HDLC (Method 2)↓1200 heart attacks; 480 fatal
Adapted from refs. 16–19.

Chapter 1 / Historic Perspective and Economic Outlook 9
given the impact that related conditions have on economic costs for the US health caresystem, ample motivation exists for better use of the food label to make informed choices.It has been estimated that for the US adult population as a whole, overweight- and obe-sity-related medical spending may account for about 10% of the annual medical expensesand may have reached or exceeded $100 billion. Much of the cost associated with obesityresults from adult-onset diabetes, CHD, and hypertension (20,21).
A mathematical model was used to project economic benefit from changing to ahealthier diet. This projection estimated that healthier US eating patterns could prevent$71 billion each year in medical costs, lost productivity, and premature deaths associ-ated with CHD, cancer, stroke, or diabetes. Specifically, medical costs account for 47%of the total, premature deaths account for 39%, and lost of productivity associated withmorbidity accounts for the remaining 13%. These estimates did not include diet-relatedcosts associated with osteoporosis, hypertension, weight problems, and NTDs (22) (seeChapter 24).
Another activity that has experienced major support by the federal government isthe nutrient references Dietary Reference Intakes (DRIs) adopted by the NationalAcademy of Sciences, Food and Nutrition Board, Institute of Medicine. The DRI ini-tiative began in 1993 (23). The DRIs replace and expand on the RecommendedDietary Allowances (RDAs) that were the acknowledged nutrient standards for thepast 50 yr. The DRIs include four reference values: the RDA, the estimated averagerequirement, the adequate intake, and the tolerable upper intake. Eight reports haveresulted from the effort. In these, nutrient group panels reviewed the scientific litera-ture regarding the roles of nutrients in health and disease, interpreted the current dataon dietary intakes in North American population groups, and made recommendationsfor the nutrient or food reviewed. The DRIs provide Americans with guidelines tooptimize health and physical functions. At the end of 2003, the Committee on the Useof Dietary Reference Intakes in Nutrition Labeling presented their recommendationson how to use DRIs in food labeling and for discretionary fortification of food inUnited States and Canada (24). A change to the food label reference values wouldaffect the Daily Values (DVs) used on the food label because nutrient content andhealth claims in the United States are largely dependent on the DV. Ongoing studiesare needed to help determine the effects of new nutrition label reference values andthe recommended fortification guidelines.
Another federal initiative, the 1969 White House Conference on Nutrition (25),focused national attention on the need for food assistance programs to address poverty-related hunger and nutrition. These food assistance programs, primarily administered byUS Department of Agriculture (USDA), provide different types of food benefits to var-ious target recipients. Three of these programs accounted for 85% of the $38 billionspent on food assistance in 2002: the Food Stamp Program ($20.7 billion), the NationalSchool Lunch Program ($6.9 billion), and the Women, Infants, and Children Program($4.3 billion) (26). The primary intent of the programs is to provide an adequate quan-tity of food, not to assure that the quality of food choices is optimal for the preventionof chronic diseases. However, the USDA provides reimbursement to states for half ofthe cost of approved Food Stamp Program education and promotion activities. Thus,there is an opportunity to influence food choices. Also, the USDA’s School Mealsfor Healthy Children regulations have been implemented to ensure that school meals com-ply with the Dietary Guidelines for Americans, making meals that provide nutrient

10 Part I / Preventive Nutrition Overview
adequacy and that are reduced in fat, SFAs, cholesterol, and sodium (Na) available (27).These examples of federal food-related initiatives demonstrate that economic benefitsmay be achieved by federally mandated dietary change.
Food is an almost $900 billion US industry, and the US food marketing system is thesecond largest advertiser in the American economy (second to the automotive industry)(28,29). Over 75% of food advertising is communicated via television, showingbranded products that consumers can easily identify (29). The highest food advertisingexpenditures are concentrated on prepared, convenience foods, followed by confec-tionery items and snacks, alcoholic beverages, soft drinks and bottled water, and cookingproducts (including sugars and oils). The foods with the highest proportions of adver-tising expenditures tend to be those that are overconsumed rather than those recom-mended by US Dietary Guidelines (29). Food manufacturers are responsible for 50% offood advertisements, with food service contributing another 25% and food retailers con-tributing about 15% (30). Advertising expenditures rose 52% between 1990 and 2000,with the largest increases paid for by food service firms and food retailers (30). Theintensity of food advertising reflects several factors. First, food purchases capture about10% of consumer spending and, hence, provide incentive for competition; second, foodis a repeat-purchase industry subject to frequent shifts in consumer opinions; and finally,food is highly branded, with easily communicated images (29).
Recognizing that the food industry is in business to sell food and uses advertising tosell food, advertising can also provide information about healthful food characteristics,appealing to consumers to select healthful food products and thus precipitate competitionthat shapes the mix of food products in the market. It is in this area that policymakersmust continue to get appropriate messages to consumers, influence consumerdemand for more healthful products, and provide incentives for the industry to respondto government dietary guidance recommendations.
2.4. Changing Meal PatternsThe forces of change as well as the pace of that change are dramatic for food and nutri-
tion today. Certainly, important changes have occurred in the choices people make. Thenotion that behavior is immutable was long ago put to rest. From food disappearance data(the foods available for consumption), it is evident that the type of food on the Americanmenu is changing (Table 7). Since 1970, the availability of red meat (mostly beef) is downabout one-sixth, fish is up by about one-quarter, and poultry has increased almost twofold.On the other hand, summing the pounds per capita in these three components of the meatgroup suggests that the combined total poundage available for consumption is up 8%. Thelargest increase occurred in the period after 1980. Coincidentally, egg availability that hadbeen declining appears to be increasing, a trend that in part reflects consumer use of moreprepared foods. Whole milk is down by 70%, whereas milk with lower fat content (<2%)continues to increase in popularity. Per capita consumption of cheese is up almost threetimes the level it was in 1970 (31). Also, food supply nutrient data show that the total fatand SFAs provided by dairy products have remained constant since 1970 (32). The avail-ability of grain and cereal products is up about 45% and the availability of fresh fruits andvegetables is also up by about 25% (31). Even considering the uncertainty introduced tofood disappearance and availability data by waste in prepared foods, it appears that con-siderable changes have occurred in a relatively short period of time, and many are in thedirection of lower SFA/total fat products.

Chapter 1 / Historic Perspective and Economic Outlook 11
Recently, the USDA developed a method to adjust food supply data for losses and torelate these data to American progress in following the 2000 edition of the DietaryGuidelines for Americans, as depicted in the Food Guide Pyramid (Table 8) (33). Thesedata show that to improve their diets, the population needs to consume more fruits anda greater variety of fruits and vegetables. Three fruits (oranges, apples, and bananas)contribute one-half of the daily fruit intake, and iceberg lettuce, potatoes, and cannedtomatoes contribute more than half of vegetable consumption (33). To improve theirdiets, many people need to change the type of grain and cereals they consume, becausewhole grains are about one serving per day rather than the minimum three servings thatare recommended; cakes, cookies, pastries, and pies account for almost 15% of totalgrain consumption, with grain-based snack foods (crackers, popcorn, pretzels, and cornchips) accounting for an additional almost 5% (33).
To improve diets regarding the meat group, more selections should be low in SFAand cholesterol, such as legumes and fish. In the dairy group, emphasis should be onlow-fat/low-SFA selections because more than half of the daily dairy choices came
Table 7Food Consumption (Pounds Per Capita)
1970 1980 1985 1990 1995 2001
Red meat 131.9 126.4 124.9 112.2 113.6 111.3Fish 11.7 12.4 15.0 14.9 14.8 14.7Poultry 33.8 40.8 45.6 56.2 62.1 66.2Eggs (#) 308.9 271.1 255.2 234.1 232.3 251.1Milk, total (gal.) 29.6 25.9 25.0 24.2 22.5 20.3
Milk, whole 24.8 16.5 13.9 10.2 8.3 7.4Milk, 2% fat 3.2 6.3 7.9 9.1 8.0 7.0Milk, <2% fat 1.5 3.1 3.2 4.9 6.1 5.9
Cheese 11.4 17.5 22.5 24.6 26.9 30.0Flour/cereal 135.6 144.7 156.5 180.9 190.2 195.7Fresh fruits 101.2 104.8 110.6 116.2 122.5 125.8Fresh vegetables 154.3 151.3 158.4 170.2 180.9 196.6
Adapted from ref. 31.
Table 8Food Supply Servings Compared With Food Guide Pyramid
Food group Food guide pyramid Food supply servings
Added fats and oils Use sparingly 64 gAdded sugars 12 teaspoons 34 teaspoonsMeat, poultry, fish
dry beans, eggs, & nuts 2–3 servings 2.5 servingsDairy products 2–3 servings 1.6 servingsVegetables 3–5 servings 4 servingsFruit 2–4 servings 1.4 servingsGrains 6–11 servings 10 servings
Adapted from ref. 33.

12 Part I / Preventive Nutrition Overview
from cheese and whole milk. Finally, to improve diets, there should be a decrease inadded sugars and added fats. The Food Guide Pyramid suggests limiting added sug-ars to 12 teaspoons a day (based on a calorie level of 2200) rather than the 34 teaspoonsprovided by the food supply, adjusted for losses (33). For added fats, which provideabout 52% of the total fat in the food supply, consuming two-fifths less added fat(approx 25 g)—especially shortening and margarine, lard, beef tallow, butter, andother dairy fats—would help to achieve a total fat intake that is less than 30% of thecalorie intake (33). To reach public health goals for a healthier US population, publicpolicy must find approaches to improve healthful food choices and to increase physicalactivity levels.
As dietary guidance policy has continued to focus on improvements in food choices,there has been a change in the food products available. In 2002, the greatest number ofnew products introductions occurred since 1995 (34). The confectionery food productcategory was strongest, followed by bakery, beverages, and sauces and seasonings, andaccounted for half of all food product introductions. With convenience vying as a majorconsideration, consumers, who had grown experienced in restaurant dining, tried newfood introductions at home and moved toward classic, retro, and ethnic cuisine, especiallythose that suggested a gourmet edge (Table 9).
By Fall 2003, the food marketplace reflected additional products that were devel-oped to respond to food labeling changes (19) and public health recommendations(24,37,38). The market responded to the new nutrient references (DRIs) adopted by theFood and Nutrition Board, Institute of Medicine, and to earlier recommendations of theDietary Guidelines 2000 (37) and the National Cholesterol Education Program (NCEP)(38) by developing an expanded number of products aimed at reductions in blood cho-lesterol levels—plant stanols and sterols, oat bran, guar gums, and soy proteins;responding to consumer interest to limit sugar intake and addressing diabetes and con-trol of blood sugar levels—sugar replacements and resistant starches; manufacturingproducts to feature proteins (which have no upper limit in the new DRIs), includingwhey protein and protein food sources such as egg, fish, gelatin, and yeast; and dis-playing numerous other food introductions that respond to consumer interest in health,such as those that propose to boost the immune system, promote eye health, and helpwith digestion.
These food marketing facts suggest a rapid change in what consumers are demandingand purchasing. With more food products that offer taste appeal and convenience andstill confusing health claims for foods, the consumer responses is to buy more food.
Table 9Food Product Trends, 2003
● Convenient meals and simple solutions; mobile meals and snacks, cookware- and uten-sil-free; bars and beverages
● Upscale culinary; indulgent, retro, fine dining, American + ethnic● New forms, varieties, flavored, and colored versions of favorite foods tailored to taste,
age, group, and lifestyle● Healthful food products to prevent or manage disease; avoidance foods—no, less than,
and reduced; novel fats; new grain products: organic and natural
Adapted from refs. 35 and 36.

Chapter 1 / Historic Perspective and Economic Outlook 13
Despite consumer interest in healthful foods, in the aggregate, food purchases haveenhanced the 20th century pattern of excess. The result has been a 15% increase in aver-age daily calories available in the food supply, from 3300 per capita in 1970 to 3800 in1994 (32). Thus, as the full range of nutritional implications of changes in the food mar-ketplace continues to evolve, the need for a compelling public health message ondietary patterns remains a challenge.
2.5. Changing Meal SourcesAmericans no longer purchase all their food as fresh items and commodities to be
prepared for meals eaten at home. Consumers still eat most of their main meals at home,and in 2002 restaurant spending grew by only 2% (35). Yet an increasing number ofmeals are fully or partially prepared outside the home. By 2002, 46% of the $900.1 bil-lion food dollar was spent on food away from home (28). Conventional supermarketscompete with alternative retail outlets including supercenters, warehouse stores, andInternet-based businesses. Competition helps to keep food prices low, and it has beenpredicted that the first decade of the 21st century will continue a historical decline infood price inflation. The 1970s had average annual food price inflation of 8.4%, the 1980shad 4.6%, and the USDA predicts annual food price inflation of 2.2% for the currentdecade (39).
The nutritional implications of these trends in meals prepared away from home arenot fully determinable. However, an analysis based on national food consumptiondata calculated that if food away from home had the same average nutritional densi-ties as food at home in 1995, US consumers would have consumed 197 fewer calo-ries per day, reduced their fat intake to 31.5% of calories (rather than 33.6%), andreduced their SFA intake to 10.9% of calories (rather than 11.5%). In addition, theconsumption of calcium would have increased by 7% and their consumption of fiberand iron by 9% each (40). Sodium intakes would not have changed significantly, pos-sibly because most sodium is added to food prior to its entry into the household. Thepreceding data raise concerns, especially for those in certain socioeconomic categories,about the potential of a lower intake of fresh fruits and vegetables and highercaloric—and likely higher fat, especially saturated fat—patterns of consumption, relativeto what would be consumed at home. However, time-pressured consumers spent only10.2% of their 2002 disposable personal income on food, and a broad spectrum offood retail outlets helped to keep prices at low inflation levels (29). Consumers areinterested in healthful foods, but health is not yet the overriding consideration regardingwhich foods to purchase.
2.6. Public AwarenessThere is little question that the public is increasingly interested in nutrition and aware
of the central issues. In 2002, 70% of consumers responding to a Food MarketingInstitute (FMI) survey said that their diets could be healthier and that they could ensurea healthy diet. About 86% agreed and 53% strongly agreed that in most cases, eatinghealthfully is a better way to manage illness than medication, up from 76 and 43%,respectively, in 2001 (41). The eating for health concept is also shown in the 2002 data,which found that 72% of consumers almost always/sometimes look at health claims, up6% over the previous year (41). Similarly, in the 1999 Discovery Health Survey, 66%of respondents knew that saturated fat was related to disease (42).

14 Part I / Preventive Nutrition Overview
However, recent FMI survey data revealed interesting findings relative to the top threeconsumer concerns about the nutritional content of foods in 2003 compared with 1996:fat content (49%, down from 60%); sugar content (18%, up from 12%); and salt content(18%, down from 28%) (43). The survey information does not provide information toexplain the change nor to relate the response to food purchase behavior. Such informationcould be useful to policymakers who offer dietary guidance recommendations.
Additional data that show consumer interest in food and health is found in 2002 data,in which most or many consumers reported that they were very interested in tryinghealth-promoting foods (54%) and wanted products designed to help them with loweringblood cholesterol levels and preventing cancer (54%) and to help with blood pressureand diabetes (51%), osteoporosis (49%), and weight control (49%) (44). These data supportconsumer health motivations in selection of food products.
Americans also like to eat. In 2002, survey data showed that 72% of consumersagreed and 30% strongly agreed with the statement, “I eat foods that I enjoy even if theyare not good for me”—up from 64 and 24%, respectively, in 2001. Also, 34% stronglyagreed and 14% agreed with the statement, “I eat what I want and don’t think muchabout how it affects my health”—up from 25 and 9%, respectively, in 2001 (43). Thissuggests that consumers may compartmentalize their information; they have awarenessand knowledge of food/nutrient and disease relationships but make choices relative toindividual products that may not translate into a healthful eating pattern. Policymakersand other leading health groups must be vigilant to recognize that consumers are likelyto seek simple solutions for health achievement such as those suggested by new foodproducts and even the newest nutrition research report. Instead, the media, nutrition sci-entists, and policymakers need to develop an engaging and consistent communicationstrategy to put the latest nutrition research and the newest food product innovations inthe context of existing knowledge about dietary patterns and health.
The task is complex because in addition to taking responsibility for providing contex-tual information, a major challenge must be faced in helping people sort out the centraltendencies of new information released to the public from scientific research—in effect,helping people understand what’s important for them, given their particular circumstances.
2.7. Professional AwarenessIn the last decade, there has been a concerted effort to increase physician awareness
and interest in nutritional issues. There is evidence that physicians are aware and use thetreatment guidelines of the NCEP (ref. 38) and of the National High Blood PressureEducation Program (ref. 45). In addition, health professionals have a growing concernabout weight problems and obesity and appropriate health messages to address this pub-lic health priority (21).
Is the health professional community doing enough? Despite a number of public andprivate sector efforts aimed at reducing obesity, only modest success is suggested and nosuccess is evident in reversing the trend in the increasing prevalence of weight problemsand obesity. In the most recent national data (1999–2000), nearly two-thirds of USadults were overweight or obese, with twice as many overweight children and threetimes as many overweight adolescents as there were in 1980 (46,47).
From 1999 to 2000, under 20% of US adults had high serum cholesterol levels (at orabove 240 mg/dL). The age-adjusted mean serum cholesterol level was 204 mg/dL, sta-tistically unchanged from 205 in 1988–1994 (6,48). Those with high serum total cholesterol

Chapter 1 / Historic Perspective and Economic Outlook 15
who also have low levels of HDL-C may be at greater risk of CHD than others. The datashowed that no age, gender, or race/ethnicity group had more than 11% of its popula-tion with this lipid combination (49). The age-adjusted prevalence of participants reportingcurrent use of cholesterol-lowering medications rose from 3.1% in 1988–1991 to 7.9%in 1999–2000 (50).
Current rates of hypertension control, although improving, continue to be low. In1999–2000, 28.7% of National Health and Nutrition Examination Survey participantshad hypertension (140/90 mmHg or greater), an increase of 3.7% from that in 1988–1991.In the latest data, 68.9% were aware of their hypertension, 58.4% were treated, andhypertension was controlled in 31% (50).
An editorial written to accompany the release of the 2003 national guidelines onblood pressure noted that successful prevention of hypertension requires the will to actby clinicians, health care system administrators, purchasers of health care, patients, andcommunities through a comprehensive program of lifestyle, environmental develop-ment, and clinical intervention (51). Also, by extension, it could be said that the samecommitment is needed to prevent and control high cholesterol levels and to control ratesof excessive weight and obesity.
Health care provider attitudes have changed substantially in recent years, but nutri-tion education in medical schools is still weak, particularly when considered against thetranslational challenge physicians will face in the future (see Chapter 36). Public policycan do much to turn the improvements in health professional awareness of the relation-ship between nutrition and health into positive influences on the health of the public;however, if the full potential is to be reached, then a close partnership will be requiredwith the scientific and health provider communities.
2.8. Development of Scientific Insights Coupled With New TechnologiesClearly, new scientific insights can change the role of nutrition in prevention, espe-
cially the public policy aimed at chronic disease prevention. A good example is whathas already happened with the NCEP based on more than half a century of researchabout the relationship between blood lipids and cardiovascular disease.
The future will undoubtedly hold much more as the nutritional sciences incorporatethe lessons from molecular biology and genetics. The priority categories of the FederalInteragency Committee on Human Nutrition Research indicate that we may expectadvances in these areas: nutrient requirements throughout the life cycle; nutrient inter-actions and bioavailability; nutrition and chronic diseases; energy regulation, obesity,and eating disorders; nutrition surveillance and monitoring methodology; and nutritioneducation techniques.
Impressive change is also occurring in the science and technology base. Theseadvances have contributed to important developments in the epidemiology of nutritionand chronic diseases, in the understanding of nutrient action at the molecular level, andabout individual variation in response to nutrient challenges. Perhaps the most dramaticdevelopments, if only in terms of the pace of change, are coming from the increasingunderstanding of how people vary.
The human genome project has made a large difference regarding expectations fornutrition and prevention in a short time. The year 2003 marked the 50th anniversary of thediscovery of the double-helical structure of DNA. The Human Genome Project (HGP)began in 1990, and all of its initial projects have now been achieved at least 2 yr ahead of

16 Part I / Preventive Nutrition Overview
expectations (52). In 2003, scientists at the HGP wrote that the project’s new researchstrategies and experimental technologies and large-scale generation of communityresource data sets had introduced new dimensions into biological and biomedicalresearch. Advances in genetics, comparative genomics, biochemistry, and bioinformaticshave provided scientists with an improved repertoire of research tools to analyze andunderstand at an unprecedented level of molecular detail. In describing the challenges thatlie ahead, a particular relevance to nutrition is cited in Challenge II-6: to develop genome-based tools that improve the health of all. Population differences in allele frequencies forsome disease-associated variants could be a contributory factor to health disparities; there-fore, incorporating this information into preventive and/or public health strategies wouldbe beneficial. Furthermore, research can explore the relationship between genomics andhealth disparities by evaluating the diverse contributions of socioeconomic status, culture,discrimination, health behaviors, diet, environmental factors, and genetics (52).
In the development of new food products, engineering genetic change is one of severaltechnologies used to change plant components, including fatty acid composition and levelsof selected amino acids and vitamins and of antioxidants such as polyphenols. One devel-opment in recent years that offers a range of food products with various sought-after prop-erties and is now in the marketplace is structured lipids. Structured lipids are tailor-madefats and oils designed to have improved nutritional or physical properties because of mod-ifications to incorporate new fatty acids or to change the position of existing fatty acidson the glycerol backbone by chemically and/or enzymatically catalyzed reactions and/orgenetic engineering (53). Several of these processes have resulted in fats with low transFA contents. Genetic engineering has allowed the development of seed oils (canola, soy-bean, and sunflower) with increased ratios of high-oleic, monounsaturated FAs to linoleic,polyunsaturated FA and/or with somewhat increased levels of SFAs. The resulting oils caneliminate the need for hydrogenation and, therefore, the production of trans FAs.Transesterification of seed oils by enzymes (e.g., lipases) and chemical esterification hasbeen used in the production of trans-free margarines (53). Esterification of seed oils eitherchemically or with enzymes also has been used to produce reduced-calorie fats (approx5 kcal/g) and fat substitutes. In the latter, most of these structured lipid products containfatty acids that are not naturally present in edible oils and fats and lack important essentialFAs, but match the chemistry and functions of natural fats. Although the field of structuredlipids is relatively new, consumers are likely to purchase products that offer characteristicssuch as a reduced content of calories and trans FAs.
3. POLICY IMPLICATIONS
In the face of uncertainty, the role of policy is to bring focus to the points of socialconvergence. Policy is fundamentally targeted to wielding levers that address commondenominators.In saying nearly 150 yr ago that “politics is nothing but medicine on alarger scale” (54), Virchow could have had the challenge of dietary guidance in mind.In this matter of great importance to the health of the American people, the task is rem-iniscent of the basic challenge of any policy process: the task of finding the right balancein the dialectic of the debate between the dictum “the greatest good for the greatestnumber” and the Hippocratic admonition “first, do no harm.”
A convergence is emerging from the often disparate vantage points of studies of dif-ferent disease processes in the American population. From studies of CHD etiologycomes the lesson that intake levels of SFAs, TFAs, and cholesterol correlate with higher
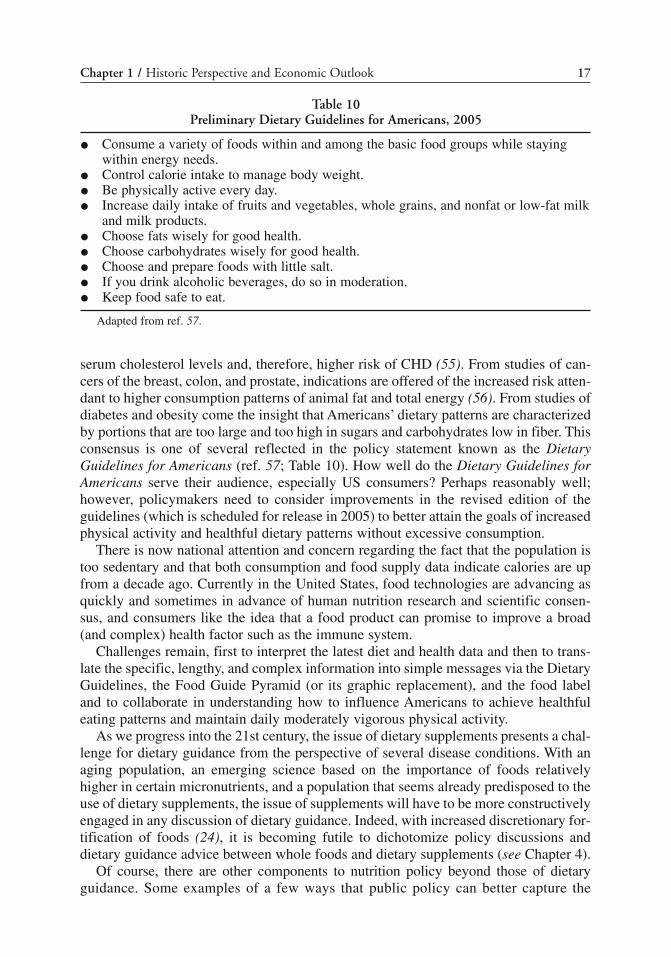
Chapter 1 / Historic Perspective and Economic Outlook 17
serum cholesterol levels and, therefore, higher risk of CHD (55). From studies of can-cers of the breast, colon, and prostate, indications are offered of the increased risk atten-dant to higher consumption patterns of animal fat and total energy (56). From studies ofdiabetes and obesity come the insight that Americans’ dietary patterns are characterizedby portions that are too large and too high in sugars and carbohydrates low in fiber. Thisconsensus is one of several reflected in the policy statement known as the DietaryGuidelines for Americans (ref. 57; Table 10). How well do the Dietary Guidelines forAmericans serve their audience, especially US consumers? Perhaps reasonably well;however, policymakers need to consider improvements in the revised edition of theguidelines (which is scheduled for release in 2005) to better attain the goals of increasedphysical activity and healthful dietary patterns without excessive consumption.
There is now national attention and concern regarding the fact that the population istoo sedentary and that both consumption and food supply data indicate calories are upfrom a decade ago. Currently in the United States, food technologies are advancing asquickly and sometimes in advance of human nutrition research and scientific consen-sus, and consumers like the idea that a food product can promise to improve a broad(and complex) health factor such as the immune system.
Challenges remain, first to interpret the latest diet and health data and then to trans-late the specific, lengthy, and complex information into simple messages via the DietaryGuidelines, the Food Guide Pyramid (or its graphic replacement), and the food labeland to collaborate in understanding how to influence Americans to achieve healthfuleating patterns and maintain daily moderately vigorous physical activity.
As we progress into the 21st century, the issue of dietary supplements presents a chal-lenge for dietary guidance from the perspective of several disease conditions. With anaging population, an emerging science based on the importance of foods relativelyhigher in certain micronutrients, and a population that seems already predisposed to theuse of dietary supplements, the issue of supplements will have to be more constructivelyengaged in any discussion of dietary guidance. Indeed, with increased discretionary for-tification of foods (24), it is becoming futile to dichotomize policy discussions anddietary guidance advice between whole foods and dietary supplements (see Chapter 4).
Of course, there are other components to nutrition policy beyond those of dietaryguidance. Some examples of a few ways that public policy can better capture the
Table 10Preliminary Dietary Guidelines for Americans, 2005
● Consume a variety of foods within and among the basic food groups while stayingwithin energy needs.
● Control calorie intake to manage body weight.● Be physically active every day.● Increase daily intake of fruits and vegetables, whole grains, and nonfat or low-fat milk
and milk products.● Choose fats wisely for good health.● Choose carbohydrates wisely for good health.● Choose and prepare foods with little salt.● If you drink alcoholic beverages, do so in moderation.● Keep food safe to eat.
Adapted from ref. 57.

18 Part I / Preventive Nutrition Overview
convergence in perspectives for the benefit of Americans are shown in Table 11. Theimportance of the commitment to improve dietary patterns can be demonstrated by policydecisions that would help in shaping the economic supports and incentives built into foodassistance programs; aiding producer groups; emphasizing more healthful and appropri-ate amounts of food; supporting physical environments in schools, the workplaces, andcommunities; and supporting sustained marketing of the agreed upon principles. The cur-rent demographic and dietary trends transform these issues from “nice things to do” tothose of “social imperatives.” Action is compelled, even in the face of uncertainty.
3.1. Clinical ImplicationsThe role of the clinician and other health care providers is to bring focus to the points
of individual variation. Most policy processes are geared to the points of convergence,but the points of individual variation must also be addressed, and they will be increas-ingly prominent in the coming years as the science unfolds. It ultimately falls to theclinician to aid patients in the considerable challenges of sorting through what they per-ceive as conflicting advice, developing strategies for applying general guidance to theirparticular living circumstances, and identifying ways in which such guidance partscompany with the character of their personal levels of risk. Often, these are likely to becomplex issues requiring more sophisticated information.
3.2. Summary and RecommendationsAt this point, the community of health professionals is ill-equipped to respond appro-
priately to this obligation. More medical schools need what might be reasonably termeda clinical nutrition curriculum (see Chapter 36) The initiative of the National Institutesof Health aims to help translate nutrition sciences into medical education with theNutrition Academic Award Program (58). In the next several years, it will be useful toassess the Program’s outcomes and to identify the successful strategies that were imple-mented to overcome barriers in training physicians in human nutrition and to foster col-laborative and dissemination efforts with other medical schools as well as other healthcare professional schools.
Physicians have lagged behind the general public in acknowledging the relationshipbetween nutrition and health. The solution to such shortfalls can only come withimprovements in the nutritional component of educational programs for medical, nurs-ing, and other health care providers; changes in the structure of health services deliveryto allow for competent dietary interventions; and introduction of economic incentivesto ensure that those interventions are delivered. The fact that more than 76 million
Table 11Public Health Nutrition Interventions
Nutrition goalsDietary guidelinesFood assistanceFood safety regulationFood labelingTax policiesLinkage to other sectors

Chapter 1 / Historic Perspective and Economic Outlook 19
Americans are already enrolled in managed care settings and that the number continuesto grow exponentially holds open the prospects for such changes but only if a concertedand coordinated effort works to ensure that they occur (6).
Futurists tell us that the years ahead will be dazzling. The results of advances in theresearch base could have major implications for the kinds of nutrition targets that willbe set in the 21st century. As noted 50 yr ago by Dr. W. Henry Sebrell, an early directorof the National Institutes of Health (59):
By many indications, this country’s major needs in nutrition today are as follows:(1) control of obesity, (2) elucidation of the role of nutrition in the chronic diseases,(3) assessment of nutritional status as a step toward control of border line deficien-cies, (4) means of complete intravenous alimentation, and (5) additional knowledgeregarding nutrition in the aged, those under stress, and in the convalescent.
The measure of our success will be found in the extent to which we have been ableto change this agenda some 50 yr later.
ACKNOWLEDGMENT
The authors thank Jessica Siehl for her assistance with this manuscript.
REFERENCES1. US Department of Health and Human Services. The Surgeon General’s Report on Nutrition and
Health. Washington, DC: US Government Printing Office, 1988.2. Centers for Disease Control, National Center for Health Statistics: Updated Trend Tables, October
2003. Table 31: Leading Causes of Death and Number of Deaths, According to Sex, Race, andHispanic Origin: United States, 1980 and 2001. Hyattsville, MD: NCHS, 2003. http://www.cdc.gov/nchs/data/hus/tables/2003/03hus031.pdf. Accessed 10/22/2003.
3. McGinnis JM, Foege WH. Actual causes of death in the United States. JAMA 1993; 270(18):2207–2212.
4. US Department of Health and Human Services. Healthy People 2010. 2nd ed. With Understandingand Improving Health and Objectives for Improving Health. 2 vols. Washington, DC: USGovernment Printing Office, November 2000.
5. American Heart Association. Heart Disease and Stroke Statistics: 2003 Update. Dallas, TX:American Heart Association, 2002. http://www.americanheart.org/downloadable/heart/10590179711482003HDSStatsBookREV7–03.pdf . Accessed 10/9/2003.
6. Centers for Disease Control, National Center for Health Statistics: Health, United States, 2003 withChartbook on Trends in the Health of Americans; Trend Tables. Hyattsville, MD: National Centerfor Health Statistics, 2003. www.cdc.gov/nchs/products/pubs/pubd/hus/trendtables.htm. Accessed10/22/2003.
7. American Cancer Society. Cancer Facts and Figures 2003. Atlanta, GA: American Cancer Society, Inc.,2003. http://www.cancer.org/downloads/STT/CAFF2003PWSecured.pdf. Accessed 10/24/ 2003.
8. American Diabetes Association. Basic Diabetes Information. Alexandria, VA: ADA, 2003.http://www.diabetes.org/info/diabetesinfo.jsp. Accessed 10/23/ 2003.
9. Centers for Disease Control, National Center on Birth Defects and Developmental Disabilities. FolicAcid Now. Atlanta, GA: National Center on Birth Defects and Developmental Disabilities, October2003. http://www.cdc.gov/ncbddd/folicacid/prof.htm. Accessed 10/23/ 2003.
10. American Lung Association. Trends in COPD, 2003. Figure 2: Number of COPD Conditions inAdults, Aged 18 Years and Older, 1997–2001. New York, NY: American Lung Association, 2003.http://www.lungusa.org/data/copd/copd203.pdf. Accessed 10/23/2003.
11. National Institute on Alcohol Abuse and Alcoholism. Alcoholism: Getting the Facts. Bethesda,Maryland: National Institute on Alcohol Abuse and Alcoholism, May 2002. http://www.niaaa.nih.gov/publications/booklet.htm. Accessed 10/23/2003.
12. U.S. Census Bureau. Population Clock: 2004 US Population. http://census.gov. Accessed 9/17/2004.

20 Part I / Preventive Nutrition Overview
13. Hobbs F, Stoops N. US Census Bureau. Demographic Trends in the 20th Century, Census 2000Special Reports, Series CENSR-4. Washington, DC: U.S. Government Printing Office, November2002. http://www.census.gov/prod/2002pubs/censr-4.pdf. Accessed 10/6/2003.
14. Centers for Disease Control, National Center for Health Statistics: Chartbook on Trends in the Healthof Americans, In Health, United States, 2003. Hyattsville, MD: NCHS. 2003. http://www.cdc.gov/nchs/data/hus/hus03cht.pdf. Accessed 10/6/2003.
15. US Census Bureau. Projections of the Total Resident Population by 5-year Age Groups and Sex withSpecial Age Categories: Middle Series, 2006 to 2010 through 2050 to 2070. January 2000.http://www.census.gov/population/projections/nation/summary/np-t3-c.txt and http://www.census.gov/population/projections/nation/summary/np-t3-f.txt. Accessed 10/6/ 2003.
16. US Department of Health and Human Services. Food and Drug Administration. Food Labeling;General provisions; nutrition labeling; label format; nutrient content claims; health claims; ingredi-ent labeling; state and local requirements; and exemptions; Proposed Rules. Federal Register 1991;Vol. 56, No. 229, 60869–60973, November 27.
17. US Department of Health and Human Services. Food and Drug Administration. Food Labeling;General provisions; nutrition labeling; label format; nutrient content claims; health claims; ingredi-ent labeling; state and local requirements; and exemptions; Final Rules. Federal Register 1993; Vol.58, No. 3, 2935–2941, January 6.
18. US Department of Health and Human Services. Food and Drug Administration. Food Standards:Amendment of the standards of identity for enriched grain products to require addition of folic acid.Federal Register 1993; Vol. 58, No. 197, 5305–5312, October 14.
19. US Department of Health and Human Services. Food and Drug Administration. Food Labeling:Trans fatty acids in nutrition labeling; Consumer research to consider nutrient content and healthclaims and possible footnote and disclosure statements; Final rule and Proposed Rule. FederalRegister 2003; Vol. 68, No. 133, 41487–41490; Tables 10, 11a, 11b, and 12; July 11.
20. Finkelstein EA, Fiebelkorn IC,Wang G. National Medical Spending Attributable to Overweight andObesity: How Much, and Who’s Paying? Health Affairs Web Exclusives, January–June 2003; vol.1:219–226. http://content.healthaffairs.org/cgi/conetnt/full/h/thaff.w3.219vl/DCI. Accessed 10/30/2003.
21. US Department of Health and Human Services. The Surgeon General’s Call to Action to Prevent andDecrease Overweight and Obesity, 2001. Rockville, MD: US Department of Health and HumanServices, Public Health Service. Office of the Surgeon General, 2001. http://www.surgeon-general.gov/topics/obesity/calltoaction/CalltoAction.pdf. Accessed 10/24/2003.
22. Frazâo E. High costs of poor eating patterns in the United States. In: Frazao, E, ed. America’s EatingHabits: Changes and Consequences. US Department of Agriculture, Economics Research Service,Food and Rural Economics Division. Agriculture Information Bulletin No. 750, 1999, pp. 5–32.
23. Institute of Medicine, Food and Nutrition Board. How Should the Recommended DietaryAllowances be Revised? National Academy Press, Washington, DC, 1994.
24. Institute of Medicine, Food and Nutrition Board. Use of Dietary References Intakes in NutritionLabeling. National Academy Press,Washington, DC, 2003.
25. White House Conference. White House Conference on Food, Nutrition and Health, Final Report.Washington, DC: US Government Printing Office, 1970.
26. US Department of Agriculture. Economic Research Service: The Food Assistance Landscape,September 2003. Food Assistance and Nutrition Research Report No. 28–3. September 2003. http://www.ers.usda.gov/publications/fanrr28–3/fanrr28–3.pdf. Accessed 10/16/2003.
27. US Department of Agriculture. Economic Research Service. Do Healthy School Lunches Cost More?Food and Nutrition Research Report No. 34–6. July 2003. http://www.ers.usda.gov/publications/fanrr34/fanrr34–6/fanrr34–6.pdf. Accessed 9/8/2003.
28. US Department of Agriculture. Economic Research Service. Food and Alcoholic Beverages: TotalExpenditures. June 2003. http://www.ers.usda.gov/Briefing/CPIFoodAndExpenditures/Data/table1.htm. Accessed 10/29/2003.
29. Gallo AE. Food Advertising in the United States. In: America’s Eating Habits, Changes andConsequences. US Department of Agriculture, Economics Research Service, Food and RuralEconomics Division. Agriculture Information Bulletin No. 750, 1999, pp. 173–180.
30. Elitzak H. Food Marketing Costs at a Glance. Food Review, September–December 2001; 24(3):47,48.31. US Department of Agriculture. Economic Research Service. Food Consumption (per capita) Data
System. http://www.ers.usda.gov/data/foodconsumption/. Accessed 8/13/2003.

Chapter 1 / Historic Perspective and Economic Outlook 21
32. US Department of Agriculture. Nutrient Content of the US Food Supply, 1909–1994. HomeEconomics Research Report No. 53, October, 1997. http://www.foodcount.com/nutrition/pdf/nutrientcontent.pdf. Accessed 10/24/2003.
33. Putnam J, Kantor LS, Allshouse J. Per Capita Food Supply Trends: Progress toward DietaryGuidelines. Food Review, 2000; 23(3):2–14. http://www.ers.usda.gov/publications/foodreview/septdec00/FRsept00a.pdf. Accessed 10/24/2003.
34. The Food Institute. New Product Introductions, 1997–2001. In: Food Industry Review 2002. TheFood Institute, Elmwood Park, NJ, 2002.
35. Sloan AE. Top 10 trends to watch and work on: 2003. Food Technol 2003; 57(4):30–49.36. Sloan AE. Healthier, heartier, and more-sophisticated products exhibited. Food Technol 2003;
57(9):64–69.37. Nutrition and Your Health: Dietary Guidelines for Americans. 5th ed. Home and Garden Bulletin No.
232. Washington, DC: US Department of Agriculture and US Department of Health and HumanServices, 2000.
38. National Cholesterol Education Program. Third Report of the National Cholesterol EducationProgram (NCEP) Expert Panel on Detection, Evaluation and Treatment of High Blood Cholesterolin Adults (Adult Treatment Panel III). Final Report. Circulation December 17–24 2002;106:3143–3421.
39. Leibtag E. The Outlook for Food Prices in 2003. Economic Research Service, US Departmentof Agriculture. Agriculture Outlook Forum. February 21, 2003. http://www.usda.gov/oce/waob/oc2003/speeches/leibtag.doc. Accessed 10/23/2003.
40. Lin B, Guthrie J, Frazâo E. Nutrient Contribution of Food Away From Home. In: America’s EatingHabits, Changes and Consequences. Food and Rural Economics Division. Economics ResearchService. U.S. Department of Agriculture. Agriculture Information Bulletin No. 750. 1999; 213–242.
41. Food Marketing Institute. Trends in the United States 2002. Washington, DC: Food MarketingInstitute, 2002.
42. Discovery Health Pulse. Top-Line Poll Results. Penn, Schoen & Berland Associates, Washington,DC, 1999.
43. Food Marketing Institute. Trends in the United States 2003. Washington, DC: Food MarketingInstitute, 2003.
44. Food Marketing Institute. Shopping for Health—2002 report. Washington, DC: Food MarketingInstitute, 2002.
45. National High Blood Pressure Education Program. The Seventh Report of the Joint National Committeeon Prevention, Detection, Evaluation and Treatment of High Blood Pressure. National Institutes ofHealth. National Heart, Lung and Blood Institute. NIH Publication No. 03–5233. Washington, DC: USDepartment of Health and Human Services, May 2003.
46. Flegal KM, Carroll MD, Ogden CL, Johnson CL. Prevalence and trends in obesity among US adults,1999–2000. JAMA 2002; 288(14):1723–1727.
47. Ogden CL, Flegal KM, Carroll MD, Johnson CL. Prevalence and trends in obesity among USchildren and adolescents, 1999–2000. JAMA 2002; 288(14):1728–1732.
48. Centers for Disease Control, National Center for Health Statistics: Cholesterol Status among Adultsin the US. Washington, DC: US Department of Health and Human Services, July 2003. http://www.cdc.gov/nchs/data/nhanes/databriefs/adultcholesterol.pdf. Accessed 9/8/2003.
49. Ford ES, Mokdad AH, Giles WH, Mensah GA. Serum total cholesterol concentrations and aware-ness, treatment, and control of hypercholesterolemia among US adults. Findings from the NationalHealth and Nutrition Examination Survey, 1999 to 2000. Circulation 2003; 107(17):2185–2189.
50. Hajjar I, Kotchen TA. Trends in prevalence, awareness, treatment, and control of hypertension in theUnited States, 1988–2000. JAMA 2003; 290(2):199–206.
51. Kottke TE, Stroebel RJ, Hoffman RS. JNC-7—It’s more than blood pressure. JAMA 2003;289(19):2573,2574.
52. Collins FS, Green ED, Guttmacher AE, Guyer MS. A vision for the future of genomics research.Nature 2003; 422:835–847.
53. Osborn HT, Akoh CC. Structured Lipids—Novel fats with medical, nutraceutical, and food applica-tions. Comp Rev Food Science Food Safety 2002;3:93–103.
54. MacLeod SM, McCullough HN. Social science education as a component of medical training. SocScience Med 1994; 39(9):1367–1373.

22 Part I / Preventive Nutrition Overview
55. Institute of Medicine, Food and Nutrition Board. Dietary Reference Intakes for Energy,Carbohydrate, Fiber, Fat, Fatty Acids, Cholesterol, Protein, and Amino Acids. National AcademyPress,Washington, DC, 2002.
56. Institute of Medicine, Food and Nutrition Board: Evolution of Evidence for Selected Nutrient andDisease Relationships. National Academy Press, Washington, DC, 2002.
57. Dietary Guidelines Advisory Committee. Report of the Dietary Guidelines advisory Committee onthe Dieatary Guidelines, 2005. Washington, DC: US Department of Agriculture and US Departmentof Health and Human Services. http://www.health.gov/dietaryguidelines/dga2005/report/. Accessed9/17/2004.
58. Pearson TA, Stone EJ, Grundy SM, McBride PE, Van Horn L, Tobin BW for the NAA CollaborativeGroup. Translation of nutritional sciences into medical education: the Nutrition Academic AwardProgram. Am J Clin Nutr 2001; 74:164–170.
59. Sebrell H. Trends and needs in nutrition. JAMA 1953; 152:42–44.

II CANCER PREVENTION


From: Preventive Nutrition: The Comprehensive Guide for Health Professionals, 2nd ed.Edited by: A. Bendich and R. J. Deckelbaum © Humana Press Inc., Totowa, NJ
25
2 Prevention of Cancersof the Esophagus and Stomach
Elizabeth T. H. Fontham and L. Joseph Su
KEY POINTS
● Prevention of both tobacco use and heavy alcohol consumption are key factors in pri-mary prevention of cancer of the upper gastrointestinal (GI) tract.
● Consumption of fruits and vegetables is lower than optimal in the United States, andincreased consumption of these foods has beneficial effects on the prevention ofesophageal and stomach cancers as well as other major chronic diseases.
● Specific micronutrients or combinations of micronutrients may be effective in theprevention of upper GI tract cancers, but this has not yet been firmly established inrandomized controlled trials.
● Helicobacter pylori is a gastric carcinogen. A relatively small proportion of personsinfected with H. pylori are ultimately diagnosed with gastric cancer; therefore, anunderstanding of the cofactors in this process is an important area of research.
● Barrett’s esophagus is believed to be a premalignant lesion for esophageal adeno-carcinoma. Obesity, as determined by elevated body mass index, is also associatedwith adenocarcinoma of the esophagus, the rates of which are increasing in theUnited States.
1. INTRODUCTION
This chapter focuses on lifestyle factors that are associated with cancers of the esoph-agus and stomach. Unlike such major cancers as prostate and breast, whose etiologiespresently remain obscure (hindering primary prevention), cancers of the upper gas-trointestinal (GI) tract offer well-defined intervention opportunities. Epidemiologicalstudies have clearly established the important role of alcohol, tobacco, and diet, andrecent findings have documented the relationship between infection with Helicobacterpylori and cancers of the upper GI tract. These factors and their interactions are dis-cussed for cancers of each of these two sites, which together account for approx 35,000new cases and 26,000 deaths annually in the United States (1).

26 Part II / Cancer Prevention
2. CANCER OF THE ESOPHAGUS
For many years, cancer of the esophagus in the United States, and in most areas world-wide, was virtually synonymous with squamous cell carcinoma (2). Therefore, most ofthe established risk factors for esophageal cancer are specific to this cell type, whichcomprised the vast majority of cases in studies of this cancer. Recent shifts in thehistopathological cell type have given rise to a rapid increase in the incidence of adeno-carcinoma of the esophagus in the United States, particularly among white males (3,4).Because of the increasing importance of esophageal adenocarcinoma, a separate sectiondiscusses this entity, which may differ in etiology from squamous cell carcinoma.
2.1. Squamous Cell Carcinoma2.1.1. TOBACCO AND ALCOHOL CONSUMPTION
Both tobacco and heavy alcohol consumption are well-established risk factors foresophageal carcinoma for both men and women. In the United States and other Westerncountries, more than 90% of the risk can be attributed to the individual and joint effectsof tobacco and alcohol (5).
An early study by Wynder and Bross (6) graphically examined the interactionbetween alcohol and tobacco, and the data suggested a multiplicative effect. Tuyns etal. (7) more formally evaluated this relationship in data from a case–control study inBrittany. At the highest level of consumption of both alcohol (≥121 g of ethanol perday) and tobacco (≥30 g/d), the relative risk of esophageal cancer was 156 compared tothat of non- or light consumers. The increased risk associated with alcohol consumptionappears exponential, whereas increased tobacco smoking appears to yield a more linearincrease. Saracci (8) estimated that the excess risk because of the interaction of alcoholand tobacco is about 25-fold.
Data from a case–control study in Italy are presented in Table 1 (9). Study subjectsincluded 271 male cases and 1754 male controls with acute illnesses unrelated totobacco and alcohol consumption. Even with a reference category that included moderatealcohol consumption (<35 drinks/wk) by nonsmokers, the estimated relative risk ofesophageal cancer among heavy smokers (≥25 cigarettes/d for 40 yr or more) and veryheavy drinkers (≥60 drinks/wk) was 22. In 1994, this report was updated to includewomen (10). Among alcohol drinkers (any vs none), similar risks were observed forwomen and men (3.0 and 4.7, respectively); however, male abstainers had a twofoldincreased risk, whereas female nondrinkers had a reduced risk (0.7) compared withlight-to-moderate drinkers. This study of esophageal cancer failed to support thehypothesis posed by Blume (11) that women may be more susceptible to the effects ofalcohol—at least for this particular cancer site. A recent analysis pooled data from threecase–control studies in the provinces of Milan and Pordenone (1984–1993) (12), theprovinces of Padua and Pordenone and the greater Milan area in northern Italy(1992–1997) (13), and in the Swiss Canton of Vaud (1992–1999) (14). The studiesexamined 114 female cases of squamous cell esophageal cancer and 425 female controlsand concluded that,similarly to men in northern Italy and Switzerland, tobacco smokingand alcohol drinking are the most important risk factors for this neoplasm in women inthese regions (15). An additive interaction (odds ratio [OR] = 12.75) was observed forcurrent smokers with heavy drinking more than three drinks a day).
A Japanese study by Hanaoka et al. (16) and a study in northern Italy by Zambon et al.(17) recently examined whether the increased risk of esophageal cancer attributed to

Chapter 2 / Cancers of the Esophagus and Stomach 27
alcohol use is a function of the dose of ethanol or whether the type of alcoholic bever-age and its other constituents play a role in esophageal cancer. Their findings confirmedthose of others, which indicated that the amount of alcohol consumed, rather than anyparticular type, is the primary determinant of risk.
The relationship between the role of tar yield of cigarettes and esophageal cancer hasonly been recently examined. The tar-yield of cigarettes has decreased over the last fewdecades (18), which may have influenced the recent trend of declining mortality fromupper digestive tract neoplasms in males in several industrialized European countries(19,20). An earlier study in northern Italy reported an odds ratio of 2.3 for esophagealcancer in high-tar cigarette smokers compared with low-tar smokers (21,22). The recentanalysis of results from two case–control studies (from Italy and Switzerland) thatinvolved 395 squamous cell esophageal cancer cases and 1066 matched controls con-cluded that there is a direct relationship between tar yield of cigarettes and esophagealcancer. The odds ratios for current smokers compared to those who had never smokedwere 4.8 and 5.4 for less than 20 mg and greater than 20 mg of tar, respectively, foresophageal cancer based on the brand of cigarette smoked for the longest time (23).
2.1.2. THERMAL IRRITATION
Thermal injury as a result of drinking very hot liquids has been suggested to increasethe risk of esophageal cancer by increasing susceptibility to other carcinogenic exposures(24–26). This hypothesis has received some support from both ecological and analyticalstudies. Persons living in regions of the world that have high rates of esophageal cancer,such as northern Iran and Siberia, are reported to drink excessively hot tea (27,28).
In Puerto Rico, Martinez (29) found that more cases than controls reported drinkinghot, rather than warm or cold, coffee. Both Segi (30) and Hirayama (31) found anincreased risk of esophageal cancer in persons consuming hot tea gruel. In LatinAmerica, several studies have examined the role of maté drinking. DeStefani et al. (32)found a strong association between hot maté consumption and risk of esophageal cancerin Uruguay. An earlier case–control study in Brazil failed to find a significant association(33). In 1994, Castelletto et al. (34) examined the role of maté in an Argentineancase–control study. They found alcohol, tobacco, and barbecued meat—but not hotmaté—to be the primary risk factors. However, hot maté consumption was found to besignificantly associated with precancerous lesions of the esophagus in a cross-sectionalendoscopic survey in southern Brazil (35).
Table 1Adjusted Odds Ratiosa for Cancer of the Esophagus by Alcohol and Tobacco Consumption
Alcohol (drinks per week)
Smoking status <35 35–59 60+
Nonsmoker 1.0b 2.2 2.6Light 2.1 4.4 5.5Moderate 4.4 9.7 11.4Heavy 8.4 18.5 21.8
aAdjusted for age, residence, education, and profession.bReference category.(Adapted from ref. 9.)

28 Part II / Cancer Prevention
A study of chronic esophagitis, a precursor lesion for esophageal cancer, in a high-riskregion in China lended support to an etiological role of thermal injury (36). A greater thanfourfold excess of mild and moderate esophagitis was found in young persons ages 15 to26 yr who consumed burning hot beverages (OR = 4.39, 95% confidence interval [CI]1.72–11.3). This study design minimized recall/response bias because case–control statuswas not known at the time of interview and suggests that this factor may be important ata relatively early stage in the development of this cancer.
2.1.3. NUTRITION
2.1.3.1. Dietary Studies. In studies worldwide, fruits and fresh vegetables are con-sistently associated with decreased risk of esophageal cancer, even after controlling fortobacco and alcohol use. Deficiencies of vitamin C, one of several micronutrients con-tained in fruits and vegetables, have been reported in several areas of the world thathave exceptionally high rates of esophageal cancer. These include northern Iran (27),Linxian County, China (37), northern and eastern Siberia (28), and Hungary (38),among others. Other dietary deficiencies are also strongly associated with esophagealcancer risk; these include iron, riboflavin, niacin, molybdenium, zinc, and other traceelements (39,40).
The 1961 report by Wynder and Bross (6) noted significantly lower consumption levelsof green and yellow vegetables among male cases compared to controls as well as anonsignificantly lower consumption level of fruit. A case–control study in Singaporedetermined that potatoes (relative risk [RR] = 0.4; p < 0.05) and bananas (RR = 0.3;p <0.01) are protective (41). Frequent consumption of 16 different fruits and vegetableswas associated with decreased risk of esophageal cancer in Iran (42). Relative risks forhigh versus low consumption levels ranged from 0.4 to 0.9, and findings for 10 of the16 foods were significantly protective. Similar findings were reported in a case–controlstudy in northern Italy (43). High consumption of raw vegetables, citrus fruit, and otherfruits were inversely associated with esophageal cancer, with odds ratios of 0.3, 0.4, and0.5, respectively, after accounting for smoking and drinking.
A significant inverse trend (p < 0.001) was reported between monthly vitamin C con-sumption and esophageal cancer in white males in New York State (39). A weaker but sig-nificant inverse association was observed for vitamin A intake (p = 0.03). A fivefoldreduction in risk was also found in the highest tertile of fruit and vegetable consumption(>81 times/mo). A report from New York found no association with vitamin C that wasderived from vegetables (44). However, in this study, only 24% of the eligible cases wereincluded, and they may not be representative of the total series of cases.
Ziegler et al. (45) found significant inverse associations between relative risk ofesophageal cancer and five indicators of general nutritional status, including total fruitand vegetable consumption (RR=0.5; p-trend<0.05). This case–control study focusedon high-risk African-American males in Washington, DC. An index of vitamin Cintake yielded an estimated relative risk of 0.55 (p-trend < 0.05) for the highest tertileof consumption. The only other micronutrient significantly inversely associated withrisk was riboflavin.
Two case–control studies conducted in the high-risk region of Calvados, France,demonstrated a protective effect of vitamin C on esophageal cancer risk (46,47).Approximately threefold significant reductions in risk were observed at the highestlevel of intake of citrus fruits and dietary vitamin C. Similarly, DeCarli et al. (48)

Chapter 2 / Cancers of the Esophagus and Stomach 29
reported a relative risk of 0.3 (95% CI 0.1–0.6) for high-level fruit consumption andnonsignificant reductions in risk for high-level vegetable intake. In India, Notani andJayant (49) found a more modest reduction from high-level fruit intake (RR = 0.8,95% CI 0.5–1.3) but a significant risk reduction among daily consumers of vegetables(RR = 0.4, 95% CI 0.2–0.7).
Two 1988 reports supported the findings of others that were indicative of protectionfrom high intake of dietary vitamin C and fresh fruits (50,51). Brown et al. (50) founda significant halving in risk in the highest tertile of consumption of citrus fruit, all fruitscombined, and dietary vitamin C (p<0.05). A study conducted in California by Yu et al.(51) showed a relative risk of 0.4 (95% CI 0.2–0.8) for high-level consumption of rawvegetables and fresh fruit. Li et al. (52) found no reduction in esophageal cancer riskassociated with fruit consumption in a high-risk region of China; however, a homoge-neously low level of intake of fruit in this population makes it a poor one in which toevaluate the association (53). In a large case–control study in Hong Kong, Cheng et al.(54) reported strong protective effects (p-trend<0.001) associated with consumption ofcitrus fruits and other fruits. The proportion of esophageal cancer cases attributable tolow-consumption levels of citrus fruits in this population was estimated to be 26%. Aretrospective cohort study of esophageal cancer in Linxian, China, reported a significantreduction in risk associated with regular consumption of fresh vegetables (RR = 0.66,95% CI 0.44–0.99) (55).
A large Italian study of esophageal cancer in lifelong nonsmokers afforded the oppor-tunity to evaluate other risk factors in the absence of residual confounding by tobaccouse (56). Although the major risk factor was not unexpectedly alcohol, green vegetablesand fresh fruit were associated with significantly reduced relative risks of 0.6 and 0.3,respectively. Similar reductions in risk were associated with β-carotene intake. Theestimated relative risk for the combination of high alcohol and low β-carotene was 8.6,with an attributable risk of approx 45%.
In addition to fruits and vegetables and their constituent micronutrients, several otherdietary factors have been proposed as candidate protective factors, although the epi-demiological evidence is currently considerably more limited. One such factor is greentea, Camellia sinensis (see Chapter 3). Experimental studies have demonstrated antimu-tagenic and anticarcinogenic effects, especially in the esophagus (57–60). Findings in arecent population-based, case–control study in China provided some support to thishypothesis (61). After adjustment for confounders, including tobacco and alcohol, a sig-nificant halving of risk was observed in women drinking green tea (OR = 0.50, 95% CI0.30–0.83), and an inverse dose–response was observed. The findings in men were notstatistically significant; however, a significant protective effect was observed in bothmen and women who did not smoke or drink alcohol. Because green tea, as well asother drinks, can be consumed at hot temperatures, and because excessively hot fluidshave been associated with increased risk of this cancer, the relationship between drinkingburning-hot fluids was also evaluated. The protective effect of green tea was limited totea taken at normal temperatures. A more recent case–control study by Ke et al. (62),which involved 1248 cases and the same number of controls in a high-risk region foresophageal cancer in south China, examined the relationship between esophageal can-cer and drinking Congou tea, a type of black tea grown in China. An inverse associa-tion was observed between consumption of Congou tea (OR = 0.4, 95% CI 0.28–0.57)and a strong dose–response relationship (p < 0.001) after adjusting for alcohol drinking

30 Part II / Cancer Prevention
and smoking. The reduced risk was more pronounced if Congou tea was consumed hot(OR = 0.04, 95% CI 0.01–0.13) rather than cold.
Ginseng, which may be taken as a tea, powder, or as a slice of the root, has also beenproposed as a potential anticarcinogen. Unlike the polyphenols in green tea, no specificcomponent or mechanism has been elaborated (63,64). Yun and Choi (64) reported acase–control study in Korea, where ginseng is commonly used. The relative risk ofesophageal cancer associated with ginseng intake was 0.20 (95% CI 0.09–0.38) afteradjustment for tobacco, alcohol, and other confounders. This large reduction in risk wasobserved in both smokers and nonsmokers. Additional studies are obviously necessaryto confirm this preliminary finding.
2.1.3.2. Biochemical Studies. Numerous studies have examined biochemical nutri-tional indicators in blood or tissue, with a particular focus on antioxidants. Chen et al.(65) collected blood specimens from a sample of the population in 65 different countiesin China and correlated the concentration of more than 10 different antioxidants withcounty-specific mortality rates for several cancers, including esophageal cancer. Ahighly significant inverse relationship was found between esophageal cancer rates andboth plasma ascorbic acid and selenium in men and selenium in women. Another studyin a high-risk region of China found low levels of zinc (66). A recent population-based,case–control study conducted in Washington (67) found no significant difference in nailzinc concentrations between esophageal cancer cases and controls but found a large andsignificant reduction in risk associated with dietary intake of zinc from foods and sup-plements (ORs of 0.5 and 0.1 for the middle and upper tertile of consumption, respec-tively; p-trend<0.001). Other elements in nail tissue associated with esophageal cancerwere iron (OR=2.9 for high vs low levels), calcium (OR=2.6), and cobalt (OR=1.9).Although this study suggests a number of differences in mineral levels of cases andcontrols that reflect differences in intake, metabolism, or both, additional investigationis warranted to determine which, if any, of these findings is etiologically meaningful.
2.1.3.3. Chemoprevention Studies. Chemoprevention, as defined by Sporn andNewton (68), is prevention of cancer with pharmacological agents used to inhibit orreverse the process of carcinogenesis. In this relatively new field, which has grown inacceptance since the 1980s, esophageal cancer is one of the first cancer sites for whichresults from completed trials are available.
In 1985, Munoz et al. (69) reported findings from the first short-term interventiontrial. A total of 610 subjects ages 35 to 64 yr in the high-risk region of Huixian, China,were randomized to receive 15 mg (50,000 IU) of retinol, 200 mg of riboflavin, and 50mg of zinc or placebo once per week for 13.5 mo. A total of 567 participants completedthe trial and underwent endoscopy for histological diagnosis of premalignant lesions ofthe esophagus (esophagitis, atrophy, dysplasia). The combined treatment had no effecton the prevalence of precancerous lesions of the esophagus. However, it should benoted that the dose was relatively small and the intervention period was short.Micronuclei in exfoliated cells of buccal and esophageal mucosa were evaluated in 170study subjects from this same trial as an indicator of chromosomal damage (70). Noreduction in the prevalence of micronuclei was found in buccal mucosa of subjects aftertreatment, but a significant reduction in the percentage of micronucleated cells inesophageal mucosa was observed in treated subjects (0.19%) compared to the placebogroup (0.31%; p = 0.04). In a third report from this same trial, Wahrendorf et al. (71)re-analyzed data by blood levels of retinol, riboflavin, and zinc at the beginning and end

Chapter 2 / Cancers of the Esophagus and Stomach 31
of the trial, because improvement in blood retinol and zinc levels had been observed in theplacebo group as well as the actively treated group. Individuals who had large increases inretinol, riboflavin, and zinc blood levels were more likely to have a histologically normalesophagus at the end of the trial, regardless of treatment group.
Two large intervention studies conducted in the high-risk population of Linxian werereported in the mid-1990s (72,73). A 6-yr randomized trial of daily vitamin/mineral sup-plementation versus placebo found no significant reductions in cancer incidence ormortality among adults with pre-existing precancerous lesions of the esophagus (72,74).The larger trial in this area included 29,584 subjects from the general population whowere randomly allocated to combinations of retinol and zinc; riboflavin and niacin; vit-amin C and molybdenum; and/or β-carotene, vitamin E, and selenium in doses of oneto two times the US Recommended Daily Allowances (RDAs). Significantly reducedtotal mortality (RR = 0.91, 95% CI 0.84–0.99) and stomach cancer mortality (RR=0.79,95% CI 0.64–0.99) were observed in those taking β-carotene, vitamin E, and selenium.No significant effects on mortality or cancer incidence, including esophageal cancer,were observed for any of the other vitamin/mineral combinations.
Wang et al. (75) evaluated whether any of the vitamin/mineral supplement combina-tions affected the prevalence of clinically silent precancerous lesions and early invasivecancers of the esophagus and stomach, as determined by endoscopy and biopsy in thissame trial. No significant reductions in risk of dysplasia or cancer were observed forany of the supplements, although retinol and zinc were suggestively associated with alower risk of gastric cancer (OR = 0.38; p = 0.09). Similarly, Dawsey et al. (76) evalu-ated the effect of the single vitamin/mineral supplement used in the trial of persons withesophageal dysplasia to determine if treatment reduced the prevalence of histologicaldysplasia or early cancer of the esophagus or gastric cardia. Modest, nonsignificant riskreductions were observed compared to placebo (OR = 0.86, 95% CI 0.54–1.38). Theauthors concluded that longer interventions with larger numbers of subjects are requiredto adequately evaluate the effectiveness of micronutrient supplementation in this high-risk population. In subjects from the same trial, Rao et al. (77) evaluated whetherepithelial proliferation, an early step in carcinogenesis, was reduced by treatment after30 mo of intervention. The results were similarly inconclusive.
A total of 778 subjects from the Linxian and Huixian China studies were followed withlinear repeated biopsies and histopathology examination for 11 yr (1989–2000). Of these,400 subjects with different severity of esophageal precancerous lesions were randomlydivided into two groups for intervention studies in which either calcium , decaffeinatedgreen tea, or placebo were administered daily for approx 1 yr (78). The study concludedthat there was no beneficial effect from either calcium or decaffeinated green tea inalleviating esophageal precancerous lesions and abnormal cell proliferation patterns.
2.2. Adenocarcinoma2.2.1. BARRETT’S ESOPHAGUS AND MEDICATIONS
Barrett’s esophagus is characterized by the replacement of the lower esophagus,which is normally stratified squamous epithelium, by metaplastic columnar epithelium(79). This condition, attributed to chronic esophageal reflux, is believed to be a prema-lignant lesion for esophageal adenocarcinoma (80).
Similarly to esophageal adenocarcinoma, Barrett’s esophagus displays a similar age,race, and gender distribution: it is most common in Caucasian males over age 40 yr (3,81).

32 Part II / Cancer Prevention
The reported incidence of esophageal adenocarcinoma in patients with Barrett’s is from 30to more than 100 times greater than the rate observed in the general population (81–84).
There also appears to be a familial form of this disease, inherited as an autosomaldominant trait (85–87). Recent reports of families with the inherited form of Barrett’sprovided additional support for Barrett’s as a precursor lesion (85,87).
A related hypothesis has proposed that the use of medications that relax theesophageal sphincter, thereby promoting reflux, may increase risk of adenocarcinomasof the esophagus and gastric cardia (88). Histamine H2 receptor antagonists used rou-tinely for treatment of peptic ulcer and gastroesophageal reflux disease have also beenproposed as an etiological factor (89). In a 1995 report, Chow et al. (90) examined therelationship between reflux disease and its treatment to risk of adenocarcinomas of theesophagus and gastric cardia. Significant increased risks of adenocarcinoma were asso-ciated with esophageal reflux (OR=2.1, 95% CI 1.2–3.6), hiatal hernia (OR=3.8, 95%CI 1.9–7.6), and esophagitis/esophageal ulcer (5.0, 95% CI 1.5–16.4). Although a four-fold increased risk was associated with four or more prescriptions for H2 antagonists,the odds ratio was reduced to 1.5 (95% CI 0.4–5.4) after adjusting for predisposing con-ditions. The relationship with use of anticholinergics adjusted for number of conditions wasactually inverse: risk decreased with increasing number of prescriptions (p-trend = 0.08).The study findings support the elevated risk of adenocarcinoma conferred by refluxdisease but indicate that the mechanism is not strongly related to treatment of reflux. Aninteresting finding indicates an increased risk of esophageal adenocarcinoma amonglong-term users of drugs that containing theophylline (91). The significance of thisfinding is linked to the rising incidence of asthma and increasing use of asthma med-ications in the general population and its association with reflux disease. However, aSwedish cohort study followed 92,986 adult patients who were hospitalized for asthmafrom 1965 to 1994 for an average of 8.5 yr to evaluate their risk of esophageal adeno-carcinoma (92). The study findings suggested that the excess risks for the cancer werelargely restricted to asthmatic patients who also had a discharge record of gastro-esophageal reflux (standardized incidence ratio [SIR] = 7.5, 95% CI 1.6–22.0). No asso-ciation was found for nonreflux asthmatic patients.
2.2.2. TOBACCO AND ALCOHOL
Two population-based studies of cancers of the esophagus and gastric cardia con-ducted in western Washington from 1983 to 1990 were analyzed to evaluate risk factorsfor adenocarcinoma compared to squamous cell carcinoma (93). Use of alcohol and cig-arettes were significantly associated with increased risk of both histological types, butthe odds ratios were markedly higher for squamous cell carcinoma. For current smokersof 80 or more packs per year compared to nonsmokers, the odds ratios were 16.9 (95%CI 4.1–6.91) for squamous cell carcinoma and 3.4 (95% CI 1.4–8.0) for adenocarci-noma. Similarly, for persons who reported drinking 21 or more drinks per week com-pared to less than 7 drinks per week, the respective odds ratios were 9.5 (95% CI4.1–22.3) and 1.8 (95% CI 1.1–3.1). Population-attributable risk estimates found thatcigarette smoking and alcohol together accounted for 87% of the squamous cell carci-nomas, whereas for adenocarcinoma, the estimates for cigarettes and alcohol consumptionof seven or more drinks per week were 34 and 10%, respectively.
Estimates by Kabat et al. (94) of esophageal adenocarcinoma risk for alcohol andtobacco use were similar; for current smokers, the OR was 2.3 (95% CI 1.4–3.9), and for

Chapter 2 / Cancers of the Esophagus and Stomach 33
alcohol drinkers who comsumed 4+ oz of whiskey-equivalents per week, the OR was1.9 (95% CI 1.3–4.3). Brown et al. (95) also reported that tobacco and alcohol arelikely etiological factors but conferred lower magnitude risk than that associated withsquamous cell cancers. The odds ratios at the highest level of smoking (>40 ciga-rettes/d) and drinking (>29 drinks/wk) were 2.6 (p-trend<0.01) and 2.8 (p-trend< 0.05),respectively. Their study included Caucasian men from Atlanta, Detroit, and NewJersey. Significantly increased risks were also found associated with history of ulcer,especially duodenal, and with low social class. The authors noted that although alcoholand tobacco use are associated with esophageal adenocarcinoma, they do not explainthe increased incidence in these tumors in the United States.
In 1997, a multicenter study of esophageal and gastric cancers reported an increasedrisk of squamous cell carcinoma and adenocarcinoma of the esophagus and adenocar-cinomas of all sites in the stomach among smokers (96). Current smokers had a two- tothreefold increased risk of adenocarcinomas of the esophagus and gastric cardia com-pared to a fivefold increased risk of squamous cell carcinoma of the esophagus.Although risk of these squamous cell tumors declined with duration of smoking cessation,risks of esophageal and cardia adenocarcinomas remained significantly elevated formore than 30 yr after cessation. This long lag suggests that the effect of tobacco on thesetumors may be on tumor initiation.
2.2.3. OBESITY AND DIET
Two recent reports linked obesity to adenocarcinoma of the esophagus (93,97). Athreefold increased risk (p <0.01) was observed at the highest level of body mass index(BMI) (>26.6 kg/m2) compared to the lowest level of BMI in Caucasian men (97). Nosignificant associations were found for dietary fat, total calories, meals eaten per day, orconsumption of coffee and tea. A protective effect was observed for high intake of rawfruit (OR = 0.4; p < 0.05) and vegetables (OR = 0.4; p < 0.05). Vaughan et al. (93)reported divergent associations for squamous cell carcinoma and adenocarcinoma withBMI. A significantly increased risk of adenocarcinoma was found at the highest decileof BMI (OR = 1.9, 95% CI 1.1–3.2), whereas body mass was inversely associated withsquamous cell carcinoma. The population-attributable risk for BMI above the 50th per-centile was 18% for adenocarcinoma. These observations are consistent withesophageal reflux associated with obesity. These reports were confirmed in a large mul-ticenter, population-based, case–control study (98) in which obesity measured by BMIwas found to be a strong risk factor for esophageal adenocarcinoma and a moderate riskfactor for adenocarcinoma of the gastric cardia. The authors suggested that the increas-ing rates of adenocarcinomas of the esophagus and cardia may partly be explained bythe increasing prevalence of obesity in the US population.
2.2.4. HELICOBACTER PYLORI
Peptic ulcer disease and gastric cancer of the antrum and body have been declining inrecent decades (1,99). In contrast, gastroesophageal reflux disease, Barrett’s esophagus,and esophageal adenocarcinoma rates have increased rapidly, particularly in theWestern countries. Recent studies (100–102) have suggested that this phenomenon maybe related to the simultaneous fall in the prevalence of H. pylori. A Swedish cohort of32,906 middle-aged subjects enrolled between 1974 and 1992 were followed throughApril 1999 (101). H. pylori infection was determined through analysis of H. pylori antigen

34 Part II / Cancer Prevention
in blood samples. A nested case–control study of 49 esophageal cancer cases and 10matched sets of controls were included in the analysis. Unexpectedly, H. pylori seropos-itivity was present in 22.7% cases and 45.0% of controls. After adjusting for confound-ing factors, esophageal cancer was associated with H. pylori infection (OR=0.29, 95%CI 0.12–0.67). The inverse association between H. pylori infection and cancer of theesophagus is stronger for esophageal adenocarcinoma (OR = 0.16) than for squamouscell carcinoma (OR = 0.41). However, the histologically specific associations did notreach statistical significance because of the small number of cases. This finding as wellas several others have sometimes been reported as H. pylori infection “protects” againstesophagus cancer (103,104). It is possible that decreased gastroesophageal refluxamong people infected with H. pylori reduces the risk for developing an esophagus can-cer. However, factors responsible for the development of esophageal cancer may alsocreate a hostile mucosal environment and cause the disappearance of H. pylori infec-tion. Additional information is needed to clarify the nature of the relationship betweenH. pylori infection and esophageal cancer risk. The American and European guide-lines for appropriate testing and treatment of H. pylori are provided at the end ofthe chapter. Currently, treatment is not recommended for patients presenting withgastroesophageal reflux disease.
3. CANCER OF THE STOMACH
A steady decline in gastric cancer has been apparent in many countries for the pastseveral decades. The declining rates were first noted in the United States as early as1930 (105) and have persisted into this century (1). Survival rates have not appre-ciably changed (1,106); therefore, the decline in deaths cannot be attributed to bettertreatment and prolonged survival but, rather, to actual declines in incidence that arenow well-documented (107). This decline, which is believed to reflect changes inenvironmental factors, has been referred to as an “unplanned triumph,” because theshifts did not result from active medical or public health intervention and arebelieved to have resulted from large shifts in food processing and consumption (108)as well as a declining prevalence of H. pylori infection. It should be noted that theincrease in esophageal adenocarcinoma that was documented in the previous sectiondoes include an increase in adenocarcinomas of the gastroesophageal junction andgastric cardia.
3.1. Histological TypesAdenocarcinomas account for more than 97% of gastric cancers, and studies of eti-
ology are generally limited to this histological type (109). Building on an earlier obser-vation that gastric carcinomas were often accompanied by features found in intestinalepithelium (110), Lauren (111) proposed a classification of adenocarcinomas into twosubtypes: “intestinal” and “diffuse.” Many, but not all, tumors can be classified into oneof these subtypes, because some tumors contain characteristics of both types and otherscontain characteristics of neither. Diffuse carcinomas, sometimes referred to as“endemic,” tend to occur with similar frequency worldwide, whereas the distribution ofintestinal, or “epidemic,” type of carcinomas tends to parallel the distribution of overallgastric cancer rates (i.e., this type is relatively more common in areas with high ratesand lower where gastric cancer rates are low) (112).

Chapter 2 / Cancers of the Esophagus and Stomach 35
3.2. Risk Factors3.2.1. H. PYLORI
Spiral-shaped bacteria in contact with gastric mucosa were first reported by Pel about100 yr ago (113) and were ignored for the following 90 yr. In 1984, Marshall and Warren(114) reported isolating these bacteria in cultures of biopsies taken from patients withgastritis and peptic ulcers who were undergoing endoscopy. By 1994, the InternationalAgency for Research on Cancer, World Health Organization, had determined that infectionwith H. pylori is carcinogenic to humans, and declared it a Group I carcinogen based onthe large body of research developed during the 11-yr period (115).
H. pylori infection is one of the most prevalent infections worldwide, with a range of20 to 40% in developed countries and a range as high as 70 to 90% in some developingcountries (116,117). Prevalence increases with age, and no difference in seroprevalencehas been found between males and females (118). Socioeconomic status (including poorhousing conditions, large family size, and low education attainment) are predictors ofprevalence of infection as well as of gastric cancer.
Person-to-person spread is believed to be key in acquisition of infection, which gen-erally occurs in childhood. Intrafamilial spread is supported by studies demonstrating ahigh prevalence of H. pylori among family members of an infected individual. A recentstudy from Greece examined the entire genome of H. pylori strains from 32 membersof 11 families. The homology of the H. pylori genome in members of the same family wasstriking and strongly supported the hypothesis of transmission from person to person orfrom a common source (119).
The role of H. pylori in gastric carcinogenesis has been explored in correlational andcase–control studies; however, this approach has yielded equivocal results, largelybecause of difficulties in determining temporality (115). Three different cohort studiesprovided material for nested case–control analyses that resolved the issue of temporality.H. pylori infection was determined by IgG antibodies in serum that was collected at thetime of cohort enrollment, which occurred 6 to 14 yr earlier. Forman et al. (120) foundan approximate threefold increased risk of subsequent gastric cancer in a cohort ofWelsh men; Parsonnet et al. (121) reported a relative risk of 3.6 (95% CI 1.8–7.3) ina cohort of men and women in California; and Nomura et al. (122) found a sixfoldsignificantly increased risk in Japanese-American men living in Hawaii.
The mechanisms by which H. pylori infection increases gastric cancer risk are thefocus of ongoing investigation. H. pylori infection, the main cause of chronic gastritis,has been demonstrated to decrease the concentration of ascorbic acid in gastric juice(123–126). H. pylori infection also is associated with varying degrees of inflammation(127). In inflammatory states, nitric oxide may be generated and interact with reactiveoxygen species to form new cytotoxic compounds (128,129). Therefore, H. pyloriinfection has the potential to increase oxidative stress and decrease antioxidant capacity.
The vast majority of individuals who are infected with H. pylori ( 80%) manifest noclinical symptoms, and fewer than 5% develop gastric cancer (130). Therefore, anunderstanding of the determinants of cancer development among infected persons isimportant. Recent research suggests that the interplay of bacterial virulence factors andhost susceptibility factors play a key role in the subsequent development of gastriccancer (131). Cytotoxin-associated antigen (CagA) and vacuolating toxin (VacA) areassociated with cancer outcomes. Risks of gastric adenocarcinoma and gastric atrophy

36 Part II / Cancer Prevention
(a premalignant condition) have been associated with CagA+ and VacA+ strains com-pared to negative strains (132–134). BabA2-positive strains are also associated withincreased gastric cancer risk. BabA is an adherence factor that causes the bacteria tobind to Lewisb blood group antigens on gastric epithelial cells. Host genetic factors thatinfluence the immune response to infection are also believed to play a role in thisprocess. Current research suggests that a pro-inflammatory response to H. pylori isassociated with an increased risk of noncardia gastric cancer. Pro-inflammatory geno-types of tumor necrosis factor-α and interleukin-10 have been associated with a doublingof gastric cancer risk (135).
3.2.2. TOBACCO AND ALCOHOL
Although both tobacco and alcohol use are weakly associated with an increased riskof gastric cancer, the strength and magnitude of the association is much less clear thanthat for esophageal cancer.
Early case–control studies of gastric cancer and alcohol intake were equivocal, withsome reporting positive associations (136,137) and others reporting none (138,139).Continued study has yielded similar mixed results. Correa et al. (140) found twofoldelevations in the risk of gastric cancer at the highest level of alcohol intake for bothCaucasian and African-Americans in Louisiana. After controlling for other risk factors,wine (OR = 2.10, 95% CI 1.13–3.89) and hard liquor (OR = 1.95, 95% CI 1.14–3.34)were significantly associated with risk in Caucasians but not in African-Americans. In1990, a report regarding stomach cancer in Los Angeles males also found an increasedrisk (OR=3.0, 95% CI 1.1–8.7) at the highest level of total ethanol intake as well as sig-nificant risks for daily consumption of beer (141). The effect of alcohol was strongerfor cancer of the gastric cardia than at other sites.
A twofold increased risk of stomach cancer was found for beer consumption in aGerman study, whereas wine and hard liquor were associated with decreased risk (142).This is in contrast to a French study that reported a very large relative risk (RR = 6.9,95% CI 3.3–14.3) associated with heavy use of red wine (143).
However, two cohort studies have suggested that alcohol is not an independent riskfactor for gastric cancer. Nomura et al. (144) found no increased risk of gastric cancerassociated with consumption of beer, wine, or hard liquor in Japanese-American menliving in Hawaii. Similarly, Kneller et al. (145) found no association for total alcohol orfor any specific cancer type.
More consistent findings have linked smoking to a 1.5- to 3-fold increased risk ofgastric cancer (140–145); however, the overall increased risk has sometimes failed todemonstrate a dose–response (136,144,146). The cohort study by Kneller et al. did findsignificant increases in risk with both increasing the number of cigarettes smoked perday and pack-years of smoking (145). At the highest number of pack-years, the relativerisk was 2.3 (95% CI 1.23–4.33), and for current use of 30 or more cigarettes per day,the relative risk was 5.8 compared to nonsmokers. Although age at death did not sig-nificantly modify risk, the association with smoking was stronger for younger cases.The authors suggested that this finding may reflect a higher proportion of adenocarci-nomas of the gastric cardia at younger ages and a stronger relationship between smokingand cancers of the cardia than with cancers of other sites in the stomach.
The evidence on tobacco smoke and cancer risk that accumulated between 1986 and2002 was recently reviewed by a work group assembled by the International Agency for

Chapter 2 / Cancers of the Esophagus and Stomach 37
Research on Cancer (147). For stomach cancer, the conclusions were that current smokerswere at increased risk of both cardia and noncardia stomach cancer and that the associ-ation between tobacco smoking and gastric cancer risk is independent of alcoholconsumption and H. pylori infection. However, the absolute risk tends to be higheramong smokers who are H. pylori-positive (148). The proportions of gastric cancerattributable to tobacco smoking (a modifiable risk factor) are about 17 and 11% in menand women, respectively, in developed countries and 11 and 4% for men and women,respectively, in developing countries.
3.2.3. SALTED, PICKLED, AND SMOKED FOODS
In animal studies, salt has been demonstrated to enhance gastric carcinogenesis(149–152). It has been suggested that the action of salt as a gastric mucosal irritantfacilitates the action of carcinogens, and, therefore, salt acts as a cocarcinogen (153).
Epidemiological studies have also suggested an increased risk of gastric cancer asso-ciated with high salt intake when salted and pickled foods are included in total intake.Death rates throughout regions of Japan (154) were found to be correlated with con-sumption of salted fish and vegetables. A geographical correlation was also demon-strated in China (155). Consumption of salt-cured meats, salted fish, and othersalt-preserved foods has been associated with increased risk in case–control studiesworldwide (156–159). Several studies have also reported associations with the additionof salt to foods (156,160) or a reported “heavy intake” (140,161).
Many of the strongest findings have been noted in areas of the world where there isa wide range of intake, including very high levels, such as in Korea (158). In a recentnested case–control analysis in a California study population, Friedman and Parsonnet(162) failed to find evidence that routine salting led to increased risk. “Heavy” saltintake in US populations may be quantitatively less than “heavy” intake in other areasof the world and may not be sufficient to demonstrate an increased risk. For example,salted fish and vegetables in Japan may contain up to 30% sodium chloride (NaCl) com-pared to isotonic saline, which contains 0.8% (153,154,162). One of the difficulties inassessing the role of salt is determination of “exposure,” for which many assessmentshave been subjective. A step forward in research was the use of a salt taste test (163).Preference for salty taste was objectively assessed using diluted rice cereal (gruel) thatcontained 0.1, 0.3, 0.5, 0.7, and 0.9% NaCl. The five different diluted rice cereals wererandomly arranged, and the subjects were asked to select a preferred concentration.People with gastric cancer were significantly more likely (p<0.01) to prefer the cerealswith high concentrations of salt (>0.5%). In this study, persons who were infected withH. pylori and who had a high-salt preference had a 10-fold higher risk of early gastric can-cer than uninfected persons who preferred low salt concentrations (p<0.05).
Numerous N-nitroso compounds have demonstrated carcinogenicity (164). Basedon studies of premalignant lesions of the stomach, it has been hypothesized that intra-gastric synthesis of N-nitroso compounds is a factor in the gastric carcinogenicprocess (165).
Two recently reported studies evaluated factors associated with in vivo nitrosamine for-mation in humans using the test developed by Ohshima and Bartsch (166), which mea-sures urinary excretion of noncarcinogenic N-nitrosoproline after ingesting a given doseof proline. Mirvish et al. (167) found that men in rural Nebraska who drank water fromprivate wells with a high-nitrate content excreted significantly higher N-nitrosoproline

38 Part II / Cancer Prevention
than men who drank water with a low-nitrate content. Their findings paralleled those ofa study in Denmark (168). Sierra et al. (169) used the nitrosoproline test in children inCosta Rica who lived in high- and low-risk areas for stomach cancer. They found thatthe concentration excreted by children in the high-risk area was significantly greater(p<0.04) compared to children from the low-risk area. They also found that excretionwas markedly reduced when ascorbic acid (an inhibitor of nitrosation reactions) wasadministered with the proline.
Associations between gastric cancer and dietary intake of nitrate, nitrite, and pre-formed nitroso compounds are suggestive (170–175), but the validity of such indicesis not well-established given the multiple sources—including food, water, andendogenous formation.
3.2.4. FRUITS AND VEGETABLES
Table 2 presents an extensive compendium of dietary studies of gastric cancer(138,140–142,144,145,158,161,170–191). The strong, consistent inverse associationbetween consumption of fruits and vegetables is abundantly clear. Of the 26 studiesdescribed that specifically examined foods and food groups, 24 found a decreased riskof stomach cancer associated with high intake of one or more fruits and vegetables, andthe vast majority were statistically significant, with up to twofold reductions in risk.Only two studies reported an increased risk of gastric cancer associated with fruits (145)or vegetables (157), and their findings cast little doubt on the apparent protective effectof fruits and vegetables. The findings of Tajima and Tominaga (157) stand in contrastto many case–control studies in Japan and elsewhere, and the study by Kneller et al.(145) was based on a very limited dietary questionnaire, which increased the likelihoodof misclassification.
Norat and Riboli conducted a meta-analysis of published case–control and cohortstudies of fruit and vegetable consumption (192). The pooled analysis of all studiesfound that high intake of vegetables was associated with significantly decreased riskof stomach cancer. Fruit intake was associated with a significantly reduced risk ofgastric and esophageal cancers. Estimates of the proportion of stomach cancers world-wide that are potentially preventable by increasing fruit and vegetable consumption areup to 50%.
3.2.5. MICRONUTRIENTS
Fruits and vegetables serve as dietary sources of a plethora of vitamins, minerals, fiber,and the less well-studied trace compounds. Many of these are highly correlated with oneanother, particularly when exposure is based on dietary assessment; therefore, a findingattributed to one may actually reflect the effect of another constituent from the samefoods. Thus, the strongest findings are based on biochemical studies (e.g., blood levelsprior to cancer onset) and chemoprevention trials, which actually test the efficacy of spe-cific micronutrients in prevention. Vitamin C, β-carotene, and vitamin E/selenium are themicronutrients that are most strongly believed to be associated with reduced risk of gas-tric cancer based on currently published studies.
Findings from dietary estimates of intake are also included in Table 2. Relativelyhigh consumption of vitamin C and β-carotene is consistently associated with reducedrisk of gastric cancer (140,142,161,170,172–174,176,179,183,185,186). Serologicalassessment also supports a role. Prospective studies that have evaluated vitamin C are

Tab
le 2
Sele
cted
Epi
dem
iolo
gica
l Stu
dies
of
Die
t an
d St
omac
h C
ance
r R
isk
Num
ber
of
case
s/co
ntro
lR
elat
ive
risk
St
udy
(ref
eren
ce)
Popu
lati
onor
coh
ort
size
Food
or
nutr
ient
(hig
h vs
low
int
ake)
Cas
e–C
ontr
olM
eins
ma
(176
)H
olla
nd34
0/10
60V
itam
in C
Inve
rse
asso
ciat
ion
Citr
us f
ruit
p=
0.1
mal
esp
= 0
.001
fem
ales
Hig
gins
on (
177)
Uni
ted
Stat
es93
/279
Dai
ry f
oods
0.6
Fres
h fr
uits
Inve
rse
asso
ciat
ion
Raw
veg
etab
les
Inve
rse
asso
ciat
ion
Hae
nsze
l et a
l. (1
78)
Japa
nese
in H
awai
i22
0/44
0To
mat
oes
0.4
(p <
0.0
5)C
eler
y0.
4 (p
< 0
.05)
Cor
n0.
5 (p
< 0
.05)
Oni
on0.
5 (p
< 0
.05)
Let
tuce
0.8
(NS)
Wes
tern
veg
etab
les
0.4
(p<
0.0
5)co
mbi
ned
Gra
ham
et a
l. (1
38)
Uni
ted
Stat
es27
6/22
00L
ettu
ce0.
64 (
p-tr
end
< 0
.01)
Bje
lke
(179
)N
orw
ay a
nd
162/
1394
Veg
etab
le in
dex
Inve
rse
asso
ciat
ion
Uni
ted
Stat
es(N
orw
ay)
(Nor
way
and
Uni
ted
Stat
es)
259/
1657
Vita
min
CIn
vers
e as
soci
atio
n (N
orw
ay
and
Uni
ted
Stat
es)
Frui
ts &
veg
etab
les
Inve
rse
asso
ciat
ion
(Nor
way
(Uni
ted
Stat
es)
and
Uni
ted
Stat
es)
Hae
nsze
l et a
l. (1
80)
Japa
n78
3/15
66Fr
uit
0.7
(p <
0.0
5)Pl
um a
nd p
inea
pple
0.7
(p<
0.0
1)C
eler
y0.
6 (p
< 0
.01)
Let
tuce
0.7
(p<
0.0
1)
(con
tinu
ed)
39

Cor
rea
et a
l. (1
40)
Uni
ted
Stat
es39
1/39
1V
itam
in C
0.50
(p–
tren
d <
0.0
5)
Cau
casi
ans
0.33
(p–
tren
d <
0.0
01)
Afr
ican
-Am
eric
ans
Frui
t ind
ex0.
47 (
p–tr
end
< 0
.005
) C
auca
sian
s0.
33 (
p-tr
end
< 0
.001
) A
fric
an-A
mer
ican
sV
eget
able
inde
x0.
50 (
p-tr
end
< 0
.05)
A
fric
an-A
mer
ican
sSm
oked
foo
ds1.
98 (
p–tr
end
< 0
.025
) A
fric
an-A
mer
ican
sR
isch
et a
l. (1
70)
Can
ada
246/
246
Vita
min
C0.
43 (
p–tr
end
= 0
.099
)C
itrus
fru
it0.
75 (
p–tr
end
= 0
.006
)N
itrite
2.61
(1.
61–4
.22)
Car
bohy
drat
es1.
53 (
1.07
–2.1
8)T
rich
opou
los
et a
l. (1
81)
Gre
ece
110/
100
Lem
ons
0.24
(p-
tren
d <
0.0
1)O
rang
es0.
33 (
p–tr
end
< 0
.01)
Past
a3.
42 (
p–tr
end
< 0
.001
)B
row
n br
ead
0.79
(p–
tren
d <
0.0
1)O
nion
s0.
68 (
p–tr
end
< 0
.001
)Ta
jima
and
Tom
inaj
a (1
57)
Japa
n93
/186
Ora
nges
0.9
(NS)
Oth
er f
ruit
1.4
(NS)
Spin
ach
2.5
(p<
0.0
5)C
abba
ge2.
2 (p
< 0
.01)
Gre
en p
eppe
r2.
0 (p
< 0
.01)
Jedr
ycho
wsk
i et a
l. (1
82)
Pola
nd11
0/11
0Fr
uit
0.3
(0.1
–0.6
)V
eget
able
s0.
6 (0
.3–1
.4)
Tab
le 2
(co
ntin
ued)
Num
ber
ofca
ses/
cont
rol
Rel
ativ
e ri
skSt
udy
(ref
eren
ce)
Popu
lati
on
or c
ohor
t si
zeFo
od o
r nu
trie
nt(h
igh
vs l
ow i
ntak
e)
40

LaV
ecch
ia e
t al.
(161
)It
aly
206/
474
Vita
min
C0.
46 (
p<
0.0
01)
Frui
ts, i
ndex
0.53
(p–
tren
d <
0.0
1)C
itrus
fru
it0.
58 (
p–tr
end
< 0
.01)
Gre
en v
eget
able
inde
x0.
33 (
p–tr
end
< 0
.001
)H
am1.
6 (p
= 0
.04)
Pole
nta
2.32
(p
= 0
.007
)β–
caro
tene
0.39
(p
< 0
.001
)Y
ou e
t al.
(183
)C
hina
564/
1131
Vita
min
C0.
5 (0
.3–0
.6)
Fres
h fr
uit
0.4
(0.3
–0.6
)Fr
esh
vege
tabl
es0.
6 (0
.4–0
.8)
Bui
atti
et a
l. (1
84)
Ital
y10
16/1
159
Raw
veg
etab
les
0.6
(p–t
rend
< 0
.001
)C
itrus
fru
its0.
6 (p
–tre
nd <
0.0
01)
Oth
er f
resh
fru
its0.
4 (p
–tre
nd <
0.0
01)
Gra
ham
et a
l. (1
85)
Uni
ted
Stat
es29
3/29
3R
aw v
eget
able
s0.
43 (
0.23
–0.7
8)Fr
uits
No
asso
ciat
ion
Vita
min
CN
o as
soci
atio
nC
arot
ene
0.79
(0.
63–0
.98)
Sodi
um1.
51 (
1.20
–.91
)R
etin
ol1.
47 (
1.17
–1.8
5)Fa
t1.
37 (
1.08
–1.7
4)C
hyou
et a
l. (1
71)
Japa
nese
in H
awai
i11
1/36
1V
eget
able
inde
x0.
7 (p
–tre
nd <
0.0
01)
Frui
t ind
ex0.
8 (p
–tre
nd =
0.2
0)N
itrite
No
asso
ciat
ion
Bui
atti
et a
l. (1
72)
Ital
y10
16/1
159
Vita
min
C0.
5 (p
–tre
nd <
0.0
01)
α–to
coph
erol
0.6
(p–t
rend
< 0
.01)
β–ca
rote
ne0.
6 (p
–tre
nd <
0.0
1)Pr
otei
n2.
6 (p
–tre
nd <
0.0
01)
Nitr
ites
1.9
(p–t
rend
0.0
01)
Wu–
Will
iam
s et
al.
(141
)U
nite
d St
ates
137/
137
Frui
t ind
ex0.
7 (N
S)B
eef
1.6
(1.0
–2.6
) (con
tinu
ed)
41

42
Bui
atti
et a
l. (1
73)
Ital
y92
3/11
59V
itam
in C
0.5
(0.3
–0.6
) in
test
inal
-typ
e0.
5 (0
.3–0
.7)
diff
use-
type
Citr
us f
ruits
0.5
(0.4
–0.7
) in
test
inal
-typ
e0.
6 (0
.4–0
.9)
diff
use
type
Oth
er f
resh
fru
its0.
5 (0
.4–0
.7)
inte
stin
al-t
ype
0.4
(0.3
–0.6
) di
ffus
e-ty
peR
aw v
eget
able
s0.
6 (0
.4–0
.8)
inte
stin
al-t
ype
0.6
(0.4
–0.9
) di
ffus
e-ty
peα–
toco
pher
ol0.
5 (0
.3–0
.8)
inte
stin
al-t
ype
0.5
(0.2
–0.8
) di
ffus
e-ty
peβ–
caro
tene
0.7
(0.5
–0.8
) in
test
inal
-typ
e0.
6 (0
.4–0
.7)
diff
use-
type
Nitr
ites
1.8
(1.2
–2.8
) in
test
inal
-typ
e2.
8 (1
.5–5
.0)
diff
use-
type
Prot
ein
2.4
(1.0
2–5.
6) in
test
inal
-typ
e5.
8 (1
.8–1
.84)
dif
fuse
type
Neg
ri e
t al.
(186
)It
aly
564/
6147
Gre
en V
eget
able
s0.
4 (0
.3–0
.6)
(p–t
rend
< 0
.001
)Fr
uit
0.4
(0.3
–0.5
) (p
–tre
nd <
0.0
01)
Boe
ing
et a
l. (1
42)
Ger
man
y14
3/57
9V
itam
in C
0.37
(p–
tren
d <
0.0
1)C
hees
e0.
44 (
p–tr
end
< 0
.01)
Proc
esse
d m
eat
1.74
(p–
tren
d <
0.0
1)W
hole
whe
at b
read
0.37
(p–
tren
d <
0.0
01)
Gon
zale
z et
al.
(187
)Sp
ain
354/
354
Coo
ked
vege
tabl
es0.
5 (t
rend
p =
0.0
2)N
on–c
itrus
fre
sh f
ruits
0.6
(p-t
rend
= 0
.006
)D
ried
fru
its0.
4 (0
.2–0
.8)
Mea
t0.
6 (p
–tre
nd =
0.0
2)H
oshi
yam
a &
Sas
aba
(188
)Ja
pan
251/
483
Frui
tsIn
vers
e as
soci
atio
nR
aw v
eget
able
sIn
vers
e as
soci
atio
nPi
ckle
d ve
geta
bles
Incr
ease
d ri
sk
Tab
le 2
(co
ntin
ued)
Num
ber
of
case
s/co
ntro
lR
elat
ive
risk
Stud
y (r
efer
ence
)Po
pula
tion
or c
ohor
t si
zeFo
od o
r nu
trie
nt(h
igh
vs l
ow i
ntak
e)

LaV
ecch
ia e
t al.
(189
)It
aly
723/
2024
β–ca
rote
ne0.
38 (
p-tr
end<
0.0
01)
Vita
min
C0.
53 (
p-tr
end
< 0
.001
)M
ethi
onin
e2.
40 (
p-tr
end
< 0
.001
)L
ee e
t al.
(158
)K
orea
213/
213
Han
sson
et a
l. (1
90)
Swed
enTo
tal V
eget
able
s0.
58 (
0.37
–0.8
9)
(p-t
rend
= 0
.01)
Citr
us f
ruits
0.49
(0.
29–0
.81)
(p
-tre
nd =
0.0
04)
Han
sson
et a
l. (1
74)
Swed
enV
itam
in C
0.47
(0.
30–0
.76)
(p
-tre
nd =
0.0
03)
β–ca
rote
ne0.
73 (
0.45
–1.1
8)
(p-t
rend
= 0
.10)
Nitr
ates
0.97
(0.
60–1
.59)
(p
-tre
nd =
0.9
9)L
opez
–Car
rillo
et a
l. (1
91)
Mex
ico
220/
752
Chi
li pe
pper
s5.
49 (
2.72
–11.
06)
(eve
r, ne
ver)
Chi
li pe
pper
s 17
.11
(7.7
8–37
.59)
(hig
h vs
non
e)G
onza
les
et a
l. (1
75)
Spai
n35
4/35
4N
itros
omin
es2.
1 (p
-tre
nd =
0.0
07)
Fibe
r0.
35 (
p-tr
end
< 0
.001
)Fo
late
0.50
(p-
tren
d=
0.0
08)
Vita
min
C0.
58 (
p-tr
end
= 0
.017
)C
ohor
tN
omur
a et
al.
(144
)Ja
pane
se in
Haw
aii
150/
7990
Frui
t ind
ex0.
8 (0
.5–1
.3)
Frie
d ve
geta
bles
0.8
(0.4
–1.6
)K
nelle
r et
al.
(145
)U
nite
d St
ates
75/1
7,63
3Fr
uit i
ndex
1.5
(p-t
rend
, NS)
Veg
etab
le in
dex
0.9
(p-t
rend
, N
S)C
arbo
hydr
ates
1.6
(p-t
rend
< 0
.05)
43

44 Part II / Cancer Prevention
scant because vitamin C deteriorates quickly unless specimens are acid-stabilized priorto freezing (193). The Basel study(194), a large well-conducted cohort study, did havesuch material available. Mean plasma vitamin C was significantly lower in persons whodied of cancer than in survivors (47.61±1.78 mol/L vs 52.76±0.44 mol/L, respectively;p < 0.01). The findings were also significant (p < 0.05) for persons who subsequentlydied of stomach cancer, and their blood levels were even lower (42.86 ± 4.88). Lowplasma levels of vitamin C were associated with a relative risk of 2.38 for gastric can-cer. Low plasma levels of β-carotene were similarly associated with significantlyincreased risk of overall mortality from cancer (p < 0.01) and cancer of the stomach(p < 0.01), which had a relative risk of 2.95. No association was observed betweenplasma levels of vitamin A or E and gastric cancer.
Haenszel et al. (195) measured serum micronutrient levels in persons with variouspremalignant gastric lesions. β-carotene levels in both men and women and vitamin Elevels in men were significantly lower in subjects with gastric dysplasia than in subjectswith normal mucosa or less advanced lesions.
A recent report from Japan (196) evaluated prediagnostic serum selenium and zinclevels and found no excess risk of stomach cancer in those with the lowest levels ofselenium (OR=1.0) or zinc (OR=1.2).
To date, the most compelling evidence for specific micronutrients in chemopreven-tion of gastric cancer comes from the previously described population trial in China(73), which found a significant reduction in stomach cancer mortality among personstaking a combination of β-carotene, vitamin E, and selenium. No reduction in risk wasobserved among persons taking vitamin C; however, there was no attempt in this trialto eradicate H. pylori—which is known to decrease the concentration of ascorbic acidin gastric juice—either by increased oxidation, impaired secretion from blood into thegastric cavity, or both (122,124–126). In 2000, another chemoprevention trial was con-ducted in a high-risk population in the Andes mountain area of Colombia. After 6 yr offollow-up study, participants who were treated with either ascorbic acid, β-carotene, oranti-H. pylori therapy, individually or in combination, were significantly more likely tohave regression of gastric premalignant lesions (163).
4. RECOMMENDATIONS
Primary prevention of esophageal and, to a lesser degree, stomach cancer obviouslybegins with prevention of tobacco use by teenagers and cessation among addicted adults.Physician prompting and participation in smoking cessation efforts have proved effective.Nicotine replacement, in conjunction with behavioral modification, may improve the suc-cess rate for smokers who are attempting to quit. More nicotine replacement methods areavailable now than ever before. These include gum, which was the first type of replacementmethod developed; a patch by which nicotine is absorbed through the skin; an inhaler; anda nasal spray. These methods can be used to deliver gradually reduced doses of nicotinewithout exposure to the myriad harmful chemicals contained in tobacco smoke.
Several non-nicotine-containing pharmacological approaches to cessation have beenattempted; however, one has been demonstrated to have serious adverse side effectsassociated with use, and others, which are used in treatment of specific disorders, havenot yet been approved by the Food and Drug Administration for use in cessation. Theseoptions are expected to develop with additional research.

Chapter 2 / Cancers of the Esophagus and Stomach 45
A reduction in tobacco use by teenagers has proved a persistent challenge, becauseeducational programs are offset by well-funded, effective, targeted marketing andpromotion by tobacco companies. The terms of the 1998 Tobacco Settlement have thepotential to reduce the impact of industry marketing and promotions, particularly ifcomplemented by the use of settlement funds for countermarketing campaigns in thosefew states that have chosen this approach. Limiting alcohol consumption to moderatelevels is particularly important for smokers, and physicians should actively counselpatients accordingly.
Intake of fresh fruits and vegetables in the United States continues to fall short of therecommended “5-A-Day” (197). More recent programs have encouraged even higherlevels of consumption (e.g., “9-A-Day”). Increased consumption should continue to bepromoted, and benefits are expected to accrue in reduced rates of both of these upperdigestive tract cancers as well as other epithelial tumors. Effective population-basedapproaches are important, and because dietary patterns often are established in child-hood, promotion of healthy choices in school-based food-service programs is an oppor-tunity that should not be missed.
The current dietary recommendations of the American Cancer Society, the AmericanHeart Association, and the National Cancer Institute are remarkably similar in directionbut differ in specificity. The most consistent general recommendations for prevention ofthe major chronic diseases in this country, including these cancers, are to eat morefruits, vegetables, and grains; eat less high-fat foods and meats; and to be active and stayfit. Website addresses with up-to-date material regarding dietary recommendations areincluded for reference in Table 3.
The efficacy of vitamin/mineral supplements has not yet been completely estab-lished in clinical trials; however, in case–control and cohort studies, the individu-als in the highest level of intake of specific micronutrients often combine highdietary intake with supplements. With the obvious caution to avoid excessiveintake, a multivitamin/mineral supplement or specific antioxidant supplement maycomplement dietary intake, particularly among persons with excessive oxidative stress,such as smokers.
In 2000, the original European H. pylori treatment guidelines were updated in a sec-ond Maastricht Consensus Report (198). The guidelines recommend a “test and treat”approach in adult patients under age 45 yr who present in primary care settings withpersistent dyspepsia, after excluding those with predominantly gastroesophageal refluxdisease symptoms, nonsteroidal anti-inflammatory drug users, and those with alarmsymptoms requiring prompt endoscopic investigation (i.e., unexplained weight loss,dysphagia, recurrent vomiting, digestive bleeding or anaemia, abnormal physical exam-ination, malabsorption, and concomitant disease with possible digestive involvement).
Table 3Websites of Organizational Nutritional Guidelines
American Cancer Society http://www.cancer.orgNational Cancer Institute http://www.nci.nih.gov
http://5aday.comAmerican Heart Association http://www.americanheart.orgAmerican Diabetes Association http://www.diabetes.org

46 Part II / Cancer Prevention
Additional recommendations from this report include:
● The urea breath test or stool antigen test are recommended as the diagnostic tests ofchoice.
● H. pylori eradication is recommended in all patients with peptic ulcers, low-grade gas-tric mucosa-associated lymphoid tissue (MALT) lymphoma, or atrophic gastritis and inpatients undergoing postgastric cancer resection.
● Eradication is also strongly recommended in infected patients with a first-degree familyhistory of gastric cancer.
The American College of Gastroenterology issued guidelines for the management ofH. pylori in 1998 (199). Their recommendations include the following:
● Diagnostic testing for H. pylori infection should be performed only if treatment isintended.
● Testing for H. pylori infection is indicated in patients with active peptic ulcer disease,a history of documented peptic ulcer, or gastric MALT lymphoma.
● Testing for H. pylori infection is not indicated in asymptomatic individuals with no his-tory of peptic ulcer disease or in patients on long-term treatment with a proton pumpinhibitor (PPI) for gastroesophageal disease.
● There is no conclusive evidence that eradication of H. pylori will reverse the symptomsof nonulcer dyspepsia. Patients may be tested for H. pylori on a case-by-case basis, andtreatment may be offered to those who test positive.
● The diagnostic test to use in a particular patient depends on the clinical setting, partic-ularly if upper GI endoscopy is performed.
● When endoscopy is indicated, the test of choice is a urease test on an antral biopsy.If a biopsy urease test is negative, H. pylori infection may be diagnosed by histol-ogy or serology. Biopsy urease tests have reduced sensitivity in patients taking PPIsand in patients with recent or active bleeding. Histology generally is not considerednecessary and is expensive. When endoscopy is not performed, an office-based sero-logical test is the least expensive means of evaluating for evidence of H. pyloriinfection.
● The highest eradication rates are achieved with the following regimens:
1. A PPI, clarithromycin, and either amoxicillin or metronidazole for 2 wk.2. Ranitidine; bismuth citrate; clarithromycin; and either amoxicillin, metronidazole,
or tetracycline for 2 wk.3. A PPI, bismuth, metronidazole, and tetracycline for 1 to 2 wk.
● Currently, routine posttreatment testing is recommended only in patients with a his-tory of ulcer complications, gastric MALT lymphoma, or early gastric cancer.Patients with recurrent symptoms after treatment of H. pylori infection also needfurther evaluation.
Although the spectrum of clinical outcomes associated with H.pylori infection iswide-ranging, from asymptomatic to gastric cancer, treatment and eradication of infec-tion as recommended previously is important because the cofactors that predispose aninfected individual to gastric cancer have not yet been established.

Chapter 2 / Cancers of the Esophagus and Stomach 47
REFERENCES1. Jemal A, Murray T, Samuels A, Ghafoor A, Ward E, Thun MJ. Cancer statistics, 2003. CA Cancer
J Clin 2003; 53:5–26.2. Moses FM. Squamous cell carcinoma of the esophagus. Natural history, incidence, etiology, and
complications. Gastroenterol Clin North Am 1991; 20:703–716.3. Blot WJ, Devesa SS, Kneller RW, Fraumeni JF Jr. Rising incidence of adenocarcinoma of the esoph-
agus and gastric cardia. JAMA 1991; 265:1287–1289.4. Koch TR. The changing face of esophageal malignancy. Curr Gastroenterol Rep 2003; 5:187–191.5. Day N, Muñoz N. Oesophagus. In: Schottenfeld D, Fraumeni J, eds. Cancer Epidemiology and
Prevention. WB Saunders, Philadelphia, PA, 1982, pp. 596–623.6. Wynder E, Bross I. A study of etiologic factors in cancer of the esophagus. Cancer 1961;
14:389–413.7. Tuyns AJ, Pequignot G, Jensen OM. [Esophageal cancer in Ille-et-Vilaine in relation to levels of
alcohol and tobacco consumption. Risks are multiplying]. Bull Cancer 1977; 64:45–60.8. Saracci R. The interactions of tobacco smoking and other agents in cancer etiology. Epidemiol Rev
1987; 9:175–193.9. Baron AE, Franceschi S, Barra S, Talamini R, La Vecchia C. A comparison of the joint effects of
alcohol and smoking on the risk of cancer across sites in the upper aerodigestive tract. CancerEpidemiol Biomark Prev 1993; 2:519–523.
10. Franceschi S, Bidoli E, Negri E, Barbone F, La Vecchia C. Alcohol and cancers of the upper aerodi-gestive tract in men and women. Cancer Epidemiol Biomarkers Prev 1994; 3:299–304.
11. Blume SB. Women and alcohol. A review. JAMA 1986; 256:1467–1470.12. Fioretti F, Tavani A, La Vecchia C, Franceschi S. Histamine-2-receptor antagonists and oesophageal
cancer. Eur J Cancer Prev 1997; 6:143–146.13. Franceschi S, Bidoli E, Negri E, et al. Role of macronutrients, vitamins and minerals in the aetiology
of squamous-cell carcinoma of the oesophagus. Int J Cancer 2000; 86:626–631.14. Levi F, Pasche C, Lucchini F, et al. Food groups and oesophageal cancer risk in Vaud, Switzerland.
Eur J Cancer Prev 2000; 9:257–263.15. Gallus S, Bosetti C, Franceschi S, et al. Oesophageal cancer in women: tobacco, alcohol, nutritional
and hormonal factors. Br J Cancer 2001; 85:341–345.16. Hanaoka T, Tsugane S, Ando N, et al. Alcohol consumption and risk of esophageal cancer in Japan:
a case–control study in seven hospitals. Jpn J Clin Oncol 1994; 24:241–246.17. Zambon P, Talamini R, La Vecchia C, et al. Smoking, type of alcoholic beverage and squamous-cell
oesophageal cancer in northern Italy. Int J Cancer 2000; 86:144–149.18. Hoffmann D, Djordjevic MV, Hoffmann I. The changing cigarette. Prev Med 1997; 26:427–434.19. Levi F, Lucchini F, Negri E, Boyle P, La Vecchia C. Cancer mortality in Europe, 1990–1994, and an
overview of trends from 1955 to 1994. Eur J Cancer 1999; 35:1477–1516.20. Tang JL, Morris JK, Wald NJ, Hole D, Shipley M, Tunstall-Pedoe H. Mortality in relation to tar yield
of cigarettes: a prospective study of four cohorts. BMJ 1995;311:1530–1533.21. La Vecchia C, Liati P, Decarli A, Negrello I, Franceschi S. Tar yields of cigarettes and the risk of
oesophageal cancer. Int J Cancer 1986; 38:381–385.22. La Vecchia C, Bidoli E, Barra S, et al. Type of cigarettes and cancers of the upper digestive and res-
piratory tract. Cancer Causes Control 1990; 1:69–74.23. Gallus S, Altieri A, Bosetti C, et al. Cigarette tar yield and risk of upper digestive tract cancers: case-
control studies from Italy and Switzerland. Ann Oncol 2003; 14:209–213.24. Watson W. Carcinoma of oesophagus. Surg Gynecol Obstet 1933; 56:884–897.25. Kwan K. Carcinoma of the esophagus, a statistical study. Chinese Med J 1937; 52:237–254.26. Goldenberg D, Golz A, Joachims HZ. The beverage mate: a risk factor for cancer of the head and
neck. Head Neck 2003; 25:595–601.27. Esophageal cancer studies in the Caspian littoral of Iran: results of population studies—a prodrome.
Joint Iran-International Agency for Research on Cancer Study Group. J Natl Cancer Inst 1977;59:1127–1138.
28. Kolicheva N. Epidemiology of Esophagus Cancer in the USSR. In: Levin D, ed. Joint USA/USSRMonograph on Cancer Epidemiology in the USA and USSR, 1980.
29. Martinez I. Factors associated with ccer of the esophagus, mouth, and pharynx in Puerto Rico. J NatlCancer Inst 1969; 42:1069–1094.

48 Part II / Cancer Prevention
30. Segi M. Tea-gruel as a possible factor for cancer for the esophagus. Gann 1975; 66:199–202.31. Hirayama T. An epidemiological study of cancer of the esophagus in Japan, with special reference
to the combined effect of selected environmental factors. Monograph No. 1, Seminar onEpidemiology of Oesophageal Cancer. Bangalore, India, 1971, pp. 45–60.
32. De Stefani E, Munoz N, Esteve J, Vasallo A, Victora CG, Teuchmann S. Mate drinking, alcohol,tobacco, diet, and esophageal cancer in Uruguay. Cancer Res 1990; 50:426–431.
33. Victora CG, Munoz N, Day NE, Barcelos LB, Peccin DA, Braga NM. Hot beverages andoesophageal cancer in southern Brazil: a case-control study. Int J Cancer 1987; 39:710–716.
34. Castelletto R, Castellsague X, Munoz N, Iscovich J, Chopita N, Jmelnitsky A. Alcohol, tobacco, diet,mate drinking, and esophageal cancer in Argentina. Cancer Epidemiol Biomarkers Prev 1994;3:557–564.
35. Munoz N, Victora CG, Crespi M, Saul C, Braga NM, Correa P. Hot mate drinking and precancerouslesions of the oesophagus: an endoscopic survey in southern Brazil. Int J Cancer 1987; 39:708,709.
36. Wahrendorf J, Chang-Claude J, Liang QS, et al. Precursor lesions of oesophageal cancer in youngpeople in a high-risk population in China. Lancet 1989; 2:1239–1241.
37. Miller R. Epidemiology. In: Kaplan H, Tschitani P, eds. Cancer in China. Alan R. Liss, New York,1978, pp. 39–57.
38. Rodler I, Zajkas G. Hungarian cancer mortality and food availability data in the last four decades ofthe 20th century. Ann Nutr Metab 2002; 46:49–56.
39. Mettlin C, Graham S, Priore R, Marshall J, Swanson M. Diet and cancer of the esophagus. NutrCancer 1981; 2:143–147.
40. Chainani-Wu N. Diet and oral, pharyngeal, and esophageal cancer. Nutr Cancer 2002; 44:104–126.41. De Jong UW, Breslow N, Hong JG, Sridharan M, Shanmugaratnam K. Aetiological factors in
oesophageal cancer in Singapore Chinese. Int J Cancer 1974; 13:291–303.42. Cook-Mozaffari PJ, Azordegan F, Day NE, Ressicaud A, Sabai C, Aramesh B. Oesophageal cancer
studies in the Caspian Littoral of Iran: results of a case-control study. Br J Cancer 1979; 39:293–309.43. Bosetti C, La Vecchia C, Talamini R, et al. Food groups and risk of squamous cell esophageal cancer
in northern Italy. Int J Cancer 2000; 87:289–294.44. Graham S, Marshall J, Haughey B, et al. Nutritional epidemiology of cancer of the esophagus.
Am J Epidemiol 1990; 131:454–467.45. Ziegler RG, Morris LE, Blot WJ, Pottern LM, Hoover R, Fraumeni JF, Jr. Esophageal cancer among
black men in Washington, D.C. II. Role of nutrition. J Natl Cancer Inst 1981; 67:1199–1206.46. Tuyns AJ. Protective effect of citrus fruit on esophageal cancer. Nutr Cancer 1983; 5:195–200.47. Tuyns AJ, Riboli E, Doornbos G, Pequignot G. Diet and esophageal cancer in Calvados (France).
Nutr Cancer 1987; 9:81–92.48. Decarli A, Liati P, Negri E, Franceschi S, La Vecchia C. Vitamin A and other dietary factors in the
etiology of esophageal cancer. Nutr Cancer 1987; 10:29–37.49. Notani PN, Jayant K. Role of diet in upper aerodigestive tract cancers. Nutr Cancer 1987;
10:103–113.50. Brown LM, Blot WJ, Schuman SH, et al. Environmental factors and high risk of esophageal cancer
among men in coastal South Carolina. J Natl Cancer Inst 1988; 80:1620–1625.51. Yu MC, Garabrant DH, Peters JM, Mack TM. Tobacco, alcohol, diet, occupation, and carcinoma of
the esophagus. Cancer Res 1988; 48:3843–3848.52. Li JY, Ershow AG, Chen ZJ, et al. A case-control study of cancer of the esophagus and gastric cardia
in Linxian. Int J Cancer 1989; 43:755–761.53. Block G. Vitamin C and cancer prevention: the epidemiologic evidence. Am J Clin Nutr 1991;
53:270S–282S.54. Cheng KK, Day NE, Duffy SW, Lam TH, Fok M, Wong J. Pickled vegetables in the aetiology of
oesophageal cancer in Hong Kong Chinese. Lancet 1992; 339:1314–1318.55. Yu Y, Taylor PR, Li JY, et al. Retrospective cohort study of risk-factors for esophageal cancer in
Linxian, People’s Republic of China. Cancer Causes Control 1993; 4:195–202.56. Tavani A, Negri E, Franceschi S, La Vecchia C. Risk factors for esophageal cancer in lifelong non-
smokers. Cancer Epidemiol Biomarkers Prev 1994; 3:387–392.57. Jain AK, Shimoi K, Nakamura Y, Kada T, Hara Y, Tomita I. Crude tea extracts decrease the muta-
genic activity of N-methyl-N’-nitro-N-nitrosoguanidine in vitro and in intragastric tract of rats.Mutat Res 1989; 210:1–8.
58. Ito Y, Ohnishi S, Fujie K. Chromosome aberrations induced by aflatoxin B1 in rat bone marrow cellsin vivo and their suppression by green tea. Mutat Res 1989; 222:253–261.

Chapter 2 / Cancers of the Esophagus and Stomach 49
59. Sasaki Yu F, Imanishi H, Ohta T, Watanabe M, Matsumoto K, Shirasu Y. Suppressing effect of tannicacid on the frequencies of mutagen-induced sister-chromatid exchanges in mammalian cells. MutatRes 1989; 213:195–203.
60. Stich HF, Rosin MP. Naturally occurring phenolics as antimutagenic and anticarcinogenic agents.Adv Exp Med Biol 1984; 177:1–29.
61. Gao YT, McLaughlin JK, Blot WJ, Ji BT, Dai Q, Fraumeni JF, Jr. Reduced risk of esophageal cancerassociated with green tea consumption. J Natl Cancer Inst 1994; 86:855–858.
62. Ke L, Yu P, Zhang ZX, Huang SS, Huang G, Ma XH. Congou tea drinking and oesophageal cancerin South China. Br J Cancer 2002; 86:346,347.
63. Yun TK, Yun YS, Han IW. Anticarcinogenic effect of long-term oral administration of red ginsengon newborn mice exposed to various chemical carcinogens. Cancer Detect Prev 1983; 6:515–525.
64. Yun TK, Choi SY. Preventive effect of ginseng intake against various human cancers: a case–controlstudy on 1987 pairs. Cancer Epidemiol Biomarkers Prev 1995; 4:401–408.
65. Chen J, Geissler C, Parpia B, Li J, Campbell TC. Antioxidant status and cancer mortality in China.Int J Epidemiol 1992; 21:625–635.
66. Thurnham DI, Rathakette P, Hambidge KM, Munoz N, Crespi M. Riboflavin, vitamin A and zincstatus in Chinese subjects in a high-risk area for oesophageal cancer in China. Hum Nutr Clin Nutr1982; 36:337–349.
67. Rogers MA, Thomas DB, Davis S, Vaughan TL, Nevissi AE. A case-control study of element levelsand cancer of the upper aerodigestive tract. Cancer Epidemiol Biomarkers Prev 1993; 2:305–312.
68. Sporn MB, Newton DL. Chemoprevention of cancer with retinoids. Fed Proc 1979; 38:2528–34.69. Munoz N, Wahrendorf J, Bang LJ, et al. No effect of riboflavine, retinol, and zinc on prevalence of
precancerous lesions of oesophagus. Randomised double-blind intervention study in high-riskpopulation of China. Lancet 1985; 2:111–4.
70. Munoz N, Hayashi M, Bang LJ, Wahrendorf J, Crespi M, Bosch FX. Effect of riboflavin, retinol, andzinc on micronuclei of buccal mucosa and of esophagus: a randomized double-blind interventionstudy in China. J Natl Cancer Inst 1987; 79:687–691.
71. Wahrendorf J, Munoz N, Lu JB, Thurnham DI, Crespi M, Bosch FX. Blood, retinol and zincriboflavin status in relation to precancerous lesions of the esophagus: findings from a vitamin inter-vention trial in the People’s Republic of China. Cancer Res 1988; 48:2280–2283.
72. Li JY, Taylor PR, Li B, et al. Nutrition intervention trials in Linxian, China: multiple vitamin/min-eral supplementation, cancer incidence, and disease-specific mortality among adults with esophagealdysplasia. J Natl Cancer Inst 1993; 85:1492–1498.
73. Blot WJ, Li JY, Taylor PR, et al. Nutrition intervention trials in Linxian, China: supplementationwith specific vitamin/mineral combinations, cancer incidence, and disease-specific mortality in thegeneral population. J Natl Cancer Inst 1993; 85:1483–1492.
74. Li B, Taylor PR, Li JY, et al. Linxian nutrition intervention trials. Design, methods, participant char-acteristics, and compliance. Ann Epidemiol 1993; 3:577–585.
75. Wang GQ, Dawsey SM, Li JY, et al. Effects of vitamin/mineral supplementation on the prevalenceof histological dysplasia and early cancer of the esophagus and stomach: results from the GeneralPopulation Trial in Linxian, China. Cancer Epidemiol Biomarkers Prev 1994; 3:161–166.
76. Dawsey SM, Wang GQ, Taylor PR, et al. Effects of vitamin/mineral supplementation on the preva-lence of histological dysplasia and early cancer of the esophagus and stomach: results from theDysplasia Trial in Linxian, China. Cancer Epidemiol Biomarkers Prev 1994; 3:167–172.
77. Rao M, Liu FS, Dawsey SM, et al. Effects of vitamin/mineral supplementation on the proliferationof esophageal squamous epithelium in Linxian, China. Cancer Epidemiol Biomarkers Prev 1994;3:277–279.
78. Wang Y, Shi XH, He SQ, et al. Comparison between continuous accelerated hyperfractionated andlate-course accelerated hyperfractionated radiotherapy for esophageal carcinoma. Int J Radiat OncolBiol Phys 2002; 54:131–136.
79. Barrett N. Chronic peptic ulcer of the esophagus and “esophagitis.” Br J Surg 1950; 38:178–182.80. Garewal HS, Sampliner R. Barrett’s esophagus: a model premalignant lesion for adenocarcinoma.
Prev Med 1989; 18:749–756.81. Sjogren RW, Jr., Johnson LF. Barrett’s esophagus: a review. Am J Med 1983; 74:313–321.82. Spechler SJ, Robbins AH, Rubins HB, et al. Adenocarcinoma and Barrett’s esophagus. An overrated
risk? Gastroenterology 1984; 87:927–933.83. Spechler SJ, Goyal RK. Barrett’s esophagus. N Engl J Med 1986; 315:362–371.

50 Part II / Cancer Prevention
84. Hameeteman W, Tytgat GN, Houthoff HJ, van den Tweel JG. Barrett’s esophagus: development ofdysplasia and adenocarcinoma. Gastroenterology 1989; 96:1249–1256.
85. Eng C, Spechler SJ, Ruben R, Li FP. Familial Barrett esophagus and adenocarcinoma of the gas-troesophageal junction. Cancer Epidemiol Biomarkers Prev 1993; 2:397–399.
86. Crabb DW, Berk MA, Hall TR, Conneally PM, Biegel AA, Lehman GA. Familial gastroesophagealreflux and development of Barrett’s esophagus. Ann Intern Med 1985; 103:52–54.
87. Jochem VJ, Fuerst PA, Fromkes JJ. Familial Barrett’s esophagus associated with adenocarcinoma.Gastroenterology 1992; 102:1400–1402.
88. Wang HH, Hsieh CC, Antonioli DA. Rising incidence rate of esophageal adenocarcinoma and useof pharmaceutical agents that relax the lower esophageal sphincter (United States). Cancer CausesControl 1994; 5:573–578.
89. Elder JB, Ganguli PC, Gillespie IE. Cimetidine and gastric cancer. Lancet 1979; 1:1005,1006.90. Chow WH, Finkle WD, McLaughlin JK, Frankl H, Ziel HK, Fraumeni JF Jr. The relation of gas-
troesophageal reflux disease and its treatment to adenocarcinomas of the esophagus and gastric cardia.Jama 1995; 274:474–477.
91. Vaughan TL, Farrow DC, Hansten PD, et al. Risk of esophageal and gastric adenocarcinomas in rela-tion to use of calcium channel blockers, asthma drugs, and other medications that promote gastroe-sophageal reflux. Cancer Epidemiol Biomark Prev 1998; 7:749–756.
92. Ye W, Chow WH, Lagergren J, et al. Risk of adenocarcinomas of the oesophagus and gastric cardiain patients hospitalized for asthma. Br J Cancer 2001; 85:1317–1321.
93. Vaughan TL, Davis S, Kristal A, Thomas DB. Obesity, alcohol, and tobacco as risk factors for can-cers of the esophagus and gastric cardia: adenocarcinoma versus squamous cell carcinoma. CancerEpidemiol Biomark Prev 1995; 4:85–92.
94. Kabat GC, Ng SK, Wynder EL. Tobacco, alcohol intake, and diet in relation to adenocarcinoma ofthe esophagus and gastric cardia. Cancer Causes Control 1993; 4:123–132.
95. Brown LM, Silverman DT, Pottern LM, et al. Adenocarcinoma of the esophagus and esophagogas-tric junction in white men in the United States: alcohol, tobacco, and socioeconomic factors. CancerCauses Control 1994; 5:333–340.
96. Gammon MD, Schoenberg JB, Ahsan H, et al. Tobacco, alcohol, and socioeconomic status and ade-nocarcinomas of the esophagus and gastric cardia. J Natl Cancer Inst 1997; 89:1277–1284.
97. Brown P, Allen AR. Obesity linked to some forms of cancer. W V Med J 2002; 98:271,272.98. Chow WH, Blot WJ, Vaughan TL, et al. Body mass index and risk of adenocarcinomas of the esoph-
agus and gastric cardia. J Natl Cancer Inst 1998; 90:150–155.99. Richter JE, Falk GW, Vaezi MF. Helicobacter pylori and gastroesophageal reflux disease: the bug
may not be all bad. Am J Gastroenterol 1998; 93:1800–1802.100. Chow WH, Blaser MJ, Blot WJ, et al. An inverse relation between cagA+ strains of Helicobacter pylori
infection and risk of esophageal and gastric cardia adenocarcinoma. Cancer Res 1998; 58:588–590.101. Henrik Siman J, Forsgren A, Berglund G, Floren CH. Helicobacter pylori infection is associated
with a decreased risk of developing oesophageal neoplasms. Helicobacter 2001; 6:310–316.102. Weston AP, Badr AS, Topalovski M, Cherian R, Dixon A, Hassanein RS. Prospective evaluation of
the prevalence of gastric Helicobacter pylori infection in patients with GERD, Barrett’s esophagus,Barrett’s dysplasia, and Barrett’s adenocarcinoma. Am J Gastroenterol 2000; 95:387–394.
103. Graham DY. Helicobacter pylori is not and never was “protective” against anything, includingGERD. Dig Dis Sci 2003; 48:629,630.
104. Rauws EA. Should Helicobacter pylori be eradicated before starting long-term proton pumpinhibitors? Ital J Gastroenterol Hepatol 1997; 29:569–573.
105. Haenszel W. Variation in incidence and mortality from stomach cancer with particular reference tothe United States. J Natl Cancer Inst 1958; 21:231–262.
106. Levin D, Devesa S, Godwin J, Silverman D. Cancer Rates and Risks, 2nd ed. USDHEW,Washington, DC, 1974.
107. Devesa SS, Silverman DT. Cancer incidence and mortality trends in the United States: 1935–74.J Natl Cancer Inst 1978; 60:545–571.
108. Howson CP, Hiyama T, Wynder EL. The decline in gastric cancer: epidemiology of an unplannedtriumph. Epidemiol Rev 1986; 8:1–27.
109. Nomura A. Stomach. In: Schottenfeld D, Fraumeni I, eds. Cancer Epidemiology and Prevention. WBSaunders, Philadelphia, 1982, pp. 624–637.

Chapter 2 / Cancers of the Esophagus and Stomach 51
110. Jarvi O, Lauren P. On the role of heterotopias of intestinal epithelium in pathogenesis of gastric cancer.Acta Path et Microbiol Scand 1951; 29:26–44.
111. Lauren P. The two histological main types of gastric carcinoma: diffuse and so-called intestinal-typecarcinoma. An attempt at a histodimcal classification. Acta Pathol Microbiol Scand 1965; 64:31–49.
112. Munoz N, Correa P, Cuello C, Duque E. Histologic types of gastric carcinoma in high- and low-riskareas. Int J Cancer 1968; 3:809–818.
113. Pel P. Ziekten van de Maag (Diseases of the Stomach). De Erven F Bohn, Amsterdam, 1899.114. Marshall BJ, Warren JR. Unidentified curved bacilli in the stomach of patients with gastritis and peptic
ulceration. Lancet 1984; 1:1311–1315.115. IARC Monographs in the Evaluation of Carcinogenic Risks to Humans. Schistosomes, Liver Flukes
and Helicobacter pylori. World Health Organization, Lyons, France, 1994.116. Megraud F. Epidemiology of Helicobacter pylori infection. Gastroenterol Clin North Am 1993;
22:73–88.117. Parsonnet J. The Epidemiology of C. pylon. In: Blaser M, ed. Campylobacterpyloni in Gastritis and
Peptic Ulcer Disease. Igaku-Shoin, New York, 1989, pp. 51–60.118. An international association between Helicobacter pylori infection and gastric cancer. The EURO-
GAST Study Group. Lancet 1993; 341:1359–1362.119. Roma-Giannikou E, Karameris A, Balatsos B, et al. Intrafamilial spread of Helicobacter pylori: a
genetic analysis. Helicobacter 2003; 8:15–20.120. Forman D, Newell DG, Fullerton F, et al. Association between infection with Helicobacter pylori
and risk of gastric cancer: evidence from a prospective investigation. BMJ 1991; 302:1302–1305.121. Parsonnet J, Friedman GD, Vandersteen DP, et al. Helicobacter pylori infection and the risk of
gastric carcinoma. N Engl J Med 1991; 325:1127–1131.122. Nomura A, Stemmermann GN, Chyou PH, Kato I, Perez-Perez GI, Blaser MJ. Helicobacter pylori
infection and gastric carcinoma among Japanese Americans in Hawaii. N Engl J Med 1991;325:1132–1136.
123. Sobala GM, Schorah CJ, Sanderson M, et al. Ascorbic acid in the human stomach. Gastroenterology1989; 97:357–363.
124. Rathbone BJ, Johnson AW, Wyatt JI, Kelleher J, Heatley RV, Losowsky MS. Ascorbic acid: a factorconcentrated in human gastric juice. Clin Sci (Lond) 1989; 76:237–241.
125. Sobala GM, Pignatelli B, Schorah CJ, et al. Levels of nitrite, nitrate, N-nitroso compounds, ascorbicacid and total bile acids in gastric juice of patients with and without precancerous conditions of thestomach. Carcinogenesis 1991; 12:193–198.
126. Ruiz B, Rood JC, Fontham ET, et al. Vitamin C concentration in gastric juice before and after anti-Helicobacter pylori treatment. Am J Gastroenterol 1994; 89:533–539.
127. Wyatt JI, Rathbone BJ. Immune response of the gastric mucosa to Campylobacter pylori. ScandJ Gastroenterol Suppl 1988; 142:44–49.
128. Routledge MN, Wink DA, Keefer LK, Dipple A. Mutations induced by saturated aqueous nitricoxide in the pSP189 supF gene in human Ad293 and E. coli MBM7070 cells. Carcinogenesis 1993;14:1251–1254.
129. Radi R, Beckman JS, Bush KM, Freeman BA. Peroxynitrite oxidation of sulfhydryls. The cytotoxicpotential of superoxide and nitric oxide. J Biol Chem 1991; 266:4244–4250.
130. Uemura N, Okamoto S, Yamamoto S, et al. Helicobacter pylori infection and the development ofgastric cancer. N Engl J Med 2001; 345:784–789.
131. Prinz C, Hafsi N, Voland P. Helicobacter pylori virulence factors and the host immune response:implications for therapeutic vaccination. Trends Microbiol 2003; 11:134–138.
132. Blaser MJ, Perez-Perez GI, Kleanthous H, et al. Infection with Helicobacter pylori strains possessingcagA is associated with an increased risk of developing adenocarcinoma of the stomach. Cancer Res1995; 55:2111–2115.
133. Kuipers EJ, Perez-Perez GI, Meuwissen SG, Blaser MJ. Helicobacter pylori and atrophic gastritis:importance of the cagA status. J Natl Cancer Inst 1995; 87:1777–1780.
134. Parsonnet J, Friedman GD, Orentreich N, Vogelman H. Risk for gastric cancer in people with CagApositive or CagA negative Helicobacter pylori infection. Gut 1997; 40:297–301.
135. El-Omar EM, Rabkin CS, Gammon MD, et al. Increased risk of noncardia gastric cancer associatedwith proinflammatory cytokine gene polymorphisms. Gastroenterology 2003; 124:1193–1201.
136. Hirayama T. Epidemiology of stomach cancer. GANN Monogr Cancer Res 1971; 11:3–19.

52 Part II / Cancer Prevention
137. Wynder E, Kmet J, Dungal N, Segi M. An epidemiologic investigation of gastric cancer. Cancer1963; 16:1461–1496.
138. Graham S, Schotz W, Martino P. Alimentary factors in the epidemiology of gastric cancer. Cancer1972; 30:927–938.
139. Acheson E, Doll R. Dietary factors in carcinoma of the stomach: a study of 100 cases and 200 controls.Gut 1964; 5:126–131.
140. Correa P, Fontham E, Pickle LW, Chen V, Lin YP, Haenszel W. Dietary determinants of gastric cancerin south Louisiana inhabitants. J Natl Cancer Inst 1985; 75:645–654.
141. Wu-Williams AH, Yu MC, Mack TM. Life-style, workplace, and stomach cancer by subsite in youngmen of Los Angeles County. Cancer Res 1990; 50:2569–2576.
142. Boeing H, Frentzel-Beyme R, Berger M, et al. Case–control study on stomach cancer in Germany.Int J Cancer 1991; 47:858–864.
143. Hoey J, Montvernay C, Lambert R. Wine and tobacco: risk factors for gastric cancer in France. AmJ Epidemiol 1981; 113:668–674.
144. Nomura A, Grove JS, Stemmermann GN, Severson RK. A prospective study of stomach cancer andits relation to diet, cigarettes, and alcohol consumption. Cancer Res 1990; 50:627–631.
145. Kneller RW, McLaughlin JK, Bjelke E, et al. A cohort study of stomach cancer in a high-riskAmerican population. Cancer 1991; 68:672–678.
146. Kahn HA. The Dorn study of smoking and mortality among US veterans: report on eight and one-half years of observation. Natl Cancer Inst Monogr 1966; 19:1–125.
147. Vineis P, Alavanja M, Nbuffler P, et al. Tobacco and cancer: recent epidemiological evidence. J NatlCancer Inst, in press.
148. Tredaniel J, Boffetta P, Buiatti E, Saracci R, Hirsch A. Tobacco smoking and gastric cancer: reviewand meta-analysis. Int J Cancer 1997; 72:565–573.
149. Kinosita R. Studies on factors affecting chemical carcinogenesis of mouse stomach. GANN Monogr1969; 8:263–268.
150. Tatematsu M, Takahashi M, Fukushima S, Hananouchi M, Shirai T. Effects in rats of sodium chlo-ride on experimental gastric cancers induced by N-methyl-N-nitro-N-nitrosoguanidine or 4-nitro-quinoline-1-oxide. J Natl Cancer Inst 1975; 55:101–106.
151. Kodama M, Kodama T, Suzuki H, Kondo K. Effect of rice and salty rice diets on the structure ofmouse stomach. Nutr Cancer 1984; 6:135–147.
152. Takahashi M, Kokubo T, Furukawa F. Effects of sodium chloride, saccharin, phenobarbitol andaspirin on gastric carcinogenesis in rats after irritation with N-methyl-N-nitrosoguanidine. Gann1984; 75:494–501.
153. Mirvish SS. The etiology of gastric cancer. Intragastric nitrosamide formation and other theories.J Natl Cancer Inst 1983; 71:629–647.
154. Sato T, Fukuyama T, Suzuki T. Studies of the causation of gasric cancer. The relation between gas-tric cancer mortality rate and salted food intake in several places in Japan. Bull Inst Publ Health(Japan) 1959; 8:187–198.
155. Lu JB, Qin YM. Correlation between high salt intake and mortality rates for oesophageal and gastriccancers in Henan Province, China. Int J Epidemiol 1987; 16:171–176.
156. Buiatti E, Palli D, DeCarli A, Amadori D, Avellini C, Bianchi S. Italian multicenter case–controlstudy on gastric cancer and diet. 1. Frequencies of food consumption. Int J Cancer 1989;44:611–616.
157. Tajima K, Tominaga S. Dietary habits and gastro-intestinal cancers: a comparative case–controlstudy of stomach and large intestinal cancers in Nagoya, Japan. Jpn J Cancer Res 1985; 76:705–716.
158. Lee JK, Park BJ, Yoo KY, Ahn YO. Dietary factors and stomach cancer: a case–control study inKorea. Int J Epidemiol 1995; 24:33–41.
159. Ward MH, Lopez-Carrillo L. Dietary factors and the risk of gastric cancer in Mexico City. Am JEpidemiol 1999; 149:925–932.
160. Tuyns AJ. Salt and gastrointestinal cancer. Nutr Cancer 1988; 11:229–232.161. La Vecchia C, Negri E, Decarli A, D’Avanzo B, Franceschi S. A case–control study of diet and gastric
cancer in northern Italy. Int J Cancer 1987; 40:484–489.162. Friedman GD, Parsonnet J. Salt intake and stomach cancer: some contrary evidence. Cancer
Epidemiol Biomark Prev 1992; 1:607,608.163. Correa P, Fontham ET, Bravo JC, et al. Chemoprevention of gastric dysplasia: randomized trial of
antioxidant supplements and anti-helicobacter pylori therapy. J Natl Cancer Inst 2000; 92:1881–1888.

Chapter 2 / Cancers of the Esophagus and Stomach 53
164. Bogovski P, Bogovski S. Animal Species in which N-nitroso compounds induce cancer. Int J Cancer1981; 27:471–474.
165. Correa P, Haenszel W, Cuello C, Tannenbaum S, Archer M. A model for gastric cancer epidemiology.Lancet 1975; 2:58–60.
166. Ohshima H, Bartsch H. Quantitative estimation of endogenous nitrosation in humans by monitoringN-nitrosoproline excreted in the urine. Cancer Res 1981; 41:3658–662.
167. Mirvish SS, Grandjean AC, Moller H, et al. N-nitrosoproline excretion by rural Nebraskans drinkingwater of varied nitrate content. Cancer Epidemiol Biomark Prev 1992; 1:455–461.
168. Moller H, Landt J, Pedersen E, Jensen P, Autrup H, Jensen OM. Endogenous nitrosation in relationto nitrate exposure from drinking water and diet in a Danish rural population. Cancer Res 1989;49:3117–3121.
169. Sierra R, Chinnock A, Ohshima H, et al. In vivo nitrosoproline formation and other risk factors inCosta Rican children from high- and low-risk areas for gastric cancer. Cancer Epidemiol BiomarkPrev 1993; 2:563–568.
170. Risch HA, Jain M, Choi NW, et al. Dietary factors and the incidence of cancer of the stomach. AmJ Epidemiol 1985; 122:947–959.
171. Chyou PH, Nomura AM, Hankin JH, Stemmermann GN. A case–cohort study of diet and stomachcancer. Cancer Res 1990; 50:7501–7504.
172. Buiatti E, Palli D, Decarli A, et al. A case–control study of gastric cancer and diet in Italy: II.Association with nutrients. Int J Cancer 1990; 45:896–901.
173. Buiatti E, Palli D, Bianchi S, et al. A case–control study of gastric cancer and diet in Italy. III. Riskpatterns by histologic type. Int J Cancer 1991; 48:369–374.
174. Hansson LE, Nyren O, Bergstrom R, et al. Nutrients and gastric cancer risk. A population-basedcase–control study in Sweden. Int J Cancer 1994; 57:638–644.
175. Gonzalez CA, Riboli E, Badosa J, et al. Nutritional factors and gastric cancer in Spain. Am JEpidemiol 1994; 139:466–473.
176. Meinsma I. Nutrition and cancer. Voeding 1964; 25:357–365.177. Higginson J. Etiological factors in gastrointestinal cancer in man. J Natl Cancer Inst 1966;
37:527–545.178. Haenszel W, Kurihara M, Segi M, Lee RK. Stomach cancer among Japanese in Hawaii. J Natl
Cancer Inst 1972; 49:969–988.179. Bjelke E. Epidemiologic studies of cancer of the stomach, colon, and rectum; with special emphasis
on the role of diet. Scand J Gastroenterol 1974; 31(Suppl):1–235.180. Haenszel W, Kurihara M, Locke FB, Shimuzu K, Segi M. Stomach cancer in Japan. J Natl Cancer
Inst 1976; 56:265–274.181. Trichopoulos D, Ouranos G, Day NE, et al. Diet and cancer of the stomach: a case–control study in
Greece. Int J Cancer 1985; 36:291–297.182. Jedrychowski W, Wahrendorf J, Popiela T, Rachtan J. A case–control study of dietary factors and
stomach cancer risk in Poland. Int J Cancer 1986; 37:837–842.183. You WC, Blot WJ, Chang YS, et al. Diet and high risk of stomach cancer in Shandong, China.
Cancer Res 1988; 48:3518–523.184. Buiatti E, Palli D, Decarli A, et al. A case–control study of gastric cancer and diet in Italy. Int
J Cancer 1989; 44:611–616.185. Graham S, Haughey B, Marshall J, et al. Diet in the epidemiology of gastric cancer. Nutr Cancer
1990; 13:19–34.186. Negri E, La Vecchia C, Franceschi S, D’Avanzo B, Parazzini F. Vegetable and fruit consumption and
cancer risk. Int J Cancer 1991; 48:350–354.187. Gonzalez CA, Sanz JM, Marcos G, et al. Dietary factors and stomach cancer in Spain: a multi-centre
case–control study. Int J Cancer 1991; 49:513–519.188. Hoshiyama Y, Sasaba T. A case–control study of single and multiple stomach cancers in Saitama
Prefecture, Japan. Jpn J Cancer Res 1992; 83:937–943.189. La Vecchia C, Ferraroni M, D’Avanzo B, Decarli A, Franceschi S. Selected micronutrient intake and
the risk of gastric cancer. Cancer Epidemiol Biomark Prev 1994; 3:393–398.190. Hansson LE, Nyren O, Bergstrom R, et al. Diet and risk of gastric cancer. A population-based
case–control study in Sweden. Int J Cancer 1993; 55:181–189.191. Lopez-Carrillo L, Hernandez Avila M, Dubrow R. Chili pepper consumption and gastric cancer in
Mexico: a case–control study. Am J Epidemiol 1994; 139:263–271.

54 Part II / Cancer Prevention
192. Norat T, Riboli E. Fruit and vegetable consumption and risk of cancer of the digestive tract: meta-analysis of published case–control and cohort studies. IARC Sci Publ 2002; 156:123–125.
193. Basu T, Schorah C. Vitamin C Reserves and Requirements in Health and Disease. Vitamin C inHealth and Disease. AVI, Westport, CT, 1982, pp. 62–92.
194. Stahelin HB, Gey KF, Eichholzer M, et al. Plasma antioxidant vitamins and subsequent cancer mor-tality in the 12-year follow-up of the prospective Basel Study. Am J Epidemiol 1991; 133:766–775.
195. Haenszel W, Correa P, Lopez A, et al. Serum micronutrient levels in relation to gastric pathology. IntJ Cancer 1985; 36:43–48.
196. Kabuto M, Imai H, Yonezawa C, et al. Prediagnostic serum selenium and zinc levels and subsequentrisk of lung and stomach cancer in Japan. Cancer Epidemiol Biomark Prev 1994; 3:465–469.
197. Serdula MK, Coates RJ, Byers T, Simoes E, Mokdad AH, Subar AF. Fruit and vegetable intakeamong adults in 16 states: results of a brief telephone survey. Am J Public Health 1995; 85:236–239.
198. Malfertheiner P, Megraud F, O’Morain C, et al. Current concepts in the management of Helicobacterpylori infection—the Maastricht 2-2000 Consensus Report. Aliment Pharmacol Ther 2002;16:167–180.
199. Howden CW, Hunt RH. Guidelines for the management of Helicobacter pylori infection. Ad HocCommittee on Practice Parameters of the American College of Gastroenterology. Am J Gastroenterol1998; 93:2330–2338.

From: Preventive Nutrition: The Comprehensive Guide for Health Professionals, Third EditionEdited by: A. Bendich and R. J. Deckelbaum © Humana Press Inc., Totowa, NJ
55
3 Non-Nutritive Components in Foodsas Modifiers of the Cancer Process
Keith W. Singletary, Steven J. T. Jackson,and John A. Milner
KEY POINTS
● Dietary habits are instrumental in about 40% of cancers in men and 60% in women.● Fruit and vegetable consumption is associated with decreased risk of several cancers.● Fruits and vegetables contain many non-nutritive as well as nutritive compounds
including carotenoids, dithiolthiones, flavonoids, glucosinolates, indoles, isothiocyanates,monoterpenes, phenols, sterols, sulfhydryls, and vitamins including folate, C, and E.
● Anticarcinogenic actions from dietary components in fruits and vegetables includethe induction of detoxification enzymes, blockage of carcinogen formation (such asnitrosamines), shifts in hormone homeostasis, slowing of cell division, induction ofapoptosis, depression in angiogenesis, and several others.
● There are critical interrelationships between diet, environment, and genetics that affectcancer risk.
● In addition to fruits and vegetables, teas, spices, and herbs consumed in the diet havebeen associated with reducing cancer risk in cell culture and animal models; epidemi-ological studies show similar associations, but there are very few intervention studiesto date.
1. INTRODUCTION
Cancer, once thought to be an inevitable consequence of the aging process, is nowconsidered to be primarily determined by the interaction of environmental factors,including dietary habits, with genetic, epigenetic, and posttranslational events involvedin the cancer process (1–6). Because dominantly inherited or familial cancers probablycontribute only a small percent of total cases, it is of paramount importance to identifythose environmental modulators that influence nonfamilial risks (1,2,7). Dietary habitsare possibly a variable that markedly influences nonfamilial cancer risk. Some haveestimated that dietary habits are instrumental in about 60% of cancers in women andabout 40% of cancers in men (8). Although these are significant contributions, the true

56 Part II / Cancer Prevention
effect depends on the individual’s genetic profile, the particular neoplasms, and thecomposition of the entire diet.
Although variability exists, fruit and vegetable consumption has often been inverselylinked with the incidence of cancer (9–17). The reason for variability remains obscurebut may relate to oxidative balance (13,16) or other physiological changes as indicatedin this chapter. Variations in pro- and antioxidant conditions that might arise from theabsence or presence of food components is recognized as an influence on several essen-tial cellular functions, including gene expression profiles (18,19). This homeostasis isunquestionably complex, as evident by the sensitivity of several kinases and transcriptionfactors to rather subtle shifts in redox status (20,21).
Almost a decade ago, Serdula et al. (22) reported that men and women living invarious regions of the United States consumed an average of 3.3 and 3.7 servings offruit and vegetables per day, respectively. More recently, based on a telephonesurvey, mean daily servings of fruits and vegetables consumed by rural African-Americans were found to be 3.7 (23). In addition, in 1999, Thompson et al. (24)reported that daily consumption by 15,060 adults averaged 3.6 servings based on aseven-item food frequency questionnaire. Collectively, although there is a fairamount of agreement about average intakes, the actual number of servings dependson several societal factors, including cost and availability, as well as several personaldeterminants such as age, education, and race. Unquestionably, variation in fruit andvegetable consumption is recognized to influence an individual’s redox status(17,20,25). Unfortunately, few Americans (10–20%) consume the recommended fiveor more daily servings of fruits and vegetables (22). Thompson et al. (17) suggestedthat even these individuals may not be able to meet all oxidative challenges. Theirstudies revealed that women whose daily vegetable and fruit consumption increasedfrom 5.8 to 12 servings exhibited a marked reduction in 8-hydroxydeoxyguanosinein DNA isolate from peripheral lymphocytes, a biomarker of oxidative cellular damage.Overall, the linkages between fruit and vegetable consumption and reduced cancerrisk serve as sufficient evidence for the continued examination of individual foodsor dietary components as modulators of the initiation, promotion, or progression stagesof carcinogenesis.
A large number of agents with antioxidant properties are found in fruits and vegeta-bles, including carotenoids, dithiolthiones, flavonoids, glucosinolates, indoles, isothio-cyanates, monoterpenes, phenols, sterols, sulfhydryls, and vitamins (including folate, C,and E). These dietary components likely have both complementary and overlappingmechanisms of action, including the induction of detoxification enzymes, blockage ofcarcinogen formation (such as nitrosamines), shifts in hormone homeostasis, slowingof cell division, induction of apoptosis, depression in angiogenesis, and several others.
Although several macronutrients likely are involved in the cancer process, they donot appear to totally explain the worldwide variance in cancer risk. Furthermore, it ispossible that their impact is markedly influenced by several physiologically importantdietary constituents. A host of nonessential constituents continue to emerge as key mod-ulators of cancer risk. Collectively, these findings have highlighted the new andintriguing term functional foods, a name based on the ability of selected foods to havehealth benefits over and beyond the basic nutrition provided. These so-called functionalfoods continue to captivate the interest of scientists and legislators and, most impor-tantly throughout the world, the consumer (26–28). Although the term functional foods
56 Part II / Cancer Prevention

Chapter 3 / Non-Nutritive Components and Cancer Risk 57
has no legal meaning, it signifies a proactive movement that deals with the health ben-efits of foods. Certainly, this is a refreshing change to the largely negative campaignsthat have been the norm for providing diet and health information to the general publicduring the past few decades.
Clearly, variability in detecting an association between dietary practices andcancer risk is logical because such a relationship must depend on a host of environ-mental and genomic factors. The complexity of this issue becomes evident when oneconsiders the multitude of interactions that can occur among the many food compo-nents. Likewise, because all metabolical and phenotypical characteristics are linkedby heredity, it is almost inconceivable that a simple solution will alter susceptibilityequally in all individuals. A greater understanding of the interrelationships amongdiet, environment, and genomics is needed to determine who might benefit mostfrom changes in eating behavior. Acquiring this information will be key in producingtailored dietary recommendations that can assist in minimizing cancer risk in targetpopulations (29).
To date, more than 500 compounds have been suggested as potential modifiers ofcancer. Some of the major antioxidant constituents of fruit, vegetables, and beveragesare derived from phenolic phytochemicals synthesized through the shikimate pathwayfrom tyrosine and phenylalanine (30,31). Many of these exist as O-glycosides andO-methyl conjugates. Some are broadly presented in Table 1.
Cinnamic acid, widely found in fruits and vegetables, is a transformation product ofphenylalanine produced by the action of phenylalanine-ammonia lyase. Isoflavonoids,flavonoids, and lignans are additional plant constituents that make up the three principalclasses of phytoestrogens consumed by humans. Soy, a staple for many Asians, is a majorsource of the isoflavonoids daidzein and genistein,.
Flavonoids are also abundantly present in fruits. Quercetin and kaempferol are twocommonly found flavonoids that are particularly profuse in apples, onions, and tealeaves. Plant lignans are present in many cereal grains, fruits, and vegetables and giverise to the mammalian lignans enterodiol and enterolactone. The richest sources oflignan precursors, such as secoisolariciresinol and matairesinol, are linseed (flaxseed)
Table 1Potential Anticarcinogenic Compounds in Fruits, Vegetables, and Spices
Compound Food source
Cinnamic acid Fruit, vegetables, coffee beansFlavonoids Vegetables, fruits, citrus
Flavones Fruit, celery, parsleyFlavonols Vegetables, grains, onions, teaCatechins TeaFlavanones Citrus, grapefruitIsoflavones SoybeanAnthocyanidins Grapes, cherry, raspberry
Indoles Cruciferous vegetablesIsothiocyanates Cruciferous vegetablesLignans Grains, flaxOrganosulfur Allium vegetables: garlic and onionsTerpenes Citrus, spices

58 Part II / Cancer Prevention
and other oil seeds. Allium foods—including garlic, onions, and leeks—provide a hostof organosulfur compounds that may influence health.
Terpenes are a group of hydrocarbons made up of building blocks of isoprene (C5H8)units that are widespread in nature. Most occur in plants as constituents of essential oils.Monoterpenes are composed of two units such as limonene, citral, and camphor, whereassesquiterpenes are made up of three units and include compounds such as humulene,which is a hops aromatic. Carotene is an example of an 8-isoprene or tetraterpene unit.
Fruit and vegetable consumption is not the only dietary factor that can influencecancer risk. Ingestion of green and black tea, herbs, and spices has been reported tobe inversely associated with cancer risk (25,32–35). Some of these food items andtheir associated non-nutritive components are also addressed in subsequent parts ofthis chapter.
This chapter is limited to a few nonessential dietary components or for those forwhich substantial documentation exists about an effect on the cancer process and forthose in which a plausible mechanism of action can be postulated. It must be noted thatthe response to individual components is assumed to be consistent with that occurringin a complex food matrix. Whether this is true or not remains to be adequately verified.
2. CINNAMIC ACID
Cinnamic acid, chemically related to benzoic acid, is ubiquitous in plants and fruits,providing a natural protection against infections by pathogenic microorganisms. Productscontaining cinnamon oil are particularly rich sources of cinnamic acid. Its relatively lowtoxicity coupled with its flavoring characteristics has fostered its commercial use (36).
Cinnamic acid and associated derivatives possess a broad spectrum of antifungal andantibacterial activities (36–38). Cinnamic acid decreases revertants in eukaryoticmurine FM3A cells induced by ethyl methanesulfonate (an alkylating agent), hydrogenperoxide (an oxidizing agent), and quinacrine (a frameshift mutagen) (39). Additionally,cinnamic acid has antitumor activity against a wide range of neoplasms (40,41).Cinnamic acid may exert its antiproliferative effects by inhibition of protein isopreny-lation, which in turn inhibits mitogenic signal transduction (40,42). Likewise, cinnamoylanalogs are recognized to act as specific protein tyrosine kinase inhibitors, also possiblyaccounting for their ability to suppress tumor cell growth (43). It must be emphasizedthat the concentrations of cinnamic acid necessary to bring about antitumorigenic prop-erties are rather massive (2–8 mM). Thus, the true physiological importance in modifyingcancer risk remains to be determined. Interestingly, the combination of interferon-α andcinnamic acid was more effective in retarding the proliferation of A549 human lungcancer than either compound alone (44). Additional studies are needed to determinewhat effects, if any, cinnamic acid and associated compounds have on other models ofcancer, especially those where dietary manipulation is possible.
3. FLAVONOIDS
The flavonoids are a group of organic molecules ubiquitously distributed in vascularplants. Approximately 4000 flavonoid compounds are known to exist. Typical dietaryintakes of flavonoids are not known with any certainty but are estimated to be severalhundred milligrams per day (45). As modified phenolic compounds, these compoundscan act as potent antioxidants and metal chelators. The cytochrome P450 (CYP) 1A
58 Part II / Cancer Prevention

Chapter 3 / Non-Nutritive Components and Cancer Risk 59
enzyme appears to be predominately involved in flavonoid hydroxylation, whereasother cytochrome CYP enzymes are involved in their demethylation (46). Overall, severalof these flavonoids appear to be effective antipromoters of the cancer process. In addition,some appear to be effective inhibitors of the bioactivation of selected carcinogens.However, depending on the flavonoid as well as the specific foreign compound, theinfluence can sometimes be stimulatory, whereas in other cases it is inhibitory (47).
Flavonoids are generally classified on the basis of substitutions occurring on one ormore of the rings. These classes include flavones, flavonols, flavanones, andisoflavones. Table 2 lists some compounds within each class that have been examinedfor their anticarcinogenic properties.
3.1. FlavonesTangeretin and nobiletin are two polymethoxylated flavonoids in citrus foods that
have been examined for their anticarcinogenic properties (48,49). These unhydroxy-lated compounds have been shown to modify several CYP enzymes. Canivenc-Lavier et al. (50) reported that tangeretin increased rat liver CYP 1A1, 1A2, and2B1, 2 by about 80% and sixfold when provided at 0.3% in the diet for 2 wk. Theability of tangeretin to inhibit unscheduled DNA synthesis induced in cultured humanliver slices by 2-amino-1-methyl-6-phenylimidazo[4,5-b]pyridine (PhIP) and 2-acety-laminofluorene (2-AAF) may be attributable to the these CYP changes (51). Nevertheless,it remains to be determined how important these changes are in vivo in determiningtumor incidence.
Both nobiletin and tangeretin are effective in inhibiting the growth of a variety ofneoplastic cells in culture (52,53). Both markedly inhibited the proliferation of a squa-mous cell carcinoma and a gliosarcoma cell line when added to the medium at relativelyhigh concentrations (2–8 mg/mL) (52). Tangeretin appears to bring about part of itsantitumorigenic effects by causing G1 arrest and by decreasing the degree of phospho-rylation of the retinoblastoma tumor suppressor protein (49). The decrease in Cdk2 andCdk4 or the increase of the Cdk inhibitors p21 and p27 may account for some of thesignal changes involved with the G1 arrest (49).
Table 2Examples of Classes of Flavonoids Found in the Food Supply
Class Food sources
FlavonesTangeretin CitrusNobiletin Citrus
FlavonolsQuercetin Fruits, vegetables, cereal grainsKaempferol Fruits, vegetablesCatechins Tea
FlavanonesNaringenin Grapefruit
IsoflavonesGenistein SoybeansDaidzein Soybeans

60 Part II / Cancer Prevention
Some cells, such as the human lung fibroblast-like cell line (CCL 135), were relativelyresistant to these flavonoids, pointing to the error in assuming that all tumors are iden-tical in their sensitivity to these bioactive food components. Kawaii et al. (53) providedevidence that the orthocatechol moiety in ring B and a C2–C3 double bond were impor-tant for the antiproliferative activity. More recently, Bracke et al. (54) found that althoughtamoxifen and tangeretin exhibit similar inhibitory effects on the growth and invasiveproperties of human mammary cancer cells in vitro, only tamoxifen was effective in axenograph transplant model, suggesting that absorption may be different between thetwo compounds. However, of greater concern was that when the two were combined,an interference with the effectiveness of tamoxifen emerged. Clearly, such evidencereveals that it is unwise, and possibly counterproductive, to use flavonoids as adjuvanttherapy until their true impact on classical therapies are better understood.
3.2. Flavonols3.2.1. QUERCETIN AND KAEMPFEROL
Although two of the most common flavonols—quercetin (3,5,7,3′,4′-pentahydrox-yflavone) and kaempferol (3,5,7,4′-tetrahydroxyflavone)—do exhibit some mutagenicityin the Ames assay (55), they also appear to be effective modifiers of cancer risk.Conjugates including quercitrin (quercetin-3-L-rhamnoside), quercetin-3-glucoside, andrutin (quercetin-3-β-D-rutinoside) are known to occur in nature and, at times, have bio-logical activity. Flavonoids such as quercetin, rather than vitamin C, can contribute sig-nificantly to the total antioxidant capacity of fruits such as apples. In fact, quercetincontributes about four times as much antioxidant power as vitamin C in several culti-vars of apples including Golden Delicious, Cortland, Monroe, Rhode Island Greening,and Empire (56). Although flavonols can be absorbed into the bloodstream principallyas glucosides, minor structural differences can markedly influence both the level ofaccumulation and the extent to which the conjugates are excreted (57).
Quercetin is recognized as a potent modifier of CYP 1A1 reactions (58). In studiesby Verma et al. (59), up to 5% quercetin was fed without apparent ill consequences tothe rat and resulted in significantly reduced incidence of both 7,12-dimethylbenz[a]-anthracene (DMBA)- and N-methyl-N-nitrosourea (MNU)-induced mammary tumors(59). Such data suggest that bioactivation is not essential for the protection provided.Evidence exists that quercetin can inhibit the promotion phase of DMBA- and MNU-induced skin tumors (60). Similarly, considerable evidence points to the ability ofquercetin and related compounds to modify the proliferation of existing neoplasms.These growth-inhibitory effects frequently coincide with a block in the G0/G1 phase ofthe cell cycle. Ranelletti et al. (61) found that quercetin addition to cultures of coloncancer cell lines produced a dose-dependent, reversible growth inhibition and thatquercetin reduced p21-ras proteins by about 50% in both cultured colon cancer cell linesand primary colorectal tumors (61,62). Also, it inhibited the expression of K-, H-, andN-ras proteins. More recently, the G1 arrest caused by quercetin in primary human fore-skin keratinocytes in G1 was linked to an elevation in the cyclin-dependent kinase (cdk)inhibitor p27(Kip1). The elevation in p27 appeared to result from not only an increasedhalf-life of the protein but also an increase in its messenger RNA (mRNA) transcription(63). Moreover, evidence suggests that the antimitotic effect of quercetin may be causedby inhibition of microtubule polymerization resulting from direct binding of quercetinwith tubulin protein (64).
60 Part II / Cancer Prevention

Chapter 3 / Non-Nutritive Components and Cancer Risk 61
Quercetin has been shown to induce mitotic cell cycle arrest and trigger apoptosis inhuman breast cancer cells (65). In human promyelocytic leukemia HL-60 cells, apoptosisinduced by adding quercetin correlated with a loss of mitochondrial transmembranepotential, cytochrome c release, and caspase-9 and -3 activation (66,67). Recent evidencesuggests that this effect might involve the CD95 apoptotic pathway. This pathway hasbeen well-characterized because it plays a fundamental role in immunosurveillance and inimmune evasion by tumors. Fas antigen CD95 (Fas/APO-1) has become best known as adeath receptor that activates the extrinsic apoptosis pathway. CD95 is a member of thetumor necrosis factor growth factor receptor superfamily and is currently recognized asthe principal cell surface receptor involved in the signal transduction that induces apop-tosis in the immune system and various tumor cells. Recently, quercetin was found inhuman pre-B (HPB)-acute lymphoblastic leukemia cells, which are normally resistant toCD95-mediated apoptosis, and sensitized this cell line through a mechanism independentof its antioxidant properties and likely through the activation of protein kinase C-α(68).
Estrogenic potency of some flavonoids can be significant, especially for estrogenreceptor (ER)-β. Thus, hormonal changes may trigger some of the biological responsesthat are evoked by some flavonoids (69). Transcriptional activity experiments with nuclearERs reveal a stronger activation of ER-β than ER-α by genistein (69). However, genisteinand the flavonid quercetin have also been shown to activate endogenous ER-α in humanbreast cancer cells (70). Interestingly, at concentrations that are sufficient to promotetranscriptional activity they simulate proliferation; however, at higher concentrationsthese phytoestrogens are strong cytotoxic agents that can kill ER-independent HeLacells (70). Overall, the mode of action of phytoestrogens and the balance between eitherrisk or chemopreventive factors for breast cancer may depend heavily on the totaldietary intake. Likewise, it must be emphasized that not all tumors are equally sensitiveto flavonols, and those that are sensitive vary considerably. (52).
3.2.2. GREEN AND BLACK TEA FLAVONOLS
Grown in about 30 countries, tea is consumed with considerable variability as a bev-erage among individuals (71). Although tea continues to be the most widely consumedbeverage (other than water), consumption is only about 0.12 L/yr. Tea is manufacturedin three basic forms: unoxidized (green) tea, oxidized (black) tea, and partially oxidized(oolong) tea. Only about 20% of the tea produced is green, whereas less than 2% isoolong. Green tea is consumed primarily in China, Japan, and a few countries in NorthAfrica and the Middle East, although it is gaining in popularity in other parts of the world.
Fresh tea leaves are unusually rich in polyphenols. These catechin polyphenolicsmay constitute up to 30% of the dry leaf weight. Other polyphenols include flavonolsand their glycosides, chlorogenic acid, coumarylquinic acid, and one unique to tea—theogallin (3-galloylquinic acid). Various quinones are produced by oxidation and con-dense to form a series of compounds, including bisflavanols, theaflavins, epitheaflavicacids, and thearubigens, which give rise to the characteristic taste and color propertiesof black tea (71). Green tea composition is very similar to that of the fresh leaf exceptfor a few enzymatically catalyzed changes that occur following harvesting.Thearubigens constitute the largest mass of the extractable matter in black tea. Oolongtea is intermediate in composition between green and black teas.
Although inconsistencies exist, some human consumption of tea or tea extracts hasbeen associated with a reduction in cancer (72–79). In particular, there may be benefits

62 Part II / Cancer Prevention
for digestive tract cancers, although intakes of tea associated with a protective effect arehigh (72). It should be noted that exaggerated intakes may also create side effects insome individuals (80). Unexpectedly, Lu et al. (81) suggested that tea consumption isassociated with an increased risk of bladder cancer. Discrepancies among studies mayresult from confounding of other lifestyle factors such as smoking and alcohol consump-tion (73), inadequate characterization of tea consumption and preparation differences(72,82,83), and individual differences in metabolism of bioactive tea constituents (73).Obviously, additional attention is needed to determine if, and under what circumstances,tea consumption may modify one or more phases of the cancer process. It should behighlighted that considerable attention has recently focused on the use of tea polyphenolicsin skin cancer chemoprevention strategies (84–88). Also, tea polyphenols may ultimatelyfind greater use for cancer prevention in combination with other phytochemicals ordrugs (83,89,90).
Recently, substantial progress has been made in understanding the human complexi-ties of tea polyphenolic bioavailability and pharmacokinetics in humans. In general, teapolyphenols are poorly bioavailable and extensively metabolized by colonic microflora(73,91,92). Because phenolic metabolites may have less antioxidant activity than theirparent compounds, care should be taken in the interpretation of in vitro findings, espe-cially those examining nonphysiological levels of phenolic compounds. Tea catechinsdiffer considerably in their pharmacokinetic behavior and metabolism when comparedto conjugated and methylated forms (93–95). This may partially explain the reason thatthe magnitude of increase in plasma antioxidant activity in humans following ingestionof tea polyphenolics varies and the reason that plasma antioxidant strength can be main-tained only by continuous daily intakes (93,96–98).
In contrast to human data, a variety of animal model bioassays have consistentlyfound that treatment with the polyphenolic fraction isolated from green tea leaves pro-tects against chemically induced cancers. Chemically induced tumors in the large intes-tine, forestomach, liver, skin, lung, pancreas, and mammary tissue all have beenreported to be suppressed by exaggerated exposure to tea or associated polyphenolics(72,73,99,100).
The chemopreventive effects of green tea may be attributed to several polyphenoliccompounds, particularly the catechins epigallocatechin-3-gallate (EGCG), epigallocat-echin, and epicatechin-3-gallate, which account for 30 to 40% of the extractable solidsof tea leaves. It is likely that several mechanisms of action may contribute to the observedanticancer effects of tea constituents, including serving as a free-radical scavenger orantioxidant, inducing cell cycle arrest and detoxification of carcinogens through alteredphase I and II enzymes, modulating inflammation-associated eicosanoid metabolism,and stimulating apoptosis (32,101,102).
Carcinogen detoxification is a key event in preventing the initiation of chemical car-cinogenesis. Tea polyphenols have been reported to inhibit DNA damage resulting frompolycyclic aromatic hydrocarbons and heterocyclic amines, effects mediated in part byenhancing carcinogen degradation and suppressing mRNA abundance of CYP 1A1 andCYP 1B1 bioactivating enzymes (103,104). Shi et al. (105) found that EGCG inhibitedthe catalytic activities of several CYP isozymes and was more potent against CYP 1Aand 2B1 than it was against 2E1. Several tea preparations have been reported to inducephase II enzymes such as glutathione-S-transferase (GST) (106,107), an effect that maydepend on involvement of gut bacterial metabolites (108). Several tea preparations can
62 Part II / Cancer Prevention

Chapter 3 / Non-Nutritive Components and Cancer Risk 63
inhibit nitrosamine formation (109). Because the vast majority of nitrosamines areknown carcinogens, at least in animal models, these studies may have particular signif-icance (110). Wu et al. (111) demonstrated that the amount of the hepatocarcinogen N-nitrosomorpholine (NNM) formed in vitro depended on the molecular structure of teacatechin derivatives and their molar ratios to nitrite. Therefore, the depression innitrosamine formation relates to a sequestering of nitrite, making it unavailable for theformation of the carcinogen. A small human study confirmed that tea supplementationcan significantly suppress fecal nitrite (112). Not only can various tea preparationsdecrease the formation of nitrosamines, they also can depress their bioactivation.Various teas have been reported to block nitrosamine-induced tumorigenesis in skin(113). Thus, a reduction in carcinogen exposure may partially account for some, but notall, of the protection provided by supplemental tea and its polyphenols under experimentalconditions.
In addition to their capacity to prevent early initiating events in carcinogenesis, teaphenolics may act to modify metabolic pathways contributing to the promotion/pro-gression of cancers. In preclinical studies, tea polyphenols have been observed toexhibit antioxidant, anti-inflammatory, antiproliferative, proapoptotic, and antiangio-genic actions (114–124). The mechanisms underlying these effects are multiple,including modulation of telomerase activity, altering the balance of signal transductionpathways, changing the metabolism of arachidonic acid, and enhancing free-radicalscavenging capacities. Recent evidence suggests that tea polyphenols may differentiallyaffect neoplastic and normal cells (125,126). An intriguing report recently demonstrateda reversal of the multidrug resistance phenotype by tea polyphenols (127), a findingthat, if confirmed, could open up new strategies for chemotherapy of some tumors.
Collectively, considerable information supports a preventative role of green andblack tea against each stage of carcinogenesis. The mechanisms by which these teacomponents afford these diverse effects appear to be multifold, with the most notablebeing an alteration in both phase I and II enzymes and alterations in cell signaling.Confirmation of the preclinical data with human intervention trial data is sorely needed.
3.3. Flavanones in GrapefruitNaringin is the most abundant flavonoid in grapefruit. It has been shown to inhibit
the activation of aflatoxin B1 (128) but was relatively ineffective in blocking unsched-uled DNA synthesis in liver slices exposed to PhIP (51). Part of the modest protectionprovided by naringin against cancer models may relate to its ability to induce phase IIenzymes. These changes can have unexpected consequences, as evident by the abilityof grapefruit juice to markedly augment oral drug bioavailability. The ability of naringinand other compounds in grapefruit to downregulate CYP 3A4 expression posttransla-tionally serves to illustrate important drug–nutrient interactions that can occur (129).Actually, several compounds in grapefruit may account for the depression in CYP 3A4activity (129). It will become increasingly important as fruit and vegetable consumption(hopefully) increases to understand their impact on a host of drugs that may be used forvarious health conditions.
3.4. Isoflavones in SoybeansConsiderable evidence points to the ability of isoflavonoids in soybeans to alter the
cancer process (130,131). Phytoestrogens present in the soybean and other legumes

64 Part II / Cancer Prevention
have been purported to contribute to the international differences in cancer prevalence,most notably that of the breast. However, epidemiological studies indicate that a pro-tective effect of adult soy intake on breast cancer risk is modest at best and hint that theage at consumption is a key factor in determining response (132–135). Compared toseveral other foods, soybeans supply relatively large amounts of four different types ofcompounds that may have anticarcinogenic properties: glycosides, phytosterols, proteaseinhibitors, and phytic acid. Soybeans are known to comprise about 2% glycosides,which are composed of soya saponins and isoflavonoids. Plant isoflavonoid glycosidesgenerally are converted by intestinal bacteria to form hormone-like compounds withweak estrogenic and antioxidative activity.
Much of the attention of soybean isoflavonoids has been directed at daidzein, equol,and genistein. Although soybean isoflavones are weak estrogens, they can functionboth as estrogen agonists and antagonists depending on the hormonal milieu, the targettissue, the species being examined, and the amount consumed. Evidence now points tothe ability of these compounds to influence not only sex hormone metabolism andassociated biological activity but also intracellular enzymes, protein synthesis, growthfactors, malignant cell proliferation, and differentiation (136–138).
Considerable evidence points to the ability of isoflavonoids to inhibit chemicallyinduced carcinogenesis. Part of this response may relate to changes in selected CYPenzymes. For example, the isoflavones genistin and daidzin, and their respective agly-cone forms daidzein and genistein, were found to block 2,3,7,8-tetrachlorodibenzo-p-dioxin-induced CYP 1A1 enzyme activity. The response was independent of aromatichydrocarbon receptor but appeared to involve a noncompetitive inhibition with theCYP 1A1 substrate (139).
Genistein also has attracted considerable attention because of its ability to inhibitseveral enzymes, including protein tyrosine kinases and others involved in signal trans-duction (140). Genistein can attenuate both growth factor- and cytokine-stimulated pro-liferation of both normal and neoplastic cells. Although genistein is a potent inhibitor oftyrosine autophosphorylation of the epidermal growth factor receptor, this responsedoes not coincide with a suppression in cell growth, suggesting the involvement of othersignal transduction pathways as possible sites of action. The alternative sites include aretarding of DNA topoisomerase II activity, a variable inhibition of cell cycle check-points, and/or antiangiogenic activity (140,141). Genistein also may inhibit cell growthby modulating transforming growth factor (TGF)-β-1 signaling pathways (140).
Lamartiniere et al. (142) provided convincing evidence that neonatal and prepubertalexposure to genistein has a long-lasting effect on the ability of the mammary gland towithstand exposure to carcinogen. Part of this protection may relate to a reduction in thenumber of carcinogen-sensitive terminal end buds and an increase in the number of dif-ferentiated, carcinogen-insensitive lobular structures within mammary tissue. However,soy and genistein may also increase the risk of some cancers, especially those that areestrogen-sensitive (143). Although experimental data are rather compelling that genisteincan induce the growth of human mammary tumors transplanted into nude mice (144),it remains to be determined if this coincides with a more aggressive tumor that is moreinvasive to surrounding tissue or one that metastasizes to a greater degree. It may be thatother metabolic changes induced by soy, genistein, or equol outweigh this change inestrogen-sensitive tumor growth. However, it would be unwise and irresponsible todismiss this as a simple experimental phenomena with no physiological significance. It
64 Part II / Cancer Prevention

Chapter 3 / Non-Nutritive Components and Cancer Risk 65
may be that some women will be placed at risk by exaggerated intakes of soy and itscomponents.
Human intervention studies provide inconsistent evidence for a protective effect ofsoy intake on biomarkers of breast cancer susceptibility, such as modulation of estrogenmetabolism. Studies in both pre- and postmenopausal women indicate that soy orisoflavone consumption has a beneficial effect, although the magnitude is small(145–147). Although soy and isoflavone intakes do not seem to affect the endometriumin premenopausal women, there is some concern about a possible weak estrogeniceffect in the breast, as evidenced by higher secretion of breast fluid and the appearanceof hyperplastic epithelial cells and elevated levels of pS2 in the nipple aspirate(148,149). However, when considering mammographic breast density as a biomarker ofbreast cancer risk, soy or isoflavone intake does not appear to exert an estrogenic effectsimilar to that of hormone replacement therapy and may have a beneficial influence(150–155).
Although considerable attention has focused on the breast cancer-modifying actionof soy, there has been a recent upsurge in interest in soy for prostate cancer prevention(156). Reduced risk for prostate cancer has been reported in Chinese men consuminghigher levels of soy foods and isoflavones (157). Cell culture and animal model exper-iments have confirmed a prostate cancer-suppressing effect of soy and genistein, aneffect mediated in part by changes in androgen metabolism, decreases in insulin-likegrowth factor (IGF)-1-stimulated cell proliferation, and increased apoptosis(158–162). Therefore, the use of soy isoflavones in prostate cancer prevention trialsmay be justified (163,164).
Vasculature has an important role in several steps of the cancer metastatic processincluding the following: (a) providing access to distant sites of metastasis, because ves-sels capture cancerous cells and provide the entry route into secondary organs, and (b)angiogenesis, because vascular endothelial cells supply nutrients for tumor growth. Thelinings of all blood vessels are covered with endothelial cells, which can have an activerole in both processes. Several studies have provided evidence that the consumption ofplant foods can prevent or retard angiogenesis or neovascularization. Soy products andgenistein appear to be potent inhibitors of endothelial cell proliferation and in vitroangiogenesis (165). Degradation of the extracellular matrix is one of the essential stepsin angiogenesis. Studies by Fajardo et al. (166) demonstrated that genistein couldinduce a shift toward antiproteolysis in both matrix metalloproteinase/tissue inhibitor ofmetalloproteinase and urokinase/plasminogen activator inhibitor proteolytic balance.Overall, the anticancer effects of soy may relate to a direct effect on tumor cells as wellas indirect effects on tumor neovasculature.
4. INDOLES
Several indole metabolites arise during the ingestion and the hydrolysis of the indolyl-methyl glucosinolate glucobrassicin that is present in cabbage, broccoli, Brusselssprouts, and other members of the genus Brassica (167). The resultant products arenumerous and include indole-3-carbinol (I3C). I3C is unstable in the acid environmentof the stomach and can undergo self-condensation reactions to form indole [3,2-b]car-bazole (ICZ) and diindoylmethane (DIM) as well as other trimers and oligomers(168,169). DIM is the major intermediate formed in vitro and in vivo. Preclinical studies

66 Part II / Cancer Prevention
indicate that I3C has preventive activity against numerous cancers, including those of themammary gland, prostate, stomach, lung, liver, endometrium, and colon; however, theeffects may not always be beneficial (170). Although many experimental cancer studieshave used rather large quantities of I3C (0.5–3%), providing as little as 56 mg/kg is suf-ficient to alter enzymes involved in carcinogen bioactivation (171). Thus, it is conceivablethat changes in cancer risk may occur with very modest intakes. The protection providedlikely depends on the species and tissue examined, although humans do appear to be sen-sitive to I3C intakes (172,173). Several mechanisms have been elucidated whereby I3Cand related indoles may modify carcinogenesis at both the initiation and postinitiationstages. These include modifying the endogenous metabolism of estrogens, stimulatingapoptosis, augmenting cellular defenses against genotoxic chemicals, and modifyingcellular signaling pathways that control proliferation.
To date, the effects of I3C on enzymes associated with estrogen and xenobioticmetabolism have been studied extensively. Particular attention has been given to thephase I CYP 1A1, 1A2, and 3A4 enzymes. Whereas both I3C and DIM can induce thesethree enzymes in short-term studies, after chronic exposure, I3C is more efficaciousthan DIM (174). DIM also decreases CYP 1B1, depresses 4-hydroxylation of estradiol,and decreases carcinogenic 4-OH-estrone (175). The effectiveness of I3C as an induceris dependent on the activation by its condensation products ICZ and DIM of the arylhydrocarbon receptor (AhR) (176–178). Such changes in CYP-mediated oxidative metab-olism of estrogen are believed to be responsible for not only carcinogen detoxification(discussed later) but also for the indole-induced increase in the ratio of 2-OH-estrone to16-OH-estrone, which is hypothesized to be protective toward breast cancer (179). Theability of oral I3C to enhance C-2 hydroxylation while depressing that of C-16 is readilyapparent in females from several species (172,180). In animal models, modulation ofCYP activity and estrogen metabolism are dose-dependent, and treatment is duration-dependent. It should be noted that genetic polymorphisms might impact the actionsof indoles. The presence of a novel Msp1 restriction fragment length polymorphism ofCYP 1A1 in African-American, but not Caucasian, women modified the magnitudeof the 2-OH-estrone/16-OH-estrone ratio following I3C administration (181).
Besides its effects on estrogen metabolism, I3C exposure also may alter the forma-tion of genotoxic intermediates that could initiate carcinogenesis. This response mayarise because of changes in both phase I and II enzymes. For example, I3C has beenshown to reduce DNA adduct formation and reduce γ-glutamyl transpeptidase activityin mouse skin induced by DMBA and benzo(a)pyrene (182,183). Likewise, I3C hasbeen shown to decrease the binding of PhIP and 2-amino-3-methylimidazo[4,5-f]quino-line (IQ) to mammary tissue (184). This response is particularly intriguing because bothare recognized carcinogenic heterocyclic amines formed in proteinaceous foods duringcooking and are known to be initially activated enzymatically by CYP 1A1 and 1A2. Inaddition to the changes in phase I CYP enzyme activities noted earlier, consumption ofI3C alters the activities of several phase II enzymes including glutathione S-transferase,quinone reductase ,and glutathione reductase (171,185). Although in general I3C andDIM appear to enhance detoxification of chemical carcinogens, the ultimate balancebetween a decrease or increase in carcinogen activation and DNA damage willdepend on the specific indole, its dose, the carcinogen examined, and the target tissue(170,186–188). For example, in contrast to high doses of I3C given to male rats, low
66 Part II / Cancer Prevention

Chapter 3 / Non-Nutritive Components and Cancer Risk 67
doses shifted the ratio of hepatic CYP 1A2 vs CYP 1A1 such that there could be anincrease in activated IQ (188).
Evidence exists that I3C can influence both the promotion and progression phases ofsome chemically induced cancers in addition to its actions during the initiation stagedescribed earlier. I3C may affect cell proliferation not only by indirectly alteringestrogen metabolism but also by directly blocking the cell cycle and inducing apoptosis.It has been reported that exposure of mammary epithelial cells to I3C can decreasenuclear ER and progesterone receptor binding and inhibit estrogen-stimulated cell pro-liferation (189,190). I3C may modify the activation and subsequent signaling events ofthe ER (191–194), in some cases in a ligand-independent manner (192). Additionally,an indole-induced antiproliferative signaling pathway has been reported in breast cancercells that leads to G1 cell cycle arrest. This arrest resulted in part from decreased cdk6activity and a concomitant increase in expression of the cdk inhibitor p21waf1/cip1 (195).It is clear that dissecting the complex interactions by which indoles alter cancer cellmultiplication warrants further scrutiny.
The ability of I3C to inhibit virally induced tumors comes from studies showing thatit inhibits the spontaneous occurrence of endometrial adenocarcinoma in female Donryurats and, more recently, from several studies with virally induced cervical cancer(196,197). Estrogen is known to promote the development of endometrial and cervicalcancers. Jin et al. (197) provided evidence that I3C may be particularly useful in theprevention of cervical-vaginal cancer, and possibly other cancers with a papillomaviruscomponent. Studies by Yuan et al. (198) with cervical CaSki cancer cells provided evi-dence that I3C can abrogate estrogen-increased expression of cells infected with humanpapillomavirus oncogenes, probably by enhancing the formation of 2-hydroxyestroneby the mechanism indicated earlier. In this regard, it is important to highlight that treatmentwith I3C of individuals with precancerous lesions of the cervix has been effective in humantranslational studies (199–201).
A depression in cell proliferation also may arise from the induction of apoptosis.There is substantial evidence that I3C and related indoles are capable of stimulatingapoptosis in a variety of cancerous cells (202–207), an effect apparently not observedin indole-treated noncancerous cells (204). I3C induction of apoptosis in non-cancerous human mammary epithelial 184-B5 cells was accompanied by enhancedp53 immunoreactivity (205).
Consumption of indoles does not always result in a beneficial effect on tumorige-nesis. Increased tumorigenesis has been reported for colon, liver, thyroid, and pancreas(170). These studies suggest that the response to I3C is highly dependent on thetiming of administration; postcarcinogen treatment with I3C often leads to promo-tion of tumorigenesis. The mechanisms for these enhancing effects remain to bedetermined, although a recent report provides evidence for a tumor-promoting mech-anism in that treatment of rat hepatocytes with ICZ resulted in an inhibition of gapjunctional intercellular communication associated with activation of the AhR and/orCYP 1A activity (208).
Collectively, considerable evidence points to the health benefits associated withenhanced I3C consumption. However, because some cases of enhanced carcinogenesisare evident, it is prudent that we understand who might be placed at risk before wide-spread recommendations for increased intakes of I3C are encouraged (170,209).

68 Part II / Cancer Prevention
5. ISOTHIOCYANATES
Cruciferous vegetables (e.g., broccoli, Brussels sprouts, cabbage, cauliflower, kale,etc.) belong to the genus Brassica and possess a variety of sulfur-containing glycosideprecursors (or glucosinolates) that yield thiocyanate, nitrile, and isothiocyanate deriva-tives upon hydrolysis and release of a glucose moiety. This hydrolysis is carried out bythe enzyme myrosinase, which is released from plant cells damaged by food processingand mastication (210,211). The chemopreventive benefit of cruciferous vegetable con-sumption has been attributed in part to the naturally occurring isothiocyanates presentwithin these foods (212). Myrosinase is notably heat-labile, and cooking broccoli hasbeen shown to strongly inhibit isothiocyanate bioavailability in humans (213,214).Isothiocyanates such as phenethyl isothiocyanate (PEITC), benzyl isothiocyanate(BITC), and sulforaphane have received much attention recently, as increasing evidencesuggests these compounds may act as key inhibitors of carcinogenesis in a variety oftissues including liver, lung, mammary gland, intestine, forestomach, and esophagus(215–219).
Organic isothiocyanates have been reported to block tumor formation in rodentsinduced by such diverse carcinogens as polycyclic aromotic hydrocarbons, azo dyes,ethionine, N-2-fluorenylacetamide, and nitrosamines (215). Substantial evidence obtainedfrom studies of lung tumorigenesis in rodent models indicates a protective effect ofselected isothiocyanates against the tobacco smoke-specific carcinogen 4-(methylni-trosamino)-1-(3-pyridyl)-1-butanone (NNK) (220–222). Nevertheless, isothiocyanatesdo not always provide protection. In some cases, they may actually accentuate tumordevelopment. For example, Hirose et al. (223) found that PEITC and BITC promotedthe postinitiation phase of diethylnitrosamine-induced bladder carcinogenesis.Similarly, Stoner et al. (224) found that dietary 6-phenylhexylisothiocyanate promotedN-nitrosomethylbenzylamine-induced esophageal carcinogenesis.
Several isothiocyanates appear to be effective inhibitors of carcinogen metabolism, asevidenced by a reduction in carcinogen binding to DNA in target tissue (215,216,225).This inhibitory effect on the initiation stage of carcinogenesis appears to be mediatedvia induction of phase II detoxification enzymes, including glutathione transferases andNAD(P)H:(quinone acceptor) oxidoreductase, and suppression of cytochrome CYP-mediated carcinogen activation (215,216). CYP 1A2 is known to catalyze bioactivationof the nitrosamine lung carcinogen NNK, and PEITC has been shown to competitivelyinhibit CYP 1A2 activity (226). Similarly, the nitrosamine N-nitrosodimethylamine isbioactivated via CYP 2E1, the activity of which is inhibited by PEITC, BITC, and sul-foraphane (227–229). Inactivation of CYP 2E1 in response to BITC may relate to itsmodification of the CYP apoprotein (227). Sulforaphane, which is both a potent com-petitive inhibitor of CYP 2E1 and an inducer of phase II detoxification enzymes, hasbeen shown to block mammary tumor formation in rats dosed with 9,10-dimethyl-1,2-benzanthracene (229,230).
Isothiocyanates may also modify the cancer process by inducing apoptosis and sup-pressing metastasis. Early studies revealed that isothiocyanic esters inhibited the invivo growth of transplanted Ehrlich ascites carcinoma cells (231). Zhang et al. (232)recently revealed that short-term exposure to several isothiocyanates was sufficient tosuppress cell proliferation, even in some drug-resistant cell lines. Part of the depres-sion in growth is also likely attributable to induction of apoptosis. PEITC has been
68 Part II / Cancer Prevention

Chapter 3 / Non-Nutritive Components and Cancer Risk 69
found to induce p53 protein expression and p53-dependent transactivation. The signif-icance of these findings is also evident by the ability of PEITC to induce apoptosis inp53 +/+, but not p53 −/−, cells (233). Exposure of human colon cancer cells (HT29cells) to sulforaphane has been shown to trigger apoptosis; however, this result appearssecondary to an arrest of the cell cycle at G2/M. Sulforaphane-induced HT29 celldeath, although characterized by molecular and morphological apoptotic markers, wasnot associated with an effect on p53 expression (234). In addition, Sasaki et al. (235)demonstrated that oral administration of 5-methylthiopentyl isothiocyanate markedlyreduces the pulmonary colonization of B16-F10 murine melanoma cells in syngeneicmice. This protection was not without some complications, as it also resulted in thymusatrophy and a selective loss of CD4+CD8+ cells in thymocytes. Interestingly, neither themetastaticity or thymus responses were observed in mice treated with 3-methylthiopropylisothiocyanate.
The protective effect of isothiocyanates may be highly dependent on its clearance withinan individual or possibly within a specific tissue. Glutathione transferase enzymes areknown to conjugate isothiocyanates, leading to their excretion, which largely occurs asdithiocarbamates (213). Recent evidence suggests that individuals with a glutathione trans-ferase M1 null genotype may have a more exaggerated response to broccoli and associatedisothiocyanates (236).
6. ORGANOSULFUR COMPOUNDS
Garlic, onions, leeks, and chives represent the major Allium foods consumed byhumans. Considerable evidence points to their consumption, particularly garlic, as pos-sible modifiers of cancer risk. In recent reviews of over 35 case–control or cohortstudies, it was reported that some protective effect was associated with intake of Alliumvegetables in about 75% of the studies (237–240). The strongest evidence was forstomach and colorectal cancers. Data for a protective effect toward prostate cancer arelimited, although a recent case-control study conducted in China (241) reported a sig-nificant 49% reduction in risk for those men with the highest Allium vegetable intakescompared to those in the lowest intake category, an effect more pronounced for subjectswith localized cancer than for those with advanced lesions. Data linking garlic intakeand precancerous lesions are also limited, although one large case–control studyreported lower risk of colorectal polyps with increased garlic consumption (237). Onthe other hand, the evidence for a cancer-protective benefit of garlic supplement intakeis limited and inconsistent (237,242). A large, unpublished trial is being conducted inChina to determine the effects of two garlic preparations on precancerous lesions of thestomach (243). Unfortunately, inadequate information is provided far too frequentlyabout the form and quantity of the garlic preparation provided and consumed (237). Inaddition to breath and body odors, adverse consequences associated with a large amountof garlic intake include esophageal and abdominal pain and increased blood coagulationtimes (237,243). The influence on blood coagulation is one reason that concerns havebeen expressed about garlic and aspirin interactions. Garlic consumption also mayinfluence drug metabolism and, therefore, influence their serum concentrations, such aswith saquinavir (Fortovase, Invirase), and potentially influence its therapeutic efficacy(244,245). These effects need to be more carefully documented, especially those asso-ciated with specific types of formulations (237,242).

70 Part II / Cancer Prevention70 Part II / Cancer Prevention
Unlike many other foods, about 0.35% of garlic’s fresh weight or 1% of its dry weightis contributed by sulfur (246,247). A complex array of sulfur compounds (Table 3),including thiosulfinates, dithiins, ajoenes, etc., can occur in garlic preparations(248–250).
Although major limitations exist in defining the precise role of garlic in the cancerprocess, laboratory-based studies with model cancers provide some of the most com-pelling evidence that garlic and its related sulfur components can suppress cancer riskand alter the biological behavior of tumors. Experimentally, garlic and its associatedcomponents suppress breast, colon, skin, uterine, oral, esophageal, and lung cancers(238,251–253). This protection may arise from several mechanisms, including blockageof nitrosamine formation, free-radical scavenging, suppressed bioactivation of severalcarcinogens, enhanced DNA repair, decreased cell proliferation, and/or the induction ofapoptosis. It is possible, and quite probable, that several of these cellular events aremodified simultaneously.
Damage to DNA, proteins, and lipids by reactive oxygen species (ROS) is believedto be an important contributor to a variety of chronic diseases, including cancer. It hasbeen suggested that garlic constituents can suppress oxygen radical-mediated cell damageby various mechanisms, including direct scavenging of ROS, stimulating formation ofcellular and antioxidant defense compounds (such as glutathione), increasing enzymeactivities (such as superoxide dismutase, catalase, and glutathione peroxidase), andblocking the activation or expression of stress pathways induced by ROS, such as NFκB(254–256). In this regard, it has recently been demonstrated in a small human trial thatdietary supplementation with a garlic extract for 2 wk substantially decreased plasmaand urine concentrations of 8-iso-prostaglandin F2α, a sensitive and specific indicatorof oxidative stress in vivo (257).
As mentioned earlier, nitrosamines are potent experimental carcinogens. Mountingevidence demonstrates the ability of several foods, including garlic, to suppress theirformation both in vitro and in vivo (258–260). Garlic appears to be effective in blockingDNA alkylation, a primary step in nitrosamine carcinogenesis (261,262). A block innitrosamine bioactivation may reflect changes in several enzymes. However, substantialevidence points to the involvement of CYP 2E1 (262,263). An autocatalytic destructionof CYP 2E1 may account for some of the chemoprotective effects of diallyl sulfide,andother possible allyl sulfur compounds (264). The reduction in nitrosamines also mayarise secondarily to an increase in the formation of nitrosothiols. Studies by Dion et al.(259) revealed that not all allyl sulfur compounds are equally effective. The ability ofS-allyl cysteine and its non-allyl analog S-propyl cysteine—but not diallyl disulfide,dipropyl disulfide, and diallyl sulfide—to retard suggests that the cysteine residue iscritical the block in nitrosamine formation (259). Because the content of allyl sulfur can
Table 3Some of the Important Sulfur Compounds Found in Garlic
3,5-Diethyl-1,2,4-trithiolane Diallyl sulfideAllyl 1-propenyl disulfide Diallyl trisulfideAllyl 1-propenyl trisulfide Methyl allyl trisulfideAllyl alcohol Methyl allyl disulfideDiallyl disulfide S-allyl cysteine

Chapter 3 / Non-Nutritive Components and Cancer Risk 71
vary among preparations, it is probable that garlic sources may vary in the protectionthey provide against nitrosamine formation. Evidence that garlic depresses nitrosamineformation in humans comes from studies by Mei et al. (265). In their studies, providing 5 gof garlic per day completely blocked the enhanced urinary excretion of nitrosoprolinecaused by ingesting supplemental nitrate and proline.
Garlic and several of its allyl sulfur compounds can also effectively block the bioac-tivation and carcinogenicity of a host of non-nitrosamine carcinogens. For example, inrodent cancer models and in cell culture, garlic components have effectively suppressedthe formation of DNA adducts, long considered to be a key early event in the initiationof carcinogenesis by chemicals (244,266,267). This protection, which involves adiverse array of compounds and several target tissue sites, suggests multiple mecha-nisms of action or a widespread biological effect. Because metabolic activation isrequired for many of the carcinogens used in these studies, there is a likelihood thatphase I and II enzymes are involved. Interestingly, little (if any) change in CYP 1A1,1A2, 2B1, or 3A4 activities (enzymes involved in polycyclic aromatic hydrocarbon car-cinogen bioactivation) is observed following treatment with garlic or related sulfurcompounds (268–270). Thus, other enzymes involved in the bioactivation or removal ofcarcinogenic metabolites might be involved in the observed protection.
Singh et al. (271) provided evidence that the efficacy of various organosulfides tosuppress benzo(a)pyrene tumorigenesis correlated with their ability to induceNAD(P)H:quinone oxidoreductase, an enzyme involved with the removal of quinonesassociated with this carcinogen. Changes in bioactivation resulting from a block incyclooxygenase and lipoxygenase may also partially account for the reduction intumors following treatment with some carcinogens (272). Also alterations in glu-tathione concentration and the activity of specific GST enzymes, important contributorsto phase II detoxification, may be involved in the protection provided by garlic. Feedinggarlic powder to rats has been found to increase GST activity (273,274). Hu et al.(275) provided evidence that the induction of GST-pi may be particularly important.
Arylamine N-acetyltransferase (NAT) is an enzyme that can inactivate arylaminesand activate some dietary heterocyclic amines. NAT polymorphisms affecting rates ofacetylation have been linked to changes in cancer risk. Allyl sulfides have been reportedto inhibit not only NAT activity in cell lines from human colon and bladder tumors(244,276) but also its activity in the bacterium Helicobacter pylori obtained from pepticulcer patients (277). Interestingly, garlic extract can decrease H. pylori-induced gastritisin Mongolian gerbils (278), an effect of potential human application, because infectionwith this microbe is intimately involved in the development of stomach cancer.
Some allyl sulfur compounds are known to block cell growth in the G2/M stage ofcell division (279–281) and also stimulate apoptotic events. Activation of the p34cdc2
kinase complex is known to modulate the progression of cells from the G2 into the Mphase by promoting chromosome condensation, cytoskeletal reorganization, andnuclear envelope breakdown (282). Recent studies by Milner et al. (281,283) revealedthat DADS caused a marked suppression in p34cdc2 kinase activity. Of recent interest isthe report that DADS is able to effectively induce, via a p53-dependent mechanism,NAG-1, a gene that is also upregulated by other antitumorigenic and proapoptotic agentssuch as nonsteroidal anti-inflammatory compounds (284). Also, an apoptosis-associatedgene was among 14 genes identified in human cancer cells that were differentiallyexpressed in response to diallyl trisulfide (285).

72 Part II / Cancer Prevention72 Part II / Cancer Prevention
Rarely has a comparison of water- and oil-soluble compounds been conducted withinthe same study. Although subtle differences among garlic preparations occur, quantityrather than source appears to be a key factor influencing the degree of protection (286).Differences that do occur between preparations likely relate to the content and effec-tiveness of individual sulfur compounds. The number of sulfur atoms present in themolecule seems to influence the degree of protection with diallyl trisulfide > diallyldisulfide > diallyl sulfide (279). Likewise, the presence of the allyl group generallyenhances protection over that provided by the propyl moiety (287).
6.1. OnionsRelatively few epidemiological and preclinical studies are available to truly assess
the effect of onions on the cancer process. Nevertheless, an inverse relationship hasbeen reported between lung, colorectal, and stomach cancer and the consumption ofonions and leeks (288–291). Recent investigations suggest that increased consumptionof onions and other Allium foods is associated with a reduction in prostate cancer (241).
Onions contain a variety of sulfur compounds, some of which are included in Table 4.Several of these have been examined for their ability to modify one or more stages ofthe cancer process.
Belman (292) reported in an animal model that onion oil inhibited skin tumor yieldand incidence following phorbol-myristate-acetate promotion in a dose-dependentmanner over the wide range when applied three times per week. Interestingly, onion oilwas more effective than garlic oil in the inhibition of these tumors. More recently, Itoet al. (293) observed that diphenyl disulfide and S-methyl methanethiosulfonate signif-icantly suppressed chromosomal aberrations induced by both aflatoxin B1 (an indirect-acting carcinogen) and methyl methanesulfonate (a direct-acting carcinogen). Changesin redox status of thiols were proposed as a possible mechanism of action. Clearly, addi-tional studies are needed to examine if protection by onions depends on the carcinogenemployed. Takada et al. (294) found that some sulfur compounds (isothiocyanic acidisobutyl ester, dipropyl trisulfide, and allyl mercaptan) promoted liver cell proliferationin rats treated with dimethylnitrosamine, suggesting that under some circumstances, theconsumption of onions may increase cancer risk. The level of importance of these find-ings for humans remains to be determined, especially because Fukushima et al. (295)reported that oil-soluble organosulfur compounds such as methyl propyl disulfide andpropylene sulfide as well as water-soluble compounds such as S-methylcysteine andcysteine retarded the development of GST-P-positive foci in the liver of rats treated withdiethylnitrosamine.
The mechanisms by which onion components retard carcinogenesis remain largelyunexplored. As indicated earlier with garlic, alterations in various biological processes
Table 4Some Important Sulfur Compounds Found in Onions
1–Propenyl propyl disulfide Methyl 1–propenyl trisulfide1–Propenyl propyl trisulfide Methyl propyl disulfide1–Propenyl methyl disulfide Methyl propyl trisulfideDimethyl trisulfide Dipropyl trisulfideDipropyl disulfideDipropyl tetrasulfide

Chapter 3 / Non-Nutritive Components and Cancer Risk 73
by selected thiols may account for part of the anticancer benefits associated with sulfurcompounds. However, other constituents such as the flavanoids may account for theobserved effects of onion as well as garlic on the cancer process. Regardless of the com-pounds responsible, extracts and essential oils of onions are known to have other phys-iological effects, including the retarding of platelet aggregation (296). Interestingly, heatingonions tends to reduce their efficacy.
Although the health benefits of onion consumption have not been extensively examined,available evidence does suggest there is little reason to reduce its use as part of a healthydiet. Nevertheless, the minimum quantity of onions needed to reduce cancer risk and thefactors that might modify this efficacy remain to be determined.
7. TERPENES
Terpenes are compounds consisting of varying numbers of isoprene building blocksthat are widely dispersed in nature. D-limonene is probably the most extensively exam-ined monoterpene for its potential carcinogenic properties. A natural constituent ofcitrus oils, it also is present in oils from mint, caraway, thyme, cardamom, and coriander.D-limonene is used commercially as a flavor and fragrance.
Interest in limonene stems from its ability to inhibit chemically induced tumorsduring experimental conditions and its ability to cause the regression of existing tumors(297). Limonene is known to inhibit skin carcinomas (298), mammary carcinomas inc-Ha-ras protooncogene transgenic rats (299), mammary tumors induced by DMBA(300), liver tumors induced by NNM (301), and lung tumors induced by NNK (302).Thus, the potential benefits may be widespread and not limited to a specific tissue.Much of the anticarcinogenic activity brought about during the initiation phase may bemediated through the induction of the hepatic detoxification enzymes GST and uridinediphosphate-glucuronyltransferase (303). Selected changes in CYP enzymes may alsocontribute to the observed protection (304).
Interestingly, limonene has been reported to cause a complete regression of mam-mary carcinomas (300,305,306), one of its most impressive effects. Some of this loss oftumor mass is probably explained by the induction of apoptosis (307). Limonene andother monterpenes are known to suppress 3-hydroxy-3-methyl-glutaryl-coenzyme A(HMG-CoA) reductase activity (308). An inhibition of HMG-CoA can deplete interme-diates required for the posttranslational modification of proteins, a process that givesproteins lipophilic anchors that bind to membranes. Consequently, nuclear lamins andras oncoproteins remain in nascent states, and cells do not proliferate. A depression inposttranslational isoprenylation of growth-controlling small G proteins may explain thisantitumorigenic property. Ruch and Sigler (309) provided evidence that the responsedoes not relate to ras. More recently, Ren and Gould (310) found that perillyl alcohol(discussed later) suppressed small G protein isoprenylation in rat mammary glands. Thegreatest inhibition of small G protein isoprenylation was with RhoA by type I geranylprotein transferase. Rho family proteins serve as guanine nucleotide-regulated binaryswitches controlling signaling pathways, which ultimately regulate diverse cellularprocesses, and have been implicated as critical regulators of oncogenesis. Thus, theseresults may be particularly important. Increased expression of the mannose-6-phosphate/IGF II receptor and TGF-β-1 are recognized responses in cells exposed to monoterpene(311). Ariazi and Gould (312) identified 42 induced and 58 repressed genes that werealtered by monoterpenes.

74 Part II / Cancer Prevention
The potential of limonene as a chemopreventive compound has led to heightenedevaluation of its hydroxylated derivative, perillyl alcohol (POH), as a more potent agent(313). In preclinical studies, cancers of the prostate, esophagus, colon, blood, skin, pan-creas, and liver were suppressed by treatment with POH (297,314–321), although thereis one report that it exerted tumor-promoting activity in the NNM-induced rodent livertumor model (322). Since 2000, an increasing number of phase I and II clinical trialshave been reported in which the pharmacokinetics and efficacy of POH toward a varietyof malignancies (323–327) have been examined.
D-limonene has been found to cause kidney tumors when given to male rats at highdoses and is associated with the development of hyaline droplet nephropathy (328). Thetumor likely arises because of a minor metabolite, D-limonene-1,2-oxide, impeding thenormal process of lysosomal proteinase. Because the protein binding this metabolitedoes not exist in humans, it is likely the tumor would also not occur. Thus, D-limonenemay not pose any special carcinogenic or nephrotoxic risk to humans (328).
8. CONCLUSIONS
Variation in the consumption and utilization of food components spanning the fruit,vegetable, and grain domains may contribute to worldwide disparities in the inci-dence of cancer. Probably keys to this disparity are a host of phytochemicalsincluding flavonoids, isothiocyanates, lignans, allyl sulfurs, and various terpenes.Research continues to provide rather compelling evidence that these and otherselected dietary components are capable of modifying cancer risks and tumorbehavior. The precise response probably reflects not only the quantity of the con-stituent consumed, but also its interaction with multiple major and minor genes, aswell as with other dietary components.
Epidemiological, clinical, and laboratory investigations provide rather convincingevidence that dietary habits can modify cancer risk. A rather large number of non-nutri-tive compounds in foods appear to protect against one or more stages of the cancerprocess. Scientifically, these nonessential nutrients are reported to modify the carcino-genic process by several mechanisms, including altering carcinogen formation andmetabolism, curtailing tumor promotion and progression, and modifying cellular andhost defenses. Understanding the molecular events that are modified by nutrients willbe a key factor in determining the most effective use of diet as a treatment for the pre-vention of cancer. Although dietary habits are not the sole determinant of cancer, theydo represent a significant point for which intervention is possible. Thus, in general,Western populations should modify their lifestyles to include increased intakes of plantfoods, therefore reducing the risk ofcancer. Nonetheless, in some cases, adjustment ofdietary practices to conform to generalized dietary goals may not be necessary or evenappropriate. Unraveling the myriad of possible interactions between specific dietarycomponents and specific genes involved with the cancer process is fundamental toestablishing tailored dietary recommendations. Optimizing nutrition by dietary modifi-cation continues to be a plausible noninvasive strategy for altering cancer initiation,promotion, and progression.
A greater appreciation of human genetics will hopefully provide valuable insightsinto identifying those individuals who might benefit or be placed at risk from exagger-ated intakes of selected foods. As the era of nutrition and genomics unfolds, it should
74 Part II / Cancer Prevention

Chapter 3 / Non-Nutritive Components and Cancer Risk 75
become possible to identify tailored diets that can be used to effectively promote healthand minimize disease states, including cancer. As this “genomic revolution” emerges, itis essential that the knowledge gained be used responsibly within an ethical framework.
9. RECOMMENDATIONS
A comprehensive understanding about the precise role that specific foods or theircomponents play in the cancer process is fundamental for improving human health.Carefully controlled and probing investigations that examine individual dietary con-stituents in the context of the entire diet and the environmental factors to which we areexposed will be key in unraveling the true effect of diet in the cancer process. Futureresearch must be aimed at the identification of the critical site(s) or molecular target(s)in which nutrition intervention beyond basic nutriture is most appropriate. Without thisinformation, it will be impossible to tailor recommendations to meet the specific needsof the individual. Although experimental evidence strongly suggests that severalnonessential nutrients are significant modifiers of the cancer process, it remains to bedetermined if humans will benefit from the intake of one or more of these nutrientswhen taken in isolation from other components of the food. Although individual sup-plements of nonessential nutrients may be just as effective, their safety must be thor-oughly examined not only for toxicity but their dependence on other components of thediet. Until this information is available, it remains prudent to eat a variety of fruits andvegetables and avoid excesses.
REFERENCES1. Raunio H, Husgafvel-Pursiainen K, Anttila S, Hietanen E, Hirvonen A, Pelkonen O. Diagnosis of poly-
morphisms in carcinogen-activating and inactivating enzymes and cancer susceptibility—a review.Gene 1995; 159:113–121.
2. Knudson A. Hereditary predisposition to cancer. Ann NY Acad Sci 1997; 833:58–67.3. Ekman P. Genetic and environmental factors in prostate cancer genesis: identifying high-risk cohorts.
Eur Urol 1999; 35:362–369.4. Loktionov A. Common gene polymorphisms and nutrition: emerging links with pathogenesis of mul-
tifactorial chronic diseases [review]. J Nutr Biochem 2003; 14:426–451.5. Greenwald P, Milner J, Anderson D, McDonald S. Micronutrients in cancer chemoprevention.
Cancer Metastsis Rev 2002; 21:217–230.6. Lampe J. Spicing up a vegetarian diet: chemopreventive effects of phytochemicals. Am J Clin Nutr
2003; 78:579S–583S.7. Müller M, Kersten S. Nutrigenomics: goals and strategies. Nature Rev Gen 2003; 4:315–322.8. Wynder E, Gori G. Contribution of the environment to cancer incidence: an epidemiologic exercise.
J Natl Cancer Inst 1977; 58:825–832.9. Cohen J, Kristal A, Stanford J. Fruit and vegetable intakes and prostate cancer risk. J Natl Cancer
Inst 2000; 92:61–68.10. Temple N. Fruits, vegetables, and cancer prevention trials. J Natl Cancer Inst 1999; 91:1164.11. Garcia-Closas R, Gonzalez C, Agudo A, Riboli E. Intake of specific carotenoids and flavonoids and
the risk of gastric cancer in Spain.Cancer Causes Control 1999; 10:71–75.12. Riboli E, Norat T. Epidemiologic evidence of the protective effect of fruit and vegetables on cancer
risk. Am J Clin Nutr 2003; 78(3Suppl):559S–569S.13. Potischman N, Swanson C, Coates R, et al. Intake of food groups and associated micronutrients in
relation to risk of early-stage breast cancer. Int J Cancer 1999; 82:315–321.14. World Health Organization. Diet, nutrition and the prevention of chronic diseases. World Health
Organ Tech Rep Ser 2003; 916:i–viiii,1–149.15. Liu R. Health benefits of fruits and vegetables are from additive and synergistic combinations of
phytochemicals. Am J Clin Nutr 2003; 78:517S–520S.

76 Part II / Cancer Prevention
16. Gate L, Paul J, Ba G, Tew K, Tapiero H. Oxidative stress induced in pathologies: the role of antiox-idants. Biomed Pharmacother 1999; 53:169–180.
17. Thompson H, Heimendinger J, Haegele A, et al. Effect of increased vegetable and fruit consumptionon markers of oxidative cellular damage. Carcinogenesis 1999; 20:2261–2266.
18. Adler V, Yin Z, Tew K, Ronai Z. Role of redox potential and reactive oxygen species in stress sig-naling. Oncogene 1999; 18:6104–6111.
19. Dalton T, Shertzer H, Puga A. Regulation of gene expression by reactive oxygen. Annu RevPharmacol Toxicol 1999; 39:67–101.
20. Roberts W, Gordon M, Walker A. Effects of enhanced consumption of fruit and vegetables on plasmaantioxidant status and oxidative resistance of LDL in smokers supplemented with fish oil. Eur J ClinNutr 2003; 57(10):1303–1310.
21. Torres M, Forman H. Redox signaling and the MAP kinase pathways. Biofactors 2003; 17(1–4):287–296.
22. Serdula M, Coates R, Byers T, Simoes E, Mokdad A, Subar A. Fruit and vegetable intake amongadults in 16 states: results of a brief telephone survey. Amer J Public Hlth 1995; 85:236–239.
23. McClelland J, Demark-Wahnefried W, Mustian R, Cowan A, Campbell M. Fruit and vegetable con-sumption of rural African Americans: baseline survey results of the Black Churches United for BetterHealth 5 A Day Project. Nutr Cancer 1998; 30:148–157.
24. Thompson B, Demark-Wahnefried W, Taylor G, et al. Baseline fruit and vegetable intake amongadults in seven 5 a day study centers located in diverse geographic areas. J Am Diet Assoc 1999;99:1241–1248.
25. Weisburger J. Mechanisms of action of antioxidants as exemplified in vegetables, tomatoes and tea.Food Chem Toxicol 1999; 37:943–948.
26. Milner J. Functional foods and health promotion. J Nutr 1999; 129(Suppl 7):1395S–1397S.27. Shatenstein B, Payette H, Nadon S, Gray-Donald K. Division on Nutrition and Healthy Aging,
Quebec Network on Aging Research. An approach for evaluating lifelong intakes of functional foodsin elderly people. J Nutr 2003; 133(7):2384–2391.
28. Palou A, Serra F, Pico C. General aspects on the assessment of functional foods in the EuropeanUnion. Eur J Clin Nutr 2003; 57(Suppl 1):S12–S17.
29. Nutrigenomics: an emerging scientific discipline. Food Technol 2003; 57:60–67.30. Herman K. The Shikimate pathway as an entry to aromatic secondary metabolites. Plant Physiol
1995; 107:712.31. Shirley B. Flavonoid biosynthesis: new functions for an old pathway. Trends Plant Sci 1996; 1:377–382.32. Steele V, Kelloff G, Balentine D, et al. Comparative chemopreventive mechanisms of green tea,
black tea and selected polyphenol extracts measured by in vitro bioassays. Carcinogenesis 2000;21:63–67.
33. Surh Y. Molecular mechanisms of chemopreventive effects of selected dietary and medicinalphenolic substances. Mutat Res 1999; 428:305–327.
34. Lambert J, Yang C. Cancer chemopreventive activity and bioavailability of tea and tea polyphenols.Mutat Res 2003; 523–524:201–208.
35. Craig W. Health-promoting properties of common herbs. Am J Clin Nutr 1999; 70(Suppl3):491S–499S.
36. Hoskins J. The occurrence, metabolism and toxicity of cinnamic acid and related compounds. J ApplToxicol 1984; 4:283–292.
37. Tawata S, Taira S, Kobamoto N, Zhu J, Ishihara M, Toyama S. Synthesis and antifungal activity ofcinnamic acid esters. Biosci Biotechnol Biochem 1996; 60:909–910.
38. Ramos-Nino M, Clifford M, Adams M. Quantitative structure activity relationship for the effect ofbenzoic acids, cinnamic acids and benzaldehydes on Listeria monocytogenes. J Appl Bacteriol 1996;80:303–310.
39. Mitscher L, Telikepalli H, McGhee E, Shankel D. Natural antimutagenic agents. Mutat Res 1996;350:143–152.
40. Ekmekcioglu C, Feyertag J, Marktl W. Cinnamic acid inhibits proliferation and modulates brushborder membrane enzyme activities in Caco-2 cells. Cancer Lett 1998; 128:137–144.
41. Lee C, Hong D, Han S, et al. Inhibition of human tumor growth by 2′-hydroxy- and 2′-benzoy-loxycinnamaldehydes. Planta Med 1999; 65:263–266.
42. Liu L, Hudgins W, Shack S, Yin M, Samid D. Cinnamic acid: a natural product with potential use incancer intervention. Int J Cancer 1995; 62:345–350.
76 Part II / Cancer Prevention

Chapter 3 / Non-Nutritive Components and Cancer Risk 77
43. Ramdas L, Budde R. The instability of polyhydroxylated aromatic protein tyrosine kinase inhibitorsin the presence of manganese. Cancer Biochem Biophys 1998; 16:375–385.
44. Jin G, Zhang T, Wang T, Yang L. Inhibition of α-interferon and cinnamic acid on proliferation ofhuman lung cancer cell Ai Zheng. 2002; 21(8):860–862.
45. Hollman P, Feskens E, Katan M. Tea flavonols in cardiovascular disease and cancer epidemiology.Proc Soc Exp Biol Med 1999; 220:198–202.
46. Nielsen S, Breinholt V, Justesen U, Cornett C, Dragsted L. In vitro biotransformation of flavonoidsby rat liver microsomes. Xenobiotica. 1998; 28:389–401.
47. Li Y, Wang E, Patten C, Chen L, Yang C. Effects of flavonoids on cytochrome P450-dependent aceta-minophen metabolism in rats and human liver microsomes. Drug Metab Dispos 1994; 22:566–571.
48. Murakami A, Koshimizu K, Ohigashi H, et al. Characteristic rat tissue accumulation of hobiletin, achemopreventive polymethoxyflavonoid, in comparison with luteolin. Biofactors 2002; 16(3–4):73–82.
49. Pan M, Chen W, Lin-Shiau S, Ho C, Lin J. Tangeretin induces cell-cycle G1 arrest through inhibitingcyclin-dependent kinases 2 and 4 activities as well as elevating Cdk inhibitors p21 and p27 in humancolorectal carcinoma cells. Carcinogenesis 2002; 23(10):1677–1684.
50. Canivenc-Lavier M, Bentejac M, Miller M, et al. Differential effects of nonhydroxylated flavonoidsas inducers of cytochrome P450 1A and 2B isozymes in rat liver. Toxicol Appl Pharmacol 1996;136:348–353.
51. Lake B, Beamand J, Tredger J, Barton P, Renwick A, Price R. Inhibition of xenobiotic-induced geno-toxicity in cultured precision-cut human and rat liver slices. Mutat Res 1999; 440:91–100
52. Kandaswami C, Perkins E, Drzewiecki G, Soloniuk D, Middleton E Jr. Differential inhibition of pro-liferation of human squamous cell carcinoma, gliosarcoma and embryonic fibroblast-like lung cellsin culture by plant flavonoids. Anti-Cancer Drugs 1992; 3:525–530.
53. Kawaii S, Tomono Y, Katase E, Ogawa K, Yano M. Antiproliferative activity of flavonoids onseveral cancer cell lines. Biosci Biotechnol Biochem 1999; 63:896–899.
54. Bracke M, Depypere H, Boterberg T, et al. Influence of tangeretin on tamoxifen’s therapeutic ben-efit in mammary cancer. J Natl Cancer Inst 1999; 91:354–359.
55. Hardigree A, Epler J. Comparative mutagenesis of plant flavonoids in microbial systems. Mutat Res1978; 58:231–239.
56. Lee K, Kim Y, Kim D, Lee H, Lee C. Major phenolics in apple and their contribution to the totalantioxidant capacity. J Agric Food Chem 2003; 51(22):6516–6520.
57. Aziz A, Edwards C, Lean M, Crozier A. Absorption and excretion of conjugated flavonols, includingquercetin-4’-O-β-glucoside and isorhamnetin-4’-O-β-glucoside by human volunteers after the con-sumption of onions. Free Radic Res 1998; 29:257–269.
58. Ciolino H, Daschner P, Yeh G. Dietary flavonols quercetin and kaempferol are ligands of the arylhydrocarbon receptor that affect CYP1A1 transcription differentially. Biochem J 1999; 340(Pt3):715–722.
59. Verma A, Johnson J, Gould M, Tanner M. Inhibition of 7,12-dimethylbenz(a)anthracene- and N-nitrosomethylurea-induced rat mammary cancer by dietary flavonol quercetin. Cancer Res 1988;48:5754–5758.
60. Mukhtar H, Das M, Khan W, Wang Z, Bik D, Bickers D. Exceptional activity of tannic acid amongnaturally occurring plant phenols in protecting against 7,12-dimethylbenz(a)anthracene-,benzo(a)pyrene-, 3-methylcholanthrene-, and N-methyl-N-nitrosourea-induced skin tumorigenesisin mice. Cancer Res 1988; 48:2361–2365.
61. Ranelletti F, Ricci R, Larocca L, et al. Growth-inhibitory effect of quercetin and presence of type-IIestrogen-binding sites in human colon-cancer cell lines and primary colorectal tumors. Int J Cancer1992; 50:486–492.
62. Ranelletti F, Maggiano N, Serra F, et al. Quercetin inhibits p21-RAS expression in human coloncancer cell lines and in primary colorectal tumors. Int J Cancer 2000; 85:438–445.
63. Beniston R, Campo M. Quercetin elevates p27(Kip-1) and arrests both primary and HPV16 E6/E7transformed human keratinocytes in G1. Oncogene 2003; 22(35):5504–5514.
64. Gupta K, Panda D. Perturbation of microtubule polymerization by quercetin through tubulin binding:A novel mechanism of its antiproliferative activity. Biochemistry 2002; 41:13,029—13,038.
65. Choi J, Kim J, Lee J, et al. Induction of cell cycle arrest and apoptosis in human breast cancer cellsby quercetin. Int J Oncol 2001; 19:837–844.
66. Csokay B, Prajda N, Weber G, Olah E. Molecular mechanisms in the antiproliferative action ofquercetin. Life Sci 1997; 60:2157–2163.

78 Part II / Cancer Prevention
67. Wang I, Lin-Shiau S, Lin J. Induction of apoptosis by apigenin and related flavonoids throughcytochrome c release and activation of caspase-9 and caspase-3 in leukaemia HL-60 cells. Eur JCancer 1999; 35:1517–1525.
68. Russo M, Palumbo R, Mupo A, et al. Flavonoid quercetin sensitizes a CD95-resistant cell line toapoptosis by activating protein kinase Cα Oncogene 2003; 22(21):3340–3342.
69. Kuiper G, Lemmen J, Carlsson B, et al. Interaction of estrogenic chemicals and phytoestrogens withestrogen receptor β. Endocrinology 1998; 139:4252–4263.
70. Maggiolini M, Bonofiglio D, Marsico S, et al. Estrogen receptor α mediates the proliferative but notthe cytotoxic dose-dependent effects of two major phytoestrogens on human breast cancer cells. MolPharmacol 2001; 60(3):595–602.
71. Graham H. Green tea composition, consumption, and polyphenol chemistry. Prev Med 1992;21:334–350.
72. Higdon J, Frei B. Tea catechins and polyphenols: health effects, metabolism and antioxidant functions.Crit Rev Food Sci Nutr 2003; 43:89–142.
73. Lambert J, Yang C. Cancer chemopreventive activity and bioavailability of tea and tea polyphenols.Mut Res 2003; 523–524:201–208.
74. Koizumi Y, Tsubono Y, Nakaya N, et al. No association between green tea and the risk of gastric cancer:pooled analysis of two prospective studies in Japan. Cancer Epid Biomark Prev 2003; 12:472–473.
75. Dora I, Arab L, Martinchik A, Sdvizhkov A, Urbanovich L, Weisgerber U. Black tea consumptionand risk of rectal cancer in Moscow population. Ann Epidemiol 2003; 13:405–411.
76. Tavani A, Bertuzzi M, Talamini R, et al. Coffee and tea intake and risk of oral, pharyngeal andesophageal cancers. Oral Oncol 2003; 39:695–700.
77. Sun C, Yuan J, Lee M, et al. Urinary tea polyphenols in relation to gastric and esophageal cancers:a prospective study of men in Shanghai, China. Carcinogenesis 2002; 23:1497–1503.
78. Wu A, Yu M, Tseng C, Haskin J, Pike M. Green tea and risk of breast cancer in Asian Americans.Int J Cancer 2003; 106:574–579.
79. Inove M, Tajima K, Mizutani M, et al. Regular consumption of green tea and the risk of breast cancerrecurrence: follow-up study from the Hospital-based Epidemiologic Research Program at AichiCancer Center (HERPACC), Japan. Cancer Lett 2001; 167:175–182.
80. Pisters K, Newman R, Coldman B, et al. Phase I trial of oral green tea extract in adult patients withsolid tumors. J Clin Oncol 2001; 19:1830–1838.
81. Lu C, Lan S, Lee Y, Huang J, Huang C, Hsieh C. Tea consumption: fluid intake and bladder cancerrisk in Southern Taiwan. Urology 1999; 54:823–828.
82. Hakim I, Harris R, Weisgerber U. Tea intake and squamous cell carcinoma of the skin: influence oftype of tea beverages. Cancer Epidemiol Biomark Prev 2000; 9:727–731.
83. Fujiki H, Suganuma M, Imai K, Nakachi K. Green tea: cancer preventive beverage and/or drug.Cancer Lett 2002; 188:9–13.
84. Stratton S, Dorr R, Alberts D. The state-of-the-art in chemoprevention of skin cancer. Eur J Cancer2000; 36:1292–1297.
85. Einspahr J, Bowden G, Alberts D. Skin cancer chemoprevention: strategies to save our skin. RecentResults Cancer Res 2003; 163:157–164.
86. Katiyar S. Skin photoprotection by green tea: antioxidant and immunomodulatory effects. Curr DrugTargets Immunr Endocr Metabol Disord 2003; 3:234–242.
87. Chung J, Han J, Hwang E, et al. Dual mechanisms of green tea extract-induced cell survival inhuman epidermal keratinocytes. FASEB J 2003; 17:1913–1915.
88. Proniuk S, Liederer B, Blanchard J. Preformulation study of epigallocatechin gallate, a promisingantioxidant for topical skin cancer prevention. J Pharm Sci 2002; 91:111–116.
89. Orner G, Dashwood W, Blum C, et al. Response of Apcmin and A33 mutant mice to treatment withtea, sulindac and 2-amino-1-methyl-6-phenylimidazo [4,5-b] pyridine (PhIP). Mut Res 2002;506–507:121–127.
90. Fujiki H, Suganuma M, Kurusu M, et al. New TNF-% releasing inhibitors as cancer preventiveagents from traditional herbal medicines and combination cancer prevention study with EGCG andsulindac or tamoxifen. Mut Res 2003; 523–524:119–125.
91. Warden B, Smith L, Beecher G, Balentine D, Clevidence B. Catechins are bioavailable in men andwomen drinking black tea throughout the day. J Nutr 2001; 131:1731–1737.
92. Olthof M, Hollman P, Buijsman M, van Amelsvoort J, Katan M. Chlorogenic acid, quercetin-3-ruti-noside and black tea phenols are extensively metabolized in humans. J Nutr 2003; 133:1806–1814.
78 Part II / Cancer Prevention

Chapter 3 / Non-Nutritive Components and Cancer Risk 79
93. Van Amelsvoort J, Van Hof K, Mathot J, Mulder T, Wiersma A, Tijburg L. Plasma concentrations ofindividual tea catechins after a single oral dose in humans. Xerobiotica 2001; 31:891–901.
94. Lee M, Maliakal P, Chen L, et al. Pharmacokinetics of tea catechins after ingestion of green tea and(–)-epigallocatechin-3-gallate by humans: formation of different metabolites and individual variability.Cancer Epidemiol Biomark Prev 2002; 11:1025–1032.
95. Chow H, Cai Y, Alberts D, et al. Phase I pharmacokinetic study of tea polyphenols following single-dose administration of epigallocatechin gallate and polyphenon E. Cancer Epidemiol Biomark Prev2001; 10:53–58.
96. Leenen R, Roodenburg A, Tijburg L, Wiseman S. A single dose of tea with or without milk increasesplasma antioxidant activity in humans. Eur J Clin Nutr 2000; 54:87–92.
97. Kimura M, Umegaki K, Kasuya Y, Sugisawa A, Higuchi M. The relation between single/double orrepeated tea catechin ingestions and plasma antioxidant activity in humans. Eur J Clin Nutr 2002;56:1186–1193.
98. Young J, Dragsted L, Haraldsdottir J, et al. Green tea extract only effects markers of oxidative stresspostprandially: lasting antioxidant effect of flavonoid-free diet. Br J Nutr 2002; 87:343–355.
99. Adhami V, Ahmad N, Mukhtar H. Molecular targets for green tea in prostate cancer prevention.J Nutr 2003; 133:2417S–2424S.
100. Yang C, Maliakal P, Meng X. Inhibition of carcinogenesis by tea. Ann Rev Pharmacol Toxicol 2001;42:25–54.
101. Katiyar S, Agarwal R, Mukhtar H. Inhibition of both stage I and stage II skin tumor promotion inSENCAR mice by a polyphenolic fraction isolated from green tea: inhibition depends on the durationof polyphenol treatment. Carcinogenesis 1993; 14:2641–2643.
102. Dashwood R, Xu M, Hernaez J, Hasaniya N, Youn K, Razzuk A. Cancer chemopreventive mechanismsof tea against heterocyclic amine mutagens from cooked meat. Proc Soc Exp Biol Med 1999; 220:239–243.
103. Chan H, Wang H, Tsang D, Chen Z, Leung L. Screening of chemopreventive tea polyphenols againstPAH genotoxicity in breast cancer cells by a XRE-luciferase reporter construct. Nutr Cancer 2003;46:93–100.
104. Arimoto-Kobayashi S, Inada N, Sato Y, Sugiyama C, Okamoto K, Hayatsu H, Negishi N. Inhibitoryeffects of (–)-epigallocatechin gallate on the mutation, DNA strang cleavage and DNA adduct forma-tion by heterocyclic amines. J Agric Food Chem 2003; 51:5150–5153.
105. Shi S, Wang Z, Smith T, et al. Effects of green tea and black tea on 4-(methylnitrosamino)-1-(3-pyridyl)-1-butanone bioactivation, DNA methylation, and lung tumorigenesis in A/J mice. CancerRes 1994; 54:4641–4647.
106. Ow Y, Stupans I. Gallic acid and gallic acid derivatives: effects on drug metabolizing enzymes. CurrDrug Metab 2003; 4:241–248.
107. Bu-Abbas A, Clifford M, Walker R, Ioannides C. Contribution of caffeine and flavanols in the induc-tion of hepatic phase II activities by green tea. Food Chem Toxicol 1998; 36:617–621.
108. Lhoste E, Ouriet V, Bruel S, et al. The human colonic microflora influences the alternations of xeno-biotic-metabolizing enzymes by catechins in male F344 rats. Food Chem Toxicol 2003; 41:695–702.
109. Tanaka K, Hayatsu T, Negishi T, Hayatsu H. Inhibition of N-nitrosation of secondary amines in vitroby tea extracts and catechins. Mutat Res 1998; 412(1):91–98.
110. Brown J. N-Nitrosamines. Occup Med 1999; 14:839–848.111. Wu Y, Wang H, Li J, Han C. The inhibitory effect of Chinese tea and its polyphenols on in vitro and
in vivo N-nitrosation. Biomed Envir Sci 1993; 6:237–258.112. Hughes R, Pollock J, Bingham S. Effects of vegetables, tea and soy on endogenous N-nitrosation,
fecal ammonia and fecal water genotoxicity during a high red meat diet in humans. Nutr Cancer2002; 42:70–77.
113. Mukhtar H, Katiyar S, Agarwal R. Green tea and skin—anticarcinogenic effects. J Invest Dermatol1994; 102:3–7.
114. Lu H, Meng X, Li C, et al. Glucuronides of tea catechins: enzymology of biosynthesis and biologicalactivities. Drug Metab Dispos 2003; 31:452–461.
115. Hong J, Smith T, Ho C-T, August D, Yang C. Effects of purified green tea and black tea polyphenols oncycloxygenase- and lipoxygenase-dependent metabolism of arachidonic acid in human colon mucosaand colon tumor tissues. Biochem Pharmacol 2001; 62:1175–1183.
116. Naasani I, Oh-hashi F, Oh-hara T, et al. Blocking telomerase by dietary polyphenols is a major mech-anism for limiting the growth of human cancer cells in vitro and in vivo. Cancer Res 2003; 63:824–830.

80 Part II / Cancer Prevention80 Part II / Cancer Prevention
117. Hastak K, Gupta S, Ahmad N, Agarwal MK, Agarwal ML, Mukthew H. Role of p53 and NF-κ B inepigallocatechin-3-gallate-induced apoptosis of LNCaP cells. Oncogene 2003; 22: 4851–4859.
118. Brusselmans K, DeSchrijver E, Heyns W, Verhoeven G, Swinnen J. Epigallocatechin-3-gallate is apotent natural inhibitor of fatty acid synthase in intact cells and selectively induces apoptosia in prostatecancer cells. Int J Cancer 2003; 106:858–862.
119. Tang F, Nguyen N, Meydam M. Green tea catechins inhibit VEGF-induced angiogenesis in vitrothrough suppression of VE-cadherin phosphorylatton and inactivation of Akt molecule. Int J Cancer2003; 106:871–878.
120. Ahn W, Huh S, Bae S, et al. A major constituent of green tea, ECGC, inhibits the growth of a humancervical cancer cell line, Ca Ski cells, through apoptosis, G(1) arrest, and regulation of gene expres-sion. DNA Cell Biol 2003; 22:217–224.
121. Park A, Dong Z. Signal transduction pathways: targets for green and black tea polyphenols. J BiochemMol Biol 2003; 36:66–77.
122. Pfeffer U, Ferrari N, Morini M, Benelli R, Noonan D, Albini A. Antiangiogenic activity of chemo-preventive drugs. Int J Biol Markers 2003; 18:70–74.
123. Bremner P, Heinrich M. Natural products as targeted modulators of the nuclear factor-κB pathway.J Pharm Pharmacol 2002; 54:453–472.
124. Chen C, Shen G, Hebbar V, Hur, Owvor E, Kong A. Epigallocatechin-3-gallate-induced stress signalsin HT-29 human colon adenocarciinoma cells. Carcinogenesis 2003; 24:1369–1378.
125. Vergote D, Cren-Olive C, Chopin V, et al. (–) Epigallocatechin (ECG) of green tea induces apoptosis ofhuman breast cancer cells but not of their normal counterparts. Breast Cancer Res Treat 2002;76:195–201.
126. Yamamoto T, Hsu D, Lewis J, et al. Green tea polyphenol causes differential oxidative environmentsin tumor vs normal epithelial cells. J Pharmacol Exp Ther 2003; 307:230–236.
127. Mei Y, Wei D, Liu J. Reversal of cancer multidrug resistance by tea polyphenols in KB cells.J Chemother 2003; 15:260–265.
128. Aboobaker V, Balgi A, Bhattacharya R. In vivo effect of dietary factors on the molecular action ofaflatoxin B1: role of non-nutrient phenolic compounds on the catalytic activity of liver fractions.In Vivo 1994; 8:1095–1098.
129. Ho P, Saville D, Wanwimolruk S. Inhibition of human CPY3A4 activity by grapefruit flavonoids,furanocoumarins and related compounds. J Pharm Sci 2001; 4:217–227.
130. Barnes S. The chemopreventive properties of soy isoflavonoids in animal models of breast cancer.Breast Cancer Res Treat 1997; 46:169–179.
131. Messina M. Legumes and soybeans: overview of their nutritional profiles and health effects. Am JClin Nutr 1999; 70(Suppl 3):439S–450S.
132. Adlerkreutz H. Phytoestroens and breast cancer. J Ster Biochem Mol Biol 2003; 83:113–118.133. Ganry O. Phytoestrogen and breast cancer prevention. Eur J Cancer Prev 2002; 11:519–522.134. Peeters P, Keinan-Boker L, van der Schouw Y, Grobbee D. Phytoestrogens and breast cancer risk.
Breast Cancer Res Treat 2003; 77:171–183.135. Messina M, Loprinzi C. Soy for breast cancer survivors: a critical review of the literature. J Nutr
2001; 131:3095S–3108S.136. Setchell K, Brown N, Lydeking-Olsen E. The clinical importance of the metabolite equol—a clue to
the effectiveness of soy and its isoflavones. J Nutr 2002; 132:3577–3584.137. Herman C, Adlercreutz T, Goldin B, et al. Soybean phytoestrogen intake and cancer risk. J Nutr
1995; 125:757S–770S.138. Chen C, Shieh B, Jin Y, et al. Microarray profiling of gene expression patterns in bladder tumor cells
treated with genistein. J Biomed Sci 2001; 8:214–222.139. Shertzer H, Puga A, Chang C, et al. Inhibition of CYP1A1 enzyme activity in mouse hepatoma cell
culture by soybean isoflavones. Chem Biol Interact 1999; 123:31–49.140. Kim H, Peterson TG, Barnes S. Mechanisms of action of the soy isoflavone genistein: emerging role
for its effects via transforming growth factor β signaling pathways. Am J Clin Nutr 1998; 68(6Suppl):1418S–1425S
141. Zhou J, Mukherjee P, Gugger E, Tanaka T, Blackburn G, Clinton S. Inhibition of murine bladdertumorigenesis by soy isoflavones via alterations in the cell cycle, apoptosis, and angiogenesis.Cancer Res 1998; 58:5231–5238.
142. Lamartiniere C, Murrill W, Manzolillo P, et al. Genistein alters the ontogeny of mammary glanddevelopment and protects against chemically-induced mammary cancer in rats. Proc Soc Exp BiolMed 1998; 217:358–364.

Chapter 3 / Non-Nutritive Components and Cancer Risk 81
143. Hilakivi-Clarke L, Cho E, Onojafe I, Raygada M, Clarke R. Maternal exposure to genistein duringpregnancy increases carcinogen-induced mammary tumorigenesis in female rat offspring. OncolRep 1999; 6:1089–1095.
144. Hsieh C, Santell R, Haslam S, Helferich W. Estrogenic effects of genistein on the growth of estrogenreceptor-positive human breast cancer (MCF-7) cells in vitro and in vivo. Cancer Res 1998;58:3833–3838.
145. Kurzer M. Hormonal effects of soy in premenopausal women and men. J Nutr 2002; 132:570S–573S.146. Duncan A, Merz-Demlow B, Xu X, Phipps W, Kurzer M. Premenopausal equol excretors show
plasma hormone profiles associated with lowered risk of breast cancer. Cancer Epidemiol BiomarkPrev 2000; 9:581–586.
147. Xu X, Duncan A, Wangen K, Kurzer M. Soy consumption alters endogenous estrogen metabolismin postmenopausal women. Cancer Epidemiol Biomark Prev 2000; 9:781–786.
148. Hargreaves D, Potten C, Harding C, et al. Two-week dietary soy supplementation has an estrogeniceffect on normal premenopausal breast. J Clin Endocrinol Metab 1999; 84:4017–4024.
149. Petrakis N, Barnes S, King E, et al. Stimulatory influence of soy protein isolate on breast-secretionin pre- and postmenopausal women. Cancer Epidemiol Biomark Prev 1996; 5:785–794.
150. Maskarinec G, Williams A, Carlin L. Mammographic densities in a one-year isoflavone intervention.Eur J Cancer Prev 2003; 12:165–169.
151. Maskarinec G, Lyu L, Meng L, Theriault A, Ursin G. Determinants of mammographic densitiesamong women of Asian, Native Hawaiian and Caucasian ancestry. Ethn Dis 2001; 11:44–50.
152. Maskarinec G, Meng L. An investigation of soy intake and mammographic characteristics in Hawaii.Breast Cancer Res Treat 2001; 3:134–141.
153. Jakes R, Duffy S, Ng F, et al. Mammographic parenchymal patterns and self-reported soy intake inSingapore Chinese women. Cancer Epidemiol Biomark Prev 2002; 11:608–613.
154. Maskarinec G, Williams A. Correspondence re: Jakes et al. Mammographic parenchymal patterns andself-reported soy intake in Singapore Chinese Women. Cancer Epidemiol Biomark Prev 2003; 12:387.
155. Atkinson C, Bingham S. Mammographic breast density as a biomarker of effects of isoflavones onthe female breast. Breast Cancer Res 2002; 4:1–4.
156. Messina M. Emerging evidence on the role of soy in reducing prostate cancer risk. Nutr Rev 2003;61:117–131.
157. Lee M, Gomez S, Chang J, Wey M, Wang R, Hsing A. Soy and isoflavone consumption in relationto prostate cancer risk in China. Cancer Epidemiol Biomark Prev 2003; 12:665–668.
158. Zhou J, Yu L, Zhong Y, et al. Inhibition of orthotopic growth and metastasis of androgen-sensitivehuman prostate tumors in mice by bioactive soybean components. Prostate 2002; 53:143–153.
159. Fritz W, Eltoum I, Cotroneo M, Lamartiniere C. Genistein alters growth but is not toxic to the ratprostate. J Nutr 2002; 132:3007–3111.
160. Zhou J, Yu L, Zhong Y, Blackburn G. Soy phytochemicals and tea bioactive components synergisticallyinhibit androgen-sensitive human prostate tumors in mice. J Nutr 2002; 133:416–521.
161. Wang S, DeGroff V, Clinton S. Tomato and soy polyphenols reduce insulin-like growth factor-I-stimulated rat prostate cancer cell proliferation and apoptotic resistance in vitro via inhibition ofintracellular signaling pathways involving tyrosine kinase. J Nutr 2003; 133:2367–2376.
162. Kazi A, Daniel K, Smith D, Kumar N, Dou Q. Inhibition of the proteasome activity, a novel mech-anism associated with the tumor cell apoptosis-inducing ability of genistein. Biochem Pharmacol2003; 66:965–976.
163. Leach R, Pollock B, Basler J, Naylor S, Thompson I. Chemoprevention of prostate cancer. Focus onkey opportunities and clinical trials. Urol Clin North Am 2003; 30:227–237.
164. Miltyk W, Craciunescu C, Fischer L, et al. Lack of significant genotoxicity of purified soyisoflavones (genistein, daidzein, glycitein) in 20 patients with prostate cancer. Am J Clin Nutr 2003;77:875–882.
165. Zhou J, Gugger E, Tanaka T, Guo Y, Blackburn G, Clinton S. Soybean phytochemicals inhibit thegrowth of transplantable human prostate carcinoma and tumor angiogenesis in mice. J Nutr 1999;129:1628–1635.
166. Fajardo I, Quesada A, Nunez de Castro I, Sanchez-Jimenez F, Medina M. A comparative study of theeffects of genistein and 2-methoxyestradiol on the proteolytic balance and tumour cell proliferation.Br J Cancer 1999; 80:17–24.
167. Beecher C. Cancer preventive properties of varieties of Brassica oleracea: a review. Amer J ClinNutr 1994; 59:1166S–1170S.
82 Part II / Cancer Prevention
168. Wortelboer H, deDruif C, vanIersel A, Falke H, Noordhoek J, Blaauboer B. Acid reaction products ofindole-3-carbinol and their effects on cytochrome P-450 and phase II enzymes in rats and monkeyhepatocytes. Bioch Pharmacol 1992; 43:1439–1447.
169. DeKruif C, Marsman J, Venekamp J, et al. Structive elucidation of acid reaction products of indole-3-carbinol: detection in vivo and enzyme induction in vitro. Chem Biol Interact 1991; 80:303–315.
170. Stoner G, Casto B, Ralston S, Roebuck B, Pereira C, Bailey G. Development of a multi-organ ratmodel for evaluating chemopreventive agents: efficacy of indole-3-carbinol. Carcinogenesis 2002;23:265–272.
171. Staack R, Kingston S, Wallig M, Jeffery E. A comparison of the individual and collective effects offour glucosinolate breakdown products from brussel sprouts on induction of detoxification enzymes.Toxicol Appl Pharmacol 1998; 149:17–23.
172. Michnovicz J, Bradlow H. Altered estrogen metabolism and excretion in humans following consump-tion of indole-3-carbinol. Nutr Cancer 1991; 16:59–66.
173. Wong G, Bradlow L, Sepkovic D, Mehl S, Mailman J, Osborne M. Dose-ranging study of indole-3-carbinol for breast cancer prevention. J Cell Biochem Suppl 1997; 28–29:111–116.
174. Leibelt D, Hedstrom O, Fischer K, Pereira C, Williams D. Evaluation of chronic dietary exposure toindole-3-carbinol and absorption-enhanced 3,31-diindolymethane in Sprague–Dawley rats. ToxicolSci 2003; 74:10–21.
175. Bradlow H, Sepkovic D, Telang N, Osborne M. Multifunctional aspects of the action of indole-3-carbinol as an antitumor agent. Ann NY Acad Sci 1999; 889:204–213.
176. Jellinck P, Forkert P, Riddick D, Okey A, Michnovicz J, Bradlow H. Ah receptor binding propertiesof indole carbinols and induction of hepatic estradial hydroxylation. Biochem Pharmacol 1993;45:129–1136.
177. Bjeldanes L, Kim J, Grose K, Bartholemew J, Bradfield C. Aromatic hydrocarbon responsivenessreceptor agonists generated from indole-3-carbinol in vitro and in vivo: comparisons with 2,3,7,8-tetrochlorodibenzo-p-dioxin. Proc Natl Acad Sci USA 1991; 88:9543–9547.
178. Chen T, Safe S, Bjeldanes L. Indole-3-carbinol and diindoyl methane as anyl hydrocarbon (Ah)receptor agonists and antagonists in T47D human breast cancer cells. Biochem Pharmacol 1996;51:1069–1076.
179. Murillo G, Mehta R. Cruciferous vegetables and cancer prevention. Nutr Cancer 2001; 41:17–28.180. Jellinck P, Michnovicz J, Bradlow H. Influence of indole-3-carbinol on the hepatic microsomal for-
mation of catechol estrogens. Steroids 1991; 56:446–450.181. Taioli E, Bradlow H, Garbers S, et al. Role of estrogen metabolism and CYP1A1 polymorphisms in
breast cancer risk. Cancer Detect Prev 1999; 23:232–237.182. Shertzer H. Indole-3-carbinol protects against covalent binding of benzo[a]pyrene and N-nitrosodi-
methylamine metabolites to mouse liver macromolecules. Chem-Biol Interactions 1984; 48:81–90.183. Shukla Y, Singh A, Srivastava B. Inhibition of carcinogen-induced activity of γ-glutamyl transpep-
tidase by certain dietary constituents in mouse skin. Biomed Environ Sci 1999; 12:110–115.184. He Y, Schut H. Inhibition of DNA adduct formation of 2-amino1methyl6phenylimidazo[4,5b]pyri-
dine and 2amino3methylimidazo[4,5f]quinoline by dietary indole3carbinol in female rats. J BiochemMol Toxicol 1999; 13:239–247.
185. Stresser D, Williams D, McLellan L, Harris T, Bailey G. Indole-3-carbinol induces a rat liver glu-tathione transferase subunit (Yc2) with high activity toward aflatoxin B1 exo-epoxide. Associationwith reduced levels of hepatic aflatoxin-DNA adducts in vivo. Drug Metab Dispos 1994; 22:392–399.
186. Horn T, Reichert M, Bliss R, Malejka-Giganti D. Modulations of P450mRNA in liver and mammarygland and P450 activities and metabolism of estrogen in liver by treatment of rats with indole-3-carbinol. Biochem Pharmacol 2002; 64:393–404.
187. Bonnesen C, Eggleston I, Hayes J. Dietary indoles and isothiocyanates that are generated from cru-ciferous vegetables can both stimulate apoptosis and confer protection from DNA damage in humancolon cell lines. Cancer Res 2001; 61:6120–6130.
188. Dashwood R, Xu M. The disposition and metabolism of 2-amino3methylimidazo[4,5f] quinoline inthe F344 rat at high versus low doses of indole3carbinol. Food Chem Toxicol 203; 41:1185–1192.
189. Suto A, Bradlow H, Wong G, Osborne M, Talang N. Experimental down-regulation of intermediatebiomarkers of carcinogenesis in mouse mammary epithelial cells. Breast Cancer Res Treat 1993;27:193–202.
190. Tiwari R, Guo L, Bradlow H, Telang N, Osborne M. Selective responsiveness of human breast cancercells to indole-3-carbinol, a chemopreventive aent. J Natl Cancer Inst 1994; 86:126–131.
82 Part II / Cancer Prevention

Chapter 3 / Non-Nutritive Components and Cancer Risk 83
191. Riby J, Chang G, Firestone G, Bjeldanes L. Ligand-independent activation of estrogen receptor func-tion by 3,3′- diindoylmethane in human breast cancer cells. Biochem Pharmacol 2000; 60:167–177.
192. Leong H, Firestone G, Bjeldanes L. Cytostatic effects of 3,3’-diindoyl methane in human endometrialcancer cells result from an estrogen receptor-mediated increase in transforming growth factor-∀expression. Carcinogenesis 2001; 22:1809–1817.
193. Ashok B, Chen Y, Liu X, et al. Multiple molecular targets of indole-3-carbinol, a chemopreventieanti-estrogen in breast cancer. Eur J Cancer Prev 2002; 11(Suppl 2):S86–S93.
194. Auborn K, Fan S, Rosen E, et al. Indole-3-carbinol is a negative regulator of estrogen. J Nutr 2003;133:2470S–2475S.
195. Firestone G, Bjeldanes l. Indole-3carbinol and 3,3diindoylmethane antiproliferative signaling path-ways control cellcycle gene ranscription in human breast cancer cells by regulating promoterSp1transcription factor interactions. J Nutr 2003; 133:2448S–2455S.
196. Kojima T, Tanaka T, Mori H. Chemoprevention of spontaneous endometrial cancer in femaleDonryu rats by dietary indole-3-carbinol. Cancer Res 1994; 54:1446–1449.
197. Jin L, Qi M, Chen D, Anderson A, Yang G, Arbeit J, Auborn K. Indole-3-carbinol prevents cervicalcancer in human papilloma virus type 16(HPV16) transgenic mice. Cancer Res 1999; 59:3991–3997.
198. Yuan F, Chen D, Liu K, Sepkovic D, Bradlow H, Auborn K Anti-estrogenic activities of indole-3-carbinolin cervical cells: implication for prevention of cervical cancer. Anticancer Res 1999; 19:1673–1680.
199. Bell M, Crowley-Nowick P, Bradlow H, et al. Placebo-controlled trial of indole-3-carbinol in thetreatment of CIN. Gytnecol Oncol 2000; 78:123–129.
200. Follen M, Vlastos A, Meyskens F, Atkinson N, Schottenfeld D. Why phase II trials in cervicalchemoprevention are negative: what have we learned? Cancer Causes Control 2002; 13:855–873.
201. Sepkovic D, Bradlow H, Bell M. Quantitative determination of 3,31-diindoyl methane in urine ofindividuals receiving indole-3-carbinol. Nutr Cancer 2001; 41:57–63.
202. Chen D, Qi M, Auborn K, Carter T. Indole-3-carbinol and diindoylmethane induce apoptosis of humancervical cancer cells and in murine HPV-16 transgenic preneoplastic cervical epithelium. J Nutr 2001;131:3294–3302.
203. Zheng Q, Hirose Y, Yoshimi N, et al. Further investigation of the modifying effect of various chemo-preventive agents on apoptosis and cell proliferation in human colon cancer cells. J Cancer Res ClinOncol 2002; 128:539–546.
204. Rahman K, Aranha O, Sarkar F. Indole-3-carbinol (I3C) induces apoptosis in tumorigenic but not innontumorigenic breast epithelial cells. Nutr Cancer 2003; 45:101–112.
205. Nachshon-Kedmi M, Yannai S, Haj A, Fares F. Indole-3-carbinol and 3,31-diindoylmethane induceapoptosis in human prostate cancer cells. Food Chem Toxicol 2003; 41:745–752.
206. Zhang X, Malejka-Giganti D. Effects of treatment of rats with indole-3-carbinol on apoptosis in themammary gland and mammary adenocarcinomas. Anticancer Res 2003; 23:2473–2479.
207. Sarkar F, Rahman K, Yiwei L. Bax translocation to mitochondria is an important event in inducingapoptotic cell death by indole-3-carbinol (I3C) treatment of breast cancer cells. J Nutr 2003;133:2434S–2439S.
208. Herrmann S, Seidelin M, Bisgaard H, Vang O. Indole [3,2-b] carbazone inhibits gap junctional intercel-lular communication in rat primary hepatocytes and acts as a potential tumor promoter. Carcinogenesis2002; 23:1861–1868.
209. Johnson F, Huff J. Development of a multi-organ rat model for evaluating chemopreventive agents:efficacy of indole-3-carbinol—certain health supplements may cause both carcinogenic and anticar-cinogenic effects. Carcinogenesis 2002; 23:1767–1768.
210. Verhoeven D, Verhagen H, Goldbohm R, van den Brandt P, van Poppel G. A review of mechanismsunderlying anticarcinogenicity by brassica vegetables. Chem Biol Interact 1997; 103:79–129.
211. Thornalley P. Isothiocyanates: mechanism of cancer chemoprevention. Anti-Cancer Drugs 2002;13:331–338.
212. van Poppel G, Verhoeven D, Verhagen H, Goldbohm R. Brassica vegetables and cancer prevention.Adv Exp Med Biol 1999; 472:159–168.
213. Shapiro T, Fahey J, Wade K, Stephenson K, Talalay P. Human metabolism and excretion of cancerchemoprotective glucosinolates and isothiocyanates of cruciferous vegetables. Cancer EpidemiolBiomarkers Prev 1998; 7:1091–1100.
214. Connaway C, Getahun S, Liebes L, Pusateri D, Topham D, Botero-Omary M, Chung F. Dispositionof glucosinolates and sulforaphane in humans after ingestion of steamed and fresh broccoli. NutrCancer 2000; 38:168–178.

84 Part II / Cancer Prevention84 Part II / Cancer Prevention
215. Zhang Y, Talalay P. Anticarcinogenic activities of organic isothiocyanates: chemistry and mecha-nisms. Cancer Research 1994; 54:1976S–81S.
216. Hecht SS Chemoprevention of cancer by isothiocyanates, modifiers of carcinogen metabolism. J Nutr1999; 129:768S–774S
217. Sugie S, Okumura A, Tanaka T, Mori H. Inhibitory effects of benzyl isothiocyanate and benzyl thio-cyanate on diethylnitrosamine-induced hepatocarcinogenesis in rats. Jap J Cancer Res 1993;84:865–870.
218. Sugie S, Okamoto K, Okumura A, Tanaka T, Mori H. Inhibitory effects of benzyl thiocyanate andbenzyl isothiocyanate on methylazoxymethanol acetate-induced intestinal carcinogenesis in rats.Carcinogenesis 1994; 15:1555–1560.
219. Fahey J, Haristoy X, Dolan P, et al. Sulforaphane inhibits extracellular, intracellular, and antibiotic-resistant strains of Helicobacter pylori and prevents benzo[a]pyrene-induced stomach tumors. ProcNatl Acad Sci USA 2002; 99:7610–7615.
220. Witschi H, Espiritu I, Yu M, Willits N. The effects of phenethyl isothiocyanate, N–acetylcysteine andgreen tea on tobacco smoke-induced lung tumors in strain A/J mice. Carcinogenesis 1998;19:1789–1794.
221. Morse M, Eklind K, Hecht S, et al. Structure-activity relationships for inhibition of 4-(methylni-trosamino)1(3pyridlyl)1butanone lung tumorigenesis by arylalkyl isothiocyanates in A/J mice.Cancer Res 1991; 51:1846–1850.
222. Morse M, Eklind K, Hecht S, Chung F. Inhibition of tobaccospecific nitrosamine 4(N-nitrosomethy-lamino)-1(3pyridyl)1butanone (NNK) tumorigenesis with aromatic isothiocyanates. IARC Sci Publ1991; 105:529–534.
223. Hirose M, Yamaguchi T, Kimoto N, et al. Strong promoting activity of phenylethyl isothiocyanateand benzyl isothiocyanate on urinary bladder carcinogenesis in F344 male rats. Int J Cancer 1998;77:773–777.
224. Stoner G, Siglin J, Morse M, et al. Enhancement of esophageal carcinogenesis in male F344 rats bydietary phenylhexyl isothiocyanate. Carcinogenesis 1995; 16:2473–2476.
225. Stoner G, Kresty L, Carlton P, Siglin J, Morse M. Isothiocyanates and freeze-dried strawberries asinhibitors of esophageal cancer. Toxicol Sci 1999; 52(Suppl 2):95–100.
226. Smith T, Guo Z, Guengerich F, Yang C. Metabolism of 4-(methylnitrosamino)1(3pyridyl)1butanone(NNK) by human cytochrome P450 1A2 and its inhibition by phenethyl isothiocyanate.Carcinogenesis 1996; 17:809–813.
227. Moreno R, Kent U, Hodge K, Hollenberg P. Inactivation of cytochrome P450 2E1 by benzyl isoth-iocyanate. Chem Res Toxicol 1999; 12:582–587.
228. Ishizaki H, Brady J, Ning S, Yang C. Effect of phenethyl isothiocyanate on microsomal N-nitroso-dimethylamine metabolism and other monooxygenase activities. Xenobiotica 1990; 20:225–234.
229. Barcelo S, Gardiner J, Gescher A, Chipman J. CYP2E1-mediated mechanism of anti–genotoxicityof the broccoli constituent sulforaphane. Carcinogenesis 1996; 17:277–282.
230. Zhang Y, Kensler TW, Cho C-G, Posner GH, Talalay P. Anticarcinogenic activities of sulforaphane andstructurally related synthetic norbornyl isothiocyanates. Proc Natl Acad Sci USA 1994; 91:3147–3150.
231. Daehnfeldt J. Cytostatic activity and metabolic effects of aromatic isothiocyanic acid esters.Biochem Pharm 1968; 17:511–518.
232. Zhang Y, Tang L, Gonzalez V. Selected isothiocyanates rapidly induce growth inhibition of cancercells. Mol Cancer Ther 2003; 2(10):1045–1052.
233. Huang C, Ma W, Li J, Hecht S, Dong Z. Essential role of p53 in phenethyl isothiocyanate-inducedapoptosis. Cancer Res 1998; 58:4102–4106.
234. Gamet-Payrastre L, Li P, Lumeau S, et al. Sulforaphane, a naturally occurring isothiocyanate, inducescell cycle arrest and apoptosis in HT29 human colon cancer cells. Cancer Res 2000; 60:1426–1433.
235. Sasaki T, Kudoh K, Uda Y, et al. Effects of isothiocyanates on growth and metastaticity of B16-F10melanoma cells. Nutr Cancer 1999; 33:76–81.
236. Lin H, Probst-Hensch N, Louie A, et al. Glutathione transferase null genotype, broccoli, and lowerprevalence of colorectal adenomas. Cancer Epidemiol Biomarkers Prev 1998; 7:647–652.
237. Mulcrow C, Lawrence V, Ackermann R, et al. Garlic: effects on cardiovascular risks and disease, andprotective effects against cancer, and clinical adverse effects. Evidence Report/TechnologyAssessment No. 20 (Contract 290-97-0012) to the San Antonio Evidence-based Practice Centerbased at The University of Texas Health Science Center at San Antonio and the Veterans AffairsHealth Services Research and Development Center of Excellence. AHRQ Publication No. 01-E023.Rockville, MD: Agency for Healthcare Research and Quality. October 2000.
Chapter 3 / Non-Nutritive Components and Cancer Risk 85
238. Bianchini F, Vainio H. Allium vegetables and organosulfur compounds: do they help prevent cancer?Environ Health Perspect 2001; 109: 893–902.
239. Fleischauer A, Poole C, Arab L. Garlic consumption and cancer prevention: meta-analysis of col-orectal and stomach cancers. Am J Clin Nutr 2000; 72:1047–1052.
240. Fleischauer F, Arab L. Garlic and cancer: a critical review of the epidemiologic literature. J Nutr2001; 131:1032S–1040S.
241. Hsing A, Chokkalingam A, Gao Y, et al. Allium vegetables and risk of prostate cancer: a population-based study. J Natl Cancer Inst 2002; 94:1648–1651.
242. Moyad M. The placebo effect and randomized trials: analysis of alternative medicine. Urol Clin NAm 2002; 29:135–155.
243. You W, Chang Y, Heinrich J, et al. An intervention trial to inhibit the progression of precancerousgastric lesions: compliance, serum micronutrients an S-allyl cysteine levels, and toxicity. Eur JCancer Prev 2001; 10:257–263.
244. Patel J, Buddha B, Dey S, Pae D, Mitra A. The in vitro interaction of the HIV protease inbibtor riton-avir with herbal constituents: changes in P-gp and CYP3A4 activity. AM J Ther 2004; 11:262–227.
245. Piscitelli et al. The effect of garlic supplements on the pharmacokinetics of saquinovir . Clin InfectDis 2002; 34:234–238.
246. Fenwick G, Hanley A. The genus Allium—Part 3. Crit Rev Food Sci Nutr 1985a; 23:1–73.247. Fenwick, G, Hanley A. The genus Allium. Part 2. Crit. Rev. Food Sci. Nutr 1985b; 22: 273–277.248. Block E. The chemistry of garlic and onion. Sci American. 1985; 252:114–119.249. Lawson L, Wang Z, Hughes B. Identification and HPLC quantitation of the sulfides and dialk(en)yl
thiosulfinates in commercial garlic products. Planta Med 1991; 57:363–370.250. Tamaki T, Sonoki S. Volatile sulfur compounds in human expiration after eating raw or heat-treated
garlic. J Nutr Sci Vitaminol (Tokyo) 1999; 45:213–222.251. Milner J. Garlic: its anticarcinogenic and antitumorigenic properties.Nutr Rev 1996; 54(11 Pt
2):S82–S86.252. Basenthil S, Rao K, Nagini S. Apoptosis induction by S-allylcysteine, a garlic consitutent, during
7,12-dimethylbenz[a]anthracene-induced hamster buccal pouch carcinogenesis. Cell Biochem Funct2002; 20:263–268.
253. Basenthil S, Rao K, Nagini S. Garlic induces apoptosis during 7,12-dimethylbenz[a]anthracene-induced hamster bucal pouch carcinogenesis. Oral Oncol 2002; 38:431–436.
254. Borek C. Antioxidant health effects of aged garlic extract. J Nutr 2001; 131: 1010S–1015S.255. Banerjee S, Mukherjee P, Maulik S. Garlic as an antioxidant: the good, bad and the ugly. Phytother
Res 2003; 17:97–106.256. Rahman K. Garlic and aging: new insights into an old remedy. Ageing Res Rev 2003; 2: 39–56.257. Dillon S, Lowe G, Billington D, Rahman K. Dietary supplementation with aged garlic extract reduces
plasma and urine concentrations of 8-iso-prostaglandin F2α in smoking and nonsmoking men andwomen. J Nutr 2002; 132:168–171.
258. Shenoy N, Choughuley A. Inhibitory effect of diet related sulphydryl compounds on the formationof carcinogenic nitrosamines. Cancer Lett 1992; 65:227–232.
259. Dion M, Agler M, Milner J. S-allyl cysteine inhibits nitrosomorpholine formation and bioactivation.Nutr Cancer 1997; 28:1–6.
260. Vermeer I, Moonen E, Dallinga J, Kleinjans J, van Maanen J. Effect of ascorbic acid and green teaon endogenous formation of N-nitrosodimethylamine and N-nitrosopiperidine in humans. Mutat Res1999; 428(1–2):353–361.
261. Lin X-Y, Liu, J, Milner J. Dietary garlic suppresses DNA adducts caused by i-nitroso compounds.Carcinogenesis 1994; 15:349–352.
262. Haber-Mignard D, Suschetet M, Berges R, Astorg P, Siess M. Inhibition of aflatoxin B1- and N-nitrosodiethylamine-induced liver preneoplastic foci in rats fed naturally occurring allyl sulfides.Nutr Cancer 1996; 25:61–70.
263. Jeong H, Lee Y. Protective effects of diallyl sulfide on N-nitrosodimethylamine-induced immuno-suppression in mice. Cancer Lett 1998; 134:73–79.
264. Jin L, Baillie T. Metabolism of the chemoprotective agent diallyl sulfide to glutathione conjugatesin rats. Chem Res Toxicol 1997; 10:318–327.
265. Mei X, Lin X, Liu J, et al. The blocking effect of garlic on the formation of N-nitrosoproline inhumans. Acta Nutrimenta Sinica 1989; 11:141–145.
266. Milner J. Mechanisms by which garlic and allyl sulfur compounds suppress carcinogen bioactivation.Garlic and carcinogenesis. Adv Exp Biol Med 2001; 492:9–81.

86 Part II / Cancer Prevention86 Part II / Cancer Prevention
267. Hageman G, vanHerwijnen M, Schilderman P, Rhijnsburger E, Moonen E, Kleinjans J. Reducing effectsof garlic constituents on DNA adduct formation in human lymphocytes in vitro. Nutr Cancer 1997;27:177–185.
268. Manson M, Ball H, Barrett M, et al. Mechanism of action of dietary chemoprotective agents in ratliver: induction of phase I and II drug metabolizing enzymes and aflatoxin B1 metabolism.Carcinogenesis 1997; 18:729–738.
269. Pan J, Hong J, Li D, et al. Regulation of cytochrome P450 2B1/2 genes by diallyl sulfone, disulfiram,and other organosulfur compounds in primary cultures of rat hepatocytes. Biochem Pharmacol 1993;45:2323–2329.
270. Wang B, Zuzel K, Rahman K, Billington D. Treatment with aged garlic extract protects against bro-mobenzene toxicity to precision cut rat liver slices. Toxicology 1999; 132:215–225.
271. Singh S, Pan S, Srivastava S, Xia H, Hu X, Zaren H, Orchard J. Differential induction of NAD(P)H:quinone oxidoreductase by anti-carcinogenic organosulfides from garlic. 1998; 244:917–920.
272. McGrath B, Milner J. Diallyl disulfide, S-allyl sulfide and conjugated linoleic acid retard 12/15-lipoxygenase-mediated bioactivation of 7,12-dimethylbenz(a)anthracene (DMBA) in vitro. FASEBJ 1999; 13:A540.
273. Singh A, Singh S. Modulatory potential of smokeless tobacco on the garlic, mace or black mustard-altered hepatic detoxication system enzymes, sulfhydryl content and lipid peroxidation in murinesystem. Cancer Lett 1997; 118:109–114.
274. Munday R, Munday C. Relative activities of organosulfur compounds derived from onions andgarlic in increasing tissue activities of quinone reductase and glutathione transferase in rat tissues.Nutr Cancer 2001; 40:205–210.
275. Hu X, Benson P, Srivastava S, et al. Induction of glutathione S-transferase pi as a bioassay for theevaluation of potency of inhibitors of benzo(a)pyrene-induced cancer in a murine model. Int J Cancer1997; 73:897–902.
276. Chen G, Chung J, Hsieh C, Lin J. Effects of the garlic components dially sulfide and diallyl disul-fide on arylamine N-acetyltransferase activity in human colon tumor cells. Food Chem Toxicol 1998;36:761–770.
277. Chung J, Chen G, Wu L, et al. Effects of garlic compounds diallyl sulfide and diallyl disulfide on ary-lamine N-acetyltransferase activity in strains of Helicobacter pylori. J Antimicrob Chemother 1999;Am J Chin Med 26:353–364.
278. Iimuro M, Shibata H, Kawamori T, et al. Suppressive effects of garlic extract on Helicobacter pylori-induced gastritis in Mongolian gerbils. Cancer Lett 2002; 187:61–68.
279. Sakamoto K, Lawson L, Milner J. Allyl sulfides from garlic suppress the in vitro proliferation ofhuman A549 lung tumor cells. Nutr Cancer 1997; 29:152–156.
280. Pinto J, Qiao C, Xing J, et al. Effects of garlic thioallyl derivatives on growth, glutathione concen-tration, and polyamine formation of human prostate carcinoma cells in culture. Am J Clin Nutr 1997;66:398–405.
281. Knowles L, Milner J. Depressed p34cdc2 kinase activity and G2/M phase arrest induced by diallyldisulfide in HCT-15 cells. Nutr Cancer 1998; 30:69–74.
282. Hartwell L, Kastan M. Cell cycle control and cancer. Science 1994; 266:1821–1828.283. Knowles L, Milner J. Possible mechanisms by which allyl sulfides suppress neoplastic cell prolifer-
ation. J Nutr 2001; 131:1061S–1066S.284. Bottone F, Baek S, Nixon J, Eling T. Diallyl disulfide (DADS) induces the antitumorigenic NSAID-
activated gene (NAG-1) by a p53-dependent mechanism in human colorectal HCT 116 cells. J Nutr2002; 132:773–778.
285. Li Y, Lu Y. Isolation of diallyl trisulfide inducible differentially expressed genes in human gastriccancer cells by modified cDNA representational difference analysis. DNA Cell Biol 2002; 21:771–780.
286. Liu J, Lin R, Milner J. Inhibition of 7,12-dimethylbenz(a)- anthracene induced mammary tumors andDNA adducts by garlic powder. Carcinogenesis 1992; 13:1847–1851.
287. Sundaram S, Milner J. Diallyl disulfide induces apoptosis of human colon tumor cells. Carcinogenesis1996; 17:669–673.
288. Steinmetz K, Potter J. Food-group consumption and colon cancer in the Adelaide Case-ControlStudy. I. Vegetables and fruit. Int J Cancer 1993;53:711–719.
289. Dorant E, van den Brandt P, Goldbohm R. A prospective cohort study on Allium vegetable consump-tion, garlic supplement use, and the risk of lung carcinoma in The Netherlands. Cancer Res 1994;54:6148—6153.

Chapter 3 / Non-Nutritive Components and Cancer Risk 87
290. Dorant E, van den Brandt P, Goldbohm R. A prospective cohort study on the relationship betweenonion and leek consumption, garlic supplement use and the risk of colorectal carcinoma in TheNetherlands. Carcinogenesis 1996; 17:477–484.
291. Dorant E, van den Brandt P, Goldbohm R, Sturmans F. Consumption of onions and a reduced riskof stomach carcinoma. Gastroenterology 1996; 110:12–20.
292. Belman, S. Onion and garlic oils inhibit tumor promotion. Carcinogenesis 1983; 4:1063–1067.293. Ito Y, Nakamura Y, Nakamura Y. Suppression of aflatoxin B1- or methyl methanesulfonate induced
chromosome aberrations in rat bone marrow cells after treatment with S-methyl methanethiosul-fonate. Mutat Res 1997; 393:307–316.
294. Takada N, Kitano M, Chen T, Yano Y, Otani S, Fukushima S. Enhancing effects of organosulfurcompounds from garlic and onions on hepatocarcinogenesis in rats: association with increased cellproliferation and elevated ornithine decarboxylase activity. Jap J Cancer Res 1994; 85:1067–1072.
295. Fukushima S, Takada N, Hori T, Wanibuchi H Cancer prevention by organosulfur compounds fromgarlic and onion. J Cell Biochem Suppl 1997; 27:100–105.
296. Ali M, Bordia T, Mustafa T. Effect of raw versus boiled aqueous extract of garlic and onion onplatelet aggregation. Prostaglandins Leukot Essent Fatty Acids 1999; 60:43–47.
297. Crowell P. Prevention and therapy of cancer by dietary monoterpenes. J Nutr 1999; 129:775S–778S.298. Elegebe J, Maltzman T, Verma A, Tanner M, Elson C, Gould M. Mouse skin tumor promoting activity
of orange peel oil and D-limonene: a re-evaluation. Carcinogenesis 1986; 7:2047–2049.299. Asamoto M, Ota T, Toriyama-Baba H, Hokaiwado N, Naito A, Tsuda H. Mammary carcinomas
induced in human c-Ha-rat proto-oncogene transgenic rats are estrogen-independent, but responsiveto d-limonene treatment. Jpn J Cancer Res 2002; 93:32–35.
300. Elegbede J, Elson C, Tanner M, Qureshi A, Gould M. Regression of rat primary mammary tumorsfollowing D-limonene. J Natl Cancer Inst 1986; 76:323–325.
301. Kaji I, Tatsuta M, Iishi H, Baba M, Inove A, Kasugai M. Inhibition by D-limonene of experimentalhepatocarcinogenesis in Sprague–Dawley rats does not involve p21(ras) plasma membrane associa-tion. Int J Cancer 2001; 93:441–444.
302. Morse M. Inhibition of NNK-induced lung tumorigenesis by modulators of NNK activation. ExpLung Res 1998; 24:595–604.
303. Elegbede J, Maltzman T, Elson C, Gould M. Effects of anticarcinogenic monoterpenes on phase IIhepatic metabolizing enzymes. Carcinogenesis 1993; 14:1221–1223.
304. Maltzman T, Christov M, Gould M, Jefcoate C. Effects of monoterpenoids on in vivo DMBA-DNAadduct formation and on phase I hepatic metabolizing enzymes. Carcinogenesis 1991; 12:2081–2087.
305. Gould M. Prevention and therapy of mammary cancer by monoterpenes. J Cell Biochem Suppl1995; 22:139–144.
306. Haag J, Lindstrom M, Gould M. Limonene-induced regression of mammary carcinomas. Cancer Res1992; 52:4021–4026.
307. Mills J, Chari R, Boyer I, Gould M, Jirtle R. Induction of apoptosis in liver tumors by the monoterpeneperillyl alcohol. Cancer Res 1995; 55:979–983.
308. Elson C, Yu S. The chemoprevention of cancer by mevalonate-derived constituents of fruits and veg-etables. J Nutr 1994; 124:607–614.
309. Ruch R, Sigler K. Growth inhibition of rat liver epithelial tumor cells by monoterpenes does notinvolve Ras plasma membrane association. Carcinogenesis 1994;15:787–789.
310. Ren Z, Gould M. Modulation of small G protein isoprenylation by anticancer monoterpenes in insitu mammary gland epithelial cells. Carcinogenesis 1998; 19:827–832.
311. Ariazi E, Satomi Y, Ellis M, Haag J, Sattler C, Gould M. Activation of the ransforming growth factorβ signaling pathway and induction of cytostasis and apoptosis in mammary carcinomas heated withthe anicancer aent perillyl alcohol. Cancer Res 1999; 59:1917–1928.
312. Ariazi E, Gould M. Identifying differential gene expression in monoterpene-treated mammarycarci-nomas using subtractive display. J Biol Chem 1996; 271:29,286–29,294.
313. Kelloff G, Crowell J, Steele V, et al. Progress in cancer chemoprevention: development of diet-derived chemopreventive agents. J Nutr 2000; 130: 467S–471S.
314. Shi W, Gould M. Induction of cytostasis in mammary carcinoma cells treated with the anticanceragent perillyl alcohol. Carcinogenesis 2002; 23:131–142.
315. Wax A, Yang C, Muller M, et al. In situ detection of neoplastic transformation and chemopreventiveeffects in rat esophagus epithelium using angle-resolved low-coherence interferometry. Cancer Res2003; 63:3556–3559.

88 Part II / Cancer Prevention88 Part II / Cancer Prevention
316. Rajesh D, Howard S. Perillyl alcohol mediated radiosensitization via augmentation of the Fas pathwayin prostate cancer cells. Prostate 2003; 57:14–23.
317. Clark S, Perman S, Sahin M, Jenkins G, Elegbede J. Antileukemia activity of perillyl alcohol (POH):uncoupling apoptosis from Go/G1 arrest suggests that the primary effect of POH on Bcr/Abl-trans-formed cells is to induce growth arrest. Leukemia 2002; 16:213–222.
318. Lluma-Prevat M, Morreale J, Gregus J, et al. Effects of perillyl alcohol on melanoma in the Tprasmouse model. Cancer Epidemial Biomark Prev 2002; 11:573–579.
319. Bardon S, Foussard V, Fournel S, Loubat A. Monoterpenes inhibit proliferation of human coloncancer cells by modulating cell cycle-related protein expression. Cancer Lett 2002; 181:187–194.
320. Burke Y, Ayoubi A, Werner S, et al. Effects of the isoprenoids perillyl alcohol and farnesol on apop-tosis biomarkers in pancreative cancer chemoprevention. Anticancer Res 2002; 22:3127–3134.
321. Liston B, Nyres R, Carlton P, et al. Perillyl alcohol as a chemopreventive agent in N-nitrosomethyl-benzyamine-induced rat esophageal tumorigenesis. Cancer Res 2003; 63:2399–2403.
322. Low-Baselli A, Huber W, Kafer M, et al. Failure to demonstrate chemoprevention by the monoter-pene perillyl alcohol during early rat hepatocarcinogenesis: a cautionary note. Carcinogenesis 2000;21:1869–1877.
323. Hudes G, Szarka C, Adams A, et al. Phase I pharmacokinetic trial of perillyl alcohol (NSC 641066)in patients with refractory solid malignancies. Clin Cancer Res 2000; 6:3071–3080.
324. Ripple G, Goule M, Arzoomanian R, et al. Phase I clinical and pharmacokinetic study of perillylalcohol administered four times a day. Clin Cancer Res 2000; 6:390–396.
325. Azzol C, Miller V, Ng K, et al. A phase I trial of perillyl alcohol in patients with advanced solidtumors. Cancer Chemother Pharmacol 2003; 51:493–498.
326. Meadows S, Mulkerin D, Berlin J, et al. Phase II trial of perillyl alcohol in patients with metastaticcolorectal cancer. Int J Gastrointest Cancer 2002; 32:125–128.
327. Bailey H, Levy D, Harris L, et al. A phase II trial of daily perillyl alcohol in patients with advancedovarian cancer: Eastern Cooperative Oncology Group Study E2E96. Gynecol Oncol 2002; 85:464–468.
328. Hard GC, Whysner J. Risk assessment of D-limonene: an example of male rat-specific renal tumorigens.Crit Rev Toxicol 1994; 24:231–254.

From: Preventive Nutrition: The Comprehensive Guide for Health Professionals, Third EditionEdited by: A. Bendich and R. J. Deckelbaum © Humana Press Inc., Totowa, NJ
89
4 Dietary Supplements and Cancer RiskEpidemiological Research and Recommendations
Marian L. Neuhouser, Ruth E. Patterson,Alan R. Kristal, and Emily White
KEY POINTS
● Approximately one-half of all Americans use dietary supplements. Thousands of sup-plements of multiple combinations of vitamins, minerals, and herbs are available forpurchase, but the most commonly used supplements are multivitamins and singlesupplements of vitamins C and E, and calcium.
● Dietary supplements can provide a large proportion of total micronutrient intake formany consumers.
● Individuals who smoke should not use β-carotene supplements, as they have beenshown to increase the risk of lung cancer among smokers.
● Vitamin C supplements may reduce the risk of cancers of the gastrointestinal tract andbladder.
● Vitamin E and selenium supplements may reduce prostate cancer risk.● Calcium may reduce colon cancer risk.
1. INTRODUCTION
Millions of Americans use dietary supplements (1). Data from national nutrition surveyssuggest that approx 50% of American adults use dietary supplements (2,3), with sub-stantially higher use among certain population subgroups such as cancer survivors(4,5). One reason for the high prevalence of use is the 1994 passage of Public Law103–417, the Dietary Supplement and Health Education Act (DSHEA) (6). This legislationdiscontinued the premarket safety evaluations for ingredients used in supplements,placed the burden of proof of product safety on the US Food and Drug Administration(FDA) instead of the manufacturers, and permitted limited nutrition support statementswithout prior approval from the FDA (6). These regulations resulted in an exponentialincrease in the number and variety of dietary supplements available for over-the-counterpurchase, including those that consumers believe may prevent chronic diseases such ascancer (7,8).

90 Part II / Cancer Prevention
The medical community is conflicted about the efficacy of dietary supplements inrelation to cancer prevention. Randomized controlled trials of supplements have yieldedsome entirely unexpected findings. β-carotene, which was believed to prevent cancer,was found to increase the incidence of lung cancer in two large clinical trials (9,10).Selenium, which was hypothesized to reduce the risk of nonmelanomatous skin cancersamong persons with previous basal cell or squamous cell carcinomas, had no effect onbasal cell cancers, increased the risk of squamous and total nonmelanoma skin cancers,and reduced the risk of several other cancers (11). Selenium is now being tested in alarge clinical trial for the primary prevention of prostate cancer (12). Some observa-tional studies suggest that calcium supplements are associated with an increased risk ofprostate cancer (13,14), but others have seen a decreased risk of colon cancer (15–17).These results are juxtaposed with a 2002 report that claimed most Americans do notobtain sufficient vitamins from the diet to prevent chronic disease, including certaincancers, and advised that all adults use a daily multivitamin supplement (18,19).Conversely, the US Preventive Services Task Force concluded that there was insuffi-cient evidence to recommend the use of dietary supplements to prevent cancer (20).These opposing views from the medical community and unexpected results from inter-vention studies underscore the need for a synthesis of the research literature regardingsupplements and cancer prevention.
This chapter describes epidemiological evidence to support or refute associationsof dietary supplement use with cancer risk. As an introduction, we provide a defini-tion of dietary supplements and briefly review potential biological mechanismswhereby dietary supplements could prevent cancer. We also present methodologicalconsiderations important for understanding epidemiological studies on supplementuse and cancer risk. The majority of the chapter is devoted to synthesizing resultsfrom studies that have provided data on supplement use and cancer risk. We then discussissues relevant to this research, with emphasis on problems in assessment of supple-ment use and potential confounding factors. Finally, we provide information on newstudies in this area and give our recommendations about the use of dietary supplementsto prevent cancer.
1.1. Definition of Dietary Supplements in the United StatesDietary supplements, as defined by the DSHEA, are vitamins, minerals, herbs, or
other botanicals and amino acids that are sold as capsules, gel caps, powders, or liquidsand are intended to supplement the diet through increased dietary intake (6). Thesecategories are not mutually exclusive, as many supplements contain mixtures of 10 ormore micronutrients, herbs, and other potentially bioactive compounds. Highly fortifiedfood products and items intended as the only component of a meal (e.g., meal-replacementbeverages) are not classified as dietary supplements.
1.2. Hypothesized Mechanisms of EffectThere is extensive evidence that high consumption of plant foods is associated with
lower risk of human cancers (21–26). A comprehensive review of diet and cancerconcluded that the current evidence demonstrates a protective effect of vegetable con-sumption and, less definitively, fruit consumption against almost all major cancers (27).The mechanisms underlying these associations are complex and likely involve numerouscompounds and multiple biochemical pathways (28). Included among potential agents

Chapter 4 / Dietary Supplements and Cancer Risk 91
from plant foods are a variety of vitamins (e.g., vitamins C and E and folate) andminerals (e.g., calcium, selenium) as well as a myriad of bioactive compounds suchas carotenoids (α-carotene, β-carotene, β-cryptoxanthin, lycopene, lutein, and zeax-anthin) and flavonoids (e.g., quercetin, naringenin). The issue of whether dietarysupplements containing micronutrients and bioactive compounds found in plantfoods would be effective chemopreventive agents is of considerable public healthinterest. A particularly important point is that the bioavailability of nutrients fromsupplements has not been completely characterized; for some nutrients, the bioavail-ability is increased from supplements, whereas for others it is decreased. For example,the bioavailability of folic acid is greater in supplement form compared to naturalfood forms (e.g., fruits and vegetables), but the bioavailability of supplemental cal-cium is dependent on the form (e.g., calcium citrate is better absorbed than calciumcarbonate) (29).
Laboratory studies provide evidence for mechanisms through which micronutrientscommonly found in dietary supplements could prevent, or promote, cancer. Most atten-tion has been focused on nutrients with antioxidant properties: carotenoids, vitamins Cand E, and selenium (30–34). There are many potentially relevant functions for antiox-idants, including protection of cell membranes and DNA from oxidative damage, scav-enging and reduction of N-nitroso compounds, and serving as cofactors or structuralcomponents for enzymes whose substrates are reactive nitrogen or reactive oxygenspecies (24). Vitamin E is a nonspecific chain-breaking antioxidant, whereas vitamin Cis a strong intra- and extracellular antioxidant via its electron donor capabilities (35).Selenium is a structural component of the glutathione peroxidases, which comprise boththe intra- and extracellular antioxidant defense systems (35).
Micronutrients have preventive properties apart from their antioxidant capabilities.Vitamin A (e.g., retinol) plays a role in the differentiation of normal epithelial cells andthe maintenance of intercellular communication through gap junctions, thus repressingthe processes leading to abnormal cell replication (36). The retinoic acid receptors,RAR and RXR, regulate gene expression of numerous enzymes and proteins andretinoids upregulate the synthesis of natural killer cells and cytokines involved in theinflammatory response (37). Vitamin C enhances the immune response and connectivetissue integrity primarily through its role as a cofactor or cosubstrate for enzymesinvolved in biosynthesis of collagen, catecholamines, and mixed function oxidases(24,35). Vitamin E has strong antiproliferative effects on cultured human tumor cells,possibly mediated by its influence on important cell signaling pathways including trans-forming growth factor (TGF)-β, c-Jun, and the mitogen-activated protein kinase signalingpathway (38). Folate may be related to cancer risk because inadequate amounts ofthe vitamin may increase hypomethylation of DNA, with subsequent loss of the nor-mal controls on gene expression (39). Low folate status may also impair DNA repaircapacity, a noted risk factor for human cancers (40). Calcium could reduce colon cancerrisk by binding bile acids (41) or by regulating colorectal epithelial cell proliferation(15). Evidence is suggestive, but not conclusive, that vitamin D reduces the risk ofcolon and prostate cancer by its crucial role in maintaining calcium homeostasis butperhaps more importantly by inhibiting epithelial cell proliferation and enhancingcellular differentiation (42,43). Selenium may block the clonal expansion of earlymalignant cells by modulation of cell cycle proteins and apoptotic proteins, in additionto its antioxidant functions (44). Conversely, iron may increase risk of cancer because

92 Part II / Cancer Prevention
it enhances the growth of transformed cells and acts as a pro-oxidant, thereby increas-ing carcinogenic DNA changes and general oxidative stress (45,46). Improved under-standing of cancer biology will be needed for identifying the cellular and molecularprocesses that can be affected by vitamin and mineral supplementation.
1.3. Prevalence of Supplement Use in the United StatesIn the United States, consumption of dietary supplements is widespread and has
been increasing over the past 15 yr. Based on the 1988–1992 National Health andNutrition Examination Survey (NHANES III), 35% of males and 44% of femalesreported taking a dietary supplement in the month prior to the survey (2). The highestlevels of use were seen in females aged 50 yr and older (52–55%), those with greaterthan high school education (50%), and people living in the west (48%). Supplementuse in Caucasians (43%) was considerably greater than in African and Mexican-Americans (30%). More recent findings published after the passage of DSHEA suggestthat about one-half of adult Americans use supplements (3,47). Importantly, manyconsumers take multiple supplements either alone or in combination with prescriptionor over-the-counter medications (3). For example, in a large cohort study of dietarysupplement use and cancer risk in western Washington, 32% of the 76,072 cohortparticipants reported daily use of five or more supplements over the previous 10 yr(48). However, it is important to note that usage patterns among a group of habitualsupplement users may differ from the general population. Dietary supplementscomprise a substantial portion of American out-of-pocket medical expenditures, estimatedat more than $12 billion per year (1).
1.4. ObjectivesThis chapter presents human observational and experimental data on the use of
dietary supplements and cancer risk. To examine the role of supplement use, weincluded only studies that presented findings on multivitamins or nutrients from sup-plements, separate from food. Studies on total intake of nutrients (diet plus supple-ments) are not presented because it is not possible in such studies to separate effects ofother bioactive compounds present in foods from those of the specific micronutrientsof interest. Hereafter, we use the term “dietary supplement” to include both vitamin andmineral supplements, and we use the term “multivitamin” to refer to a one-a-day typeof multivitamin, which typically also contains minerals.
2. BACKGROUND IMPORTANT IN INTERPRETING PUBLISHEDSTUDIES
2.1. Micronutrient Intakes From Foods and Supplements Differ MarkedlyDietary supplements can provide a large proportion of total intakes of some micronu-
trients and therefore, the variability in total micronutrient intake attributable to sup-plements can overwhelm that from foods. For example, in the Women’s HealthInitiative (WHI) (49), supplement users obtained 50–70% of their total retinol, vitaminC, and vitamin E from supplements, and the median dose from supplements was gen-erally greater than that from foods (Table 1) (50). More recent data from WHI show thatantioxidant supplement use increased over time such that compared to 1993–1994, theodds of using single supplements of vitamins C and E in 1998 were 1.37 and 2.10,

Chapter 4 / Dietary Supplements and Cancer Risk 93
respectively (51). These results were remarkably similar to results among men enrolledin a large chemoprevention trial for the primary prevention of prostate cancer. Of themen enrolled in the trial, 44% reported use of a multivitamin on a regular basis andapprox 33% used high-dose single supplements of vitamin C or E. Among supplementusers, nutrient intake from supplements contributed to about 50% of total β-caroteneand folate intakes and approx 60% of vitamins A, C, and D and 90% of vitamin Eintakes (Fig. 1) (52). These data illustrate the point that for many nutrients (such as vit-amin E), the dose available from supplements (typically 200–1000 mg) is many timeslarger than can possibly be obtained from foods (about 8–10 mg) (53). Therefore, inmany observational studies of cancer risk, the highest levels of intake of many micronu-trients could only be obtained from supplements. It follows that some of the signif-icant findings on vitamin or mineral intake were actually detecting an associationbetween supplement use and cancer risk. However, because many of the earlier pub-lished studies do not present findings separately for nutrients from foods vs nutrientsfrom supplements, the studies presented here are likely a subset of those that couldaddress associations of supplements with cancer risk. Studies published within thelast 5 yr have more consistently presented results separately for nutrients from foodvs supplements.
An additional important point regarding micronutrients from food vs supplements isthat the chemical isomers in supplements may differ from those in food. This is partic-ularly important for vitamin E. For example, the principal vitamin E isomer in foods isγ-tocopherol, whereas it is almost exclusively α-tocopherol in supplements. These twoforms are purported to have distinct biological functions in relation to cancer risk. Forexample, α-tocopherol is a potent chain-breaking antioxidant because of its electrondonating capabilities, whereas γ-tocopherol may be more effective at trapping reactivenitrogen species. γ-tocopherol, but not α-tocopherol, has anti-inflammatory propertiesand both forms of the vitamin induce apoptosis (54).
Table 1Vitamin and Mineral Supplement Use Among 16,747 Participants
in the Women’s Health Initiative
Intake from Supplement Supplementsupplements intake as % intake as %
Taking among Intake of total of totalsupplement supplement from intake among intake among allcontaining users foods supplement users participants
Nutrient nutrient (%) (median) (median) (mean) (mean)
Retinol, μg 43.5 2250 439 53.6 35.2β-carotene, μg 42.6 4500 3264 37.1 24.3Vitamin C, mg 53.1 200 95 51.4 33.7Vitamin E, mg 53.2 30 7 71.3 46.7Folate, μg 44.0 400 245 41.1 26.9Calcium, mg 51.5 500 672 30.9 20.3Iron, mg 37.0 18 13 33.4 21.9Selenium, μg 32.5 20 89 11.3 7.4
From ref. 50.

94 Part II / Cancer Prevention
2.2. The Effects of Micronutrients in Multivitamins Cannot Be IsolatedFindings from investigations that measure multivitamin use are a particular analytical
challenge because one cannot isolate the potential effect of the micronutrient of interest(e.g., vitamin A) from all the other vitamins and minerals in the supplement. To inves-tigate micronutrients from supplements, study samples must have sufficient numbers ofparticipants using single supplements (e.g., a capsule containing only vitamin A) toseparate the effects of these micronutrients from multivitamin use. We suggest that find-ings on micronutrients that are seldom taken as single supplements (e.g., vitamin A andD, zinc) almost certainly reflect the use of multivitamins and are thus confounded byother constituents. Therefore, we only present observational studies on multivitaminsand the following micronutrients: vitamins C and E and calcium. These micronutrientsrepresent the most commonly used single supplements (55) and therefore, it is at leastplausible that studies of these micronutrients had enough users to isolate their effectfrom that of multivitamins. There are insufficient epidemiological data addressingherbal supplements and cancer risk to be included in this chapter.
2.3. Issues of Study Design as Related to Research on Vitamin SupplementsHere we briefly describe three study designs used in epidemiological research, with
additional comments on their strengths and weaknesses when used to study associationsof dietary supplements use with cancer risk.
2.3.1. RANDOMIZED CONTROLLED TRIALS
In randomized controlled trials (RCTs), the investigators allocate the exposure (i.e.,the supplement) at random. Participants are then followed over a period of time to
Fig. 1. Nutrient intake among supplement users (n = 9263) and complete sample(n = 15,387) of men enrolled in The Prostate Cancer Prevention Trial (52).

Chapter 4 / Dietary Supplements and Cancer Risk 95
assess the occurrence of a specified disease outcome. Assuming the sample is suf-ficiently large, the experimental design of an RCT provides a very high degree ofassurance about the validity of the results, because both known and unknown charac-teristics of the intervention and control groups will be identical, thereby eliminating thebiases of observational studies, which are described under Subheadings 2.3.2. and 2.3.3.However, RCTs are too costly to conduct multiple trials for different types of cancers,nutrients, doses, combinations, or for long periods of time. The latter point is particu-larly important because carcinogenesis is a process that takes place over a period ofmany years; therefore, short-term trials are not likely to yield definitive information. Inaddition, in many trials the participants are selected to be at high risk for the cancer ofinterest (e.g., smokers in studies of lung cancer) (9,10), limiting the generalizabilityof the findings. Finally, prevention trials cannot test an agent with known risk.
2.3.2. COHORT STUDIES
In cohort studies, the supplement use of a group of disease-free participants ismeasured. This group is then followed to assess the occurrence of multiple disease out-comes. Cohorts are attractive for studies of supplement use because they can assess theeffects of many types, doses, and combinations of supplements, with multiple cancers.Their primary limitation is that the exposure is self-selected, thus investigators mustmeasure and control for factors (such as diet or exercise) likely to confound supple-ment–cancer associations. In addition, some cohort studies have inadequate statisticalpower to test associations of supplement use with cancer, because supplement usewas relatively rare when these cohorts were established (55), although many cohortshave updated their dietary assessment strategies to include assessment of supplementuse (48,56,57).
2.3.3. CASE–CONTROL STUDIES
In case–control studies, participants are selected based on whether they do (case) ordo not (control) have cancer. The groups are then compared to see whether supplementuse varies by disease status. Selection bias can occur if supplement users are more likelythan nonusers to agree to be controls in a study. This bias is probable, because supple-ment users are more interested in health issues than nonusers (58) and, therefore, morelikely to participate in a research study. Thus, selection bias may lead to finding aprotective effect of a supplement, which may be erroneous. Recall bias can occur ifindividuals with cancer remember and report their use of supplements differently thancontrols, which can result in either an overestimation or underestimation of the associ-ation of supplement use with cancer risk.
3. REVIEW OF STUDIES ON VITAMIN SUPPLEMENTSAND CANCER RISK
3.1. MethodsHere we summarize the published literature on vitamin supplements and cancer risk,
organized by supplement type and by study design. We present results grouped by sup-plement type because an evaluation of which vitamin supplements are associated withcancer at all sites is important for the development of public health recommendationsfor the prevention of cancer as a whole. We used the MEDLINE® database of theNational Library of Medicine to identify epidemiological studies on dietary supplement

96 Part II / Cancer Prevention
use and cancer risk. We limited our review in several ways. Because few studies pre-sented findings on vitamin supplements before 1985, we searched the database from1980 forward (up to July 2003). We included a paper only if there were at least 50 cancerendpoints (cases or deaths) in adults. We did not review studies of precancerous condi-tions (e.g., colorectal adenomas or leukoplakia). We present all data on multivitaminsand the other most common single supplements: vitamins C and E and calcium.Additionally, we give data from RCTs of β-carotene and selenium because the unex-pected results from these trials have strongly influenced public health recommendationsfor these nutrients and have motivated the initiation of additional studies (12). As notedearlier, because many other vitamins and minerals (e.g., vitamin A, zinc) are generallyonly obtained from multivitamin pills, we do not present results for those nutrients.
When available, we present adjusted relative risks (and 95% confidence intervals)for high vs low levels of dietary supplement use (i.e., dose). When relative risks andconfidence intervals were not provided, we (a) present relative risks only, (b) calcu-late relative risks from published tables, or (c) provide a description of findings (e.g.,no association).
3.2. Randomized Controlled Trials of β-CaroteneTable 2 gives results from seven RCTs that examined either supplemental β-
carotene alone or β-carotene combined with other supplemental nutrients (9,10,59–66).These trials were motivated by observational epidemiology, animal experiments, andmechanistic studies of carcinogenesis. There are strong and consistent findings of pro-tective effects for fruit and vegetable consumption (primary dietary sources ofcarotenoids), total carotenoid intake, and serum carotenoid concentration on cancerincidence, in particular for cancer of the lung. However, the intervention trials of β-carotene supplements, either alone or combined with other agents, did not support pro-tective effects for incident cancer, cancer mortality, or total mortality. In two studies ofpersons at high risk of lung cancer, resulting from either smoking or asbestos exposure(The Beta-Carotene and Retinol Efficacy Trial [CARET] and The Alpha-TocopherolBeta-Carotene Cancer Prevention Study [ATBC]), β-carotene significantly increasedlung cancer incidence by 20 and 30%, respectively (9,10), whereas a trial conducted ina low-risk population of male physicians and another among female health profes-sionals found no effect of β-carotene on lung cancer incidence (63) or total cancer inci-dence and mortality (66). In CARET, β-carotene also significantly increased lungcancer mortality and cardiovascular disease (CVD) mortality (10). CARET and ATBCcontinue follow-up with study participants for cancer and mortality endpoints (GaryGoodman, personal communication, 2004) (64). ATBC reported that even after thecessation of the β-carotene intervention, the relative risk for mortality in the β-carotenearm remained elevated for up to 6 yr during the post-trial follow-up. The majority ofthe excess deaths resulted from cardiovascular events. In terms of cancer incidence inthe ATBC follow-up period, there were no statistically significant differences in can-cer incidence between β-carotene recipients and nonrecipients at any site, with theexception of a late effect of β-carotene being associated with an 88% increased risk ofcolorectal cancer (64).
A British trial in 20,536 adults investigated whether a combined supplement of β-carotene and vitamins C and E could reduce the incidence of CVD. Cancer was a sec-ondary endpoint of this trial; there were no statistically significant differences in cancerincidence or mortality at any cancer site between the treatment groups (65). In the single

Chapter 4 / Dietary Supplements and Cancer Risk 97
Table 2Randomized Controlled Trials of β-Carotene (or Combinations Containing β-Carotene)
and Risk of Cancer
Study name Relative risk for (Reference) Agent Endpoint(s) Cases supplementation
Skin Cancer 50 mg β-carotene Cancer mortality 82 0.8 (0.5–1.3)a
Prevention Study All sites(59,60) Incidence
Nonmelanoma 1,952 1.0 (0.9–1.2)a
skin cancerBasal cell 651 1.0 (0.9–1.2)a
Squamous cell 132 1.2 (0.9–1.7)a
Nutrition 15 mg β-carotene, Cancer mortalityIntervention 50 μg selenium, All sites 792 0.9 (0.8–1.0)Trials in Linxian, and 30mg Esophageal 360 1.0 (0.8–1.2)China (61) β-tocopherol Stomach 331 0.8 (0.6–1.0)
Cardia 253 0.8 (0.6–1.0)Noncardia 78 0.7 (0.5–1.1)
Nutrition Intervention High-dose (two to Cancer mortalityTrials in Linxian, three times the All sites 176 1.0 (0.7–1.3)a
China (62) Recommended Esophageal 82 0.8 (0.5–1.3)a
Daily Allowance) Stomach 77 1.2 (0.9–1.9)a
multivitamin Incidencewith minerals All sites 448 1.0 (0.9–1.2)a
and 15 mg Esophageal 251 0.9 (0.7–1.2)a
β-carotene Stomach 177 1.2 (0.9–1.6)a
Alpha-Tocopherol, 20 mg β-carotene Cancer mortalityBeta-Carotene 50 mg vitamin E Lung 564 1.2 (NS)b
Study Other 552 1.0 (NS)b
Intervention Incidenceperiod results (9) Lung 876 1.2 (1.0–1.4)
Four cancers 149–250 No associations
Alpha-Tocopherol, N/A Cancer mortalityBeta-Carotene All sites 1847Study 1993–1996 1.11 (1.03–1.21)a
Postintervention 1996–1999 1.07 (99–1.15)a
Follow-Up (64) IncidenceLung1993–1996 498 1.17 (0.98–1.39)a
1996–1999 539 0.97 (0.82–1.15)a
Colon1993–1996 92 1.06 (0.70–1.60)a
1996–1999 113 1.88 (0.82–1.15)a
All other sites1993–1999 1878 No associations
Physicians’ Health 50 mg β-carotene Cancer mortality 1.0 (0.9–1.2)a
Study (63) on alternate days All sites 766 1.0 (0.9–1.1)a
IncidenceNine cancers 50–1047 No associations

98 Part II / Cancer Prevention
trial examining skin cancer, there was no effect of β-carotene on any type of skin can-cer or cancer mortality overall (59,60). Two trials in China examined β-carotene com-bined with other micronutrients. In one trial focused on cancers of the upper digestivetract, supplementation of 15 mg of β-carotene with selenium and vitamin E resulted ina near statistically significant 20% reduction in mortality from stomach cancer (61). Ina trial of persons with esophageal dysplasia, supplementation with 15 mg of β-caroteneplus high-dose multivitamins with minerals had no effect on total, esophageal, or stom-ach cancer incidence or mortality (62). The consistent negative or null findings fromthese clinical trials of supplemental β-carotene are perplexing, given the strong and con-sistent protective effects of dietary and serum carotenoids found in observational studies(21–26,67–71) However, it is clear that high-dose β-carotene supplementation will notreduce the risk of lung cancer among smokers or generally healthy populations.
3.3. Randomized Controlled Trials of SeleniumThe Nutritional Prevention of Cancer Trial was designed to test whether selenium sup-
plementation would prevent recurrence of nonmelanoma skin cancers among personsliving in parts of the United States where soil selenium levels are low (72). Compared tothose in the placebo group, there was a 25% reduction in total cancer incidence and a 40%reduction in cancer mortality. The selenium supplementation reduced prostate and coloncancers by about half, but it statistically significantly increased squamous cell and totalnonmelanoma skin cancer by 25 and 17%, respectively, compared to placebo (11,72,73).These findings have generated considerable clinical and scientific interest in selenium’scancer preventive properties (74,75). Selenium, together with vitamin E, is currentlybeing tested in a large, randomized trial for the primary prevention of prostate cancer (12).
Table 2 (Continued)
Study name Relative risk for (Reference) Agent Endpoint(s) Cases supplementation
MRC/BHF Heart 600 mg Cancer mortalityProtection vitamin C All sites 704 1.04 (0.90–1.21)Study (65) 250 mg Incidence
vitamin E All sites 1617 0.98 (0.89–1.08)20 mg β-carotene Lung 301 1.1 (NS)
Stomach 116 1.0 (NS)Prostate 290 0.9 (NS)
Beta-Carotene and 30 mg β-carotene Cancer mortalityRetinol Efficacy and 25,000 IU Lung cancer 254 1.5 (1.1–2.0)Trial or vitamin A IncidenceCARET (10) Lung cancer 388 1.3 (1.0–1.6)
Prostate cancer 300 No associationsOther cancers 730 No associations
Women’s Health 50 mg β-carotene Cancer mortalityStudy (66) on alternate days All sites 59 1.11 (0.67–1.85)
Cancer IncidenceAll sites 747 1.03 (0.89–1.18)
aAdjusted relative risk, see original studies for details.bNonsignificant.

Chapter 4 / Dietary Supplements and Cancer Risk 99
3.4. MultivitaminsMultivitamins are the most commonly used dietary supplement. Figure 2 shows
results of 28 studies that reported associations of multivitamin use with cancer inci-dence or mortality (56,57,62,76–99). Only two studies examined all cancers sites, andneither found statistically significant results (62,76). The largest number of studiesexamined cancers of the upper digestive tract (oral cavity, pharynx, esophagus, andstomach). The single randomized controlled trial found no association with cancers ofthe upper digestive tract (62). Seven observational studies examined cancers of the oralcavity, esophagus, pharynx, and stomach (77–79,89,93,95,98,99). One found a statisti-cally significant 70% increased risk for oral cancer (89), but among the other studiesthere were no significant associations or consistent trends. The four studies of breastcancer were inconsistent: two cohort studies found a relative risk near the null value of1.0 (80,92), one case–control study found a statistically significant 30% increased risk(81), whereas another case–control study reported a nonsignificant 27% reduced risk(96). Five out of six studies of colon cancer found reduced risks (57,82,83,90,91),although only two findings of 50 and 75% reduced risks were statistically significant(83,90). Both studies of multivitamins and cervical cancer found statistically significant40 and 60% reduced risks, respectively (84,85). One study of bladder cancer found astatistically significant 39% reduced risk (86), whereas another reported no association(94). A study of prostate cancer reported no association of multivitamins with diseaserisk (97). The single study of non-Hodgkin’s lymphoma found a doubling in risk forwomen who used multivitamins over a 10-yr period but no association for men (56).
Studies of multivitamins do not support a protective effect of multivitamins for can-cers of the upper digestive tract (oral, pharyngeal, esophageal, and stomach), breast, orprostate. There is limited evidence for a protective effect for cancers of the colon, blad-der, and cervix and an increased risk of non-Hodgkin’s lymphoma in women.
3.5. Vitamin CFigure 3 gives results of the 37 studies that reported associations of supplemental vit-
amin C with cancer incidence or mortality (56,61,76–80,83–87,89,92–98,100–116).Three studies examined all cancer sites combined, and none found either large or sta-tistically significant associations (61,76,100). Several studies examined cancers of theupper digestive tract. The single RCT found no association with cancers of the upperdigestive tract (61). Of the seven observational studies, three found statistically signif-icant protective associations: a 50% reduced risk of pharyngeal (78), a 30% reduced riskof oral plus pharyngeal (79), and one found a halving in risk, but the results were sta-tistically significant only among the White study participants (98). Two studies found anonsignificant 25% reduced risk for esophageal cancers (89,95). The studies of stom-ach cancer found consistent inverse associations with vitamin C, but the confidenceintervals around the point estimates all included the null value of 1.0 (93,95,101). Thestudies of breast cancer found no statistically significant associations or consistenttrends (80,92,96,100,102–104). Of the three studies that examined lung cancer, onefound a statistically significant 60% reduced risk for men and a nonsignificant 40%increased risk for women (105), whereas results of other studies were inconsistent andnone were statistically significant (100,106). Of the studies that examined colon cancer,one found a statistically significant 40% reduced risk (83), two found nonstatistically

Fig
. 2.A
ssoc
iatio
ns o
f m
ultiv
itam
in u
se a
nd c
ance
r ri
sk.
100

Fig
. 2. (
Con
tinu
ed)
101

102 Part II / Cancer Prevention
significant reduced risks (100,107), and one found a nonstatistically significant reducedrisk for women only (108). Both studies of cervical cancer found statistically signifi-cantly reduced risks—50% for in situ (84) and 30% for invasive (85). Results from thesix studies that examined bladder cancer were inconsistent. One study found a statisti-cally significant 40% reduced risk for men only (100). Of the remaining studies, onefound a statistically significant 60% reduction (86), two found a nonsignificant 30–50%reduced risk (94,109), whereas another found a 50% reduced risk in women and a20% increased risk in men, both of which were nonstatistically significant (110). Onlyone cohort study reported a nonsignificant 25% increased risk for bladder cancer mor-tality associated with use of vitamin C supplements (113). The single study of ovariancancer reported a statistically significant halving in risk associated with use of supplemen-tal vitamin C (115). Studies of basal cell carcinoma, prostate cancer, and non-Hodgkin’slymphoma did not find any statistically significant associations with vitamin C use(56,87,97,114,116).
Studies of vitamin C do not support a protective effect for total, breast, prostate, orlung cancers. There is modest evidence for a protective effect for cancers of the upperdigestive tract, cervix, ovary, bladder, and colon.
3.6. Vitamin EFigure 4 shows results for the 34 studies that have reported associations of supple-
mental vitamin E with cancer incidence or mortality (56,61,76,79,80,83–87,89,92,93,95–97,100–104,107,108,111–115,117–121). Only three studies report associations withall cancer sites combined; two found nonstatistically significant 20% (61,100) reduc-tions in risk, and one found a nonstatistically significant 60% reduction in risk (76). Oneof these studies was an RCT that combined vitamin E with β-carotene and selenium,thus its result cannot be attributed to vitamin E alone (61). None of the seven studies ofbreast cancer found statistically significant associations or consistent trends(80,92,96,100,102–104). Of the three studies on lung cancer, only the study among non-smokers found a significant 50% reduced risk for both men and women (118).Importantly, the ATBC Study, which was a randomized trial that included one study armdesigned specifically to test whether vitamin E could prevent lung cancer in smokers,found no effect (9). However, an unexpected finding in this trial was a statistically sig-nificant 30% reduced risk for prostate cancer in the vitamin E arm of the trial, as notedearlier (117). Subsequently, a cohort study reported a modest increased risk of late-stageprostate cancer with vitamin E (121), but another cohort study and a case–control studyfound nonstatistically significant 24 and 30% reduced risks (97,116). The selenium and
Fig. 2. Results of studies of multivitamin supplementation and cancer risk: relativerisks and odds ratios with 95% confidence intervals, in which a point estimate of lessthan 1.0 indicates that multivitamins reduce the risk of cancer and a confidence intervalthat does not include 1.0 indicates that the finding was statistically significant (p < 0.05).A “❍” indicates that there was no statistically significant association, and the relativerisk or odds ratio was not presented in the original manuscript. A “*” indicates that therewas a statistically significant association, but the confidence intervals were not given inthe original manuscript. An arrow indicates that the confidence interval exceeds the scale.RCT, randomized controlled trial; COH, cohort study; C/C, case–control study.

Fig
. 3.A
ssoc
iatio
ns o
f vi
tam
in C
with
can
cer
risk
.
103

Fig
. 3.(
Con
tinu
ed)
104

Fig
. 3.
Res
ults
of
stud
ies
of v
itam
in C
sup
plem
enta
tion
and
canc
er r
isk:
rel
ativ
e ri
sks
and
odds
rat
ios
with
95%
con
fi-
denc
e in
terv
als,
in w
hich
a p
oint
est
imat
e of
less
than
1.0
indi
cate
s th
at v
itam
in C
red
uces
the
risk
of
canc
er a
nd a
con
fi-
denc
e in
terv
al th
at d
oes
not i
nclu
de 1
.0 in
dica
tes
that
the
find
ing
was
sta
tistic
ally
sig
nifi
cant
(p
<0.
05).
A“ ❍
” “
indi
cate
sth
at t
here
was
no
stat
istic
ally
sig
nifi
cant
ass
ocia
tion,
and
the
rel
ativ
e ri
sk o
r od
ds r
atio
was
not
pre
sent
ed i
n th
e or
igin
alm
anus
crip
t. A
“*”
indi
cate
s th
at t
here
was
a s
tatis
tical
ly s
igni
fica
nt a
ssoc
iatio
n, b
ut t
he c
onfi
denc
e in
terv
als
wer
e no
tgi
ven
in th
e or
igin
al m
anus
crip
t. Fi
rst c
olum
n gi
ves
type
s of
stu
dy. R
CT,
ran
dom
ized
con
trol
led
tria
l; C
OH
, coh
ort s
tudy
;C
/C, c
ase–
cont
rol s
tudy
.
105

106
Fig
. 4.A
ssoc
iatio
ns o
f vi
tam
in E
with
can
cer
risk
.

107
Fig
. 4.(
Con
tinu
ed)

108
Fig
. 4.

Chapter 4 / Dietary Supplements and Cancer Risk 109
Vitamin E Chemoprevention Trial (SELECT) is currently in progress to test whether acombination of vitamin E and selenium is effective for the primary prevention ofprostate cancer (12).
Twelve studies examined associations of vitamin E with upper digestive tract can-cers. Of the two RCTs, the trial examining the vitamin E, selenium, and β-carotenecombined found a near statistically significant 20% reduction in stomach cancer (61),whereas the other trial of vitamin E alone found a nonstatistically significant 30%increased risk (9). Of the three studies that examined oral cancer alone, or oral plus pha-ryngeal cancer, two found statistically significant protective effects ranging from a 50to 70% reduced risk (79,119). The remaining studies of upper digestive tract cancersfound either no associations (93) or nonstatistically significant protective associations(89,95,101). Of the eight studies that examined colon cancer, two observational studiesfound statistically significant protective associations of 50 and 60% reduced risks(16,83), whereas the others found only modest, nonstatistically significant inverse asso-ciations. For example, an RCT found a nonsignificant 20% reduced risk (9), and threeof four observational studies found small reduced risks in women but not men(100,108,120), whereas one reported nonsignificant reduced risks of similar magnitudefor both men and women (57). Vitamin E supplements significantly reduced ovariancancer risk by 57% and cervical cancer risk by 40 to 60% in the few studies of gyne-cological cancers (84,115). Two studies of bladder cancer found 50 to 60% reducedrisks associated with vitamin E supplementation (86,113).
Studies of vitamin E do not support an association with breast or smoking-relatedlung cancers. There is a single study of a protective effect for prostate cancer in an RCT,but the inconsistent results from observational studies suggest that waiting for theresults from SELECT will be important before public health recommendations can beformulated regarding vitamin E and prostate cancer prevention. There is modest evi-dence for protective associations of vitamin E with cancers of the upper digestive tract,colon, bladder, and the female reproductive tract.
3.7. CalciumFigure 5 gives results of 15 studies that have reported associations of calcium sup-
plementation with cancer incidence (13,16,17,83,95,111,122–129). Of the studies thatexamined colon cancer, two found a statistically significant reduced risk (122,127),
Fig. 4. Results of studies of vitamin E (AT) supplementation and cancer risk: relativerisks and odds ratios with 95% confidence intervals, in which a point estimate of lessthan 1.0 indicates that vitamin E reduces the risk of cancer and a confidence intervalthat does not include 1.0 indicates that the finding was statistically significant (p < 0.05).A “❍” “indicates that there was no statistically significant association, and the relativerisk or odds ratio was not presented in the original manuscript. A “■” indicates that therewas no statistically significant association, and only the relative risk or odds ratio is pre-sented in the original manuscript, but not the confidence intervals. A “*” indicates thatthere was a statistically significant association, but the confidence intervals were notgiven in the original manuscript. First column gives types of study. RCT, randomizedcontrolled trial; COH, cohort study; C/C, case–control study.

Fig
. 5. A
ssoc
iatio
ns o
f ca
lciu
m w
ith c
ance
r ri
sk.
110

Chapter 4 / Dietary Supplements and Cancer Risk 111
three found nonstatistically significant 20 and 30% reduced risks (16,17,83), and tworeported no association (122,128). The single report for rectal cancer found a near sta-tistically significant 24% reduced risk (123). The data on prostate cancer are inconsis-tent; one cohort study found a large (approx 300%) and statistically significantincreased risk (13) and another reported a modest 60% increased risk associated withcalcium intake (124). However, the exceptionally wide confidence intervals in onestudy (13) and the small number of cases in the highest quintile of calcium intake in theother (124) suggest that we view these findings with caution. Notably, a case–controlstudy reported no association of supplemental calcium with prostate cancer risk (126),but a later publication from that study suggested a modest association of use of calciumsupplement with increased risk for metastatic prostate cancer (126). There were non-statistically significant associations of calcium supplementation with cancers of theendometrium (111) and ovary (125) and inconsistent associations with cancers of the upperdigestive tract (95).
Studies of calcium supplementation and cancer are limited. There is modest evidencefor a protective association of calcium supplementation with colon cancer risk.
4. DISCUSSION
This chapter provides modest support for an association of dietary supplement usewith cancer risk. The strongest findings are from the RCTs that indicate β-carotene canincrease incidence of cancer in smokers, α-tocopherol can reduce risk of prostate can-cer, and selenium may influence a broad range of cancers. No supplements appear tobe definitively related to breast cancer. Cancers of the gastrointestinal tract appear to beinversely associated with all the supplements examined here, with perhaps the mostconsistent associations seen between multivitamins, vitamin E, calcium, and colon cancer,and vitamin C with both upper and lower gastrointestinal cancers.
There are a number of methodological problems in much of the epidemiologicalresearch on dietary supplement use. These limitations are important to consider beforedrawing conclusions from this chapter. Here we discuss three important issues: (a)measurement error in assessment of supplement use, (b) importance of a time-inte-grated measure, and (c) supplement use as a marker for cancer-related behavior.
4.1. Measurement Error in Assessment of Supplement UseConsiderable controversy exists regarding the validity of dietary data obtained in
epidemiological studies. However, less is known about instruments used to assess
Fig. 5. Results of studies of calcium supplementation and cancer risk: relative risks andodds ratios with 95% confidence intervals, in which a point estimate of less than 1.0indicates that calcium was associated with a reduced risk of cancer and a confidenceinterval that does not include 1.0 indicates that the finding was statistically significant(p < 0.05). A “*” indicates that there was a statistically significant association, but theconfidence intervals were not given in the original manuscript. An arrow indicates thatthe point estimate and confidence interval exceed the scale. COH, cohort study; C/C,case–control study. There were no published randomized controlled trials of the calciumsupplementation and cancer incidence of mortality.

112 Part II / Cancer Prevention
supplement use. Epidemiological studies typically use personal interviews or self-administered questionnaires to obtain information on three to five general classes ofmultivitamins and on single supplements, the dose of single supplements, and some-times frequency and/or duration of use. We have dedicated a considerable effort towardvalidating dietary supplement collection instruments.
In 1998, we published results from a validation study comparing supplement datacollected in a telephone interview and from a brief self-administered questionnaire withdata derived from a detailed in-person interview and transcription of the labels ofsupplement bottles (i.e., a gold standard) among adult supplement users in Washington(n = 104). Correlation coefficients comparing average daily supplemental vitamin andmineral intake from the interview or questionnaire to the gold standard ranged from 0.8for vitamin C to 0.1 for iron (130). These results suggest that commonly used epidemi-ological methods of assessing supplement use may incorporate significant amounts oferror in estimates of some nutrients. The effect of this type of nondifferential measurementerror is to attenuate measures of association, which could obscure many significantassociations of supplement use with cancer.
More recently, we completed a validity study of a very extensive and detailed 24-page instrument of dietary supplement use in comparison with an array of nutritionalbiomarkers. In a sample of 220 adults aged 50 to 74 yr, there were modest correla-tions of self-reported use of supplemental intake with serum concentrations of vitamin C(r = 0.29) and β-carotene (r = 0.31) and a very good correlation with serum vitamin E(r = 0.69) (131). The high correlation with serum vitamin E might suggest that thisself-administered supplement questionnaire was quite accurate, with the lower cor-relation for the other biomarkers resulting from other influences on those serummeasures.
4.2. Importance of a Time-Integrated Measure of Supplement UseInvestigators studying diet and chronic diseases usually wish to measure an individual’s
long-term nutrient intake because the induction and latent periods for these diseases arelong (21,22). However, many studies only asked participants about their current use ofvitamin and mineral supplements or only obtained information about supplement useat one point in time. Potential sources of variability in supplement use over time includechanges in (a) the type of multivitamin used, (b) number of years the supplement wastaken, (c) formulations of multivitamins or dose of single supplements, and (d) frequencyof taking supplements.
We conducted a mail survey to investigate the relationship between current andlong-term (10-yr) supplement use (n = 325 adults) (132). Estimates of current dailyintakes for supplemental micronutrients were roughly twice that of average daily intakeover the previous 10 yr. Correlations between current intake and long-term intake fromsupplements alone were 0.77, 0.75, and 0.65 for vitamins C, E, and calcium, respectively(132). This type of measurement error may also have contributed to many of the nullassociations in this chapter.
4.3. Supplement Use as a Marker for Cancer-Related BehaviorObservational studies on supplement use can be seriously compromised by confounding
information because supplement use is strongly related to other factors that affect can-cer risk. Supplement users are more likely than nonusers to be female, Caucasian, better

Chapter 4 / Dietary Supplements and Cancer Risk 113
educated, affluent, nonsmokers, light drinkers, and to consume diets lower in fat andhigher in fiber and some micronutrients (133–137). However, one set of potentialconfounding variables only recently explored are those specific to cancer risk: screening,use of potentially chemopreventive agents, and diet-related attitudes and behavior.
Demographical and health-related characteristics of high-dose supplement userswere assessed as part of a cohort study of dietary supplement users and cancer risk inwestern Washington. Among women, those who had a mammogram in the previous2 yr were 60% more likely to be users of calcium, 50% more likely to use multivita-mins, and 20 and 40% more likely to use vitamins C and E, respectively, than womenwho did not have a mammogram. Among men, those who had a prostate-specific anti-gen (PSA) test within the previous 2 yr were about 1.5 times more likely to be users ofvitamin E and 40% more likely to be users of multivitamins and vitamin C than menwho did not get a PSA test. For both men and women, there was a strong positive asso-ciation between having a sigmoidoscopy, using nonsteroidal anti-inflammatory drugsand using multivitamins and single supplements. High-dose supplement users werestatistically significantly more likely to be of normal weight, be nonsmokers, exerciseregularly, and eat five or more servings fruits and vegetables per day (48). These resultsare similar to our results from a random-digit-dial survey to monitor cancer risk behaviorin adults in Washington state (n = 1449) (58).
These relationships could confound studies of supplement use and cancer risk incomplex ways. For example, male supplement users were more likely to have had aPSA test, which is associated with increased diagnosis of prostate cancer. Thus, sup-plement users could appear to have a higher incidence of prostate cancer. However, ifearly diagnosis of prostate cancer by PSA reduces mortality, supplement users couldappear to have lower prostate cancer mortality. Health beliefs influence cancer riskthrough behavior such as diet and exercise. For example, in a previous prospectivestudy, we found that belief in a connection between diet and cancer was a statisticallysignificant predictor of changes to more healthful diets over time (138). Cohort studiesshowed that the increasing healthfulness of supplement users’ diets and other healthpractices over time could result in a spurious positive association between supplementuse and chronic disease.
In theory, control in analyses for demographics and health-related behavior adjustsfor these confounding factors. However, absence of residual confounding cannot beassured, especially if important confounding factors are unknown, not assessed, or notincluded in the analyses.
4.4. Future ResearchDespite the large number of studies reviewed in this report, the published studies
to date on dietary supplements and cancer risk are far from definitive. Research ondietary supplements must continue before public health recommendations can be for-mulated. The National Institutes of Health appears to be committed to research ondietary supplements. The 1994 DSHEA legislation mandated the creation of the Officeof Dietary Supplements (ODS) (6). The ODS supports research, sponsors workshopsand consensus conferences, and disseminates information about dietary supplements toresearchers, clinicians, and consumers. One goal of some of the ODS-funded researchis to establish a network of Dietary Supplement Research Centers (139). The ODS canbe accessed at http://dietary-supplements.info.nih.gov/. The website contains links to

114 Part II / Cancer Prevention
several of the dietary supplement consensus conferences, which have occurred overthe last several years.
Several large projects funded by the National Institutes of Health are in progress.Specifically regarding supplements, the WHI is testing other outcomes such as fracture riskand whether a combined dose of calcium and vitamin D will reduce the incidence of col-orectal cancer in postmenopausal women (49); results are expected in 2005. The SELECTStudy is underway, but results are not expected until 2014 (12). The Physicians’ HealthStudy II is a randomized trial of β-carotene, vitamin E, vitamin C, and multivitaminsamong healthy, male physicians to test whether these supplements will reduce the inci-dence of total and prostate cancers, as well as CVD and eye diseases (140). Results from aFrench randomized trial to test whether antioxidant supplements can reduce cancer inci-dence and cancer mortality are expected soon (141,142). A cohort of more than 77,000 res-idents of western Washington called VITamins And Lifestyle Study (VITAL ) is examiningassociations of dietary supplement use with cancer incidence. Recruitment was completedin 2002, and reports on specific cancers are expected within the next 5 yr (48). These andother investigations are expected to yield important data on specific dietary supplements inrelation to cancer risk that will be useful to both scientists and clinicians.
5. RECOMMENDATIONS
Increasing numbers of Americans are using dietary supplements. Health professionalsare confronted regularly with questions regarding the efficacy of these compounds.Physicians must remain informed about research showing efficacy, harm, or no effectof dietary supplements in relation to cancer prevention.
Most supplement users believe that these compounds improve their health. In a smallstudy on motivations and beliefs of supplement users (n = 104), we found that supple-ment users believed that multivitamins helped them feel better (41%), vitamin C preventscolds and/or flu (76%), and vitamin E and calcium prevent chronic disease (60–80%)(52). Many participants felt that foods could not supply adequate amounts of certainnutrients, indicating that advice to “eat a balanced diet” would not reduce their motivationto take dietary supplements.
Given the large numbers of Americans taking dietary supplements, we believe that itis important to formulate recommendations regarding their use. We feel the followingrecommendations regarding dietary supplements and cancer risk are consistent with theliterature and are responsible:
● Results of RCTs clearly indicate that cigarette smokers, or other individuals at high riskfor lung cancer, should not take β-carotene supplements. Healthy adults will receive nobenefit from β-carotene supplementation.
● The evidence regarding selenium and cancer is intriguing and biologically plausible.The formulation of specific recommendations for the public should be made after theresults are known from the RCTs currently in progress (12). Another remaining questionis that little is known about which forms of the mineral may yield the most benefits: theso-called food forms of selenium in yeast vs inorganic forms of selenium (selenate orselenite, the latter of which is relatively instable) (143). The SELECT trial is testing theorganic form of selenium as 200 μg of seleomethionine (12). If an individual choosessupplementation, we recommend that the daily dose not exceed 200 μg, which appearsto have been safe in the US intervention trial (72).
● A daily multivitamin and mineral pill is unlikely to be harmful and may be beneficial.

Chapter 4 / Dietary Supplements and Cancer Risk 115
● Vitamin C supplementation may reduce the risk of some cancers, particularly those ofthe gastrointestinal tract and the bladder. Anecdotal evidence indicates that doses ashigh as 1 g/d are safe (144). However, pharmacokinetic evidence suggests that there isa ceiling effect of oral vitamin C on plasma levels (145). Therefore, higher doses of Cmay not offer an increase in benefit.
● Studies to date suggest that vitamin E supplementation may reduce risk of prostate orcolon cancer. The toxicity of vitamin E is low, and clinical trials indicate that largedoses (200–800 mg/d) do not result in serious side effects in most adults (146).Therefore, doses in this range are acceptable.
● There is evidence that calcium supplements may reduce risk of colon cancer. The resultsfrom the WHI are expected to provide important information about calcium in relationto colon cancer risk in postmenopausal women. Given the much stronger evidence thatthis supplement can prevent osteoporosis (147), use of calcium supplements in therange of 500 to 1000 mg/d may be prudent for many Americans. Additionally, there ismodest evidence that folic acid reduces colon cancer risk (90,91). Limitations of thecurrently published studies are that many of the outcomes are intermediate endpoints(e.g., adenomas) and the fact that few individuals use single supplements of folic acid.Further research is needed in this area.
● There is little epidemiological research on other vitamin (e.g., vitamins A, B1, B2, B6,and B12), mineral (e.g., chromium, copper, magnesium, iron, zinc) and herbal supple-ments and cancer. Additionally, there is some emerging and compelling data to suggesta preventive role for vitamin D in relation to breast, prostate, and colon cancers(43,148). However, most Americans obtain vitamin D either from milk products or multi-vitamins. Despite the increasing publications of animal and in vitro studies of the potentialrole for vitamin D in carcinogenesis, few use single supplements of vitamin D; therefore,findings were not available for this report.
● Because of the risk of toxicity, we do not recommend high-dose supplementation ofvitamins A or D, particularly for women of childbearing potential (146,149). The Bvitamins (including folic acid) are relatively nontoxic (53) and, therefore, are low-risksupplements. Given the possibility that iron increases cancer risk (45), we would adviseagainst large doses of this mineral for the purposes of preventing cancer. No recommen-dations are possible regarding other minerals.
Americans need a strong message that there are many bioactive compounds in foods,especially in fruits and vegetables, which likely play an important role in the preventionof cancer and other diseases (21,22). Dietary supplements cannot replace the benefitsobtained from eating a diet high in fruit and vegetables, nor can they reverse the dam-age caused by a low-fiber, high-fat diet. Finally, health care providers should always askpatients about use of dietary supplements. As noted in this chapter, many Americans usemultiple supplements on a regular basis. Clinicians must be aware of several issuesincluding the potential for supplement–drug interactions, high monetary expendituresfor supplements, and the tempting possibility for patients to replace (or substitute)important healthy behaviors, such as maintaining or losing weight, engaging in physi-cal activity, eating a low-fat/high-fruit and -vegetable diet, and smoking cessation, witha dietary supplement pill. However, published evidence suggests that users of dietarysupplements adhere to healthy lifestyle behaviors (58). Research results that will bepublished within the next 10–15 yr will provide clinicians with information that may beuseful in formulating public health recommendations about dietary supplements andcancer prevention.

116 Part II / Cancer Prevention
REFERENCES1. Nesheim MC. What is the research base for the use of dietary supplements? Public Health Nutr
1999;2:35–38.2. Ervin RB, Wright JD, Kennedy-Stephenson JJ. Use of dietary supplements in the United States,
1988–1994. Vital Health Statistics 1999;244:1–14.3. Kaufman DW, Kelly JP, Rosenberg L, Anderson TE, Mitchell AA. Recent patterns of medication use
in the ambulatory adult population of the United States. JAMA 2002;287:337–344.4. Patterson RE, Neuhouser ML, Hedderson MM, Schwartz SM, Standish LJ, Bowen DJ. Changes in
diet, physical activity, and supplement use among adults diagnosed with cancer. J Am Diet Assoc2003;103:323-8.
5. Burstein HJ, Gelber S, Guadagnoli E, Weeks J. Use of alternative medicine by women with early-stage breast cancer. N Engl J Med 1999;340:1733–1739.
6. Public Law 103-417. 103rd Congress (October 25, 1994) Dietary Supplement and Health EducationAct of 1994.
7. Neuhouser ML, Patterson RE, Levy L. Motivations for using vitamin supplements. J Am Diet Assoc1999;99:851–854.
8. Satia-Abouta J, Kristal AR, Patterson RE, Littman AJ, Stratton KL, White E. Dietary supplement useand medical conditions—the VITAL study. Am J Prev Med 2003;24:43–51.
9. The Alpha-Tocopherol Beta Carotene Cancer Prevention Study Group. The effect of vitamin E andbeta carotene on the incidence of lung cancer and other cancers in male smokers. N Engl J Med1994;330:1029–1035.
10. Omenn GS, Goodman GE, Thornquist MD, et al. Effects of a combination of beta carotene andvitamin A on lung cancer and cardiovascular disease. N Engl J Med 1996;334:1150–1155.
11. Duffield-Lillico AJ, Slate EH, Reid ME, et al. Selenium supplementation and seconday preventionof nonmelanoma skin cancer in a randomized trial. J Natl Cancer Inst 2003;95:1411–1481.
12. Klein EA, Thompson IA, Lippman SM, et al. SELECT: The next prostate cancer prevention trial.J Urol 2001;166:1311–1315.
13. Giovannucci E, Rimm EB, Wolk A, et al. Calcium and fructose intake in relation to risk of prostatecancer. Cancer Res 1998;58:442–447.
14. Chan JM, Stampfer MJ, Ma J, Gann PH, Gaziano JM, Giovannucci EL. Dairy products, calcium,and prostate cancer risk in the Physician’s Health Study. Am J Clin Nutr 2001;74:549–554.
15. Bostick RM, Potter JD, Fosdick L, et al. Calcium and colorectal epithelial cell proliferation: a prelimi-nary randomized, double-blinded, placebo-controlled clinical trial. J Natl Cancer Inst 1993;85: 132–141.
16. Bostick RM, Potter JD, Sellers TA, McKenzie DR, Kushi LH, Folsom AR. Relation of calcium, vitaminD, and dairy food intake to incidence of colon cancer among older women. Am J Epidemiol 1993;137:1302–1317.
17. Wu K, Willett WC, Fuchs CA, Colditz GA, Giovannucci EL. Calcium intake and risk of colon cancerin women and men. J Natl Cancer Inst 2002;94:437–446.
18. Fletcher RH, Fairfield KM. Vitamins for chronic disease prevention in adults—clinical applications.JAMA 2002;287:3127–3129.
19. Fairfield KM, Fletcher RH. Vitamins for chronic disease prevention in adults—scientific review.JAMA 2002;287:3116–3126.
20. US Preventive Services Task Force. Routine vitamin supplementation to prevent cancer and cardio-vascular disease: recommendations and rationale. Ann Intern Med 2003;139:51–55.
21. Steinmetz K, Potter JD. Vegetables, fruit, and cancer. I: epidemiology. Cancer Causes Control1991;2:325–357.
22. Steinmetz K, Potter JD. A review of vegetables, fruit, and cancer. II: mechanisms. Cancer CausesControl 1991;2:427–442.
23. Block G, Patterson BH, Subar AF. Fruit, vegetables, and cancer prevention: a review of the epidemio-logic evidence. Nutr Cancer 1992;18:1–29.
24. Steinmetz K, Potter JD. Vegetables, fruit and cancer prevention: a review. J Am Diet Assoc1996;96:1027–1039.
25. Verhoeven DTH, Goldbohm RA, Van Poppel G, Verhagen H, van den Brandt PA. Epidemiologicalstudies on brassica vegetables and cancer risk. Cancer Epidemiol Biomarkers Prev 1996;5:733–748.
26. Willett WC, Trichopoulos D. Nutrition and cancer: a summary of the evidence. Cancer Causes Control1996;7:178–180.

Chapter 4 / Dietary Supplements and Cancer Risk 117
27. World Cancer Research Fund. Food, nutrition and the prevention of cancer: a global perspective.American Institute of Cancer Research, Washington DC, 1997.
28. Lampe JW. Health effects of vegetables and fruit: assessing mechanisms of action in human exper-imental studies. Am J Clin Nutr 1999;70:475s–490s.
29. Hendrich S, Fisher K. What do we need to know about active ingredients in dietary supplements?Summary of workshop discussion. Nutrition 2001;131:1387S,1388S.
30. Bertram JS, Dolonel LN, Meyskens FL. Rationale and strategies for chemoprevention of cancer inhumans. Cancer Res 1987;47:3012–3031.
31. Moon TE, Micozzi MS. Nutrition and Cancer Prevention: Investigating the Role of Micronutrients.Marcel Dekker, New York, NY, 1988.
32. Diplock AT. Antioxidant nutrients and disease prevention: an overview. Am J Clin Nutr1991;53(Suppl):189–193.
33. Weisburger JH. Nutritional approach to cancer prevention with emphasis on vitamins, antioxidants,and carotenoids. Am J Clin Nutr 1991;53(Suppl):226S–2237S.
34. Willett WC. Micronutrients and cancer risk. Am J Clin Nutr 1994;59 (Suppl):1162S–1165S.35. Dietary Reference Intakes for Vitamin C, Vitamin E, Selenium and Carotenoids. National Academy
Press, Washington DC, 2000.36. Hossian MZ, Wiliens LR, Mehta PP, Loewenstein W, Bertram JS. Enhancement of gap junctional
communication by retinoids correlates with their ability to inhibit neoplastic transformation.Carcinogenesis 1989;10:1743–1748.
37. Dietary Reference Intakes for Vitamin A, Vitamin K, Arsenic, Boron, Chromium, Copper, Iodine, Iron,Manganese, Molybdenum, Nickel, Silicon, Vanadium, and Zinc. National Academy Press, WashingtonD.C., 2001.
38. Kline K, Yu W, Sanders BG. Vitamin E: mechanisms of action as tumor cell growth inhibitors.Nutrition 2001;131:161S-163S.
39. Giovannucci E, Stampfer MJ, Colditz GA, et al. Folate, methionine, and alcohol intake and the riskof colorectal adenoma. J Natl Cancer Inst 1993;85:875–884.
40. Goode EL, Ulrich CM, Potter JD. Polymorphisms in DNA repair genes and associations with can-cer risk. Cancer Epidemiol Biomarkers Prev 2002;11:1513–1530.
41. Alberts DS, Rittenbaugh C, Story JA, et al. Randomized, double-blinded, placebo-controlled studyof effect of wheat bran fiber and calcium on fecal bile acids in patients with resected adenomatouscolon polyps. J Natl Cancer Inst 1996;88:81–92.
42. Evans SR, Schwartz AM, Shchepotin EI, Uskokovic MR, Shchepotin IR. Growth inhibitory effectsof 1,25-dihydroxyvitamin D3 and its synthetic analogue 1-alpha,25,dihydroxy-16-ene-23yne-26,27-hexafluoro-19-nor-cholecalciferol (Ro 25-6760) on a human colon cancer xenograft. Clin CancerRes 1998;4:2869–2876.
43. Giovannucci E. Dietary influences of 1,25(OH)2 vitamin D in relation to prostate cancer: a hypoth-esis. Cancer Causes Control 1998;9:567–582.
44. Ip C. Lessons from basic research in selenium and cancer prevention. J Nutr 1998;128:1845–1854.45. Bird Cl, Witte JS, Swendseid ME, et al. Plasma ferritin, iron intake, and the risk of colorectal polyps.
Am J Epidemiol 1996;144:34–41.46. Swain JH, Alekel DL, Dent SB, Peterson CT, Reddy MB. Iron indexes and total antioxidant status
in response to soy protein intake in perimenopausal women. Am J Clin Nutr 2002;76:165–171.47. Blendon RJ, DesRoches CM, Benson JM, Brodie M, Altman DE. Americans’ views on the use and
regulation of dietary supplements. Arch Intern Med 2001;161:805–810.48. White E, Patterson RE, Kristal AR, et al. VITamins And Lifestyle Cohort Study: study design and
characteristics of supplement users. Am J Epidemiol 2004;159:83–93.49. Women’s Health Initiative Study Group. Design of the Women’s Health Initiative Clinical Trial and
Observational Study. Control Clin Trials 1998; 19:61–109.50. Patterson RE, Kristal AR, Carter RA, Fels-Tinker L, Bolton MP, Agurs-Collins T. Measurement
characteristics of the Women’s Health Initiative food frequency questionnaire. Ann Epidemiol 1999;9:178–187.
51. Shikany JM, Patterson RE, Agurs-Collins T, Anderson G. Antioxidant supplement use in Women’sHealth Initiative participants. Prev Med 2003; 36:379–387.
52. Neuhouser ML, Kristal AR, Patterson RE, Goodman PT, Thompson IM. Dietary supplement usein the prostate cancer prevention trial: implications for prevention trials. Nutr Cancer 2001;39:12–18.

118 Part II / Cancer Prevention
53. Subcommittee on the Tenth Edition of the RDAs. Recommended Dietary Allowances. Vol 10th rev.ed. Washington, D.C.: Food and Nutrition Board, Commission on Life Sciences, National ResearchCouncil, 1989.
54. Giovannucci EL. γ-Tocopherol: a new player in prostate cancer prevention? J Natl Cancer Inst 2000;92:1966,1967.
55. Patterson RE, White E, Kristal AR, Neuhouser ML, Potter JD. Vitamin supplements and cancer risk:a review of the epidemiologic evidence. Cancer Causes Control 1997; 8:786–802.
56. Zhang SM, Giovannucci EL, Hunter DJ, et al. Vitamin supplement use and the risk of non-Hodgkin’slymphoma among women and men. Am J Epidemiol 2001; 153:1056–1063.
57. Wu K, Willett WC, Chan JM, et al. A prospective study on supplemental vitamin E intake and riskof colon cancer in women and men. Cancer Epidemiol Biomarkers Prev 2002; 11:1298–1304.
58. Patterson RE, Neuhouser ML, White E, Hunt JR, Kristal AR. Cancer-related behavior of vitaminsupplement users. Cancer Epidemiol Biomarkers Prev 1998;7:79–81.
59. Greenberg RE, Baron JA, Stukel TA, et al. A clinical trial of beta carotene to prevent basal-cell andsquamous-cell cancers of the skin. N Engl J Med 1990; 323:789–795.
60. Greenberg ER, Baron JA, Karagas MR, Stukel TA, Nierenberg DW, Stevens MM. Mortality associ-ated with low plasma concentration of beta carotene and the effect of oral supplementation. JAMA1996; 275:699–703.
61. Blot WJ, Li JY, Taylor PR, et al. Nutrition intervention trials in Linxian, China: supplementationwith specific vitamin/mineral combinations, cancer incidence, and disease-specific mortality in thegeneral population. J Natl Cancer Inst 1993; 85:1483–1492.
62. Li J, Taylor PR, Li B, Dawsey S, Wang G, Ershow AG. Nutrition intervention trials in Linxian,China: multiple vitamin/mineral supplementation, cancer incidence, and disease-specific mortalityamong adults with esophageal dysplasia. J Natl Cancer Inst 1993; 85:1492–1498.
63. Hennekens CH, Buring JE, Manson JE, Stampfer M, Rosner B, Cook NR. Lack of effect of long-term supplementation with beta carotene on the incidence of malignant neoplasms and cardiovascu-lar disease. N Engl J Med 1996; 334:1145–1149.
64. The Alpha-Tocopherol Beta Carotene Cancer Prevention Study Group. Incidence of cancer and mor-tality following α-tocopherol and β-carotene supplementation. A postintervention follow-up. JAMA2003; 290:476–485.
65. Heart Protection Study Collaborative Group. MRC/BHF Heart Protection Study of antioxidant vita-min supplementation in 20,536 high-risk individuals: a randomised placebo-controlled trial. Lancet2002; 360:23–33.
66. Lee IM, Cook NR, Manson JE, Buring JE, Hennekens CH. β-carotene supplementation and inci-dence of cancer and cardiovascular disease: the Women’s Health Study. J Natl Cancer Inst 1999;91:1202–1206.
67. Ito Y, Sazuki S, Yakyu K, Sasaki R, Suzuki K, Aoki K. Relationship between serum carotenoid levels andcancer death rates in the residents living in a rural area of Hokkaido, Japan. Epidemiology 1997; 7:1–8.
68. Comstock GW, Alberg AJ, Huang HY, et al. The risk of developing lung cancer associated withantioxidants in the blood: ascorbic acid, carotenoids, alpha-tocopherol, selenium, and total peroxylradical absorbing capacity. Cancer Epidemiol Biomarkers Prev 1997; 6:907–916.
69. Dorgan JF, Sowell A, Swanson CA, et al. Relationships of serum carotenoids, retinol, alpha-toco-pherol, and selenium with breast cancer risk: results from a prospective study in Columbia, Missouri(United States). Cancer Causes Control 1998; 9:89–97.
70. Michaud DS, Feskanich D, Rimm EB, et al. Intake of specific carotenoids and risk of lung cancer in2 prospective US cohorts. Am J Clin Nutr 2000; 72:990–997.
71. Feskanich D, Ziegler RG, Michaud DS, et al. Prospective study of fruit and vegetable consumptionand risk of lung cancer among men and women. J Natl Cancer Inst 2000; 92:1812–1823.
72. Clark LC, Combs GF, Turnbull BW, et al. Effects of selenium supplementation for cancer preven-tion in patients with carcinoma of the skin. A randomized controlled trial. Nutritional Prevention ofCancer Study Group. JAMA 1996; 276:1957–1963.
73. Duffield-Lillico AJ, Reid ME, Turnbull BW, et al. Baseline characteristics and the effect of seleniumsupplementation on cancer incidence in a randomized clinical trial: a summary report of theNutritional Prevention of Cancer Trial. Cancer Epidemiol Biomarkers Prev 2002; 11:630–639.
74. Platz EA, Helzlsour KJ. Selenium, zinc and prostate cancer. Epidemiologic reviews 2001; 23:93–101.75. Helzlsouer KJ, Huang H-Y, Alberg AJ, et al. Association between α-tocopherol, γ-tocopherol, selenium
and subsequent prostate cancer. J Natl Cancer Inst 2000; 92:2018–2023.

Chapter 4 / Dietary Supplements and Cancer Risk 119
76. Losonczy KG, Harris TB, Havlik RJ. Vitamin E and vitamin C supplement use and risk of all-causeand coronary heart disease mortality in older persons: the established populations for epidemiologicstudies of the elderly. Am J Clin Nutr 1996; 64:190–196.
77. Brown LM, Swanson CA, Gridley G, Swanson GM, Schoenberg JB, Greenberg RS. Adenocarcinomaof the esophagus: role of obesity and diet. J Natl Cancer Inst 1995; 87:104–109.
78. Rossing MA, Vaughan TL, McKnight B. Diet and pharyngeal cancer. Int J Cancer 1989; 44:593–597.79. Gridley G, McLaughlin JK, Block G, Blot WJ, Gluch M, Fraumeni J. Vitamin supplement use and
reduced risk of oral and pharyngeal cancer. Am J Epidemiol 1992; 135:1083–1092.80. Hunter DF, Manson JE, Colditz GA, Stampfer MJ, Rosner B, Hennekens CH. A prospective study
of the intake of vitamins C, E, and A and the risk of breast cancer. N Engl J Med 1993; 329:234–240.
81. Ewertz M, Gill C. Dietary factors and breast-cancer risk in Denmark. Int J Cancer 1990; 46:779–784.82. Martinez ME, Giovannucci EL, Colditz GA, et al. Calcium, vitamin D, and the occurrence of col-
orectal cancer among women. J Natl Cancer Inst 1996; 88:1375–1382.83. White E, Shannon JS, Patterson RE. Relationship between vitamin and calcium supplement use and
colon cancer. Cancer Epidemiol Biomarkers Prev 1997; 6:769–774.84. Ziegler RG, Jones CH, Brinton LA, Norman SA, Mallin K, Levin RS. Diet and the risk of in situ
cervical cancer among white women in the United States. Cancer Causes Control 1991; 2:17–29.85. Ziegler RG, Brinton LA, Hamman RF, Lehman HF, Levin RS, Mallin K. Diet and the risk of inva-
sive cervical cancer among white women in the United States. Am J Epidemiol 1990; 132:432–445.86. Bruemmer B, White E, Vaughan TL, Cheney CL. Nutrient intake in relation to bladder cancer among
middle-aged men and women. Am J Epidemiol 1996; 144:485–495.87. Hunter DJ, Colditz GA, Stampfer MJ, Rosner B, Willett WC, Speizer FE. Diet and risk of basal cell
carcinoma of the skin in a prospective cohort of women. Ann Epidemiol 1992; 2:231–239.88. Kirkpatrick CS, White E, Lee JAH. Case-control study of malignant melanoma in Washington State.
II. Diet, alcohol, obesity. Am J Epidemiol 1994; 139:869–880.89. Barone J, Tailoi E, Hebert JR, Wynder EL. Vitamin supplement use and risk for oral and esophageal
cancer. Nutr Cancer 1992; 18:31–41.90. Giovannucci E, Stampfer M, Colditz GA. Multivitamin use, folate and colon cancer in women in the
Nurses’ Health Study. Ann Intern Med 1998; 129:517–524.91. Fuchs CS, Willett WC, Colditz GA, et al. The influence of folate and multivitamin use on the familial
risk of colon cancer in women. Cancer Epidemiol Biomarkers Prev 2002; 11:227–234.92. Zhang S, Hunter DJ, Forman M. Dietary carotenoids and vitamins A, C and E and risk of breast cancer.
J Natl Cancer Inst 1999; 91:547–556.93. Jacobs EJ, Connell CJ, McCullough ML, et al. Vitamin C, vitamin E, and mutivitamin supplement
use and stomach cancer mortality in the Cancer Prevention Study II cohort. Cancer EpidemiolBiomarkers Prev 2002; 11:35–41.
94. Michaud DS, Spiegelman D, Clinton SK, Rimm EB, Willett WC, Giovannucci E. Prospective studyof dietary supplements, macronutrients, and risk of bladder cancer in US men. Am J Epidemiol 2000;152:1145–1153.
95. Mayne ST, Risch HA, Dubrow R, et al. Nutrient intake and risk of subtypes of esophageal and gas-tric cancer. Cancer Epidemiol Biomarkers Prev 2001; 10:1055–1062.
96. Moorman PG, Ricciuti MF, Millikan RC, Newman B. Vitamin supplement use and breast cancer ina North Carolina population. Pub Health Nutr 2001; 4:821–827.
97. Kristal AR, Stanford LL, H CJ, Wicklund K, Patterson RE. Vitamin and mineral supplement use isassociated with reduced risk of prostate cancer. Cancer Epidemiol Biomarkers Prev 1999; 8:887–892.
98. Brown LM, Swanson CA, Gridley G, et al. Dietary factors and the risk of squamous cell esophagealcancer among black and white men in the United States. Cancer Causes Control 1998; 9:467–474.
99. Farrow DC, Vaughan TL, Berwick M, Lynch CF, Swanson GM, Lyon JL. Diet and nasopharyngealcancer in a low-risk population. Int J Cancer 1998; 78:675–679.
100. Shibata A, Paganini-Hill A, Ross PK, Henderson BE. Intake of vegetables, fruits, beta-carotene, vit-amin C and vitamin supplements and cancer incidence among the elderly: a prospective study. BrJ Cancer 1992; 66:673–679.
101. Hansson L, Nyren O, Bergstrom R, Wolk A, Lindgren A, Baron J. Nutrients and gastric cancer risk.A population-based case control study in Sweden. Int J Cancer 1994; 57:638–644.
102. Rohan TE, Howe GR, Friedenreich CM, Jain M, Miller AB. Dietary fiber, vitamins A, C, and E, andrisk of breast cancer: a cohort study. Cancer Causes Control 1993; 4:29–37.

120 Part II / Cancer Prevention
103. Kushi LJ, Fee RM, Sellers TA, Zheng W, Folsom AR. Intake of vitamins A, C, E and post-menopausal breast cancer. Am J Epidemiol 1996; 144:165–174.
104. Freudenheim JL, Marshall JR, Vena JE, Laughlin R, Brasure JR, Swanson MK. Premenopausalbreast cancer risk and intake of vegetables, fruits, and related nutrients. J Natl Cancer Inst 1996;88:340–348.
105. Le Marchand L, Yoshizawa CN, Kolonel LN, Hankin JH, Goodman MT. Vegetable consumption andlung cancer risk: a population-based case-control study in Hawaii. J Natl Cancer Inst 1989;81:1158–1164.
106. Jain M, Burch JD, Howe GR, Risch HA, Miller AB. Dietary factors and risk of lung cancer: resultsfrom a case-control study, Toronto, 1981–1985. Int Cancer 1990; 86:33–38.
107. Bostick RM, Potter JC, McKenzie DR, Sellers TA, Kushi LH, Steinmetz KA. Reduced risk of coloncancer with high intake of vitamin E: the Iowa Women’s Health Study. Cancer Res 1993;53:4230–4237.
108. Wu HA, Paganini-Hill A, Ross RK, Henderson BE. Alcohol, physical activity and other risk factorsfor colorectal cancer: a prospective study. Br J Cancer 1987; 55:687–694.
109. Steineck G, Hagman U, Gerhardsson M, Norell SE. Vitamin A supplements, fried foods, fat andurothelial cancer, A case-referent study in Stockholm in 1985-87. Int J Cancer 1990; 45:1006–1011.
110. Nomura AMY, Kolonel LN, Hankin JH, Yoshizawa CN. Dietary factors in cancer of the lower uri-nary tract. Int J Cancer 1991; 48:199–205.
111. Barbone F, Austin H, Partridge EE. Diet and endometrial cancer: a case-control study. Am J Epidemiol1993; 137:393–409.
112. Jacobs EJ, Connell CJ, Patel AV, et al. Vitamin C and vitamin E supplement use and colorectal cancermortality in a large American Cancer Society cohort. Cancer Epidemiol Biomarkers Prev 2001; 10:17–23.
113. Jacobs EJ, K HA, Briggs PJ, et al. Vitamin C and vitamin E supplement use and bladder cancermortality in a large cohort of US men and women. Am J Epidemiol 2002; 156:1002–1010.
114. Fung TT, Hunter DJ, Spiegelman D, Colditz GA, Speizer FE, Willett WC. Vitamins and carotenoidsintake and the risk of basal cell carcinoma of the skin in women (United States). Cancer CausesControl 2002; 13:221–230.
115. Fleischauer AT, Olson SH, Mignone L, Simonsen N, Caputo TA, Harlap S. Dietary antioxidants,supplements, and risk of epithelial ovarian cancer. Nutr Cancer 2001; 40:92–98.
116. Schuurman A, Goldbohm RA, Brants HAM, van den Brandt PA. A prospective cohort study onintake of retinol, vitamins C and E, and carotenoids and prostate cancer risk (Netherlands). CancerCauses Control 2002; 13:573–582.
117. Heinonen OP, Albanes D, Virtamo J, et al. Prostate cancer and supplementation with β-tocopheroland β-carotene: incidence and mortality in a controlled trial. J Natl Cancer Inst 1998; 90:440–446.
118. Mayne ST, Janerich DT, Greenwald P, Chorost S, Tucci C, Zaman MB. Dietary beta-carotene andlung cancer risk in US nonsmokers. J Natl Cancer Inst 1994; 86:33–38.
119. Day GL, Blot WJ, Austin DF, Bernstein L, Greenberg RS, Preston-Martin S. Racial differences inrisk of oral and pharyngeal cancer: alcohol, tobacco, and other determinants. J Natl Cancer Inst1993; 88:340–348.
120. Slattery ML, Edwares SL, Anderson K, Caan B. Vitamin E and colon cancer: Is there an association?Nutr Cancer 1998; 30:201–206.
121. Chan J, Stampher M, Ma J, Rimm EB, Willett W, Giovannucci EL. Supplemental vitamin E intakeand prostate cancer risk in a large cohort of men in the United States. Cancer Epidemiol BiomarkersPrev 1999; 8:893–899.
122. Kampman E, Goldbohm RA, van den Brandt PA, van’t Veer P. Fermented dairy products, calcium,and colorectal cancer in the Netherlands cohort study. Cancer Res 1994; 54:3186–3190.
123. Zheng W, Anderson KE, Kushi LH, et al. A prospective cohort study of intake of calcium, vitaminD, and other micronutrients in relation to incidence of rectal cancer among postmenopausal women.Cancer Epidemiol Biomarkers Prev 1998; 7:221–225.
124. Rodriguez C, McCullough M, Mondul A, et al. Calcium, dairy products, and risk of prostate cancerin a prospective cohort of United States men. Cancer Epidemiol Biomarkers Prev 2003; 12:597–603.
125. Goodman MT, Wu AH, Tung K-H, et al. Association of dairy products, lactose, and calcium with therisk of ovarian cancer. Am J Epidemiol 2002; 156:148-–157.
126. Kristal A, Cohen JH, Qu P, Stanford JL. Associations of energy, fat, calcium and vitamin D withprostate cancer risk. Cancer Epidemiol Biomarkers Prev 2002; 11:719–725.

Chapter 4 / Dietary Supplements and Cancer Risk 121
127. McCullough ML, Robertson AS, Rodriguez C, et al. Calcium, vitamin D, dairy products, and risk ofcolorectal cancer in the Cancer Prevention Study II Nutrition Cohort (United States). Cancer CausesControl 2003; 14:1–12.
128. Marcus PM, Newcomb PA. The association of calcium and vitamin D, and colon and rectal cancerin Wisconsin women. Int J Epidemiol 1998; 27:788–793.
129. Shin M-Y, Holmes MD, Hankinson SE, Wu K, Colditz GA, Willett WC. Intake of dairy products,calcium, and vitamin D and risk of breast cancer. 2002; 94:1301–1311.
130. Patterson RE, Kristal AR, Levy L, McLerran D, White E. Validity of methods used to assess vitaminand mineral supplement use. Am J Epidemiol 1998; 148:643–649.
131. Satia-Abouta J, Patterson RE, King IB, et al. Reliability and validity of self-report of vitamin andmineral supplement use in the VITamins and Lifestyle Study. Am J Epidemiol 2003; 157:944–954.
132. Patterson RE, Neuhouser ML, White E, Kristal AR, Potter JD. Measurement error from assessinguse of vitamin supplements at one point in time. Epidemiology 1998; 9:567–569.
133. Block G, Cox G, Madans J, Schreiber GB, Licitra L, Melia N. Vitamin supplement use, by demo-graphic characteristics. Am J Epidemiol 1988; 127:297–309.
134. Subar AF, Block C. Use of vitamin and mineral supplements: demographics and amounts of nutri-ents consumed. Am J Epidemiol 1990; 132:1091–1101.
135. Slesinski MJ, Subar AF, Kahle LL. Dietary intake of fat, fiber and other nutrients is related to theuse of vitamin and mineral supplements in the United States: The 1992 National Health InterviewSurvey. J Nutr 1996; 126:3001–3008.
136. Lyle BJ, Mares-Perlman JA, Klein BEK, Klein R, Greger JL. Supplement users differ from nonusersin demographic, lifestyle, dietary and health characteristics. J Nutr 1998; 128:2355–2362.
137. Hoggatt KJ, Bernstein L, Reynolds P, et al. Correlates of vitamin supplement use in the UnitedStates: data from the California Teachers Study cohort. Cancer Causes Control 2002; 13:735–740.
138. Patterson RE, Kristal AR, White E. Do beliefs, knowledge, and perceived norms about diet and can-cer predict dietary change? Am J Pub Health 1996; 86:1394–1400.
139. Costello RB, Coates P. In the midst of confusion lies opportunity: fostering quality science in dietarysupplement research. J Am Coll Nutr 2001; 20:21–25.
140. Christen WG, Gaziano JM, Hennekens CH. Design of Physicians’ Health Study II—a randomizedtrial of beta-carotene, vitamins E and C, and multivitamins, in prevention of cancer, cardiovasculardisease, and eye disease, and review of results of completed trials. Ann Epidemiol 2000; 10:125–134.
141. Hercberg S, Preziosi P, Brianςon S, et al. A primary prevention trial using nutritional doses of antiox-idant vitamins and minerals in cardiovascular diseases and cancers in a general population: TheSU.VI.MAX Study–design, methods, and participant characteristics. Control Clin Trials 1998;19:336–351.
142. Hercberg S, Galan P, Preziosi P, et al. The SU.VI.MAX trial on antioxidants. IARC Sci Pub 2002;156:451–455.
143. Patterson BH, Levander OA. Naturally occurring selenium compounds in cancer chemopreventiontrials: a workshop summary. Cancer Epidemiol Biomarkers Prev 1997; 6:63–69.
144. Diplock AT. Safety of antioxidant vitamins and beta-carotene. Am J Clin Nutr 1995; 62:1510S–1516S.145. Blanchard J, Tozer TN, Rowland M. Pharmacokinetic perspectives in megadoses of ascorbic acid.
Am J Clin Nutr 1997; 66:1165–1170.146. Kaegi E. Unconventional therapies for cancer: 5. Vitamins A, C and E. CMAJ 1998; 158:1483–1488.147. Nordin BE. Calcium and osteoporosis. Nutrition 1997; 13:664–686.148. Holick MF. Vitamin D: the underappreciated D-lightful hormone that is important for skeletal and
cellular health. Curr Opin Endocrinol Diabetes 2002; 9:87–98.149. Marriott B. Vitamin D supplementation: a word of caution. Ann Intern Med 1997; 127:231–233.


From: Preventive Nutrition: The Comprehensive Guide for Health Professionals, Third EditionEdited by: A. Bendich and R. J. Deckelbaum © Humana Press Inc., Totowa, NJ
123
5 Soy Consumptionand Cancer PreventionA Critical Review
Jin-Rong Zhou and John W. Erdman, Jr.
KEY POINTS
● Soybeans contain several potential anticancer components.● Epidemiological studies suggest that consumption of soy foods is associated with lower
risk of breast and prostate cancer.● The epidemiological evidence for the association of soy food consumption and reduced
risk of other cancers is not consistent.● Animal studies generally support the conclusion that some components in soy prevent
the development and progression of breast, prostate, and colorectal cancers.● In animal studies, it appears that soy may act synergistically with bioactive components
from other foods (e.g., tea) to reduce breast and prostate cancer.● There are several possible mechanisms by which soy bioactives may reduce cancer risk.
1. INTRODUCTION
Cancer chemoprevention refers to the reduction of cancer incidence by administrationof agents or drugs that inhibit, reverse, or retard the cancer process. The role of soy-based foods or soy-based products as potential cancer chemopreventive agents hasbeen an increasingly important subject of research. Since publication of the previousreview on soy and cancer prevention in the second edition of Preventive Nutrition,more epidemiological investigations have been conducted. In addition, basic labora-tory investigations using both in vitro and animal models have been conducted exten-sively to identify the bioactive components in soybeans, determine the efficacy ofthese components in prevention and/or treatment of cancer, and elucidate the under-lying mechanisms of action by which these bioactive components exert their preven-tive activities. Although most laboratory studies have supported the role of soyproducts in prevention of certain forms of cancer, some studies suggest potentialadverse effects of some soy components. A typical example is that animal studiessuggest that soy isoflavone genistein stimulated the growth of estrogen-dependent MCF-7

124 Part II / Cancer Prevention
breast tumor in ovariectomized animals, which raises concerns that women withestrogen-dependent breast cancer (BRCA) or at high risk of developing BRCA shouldavoid consumption of soy-based products. These negative studies have particularlyattracted the attention of the public and the scientific community. Many scientists andhealth professionals experience a dilemma in explaining the results and making anyrecommendations to the public and to their patients.
The objectives of this chapter are to update epidemiological and in vivo experi-mental studies published in the past several years regarding soy products and cancerprevention, to discuss possible in vivo mechanisms based on animal studies, and todraw some conclusions and recommendations based on the totality of the evidence.Special emphasis is placed on discussing, and hopefully clarifying, the role of soyproducts (especially genistein) in estrogen-dependent breast tumors.
2. THE ROLE OF SOY PRODUCTS IN CANCER PREVENTION
In the past several years, investigation of the role of soy products in prevention ofBRCA, prostate cancer (CaP), and colorectal cancer (CRC) continues to be one of thepriorities in cancer prevention research. In addition, data have emerged regarding soyproducts and prevention of other forms of cancer. In particular, more animal studieshave been conducted to identify the bioactive ingredients in soy products to evaluate thein vivo efficacy. This section provides a concise but critical review of the scientific datapublished in the past several years.
2.1. Soy and Breast Cancer Prevention: Epidemiological StudiesThe role of soy products and soy bioactive components in BRCA prevention has been
studied extensively. The association between soy product consumption and reduced riskof BRCA originated from the perspective of international investigations. Risk of BRCAvaries widely, with about a sixfold difference between the highest risk (typically seenin women from the United States and western Europe) and the lowest, usually found inwomen from China and Japan (1). Asian women born in the United States or in Westernnations have similar BRCA incidence rates as women who reside in those areas (2).Japanese women who move to the United States tend to have higher incidence rates ofBRCA than Japanese women who remain in Japan (2). These data have led researchersto believe that environmental factors, such as diet and chemical exposures, play a largerole in the development of BRCA.
This association has been further tested in epidemiological investigations and in vivoanimal studies. Previous studies generally support the association between increasedconsumption of soy products and reduced risk of BRCA (3). In the past 5–6 yr, datafrom both epidemiological investigations and experimental studies have continued toemerge. The epidemiological studies on soy products and BRCA that have taken placesince 1997 are summarized in Table 1. Among recent descriptive epidemiological stud-ies, intake of soy products was not significantly associated with the risk of invasiveBRCA in California (4), the risk of BRCA in women of Hiroshima and Nagasaki (twocities ruined by atomic bombs during the World War II in Japan) (5), or the risk ofBRCA mortality in an international ecological study (6). One population-based study inJapan indicated that consumption of miso soup or soy isoflavones was significantlyassociated with reduced risk of BRCA (7).

Chapter 5 / Soy Consumption and Cancer Prevention 125
Table 1Epidemiological Studies of Soy Consumption and BRCA Risk
Result
Study (Reference) Population Significancea Association
Descriptive studiesHorn-Ross et al., Cohort study, 111,526 subjects, None Phytoestrogens and
2002 (4) 711 cases (invasive BRCA), risk of invasive BRCACalifornia
Key et al., 34,759 women in Hiroshima None Tofu and BRCA risk1999 (5) and Nagasaki,
Japan, 427 casesNagata et al., International ecological study None Soy protein and the
2000 (6) mortality of BRCAYamamoto et al., Population-based, 21,852 — Miso soup and BRCA risk
2003 (7) women in Japan, 179 cases — Isoflavones intake andBRCA risk
Case control studiesDai et al., Asian population, 1459 cases, — Soyfood and risk of
2001 (16) 1556 age-matched controls ER+/PR+ BRCANone Soyfood and BRCA risk
in regular soy eatersDai et al., Chinese population in Shanghai, — Urinary isoflavone levels
2002 (11) China, 250 cases, 250 controls and BRCA riskDen Tonkelaar Postmenopausal women in None Urinary excretion of
et al., 2001 (8) Netherlands, 88 cases, genistein and BRCA268 controls risk
Horn-Ross et al., Multiethnic population, 1326 None Phytoestrogens and 2001 (9) cases, 1657 controls BRCA risk
— Soymilk and soy burgersand BRCA risk
Ingram et al., 144 cases, 144 controls, — Urinary equol levels and 1997 (12) Australia BRCA risk
— Urinary enterolactone andBRCA risk
Murkies et al., Postmenopausal women in — Urinary daidzein and2000 (10) Australia, 18 cases, BRCA risk
20 controls None Urinary genistein andBRCA risk
Shu et al., Asian population, 1459 cases, — Tofu during adolescence2001 (13) 1556 age-matched controls and BRCA risk in both
pre- and postmeno-pausal women
— Soy food (excluding tofu)during adolescence andBRCA risk in both pre- and postmenopausalwomen
(Continued)

126 Part II / Cancer Prevention
Case–control studies demonstrated more consistent association between soy intake andBRCA risk. The studies were conducted in different regions and different populationsaround the world, and the soy consumption was assessed by dietary intake of soy-basedfood, soy isoflavones and/or isoflavone secretion. Soy consumption, measured as foodintake or urinary excretion of soy isoflavones, was associated with either a nonsignificanteffect (8–10) or significant reduction of risk of BRCA (10–15) and both estrogen receptor(ER)-positive and progesterone receptor-positive BRCA (16). Consumption of some soyproducts such as tofu (14), especially during adolescence (13), or soymilk and soy burgers(9) was also associated with a significant reduction of BRCA risk. There has been no reportregarding epidemiological studies of an adverse effect of soy consumption on BRCA risk.
Increased mammographic density has been suggested to be a predictor of BRCA risk.In a pilot intervention study, premenopausal women were randomized to receive eithera daily 100-mg supplement of isoflavone or a placebo over 12 mo. Isoflavone supple-mentation did not significantly change either the size of the dense areas or the percentdensities (17). These results suggest that isoflavones do not exert an estrogenic effectsimilar to hormone replacement therapy on mammographic density.
2.2. Soy and Breast Cancer Prevention: Animal StudiesIn addition to promising epidemiological studies, animal studies using different animal
models have shown that supplementation of soy bioactive components have preventiveactivities in BRCA carcinogenesis, progression, and/or metastasis, as shown in Table 2.Chemical carcinogens such as 7,12-dimethylbenz[a]anthracene (DMBA), N-methyl-N-nitrosourea (MNU), N-nitroso-N-methylurea (NMU) or 2-amino-1-methyl-6-phenylim-idazol[4,5-b]pyridine (PhIP) were used to induce mammary carcinogenesis in animals.Tumor incidence, multiplicity, and/or latency were used as endpoint parameters.Although some studies did not show significant effects of soy components such as soy
Table 1 (Continued)
Result
Study (Reference) Population Significancea Association
Wu et al., 501 cases, 594 controls, — Tofu and BRCA risk2002 (14) Asian- American women Soy food during adult life
in California and BRCA risk— Soy food during both
adolescence and adultand BRCA risk
Zheng et al., Chinese women in China, — Urinary excretion of iso-1999 (15) 60 cases, 60 controls flavones and BRCA risk
Clinical intervention studiesMaskarinec et al., Double-blinded, randomized, None Isoflavones and mammo-
2003 (17) placebo- controlled, iso- graphic density of breastflavones and mammographicsupplements (100 mg)and placebo
a—significant negative association, p < 0.05; None, no significant association.BRCA; breast cancer.

Tab
le 2
Ani
mal
stu
dies
of
soy
cons
umpt
ion
and
brea
st c
ance
r (B
RC
A)
prev
enti
on
Res
ults
Stud
y (R
efer
ence
)A
nim
al m
odel
sTr
eatm
ent
grou
psSi
gnifi
canc
eA
ssoc
iati
on
Che
mic
al-i
nduc
edA
ppel
t et a
l.,SD
rat
s, D
MB
ASP
I w
ith th
ree
Non
e SP
I/is
ofla
vone
s an
d tu
mor
1999
(18
)is
ofla
vone
leve
lsin
cide
nce/
mul
tiplic
ityB
adge
r et
al.,
Fem
ale
SD r
ats,
SPI
(20%
)—
SPI
and
tum
or in
cide
nce
2001
(26
)D
MB
AC
ohen
et a
l.,F3
44 r
ats,
NM
USP
I (1
0,20
%)
Isof
lavo
ne-
Non
eSo
y di
ets
(pro
tein
or
isof
lavo
nes)
2000
(19
)de
plet
ed S
PI (
10,2
0%)
and
tum
or in
cide
nce,
late
ncy,
mul
tiplic
ity o
r vo
lum
eC
onst
antin
ou e
t al.,
SD r
ats,
DM
BA
Gen
iste
in (
0.02
%),
dai
dzei
n—
SPI
and
tum
or m
ultip
licity
20
01 (
20)
(0.0
2%),
gen
iste
in a
ndN
one
SPI
and
tum
or la
tenc
y or
tum
or in
cide
nce
daid
zein
(0.
01%
eac
h),
SPIs
(no
rmal
or
depl
eted
—D
aidz
ein
and
tum
or m
ultip
licity
leve
ls o
f is
ofla
vone
s)N
one
Isof
lavo
nes
and
tum
or la
tenc
y or
inci
denc
eFr
itz e
t al.,
SD r
ats,
DM
BA
Gen
iste
in (
0.00
25%
,—
Gen
iste
in a
nd tu
mor
inci
denc
e19
98 (
25)
0.02
5%)
Non
eG
enis
tein
and
tum
or la
tenc
yG
allo
et a
l.,SD
rat
s, D
MB
ASo
y ex
trac
t con
tain
ing
Non
eSo
y an
d tu
mor
inci
denc
e 20
01 (
21)
12%
isof
lavo
nes
and
—So
y (0
.7%
) an
d pe
rcen
t of
poor
ly35
% s
apon
ins
(0.3
5,0.
7%)
diff
eren
tiate
d tu
mor
sG
otoh
et a
l.,SD
rat
s, N
MU
Pow
dere
d so
ybea
n —
Soyb
ean
(10%
) an
d tu
mor
mul
tiplic
ity19
98 (
27)
(2, 1
0%),
Bio
chan
in A
—B
ioch
anin
Aan
d tu
mor
mul
tiplic
ity(0
.001
,0.0
05%
)—
Bio
chan
in A
(0.0
05%
) an
d tu
mor
inci
denc
eH
akka
k et
al.,
SD r
ats,
DM
BA
SPI
(20%
)—
SPI
and
tum
or in
cide
nce
in F
2 ge
nera
tion
2000
(24
)N
one
SPI
and
tum
or m
ultip
licity
Lam
artin
iere
et a
l.,SD
rat
s, D
MB
AD
aidz
ein
(0.0
25%
)N
one
Dai
dzei
n an
d tu
mor
inci
denc
e20
02 (
22)
(Con
tinu
ed)
127

Tab
le 2
(C
ontin
ued)
Res
ults
Stud
y (R
efer
ence
)A
nim
al m
odel
sTr
eatm
ent
grou
psSi
gnifi
canc
eA
ssoc
iati
on
Oht
a et
al.,
SD r
ats,
PhI
PFe
rmen
ted
soym
ilk(1
0%),
—Fe
rmen
ted
soym
ilk a
nd tu
mor
2000
(28
)so
y is
ofla
vone
mix
ture
mul
tiplic
ity, v
olum
e an
d in
cide
nce
(0.0
2,0.
04%
) in
a—
Soy
isof
lavo
ne m
ixtu
rehi
gh-
fat d
iet
and
tum
or m
ultip
licity
Zai
zen
et a
l.,F3
44 r
ats,
MN
USP
I (2
0%)
Soy
hypo
coty
ls+
Soy
diet
s an
d tu
mor
late
ncy
2000
(23
)(1
.5 a
nd 5
.0%
)N
one
Soy
diet
s an
d tu
mor
inci
denc
eT
rans
geni
cJi
n et
al.,
MM
TV
- ne
u/E
rbB
-2ge
nist
ein(
0.02
5%),
dai
dzei
n+
Gen
iste
in, d
aidz
ein,
or
isof
lavo
ne20
02 (
29)
tran
sgen
ic m
ice
(0.0
25%
), I
sofl
avon
em
ixtu
re a
nd tu
mor
late
ncy
mix
ture
(eq
uiva
lent
toge
nist
ein
at 0
.025
%)
Miz
unum
a et
al.,
MM
TV
-ger
m-f
ree
Bio
chan
in A
(0.0
2%),
—B
ioch
anin
Aan
d tu
mor
inci
denc
e in
CV
2002
(31
)(G
F) m
ice
thei
rda
idze
in (
0.02
%).
mic
e co
nven
tiona
lized
+B
ioch
anin
Aan
d tu
mor
inci
denc
e in
GF
(CV
) m
ice
mic
eN
one
Dai
dzei
n an
d tu
mor
inci
denc
e in
eith
erm
ice
Yan
g et
al.,
MM
TV
-neu
/Her
-2C
rude
soy
pro
tein
(27
7 μg
+So
y an
d la
tenc
y of
mam
mar
y tu
mor
2003
(30
)da
idze
in/g
die
t and
deve
lopm
ent
214
μg g
enis
tein
/g d
iet)
Tra
nspl
anta
ble
Allr
ed e
t al.,
MC
F-7,
ova
riec
tom
ized
SPI
with
dif
fere
nt le
vels
+G
enis
tein
and
MC
F-7
tum
or g
row
th20
01 (
37)
nude
mic
e, e
stro
gen-
of g
enis
tein
depl
eted
Allr
ed e
t al.,
MC
F-7,
ova
riec
tom
ized
Gen
iste
in (
0.07
5%)
and
+G
enis
tein
or
geni
stin
and
MC
F-7
2001
(36
)nu
de m
ice,
est
roge
n-ge
nist
in (
0.12
%)
tum
or g
row
thde
plet
ed
128

Hsi
eh e
t al.,
MC
F-7,
ova
riec
tom
ized
Gen
iste
in (
0.07
5%)
+G
enis
tein
and
MC
F-7
tum
or g
row
th19
98 (
34)
nude
mic
e, e
stro
gen-
depl
eted
Ju e
t al.,
200
1 (3
5)M
CF-
7, o
vari
ecto
miz
edG
enis
tein
(0.
0125
%-0
.1%
)+
Gen
iste
in a
nd M
CF-
7 tu
mor
gro
wth
in a
nude
mic
e, e
stro
gen-
dose
-dep
ende
nt m
anne
rde
plet
edSh
ao e
t al.,
MC
F-7,
est
roge
n-su
bcut
-G
enis
tein
—G
enis
tein
and
MC
F-7
tum
or g
row
th19
98 (
39)
eneo
us m
aint
aine
dY
an e
t al.,
BA
LB
/c, 4
526
SPI
(10,
20%
) —
SPI
(20%
) an
d tu
mor
vol
ume
and
2002
(33
)m
urin
e m
amm
ary
freq
uenc
y of
met
abas
isca
rcin
oma
cell
line
Yua
n et
al.,
MD
A-M
B-
231,
sc
Gen
iste
in c
ombi
ned
—So
y pr
oduc
t and
tum
or g
row
th20
03 (
32)
poly
sacc
hari
de (
1%)
and
fina
l tum
or w
eigh
tZ
hou
et a
l.,M
CF-
7, o
rtho
topi
c,
SPC
(0.1
,0.5
%),
Gen
istin
—
SPC
or
geni
stin
and
MC
F-7
2004
(38
)es
trog
en-m
aint
aine
d(0
.028
,0.1
4%)
tum
or g
row
tha—
, sig
nifi
cant
neg
ativ
e as
soci
atio
n, p
< 0
.05;
+, s
igni
fica
nt p
ositi
ve a
ssoc
iatio
n, p
< 0
.05;
Non
e, n
o si
gnif
ican
t ass
ocia
tion.
SPI;
soy
pro
tein
iso
late
; D
MB
A;
7,12
-dim
ethy
lben
z(a)
ant
hrac
ene;
MN
U;
N-m
ethy
l-N
-nitr
osou
rea;
NM
U;
N-n
itros
o-N
-met
hylu
rea;
Phl
P; 2
-am
ino-
1-m
ethy
l-6-
phen
ylim
idaz
ol [
4,5-
b] p
yrid
ine.
129

130 Part II / Cancer Prevention
protein isolate (SPI) and soy isoflavones on tumor incidence (18–23), multiplicity(18,19,24), or latency (19,20,25), other studies indicated that SPI and soy isoflavonessignificantly reduced tumor incidence (24–28), multiplicity (20,27,28) or latency (23).A soy extract with isoflavones and saponins also significantly reduced poorly differen-tiated mammary tumor induced by DMBA (21).
Recently, a transgenic mouse model for BRCA, MMTV-neu/Her-2 transgenic model,was used to determine the effect of soy bioactive components on prevention of mam-mary carcinogenesis. Supplementation of soy isoflavones or isoflavone-containingcrude soy protein significantly prolonged the latency period of mammary tumor devel-opment (29,30). Biochanin A, an isoflavone that can be converted to genistein in vivo,also significantly inhibited tumor incidence in conventional mice (31).
The transplantable tumor model is a widely used in vivo model to evaluate the efficacyof treatment and to study mechanisms of action. Yuan and coworkers (32) found that agenistein-containing soy polysaccharide significantly inhibited growth of estrogen-independent breast tumors. Yan and coworkers (33) found that SPI at 20% of the dietsignificantly inhibited the growth and metastasis of a murine mammary carcinoma.
2.3. Does Genistein Stimulate the Growth of Estrogen-Dependent BreastTumors?
The controversy with soy and BRCA comes from the results derived from trans-plantable animal models using estrogen-dependent MCF-7 human BRCA cells inimmune-deficient mice. Studies using an estrogen-depleted ovariectomized animalmodel showed that dietary genistein or genistein-containing soy protein stimulated thegrowth of estrogen-dependent MCF-7 tumors in vivo (34–37). These results have beenextensively publicized, and concerns have been raised regarding use of soy products bywomen with BRCA or women at high risk of developing BRCA.
We investigated the effects of genistin (the natural form of genistein present in soy)and the soy phytochemical concentrate (SPC; the soy phytochemical mixture present insoy) on the growth of MCF-7 tumors in estrogen-maintained intact animal models (38).Both genistin and SPC inhibited the growth of MCF-7 tumors in a dose- and time-dependent manner (38). In this study, we further demonstrated that the combination ofSPC at a low dietary level with tea had a suggestive synergistic effect on inhibiting thegrowth of MCF-7 tumors, although SPC alone did not significantly inhibit tumor growth(38). This study clearly indicates that one of the major reasons by which the Asian dietmay have protective effects on BRCA may be by interactive actions of several types offoods or bioactive food ingredients. By using the similar estrogen-maintained intact animalmodel, Shao et al. (39) also demonstrated that genistein inhibited MCF-7 tumor growth ina dose-dependent manner.
Explanation and debate of these controversial results are focused on which animalmodels are more clinically relevant. Clearly, estrogen plays a critical role in the growth anddevelopment of estrogen-dependent BRCA. One of the mechanisms by which compoundssuch as soy isoflavones and surrogate ER modulators exert an estrogenic/anti-estro-genic effect is by competing with endogenous estrogens to bind ERs. Estrogens arepresent in certain levels in postmenopausal women, whose adipose tissue becomes theirmajor source of endogenous estrogen (40). Therefore, competitive binding by estrogensand genistein (or other phytoestrogens) to ERs is a common biological behavior in vivo.We propose that an animal model with maintained estrogen levels to support growth of

Chapter 5 / Soy Consumption and Cancer Prevention 131
a MCF-7 tumor would have greater clinical relevance than one with depleted estrogenlevels for evaluating the effect of genistein on the growth of estrogen-dependent MCF-7breast tumors in vivo. Although estrogen levels in the blood of ovariectomized femalemice are comparable to that in postmenopausal women, the growth of MCF-7 estrogen-dependent breast tumors in ovariectomized and intact animal models requires estrogensupplements (41); removal of estrogen pellets stops tumor growth. Conversely, estrogen-dependent breast tumors develop and progress in postmenopausal women, indicatingthat estrogen levels in postmenopausal women are sufficient to support growth ofestrogen-dependent breast tumors. In animals, growth of estrogen-dependent breasttumors requires higher circulating levels of estrogen than those required for growth ofestrogen-dependent breast tumors in women. If this effect indicates that tumor-stimu-lating estrogen bioactivity in animals might be lower than that in humans, then clinicallyrelevant animal models of estrogen-dependent BRCA should contain estrogen levelsadequate to support tumor growth.
Similarly to the animal studies, we also propose that a cell culture system with a main-tained estrogen level would be more relevant than one with a depleted estrogen level forevaluating the effects of estrogenic/anti-estrogenic compounds on estrogen-dependentBRCA cells. Indeed, although genistein showed estrogenic activity and stimulated pro-liferation of MCF-7 cells and enhanced expression of the estrogen-responsive pS2 genein an estrogen-depleted cell culture system, it inhibited estrogen-induced proliferation ofMCF-7 cells (38,42,43) and pS2 expression in an estrogen-maintained system (42,43).
In summary, recent epidemiological studies generally have supported the associationbetween increased consumption of soy products and a reduced risk of BRCA, and animalstudies have suggested that some soy components prevent the development and pro-gression of BRCA. However, some animal studies have suggested that the soyisoflavone genistein stimulated the growth of estrogen-dependent breast tumors, whichraises the issue of whether women at high risk of developing BRCA and/or womenwith BRCA should avoid soy isoflavone supplementation. We have provided results,together with those of other groups, to demonstrate that for estrogen-dependent breasttumor, an estrogen-maintained animal model may be more clinically relevant than anestrogen-depleted animal model. Although the effect of genistein on estrogen-dependentbreast tumors in women still needs to be investigated, our results suggest that genis-tein or soy phytochemicals inhibits the growth of estrogen-dependent breast tumors.Moreover, there is a lower level of concern regarding consumption of foods containingsoy and increased risk of BRCA.
2.4. Soy and Prostate Cancer Prevention: Epidemiological StudiesIn the past several years, additional epidemiological studies have been conducted to
investigate the relationship between soy intake and CaP risk. The updated references arelisted in Table 3. Among three descriptive studies, one cross-nation study showed thatsoy consumption was correlated with a significantly lower mortality rate of CaP (44),and one study of Seventh-Day Adventist men in California showed that consumption ofsoy milk was associated with reduced risk of CaP (45), whereas another ecological studyin Japan did not show significant association between soy consumption and CaP risk (6).
Recent case–control studies have provided supporting evidence on soy consumptionand reduced risk of CaP. Two case–control studies in multiethnic groups in the UnitedStates and Canada (46) or in Canada alone (47) indicated that consumption of soy foods

132 Part II / Cancer Prevention
or tofu reduced the risk of CaP. Two other studies investigated the effect of soyisoflavones on CaP and found that intake of daidzein was associated with significantreduction of CaP risk (48) and that daidzein metabolizers (equol producers) signifi-cantly reduced the risk of CaP or poorly differentiated CaP (49), although intake ofgenistein was not significantly associated with the risk of CaP (48).
2.5. Soy and Prostate Cancer Prevention: Animal StudiesAnimal studies using different types of animal models for CaP have been conducted
in the past few years to identify the bioactive components in soybeans, evaluate the effi-cacy of the components, and elucidate the mechanisms of action (Table 4). In theDMBA-induced prostate carcinogenesis model, genistein and daidzein significantlyinhibited multiplicity of the ventral prostate carcinomas (50), and a soy isoflavone mix-ture significantly reduced tumor incidence (51). In an MNU-induced prostate carcino-genesis model, SPI reduced the incidence of prostate tumors (52), and genistein reducedthe incidence of invasive prostate adenocarcinoma (53).
Table 3Epidemiological Studies of Soy Consumption and CAP Risk
Result
Study (Reference) Population Significancea Association
Descriptive studiesHebert et al., A cross-national study — Soy products and CaP
1998 (44) mortalityJacobsen et al., Seven-Day Adventist men — Soymilk and CaP risk
1998 (45) in California; 225 cases in 12,395 subjects
Nagata et al., 2000 (6) Ecological study, Japan None Soy food and CaP risk Case-control studiesAkaza et al., Japanese population; 141 — Daidzein metabolizer
2002 (49) cases, 112 cancer- (equol producer) andfree controls CaP risk
— Daidzein metabolizer(equol producer) andpoorly differentiatedCaP
Kolonel et al., Multiethnic population — Soy food and CaP risk2000 (46) in the United States and
Canada; 1619 cases,1618 controls
Strom et al., 83 Caucasian cases, 107 — Daidzein intake and1999 (48) controls, United States CaP risk
None Genistein intake andCaP risk
Villeneuve et al., Multiethnic population in — Tofu and CaP risk 1998 (47) Canada; 1623 cases,
1623 controlsa—, significant negative association, p < 0.05; None, no significant association. CaP, Prostate cancer.

Tab
le 4
Ani
mal
Stu
dies
of
Soy
Con
sum
ptio
n an
d C
aP P
reve
ntio
n
Tum
or t
ypes
and
stu
dyR
esul
ts(R
efer
ence
)Tu
mor
and
ani
mal
Trea
tmen
t gr
oups
Sign
ifica
nce
Ass
ocia
tion
Che
mic
al-i
nduc
edK
ato
et a
l., 2
000
(50)
F344
rat
s, D
MB
AG
enis
tein
(0.
1%),
dai
dzei
n—
Gen
iste
in o
r da
idze
in a
nd m
ultip
licity
of
(0.1
%)
the
vent
ral p
rost
ate
carc
inom
aO
noza
wa
et a
l.,
F344
rat
s, D
MB
ASo
ybea
n is
ofla
vone
mix
ture
—So
y is
ofla
vone
s an
d tu
mor
inci
denc
e19
99 (
51)
(0.0
1, 0
.04%
)Po
llard
et a
l.,L
obou
nd-W
iste
r ra
ts,
SPI
(20%
), s
oy m
eal (
30%
)—
SPI
and
tum
or in
cide
nce
2000
(52
)M
NU
Non
eSo
y m
eal a
nd tu
mor
inci
denc
eW
ang
et a
l., 2
002
(53)
Lob
und-
Wis
tar
rats
,G
enis
tein
(0.
0025
,0.0
25%
)—
Gen
iste
in (
0.02
5%)
and
inva
sive
MN
Uad
enoc
arci
nom
aT
rans
geni
c/sp
onta
neou
sM
ento
r-M
arce
l et a
l.,T
RA
MP,
tran
sgen
icG
enis
tein
(10
0-50
0mg/
kg—
Gen
iste
in a
nd d
evel
opm
ent o
f po
orly
2001
(53
)di
et)
vs c
ontr
oldi
ffer
entia
ted
pros
tate
tum
orPo
llard
et a
l, 20
00 (
54)
Lob
ound
-Wis
ter
rats
,SP
I (2
0%),
soy
mea
l (30
%)
—SP
I an
d tu
mor
inci
denc
esp
onta
neou
sN
one
Soy
mea
l and
tum
or in
cide
nce
Polla
rd e
t al.,
200
1 (5
5)L
obou
nd-W
iste
r ra
ts,
SPI
(20%
), s
oy m
eal (
30%
)—
SPI
and
inci
denc
e of
hor
mon
e-sp
onta
neou
sin
depe
nden
t tum
orN
one
Soym
eal a
nd tu
mor
inci
denc
eT
rans
plan
tabl
eA
rons
on e
t al.,
199
9 (6
0)SC
ID m
ice,
LN
CaP
,SP
I pl
us is
ofla
vone
ext
ract
—SP
I pl
us is
ofla
vone
ext
ract
in lo
w-f
at
subc
utan
eous
in h
igh-
and
and
diet
and
tum
or g
row
thim
plan
tatio
nlo
w-f
at d
iets
Byl
und
et a
l., 2
000
(59)
BA
LB
/c m
ice,
LN
CaP
,SP
I (2
2.5%
) vs
milk
pro
tein
—
SPI
and
tum
or v
olum
e, tu
mor
wei
ght,
s.c.
impl
anta
tion
(28%
)an
d se
rum
PSA
(Con
tinu
ed)
133

Tab
le 4
(C
ontin
ued)
Tum
or t
ypes
and
stu
dyR
esul
ts(R
efer
ence
)Tu
mor
and
ani
mal
Trea
tmen
t gr
oups
Sign
ifica
nce
Ass
ocia
tion
Coh
en e
t al.,
200
3 (5
8)C
open
hage
n ra
ts, A
T-1
SPI
(5, 1
0, 2
0%)
+SP
I (1
0, 2
0%)
and
tum
or g
row
than
drog
en in
depe
nden
tce
ll, s
ubcu
tane
ous
impl
anta
tion
Lan
dstr
om e
t al.,
Cop
enha
gen-
Fish
er r
ats,
Def
atte
d so
y fl
our
(33.
3%)
vs—
Soy
flou
r an
d tim
or in
cide
nce,
tum
or19
98 (
57)
Dun
ning
R33
27 r
atlo
w-f
at m
ilk p
owde
r (2
8.1%
)vo
lum
e an
d tu
mor
gro
wth
rat
espr
osta
te c
ance
r ce
ll,
subc
utan
uous
impl
anta
tion
Wan
et a
l., 1
999
(61)
Nud
e m
ice,
LN
CaP
BB
I (1
%),
BB
IC(1
,2,3
%)
—B
BI
and
tum
or w
eigh
t or
tum
or d
oubl
ing
cells
, ort
hoto
pic
time
Non
eB
BIC
and
tum
or w
eigh
t or
tum
ordo
ublin
g tim
eZ
hou
et a
l., 1
999
(103
)SC
ID m
ice,
LN
CaP
,SP
I (2
0%),
soy
phy
toch
emic
al—
SPI
(1.0
%)
and
tum
or g
row
thsu
bcut
aneo
usco
ncen
trat
e (S
PC, 0
.2%
,1.0
%),
—SP
I pl
us S
PC (
0.2%
) an
d tu
mor
gro
wth
impl
anta
tion
SPI
plus
SPC
—SP
I pl
us S
PC (
1.0%
) an
d tu
mor
gro
wth
Zho
u et
al.,
200
2 (6
2)SC
ID m
ice,
LN
CaP
,Is
ofla
vone
- de
plet
ed S
PI (
20%
),—
Gen
iste
in a
nd tu
mor
gro
wth
or
thot
opic
geni
stin
(0.
14%
), S
PC (
0.5%
)—
SPC
and
tum
or g
row
th
impl
anta
tion
Non
e Is
ofla
vone
-dep
lete
d SP
I an
d tu
mor
gro
wth
—SP
C a
nd m
etas
tasi
s to
lym
ph n
odes
and
lung
sZ
hou
et a
l., 2
003
(63)
SCID
mic
e, L
NC
aP,
SPC
(0.
5%)
—SP
C a
nd tu
mor
igen
icity
rat
eor
thot
opic
—SP
C a
nd tu
mor
gro
wth
impl
anta
tion
a—
, sig
nifi
cant
neg
ativ
e as
soci
atio
n, p
< 0
.05;
+, s
igni
fica
nt p
ositi
ve a
ssoc
iatio
n, p
< 0
.05;
Non
e, n
o si
gnif
ican
t ass
ocia
tion.
BB
l; B
owm
an-B
irk
inhi
bito
r; B
BlC
; BB
I co
ncen
trat
e; S
PC; s
oy p
hyto
chem
cial
con
cent
rate
; SPI
; soy
pro
tein
isol
ate;
DM
BA
; 7,1
2-di
met
hylb
enz(
a) a
nthr
acen
e;M
NU
; N-m
ethy
l-N
-nitr
osou
rea.
134

Chapter 5 / Soy Consumption and Cancer Prevention 135
Lobound-Wister rats also develop prostate tumors spontaneously. This spontaneoustumor model has been used to determine the effect of soy isoflavones and soy proteins onprostate carcinogenesis and metastasis. SPI supplementation significantly reduced tumorincidence (54) and the incidence of hormone-independent tumors (55). A soy meal did nothave a tumor-inhibiting effect, suggesting that soy meal may contain other ingredients thatmay have adverse effects. The transgenic adenocarcinoma of the mouse prostate (TRAMP)model was also used, and one study showed that genistein significantly inhibited the devel-opment of poorly differentiated prostate adenocarcinoma in a dose-dependent manner (56).
Transplantable prostate tumor models have been widely used to determine the effectsof soy components on the growth and progression of prostate tumors. Defatted soyflours significantly reduced incidence and growth of Dunning R3327 prostate tumors ina rat model (57). However, SPI stimulated growth of androgen-independent prostatetumors in rats (58). Dietary SPI (59) or SPI with soy isoflavones in a low-fat diet (60)significantly inhibited the growth of androgen-sensitive human prostate LNCaP tumors.Bowman-Birk inhibitor (BBI), a soybean protease inhibitor, also significantly inhibitedthe growth of LNCaP tumor (61).
We evaluated the effects of a series of soy components on the growth and metastasisof LNCaP tumors. By using a subcutaneous tumor model, we found that SPI (20%),SPC (1%), or SPI (20%) plus SPC (0.2% or 1%) significantly inhibited tumor growth.We further applied an orthotopic prostate tumor model to mimic interactions betweencancer cells and stromal matrix in the prostate, and found that both genistin and SPCsignificantly inhibited the growth of orthotopic LNCaP tumor (62,63), and SPC signif-icantly inhibited tumorigenicity rate (63), and metastasis to lymph nodes and lungs (62),whereas the inhibitory effect of the isoflavone-depleted soy protein was not significant(62). The combined effects between soy phytochemicals and tea also were evaluated.The combination of SPC and black tea synergistically inhibited prostate tumorigenicity,final tumor weight, and metastases to lymph nodes, and the combination of SPC andgreen tea synergistically inhibited final tumor weight and metastasis (63).Our studiesindicate that soy isoflavones and soy phytochemicals are important soy bioactive com-ponents that can inhibit the growth of prostate tumors and that SPC might contain othercomponents that have antimetastasis activity. Our studies also suggest that combinationsof bioactive components from several food sources (such as tea) and soy may accountfor the cancer prevention activity of the Asian diet.
In summary, the mounting studies from both epidemiological and animal studies inthe past several years further support the preventive role of soy products in CaP.
2.6. Soy and Colorectal Cancer Prevention: Epidemiological StudiesSome epidemiological studies have evaluated the association between soy food
intake and the risk of CRC, and this topic has been reviewed (64). In general, previousepidemiological studies did not provide sufficient evidence to support the protective roleof soy food intake in CRC. Recent epidemiological studies are summarized in Table 5.In an ecological study, Nagata et al. (6) found a significant positive association betweensoy consumption and reduced CRC mortality in Japan. However, other case–controlstudies failed to demonstrate significant associations between soy-based foods or tofuintake and CRC risk (65–67), except that soy-based food intake was associated with areduced risk of CRC in women (66). Overall, recent epidemiological studies do notsuggest an association between soy-based food intake and reduced risk of CRC.

136 Part II / Cancer Prevention
Despite nonsignificant associations between soy-based food intake and reduced CRCrisk in epidemiological studies, a small clinical intervention study demonstrated that soyprotein supplementation to a group of “at-risk” subjects significantly inhibited colon cryptcell proliferation, a suggested biomarker for colon cancer risk (68).
2.7. Soy and Colorectal Cancer Prevention: Animal StudiesAs shown in Table 6, chemical carcinogen-induced colon/rectal carcinogenesis models
continue to be used as major in vivo systems to evaluate the effect of soy components onprevention of CRC. In the past several years, no animal study used a transplantable tumormodel, and one study used a transgenic Apc (Min) mouse model. Sorensen and cowork-ers (69) compared the effect between a high-isoflavone SPI and a low-isoflavone SPI oncolon carcinogenesis in Apc (Min) transgenic model and found that soy isoflavones didnot significantly inhibit the incidence or multiplicity of tumor. However, it is unclear ifsoy protein had any protective effect in this model because a control group with anotherprotein type was not included.
Azuma and coworkers conducted a series of animal studies using azoxymethane/deoxy-cholate-induced tumor models and found that a soybean high-molecular-weight fraction(HMF) isolated from the proteolytic digest of soy protein significantly inhibited tumor inci-dence (70–72) and especially tumor promotion by deoxycholate (73). It was further shownthat SPI significantly inhibited tumor incidence and the incidences of benign and invasivetumors (74). Soya saponins (75), full-fat soy flakes, defatted soy flour, or genistein (76)significantly inhibited multiplicity of aberrant crypt foci. However, Rao and coworkers
Table 5Epidemiological Studies of Soy Consumption and CRC Risk
Result
Study (Reference) Population Significancea Association
Descriptive studiesNagata et al., 2000 (6) Ecological study, Japan + Soy foods and CRC
mortality in both sexesCase-control studiesSeow et al., 2002 (65) 121 cases, 222 controls, None Soy intake and CRC risk
Chinese population inSingapore
Le Marchand et al., Multiethnic population, — Soyfoods and CRC risk 1997 (66) United States; 1192 in women
cases, 1192 controls None Soyfoods and CRC riskin men
Nishi et al., 1997 (67) 330 cases, 660 controls, None Tofu and CRC riskJapanese
Clinical intervention studiesBennink et al., “At risk” population, — SPI and labeling index
2001 (68) double-blind, SPI group — SPI and proliferation zone(129 subjects), caseingroup (13 subjects)
a—, significant negative association p < 0.05; +, significant positive association, p < 0.05; None, nosignificant association. CRC, colorectal cancer; SPI, soy protein isolate.

Tab
le 6
Ani
mal
Stu
dies
of
Soy
Com
pone
nts
and
CR
C P
reve
ntio
n
Tum
or t
ypes
and
stu
dyR
esul
ts(R
efer
ence
)Tu
mor
and
ani
mal
Trea
tmen
t gr
oups
Sign
ifica
ncea
Res
ults
Che
mic
al-i
nduc
edA
zum
a et
al.,
F344
rat
s, A
zoxy
met
hane
Soyb
ean
high
- m
olec
ular
-wei
ght
—So
ybea
n H
MF
and
colo
nic
tum
or19
99 (
73)
and
deox
ycho
late
frac
tion
(HM
F) (
26%
)pr
omot
ion
by d
eoxy
chol
ate
Azu
ma
et a
l.,F3
44 r
ats,
Azo
xym
etha
neSo
ybea
n hi
gh-
mol
ecul
ar-w
eigh
t-—
Soyb
ean
HM
F an
d tu
mor
inci
denc
e19
99 (
70)
and
deox
ycho
late
frac
tion
(HM
F) (
13.5
%)
Azu
ma
et a
l.,F3
44 r
ats,
Azo
xym
etha
neSo
ybea
n H
MF
(13.
5%)
vs c
asei
n —
Soyb
ean
HM
F an
d tu
mor
inci
denc
e20
00 (
71)
and
deox
ycho
late
(10%
)A
zum
a et
al.,
F344
rat
s, A
zoxy
met
hane
Soyb
ean
HM
F (2
0.6%
)—
Soyb
ean
HM
F an
d tu
mor
inci
denc
e20
00 (
72)
and
deox
ycho
late
and
deve
lopm
ent
Dav
ies
et a
l.,F3
44 r
ats,
Azo
xym
etha
neH
igh-
isof
lavo
ne S
PI v
s lo
w-
Non
e Is
ofla
vone
s an
d tu
mor
num
bers
1999
(12
4)is
oflv
one
SPI
Gee
et a
l., 2
000
(79)
Wis
tar
rats
, 1,2
-dim
ethy
l-G
enis
tein
(0.
025%
), S
PI+
Gen
iste
in o
r SP
I be
fore
DM
H a
ndhy
draz
ine
(DM
H)
(con
tain
ing
0.02
5% g
enis
tein
)th
e in
cide
nce
of a
berr
ant c
rypt
foci
in d
ista
l col
onN
one
Gen
iste
in o
r SP
I af
ter
DM
H a
nd th
ein
cide
nce
of a
berr
ant c
rypt
foc
iH
akka
k et
al.,
SD r
ats,
Azo
xym
etha
neSP
I (2
0%)
—SP
I an
d tu
mor
inci
denc
e 20
01 (
74)
—SP
I an
d in
cide
nces
of
beni
gn a
ndin
vasi
ve tu
mor
sK
enne
dy e
t al.,
SD r
ats,
DM
H
BB
IC(0
.1,0
.5%
), B
BI
(0.0
1,0.
1%),
—B
BI
or B
BIC
and
tum
or in
cide
nce
2002
(78
)A
BB
IC (
0.5%
)K
orat
kar
et a
l.,C
F1 m
ice,
Azo
xym
etha
neSo
ybea
n sa
poni
ns (
3%)
—So
ya s
apon
ins
and
mul
tiplic
ity o
f19
97 (
75)
aber
rant
cry
pt f
oci Con
tinu
ed
137

Tab
le 6
(Con
tinue
d)
Tum
or t
ypes
and
stu
dyR
esul
ts(R
efer
ence
)Tu
mor
and
ani
mal
Trea
tmen
t gr
oups
Sign
ifica
ncea
Res
ults
Rao
et a
l., 1
997
(77)
F344
rat
s, A
zoxy
met
hane
Gen
iste
in (
0.02
5%)
Non
eG
enis
tein
and
tum
or in
cide
nce
+G
enis
tein
and
mul
tiplic
ity o
f no
nin-
vasi
ve a
nd to
tal a
deno
carc
inom
aT
hiag
araj
an e
t al.,
F344
rat
s, A
zoxy
met
hane
Soy
prot
ein
conc
entr
ate
(28.
5%),
—Fu
ll-fa
t soy
fla
kes,
def
atte
d so
y 19
98 (
76)
Full-
fat s
oy f
lake
s (4
6%),
fl
our
or g
enis
tein
and
num
ber
of
Def
atte
d so
y fl
our
(36%
),
colo
nic
aber
rant
cry
pt f
oci
geni
stei
n (0
.015
%)
vs c
ontr
olT
rans
geni
c/sp
onta
neou
s So
rens
en e
t al.,
Apc
(Min
) m
ice
Hig
h-is
ofla
vone
SPI
vs
low
-N
one
Isof
lavo
nes
and
tum
or in
cide
nce
or
1998
(69
)is
ofla
vone
SPI
mul
tiplic
itya—
, sig
nifi
cant
neg
ativ
e as
soci
atio
n p
< 0
.05;
+, s
igni
fica
nt p
ositi
ve a
ssoc
iatio
n, p
< 0
.05;
Non
e, n
o si
gnif
ican
t ass
ocia
tion.
BB
I, B
BIC
AB
BIC
; au
tocl
aved
BB
IC;
SPI;
soy
pro
tein
iso
late
; D
MB
A;
7,12
-dim
ethy
lben
z(a)
ant
hrac
ene;
MN
U;
N-n
itros
o-N
-met
hylu
rea;
PhI
P; 2
-am
ino-
1-m
ethy
l-6-
phen
ylim
idaz
ol [
4,5-
b] p
yrid
ine.
138

Chapter 5 / Soy Consumption and Cancer Prevention 139
(77) found that genistein did not affect tumor incidence but significantly stimulated multi-plicity of noninvasive and total adenocarcinoma. By using another animal model ofdimethylhydrazine (DMH)-induced aberrant crypt foci, Kennedy and coworkers found thatsoy protease BBI significantly inhibited tumor incidence (78). However, Gee and coworkers(79) found that genistein or SPI treatment before, but not after, DMH induction significantlyincreased the incidence of aberrant crypt foci in the distal colon.
In summary, recent epidemiological investigations and in vivo animal studies,together with previous studies, provide suggestive but inconclusive evidence for a roleof soy foods in prevention of CRC. More studies are needed to further determine therole of soy foods/soy bioactive components in prevention of CRC.
2.8. Soy and Prevention of Other Forms of Cancer: Epidemiologicaland Animal Studies
The association between consumption of soy foods and the risks of other forms ofcancer has also been evaluated in several epidemiological studies in recent years. Inaddition, the efficacy of soy bioactive components was evaluated in several animalstudies. Because of limited numbers of studies, this chapter reviews epidemiologicaland animal studies together. Epidemiological and animal studies are summarized inTables 7 and 8, respectively.
Seven epidemiological studies investigated the association between soy food intakeand the risk of stomach cancer, as shown in Table 7. In a prospective study, Nagata andcoworkers (80) found that consumption of total soy products or fermented soy productswas associated with a reduced risk of stomach cancer in Japanese men, and consump-tion of nonfermented soy products, but not total soy products, was associated with areduced risk of stomach cancer in women. In another prospective study, consumptionof tofu, but not soymilk, was associated with a reduced death rate of stomach cancer inJapan (81). Two ecological studies showed a significant association between soy foodconsumption and a reduced stomach cancer risk or mortality (6,82). In three case–controlstudies, one study showed a significant association between tofu intake and a reducedrisk of postsurgery death from stomach cancer (83); one study showed a significantassociation between intake of soy products and the reduced risk of stomach cancer inmen (84); but the other study did not show any significant association between soy andthe risk of stomach cancer (85).
Three case–control studies evaluated the association between soy food consumptionand the risks of ovarian and endometrial cancer. Consumption of soy products or tofu wasassociated with a significant reduction of endometrial cancer risk (86), and intake of soyisoflavones was associated with a significant reduction of endometrial cancer in post-menopausal women (87). However, consumption of soy products was not significantlyassociated with the risk of ovarian cancer (88).
Among five epidemiological studies of lung cancer, one ecological study (6) and onecase–control study (89) failed to find significant associations between soy consumptionand the risk of lung cancer. Consumption of soy foods was significantly associated withthe risk of lung cancer in nonsmokers but was not significantly associated with a reductionof risk of lung adenocarcinoma in smokers (90). Consumption of soybean curd signifi-cantly reduced the risk of lung adenocarcinoma, but not lung squamous and small cellcarcinoma, in women (91). Wakai et al. (92) found that soy food intake was associatedwith a significant reduction of lung cancer in Japanese men but not in women. They also

Tab
le 7
Epid
emio
logi
cal S
tudi
es o
f So
y C
onsu
mpt
ion
and
Ris
ks o
f O
ther
For
ms
of C
ance
r
Res
ult
Stud
y (R
efer
ence
)Po
pula
tion
Sign
ifica
ncea
Ass
ocia
tion
Stom
ach
canc
er
Des
crip
tive
stu
dies
Nag
ata
et a
l.,Pr
ospe
ctiv
e st
udy,
30,
304
Japa
nese
,—
Soy
prod
ucts
, fer
men
ted
or n
onfe
rmen
ted
soy
prod
ucts
2002
(80
)12
1 de
aths
and
deat
h ra
tes
from
sto
mac
h ca
ncer
in m
en
Non
eSo
y pr
oduc
ts a
nd d
eath
rat
e fr
om s
tom
ach
canc
erin
wom
en
—N
onfe
rmen
ted
soy
prod
ucts
and
sto
mac
h ca
ncer
de
ath
rate
s in
wom
enTa
keza
ki e
t al.,
Com
para
tive
ecol
ogic
al s
tudy
, Chi
na—
Freq
uenc
y of
soy
foo
d co
nsum
ptio
n an
d ga
stri
c ca
ncer
19
99 (
82)
414
subj
ects
fro
m a
hig
h-ri
sk a
rea,
risk
in m
en a
nd w
omen
425
subj
ects
fro
m a
low
-ris
k ar
eaN
agat
a et
al.,
200
0 (6
)E
colo
gica
l stu
dy, J
apan
ese,
Jap
an—
Soy
food
s an
d st
omac
h ca
ncer
mor
talit
y N
goan
et a
l., 2
002
(81)
Pros
pect
ive
stud
y, J
apan
ese,
Jap
an,
—To
fu a
nd d
eath
rat
e of
sto
mac
h ca
ncer
13
250
subj
ects
, 116
dea
ths
Non
eSo
ymilk
and
dea
th r
ate
of s
tom
ach
canc
erC
ase–
cont
rol s
tudi
esH
uang
et a
l., 2
000
(83)
877
gast
ric
canc
er p
atie
nts,
Jap
anes
e, J
apan
—To
fu in
take
and
ris
k of
pos
tsur
gery
dea
th o
f st
omac
hca
ncer
Ji e
t al.,
199
8 (8
4)11
24 c
ases
, 145
1 co
ntro
ls, C
hine
se, C
hina
—So
ybea
n pr
oduc
ts a
nd s
tom
ach
canc
er r
isk
in m
enN
one
Soyb
ean
prod
ucts
and
sto
mac
h ca
ncer
ris
k in
wom
enG
ao, e
t al.,
199
9 (8
5)23
4 ca
ses,
234
con
trol
s, C
hine
se, C
hina
Non
e So
y pr
oduc
t and
sto
mac
h ca
ncer
ris
k
Ova
rian
and
end
omet
rial
can
cer
Cas
e–co
ntro
l stu
dies
Zha
ng e
t al.,
200
2 (8
8)25
4 ca
ses,
652
con
trol
s, C
hina
Non
e So
ybea
n pr
oduc
ts a
nd o
vari
an c
ance
r ri
sk in
wom
enG
oodm
an e
t al.,
Mul
tieth
nic
popu
latio
n in
the
Uni
ted
Stat
es,
—To
fu a
nd e
ndom
etri
al c
ance
r ri
sk
1997
(86
)33
2 ca
ses,
511
con
trol
s—
Tofu
and
oth
er s
oy p
rodu
cts
and
endo
met
rial
can
cer
risk
140

Hor
n-R
oss
et a
l.,N
on-A
sian
wom
en in
the
Uni
ted
Stat
es—
Isof
lavo
ne in
take
and
ris
k of
end
omet
rial
can
cer
in
2003
(87
)50
0 ca
ses,
470
con
trol
spo
stm
enop
ausa
l wom
en
Lun
g ca
ncer
Des
crip
tive
stu
dies
Nag
ata
et a
l., 2
000
(6)
Eco
logi
cal s
tudy
N
one
Soy
cons
umpt
ion
and
lung
can
cer
risk
C
ase-
cont
rol s
tudi
es
Seow
et a
l., 2
002
(90)
Chi
nese
wom
en in
Sin
gapo
re, 3
03—
Soy
food
s an
d lu
ng c
ance
r ri
sk a
nd in
cide
nce
ofca
ses,
765
con
trol
sad
enoc
arci
nom
a in
non
smok
ers
Non
eSo
y fo
ods
and
lung
can
cer
risk
in s
mok
ers
Hu
et a
l., 1
997
(89)
Chi
nese
pop
ulat
ion,
Chi
na, 2
27 c
ases
,N
one
Soy
food
s an
d lu
ng c
ance
r ri
sk
227
cont
rols
Take
zaki
et a
l., 2
001
(91)
Japa
nese
, Jap
an, 1
,045
cas
es,
—So
ybea
n cu
rd a
nd r
isk
of lu
ng a
deno
carc
inom
a in
41
43 c
ontr
ols
wom
enN
one
Soyb
ean
curd
and
ris
k of
lung
squ
amou
s an
d sm
all c
ell
carc
inom
as in
wom
enW
akai
et a
l., 1
999
(92)
Japa
nese
, Jap
an, 3
33 c
ases
, 666
con
trol
sN
one
Tofu
and
ris
k of
lung
can
cer
or lu
ng a
deno
carc
inom
a—
Tofu
and
ris
k of
squ
amou
s ce
ll ca
rcin
oma
—So
y fo
ods
and
risk
of
lung
can
cer
in m
enN
one
Soy
food
s an
d ri
sk o
f lu
ng c
ance
r in
wom
en
Thy
roid
Can
cer
Cas
e–co
ntro
l stu
dies
Hor
n-R
oss
et a
l.,M
ultie
thni
c po
pula
tion
in th
e U
nite
d St
ates
,—
Tofu
and
ris
k of
thyr
oid
canc
er
2002
(93
)60
8 ca
ses,
608
con
trol
sN
one
Oth
er s
oy p
rodu
cts
and
risk
of
thyr
oid
canc
erH
asel
korn
et a
l.,
Asi
an p
opul
atio
n in
the
Uni
ted
Stat
es,
—D
ieta
ry is
ofla
vone
inta
ke a
nd r
isk
of th
yroi
d ca
ncer
2003
(94
)51
5 ca
ses,
486
con
trol
s
Bla
dder
can
cer
Des
crip
tive
stu
dies
Sun
et a
l., 2
002
(96)
Coh
ort s
tudy
, 63,
257
subj
ects
, 62
case
s,+
Soy
food
s an
d ri
sk o
f bl
adde
r ca
ncer
Sing
apor
e
141
Con
tinu
ed

Tab
le 7
(Con
tinue
d)
Res
ult
Stud
y (R
efer
ence
)Po
pula
tion
Sign
ifica
ncea
Ass
ocia
tion
Cas
e–co
ntro
l stu
dies
Lu
et a
l., 1
999
(95)
Chi
nese
, Tai
wan
, 40
case
s, 1
60 c
ontr
ols
Non
eSo
y ju
ice
and
blad
der
canc
er r
isk
Nas
opha
ryng
eal C
ance
rC
ase–
cont
rol s
tudi
es
War
d et
al.,
200
0 (9
8)C
hine
se p
opul
atio
n in
Tai
wan
, 375
cas
esN
one
Soy
food
s an
d ri
sk o
f na
soph
aryn
geal
can
cer
327
cont
rols
Hep
atic
can
cer
Cas
e–co
ntro
l stu
dies
Lei
et a
l., 2
000
(99)
Ital
ian/
Ital
y, 3
2 ca
ses,
92
cont
rols
—G
enis
tein
inta
ke a
nd h
epat
ic c
ance
r N
one
Dai
dzei
n in
take
and
hep
atic
can
cer
a—
, sig
nifi
cant
neg
ativ
e as
soci
atio
n, p
< 0
.05;
+, s
igni
fica
nt p
ositi
ve a
ssoc
iatio
n, p
< 0
.05;
Non
e, n
o si
gnif
ican
t ass
ocia
tion.
142

Tab
le 8
Ani
mal
Stu
dies
of
Soy
Com
pone
nts
and
Prev
enti
on o
f O
ther
For
ms
of C
ance
r
Tum
or t
ypes
and
stu
dyR
esul
ts(R
efer
ence
)A
nim
al m
odel
Trea
tmen
t gr
oups
Sign
ifica
ncea
Ass
ocia
tion
Tra
nspl
anta
ble
Li e
t al.
(101
), 1
999
C57
/BL
mic
e, B
16-B
L6
mur
ine
Gen
iste
in a
nd d
aidz
ein
—G
enis
tein
and
dai
dzei
n an
d th
e nu
mbe
r m
elan
oma
cells
intr
aven
ousl
yan
d si
ze o
f lu
ng m
etas
tase
sR
ecor
d et
al.
(100
), 1
997
C57
/BL
mic
e, B
16-B
L6
cells
,G
enis
tein
(0.0
33%
)—
Gen
iste
in a
nd tu
mor
vol
ume
subc
utan
eous
lyY
an e
t al.
(102
), 1
997
C57
/BL
mic
e, B
16-B
L6
mur
ine
SPI
(10,
15,
20%
) vs
—
SPI
and
the
inci
denc
e an
d nu
mbe
r of
m
elan
oma
cells
, int
rave
nous
lyca
sein
(20
%)
met
asta
sis
in lu
ngs
Zho
u et
al.
(97)
, 199
8C
57/B
L6
mic
e, f
emal
e, M
B-4
9G
enis
tein
, SPC
, SPI
—G
enis
tein
, SPC
, or
SPI
and
blad
der
mur
ine
blad
der
canc
er c
ell l
ine,
(20%
)tu
mor
vol
ume
subc
utan
eous
lya—
, sig
nifi
cant
neg
ativ
e as
soci
atio
n, p
<0.
05.
SPC
; soy
phy
toch
emic
al c
once
ntra
te: S
Pl; s
oy p
rote
in is
olat
e.
143

144 Part II / Cancer Prevention
found that tofu intake was not significantly associated with the risk of lung cancer orlung adenocarcinoma but was associated with a significant reduction of squamous cellcarcinoma (92).
Two case–control studies examined the association between soy products and thyroidcancer. Tofu intake, but not other soy products, was associated with a significant reductionof thyroid cancer (93), and intake of dietary isoflavones was associated with a significantreduction of the risk of thyroid cancer (94).
One case–control study failed to find a significant association between soymilkintake and bladder cancer (95). However, one cohort study found that soy food intakewas associated with a significant increase of bladder cancer risk (96). We studied theeffect of soy components on bladder tumor growth in an animal model and found thatgenistein, dietary SPC, or dietary SPI all significantly inhibited the growth of bladdertumors in mice (97) (Table 8).
Two case–control studies evaluated the association between soy consumption and therisk of nasopharyngeal or hepatic cancer. Soy food intake was not associated with therisk of nasopharyngeal cancer (98). Intake of genistein, but not daidzein, was associatedwith a significant reduction of hepatic cancer (99).
Despite lack of epidemiological studies, three animal experiments studied the effectsof soy components on melanoma (Table 8). Dietary genistein significantly inhibited thegrowth of the melanoma tumor (100). Soy isoflavones or SPIs also significantly inhibitedmetastasis of melanoma tumor cells to lungs in the animal models (101,102).
In summary, despite additional epidemiological and animal studies in recent years todetermine the role of soy components in prevention of other forms of cancer, the dataare neither consistent nor sufficient to suggest the role of soy components in preventionof these cancers. More epidemiological and animal studies are needed to determine therole of soy bioactive components in prevention of these forms of cancer.
2.9. Mechanisms of ActionCarcinogenesis involves a cascade of processes including initiation, promotion, pro-
gression, and metastasis. DNA damage caused by carcinogen exposure and reactiveoxygen substances has been suggested to be one of the early steps in initiation of car-cinogenesis, whereas deregulated cell proliferation, differentiation, and apoptosis anduncontrolled angiogenesis are major cellular modifiers involved in the promotion, pro-gression, and metastasis stages of carcinogenesis. Both in vitro and in vivo animal modelshave been used to study the mechanisms by which soy bioactive components may havepreventive activity on certain types of cancer. Among soy bioactive components, the soyisoflavone genistein has been studied extensively. A large body of data on mechanisms isderived from the in vitro studies, but only a few suggested mechanisms have been con-firmed in the in vivo animal models. Although in vitro studies can provide importantinformation on cellular and molecular mechanisms, there are substantial differencesbetween in vitro and in vivo systems. Therefore, we review the mechanistic evidence thathas been elucidated only in animal models. Because soy bioactive components may exerttheir preventive activities with different cancers via the similar mechanistic pathways, thisreview is made based on mechanistic pathways rather than cancer types.
Despite in vitro studies suggesting that the soy bioactive component genistein mayhave antioxidant activity and exerts its cancer prevention activities by modulating theinitiation process, there is no in vivo evidence to support this suggestion. Animal studies

Chapter 5 / Soy Consumption and Cancer Prevention 145
have focused mainly on the mechanisms by which soy bioactive components may pre-vent progression and metastasis processes of carcinogenesis. We focus on the cellular andmolecular mechanisms by which soy bioactive components prevent progression andmetastasis of carcinogenesis in vivo, mainly on cancer cell proliferation and apoptosis,and on tumor angiogenesis.
2.9.1. MODULATION OF CANCER CELL APOPTOSIS AND PROLIFERATION
BY SOY BIOACTIVE COMPONENTS
Apoptosis is an active process of programmed cell death designed to control cell pop-ulations in a variety of normal and neoplastic tissues. In cancer, it is regulated bynumerous oncogenes, tumor suppressor genes, and growth factors. Some soy bioactivecomponents such as genistein and SPI have been shown to induce apoptosis of cancercells in vivo. SPI inhibited growth of prostate tumor and induced tumor cell apoptosisin vivo (59). Antiproliferation activity of soy products has also been shown in a clinicalintervention study. Bennink et al. (68) found that consumption of SPI significantlyreduced the labeling index and proliferation zone of human colon mucosa.
We studied the mechanisms by which genistein, a soy phytochemical mixture, andsoy protein inhibited the growth of bladder, breast, and prostate tumors in animal mod-els. In the bladder cancer study (97), we found that genistein, SPC, and SPI significantlyinhibited tumor growth, associated in part with induction of apoptosis. All three com-ponents significantly inhibited tumor cell proliferation; SPC and SPI also significantlyinduced tumor cell apoptosis. In CaP studies, we found that soy protein or soy phyto-chemicals inhibited growth of LNCaP tumors associated with inhibition of cancer cellproliferation (63,103) and induction of cancer cell apoptosis in vivo (62,103). Genisteinalso inhibited tumor growth and induced cancer cell apoptosis in vivo (62). Genisteinand SPC also prevented growth of estrogen-dependent breast tumors in animals, asso-ciated in part with inhibition of tumor cell proliferation (63). Although SPC treatmentalone did not significantly induce tumor cell apoptosis, its combination with tea resultedin a significant induction of tumor cell apoptosis (63).
The molecular mechanisms by which soy protein and genistein induce tumor cellapoptosis and inhibit cell proliferation are still largely unknown. We determined p53protein levels in prostate tumor samples and found that SPC treatment significantlyincreased p53 protein expression (62). Because LNCaP cells express the wild-type p53,this result suggests that one of the molecular mechanisms by which soy phytochemicalsinhibit prostate tumor growth is via induction of p53 expression and function. In vitrostudies suggest that genistein may induce apoptosis and inhibit proliferation of cancercells via modulation of expression of BCL-2, p21, and/or DNA topoisomerases, butthey have not been verified in vivo (104–109).
2.9.2. MODULATION OF TUMOR ANGIOGENESIS BY SOY BIOACTIVE COMPONENTS
Angiogenesis, the generation of new blood vessels, is an essential step in tumordevelopment, progression, and metastasis (110). Angiogenesis is controlled by a seriesof angiogenesis and antiangiogenesis factors. Among these, vascular endothelial growthfactor (VEGF)and basic fibroblast growth factor (bFGF) are believed to be importantangiogenic factors.
The potential antiangiogenesis activities of soy bioactive components have beenstudied in our animal experiments. The prevention effects of genistein, SPC, and SPI on

146 Part II / Cancer Prevention
growth of bladder tumors and prostate tumors were associated with significant inhibitionof tumor microvessel density, a marker of angiogenesis in vivo (62,63,97,103). Althoughgenistein and SPC did not significantly reduce angiogenesis in MCF-7 tumors, the com-bination of SPC with tea significantly reduced angiogenesis (38), which suggests thatone possible mechanism by which soy and tea may synergistically suppress estrogen-dependent breast tumors may be via interactions that impede tumor angiogenesis. We alsodetermined the molecular targets that may be responsible for anti-angiogenesis activityof soy components and found that the expression of bFGF, not VEGF, was slightly, butsignificantly, downregulated by soy protein and genistein in vivo (62). Clearly, otherangiogenic/anti-angiogenic factors are also responsible, and more mechanistic studiesare needed to identify these target factors.
2.9.3. SOY BIOACTIVE COMPONENTS AND HORMONAL MODULATION
Both BRCA and early stages of CaP are hormone-dependent. Clearly androgens andestrogens play important roles in the development and progression of these cancers. Inthe prostate, testosterone is rapidly and irreversibly converted to a more biologicallyactive metabolite, dihydrotestosterone (DHT), by catalysis of 5α-reductase. Estrogenplays a key role in estrogen-dependent BRCA development and growth, exerting itseffect on estrogen-dependent tumors by binding to ER-α and -β and inducing ER-dependent transcriptional expression of estrogen-responsive genes that promote cancercell proliferation.
The role of soy bioactive components in estrogen metabolism has been a topic ofactive research, and several studies have been conducted to determine the effect of soycomponents on estrogens. Supplementation of soy products (soymilk, soy isoflavonemixture, or soy protein) either had no effect on serum estradiol levels in premenopausal(111–115) and postmenopausal women (116,117) or reduced serum estradiol levels inpremenopausal (118,119) and postmenopausal women (120). Soy products also resultedin a nonsignificant effect (111–115,119) or significant increase (116,120,121) of serumsex hormone-binding globulin levels. These results suggest that soy components mayact by reducing estrogen bioactivity in human.
The data from animal studies on soy supplementation and estrogen metabolism arelimited. Genistein reduced ER-α protein levels in MCF-7 cells in vitro (122). We didnot find significant modulation of either ER-α or -β in MCF-7 tumors by soy treatment(38). However, the combination of SPC and green tea synergistically reduced ER-α pro-tein levels in MCF-7 tumors (38), an outcome that suggests a possible mechanism forpotent synergistic effects of the soy–green tea combination on estrogen-dependentbreast tumors.
The effects of soy products on androgens in humans have not been adequately studied.Instead, animal studies have been conducted to determine the effects of soy componentson androgen modulation. We found that dietary genistein significantly inhibited LNCaPprostate tumor growth and reduced serum levels of DHT and testosterone/DHT ratios(62), suggesting that genistein may inhibit 5α-reductase in vivo. Soy phytochemicals didnot significantly modulate serum levels of androgens (62,63). However, the combinationof SPC with green tea significantly reduced serum levels of total testosterone and DHT(63), suggesting that interactive modulation of androgen levels is one of the importantmechanisms for the synergistic prevention of CaP progression by the soy–green tea com-bination. Studies by other groups indicate that dietary genistein downregulated androgen

Chapter 5 / Soy Consumption and Cancer Prevention 147
receptor and ER-α and -β messenger RNA expression in the dorsolateral prostate in adose-dependent manner (123). However, soy products did not significantly modulate theexpression of androgen receptor in LNCaP tumors in our study (62).
3. CRITICAL ISSUES IN SOY AND CANCER PREVENTION RESEARCH
A growing body of evidence from both epidemiological and animal studies suggeststhat soybean may contain bioactive components that can prevent certain forms of can-cer, such as BRCA, CaP, and possibly CRC. However, a large gap in data exists betweenanimal and human studies that is a barrier to advancing the soy and cancer preventionhypothesis. Identification of the following critical issues will provide direction forfuture research in the area of soy and cancer prevention.
3.1. Identifying Bioactive Components in SoySoybeans contain a diverse array of components. Although some components are
“bioactive” and the others are “inactive,” it is possible that the presence of these activecomponents may exert an additive or even synergistic action. It is also possible thatsome inactive components are required for the “active” components to be active.Process of soybeans results in concentration of certain types of bioactive componentsbut may remove other bioactive and/or cofactors. Soy products used in clinical and ani-mal studies contain a substantial variation in compositions, and the results of trials withdifferent products are mixed. Well-characterized bioactive soy products need to bedeveloped for clinical prevention study. Researchers should also clearly identify whatthey use in published studies. In addition, soy components may demonstrate differentbioactivity for different forms of cancer or different subgroups of cancer. Therefore, dif-ferent soy components may be more useful for prevention of specific types of cancer orphenotypes.
3.2. Application of Experimental Models for EvaluationSuccessful identification of bioactive soy components requires application of appropri-
ate testing systems, both in vitro and animal models. Although in vitro cell culture systemsprovide a fast and inexpensive screening system, it should be recognized that cell cultureis an artificial system with different metabolic and biological processes from the in vivosystem. Simple extrapolation of in vitro results to in vivo effects may be misleading.
Appropriate animal models are required to confirm any findings derived from the cellculture studies, identify other potential effective components, elucidate the in vivomechanisms of action, and validate biomarkers that may be used as intermediate end-points in future clinical trials. Bioactive components need to be validated and their tox-icity and side effects determined in animal tumor models before any clinicalinvestigations can be initiated. It is true that each animal model has its strengths andweaknesses. Therefore, it is important to use the most clinically relevant tumor modelspossible. For example, an orthotopic (intra-organ) tumor model may be more clinicallyrelevant than a subcutaneous tumor model, because the orthotopic tumor model maymimic the tumor microenvironment and epithelial/stromal cell interactions in humans.In addition, the tumor behavior or biology may be a better parameter in judging therelevance of an animal model. For example, although the ovariectomized mouse has asimilar level of blood estrogen as postmenopausal woman, estrogen-dependent MCF-7

148 Part II / Cancer Prevention
breast tumors do not grow in the intact female mouse, suggesting that estrogen in themouse may be less bioavailable to MCF-7 cells than that in patients with BRCA.Therefore, a clinically relevant animal model for estrogen-dependent human BRCAshould provide a blood estrogen concentration at a level that can support tumor growth,as seen in patients with BRCA.
3.3. Effects of Interactions Between Soy Bioactive Components and OtherDietary Components on Cancer Prevention
The soy and cancer prevention hypothesis was originally derived from epidemiolog-ical observations that Asian populations have reduced risks of certain forms of cancer,and those migrating to the United States increase their risks of cancer development. Infact, several food items in the Asian diet have been suggested to be associated withreduced cancer risk, and soy consumption is one of these dietary factors. Therefore, itis possible that reduced cancer risk in the Asian population is the outcome of additiveand/or synergistic effects among several dietary factors. Indeed, our animal studies indi-cated that soy phytochemicals and tea combination had a synergistic effect on prevent-ing the growth of both androgen-sensitive LNCaP prostate tumors andestrogen-dependent MCF-7 tumors (38,63). Unfortunately, few epidemiological inves-tigations and animal studies have looked at the combined effects among dietary compo-nents on cancer risk. Because different bioactive components may target different sitesin the process of carcinogenesis, combination of agents may lead to the development ofa multiagent strategy to maximize the complementary effects of different agents. Futureepidemiological investigations and animal studies to determine the combined effect ofsoy and other dietary components are needed.
3.4. Doses Needed for Laboratory and Clinical StudiesAnother critical issue that needs to be resolved is the proper dose needed to display
significant effects in clinical trials. Most animal studies found that higher doses of soybioactive components than those are usually found in the Asian diet are required toachieve significant effects. Several reasons may explain this difference: (a) it takeslonger for cancer to develop and progress in humans compared to animals, thus thehigher doses may be needed to achieve the significant effect in animal studies; and (b)most animal studies only evaluate the effect of a single soy bioactive component,whereas humans consume other soy bioactive components and bioactive componentsfrom other foods. Therefore, it is not surprising that a higher dose of a single bioactivecomponent may be required. The higher doses of a single soy component may berequired in clinical intervention studies to achieve a significant effect.
3.5. Selection of Population for Intervention Trials and IntermediateEndpoints for Evaluation of Effectiveness
Although it would be ideal to select a normal population for intervention trials anduse tumor incidence as the endpoint, such a study would be very costly and require along period of intervention. Therefore, subjects that are usually at high risk of develop-ing cancer are suitable candidates for intervention trials, and biomarkers that wouldreflect the cancer risk and respond to treatment should be used to evaluate the effec-tiveness of the intervention. However, caution is needed in selection of these subjects withdifferent genetic backgrounds. Although they have similarly high risks of developing
Chapter 5 / Soy Consumption and Cancer Prevention 149
cancer, the associated risk factors may be different. Soy bioactive components to be testedmay target only one of these risk factors; therefore, their responses to the treatment mayvary significantly.
Alternatively, cancer patients that have undergone treatments (chemotherapy,surgery, and/or radiation therapy) are another subgroup for secondary prevention trialsto determine the effect of the intervention regimen on tumor recurrence and progres-sion, and biomarkers that are related to tumor progression may be used as intermediateendpoints to evaluate the effectiveness of treatment. However, this type of interventionstudy may require even higher doses of bioactive components because of existence of thedisease. The doses used in primary intervention trials to prevent the development ofcarcinogenesis may not be sufficient to achieve significant effects in secondary preventiontrials to delay or reverse progression of tumorigenesis.
4. FUTURE RESEARCH
Identification of the critical issues in soy and cancer prevention allows us to proposeseveral priorities in the future research.
4.1. Application of Animal Models to Identify the Effective Soy BioactiveComponents
Despite limitations of each animal model, in vivo experiments using animal modelsthat represent different types of cancer and different stages of carcinogenesis processeshave contributed significantly to advances in cancer prevention research. Various typesof animal models are needed to establish the safety and efficacy of soy bioactive com-ponents. Although pure soy compounds may have specific effects, a combination ofseveral soy components may provide a more effective regimen for cancer prevention bytargeting several pathways. More research emphasis should focus on identification ofthe soy component(s) for early prevention. Chemical carcinogen-induced carcinogene-sis models are commonly used for this purpose. Several transgenic animal models, suchas the MMTV/neu transgenic mouse model for mammary carcinogenesis (29,30) andthe TRAMP model for prostate carcinogenesis (56), have been used to evaluate theeffects of soy components on prevention of these types of cancer.
4.2. Further Elucidation of Mechanisms and Identification and Verificationof Biomarkers as Intermediate Endpoints
Despite progression in mechanistic research, the in vivo mechanisms by which soybioactive components prevent carcinogenesis and tumorigenesis are largely unknown,and it is unclear what molecular events are responsible for inducing apoptosis andinhibiting proliferation and angiogenesis by soy bioactive components. Traditionalmethods of analysis of gene expression patterns have imposed a practical limit on thenumber of candidate genes. Highly parallel technologies exploiting sample hybridizationto oligonucleotide or complementary DNA arrays permit the expression levels of tensof thousands of genes to be monitored simultaneously and rapidly. With the advent of DNAmicroarray technology, quantitative comparisons of thousands of genes can be madesimultaneously. The application of this technology and/or other advanced technologies,such as proteomics, will greatly facilitate our mechanistic research and identification ofbiomarkers that could be used as intermediate endpoints.

150 Part II / Cancer Prevention
4.3. Clinical Intervention StudiesWith identification of effective bioactive components by animal studies, intervention
studies are an appropriate consideration to assess the clinical effects of these components.The golden standard is still the randomized, double-blinded, and placebo-controlledintervention trial. Because of high cost and long duration of this type of trial, alterna-tive trials with short and intermediate durations using smaller cohorts of a subgroup ofpatients with cancer may provide excellent and cost-effective approaches for efficacytesting. For example, patients with CaP prior to or following radical prostatectomy canbe used to determine the efficacy of soy intervention prior to surgery. Of course, thesetrials focus on clinically significant cancer and only assess the effects of soy compo-nents on secondary prevention. However, these trials are essential in the developmentof effective cancer prevention strategy by using soy bioactive components.
5. CONCLUSIONS AND RECOMMENDATIONS
The epidemiological evidence to date supports the association between increasedconsumption of soy foods and reduced risks of certain forms of cancer, such as BRCA,CaP, and possibly CRC. Animal studies further indicate that soybeans contain severalbioactive components that may provide the cancer prevention activity of soybeans.However, not all soy products are created equal. Different soy components may havedifferent bioactivities, and processing procedures may substantially alter the composi-tion of soy products. Much research is still required to determine whether a particularsoy product or a soy extract is safe and effective.
Based on epidemiological observations, it is appropriate to recommend increasedconsumption of soy foods or whole soy-based products. However, it is not recom-mended to consume soy extracts or supplements without knowledge of their safety andeffectiveness. In addition to increased consumption of soy foods, people should incor-porate other healthy dietary habits and lifestyles, such as increased consumption offruits and vegetables, reduced fat intake, increased tea drinking, and exercise. It isbelieved that supplementation of human diets with certain soybean products, together witha healthy dietary pattern and lifestyle, could markedly reduce the risk and the mortalityrate of human cancers.
REFERENCES1. Henderson BE, Bernstein L. The international variation in breast cancer rates: an epidemiological
assessment. Breast Cancer Res Treat, 1991; 18: S11–S17.2. Ziegler RG, Hoover RN, Pike MC, et al. Migration patterns and breast cancer risk in Asian-
American women. J Natl Cancer Inst 1993; 85:1819–1827.3. Messina MJ, Loprinzi CL. Soy for breast cancer survivors: a critical review of the literature. J Nutr
2001; 131:3095S–3108S.4. Horn-Ross P, Hoggatt K, West D, et al. Recent diet and breast cancer risk: the California Teachers
Study (USA). Cancer Causes Control 2002; 13:407–415.5. Key TJ, Sharp GB, Appleby PN, et al. Soya foods and breast cancer risk: a prospective study in
Hiroshima and Nagasaki, Japan. Br J Cancer 1999; 81:1248–1256.6. Nagata C. Ecological study of the association between soy product intake and mortality from cancer
and heart disease in Japan. Int J Epidemiol 2000; 29:832–836.7. Yamamoto S, Sobue T, Kobayashi M, Sasaki S, Tsugane S. Soy, isoflavones, and breast cancer risk
in Japan. J Natl Cancer Inst 2003; 95:906–913,.8. den Tonkelaar I, Keinan-Boker L, Van’t Veer P, et al. Urinary phytoestrogens and postmenopausal
breast cancer risk. Cancer Epidemiol Biomark Prev 2001; 10:223–228.

Chapter 5 / Soy Consumption and Cancer Prevention 151
9. Horn-Ross, P. L., John, E. M., Lee, M., et al. Phytoestrogen consumption and breast cancer risk in amultiethnic Population: the Bay Area Breast Cancer Study. Am J Epidemiol 2001; 154:434–441.
10. Murkies A, Dalais FS, Briganti EM, et al. Phytoestrogens and breast cancer in postmenopausalwomen: a case control study. Menopause 2000; 7:289–296.
11. Dai Q, Franke A, Jin F, et al. Urinary excretion of phytoestrogens and risk of breast cancer amongChinese women in Shanghai. Cancer Epidemiol Biomark Prev 2002; 11:815–821.
12. Ingram D, Sanders K, Kolybaba M, Lopez D. Case-control study of phyto-oestrogens and breastcancer. Lancet 1997; 350:990–994.
13. Shu XO, Jin F, Dai Q, et al. Soyfood intake during adolescence and subsequent risk of breast canceramong Chinese women. Cancer EpidemiolBiomark Prev 2001; 10:483–488.
14. Wu AH, Wan P, Hankin J, Tseng CC, Yu MC, Pike MC. Adolescent and adult soy intake and risk ofbreast cancer in Asian-Americans. Carcinogenesis 2002; 23:1491–1496.
15. Zheng W, Dai Q, Custer LJ., et al. Urinary excretion of isoflavonoids and the risk of breast cancer.Cancer EpidemiolBiomark Prev 1999; 8:35–40.
16. Dai Q, Shu XO, Jin F, et al. Population-based case-control study of soyfood intake and breast can-cer risk in Shanghai. Br J Cancer 2001; 85:372–378.
17. Maskarinec G, Williams A, Carlin L. Mammographic densities in a one-year isoflavone intervention.Eur J Cancer Prev 2003; 12:165–169.
18. Appelt LC, Reicks MM. Soy induces phase II enzymes but does not inhibit dimethylbenz[a]-anthracene-induced carcinogenesis in female rats. J Nutr 1999; 129:1820–1826.
19. Cohen LA, Zhao Z, Pittman B, Scimeca JA. Effect of intact and isoflavone-depleted soy protein onNMU-induced rat mammary tumorigenesis. Carcinogenesis 2000; 21:929–935.
20. Constantinou AI, Lantvit D, Hawthorne M, Xu X, van Breemen RB, Pezzuto JM. Chemopreventiveeffects of soy protein and purified soy isoflavones on DMBA-induced mammary tumors in femaleSprague-Dawley rats. Nutr Cancer 2001; 41:75–81.
21. Gallo D, Giacomelli S, Cantelmo F, et al. Chemoprevention of DMBA-induced mammary cancer inrats by dietary soy. Breast Cancer Res Treat 2001; 69:153–164.
22. Lamartiniere CA, Wang J, Smith-Johnson M, Eltoum IE. Daidzein: bioavailability, potential forreproductive toxicity, and breast cancer chemoprevention in female rats. Toxicologic Sciences 2002;65:228–238.
23. Zaizen Y, Higuchi Y, Matsuo N, Shirabe K, Tokuda H, Takeshita M. Antitumor effects of soybeanhypocotyls and soybeans on the mammary tumor induction by N-methyl-n-nitrosourea in F344 rats.Anticancer Res 2000; 20:1439–1444.
24. Hakkak R, Korourian S, Shelnutt SR, Lensing S, Ronis MJ, Badger, TM. Diets containing wheyproteins or soy protein isolate protect against 7,12-dimethylbenz(a)anthracene-induced mammarytumors in female rats. Cancer Epidemiol Biomark Prev 2000; 9:113–117.
25. Fritz WA, Coward L, Wang J, Lamartiniere CA. Dietary genistein: perinatal mammary cancer pre-vention, bioavailability and toxicity testing in the rat. Carcinogenesis 1998; 19:2151–2158.
26. Badger TM, Ronis MJ, Hakkak R. Developmental effects and health aspects of soy protein isolate,casein, and whey in male and female rats. Int J Toxicol 2001; 20:165–174.
27. Gotoh T, Yamada K, Yin H, Ito A, Kataoka T, Dohi K. Chemoprevention of N-nitroso-N-methylurea-induced rat mammary carcinogenesis by soy foods or biochanin A. Jpn J Cancer Res 1998; 89:137–142.
28. Ohta T, Nakatsugi S, Watanabe K, et al. Inhibitory effects of bifidobacterium-fermented soy milk on2-amino-1-methyl-6-phenylimidazo[4,5-b]pyridine-induced rat mammary carcinogenesis, with apartial contribution of its component isoflavones. Carcinogenesis 2000; 21:937–941.
29. Jin Z, MacDonald RS. Soy Isoflavones increase latency of spontaneous mammary tumors miceJ Nutr 2002; 132:3186–3190.
30. Yang X, Edgerton SM, Kosanke SD, et al. Hormonal and dietary modulation of mammary carcino-genesis in mouse mammary tumor virus-c-erbB-2 transgenic mice. Cancer Res 2003; 63:2425–2433.
31. Mizunuma H, Kanazawa K, Ogura S, Otsuka S, Nagai H. Anticarcinogenic effects of isoflavonesmay be mediated by genistein in mouse mammary tumor virus-induced breast cancer. Oncology2002;62:78–84.
32. Yuan L, Wagatsuma C, Yoshida M, et al. Inhibition of human breast cancer growth by GCP (genis-tein combined polysaccharide) in xenogeneic athymic mice: involvement of genistein biotransfor-mation by beta-glucuronidase from tumor tissues. Mutat Res 2003; 523,524: 55–62.
33. Yan L, Li D, Yee JA. Dietary supplementation with isolated soy protein reduces metastasis of mam-mary carcinoma cells in mice. Clin Exp Metastasis 2002; 19:535–540.
152 Part II / Cancer Prevention
34. Hsieh C -Y, Santell RC, Haslam SZ, Helferich WG. Estrogenic effects of genistein on the growth ofestrogen receptor-positive human breast cancer (MCF-7) cells in vitro and in vivo. Cancer Res 1998;58:3833–3838.
35. Ju YH, Allred CD, Allred KF, Karko KL, Doerge DR, Helferich WG. Physiological concentrationsof dietary genistein dose-dependently stimulate growth of estrogen-dependent human breast cancer(MCF-7) tumors implanted in athymic nude mice. J Nutr 2001; 131:2957–2962.
36. Allred CD, Ju YH, Allred KF, Chang J, Helferich WG. Dietary genistin stimulates growth of estro-gen-dependent breast cancer tumors similar to that observed with genistein. Carcinogenesis 2001;22:1667–1673.
37. Allred CD, Allred KF, Ju YH, Virant SM, Helferich WG. Soy diets containing varying amounts ofgenistein stimulate growth of estrogen-dependent (MCF-7) tumors in a dose-dependent manner.Cancer Res 2001; 61:5045–5050.
38. Zhou J-R, Yu L, Mai Z, Blackburn GL. Combined inhibition of estrogen-dependent human breastcarcinoma by soy and tea bioactive components in mice. Int J Cancer 2004; 108:8–14.
39. Shao Z-M, Wu J, Shen Z-Z, Barsky SH. Genistein exerts mutiple suppressive effects on humanbreast carcinoma cells. Cancer Res 1998; 58:4851–4857.
40. Brodie A, Lu Q, Nakamura J. Aromatase in the normal breast and breast cancer. J Steroid BiochemMol Biol, 1997; 61:281–286.
41. Soule HD, McGrath CM. Estrogen responsive proliferation of clonal human breast carcinoma cellsin athymic mice. Cancer Lett 1980; 10:177–189.
42. Wang T, Sathyamoorthy N, Phang JM. Molecular effects of genistein on estrogen receptor mediatedpathways. Carcinogenesis 1997; 17:271–275.
43. So FV, Guthrie N, Chambers AF, Carroll KK. Inhibition of proliferation of estrogen receptor-positiveMCF-7 human breast cancer cells by flavonoids in the presence and absence of excess estrogen.Cancer Lett 1997; 112:127–133.
44. Hebert JR, Hurley TG, Olendzki BC, Teas J, Ma Y, Hampl J. S. Nutritional and socioeconomic fac-tors in relation to prostate cancer mortality: a cross-national study. J Natl Cancer Inst 1998; 90:1637–1647.
45. Jacobsen BK, Knutsen SF, Fraser GE. Does high soy milk intake reduce prostate cancer incidence?The Adventist Health Study (United States). Cancer Causes Control 1998; 9:553–557.
46. Kolonel LN, Hankin JH, Whittemore AS, et al. Vegetables, fruits, legumes and prostate cancer:a multiethnic case-control study. Cancer Epidemiol Biomark Prev 2000; 9:795–804.
47. Villeneuve P, Johnson K, Kreiger N, Mao Y. Risk factors for prostate cancer: results from theCanadian National Enhanced Cancer Surveillance System. Cancer Causes Control 1999; 10:355–367.
48. Strom SS, Yamamura Y, Duphorne CM, et al. Phytoestrogen intake and prostate cancer: a case-con-trol study using a new database. Nutr Cancer 1999; 33:20–25.
49. Akaza H, Miyanaga N, Takashima N, et al. Is daidzein non-metabolizer a high risk for prostate cancer?A case-controlled study of serum soybean isoflavone concentration. Jpn J Clin Oncol 2002; 32:296–300.
50. Kato K, Takahashi S, Cui L, et al. Suppressive effects of dietary genistin and daidzin on rat prostatecarcinogenesis. Jpn J Cancer Res 2000; 91:786–791.
51. Onozawa M, Kawamori T, Baba M, et al. Effects of a soybean isoflavone mixture on carcinogene-sis in prostate and seminal vesicles of F344 rats. Jpn J Cancer Res 1999; 90:393–398.
52. Pollard M, Wolter W, Sun L. Prevention of induced prostate-related cancer by soy proteinisolate/isoflavone-supplemented diet in Lobund-Wistar rats. In Vivo 2000; 14:389–392.
53. Wang J, Eltoum I, Lamartiniere C. Dietary genistein suppresses chemically induced prostate cancerin Lobund-Wistar rats. Cancer Lett 2002; 186:11–18.
54. Pollard M, Wolter W. Prevention of spontaneous prostate-related cancer in Lobund-Wistar rats by asoy protein isolate/isoflavone diet. Prostate 2000; 45:101–105.
55. Pollard M, Wolter W, Sun L. Diet and the duration of testosterone-dependent prostate cancer inLobund-Wistar rats. Cancer Lett 2001; 173:127–131.
56. Mentor-Marcel R, Lamartiniere CA, Eltoum IE, Greenberg NM, Elgavish A. Genistein in the dietreduces the incidence of poorly differentiated prostatic adenocarcinoma in transgenic mice(TRAMP). Cancer Res 2001; 61:6777–6782.
57. Landstrom M, Zhang J-X, Hallmans G, et al. Inhibitory effects of soy and rye diets on the develop-ment of Dunning R3327 prostate adenocarcinoma in rats. Prostate 1998; 36:151–161.
58. Cohen LA, Zhao Z, Pittman B, Scimeca J. Effect of soy protein isolate and conjugated linoleic acidon the growth of Dunning R-3327-AT-1 rat prostate tumors. Prostate 2003; 54:169–180.

Chapter 5 / Soy Consumption and Cancer Prevention 153
59. Bylund A, Zhang JX, Bergh A, et al. Rye bran and soy protein delay growth and increase apoptosisof human LNCaP prostate adenocarcinoma in nude mice. Prostate 2000; 42:304–314.
60. Aronson WJ, Tymchuk CN, Elashoff RM, et al. Decreased growth of human prostate LNCaP tumorsin SCID mice fed a low-fat, soy protein diet with isoflavones. Nutr Cancer 1999; 35:130–136.
61. Wan XS, Ware JH, Zhang L,. Treatment with soybean-derived Bowman Birk inhibitor increasesserum prostate-specific antigen concentration while suppressing growth of human prostate cancerxenografts in nude mice. Prostate 1999; 41:243–252.
62. Zhou J-R, Yu L, Zhong Y, et al. Inhibition of orthotopic growth and metastasis of androgen-sensitivehuman prostate tumors in mice by bioactive soybean components. Prostate 2002; 53:143–153.
63. Zhou J-R, Yu L, Zhong Y, Blackburn GL. Soy phytochemicals and tea bioactive components syner-gistically inhibit androgen-sensitive human prostate tumors in mice. J Nutr 2003; 133:516–521.
64. Messina M, Bennink M. Soyfoods, isoflavones and risk of colonic cancer: a review of the in vitroand in vivo data. Baillieres Clin Endocrinol Metab 1998; 12:707–728.
65. Seow A, Quah S, Nyam D, Straughan P, Chua T, Aw T. Food groups and the risk of colorectal car-cinoma in an Asian population. Cancer 2002; 95:2390–2396.
66. Le Marchand L, Hankin JH, Wilkens LR, Kolonel LN, Englyst HN, Lyu LC. Dietary fiber and col-orectal cancer risk. Epidemiology 1997; 8:658–665.
67. Nishi M, Yoshida K, Hirata K, Miyake H. Eating habits and colorectal cancer. Oncol Report 1997;4:995–998.
68. Bennink MR. Dietary soy reduces colon carcinogenesis in human and rats. Soy and colon cancer.Advances Experiment Med Biol 2001; 492:11–17.
69. Sorensen IK, Kristiansen E, Mortensen A, et al. The effect of soy isoflavones on the development ofintestinal neoplasia in ApcMin mouse. Cancer Lett 1998; 130:217–225.
70. Azuma N, Suda H, Iwasaki H, Kanamoto R, Iwami K. Soybean curd refuse alleviates experimentaltumorigenesis in rat colon. Biosci Biotechnol Biochem, 1999; 63:2256–2258.
71. Azuma N, Suda H, Iwasaki H, et al. Antitumorigenic effects of several food proteins in a rat modelwith colon cancer and their reverse correlation with plasma bile acid concentration. J Nutr SciVitaminol (Tokyo), 2000; 46:91–96.
72. Azuma N, Machida K, Saeki T, Kanamoto R, Iwami K. Preventive effect of soybean resistant pro-teins against experimental tumorigenesis in rat colon. J Nutr Sci Vitaminol (Tokyo), 2000; 46:23–29.
73. Azuma N, Kanaya M, Kanamoto R, Iwami K. Feeding soybean resistant protein to rats raises fecalbile acid excretion but counteracts a deoxycholate-caused decrease in colonic aberrant crypt foci.J Nutr Sci Vitaminol (Tokyo), 1999; 45:183–192.
74. Hakkak R, Korourian S, Ronis MJ, Johnston JM, Badger TM. Soy protein isolate consumption pro-tects against azoxymethane-induced colon tumors in male rats. Cancer Lett, 2001; 166:27–32.
75. Koratkar R, Rao AV. Effect of soya bean saponins on azoxymethane-induced preneoplastic lesionsin the colon of mice. Nutr Cancer 1997; 27:206–209.
76. Thiagarajan DG, Bennink MR, Bourquin LD, Kavas FA. Prevention of precancerous colonic lesionsin rats by soy flakes, soy flour, genistein, and calcium. Am J Clin Nutr 1998; 68:1394S–1399S.
77. Rao CV, Wang CX, Simi B, et al. Enhancement of experimental colon cancer by genistein. CancerRes 1997; 57:3717–3722.
78. Kennedy A, Billings P, Wan X, Newberne P. Effects of Bowman-Birk inhibitor on rat colon car-cinogenesis. Nutr Cancer 2002; 43:174–186.
79. Gee J, Noteborn H, Polley A, Johnson I. Increased induction of aberrant crypt foci by 1,2-dimethyl-hydrazine in rats fed diets containing purified genistein or genistein-rich soya protein.Carcinogenesis 2000; 21:2255–2259.
80. Nagata C, Takatsuka N, Kawakami N, Shimizu H. A prospective cohort study of soy product intakeand stomach cancer death. Br J Cancer, 2002; 87:31–36.
81. Ngoan L, Mizoue T, Fujino Y, Tokui N, ad Yoshimura T. Dietary factors and stomach cancer mor-tality. Br J Cancer 2002; 87:37–42.
82. Takezaki T, Gao C, Ding J, Liu T, Li M, Tajima K. Comparative study of lifestyles of residents inhigh and low risk areas for gastric cancer in Jiangsu Province, China; with special reference to alliumvegetables. J Epidemiol 1999; 9:297–305.
83. Huang X-E, Tajima K, Hamajima N, et al. Effects of dietary, drinking, and smoking habits on theprognosis of gastric cancer. Nutr Cancer 2000; 38:30–36.
84. Ji B-T, Wong-Ho Chow W-H, Yang G, et al. Dietary habits and stomach cancer in Shanghai, China.Int J Cancer 1998; 76:659–664.

154 Part II / Cancer Prevention
85. Gao C, Takezaki T, Ding J, Li M, Tajima K. Protective effect of allium vegetables against bothesophageal and stomach cancer: a simultaneous case-referent study of a high-epidemic area inJiangsu Province, China. Jpn J Cancer Res 1999; 90:614–621.
86. Goodman MT, Wilkens LR, Hankin JH, Lyu LC, Wu AH, Kolonel LN. Association of soy and fiberconsumption with the risk of endometrial cancer. Am J Epidemiol 1997; 146:294–306.
87. Horn-Ross P, John E, Canchola A, Stewart S, Lee M. Phytoestrogen intake and endometrial cancerrisk. J Natl Cancer Inst 2003; 95:1158–1164.
88. Zhang M, Yang Z, Binns C, Lee A. Diet and ovarian cancer risk: a case-control study in China. BrJ Cancer 2002; 86:712–717.
89. Hu J, Johnson K, Mao Y, et al. A case-control study of diet and lung cancer in northeast China. IntJ Cancer 1997; 71:924–931.
90. Seow A, Poh W, Teh M, et al. Diet, reproductive factors and lung cancer risk among Chinese womenin Singapore: evidence for a protective effect of soy in nonsmokers. Int J Cancer 2002; 97:365–371.
91. Takezaki T, Hirose K, Inoue M, et al. Dietary factors and lung cancer risk in Japanese: with specialreference to fish consumption and adenocarcinomas. Br J Cancer 2001; 84:1199–1206.
92. Wakai K, Ohno Y, Genka K, et al. Risk modification in lung cancer by a dietary intake of preservedfoods and soyfoods: findings from a case-control study in Okinawa, Japan. Lung Cancer 1999;25:147–159.
93. Horn-Ross PL, Hoggatt, KJ, Lee MM. Phytoestrogens and thyroid cancer risk: the San FranciscoBay Area Thyroid Cancer Study. Cancer Epidemiol Biomark Prev 2002; 11:43–49.
94. Haselkorn T, Stewart SL, Horn-Ross PL. Why are thyroid cancer rates so high in Southeast Asianwomen living in the United States? The Bay Area Thyroid Cancer Study. Cancer Epidemiol BiomarkPrev 2003; 12:144–150.
95. Lu CM, Lan SJ, Lee YH, Huang JK, Huang CH, Hsieh CC. Tea consumption: fluid intake and blad-der cancer risk in Southern Taiwan. Urology 1999; 54:823–828.
96. Sun CL, Yuan JM, Arakawa K, Low SH, Lee HP, Yu MC. Dietary soy and increased risk of bladdercancer: the Singapore Chinese Health Study. Cancer Epidemiol Biomark Prev 2002; 11:1674–1677.
97. Zhou J-R, Mukherjee P, Gugger ET, Tanaka T, Blackburn GL, Clinton SK. The inhibition of murinebladder tumorigenesis by soy isoflavones via alterations in the cell cycle, apoptosis, and angiogenesis.Cancer Res 1998; 58:5231–5238.
98. Ward MH, Pan WH, Cheng YJ, et al. Dietary exposure to nitrite and nitrosamines and risk ofnasopharyngeal carcinoma in Taiwan. Int J Cancer 2000; 86:603–609.
99. Lei B, Roncaglia V, Vigano R, et al. Phytoestrogens and liver disease. Mol Cell Endocrinol 2002;193:81–84.
100. Record IR, Broadbent JL, King RA, Dreosti IE, Head RJ, Tonkin AL. Genistein inhibits growth ofB16 melanoma cells in vivo and in vitro and promotes differentiation in vitro. Int J Cancer 1997;72:860–864.
101. Li D, Yee JA, McGuire MH, Murphy PA, Yan L. Soybean isoflavones reduce experimental metasta-sis in mice. J Nutr 1999; 129:1075–1078.
102. Yan L, Yee J, McGuire M, Graef G. Effects of dietary supplementation of soybeans on experimen-tal metastasis of melanoma cells in mice. Nutr Cancer 1997; 29:1–6.
103. Zhou J-R, Gugger ET, Tanaka T, Guo Y, Blackburn GL, Clinton SK. Soybean phytochemicals inhibitthe growth of transplantable human prostate carcinoma and tumor angiogenesis in mice. J Nutr 1999;129:1628–1635.
104. Li Y, Upadhyay S, Bhuiyan M, Sarkar FH. Induction of apoptosis in breast cancer cells MDA-MB-231 by genistein. Oncogene 1999; 18:3166–3172.
105. Shao ZM, Alpaugh ML, Fontana JA, Barsky SH. Genistein inhibits proliferation similarly in estro-gen receptor-positive and negative human breast carcinoma cell lines characterized byP21WAF1/CIP1 induction, G2/M arrest, and apoptosis. J Cell Biochem 1998; 69:44–54.
106. Choi YH, Zhang L, Lee WH, Park KY. Genistein-induced G2/M arrest is associated with the inhibi-tion of cyclin B1 and the induction of p21 in human breast carcinoma cells. Int J Oncol 1998;13:391–396.
107. Choi YH, Lee WH, Park KY, Zhang L. p53-independent induction of p21 (WAF1/CIP1), reductionof cyclin B1 and G2/M arrest by the isoflavone genistein in human prostate carcinoma cells.Japanese J Cancer Res 2000; 91:164–173.
108. McCabe MJ, Orrenius S. Genistein induces apoptosis in immature human thymocytes by inhibitingtopoisomerase-II. Biochemical Biophysic Res Communications 1993; 194:944–950.

Chapter 5 / Soy Consumption and Cancer Prevention 155
109. Salti GI, Grewal S, Mehta RR, Das Gupta TK, Boddie AW Jr, Constantinou AI. Genistein inducesapoptosis and topoisomerase II-mediated DNA breakage in colon cancer cells. Eur J Cancer 2000;36:796–802.
110. Folkman J. What is the evidence that tumors are angiogenesis dependent? J Natl Cancer Inst 1989;82:4–6.
111. Nagata C, Takatsuka N, Inaba S, Kawakami N, Shimizu H. Effect of soymilk consumption on serumestrogen concentrations in premenopausal Japanese women. J Natl Cancer Inst 1998; 90:1830–1835.
112. Wu AH, Stanczyk FZ, Hendrich S, et al. Effects of soy foods on ovarian function in premenopausalwomen. Br J Cancer 2000; 82:1879–1886.
113. Duncan AM, Merz BE, Xu X, Nagel TC, Phipps WR, Kurzer MS. Soy isoflavones exert modest hor-monal effects in premenopausal women. J Clin Endocrinol Metab 1999; 84:192–197.
114. Brown B, Thomas W, Hutchins A, Martini M, Slavin J. Types of dietary fat and soy minimally affecthormones and biomarkers associated with breast cancer risk in premenopausal women. Nutr Cancer2002; 43:22–30.
115. Maskarinec G, Williams AE, Inouye JS, Stanczyk FZ, Franke AA. A randomized isoflavone inter-vention among premenopausal women. Cancer Epidemiol Biomark Prev 2002; 11:195–201.
116. Persky VW, Turyk ME, Wang L, et al. Effects of soy protein on endogenous hormones in post-menopausal women. Am J Clin Nutr 2002; 75:145–153.
117. Pino AM, Valladares LE, Palma MA, Mancilla AM, Yanez M, Albala C. Dietary isoflavones affectsex hormone-binding globulin levels in postmenopausal women. J Clin Endocrinol Metab 2000;85:2797–2800.
118. Lu LJ, Anderson KE, Grady JJ, Kohen F, Nagamani M. Decreased ovarian hormones during a soyadiet: implications for breast cancer prevention. Cancer Research 2000; 60:4112–4121.
119. Lu L-JW, Anderson KE, Grady JJ, Nagamani M. Effects of an isoflavone-free soy diet on ovarianhormones in premenopausal women. J Clin Endocrinol Metab 2001; 86:3045–3052.
120. Duncan AM, Underhill KE, Xu X, Lavalleur J, Phipps WR, Kurzer MS. Modest hormonal effects ofsoy isoflavones in postmenopausal women. J Clin Endocrinol Metab 1999; 84:3479–3484.
121. Brzezinski A, Aldercreutz H, Shaoul R, Rosler A, Shmueli A, Tanos V, Schenker JG. Short-termeffects of phytoestrogen-rich diet on postmenopausal women. Menopause 1997; 4:89–94.
122. Diel P, Olff S, Schmidt S, Michna H. Molecular identification of potential selective estrogen recep-tor modulator (SERM) like properties of phytoestrogens in the human breast cancer cell line MCF-7. Planta Med 200167:510–514.
123. Fritz WA, Wang J, Eltoum IE, Lamartiniere CA. Dietary genistein down-regulates androgen andestrogen receptor expression in the rat prostate. Mol Cell Endocrinol 2002; 186:89–99.
124. Davies MJ, Bowey EA, Adlercreutz H, Rowland IR, Rumsby PC. Effects of soy or rye supplemen-tation of high-fat diets on colon tumour development in azoxymethane-treated rats. Carcinogenesis1999; 20:927–931.


From: Preventive Nutrition: The Comprehensive Guide for Health Professionals, Third EditionEdited by: A. Bendich and R. J. Deckelbaum © Humana Press Inc., Totowa, NJ
157
6 Tomato, Lycopene, and Prostate Cancer
Jessica K. Campbell and John W. Erdman, Jr.
KEY POINTS
● Prostate cancer is the second leading cause of cancer death of men in the United States.● Americans consume large quantities of tomatoes and tomato products, which contain
various nutrients and phytochemicals, including lycopene.● Epidemiological evidence strongly indicates a relationship between the increased con-
sumption of tomatoes, tomato products, and lycopene and a reduced risk of prostate cancer.● In vitro studies demonstrate that lycopene and other carotenoids decrease cancer cell
proliferation in various cancer lines, including prostate cancer cells.● In vivo animal studies indicate that consumption of a tomato powder diet delays chem-
ically induced prostate cancer compared to the control diet.● Lycopene is found in human tissues and serum and is the major carotenoid found in the
human prostate.● Plausible mechanisms of action for lycopene include acting as a singlet oxygen quencher,
upregulating cellular communication, and modulation of xenobiotic metabolism.● Because tomatoes contain a variety of phytochemicals in addition to lycopene, potential
interactions and synergies may exist between these compounds to contribute to areduction in prostate cancer.
1. INTRODUCTION
Prostate cancer (CaP) is the second leading cause of cancer death of men in the UnitedStates. In 2004, an estimated 230,000 new cases will be diagnosed and an estimated 29,900deaths will occur in the United States (1). Approaches for the prevention of CaP, such asnutrition and diet, are currently under intense investigation. Epidemiological evidence indi-cates that a diet rich in fruits and vegetables is associated with a lower risk of many formsof cancer (2). Dietary components found in fruits and vegetables, such as fiber, vitamins,minerals, and phytochemicals, may act through specific or interactive mechanisms to pro-vide cancer protection. The protective effects of tomatoes, tomato products, and thecarotenoid lycopene are an ongoing focus of CaP research. This chapter initially reviewsthe composition of tomatoes and tomato products and then evaluates their potentialrelationship with a reduced risk of CaP. This chapter examines various in vitro and in vivo

158 Part II / Cancer Prevention
studies, as well as plausible mechanisms of action of lycopene on CaP. Finally, futureresearch efforts in the area are suggested and patient recommendations are reviewed.
2. TOMATO CONSUMPTION AND COMPOSITION
Americans consume large quantities of tomatoes and tomato products; the consump-tion of these ranks second of all vegetables (3). In 1995, a net total of 13.3 million tonsof tomatoes were available for consumption, 85% of which were processed into productssuch as paste, puree, juice, and sauce and were either consumed or used as ingredientsin other processed foods (3). Because of this large production and consumption, toma-toes and tomato products serve as a ready and convenient way to provide necessarynutrients to humans.
Tomatoes contain various nutrients and phytochemicals. Tomatoes have varyingconcentrations of many essential vitamins and minerals, including folate, potassium,vitamin C, provitamin A carotenoids, and vitamin E (3). The amounts of these nutrientsalong with the carotenoid contents in different tomato products are listed in Table 1. Themajor carotenoids include phytoene, phytofluene, ζ-carotene, neurosporene, lycopene,γ-carotene, and β-carotene. The red carotenoid, lycopene, has the highest carotenoidconcentration in tomatoes and tomato products. Although other foods contain lycopene,such as watermelon and pink grapefruit, the concentrations of lycopene in these fruitsare approximately one-half to one-fifth to that of canned tomatoes (3). Therefore, toma-toes are the major source of lycopene in the American diet. Furthermore, tomatoes con-tain various flavonoids such as quercetin, kaempferol (4), and naringenin (5). Many ofthese phytochemicals and nutrients have antioxidant properties and, in combinationwith lycopene, may contribute to the health benefits of tomatoes and tomato products,as discussed later in the chapter.
3. BIOAVAILABILITY: FOOD PROCESSING AND THE PRESENCEOF LIPIDS
Lycopene is an open-chain hydrocarbon carotenoid containing 40 carbon atoms and11 conjugated double bonds. It is found primarily (80–97%) in tomatoes and tomato
Table 1Nutrient and Carotenoid Contents of Selected Tomato Productsa
Tomato product mg/100 g
Cooked CannedNutrient tomatoes Carotenoid tomatoes Catsup Sauce
Folate (μg/100 g) 13 Phytoene 1.9 3.4 3.0Phytofluene 0.8 1.5 1.3
Potassium (mg/100 g) 279 ζ-Carotene 0.2 0.3 0.8Neurosporene 1.1 2.6 7.0
Vitamin A (IU/100 g) 743 Lycopene 9.3 17.2 18.0γ-Carotene 1.5 3.0 3.2
Vitamin C (mg/100 g) 23 β-Carotene 0.2 0.6 0.5aData from ref. 3.

Chapter 6 / Prostate Cancer and Tomato Products 159
products as the all-trans-linear isomer (6). Rotation around any of the conjugated doublebonds allows formation of numerous possible cis-isomers of lycopene.
Lycopene intake is not always equivalent to the amount absorbed. Many factors, suchas food processing, cooking, and the presence of dietary lipids, influence its availabilityfor absorption. The release of lycopene from the fibrous food matrix is the first neces-sary step in its absorption. Cooking or food processing has been shown to increase thebioavailability of lycopene by aiding in its release from the food matrix into the lipidphase of the meal (6). One study demonstrated that lycopene bioavailability fromtomato paste was approximately three times greater than that of fresh tomatoes inhumans, suggesting that processed tomato products may be more efficient sources oflycopene than raw tomatoes (7). Similar to other carotenoids, lycopene is lipophilic andhydrophobic and, therefore, poorly absorbed without the presence of fat in the samemeal. As demonstrated by Stahl and Sies (8), tomato juice consumption, preheated inthe presence of 1% corn oil, resulted in significantly increased total serum lycopeneconcentrations when compared to unheated tomato juice. Lycopene uptake by the ente-rocytes occurs through the formation of bile acid micelles, whose formation is stimu-lated by the presence of dietary fat. After being taken up by the enterocytes, lycopeneis subsequently packaged with triglycerides and phospholipids into chylomicrons fortransport into the mesenteric lymph and, ultimately, the portal blood (9).
Although tomato products primarily contain the all-trans conformation of lycopene,numerous studies have shown that tissues and serum of humans and animals preferentiallyaccumulate cis-isomers. Stahl and Sies (8) observed that serum from healthy human sub-jects contained 50% cis-isomers of lycopene after consumption of tomato juice that containedonly 20% cis-isomers. In a more recent study, lycopene was found to exist in human serumand prostate in 18 different isomer forms; however, the sum of the cis-isomers accountedfor the majority of the total lycopene (10). In addition, our laboratory demonstrated thepreferential absorption of cis-lycopene isomers using the ferret, an animal that absorbscarotenoids similarly to humans. In this study, ferrets were orally dosed with lycopenecontaining only 9% cis-isomers, yet mucosa, lymph, blood, and tissues all contained sig-nificantly more cis-lycopene isomers (approx 50%) than that of stomach or intestinal con-tents (11). In vitro experiments suggest that cis-isomers are taken up more readily by lipidmicelles and, therefore, more easily absorbed by enterocytes (11).
4. EPIDEMIOLOGY
An abundance of epidemiological evidence suggests that a diet rich in fruits and veg-etables is associated with a lower risk of several types of cancer. Earlier work by Blocket al. (2) examined approx 200 epidemiological studies and found a positive relation-ship between higher intake of fruits and vegetables and reduced risks of some types ofcancer, including cancer of the lung, colon, breast, cervix, esophagus, oral cavity, stom-ach, bladder, pancreas, and ovary. Consumption of fruits and/or vegetables providedstatistically significant protection from various forms of cancer in 128 of 156 dietarystudies. In fact, a twofold increased risk was observed at most cancer sites for those witha low intake of fruits and vegetables, after controlling for confounding factors (2).However, in that review, the studies regarding CaP were inconclusive.
More recently, several epidemiological studies have specifically analyzed the rela-tionship between consumption of tomatoes, tomato products, and lycopene and CaP risk(Table 2). Of particular interest is that of a large, comprehensive dietary prospective

160 Part II / Cancer PreventionT
able
2Su
mm
ary
of S
elec
ted
Epid
emio
logi
cal S
tudi
es E
valu
atin
g th
e R
ole
of T
omat
oes,
Lyco
pene
, and
Pro
stat
e C
ance
r R
iska
Pub
lica
tion
St
atis
tica
l(y
ear)
Stud
y ty
peSu
bjec
tsD
ieta
ry v
aria
ble
Ris
ksi
gnifi
canc
e
Gio
vann
ucci
Coh
ort
47,8
94 M
enD
ieta
ry in
take
of
tom
ato
RR
=0.
65Y
eset
al.
(199
5)77
3 C
ases
>10
ser
ving
s/w
k vs
(p=
0.01
)<
1.5
serv
ings
/wk
Raw
tom
ato
inta
keR
R =
0.74
Yes
2–4
serv
ings
/wk
vs n
one
(p=
0.03
)To
mat
o sa
uce
RR
=0.
66Y
es2–
4 se
rvin
gs/w
k vs
non
e(p
=0.
001)
Pizz
aR
R =
0.85
Yes
2–4
serv
ings
/wk
vs n
one
(p =
0.05
)G
ann
et a
l. N
este
d ca
se–
14,9
16 M
enPl
asm
a ly
cope
ne q
uint
iles
All
case
sN
o(1
999)
cont
rol
578
Cas
es>
580.
1 ng
/mL
vsO
R =
0.75
1294
Con
trol
s<
261.
7 ng
/mL
Agg
ress
ive
case
sY
esO
R =
0.56
(p =
0.05
)C
ohen
et a
l.C
ase–
cont
rol
628
Cas
esC
ooke
d/ra
w to
mat
o in
take
Coo
ked
tom
ato
No
(200
0)60
2 C
ontr
ols
≥3 s
ervi
ngs/
wk
OR
=0.
90<
1 se
rvin
gs/w
kR
aw to
mat
oN
oO
R =
1.22
Gio
vann
ucci
et a
l. C
ohor
t47
,365
Men
Lyco
pene
inta
kes
RR
=0.
84Y
es(2
002)
2481
Cas
esap
prox
18,
780
μg/d
vs
(p =
0.00
3)ap
prox
341
5 μg
/dTo
mat
o sa
uce
All
case
sY
es≥2
ser
ving
s/w
k vs
RR
=0.
77(p
< 0
.001
)<
1 se
rvin
g/m
oA
dvan
ced
case
sY
esR
R =
0.65
(p =
0.02
)aD
ata
from
ref
. 16.
RR
, rel
ativ
e ri
sk; O
R, o
dds
ratio
.
160

Chapter 6 / Prostate Cancer and Tomato Products 161
study by Giovannucci and colleagues (12), which reported that high intake of lycopenewas related to a statistically significant reduction of CaP risk by 21% when comparedto the intake of carotenoids β-carotene, α-carotene, lutein, and β-cryptoxanthin. Thisstudy was composed of over 47,000 men from the Health Professionals Follow-upStudy (HPFS) who were followed from 1986 to 1992 and periodically answered ques-tionnaires concerning medical conditions, lifestyle, and diet. Participants answered a131-item food-frequency questionnaire in 1986 and 1990. In this cohort, 773 cases ofCaP were diagnosed by 1992. Statistical analysis found that of all fruits and vegetablesincluded on the food-frequency questionnaire, raw tomatoes were significantly associatedwith a reduction of CaP risk (relative risk [RR] = 0.74; 95% confidence interval [CI],0.58–0.93; p-trend = 0.03]. Furthermore, tomato products such as tomato sauce (RR =0.66; 95% CI, 0.49–0.90; p-trend = 0.001) and pizza (RR = 0.85; 95% CI, 0.45–1.58;p-trend = 0.05) were also found to be statistically associated with reduced CaP riskwhen consumed two to four times a week compared to no consumption. When combiningthe tomato groups together, consumption of more than 10 servings of tomato products perweek was related to a 35% reduction of CaP risk when compared to consumption of lessthan 1.5 servings per week (RR = 0.65; 95% CI, 0.44–0.95, p-trend = 0.01). Moreover, theprotective effect from tomato products was greater for those with more aggressive or advancedstages of CaP (RR = 0.47; 95% CI, 0.22–1.00; p-trend = 0.03) (12).
More recently, additional data from the HPFS was analyzed to verify if the associa-tion of frequent consumption of tomato products and/or lycopene with reduced risk ofCaP would persist in this cohort. Of the 47,365 participants who completed dietaryquestionnaires in 1986, 1990, and 1994, 2481 men developed CaP by 1998 (13). Data from1986 through 1998 again showed that intake of lycopene was associated with reducedrisk of CaP (RR for high vs low quintiles = 0.84; 95% CI, 0.73–0.96; p-trend = 0.003)(13). Tomato sauce intake, when comparing two or more servings per week to less thanone serving per week, was associated with a reduction in CaP risk (RR = 0.77; 95% CI,0.66–0.90; p-trend < 0.001) and in extraprostatic cancers (RR = 0.65; 95% CI,0.42–0.99; p-trend = 0.02). Additional data analyzed from this cohort of men confirmedthe results found in the previous study: frequent consumption of tomato products isassociated with a lower risk of CaP.
A different prospective study was designed to assess the relationship between plasmaconcentrations of several major antioxidants (including a variety of carotenoids andα- and γ-tocopherol) and CaP risk. This nested case–control study used plasma samplesfrom men enrolled in the Physicians’ Health Study, a randomized placebo-controlledtrial of aspirin and β-carotene (14). Subjects included 578 men who developed CaP and1294 matched controls. Of the antioxidants measured, only plasma lycopene was sig-nificantly lower in cases of prostate cancer than in matched controls (p-trend = 0.04for all cases) (14). Furthermore, the odds ratios (ORs) for prostate cancers tended todecline with increasing plasma lycopene (fifth quintile OR = 0.75, 95% CI, 0.54–1.06;p-trend = 0.12), and a stronger inverse relationship for aggressive prostate cancer wasseen (fifth quintile OR = 0.56, 95% CI, 0.34–0.91; p-trend = 0.05). Plasma lycopenewas also strongly associated with lower risk of prostate cancer in the placebo group (fifthquintile OR = 0.40; p-trend = 0.006 for aggressive cancer) (14). The results from thisstudy coincide with those from the HPFS, which indicated that lycopene is positivelyassociated with reduced risk of CaP and that increased intake of tomato products andother lycopene-containing foods may decrease CaP cases.
162 Part II / Cancer Prevention
A recent case–control study examined the associations of fruit and vegetable intakeswith CaP risk in more than 1200 men younger than age 65 yr from King County,Washington. Dietary categories included citrus fruits, cooked tomatoes, cruciferousvegetables, beans, and green leafy vegetables. Results demonstrated that men who ateat least 28 servings of vegetables per week had a 35% lower risk of CaP compared tomen who ate less than 14 servings of vegetables per week (OR = 0.65; 95% CI,0.45–0.94; p-trend = 0.01) (15). No associations were found between fruit intake andCaP risk or for any specific category of fruits or vegetables, with the exception of cru-cifers. Interestingly, the consumption of three or more servings of cruciferous vegeta-bles per week was associated with a 41% decreased risk of CaP compared toconsumption of less than one serving per week (15). No significant relationship wasobserved in this study regarding the consumption of cooked tomatoes. It should benoted that this study was composed of younger (<65 yr) patients with CaP , who mayrepresent a unique subgroup with a specific genetic component leading to CaP. It wasproposed that CaP occurrence at a younger age may characterize an accelerated cancerprocess as a result of genetic polymorphisms and may interact with dietary componentsdifferently than in the majority of patients with CaP (>65 yr) (16).
Overall, epidemiological evidence—especially prospective trials—supports thehypothesis that tomatoes, tomato products, and lycopene may offer protection from CaPand validates the use of in vitro and in vivo studies to further investigate this association.
5. CELL CULTURE
In vitro studies have been used to analyze the relationship between tomatoes andlycopene and the reduction of CaP. The controlled environments for in vitro experi-ments allow for the investigation of the molecular and cellular effects of carotenoids oncancer cells in culture. Several carotenoids have been found to inhibit growth of a num-ber of cancer cell lines, including prostate, melanoma, lung, mammary, colon, andleukemia (17). Of the carotenoids, lycopene and β-carotene are the most commonlystudied in cell culture models. Our laboratory reported that β-carotene at concentrationsgreater than 30 μmol/L significantly decreased growth of three different CaP cell lines,including PC-3, DU-145, and LNCaP cells (18). In that work, 14C-labeled retinol wasdetected in the CaP cells incubated with 14C-labeled β-carotene, suggesting that the invitro effects of β-carotene on CaP cells may partially result from the metabolic conver-sion of β-carotene (a provitamin A carotenoid) to retinol or other metabolites (18).Pastori et al. (19) showed that lycopene at 1 μmol/L, when incubated with 50 μmol/L ofα-tocopherol, inhibited CaP proliferation of PC-3 and DU-145 cells, although lycopenealone at concentrations of 5 μmol/L or less was not found to be a potent inhibitor.Furthermore, the effect of lycopene with α-tocopherol appeared synergistic, whereassimilar results did not occur with treatments of lycopene with β-tocopherol or ascorbicacid (19). Kotake-Nara et al. (17) recently evaluated 15 common food carotenoidsregarding the growth of CaP cell lines PC-3, DU-145, and LNCaP. Their results demon-strated that lycopene, phytofluene, and ζ-carotene, all of which are present in tomatoes,significantly reduced cancer cell growth at concentrations of 20 μmol/L or less (17).Although other carotenoids (including α-carotene, β-carotene, and lutein) decreased can-cer cell viability, lycopene appeared to be the most potent acyclic carotenoid by signif-icantly inhibiting CaP cell growth at as low as 5 μmol/L (17). Studies by Levy et al. (20)

Chapter 6 / Prostate Cancer and Tomato Products 163
also demonstrated that lycopene was a more potent inhibitor of cell growth than α- andβ-carotene in various human cancer cell lines including endometrial, mammary, andlung cancer cells. Proposed mechanisms for the inhibitory growth effects by carotenoidson cancer cells include cell-cycle arrest, enhancement of gap-junction communication,inhibition of malignant transformation, and the induction of apoptosis and cellulardifferentiation (17). In addition, lycopene has been shown to inhibit insulin-like growthfactor (IGF)-1 signaling in vitro (20,21), which is relevant because high IGF-1 bloodlevels have been shown to be associated with a greater risk of CaP (22).
6. ANIMAL STUDIES
Laboratory animal studies are also valuable in the elucidation of the mechanism bywhich lycopene or components of tomatoes may reduce CaP risk. Our laboratory has beenvery interested in the potential interrelationships of lycopene and androgen status (23),because early CaP tumor growth is characterized by its androgen dependence (24). Thisinterrelationship was recently examined in our laboratory through the use of a rodent ani-mal model (23,25). In one study, male rats were fed one of four diets containing totallycopene concentrations of 0.00, 0.05, 0.50, or 5.0 g/kg. Androgen status of the rats wasreduced in some groups through the use of surgical castration. As dietary lycopeneincreased (0.00–0.50 g/kg), serum and tissue lycopene concentrations increased signifi-cantly (23). Furthermore, as dietary lycopene increased, the percentage of cis-lycopene inthe liver increased. In addition, castrated rats accumulated twice as much liver lycopeneand had a greater proportion of cis-lycopene isomers in the liver than the intact controls.Because androgens potentiate CaP, it is of relevance that androgen status is inversely asso-ciated with lycopene accumulation and apparently affects its metabolism (23).
To further assess the role of androgen in altering hepatic lycopene accumulation, asecond study was conducted in our laboratory using the same rodent model fed a dietcontaining 0.25 g/kg of lycopene (25). In addition to the role of testosterone, the influ-ence of 20% food restriction on lycopene metabolism was investigated. Results showedthat despite a 13% lower dietary intake, castrated rats accumulated nearly twice as muchhepatic lycopene as intact rats allowed to eat ad libitum (25). Moreover, food restrictionwas found to significantly increase liver lycopene by 68%, despite a 20% decrease inlycopene intake (25). The findings from this study imply that both excess calorie intakeand higher testosterone levels may promote lycopene metabolism and degradation (25).Additionally, our laboratory is interested in determining whether provision of lycopeneand other tomato antioxidants will reduce the adverse effects of oxidative metabolismin the prostate.
A more recent study in our laboratory examined the question of whether a lycopene-containing diet (161 mg/kg) and/or a 10% freeze-dried whole tomato diet (providing 13mg/kg of lycopene) could enhance the survival of rats with chemically induced CaPcompared to a control diet (26). In addition, the role of dietary restriction in cancermodulation was examined by subdividing each dietary group into either a 20% foodrestriction or ad libitum feeding 3 d postcarcinogenesis. The animal model employedwas an N-nitroso-N-methylurea (NMU) androgen-induced rat model that causes tumordevelopment in prostate lobes similarly to that of prostate tumor development inhumans (27). At age 6 wk, tumors were initiated by NMU and androgen, followed bypromotion of tumor formation through testosterone implantation. Results demonstrated

164 Part II / Cancer Prevention
that rats fed the tomato diet had a significantly lower risk of death from CaP comparedto that of the controls, whereas the survival of the lycopene-fed group was comparableto that of the control group (26). The proportion of deaths caused by CaP in the control,lycopene, and tomato powder groups were 80, 72, and 62%, respectively. In addition,20% dietary restriction slightly reduced CaP mortality, and the proportion of rats thatdeveloped CaP in the control and restricted diets were 79 and 65%, respectively (26).Overall, this study demonstrates that consumption of tomato powder can inhibitchemically induced prostate carcinogenesis and that components of tomato, in additionto lycopene, warrant investigation.
Another study examining dietary lycopene supplementation and cancer preventioninvolved lung cancer. In this study, lycopene supplementation was shown to be protectiveagainst smoke-induced lung carcinogenesis in ferrets (28). As reviewed by Liu andcoworkers, higher intake of lycopene is associated with a lower risk of lung cancer, andlung cancer risk is related to higher levels of IGF-1 and/or lower levels of IGF-bindingprotein 3 (IGF-BP3). Liu et al. examined the effects of lycopene supplementation onplasma IGF-1/IGF-BP3 levels, changes in lung histology, cell proliferation, and apop-tosis in ferrets with or without cigarette smoke exposure for 9 wk. Two doses oflycopene were used in this study design, including a low dose that was equivalent to ahuman intake of 15 mg/d of lycopene and a high dose that was equivalent to a humanintake of 60 mg/d of lycopene. Results showed that ferrets supplemented with lycopeneand exposed to smoke had significantly lower IGF-1/IGF-BP3 ratios as well as higherplasma IGF-BP3 levels compared to those of the control group. Both lycopene dosesinhibited smoke-induced squamous metaplasia and cell proliferation. In addition, bothlow- and high-dose lycopene supplementations prevented the downregulated apoptosisin the lungs that is normally induced by cigarette smoke. Lycopene concentrationsincreased in the plasma and lungs of ferrets treated without cigarette smoke in a dose-dependent manner, whereas lycopene concentrations were substantially lower in theplasma and lungs of ferrets receiving both lycopene supplementation and smoke expo-sure (28). In addition, cis-lycopene isomers in the lungs increased with exposure tosmoke (28). Overall, the results of this study suggest that lycopene may protect againstsmoke-induced lung cancer through upregulation of IGF-BP3, promotion of apoptosis,and the inhibition of cell proliferation, which may help explain current epidemiologicalevidence correlating a reduction of lung cancer risk with the increased consumption oftomatoes, tomato products, and lycopene (29).
7. HUMAN STUDIES
Presently, 25 carotenoids and 9 metabolites have been identified and characterizedfrom human serum and breast milk (30). Carotenoids and their metabolites have beenfound in several human organs such as the liver, lung, breast, cervix, prostate, colon,and skin in μg-ng/g of tissue (30). It is of particular interest that lycopene is the majorcarotenoid found in the prostate (10), but various other tomato carotenoids are also pre-sent, such as β-, γ-, and ζ-carotene, phytofluene, and phytoene, in ng/g concentrations(30). In addition, 2,6-cyclolycopene-1,5-diols A and B, metabolites derived fromlycopene, have been found in human serum and milk, liver, breast, colon, lung, skin,and prostate tissue, which may have specific biological importance (30), as discussed inthe next section.

Chapter 6 / Prostate Cancer and Tomato Products 165
If lycopene does alter prostate carcinogenesis, then it is necessary to determine iflycopene is present in the human prostate at biologically significant concentrations. Ina study by Clinton et al. (10), paired benign and malignant prostate tissues from 25men (ages 53–74 yr) undergoing prostatectomy for localized CaP were analyzed forconcentrations of lycopene, other carotenoids, and vitamin A. A wide variety ofcarotenoids were detected in human prostate tissue, but lycopene had the highest meanconcentration (0.80 nmol/g +/− 0.08 nmol/g) compared to other carotenoids. Lycopeneconcentrations within the prostate ranged from 0 to 2.58 nmol/g, and the totalcarotenoid concentrations ranged from 0.75 to 5.0 nmol/g. In addition, analysis ofgeometric lycopene isomers in tomato products, serum, and prostate tissue was con-ducted through the use of high-performance liquid chromatography with a polymericC30 reversed phase column. Results showed that all-trans-lycopene accounted for 79 to91%, and cis-lycopene isomers accounted for 9 to 21% of total lycopene in tomato andtomato products (10). Serum lycopene concentrations ranged from 0.60 to 1.9 nmol/mL,with 58 to 73% consisting of cis-lycopene isomers and only 27 to 47% consisting of all-trans-lycopene (10). Interestingly, all-trans-lycopene accounted for only 12 to 21% oftotal lycopene, whereas cis-isomers accounted for the majority (79–88%) of totallycopene in benign and malignant prostate tissues. The cis-isomers were distributedamong 12 to 14 peaks in human serum and 14 to 18 peaks in human prostate tissue (10).
In a more recent study, van Breeman et al. (31) analyzed all-trans- and cis-lycopeneisomers in human serum and prostate tissues after dietary supplementation with tomatoproducts. In this study, 32 men with clinical stage CaP (T1 or T2) consumed a tomatosauce-based pasta dish daily that provided 30 mg/d of lycopene (83% of which was all-trans-lycopene) for 3 wk before prostectomy. Prostate tissue was removed from 11 indi-viduals by needle biopsy before dietary intervention and by prostectomy aftersupplementation and was analyzed for total lycopene and lycopene isomers. Data fromthis study demonstrated that after dietary supplementation, total serum lycopeneincreased twofold, from 0.664 to 1.30 μM (31). Furthermore, total lycopene in theprostate tissue also increased threefold, from 0.196 to 0.582 ng/mg. These findings areinteresting not only because dietary supplementation with tomato products produced anincrease in prostate lycopene concentrations but because all-trans-lycopene accountedfor only approx 12.4% of total lycopene in prostate tissue before dietary interventionwith tomato sauce but increased to 22.7% after supplementation (31). There was also asmall, yet significant increase of 2.8% of all-trans-lycopene in serum after supplemen-tation (31). Data from this study further confirm that cis-lycopene isomers accumulatein the prostate; however, the relevance to carcinogenesis remains unknown.
8. PLAUSIBLE MECHANISMS
Several plausible mechanisms have been suggested for the protective health benefitsof tomatoes and lycopene. As reviewed by Boileau et al. (32), carotenoids present infoods have distinct antioxidant properties and can quench free radicals. The humanbody is subjected to a variety of reactive radical species, including hydrogen peroxide,superoxide anion, and singlet oxygen, which are made endogenously by the body throughaerobic metabolism and by immune cells. These reactive species are capable of react-ing with DNA, proteins, and lipids, and these reactions can cause degradation of thesemolecules (32). The degradation of DNA, proteins, and lipids is potentially detrimental

166 Part II / Cancer Prevention
to one’s health and, over time, may lead to disease occurrence such as cancer and car-diovascular disease (CVD). Reactive oxygen and nitrogen species can also enter thebody from exogenous sources such as dietary components and cigarette smoke, conse-quently producing harm. Carotenoids have been found to react with and inactivate thesecompounds and, therefore, protect cells from damage and potentially decreasing the riskof cancer and CVD (32). Carotenoids are especially effective quenchers of singlet oxy-gen (33). The quenching ability of carotenoids is related to the number of conjugateddouble bonds present within the carotenoid (33). Compared to other commoncarotenoids, lycopene is the most efficient singlet oxygen quencher in vitro, with higherquenching rate constants than all other C40 carotenoids (33). This increased reactivity oflycopene is believed to result from the presence of two additional conjugated doublebonds in this carotenoid (33).
Another way in which lycopene has been thought to affect carcinogenesis is throughthe modulation of gap junctions between cells. Nontransformed cells communicate witheach other either through hormonal signaling or via gap-junctional communication.Communication between cells is crucial for cellular and tissue homeostasis, and modi-fications in this communication may allow uncontrolled cell growth and potential cancerdevelopment. Transmembrane proteins called connexins typically form gap junctionsand allow formation of channels in between adjacent cellular membranes. Low-molec-ular-weight compounds are able to translocate between adjacent cells through thesechannels, thereby allowing for cellular communication and signaling (32). Carotenoids,including lycopene, have been shown to upregulate gap junctions, specifically byincreasing connexin expression and thus enhancing the opportunity for cellular com-munication (34). Stahl et al. (35) recently tested lycopene and its potential oxidationproduct, acycloretinoic acid, to determine which was more effective regarding upregu-lation of gap junctions and stabilization of connexin messenger RNA in human fetalskin fibroblasts. Results demonstrated that both compounds increased gap-junctioncommunication, but lycopene was more effective at a low, physiological dose (0.1 μM)when compared to a higher dose (1.0 μM) of acycloretinoic acid (35). Because anincrease of gap-junction communication is correlated with growth inhibition, it ishypothesized that this is one potential mechanism by which lycopene inhibits growth ofprecancerous cells. Further research is necessary to prove this hypothesis.
A third potential mechanism for lycopene is through the modulation of xenobioticmetabolism. Xenobiotic metabolism involves enzymes that serve to detoxify foreigncompounds that enter the body. Phase I xenobiotic metabolizing enzymes serve pri-marily to add or uncover a specific functional group of the xenobiotic, thus potentiallyactivating it. Often, phase I enzymes activate a procarcinogen into a carcinogen. PhaseII enzymes further react with the xenobiotic to make them unreactive and more easilyexcretable into the urine. Moreover, phase I and II enzymes often are coordinated in thatthe product of one becomes the substrate of the other. Under ideal circumstances, efficientclearance of xenobiotics from the body would consist of increasing phase II enzymeactivity while decreasing phase I activity.
Many dietary factors have been shown to alter the expression and/or the activity ofthese xenobiotic metabolizing enzymes. It is presently unclear whether carotenoidshave a significant role in the modulation of xenobiotic metabolism (see review in ref. 32).Recent work by Brienholt and coworkers (36) examined the dose–response of lycopeneon specific xenobiotic metabolizing enzymes. Female rats were orally dosed with

Chapter 6 / Prostate Cancer and Tomato Products 167
lycopene, with doses ranging from 0.001 to 0.1g/kg of body weight per day for 2 wk.Results demonstrated that phase I enzymes, such as P450-dependent enzymes, weresignificantly induced in a dose-dependent manner at all doses of lycopene (36). In addition,lycopene was also able to induce hepatic quinone reductase, a phase II enzyme, byapproximately twofold at lycopene doses between 0.001 and 0.05g/kg of body weight(36). Glutathione transferase activity, a second phase II enzyme, also was significantlyinduced at lycopene dosage of 0.1g/kg of body weight (36). Overall, this study supportsthe finding that lycopene may be effective in the modulation of xenobiotic metabolism,therefore providing a possible mechanism of protection from cancer. However, moreresearch is needed in this area.
9. CRITICAL ISSUES
9.1. SupplementationIn the United States, total carotenoid intake is approx 7 mg/d, and typical lycopene
intake is about 2 mg/d (37). Although phytochemicals, including carotenoids, have beenshown to positively modulate markers for chronic diseases in various animal and humanstudies, a high intake of a specific dietary substance is not always advantageous. Forinstance, β-carotene supplementation at 20 mg/d (38) or 30 mg/d with 25,000 IU of vit-amin A (39) both failed to demonstrate protective effects; in fact, this supplementationenhanced lung cancer incidence in smokers/asbestos workers in human intervention tri-als. This finding was demonstrated despite the epidemiological evidence suggesting thatβ-carotene intakes of 4 mg/d or greater are associated with a reduced risk of lung can-cer (40). The key difference was that the epidemiological evidence was based on intakeof whole foods (2), rather than highly bioavailable β-carotene supplements. For this rea-son, it is advised that instead of taking supplements, individuals should increase theirfruit and vegetable intakes to raise the carotenoids ingested.
9.2. Other Dietary Components in TomatoesResults from epidemiological and animal studies suggest the importance of diets
containing whole foods rather than just one dietary component (Table 2) (16). As men-tioned earlier, there are many nutrients and phytochemicals other than lycopene intomatoes (Table 1). The presence of other tomato carotenoids, including phytoene,phytofluene, neurosporene, and γ-carotene, may also contribute to the reduced risk ofCaP through similar mechanisms as lycopene, although little research has been done toexamine their role. These carotenoids also have been found in human serum, milk, andvarious tissues, including the prostate (30). In addition, polyphenols (such as quercetin,kaempferol, and naringenin) present in tomatoes exhibit anticancer properties, includingantioxidant activities, antiestrogenic properties, and antiproliferative activites (41).Preliminary in vitro studies in our laboratory demonstrated that quercetin, kaempferol,and naringenin, inhibit cancer cell proliferation in both LNCaP cells (human prostatecarcinoma) and Hepa1c1c7 cells (mouse hepatic carcinoma) in a dose-dependent manner(10–50 μM) (42). It has also been suggested that a synergy may be present between pro-tective compounds found within whole tomato foods. For example, data from our lab-oratory show that combination treatments (25–50 μM) of quercetin, kaempferol, andnaringenin produce additive and perhaps synergistic inhibition of growth in bothLNCaP and Hepa1c1c7 cell lines (42). As mentioned earlier, lycopene and α-tocopherol

168 Part II / Cancer Prevention
appear to act synergistically in the inhibition of cancer cell growth in various humanprostate cancer cell lines (19). Future research is needed in both in vitro and in vivomodels to examine the role of tomato phytochemicals, in addition to lycopene and thepotential synergies between these compounds regarding the reduction of CaP.
10. RECOMMENDATIONS AND CONCLUSIONS
Recommendations from the American Cancer Society include the consumption offive servings of fruits and vegetables a day to lower the risk of various cancers (1). Byfollowing this recommendation, a variety of chemopreventive phytochemicals andnutrients would be supplied through the consumption of whole food products, whichcannot be duplicated by supplements. Furthermore, some dietary components found inwhole foods may be beneficial when other compounds are ingested simultaneously. Itis also reasonable to recommend five servings of tomato products per week to reducethe risk of prostate cancer, other carcinomas, and various chronic diseases (16).Furthermore, the American Institute for Cancer Research advises a diet rich in fruits,vegetables, whole grains, and beans in combination with maintenance of a healthyweight and regular physical activity (43). These recommendations will not only loweran individual’s risk for cancer but also the risk of other chronic diseases such as CVD.Annual prostate-specific antigen blood tests and digital rectal examinations also are rec-ommended for men age 50 yr or older or for those in a higher risk group who are age45 yr or older (43). Higher risk factors include: age greater than 50 yr, African-American descent, having a close relative with prostate cancer, a diet high in fat and lowin fruits and vegetables, and obesity (43).
Overall, epidemiological evidence suggests that a diet abundant in fruits and vegetablesis associated with a lower risk of several types of cancer. Regarding CaP, epidemiologicalstudies focusing on dietary assessment imply that the intake of tomatoes and tomato prod-ucts seem to be associated with a reduced risk. Because lycopene is the most abundantcarotenoid in tomatoes and several plausible mechanisms of anticancer action have beenproposed, it is plausible that lycopene is one protective compound that contributes to areduction in CaP. Tomatoes and tomato products contain a variety of other carotenoids andphytochemicals, but these compounds have received little research attention.
REFERENCES1. Cancer Facts & Figures 2004: American Cancer Society, 2003. www.cancer.org. Accessed July 1, 2004.2. Block G, Patterson B, Subar A. Fruit, vegetables, and cancer prevention: a review of the epidemio-
logical evidence. Nutr Cancer 1992; 18:1–29.3. Beecher GR. Nutrient content of tomatoes and tomato products. Proc Soc Exp Biol Med 1998;
218:98–100.4. Hertog MGL, Hollman PCH, Katan MB. Content of potentially anticarcinogenic flavonoids of 28
vegetables and 9 fruits commonly consumed in the Netherlands. J Agric Food Chem 1992;40:2379–2383.
5. Hunt GM, Baker EA. Phenolic constituents of tomato fruit cuticles. Phytochemistry 1980;19:1415–1419.
6. Boileau TW, Boileau AC, Erdman JW Jr. Bioavailability of all-trans and cis-isomers of lycopene.Exp Biol Med (Maywood) 2002; 227:914–919.
7. Gartner C, Stahl W, Sies H. Lycopene is more bioavailable from tomato paste than from fresh tomatoes.Am J Clin Nutr 1997; 66:116–122.
8. Stahl W, Sies H. Uptake of lycopene and its geometrical isomers is greater from heat-processed thanfrom unprocessed tomato juice in humans. J Nutr 1992; 122:2161–2166.

Chapter 6 / Prostate Cancer and Tomato Products 169
9. Williams AW, Boileau TW, Erdman JW, Jr. Factors influencing the uptake and absorption ofcarotenoids. Proc Soc Exp Biol Med 1998; 218:106–108.
10. Clinton SK, Emenhiser C, Schwartz SJ, et al. cis-trans lycopene isomers, carotenoids, and retinol inthe human prostate. Cancer Epidemiol Biomarkers Prev 1996; 5:823–833.
11. Boileau AC, Merchen NR, Wasson K, Atkinson CA, Erdman JW Jr. cis-lycopene is more bioavailablethan trans-lycopene in vitro and in vivo in lymph-cannulated ferrets. J Nutr 1999; 129:1176–1181.
12. Giovannucci E, Ascherio A, Rimm EB, Stampfer MJ, Colditz GA, Willett WC. Intake of carotenoidsand retinol in relation to risk of prostate cancer. J Natl Cancer Inst 1995; 87:1767–1776.
13. Giovannucci E, Rimm EB, Liu Y, Stampfer MJ, Willett WC. A prospective study of tomato products,lycopene, and prostate cancer risk. J Natl Cancer Inst 2002; 94:391–398.
14. Gann PH, Ma J, Giovannucci E, et al. Lower prostate cancer risk in men with elevated plasmalycopene levels: results of a prospective analysis. Cancer Res 1999; 59:1225–1230.
15. Cohen JH, Kristal AR, Stanford JL. Fruit and vegetable intakes and prostate cancer risk. J NatlCancer Inst 2000; 92:61–68.
16. Miller EC, Giovannucci E, Erdman JW Jr., Bahnson R, Schwartz SJ, Clinton SK. Tomato products,lycopene, and prostate cancer risk. Urol Clin North Am 2002; 29:83–93.
17. Kotake-Nara E, Kushiro M, Zhang H, Sugawara T, Miyashita K, Nagao A. Carotenoids affect prolif-eration of human prostate cancer cells. J Nutr 2001; 131:3303–3306.
18. Williams AW, Boileau TW, Zhou JR, Clinton SK, Erdman JW Jr. β-carotene modulates humanprostate cancer cell growth and may undergo intracellular metabolism to retinol. J Nutr 2000;130:728–732.
19. Pastori M, Pfander H, Boscoboinik D, Azzi A. Lycopene in association with α-tocopherol inhibits atphysiological concentrations proliferation of prostate carcinoma cells. Biochem Biophys ResCommun 1998; 250:582–585.
20. Levy J, Bosin E, Feldman B, et al. Lycopene is a more potent inhibitor of human cancer cell prolif-eration than either α-carotene or β-carotene. Nutr Cancer 1995; 24:257–266.
21. Karas M, Amir H, Fishman D, et al. Lycopene interferes with cell cycle progression and insulin-likegrowth factor I signaling in mammary cancer cells. Nutr Cancer 2000; 36:101–111.
22. Chan JM, Stampfer MJ, Giovannucci E, et al. Plasma insulin-like growth factor-I and prostate cancerrisk: a prospective study. Science 1998; 279:563–566.
23. Boileau TW, Clinton SK, Erdman JW Jr. Tissue lycopene concentrations and isomer patterns areaffected by androgen status and dietary lycopene concentration in male F344 rats. J Nutr 2000;130:1613–1618.
24. Aquilina JW, Lipsky JJ, Bostwick DG. Androgen deprivation as a strategy for prostate cancerchemoprevention. J Natl Cancer Inst 1997; 89:689–696.
25. Boileau TW, Clinton SK, Zaripheh S, Monaco MH, Donovan SM, Erdman JW Jr. Testosterone andfood restriction modulate hepatic lycopene isomer concentrations in male F344 rats. J Nutr 2001;131:1746–1752.
26. Boileau TW, Liao Z, Kim S, Lemeshow SA, Erdman JW Jr., Clinton SK. Prostate carcinogenesis inN-methyl-N-nitrosourea (NMU)-testosterone-treated rats fed tomato powder, lycopene, or energyrestricted diets. J Natl Cancer Inst 2003; 95: 1578–1586.
27. Bosland MC. Use of animal models in defining efficacy of chemoprevention agents against prostatecancer. Eur Urol 1999; 35:459–463.
28. Liu C, Lian F, Smith DE, Russell RM, Wang XD. Lycopene supplementation inhibits lung squamousmetaplasia and induces apoptosis via up-regulating insulin-like growth factor-binding protein 3 incigarette smoke-exposed ferrets. Cancer Res 2003; 63:3138–3144.
29. Giovannucci E. Tomatoes, tomato-based products, lycopene, and cancer: review of the epidemiologicliterature. J Natl Cancer Inst 1999; 91:317–331.
30. Khachik F, Carvalho L, Bernstein PS, Muir GJ, Zhao DY, Katz NB. Chemistry, distribution, andmetabolism of tomato carotenoids and their impact on human health. Exp Biol Med (Maywood)2002; 227:845–851.
31. van Breemen RB, Xu X, Viana MA, et al. Liquid chromatography-mass spectrometry of cis- and all-trans-lycopene in human serum and prostate tissue after dietary supplementation with tomato sauce.J Agric Food Chem 2002; 50:2214–2219.
32. Boileau TWM, Moore AC, Erdman JW, Jr. Carotenoids and Vitamin A. In: Papas AM, ed.Antioxidant Status, Diet, Nutrition, and Health. CRC Press, Boca Raton, 1999, 133–158.
33. Sies H, Stahl W. Lycopene: antioxidant and biological effects and its bioavailability in the human.Proc Soc Exp Biol Med 1998; 218:121–124.

170 Part II / Cancer Prevention
34. Zhang LX, Cooney RV, Bertram JS. Carotenoids enhance gap junctional communication and inhibitlipid peroxidation in C3H/10T1/2 cells: relationship to their cancer chemopreventive action.Carcinogenesis 1991; 12:2109–2114.
35. Stahl W, von Laar J, Martin HD, Emmerich T, Sies H. Stimulation of gap junctional communication:comparison of acyclo-retinoic acid and lycopene. Arch Biochem Biophys 2000; 373:271–274.
36. Breinholt V, Lauridsen ST, Daneshvar B, Jakobsen J. Dose–response effects of lycopene on selecteddrug-metabolizing and antioxidant enzymes in the rat. Cancer Lett 2000; 154:201–210.
37. Nebeling LC, Forman MR, Graubard BI, Snyder RA. The impact of lifestyle characteristics oncarotenoid intake in the United States: the 1987 National Health Interview Survey. Am J PublicHealth 1997; 87:268–271.
38. The effect of vitamin E and β carotene on the incidence of lung cancer and other cancers in malesmokers. The α-Tocopherol, β Carotene Cancer Prevention Study Group. N Engl J Med 1994;330:1029–1035.
39. Omenn GS, Goodman GE, Thornquist MD, et al. Effects of a combination of β carotene and vit-amin A on lung cancer and cardiovascular disease. N Engl J Med 1996; 334:1150–1155.
40. Erdman JW Jr., Russell RM, Rock CL, et al. β-Carotene and the carotenoids: beyond the interventiontrials. Nutr Rev 1996; 54:185–188.
41. Ross JA, Kasum CM. Dietary flavonoids: bioavailability, metabolic effects, and safety. Annu RevNutr 2002; 22:19–34.
42. Campbell JK, King JL, Lila MA, Erdman JW, Jr. Anti-Proliferation effects of tomato polyphenols inHepa1c1c7 and LNCaP cell lines. J Nutr 2003; 133:3858S–3859S.
43. Reducing your risk of prostate cancer: American Institute for Cancer Research, 2003. www.aicr.org.

III CARDIOVASCULAR DISEASE PREVENTION


From: Preventive Nutrition: The Comprehensive Guide for Health Professionals, Third EditionEdited by: A. Bendich and R. J. Deckelbaum © Humana Press Inc., Totowa, NJ
173
7 Iron and Heart DiseaseA Review of the Epidemiological Data
Christopher T. Sempos, Richard F. Gillum,and Anne C. Looker
KEY POINTS
● In 1981, Dr. Jerome Sullivan proposed the hypothesis that the risk of coronary heart dis-ease (CHD) increases in a positive fashion as body iron stores increase. Nearly all ofthe research on this topic in humans has come through observational, epidemiologicalstudies. Serum ferritin and other less precise measures of body iron stores have beenused in those studies to test the hypothesis.
● Serum ferritin was not significantly related to risk of developing CHD in five of seventraditional cohort studies.
● Serum ferritin was not significantly related to having cardiovascular disease in 9 of 10case–control and cross-sectional studies.
● Serum transferrin saturation was not significantly related to risk of developing CHD insix of seven cohort studies.
● In an experiment, 14 men who were heavy smokers donated 500 mL of blood threetimes over a 14-wk period and demonstrated reductions in serum ferritin and improve-ment in indices designed to measure low-density lipoprotein cholesterol oxidizability.The experiment has not been repeated.
● The presence of the Cys282Tyr mutation, which accounts for most of the cases ofhemochromatosis, was found to be associated with CHD risk in three cohort studies butnot in six case–control or cross-sectional studies—study designs that are considered tobe scientifically weaker than the cohort study design.
● At present, the vast majority of the epidemiological data does not support the hypothesisthat body iron stores are directly related to the risk of developing CHD.
1. INTRODUCTION
In 1981, Dr. Jerome Sullivan (1) proposed a new theory to explain the differences incoronary heart disease (CHD) incidence and mortality between men and women. He

174 Part III / Cardiovascular Disease Prevention
noticed that as men and women age, the gaps between them in both heart disease inci-dence and in body iron stores decrease (2,3). Lower stores of iron levels in women aremostly caused by menstrual blood loss, and with menopause the differences in ironstores decrease. As a result, Sullivan theorized that body iron stores are directly orpositively related to CHD risk (i.e., the higher one’s body iron stores, the greater one’sCHD risk). The hypothesis was largely ignored until the publication of results fromFinland by Salonen et al. (4), which showed that men with serum ferritin levels (a mea-sure of body iron stores) at or above 200 μg/L had double the risk of having a heartattack. Since then, however, there has been intense interest in this topic. It is believedthat iron might promote the atherosclerosis leading to CHD by catalyzing the oxidationof low-density lipoprotein (LDL) cholesterol (5–10).
The purpose of this chapter is to examine and update the recent epidemiologicaldata directly related to Sullivan’s hypothesis (11,12). Important related topics to CHDrisk (e.g., the relationship of antioxidant nutrients, oral contraceptives, estrogen-replacement therapy, and menopause) and iron and myocardial reperfusion injury arenot discussed.
2. SERUM MEASURES OF BODY IRON STORES
Serum ferritin is currently the best measure of body iron stores that is feasible to usein epidemiological studies (13). It is a fairly sensitive indicator of changes in body ironstores in healthy individuals (e.g., those not suffering from an infection, inflammation,or cancer) as they moves through the stages of iron status from deficient to replete toiron overload. Less direct and sensitive measures of body iron stores are serum iron,total iron-binding capacity (TIBC), and transferrin saturation (TS), which is calculatedas the ratio of serum iron to TIBC. TS is the best measure of circulating iron availableto tissues and is considered to be a better measure of iron stores than serum iron orTIBC but is not as good as serum ferritin. Other common iron status measures are evenless directly related to body iron stores (e.g., hemoglobin, hematocrit, and erythrocyteprotoporphyrin). Hemoglobin and hematocrit are measures of the oxygen-carryingcapacity and viscosity of blood.
As body iron stores increase, so do serum ferritin levels (14,15). As a result, serumferritin can be useful in detecting iron deficiency and overload. A serum ferritin level ofless than 15 μg/L has been used as an indicator of iron deficiency in both men andwomen (16). Separate upper limits have been suggested for adult men (400 μg/L), men-struating women (200 μg/L), and postmenopausal women (300 μg/L) (16).
TS and serum iron levels also tend to increase as stores increase over the normalrange, whereas TIBC levels tend to decrease as stores increase. The opposite trendsoccur as body iron stores decrease. TS is considered to be a good measure of body ironstores when they are at very high levels, as in homozygous hemochromatosis (TS >60%),or at depleted levels (TS <16%; i.e., iron deficiency). Within the normal range of TS(20–60%), it is not clear how well TS reflects body iron stores. Data from the thirdNational Health and Nutrition Examination Survey (NHANES III; Table 1), conductedfrom 1988 through 1994, show that there does appear to be a positive correlation, albeitlow, between the two measurements with the result that when levels of TS increase, lev-els of serum ferritin levels tend to rise as well, especially in women. The correlationbetween logarithmic-transformed serum ferritin and TS for men and women ages 45 to74 yr was r = 0.22 overall, r = 0.14 for men, and r = 0.25 for women (Table 2).
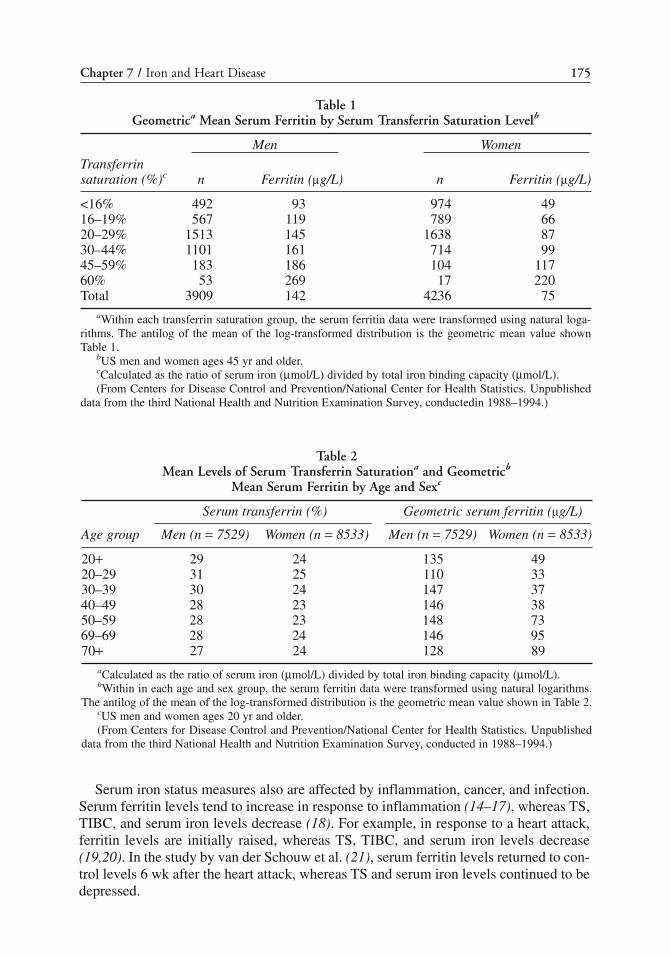
Chapter 7 / Iron and Heart Disease 175
Serum iron status measures also are affected by inflammation, cancer, and infection.Serum ferritin levels tend to increase in response to inflammation (14–17), whereas TS,TIBC, and serum iron levels decrease (18). For example, in response to a heart attack,ferritin levels are initially raised, whereas TS, TIBC, and serum iron levels decrease(19,20). In the study by van der Schouw et al. (21), serum ferritin levels returned to con-trol levels 6 wk after the heart attack, whereas TS and serum iron levels continued to bedepressed.
Table 1Geometrica Mean Serum Ferritin by Serum Transferrin Saturation Levelb
Men Women
Transferrinsaturation (%)c n Ferritin (μg/L) n Ferritin (μg/L)
<16% 492 93 974 4916–19% 567 119 789 6620–29% 1513 145 1638 8730–44% 1101 161 714 9945–59% 183 186 104 11760% 53 269 17 220Total 3909 142 4236 75
aWithin each transferrin saturation group, the serum ferritin data were transformed using natural loga-rithms. The antilog of the mean of the log-transformed distribution is the geometric mean value shownTable 1.
bUS men and women ages 45 yr and older.cCalculated as the ratio of serum iron (μmol/L) divided by total iron binding capacity (μmol/L).(From Centers for Disease Control and Prevention/National Center for Health Statistics. Unpublished
data from the third National Health and Nutrition Examination Survey, conductedin 1988–1994.)
Table 2Mean Levels of Serum Transferrin Saturationa and Geometricb
Mean Serum Ferritin by Age and Sexc
Serum transferrin (%) Geometric serum ferritin (μg/L)
Age group Men (n = 7529) Women (n = 8533) Men (n = 7529) Women (n = 8533)
20+ 29 24 135 4920–29 31 25 110 3330–39 30 24 147 3740–49 28 23 146 3850–59 28 23 148 7369–69 28 24 146 9570+ 27 24 128 89
aCalculated as the ratio of serum iron (μmol/L) divided by total iron binding capacity (μmol/L).bWithin in each age and sex group, the serum ferritin data were transformed using natural logarithms.
The antilog of the mean of the log-transformed distribution is the geometric mean value shown in Table 2.cUS men and women ages 20 yr and older.(From Centers for Disease Control and Prevention/National Center for Health Statistics. Unpublished
data from the third National Health and Nutrition Examination Survey, conducted in 1988–1994.)
176 Part III / Cardiovascular Disease Prevention
The NHANES III distributions of serum TS and ferritin by age and gender are shownin Table 2. Two recent papers discussed the important issues regarding monitoring ironstatus measures over time in the national surveys (22) and gave more details about ironstatus data from NHANES III (23).
3. BODY IRON STORES AND RISK OF HEART DISEASE:THE EPIDEMIOLOGICAL DATA
3.1. Cohort Studies Based on Serum FerritinCohort studies also are referred to as prospective, incidence, follow-up, and longitu-
dinal studies. The question asked in cohort studies is: Do persons with the risk factordevelop or die from the disease more frequently or sooner than those who do not havethe risk factor? For example, are persons who have high serum ferritin levels morelikely to develop CHD in the future than persons who do not? Because risk-factor expo-sure is measured prior to the onset of clinically apparent disease, cohort studies are con-sidered to be the strongest observational study design in epidemiology (24,25). Usingvarious measures of body iron stores, a number of researchers have attempted to assessthe validity of the hypothesis that CHD risk increases with body iron stores (Table 3).
As stated earlier, the theory was largely ignored until the publication of results fromthe Finnish Kuopio Ischemic Heart Disease Risk Factor Study (KIHD) (4). The studyconsisted of 1931 randomly selected men who were ages 42, 48, 54, or 60 yr and who werefree of clinical symptoms of CHD at baseline. During an average of 3 yr of follow-up, 46men had either a definite or possible heart attack as defined by electrocardiogram(ECG) or enzyme criteria. Five additional men who were admitted to the hospital forprolonged chest pain did not meet the criteria. The authors reported that the results werenot substantively changed by including those men, and the published results were basedon 51 heart attacks.
Salonen et al. (4) reported finding a statistically significant linear association betweenserum ferritin level and the risk of heart attack (z = 2.64; p < 0.01) after adjusting for pos-sible confounding. Thus, as serum ferritin levels increased, so did the risk of heartattack. However, the more surprising finding was that men with a serum ferritin of200 μg/L had a greater than twofold higher risk of heart attack compared to those withlower serum ferritin values. The difference was statistically significant (relative risk[RR] = 2.2; 95% confidence interval [CI] 1.2–4.0, p < 0.01). Again, the results wereadjusted for possible confounding in a multivariate model. Additionally, they reportedfinding that compared to men with serum ferritin levels less than 200 μg/L, men with aferritin of 200–399 μg/L had a nearly identical risk of heart attack as did men withferritin levels of 400 μg/L (4).
The study by Salonen et al. (4), although based on a small number of heart attacks,was well-conducted. In a letter to the editor, they presented data indicating that the rela-tionship was still significant after an average of 5 yr of follow-up and 83 heart attacks(RR = 2.0; 95% CI, 1.2–3.1; p = 0.004) (26). However, they have been criticized for notadequately adjusting for inflammation (27) and because there was a negative correla-tion between age and serum ferritin (28). Neither criticism appears to be entirely justi-fied (29,30). The authors reported that they found no correlation between serum ferritinand plasma fibrinogen (an acute phase protein) in the whole sample or with C-reactiveprotein in a subsample (4,29,30). Moreover, the authors adjusted for blood leukocyte

Chapter 7 / Iron and Heart Disease 177
count in their analyses (4). More importantly, the association between serum ferritin andheart attack was not attenuated when the analysis was repeated after excluding heartattacks that occurred within the first 6 mo following blood collection. As stated earlier,serum ferritin levels increase after a heart attack but return to baseline levels within 6mo after the heart attack (21).
In a subsample of their cohort, the Salonen research group also reported that the ratioof transferrin to ferritin was positively related to CHD risk (31,32). This is not surpris-ing given the strong finding in the larger cohort. Moreover, because the three studies bytheir group were based on the same set of individuals from the KIHD cohort, we considerthem as one study supporting the Sullivan hypothesis (Table 2).
The results from eight additional cohort studies (33–40) have been reported regard-ing the association between serum ferritin and CHD (Table 2). Only one study found anassociation between serum ferritin and CHD (37). In that study, Kiechl et al. (37)reported that the 5-yr progression of carotid stenosis was significantly related to serumferritin levels. The study consisted of 826 men and women ages 40 to 79 yr who wererandomly selected from the population of Bruneck, Italy. Carotid atherosclerosis wasassessed by repeated carotid ultrasound evaluation.
The authors further reported that changes in iron stores were associated with changesin the progression of carotid atherosclerosis in that decreases in stores were associatedwith decreased risk of progression, whereas increases in stores were associated with
Table 3Serum Ferritin and Heart Disease: Cohort Studies
Study (reference) Sex Sample size Association
Kuopio Ischemic Heart Disease Risk Factor Study (KIHD)a
Salonen et al. (4) M 1931 +Salonen et al. (26) M 1931 +Tuomainen et al. (31) M 197b +
Magnusson et al. (33) M 990 NoneW 1046 None
Stampfer et al. (34) M 476b NoneSempos et al. (39) M/W 1376 NoneMänttäri et al. (35) M 268b NoneKnuiman et al. (40) M/W 1612 NoneFrey and Krider (36) M 298c NoneKiechl et al. (37) M/W 826 +Aronow and Ahn (38) M/W 577 None
aAll three studies are from the same cohort: Kuopio Ischemic Heart Disease Risk Factor Study (KIHD).The difference between the two studies by Salonen et al. is that the first consisted of the results after 3-yrof follow-up and the second after 5-yr of follow-up of the same individuals. The third paper is a study ona subset of the cohort in the first two studies examining the transferrin/ferritin ratio and risk of heart attack.
bNested case–control study (i.e., a case–control or retrospective study that is “nested” within a cohortor cohort study) (32,42). Serum transferrin/ferritin ratio (Tuomainen et al. [31]), or ferritin (Stampfer et al.[34], Mänttäri et al. [35]) were determined on frozen sera collected at the beginning of the study. Casesaccrued during the follow-up period and controls were selected from the pool of individuals who were atrisk of having CHD at the time a case was diagnosed. Because of the efficient sample design, only smallsample sizes are required (32).
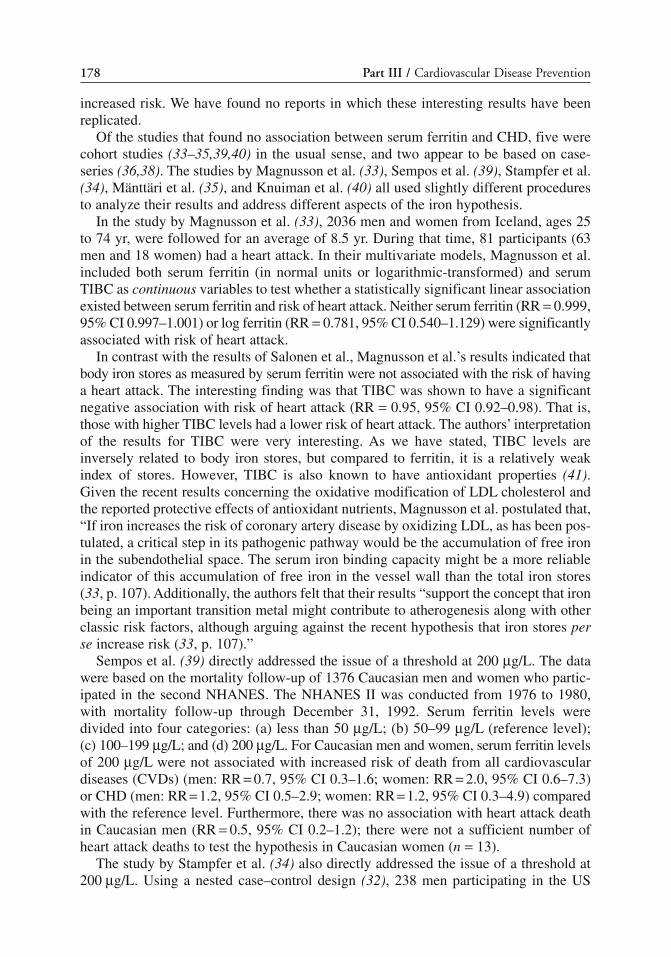
178 Part III / Cardiovascular Disease Prevention
increased risk. We have found no reports in which these interesting results have beenreplicated.
Of the studies that found no association between serum ferritin and CHD, five werecohort studies (33–35,39,40) in the usual sense, and two appear to be based on case-series (36,38). The studies by Magnusson et al. (33), Sempos et al. (39), Stampfer et al.(34), Mänttäri et al. (35), and Knuiman et al. (40) all used slightly different proceduresto analyze their results and address different aspects of the iron hypothesis.
In the study by Magnusson et al. (33), 2036 men and women from Iceland, ages 25to 74 yr, were followed for an average of 8.5 yr. During that time, 81 participants (63men and 18 women) had a heart attack. In their multivariate models, Magnusson et al.included both serum ferritin (in normal units or logarithmic-transformed) and serumTIBC as continuous variables to test whether a statistically significant linear associationexisted between serum ferritin and risk of heart attack. Neither serum ferritin (RR = 0.999,95% CI 0.997–1.001) or log ferritin (RR = 0.781, 95% CI 0.540–1.129) were significantlyassociated with risk of heart attack.
In contrast with the results of Salonen et al., Magnusson et al.’s results indicated thatbody iron stores as measured by serum ferritin were not associated with the risk of havinga heart attack. The interesting finding was that TIBC was shown to have a significantnegative association with risk of heart attack (RR = 0.95, 95% CI 0.92–0.98). That is,those with higher TIBC levels had a lower risk of heart attack. The authors’ interpretationof the results for TIBC were very interesting. As we have stated, TIBC levels areinversely related to body iron stores, but compared to ferritin, it is a relatively weakindex of stores. However, TIBC is also known to have antioxidant properties (41).Given the recent results concerning the oxidative modification of LDL cholesterol andthe reported protective effects of antioxidant nutrients, Magnusson et al. postulated that,“If iron increases the risk of coronary artery disease by oxidizing LDL, as has been pos-tulated, a critical step in its pathogenic pathway would be the accumulation of free ironin the subendothelial space. The serum iron binding capacity might be a more reliableindicator of this accumulation of free iron in the vessel wall than the total iron stores(33, p. 107). Additionally, the authors felt that their results “support the concept that ironbeing an important transition metal might contribute to atherogenesis along with otherclassic risk factors, although arguing against the recent hypothesis that iron stores perse increase risk (33, p. 107).”
Sempos et al. (39) directly addressed the issue of a threshold at 200 μg/L. The datawere based on the mortality follow-up of 1376 Caucasian men and women who partic-ipated in the second NHANES. The NHANES II was conducted from 1976 to 1980,with mortality follow-up through December 31, 1992. Serum ferritin levels weredivided into four categories: (a) less than 50 μg/L; (b) 50–99 μg/L (reference level);(c) 100–199 μg/L; and (d) 200 μg/L. For Caucasian men and women, serum ferritin levelsof 200 μg/L were not associated with increased risk of death from all cardiovasculardiseases (CVDs) (men: RR = 0.7, 95% CI 0.3–1.6; women: RR = 2.0, 95% CI 0.6–7.3)or CHD (men: RR = 1.2, 95% CI 0.5–2.9; women: RR = 1.2, 95% CI 0.3–4.9) comparedwith the reference level. Furthermore, there was no association with heart attack deathin Caucasian men (RR = 0.5, 95% CI 0.2–1.2); there were not a sufficient number ofheart attack deaths to test the hypothesis in Caucasian women (n = 13).
The study by Stampfer et al. (34) also directly addressed the issue of a threshold at200 μg/L. Using a nested case–control design (32), 238 men participating in the US

Chapter 7 / Iron and Heart Disease 179
Physicians Study had a heart attack during the period after the 1982 baseline. Storedserum for those men and for 238 controls matched for age and smoking status were ana-lyzed for serum ferritin concentrations. After adjustment for other CHD risk factors,men with serum ferritin levels of 200 μg/L were not found to have a higher risk of heartattack (RR = 1.1, 95% CI 0.7–1.6).
Similar results were found in another nested case–control study by Mänttäri et al.(35). The participants in this study were a subset of men from the Finnish HelsinkiHeart Study—a randomized clinical trial of the lipid-lowering drug gemfibrozil. In thatstudy, the authors examined whether the threshold for ferritin occurs at much lowerlevels than the 200 μg/L cutoff used by Salonen et al. (4). Mänttäri et al. looked at therisk of developing CHD in two groups of men with serum ferritin levels of 43 to 84 μg/Lor 85 μg/L compared with men with serum ferritin levels of 42 μg/L and found thatrisk was not different.
In a 17-yr follow-up of a cohort from Busselton, Western Australia, no associationwas found between serum ferritin and risk of CHD or stroke (40). The cohort included1612 men and women who participated in the 1981 Busselton Heath Survey. The asso-ciation was assessed with ferritin divided up into gender-specific tertiles or as a contin-uous variable. The tertiles were: men—126 μg/L, greater than 126–233 μg/L, andgreater than 233 μg/L; women—49 μg/L, greater than 49–122 μg/L, and greater than122 μg/L. Therefore, the results for women do not directly address the 200 μg/L cutoff.The results for the association between serum ferritin as a continuous variable and CHDwere: men—RR = 0.944, 95% CI 0.71–1.25; women—RR = 0.849, 95% CI 0.60–1.2.
In case-series studies, patients who receive a particular test or procedure are followedover time using cohort study methods to evaluate the association between the test resultand an outcome. The information from such a study may be very useful in suggestinghypotheses or testing a current one. However, because the test or procedure was orderedfor a particular medical reason that may be favorably or unfavorably related to theoutcome of interest the results from those studies may be biased and thus cannot beconsidered as rigorous as the data from a standard cohort study (38). The study by Freyand Krider (36) was based on a clinical case series of 298 men who had serum ferritinmeasurements taken at some point over a 10-yr period (mean: 5.2 yr) in a West Virginiamedical practice. Over that follow-up period, 32 men had a heart attack. The authorsreported finding no difference in mean serum ferritin levels between patients who didor did not have a heart attack. Nor was there any association between risk of heart attackand a serum ferritin level above 200 μg/L. Unfortunately, none of the results appearedto have been adjusted for age or for other CHD risk factors. Finally, in a small study (itis not clear if it is a defined cohort or a case series) of 577 men and women ages 62 yrand older, no association was found between serum ferritin and incidence of CHD basedon 3 yr of follow-up (38).
3.2. Cohort Studies Based on TSThe association between TS (43–47), serum iron (44,46,48,49), or TIBC
(33,44,46,47) and CHD risk has been investigated in seven different cohorts (Table 4).Only the study by Morrison et al. (48) reported a significant positive association. In thatstudy, 9920 men and women ages 35–79 yr were followed for approx 16 yr. During thattime, 141 men and 83 women died of an acute myocardial infarction (MI) or heartattack. Persons with a serum iron level of 175 μg/L compared to those with a value of

180 Part III / Cardiovascular Disease Prevention
less than 120 μg/L were found to have a significantly higher risk of dying from an acuteMI (men: RR = 2.18, 95% CI 1.01–4.74; women: RR = 5.53, 95% CI 1.69–18.12).However, there were only seven deaths among the men and three among the women forthose with a serum iron in the highest category. Although the results are consistent withthose from Finland, the small numbers of events in the highest category tend to makethe results less certain. In contrast, Coti et al. (49) reported a significant inverse associ-ation between serum iron and CHD and cardiovascular death, that is, the higher a person’sserum iron level, the lower there is his or her risk of death from CHD or CVD.
The studies mentioned earlier that found no association between iron status and CHDhave been criticized for using TS as a measure of body iron stores (26,50,51) and forusing the lowest levels of TS as the comparison group. However, while criticizing theheart disease studies that have not found an association, the proponents of the ironhypothesis have cited studies that demonstrated an association between TS and risk ofcancer (51,52) or serum iron and risk of CHD (52) as evidence that high body ironstores generally increase the risk of both heart disease and cancer.
Clearly, if TS is an indicator of body iron stores in one setting, then it must also be anindicator in the other. Because persons with very low TS levels (<16%) as well as thosewith very high levels (>60%) are probably ill individuals, we agree that persons with thelowest TS levels may not be the most appropriate comparison group. To explore theeffects of using the lowest TS levels as the comparison group, we reanalyzed the rela-tionship between TS and risk of CHD (11) using methods previously described (11,43)and by dividing TS into six categories (<16, 16–19, 20–29, 30–44, 45–59, and 60%). Forthose new analyses, the TS category of 20–29% was used as the reference category. A
Table 4Serum TS and Heart Disease: Cohort Studies
Study (reference) Sex Sample size Association
NHANES I Follow-up Studya
Sempos et al. (43) M 1345 NoneW 1750 None
Liao et al. (44) M 1827 NoneW 2410 None
Baer et al. (45) M 15,167 NoneW 31,765 None
Reunanen et al. (46) M 6068 NoneW 6102 None
van Asperen et al. (47) M 129 NoneW 131 None
Morrison et al. (48) M ? +(serum iron) W ? +
Magnusson et al. (33) M 990 –(TIBC) W 1046 None
Corti et al. (49) M 1385 –(serum iron) W 2551 –
aThe studies by Sempos et al. and Liao et al. are from the same cohort: The NHANES I EpidemiologicFollow-up Study. Because cases within the first 3 yr of follow-up were deleted in the study by Sempos et al.,the sample size in their study is smaller than the sample size reported by Liao et al.

Chapter 7 / Iron and Heart Disease 181
TS of less than 16% was used to indicate iron deficiency, and a TS between 16 and 29%was at the low end of the normal range. The RRs of CHD for the TS less than 16, 16–19,30–44, 45–59, and 60% categories were 1.09, 1.09, 1.01, 0.75, and 0.76, respectively, formen and 1.28, 1.18, 0.84, 0.97, and 0.86, respectively, for women.
None of the estimates were significantly different (p > 0.05) than the risk of CHD inthe 20–29% TS category. Persons with TS levels between 16 and 19% appeared to beat equal or higher risk of CHD, whereas persons with TS levels between 30 and 60%appeared to be at a possibly lower risk of CHD than those with a TS level of 20–29%.As a result, changing the comparison group for TS does not appear to change the con-clusion that those data do not support the hypothesis that body iron stores are positivelyrelated to CHD risk.
There have also been a few cohort studies that used TS to look at the associationbetween iron status and risk of stroke and all causes mortality. A U-shaped associationbetween TS and stroke was reported for Caucasian women (53) where those with a TSlevel less than 29% and those with a TS level of 44% had significantly higher risks ofstroke compared to those with a TS level of 30–36%. However, no association wasfound for Caucasian men or African-Americans. Additionally, no association has beenfound between TS and all causes mortality (11,49,54).
3.3. Case–Control or Cross-Sectional StudiesThere has been a number of studies (55–64) that have used a case–control or cross-
sectional study design (Table 5). All of the studies used serum ferritin as the measure ofbody iron stores.
Only one (64) of the studies reported a significant positive association betweenserum ferritin and CHD, and this association was found only in the youngest of two agegroups examined (ages 40–59 yr).
Table 5Serum Ferritin and Heart Disease: Case–Control and Cross-Sectional Studies
Study (reference) Sex Sample size Association
Case-control studiesDuthie et al. (55) M/W 225 NoneRengström et al. (56) M 194 NoneMoore et al. (57) M/W 730 NoneVan der Schouw et al. (58) M/W 162 NoneEichner et al. (59) M 457 None
W 114 NoneEndbergs et al. (60) M 208 None
W 67 NoneCross-sectional studies
Aronow (61) M 171 NoneW 406 None
Solymoss et al. (62) M 225 NoneW 74 None
Rauramaa et al. (63) M 206 NoneKiechl et al. (64) M/W 431 + (ages 40–59 yr)
416 None (ages 60–79 yr)

182 Part III / Cardiovascular Disease Prevention
Case–control and cross-sectional studies generally are not considered to be as rigor-ous as cohort studies regarding observational study design (24,25,42). The problemwith both types of studies is that both disease status (e.g., heart disease) and risk factorexposure (e.g., serum ferritin) are measured simultaneously, thus it is impossible to tellif risk factor exposure preceded the disease or was a consequence of it. For example,the disease itself may alter body iron stores or serum ferritin levels. Additionally, peoplewho already know they are sick may change their behavior to alter their levels of bodyiron stores. As a result, with case–control and cross-sectional experimental designs, it isdifficult to establish if the exposure led to the disease or vice versa.
Because serum ferritin levels rise in response to inflammation, infection, cancer,and heart attack, clinically apparent CHD should increase serum ferritin levels so that,more often than not, a false-positive association would be found between ferritin andCHD. The fact that only one of the studies in this category found no association is asomewhat stronger argument against the hypothesis. On the other hand, includingpersons with CHD in these studies who have changed their diets to lower their serumcholesterol levels would tend to produce false-negative results, because a reduction inthe intake of meat and animal products may also reduce levels of body iron storesover time and, as a result, reduce serum ferritin levels. One way to evaluate this pos-sibility is to assess the association between serum total and LDL cholesterol and CHDconcurrently with the serum ferritin and CHD assessments. In six of the nine studiesthat found no association between serum ferritin and CHD (55–54,60,62,63) and inthe one study that found a positive association (64), LDL cholesterol was positivelyassociated with CHD, suggesting that it is less likely that changes in behavior producedfalse-negative results.
3.4. Dietary Iron and CHD RiskSalonen et al. (4) also reported that dietary iron intake was positively associated with
the risk of a heart attack. Other researchers have not been able to corroborate this finding(11,44,46,48,57,63,65–67), and to date, only one other study (66) has found a positiveassociation between dietary iron intake and CHD risk.
Two studies reported an association between heme iron intake and risk of heart attackbut not with total iron intake (65,67), whereas a third study found no association (46).In any event, it is not clear what a relationship between dietary heme iron and CHDwould mean in the context of a discussion regarding the association between body ironstores and CHD risk. Dietary intake methods do not adequately capture long-termdietary patterns, nor do they reflect the influence of growth and development or theeffect of menopausal status on body iron stores, all of which are important factors indetermining body iron stores. Additionally, an association between dietary iron andCHD risk may be a marker for a high-fat, high-cholesterol diet or may be somethingtotally unrelated to body iron stores. For example, in a study by Klipstein-Grobuschet al. (67), heme iron intake was positively correlated with hypercholesterolemia, a clearmarker for a diet high in saturated fatty acids and cholesterol, as well as with hypertension,current cigarette smoking, and diabetes.
To help reduce the potential for confounding factors, epidemiologists, such as theauthors of the studies on heme iron intake and CHD risk, use multivariate models tosimulate an experiment (32, pp. 271–281). By using multivariate models that adjust forpossible confounding factors, it is possible to evaluate the association between the

Chapter 7 / Iron and Heart Disease 183
exposure of interest and the outcome variable while holding all other variables in themodel constant (32). However, there are limits to modeling. The unfortunate fact is thatconfounding caused by correlation in intakes or metabolism cannot simply be reducedor eliminated by statistical modeling (68–70).
3.5. Blood Donor Studies and Iron and Oxidized LDL CholesterolBlood donation has been hypothesized as a way to decrease body iron stores and
reduce the risk of heart disease (71,72). Clearly, frequent blood donation will reducebody iron stores and serum ferritin levels (73). Although there has been no directevidence that blood donation will lead to a reduction in CHD, two approaches havebeen used to address this issue.
An indirect way to test this hypothesis involved examining the risk of CHD in volun-tary blood donors and nondonors in existing epidemiological studies. There have beenthree such studies (74–77) (the paper by Salonen et al. (76) is an expanded version of theearlier paper by Tuomainen et al. (75) and is not a separate study) as well as a studyexamining the effects of blood donation on cancer incidence (78). The results weremixed. Meyers et al. (74) reported that blood donation was associated with a reduced riskof CHD in nonsmoking men but not in male smokers or in women, whereas Tuomainenet al. (75,76) reported a significant reduction in the risk of heart attack in the cohort ofFinnish men from the KIHD Study, which originally reported an association betweenserum ferritin and risk of heart attack. Ascherio et al. (77) found no association betweenhistory of blood donation and incidence of heart attack or fatal CHD.
There are several concerns regarding these studies. The principal concern is that vol-unteers for blood donation generally are healthier than nondonors and that any associa-tion may be a result of some unmeasured selection bias (79,80). The data from bothstudies clearly do indicate that the volunteers were healthier. For example, in contrastto the usual practice in cohort studies, Salonen et al. (75,76) did not eliminate personswith pre-existing clinical CHD at baseline from their analyses as they had done in theirprevious studies (4). In their study, over one-fourth of the 2529 nondonors (26.3%) hadpre-existing disease compared to 8.5% of the 153 voluntary donors. As a result, it isimpossible to determine if voluntary blood donation was influenced by the presence ofheart disease, and, as stated earlier, that bias cannot be reduced or eliminated by statis-tical analysis (68–70).
The paper by Ascherio et al. (77) examined the issue of blood donation using 38,244men from the Health Professionals Study who were free of CHD at baseline. During 4 yrof follow-up, there were 328 nonfatal heart attacks and 131 CHD-related deaths amongthe cohort. In the 1992 questionnaire, the participants were asked to report the numberof times they had donated blood over the previous 30 yr. The categories for lifetime blooddonation in the analyses were: 0, 1–4, 5–9, 10–19, 20–29, and 30 times. To validate theself-reported history of lifetime blood donation, the authors measured serum ferritinlevels in stored blood samples that were collected in 1986 from a random sample of 123men in the study. The authors found a negative association between the number of timesblood was donated and the level of serum ferritin. That finding supports the generalaccuracy of the blood donation questionnaire.
However, no association was found with nonfatal heart attack or fatal CHD. In whatmight have been a more direct test of the hypothesis, Salonen et al. (52) used a LatinSquares design to determine the effects of donating 500 mL of blood three times over a

184 Part III / Cardiovascular Disease Prevention
14-wk period on measures of non-HDL (very LDL plus LDL ) cholesterol oxidizabilityin 14 men who were heavy smokers. The authors reported finding that serum ferritinlevels were reduced by 44%, whereas the maximal oxidation velocity was decreased by20% and the lag time to start oxidation was lengthened by 33%.
Although interesting, the results of Salonen et al., even if replicated, are uncertain(81). Currently, the LDL oxidation theory is interesting and increasingly accepted (9).However, a problem lies in the measurement of LDL oxidation (5). LDL oxidizabilityusually is measured by using LDL and exposing it to oxidative stress. The question iswhether such a marker of LDL oxidizability corresponds to the extent of oxidation invivo and whether it predicts risk of CHD (77). The results of the few epidemiologicalstudies that have examined the association between LDL oxidizability and markers ofatherosclerosis or CHD risk are mixed (82–85). There are also mixed results concerningthe association between autoantibodies against oxidized LDL and atherosclerosis (86).Thus, the available markers for oxidized LDL cannot yet be regarded as valid predictorsof the risk of coronary artery disease in humans (82).
Putting aside the possible problems with the measurement of oxidized LDL, sev-eral observational studies have looked at the association between serum ferritin andLDL oxidizability (85,87,88). No association was found in any of the studies. In fact,Craig et al. (88) reported that serum ferritin accounted for about 1.6% of the variabilityin measures of LDL oxidizability, whereas serum copper accounted for 21% of thatvariability. Serum copper also is considered as a possible catalyst for the oxidation ofLDL (12,89).
The results from two human feeding studies appear to be at variance with the hypoth-esis that there is a positive association between body iron stores and the susceptibilityof LDL to oxidation (90,91). In the first study, Derstine et al. (90) tested the oxidizabilityof the LDL cholesterol in the plasma samples of 77 men and women ages 20–65 yr whowere participating in one of three feeding studies. No association was found betweenserum ferritin and the measures of LDL oxidizability. In the second study, 26 women,ages 19–47 yr, who had low hemoglobin and serum ferritin levels (i.e., low iron status)participated in a randomized double-blind two-period crossover study (91). Participantswere randomized to an iron supplement (50 mg of elemental iron per day) or placebo.They were then randomly assigned to an average American diet or a low-fat diet knownas the Step 2 Diet (92). The average American diet contained 36% of the energy intake(i.e., kcals) as fat, with 15% of the total kcals from saturated fatty acids. The Step 2 Dietcontained 26% of energy from fat and 7% from saturated fatty acids. Both diets con-tained about 25 g of fiber per day. Each diet was consumed for 3 wk with a 2-wkwashout period. Although iron supplementation resulted in an increase in serum ferritinlevels (p = 0.008), there was no association between iron supplementation and LDLoxidative susceptibility as measured by the rate of oxidation or total dienes.
4. IRON OVERLOAD AND CHD RISK
Hemochromatosis is a genetic disorder that, in the homozygous state, leads to ironoverload, serious illness, and early death—usually from liver cancer, other liver diseases,cardiomyopathy, or diabetes (93). Persons with the heterozygous form of hemochromato-sis are unlikely to develop iron overload. The concern is that although iron overloadis uncommon, heterozygotes tend to have higher levels of body iron stores, as indicated

Chapter 7 / Iron and Heart Disease 185
by higher serum ferritin and TS levels, than persons without the condition, and the het-erozygous form of the disease is relatively common (a prevalence of 10–15%)(94–96). Therefore, if the iron hypothesis is correct, then heterozygotes form a sub-stantial pool of persons at increased risk of CHD.
The cysteine-to-tyrosine substitution on the hemochromatosis gene (Cys282Tyr muta-tion) is thought to account for most of the cases of hemochromatosis. There have beennine published studies examining the association between the presence of the Cys282Tyrmutation in an individual and the risk of heart disease (97–105). Note that the studies onthis topic have looked at the association between the presence or absence of a mutationand CHD risk and have not examinedwhether serum ferritin or some other marker ofbody iron stores was related to risk. Taking that into consideration, the three prospectivecohort studies found an association between the presence or absence of a mutation andthe risk of CHD, and the six case-control or cross-sectional studies did not.
Roest et al. (98) found that in Dutch women, heterozygotes for the Cys282Tyr mutationwere 1.5 times more likely to die of a heart attack (95% confidence limit [CL] 0.9–2.5), 2.4times more likely to die of a stroke (95% CL 1.3–3.5), and 1.6 times more likely to die ofany CVD (95% CL 1.1–2.4). By the same token, Toumainen et al. (99) reported thatFinnish male heterozygotes had a 2.3-fold higher risk of suffering a heart attack (95% CL1.1–4.8). Although Rasmussen et al. (100) reported that men and women in the US ARICstudy were found to have a 2.7-fold higher risk of incident CHD (95% CL 1.2–6.1), theyalso reported that the results were somewhat unstable because of a few subjects in somestrata. As a result, they advised that their results should be interpreted cautiously).
All of the studies that reported finding no association between the presence of theCys282Tyr mutation were either case–control or cross-sectional studies (97,101–105).
Prospective or cohort studies are generally thought to be superior to those studydesigns because, as noted earlier, the exposure or risk factor precedes the event; however,for these studies, the limitation may not be as severe, because we are discussing the asso-ciation between an inherited mutation and the risk of disease. However, cross-sectionaland case–control studies are limited in that subjects must be in relatively early clinicalstages of developing CHD or must have had nonfatal events to be included in thosestudies. The relationship of the mutation to fatal first events may be missed in designsthat are not prospective in nature. Accordingly, the results from cross-sectional andcase–control studies need to be evaluated cautiously.
The possible association between hemochromatosis and CHD is even further cloudedby the fact that an elevated fasting level of serum TS is used as the presumptive diag-nosis for the disease (106). Therefore, it is unclear why serum TS hasn’t been consid-ered as a risk factor for CHD in observational studies more often. It may be that thepersons with hemochromatosis metabolize iron somewhat differently from those whohave higher TS levels but who do not possess the heterozygous hemochromatosis gene.If this is the case, it might explain why serum TS generally hasn’t been considered as apredictor of CHD risk.
5. SUMMARY
In 1981, Dr. Jerome Sullivan (1) proposed that body iron stores are directly or posi-tively related to CHD risk (i.e., the higher your body iron stores, the greater your CHDrisk). The hypothesis was largely ignored until the publication of results from Finland

186 Part III / Cardiovascular Disease Prevention
by Salonen et al. (4), which showed a positive relationship between serum ferritin levelsand risk of heart attack in men. Although a plausible hypothesis was proposed bySullivan to define a role for iron in the development of CHD, possibly by catalyzing thefree radical oxidation of LDL cholesterol, the vast majority of the epidemiologicalresults published since the study by Salonen et al. (4) have failed to support the originalhypothesis. Whether looking at the direct relationships between serum ferritin and CHDrisk, serum ferritin and measures of atherosclerosis, serum TS and CHD risk, iron intakeand CHD risk, serum ferritin and measures of LDL oxidizability, or iron overload andCHD risk, the results are the same: the data do not consistently support the hypothesisthat body iron stores are a risk factor for CHD. Additionally, the effect of blood dona-tion on serum levels of oxidized LDL remains an open issue, as does the issue of therelationship of heterozygous hemochromatosis to risk of CHD.
6. RECOMMENDATIONS
Sound clinical guidance and public health recommendations must be based on rea-sonably solid evidence that the issue being recommended is both safe and effective.Given the results to date concerning the iron hypothesis, there can be no doubt aboutthe recommendations. Further research, including basic research and large-scale epi-demiological studies, is needed to fully assess the association between iron status andthe risk of CVD and other adverse outcomes. Presently, the currently available data donot support radical changes in dietary recommendations or screening to detect high lev-els of serum ferritin, nor do they support the need for large-scale randomized trials ofdietary restriction or phlebotomy as a means of lowering iron stores (107).
Finally, it must be remembered that there are currently a number of proven CHD riskfactors, including high blood cholesterol, high blood pressure, cigarette smoking, obesity,diabetes, and lack of exercise, for which there are proven and effective guidelines and mea-sures for decreasing CHD risk (108–111). Until other measures are proven and established,it is our recommendation that the public focus on them rather than on unproven measures.
REFERENCES1. Sullivan JL. Iron and the sex difference in heart disease risk. Lancet 1981; 1:1293–1294.2. Sullivan JL. The iron paradigm of ischemic heart disease. Am Heart J. 1989; 117:1177–1788.3. Sullivan JL. The sex difference in ischemic heart disease. Perspect Biol & Med 1983; 26:657–671.4. Salonen JT, Nyyssönen K, Korpela H, Tuomilehto J, Seppänen R, Salonen R. High stored iron lev-
els are associated with excess risk of myocardial infarction in eastern Finnish men. Circulation 1992;86:803–811.
5. Halliwell B, Chirico S. Lipid peroxidation: its mechanism, measurement and significance. Am J ClinNutr 1993; 57(Suppl):715s–725s.
6. Reaven PD, Wiztum JL. Oxidized low density lipoproteins in atherogenesis: role of dietary modifi-cation. Ann Rev Nutr 1996; 16:51–71.
7. Steinberg D.Oxidative modification of LDL and atherogenesis. Circulation 1997; 95:1062–1071.8. Yuan XM, Brunk UT. Iron and LDL-oxidation in atherogenesis. APMIS 1998; 106:825–842.9. Heinecke JW. Oxidants and antioxidants in the pathogenesis of atherosclerosis: implications for the
oxidized low density lipoprotein hypothesis. Atherosclerosis 1998; 141:1–5.10. Danesh J, Appleby P. Coronary heart disease and iron status. Meta-analysis of prospective studies.
Circulation 1999; 99:852–854.11. Sempos CT, Gillum RF, Looker AC. Iron and Heart Disease: A Review of the epidemiologic data.
Chapter 10. In: Bendich A and Deckelbaum RJ, eds. Preventive Nutrition: The ComprehensiveGuide for Health Professionals. Humana Press Inc. Totowa, NJ 1997.

Chapter 7 / Iron and Heart Disease 187
12. Sempos CT, Looker AC, Gillum RF. Iron and heart disease: the epidemiologic data. Nutr Rev 1996;54(3):73–84.
13. Expert Scientific Working Group. Summary of a report on assessment of the iron nutritional statusof the United States population. Am J Clin Nutr 1985;42:1318–1330.
14. Bothwell T, Charlton R, Cook J, Finch C. Iron Metabolism in Man. Blackwell Scientific, Oxford,England, 1979.
15. Herbert V. Everyone should be tested for iron disorders. J Am Diet Assoc 1992; 92:1502–1509.16. Custer EM, Finch CA, Sobel RE, Zettner A. Populations norms for serum ferritin. J Lab Clin Med
1995; 126:88–94.17. Hulthén L, Lindstedt G, Lundberg P-A, Hallberg L. Effect of a mild infection on serum ferritin con-
centration - clinical and epidemiological implications. Eur J Clin Nutr 1998; 52:376–379.18. Yip R, Dallman PR. The roles of inflammation and iron deficiency as causes of anemia. Am J Clin
Nutr 1988; 48:1295–1300.19. Birgegård G, Hällgren R, Venge P, Wide L. Serum ferritin during inflammation. A study on myocar-
dial infarction. Acta Med Scan 1979; 206:361–366.20. Griffiths JD, Campbell LJ, Woodruff IW, et al. Acute changes in iron metabolism following myocardial
infarction. Am J Clin Pathol 1985; 84:649–654.21. Schouw YT van der, Veeken PMWC van der, Kok FJ, Koster JF, Schouten EG, Hofman A. Iron sta-
tus in the acute phase and six weeks after myocardial infarction. Free Radical Biol Med 1990;8:47–53.
22. Zacharski LR, Ornstein DL, Woloshin S, Schwartz LM. Association of age, sex, and race with bodyiron stores in adults: Analysis of NHANES III data. Am Heart J 200; 140:98–104.
23. Looker AC, Gunter AW, Johnson CL. Methods to assess iron status in various NHANES Surveys.Nutr Rev 1995; 53:246–254.
24. Beaglehole R, Bonita R, Kjellström T. Basic Epidemiology. World Health Organization, Geneva, 1993.25. Gordis L. Epidemiology. WB Saunders Co, Philadelphia, 1996.26. Salonen JT, Nyyssönen K, Salonen R. Body iron stores and the risk of coronary heart disease.
[Letter]. N Engl J Med 1994; 331:1159.27. Weiss G, Fuchs D, Wachter H. High stored iron levels and the risk of myocardial infarction. [Letter]
Circulation 1993; 87:1425.28. MacDonald HB. High stored iron levels are associated with excess risk of myocardial infarction in
Eastern Finnish men. [Letter] Circulation 1993; 87:2063.29. Salonen JT, Nyyssönen K, Korpela H, Salonen R, Tuomilehto J, Seppänen R. High stored iron lev-
els and the risk of myocardial infarction. [Reply] Circulation 1993; 87:1425,1426.30. Salonen JT, Nyyssönen K, Korpela H, Salonen R, Tuomilehto J, Seppänen R. High stored iron levels
are associated with excess risk of myocardial infarction in Eastern Finnish Men. [Reply] Circulation1993; 87:2063–2064.
31. Toumainen TP, Punnonen K, Nyyssönen K, Salonen JT. Association between body iron stores andthe risk of acute myocardial infarction. Circulation 1998; 1461–1466.
32. Clayton D, Hills M. Statistical Models in Epidemiology.Oxford. Oxford University Press, 1993.33. Magnusson MK, Sigfusson N, Sigvaldason H, Johannesson GM, Magnusson S; Thorgeirsson G.
Low iron-binding capacity as a risk factor for myocardial infarction. Circulation 1994; 89:102–108.34. Stampfer MJ, Grodstein F, Rosenberg I, Willett W, Hennekens C. A prospective study of plasma
ferritin and risk of myocardial infarction in US physicians [Abstract]. Circulation 1993; 87:688.35. Mänttäri M, Manninen V, Huttunen JK, et al. Serum ferritin and ceruloplasmin as coronary risk
factors. European Heart J 1994; 15:1599–1603.36. Frey GH, Krider DW. Serum ferritin and myocardial infarct. West Virginia Med J 1994; 90:13–15.37. Kiechl S, Willeit J, Egger G, Poewe W, Oberholenzer F. Body iron stores and the risk of carotid
atherosclerosis. Circulation 1997; 96:3300–3307.38. Aronow WS, Ahn C. Three-year follow-up shows no association of serum ferritin levels with inci-
dence of of new coronary events in 577 persons aged ≥62 years. The Am J Cardiol 1996; 78:678,679.39. Sempos CT, Looker AC, Gillum RF, McGee DL, Vuong CV, Johnson CL. Ann Epidemiol 2000;
10:441–448.40. Knuiman MW, Divitini ML, Olynyk JK, Cullen DJ, Batholomew HC. Serum ferritin and cardiovas-
cular disease: a 17-year follow-up in Busselton, Western Australia. Am J Epidemiol 2003;158:144–149.
41. Dormandy TL. Free-radical oxidation and antioxidants. Lancet 1978; 1:647–650.

188 Part III / Cardiovascular Disease Prevention
42. Hennekens DG, Buring BG. Epidemiology in Medicine. Little Brown & Co, Boston, 1987.43. Sempos CT, Looker AC, Gillum RF, Makuc DM. Body iron stores and the risk of coronary heart
disease. N Engl J Med 1994; 330:1119–1124.44. Liao Y, Cooper RS, McGee DL. Iron status and coronary heart disease: negative findings from the
NHANES I Epidemiologic Follow-up Study. Am J Epidemiol 1994; 139:704–712.45. Baer DM, Tekawa IS, Hurley LB. Iron stores are not associated with acute myocardial infarction.
Circulation 1994; 89:2915–2918.46. Reunanen A, Takkunen H, Knekt P, Sappänen R, Aromaa A. Body iron stores, dietary iron intake and
coronary heart disease mortality. J Intern Med 1995; 238:223–230.47. Asperen IA van, Feskens EJM, Bowels CH, Kromhout D. Body iron stores and mortality due to cancer
and ischemic heart disease: a 17-year follow-up study of elderly men and women. J Epidemiol 1995;24:665–670.
48. Morrison HI, Semenciw RM, Mao Y, Wigle DT. Serum iron and fatal acute myocardial infarction.Epidemiology 1994; 5:243–246.
49. Corti MC, Guralnik JM, Salvie ME, et al. Serum iron level, coronary artery disease, and all causemortality in older men and women. Am J Cardiol 1997; 79:120–127.
50. Ascherio A, Willett WC. Are body iron stores related to risk of coronary heart disease? N Engl J Med1994; 330:1152,1153. [editorial].
51. Sullivan JL. Iron versus cholesterol—perspectives on the iron heart disease debate. J Clin Epidemiol1996; 49:1345–1352.
52. Salonen JT, Korpela H, Nyyssönen K, et al. Lowering of body iron stores by blood letting and oxi-dation resistence of serum lipoproteins: a randomized cross-over trial in male smokers. J Intern Med1995; 237:161–168.
53. Gillum RF, Sempos CT, Looker AC, Chien CY. Serum transferrin saturation and stroke incidenceand mortality in men and women: the NHANES I Epidemiologic Follow-up Study. Am J Epidemiol1996; 144:59–68.
54. Takkunen H, Reunanen A, Knekt P, Aromaa A. Body iron stores and the risk of cancer [Letter]. NEngl J Med 1989; 320:1013,1014.
55. Duthie GG, Beattie JAG, Arthur JR, Franklin M, Morrice PC, James WPT. Blood antioxidants andindices of lipid peroixidation in subjects with stable angina. Nutrition 1994; 10:313–316.
56. Rengström J, Tonrvall P, Kallner A, Nilsson J, Hamsten A. Stored iron levels and myocardial infarc-tion at a young age. Atherosclerosis 1994; 106:123–125.
57. Moore M, Folsom AR, Barnes RW, Eckfeldt JH. No association between serum ferritin and asymp-tomatic carotid atherosclerosis. The Atherosclerosis Risk in Communities (ARIC) Study. Am JEpidemiol 1995;141:719–723.
58. van der Schouw YT, Verbeek A, Ruijs J. ROC curves for the initial assessment of new diagnostictests. Family Practice 1992; 9:506–511.
59. Eichner JE, Qi H, Moorre WE, Schechter E. Iron measures in coronary angiography patients.Atherosclerosis 1998; 136:241–245.
60. Endbergs A, Dorzewski A, Luft M, et al. Failure to confirm ferritin and caeruloplasmin as riskfactors for the angiographic extent of coronary atherosclerosis. Coronary Art Dis 1998; 9:119–124.
61. Aronow WS. Serum ferritin is not a risk factor for coronary artery disease in men and womenaged ≥ 62 years. Am J Cardiology 1993; 72: 347,348.
62. Solymoss BC, Marcil M, Gilfix BM, Gelinas F, Poitras AM, Campeau L. The place of ferritin amongrisk factors associated with coronary artery disease. Coronary Art Dis 1994; 5:231–235.
63. Rauramaa R, Väisänen S, Mercuri M, Rankinen T, Penttila I, Bond MG. Association of risk factorsand body iron status to carotid atherosclerosis in middle-aged Eastern Finnish men. European HeartJ 1994; 15:1020–1027.
64. Kiechl S, Aichner F, Gerstenbrand F, et al. Body iron stores and presence of carotid atherosclerosis.Results from the Bruneck Study. Arterioscler Thromb 1994; 14:1625–1630.
65. Ascherio A, Willett WC, Rimm EB, Giovannucci EL, Stampfer MJ. Dietary iron and risk of coronaryheart disease among men. Circulation 1994; 89:969–974.
66. Tzonou A, Lagiou P, Trichopoulou A, Tsoutsos V, Trichopoulos D. Dietary iron and coronary heartdisease risk: A study from Greece. Am J Epidemiol 1998; 147:161–166.
67. Klipstein-Grobusch K, Grobbee DE, den Breejien JH, Boeing H, Hofman A, Witterman JCM. Dietaryiron and risk of myocardial infarction in the Rotterdam Study. Am J Epidemiol 1999;149:421–428.

Chapter 7 / Iron and Heart Disease 189
68. Gordon T. Hazards in the use of the logistic function with special reference to data from prospectivecardiovascular disease studies. J Chron Dis 1974;27:97–102.
69. McGee D, Reed D, Yano K. The results of logistic regression analyses when the variables are highlycorrelated: An empirical example using diet and CHD incidence. J Chronic Dis 1984; 37:713–719.
70. Sempos CT, Liu K, Ernst ND. Food and nutrient exposures: what to consider when evaluatingepidemiologic evidence. Am J Clin Nutr 1999; in press.
71. Sullivan JL. Blood donation may be good for the donor. Vox Sang 1991; 61:161–164.72. Sullivan JL. Stored iron and ischemic heart disease. Empirical support for the new paradigm.
Circulation 1992; 86:1036,1037.73. Finch CA, Cook JD, Labbe RF, Culala M. Effect of blood donation on iron stores as evaluated by
serum ferritin. Blood 1977;50:441–447.74. Meyers DG, Strickland D, Maloley PA, Seburg JJ, Wilson JE, McManus BF. Possible association of
a reduction in cardiovascular events with blood donation. Heart 1997; 78:188–193.75. Tuomainen T-P, Salonen R, Nyyssönen K, Salonen JT. Cohort study of relation between donating
blood and risk of myocardial infarction in 2,682 men in eastern Finland. BMJ 1997; 314:793,794.76. Salonen JT, Tuomainen T-P, Salonen R, Lakka TA, Nyyssönen K. Donation of blood is associated
with reduced risk of myocardial infarction. Am J Epidemiol 1998; 148:445–451.77. Ascherio A, Rimm EB, Giovannucci E, Willett WC, Stampfer MJ. Blood donations ans risk of
coronary heart disease in men. Circulation 2001; 103:52–57.78. Merk K, Mattsson B, Mettsson A, Holm G, Gullbring B, Björkholm M. The incidence of cancer
among blood donors. Int J Epidemiol 1990; 19:505–509.79. Ford I. Is blood donation good for the donor [editorial]. Heart 1997; 78:107.80. Gillum RF. Body iron stores and atherosclerosis [editorial]. Circulation 1997; 96:3261–3263.81. Weintraub WS, Wenger NK, Parthasaranthy S, Brown WV. Hyperlipidemia versus iron overload and
coronary heart disease: Yet more arguments on the cholesterol debate. J Clin Epidemiol 1996;49:1353–13568.
82. Zock PL, Katan MB. Diet, LDL oxidation, and coronary artery disease [editorial]. Am J Clin Nutr1998; 68:759,760.
83. Iribarren C, Folsom AR, Jacobs DR, Gross MD, Belcher JD, Eckfeldt JH. Association of serum vit-amin levels, LDL susceptibility to oxidation, and autoantibodies against MDALDL with carotidatherosclerosis. Arterioscler Thromb Vasc Biol 1997; 17:1171–1177.
84. van de Vijver LPL, Kardinaal AFM, van Duyvenvoorde W, et al. LDL oxidation and extent of coro-nary atherosclerosis. Arterioscler Thromb Vasc Biol 1998; 18:193–199.
85. Halevy D, Thiery J, Nagel D, et al. Increased oxidation of LDL in patients with coronary artery diseaseis independent from dietary vitamins E and C. Arterioscler Thromb Vasc Biol 1997; 17:1432–1437.
86. Uusitupa MIJ, Niskanen L, Luoma J, et al. Autoantibodies against oxidized LDL do not predict ath-erosclerotic vascular disease in non-insulin dependent diabetes. Arterioscler Thromb Vasc Biol 1996;16:1236–1242.
87. Iribarren C, Sempos CT, Eckfeldt JH, Folsom A. Lack of association between ferritin level and mea-sures of LDL oxidation. The ARIC Study. Atherosclerosis 1998; 139:189–195.
88. Craig WY, Poulin Se, Palomaki GE, Neveux LM, Ritchie RF, Ledue TB. Oxidationrelated analytesand lipid and lipoprotein concentrations in adults. Arterioscler Thromb Vasc Biol 1995; 15:733–739.
89. Ferns GAA, Lamb DJ, Taylor A. The possible role of copper ions in atherosclerosis: the Blue Janus.Atherosclerosis 1997; 133:130–152.
90. Derstine JL, Murray-Kolb LE, Yu-Poth S, Hargrove RL, Kris-Etherton P, Beard JL. Iron status inassociation with cardiovascular disease risk in three controlled feeding studies. Am J Clin Nutr 2003;77:56–62.
91. Binoski AE, Kris-Etherton PM, Beard JL. Iron supplementation does not affect the susceptibility ofLDL to oxidative modification in women with low iron status. J Nutr 2004; 134:99–103.
92. Expert Panel on Detection, Evaluation, and Treatment of High Blood Cholesterol in Adults.Summary of the second report of the National Cholesterol Education Program (NCEP) Expert Panelon Detection, Evaluation, and Treatment of High Blood Cholesterol in Adults (Adult TreatmentPanel II). JAMA 1993; 269:3015–3023.
93. Yang Q, McDonnell SM, Khoury MJ, Cono J, Parrish RG. Hemachromatosis-associated mortalityin the United States from 1979–1992: an analysis of multiple-cause mortality data. Ann Intern Med1998; 129:946–953.

190 Part III / Cardiovascular Disease Prevention
94. Bulaj ZJ, Griffen LM, Jorde LB, Edwards CQ, Kushner JP. Clinical and biochemical abnormalitiesin people heterozygous for hemachromatosis. N Engl J Med 1996; 335:1799–1805.
95. McLaren CE, Gordeuk VR, Looker AC, et al. Prevalence of heterozygotes for hemochromatosis inthe white population of the United States. Blood 1995; 86:2021–2027.
96. Steinberg KK, Cogswell ME, Chang JC, et al. Prevalence of C282Y and H63D mutations in thehemachromatosis (HFE) gene in the United States. JAMA 2001; 285:2216–2222.
97. Rossi E, McQuillan BM, Hung J, Thompson PL, Kuek C, Beilby JP. Serum ferritin and C282Ymutation of the hemochromatosis gene as predictors of asymptomatic carotid atherosclerosis in acommunity population. Stroke 2000; 31:3015–3020.
98. Roest M, van der Schouw YT, de Valk B, et al. Heterozygosity for a hereditary hemachromatosisgene is associated with cardiovascular death in women. Circulation 1999; 100:1268–1273.
99. Toumainen TP, Kontula K, Nyyssönen K, Lakka TA, Heliö T, Salonen JT. Increased risk of acutemyocardial infarction in carriers of the hemochromatosis gene Cys282Tyr mutation. A prospectivecohort study in men in Eastern Finland. Circulation 1999; 100:1274–1279.
100. Rasmussen ML, Folsom AR, Catellier DJ, Tsai MY, Garg U, Eckfeldt JH. A prospective study ofcoronary heart disease and the hemochromatosis gene (HFE) C282Y mutation: the AtherosclerosisRisk in Communities (ARIC) Study. Atherosclerosis 2001; 154:739–746.
101. Franco RF, Zago MA, Trip MD, et al. Prevalence of hereditary haemochromatosis in premature ath-erosclerotic vascular disease. Br J Haematology 1998; 102:1172–1175.
102. Annichino-Bizzacchi JM, Saad ST, Arruda VR, et al. C282Y mutation in the HLA-H gene is not arisk factor for patients with myocardial infarction. J Cardiovasc Risk 2000; 7:37–40.
103. Battiloro E, Ombres D, Pascale E, D Ambrosio E, Verna R, Arca M. Haemochromatosis genemutations and risk of coronary artery disease. Eur J Genet 2000; 8:389–392.
104. Margaglione M, Di Castelnuovo A, Totaro A, Iacoveillo L, Di Minno G. Thromb Haemost 2000;84:726,727.
105. Hetet G, Elbaz A, Gariepy J, et al. Association studies between hemochromatosis gene mutations andthe risk of cardiovascular diseases. Eur J Clin Invest 2001;31:382–388.
106. Powell LW, George K, McDonnell SM, Kowdley KV. Diagnosis of hemochromatosis. Ann InternMed 1998; 129:925–931.
107. Corti M-C, Gaziano M, Hennekens CH. Iron status and risk of cardiovascular disease. AnnEpidemiol 1997; 7:62–68.
108. National Cholesterol Education program. Report of the Expert Panel on Population Strategies forBlood Cholesterol Reduction. Circulation 1991; 83:2154–2232.
109. Expert Panel on Detection, Evaluation, and Treatment of High Blood Cholesterol in Adults.Executive summary of the third report of the National Cholesterol Education Program (NCEP)Expert Panel on Detection, Evaluation, and Treatment of High Blood Cholesterol in Adults (AdultTreatment Panel III). JAMA 2001; 285:2486–2497.
110. De Backer G, Ambrosioni E, Borch-Johnsen K, et al. European guidelines on cardiovascular diseaseprevention in clinical practice. Third Joint Task Force of European and other Societies onCardiovascular Disease Prevention in Clinical Practice. Eur Heart J 2003; 24:1601–1610.
111. Tomkin A, Barter P, Best J, et al. Lipid management guidelines—2001. Med J Aus 2001; 175(Suppl):S57–S88.

From: Preventive Nutrition: The Comprehensive Guide for Health Professionals, Third EditionEdited by: A. Bendich and R. J. Deckelbaum © Humana Press Inc., Totowa, NJ
191
8 Homocysteine, Folic Acid,and Cardiovascular Disease Risk
Shirley A. A. Beresford and Arno G. Motulsky
KEY POINTS
● The balance of homocysteine and methionine in the body can be disturbed because of lowfolic acid, B12, or B6 intake or low activity of several enzymes under genetic control.
● In the United States, the plateau of maximal lowering of homocysteine that can be attainedby folic acid fortification of enriched flour and grain products has not yet been achieved.
● Inferences from meta-analyses restricted to prospective observational studies consis-tently point to a small elevated risk of coronary heart disease (CHD) associated with higherlevels of homocysteine.
● Similarly, an independent effect of homocysteine is found on the risk of cerbrovascularand peripheral vascular disease.
● Most evidence suggests an elevated risk of CHD in the relatively common homozygotes(approx 10%) for the methylene tetrahydrofolate reductase C677T polymorphism (i.e.,those with two copies of the cytosine to thymine mutation at neucleotide 677), amongthose with borderline folate status.
● Trials for secondary prevention of vascular disease are expected to provide evidenceconcerning the preventive potential of lowering homocysteine.
1. INTRODUCTION
The interest in homocysteine as a potential modifiable risk factor for cardiovasculardisease exploded in the late 1990s and the turn of the millennium and remains high.Homocysteine is an amino acid byproduct of methionine metabolism. Historically, thefinding of thrombotic complications in the rare hereditary disease of homocystinuria ledto the hypothesis that the carriers for this condition, who number about 1 in 200 of thegeneral population and have a partial metabolic defect and slightly elevated homocys-teine levels, might have an increased frequency of vascular disease. Therefore, manystudies were performed to relate elevated homocysteine blood levels—genetic in originor not—to vascular disease. The majority of these investigations showed an associationof hyperhomocysteinemia with coronary artery disease (CAD), cerebrovascular disease,and peripheral vascular disease.

192 Part III / Cardiovascular Disease Prevention
This chapter reviews the metabolism of homocysteine, its regulation, and its mea-surement. We review the relationship between folate intake and homocysteine levels,both in the absence and presence of fortification of enriched flour and grain productswith synthetic folic acid in the United States and Canada. A brief summary of studies isprovided reporting the association between blood folate levels and homocysteine levelsand of the additional roles of pyridoxine and cobalamin in reducing elevated homocys-teine. A summary of formal meta-analyses and systematic information syntheses of theassociation between homocysteine and coronary heart disease (CHD) and other cardio-vascular disease (CVD) follows. We then provide a brief summary of the clinical trialsof folic acid and other B-vitamins as homocysteine—reducing agents in the secondaryprevention of CVD. Finally, we summarize the current understanding of the role ofhomocysteine and folic acid on CVD risk and discuss the implications for public policyand further research.
2. HOMOCYSTEINE
2.1. Homocysteine MetabolismWhen protein is digested, methionine, an essential amino acid, is released.
Homocysteine, a sulfur-containing amino acid, is a product of methionine metabolismand is an essential intracellular metabolite. Under normal circumstances, methionineand homocysteine cycle metabolically, with a steady proportion of homocysteine beingexported into the blood (Fig. 1).
Homocysteine can be metabolized via transsulfuration or remethylation (1,2).Vitamin B6 is important in homocysteine transsulfuration, whereas folate and vitaminB12 play principal roles in homocysteine remethylation. The condensation of homocys-teine and serine to form cystathionine is catalyzed by cystathionine β-synthase, an enzymewidely distributed in mammalian tissues. This enzyme requires pyridoxal 5’-phosphate(the biologically active form of vitamin B6) as a cofactor, and S-adenosylmethionine(SAM) is a positive allosteric effector in this reaction (3). Remethylation of homocysteineto methionine is accomplished by two pathways in humans. One pathway is catalyzedby N-5-methyltetrahydrofolate:homocysteine methyltransferase (methionine synthase).This enzyme, widely distributed in animal tissues, requires 5-methyltetrahydrofolate (themain circulating form of folate in plasma) as the methyl donor and cobalamin (vitaminB12) as a cofactor. Methionine synthase also requires SAM once every 1000 turns of thecatalytic cycle (4). Tetrahydrofolate produced during remethylation reacts with serine ina reaction catalyzed by B6-dependent serine:glycine hydroxymethyltransferase to pro-duce glycine and 5,10-methylenetetrahydrofolate. The enzyme methylenetetrahydrofolatereductase (which is riboflavin [B2]-dependent) regenerates 5-methyltetrahydrofolate.SAM inhibits this reaction, acting as a negative allosteric effector (3). In the secondpathway, betaine acts as the methyl donor, and the active enzyme is betaine:homocys-teine methyltransferase, also inhibited by SAM. This second pathway is confined tothe liver; its quantitative significance in humans is not fully elucidated (5). Thus, theamount of circulating homocysteine is tightly regulated by four B-vitamins: folate,B12, B6, and B2.
Human cells and tissues have different potentials for metabolizing homocysteine. Allcells have the potential for remethylation of homocysteine, but only a limited number ofhuman tissues and organs have the transulfuration pathway available. Defects in either

Fig
. 1.H
omoc
yste
ine
met
abol
ism
in
hum
ans.
Enz
ymes
: 1.
N-5
-met
hylte
trah
ydro
fola
te:
hom
ocys
tein
e m
ethy
ltran
sfer
ase
(met
hion
ine
synt
hase
) [v
itam
in B
12],
2. S
erin
e-gl
ycin
e hy
drox
ymet
hyltr
ansf
eras
e [v
itam
in B
6];
3. m
ethy
lene
-tet
rahy
drof
olat
e re
duct
ase
(MT
HFR
),[v
itam
in B
2];
4.
cyst
athi
onin
e β-
synt
hase
[vi
tam
in B
6];
5.
γcy
stat
hion
ase
[vita
min
B6];
6.
Bet
aine
: ho
moc
yste
nie
met
hyltr
ansf
eras
e;7.
Met
hion
ine
aden
osyl
tran
sfer
ase;
8. M
ethy
ltran
sfer
ases
use
SA
M a
s su
bstr
ate
for
met
hyl
grou
p tr
ansf
ers
to a
ccep
tor
(A)
mol
ecul
es;
9. S
-Ade
nosy
lhom
ocys
tein
e hy
drol
ase.
193

194 Part III / Cardiovascular Disease Prevention
pathway lead to intracellular accumulation of homocysteine, followed by an export tothe circulation, thereby raising blood levels of homocysteine.
Homocysteine exists in plasma in several forms. In normal subjects, about 70 to 85%of the amino acid homocysteine is protein-bound via disulfide linkages, primarily toalbumin (6,7). The remaining homocysteine in plasma rapidly oxidizes to the disulfideshomocystine (two homocysteine molecules linked together) and cysteine-homocys-teine. The amount of total plasma/serum homocysteine is the sum of these three com-ponents and is referred to as homocysteine or total homocysteine (tHcy) (8,9).
Even when the various methods for measuring tHcy correlate well (r = 0.95 andr = 0.98) with each other (10,11), values for tHcy may vary somewhat depending on thelaboratory and collection methods. Some variable changes in tHcy have been observedpostprandially (8); therefore, it is recommended to obtain fasting samples when possi-ble. Fasting levels between 5 and 15 μmol/L are considered normal. Elevated levels oftHcy are referred to as moderate, intermediate, and severe hyperhomocysteinemia forconcentrations between 16 and 30, between 31 and 100, and greater than 100 μmol/L,respectively (7).
Shimakawa et al. (12) reported that among men and women in the AtherosclerosisRisk in Communities Study, methionine and protein intake did not show any significantassociation with plasma tHcy. However, a single dose of methionine administered as100 mg/kg of body weight (i.e., about four times the dietary intake of a normal Westerndiet) (13,14) has been used as a diagnostic test to detect disordered homocysteinemetabolism. Fasting and postmethionine load (PML) levels of tHcy have been found tobe highly interrelated (14,15). Elevated levels of fasting tHcy are believed to reflectfolate- and cobalamin-dependent remethylation, whereas elevated PML is dependent onpyridoxal 5’-phosphate-dependent transsulfuration (16).
2.2. Abnormalities of Homocysteine Regulation: Genetic EffectsThe balance of methionine and homocysteine in the body can be disturbed because
of inadequate intake of folic acid, B12, or B6 or because of genetic defects leading tolow or absent enzyme activity rates in the relevant metabolic pathways. The finding thatthere is a strong genetic influence on homocysteine levels is supported by twin studies(17,18), whereas familial studies also point to a role of shared environment (19,20). Aninterruption of the transsulfuration or remethylation pathways of homocysteine (Fig. 1)produces hyperhomocysteinemia. Severe hyperhomocysteinemia (>100 μmol/L) ismost often the result of homozygous cystathione β-synthase deficiency and leads to acondition called homocystinuria, which is characterized by an overaccumulation oftHcy, as evidenced by urinary excretion of homocysteine. The frequency of this geneticdisorder in the US population has been estimated as 1 in 291,000 (2), with 0.5% of thepopulation being carriers or heterozygotes for cystathione β-synthase deficiency.Several other autosomal recessive inborn errors of metabolism can cause homocystin-uria. These are also very rare and include five different vitamin B12 metabolic defects(CbC, D, E, F, and G) (21). A homozygous deficiency of the enzyme, methylenete-trahydrofolate reductase (MTHFR), presents with neurological symptoms but isextremely rare and occurs in the general population at a rate of about one-tenth that ofcystathione β-synthase deficiency (22).
In 1988, Kang et al. (23) described a less severe defect of the MTHFR enzyme. Thisthermolabile variant of the MTHFR enzyme was associated with raised levels of tHcy.

Chapter 8 / Homocysteine and CVD Risk 195
This form occurs in neurologically normal subjects and is inherited as an autosomalrecessive trait at an allele frequency of 5%, implying that 35% of the general Europeanpopulation (including people of European descent in the United States) are heterozy-gous for this trait. The elevated levels of tHcy seen in individuals with MTHFR enzymevariant in the homozygous state have been found to be correctable with oral folic acidsupplemention (24,25), suggesting that this metabolic block can be overcome withpharmacological doses of folic acid.
This heat-labile variant of MTHFR has been shown to result from a cytosine-to-thymine (C-to-T) mutation at nucleotide 677 (26,27). Homozygotes for the TT genotypehave higher tHcy levels compared with heterozygotes CT and normal homozygotes CC(28). This is most pronounced in homozygotes with low serum folate levels. A secondcommon polymorphism in the MTHFR gene (A1298C) is a glutamic acid-to-alaninesubstitution at codon 429 (29,30), which also results in decreased MTHFR activity. Anestimated 10% of the Canadian and Dutch populations (29,30) are homozygous (CC)for this polymorphism. The combined MTHFR 677TT and 1298CC genotypes are morerare than expected in the general population, which raises the possibility of a phenotypethat is selected against during development (31,32). Although individuals homozygousfor the A1298C polymorphism do not have increased homocysteine levels or lowerplasma folate, individuals who are heterozygous for both polymorphisms (approx 20%of a Caucasian population) have reduced MTHFR activity, higher homocysteine, andreduced plasma folate, similarly to individuals who are homozygous for the C667Tpolymorphism (29).
2.3. Total Homocysteine Concentration in the PopulationThe concentration of tHcy in plasma among healthy, disease-free individuals ranges
between 5 and 15 μmol/L (8). Figure 2 shows mean levels of tHcy for male and femaleadults by age group based on National Health and Nutrition Examination Survey(NHANES) III data (33). The 95% confidence intervals (CIs) are shown for two 4-yrage groups (12–15 yr and 16–19 yr) and six 10-yr age groups ranging from ages 20–29 yrto 80+ yr.
Plasma tHcy is dependent on age and gender, with plasma homocysteine concen-trations increasing with increasing age. As shown in Fig. 2, and as is generally foundin population-based studies, men have higher tHcy concentrations than women(17,34). In women, homocysteine levels are possibly related to menopausal status(10). On the other hand, large differences between pre- and postmenopausal womenfound when measuring homocysteine-cysteine mixed disulfide (6,35) were not foundwhen measuring tHcy.
The reasons for the higher tHcy concentrations observed in older subjects may besecondary to decreased enzyme activity, depressed renal function, and other changesassociated with aging. Gartler et al. (36) showed that cystathionine β-synthase activityin healthy subjects decreased with age; therefore, persons older than age 70 yr and par-ticularly the very elderly had very low enzyme activity. Bostom et al. (37) used a ratmodel to document that loss of homocysteine metabolizing capacity of the kidneys maybe a determinant of elevated tHcy concentration. A decreased intake and absorption ofthe vitamin cofactors responsible for homocysteine metabolism might also contribute.The consistent results of higher tHcy levels in the older population generally supportthese findings.

Fig
. 2.M
ean
leve
ls o
f pl
asm
a ho
moc
yste
ine
in m
ales
and
fem
ales
(fr
om N
HA
NE
S II
I) (
31).
196

Chapter 8 / Homocysteine and CVD Risk 197
3. FOLATE AND HOMOCYSTEINE
3.1. The Influence of Folate Intake on Plasma HomocysteineSeveral investigators have conducted studies examining the effect on homocysteine
levels in response to changes in folic acid intake. Many of these studies were includedin a careful meta-analysis published by the homocysteine lowering trialists’ collabora-tion, which was guided by the Clinical Trial Service Unit in Oxford, UK (38). The meta-analysis used individual-level data contributed by the collaborating authors. The resultsconfirmed that folic acid supplements decrease homocysteine levels at all levels ofhomocysteine but that the amount of reduction was greater for higher baseline levelsand lower blood folate levels, as had been suggested previously (39,40). At average pre-treatment values of homocysteine (12 μmol/L) and folate (12 nmol/L), added folic acidof at least 0.5 mg/d reduced homocysteine levels by about 25% (38). The addition ofvitamin B12 to folic acid supplements further reduced homocysteine levels by about 7%.Supplementation with vitamin B6 had little additional effect on homocysteine levels.(The meta-analysis did not include an evaluation of PML levels of homocysteine.)
We are aware of several additional studies, not included in the meta-analysis, ofhealthy subjects with normal concentrations of folate, vitamin B12, and vitamin B6, inwhom the effect of added folic acid alone for at least 3 wk could be evaluated. Thesefindings are summarized in Table 1. Two studies were conducted in the United Statesbefore 1998 (41,42), four were conducted in the United Kingdom (43–46), three wereconducted in The Netherlands (47–49), one was conducted in Germany (50), one wasconducted in Finland (51) and one was conducted in Ireland (52). In all these studies,there was no fortification with folate at the time.
These studies, conducted in populations without the exposure of increased folic acidin enriched flour and grain products, suggest a graded benefit at doses of folic acidbelow 0.5 mg/d. If there is indeed a graded benefit, it may not extend above about 0.5mg of folic acid daily, because the meta-analysis (38) suggests that a plateau may bereached at about 500 μg/d of added folic acid. This existence of a plateau is supportedby the result of Ubbink and colleagues (53) in which subjects, after 6 wk of treatmentwith 1000 μg of folic acid, 0.4 mg of cobalamin, and 12.2 mg of pyridoxine, had noadditional lowering of tHcy when twice these amounts were given. The recent randomizedtrial by Oort and colleagues (49) also supported the existence of a plateau. This studyused seven doses of folic acid (including placebo) to characterize the dose–responsecurve and concluded that about 90% of the maximal reduction of homocysteine isachieved with the 400 μg/d dose of folic acid.
The studies in Table 1 showed that supplemental folic acid decreases tHcy, and fourof the studies also investigated the effects of natural food folate on tHcy or includedfolic acid in breakfast cereals (48,51,54,55). Most of the dietary folate groups evaluatedexperienced significant increases in plasma folate and red blood cell folate concentra-tions, as well as significant reductions in fasting plasma tHcy. Although the amount offolate consumed by the dietary folate groups reported in Table 1 is higher than com-monly consumed in the general population, these studies show that folate-dense foodscan significantly enhance folate status and decrease tHcy concentration. These resultsare consistent with the studies of folic acid supplements.
Two randomized studies have been conducted in the United States during the post-fortification period (56,57). In a small depletion-repletion study of 30 elderly women

Tab
le 1
Hom
ocys
tein
e R
espo
nse
to F
olic
Aci
d
Dos
e of
Red
ucti
onA
utho
rC
ount
ryN
umbe
rG
ende
rfo
lic
acid
in t
Hcy
Com
men
ts
Hom
ocys
tein
eV
ario
us (
none
had
1114
M/F
400–
5000
μg
0.8–
11.6
μm
ol/L
Met
a-an
alys
is o
f tr
ials
of
both
Low
erin
g T
rial
ists
fort
ific
atio
n at
the
heal
thy
indi
vidu
als
and
thos
eC
olla
bora
tion,
199
9tim
e of
the
stud
y)w
ith e
leva
ted
tHcy
. Min
imum
trea
tmen
t per
iod
of 3
wk.
Tri
als
on h
ealth
y po
pula
tions
not
incl
uded
in th
e H
omoc
yste
ine
Low
erin
g T
rial
ists
’met
a-an
alys
isa
In p
opul
atio
ns n
ot e
xpos
ed to
for
tific
atio
n w
ith f
olic
aci
dO
’Kee
fe e
t al.,
Uni
ted
Stat
es17
F17
0 μg
Com
pari
son
Dep
letio
n th
en s
uppl
emen
tatio
n.19
95 (
41)
270
μg2.
7 μm
ol/L
Onl
y fi
nal t
Hcy
val
ues
wer
e37
0 μg
4.2
μmo/
Lav
aila
ble,
so
rela
tive
redu
ctio
nsha
ve b
een
calc
ulat
ed.
War
d et
al.,
Nor
ther
n Ir
elan
d30
M10
0 μg
0.8
μmol
/LD
oses
wer
e ad
min
iste
red
sequ
en-
1997
(46
)20
0 μg
1.5
μmol
/Ltia
lly. S
uppl
emen
t use
rs w
ere
400
μg1.
8 μm
ol/L
excl
uded
. Tre
atm
ent p
erio
dsw
ere
6, 6
, and
14
wk,
resp
ectiv
ely.
Jaco
b et
al.,
Uni
ted
Stat
es8
F55
μg
0.0
μmol
/LD
eple
tion-
repl
etio
n; 3
-wk
1998
(42
)tr
eatm
ent p
erio
d.N
elen
et a
l.N
ethe
rlan
ds49
F50
0 μg
3.6
μmol
/LN
o co
mpa
riso
n gr
oup:
bef
ore-
1998
(47
)af
ter
com
pari
sons
; 8-w
k tr
eat
men
t per
iod;
par
ticip
ants
had
hist
ory
of r
ecur
rent
spo
ntan
eous
mis
carr
iage
.B
röns
trup
et a
l.,G
erm
any
51F
400
μg0.
95 μ
mol
/LR
educ
tion
com
pare
d to
pla
cebo
1998
(50
)w
asho
ut; 4
-wk
trea
tmen
t per
iods
.B
rouw
er e
t al.,
Net
herl
ands
144
F25
0 μg
1.3
μmol
/LSu
pple
men
t use
rs w
ere
excl
uded
;19
99 (
48)
500
μg2.
6 μm
ol/L
4-w
k tr
eatm
ent p
erio
d.
198

Bro
uwer
et a
l.,N
ethe
rlan
ds67
M/F
350
μg o
f2.
1 μm
ol/L
Fola
te le
vels
are
add
ition
al to
thos
e19
99 (
176)
diet
ary
fola
te2.
4 μm
ol/L
of th
e pl
aceb
o gr
oup;
4-w
k25
0 μg
of
trea
tmen
t per
iod.
folic
aci
dR
idde
ll et
al.,
New
Zea
land
65M
/F47
0 μg
of
0.4
μmol
/LC
ompa
riso
ns w
ith c
ontr
ol g
roup
;20
00 (
54)
diet
ary
fola
te12
-wk
trea
tmen
t per
iod.
300
μg o
f fo
lic2.
4 μm
ol/L
acid
in b
reak
fast
cere
al44
0 μg
of
2.2
μmol
/Lfo
lic a
cid
Sila
ste
et a
l.,Fi
nlan
d37
F38
0 μg
of
1.1
μmol
/LC
ross
over
tria
l: 5-
wk
trea
tmen
t20
01 (
51)
diet
ary
fola
tepe
riod
s w
ith 3
-wk
was
hout
.D
iffe
renc
e in
die
tary
fol
ate
equi
v-al
ent t
o 22
3 μg
of
folic
aci
d.D
aly
et a
l.,Ir
elan
d95
F10
0 μg
0.16
μm
ol/L
Ten-
wee
k tr
eatm
ent p
erio
d.20
02 (
52)
200
μg0.
41 μ
mol
/LC
hang
es in
rel
atio
n to
pla
cebo
400
μg1.
21 μ
mol
/Lgr
oup
calc
ulat
ed.
Ven
n et
al.,
New
Zea
land
70M
/F10
0 μg
in f
ortif
ied
1.8
μmol
/LFo
ur-w
eek
trea
tmen
t per
iod.
2002
(55
)20
0 μg
bre
akfa
st
1.3
μmol
/LD
iffe
rent
ial c
hang
e ca
lcul
ated
in30
0 μg
cer
eal
2.1
μmol
/Lre
fere
nce
to th
e co
ntro
l gro
up.
Ryd
lew
icz
et a
l.,U
nite
d K
ingd
om36
8M
/F50
μg
1.34
μm
ol/L
Six-
wee
k tr
eatm
ent p
erio
d.20
02 (
43)
(Sco
tland
)10
0 μg
0.54
μm
ol/L
Dif
fere
ntia
l cha
nge
calc
ulat
ed in
200
μg1.
41 μ
mol
/Lre
fere
nce
to th
e pl
aceb
o gr
oup
400
μg1.
98 μ
mol
/Laf
ter
3-w
k ru
n-in
.60
0 μg
1.87
μm
ol/L
Ash
fiel
d-W
att e
t al.,
Uni
ted
Kin
gdom
126
M/F
246
μg in
2.2
μmol
/LSi
xtee
n-w
eek
trea
tmen
t per
iods
;20
02 (
44)
(Wal
es)
fort
ifie
d fo
ods
cros
sove
r tr
ial.
Cha
nges
rel
ativ
e 35
2 μg
in2.
3 μm
ol/L
to e
xclu
sion
die
t per
iod.
Dos
esu
pple
men
tta
kes
acco
unt o
f co
mpl
ianc
e (8
8%)
Ash
fiel
d-W
att e
t al.,
Uni
ted
Kin
gdom
135
M/F
100
μg n
atur
al0.
61 μ
mol
/LSi
xtee
n-w
eek
inte
rven
tion
peri
ods.
2003
(45
)(W
ales
)fo
late
0.47
μm
ol/L
All
part
icip
ants
had
wild
-typ
e C
C10
0 μg
fol
ic a
cid
geno
type
for
MT
HFR
C67
7T.
(Con
tinu
ed)
199

Tab
le 1
(C
ontin
ued)
Dos
e of
Red
ucti
onA
utho
rC
ount
ryN
umbe
rG
ende
rfo
lic
acid
in t
Hcy
Com
men
ts
Van
Oor
t et a
l.,N
ethe
rlan
ds31
6M
/F50
μg
0.8
μmol
/LD
iffe
rent
ial c
hang
e ca
lcul
ated
in20
03 (
49)
100
μg1.
3 μm
ol/L
refe
renc
e to
pla
cebo
. Tw
elve
-wee
k20
0 μg
2.2
μmol
/Ltr
eatm
ent p
erio
d. S
trat
ific
atio
n by
400
μg2.
8 μm
ol/L
quar
tile
of tH
cy b
efor
e60
0 μg
3.4
μmol
/Lra
ndom
izat
ion.
800
μg2.
8 μm
ol/L
In p
opul
atio
ns e
xpos
ed to
for
tific
atio
n w
ith f
olic
aci
dK
auw
ell e
t al.,
Uni
ted
Stat
es30
F10
μg
ofC
ompa
riso
nD
eple
tion
(to
110
μg o
f fo
late
)-re
ple-
2000
(56
)fo
lic a
cid
+tio
n. R
esul
ts in
com
pari
son
to70
μg
diet
ary
low
fol
ate
grou
p. F
olat
e va
lues
fola
tear
e ad
ded
to 1
10 μ
g of
die
tary
86 μ
g of
0.9
μmol
/Lfo
late
; 7-w
k tr
eatm
ent p
erio
ds;
folic
aci
del
derl
y w
omen
.13
7 μg
of
1.3
μmol
/Lfo
lic a
cid
+15
5 μg
of
diet
ary
fola
te31
1 μg
of
2.8
μmol
/Lfo
lic a
cid
Ber
esfo
rd e
t al.,
Uni
ted
Stat
es16
0M
200
μg0.
4 μm
ol/L
Two
cros
sove
r tr
ials
with
two
12-w
k20
04 (
57)
F40
0 μg
0.4
μmol
/Ltr
eatm
ent p
erio
ds, 3
0 w
k of
was
h-ou
t per
iod
betw
een
trea
tmen
ts.
Stra
tific
atio
n by
MT
HFR
ge
noty
pe, g
ende
r, an
d br
oad
tHcy
le
vel b
efor
e ra
ndom
izat
ion.
aR
estr
icte
d to
stu
dies
or
part
s of
stu
dies
with
at l
east
3 w
k of
inte
rven
tion.
200

Chapter 8 / Homocysteine and CVD Risk 201
(56), participants followed a low-folate diet (110 μg of dietary folate) for 7 wk and wererandomized to one of four groups with varying combinations of orange juice or folicacid provided in apple juice. Significant additional lowering of homocysteine levelsoccurred in response to the equivalent of 300 μg additional folic acid (56). In a study of160 volunteers (men and women), in which persons homozygous for the TT genotypeof MTHFR C677T were overrecruited, a dose of 200 μg of folic acid given for 12 wkwas compared to a placebo. The design was a crossover trial with a long washout period(30 wk), so that each person served as his or her own control. The order of treatmentswas randomized. A similar parallel trial compared the dose of 200 μg with 400 μg offolic acid. The estimates of additional lowering of tHcy beyond placebo were signifi-cant for both doses (57). Taken together, these studies suggest that the plateau of low-ering of homocysteine attributable to folic acid has not yet been achieved with currentlevels of fortification.
3.2. Homocysteine and Folate ConcentrationsThe lowering of homocysteine levels in response to increasing folate intake is further
supported by the inverse relationship between blood folate and tHcy. Seven studies(8,10,58–62) of tHcy and folate found that tHcy levels markedly increased asplasma/serum folate levels decreased. Folate levels were determined from blood (10),plasma (59,60), or serum (8,58) samples and quantified by radioassay (58,62) or micro-biological assay (59,60). Five additional studies (14,34,63–65) provided support for astrong inverse association between tHcy levels and plasma/serum folate levels.
Kang et al. (58) measured serum protein-bound homocysteine in 239 stored samplesthat represented the extremes of depletion or sufficiency of folate or vitamin B12 among1826 subjects seen in a 1-yr period at a major metropolitan medical center. The meanage of included subjects was 63.7 yr (range: 16–97 yr), with 56% of subjects beingfemale. Among subjects with subnormal serum folate <4.5 nmol/L), 84% had homo-cysteine values that exceeded two standard deviations (SDs) above the mean for a nor-mal group. Homocysteine levels did not appear to change significantly above 9.1nmol/L. Because carefully conducted assessment of dietary folate intake reflects bio-chemically measured folate status (66), these findings are consistent with an inverseassociation between tHcy levels and dietary folate over the low portion of the range offolate intake, with a flattening out of the relationship at the high end, as has been sug-gested by the studies of folate intake. The criteria used to evaluate plasma folate levelsin the absence of vitamin B12 deficiency are: persons with levels less than 6.7 nmol/Lare at “high risk,” persons with levels between 6.7 and 11.1 nmol/L are at “moderaterisk,” and persons with levels greater than 11.1 nmol/L are at “low risk” (66).
Since the introduction of fortification of enriched flour with folic acid, studies in theUnited States have found substantial changes in the distribution of both tHcy and plasmafolate. One study was particularly informative because of information from an ongoingcohort. As part of the regular follow-up examinations of the Framingham offspringcohort, fasting blood samples were obtained, and all participants completed a food-fre-quency questionnaire containing information on vitamin supplements. The timing of thefifth examination was such that it was completed before fortification started. For a por-tion of the cohort, the sixth examination also occurred before fortification, whereas foranother portion, the exam occurred after fortification. Members of the cohort whose sixthexamination occurred between October 1996 and August 1997 were excluded from the

202 Part III / Cardiovascular Disease Prevention
analysis because fortification had begun but was not yet fully implemented (67). Theincrease in plasma folate attributable to fortification was about 5 ng/mL. Among the sub-groups of the cohorts not taking B-vitamin supplements, the reduction in tHcy attribut-able to fortification was about 0.9 μmol/L. Interestingly, although the sixth examinationtHcy levels in the subgroups taking B-vitamin supplements were lower on average thanin the rest of the cohort, the change in tHcy attributable to fortification was an increaseof 0.5 μmol/L. Of note, the difference in the proportion of persons with tHcy greater than13 μmol/L postfortification was not significant after adjusting for B6 and B12 differencesbetween users and nonusers of B-vitamin supplements.
3.3. Pyridoxine and Vitamin B12
Cobalamin alone is effective in lowering tHcy levels in cases with overt cobalamin(vitamin B12) deficiency (28,68–70). In 20 subjects with vascular disease with elevatedtHcy values (68), treatment with pyridoxine alone improved the result of the methion-ine loading test, whereas the inclusion of folic acid resulted in a marked decrease inbasal tHcy levels, especially in subjects with hyperhomocysteinemia. From this andother studies (71), it appears that pyridoxine may be effective in reducing elevated tHcyfollowing a methionine load test but is not effective in reducing the elevated fastingtHcy. Dudman et al. (72) found that treatment with either pyridoxine or folic acid wassimilarly effective to those from combined treatment for subjects with vascular diseaseas assessed with a PML test. On the other hand, folic acid seems to be the key factor inreducing fasting hyperhomocysteinemia.
4. HOMOCYSTEINE AND CVD
4.1. Homocysteine and CHDMany studies have been conducted concerning various kinds of vascular diseases and
their relationship to tHcy levels and/or folate levels or folate intake. Study designs var-ied from prospective to cross-sectional to case-control studies, in which controls wereselected from a source population different than that of the cases. These source popula-tions of controls ranged from volunteers to hospital patients. Other studies recruitedcontrols from screening programs or population-based registries. Some studies includedcases of both fatal and nonfatal myocardial infarction (MI), whereas others includedonly nonfatal cases, sometimes defined by degree of angiographically confirmed occlu-sion of a coronary vessel. Some studies measured PML levels, whereas others used fast-ing or basal (casual) levels of homocysteine. Basal levels are easier to obtain thanfasting levels in large cohort investigations. Our group has summarized, in detail, stud-ies identified through 1999 (73–75), and overlapping sets of studies have been subjectedto critical review or meta-analysis by other groups (76–83). The meta-analyses report-ing pooled risk of CHD are summarized in Table 2.
Nested case-control studies are those in which controls were sampled from the cohortfrom which the cases arose; blood samples were obtained (and frozen) before the dis-ease occurred. Population-based case-control studies are retrospective studies in whichcases and controls were drawn from the same defined general population. These twostudy types are considered to be “high quality” but were separately synthesized in mostmeta-analyses. These analyses differed in their treatment of cross-sectional and “other”case–control studies. Cross-sectional studies used no sampling by outcome status and

Tab
le 2
Met
a-A
naly
ses
of H
omoc
yste
ine
and
CH
D R
isk
Est
imat
ed O
dds
Rat
io (
95%
Con
fide
nce
Inte
rval
)
Uni
t of
tH
cy c
hang
eA
utho
rus
ed i
n od
ds r
atio
CH
D p
rosp
ecti
veC
HD
ret
rosp
ecti
veN
umbe
r of
stu
dies
Stud
ies
that
did
not
dif
fere
ntia
te p
opul
atio
n-ba
sed
case
-con
trol
stu
dies
fro
m o
ther
cas
e-co
ntro
l stu
dies
Cle
opha
s et
al.,
200
0 (7
8)“E
leva
ted”
tHcy
1.49
(1.
33–1
.67)
1.62
(1.
50–1
.74)
a11
pro
spec
tive
22 r
etro
spec
tive
Ford
et a
l. IJ
E, 2
003
(82)
5-μm
ol/L
chan
ge1.
23 (
1.14
–1.3
2)b
1.70
(1.
50–1
.93)
10 p
rosp
ectiv
e29
ret
rosp
ectiv
e
Stud
ies
that
onl
y in
clud
ed p
opul
atio
n-ba
sed
case
-con
trol
stu
dies
in th
e po
oled
est
imat
e of
ret
rosp
ectiv
e st
udie
sU
elan
d et
al.,
200
0 (7
7)5-
μmol
/Lch
ange
1.20
(1.
14–1
.25)
Not
incl
uded
14 p
rosp
ectiv
eB
eres
ford
and
Bou
shey
,5-
μmol
/Lch
ange
1.15
(1.
09–1
.21)
mal
e1.
35 (
1.24
–1.4
8) m
ale
12 m
ale,
7 f
emal
e20
01 (
73)
pros
pect
ive
1.42
(1.
25–1
.62)
fem
ale
1.37
(1.
15–1
.55)
fem
ale
6 m
ale,
5 f
emal
epo
pula
tion-
base
dca
se-c
ontr
olT
he H
omoc
yste
ine
stud
ies
25%
low
er b
asel
ine
0.83
(0.
77–0
.89)
0.67
(0.
62–0
.71)
11 p
rosp
ectiv
eco
llabo
ratio
n, 2
002
(79)
hom
ocys
tein
e le
vel
1.20
(1.
12, 1
.30)
1.49
(1.
41, 1
.61)
12 p
opul
atio
nca
lcul
ated
inve
rse
-bas
ed c
ase-
cont
rol
Bau
tista
et a
l., 2
002
(81)
“Ele
vate
d” tH
cy1.
46 (
1.15
–1.8
6)N
ot in
clud
ed9
pros
pect
ive
only
Wal
d et
al.,
200
2 (8
3)5-
μmol
/Lch
ange
1.23
(1.
14–1
.32)
Not
incl
uded
16 p
rosp
ectiv
e on
lyaR
epor
ted
as C
AD
but
act
ually
incl
uded
in s
ome
stud
ies
of c
ereb
rova
scul
ar d
isea
se.
bO
nly
nest
ed c
ase–
cont
rol s
tudi
es in
clud
ed in
this
poo
led
estim
ate.
CH
D, c
oron
ary
hear
t dis
ease
; CA
D, c
oron
ary
arte
ry d
isea
se.
203

204 Part III / Cardiovascular Disease Prevention
may have included convenience samples. Other case–control studies included hospital-based investigations and those in which controls were from a different population thanthe cases. Some researchers decided against conducting a formal meta-analysis of thesestudies because of the variability in study methods and quality (76). Others assignedquality scores to each study based on design criteria (82).
There is still no consensus on the exact level for defining elevated tHcy. The defini-tions commonly employed are values exceeding the 90th or 95th percentile among agroup of healthy subjects or values exceeding the mean of normal controls by more thantwo SDs. Therefore, the cutoff values used by investigators for classification of elevatedtHcy levels in their respective studies vary according to the distribution among theircontrol subjects. This presents a challenge for summarizing the evidence concerning thelink between hyperhomocysteinemia and risk of CHD in a quantitative fashion.
Although early studies examined the risk of CVD associated with elevated homocys-teine, many later studies found evidence of a graded relationship between homocysteineand risk of cardiovascular disease (84–88). Indeed, several studies (89–91) of carotid andcoronary arteries indicated that the extent of quantitatively defined arterial narrowing isconsistent with a graded response to increasing tHcy levels. As described earlier, pool-ing information from studies that used disparate definitions of elevated homocysteineleads to grouping of quite disparate estimates of risk. Nonetheless, this approach wasused in a few of the meta-analyses (78,81). Studies using cut-points for elevated tHcyalso can contribute to estimates of the linear association between tHcy and CHD risk.
Analyses from our group (73–75), as well as some others (82,83), assumed a linearrelationship between tHcy levels and risk of CAD and calculated a summary odds ratiobased on a 5-μmol/L increment in tHcy concentration. The combined odds ratio for a 5-μmol/L increment in tHcy, adjusting for conventional risk factors for CHD as reportedin the individual studies, is shown in Table 2. It should be noted that some prospectivestudies included in these meta-analyses reported being able to distinguish betweenshort-term and longer term risk of CHD associated with high homocysteine (e.g., refs.92–94). However, the meta-analysis of prospective studies by Bautista and colleagues(81) found that the magnitude of the combined risk of all CVD was independent of theduration of follow-up. Again, some of the studies found evidence of an interaction effect(77) with one or more of the conventional risk factors (15). On the other hand, this wasnot confirmed in the large collaborative study of British, European, and American sci-entists in which some of our group participated, known as the Homocysteine StudiesCollaboration (79). This collaboration obtained primary data from 30 studies, allowing apowerful set of analyses that examined differences between studies, confounding factors,and regression dilution bias.
There was no evidence of interaction between the association of homocysteine withCHD and age, gender, smoking, blood pressure, or blood cholesterol (79).Homocysteine was correlated with the major known risk factors for CHD, namely cur-rent smoking, total cholesterol, and systolic blood pressure, and adjustment for thesefactors did attenuate the size of the association between tHcy and risk of CHD. Theserisk estimates, calculated using a multiplicative model (using a logarithmic transforma-tion of tHcy), are presented in Table 2. The estimates relate to a 25% lower than baselineshift in tHcy, which is equivalent to about 3 μmol/L at the mean tHcy in controls, 4 μmol/Lat mean plus one SD, and 5 μmol/L at mean plus two standard deviations,. Because theother meta-analyses have calculated pooled risks in relation to elevated tHcy or tHcy of

Chapter 8 / Homocysteine and CVD Risk 205
5 μmol/L higher, we have included a recalculation of the published estimate and twoends of the CI, using the inverse of each number, for comparison purposes.
Several authors claimed that the relative risks estimated from prospective studieswere less likely to show an effect of tHcy elevations on CHD than those estimated fromcase-control studies (including population-based). Although this has been documentedin several studies that conducted careful meta-analyses separately for these two types ofstudies, it did not hold universally true, as demonstrated in Table 2. For example,Beresford and Boushey (73) found that the estimated risk per 5 μmol/L tHcy was closerto the null for the case–control studies than for the prospective studies for women.Overall, the pooled odds ratio for CHD for men and women together is consistentlyaround 1.2 per 5 μmol/L tHcy change and around 1.5 for elevated tHcy.
4.2. Homocysteine and Cerebrovascular DiseaseStudies of homocysteine and risk of stroke also have been summarized by our group
(74,75) as well as others (79,80,82,83), and these summaries have included bothprospective studies and retrospective case-control studies. The various meta-analyses ofhomocysteine and risk of cerebrovascular disease are shown in Table 3. Four studies ofpresymptomatic carotid arteriosclerosis provide additional support for tHcy as a riskfactor in cerebrovascular disease. Evidence of carotid atherosclerosis using ultrasoundmethods was noted in heterozygotes for cystathionine β-synthase deficiency (95,96).Two larger cross-sectional studies also showed an association of hyperhomocysteine-mia with objective evidence of carotid artery stenosis (90,91). From prospective studies,the pooled odds ratio for stroke per 5 μmol/L tHcy change has been estimated at between1.3 and 1.6, as shown in Table 3.
4.3. Homocysteine and Peripheral Vascular DiseaseThree population-based case–control studies (97–99) were part of our earlier synthesis
of homocysteine and peripheral vascular disease studies (14,68,73,97–103), and twoothers have been published since 1996 (15,104). All five studies found homocysteine tobe a risk factor for peripheral vascular disease, independent of conventional risk factors.The Framingham study (105), with a median follow-up of 10 yr, also found an increasedrisk of CVD (including peripheral vascular disease) of 1.53 (95% CI 1.16, 1.98), associ-ated with homocysteine levels in the highest quartile compared to the other three quartilesafter adjustment for age, gender, cholesterol (total and HDL), smoking, blood pressure,and diabetes.
5. MTHFR, FOLATE INTAKE, AND CVD RISK
Given the evidence that homocysteine is related to increased risk of CVD and thatindividuals homozygous for MTHFR C677T have decreased MTHFR activity andhigher homocysteine levels, it seems plausible that individuals with the TT mutationmight experience an increased risk of MI. The hypothesis is that high folate intakemight compensate the lower MTHFR activity in homozygotes by lowering plasma tHcyin individuals with the mutation. One of the first studies to examine this hypothesis wasthe Physicians’ Health Study (106). During an 8-yr follow-up, the risk for nonfatal MIand fatal CHD was not significantly different between the three C677T genotypes,despite the TT genotype having significantly higher mean tHcy levels than the CC

Tab
le 3
Met
a-A
naly
ses
of H
omoc
yste
ine
and
Stro
ke R
isk
Est
imat
ed O
dds
Rat
io (
95%
con
fide
nce
inte
rval
)
Uni
t of
tH
cy c
hang
eSt
roke
ret
rosp
ecti
ve w
ith
Aut
hor
used
in
odds
rat
ioSt
roke
pro
spec
tive
popu
lati
on c
ontr
ols
Num
ber
of s
tudi
es
Stud
ies
that
did
not
dif
fere
ntia
te p
opul
atio
n-ba
sed
case
-con
trol
stu
dies
fro
m o
ther
cas
e-co
ntro
l stu
dies
Kel
ly e
t al.,
200
2 (8
0)“E
leva
ted”
tHcy
1.43
(1.
09–1
.89)
HR
1.79
(1.
61–2
.00)
a6
pros
pect
ive
(3 w
ith H
R, 3
with
2.01
(0.
97–4
.13)
OR
14 c
ombi
ned
pros
pect
ive
and
retr
ospe
ctiv
eFo
rd e
t al.,
200
2 (8
2)5-
μmol
/Lch
ange
1.58
(1.
35–1
.85)
2.16
(1.
65–2
.82)
6 ne
sted
cas
e-co
ntro
l20
ret
rosp
ectiv
e
Stud
ies
that
onl
y in
clud
ed p
opul
atio
n-ba
sed
case
-con
trol
stu
dies
in th
e po
oled
est
imat
e of
ret
rosp
ectiv
e st
udie
sB
eres
ford
and
Bou
shey
,5-
μmol
/Lch
ange
1.5
(1.3
–1.8
)aN
ot in
clud
ed3
pros
pect
ive
com
bine
d w
ith 1
1997
(74
)po
pula
tion-
base
d ca
se-c
ontr
olT
he H
omoc
yste
ine
stud
ies
25%
low
er0.
77 (
0.66
–0.9
0)0.
86 (
0.73
–1.0
1)8
pros
pect
ive
colla
bora
tion,
200
2 (7
9)ho
moc
yste
ine
leve
lC
alcu
late
d in
vers
e1.
30 (
1.11
, 1.5
2)1.
16 (
0.99
, 1.3
7)3
popu
latio
n-ba
sed
case
-con
trol
Wal
d et
al.,
200
2 (8
3)5-
μmol
/Lch
ange
1.42
(1.
21–1
.66)
Not
incl
uded
8 pr
ospe
ctiv
e on
lyaC
ombi
ned
all s
tudi
es. H
R, h
azar
d ra
tio; O
R, o
dds
ratio
.
206

Chapter 8 / Homocysteine and CVD Risk 207
genotype. This difference was most marked among men with low folate levels. Thus, inthis population, the MTHFR C677T polymorphism was associated with higher tHcylevels but not with risk of MI (106). Many other studies addressing the role of theMTHFR polymorphism and its effect of vascular disease (107,108) reported similarresults. More recently, a family-based study in Spain (109) used the transmission dise-quilibrium test to evaluate the associations of the MTHFR C677T gene variants andCHD risk. In this study, 101 nuclear families (parents) were recruited from index cases.No difference in T-allele frequency was found, even within subgroups defined by majorCHD risk factors. One meta-analysis of 23 reports in the literature (28) concluded theprevalence of the TT genotype in patients with CVD was almost identical to the preva-lence in controls (11.9 and 11.7% respectively). A meta-analysis of stroke risk reportedthe pooled odds ratio from 19 studies associated with the TT genotype as 1.23 (95% CI0.96–1.58) (80). On the other hand, two recent meta-analyses did find a significant ele-vated risk associated with the TT genotype. In a meta-analysis of 46 studies of CHD inrelation to TT genotype, the pooled odds ratio for homozygotes for 677TT comparedwith wild-type CC677 was 1.21 (95% CI 1.06–1.39) (83). Similarly, a meta-analysisthat included 40 studies (22 from Europe, 10 from North America, and 8 from othercontinents) (110) found an overall odds ratio of 1.16 (95% CI 1.05–1.28). There washeterogeneity between studies that was largely accounted for by continent of origin. Thepooled risk of CHD among individuals with TT genotype compared to those with CCgenotype within the European studies was 1.14 (95% CI 1.01–1.28), whereas thecorresponding risk within North American studies was 0.87 (95% CI 0.73–1.05). Thisdifference may be explained by differences in folate status, as suggested by Klerk andcolleagues (110). A subset of the studies included data on folate status, so that the effectof TT genotype on CHD risk could be estimated separately by folate status. There wasa significant elevation among those with low status, who had a pooled odds ratio of 1.44(95% CI 1.12–1.83), but not among those with high folate status, who had a pooled oddsratio of 0.99 (95% CI 0.77–1.29) (110). Therefore, most of the evidence suggests thatthere is an elevated risk of CHD associated with TT homozygotes for the MTHFRC677T polymorphism (111); this association has been difficult to prove because of thesmall overall effect but is apparent among those with concomitant low folate status.This evidence of the role of MTHFR C677T is consistent with the relationship betweenhomocysteine and CHD risk.
6. FOLATE AND CVD
6.1. Dietary Folate and Folate Concentration and Risk of CVDMany studies of CVD and tHcy levels also measured the B-vitamins that most influ-
ence tHcy concentration, namely, folate, vitamin B6, and vitamin B12. In particular, folateis strongly inversely associated with levels of tHcy, and if tHcy is associated with CVD,then of the link between folate status and risk of CVD is important. The findings amongthese observational studies have been reviewed previously (73,74). In spite of differentdefinitions of case and the use of different cut-points of the folate distribution, the resultsof the studies are fairly consistent. At concentrations of plasma/serum folate above 10nmol/L, there is a significant reduction in risk for vascular disease (89,91,112,113), par-ticularly among females (108,114) and adults ages 35 to 55 yr (115). Point estimates fromother studies (93,116,117) supported these findings but were not statistically significant.

208 Part III / Cardiovascular Disease Prevention
In the studies that had available levels of tHcy as well as concentration of folate, inves-tigators were able to examine the association of folate with vascular disease while simul-taneously controlling for fasting tHcy. Theoretically, if the risk associated with folate andvascular disease changes with the addition of tHcy in the model, then one can assume thatfolate is affecting the risk of vascular disease via the tHcy pathway. In the population-based case–control studies reported by Pancharuniti et al. (89) and Robinson et al. (113),the addition of tHcy to their models of folate and CVD resulted in folate no longer beingsignificant. In the study by Schwartz et al. (116) among younger aged women, the asso-ciation with folate was weakened when tHcy was added to the model. In the prospectivePhysicians’ Health Study, the presence of tHcy in the model only slightly attenuated theRR for low levels of folate; therefore, it was not clear in this study whether folate affectedthe risk of MI only via the tHcy pathway or had an independent effect.
Regardless of the pathway, there is enough evidence to justify a targeted researcheffort to explore the relationship between intake of dietary folate and risk for vasculardisease. Early studies used observational data to examine this question. In a subset ofsubjects from the Framingham Heart Study (91), stenosis was inversely related toreported intakes of folate. Intakes less than 327 μg/d showed a fivefold increase in riskcompared to intakes greater than 475 μg/d. Another analysis from the FraminghamStudy (118) indicated that intake of fruits and vegetables was inversely associated withincidence of strokes and transient ischemic attacks (TIAs). Although many factors couldpotentially explain this finding, one consideration is the large contribution that fruitsand vegetables made to total folate intake. Therefore, the protective effect of fruits andvegetables for stroke and TIA is compatible with folate lowering the risk of CVD,possibly through lowering tHcy levels. In a careful analysis of the NHANES IEpidemiologic Follow-Up Study, dietary intake of folate was assessed using informa-tion from the single 24-h dietary recall (at baseline in 1971–1975), and informationabout folate content of foods reported was calculated using ESHA Food Procesessorsoftware (119). At about 19 yr of follow-up (in 1992), 3758 incident cardiovascularevents had occurred, of which 926 were incident stroke events (120). The mediandietary folate intake in the early 1970s was approx 200 μg/d. Analyses adjusted forenergy intake and known major risk factors for stroke and CVD. Participants who con-sumed at least 300 μg/d had a 20% lower risk of stroke and a 13% lower risk of anyCVD. Limitations of the single 24-h recall were acknowledged, but within-person vari-ability would most likely lead to underestimation of the association between dietaryfolate and stroke risk (120).
A small case–control study of dietary folate intake and risk of nonfatal MI was con-ducted in Spain. Compared to the lowest quartile of energy-adjusted folate intake (esti-mated from a food-frequency questionnaire), the upper three quartiles had an odds ratioof 0.57 (95% CI 0.35–0.94) (121). Graham et al. (15) found that users of vitamin sup-plements had a substantially lower risk of vascular disease than nonusers, and some ofthis lowering was attributable to lower plasma tHcy levels. A prospective study inFinland based in Kuopio, which has one of the highest rates of CHD, included a 4-dfood record at baseline (1984–1989). By the 10-yr follow-up, 199 men had experiencedan acute coronary event. After adjusting for major known risk factors and other con-ventional and nutritional factors, men in the highest quintile of folate intake at baseline(300 μg/d or more) had a relative risk of acute coronary events of 0.45 (95% CI 0.25–0.81)compared to those in the lowest quintile of folate intake (about 200 μg/d or less) (122).

Chapter 8 / Homocysteine and CVD Risk 209
Additional evidence for dietary and supplement sources of folate comes from theprospective analysis of the Nurses’ Health Study by Rimm et al. (123). During a 14-yrfollow-up, the risk for nonfatal MI and fatal CHD was considerably lower amongwomen who consumed 696 μg of folate per day compared to 158 μg (RR = 0.69, 95%CI 0.55–0.87). Risk of CHD was also reduced among women who regularly used mul-tiple vitamins (the major source of folate), including vitamin B12 and B6 (RR = 0.76,96% CI 0.65–0.90).
Several randomized controlled trials of folate, vitamin B12, and vitamin B6 are beingconducted or have concluded recently. One small study of an intervention to reducecarotid plaque area provided evidence of vitamin supplementation influencing the pro-gression of atherosclerosis (124). This study followed 18 men and 20 women (meanage: 57.9 yr) with initial tHcy concentration greater than 14 μmol/L for 4.4 yr aftertreatment with 2.5 mg of folic acid, 25 mg of pyridoxine, and 250 μg of vitamin B12.Each individual had at least two measurements of total plaque area before and two mea-surements after treatment as determined by ultrasound. Prior to treatment, plaque areahad been measured as increasing. After treatment, plaque area decreased significantlyand both genders and all ages responded equally to treatment with the B vitamins (124).No concentration levels of vitamins or tHcy were reported. Two slightly larger trialswere recently published (125,126). In a randomized controlled study of 5000 μg/d offolic acid, 593 patients in the Netherlands with stable CHD and currently on statin treat-ment were randomized to intervention or control and followed for approx 2 yr. A forti-fication program in the Netherlands had not been implemented at the time of the study.Nonetheless, the study found no difference in time to first event of any of a variety ofCVD events for the folic acid-supplemented group compared to the placebo group(125). In contrast, the randomized controlled trial in Switzerland of 1000 μg/d of folicacid with 400 μg/d of vitamin B12 and 10 mg/d of vitamin B6 found a lower risk ofdeath, nonfatal MI, and need for repeat revascularization at 1 yr of a composite endpoint(127). Participants were 553 consecutive patients enrolled after successful angioplastyof at least one significant coronary stenosis who were not taking vitamin supplements.The treatment period was 6 mo. Clinical follow-up took place at 6 mo and again at 12 mopostrandomization. The hazard ratio of any event was 0.66 (95% CI 0.47–0.94) in thefolic acid, B12, and B6-treated group compared to the placebo after adjustment for factorsknown to influence the need for target lesion revascularization (127). None of these trialswas large, and all had relatively short-term follow-up.
Studies in countries such as the United States and Canada, where fortification ofenriched flour and grain products has already been implemented, may need even largernumbers because the reduction in levels of homocysteine with additional folic acid,B12, and B6 treatment is likely smaller than would have been expected prior to fortifi-cation (see Table 1). It has been pointed out that useful inferences may still be madefrom studying subsets of persons with very high levels of homocysteine, such as thosewith renal impairment (128), because renal function is highly correlated with homo-cysteine levels, especially in those over age 65 yr (129). One large study was recentlypublished (130). Participants were individuals who had a nondisabling stroke and totalhomocysteine levels in the top quartile of the North American homocysteine distribution.Centers collaborated from the United States, Canada, and Scotland. After a run-inperiod, 3680 participants were randomized to high dose or low dose of folic acid, pyri-doxine, and cobalamin. The study was stopped early, after an average of 20 mo, with

210 Part III / Cardiovascular Disease Prevention
essentially no difference in the risk of recurrent stroke (130). The reduction in follow-uphomocysteine levels in the group assigned to receive high doses of vitamins was notas large as had been anticipated, and even this study was insufficiently powered todetect the corresponding difference (predicted from observational studies) in combinedCHD and stroke risk.
There are at least nine other large randomized trials underway for which results cur-rently are not known. The minimum sample size projected is 2000, and the maximumis 12,000 (131,132). There are two studies in Norway (NORVIT, WENBIT), two inAustralia (PACIFIC [133], VITATOPS), one in the United States (WACS), one inCanada (HOPE-2), two in the United Kingdom (SEARCH, CHAOS-2), and one in France(SU.FOL.OM3 [134]). The interventions include various combinations of folic acid (atdoses between 2000 and 5000 μg), vitamin B12 (at doses between 400 and 1000 μg),and vitamin B6 (at doses between 25 and 50 mg). All are secondary prevention trials ofstroke, CHD, or other vascular disease (131).
7. SUMMARY AND CONCLUSIONS
7.1. A Causal Relationship Between Homocysteine and CHDThe evidence linking homocysteine levels with risk of CVD is consistent. Both prospec-
tive and case-control studies suggest a positive association. Although there is some evi-dence of confounding, there is also evidence regarding CHD that tHcy is an independentrisk factor, contributing additional risk independent of some other known major risk fac-tors such as total cholesterol (89,92,135–138), LDL or HDL cholesterol (89,92,138,139),body mass index (89,92), age (89), and high blood pressure (89,92,137,138).
Although the magnitude of the association between tHcy and risk of CHD is notlarge, it has been estimated with good precision. In the various meta-analyses reviewed,the summary risk estimate for CAD for an increase of 5 μmol/L of homocysteine wasabout 1.2 after adjusting for conventional risk factors, using only the prospective studies.This level of risk is similar to other well-established risk factors for CHD.
There is no evidence that CAD or related diagnostic manipulations influence tHcyconcentrations. In the prospective studies, high tHcy levels clearly antedated the mani-festations of either CAD or stroke.
There are biologically plausible mechanisms by which tHcy might alter risk of devel-oping vascular disease. Atherogenic mechanisms promoted by homocysteine includeendothelial cell desquamation, oxidation of LDL, and monocyte adhesion to the vesselwall (22,140). Direct toxicity of homocysteine to the endothelium has been reported inlaboratory studies (141–143). Harker et al. showed endothelial desquamation in vivo inbaboons infused with homocystine (144) or homocysteine (145) at the high levels typ-ical of patients with homocystinuria. Tsai and coworkers (146) showed that homo-cysteine increases DNA synthesis in vascular smooth muscle cells consistent with earlyarteriosclerotic lesions and induces these cells to proliferate while impeding the regen-eration of endothelial cells. Homocysteine may predispose to arteriosclerosis by pro-moting oxidation of LDL (147) or by decreasing thrombomodulin cell-surfaceexpression and inhibiting protein C activation, thus probably contributing to develop-ment of thrombosis (148). Folate may have beneficial cardiovascular effects viaendothelium-dependent responses, as was demonstrated in a crossover trial of adultswith hyperhomocysteinemia (149).

Chapter 8 / Homocysteine and CVD Risk 211
In summary, the association between hyperhomocysteinemia and CHD has therequired elements of strength, consistency, temporality, and biological plausibility thatallow a causal inference from observational studies (150).
7.2. LimitationsIn meta-analysis, results are combined from studies that may differ in methodology
and include noncomparable populations. Publication bias (i.e., not publishing smallnegative studies) is possible. Although those negative studies that were published wereincluded in the summary risk ratios, there may have been other negative studies per-formed for which lack of inclusion may have inflated the summary risk ratios calcu-lated. The relationship between homocysteine and CHD risk is established from theobservational studies, but to date, only a few short-term randomized controlled trialshave been published that have investigated the effects of lowering of homocysteine onCVD markers (151,152). More than nine large randomized controlled trials are nowunderway, and we await their results with interest.
Many investigations demonstrated that folic acid reduces tHcy levels. Although var-ious combinations of folic acid, vitamin B12, and vitamin B6 were often administered,folic acid appeared to be the effective agent, because it reduced tHcy levels even whenadministered alone. Vitamin B12 contributes additional lowering of tHcy (153,154).However, because the interactions of folic acid, vitamin B12, and vitamin B6 are notfully known, further studies of all three of these vitamins will be useful. Whether nutri-tional inadequacy of folic acid alone will raise tHcy levels or whether this response islimited to individuals predisposed genetically to develop hyperhomocysteinemiarequires further study. The existence of several different genetic traits (including thecommon MTHFR polymorphism described earlier) predisposing to high tHcy levelssuggests that genetic variability in response to folic acid intake might be expected.Therefore, it is not unlikely that TT homozygotes for the MTHFR polymorphism (155)may have higher folate requirements, and furthermore, it is possible that other subsetsof the population may have different folate requirements (regarding homocysteine low-ering capacity). Until such differences are fully elucidated, a population approach thattreats the different genetic and environmental origins of the homocysteine–folic acidrelationship in the same way appears appropriate.
7.3. The Broader Health ContextAre there negative implications of widespread supplementation or fortification with
folic acid? It has been known for a long time that folic acid may mask the hematologi-cal manifestation of unrecognized pernicious anemia (cobalamin deficiency) while itsneurological manifestations, which may be severe and include spinal cord damage, mayprogress (156). However, such effects were observed mainly with high pharmacologi-cal doses of folic acid (i.e., 5,000 μg or more). It is not clear whether such high dosesprecipitate or exacerbate the neuropathy of cobalamin deficiency. The effect on the neu-ropathy of vitamin B12 deficiency of lower doses, such as those received through forti-fication of enriched flour and grain products in the United States, remains poorlydefined (156). Among the elderly, studies have estimated a 5% prevalence of serumvitamin B12 deficiency associated with methylmalonicacidemia (62,70), unrelated topernicious anemia. This deficiency could be corrected by oral doses of cobalamin, as hasbeen demonstrated by some members of our group (157). If the oral dose of vitamin B12

212 Part III / Cardiovascular Disease Prevention
were large enough (such as 1000 μg of B12), even persons with pernicious anemia (esti-mated to be 1 in 5000) (158) would derive some benefit, because 1 to 3% of vitaminB12 can be absorbed by simple diffusion (159,160). In countries that have implementedfortification with folic acid at low doses (140 μg/100 μg of grain product) as well as inthose that have not, the highest consumers of folic acid continue to be those taking vit-amin supplements containing 400 μg of folic acid. If 1000 μg of cobalamin was addedto vitamin supplements containing 400 μg of folic acid, then most vitamin B12 defi-ciencies would be corrected, and concern about the possible masking effects of folicacid would likely be negligible (156).
What are other implications of a nutritional policy to increase folic acid intake?About 2500 cases of neural tube defects occur annually in the United States, and about1500 fetuses with this condition are aborted following detection by prenatal diagnosis(161). Women who had children with neural tube defects have slightly elevated tHcylevels. In some women, this is caused by low folate intake or poor absorption, and inothers, this is presumably caused by yet undescribed genetic defects or variants predis-posing to hyperhomocysteinemia (162). There is excellent evidence from a variety ofstudies that at least 50% of neural tube defects can be prevented if 400 μg of folic acidis taken daily before and during the first 4 wk of pregnancy (161). Because manywomen do not realize it when they are in the very early stages of pregnancy, folic acidsupplementation and dietary counseling have not been successful in increasing folicacid intake in the population during this critical time (163). The Food and DrugAdministration in the United States mandated adding folic acid to the food supply byfortification of enriched grains from 1998 onward (164). The policy of fortificationappears to have delivered more than the average population-wide increase of 100 μg/dthat had been anticipated. A study of serum folate levels over time using stored bloodsat Kaiser–Permamanente showed a 50% increase in median serum folate value between1994 and 1998 (165), and an application of a linear regression analysis using publishedstudies of the relationship between folate intake and serum folate suggested a dailyincrease of about 200 μg in folate intake following fortification (166). The fortificationpolicy appears to have led to a reduction in the rate of neural tube defects of about 19%(167) and—in light of our review of the homocysteine, folic acid, and CVD risk story—at the same time promises to have the much larger effect of reducing vascular diseasein several thousand older men and women.
8. RECOMMENDATIONS
Although the cause and mechanism of homocysteine associated CVD have not yetbeen firmly established, the American Heart Association deemed the association com-pelling enough to issue a Science Advisory in early 1999 (168). Currently, widespreadscreening of tHcy levels is not recommended. However, determining fasting tHcy lev-els among affected individuals of younger age and in high-risk patients (i.e., individu-als with a strong family history for premature atherosclerosis or occlusive vasculardisease in the absence of other “traditional” risk factors) should be considered. On theother hand, the report of the Food and Nutrition Board of the National Academy ofSciences, Institute of Medicine (169) included Dietary Reference Intakes of 400 μg ofdietary folate equivalents, 1.7 mg of vitamin B6, and 2.4 μg of vitamin B12 as an aver-age daily intake. Because a large proportion of the population does not currently meet

Chapter 8 / Homocysteine and CVD Risk 213
these dietary recommendations, a reasonable population approach is to promote anincrease in the intake of foods containing these vitamins.
On a population basis, fortification of grains with enough folic acid to deliver 400 μgto the majority of women of childbearing age would be the most logical step to preventa large fraction of neural tube defects (170–172). The strength of the evidence suggestingthat increased folic acid as a public health measure to lower homocysteine might benefitlarge numbers of elderly people in the prevention of vascular and other disease (173) faroutweighs the available evidence concerning possible risks for mild neurological impair-ment with undiagnosed vitamin B12 deficiency. Clinical trials have been initiated toassess the role of folic acid for vascular disease prevention with careful attention to itspossible neurological effects in vitamin B12-deficient individuals. Meanwhile, action ona population basis should not wait: a combined strategy to increase both folic acid andvitamin B12 intake appears prudent at this stage (156) and would likely prevent mucharteriosclerotic vascular disease as well as neural tube defects.
Despite the fact that fortification seems to have led to higher daily folic acid intakesthan anticipated (166), there continues to be wide recognition that the current fortifica-tion policy is not optimally lowering homocysteine (49,174,175). There is not consensusregarding the best way to reach this optimum (153,154). We recommend a policy of: (a)fortification of grains with folic acid at a level at least as high as that currently practicedin the United States and (b) the mandatory addition of 1 mg of vitamin B12 to all vitaminsupplements containing 400 μg of folic acid.
There are population subgroups in which folate requirement may be higher becauseof a polymorphism in MTHFR or because of regular high alcohol consumption, renaldisease, and so forth. For these groups, additional supplementation is likely of even greaterimportance. While further evidence accumulates, the best course may be to followphysician recommendations tailored to the individual.
On an individual basis, in general, we recommend taking a dietary supplement of400 μg/d of folic acid to prevent vascular disease. This recommendation has particularpotential benefits for middle-aged and elderly individuals, both men and women. Sucha dose is found in most multivitamins of the one-a-day type.
REFERENCES1. Ueland PM, Refsum H. Plasma homocysteine, a risk factor for vascular disease: plasma levels in
health, disease, and drug therapy. J Lab Clin Med 1989; 114(5):473–501.2. Mudd SH, Levy HL, Skovby F. Disorders of transsulfuration. In: Scriver CR, Beaudet AL, Sly WS,
et al., eds. The Metabolic and Molecular Basis of Inherited Disease. McGraw-Hill, New York, 1995,pp. 1279–1327.
3. Jacobsen D. Biochemistry and Metabolism. In: Robinson EK, ed. Homocysteine and VascularDisease. Kluwer Academic Publishers, Dordrecht, 2000, pp. 15–39.
4. Banerjee R, Matthews K. Cobalamin-dependent methionine synthase. Faseb J 1990; 4(5):1450–1459.5. Mason JB, Miller JW. The effects of vitamins B12, B6, and folate on blood homocysteine levels.
Ann NY Acad Sci 1992; 669:197–203.6. Brattstrom LE, Hultberg BL, Hardebo JE. Folic acid responsive postmenopausal homocysteinemia.
Metabolism 1985; 34(11):1073–1077.7. Kang S, Wong P, Malinow M. Hyperhomocysteinemia as a risk factor for occlusive vascular disease.
Annu Rev Nutr 1992; 12:279–298.8. Ueland PM, Refsum H, Stabler SP, Malinow MR, Andersson A, Allen RH. Total homocysteine in
plasma or serum: methods and clinical applications. Clin Chem 1993; 39(9):1764–1779.9. Malinow MR, Stampfer MJ. Role of plasma homocysteine in arterial occlusive diseases. Clin Chem
1994; 40(6):857,858.

214 Part III / Cardiovascular Disease Prevention
10. Andersson A, Brattstrom L, Israelsson B, Isaksson A, Hamfelt A, Hultberg B. Plasma homocysteinebefore and after methionine loading with regard to age, gender, and menopausal status. Eur J ClinInvest 1992; 22(2):79–87.
11. Shipchandler MT, Moore EG. Rapid, fully automated measurement of plasma homocysteine with theAbbott ImxR Analyzer. Clin Chem 1995; 41:991–994.
12. Shimakawa T, Nieto FJ, Malinow MR, Chambless LE, Schreines PJ, Szklo M. Vitamin intake: a pos-sible determinant of plasma homocysteine among middle-aged adults. Ann Epidemiol 1997;7(4):285–293.
13. Boers G, Smals AG, Trijbels FJ, et al. Heterozygosity for homocystinuria in premature peripheraland cerebral occlusive arterial disease. N Engl J Med 1985; 313(12):709–715.
14. Clarke R, Daly L, Robinson K, et al. Hyperhomocysteinemia: an independent risk factor for vascu-lar disease. N Engl J Med 1991; 324(17):1149–1155.
15. Graham IM, Daly LE, Refsum HM, et al. Plasma homocysteine as a risk factor for vascular disease.The European Concerted Action Project. JAMA 1997; 277(22):1775–1781.
16. Ubbink JB. The role of vitamins in the pathogenesis and treatment of hyperhomocyst(e)inaemia.J Inherit Metab Dis 1997; 20(2):316–325.
17. Berg K, Malinow MR, Kierulf P, Upson B. Population variation and genetics of plasma homocys-teine level. Clin Genet 1992; 41(6):315–321.
18. Reed T, Malinow MR, Christian JC, Upson B. Estimates of heritability of plasma homocysteinelevels in aging adult male twins. Clin Genet 1991; 39(6):425–428.
19. Genest JJ, Jr, McNamara JR, Upson B, et al. Prevalence of familial hyperhomocysteinemia in menwith premature coronary artery disease. Arterioscler Thromb 1991; 11(5):1129–1136.
20. Williams RR, Malinow MR, Hunt SC, et al. Hyperhomocysteinemia in Utah siblings with earlycoronary disease. Cor Art Dis 1990; 1:681–685.
21. Rosenblatt DS, Thomas IT, Watkins D, Cooper BA, Erbe RW. Vitamin B12 responsive homocystin-uria and megaloblastic anemia: heterogeneity in methylcobalamin deficiency. Am J Med Genet1987; 26(2):377–383.
22. Rees MM, Rodgers GM. Homocysteinemia: association of a metabolic disorder with vascular dis-ease and thrombosis. Thromb Res 1993; 71(5):337–359.
23. Kang SS, Zhou J, Wong PW, Kowalisyn J, Strokosch G . Intermediate homocysteinemia: a thermo-labile variant of methylenetetrahydrofolate reductase. Am J Hum Genet 1988; 43(4):414–421.
24. Kang SS, Wong PW, Susmano A, Sora J, Norusis M, Ruggie N. Thermolabile methylenetetrahydrofolatereductase: an inherited risk factor for coronary artery disease. Am J Hum Genet 1991; 48(3):536–545.
25. Kang SS, Wong PW, Zhou JM, et al. Thermolabile methylenetetrahydrofolate reductase in patientswith coronary artery disease. Metabolism 1988; 37(7):611–613.
26. Goyette P, Sumner JS, Milos R, et al. Human methylenetetrahydrofolate reductase: isolation ofcDNA, mapping and mutation identification. Nat Genet 1994; 7(2):195–200.
27. Frosst P, Blom HJ, Milos R, et al. A candidate genetic risk factor for vascular disease: a commonmutation in methylenetetrahydrofolate reductase. Nat Genet 1995; 10(1):111–113.
28. Brattstrom L, Wilcken DE, Ohrvik J, Brudin L. Common methylenetetrahydrofolate reductase genemutation leads to hyperhomocysteinemia but not to vascular disease: the result of a meta-analysis.Circulation 1998; 98(23):2520–2526.
29. van der Put NM, Gabreels F, Stevens EM, et al. A second common mutation in the methylenete-trahydrofolate reductase gene: an additional risk factor for neural-tube defects? Am J Hum Genet1998; 62(5):1044–1051.
30. Weisberg I, Tran P, Christensen B, Sibani S, Rozen R. A second genetic polymorphism in methyl-enetetrahydrofolate reductase (MTHFR) associated with decreased enzyme activity. Mol GenetMetab 1998; 64(3):169–172.
31. Isotalo PA, Wells GA, Donnelly JG. Neonatal and fetal methylenetetrahydrofolate reductase geneticpolymorphisms: an examination of C677T and A1298C mutations. Am J Hum Genet 2000;67(4):986–990.
32. Reyes-Engel A, Munoz E, Gaitan MJ, et al. Implications on human fertility of the 677C→T and1298A→C polymorphisms of the MTHFR gene: consequences of a possible genetic selection. MolHum Reprod 2002; 8(10):952–957.
33. Jacques PF, Rosenberg IH, Rogers G, et al. Serum total homocysteine concentrations in adolescentand adult Americans: results from the third National Health and Nutrition Examination Survey. AmJ Clin Nutr 1999; 69(3):482–489.

Chapter 8 / Homocysteine and CVD Risk 215
34. Jacobsen DW, Gatautis VJ, Green R, et al. Rapid HPLC determination of total homocysteine andother thiols in serum and plasma: sex differences and correlation with cobalamin and folate concen-trations in healthy subjects. Clin Chem 1994; 40(6):873–881.
35. Boers GH, Smals AG, Trijbels FJ, Leermakers AI, Kloppenborg PW. Unique efficiency of methion-ine metabolism in premenopausal women may protect against vascular disease in the reproductiveyears. J Clin Invest 1983; 72(6):1971–1976.
36. Gartler SM, Hornung SK, Motulsky AG. Effect of chronologic age on induction of cystathioninesynthase, uroporphyrinogen I synthase, and glucose-6-phosphate dehydrogenase activities in lym-phocytes. Proc Natl Acad Sci USA 1981; 78(3):1916–1919.
37. Bostom AG, Roubenoff R, Dellaripa P, et al. Validation of abbreviated oral methionine-loading test.Clin Chem 1995; 41(6 Pt 1):948,949.
38. Homocysteine Lowering Trialists’ Collaboration.Lowering blood homocysteine with folic acidbased supplements: meta-analysis of randomised trials. BMJ 1998; 316(7135):894–898.
39. Landgren F, Israelsson B, Lindgren A, Hultberg B, Andersson A, BrattstromL. Plasma homocysteinein acute myocardial infarction: homocysteine-lowering effect of folic acid. J Intern Med 1995;237(4):381–388.
40. Ubbink JB, Becker PJ, Vermaak WJ, Delport R . Results of B-vitamin supplementation study usedin a prediction model to define a reference range for plasma homocysteine. Clin Chem 1995;41(7):1033–1037.
41. O’Keefe CA, Bailey LB, Thomas EA, et al. Controlled dietary folate affects folate status in non-pregnant women. J Nutr 1995; 125(10):2717–2725.
42. Jacob RA, Gretz DM, Taylor PC, et al. Moderate folate depletion increases plasma homocysteine anddecreases lymphocyte DNA methylation in postmenopausal women. J Nutr 1998; 128:1204–1212.
43. Rydlewicz A, JA Simpson, RJ Taylor, CM Bond, MHN Golden. The effect of folic acid supplemen-tation on plasma homocysteine in an elderly population. QJM 2002; 95(1):27–35.
44. Ashfield-Watt PA, Pullin CH, Whiting JM, et al. Methylenetetrahydrofolate reductase 677C—>Tgenotype modulates homocysteine responses to a folate-rich diet or a low-dose folic acid supple-ment: a randomized controlled trial. Am J Clin Nutr 2002; 76(1):180–186.
45. Ashfield-Watt PA, Whiting JM, Clark ZE, et al. A comparison of the effect of advice to eat either‘5-a-day’ fruit and vegetables or folic acid-fortified foods on plasma folate and homocysteine. EurJ Clin Nutr 2003; 57(2):316–323.
46. Ward M, McNulty H, McPartlin J, Strain JJ, Weir DG, Scott JM. Plasma homocysteine, a risk fac-tor for cardiovascular disease, is lowered by physiological doses of folic acid. QJM 1997;90(8):519–524.
47. Nelen WL, Blom HJ, Thomas CM, Steegers EA, Boers GH, Eskes TK. Methylenetetrahydrofolatereductase polymorphism affects the change in homocysteine and folate concentrations resulting fromlow dose folic acid supplementation in women with unexplained recurrent miscarriages. J Nutr 1998;128(8):1336–1341.
48. Brouwer IA, van Dusseldorp M, Thomas CM, et al. Low-dose folic acid supplementation decreasesplasma homocysteine concentrations: a randomized trial. Am J Clin Nutr 1999; 69(1):99–104.
49. van Oort F, Melse-Boonstra A, Brouwer I, et al. Folic acid and reduction of plasma homocysteineconcentrations in older adults: a dose–response study. Am J Clin Nutr 2003; 77:1318–1323.
50. Brönstrup A, Hages M, Prinz-Langenohl R, Pietrzik K. Effects of folic acid and combinations offolic acid and vitamin B-12 on plasma homocysteine concentrations in healthy, young women. AmJ Clin Nutr 1998; 68(5):1104–1110.
51. Silaste, M-L, Rantala M, Sampi M, Alfthan G, Aro A, Kesaniemi YA. Polymorphisms of keyenzymes in homocysteine metabolism affect diet responsiveness of plasma homocysteine in healthywomen. J Nutr 2001; 131(10):2643–2647.
52. Daly S, Mills JL, Molloy AM, et al. Low-dose folic acid lowers plasma homocysteine levels inwomen of child-bearing age. QJM 2002; 95(11):733–740.
53. Ubbink JB, Vermaak WJ, van der Merwe A, Becker PJ. Vitamin B-12, vitamin B-6, and folate nutri-tional status in men with hyperhomocysteinemia. Am J Clin Nutr 1993; 57(1):47–53.
54. Riddell LJ, Chisholm A, Williams S, Mann JI. Dietary strategies for lowering homocysteine con-centrations. Am J Clin Nutr 2000; 71:1448–1454.
55. Venn BJ, Mann JI, Williams SM, et al. Assessment of three levels of folic acid on serum folate andplasma homocysteine: a randomised placebo-controlled double-blind dietary intervention trial. EurJ Clin Nutr 2002; 56(8):748–754.

216 Part III / Cardiovascular Disease Prevention
56. Kauwell GP, Lippert BL, Wilsky CE, et al. Folate status of elderly women following moderate folatedepletion responds only to a higher folate intake. J Nutr 2000; 130(6):1584–1590.
57. Beresford S, Lampe J, Motulsky A, et al. Does additional folic acid lower homocysteine levels inthis post-fortification era?, unpublished.
58. Kang SS, Wong PW, Norusis M. Homocysteinemia due to folate deficiency. Metabolism 1987;36(5):458–462.
59. Lewis CA, Pancharuniti N, Sauberlich HE. Plasma folate adequacy as determined by homocysteinelevel. Ann NY Acad Sci 1992; 669:360–362.
60. Selhub J, Jacques PF, Wilson PW, Rush D, Rosenberg IH. Vitamin status and intake as primary deter-minants of homocysteinemia in an elderly population. JAMA 1993; 270(22):2693–2698.
61. Stabler SP, Marcell PD, Podell ER, Allen RH, Savage DG, Lindenbaum J. Elevation of total homo-cysteine in the serum of patients with cobalamin or folate deficiency detected by capillary gas chro-matography-mass spectrometry. J Clin Invest 1988; 81(2):466–474.
62. Lindenbaum J, Rosenberg IH, Wilson PW, Stabler SP, AllenRH. Prevalence of cobalamin deficiencyin the Framingham elderly population. Am J Clin Nutr 1994; 60(1):2–11.
63. Brattstrom L, Lindgren A, Israelsson B, Andersson A, Hultberg B. Homocysteine and cysteine:determinants of plasma levels in middle-aged and elderly subjects. J Intern Med 1994; 236(6):633–641.
64. Ubbink JB, Vermaak WJ, Bennett JM, Becker PJ, van Staden DA, BissbortS. The prevalence ofhomocysteinemia and hypercholesterolemia in angiographically defined coronary heart disease. KlinWochenschr 1991; 69(12):527–534.
65. Brattstrom L, Lindgren A, Israelsson B, Malinow MR, Norrving B, Upson B, Hamfelt A. Hyper-homocysteinaemia in stroke: prevalence, cause, and relationships to type of stroke and stroke riskfactors. Eur J Clin Invest 1992; 22(3):214–221.
66. Sauberlich HE. Evaluation of Folate Nutrition in Population Groups. In: Picciano MF, StokstadELR, Gregory JF, eds. Folic Acid Metabolism in Health and Disease. Wiley-Liss, New York, 1990,pp. 212–235.
67. Jacques PF, Selhub J, Bostom AG, Wilson PWF, Rosenberg IH. The effect of folic acid fortificationon plasma folate and total homocysteine concentrations. N Engl J Med 1999; 340(19):1449–1454.
68. Brattstrom L, Israelsson B, Norrving B, et al. Impaired homocysteine metabolism in early-onsetcerebral and peripheral occlusive arterial disease. Effects of pyridoxine and folic acid treatment.Atherosclerosis 1990; 81(1):51–60.
69. Lindenbaum J, Healton EB, Savage DG, et al. Neuropsychiatric disorders caused by cobalamin defi-ciency in the absence of anemia or macrocytosis. N Engl J Med 1988; 318(26):1720–1728.
70. Allen RH, Stabler SP, Savage DG, Lindenbaum J . Diagnosis of cobalamin deficiency I: usefulness ofserum methylmalonic acid and total homocysteine concentrations. Am J Hematol 1990; 34(2):90–98.
71. Brattstrom L, Lindgren A. Hyperhomocysteinemia as a risk factor for stroke. Neurol Res 1992;14(Suppl 2):81–84.
72. Dudman NP, Wilcken DE, Wang J, Lynch JF, Macey D, LundbergP. Disordered methionine/homo-cysteine metabolism in premature vascular disease. Its occurrence, cofactor therapy, and enzymol-ogy. Arterioscler Thromb 1993; 13(9):1253–1260.
73. Beresford SAA, Boushey CJ. Homocysteine, Folic Acid and Cardiovascular Disease Risk. In:Bendich A, Deckelbaum RJ, eds. Preventive Nutrition: The Comprehensive Guide for HealthProfessionals, Humana Press, Totowa, NJ, 2001, pp. 191–219.
74. Beresford SAA, Boushey CJ. Homocysteine, Folic Acid and Cardiovascular Disease Risk. In:Bendich A, Deckelbaum RJ, eds. Preventive Nutrition. Humana Press, Totowa, NJ 1997, pp. 193–224.
75. Boushey CJ, Beresford SA, Omenn GS, Motulsky AG. A quantitative assessment of plasma homo-cysteine as a risk factor for vascular disease. Probable benefits of increasing folic acid intakes.JAMA 1995; 274(13):1049–1057.
76. Eikelboom JW, Lonn E, Genest J Jr, Hankey G, Yusuf S. Homocysteine and cardiovascular disease:a critical review of the epidemiologic evidence. Ann Intern Med 1999; 131(5):363–375.
77. Ueland PM, Refsum H, Beresford SA, Vollset SE. The controversy over homocysteine and cardio-vascular risk. Am J Clin Nutr 2000; 72(2):324–332.
78. Cleophas TJ, Hornstra N, van Hoogstraten B, van der Meulen J. Homocysteine, a risk factor forcoronary artery disease or not? A meta-analysis. Am J Cardiol 2000; 86(9):1005–1009, A8.
79. Homocysteine Studies Collaboration. Homocysteine and risk of ischemic heart disease and stroke: ameta-analysis. JAMA 2002; 288(16):2015–2022.

Chapter 8 / Homocysteine and CVD Risk 217
80. Kelly PJ, Rosand J, Kistler JP, et al. Homocysteine, MTHFR 677C—>T polymorphism, and risk ofischemic stroke: results of a meta-analysis. Neurology 2002; 59(4):529–536.
81. Bautista LE, Arenas IA, Penuela A, Martinez LX. Total plasma homocysteine level and risk of cardio-vascular disease: a meta-analysis of prospective cohort studies. J Clin Epidemiol 2002; 55(9):882–887.
82. Ford ES, Smith SJ, Stroup DF, Steinberg KK, Mueller PW, Thacker SB. Homocysteine and cardio-vascular disease: a systematic review of the evidence with special emphasis on case-control studiesand nested case-control studies. Int J Epidemiol 2002; 31(1):59–70.
83. Wald DS, Law M, Morris JK. Homocysteine and cardiovascular disease: evidence on causality froma meta-analysis. BMJ 2002; 325(7374):1202.
84. Stampfer MJ, Malinow MR. Can lowering homocysteine levels reduce cardiovascular risk? N EnglJ Med 1995; 332(5):328,329.
85. den Heijer M, Blom HJ, Gerrits WB, et al. Is hyperhomocysteinaemia a risk factor for recurrentvenous thrombosis? Lancet 1995; 345(8954):882–885.
86. Arnesen E, Refsum H, Bonaa KH, Ueland PM, Forde OH, Nordrehaug JE . Serum total homocys-teine and coronary heart disease. Int J Epidemiol 1995; 24(4):704–709.
87. Robinson K, Mayer EL, Miller DP, et al. Hyperhomocysteinemia and low pyridoxal phosphate.Common and independent reversible risk factors for coronary artery disease. Circulation 1995;92(10):2825–2830.
88. Perry IJ, Refsum H, Morris RW, Ebrahim SB, Ueland PM, Shaper AG. Prospective study of serumtotal homocysteine concentration and risk of stroke in middle-aged British men. Lancet 1995;346(8987):1395–1398.
89. Pancharuniti N, Lewis CA, Sauberlich HE, et al. Plasma homocysteine, folate, and vitamin B-12 con-centrations and risk for early-onset coronary artery disease. Am J Clin Nutr 1994; 59(4):940–948.
90. Malinow MR, Nieto FJ, Szklo M, Chambless LE, Bond G. Carotid artery intimal-medial wall thick-ening and plasma homocysteine in asymptomatic adults. The Atherosclerosis Risk in CommunitiesStudy. Circulation 1993; 87(4):1107–1113.
91. Selhub J, Jacques PF, Bostom AG, et al. Association between plasma homocysteine concentrationsand extracranial carotid-artery stenosis. N Engl J Med 1995; 332(5):286–291.
92. Stampfer MJ, Malinow MR, Willett WC, et al. A prospective study of plasma homocysteine and riskof myocardial infarction in US physicians. JAMA 1992; 268(7):877–881.
93. Chasan-Taber L, Selhub J, Rosenberg IH, et al. A prospective study of folate and vitamin B6 and riskof myocardial infarction in US physicians. J Am Coll Nutr 1996; 15(2):136–143.
94. Kark JD, Selhub J, Adler B, et al. Nonfasting plasma total homocysteine level and mortality in mid-dle-aged and elderly men and women in Jerusalem. Ann Intern Med 1999; 131(5):321–330.
95. Clarke R, Fitzgerald D, O’Brien C, et al. Hyperhomocysteinaemia: a risk factor for extracranialcarotid artery atherosclerosis. Ir J Med Sci 1992; 161(3):61–65.
96. Rubba P, Faccenda F, Pauciullo P, et al. Early signs of vascular disease in homocystinuria: a nonin-vasive study by ultrasound methods in eight families with cystathionine-beta-synthase deficiency.Metabolism 1990; 39(11):1191–1195.
97. Molgaard J, Malinow MR, Lassvik C, Holm AC, Upson B, Olsson AG. Hyperhomocyst(e)inaemia:an independent risk factor for intermittent claudication. J Intern Med 1992; 231(3):273–279.
98. Bergmark C, Mansoor MA, Swedenborg J, de Faire U, Svardal AM, Ueland PM. Hyper-homocys-teinemia in patients operated for lower extremity ischaemia below the age of 50—effect of smokingand extent of disease. Eur J Vasc Surg 1993; 7(4):391–396.
99. Mansoor MA, Bergmark C, Svardal AM, Lonning PE, Ueland PM. Redox status and protein bindingof plasma homocysteine and other aminothiols in patients with early-onset peripheral vasculardisease. Homocysteine and peripheral vascular disease. Arterioscler Thromb Vasc Biol 1995; 15(2):232–240.
100. Taylor LM Jr., DeFrang RD, Harris EJ Jr., Porter JM. The association of elevated plasma homocys-teine with progression of symptomatic peripheral arterial disease. J Vasc Surg 1991; 13(1):128–136.
101. Graham I. Interactions between homocysteinaemia and conventional risk factors in vascular disease.Eur Heart J 1994; 15(suppl):530.
102. Daly L, Graham I. Hyperhomocysteinaemia: A Powerful Risk Factor for Vascular Disease. In:Annual Scientific Meeting Working Group/Epidemiology and Prevention. European Society ofCardiology. Venice, Italy, 1994.
103. Boers GH, Smals AG, Trijbels FJ, et al. Heterozygosity for homocystinuria in premature peripheraland cerebral occlusive arterial disease. N Engl J Med 1985; 313(12):709–715.

218 Part III / Cardiovascular Disease Prevention
104. Hoogeveen EK, Kostense PJ, Beks PJ, et al Stehouwer. Hyperhomocysteinemia is associated withan increased risk of cardiovascular disease, especially in non-insulin-dependent diabetes mellitus: apopulation-based study. Arterioscler Thromb Vasc Biol 1998; 18(1):133–138.
105. Bostom AG, Silbershatz H, Rosenberg IH, et al. Nonfasting plasma total homocysteine levels andall-cause and cardiovascular disease mortality in elderly Framingham men and women. Arch InternMed 1999; 159(10):1077–1080.
106. Ma J, Stampfer MJ, Hennekens CH, et al. Methylenetetrahydrofolate reductase polymorphism,plasma folate, homocysteine, and risk of myocardial infarction in US physicians. Circulation 1996;94(10):2410–2416.
107. Verhoef P, Stampfer MJ, Rimm EB. Folate and coronary heart disease. Curr Opin Lipidol 1998;9(1):17–22.
108. Folsom AR, Nieto FJ, McGovern PG, et al. Prospective study of coronary heart disease incidence inrelation to fasting total homocysteine, related genetic polymorphisms, and B vitamins: theAtherosclerosis Risk in Communities (ARIC) study. Circulation 1998; 98(3):204–210.
109. Gonzalez-Perez E, Via M, Lopez-Alomar A, et al. Lack of association between methylenetetrahy-drofolate reductase (MTHFR) C677T and ischaemic heart disease (IHD): family-based associationstudy in a Spanish population. Clin Genet 2002; 62(3):235–239.
110. Klerk, M, Verhoef P, Clarke R, Blom HJ, Kok FJ, Schouten EG. MTHFR 677C—>T polymorphismand risk of coronary heart disease: a meta-analysis. JAMA 2002; 288(16):2023–2031.
111. Hackam DG, Anand SS. Emerging risk factors for atherosclerotic vascular disease: a critical reviewof the evidence. JAMA 2003; 290:932–940
112. Verhoef P, Stampfer MJ, Buring JE, et al. Homocysteine metabolism and risk of myocardial infarc-tion: relation with vitamins B6, B12, and folate. Am J Epidemiol 1996; 143(9):845–859.
113. Robinson K, Arheart K, Refsum H, et al. Low circulating folate and vitamin B6 concentrations: riskfactors for stroke, peripheral vascular disease, and coronary artery disease. European COMACGroup. Circulation 1998; 97(5):437–443.
114. Morrison HI, Schaubel D, Desmeules M, Wigle DT. Serum folate and risk of fatal coronary heartdisease. JAMA 1996; 275(24):1893–1896.
115. Giles WH, Kittner SJ, Croft JB, Anda RF, Casper ML, Ford ES. Serum folate and risk for coronaryheart disease: results from a cohort of US adults. Ann Epidemiol 1998; 8(8):490–496.
116. Schwartz SM, Siscovick DS, Malinow MR, et al. Myocardial infarction in young women in relationto plasma total homocysteine, folate, and a common variant in the methylenetetrahydrofolate reduc-tase gene. Circulation 1997; 96(2):412–417.
117. Giles WH, Kittner SJ, Anda RF, Croft JB, Casper ML. Serum folate and risk for ischemic stroke.First National Health and Nutrition Examination Survey epidemiologic follow-up study. Stroke1995; 26(7):1166–1170.
118. Gillman MW, Cupples LA, Gagnon D, et al. Protective effect of fruits and vegetables on develop-ment of stroke in men. JAMA 1995; 273(14):1113–1117.
119. ESHA RI. Nutritional Analysis and Fitness Software, in Food Processor for Windows. Salem,Oregon, 1987.
120. Bazzano LA, He J, Ogden LG, et al. Dietary intake of folate and risk of stroke in US men andwomen: NHANES I Epidemiologic Follow-up Study. National Health and Nutrition ExaminationSurvey. Stroke 2002; 33(5):1183–1188.
121. Hernandez-Diaz S, Martinez-Losa E, Fernandez-Jarne E, Serrano-Martinez M, Martinez-GonzalezM. Dietary folate and the risk of nonfatal myocardial infarction. Epidemiology 2002; 13:700–706.
122. Voutilainen S, Rissanen T, Virtanen J, Lakka T, Salonen J. Low dietary folate intake is associatedwith an excess incidence of acute coronary events. The Kuopio Ischemic Heart Disease Risk FactorStudy. Circulation 2001; 103:2674–2680.
123. Rimm EB, Willett WC, Hu FB, et al. Folate and vitamin B6 from diet and supplements in relationto risk of coronary heart disease among women. JAMA 1998; 279(5):359–364.
124. Peterson JC, Spence JD. Vitamins and progression of atherosclerosis in hyper-homocyst(e)inaemia.Lancet 1998; 351(9098):263.
125. Liem A, Reynierse-Buitenwerf GH, Zwinderman AH, Jukema JW, van Veldhuisen DJ. Secondaryprevention with folic acid: effects on clinical outcomes. J Am Coll Cardiol 2003; 41(12):2105–2113.
126. Schnyder G, Roffi M, Flammer Y, Pin R, Hess O. Effect of homocysteine-lowering therapy withfolic acid, vitamin B12, and vitamin B6 on clinical outcome after percutaneous coronary interven-tion. The Swiss Heart Study: a randomized controlled trial. JAMA 2002; 288:973–979.

Chapter 8 / Homocysteine and CVD Risk 219
127. Schnyder G, Roffi M, Flammer Y, Pin R, Hess O. Effect of homocysteine-lowering therapy withfolic acid, vitamin B12, and vitamin B6 on clinical outcome after percutaneous coronary intervention.JAMA 2002; 288:973–979.
128. Bostom A, Selhub J, Jacques P, Rosenberg I. Power shortage: clinical trials testing the “homocys-teine hypothesis” against a background of folic acid-fortified cereal grain flour. Ann Intern Med2001; 135:133–137.
129. Clarke R, Lewington S, Landray M. Homocysteine, renal function, and risk of cardiovascular dis-ease. Kidney Int Suppl 2003; 84(S131–S133).
130. Toole JF, Malinow MR, Chambless LE, et al. Lowering homocysteine in patients with ischemicstroke to prevent recurrent stroke, myocardial infarction, and death: the Vitamin Intervention forStroke Prevention (VISP) randomized controlled trial. JAMA 2004; 291(5):565–575.
131. Clarke R. Design of Clinical Trials to Test the Homocysteine Hypothesis of Vascular Disease. In:Carmel R, Jacobsen DW, eds. Homocysteine in Health and Disease. Cambridge University Press,New York, NY, 2001.
132. Booth GL, Wang EE. Preventive health care, 2000 update: screening and management of hyperho-mocysteinemia for the prevention of coronary artery disease events. The Canadian Task Force onPreventive Health Care. CMAJ 2000; 163(1):21–29.
133. Mangoni A, Jackson S. Homocysteine and cardiovascular disease: current evidence and futureprospects. Am J Med 2002; 112:556–565.
134. Galan P, De Bree A, Mennen L, et al. Background and rationale of the SU.FOL.OM3 study: double-blind randomized placebo-controlled secondary prevention trial to test the impact of supplementa-tion with folate, vitamin B6 and B12 and/or omega-3 fatty acids on the prevention of recurrentischaemic events in subjects with atherosclerosis in the coronary or cerebral arteries. J Nutr HealthAging 2003; 7(428–435).
135. Murphy-Chutorian DR, Wexman MP, Grieco AJ, et al. Methionine intolerance: a possible risk fac-tor for coronary artery disease. J Am Coll Cardiol 1985; 6(4):725–730.
136. Israelsson, B, Brattstrom LE, Hultberg BL. Homocysteine and myocardial infarction.Atherosclerosis 1988; 71(2-3):227–233.
137. Kang SS, Wong PW, Cook HY, Norusis M, Messer JV. Protein-bound homocysteine. A possible riskfactor for coronary artery disease. J Clin Invest 1986; 77(5):1482–1486.
138. Genest JJ Jr., McNamara JR, Salem DN, Wilson PW, Schaefer EJ, Malinow MR. Plasma homocys-teine levels in men with premature coronary artery disease. J Am Coll Cardiol 1990; 16(5):1114–1119.
139. Wu LL, Wu J, Hunt SC, et al. Plasma homocysteine as a risk factor for early familial coronary arterydisease. Clin Chem 1994; 40(4):552–561.
140. Mudd SH, Levy HL, Skovby F. Disorders of Transsulfuration. In: Scriver CR, Beaudet AC, Sly WS,et al., eds. The Metabolic Basis of Inherited Disease, McGraw-Hill, New York, 1989, pp. 1279–1327.
141. Dudman NP, Hicks C, Wang J, Wilcken DE. Human arterial endothelial cell detachment in vitro: itspromotion by homocysteine and cysteine. Atherosclerosis 1991; 91(1–2):77–83.
142. Wall RT, Harlan JM, Harker LA, Striker GE. Homocysteine-induced endothelial cell injury in vitro:a model for the study of vascular injury. Thromb Res 1980; 18(1–2):113–121.
143. Blann AD. Endothelial cell damage and homocysteine. Atherosclerosis 1992; 94(1):89–91.144. Harker LA, Slichter SJ, Scott CR, Ross R. Homocystinemia. Vascular injury and arterial thrombosis.
N Engl J Med 1974; 291(11):537–543.145. Harker LA, Ross R, Slichter SJ, Scott CR. Homocystine-induced arteriosclerosis. The role of
endothelial cell injury and platelet response in its genesis. J Clin Invest 1976; 58(3):731–741.146. Tsai JC, Perrella MA, Yoshizumi M, et al. Promotion of vascular smooth muscle cell growth by
homocysteine: a link to atherosclerosis. Proc Natl Acad Sci USA 1994; 91(14):6369–6373.147. Heinecke JW, Rosen H, Chait A. Iron and copper promote modification of low density lipoprotein
by human arterial smooth muscle cells in culture. J Clin Invest 1984; 74(5):1890–1894.148. Lentz SR, Sadler JE. Inhibition of thrombomodulin surface expression and protein C activation by
the thrombogenic agent homocysteine. J Clin Invest 1991; 88(6):1906–1914.149. Bellamy MF, McDowell IF, Ramsey MW, Brownlee M, Newcombe RG, Lewis MJ. Oral folate enhances
endothelial function in hyperhomocysteinaemic subjects. Eur J Clin Invest 1999; 29(8):659–662.150. Hill AB. The environment and disease: association or causation? Proc R Soc Med 1965; 58:295–300.151. Graham I. Homocysteine in health and disease. Ann Intern Med 1999; 131(5):387,388.152. Bostom AG, Garber C. Endpoints for homocysteine-lowering trials. Lancet 2000; 355(9203):
511,512.

220 Part III / Cardiovascular Disease Prevention
153. Scott J. Modification of hyperhomocysteinemia. In: Carmel R, Jacobsen DW, eds. Homocysteine inHealth and Disease. Cambridge University Press, New York, NY, 2001.
154. Quinlivan E, McPartin J, McNulty H, Ward M, Strain J, Weir D, Scott J. Importance of both folicacid and vitamin B12 in reduction of risk of vascular disease. Lancet 2002; 359:227,228.
155. Rosenberg IH, Rosenberg LE. The implications of genetic diversity for nutrient requirements: thecase of folate. Nutr Rev 1998; 56(2 Pt 2):s47–s53.
156. Savage DG, Lindenbaum J. Folate–Cobalamin Interactions. In: Bailey LB, ed. Folate in Health andDisease. Marcel Dekker, New York, 1995, pp. 237–285.
157. Rajan S, Wallace JI, Brodkin KI, Beresford SA, Allen RH, Stabler SP. Response of elevated methyl-malonic acid to three dose levels of oral cobalamin in older adults. J Am Geriatr Soc 2002; 50(11):1789–1795.
158. Schafer LW, Larson DE, Melton LJ 3rd, Higgins JA, Zinsmeister AR. Risk of development of gas-tric carcinoma in patients with pernicious anemia: a population-based study in Rochester, Minnesota.Mayo Clin Proc 1985; 60(7):444–448.
159. Linder MC. Nutrition and Metabolism of Vitamins, In: Linder MC, ed. Nutritional Biochemistry andMetabolism With Clinical Applications,. Elsevier, New York, 1985, pp. 69–131.
160. Brattstrom L. Vitamins as homocysteine-lowering agents. J Nutr 1996; 126(4 Suppl):1276S–1280S.161. CDC. Recommendations for the use of folic acid to reduce the number of cases of spina bifida and
other neural tube defects. MMWR Recomm Rep 1992; 41(RR-14):1–7.162. Mills JL, McPartlin JM, Kirke PN, et al. Homocysteine metabolism in pregnancies complicated by
neural-tube defects. Lancet 1995; 345(8943):149–151.163. Stevenson RE, Dean JH, Allen WP, KellyM. Prevention program for reducing risk for neural tube
defects—South Carolina, 1992–1994. MMWR 1995; 44:141,142.164. Federal Register. Food standards: amendment of standards of identity for enriched grain products to
require addition of folic acid. Federal Register, 1996; 61(44):8781–8797. 21 CFR Part 136, 137 and139. Docket No. 91N–100S.
165. Lawrence J, Tetitti D, Watkins M, Umekubo M. Trends in serum folate after food fortification.Lancet 1999; 354:915,916.
166. Quinlivan EP, Gregory JF 3rd. Effect of food fortification on folic acid intake in the United States.Am J Clin Nutr 2003; 77(1):221–225.
167. Honein M, Paulozzi L, Mathews T, Erickson J, Wong L-Y. Impact of folic acid fortification of theU.S. food supply on the occurrence of neural tube defects. JAMA 2001; 285:2981–2986.
168. Malinow MR, Bostom AG, Krauss RM. Homocysteine, diet, and cardiovascular diseases: a state-ment for healthcare professionals from the Nutrition Committee, American Heart Association.Circulation 1999; 99(1):178–82.
169. Institute of Medicine. Committee for the Study of the Future of Medicine, The future of publichealth. National Academy Press, Washington, DC, 1988.
170. Bentley JR, Ferrini RL, Hill LL. American College of Preventive Medicine public policy statement:Folic acid fortification of grain products in the US to prevent neural tube defects. Am J Prev Med1999; 16:264–267.
171. ACOG Educational Bulletin. Nutrition and women. Int J Gynecol Obstet 1997; 56:71–81.172. American Academy of Pediatrics and C.o. Genetics. Folic acid for the prevention of neural tube
defects. Pediatrics 1999; 104:325–327.173. Bailey L, Rampersaud G, Kauwell G. Folic acid supplements and fortification affect the the risk for
neural tube defects, vascular disease and cancer: evolving science. J Nutr 2003; 133:1961S–1968S.174. Kasner S. Folate and risk of stroke: fortify first and ask questions later? Stroke 2002; 33:1188–1189.175. Oakley G. Global prevention of all folic acid-preventable spina bifida and anencephaly by 2010.
Community Genet 2002; 5:70–77.176. Brouwer IA, van Dusseldorp M, West CE, et al. Dietary folate from vegetables and citrus fruit
decreases plasma homocysteine concentrations in humans in a dietary controlled trial. J Nutr 1999;129(6):1135–1139.

From: Preventive Nutrition: The Comprehensive Guide for Health Professionals, Third EditionEdited by: A. Bendich and R. J. Deckelbaum © Humana Press Inc., Totowa, NJ
221
9 n-3 Fatty Acids from Fish and PlantsPrimary and Secondary Preventionof Cardiovascular Disease
William E. Connor and Sonja L. Connor
KEY POINTS
● Animal studies, epidemiological studies, and clinical trials have shown that fish andfish oil may reduce sudden death by preventing cardiac arrhythmias.
● n-3 fatty acids have an antithrombotic effect through the diminution of thromboxaneA2 that produces platelet aggregation and vasoconstriction.
● Eicosapentaenoic and docosahexaenoic acids have been shown to inhibit atherosclero-sis, probably because of their suppression of cellular growth factors that inhibit the pro-liferation of smooth muscle cells.
● n-3 fatty acids lower very low-density lipoprotein and triglyceride through depressionof synthesis of triglyceride in the liver. n-3 fatty acids also suppress postprandiallipemia, which reduces chylomicron remnants that are considered atherogenic.
● Fish oil does not adversely affect glucose control in patients with diabetes.● n-3 fatty acids have been uniformly associated with a mild decrease in systolic blood
pressure and, at times, a decrease in diastolic blood pressure.● The intake of n-3 fatty acids should be increased to prevent coronary heart disease.
1. INTRODUCTION
Fish and fish oils contain the very long-chained and highly polyunsaturated n-3 fattyacids (in this chapter, the terms n-3 and omega-3 are used interchangeably), which arederived from phytoplankton, the base of the food chain in oceans, lakes, and rivers (1).Phytoplankton synthesize the n-3 fatty acids eicosapentaenoic (20:5) (EPA) and docosa-hexaenoic (22:6) (DHA), which are subsequently incorporated into fish, shellfish, andsea mammals. The plants synthesize an n-3 fatty acid, linolenic acid (18:3), which canbe converted by the body to EPA and more slowly to DHA (2,3). The n-3 fatty acidshave profound biological and biochemical effects in the body. Despite a wealth of sci-entific information (a review listed more than 120 references about cardiovasculareffects alone (4), clinical interest in n-3 fatty acids has not been high in the United States

222 Part III / Cardiovascular Disease Prevention
despite considerable attention to their use in Europe and Japan. This chapter focuseson the considerable and underappreciated potential benefits of the n-3 fatty acids incardiovascular disease (CVD).
In the 1950s, it was discovered that polyunsaturated vegetable oils containing then-6 linoleic acid had a pronounced plasma cholesterol-lowering effect, but the mech-anism of this action has remained obscure (1). At that time, it was noted that fish oil,which was also polyunsaturated, had a similar hypocholesterolemic effect. No mentionwas made of the fact that fish oil contained very long-chain n-3 fatty acids (C20:5and C22:6) and that these might act differently than the n-6 fatty acids of vegetableoils, such as linoleic acid (C18:2). These early data about fish oil laid fallow untilthe pioneering observations of Dyerberg and Bang focused special attention on then-3 fatty acids EPA (20:5) and DHA (22:6), which are found in marine oils (5).Dyerberg and Bang observed a lower coronary mortality among the GreenlandEskimos, whose diet was especially rich in marine oils compared to Danish people,who consumed a diet high in saturated fat (6). It was later discovered that not onlydid these n-3 fatty acids lower cholesterol, but they had a profound plasma triglyceride-lowering effect, especially in hypertriglyceridemic patients (7–9). Over two decadesof research in humans, animals, perfused organs, and tissue cultures have firmly docu-mented the mechanisms of the hypolipidemic actions of these n-3 fatty acids from fishand, furthermore, have demonstrated that these fatty acids have many other beneficialeffects in CVD.
This chapter focuses on seven different areas of research that will help to answer thequestion about the potential benefits of n-3 fatty acids from fish oil for primary and sec-ondary prevention of CVD. These benefits are listed below and are subsequently dis-cussed in detail. We first discuss how n-3 fatty acids will prevent further events in thosepatients who already have coronary heart disease (CHD) (secondary prevention). Thisis especially relevant to staving off fatal arrhythmias of the heart and thrombosis. Then,we discuss how n-3 fatty acids might prevent coronary disease in healthy individuals,especially in those who possess certain risk factors.
2. ANTIARRHYTHMIC ACTIONS
2.1. Animal StudiesSudden death from ventricular arrhythmias is a much-dreaded complication in
patients with CHD. Several experimental studies have addressed this problem withthe use of n-3 fatty acids from fish oil. McLennan et al. (10) used coronary artery lig-ation in the rat to produce an in vivo model of ventricular fibrillation and myocardialinfarction (MI). They found that the number of ventricular ectopic beats and durationof tachycardia or fibrillation was increased in rats that were fed sheep kidney fat (asaturated fat) compared to rats that were fed tuna fish oil, a rich source of n-3 fattyacids. The rats that were fed tuna fish oil had a significantly reduced incidence andseverity of arrhythmias. In another animal study, ventricular fibrillation was preventedby fish oil during both the occlusion of the coronary artery and reperfusion of theheart (11).
In other experiments, Hallaq et al. (12) used isolated neonatal cardiac myocytes(from hearts of 1-d-old rats) as a model for the study of cardiac arrhythmogenic factorsthat are modified by n-3 fatty acids. They incubated isolated myocytes (for 3–5 d) in a

Chapter 9 / n-3 Fatty Acids and CVD 223
culture medium enriched with arachidonic acid or EPA (20:5 n-3). The arachidonicacid-enriched myocytes developed a toxic cytosolic calcium concentration on exposureto ouabain, whereas EPA-enriched myocytes preserved physiological calcium levels.An increase of EPA was demonstrated in the membrane phospholipids, with a smallreduction in arachidonic acid in myocytes that were fed EPA. A second study by thesame researchers further indicated the mechanism of action of the fish oil fatty acids inpreventing the arrhythmias of these isolated myocytes (13). It was found that n-3 fattyacids prevented a calcium-depleted state in the myocytes that was caused by the L-typecalcium channel blocker nifedipine. The protective effects of the n-3 fatty acidsappeared to result from their modulatory effects on nifedipine-sensitive L-type calciumchannels. In a recent study, dogs were given pure EPA, DHA, or α-linolenic acid intra-venously (14). Tests were performed in a dog model of sudden death. With infusion ofEPA, five of seven dogs did not have a fatal ventricular arrhythmia (p < 0.02); withDHA and α-linolenic acid, six of eight dogs in each group were protected (p < 0.004 foreach). These studies indicated a definite beneficial effect of dietary n-3 fatty acids on theheart; both marine and plant sources of these fatty acids prevented cardiac arrhythmiasin animals.
2.2. Population StudiesThe epidemiological data regarding dietary n-3 fatty acids and coronary disease are
extensive and go back to the initial observations of Dyerberg and Bang, who found amuch lower rate of CHD in the Greenland Eskimos compared with Danes (6). By meansof extensive studies, they deduced that it was the n-3 fatty acid content of the Eskimodiet that inhibited the atherosclerotic disease despite the fact that the Eskimo diet was ahigh-cholesterol, high-fat diet (5). Their dietary fat was protective rather than patho-genic, because it was derived from the seas (fish, seal, etc.) and contained the n-3 fattyacids. Furthermore, autopsy studies revealed that the rate of atherosclerosis in AlaskanEskimos was much less than found in Caucasians living in Alaska (15).
Numerous studies have been conducted correlating fish consumption (providing n-3 fatty acids) and mortality from CHD (4). In Dutch men, the mortality from CHDwas more than 50% lower among those who consumed at least 30 g of fish per daythan among those who did not eat fish (16). In the Multiple Risk Factor Interventiontrial, n-3 fatty acid consumption correlated inversely with all-cause mortality andcoronary mortality (17). Even in the Harvard Health Professionals Follow-Up Studyof 51,529 men, the consumption of one to two servings of fish per week was associatedwith a lower incidence of CHD (18). Some of these studies are described in greaterdetail later.
More recently, fatty fish consumption was associated with prevention of cardiacarrest from ventricular fibrillation in coronary patients. Ventricular fibrillation is thecause of death in most patients with CHD and it accounts for the 20 to 30% of peoplewhose first indication of coronary disease is cardiac arrest. A study from the Universityof Washington compared the effects of eating fish with the incidence of cardiac arrest(19). There was a 50% reduction in the risk of cardiac arrest in people who consumedat least one fatty fish meal per week. A typical fatty fish would be salmon. Other fattyfish include sardines, mackerel, and Chilean sea bass. Even those who consumed a lessfatty fish, such as tuna, benefited, because all fish and shellfish contain the beneficialn-3 fatty acids.

224 Part III / Cardiovascular Disease Prevention
This protection against cardiac arrest occurred from the n-3 fatty acids (EPA and DHA)in the fat of the fish. The effects of eating fish were reflected biochemically in the fattyacids of the red blood cells. Individuals whose red blood cells had a relatively low levelof the n-3 fatty acids (3.3% of total fatty acids) had a much greater risk of cardiac arrestthan those individuals whose red blood cell n-3 fatty acids comprised 5% or more of thetotal fatty acids. In other words, there was a 70% reduction in the risk of cardiac arrest inthose people with the higher red blood cell n-3 fatty acid content (19). Similarly, the USPhysicians Health Study of 20,551 men ages 40 to 84 yr showed a 52% reduction in therisk of sudden cardiac death in men who consumed fish at least once a week (20).
Data from 76,283 women in the Nurses’ Health Study showed that a daily intake of1.1 g or more of α-linolenic acid (18:3 n-3) protected against fatal ischemic heart diseaseand that this protection probably resulted from an antiarrhythmic effect of α-linolenicacid (21). However, the protective effect of α-linolenic acid did not extend to nonfatalMI, for which there was a nonsignificant trend for an effect.
2.3. Clinical TrialsThese epidemiological data are buttressed by a randomized, controlled clinical trial
of 2333 men who had recovered from MI and who were then asked to increase theirintake of fatty fish or to take fish oil (22). There was a 29% reduction in the 2-yr all-cause mortality in subjects advised to eat fatty fish, and there was also a reduction indeaths from ischemic heart disease, but there was no reduction in nonfatal MI. This wasthe first intervention trial in which all-cause mortality was reduced in a coronary inter-vention program. One likely reason for the reduction in coronary mortality was thedecrease in cardiac arrest, as documented by Siscovick et al. (19). Men who ate fattyfish at least once a week had a 50% reduction in cardiac arrest, which probably resultedfrom the antiarrhythmic action of the n-3 fatty acids discussed earlier.
In a second clinical trial, 223 patients with angiographically proven coronary arterydisease (CAD) received about 1.5 g/d of n-3 fatty acids from fish oil concentrate for2 yr (23). The progression of coronary disease was significantly but modestly decreasedcompared to the control group. Thus, the evidence grew stronger that even some fish (orn-3 fatty acid consumption from fish oil) on a consistent basis (at least one serving aweek) may prevent many deaths from CHD.
However, the most recent and largest test of fish oil in coronary patients occurred inItaly; the GISSI-Prevenzione Trial studied 11,324 patients who had survived a recentMI (24). These patients were divided into four groups and were randomly assigneddaily supplements of 1 g of n-3 polyunsaturated fatty acids (PUFAs) and 300 mg of vit-amin E or no supplements (control). The amount of fish oil used provided approx 0.85 gof EPA and DHA in ethyl esters in a ratio of 1:2. There was no placebo control group. Theduration of the supplementation was 3.5 yr. In this massive trial, treatment with the fishoil n-3 PUFAs, but not vitamin E, significantly lowered the risk of death (14–20% less)and of cardiovascular death (17–30% less, dependent on the type of statistical analyses).The deaths and cardiovascular events included nonfatal MI and stroke. Plasma triglyc-erides were lowered in the patients treated with n-3 PUFAs.
This 1999 study was reanalyzed in 2002 (25). It was shown that the risk of suddendeath was significantly prevented by only 3 mo of treatment with fish oil, and there wasa 67% reduction in overall deaths. This benefit continued for 3.5 yr to the end of the

Chapter 9 / n-3 Fatty Acids and CVD 225
study. It is important to recognize that the benefit from fish oil occurred early. Insteadof dying from sudden death after the onset of a MI, men treated with fish oil survivedin greater numbers.
Several conclusions may be drawn from this study. Fish oil was safely administeredover the relatively long time period of 3.5 yr. The authors expected a greater reductionin deaths as occurred in the Diet and Reinfarction Trial in Wales (29%). They attributedtheir less, but still positive results to a number of coexisting factors. One problem wasthe relatively low death rate in the control group. It is worth mentioning that all of thepatients were consuming the Mediterranean diet, which in itself is associated with alowered death rate from CHD, perhaps in part from more antioxidant consumption andmore fish. A second possible problem was the ratio of EPA to DHA, which in most otherstudies was 1.5 to 2.0 but in this study was 0.5. EPA may be the more active of the twon-3 PUFAs in its clinical effects (i.e., a direct antagonist of the cyclooxygenase enzymethat produces thromboxane A2 in platelets). It was believed that the reduction in deathrate occurred largely because of the prevention of sudden death from cardiac arrhyth-mias. This is the first large-scale trial proving that a low dose of fish oil (n-3 PUFAs)over a 3.5-yr time period saved lives. The evidence is steadily mounting regarding thecardioprotective effects of fish oil fatty acids.
The Lyon Diet Heart Study, a randomized secondary prevention trial (following afirst MI), showed a remarkable 76% reduction in risk of cardiac death and nonfatal heartattack after 4 yr (26,27). Subjects followed a diet high in canola oil and canola oil mar-garine (which is high in the plant n-3 fatty acid α-linolenic acid). The diet was alsolow in fat and high in complex carbohydrates and fiber. Very recent data indicate thatα-linolenic acid may have a direct effect on cardiac arrhythmias, whereas other cardio-vascular effects are likely mediated through the synthesis of EPA and DHA (2).Conversion of α-linolenic acid to EPA is fairly rapid and measurable within a few daysafter the dietary ingestion of linolenic acid; the conversion consists of desaturation,elongation, and further desaturation, with the rate-limiting enzyme step being the firstdesaturation step brought about by Δ6-desaturase.
The clinical prevention of sudden cardiac death by n-3 PUFAs and the mechanismof this prevention is summarized here (28). Both the clinical and animal studies show-ing the antiarrhythmic effects of n-3 PUFAs convey exactly the same message, namely,fish oil fatty acids are a powerful but simple modality for prevention of the 300,000episodes of sudden death that occur annually in the United States. The mechanism ofthe antiarrhythmic actions is to modulate ion channels, thus stabilizing the cardiacmyocytes electrically. Fatty acids act to inhibit the fast, voltage-dependent sodium cur-rent and the L-type calcium currents. It was also suggested that the electrical activity inbrain neurons is similarly modulated by the n-3 fatty acids quieting action on allexcitable tissues, including the neurons of the central nervous system.
3. THROMBOSIS
n-3 fatty acids from fish oil have invariably had an antithrombotic effect, particularly adiminution in thromboxane A2 that produces platelet aggregation and vasoconstriction(1,29,30). Therefore, platelet reactivity and adhesion were considerably reduced after fishoil ingestion (31). There have been reductions also of plasminogen activator inhibitor-1,

226 Part III / Cardiovascular Disease Prevention
fibrinogen, and tissue plasminogen activator and increases in platelet survival andbleeding time (4). Enhanced fibrinolysis has also been observed (4). Perhaps even moresignificant was a study in baboons showing that n-3 fatty acids eliminated both vascularthrombus formation and vascular lesions after vascular injury (32). The baboons treatedwith fish oil showed decreases in thrombus formation at sites of surgical carotidendarterectomy.
The intake of α-linolenic acid either has no effect or leads to decreased plateletaggregation when compared with linoleic acid (33,34). The function of the endothe-lium, important in both thrombosis and atherosclerosis, is affected by n-3 fatty acids(29). The production of prostacyclin is enhanced, and endothelial-derived relaxationfactor, or nitric oxide (which is depressed in atherosclerotic disease), was greatlyincreased by the n-3 fatty acids of fish oil (35–37). Eight patients with CAD received1.8 g/d of EPA for 6 wk (38). EPA had beneficial effects on both nitric oxide-dependentand nondependent forearm vasodilitation. The production of prostacyclin increased inrats fed 2.5 and 5% linseed oil (39). Fish oil supplementation improved arterial com-pliance in diabetic subjects (40). Fish oil supplementation also inhibits norepinephrine-medicated vasoconstriction, which also increases arterial compliance (41). Fifteenobese people with insulin resistance were fed four diets lasting 4 wk each. The diet of20 g/d of α-linolenic acid (flaxseed oil) (42) caused a marked rise in arterial compli-ance; however, insulin sensitivity and high-density lipoprotein (HDL) cholesteroldecreased and low-density lipoprotein (LDL) oxidizability increased.
4. EXPERIMENTAL ATHEROSCLEROSIS AND FISH OIL
When menhaden oil (a fish oil product) was incorporated in atherogenic diets fed torhesus monkeys, aortic plaques and their cholesterol content were much less than in thegroups that were not fed fish oil (43). Because the plasma lipid levels were roughly sim-ilar in control groups, the inhibition of atherosclerosis may have involved other mecha-nisms operative in the vessel wall itself. Carotid atherosclerosis was similarly inhibited.Pigs fed an atherogenic diet had much less coronary atherosclerosis when given codliver oil containing the n-3 fatty acids (44).
There is good evidence that EPA and DHA from fish oil are even incorporated intoadvanced human atherosclerotic plaques (45). They are present in complicated plaques ascomponents of cholesterol esters and phospholipids. The incorporation of EPA and DHAfrom the plasma lipoproteins into the plaques is detectable within a week of fish oil feed-ing. Perhaps the inhibition of atherosclerosis occurs because EPA and DHA inhibit cellu-lar growth in the arterial wall (46). Atherosclerosis cannot develop even after injury andthe influx of LDL cholesterol and cholesterol ester unless there is also a cellular reaction.Two important cells in atherosclerosis are smooth muscle cells and macrophages. Becauseof the suppression of cellular growth factors by n-3 fatty acids, proliferation of smoothmuscle cells was inhibited (47). Likewise, macrophage infiltration into the vessel wallwas lessened by n-3 fatty acids (43). Even the initial lesion of atherosclerosis—the fattystreak—develops less under the influence of dietary n-3 fatty acids (43).
5. EFFECTS ON THE PLASMA LIPIDS AND LIPOPROTEINS
There is a major effect on the plasma levels of lipids and lipoproteins as a result ofdietary n-3 fatty acids from fish oil (8,48). As shown here, the science in this area is very

Chapter 9 / n-3 Fatty Acids and CVD 227
clear: n-3 fatty acids in practical doses (<7 g/d) lower the plasma very low-densitylipoprotein (VLDL) and triglyceride levels through depression of synthesis of triglyc-eride in the liver. n-3 fatty acids from fish oil also suppress postprandial lipemia, thechylomicron remnants of which are considered atherogenic. As VLDL concentrationsdecrease, LDL cholesterol rises, possibly transiently. HDL cholesterol does not change.Similarly to the drug gemfibrozil, n-3 fatty acids may cause an increase in LDL as theylower the plasma triglyceride concentration in some hyperlipidemic states such asfamilial combined hyperlipidemia; this is discussed in detail later. It is unclear whethern-3 fatty acids from plants (α-linolenic acid) possess these actions. α-linolenic acid fromflaxseed oil has not been shown to lower the plasma triglyceride levels, except in verylarge amounts (38 g/d) (49).
Theoretically, the ideal nutritional program to reduce the plasma lipid and lipopro-tein concentrations maximally would be the combination of a diet that is very low cho-lesterol and saturated fat, which would upregulate the LDL receptor and reduce LDLplasma concentrations, with a diet containing fish oil, which would suppress VLDL pro-duction and lower plasma triglyceride concentrations. This view is buttressed by a well-controlled dietary study of fish oil and saturated fat fed as isolated variables. Saturatedfat raised the plasma LDL cholesterol levels, and fish oil lowered the plasma triglyceridelevels (50).
5.1. Effects of Fish Oil in Normal SubjectsSeveral recent reviews documented that n-3 fatty acids from fish had a great effect
on plasma lipids and lipoproteins, even in normal subjects (1,8,48). The principal actionis on the plasma triglyceride and VLDL concentrations. This hypolipidemic action iswell-illustrated in a study of 12 healthy adults (6 men and 6 women) who were giventhree different diets fed in random order for 4 wk each: a saturated control diet, a salmondiet containing considerable amounts of n-3 fatty acids, and a vegetable oil diet high inn-6 fatty acids (51). Both the salmon diet and the vegetable oil diet decreased theplasma cholesterol similarly, from 188 to 162 mg/dL. Both diets reduced LDL from 128to 108 mg/dL. HDL cholesterol levels were not changed by the salmon diet. The salmondiet decreased VLDL cholesterol levels, and the changes in plasma triglyceride weremost striking, from 76 to 50 mg/dL. The polyunsaturated vegetable oils did not lowerVLDL and triglyceride levels.
5.2. Studies in Hyperlipidemic PatientsBecause of the hypolipidemic effect of n-3 fatty acids from fish oil in normal sub-
jects, it seemed most reasonable to test their effects in hyperlipidemic patients (9). Thetwo groups of hyperlipidemic patients selected for the study were characterized byhypertriglyceridemia, because the depression of the plasma triglyceride and VLDLappeared to be a unique effect of n-3 fatty acids from fish oil.
Twenty hypertriglyceridemic patients volunteered for the study (8 men and 12women). Of these, 10 presented with increased levels of both VLDL and LDL, consis-tent with the type II-B phenotype. Their mean plasma lipid levels at time of entry were337 mg/dL for cholesterol and 355 mg/dL for triglyceride. Clinically, many of thesepatients had familial combined hyperlipidemia, a disorder characterized by a strong dis-position to the development of CHD and by overproduction of lipoproteins, particularlyVLDL.

228 Part III / Cardiovascular Disease Prevention
The other 10 patients had apparent type V hyperlipidemia, as characterized byincreased chylomicrons and greatly increased VLDL levels in the fasting state. Theirmean plasma lipid levels at entry were 514 mg/dL for cholesterol and 2874 mg/dL fortriglyceride. Four of the type V patients had concomitant, non-insulin-dependent diabetesmellitus, and two had adult-onset, insulin-dependent diabetes mellitus. Despite the salmonoil, their insulin doses and diabetic control remained constant throughout the study.
Both overproduction of VLDL and impaired clearance of the remnants of chylomicronand VLDL metabolism characterize the type V phenotype. Clinically, type V patientshave the “chylomicronemia” syndrome, which is characterized by episodes of abdomi-nal pain from enlargement of abdominal viscera (hepatomegaly and splenomegaly) andepisodes of acute pancreatitis. These patients also suffer from eruptive xanthomata, neu-ropathy, and lipemia retinalis. Although LDL levels are low in patients with fasting chy-lomicronemia, the presence of the atherogenic remnant particles predisposes them to thedevelopment of atherosclerotic complications, including CHD.
Special care was taken to ensure that the patients were in steady-state conditionsbefore entry. Steady-state was defined as a constancy of body weight and diet, and anabsence of any residual hypolipidemic drug effect. Most of the patients had not beenreceiving any hypolipidemic drugs just prior to the study. In the patients previouslygiven drugs, these were discontinued, and plasma lipid levels were monitored until pre-drug levels were attained.
Two different control diets were used for the two groups of hypertriglyceridemicpatients, depending on their phenotype of hyperlipidemia. Patients with combinedhyperlipidemia (type II-B) received their usual low-cholesterol (100 mg/d), low-fat(20–30% of total calories) diet. Subsequent dietary periods for these patients consistedof a fish oil diet for 4 wk followed, in some patients, by a 4-wk diet that was high in avegetable oil containing a predominance of n-6 fatty acids. Both of these diets were bal-anced for cholesterol content (approx 250 mg/d) and contained 30% of calories as fat.The diets in all periods were eucaloric, thus the subjects neither gained nor lost weight.
For patients with fasting chylomicronemia (type V), the control diet consisted of avery low-fat diet (5%) to lower plasma triglyceride levels maximally. The next dietaryinterval contained fish oil at 20 or 30% of total calories. Finally, a vegetable oil dietthat was high in n-6 fatty acids also was provided, which contained 20 to 30% of totalcalories as fat, and 200 to 300 mg of cholesterol per day. Both the fish oil and the veg-etable oil diets initially were used cautiously in the patients with fasting chylomi-cronemia (type V) to minimize the risk of hepatosplenomegaly, abdominal pain, andacute pancreatitis.
The salmon oil diet provided about 20 g/d of n-3 fatty acids for a 2600-kcalintake, with 30% of total calories as fat. On the other hand, the vegetable oil diet pro-vided about 47 g of the n-6 polyunsaturated fatty acid linoleic acid. Thus, gram forgram, the fish oil diets actually provided 43 to 64% less total PUFAs than the vegetableoil diet.
The fish oil diet decreased the plasma LDL-cholesterol levels in the patients withcombined hyperlipidemia (type II-B) by 26 mg/dL. Of individual lipoprotein choles-terol changes, the decline of VLDL cholesterol was most striking; however, LDL andHDL cholesterol also decreased. The plasma triglyceride changes were even greaterthan the cholesterol changes with the fish oil diet. The plasma triglyceride leveldecreased from 334 to 118 mg/dL. This occurred largely because of the change inVLDL triglyceride, which was lowered from 216 to 55 mg/dL.

Chapter 9 / n-3 Fatty Acids and CVD 229
The highly polyunsaturated n-6 vegetable oil diet had a much weaker effect onVLDL cholesterol and triglyceride. LDL values were similar, but, in contrast, HDL cho-lesterol was higher after the vegetable oil diet. Plasma apolipoprotein changes reflectedthe lipoprotein lipid changes. In the type II-B patients, there were significant reductionsin apolipoprotein (apo)B and C-III levels during the fish oil diet period, which paral-leled the declines in LDL and VLDL levels.
The effects of the fish oil diet were even more striking in type V patients (Figs. 1 and 2).With consumption of the very low-fat control diet, their initial plasma lipid levels declinedconsiderably but still remained greatly elevated. Many of these patients still had plasmathat appeared milky, with chylomicrons present in the fasting state. The first change tooccur in these patients after the fish oil diet was the virtual disappearance of fasting chy-lomicronemia, which had been present in five of the patients. During the fish oil diet, totalplasma triglyceride decreased from a control value of 1353 to 281 mg/dL, a drop of 79%(Fig. 1). VLDL triglyceride decreased similarly, from 1087 to 167 mg/dL. Plasma choles-terol levels declined into the normal range after the fish diet, from 373 to 207 mg/dL(Fig. 2). Most of this total plasma cholesterol decrease occurred as the result of markedchanges in the amount of VLDL cholesterol, which decreased from 270 to 70 mg/dL.
Fig. 1. The changes in plasma triglyceride levels in the 10 type V patients: control dietvs fish oil diet. To convert triglyceride from milligrams per deciliter to millimoles perliter, multiply by 0.0113. Reproduced with permission from ref 9. ©1985 MassachusettsMedical Society. All rights reserved.

230 Part III / Cardiovascular Disease Prevention
Of interest was the 48% concomitant rise of LDL cholesterol, from the low value of 84 to125 mg/dL. Apo levels changed to reflect the altered lipoprotein lipid levels. Apo A-1 lev-els did not change, whereas apoB, C-III, and E all decreased significantly.
When the n-6-rich vegetable oil replaced the fish oil in the diets of eight patients, allpatients with fasting chylomicronemia (type V) had increases in plasma triglyceride lev-els within 3–4 d. After 10–14 d of the n-6 vegetable oil feeding, the mean plasma triglyc-eride values rose 198%, and VLDL triglyceride increased from 171 to 550 mg/dL.Plasma cholesterol also increased, from 195 to 264 mg/dL. However, LDL cholesterollevels were decreased 28% by the vegetable oil diet, again indicating that the metabolicabnormality of the type V phenotype was worsening. Because of enhanced hypertriglyc-eridemia and the risk of developing abdominal pain typical of this type V disorder, thevegetable oil feeding period was discontinued prematurely in all type V patients (9).
5.3. Implications of the Fish Oil Studies in Hypertriglyceridemic PatientsIn the 20 hypertriglyceridemic patients, fish oil incorporated in the diet led to an even
more profound hypolipidemic effect than had been observed in normal subjects. Theplasma triglyceride levels decreased in each of the 20 patients, with a 79% decrease inthe type V patients and a 64% decrease in the patients with combined hyperlipidemia
Fig. 2. The changes in plasma cholesterol levels in the 10 type V patients: control dietvs fish oil diet. To convert cholesterol from milligrams per deciliter to millimoles perliter, multiply by 0.026. Reproduced with permission from ref 9. ©1985 MassachusettsMedical Society. All rights reserved.

Chapter 9 / n-3 Fatty Acids and CVD 231
(type II-B); plasma cholesterol levels decreased 45 and 27%, respectively. In the 12 nor-mal subjects previously investigated (51), decreases were less for plasma triglyceride(38%) and much less for plasma cholesterol (14%). Apparently, the greater the hyper-triglyceridemia, the greater the reductions brought about by dietary fish oil—in plasmalipids and especially in VLDL.
These results may have considerable therapeutic importance for patients with severeand moderate hypertriglyceridemia. To date, the only dietary treatment for severelyhypertriglyceridemic patients with fasting chylomicronemia (type V) has been the verysevere and therapeutically difficult restriction of dietary fat to between 5 and 10% of totalcalories in an effort to approach normal plasma triglyceride levels. Americans find thispossible to do on a short-term basis but very difficult on a long-term basis, because theyare accustomed to eating higher quantities of fat (i.e., approx 40% of total calories). Untilthis study, all fatty foods have been contraindicated in patients with fasting chylomi-cronemia (type V). The findings of this study suggest that some fatty, and even high-cholesterol, foods (i.e., fish or even shellfish) containing marine n-3 fatty acids are quiteappropriate for ingestion and may produce further triglyceride lowering over and abovethat which results from the very low-fat diet.
Other studies in familial combined hyperlipidemia and in type IV hyperlipidemiashowed increases in LDL and apoB while plasma VLDL and triglyceride valuesdeclined (8,52,53). Such LDL increases also occurred in type IV patients given the druggemfibrozil. Perhaps this is an expected physiological action when hypertriglyc-eridemia is being corrected. Should the LDL levels become abnormally high afteradministration of drugs or fish oil, then further therapy of the LDL is specifically war-ranted (i.e., bile acid binding resins or one of the statins, such as lovastatin). Fish oilalso produced plasma cholesterol and triglyceride lowering in type III patients and infamilial hypercholesterolemia (54).
5.4. Reduction of Postprandial Lipemia After Fatty MealsIt was observed that fish oils markedly decreased the usual chylomicronemia that
follows fatty meals (55,56). In other words, fat tolerance was greatly improved (seeFig. 3). This improvement could result from diminished absorption, slower synthesis,and slower entry of chylomicrons into the circulation or, alternatively, from a morerapid removal of the chylomicrons that do appear in the circulation. There is no evi-dence for diminished absorption, and fat balance studies did not show increased fatexcretion in stools after dietary periods enriched with fish oil. Whether reduced chy-lomicron production or enhanced removal of chylomicrons is responsible has notbeen clarified completely. Fish oil feeding produces smaller VLDL particle size inanimals compared to vegetable oil feeding. Therefore, smaller VLDL would have anenhanced catabolism. Perhaps, after a background diet of fish oil, chylomicrons aresmaller in size and thus more rapidly catabolized, resulting in a much flatter fat tolerancecurve (55).
5.5. The Mechanism of the Hypolipidemic Effects of Fish OilThe mechanism by which n-3 fatty acids exert their effects to decrease the levels of
plasma triglyceride and cholesterol has been tested in humans in two different sets ofexperiments that studied: (a) the inhibition by fish oil of the usual hypertriglyceridemiathat inevitably results when a high-carbohydrate diet is suddenly fed to humans and (b)the effects of fish oil on apoB, VLDL, and LDL production rates and turnovers.

232 Part III / Cardiovascular Disease Prevention
5.5.1. FISH OIL AND THE INHIBITION OF CARBOHYDRATE-INDUCED
HYPERTRIGLYCERIDEMIA
The well-known phenomenon of carbohydrate-induced hypertriglyceridemia is aphysiological response. In this model, VLDL triglyceride synthesis is stimulated as thedietary carbohydrate intake abruptly increases. The increased VLDL synthesis leads tohypertiglyceridemia, which may persist for many weeks. If n-3 fatty acids do inhibitVLDL synthesis, then the usual carbohydrate-induced hypertiglyceridemia should notoccur when fish oil is incorporated into the high-carbohydrate diet.
Seven mildly hypertriglyceridemic but otherwise healthy subjects (ages 22–54 yr) werefed three different experimental diets (57). Each was composed of a liquid formula plusthree bran muffins per day to supply fiber. The baseline diet contained 45% of caloriesfrom carbohydrates. The high-carbohydrate diets were then divided into control and fishgroups; both groups contained 15, 10, and 75% of calories as fat, protein, and carbohy-drates, respectively. In the baseline and high-carbohydrate control diets, a blend of peanutoil and cocoa butter provided the fat, which was replaced by fish oil (in the form of a com-mercially available marine lipid concentrate) in the high-carbohydrate fish oil diet. Thetotal amount of fish oil consumed per day was 50 g (in a 3000-kcal diet), equivalent toapprox 3.3 tablespoons of oil. This amount provided 8.5 g of EPA and 5.5 g of DHA.
The three experimental diets were fed in three different sequences in the ClinicalResearch Center (Fig. 4). In the first sequence, the high-carbohydrate control diet precededthe high-carbohydrate fish oil diet (Fig. 4A). In the second sequence, the high-carbohydratediet was given for 20 d, rather than 10, to demonstrate that the hypertriglyceridemia didnot spontaneously resolve after the first 10 d. This was then followed by the fish oil diet(Fig. 4B). In the third sequence, the fish oil was fed first with the high-carbohydrate dietfor 25 d and then removed to permit the effects of the high-carbohydrate diet to be man-ifest for the next 15 d (Fig. 4C). Three subjects were studied with the first sequence, andtwo subjects each were studied with the second and third sequences.
Fig. 3. The increase in plasma triglyceride levels following the ingestion of 50 g of fat.Saturated fat test meal given during the saturated fat diet (closed circles); vegetable oiltest meal given during the vegetable oil diet (open circles); salmon oil test meal givenduring the salmon oil diet (triangles). Mean fasting triglyceride levels were 72 ± 19,76 ± 37, and 46 ± 11 mg/dL before the saturated fat, vegetable and salmon oil, respec-tively; test meals were administered.

Chapter 9 / n-3 Fatty Acids and CVD 233
In all seven subjects, the high-carbohydrate control diet increased the plasma triglyc-eride levels over the baseline diet, from 105 to 194 mg/dL (57). The magnitude of thecarbohydrate-induced hypertriglyceridemia correlated significantly with each individual’sbaseline triglyceride levels. The rise in plasma triglyceride levels was complete by day 5and resulted almost entirely from an increase in the VLDL triglyceride fraction, whichmore than doubled during the control diet, from 69 to 156 mg/dL (Fig. 4). Although thetotal plasma cholesterol levels did not change, VLDL cholesterol levels almost doubled,from 18 to 34 mg/dL, and HDL cholesterol was reduced, from 49 to 41 mg/dL.
When the fat of the high-carbohydrate control diet was replaced isocaloricallywith fish oil, the elevated plasma triglyceride concentration was reduced from 194
Fig. 4. The effects of the baseline diet, high-carbohydrate (Hi-CHO) control and high-carbohydrate (Hi-CHO) fish oil diets on plasma triglyceride levels in three subjects. We seethe reversal of carbohydrate-induced hypertriglyceridemia by dietary fish oil (A), the per-sistence of the hypertriglyceridemia (throughout 20 d) and the subsequent reversal by fishoil (B), and the prevention of carbohydrate-induced hypertriglyceridemia by fish oil (C).

234 Part III / Cardiovascular Disease Prevention
to 75 mg/dL, a decrease of 61%. This decrease usually occurred within 3 d (Fig. 4A).Again, changes in VLDL triglyceride levels (from 156 to 34 mg/dL) were largelyresponsible for this effect (Fig. 5). Total cholesterol levels decreased insignificantly(from 172 to 153 mg/dL) during the high-carbohydrate fish oil diet, primarily becauseof the drop in VLDL cholesterol levels (from 34 to 12 mg/dL) (57).
The hypertriglyceridemia persisted even when the period of carbohydrate inductionwas prolonged from 10 to 20 d and did not significantly decrease until fish oil wasincorporated into the diet (Fig. 4B). When the high-carbohydrate fish oil diet followedthe baseline diet, the plasma triglyceride level did not rise, but the level increased whenthe high-carbohydrate control diet was fed subsequently (Fig. 4C). The high-carbohy-drate control diet decreased the levels of apoB and increased apoC-III concentrations;apoA-1 and E levels did not change. The high-carbohydrate fish oil diet decreasedapoA-1 and apoC-III levels; apoB and E concentrations did not change.
The incorporation of corn oil in place of fish oil into the high-carbohydrate regimenfailed to prevent the induced hypertriglyceridemia. For the three subjects who participatedin this study, the average triglyceride levels were as follows: baseline, 93 ± 23 mg/dL;high-carbohydrate control, 196 ± 58 mg/dL; high-carbohydrate corn oil, 215 ± 90 mg/dL;and high-carbohydrate fish oil, 86 ± 10 mg/dL.
Dietary fish oil not only prevented but also rapidly reversed the dietary, carbohy-drate-induced elevations in plasma triglyceride and VLDL levels, whereas the corn oilthat was rich in n-6 fatty acids had no effect at all. Because the primary differencebetween corn oil and the commercial fish oil preparation is the type of polyunsaturated
Fig. 5. The effects of the high-carbohydrate control and fish oil diets on the plasmaVLDL triglyceride levels in the seven subjects.

Chapter 9 / n-3 Fatty Acids and CVD 235
fatty acids present (corn oil, 57% 18:2 n-6, linoleic acid; the commercially availablefish oil preparation, 32% n-3 fatty acids), the difference in effect resulted from the n-3fatty acids in the fish oil. This finding implied a probable inhibitory effect of n-3 fattyacids on hepatic VLDL production.
5.5.2. FISH OIL AND THE SYNTHESIS AND TURNOVER OF APOB, VLDL, AND LDLThe hypothesis that n-3 fatty acids probably reduced VLDL levels by inhibiting
VLDL synthesis was supported by studies designed to elucidate further mechanisms ofthe hypotriglyceridemic effect of n-3 fatty acids. Dietary fish oil either affected the syn-thesis or the removal of VLDL. The rates of flux and turnover of VLDL triglyceride weremeasured after injection of 3H-glycerol into people studied under two dietary protocols:one containing fish oil and the other containing fats typical of the American diet (58).This technique permitted the calculation of both synthetic and removal rates of VLDL.
Ten male subjects were selected because they possessed a wide range of fastingplasma triglyceride concentrations, from 34 to 4180 mg/dL; therefore, the hypothesisabout the mechanism of action of dietary fish oils could be tested in subjects withgreatly different pool sizes of plasma triglyceride. Liquid formula diets containing 15to 20% fat, 65 to 75% carbohydrate, and 10 to 15% protein were fed to subjects duringboth the control and the fish oil dietary periods. The two diets differed only in the typeof fat they contained. In the control diet, a blend of cocoa butter and peanut oil (1:2)was incorporated into the formulas. The fish oil diet containing the commercial prepa-ration was taken in three divided doses daily and was not mixed into the formulas. Theprincipal difference between the two diets was the higher content of linoleic acid (18:2n-6) in the control diet, and the presence of n-3 fatty acids in the fish oil diet. The for-mer diet contained virtually no n-3 fatty acids, whereas the latter provided about 17 g/dof these highly polyunsaturated fatty acids.
The experimental diets were consumed for a period of 3–5 wk before the actualVLDL turnover procedure was conducted. This time was needed for the plasma triglyc-eride levels to stabilize, particularly in the subjects whose triglyceride levels were abovenormal. Seven subjects consumed the control diet first, followed by the fish oil diet; inthe remaining three subjects, the order was reversed. The order in which the diets wereadministered did not affect the results.
The isocaloric substitution of fish oil for the control vegetable fat produced theexpected significant reductions in the total and lipoprotein lipid levels in all 10 subjects.Total cholesterol levels for all 10 subjects fell from 195 to 144 mg/dL, a reduction of 22%.Decreases in VLDL levels (from 83 to 21 mg/dL) accounted for most of the drop inplasma cholesterol. LDL cholesterol levels did not change significantly, whereas HDLcholesterol concentrations fell from 31 to 24 mg/dL. All of these changes were evidentin both the normal and the hypertriglyceridemic groups.
After the administration of 3H-glycerol and its incorporation into the triglyceride ofVLDL, the decay curves were analyzed by computer models so that VLDL synthesis andturnover could be calculated. The incorporation of n-3 fatty acids into the diet caused a72% decrease in the VLDL triglyceride pool size (from 11.4 to 3.2 g; p < 0.025). Thedecreased pool size was associated with a 45% reduction in the VLDL triglyceride syn-thetic rate (from 23 to 12.6 mg/h/kg ideal body weight [IBW]; p < 0.005) and a 45%decrease in the residence time of VLDL triglyceride in the plasma (from 5.8 to 3.2 h;p < 0.005). The reciprocal of the residence time is the fractional catabolic rate (FCR),

236 Part III / Cardiovascular Disease Prevention
which was increased by 65% (from 0.23 to 0.38 h-1; p < 0.005). There was a significantrise in the cholesterol/triglyceride ratio in VLDL during the fish oil interval (from 0.18 to0.25; p < 0.05). Finally, the ratio of the fast to the slow synthetic pathways did not changewith fish oil feeding. The same trends were seen in both normal and hypertriglyceridemicpatients. Similar results were also found by using a slightly different dietary plan andwith the labeling of VLDL apoB with 125I (59). There was a striking reduction of VLDLsynthesis and enhanced turnover.
Direct evidence that the hepatic synthesis of triglyceride and VLDL is suppressed byn-3 fatty acids from fish oil was produced in three in vitro studies of the perfused ratliver and in studies of liver cells from rats and rabbits in primary culture (60–62). In allof these studies, triglyceride synthesis was reduced. In one, enhanced ketone body pro-duction resulted; in the others, there was a diversion of n-3 fatty acids from triglyceridesynthesis into phospholipid synthesis (62). When the net results of the human and ani-mal studies are taken together, the evidence is very strong that suppression of VLDLand triglyceride synthesis is a primary mechanism for the hypolipidemic effects of n-3fatty acids, coupled with an increased FCR of VLDL.
5.6. Fish Oil and LDL TurnoverLabeled LDL turnover studies have been carried out in normal subjects given fish oil.
One of these studies demonstrated that there was a decreased synthesis of LDL and atendency for an increased FCR (63). Spady and colleagues (64) showed enhancementof LDL receptor activity after the administration of fish oil in the rat. This latter resultis consistent with the increased FCR observed in the normal human subjects. It seemsclear that the n-3 fatty acids from fish oil have major effects on all of the major lipopro-teins, with the exception of HDL.
5.7. Summary and Conclusions: Fish Oil Effects on Plasma Lipids and Lipoproteins
The n-3 fatty acids from fish oil and fish have been shown to have a remarkable effecton the synthesis and clearance of triglyceride-rich lipoproteins, especially VLDL and chy-lomicrons. Even LDL synthesis and clearance have been affected. Because of these signif-icant effects on lipoprotein synthesis and clearance, beneficial effects of fish oil have beendemonstrated in a variety of hyperlipidemic states, especially those with conditions such ashypertriglyceridemia and chylomicronemia. Therapeutic implications for fish oil are espe-cially positive in hyperlipidemia types V, IV, and III. A similar effect has been shown inhypertriglyceridemic diabetic patients without affecting glucose homeostasis (65).
There has been difficulty in interpreting the effects of fish oil in various hyperlipi-demic patients because of vastly different experimental conditions (8). In some studies,fish oil was simply added as a supplement to the usual diet in doses of 8 to 16 g/d. Inthe control period, a placebo oil (such as olive oil or safflower oil) was not always used.In other studies, there was the customary diet plus the use of an appropriate placebo oil.Furthermore, various kinds of fish oils have been used, some containing a considerableamount of cholesterol and saturated fat. Newer fish oils have less saturated fatty acids,higher concentrations of n-3 fatty acids, and a lower cholesterol content.
Some conclusions have emerged from the wide variety of studies, most of which havenot been controlled for caloric and body weight stablility. Fish oil is most effective whenthe diet is well-controlled. In these studies, LDL lowering usually has occurred as well

Chapter 9 / n-3 Fatty Acids and CVD 237
as profound VLDL and triglyceride lowering in normal subjects and in a wide variety ofhyperlipidemic states. In our experience, this lowering of plasma cholesterol levels hasoccurred in patients with elevated plasma triglyceride concentrations (types V, II-A, II-B,III, and IV hyperlipidemia), with the most dramatic results occurring in the patients withfasting chylomicronemia (type V) who do not tolerate any other kind of dietary fat(8,9,48,66). In the literature and in our experience, HDL levels have not been greatlyaffected by fish oil. Clearly, the use of fish oil in hyperlipidemia must be individualizedregarding both use and dosage. Lower doses of fish oil (8–15 g/d) or 2.4–4.5 g of n-3fatty acids (EPA and DHA) particularly lower the plasma triglyceride levels (8).
Why has there been an occasional increase in the plasma LDL and apoB after fish oiladministration when there has been a simultaneous decrease in plasma VLDL andtriglyceride? This is a most challenging question and may relate to fundamental aspectsof VLDL-LDL metabolism. Normally, LDL is derived from two sources: conversionfrom VLDL and direct synthesis from the liver. Similarly, the catabolism of VLDLoccurs in two directions through intermediate density lipoprotein. This lipoprotein maybe removed by the apoE receptor in the liver or converted to LDL. The animal experi-ments of Huff and Telford (67) suggest the reason that in some instances, fish oil mightincrease LDL. Turnover studies in the miniature pig revealed that fish oil feedingincreased the proportion of VLDL being converted to LDL. Apparently, the n-3 fattyacids of fish oil produce a smaller VLDL particle, which is more likely to be convertedto LDL. In this pig study, however, LDL concentrations did not increase, because thedirect synthesis of LDL was reduced more by fish oil than the increase in LDL fromVLDL. The findings from these pig studies await confirmation in humans. They doexplain the reason that LDL may increase in some humans who are fed fish oil: moreVLDL is converted to LDL and direct LDL synthesis does not decrease, thus there ismore LDL. LDL turnover studies showed decreased production of LDL in normalhumans given large amounts of salmon oil vs vegetable oil (63). In this study, theplasma LDL decreased after n-3 fatty acids.
6. FISH OIL IN PATIENTS WITH DIABETES
In patients with diabetes, there is enhanced risk for vascular disease, so that the use offish oil might be particularly desirable if glucose control is not disturbed. The literature iscontroversial regarding the effects of n-3 fatty acids in patients with diabetes (68,69). Intype I, insulin-dependent diabetics, there is universal agreement that glucose control is nothampered with fish oil supplementation and that the beneficial effects on the plasma lipidsand lipoproteins have been demonstrated. In type II, adult-onset non-insulin-dependentdiabetics, the results have been somewhat conflicting, possibly because such patients arevery susceptible to the caloric load imposed. In most studies, the plasma triglyceride andVLDL concentrations have declined, but some studies have shown the deterioration inglucose homeostatsis. This literature was reviewed recently by Heine and colleagues (68).Most of the studies were short-term and, in some, caloric control has been somewhat dis-torted by the administration of calorie-dense fish oil without the existence of a suitableplacebo. The addition of fish oil to the usual diet would be hypercaloric, thereby disturb-ing glucose control. When there is attention to the caloric content of the supplement, thenthere are beneficial effects on the plasma triglyceride and VLDL without disturbing glu-cose homeostasis, as illustrated in the following experiments.

238 Part III / Cardiovascular Disease Prevention
These problems and objections were considered in an experimental design of astudy of 16 adult-onset diabetics who were randomized to a double-blind, placebo-controlled, crossover study (65). The subjects of the study were overweight, and mostwere receiving hypoglycemic agents. There was a 3-mo stabilization baseline periodin which they were given a eucaloric, lower fat (30% of calories from fat), high-com-plex carbohydrate diet with 55% of calories from carbohydrate. This was followed bytwo 6-mo intervention periods in which the subjects continued on the same diet andreceived a supplement of 15 g/d of either olive or fish oil. The fish oil contained 6 g/dof n-3 fatty acids. The endpoints of the study were plasma lipid and lipoprotein con-centrations and glucose homeostasis. The plasma triglyceride concentrations weremuch lower with the fish oil preparation vs olive oil (260 vs 449 mg/dL). VLDL cho-lesterol and VLDL triglyceride were lower. The total plasma cholesterol wasunchanged. There was a significant increase in LDL cholesterol, from 117 to 145 mg/dL,when hypertriglyceridemic individuals were given fish oil. HDL cholesterol did notchange.
However, the effects of fish oil on glucose homeostasis revealed no difference fromthe 6-mo period of olive oil administration. Body weights were unchanged. Fasting glu-cose levels were 172 and 178 mg/dL for olive and fish oil, respectively. Another mea-sure of diabetic control, hemoglobin A-1 C, revealed no difference nor did the 24-hurinary glucose excretion, the plasma C-peptide, or the 24-h urinary C-peptide.
In view of the extremely high mortality from CHD in adult-onset diabetics, thishypolipidemic action of fish oil was of interest because diabetic control did not deteri-orate, and there were significantly beneficial plasma lipid lipoprotein effects. The otheractions of the n-3 fatty acids from fish oil in inhibiting the development of atheroscle-rosis, preventing thromboxane A2 formation, increasing endothelial-derived relaxingfactor, and inhibiting platelet-derived growth factor are all additional reasons for postu-lating a therapeutic benefit from the use of fish oil in patients with diabetes.
7. HYPERTENSION
Eleven studies showed a uniform association between n-3 fatty acids and a milddecrease in systolic blood pressure and, at times, a decrease in diastolic blood pressure,particularly in the upright position (4). This has especially occurred in mild hyperten-sives (4,70,71). A randomized controlled trial was conducted to study the effects of fishintake and weight loss on blood pressure in medication-treated, overweight hyperten-sive patients (72). Combining a daily fish meal with weight loss resulted in additivedecreases in ambulatory blood pressure and decreased heart rate. The suggested mech-anism has been an attenuation in the responses of forearm vascular resistance andbloodflow to angiotensin (i.e., less vascular reactivity). Because the decreases in bothsystolic and diastolic pressures are not large even in the best studies (4.6 mmHg and3.0 mmHg, respectively) (71), fish oil cannot be regarded as a single treatment modal-ity for hypertension. However, when used for other purposes, the mild blood pressure-lowering effect of n-3 fatty acids would certainly provide an added benefit.
8. CONCLUSION
The intake of n-3 fatty acids from fish and plants should definitely be increased toprevent CHD (2,73). This could be best implemented in the form of two to three fish

Chapter 9 / n-3 Fatty Acids and CVD 239
meals per week in the context of a low-fat diet. Fish, of course, could be substituted formeat in the diet. An intake of 2 g/d of α-linolenic acid or 1% of energy has been sug-gested (73). At the same time, the diet should be reduced in fat content to 20% of thetotal calories with a high intake of carbohydrates and fiber. The intake of cholesterolshould be limited to 100 mg/d.
Table 1 provides the fat and n-3 fatty acid content for a wide variety of fish and shell-fish (74). All fish and shellfish contain the n-3 fatty acids even when the fat content israther low, as seen in shellfish. The lower the fat content, the higher the percentage ofn-3 fatty acids that are present in a given fish or shellfish. The goal of this recommen-dation is to produce an increased content of the n-3 fatty acids EPA and DHA in theblood and tissues of the body. This will occur if there is regular consumption of fish andshellfish (at least to the extent of 200–300 g/wk) such that these n-3 fatty acids will bepresent in the diet.
With the depletion of wild fish stocks, consumers will more commonly find onlyfarmed fish on the markets, especially salmon and catfish. An important issue involvesthe EPA and DHA content of farmed fish. Preliminary data from our laboratory indicatethat EPA and DHA are 50 to 75% lower in farmed catfish. Farmed and wild salmonhave similar amounts of EPA and DHA. Additional analyses are needed to confirmthese data.
Table 2 provides the n-3 fatty acid (α-linolenic acid) content from various oils andfoods (2). Daily consumption of 15 g (1 Tbsp.) of canola oil or canola oil margarine pro-vides as much as 1 g of α-linolenic acid per day. Other rich dietary sources of α-linolenic acid include English walnuts and flaxseed oil. α-linolenic acid also is aprominent fatty acid of green leafy vegetables; however, because these vegetables havesuch a low fat content, the net amount of α-linolenic acid ingested from these sourcesis small. Human, but not cow, milk is a good source of the n-3 fatty acids, including α-linolenic acid, EPA, and DHA. The amounts in human milk (2.2% of total fatty acids)provide a good basis for considering similar amounts in the diets of children and adults.In recognition of the importance of n-3 fatty acids in human nutrition, the producers ofinfant formulas are including soy oil, an excellent source of α-linolenic acid, as one ofthe fat ingredients in formula, rather than corn and coconut oils, which are poor sources.Similarly, intravenous fat preparations use soy oil instead of safflower oil, which is apoor source of n-3 fatty acids.
If researchers desire to ascertain the long-term intake of fish and shellfish, there areexcellent markers to document this point. The markers would be: the measurement of then-3 fatty acids in the plasma, which would reflect a more immediate intake; their mea-surement in red blood cells, which, because of the greater half-life of these cells, wouldreflect the intake over a longer period of time; and finally, biopsies of the adipose tissuein which fatty acids would reflect the intake over many months and years (75).
For the intensive treatment of various forms of hyperlipidemia as well as the pro-duction of an antithrombotic state, fish oils would need to be used in addition to the con-sumption of fish. The dose of fish oil might well be from 6 to 15 g/d, titrated accordingto the endpoint desired.
For people who are unable to consume fish or shellfish, the use of fish oil wouldagain be advisable. For primary prevention, 2 to 3 g/d would be desirable. As noted ear-lier, higher doses should be used for secondary prevention and the attainment of discreteendpoints of plasma lipid and lipoprotein levels and platelet function.

Table 1Fat and n-3 Fatty Acid (EPA and DHA) Content of Seafood and Fish Oils
Seafood Fat n-3 fatty acids (EPA & DHA)(100 g, edible portion, raw) (grams) (grams)
FishAnchovy, European 4.8 1.4Bass, striped 2.3 0.8Bluefish 6.5 1.2Carp 5.6 0.3Catfish, channel 4.3 0.3Cod, Atlantic 0.7 0.3Cod, Pacific 0.6 0.2Flounder, unspecified 1.0 0.2Haddock 0.7 0.2Halibut, Pacific 2.3 0.4Herring, Atlantic 9.0 1.6Herring, Pacific 13.9 1.7Mackerel, Atlantic 13.9 2.5Mullet, unspecified 4.4 1.1Perch, ocean 1.6 0.2Pike, walleye 1.2 0.3Pompano, Florida 9.5 0.6Sablefish 15.3 1.4Salmon, Atlantic 6.3 1.2Salmon, Chinook 10.4 1.4Salmon, pink 3.4 1.0Salmon, sockeye 8.6 1.2Sardines, in sardine oila 15.5 3.3Snapper, red 1.2 0.2Sole 1.2 0.1Sturgeon 3.3 0.3Swordfish 2.1 0.2Trout, brook 2.7 0.4Trout, lake 9.7 1.6Trout, rainbow 3.4 0.5Tuna 2.5 0.5
CrustaceansCrab, Alaska King 0.8 0.3Crab, Dungeness 1.0 0.3Crayfish, unspecified 1.4 0.1Lobster, Northern 0.9 0.2Shrimp, unspecified 1.2 0.3
MollusksAbalone, New Zealand 1.0 TraceClam, hardshell 0.6 TraceClam, littleneck 0.8 TraceMussel, blue 2.2 0.5Octopus, common 1.0 0.2Oyster, Pacific 2.3 0.6Scallop, unspecified 0.8 0.2Squid, unspecified 1.1 0.3aAnalysis by the Atherosclerosis Research Laboratory, Portland, OR.

Chapter 9 / n-3 Fatty Acids and CVD 241
9. RECOMMENDATIONS
The n-3 fatty acids from fish, fish oil, and plants greatly inhibit the atheroscleroticprocess, coronary thrombosis, and cardiac arrhythmias by a variety of actions andshould be considered as an important therapeutic modality in patients with alreadyestablished CHD and to prevent coronary disease in highly susceptible people.
REFERENCES1. Goodnight SH Jr., Harris WS, Connor WE, Illingworth DR. Polyunsaturated fatty acids, hyperlipi-
demia and thrombosis. Arteriosclerosis 1982; 2:87–113.2. Connor WE. α-Linolenic acid in health and disease. Am J Clin Nutr 1999; 69:827,828.3. Voss A, Reinhart M, Sankarappa S, Sprecher H. The metabolism of 7,10,13,16,19-docosapentaenoic
acid to 4,7,10,16,19-docosahexaenoic acid in rat liver is independent of 4-desaturase. J Biol Chem1991; 266:19,995–20,000.
4. Connor WE. N-3 fatty acids and heart disease. In: Kritchevsky D, Carroll KK, eds. Nutrition andDisease Update: Heart Disease.; American Oil Chemists’ Society Press, Champaign, IL, 1994, pp.7–42.
5. Bang HO, Dyerberg J, Hyorne N. The composition of food consumed by Greenlandic Eskimos. ActaMed Scand 1973; 200:69–73.
6. Bang HO, Dyerberg J. Lipid metabolism and ischemic heart disease in Greenland Eskimos. In:Draper HH, ed. Advanced Nutrition Research, vol 3. Plenum Press, New York. 1980, pp. 1–32.
7. Connor WE. Hypolipidemic effects of dietary n-3 fatty acids in normal and hyperlipidemic humans:Effectiveness and mechanisms. In: Simopoulos AP, ed. Health Effects of Polyunsaturated FattyAcids in Seafoods. Ch. 10, Academic Press, Orlando, FL. 1986, pp. 173–210.
8. Harris WS. Fish oils and plasma lipid and lipoprotein metabolism in humans: a critical review. J LipRes 1989; 30:785–807.
Table 2α-Linolenic Acid Content of Various Oils and Foods
α-Linolenic acidFood % by wt
OilsFlaxseed oil 50.8Canola oil 9.3Soy oil 7.0Corn oil 1.0Olive oil 0.6Safflower oil 0.4Chocolate 0.1Coconut oil Trace
NutsEnglish walnuts, dry roasted 6.8Almonds, dry roasted 0.4Hazelnuts, dry roasted 0.2Cashews, dry roasted 0.2Peanuts, dry roasted Trace
Green, leafy vegetables, raw (edible portion)Brussels sprouts 0.20Kale 0.13Spinach 0.12

242 Part III / Cardiovascular Disease Prevention
9. Phillipson BE, Rothrock DW, Connor WE, Harris WS, Illingworth DR. The reduction of plasmalipids, lipoproteins and apoproteins in hypertriglyceridemic patients by dietary fish oil. N Engl JMed 1985; 312:1210–1216.
10. McLennan PL, Abeywardena MY, Charnock JS. Influence of dietary lipids on arrhythmias andinfarction after coronary artery ligation in rats. Can J Physiol Pharmacol. 1985; 63:1411–1417.
11. McLennan PL, Abeywardena MY, Charnock JS. Dietary fish oil prevents ventricular fibrillation fol-lowing coronary artery occlusion and reperfusion. Amer Heart J 1988; 116:706–717.
12. Hallaq H, Sellmayer A, Smith TW, Leaf A. Protective effect of eicosapentaenoic acid on ouabaintoxicity in neonatal rat cardiac myocytes. Proc Natl Acad Sci 1990; 87:7834–7838.
13. Hallaq H, Smith TW, Leaf A. Modulation of dihydropyridine-sensitive calcium channels in heartcells by fish oil fatty acids. Proc Natl Acad Sci 1992; 89:1760–1764.
14. Billman GE, Kang JX, Leaf A. Prevention of sudden cardiac death by dietary pure omega-3 polyun-saturated fatty acids in dogs. Circulation 1999; 99:2452–2457.
15. Newman WP, Propst MT, Rogers DR, Middaugh JP, Strong JP. Athersclerosis in Alaska natives andnon-natives. Lancet 1993; 341:1056,1057.
16. Kromhout D, Bosschieter EB, Coulander C. The inverse relation between fish consumption and20-year mortality from coronary heart disease. N Engl J Med 1985; 312:1205–1209.
17. Dolecek TA, Grandits G. Dietary polyunsaturated fatty acids and mortality in the Multiple RiskFactor Intervention Trial (MRFIT). World Rev Nutr Diet 1991; 66:205–216.
18. Ascherio A, Rimm EB, Stampfer MJ, Giovannucci EL, Willett WC. Dietary intake of marine n-3fatty acids, fish intake, and the risk of coronary disease among men. N Engl J Med 1995;332:977–982.
19. Siscovick DS, Raghunathan TE, King I, et al. Dietary intake and cell membrane levels of long-chainn-3 polyunsaturated fatty acids and the risk of primary cardiac arrest. JAMA 1995; 274:1363–1367.
20. Albert CM, Hennekens CH, O’Donnell CJ, et al. Fish consumption and risk of sudden cardiac death.JAMA 1998; 279:23–28.
21. Hu FB, Stampfer MJ, Manson JE, et al. Dietary intake of alpha-linolenic acid and risk of fatalischemic heart disease among women. Am J Clin Nutr 1999; 69:890–897.
22. Burr ML, Fehily AM, Gilbert JF, et al. Effects of changes in fat, fish, and fibre intakes on death andmyocardial reinfarction: diet and reinfarction trial (DART). Lancet 1989; 2:757–762.
23. von Schacky C, Angerer P, Kothny W, Theisen K, Mudra H. The effect of dietary omega-3 fatty acidson coronary atherosclerosis. A randomized, double-blind, placebo-controlled trial. Ann Intern Med1999; 130:554–562.
24. GISSI-Prevenzione Investigators. Dietary supplementation with n-3 polyunsaturated fatty acids andvitamin E after myocardial infarction: results of the GISSI-Prevenzione trial. Lancet 1999;354:447–455.
25. GISSI II—Marchioli R, Barzi F, Bomba E, et al. Early protection against sudden death by n-3polyunsaturated fatty acids after myocardial infarction: time-course analysis of the results of theGruppo Italiano per Studio della Sopravvivenza nell’Infarto Miocardico (GISSI)-Prevenzione.Circulation 2002; 105:1897–1903.
26. de Lorgeril M, Salen P, Martin J-L, et al. Effect of a Mediterranean type of diet on the rate of car-diovascular complications in patients with coronary artery disease. J Am Coll Cardiol 1996;28:1103–1108.
27. de Logeril M, Salen P, Martin J-L, Monjaud I, Delaye J, Mamelle N. Mediterranean diet, traditionalrisk factors, and the rate of cardiovascular complications after myocardial infarction. Circulation1999; 99:779–785.
28. Leaf A, Kang JS, Billman GE. Clinical prevention of sudden cardiac death by n-3 polyunsaturatedfatty acids and mechanism of prevention of arrhythmias by n-3 fish oils. Circulation 2003;107:2646–2652.
29. Leaf A, Weber PC. Cardiovascular effects of n-3 fatty acids. N Engl J Med 1988; 318:549–557.30. Andriamampandry MD, Leray C, Freund M, Cazenave JP, Gachet C. Antithrombotic effects of (n-3)
polyunsaturated fatty acids in rat models of arterial and venous thrombosis. Thromb Res 1999; 93:9–16.31. Goodnight SH Jr., Harris WS, Connor WE. The effects of dietary n-3 fatty acids upon platelet com-
position and function in man: a prospective, controlled study. Blood 1981; 58:880–885.32. Harker LA, Kelly AB, Hanson SR, et al. Interruption of vascular thrombus formation and vascular
lesion formation by dietary n-3 fatty acids in fish oil in non human primates. Circulation 1993;87:1017–1029.

Chapter 9 / n-3 Fatty Acids and CVD 243
33. Mutanen M, Freese R. Polyunsaturated fatty acids and platelet aggregation. Curr Opin Lipidol 1996;7:14–19.
34. Allman MA, Pena MM, Pang D. Supplementation with flaxseed oil versus sunflowerseed oil inhealthy young men consuming a low fat diet: effects on platelet composition and function. Eur J ClinNutr 1995; 49:169–178.
35. DeCaterina R, Giannessi D, Mazzone A, et al. Vascular prostacyclin is increased in patients ingest-ing ω-3 polyunsaturated fatty acids before coronary artery bypass graft surgery. Circulation 1990;82:428–438.
36. Shimokawa H, Vanhoutte PM. Dietary n-3 fatty acids and endothelium-dependent relaxation inporcine coronary arteries. Am J Physiol 1989; 256:H968–H973.
37. Nordoy A, Hatcher L, Goodnight S, FitzGerald GA, Connor WE. Effects of dietary fat content, sat-urated fatty acids and fish oil on eicosanoid production and hemostatic parameters in normal men.J Lab Clin Med 1994; 123:914–920.
38. Tagawa H, Shimokawa H, Tagawa T, Kuroiwa-Matsumoto M, Hirooka Y, Takeshita A. Long-termtreatment with eicosapentaenoic acid augments both nitric oxide-mediated and non-nitric oxide-mediated endothelium-dependent forearm vasodilatation in patients with coronary artery disease.J Cardiovasc Pharmacol 1999; 33:633–640.
39. Rupp H, Turcani M, Ohkubo T, Maisch B, Brilla CG. Dietary linolenic acid-mediated increase invascular prostacyclin formation. Mol Cell Biochem 1996; 162:59–64.
40. McVeigh GE, Brennan GM, Cohn JN, Finkelstein SM, Hayes RJ, Johnston GD. Fish oil improvesarterial compliance in non-insulin-dependent diabetes mellitus. Arterioscler Thromb 1994;14:1425–1429.
41. Chin JFP, Gust AP, Nestel PJ, Dart AM. Marine oils dose-dependently inhibit vasoconstriction offorearm resistance vessels in humans. Hypertension 1993; 21:22–28.
42. Nestel PJ, Pomeroy SE, Sasahara T, et al. Arterial compliance in obese subjects is improved withdietary plant n-3 fatty acid from flaxseed oil despite increased LDL oxidizability. ArteriosclerThromb Vasc Biol 1997; 17:1163–1170.
43. Davis HR, Bridenstine RT, Vesselinovitch D, Wissler RW. Fish oil inhibits development of athero-sclerosis in Rhesus monkeys. Arteriosclerosis 1987; 7:441–449.
44. Weiner BH, Ockene IS, Levine PH, et al. Inhibition of atherosclerosis by cod-liver oil in a hyper-lipidemic swine model. N Engl J Med 1986; 315:841–846.
45. Rapp JH, Connor WE, Lin DS, Porter JM. Dietary eicosapentaenoic acid (EPA) and docosa-hexaenoic acid (DHA) from fish oil: Their incorporation into advanced human athero-scleroticplaques. Arterioscler Thromb 1991; 11:903–911.
46. Fox PL, DeCorleto PE. Fish oils inhibit endothelial cell production of platelet-derived growth factor-like protein. Science 1988;241:453–456.
47. Kaminski WE, Jendraschak E, Kiefl R, Von Schacky C. Dietary ω-3 fatty acids lower levels ofplatelet-derived growth factor mRNA in human mononuclear cells. Blood 1993; 81:1871–1879.
48. Harris WS. N-3 fatty acids and serum lipoproteins: human studies. Am J Clin Nutr 1997;65:1645S–1654S.
49. Singer P, Berger I, Wirth M, Godicke W, Jaeger W, Voigt S. Slow desaturation and elongation oflinoleic and α-linolenic acids as a rationale of eicosapentaenoic acid-rich diet to lower blood pres-sure and serum lipids in normal, hypertensive and hyperlipemic subjects. Prostaglandins LeukotMed 1986; 24:173–193.
50. Nordoy A, Hatcher LF, Ullmann DL, Connor WE. The individual effects of dietary saturated fat andfish oil upon the plasma lipids and lipoproteins in normal men. Am J Clin Nutr 1993; 57:634–639.
51. Harris WS, Connor WE, McMurry MP. The comparative reduction of the plasma lipids and lipopro-teins by dietary polyunsaturated fats: salmon oil versus vegetable oils. Metabolism 1983; 32:179–184.
52. Friday KE, Failor RA, Childs MT, Bierman EL. Effects of n-3 and n-6 fatty acid-enriched diets onplasma lipoproteins in heterozygous familial hypercholesterolemia. Arterioscler Thromb 1991;11:47–54.
53. Failor RA, Childs MT, Bierman EL. The effects of n-3 and n-6 fatty acid-enriched diets on plasmalipoproteins and apoproteins in familial combined hyperlipidemia. Metabolism 1988; 37:1021–1028.
54. Illingworth DR, Schmidt E. The influence of dietary n-3 fatty acids on plasma, lipids and lipopro-teins. Ann NY Acad Sci 1993; 676:60–69.
55. Harris WS, Connor WE, Alam N, Illingworth DR. The reduction of postprandial triglyceride inhumans by dietary n-3 fatty acids. J Lipid Res 1988; 29:1451–1460.

244 Part III / Cardiovascular Disease Prevention
56. Weintraub MS, Zechner R, Brown A, Eisenberg S, Breslow JL. Dietary polyunsaturated fats of theω-6 and ω-3 series reduce postprandial lipoprotein levels: chronic and acute effects of fat saturationon postprandial lipoprotein metabolism. J Clin Invest 1988; 82:1884–1893.
57. Harris WS, Connor WE, Inkeles SB, Illingworth DR. Dietary n-3 fatty acids prevent carbohydrate-induced hypertriglyceridemia. Metabolism 1984; 33:l0l6–l0l9.
58. Harris WS, Connor WE, Illingworth DR, Rothrock DW, Foster DM. Effect of fish oil on VLDLtriglyceride kinetics in man. J Lipid Res 1990; 31:1549–1558.
59. Nestel PJ, Connor WE, Reardon MR, Connor S, Wong S, Boston R. Suppression by diets rich in fishoil of very low density lipoprotein production in men. J Clin Invest 1984; 74:82–89.
60. Wong, SH, Nestel PH, Trimble RP, Storer BG, Illman RJ, Topping DL. The adaptive effects ofdietary fish and safflower oil on lipid and lipoprotein metabolism in perfused rat liver. BiochemBiophys Acta 1984; 792:103–109.
61. Wong S, Reardon M, Nestel P. Reduced triglyceride formation from long chain polyenoic fatty acidsin rat hepatocytes. Metabolism 1985; 34:900–905.
62. Benner KG, Sasaki A, Gowen DR, Weaver A, Connor WE. The differential effect of eicosapen-taenoic acid and oleic acid on lipid synthesis and VLDL secretion in rabbit hepatocytes. Lipids 1990;25:534–540.
63. Illingworth DR, Harris WS, Connor WE. Inhibition of low density lipoprotein synthesis by dietaryn-3 fatty acids in humans. Arteriosclerosis 1984; 4:270–275.
64. Ventura MA, Woollett LA, Spady DK. Dietary fish oil stimulates hepatic low density lipoproteintransport in the rat. J Clin Invest 1989; 84:528–537.
65. Connor WE, Prince MJ, Ullman D, et al. The hypotriglyceridemic effect of fish oil in adult-onsetdiabetes without adverse glucose control. Ann NY Acad Sci 1993; 683:337–340.
66. Schmidt EB, Kristensen SD, DeCaterina R, Illingworth DR. The effects of n-3 fatty acids on plasmalipids and lipoproteins and other cardiovascular risk factors in patients with hyperlipidemia.Atherosclerosis 1993; 103:107–121.
67. Huff MW, Telford DE. Dietary fish oil increases the conversion of very low density lipoprotein B tolow density lipoprotein. Arteriosclerosis 1989; 9:58–66.
68. Heine RJ. Dietary fish oil and insulin action in humans. Ann NY Acad Sci 1993; 683:110–121.69. Connor WE. Diabetes, fish oil and vascular disease. Ann Int Med 1995, 123:950–952.70. Toft I, Bonaa KH, Ingebretsen OC, Nordoy A, Jenssen T. Effects of n-3 polyunsaturated fatty acids
on glucose homeostasis and blood pressure in essential hypertension: a randomized, controlled trial.Ann Intern Med 1995,123:911–918.
71. Bonaa KH, Bjerve KS, Straumme B, Gram IT, Thelle D. Effect of eicosapentaenoic and docosa-hexaenoic acids on blood pressure in hypertension: a population-based intervention trial from theTromso study. N Engl J Med 1990; 322:795–801.
72. Bao DQ, Mori TA, Burke V, Puddey IB, Beilen LJ. Effects of dietary fish and weight reduction onambulatory blood pressure in overweight hypertensives. Hypertension 1998; 32:710–717.
73. de Deckere EA, Korver O, Verschuren PM, Katan MB. Health aspects of fish and n-3 polyunsatu-rated fatty acids from plant and marine origin. Eur J Clin Nutr 1998; 52:749–753.
74. Connor WE, Connor S. Diet, atherosclerosis and fish oil. In: Stollerman H, Siperstein MD, eds.Advances in Internal Medicine, 35th ed., Year Book Publishers, Chicago, IL, 1989, pp. 139–172.
75. Leaf DA, Connor WE, Barstad L, Sexton G. Incorporation of dietary n-3 fatty acids into the fattyacids of human adipose tissue and plasma lipid classes. Am J Clin Nutr 1995; 62:68–73.

From: Preventive Nutrition: The Comprehensive Guide for Health Professionals, Third EditionEdited by: A. Bendich and R. J. Deckelbaum © Humana Press Inc., Totowa, NJ
245
10 Antioxidant Vitamin Supplementationand Cardiovascular Disease
Howard N. Hodis, Wendy J. Mack, and Alex Sevanian
KEY POINTS
● Free radical-related processes underlie many of the proinflammatory and vascular cellchanges associated with atherogenesis.
● Although observational studies have been mixed, the most consistent inverse associa-tion between antioxidant vitamin intake and reduced cardiovascular disease (CVD) hasbeen reported with vitamin E.
● Primary and secondary randomized controlled trials, including arterial imaging trials,have predominantly indicated a null effect of antioxidant vitamin supplementation onCVD events and progression of atherosclerosis.
● Troublesome data from randomized controlled trials (RCTs) of antioxidant vitamin sup-plementation have arisen in certain subgroups.
● Limited data indicate that low antioxidant levels may be a prerequisite for the cardio-protective effects of antioxidant vitamin supplementation to be expressed.
● Current data do not support the use of antioxidant vitamin supplementation for the pre-vention or treatment of CVD.
● The divergent information derived from observational trials and RCTs warrants furtherinvestigation.
● Consumption of fruits and vegetables high in antioxidant vitamins appears to be animportant component of a healthy lifestyle.
1. INTRODUCTION
A large body of laboratory evidence suggests that the early stages of atherosclerosis arecomprised of a series of oxidative processes (1). Animal studies suggest that oxidativedamage may be involved with atherogenic-promoting processes, such as endothelial dam-age (2), and that antioxidants reduce oxidative damage and atherosclerosis lesions (3,4).Therefore, there is much basic science research and animal studies supporting the anti-atherogenic hypothesis of antioxidants. Although information concerning antioxidants

246 Part III / Cardiovascular Disease Prevention
and human atherosclerosis is accumulating, the relevance of this hypothesis to athero-sclerosis prevention in humans remains unproven.
Studies in humans indicate an association between blood measures of oxidative processesand atherosclerosis (5). These data are paralleled by observational studies, including arterialimaging studies (6,7) that have demonstrated an inverse association between use of antiox-idant vitamin supplements and cardiovascular disease (CVD). Data from randomized con-trolled trials (RCTs) have been less consistent, and the safety of certain antioxidantsupplementations has been questioned in some studies. This chapter reviews evidence fromobservational studies, RCTs, and atherosclerosis arterial imaging studies to determinewhether there is an anti-atherogenic effect of antioxidant vitamins in humans.
2. FREE RADICALS, OXIDATION, ANTIOXIDANTS, AND ATHEROSCLEROSIS
Oxidative processes that evoke early atherogenesis resemble mechanisms describedfor lipid and protein oxidation by free-radical species. Relative to free-radical-mediatedinjury to cells and tissues, certain antioxidants provide significant scavenging and pro-tective effects. It has been suggested that oxidative damage to tissues is the outcome ofan imbalance between free-radical species formation and elimination. Accordingly,emphasis has been placed on antioxidant interventions. Different categories of antioxi-dant defenses have been described, and are subdivided into nonenzymatic and enzy-matic antioxidants (8). A detailed overview of free-radical mechanisms that are relevantto the modification of lipoproteins and injury to vascular tissues has been published (9).
Lipid peroxidation, a free-radical-related process, underlies many of the proinflam-matory and vascular cell changes associated with atherogenesis. Mechanisms to preventlipid peroxidation have been the focus of antioxidant research. Free-radical-relatedmechanisms initiating lipid peroxidation in tissues and lipoproteins involve a host ofreactive oxygen species (ROS), including superoxide anion radicals (O2
−) and H2O2,both formed metabolically and by redox cycling of many compounds (10). Metabolicsources for ROS include enzymes of the mitochondrial respiratory chain (11), xanthineoxidase (12), the cytochrome P450 enzyme family (13), the nicotinamide adenine din-ucleotide/ nicotinamide adenine dinucleotide phosphate oxidases (12) and lipoxyge-nases (14). The reactivity of ROS and rate of lipid peroxidation is facilitated by certaintransition metals that are probably complexed to proteins, because free transition met-als do not exist in normal tissues at catalytic levels sufficient to support the ROS pro-duction rates needed to induce cellular lipid peroxidation. Iron or copper bound toprotein serve as effective catalysts, especially with saturation of protein-binding sites(15). This has been described for ceruloplasmin, which has been implicated in the oxi-dation of serum lipoproteins (16). Plausible mechanisms for initiating lipid peroxidationmay also involve heme proteins, which can be converted to potent oxidants (17).
Interaction of ROS with nitric oxide (NO) represents another important pathway foroxidation reactions between cells and lipoproteins. Oxidation reactions resulting from theinteraction of O2
− with NO not only produce ROS (notably peroxynitrite) but consumeNO that normally functions to prevent peroxidation of lipids and proteins (18). Thus,antioxidant properties of NO may be lost along with other important vascular functions.Notably, vitamin E treatment improves endothelium-dependent vasomotor capacity andprevents decreased expression of endothelial NO synthase (NOS) in hypercholesterolemic

Chapter 10 / Antioxidants and CVD 247
animals (19). This protective effect is thought to be based on the ability of vitamin E toreduce peroxynitrite formation and spare NO (20).
Certain steps of arterial wall cellular metabolism that lead to atheroma formation canbe modulated by low-density lipoprotein (LDL)-derived oxidation products. The typeand proportion of oxidation products are dependent on the radical-generating system.Cu2+-mediated oxidation is a common in vitro system used to investigate the role of LDLcomponents during lipid peroxidation. It is also used in vitro to determine LDL oxidativesusceptibility in healthy subjects and in patients in states associated with oxidative stress,such as myocardial infarction (MI). Measurements often are based on the inhibition periodof oxidation (lag time), typically using 5 to 10 μmol of Cu2+/LDL-cholesterol (LDL-C).The susceptibility of LDL to oxidation is dependent on the composition of LDL (i.e., on itsantioxidant, lipid hydroperoxide, and fatty acid content) (21). Cu2+-oxidized LDL (Ox-LDL)shares similar properties with LDL isolated from arterial lesions (21).
Oxidation of lipoproteins, particularly LDL, forms a heterogeneous group of unsat-urated carbonyls that react with the lysine ε-amino groups of apolipoprotein B (apoB),thus reducing the proportion of positively charged amino acids (22). LDL accordinglyacquires a progressively negative net charge and is taken up by a receptor that bindsnegatively charged apoB, scavenger receptor-A1 (23). A continuum of increasingly Ox-LDL can be formed based on the duration and/or severity of oxidation. A threshold foroxidative modification of LDL apoprotein has been proposed on the basis of the num-ber of covalently modified lysine groups (24) and by modifications at other domains ofthe apoprotein (25). Progressive modifications along important domains of apoB, partic-ularly at the ligand epitopes for cell LDL receptors, reduce its capacity for assimilationby receptor-mediated endocytosis (25). Ox-LDL can exist as both soluble and insoluble(aggregate) particles when LDL is oxidized with Cu2+ to varying degrees (26).
Lipid hydroperoxides formed in lipoproteins react with apoproteins via two mecha-nisms: (a) by decomposition to reactive carbonyls, or (b) by addition of the peroxy rad-ical to free amino groups, including those found in phosphatidylethanolamine (27). Areaction of the hydroperoxide with protein has been proposed to involve release of O2
–,which may participate in further ROS-mediated oxidation reactions. This second mech-anism may account for more fluorescent products after LDL oxidation than are foundby reactions with aldehydic products. This reaction may take place in parallel with for-mation of Schiff bases, which are common reaction products of reactive carbonyls. Thespectrum for the fluorescent products for reactions, via either mechanism 1 or 2, resem-bles the spectrum obtained for Ox-LDL that is isolated from atherosclerosis tissues orLDL subjected to a variety of oxidation reactions. This suggests that similar reactionsmay occur during the oxidation of lipoproteins in vivo.
Oxidized lipoproteins are known to be cytotoxic to vascular cells (28), with toxicityattributable to the lipid components (29). The cytotoxic effects appear to result from afree-radical-mediated oxidation process induced in cells upon exposure to Ox-LDL,because toxicity is prevented mostly by antioxidant pretreatments (30). Receptor-mediateddelivery of the oxidized lipoproteins provides a targeted means for delivering oxidizedlipids and their decomposition products to intracellular sites, resulting in the signalingand expression of stress-response genes, cytokines, and adhesion molecules. Ox-LDLis chemotactic to monocytes and inhibits macrophage motility, effects also attributableto the lipid components (31,32). Further evidence that these effects result from oxidizedlipids comes from studies (33) showing that lipid loading and binding to collagen are

248 Part III / Cardiovascular Disease Prevention
inhibited by antioxidants. Studies using the antioxidants probucol and butylatedhydroxytoluene offer compelling, but indirect, evidence for LDL oxidation as an impor-tant factor contributing to atherogenesis (3,4). In atherosclerosis animal studies (3,4),these agents slowed the development of atherosclerosis . These atherogenic events maybe evoked either directly or indirectly through the presence of lipid peroxidation prod-ucts and, in a concerted manner, facilitate the development of an atherosclerosis lesion.The ability to induce the expression of cytokine genes, along with a series of other acuteresponse proteins in vascular cells, is shared by both Ox-LDL and fatty acid hydroper-oxides. Treatment of endothelial cells with either oxidant results in augmented expres-sion of cytokine-mediated formation of adhesion molecules (vascular cell adhesionmolecule and intercellular adhesion molecule) (30). Inhibition of these responses byantioxidants is taken as evidence that the effects occur through cellular oxidant stressinvolving redox-sensitive transcriptional or posttranscriptional factors (34). Similarly,the induction of factors such as monocyte chemotactic peptide is evoked by Ox-LDLand lipid peroxidation products through oxidant-sensitive transcriptional factors (34). Inthis respect, vitamin E—specifically R,R,R-α-tocopherol—may have a modulatory roleon signal transduction events associated with the regulation of smooth muscle cell pro-liferation. The effect appears to be unrelated to its direct antioxidant activity (i.e., inhi-bition of lipid peroxidation and free-radical generation), although an indirect actionrelated to modulating the cellular redox state is plausible. It has been proposed (35) thatprotein kinase C (PKC)-α inhibition by α-tocopherol is linked to the activation of a pro-tein phosphatase, which in turn dephosphorylates PKC-α and inhibits its activity. Thismechanism of action may not only influence the signaling events regulating smoothmuscle cell proliferation but may also inhibit formation of early atherosclerosis lesions,demonstrated in rabbits in which vitamin E prevented cholesterol-induced atheroscle-rosis lesions and the induction of PKC-α activity (36). Therefore, vitamin E appears tooperate at several levels, either by direct inhibition of oxidative modification of lipopro-teins or cell lipids or by indirect effects that may be independent of its antioxidant activ-ity. Moreover, there may be interaction between these two mechanisms that wouldlikely obscure responses that are monitored in vivo. An example can be taken from thewell-known inhibition of LDL oxidation and the consequent reduction of this ligand forthe CD36 receptor (37). Decreased ligand binding would, in turn, affect signalingevents such as activation of nuclear factor-κB (38) and peroxisome proliferator-acti-vated receptor (39) transcription factors, which modulate a variety of cell responses. Ineach of these cases, the oxidant-sensitive/antioxidant-inhibitable mechanism involvesactivation of transcription factors that signal cell proliferation, chemotaxis, and adhe-sion of inflammatory cells at vascular loci where atherosclerosis lesions are prone todevelop. The extent to which specific antioxidants are able to modulate these responsesis currently under investigation.
3. OBSERVATIONAL EVIDENCE FOR ANTI-ATHEROGENIC EFFECTSOF ANTIOXIDANTS
3.1. Ecological StudiesSeveral early ecological studies that reported an inverse correlation between con-
sumption of vitamin-containing foods and CVD suggest a possible role of dietaryantioxidants in the prevention of atherosclerosis . In Scotland and England, fresh fruit

Chapter 10 / Antioxidants and CVD 249
and vegetable consumption was inversely associated with CVD mortality (40,41).Vitamin C from fresh fruit and vegetable consumption was inversely related with coro-nary heart disease (CHD) mortality (40,41). Data from the US Department ofAgriculture and vital statistics from 1964 to 1978 indicated an inverse correlationbetween fruit and vegetable consumption and CVD mortality, which was especially truefor foods rich in vitamin C (42). A similar correlation was observed between increasedascorbate production and reduction in CHD mortality in the United States between 1958and 1978 (43). Although these represent important observations, results from these eco-logical studies are limited, because they are susceptible to large interpretative biasesresulting from the inability to link CVD risk with food consumption in specific indi-viduals. Furthermore, these studies were not adjusted for concomitant CVD risk factors.
3.2. Epidemiological Studies3.2.1. VITAMIN E DIETARY AND SUPPLEMENTARY INTAKE
Five large-scale prospective cohort studies (44–48) investigated the relationshipbetween vitamin E intake and CVD (Table 1). Although only one of these studies (46)found decreased CHD risk associated with dietary intake of vitamin E, three studiesfound that supplementary vitamin E intake was significantly associated with lowerCHD risk in the elderly (48), middle-aged women (44), and men (45). The Nurses’Health Study was the largest of these studies, with 87,245 female nurses (ages 34–59 yr)initially free of CHD who completed dietary questionnaires that assessed daily dietaryand supplementary antioxidant vitamin intake (44). During a follow-up of 8 yr, 552cases of CHD were documented, including 437 nonfatal MIs and 115 coronary deaths.Compared to women in the lowest quintile of vitamin E intake (<3.5 IU/d), those in thetop quintile (>21.5 IU/d) had a relative risk (RR) of CHD of 0.66 (95% confidenceinterval [CI], 0.50–0.87; p < 0.001), after adjustment for age, smoking, and a variety ofadditional CVD risk factors. The CHD benefit was attributable primarily to supple-mentary vitamin E intake, because dietary sources were not associated with significantreductions in CHD. Those who used supplementary vitamin E for less than 2 yr had nosignificant reduction in CHD risk (RR = 0.86, 95% CI, 0.52–1.43). However, use ofsupplementary vitamin E for 2 yr or more was associated with a significant reduction inCHD risk, after adjustment for CVD risk factors and other antioxidant vitamins (RR = 0.59,95% CI, 0.38–0.91). Women taking at least 100 IU/d of specific vitamin E supplements(i.e., not multivitamins) had a relative risk of CHD of 0.57 (95% CI, 0.41–0.78) com-pared with nonusers. There was no trend toward a greater decrease in CHD risk withincreasing daily intake of supplementary vitamin E; relative risk was 0.56 (95% CI,0.21–1.51) for an intake of 100–250 IU/d, 0.56 (95% CI, 0.33–0.96) for intake of300–500 IU/d, and 0.58 (95% CI, 0.24–1.42) for intake greater than 600 IU/d.
In the Health Professionals Follow-Up Study, 39,910 male health professionals (ages40–75 yr) who were initially free of CVD completed dietary questionnaires thatassessed daily dietary and supplementary antioxidant vitamin intake (45). During a 4-yrfollow-up, 667 cases of CHD were documented, including 360 coronary artery bypassgrafts or percutaneous transluminal coronary angioplasties, 201 nonfatal MIs, and 106fatal MIs. Compared with men in the lowest quintile of vitamin E intake (median intake:6.4 IU/d), those in the top quintile (median intake: 419 IU/d) had a relative risk of 0.64(95% CI, 0.49–0.83; p < 0.003) for CHD after adjustment for age, smoking, body massindex, hypertension, and additional CVD risk factors and a relative risk of CHD of 0.60

250 Part III / Cardiovascular Disease Prevention
(95% CI, 0.44–0.81; p < 0.01) with further adjustments for vitamin C and caroteneintake. The CHD benefit was primarily attributable to supplementary vitamin E intake,because dietary sources were not associated with significant reductions in CHD. For menconsuming 60 IU or more of vitamin E per day, the RR of CHD was 0.64 (95% CI,0.49–0.83) compared to those consuming less than 7.5 IU/d. Maximal reduction in riskwas seen with an intake of 100–249 IU of vitamin E per day, with no further decreasein risk at higher intakes. Men taking at least 100 IU of vitamin E supplements per dayfor 2 yr or longer had a relative risk of 0.63 (95% CI, 0.47–0.84) for CHD comparedwith nonusers, after controlling for multivitamin use. Men taking at least 100 IU of spe-cific vitamin E supplements (i.e., not multivitamins) per day had a relative risk of 0.75(95% CI, 0.61–0.93) for CHD compared with nonusers.
The Iowa Women’s Health Study followed 34,486 postmenopausal women for up to7 yr (46). The women (ages 55–69 yr) were initially free of CVD and completed ques-tionnaires that assessed daily dietary and supplementary antioxidant vitamin intake.During follow-up, 242 women died of CHD. In the overall cohort, vitamin E intakefrom food and supplements was not associated with a lower risk of CHD death (RR = 0.96,95% CI, 0.62–1.51; p = 0.27). However, vitamin E intake from food was inversely asso-ciated with CHD death among the subgroup of 21,809 women who did not consume vit-amin supplements. Compared with women in the lowest quintile of vitamin E intake(<4.91 IU/d), those in the top quintile (>9.64 IU/d) had a relative risk of 0.38 (95% CI,0.18–0.80; p < 0.004) for CHD death after adjustment for age, total energy intake, and
Table 1Epidemiological Studies of Dietary and Supplementary Vitamin Intake
Vitamin ENurses’ Health StudyHealth Professionals Follow-Up StudyIowa Women’s Health StudyFinnish Mobile Clinic StudyEstablished Populations for Epidemiologic Studies of the Elderly
Vitamin CNurses’ Health StudyHealth Professionals Follow-Up StudyIowa Women’s Health StudyFinnish Mobile Clinic StudyEstablished Populations for Epidemiologic Studies of the ElderlyAlameda County StudyWestern Electric StudySwedish Women’s StudyBritish Department of Health and Social Security Nutritional SurveyFirst National Health and Nutrition Examination Survey Epidemiologic Follow-Up Study
β-caroteneNurses’ Health StudyHealth Professionals Follow-Up StudyIowa Women’s Health StudyFinnish Mobile Clinic StudyWestern Electric StudyMassachusetts Health Care Panel Study

Chapter 10 / Antioxidants and CVD 251
a variety of additional CVD risk factors. Unlike the Nurses’ Health Study (44) and theHealth Professionals Follow-Up Study (45), supplementary intake of vitamin E was notassociated with lower CHD risk. Intake of foods rich in vitamin E (such as margarine,nuts and seeds, and mayonnaise or creamy salad dressings) was inversely associatedwith a lower risk for CHD death.
The Finnish Mobile Clinic Study was conducted in 5133 Finnish men and women(ages 30–69 yr) who were initially free of CVD (47). Daily dietary and supplementaryantioxidant vitamin intake was assessed with questionnaires at baseline. During themean 14-yr follow-up period, there were 186 CHD deaths in men and 58 CHD deathsin women. In the 2748 men, those in the highest tertile of vitamin E intake had a rela-tive risk of 0.68 (95% CI, 0.42–1.11; p-trend = 0.01) for CHD death relative to those inthe lowest tertile after adjustment for CVD risk factors. In the 2385 women, those in thehighest vs lowest tertile of vitamin E intake had a relative risk of 0.35 (95% CI,0.14–0.88; p-trend < 0.01) for CHD death after adjustment for CVD risk factors.Individuals who died of CHD consumed more dairy products and less vegetables, fruits,and margarine than did the survivors. The adjusted relative risk for CHD mortality was0.55 (95% CI, 0.18–1.73) among the 3% of men and women who used supplementscontaining vitamin E or vitamin C vs those individuals who did not use supplements.
The Established Populations for Epidemiologic Studies of the Elderly was a prospec-tive study designed to determine the effect of vitamin E and C supplement intake (notpart of a multivitamin) on CHD mortality in 11,178 men and women ages 67 to 105 yr(48). During the 6 to 9 yr of follow-up, there were 3490 deaths, including 1101 CHDdeaths. Vitamin E supplement intake was associated with a relative risk of 0.59 (95%CI, 0.37–0.93) for CHD mortality as well as a relative risk of 0.73 (95% CI, 0.58–0.91)for all-cause mortality after adjustment for CVD risk factors. However, the dosages ofthe vitamin supplements and consistency of their use were not assessed.
3.2.2. VITAMIN C DIETARY AND SUPPLEMENTARY INTAKE
Ten large-scale prospective cohort studies (45–54) examined the relationship betweenvitamin C intake and CVD (Table 1). The results from these studies have been less con-sistent than those for vitamin E, and the majority of the studies do not support a rela-tionship between vitamin C intake and CVD protection. Eight of these studies (45–52)found no CVD risk reduction from vitamin C intake. After adjustment for other vitaminand multivitamin intake, both the Nurses’ Health Study (49) and the Health ProfessionalsFollow-Up Study (45) showed no additional CVD benefit from vitamin C intake. In theHealth Professionals Follow-Up Study, men in the top quintile of vitamin C intake(median intake: 1162 mg/d) vs the lowest quintile (median intake: 92 mg/d) had a non-significant decreased risk for CHD (RR = 0.89, 95% CI, 0.68–1.16) (45). In the IowaWomen’s Health Study, women in the top quintile of vitamin C intake (>196.3 mg/d) vsthe lowest quintile (<87.3 mg/d) had a nonsignificant increased risk for CHD mortal-ity (RR = 1.43, 95% CI, 0.75–2.70) (46).
In the Finnish Mobile Clinic Study, women in the highest vs lowest tertile of vitaminC intake had a relative risk of 0.49 (95% CI, 0.24–0.98; p = 0.06) for CHD death afteradjustment for CVD risk factors; men had a relative risk of 1.00 (95% CI, 0.68–1.45;p = 0.94) (47). In the Established Populations for Epidemiologic Studies of the Elderly,vitamin C supplement vs no supplement intake was associated with a relative risk ofCHD mortality of 0.99 (95% CI, 0.74–1.33) after adjustment for CVD risk factors (48).

252 Part III / Cardiovascular Disease Prevention
In the Alameda County Study, 3119 men and women (ages 16 yr and older) were fol-lowed for up to 10 yr (50). The subjects completed dietary questionnaires that assesseddaily dietary and supplementary antioxidant vitamin intake. During follow-up, 276deaths occurred. There were no significant relationships between vitamin C intakeabove 250 mg/d and mortality from cancer, CVD, or total mortality.
In the Western Electric Study, 1556 men (ages 40–55 yr) were followed for 24 yr (51).Although there was a relative risk of 0.75 (95% CI, 0.52–1.07) for CHD death in thehighest tertile of vitamin C intake (>112 mg/d) vs the lowest tertile (<83 mg/d), this wasnot statistically significant. In a 12-yr follow-up study of 1462 Swedish women (ages38–60 yr), vitamin C intake, estimated from 24-h dietary recalls, was not associated withCVD mortality, MI, or stroke after controlling for CV risk factors (52).
In the British Department of Health and Social Security Nutritional Survey, 730British men and women (ages 65 yr and older) were followed for up to 20 yr (53).The subjects were initially free of CVD and completed 7-d dietary records. Duringfollow-up, there were 124 deaths from stroke and 182 deaths from CHD. Comparedwith subjects in the lowest tertile of vitamin C intake (≤ 27.9 mg/d), those in the toptertile (≥44.9 mg/d) had a relative risk of 0.50 (95% CI, 0.30–0.80; p < 0.003) fordeath from stroke after adjustment for age, gender, and CVD risk factors. In contrastto the stroke results, there was no significant association between vitamin C intakeand CHD mortality (RR = 0.8, 95% CI, 0.6–1.2).
The First National Health and Nutrition Examination Survey Epidemiologic Follow-Up Study was the only large-scale prospective cohort study to find a significant CVDbenefit from vitamin C intake (54). This study involved a median follow-up of 10 yr in11,348 men and women (ages 15–74 yr). In the cohort of 4479 men, there were 1069verified deaths, and in the 6869 women, there were 740 verified deaths. Men who hada dietary intake of vitamin C of no less than 50 mg/d and who consumed vitamin C sup-plements on a regular basis had a CVD standardized mortality ratio of 0.58 (95% CI,0.41–0.78) compared with all US Caucasian males, for whom the standardized mortal-ity ratio was defined to be 1.00. Women with the same vitamin C intake had a CVDstandardized mortality ratio of 0.66 (95% CI, 0.53–0.82). The average vitamin C sup-plement intake among users was 800 mg/d. The inverse association between vitamin Cintake and CVD mortality appeared to be explained by supplementary intake, becausevitamin C dietary intake was not significantly associated with reduced CVD mortality.However, caution in the interpretation of these results is warranted, because the use ofother vitamin supplements or multivitamins was not considered in the data analyses.
3.2.3. β-CAROTENE DIETARY AND SUPPLEMENTARY INTAKE
Six large-scale prospective cohort studies (45–47,51,55,56) investigated the relation-ship between β-carotene intake and CVD (Table 1). As in the case with vitamin C,the reported relationships between β-carotene intake and CVD were inconsistent. Of thesix reported prospective cohort studies, only two showed a statistically significantinverse relationship between β-carotene intake and CVD (45,55). Although women inthe highest vs lowest quintile of β-carotene intake had a RR of 0.78 (95% CI,0.59–1.03) for CHD risk in the Nurses’ Health Study (56), this did not reach statisticalsignificance after adjustment for age, smoking, and other CHD risk factors. In the IowaWomen’s Health Study, no association was found between CHD mortality and vitaminA, retinol, or carotenoids from dietary or supplement intake alone or from dietary and

Chapter 10 / Antioxidants and CVD 253
supplement intake combined (46). In the Finnish Mobile Clinic Study, women in thehighest vs lowest tertile of β-carotene intake had a relative risk of 0.62 (95% CI,0.30–1.29; p = 0.60) for CHD death after adjustment for CVD risk factors; men had arelative risk of 1.02 (95% CI, 0.70–1.48; p = 0.36) (47). Although there was a relativerisk of 0.79 (95% CI, 0.60–1.04) for CHD death in middle-aged men in the highest(>15.9 mg/d) vs the lowest (<2.9 mg/d) tertile of β-carotene intake in the WesternElectric Study, this did not reach statistical significance (51).
In the Health Professionals Follow-Up Study, men in the top quintile of caroteneintake (dietary and supplementary median intake: 19,034 IU/d) vs the lowest quintile(median intake: 3969 IU/d) had a lower risk for CHD (RR = 0.71, 95% CI, 0.53–0.86;p = 0.03) (45). Although this inverse relationship between carotene intake and CHD riskwas not found among those men who had never smoked (RR = 1.09, 95% CI, 0.66–1.79;p = 0.64), an inverse association was apparent among current smokers (RR = 0.30, 95%CI, 0.11–0.82; p = 0.02) and former smokers (RR = 0.60, 95% CI, 0.38–0.94; p = 0.04).
The Massachusetts Health Care Panel Study examined the association between con-sumption of carotene-containing fruits and vegetables and CVD mortality in a prospec-tive cohort of 1299 Massachusetts residents (ages 66 yr and older) who were initiallyfree of CVD (55). During a 4.75-yr follow-up, 161 cases of CVD mortality were docu-mented, including 48 confirmed fatal MIs. Compared with men and women in the low-est quartile of carotene-containing fruit and vegetable consumption (<0.8 servings/d),those in the top quartile (≥2.05 servings/d) had a relative risk of 0.59 (95% CI,0.37–0.94; p = 0.014) for CVD death after adjustment for age, smoking, cholesterolintake, alcohol consumption, and additional CVD risk factors and a relative risk of 0.27(95% CI, 0.10–0.74; p = 0.005) for fatal MI.
3.3. Studies Measuring Serum Antioxidant ConcentrationsIn general, studies examining the relationship between serum antioxidant concentra-
tions and CVD have been inconclusive (57–74). Specifically, studies examining therelationship between serum β-carotene, vitamin A, and vitamin C concentrations andCVD have been as inconsistent as the observational studies examining CVD and dietaryand supplementary intake of these antioxidant vitamins. Also, studies examining therelationship between serum vitamin E concentrations and CVD have not consistentlyconfirmed the observational studies examining dietary and supplementary intake of vit-amin E and CVD.
3.3.1. CROSS-SECTIONAL STUDIES
In the cross-sectional World Health Organization/Multinational Monitoring Project ofTrends and Determinants of Cardiovascular Disease Study (WHO/MONICA), multiplegroups of approx 100 healthy men (ages 40–49 yr) from 16 different worldwide regionsdiffering sixfold in age-standardized CHD mortality were compared regarding plasmalevels of vitamins A, C, E, and carotene (57,58). Independent of lipid levels, the plasmavitamin E concentration was the strongest inverse predictive factor for cross-culturalCHD mortality rates. This study also indicated that the low vitamin E plasma levels mayhave a greater impact on CHD mortality than classical risk factors, such as hypercholes-terolemia or hypertension. Across all 16 regions, where LDL-C levels ranged from 3.36mmol/L (130 mg/dL) to 4.91 mmol/L (190 mg/dL), moderate associations between CHDmortality rates and plasma cholesterol (r2 = 0.29; p = 0.03) and diastolic blood pressure

254 Part III / Cardiovascular Disease Prevention
(r2 = 0.25; p = 0.05) were found; a considerably stronger inverse association was foundfor lipid-standardized vitamin E plasma levels (r2 = 0.62; p = 0.0003). Lipid-standardizedvitamin A (r2 = 0.24; p = 0.05), vitamin C (r2 = 0.11; p = 0.22), and carotene (r2 = 0.04;p = 0.48) plasma levels showed weaker inverse associations with CHD mortality rates.Among 12 regions with common plasma LDL-C levels, ranging from 3.88 mmol/L (150mg/dL) to 4.40 mmol/L (170 mg/dL), the absolute levels of vitamin E (r2= 0.63; p = 0.002)and lipid-standardized vitamin E (r2 = 0.73; p = 0.0004) showed strong inverse correla-tions with CHD mortality rates. Additionally, vitamin C plasma levels showed a moder-ately strong, statistically significant inverse correlation with CHD mortality rates amongthese 12 regions (r2 = 0.41; p = 0.03). Lipid-standardized vitamin A (r2 = 0.16; p = 0.19)and carotene (r2 = 0.21; p = 0.14) plasma levels showed no association with CHD mor-tality rates among the 12 regions. In regions with low and medium CHD risk (Italy,Switzerland, and Northern Ireland), the average vitamin E plasma levels among healthymiddle-aged males were 26 to 28 μmol/L; in regions with the highest CHD risk (Finlandand Scotland), vitamin E plasma levels were 20 to 21.5 μmol/L (58). On average, vitaminE plasma levels were about 25% lower (p<0.01) in regions with high CHD risk than inregions of low-to-medium risk, and there was only a small overlap in the distributions ofvitamin E plasma levels. This indicates that there may be a threshold of CHD risk fromvitamin E plasma levels below 25 to 30 μmol/L (58). A similar threshold for CHD riskmay be operational for vitamin C plasma levels below 23 to 51 μmol/L (58). In a smallercross-sectional survey (59) of four European regions, the evidence did not support thehypothesis that plasma antioxidant concentrations explain regional differences inCHD mortality.
In a cross-sectional survey (60) of 595 individuals (ages 50–84 yr) conducted in anurban population of India, a significant inverse association was found between plasmavitamins A, C, E, and β-carotene levels and prevalence of coronary artery disease(CAD; defined as presence of angina or diagnosis of MI). The vitamin A and E levelsremained inversely related to CAD after adjustment for other CVD risk factors. Theadjusted odds ratio (OR) for CAD, between the lowest and highest quintiles of plasmavitamin levels in 523 subjects without CAD and 72 subjects with CAD, was significantonly for plasma vitamin E levels (OR = 2.53, 95% CI, 1.11–5.31); the lowest quintileplasma vitamin E levels were below 11.8 μmol/L, and the highest quintile plasmavitamin E levels were greater than 19.2 μmol/L.
The relation between serum ascorbic acid level and the prevalence of CVD was ana-lyzed among 6624 US men and women (ages 40–74 yr) enrolled in the National Healthand Nutrition Examination Survey (61). Compared with participants with the lowestserum vitamin C concentration (≤ 0.4 mg/dL), there was a 27% (95% CI, 10–41%)decreased prevalence of CHD and a 26% (95% CI, 3–44%) decreased prevalence ofstroke after adjustment for CVD risk factors obtained from demographical and historicalinformation among those participants with the highest (≥1.1 mg/dL) serum vitamin C con-centration. Other CVD risk factors, such as plasma cholesterol levels and other serumantioxidant levels, were not controlled for in the analyses. In addition, misclassification ofCVD may have occurred, because this diagnosis was self-reported.
3.3.2. CASE–CONTROL STUDIES
Case–control and prospective cohort studies have yielded mixed results and, in general,have not confirmed the inverse relationship between serum vitamin antioxidant levels and

Chapter 10 / Antioxidants and CVD 255
CVD found in cross-sectional/ecological studies. Three nested case–control studies, con-ducted within large prospective cohort studies, were reported (62–64). In two of thesestudies, no association was found between serum vitamin E or vitamin A concentrationsand subsequent CVD mortality (62,63). However, in the nested case–control studies fromthe Netherlands (62) and eastern Finland (63), blood samples were collected at baseline,and vitamin assays were determined 7 to 10 yr after sampling. Blood samples were frozenat −20°C, a temperature at which antioxidant vitamins are unstable and undergo degrada-tion. Thus, it is probable that the measured vitamin E levels were inaccurate. In the nestedcase–control study from Washington County, Maryland, blood samples were properlyfrozen at −70°C and analyzed for vitamin levels 16 yr after collection (64). Although noassociation was found between serum R,R,R-α-tocopherol levels and risk for MI in thetotal sample, a protective association for MI was suggested with higher serum levels ofα-tocopherol in the subgroup of individuals with serum cholesterol levels of 6.21 mmol/Lor higher (≥240 mg/dL). In addition, an increasing risk for MI was found with decreasingserum β-carotene concentrations (p = 0.02), with a similar trend found with decreasinglevels of lutein (p = 0.09). However, the excess risk for MI associated with low serumcarotenoid concentrations was limited to current smokers.
In a case–control study of 110 cases of angina pectoris and 394 controls selected from asample of 6000 men (ages 35–54 yr), a significant inverse association was found betweenvitamin E plasma levels and angina pectoris (65). Vitamin E levels remained independentlyand inversely associated with the risk of angina pectoris after adjustment for age, smoking,blood pressure, lipids, and weight. The adjusted odds ratio for angina pectoris between thelowest vs highest quintiles of vitamin E plasma levels was 2.68 (95% CI, 1.07–6.70;p = 0.02). Adjusted plasma levels of vitamin C, vitamin A, and carotene were inversely, butnot significantly, associated with angina pectoris. Several double-blind RCTs examiningthe effect of vitamin E administration on angina pectoris yielded mixed results (75–77).
3.3.3. PROSPECTIVE COHORT STUDIES
At least three prospective cohort studies (66–68) reported the relationship betweenserum vitamin E, vitamin C, and β-carotene concentrations and CVD risk. The BaselProspective Study examined the relationship between baseline serum vitamin C, vitaminE, and β-carotene concentrations and subsequent CVD mortality in 2974 male Swiss phar-maceutical company employees (ages 41–59 yr) who did not initially have CVD (66).During 12 yr of follow-up, 553 men died, including 132 from ischemic heart disease (IHD)and 31 from stroke. Compared with men in the highest quartile of serum carotene (β-carotene plus α-carotene) concentration, those in the lowest quartile (<0.23 μmol/L) had arelative risk of 1.53 (95% CI, 1.07–2.20; p < 0.024) for CVD mortality after adjustment forage, smoking, blood pressure, and cholesterol. Compared with men in the highest quartileof serum vitamin C concentration, those in the lowest quartile (<22.7 μmol/L) had a rela-tive risk of 1.25 (95% CI, 0.77–2.01; p = 0.38) for CVD mortality. Separately, low serumconcentrations of carotene and vitamin C were not associated with death from stroke, withrelative risks of 2.07 (95% CI, 0.78–5.46; p = 0.14) and 1.28 (95% CI, 0.40–4.09; p = 0.34),respectively. However, the risk of death from stroke was significantly increased in subjectswho were in both the lowest quartile of carotene (<0.23 μmol/L) and vitamin C (<22.7μmol/L) plasma levels, relative to those in the highest quartile of both carotene and vita-min C (RR = 4.17, 95% CI, 1.68–10.33; p = 0.002). There was no association betweenCVD mortality and serum vitamin E concentrations. This latter finding may result from the

256 Part III / Cardiovascular Disease Prevention
fact that the median serum vitamin E concentration in the cohort was 35 μmol/L, and, assuch, all of the serum vitamin E concentration quartiles were above the presumed thresh-old for CHD risk of 25–30 μmol/L, as suggested by the WHO/MONICA cross-sectionalstudy (58). This also may have been true for the vitamin A levels.
The relationship between serum carotenoid concentration and subsequent CHD events(nonfatal MI and CHD death) was prospectively assessed in 1899 hyperlipidemic menassigned to the placebo arm of the Lipid Research Clinics Coronary Primary PreventionTrial (67). A total of 1883 men (ages 40–59 yr) had data for serum carotenoid levels andsmoking status. After a 13-yr follow-up, men in the highest quartile of serum β-caroteneconcentration (>3.16 μmol/L) had a relative risk of 0.64 (95% CI, 0.44–0.92; p = 0.01)for CHD events compared with those in the lowest quartile (<2.33 μmol/L) after adjust-ment for age, smoking, high-density cholesterol, low-density cholesterol, and otherknown CHD risk factors. This finding was stronger among the 441 men who neversmoked, in whom the relative risk was 0.28 (95% CI, 0.11–0.73; p-trend = 0.06). For the679 current smokers, the relative risk was 0.78 (95% CI, 0.44–1.34; p-trend = 0.04).
The relationship between serum vitamin C concentration and subsequent MI wasprospectively assessed in 1605 randomly selected men in eastern Finland with an aver-age age of 54 yr who were initially free of CVD (68). After up to 8.75 yr of follow-up,there were 70 fatal or nonfatal MIs. Compared with men in the highest quintile ofplasma vitamin C concentration (>64.8 μmol/L), men in the lowest quintile (<11.4μmol/L) had a relative risk of 4.03 (95% CI, 1.74–9.36; p = 0.001) for fatal or nonfatalMI after adjustment for age, season, and examination year. However, after adjustmentfor a variety of CVD risk factors, the RR was substantially diminished to 2.08 (95% CI,0.82–5.30) and was no longer statistically significant.
Taken together, the studies relating serum antioxidant vitamin concentrations withCVD have been inconsistent and inconclusive. These studies further complicate the incon-sistencies seen with the vitamin C and carotene dietary intake studies and, in general, havefailed to confirm the apparent protective effect of high dietary and supplementary intakeof vitamin E.
3.4. Arterial Imaging Studies3.4.1. ANGIOGRAPHICAL STUDIES
In contrast to the relatively large number of epidemiological studies examining theassociation between antioxidant vitamin intake and CVD, antioxidant relationships withatherosclerosis have been studied infrequently through direct arterial visualization.Leukocyte ascorbic acid levels were significantly lower in patients with angiographicallyproven CAD than in patients without CAD (69). Vitamin E plasma levels were equalbetween patients with and without angiographically proven CAD, but plasma levelswere no less than 30 μmol/L in both groups (70). In another study, plasma total R,R,R-α-tocopherol levels were not different between patients with and without angiographicallyproven CAD; LDL R,R,R-α-tocopherol levels were unexpectedly significantly higher inpatients with angiographically proven CAD (71). These studies are difficult to interpretbecause no details of angiographic results were provided, and the classification systemsused for categorizing patients with and without angiographically proven CAD were tooimprecise to determine associations with risk factors. Additionally, the plasma antioxi-dant levels measured after diagnosis may have reflected lifestyle changes.

Chapter 10 / Antioxidants and CVD 257
The first data relating antioxidant vitamin intake with progression of atherosclero-sis came from the Cholesterol Lowering Atherosclerosis Study (CLAS) (6,7). CLASwas a randomized, placebo-controlled, serial arterial imaging clinical trial designedto determine whether drug reduction of LDL-C would reduce the progression of ath-erosclerosis in the coronary (78,79), carotid (80,81), and femoral (82) arteries, asdetermined from serial angiographic and ultrasonographic measurements of change inatherosclerosis (83). Ancillary analyses of dietary and supplementary antioxidant vit-amin intake used a large database derived from 7-d food records collected on the 188CLAS subjects every 2 mo (83). The association between self-selected dietary andsupplementary antioxidant vitamin intake and progression of CAD was derived fromanalysis of the serial quantitative coronary angiographic data from CLAS (6).Overall, subjects with supplementary vitamin E intake of no less than 100 IU/ddemonstrated less coronary artery lesion progression (average per-subject change inpercent diameter stenosis [%S]) than subjects with supplementary vitamin E intake ofless than 100 IU/d for all lesions (−0.8 vs 2.0 %S; p < 0.04) and for mild/moderatelesions less than 50%S (−0.6 vs 3.1%S; p < 0.02). Among the subjects randomized tocolestipol-niacin treatment in whom LDL-C was reduced to less than 2.59 mmol/L(100 mg/dL), a benefit of supplementary vitamin E intake was found for all lesions(−1.1 vs 3.4%S; p < 0.03) and mild/moderate lesions (2.2 vs 3.2%S; p < 0.02).Although placebo subjects with supplementary vitamin E intake of 100 IU/d orgreater demonstrated less coronary artery lesion progression than placebo subjectswith supplementary vitamin E intake of less than 100 IU/d for all lesions (1.7 vs2.9%S) and mild/moderate lesions (1.8 vs 4.0%S), these differences were not signif-icant. Dietary vitamin E intake was inversely, but nonsignificantly, associated withprogression of CAD. No benefit was found for intake of dietary or supplementaryintake of vitamin C. Because CAD progression (specifically, progression of lesionsless than 50%S) is linked to the risk of clinical coronary events (84), CLAS results pre-sent a plausible explanation for reduced CHD events seen with supplementary vitamin Eintake in other studies.
Angiographic studies examining the effects of supplementary antioxidant vitaminsfor preventing restenosis after cardiac angioplasty have been less successful. In a dou-ble-blind, placebo-controlled trial, 115 subjects (average age 54 yr) were randomized toeither 400 IU of α-tocopherol three times a day or placebo 48 h after angioplasty (85).Four months after therapy, 36% of subjects who received R,R,R-α-tocopherol hadrestenosis vs 48% of subjects who had received placebo (p = 0.06).
In the Multivitamins and Probucol (MVP) Trial (86), 317 subjects (mean age: 60 yr)were randomly assigned to one of four treatments: probucol (500 mg), multivitamins(700 IU of vitamin E, 500 mg of vitamin C, and 30,000 IU of β-carotene), both probu-col and multivitamins, or placebo. The agents were administered to subjects twice daily4 wk before and 6 mo after angioplasty; subjects were also given an extra 1000 mg ofprobucol, 2000 IU of vitamin E, both probucol and vitamin E, or placebo 12 h prior tothe angioplasty, according to their treatment assignments. Six months after angioplasty,the mean ± standard deviation (SD) reduction in luminal diameter was 0.12 ± 0.41 mmin the probucol-treated group, 0.22 ± 0.46 mm in the combined probucol-multivitamingroup, 0.33 ± 0.51 mm in the multivitamin group, and 0.38 ± 0.50 mm in the placebo-treated group. For those subjects receiving probucol vs those not receiving probucol,these results were significant (p = 0.006); for those subjects receiving vitamins vs those

258 Part III / Cardiovascular Disease Prevention
not receiving vitamins, these results were not significant (p = 0.70). Restenosis occurredin 25.0, 35.9, 42.2, and 42.9% of the subjects treated with probucol, the combination ofprobucol and multivitamins, just multivitamins, and placebo, respectively. For those sub-jects receiving probucol vs those not receiving probucol, these results were significant(p = 0.004); for those subjects receiving vitamins vs those not receiving vitamins, theseresults were not significant (p = 0.49). It is not clear why probucol (a potent antioxidant)prevented restenosis, whereas multivitamin antioxidants—either alone or in combinationwith probucol—did not. Results similar to those of the MVP Trial were reported fromthe Probucol Angioplasty Restenosis Trial, another trial of probucol vs placebo (87).
3.4.2. B-MODE ULTRASOUND STUDIES
High-resolution, B-mode ultrasound measurement of arterial wall intima-mediathickness (IMT) determines the extent and progression of subclinical atherosclerosis inits earliest stages and can be used to determine atherosclerosis relationships in asymp-tomatic individuals (88–91). Furthermore, because antioxidants are hypothesized toaffect atherosclerosis at its earliest stages, carotid wall measurements are ideal for deter-mining associations with the earliest clinical stages of atherosclerosis. Several reportshave investigated the association between carotid artery IMT and antioxidant vitaminintake and their plasma levels.
In the largest cross-sectional arterial imaging study (92), the average carotid arteryIMT was determined by quintile of R,R,R-α-tocopherol, ascorbic acid, and carotenedietary intake in 6318 women and 4989 men (ages 45–65 yr) without clinical evidenceof atherosclerosis. Vitamin intake was adjusted for age, race, body mass index, LDL-C,HDL-C, smoking, plasma glucose, blood pressure, and caloric intake. Among womenand men younger than age 55 yr, there was no association between dietary intake of anyof the antioxidant vitamins and carotid wall thickness. Among women age 55 yr andolder, those consuming more dietary vitamin C or α-tocopherol had less carotid wallthickening (p-trend across quintiles of vitamin intake were 0.019 and 0.033, respec-tively). Among men age 55 yr and older, those consuming more dietary vitamin C hadless carotid wall thickening (p-trend across quintiles was 0.035). No significant associa-tions were found between antioxidant vitamin supplement intake and carotid wall thick-ness. Serum vitamin antioxidant levels from 231 cases (defined as subjects exceeding the90th percentile for carotid IMT) and 231 controls (defined as subjects below the 75thpercentile for carotid IMT) were examined from the same cohort (72). Cases with a thickercarotid artery IMT had significantly lower levels of the specific carotenoids β-cryptoxanthinand lutein plus zeaxanthin. However, after adjustment for other CVD risk factors, thisassociation became nonsignificant. Serum levels of retinol and α-tocopherol werenonsignificantly higher among case than control subjects.
In another large cross-sectional arterial imaging study, carotid artery IMT was deter-mined by quartile of erythrocyte vitamin E and plasma carotenoid levels in 1187 menand women (ages 59–71 yr) who initially did not have CVD (73). After adjustment forCVD risk factors, erythrocyte vitamin E levels were inversely and significantly associ-ated with carotid artery IMT in men and women; plasma carotenoid levels were notassociated with carotid IMT in either gender.
A longitudinal study examined the relationship of vitamin E and β-carotene plasmalevels with the 12-mo progression of carotid IMT in 216 men without CVD who had

Chapter 10 / Antioxidants and CVD 259
serum LDL-C levels greater than 4.01 mmol/L (>155 mg/dL) (74). After adjusting forage, LDL-C level, systolic blood pressure, smoking, and other variables, there was aninverse correlation between progression of carotid artery IMT and vitamin E plasmalevels (p = 0.018), as well as with β-carotene levels (p = 0.012). The adjusted mean 12-mo carotid IMT increase was 78% (p = 0.045) greater in the lowest (≤22.5 μmol/L) thanin the highest (≥32.7 μmol/L) quartile of vitamin E plasma levels, and 92% greater(p = 0.028) in the lowest (≤0.27 μmol/L) than in the highest (≥0.64 μmol/L) quartileof β-carotene plasma levels.
Evidence demonstrating a beneficial effect of supplementary vitamin E intake on pro-gression of early atherosclerosis was obtained from analysis of the CLAS carotid arteryIMT data (7). Subjects in the CLAS placebo group who ingested more than 100 IU/d ofsupplemental vitamin E demonstrated less progression of carotid IMT over a 2-yr periodthan those who ingested less than 100 IU/d (0.008 vs 0.023 mm/yr; p = 0.02). These dataindicate that supplemental vitamin E intake may have a beneficial effect on reducing theprogression of early preintrusive atherosclerosis. The lack of effect of supplemental vit-amin E intake on the progression of carotid IMT in the drug group most likely reflects adominating effect of lipid-lowering on the progression of early atherosclerosis . Whenexamined independently of supplementary vitamin intake, dietary vitamin E and C intakehad no beneficial effect on the progression of carotid IMT. Supplementary vitamin Cintake had no beneficial effect on the progression of carotid IMT.
4. COMPLETED RANDOMIZED CONTROLLED TRIALS
Although the conclusions from epidemiological studies concerning the CVD protectiveeffects of antioxidant vitamins have been mixed, there was enough consistency in the dataand potential benefit in reducing disease risk to warrant clinical trials. Epidemiologicalstudies are unable to completely control for confounding variables that could affect dis-ease outcome. It is not possible to conclusively determine whether the association of CVDwith dietary assessment or serum measurements of antioxidant vitamins represent a trueassociation or are confounded by other dietary or lifestyle practices, which themselves areprotective. Additionally, the protective effects seen in these studies may be a result of othercomponents of the foods or a combination of antioxidants or these other food components.The epidemiological data examining the relationship between antioxidant vitamin intakeand CVD are limited in providing definitive answers regarding whether antioxidant vita-mins are protective for CVD. Unbiased estimates of the efficacy of antioxidant vitamins astherapeutic or preventive agents can only be obtained from RCTs.
To date, 19 RCTs of antioxidant vitamin supplementation examining CVD events andatherosclerosis progression have been published (Tables 2–4). Of these 19 RCTs, 8 weredesigned to determine whether antioxidant vitamin supplementation was effective in pre-venting cancer with CVD as a secondary outcome (Table 2; refs. 93–102). These RCTswere conducted in individuals predominantly asymptomatic for CVD at baseline. Theremaining 11 RCTs were specifically designed to study CVD outcomes with antioxidantvitamin supplementation (Tables 3 and 4). Of these 11 RCTs, 5 have been conducted inindividuals with established CVD at baseline (103–107), 1 has been conducted in indi-viduals without established CVD (Table 3; ref. 108), and 5 have been arterial imagingtrials to measure the progression of atherosclerosis (Table 4; refs. 109–113).

260 Part III / Cardiovascular Disease Prevention
4.1. Randomized Controlled Trials With CVD as a Secondary Outcome4.1.1. VITAMIN E
The Alpha-Tocopherol Beta-Carotene Cancer (ATBC) Prevention Study was a dou-ble-blind, placebo-controlled, primary prevention RCT designed to determine whetherdaily R,R,R-α-tocopherol, β-carotene, or both, would reduce the incidence of lung andother cancers (93). A total of 29,133 male Finnish smokers (ages 50–69 yr) were ran-domized in a 2 × 2 factorial design to α-tocopherol (50 mg/d) alone, β-carotene (20 mg/d)alone, both α-tocopherol and β-carotene, or placebo. After a median follow-up of 6.1yr of randomized treatment, there was no overall benefit of either supplement on CVD.Relative to the individuals who did not receive α-tocopherol, those assigned to α-tocopherol experienced a −16% (95% CI, −41 to 19%) nonsignificant reduction in deathfrom ischemic stroke but a statistically significant 50% (95% CI, 2–120%) increase indeath from hemorrhagic stroke. Individuals assigned to α-tocopherol had a −5% (95%CI, −15 to 6%) nonsignificant reduction in death from IHD but a 2% (95% CI, −5 to
Table 2Randomized Controlled Trials of Supplementary Vitamin Intake With Cardiovascular
Disease as a Secondary Outcome
Vitamin EAlpha-Tocopherol Beta-Carotene Cancer Prevention Study (ATBC)Linxian Study
Vitamin CLinxian StudyGeriatric Hospital Study
β-CaroteneAlpha-Tocopherol Beta-Carotene Cancer Prevention Study (ATBC)Linxian studyBeta-Carotene and Retinol Efficacy Trial (CARET)Skin Cancer Prevention Study (SCPS)Physicians’ Health Study (PHS)Women’s Health Study (WHS)Nambour Skin Cancer Prevention Trial (NSCPS)
Table 3Randomized Controlled Trials of Supplementary Vitamin Intake With Cardiovascular
Disease as the Primary Outcome
Vitamin ESecondary Prevention Trials
Cambridge Heart Antioxidant Study (CHAOS)Gruppo Italiano per lo Studio della Sopravvivenza nell’Infarto Miocardico Acuto
Prevenzione Trial (GISSI)Heart Outcomes Prevention Evaluation (HOPE) StudySecondary Prevention with Antioxidants of Cardiovascular Disease in Endstage Renal
Disease (SPACE)Heart Protection Study (HPS)
Primary Prevention TrialPrimary Prevention Project (PPP)

Chapter 10 / Antioxidants and CVD 261
9%) higher overall mortality that was also nonsignificant compared to those individu-als who did not receive α-tocopherol. Regarding the primary trial end point, the β-carotene group experienced a statistically significant 18% (95% CI, 3–36%; p = 0.01)increase in the incidence of lung cancer relative to the placebo group. Subjects receiv-ing α-tocopherol had a statistically significant −34% (95% CI, −49 to −15%) lower inci-dence of prostate cancer than control subjects; those receiving β-carotene had a 23%(95% CI, −4 to 58%) nonsignificantly greater incidence of prostate cancer than controlsubjects. Those receiving α-tocopherol also had a nonsignificant increase in bladder andstomach cancer incidence. The incidence of lung cancer was unaffected by α-toco-pherol supplementation.
The first major coronary event after randomization was determined in the subset of1862 men randomized to the ATBC Prevention Study who had a previous MI (94). Inthis subset of subjects, 424 nonfatal MIs and fatal cases of CHD occurred during fol-low-up. Relative to subjects who received placebo (438 subjects), those assigned onlyto the α-tocopherol group (466 subjects) experienced a −38% (95% CI, −59 to −4%)significant reduction in nonfatal MI. However, there was a 33% (95% CI, −14 to 105%)nonsignificant increase in fatal cases of CHD in the α-tocopherol group. All eventscombined (nonfatal MI and fatal CHD) were nonsignificantly reduced by −10% (95%CI, −33 to 22%) in subjects assigned to the α-tocopherol group. Subjects assigned tothe α-tocopherol plus β-carotene group experienced a 58% (95% CI, 5–140%) signifi-cant increase in death from CHD relative to the placebo group. Combined nonfatal MIand fatal CHD were nonsignificantly increased 14% (95% CI, −13 to 51%) in the α-toco-pherol plus β-carotene group. Nonfatal MI was nonsignificantly reduced −14% (95% CI,−42 to 26%) in the α-tocopherol plus β-carotene group.
The first major coronary event after randomization also was determined in the sub-set of 27,271 men randomized to the ATBC Prevention Study who did not have a pre-vious MI (95). In this subset of subjects, 2111 nonfatal MIs and fatal cases of CHDoccurred during follow-up. Relative to subjects who received placebo (6849 subjects),those assigned only to the α-tocopherol group (6820 subjects) experienced a 4% (95%CI, −11 to 22%) nonsignificant increase in nonfatal MIs. Fatal CHD was nonsignifi-cantly decreased −10% (95% CI, −25 to 8%) in the α-tocopherol group. All eventscombined (nonfatal MI and fatal CHD) were nonsignificantly reduced by −2% (95% CI,−13 to 10%) in subjects assigned to the α-tocopherol group. Subjects assigned to theα-tocopherol plus β-carotene group experienced a −6% (95% −21 to 13%) nonsignifi-cant decrease in death from CHD relative to the placebo group. All events combined(nonfatal MI and fatal CHD) were nonsignificantly decreased −3% (95% CI, −14 to 9%)
Table 4Arterial Imaging Randomized Controlled Trials
Coronary Angiographic TrialsHDL-Atherosclerosis Treatment Study (HATS)Women’s Angiographic Vitamin and Estrogen (WAVE) Trial
B-Mode Ultrasound TrialsAntioxidant Supplementation in Atherosclerosis Prevention (ASAP) StudyStudy to Evaluate Carotid Ultrasound Changes in Patients Treated with Ramipril and
Vitamin E (SECURE)Vitamin E Atherosclerosis Prevention Study (VEAPS)

262 Part III / Cardiovascular Disease Prevention
in the α-tocopherol plus β-carotene group. Nonfatal MI was nonsignificantly reducedby −1% (95% CI, −16 to 16%) in the α-tocopherol plus β-carotene group.
The Linxian Study was a randomized, double-blind, placebo-controlled, primary pre-vention trial designed to determine whether daily intake of four combinations of nineindividual vitamin-mineral supplements (2 × 4 factorial design) would reduce overall orcancer mortality or incidence of cancer (96). Subjects (ages 40–69 yr) were recruitedfrom four Linxian (Chinese) communities, and 29,584 individuals were randomized toplacebo or retinol (5000 IU) and zinc (22.5 mg); riboflavin (3.2 mg) and niacin (40 mg);vitamin C (120 mg) and molybdenum (30 μg); and vitamin E (30 mg), β-carotene (15mg), and selenium (Se) (50 μg). Linxian Province was chosen because inhabitants ofthis area have one of the highest esophageal/gastric cancer rates in the world, as well asa low intake of several micronutrients. After a follow-up of 5.25 yr of randomizedtreatment, total mortality was significantly reduced (RR = −9%, 95% CI, −16 to −1%;p = 0.03) among those randomized to the vitamin E, β-carotene, Se supplementationgroup relative to placebo. This reduction mostly resulted from lower cancer mortality,especially stomach cancer. There was also a nonsignificant reduction in cerebrovascularmortality (RR = −10%, 95% CI, −24 to 7%). Because vitamin E, β-carotene, and Se wereused in combination, it was not possible to determine which supplement or supplementscontributed to the lower mortality rates. The other three combination regimens of retinoland zinc, riboflavin and niacin, and vitamin C and molybdenum had no significant effectson mortality rates. The relevance of these results to Western populations is unclear.
4.1.2. VITAMIN CIn the Linxian study, there was no significant effect on mortality rates in the vitamin
C plus molybdenum supplement group (96). In a smaller, separate study of 538 subjects(ages 52–97 yr), there was no reduction in total mortality at 6 mo in those individualsrandomized to 200 mg/d of vitamin C vs those taking placebo (97).
4.1.3. β-CAROTENE
In the ATBC Prevention Study, subjects randomized to β-carotene experienced an 8%(95% CI, 1–16%) significant increase in total mortality and a 12% (95% CI, 1–25%) sig-nificant increase in death from IHD compared to those who did not receive β-carotene(93). In addition, relative to those individuals who did not receive β-carotene, those assignedto β-carotene experienced a 23% (95% CI, −14 to 76%) nonsignificant increase in deathfrom ischemic stroke and a 17% (95% CI, −20 to 70%) nonsignificant increase in deathfrom hemorrhagic stroke. In addition to apparently increasing all of the CVD mortalityendpoints, β-carotene also significantly increased the incidence of lung cancer andnonsignificantly increased prostate, colon and rectal, and stomach cancer.
In the ATBC Prevention Study subset (94) of men who had a previous MI, subjectsassigned to the β-carotene group (461 subjects) experienced a 75% (95% CI, 16–164%)significant increase in death from CHD compared to placebo subjects. All events com-bined (nonfatal MI and fatal CHD) were nonsignificantly increased 11% (95% CI, −16 to48%) in subjects assigned to the β-carotene group. In the β-carotene group, nonfatal MIwas nonsignificantly reduced by −33% (95% CI, −56 to 2%) relative to the placebo group.
In the ATBC Prevention Study subset (95) of men who did not have a previous MI,subjects assigned only to the β-carotene group (6821 subjects) experienced a −1% (95%CI, −17 to 19%) nonsignificant reduction in death from CHD. All events combined

Chapter 10 / Antioxidants and CVD 263
(nonfatal MI and fatal CHD) were nonsignificantly increased by 3% (95% CI, −9 to16%) in subjects assigned to the β-carotene group. In the β-carotene group, nonfatal MIwas nonsignificantly increased 6% (95% CI, −10 to 24%), relative to the placebo group.
In the Linxian study, β-carotene supplementation was used in combination with vit-amin E and Se (96). The results of this combination of supplements on total mortality,CVD mortality, and cancer are summarized in Subheading 4.1.1.
The Beta-Carotene and Retinol Efficacy Trial (CARET) was a double-blind,placebo-controlled, primary prevention RCT designed to determine whether daily treat-ment with a combined supplement containing β-carotene and vitamin A would reducethe incidence of lung cancer, the primary trial endpoint (98). A total of 18,314 men andwomen (ages 45–74 yr) with a high risk for lung cancer from asbestos and/or smokingexposure were randomized to placebo or a combined supplement of β-carotene (30mg/d) and vitamin A (25,000 IU/d) in the form of retinyl palmitate. After a mean fol-low-up of 4 yr of randomized treatment, CARET was terminated early because of a 28%(95% CI, 4–57%; p = 0.02) significantly increased risk for lung cancer in the combinedsupplement group compared with the placebo group. In the combined supplement group,overall mortality was significantly increased by 17% (95% CI, 3–33%; p = 0.02), anddeath from CVD was nonsignificantly increased by 26% (95% CI, −1 to 61%) comparedwith the placebo group.
The Skin Cancer Prevention Study (SCPS) was a randomized, double-blind, placebo-controlled, secondary prevention trial designed to determine the effect of daily β-carotenesupplementation on all-cause mortality and mortality from CVD and cancer in subjectswith at least one biopsy-proven basal cell or squamous cell skin cancer (99). A total of1188 men and 532 women (mean age: 63 yr) were randomized to placebo or β-carotene(50 mg/d) supplementation. After a median follow-up of 4.3 yr of randomized treat-ment, subjects randomized to β-carotene supplementation showed a 3% (95% CI, −18to 30%) nonsignificant increase in all-cause mortality and a 16% (95% CI, −18 to 64%)nonsignificant increase in CVD mortality compared with the placebo group. In sub-group analyses, there was no evidence of a protective effect of β-carotene supplemen-tation on mortality in subjects with initial plasma β-carotene levels below the medianconcentration or among subjects classified by smoking history.
The Physicians’ Health Study was a randomized, double-blind, placebo-controlled,primary prevention trial designed to test whether aspirin and β-carotene supplementationcould prevent cancer and CVD (100). Using a 2 × 2 factorial design, 22,071 US malephysicians (ages 40–84 yr) without a history of cancer (except nonmelanomatous skincancer) and CVD were randomized to aspirin (325 mg/d) plus β-carotene placebo, β-carotene (50 mg every other day) plus aspirin placebo, both active agents, or both place-bos. At the beginning of the study, 11% of the subjects were current smokers and 39%were former smokers. The aspirin portion of the study was terminated early because ofa 44% statistically significant (p < 0.001) reduction in risk for a first MI (114). After amean follow-up of 12 yr of randomized treatment, subjects randomized to β-carotenesupplementation showed no statistically significant overall benefit or harm with respectto cancer, cardiovascular events, CVD mortality, or total mortality (100). However, therewere certain trends consistent with the ATBC Prevention (93–95), CARET (98), andSCPS (99) studies in the current smokers who were randomized to β-carotene supple-mentation. Current smokers randomized to β-carotene supplementation had an 8%(95% CI, −20 to 48%) greater risk for MI, 18% (95% CI, −17 to 67%) greater risk for

264 Part III / Cardiovascular Disease Prevention
stroke, 15% (95% CI, −7 to 43%) greater risk for cardiovascular events (nonfatal MIs,nonfatal strokes, and CVD deaths), 13% (95% CI, −20 to 61%) greater risk for CVDmortality, and 5% (95% CI, −14 to 29%) greater risk for death from all causes comparedwith placebo subjects; all relative risks were nonsignificant (100).
The Women’s Health Study was a randomized, double-blind, placebo-controlled trialusing a 2 × 2 × 2 factorial design to test aspirin (100 mg every other day), vitamin E(600 IU every other day), and β-carotene (50 mg every other day) in the prevention ofcancer and CVD in 39,876 women ages 45 yr or older (101). The β-carotene compo-nent was terminated early after a median intervention of 2.1 yr primarily because of thenull findings on β-carotene and cancer incidence after 12 yr of randomized treatmentin the companion Physicians’ Health Study. Compared with placebo, there were no sta-tistically significant differences in the incidence of cancer, CVD, or total mortality afterthe 2.1-yr treatment period or after an additional 2-yr follow-up. MI was nonsignificantlyreduced by −16% (95% CI, −44 to 27%) in the β-carotene group relative to placebo group,whereas stroke was nonsignificantly increased by 42% (95% CI, −4 to 110%), and deathfrom CVD nonsignificantly increased 17% (95% CI, −46 to 153%) in the β-carotenegroup relative to the placebo group.
The Nambour Skin Cancer Prevention Trial (NSCPT) was a randomized, double-blind,placebo-controlled trial using a 2 × 2 factorial design to test β-carotene (30 mg/d) and15-plus sunscreen in the prevention of basal and squamous cell carcinomas in 1621 resi-dents (ages 20–69 yr) of Nambour in southeast Queensland, Australia (102). After 4.5 yrof intervention, there were no significant differences in the incidence of new skin cancersbetween the treatment groups. During the course of the trial, there were 11 deaths amongthe 801 participants randomized to β-carotene supplementation and 21 deaths among the820 participants randomized to placebo, resulting in a nonsignificant −50% (95% CI, −76to 3%) reduction in overall mortality. Although there were few CVD deaths (6 in the β-carotene group and 12 in the placebo group), they were nonsignificantly reduced by 50%.
4.2. Randomized Controlled Trials With CVD as the Primary Outcome4.2.1. SECONDARY PREVENTION TRIALS
The Cambridge Heart Antioxidant Study (CHAOS) was a randomized, double-blind,placebo-controlled, secondary prevention trial designed to determine whether α-tocopherolwould reduce CVD risk (103). The primary trial outcomes were a combined endpoint ofCVD death and nonfatal MI and nonfatal MI alone. A total of 2002 subjects with angio-graphically proven CAD were randomized to α-tocopherol (1035 subjects) and placebo(967 subjects). The first 546 subjects assigned to the α-tocopherol group received 800IU/d; the remainder received 400 IU/d. After a median follow-up of 510 d, subjectsassigned to the α-tocopherol group experienced a significant reduction of −47% (95%CI, −66 to −17%; p = 0.005) in the CVD death and nonfatal MI combined endpoint.The beneficial effect on the composite endpoint resulted from a −77% (95% CI, −89 to−53%; p = 0.005) significant reduction in the risk for nonfatal MI. However, there was anonsignificant increase 18% (95% CI, −38 to 127%) for CVD death in the α-tocopherolgroup. In addition, total mortality was nonsignificantly greater in the α-tocopherol groupthan in the placebo group (3.5 vs 2.7%; p = 0.31). The pattern of a significant reductionin nonfatal MI and a nonsignificant increase in CVD death in CHAOS is similar to theresults from the ATBC substudy and remains unexplained (94).

Chapter 10 / Antioxidants and CVD 265
The Gruppo Italiano per lo Studio della Sopravvivenza nell’Infarto Miocardico (GISSI)Prevenzione trial was an open-label trial conducted in 1665 women and 9659 men (aver-age age: 59.4 yr) who had a recent (≤3 mo) MI (104). Subjects were randomly assignedaccording to a 2 × 2 factorial design to receive either 300 mg of synthetic vitamin E dailyor no supplement and either an n-3 polyunsaturated fatty acid (PUFA) supplement or nosupplement for a mean of 3.5 yr. The primary trial outcome was a composite of death,nonfatal MI, and stroke. Intention-to-treat analyses were done according to the factorialdesign (two-way) and by treatment group (four-way). Vitamin E had no beneficial effectin either analysis on the primary trial endpoint relative to the other treatment groups. Bythe two-way analysis, a total of 730 of the 5660 subjects randomized to vitamin E (12.9%)and 770 of the 5664 subjects randomized to the control group (13.6%) had a primary out-come event, yielding a nonsignificantly reduced risk of −5% (95% CI, −14 to 5%).Cardiovascular death was also nonsignificantly decreased by −6% (95% CI, −19 to 10%).By the four-way analysis, a total of 371 of the 2830 subjects randomized to vitamin Ealone (13.1%) and 414 of the 2828 subjects randomized to the control group (14.6%) hada primary outcome event, yielding a nonsignificantly reduced risk of −11% (95% CI, −23to 3%). Cardiovascular death was significantly decreased −20% (95% CI, −35 to −1%) inthe four-way analysis. On the other hand, both the two-way and the four-way analysesindicated a significant reduction of −10 to −15% (95% CI, −26 to −1%) in the primarytrial outcome and a significant reduction of −17 to −30% (95% CI, −29 to −3%) incardiovascular death by n-3 PUFA relative to the other treatment groups.
The Heart Outcomes Prevention Evaluation (HOPE) Study was a double-blind,placebo-controlled trial conducted in 2545 women and 6996 men (ages 55 yr or older)who had either established CVD or diabetes in addition to one other CVD risk factor(105). Subjects were randomly assigned according to a 2 × 2 factorial design to receiveeither 400 IU of natural vitamin E daily or matching placebo and either Ramipril (anangiotensin-converting enzyme inhibitor) or matching placebo for a mean of 4.5 yr. Theprimary trial outcome was a composite of MI, stroke, and death from cardiovascularcauses. A total of 772 (16.2%) of the 4761 subjects randomized to vitamin E and 739(15.5%) of the 4780 subjects randomized to placebo had a primary outcome event(RR = 5%, 95% CI, −5 to 16%; p = 0.33). There were also no significant differencesbetween vitamin E and placebo in the components of the composite primary trial out-come with a nonsignificant 17% (95% CI, −5 to 42%; p = 0.13) increase in stroke and a5% (95% CI, −10 to 22%; p = 0.54) increase in cardiovascular death. On the other hand,relative to subjects randomized to placebo, subjects receiving Ramipril had a significantreduction of −22% (95% CI, −30 to −14%; p < 0.001) in the primary trial outcome (115).
The Secondary Prevention with Antioxidants of Cardiovascular Disease inEndstage Renal Disease (SPACE) was a double-blind, placebo-controlled trial con-ducted in 61 women and 135 men (ages 40–75 yr) who had pre-existing CVD (106).All participants were chronic hemodialysis patients. Subjects were randomlyassigned to either 800 IU of natural vitamin E daily or matching placebo for amedian of 519 d. The primary trial outcome was a composite of fatal and nonfatalMI, stroke, peripheral vascular disease, and unstable angina. Fifteen (16%) of the 97subjects randomized to vitamin E and 33 (33%) of the 99 subjects randomized toplacebo had a primary outcome event, a significant reduction in risk of −54% (95%CI, −73 to −22%; p = 0.014). Five (5.1%) of the 97 subjects randomized to vitaminE and 17 (17.2%) of the 99 subjects randomized to placebo had a MI, a significant

266 Part III / Cardiovascular Disease Prevention
reduction in risk of −70% (95% CI, −89 to −22%; p = 0.016). CVD mortality wasnonsignificantly reduced by −39% (95% CI, −72 to 30%).
The Heart Protection Study was a double-blind, placebo-controlled trial conducted in5082 women and 15,454 men (ages 40–80 yr) who had either established CAD, otherocclusive vascular disease, or diabetes (107). Subjects were randomly assigned according toa 2 × 2 factorial design to receive either antioxidant vitamin supplementation (600 mg ofsynthetic vitamin E, 250 mg of vitamin C, and 20 mg of β-carotene daily) or matchingplacebo and either simvastatin or matching placebo for a mean of 5 yr. The primary out-comes were fatal and nonfatal vascular events. There was no significant difference in all-cause mortality between subjects randomized to antioxidant vitamin supplementation(1446 of 10,269 subjects [14.1%]) and subjects randomized to placebo (1389 of 10,267subjects [13.5%]), for an increased risk of 4% (95% CI, −3 to 12%; p = 0.30). Similarly,there were no significant differences in deaths resulting from vascular or nonvascularcauses. A total of 878 (8.6%) of the 10,269 subjects randomized to antioxidant vitaminsupplementation and 840 (8.2%) of the 10,267 subjects randomized to placebo died froma vascular cause, for an increased risk of 5% (95% CI, −5 to 15%; p = 0.30). There wasno significant difference in the number of subjects having a nonfatal MI or coronarydeath: 1063 (10.4%) of 10,269 subjects randomized to antioxidant vitamin supplementa-tion vs 1047 (10.2%) of 10,267 subjects randomized to placebo, for an increased risk of2% (95% CI, −6 to 11%; p = 0.70). There was no significant difference in the numberof subjects who had a fatal or nonfatal stroke, 511 (5%) of 10,269 subjects randomizedto antioxidant vitamin supplementation vs 518 (5%) of 10,267 subjects randomized toplacebo, for a decreased risk of −1% (95% CI, −13 to 12%; p = 0.80). On the other hand,relative to subjects randomized to placebo, subjects receiving simvastatin had a signifi-cant reduction of −13% (95% CI, −9 to −6%; p = 0.0003) in all-cause mortality and a −17 to −27% significant reduction in cardiovascular mortality and vascular events (116).
4.2.2. PRIMARY PREVENTION TRIALS
The Primary Prevention Project was an open-label trial conducted in 2583 women and1912 men (mean age: 64.4 yr) without pre-existing CVD (108). Subjects were randomlyassigned according to a 2 × 2 factorial design to receive either 300 mg of synthetic vita-min E daily or no supplement and either low-dose aspirin or no aspirin for a mean of 3.6 yr.The primary trial outcome was a composite of cardiovascular death, nonfatal MI, stroke,and nonfatal stroke. A total of 56 (2.5%) of the 2231 subjects randomized to vitamin Eand 53 (2.3%) of the 2264 subjects randomized to placebo had a primary outcome event,yielding a nonsignificant increased risk of 7% (95% CI, −26 to 56%). There were alsono significant differences between vitamin E and no vitamin E in the components of thecomposite primary trial outcome, with a nonsignificant reduction of −14% (95% CI,−51 to 52%) in cardiovascular death, an increase of 1% (95% CI, −44 to 103%) in non-fatal MI and an increase of 56% (95% CI, −44 to 103%) in nonfatal stroke. On the otherhand, subjects receiving low-dose aspirin had a significant reduction of −24% (95% CI,−69 to −1%) in cardiovascular death relative to subjects not receiving aspirin.
4.2.3. ARTERIAL IMAGING TRIALS
4.2.3.1. Coronary Angiographical Trials. The HDL-Atherosclerosis TreatmentStudy (HATS) was a randomized, double-blind, placebo-controlled trial of 160 subjects(13% female; average age: 53 yr) with CAD and a low HDL-cholesterol level (≤35 mg/dL

Chapter 10 / Antioxidants and CVD 267
for men, ≤40 mg/dL for women) (109). Subjects with angiographically documented CADwere randomly assigned to one of four regimens: antioxidants (800 IU of synthetic vita-min E, 1000 mg of vitamin C, 25 mg of natural β-carotene, and 100 μg of Se daily), sim-vastatin-niacin plus antioxidants, simvastatin-niacin, or placebos. After 3 yr ofintervention, standardized coronary angiograms were performed and compared with thestandardized baseline coronary angiograms. The primary trial endpoints were angio-graphic evidence of a change in coronary stenosis and the occurrence of a cardiovascularevent, death, MI, stroke, or revascularization. The simvastatin and niacin dosages weretitrated to obtain an LDL-cholesterol goal of less than 90 mg/dL and to raise HDL-cho-lesterol by at least 10 mg/dL over baseline. The mean per-subject change in lesion %S was+3.9%S with placebos, −0.4%S with simvastatin-niacin alone (p < 0.001 for the compar-ison with the placebo group), +1.8%S with antioxidants alone (p = 0.16 for the compari-son with the placebo group), and +0.7%S with simvastatin-niacin plus antioxidants (p =0.004 for the comparison with the placebo group). The frequency of clinical event endpointswas 24% in the placebo group, 3% in the simvastatin-niacin group, 21% in the antioxidantgroup, and 14% in the simvastatin-niacin plus antioxidant group. Only the frequency ofclinical events in the simvastatin-niacin group significantly (p = 0.003) differed from theplacebo group.
The Women’s Angiographic Vitamin and Estrogen (WAVE) Trial was a double-blind,placebo-controlled trial conducted in 423 postmenopausal women (average age: 65 yr)with angiographically established CAD (110). Subjects were randomly assignedaccording to a 2 × 2 factorial design to receive either 400 IU of vitamin E plus 500 mgof vitamin C daily or matching placebo and either 0.625 mg of conjugated equine estro-gen daily (plus 2.5 mg of medroxyprogesterone acetate daily for women who had nothad a hysterectomy) or matching placebo. The mean interval between the baseline andfollow-up coronary angiograms was 2.8 yr. The primary clinical trial endpoint wasbased on the change in the mean minimum lumen diameter of all qualifying coronaryarterial segments and on the incidence of MI and death. The mean minimum lumendiameter (in millimeters/year [mm/yr]) worsened in all four groups: −0.0010 mm/yrwith placebos, −0.048 mm/yr with hormone therapy alone, −0.042 mm/yr with antiox-idant therapy alone, and −0.046 mm/yr with antioxidant therapy plus hormone therapy;none of the differences compared with placebo were significant. The frequency of thecomposite clinical endpoint was 2.8% in the placebo group, 4.9% in the hormone ther-apy group, 6.7% in the antioxidant group, and 6.5% in the antioxidant therapy plus hor-mone therapy group. The frequency of clinical events was not significantly differentamong groups (p = 0.54). However, all-cause mortality was significantly higher inwomen assigned to antioxidant vitamin supplementation compared with womenassigned to antioxidant vitamin placebo (16 vs 6; hazard ratio = 2.6; 95% CI, 1.1–7.2;p = 0.047).
4.2.3.2. B-Mode Ultrasound Trials. The Antioxidant Supplementation inAtherosclerosis Prevention (ASAP) Study was a double-blind, placebo-controlled trialconducted in 264 postmenopausal women and 256 men (ages 45–69 yr) with serum cho-lesterol of no less than 194 mg/dL (111). Subjects were randomly assigned according toa 2 × 2 factorial design to receive either 136 IU of vitamin E, 250 mg of slow-release vit-amin C, a combination of both vitamins, or placebo twice daily for 3 yr. The primary trialendpoint was progression of common carotid artery IMT determined every 6 mo fromserial high-resolution B-mode ultrasonograms. In women, there were no significant

268 Part III / Cardiovascular Disease Prevention
differences in progression rates among the treatment groups: 0.016 mm/yr in women ran-domized to placebo, 0.015 mm/yr in women who received vitamin E, 0.017 mm/yr inwomen who received only vitamin C, and 0.016 mm/yr in women who received the vit-amin combination. In men, the rates of progression were 0.020 mm/yr in those ran-domized to placebo, 0.018 mm/yr in those who received only vitamin E, 0.017 mm/yrin those who received only vitamin C, and 0.011 mm/yr in those who received both vit-amins. The progression rate was significantly less in the men who were randomized toboth vitamins compared to all men (p = 0.009) or compared with men who receivedplacebo (p = 0.008). The treatment effect of the vitamin combination was limited tohypercholesterolemic men who smoked. Baseline plasma α-tocopherol and total ascor-bate levels were lowest among men who smoked relative to men who did not smoke orto women who did or did not smoke.
The Study to Evaluate Carotid Ultrasound Changes in Patients Treated with Ramipriland Vitamin E (SECURE) (112) was a substudy of HOPE (105). SECURE was a double-blind, placebo-controlled trial conducted in 172 women and 560 men (ages 55 yr orolder) who had either established CVD or diabetes in addition to one other cardiovas-cular risk factor. Subjects were randomly assigned according to a 3 × 2 factorial designto receive either 400 IU of natural vitamin E daily or matching placebo and either 2.5or 10 mg/d of Ramipril or matching placebo for a mean of 4.5 yr. The primary trial end-point was progression of the mean maximum carotid artery intima-media thickness deter-mined every 6 mo from serial high-resolution B-mode ultrasonograms. There were nodifferences in progression rates between patients randomized to vitamin E and those ran-domized to placebo (0.0174 vs 0.0180 mm/yr, respectively). On the other hand, the pro-gression rates among patients randomized to Ramipril were significantly less than theprogression rate of patients randomized to placebo (0.021 mm/yr for the placebo group,0.0180 mm/yr for the Ramipril group receiving 2.5 mg/d, and 0.0137 mm/yr for theRamipril group receiving 10 mg/d; p = 0.033).
The Vitamin E Atherosclerosis Prevention Study (VEAPS) was a randomized, double-blind, placebo-controlled trial conducted in 185 women and 168 men (age 40 yr orolder) with LDL-cholesterol 130 mg/dL or higher and no clinical signs or symptoms ofCVD (113). Subjects were randomly assigned to either 400 IU of synthetic vitamin Edaily or matching placebo for 3 yr. The primary trial endpoint was progression of com-mon carotid artery IMT, a well-validated measure of subclinical atherosclerosis (89–91)determined every 6 mo from serial high-resolution B-mode ultrasonograms. Althoughon-trial plasma vitamin E levels were significantly increased and several markers indi-cated a significant reduction in LDL oxidation in the vitamin E group, there was no dif-ference in the average rates of atherosclerosis progression between the two treatmentgroups. In fact, the rate of progression in the vitamin E group was twice that of theplacebo group (0.0040 vs 0.0023 mm/yr; p = 0.08).
5. SUMMARY OF RANDOMIZED CONTROLLED TRIALS OF ANTIOXIDANT VITAMIN SUPPLEMENTATION
Publication of no less than 19 RCTs examining the effects of antioxidant vitamin sup-plements on CVD events and atherosclerosis progression have yielded inconsistent, con-flicting, and, occasionally, somewhat troublesome data. In general, when one examines thevitamin E data (Tables 2–4), there is a general null effect of this antioxidant supplement onCVD events and on the progression of atherosclerosis . In fact, when one examines the data

Chapter 10 / Antioxidants and CVD 269
carefully, there are some troublesome results. In ATBC, there was no overall benefit of vit-amin E supplementation on CVD. However, subjects who received vitamin E had a sig-nificantly greater risk of death from hemorrhagic stroke (93). In CHAOS, although therewas a reduction in risk from nonfatal MI, there was a nonsignificant increased risk for bothCVD death and total mortality in the vitamin E group (103). Similar to the CHAOS study,the ATBC substudy (94) in men with previous MI showed the same pattern of a significantreduction in nonfatal MI but a nonsignificant increase in CVD death. Interestingly, theincrease in risk for CVD death was not apparent in the ATBC substudy of men without aprevious MI (95). The cohort of ATBC was comprised of individuals who smoked (93). Inthe arterial imaging trials, VEAPS (113) showed a nonsignificant greater progression rateof subclinical atherosclerosis in healthy men and women receiving vitamin E relative toplacebo, whereas ASAP (111) and SECURE (112) showed no effect of vitamin E supple-mentation relative to placebo. However, there have been trial results indicating a signifi-cant reduction of CVD events with vitamin E supplementation, as in CHAOS (103) and thesmaller SPACE trial (106). CHAOS and SPACE are similar in that both of these trials useda higher dosage of vitamin E (in CHAOS, a lower dosage was subsequently used) relativeto most of the other trials, and they were conducted for the shortest time periods relative toother trials. SPACE, like CHAOS, did not show a reduction in CVD mortality with vita-min E supplementation. The only trial that showed a significant reduction in CVD mortalitywas GISSI (104). However, this finding was restricted to the four-way analysis. Neither thetwo-way nor the four-way analysis showed a significant reduction in the primary trial out-come composite of death, nonfatal MI, and stroke.
In the two randomized controlled trials that studied vitamin C alone (96,97), therewas no evidence that vitamin C was effective in reducing CVD events or mortality. Noadverse effects were observed.
The results from the ATBC (93–95), Linxian (96), CARET (98), SCPS (99), Physicians’Health Study (100), Women’s Health Study (101), and NSCPT (102) trials provided nosupport for a beneficial effect of β-carotene in the prevention of CVD in contradistinctionto the beneficial effects inferred from observational studies. In fact, taken together, theresults of these trials are troubling because subjects, particularly smokers randomized toβ-carotene supplementation groups, had increased rates of cancer, cardiovascular events,CVD mortality, and overall mortality. In particular, in the ATBC substudy of subjects whohad a previous MI, those randomized to β-carotene supplementation had a 75% signifi-cantly greater risk of CVD mortality compared with placebo (94). Those subjects whoreceived both vitamin E and β-carotene supplementation had a 58% significantly greaterrisk of CVD mortality than those receiving placebo (94). These trials indicate that β-carotene is not the primary component responsible for the lower risks of cancer and CVDassociated with the high intakes of fruits and vegetables. Although one could argue thatβ-carotene should still be tested in other populations, there is little support for efficacy andgood reason for concern for the safety of supplemental β-carotene for the prevention ofcancer and CVD in certain populations, such as smokers.
The serial arterial imaging trials provided important information regarding the effectsof antioxidant supplements on the progression of atherosclerosis . The coronary angio-graphic trials HATS (109) and WAVE (110) showed that cocktails of antioxidantsincluding vitamin E, vitamin C, β-carotene, and Se have no beneficial effect on the pro-gression of established coronary artery atherosclerosis . In fact, in HATS, when antiox-idant therapy was combined with simvastatin-niacin, the coronary angiographic andclinical event benefits of simvastatin-niacin alone were diminished. In terms of the

270 Part III / Cardiovascular Disease Prevention
angiographic endpoint, this adverse interaction between the antioxidant and the sim-vastatin-niacin therapies was significant (p = 0.02). This interaction appeared to be theresult of a significant blunting of the increase in the HDL2 atherosclerosis protectivesubfraction by the antioxidant therapy (109).
In contrast to coronary angiography, which is a measurement endpoint for establishedlate-stage atherosclerosis, B-mode carotid artery ultrasound is used to measure arterialwall thickness, the earliest anatomical manifestation of atherosclerosis (117). Three com-pleted trials, VEAPS (113), SECURE (112), and ASAP (111), showed that vitamin E hasno effect on the progression of subclinical atherosclerosis. In fact, in VEAPS, subjectswho were randomized to vitamin E had a nonsignificant two-fold greater progressionrate of subclinical atherosclerosis than those subjects randomized to placebo. This effectwas seen in men and women. ASAP also showed that vitamin C alone had no effect onthe progression of subclinical atherosclerosis (111). In contrast to the null effects of vit-amin E and C alone, ASAP showed that a combination of vitamin E and vitamin C hada significant effect in reducing the progression of subclinical atherosclerosis (111).However, this effect was limited to males who smoked and had high serum cholesterollevels. Relative to the other groups of subjects in ASAP (nonsmoking men and womenand smoking women), smoking men had low baseline serum vitamin C and E levels.Along with other trial results, such as those from SPACE (106), ASAP indicated thatindividuals who are vitamin deficient may derive anti-atherosclerosis benefits fromantioxidant vitamin supplementation. Although serum vitamin levels were not reportedin SPACE, it is generally believed that chronic dialysis patients have low intracellularvitamin concentrations and experience a much greater level of oxidative stress than mostother populations studied, with the possible exception of smokers.
It remains to be seen whether administration of antioxidant vitamin supplementa-tion in relation to earliest stages of atherosclerosis (perhaps during childhood or youngadulthood) will be effective in reducing progression. By the time atherosclerosis is well-established, it appears that antioxidant vitamin supplementation is ineffective in reducingprogression and clinical coronary events. Animal studies have predominantly demon-strated antioxidants to be effective in preventing atherosclerosis, usually when it is in itsearliest stages. There are very little data indicating that antioxidant vitamin supplemen-tation may be therapeutically effective in treating atherosclerosis once it is established.
Epidemiological studies probably reflect long-term lifestyle behaviors, such as highdietary and supplementary intake of vitamins over many years, perhaps even during theearly formative years of atherosclerosis development. In contrast, the RCTs have investi-gated vitamin intervention for a limited period of time and, in most instances, with popu-lations that already have some degree of atherosclerosis . Although inverse associationswith vitamin intake found in epidemiological studies may have resulted from uncontrolledconfounding, the divergent results of the observational and clinical trial data alternativelysuggest that antioxidant vitamins may have different effects in preventing atherosclerosis,reducing atherosclerosis progression, or affecting the rupture of atherosclerosis plaques.Before final conclusions are reached regarding the effects of antioxidant vitamin supple-ments on CVD, questions raised by the completed randomized trials need to be addressed.
6. ONGOING RANDOMIZED CONTROLLED TRIALS
Several ongoing RCTs are still underway (Table 5). These trials are testing antioxidantvitamin supplements in both primary and secondary prevention of CVD. SU.VI.MAX is

Ong
oing
Ran
dom
ized
, Dou
ble-
Blin
d, P
lace
bo-C
ontr
olle
d Tr
ials
Tes
ting
Ant
ioxi
dant
s A
lone
or
in C
ombi
nati
on W
ith
Oth
er A
gent
s in
the
Pri
mar
y an
d Se
cond
ary
Prev
enti
on o
f C
VD
Tria
lC
ohor
tA
gent
and
dos
age
Pri
mar
y en
d po
int
Prim
ary
prev
entio
n PH
S22
,000
U.S
. mal
esV
itam
in E
(40
0 IU
qod
a)
MI,
str
oke,
and
CV
D m
orta
lity
Vita
min
C (
500
mg/
d)β-
caro
tene
(50
mg
qod)
Mul
tivita
min
(st
anda
rd d
ose)
(fac
tori
al d
esig
n)W
HS
40,0
00 U
.S. w
omen
Vita
min
E (
600
IU q
od)
MI,
str
oke,
and
CV
D m
orta
lity
+ as
piri
n (1
00 m
g qo
d)SU
.VI.
MA
X15
,000
Fre
nch
men
and
wom
enV
itam
in E
(30
IU
/d)
MI,
str
oke,
and
CV
D m
orta
lity
+ β-
caro
tene
(6
mg/
d)
+ vi
tam
in C
(12
0 m
g/d)
+
Se (
100
μg/d
) +
zinc
(20
mg/
d)Se
cond
ary
prev
entio
nW
AC
Sb80
00 U
.S. w
omen
Vita
min
E (
600
IU q
od),
MI,
stro
ke, C
Are
vasc
ular
izat
ion
β-ca
rote
ne (
50 m
g qo
dc ),an
d C
VD
mor
talit
yvi
tam
in C
(50
0 m
g qo
d),
(fac
tori
al d
esig
n)A
rter
ial i
mag
ing
FAT
S60
men
with
CA
DV
itam
in E
(40
0 IU
BID
) Pr
ogre
ssio
n of
CA
D b
y +
vita
min
C (
500
mg
BID
) qu
antit
ativ
e co
rona
ry+
β-ca
rote
ne (
12.5
mg
BID
) an
giog
raph
y+
Se (
50 μ
g B
ID)
+ tr
iple
lipi
d-lo
wer
ing
med
icat
ion
SMA
RT
FED
150
men
and
wom
en w
ith d
iabe
tes
Vita
min
E (
400
IU/d
)Pr
ogre
ssio
n of
CA
D b
y an
d dy
slip
idem
iaqu
antit
ativ
e co
rona
ry a
ngio
grap
hyM
CB
IT60
0 m
en a
nd w
omen
with
CA
Vita
min
E (
800
IU/d
) Pr
ogre
ssio
n of
CA
D b
yby
pass
sur
gery
+ lo
vast
atin
(±L
DL
-phe
resi
s)qu
antit
ativ
e co
rona
ry a
ngio
grap
hyaqo
d =
ever
y ot
her
day.
bPr
ior
CV
D o
r th
ree
or m
ore
coro
nary
ris
k fa
ctor
s.c β-
caro
tene
was
rep
lace
d w
ith f
olat
e.PH
S,Ph
ysic
ians
’H
ealth
Stu
dy;
WH
S, W
omen
’s H
ealth
Stu
dy;
SU.V
I.M
AX
, Su
pple
men
tatio
n en
Vita
min
es e
t M
iner
aux
Ant
ioxi
dant
s tr
ial;
WA
CS,
Wom
en’s
Ant
ioxi
dant
Car
diov
ascu
lar
Stud
y; F
AT
S, F
amili
al A
ther
oscl
eros
is T
reat
men
t Stu
dy—
Lon
g-Te
rm F
ollo
w-U
p; S
MA
RT
FED
, St.
Mic
hael
’s A
ther
oscl
eros
is R
egre
ssio
nT
rial
with
Fen
ofib
rate
and
Vita
min
E in
Dia
betic
s; M
CB
IT, M
unic
h C
oron
ary
Byp
ass
Inte
rven
tion
Tri
al.
271

272 Part III / Cardiovascular Disease Prevention
a large primary prevention trial that will hopefully provide important information aboutthis population (118). More secondary prevention trials have been conducted than pri-mary prevention trials; therefore, more data are needed in this latter population.
7. RECOMMENDATIONS
Although observational data suggest that antioxidant vitamins may reduce CVD riskand basic research provides plausible mechanisms for such an effect, these data havenot been substantiated by completed RCTs. Additionally, results from these completedRCTs raise a level of concern for the safety of certain antioxidant vitamin supplemen-tation among certain subgroups. In the final analysis, current data do not support the useof antioxidant vitamin supplements for the prevention or treatment of CVD (119).Guidelines for the use of antioxidant vitamin supplements for the prevention or treat-ment of CVD will have to await the results of ongoing RCTs and assessment of theeffects of antioxidant vitamins in certain populations, such as those with low serum vit-amin levels and those with chronic disease states that may take a toll on the body’santioxidant capacity (e.g., diabetics and other special populations).
A conclusion that is emerging, but clearly not fixed, at this point is that supplemen-tation with specific antioxidant vitamins does not prevent development of CVD in agenerally healthy population. However, special populations may represent a type ofdeficiency whose basis is a disease state that creates an excess oxidant burden. Undersuch circumstances, vitamin E or other specific antioxidants may provide a significantmargin of protection. Based on the understanding of these limitations, current and futuretrials may be able to identify at-risk populations that can benefit from antioxidant vita-min supplementation. The recent paper on the European perspective on vitamin Eregarding our current level of knowledge emphasized the importance of considering thenonantioxidant functions of vitamin E (120). Novel mechanisms for the antiatheroscle-rotic properties of vitamin E—which involve modulation of cellular signaling, tran-scriptional regulation, induction of apoptosis and interaction regulatory pathwaysinvolved in drug metabolism—were used as examples to suggest that inconclusive ortroubling findings from clinical trials may reflect potentially disturbing effects of vita-min E when inappropriately applied to a healthy population. Regardless of the resultsof these trials, however, consumption of fruits and vegetables high in antioxidant vita-mins appears to be an important component of a healthy dietary intake and lifestyle.
REFERENCES1. Steinberg D, Parthasarathy S, Carew TE, Khoo JD, Witztum JL. Beyond cholesterol: modifications
of low density lipoproteins that increase its atherogenicity. N Engl J Med 1989; 320:915–924.2. Rong JX, Rangaswamy S, Shen L, et al. Arterial injury by cholesterol oxidation products causes
endothelial dysfunction and arterial wall cholesterol accumulation. Arterioscl Thromb Vasc Biol1998; 18:1885–1894.
3. Bjorkhem I, Henriksson-Freyschuss A, Breuer O, Diczfalusy U, Berglund L, Henriksson P. Theantioxidant butylated hydroxytoluene protects against atherosclerosis. Arterioscl Thromb 1991;11:15–22.
4. Hodis HN, Chauhan A, Hashimoto S, Crawford DW, Sevanian A. Probucol reduces plasma and aor-tic wall oxysterol levels in cholesterol fed rabbits independently of its plasma cholesterol loweringeffect. Atherosclerosis 1992; 96:125–134.
5. Stringer MD, Görög PG, Freeman A, Kakkar VV. Lipid peroxides and atherosclerosis. Br Med J1989; 298:281–284.

Chapter 10 / Antioxidants and CVD 273
6. Hodis HN, Mack WJ, LaBree L, et al. Serial coronary angiographic evidence that antioxidant vita-min intake reduces progression of coronary artery atherosclerosis. JAMA 1995; 273:1849–1854.
7. Azen SP, Qian D, Mack WJ, et al. Effect of supplementary antioxidant vitamin intake on carotid arte-rial wall intima-media thickness in a controlled clinical trial of cholesterol lowering. Circulation1996; 94:2369–2372.
8. Davies KJA, Weise AG, Sevanian A, Kim E. Repair systems in oxidative stress. In: Valentine J, ed.Molecular Biology of Aging, UCLA Symposium on Molecular and Cellular Biology. Alan R. Liss,New York, 1990, pp. 123–141.
9. Sevanian A, Hodis HN. Antioxidants and atherosclerosis: an overview. BioFactors 1997; 6:385–390.10. Brunmark A, Cadenas E. Redox and addition chemistry of quinoid compounds and its biological
implications. Free Rad Biol Med 1989; 7:435–477.11. Boveris A, Cadenas E. Production of Superoxide Radicals and Hydrogen Peroxide in Mitochondria.
In: Oberley LW, ed. Superoxide Dismutase, Vol. II. CRC, Boca Raton, 1982, pp. 16–28.12. Harrison D, Griendling KK, Landmesser U, Hornig B, Drexler H. Role of oxidative stress in ather-
osclerosis. Am J Cardiol 2003; 91:7A–11A.13. Sevanian A, Nordenbrand K, Kim E, Ernster L, Hochstein P. Microsomal lipid peroxidation: the role
of NADPH-cytochrome P-450 reductase and cytochrome P-450. Free Rad Biol Med 1990;8:145–152.
14. Schewe T, Kuhn H. Do 15-lipoxygenases have a common biological role? Trends Biochem Sci 1991;16:369–373.
15. de Silva DM, Aust SD. Ferritin and ceruloplasmin in oxidative damage: review and recent findings.Can J Physiol Pharmacol 1993; 71:84,322–84,705.
16. Ehrenwald E, Chisholm GM, Fox PL. Intact human ceruloplasmin oxidatively modifies low densitylipoprotein. J Clin Invest 1994; 93:1493–1501.
17. Patel RP, Svistunenko DA, Darley-Usmar VM, Symons MCR, Wilson MT. Redox cycling of humanmethaemoglobin by H2O2 yields persistent ferryl iron and protein based radicals. Free Rad Res1996; 25:117–123.
18. Hogg N, Kalyanaraman B. Nitric oxide and lipid peroxidation. Biochim Biophys Acta 1999;1411:378–384.
19. Rodriguez JA, Grau A, Eguinoa E, et al. Dietary supplementation with vitamins C and E preventsdownregulation of endothelial NOS expression in hypercholesterolemia in vivo and in vitro.Atherosclerosis 2002;165:33–40.
20. Chow CK, Hong CB. Dietary vitamin E and selenium and toxicity of nitrite and nitrate. Toxicology2002; 180:195–207.
21. Esterbauer H, Gebicki J, Puhl H, Jurgens G. The role of lipid peroxidation and antioxidants in oxida-tive modification of LDL. Free Rad Biol Med 1992; 13:341–390.
22. Steinbrecher UP. Oxidation of human low density lipoprotein results in derivatization of lysineresidues of apolipoprotein B by lipid peroxide decomposition products. J Biol Chem 1987;262:3603–3608.
23. Goldstein JL, Ho YK, Basu SK, Brown MS. Binding site on macrophages mediates uptake anddegradation of acetylated LDL producing massive cholesterol deposition. Proc Natl Acad Sci 1979;76:333–337.
24. Haberland ME, Fogelman AM, Edwards PA. Specificity of receptor mediated recognition of malon-dialdehyde modified low density lipoproteins. Proc Natl Acad Sci 1982; 79:1712–1716.
25. Keidar S, Rosenblat M, Fuhrman B, Dankner G, Aviram M. Involvement of the macrophage LDLreceptor-binding domains in the uptake of oxidized LDL. Arterioscl Thromb 1992; 12:484–493.
26. Hoff HF, Whitaker TE, O’Neil J. Oxidation of low density lipoprotein leads to particle aggregationand altered macrophage recognition. J Biol Chem 1992; 267:602–609.
27. Fruebis J, Parthasarathy S, Steinberg D. Evidence for a concerted reaction between lipid hydroper-oxides and polypeptides. Proc Natl Acad Sci 1992; 89:10,588–10,592.
28. Hodis HN, Kramsch DM, Avogaro P, Bittolo-Bon G, Cazzolato G, Hwang J, Peterson H, SevanianA. Biochemical and cytotoxic characteristics of in-vivo circulating oxidized low density lipoprotein(LDL−). J Lipid Res 1994; 35:669–677.
29. Hessler JR, Morel DW, Lewis LJ, Chisolm GM. Lipoprotein oxidation and lipoprotein-induced cyto-toxicity. Arteriosclerosis 1983; 3:215–222.
30. Berliner JA, Heinecke JW. The role of oxidized lipoproteins in atherogenesis. Free Rad Biol Med1996; 20:707–727.

274 Part III / Cardiovascular Disease Prevention
31. Quinn MT, Parthasarathy S, Fong LG, Steinberg D. Oxidatively modified LDL: a potential role inrecruitment and retention of monocyte/macrophages during atherogenesis. Proc Natl Acad Sci 1987;84:2995–2998.
32. Berliner JA, Territo MC, Sevanian A, Ramin S, Kim JA, Esterson M, Fogelman AM. Minimallymodified LDL stimulates monocyte endothelial interactions. J Clin Invest 1990; 85:1260–1266.
33. Parthasarathy S, Young SG, Witstum JL, Pittman RC, Steinberg D. Probucol inhibits oxidative mod-ification of low-density lipoprotein. J Clin Invest 1986; 77:641–644.
34. Suzuki YJ, Forman HJ, Sevanian A. Reactive oxygen species as stimulators of signal transduction.Free RadBiol Med 1996; 22:269–285.
35. Ricciarelli R, Tasinato A, Clement S, Ozer NK, Boscoboinik D, Azzi A. Alpha-tocopherol specifi-cally inactivates cellular protein kinase C alpha by changing its phosphorylation state. Biochem J1998; 334:243–249.
36. Ozer NK, Sirikci O, Taha S, San T, Moser U, Azzi A. Effect of vitamin E and probucol on dietarycholesterol-induced atherosclerosis in rabbits. Free Rad Biol Med 1998; 24:226–233.
37. Kunjathoor VV, Febbraio M, Podrez EA, et al. Scavenger receptors class A-I/II and CD36 are theprincipal receptors responsible for the uptake of modified low density lipoprotein leading to lipidloading in macrophages. J Biol Chem 2002; 277:49,982–49,988.
38. Janabi M, Yamashita S, Hirano K, et al. Oxidized LDL-induced NF-kappa B activation and subse-quent expression of proinflammatory genes are defective in monocyte-derived macrophages fromCD36-deficient patients. Arterioscler Thromb Vasc Biol 2000; 20:1953–1960.
39. Nicholson AC, Han J, Febbraio M, Silversterin RL, Hajjar DP. Role of CD36, the macrophage classB scavenger receptor, in atherosclerosis. Ann NY Acad Sci 2001; 947:224–228.
40. Acheson RM, Williams DRR. Does consumption of fruit and vegetables protect against stroke?Lancet 1993; 1:1191–1193.
41. Armstrong BK, Mann JI, Adelstein Am, Eskin F. Commodity consumption and ischemic heart dis-ease mortality, with special reference to dietary practices. J Chron Dis 1975; 28:455–469.
42. Verlangieri AJ, Kapeghian JC, el-Dean S, Bush M. Fruit and vegetable consumption and cardiovas-cular mortality. Med Hypoth 1985; 16:7–15.
43. Ginter E. Decline in coronary mortality in United States and vitamin C. Am J Clin Nutr 1979;32:511–512.
44. Stampfer MJ, Hennekens CH, Manson JE, Colditz GA, Rosner B, Willett WC. Vitamin E consump-tion and the risk of coronary disease in women. N Engl J Med 1993; 328:1444–1449.
45. Rimm EB, Stampfer MJ, Ascherio A, Giovannucci E, Colditz, GA, Willett WC. Vitamin E con-sumption and the risk of coronary heart disease in man. N Engl J Med 1993; 328:1450–1456.
46. Kushi LH, Folsom AR, Prineas RJ, Mink PJ, Wu Y, Bostick RM. Dietary antioxidant vitamins anddeath from coronary heart disease in postmenopausal women. N Engl J Med 1996; 334:1156–1162.
47. Knekt P, Reunanen A, Jarvinen R, Seppanen R, Heliovaara M, Aromaa A. Antioxidant vitaminintake and coronary mortality in a longitudinal population study. Am J Epidemiol 1994;139:1180–1189.
48. Losonczy KG, Harris TB, Havlik RJ. Vitamin E and vitamin C supplement use and risk of all-causeand coronary heart disease mortality in older persons: the Established Populations for EpidemiologicStudies of the Elderly. Am J Clin Nutr 1996; 64:190–196.
49. Manson JE, Stampfer MJ, Willett WC, et al. A prospective study of vitamin C and incidence of coro-nary heart disease in women. Circulation 1992; 85[abs]:865.
50. Enstrom JE, Kanim LE, Breslow L. The relationship between vitamin C intake, general health prac-tices, and mortality in Alameda County, California. Am J Public Health 1986; 76:1124–1130.
51. Pandey DK, Shekelle R, Selwyn BJ, Tangney C, Stamler J. Dietary vitamin C and B-carotene andrisk of death in middle-aged men. Am J Epidemiol 1995; 142:1269–1278.
52. Lapidus L, Anderson H, Bengtsson C, Bosaeus I. Dietary habits in relation to incidence of cardio-vascular disease and death in women: a 12-year follow-up of participants in the population study ofwomen in Gothenburg, Sweden. Am J Clin Nutr 1986; 44:444–448.
53. Gale CR, Martyn CN, Winter PD, Cooper C. Vitamin C and risk of death from stroke and coronaryheart disease in cohort of elderly people. Br Med J 1995; 310:1563–1566.
54. Enstrom JE, Kanim LE, Klein MA. Vitamin C intake and mortality among a sample of the UnitedStates population. Epidemiology 1992; 3:194–202.

Chapter 10 / Antioxidants and CVD 275
55. Gaziano JM, Manson JE, Branch LG, Colditz GA, Willett WC, Buring JE. A prospective study ofconsumption of carotenoids in fruits and vegetables and decreased cardiovascular mortality in theelderly. Ann Epidemiol 1995; 5:255–260.
56. Manson JE, Stampfer MJ, Willett WC, et al. A prospective study of antioxidant vitamins and inci-dence of coronary heart disease in women. Circulation 1991; 84[abs]:II–546.
57. Gey KF, Puska P, Jordan P, Moser U. Inverse correlation between plasma vitamin E and mortal-ity from ischemic heart disease in cross-cultural epidemiology. Am J Clin Nutr 1991;53:326S–334S.
58. Gey KF, Brubacher GB, Stahelin HB. Plasma levels of antioxidant vitamins in relation to ischemicheart disease and cancer. Am J Clin Nutr 1987; 45:1368–1377.
59. Riemersma RA, Oliver M, Elton RA, et al. Plasma antioxidants and coronary heart disease: vitaminsC and E, and selenium. Eur J Clin Nutr 1990; 44:143–150.
60. Singh RB, Ghosh S, Niaz MA,. Dietary intake, plasma levels of antioxidant vitamins, and oxidativestress in relation to coronary artery disease in elderly subjects. Am J Cardiol 1995; 76:1233–1238.
61. Simon JA, Hudes ES, Browner WS. Serum ascorbic acid and cardiovascular disease prevalence inU.S. adults. Epidemiology 1998; 9:316–321.
62. Kok FJ, de Bruijn AM, Vermeeren R, et al. Serum selenium, vitamin antioxidants, and cardiovascu-lar mortality: a 9-year follow-up study in the Netherlands. Am J Clin Nutr 1987; 45:462–468.
63. Salonen JT, Salonen R, Penttil_ I, et al. Serum fatty acids, apolipoproteins, selenium and vitaminantioxidants and the risk of death from coronary heart disease. Am J Cardiol 1985; 56:226–231.
64. Street DA, Comstock GW, Salkeld RM, Schuep W, Klag MJ. Serum antioxidants and myocardialinfarction: are low levels of carotenoids and α-tocopherol risk factors for myocardial infarction?Circulation 1994; 90:1154–1161.
65. Riemersma RA, Wood DA, Macintyre CCA, Elton RA, Gey KF, Oliver MF. Risk of angina pectorisand plasma concentrations of vitamins A, C, E, and carotene. Lancet 1991; 337:1–5.
66. Gey KF, Stahelin HB, Eichholzer M. Poor plasma status of carotene and vitamin C is associated withhigher mortality from ischemic heart disease and stroke: Basel Prospective Study. Clin Invest 1993;71:3–6.
67. Morris DL, Kritchevsky SB, Davis CE. Serum carotenoids and coronary heart disease: the Lipid ResearchClinics Coronary Primary Prevention Trial and Follow-up Study. JAMA 1994; 272:1439–1441.
68. Nyyssonen K, Parviainen MT, Solonen R, Toumilehto J, Salonen JT. Vitamin C deficiency and riskof myocardial infarction: prospective population study of men from eastern Finland. Br Med J 1997;314:634–638.
69. Ramirez J, Flowers NC. Leukocyte ascorbic acid and its relationship to coronary artery disease inman. Am J Clin Nutr 1980; 33:2079–2087.
70. Kok FJ, van Poppel G, Melse J, et al. Do antioxidants and polyunsaturated fatty acids have a com-bined association with coronary atherosclerosis? Atherosclerosis 1991; 31:85–90.
71. Halevy D, Thiery J, Nagel D, et al. Increased oxidation of LDL in patients with coronary artery disease is independent from dietary vitamins E and C. Arterioscl Thromb Vasc Biol 1997;17:1432–1437.
72. Iribarren C, Folsom AR, Jacobs DR, Gross MD, Belcher JD, Eckfeldt JH. Association of serum vit-amin levels, LDL susceptibility to oxidation, and autoantibodies against MDA-LDL with carotid ath-erosclerosis: a case control study. Arterioscl Thromb Vasc Biol 1997; 17:1171–1177.
73. Bonithon-Kopp C, Coudray C, Berr C, et al. Combined effects of lipid peroxidation and antioxidantstatus on carotid atherosclerosis in a population aged 59-71 y: the EVA Study. Am J Clin Nutr 1997;65:121–127.
74. Salonen JT, Myyss_nen K, Parviainen M, Kantola M, Korpela H, Salonen R. Low plasma beta-carotene, vitamin E and selenium levels associate with accelerated carotid atherogenesis in hyperc-holesterolemic eastern Finnish men. Circulation 1993; 87[abs]:678.
75. Rapola JM, Virtamo J, Haukka JK, et al. Effect of vitamin E and beta carotene on the incidence ofangina pectoris: a randomized, double-blind, controlled trial. JAMA 1996; 275:693–698.
76. Gillilan RE, Mondell B, Warbasse JR. Quantitative evaluation of vitamin E in the treatment ofangina pectoris. Am Heart J 1977; 93:444–449.
77. Anderson TW, Reid DBW. A double-blind trial of vitamin E in angina pectoris. Am J Clin Nutr 1974;27:1174–1178.

276 Part III / Cardiovascular Disease Prevention
78. Blankenhorn DH, Nessim SA, Johnson RL, Sanmarco ME, Azen SP, Cashin-Hemphill L. Beneficialeffects of combined colestipol-niacin therapy on coronary atherosclerosis and coronary venousbypass grafts. JAMA 1987; 257:3233–3240.
79. Cashin-Hemphill L, Mack WJ, Pogoda J, Sanmarco ME, Azen SP, Blankenhorn DH, and the CLASStudy Group. Beneficial effects of colestipol-niacin on coronary atherosclerosis: a 4-year follow-up.JAMA 1990; 264:3013–3017.
80. Blankenhorn DH, Selzer RH, Crawford DW, et al. Beneficial effects of colestipol-niacin therapy onthe common carotid artery: two- and four-year reduction of intima-media thickness measured byultrasound. Circulation 1993; 88:20–28.
81. Mack WJ, Selzer RH, Hodis HN, et al. One-year ultrasound detection of significant reduction incarotid intimal-medial thickness associated with colestipol/niacin therapy. Stroke 1993;24:1779–1783.
82. Blankenhorn DH, Azen SP, Crawford DW, et al. Effects of colestipol-niacin therapy on humanfemoral atherosclerosis. Circulation 1991; 83:438–447.
83. Blankenhorn DH, Johnson RL, Nessim SA, Azen SP, Sanmarco ME, Selzer RH. The CholesterolLowering Atherosclerosis Study (CLAS): design, methods, and baseline results. Controlled ClinTrials 1987; 8:354–387.
84. Azen SP, Mack W, Cashin-Hemphill L, et al. Progression of coronary artery disease predicts clini-cal coronary events: long-term follow-up from the Cholesterol Lowering Atherosclerosis Study.Circulation 1996; 93:34–41.
85. DeMaio SJ, King SB III, Lembo NJ, et al. Vitamin E supplementation, plasma lipids and incidenceof restenosis after percutaneous transluminal coronary angioplasty (PTCA). J Am Coll Nutr 1992;11:68–73.
86. Tardif JC, Cote G, Lesperance J, et al. Probucol and multivitamins in the prevention of restenosisafter coronary angioplasty. N Engl J Med 1997; 337:365–372.
87. Yokoi H, Daida H, Kuwabara Y, et al. Effectiveness of an antioxidant in preventing restenosis afterpercutaneous transluminal coronary angioplasty: the Probucol Angioplasty Restenosis Trial. J AmColl Cardiol 1997; 30:855–862.
88. Pignoli P, Tremoli E, Poli A, Oreste P, Paoletti R. Intimal plus medial thickness of the arterial wall:a direct measurement with ultrasound imaging. Circulation 1986; 74:1399–1406.
89. Mack WJ, LaBree L, Liu CR, Liu CH, Selzer RH, Hodis HN. Correlations between measures of ath-erosclerosis change using carotid ultrasonography and coronary angiography. Atherosclerosis 2000;371–379.
90. Hodis HN, Mack WJ, LaBree L, et al. The role of carotid arterial intima-media thickness in predict-ing clinical coronary events. Ann Intern Med 1998; 262–269.
91. Selzer RH, Hodis HN, Kwong-Fu Helenann, et al. Evaluation of computerized edge tracking forquantifying intima-media thickness of the common carotid artery from B-mode ultrasound images.Atherosclerosis 1994; 111:1–11.
92. Kritchevsky SB, Shimakawa T, Tell GS, et al. Dietary antioxidants and carotid artery wall thickness:the ARIC Study. Circulation 1995; 92:2142–2150.
93. The Alpha-Tocopherol, Beta Carotene Cancer Prevention Study Group. The effect of vitamin E andbeta carotene on the incidence of lung cancer and other cancers in male smokers. N Engl J Med1994; 330:1029–1035.
94. Rapola J, Virtamo J, Ripatti S, et al. Randomised trial of α-tocopherol and β-carotene supplementson incidence of major coronary events in men with previous myocardial infarction. Lancet 1997;349:1715–1720.
95. Virtamo J, Rapola JM, Ripatti S, et al. Effect of vitamin E and beta carotene on the incidence of pri-mary nonfatal myocardial infarction and fatal coronary heart disease. Arch Intern Med 1998;158:668–675.
96. Blot WJ, Li JY, Taylor PR, et al. Nutrition intervention trials in Linxian, China: supplementationwith specific vitamin/mineral combinations, cancer incidence, and disease-specific mortality in thegeneral population. J Natl Cancer Inst 1993; 85:1483–1492.
97. Wilson TS, Datta SB, Murrell JS, Andrews CT. Relation of vitamin C levels to mortality in a geri-atric hospital: a study of the effect of vitamin C administration. Age Ageing 1973; 2:163–171.
98. Omenn GS, Goodman GE, Thornquist MD, et al. Effects of a combination of beta carotene and vit-amin A on lung cancer and cardiovascular disease. N Engl J Med 1996; 334:1150–1155.

Chapter 10 / Antioxidants and CVD 277
99. Greenberg ER, Baron JA, Karagas MR, et al. Mortality associated with low plasma concentration ofbeta carotene and the effect of oral supplementation. JAMA 1996; 275:699–703.
100. Hennekens CH, Buring JE, Manson JE, et al. Lack of effect of long-term supplementation with betacarotene on the incidence of malignant neoplasms and cardiovascular disease. N Engl J Med 1996;334:1145–1149.
101. Lee I, Cook NR, Manson JE, Buring JE, Hennekens CH. β-carotene supplementation and incidence ofcancer and cardiovascular disease: the Womens’ Health Study. J Natl Cancer Inst 1999; 91:2102–2106.
102. Green A, Williams G, Neale R, et al. Daily sunscreen application and beta-carotene supplementationin prevention of basal-cell and squamous-cell carcinomas of the skin: a randomized controlled trial.Lancet 1999; 354:723–729.
103. Stephens NG, Parsons A, Schofield PM, et al. Randomised controlled trial of vitamin E in patientswith coronary disease: Cambridge Heart Antioxidant Study (CHAOS). Lancet 1996; 347:781–786.
104. Dietary supplementation with n-3 polyunsaturated fatty acids and vitamin E after myocardial infarc-tion: results of the GISSI Prevenzione trial. Lancet 1999; 354:447–455.
105. The Heart Outcomes Prevention Evaluation Study Investigators. Vitamin E supplementation and car-diovascular events in high-risk patients. N Engl J Med 2000; 342:154–160.
106. Boaz M, Smetana S, Weinstein T, et al. Secondary prevention with antioxidants of cardiovasculardisease in endstage renal disease (SPACE): randomized placebo-controlled trial. Lancet 2000;356:1213–1218.
107. MRC/BHF Heart Protection Study of antioxidant vitamin supplementation in 20,536 high-risk indi-viduals: a randomized placebo-controlled trial. Lancet 2002; 360:23–33.
108. Collaborative Group of the Primary Prevention Project (PPP). Low-dose aspirin and vitamin E inpeople at cardiovascular risk: a randomized trial in general practice. Lancet 2001; 357:89–95.
109. Brown BG, Zhao XQ, Chait A, et al. Simvastatin and niacin, antioxidant vitamins, or the combina-tion for the prevention of coronary disease. N Engl J Med 2001; 345:1583–1592.
110. Waters DD, Alderman EL, Hsia J, et al. Effects of hormone replacement therapy and antioxidant vit-amin supplements on coronary atherosclerosis in postmenopausal women: a randomized controlledtrial. JAMA 2002; 288:2432–2440.
111. Salonen JT, Nyyssonen K, Salonen R, et al. Antioxidant supplementation in atherosclerosis preven-tion (ASAP) study: a randomized trial of the effect of vitamins E and C on 3-year progression ofcarotid atherosclerosis. J Intern Med 2000; 248:377–386.
112. Lonn EM, Yusuf S, Dzavik V, et al. Effects of Ramipril and vitamin E on atherosclerosis: the studyto evaluate carotid ultrsound changes in patients treated with Ramipril and vitamin E (SECURE).Circulation 2001; 103:919–925.
113. Hodis HN, Mack WJ, LaBree L, et al. Alpha-tocopherol supplementation in healthy individualsreduces low-density lipoprotein oxidation but not atherosclerosis: the Vitamin E AtherosclerosisPrevention Study (VEAPS). Circulation 2002; 106:1453–1459.
114. Steering Committee of the Physicians’ Health Study Research Group. Final report on the aspirincomponent of the ongoing Physicians’ Health Study. N Engl J Med 1989; 321:129–135.
115. The Heart Outcomes Prevention Evaluation Study Investigators. Effects of an angiotensin-convertingenzyme inhibitor, ramipril, on cardiovascular events in high-risk patients. N Engl J Med 2000; 342:145–153.
116. Heart Protection Study Collaborative Group. MRC/BHF Heart Protection Study of cholesterol low-ering with simvastatin in 20,536 high-risk individuals: a randomized placebo-controlled trial. Lancet2002; 360:7–21.
117. Blankenhorn DH, Hodis HN. Arterial imaging and atherosclerosis reversal. Arterioscler Thromb1994; 14:177–192.
118. Hercberg S, Preziosi P, Briancon S, et al. A primary prevention trial using nutritional doses of antiox-idant vitamins and minerals in cardiovascular diseases and cancers in a general population: theSU.VI.MAX study-design, methods, and participant characteristics. Control Clin Trials 1998;19:336–351.
119. Tribble DL. Antioxidant consumption and risk of coronary heart disease: emphasis on vitamin C, vitamin E, and β-carotene: a statement for healthcare professionals from the American HeartAssociation. Circulation 1992; 99:591–595.
120. Brigelius-Flohe R, Kelly FJ, Salonen JT, Neuzil J, Zingg JM, Azzi A. The European perspective onvitamin E: current knowledge and future research. Am J Clin Nutr 2002; 6:703–716.


From: Preventive Nutrition: The Comprehensive Guide for Health Professionals, Third EditionEdited by: A. Bendich and R. J. Deckelbaum © Humana Press Inc., Totowa, NJ
279
11 Health Effects of Trans Fatty Acids
Ronald P. Mensinkand Susanne H. F. Vermunt
KEY POINTS
● Trans fatty acids are found in hydrogenated fats and in fats from ruminants.● The intake of trans fatty acids is declining in the United States and is approx 2% of
energy.● Tissue levels of trans fatty acids reflect dietary intakes.● Trans fatty acids have an adverse effect on the serum lipoprotein profile.● Epidemiological studies suggest a positive relationship between the intake of trans fatty
acids and cardiovascular risk.● There is no strong evidence that trans fatty acids increase cancer risk.● Keep the intake of trans fatty acids as low as possible.
1. INTRODUCTION
The position of the double bond in the carbon chain of a fatty acid is indicated inseveral ways. When counted from the carboxyl end (–COOH) of the molecule, theposition (x) is denoted by the ‘Δ–x’ nomenclature, whereas the ‘n-x’ classification isused when counting starts from the methyl end (–CH3). Thus, ‘n-3’ means that the dou-ble bond is located at the third carbon atom from the methyl end. These double bondscan have either the cis or the trans configuration. Cis means that the two carbon atomsadjacent to the double bond point in the same direction, whereas in the trans configu-ration, the two carbon atoms are located at opposite sides of the double bond. As anexample, α-linolenic acid (C18:3 n-3), which belongs to the n-3 family, and one of itstrans-isomers (C18:3n-3 Δ–9c, 12c, 15tr) are shown in Fig. 1. These two molecules areso-called “geometrical isomers.”
Trans fatty acids in the diet are derived from several sources. First, they are formed,to small extents, from polyunsaturated fatty acids (PUFAs) by bacteria in the first stomach(rumen) of ruminant animals.

280 Part III / Cardiovascular Disease Prevention
Second, trans fatty acids are produced by industrial hydrogenation and deodorizationof vegetable oils. Hydrogenation is used to change the chemical, physical, and sensorycharacteristics of a vegetable oil to make the oil suitable for the production of foodssuch as margarines, shortenings, and biscuits. When all double bonds are hydrogenated,a saturated fatty acid is formed. However, the cis double bond may also isomerize intoa trans double bond without net uptake of hydrogen. Furthermore, double bonds canmigrate along the molecule, which results in the formation of positional isomers.Therefore, through hydrogenation, many different molecules can be formed (Fig. 2),although trans monounsaturated fatty acids are the most prevailing molecules.
Trans PUFAs—in particular those from α-linolenic acid—can be produced duringdeodorization, the last step of the refining process of vegetable oils. Finally, heatingand frying of oils at high temperatures may also result in the formation of transpolyunsaturated bonds.
Fig. 1. Chemical structure of all-cis C18:3 n-3, and 9-cis, 12-cis, 15-trans C18:3 n-3(C18:3 n-3 Δ9c, 12c, 15tr).
Fig. 2. Potential conversions of linoleic acid into its positional and geometrical isomers.

Chapter 11 / Trans Fatty Acids 281
The beneficial effects of cis fatty acids on health differ from those of trans fattyacids. This chapter discusses the effects of trans fatty acids on various risk parametersfor coronary heart disease (CHD), such as lipids and lipoproteins, low-density lipopro-tein (LDL) oxidation, and hemostasis, and the effects of trans fatty acids on risks forcancer. The metabolism of trans fatty acids and their effects on the desaturation andelongation of other fatty acids is also addressed.
2. TRANS FATTY ACIDS IN FOODS
Trans fatty acids in margarines and dairy products are mainly found in triacylglyc-erols; in meat, trans fatty acids are found in phospholipids. Recent calculations suggestthat the intake of trans fatty acids in the United States is declining. From 1980 to 1982,it was estimated that daily intakes of trans fatty acids were 3.0 and 2.8% of energy (8.4and 5.4 g) in men and in women, respectively. During 1995–1997, these values were2.2% for both men and women (6.4 and 4.7 g, respectively) (1). For comparison, theintakes of saturated and monounsaturated fatty acids in 1995–1997 were about 11 to12%. In Europe, the daily total trans fatty acid intake varied between 0.5% of energy inItaly to 2% of energy in Iceland (2). Major contributors to total trans fatty acid intake arefried foods and snacks, stick margarines, baked goods, and, to a minor extent, dairy prod-ucts. About 85% of all trans fatty acids in the diet are trans monounsaturated fatty acids,mostly C18:1 trans. When derived from ruminant fats, the double bond is mainly at theΔ−11 position (C18:1 Δ−11 trans or vaccenic acid). This is because these trans-isomersare formed through the specific action of bacteria in the rumen. In industrially hydro-genated oils, trans-isomers are formed chemically and, therefore, the double bond variesmore or less randomly between positions Δ−8 and −13. The remaining 15% of trans fattyacid intake is provided primarily by mono-trans-isomers of linoleic and α-linolenic acid; afew di-trans-isomers also are present.
3. METABOLISM
3.1. Digestion, Absorption, and Incorporation into Blood LipidsThe metabolic pathways of trans fatty acids after intake are shown in Fig. 3. After
ingestion, triacylglycerols are hydrolyzed by pancreatic lipase into free fatty acids,sn2-monoglycerides, and, to a small extent, diglycerides. Phospholipids are split bypancreatic phospholipases, which remove the fatty acid from the sn1 or sn2 position. Asa result, lysophospholipids and free fatty acids are formed.
The breakdown products of triacylglycerol and phospholipids are incorporatedinto micelles and absorbed by the enterocyte. Hydrolysis and absorption of oleic acidand its positional and geometrical isomers are comparable. Within the enterocyte,the free fatty acids are used for the formation of triacylglycerols, cholesteryl esters,and phospholipids. After esterification, lipids are used for the formation of chylomi-crons, which transport the fatty acids through the lymph to the liver. In the liver, fattyacids can be incorporated into very low-density lipoproteins (VLDLs). The incorpo-ration of trans-isomers of C18:1 Δ−9 into VLDL, but also into other lipoproteins likeLDL and high-density lipoproteins (HDLs), is lower than that of C18:1 Δ−9c. As anyother fatty acid, trans fatty acids are also incorporated into tissue phospholipids,stored in adipose tissue, desaturated and elongated into longer chain PUFAs, andoxidized (3–7).

282 Part III / Cardiovascular Disease Prevention
3.2. Tissue LevelsAs trans fatty acids are not made by humans, tissue levels reflect dietary intakes. The
trans fatty acid content of adipose tissue for US subjects is about 4% of total fatty acids(8). Approximately 70% of the trans fatty acids are C18:1 isomers with double bondsat the Δ−8, −9, −10, −11, −12, or −13 positions. Trans C16:1 isomers, which originatemainly from dairy fat, are also found in adipose tissue. About 20% of the trans isomersare trans C18:2 isomers. Both mono–(Δ−9c, 12t, and Δ−9t, 12c) and di-trans (Δ−9t, 12t)C18:2 isomers and several trans C18:3 isomers have been detected in adipose tissue.Trans C18:1 and C18:2 fatty acids have been found in human kidney, brain, heart, liver,aorta, and jejunum as well ashuman milk (9), and trans C18:3 has been detected inplatelets and human milk (10,11).
3.3. ConversionHuman liver microsomal complexes contain three different desaturation enzymes:
Δ−9, −6, and −5 desaturases, which insert double bonds at the Δ−9, −6, or −5 positionof the fatty acid molecule, respectively. Furthermore, fatty acids can be elongated byaddition of a two-carbon unit. In this way, stearic acid, linoleic acid, and α-linolenicacid are converted into their longer chain metabolites (Fig. 4), which play an important
Fig. 3. Simplified scheme of trans fatty acid metabolism in humans. TG, triacylglyc-erols; PL, phospholipids; CE, cholesteryl esters; LC-PUFA, long-chain polyunsaturatedfatty acids.

Chapter 11 / Trans Fatty Acids 283
role in many physiological processes. Because chain elongation and desaturationalways occur at the carboxyl end of the fatty acid molecule, the position of the first dou-ble bond at the methyl end will not change during conversion reactions.
Trans fatty acids are desaturated by the same enzymes as cis fatty acids. With theexception of Δ–8, −9, and −10 trans-isomers, C18:1 positional isomers are good sub-strates for Δ–9 desaturase (12). Consequently, cis, trans and trans, cis fatty acids canbe formed. Some trans-isomers of C18:1 are also substrates for Δ–6 and −5 desaturases(13). In addition, C18:1 trans-isomers can be elongated into C20 and C22 fatty acids.
Trans linoleic acid can be converted into trans-isomers of arachidonic acid (C20:4 n-6),although at a lower rate than all-cis C18:2 (14). Trans-isomers of α-linolenic acid canbe converted into trans-isomers of docosahexaenoic acid (C22:6 n−3) (15).
Fig. 4. Desaturation and elongation of fatty acids.

284 Part III / Cardiovascular Disease Prevention
Because trans and cis fatty acids are converted by the same desaturase and elongaseenzymes, competition between fatty acids exists. In vitro studies do suggest that boththe cis and trans monoenoic positional isomers inhibit Δ–6 and −5 desaturation oflinoleic and α-linolenic acids and their longer chain metabolites. In contrast, C18:1Δ–9tr increased Δ–9 desaturation of stearic acid, whereas C18:1 Δ-11tr and C18:2Δ–9tr, 12tr had no effects on Δ–9 desaturase activity (16,17). It is difficult to extrapo-late these in vitro findings to the in vivo situation. However, a recent human study foundno effect of trans α-linolenic acid on the conversion of linoleic acid (18). Therefore, itseems that in adult volunteers consuming a diet adequate in essential fatty acids, thepresent intake of trans-isomers does not affect desaturase activity.
3.4. OxidationOnly a few human studies have been carried out to examine the postprandial oxida-
tion of trans fatty acids. As compared to their cis counterparts, trans-isomers of oleic andα-linolenic acids were oxidized to the same extent, whereas isomerization increased thepostprandial oxidation of linoleic acid (19,20).
4. EFFECTS OF TRANS MONOUNSATURATED FATTY ACIDSON SERUM LIPIDS AND LIPOPROTEINS
4.1. Serum Total, LDL, and HDL CholesterolEffects of dietary trans monounsaturated fatty acids on serum cholesterol concentra-
tions have been investigated since the early 1960s. Most studies found increased serumtotal cholesterol levels in humans consuming partially hydrogenated vegetable oils.However, results were not uniform. In addition, these earlier studies did not examine therelationship between dietary trans monounsaturated fatty acids and the distribution ofcholesterol over the different lipoproteins. In one of the first controlled interventionstudies that specifically examined the effects of trans monounsaturated fatty acids onserum LDL and HDL cholesterol, 25 men and 34 women were fed a diet that was highin oleic acid, in trans-isomers of oleic acid, or in a mixture of the saturated fatty acidslauric and palmitic acid (21). Each diet was administered for 3 wk. The level of transmonounsaturated fatty acids in the trans diet was 11% of total energy. Results showedthat trans monounsaturated fatty acids significantly raised serum total and LDL choles-terol levels by 0.26 and 0.37 mmol/L, respectively, and lowered HDL cholesterol levels by0.17 mmol/L compared to oleic acid. These effects were confirmed by later studies thattested lower intakes of trans monounsaturated fatty acids. Recently, a meta-analysis wasperformed that combined the results of all recent studies regarding the effects of transfatty acids on serum lipoproteins. It was estimated that each additional percent ofdietary energy as trans monounsaturated fatty acids at the expense of oleic acid resultsin an increase in LDL cholesterol levels of 0.049 mmol/L and a decrease in HDL choles-terol levels of 0.008 mmol/L (Fig. 5) (22).
Consumption of trans fatty acids also decreases LDL particle size (23). This is anotherreason to keep the intake of trans fatty acids as low as possible, because small, dense LDLis a risk marker for CHD. Similarly, an elevated fasting triacylglycerol concentration is alsoa risk marker for CHD. It has been estimated that each additional percent of energy astrans monounsaturated fatty acids at the expense of oleic acid increases triacylglycerollevels by 0.019 mmol/L (22).

Chapter 11 / Trans Fatty Acids 285
Finally, effects of trans monounsaturated fatty acids on lipoprotein(a) [Lp(a)] havebeen studied. Lp(a) is an LDL particle with an extra glycoprotein [apoprotein(a)], whichis attached through a disulfide link. High levels of Lp(a) increase the risk for CHD.Therefore, effects of trans monounsaturated fatty acids on Lp(a) have been investigatedin several intervention studies. From these studies, it can be concluded that when com-pared with saturated fatty acids, trans monounsaturated fatty acids raise Lp(a), particu-larly in subjects who already have increased Lp(a) levels (21).
4.2. ConclusionTrans monounsaturated fatty acids do have adverse effects on the serum lipoprotein
profile, because they raise serum LDL cholesterol, Lp(a), and triacylglycerol levels,whereas HDL cholesterol levels and LDL particle size decrease. Although they havebeen studied less extensively, trans PUFAs also seem to have unfavorable effects on theserum lipoprotein profile (24).
4.3. MechanismThe mechanisms underlying the effects of trans fatty acids on serum lipoprotein con-
centrations are poorly understood. It has been hypothesized that cholesteryl ester trans-fer protein (CETP) is involved. CETP transfers cholesteryl esters from HDL to theapolipoprotein B-containing lipoproteins LDL and VLDL in exchange for triacylglyc-erol. Indeed, an increased transfer of cholesteryl ester transfer activity has been foundin volunteers who consumed a trans fatty acid-enriched diet (25).
Lecithin:cholesterol acyltransferase (LCAT) has also been suggested to be involved inthis process. LCAT, which is bound to HDL, esterifies free cholesterol from tissues bythe transfer of an acyl group from phosphatidylcholine (PC). Because a significant partof the dietary trans fatty acids is incorporated into PC (7), a few studies investigated the
Fig. 5. Effects of exchanging one percent of energy from saturated or trans monoun-saturated fatty acids for oleic acid on serum total, low-density lipoprotein, and high-density lipoprotein cholesterol and on triacylglycerol concentrations. (Data are derivedfrom ref. 22.)

286 Part III / Cardiovascular Disease Prevention
effect of trans fatty acids on LCAT. One study showed that trans fatty acids decreasedLCAT activity (26), whereas another study did not demonstrate an effect of trans fattyacids on LCAT activity (27).
In the liver, fatty acids from chylomicrons are esterified to free cholesterol by acyl-CoA:cholesterol acyl transferase (ACAT). The affinity of ACAT differs for different fattyacids. A low affinity of the enzyme for a particular fatty acid increases the proportion offree cholesterol in the liver, which decreases LDL receptor activity. Because the LDLreceptor removes LDL from plasma, a decreased LDL receptor activity results in higherplasma LDL concentrations. Thus, through this pathway, dietary fatty acids can influencethe plasma LDL cholesterol concentration. In hamsters, trans monounsaturated fatty acidsdecreased hepatic cholesteryl ester concentrations relative to oleic acid (28). This suggeststhat the affinity of ACAT is lower for trans monounsaturated fatty acids compared to oleicacid, which may result in higher free cholesterol levels in the liver. In addition, the plasmaLDL cholesterol concentration increased and the LDL receptor activity decreased on thediet high in trans monounsaturated fatty acids. Therefore, trans monounsaturated fattyacids may affect plasma LDL cholesterol via the pathway, as described earlier. However,this mechanism has not been investigated in humans. It is expected that a decreased fluxof LDL cholesterol from the blood to cells leads to an increased de novo cholesterol syn-thesis, simply because cells do need cholesterol. However, in healthy volunteers, de novocholesterol synthesis was not different after consumption of a diet high in hydrogenatedor unhydrogenated corn oil (29). Thus, the precise mechanism by which trans fatty acidsinfluences serum lipoprotein concentrations is unknown.
5. EFFECTS OF TRANS FATTY ACIDS ON OTHER RISK FACTORS FOR CHD
5.1. LDL OxidationFree radicals initiate the oxidation of unsaturated fatty acids in the LDL particle,
which may ultimately lead to formation of an atherosclerotic plaque. Because thefatty acid composition of the LDL particle reflects the fatty acid composition of thediet, effects of increased intakes of trans fatty acids on the in vitro susceptibility ofLDL to oxidation have been investigated in several intervention trials. However, noeffects were found after consumption of trans monounsaturated fatty acids comparedto other fatty acids (29). Therefore, at least in vitro, trans fatty acids have no impacton LDL oxidizability.
5.2. HemostasisOnly a few human studies have investigated the effects of trans fatty acids on markers
for platelet aggregation, coagulation, and fibrinolysis—three determinants of hemosta-tic function. These studies yielded conflicting results, which may result partly from themany different methods to measure hemostatic function. Therefore, it seems that transfatty acids do not have a major impact on hemostatic function (30–32).
6. EPIDEMIOLOGICAL STUDIES
Various approaches have been used in epidemiological studies to examine the rela-tionship between the intake of trans fatty acids and the risk for CHD. Because highserum LDL cholesterol levels are positively associated with CHD and high levels ofHDL cholesterol are antiatherogenic, some epidemiological studies focused on the relation

Chapter 11 / Trans Fatty Acids 287
between the proportion of trans fatty acids in tissues, which reflects dietary intakes, orthe dietary trans fatty acid intake and the lipid profile (33–35). Altogether, these epi-demiological studies confirmed the dietary intervention studies, which found that transfatty acids have a negative impact on the lipid profile. However, these studies did notaddress the question of whether high intakes of trans fatty acids were truly related to therisk for CHD. This issue was examined in several case-control studies. In these studies,the proportion of trans fatty acids in tissues or the dietary trans fatty acid intake of case-subjects (e.g., subjects with CHD) was compared with that of control subjects (e.g., sub-jects without CHD). Some studies suggested a higher total trans fatty acid intakes (36)in cases compared to controls, whereas other studies did not find any effects of transfatty acids on CHD risk (37). One study even showed that the proportion of trans-18:1in adipose tissue was negatively associated with the risk for CHD (38). However, case-controls studies have the disadvantage that they are sensitive to information bias, selec-tion bias, and confounding. Four prospective cohort studies, which suffer less from thesedisadvantages, examined the relationship between the trans fatty acid intake and the riskfor CHD. In the Nurses’ Health Study (39), the relative risk (RR) of CHD was 1.27 forthe highest quintile of trans fatty acid intake (mean intake: 2.9% of energy) relative tothe lowest quintile (mean intake: 1.3% of energy). This means that women who consume2.9% of energy as trans fatty acids per day have a 27% higher risk for CHD than womenwith a trans fatty acid intake of 1.3% of energy. These results were confirmed by threeprospective cohort studies (40–42), shown in Fig. 6. One study looked into detailsbetween the source of trans fatty acids and the risk for CHD. Relationships for trans fattyacids from ruminant and industrial sources were essentially similar (42).
In summary, results from case-control studies are inconsistent. For prospectivecohort studies, results are more uniform: a high intake of trans fatty acids is associatedwith an increased risk of CHD.
Fig. 6. Pooled relative risk of coronary heart disease, as calculated from the results offour different prospective cohort studies when the intake of trans fatty acids is increasedwith 2% of energy. (Data are derived from ref. 39.)

288 Part III / Cardiovascular Disease Prevention
7. CANCER
Only a few human studies focused on the relationship between trans fatty acids andcancer, particularly the risk for breast cancer. In the Nurses’ Health Study, a large prospec-tive cohort study, a RR of 0.92 for breast cancer was found when trans fatty acid intakeincreased with 1% of energy (43). Furthermore, three case-control studies related the transfatty acid content of adipose tissue to cancer risk. In the EURAMIC study, the trans fattyacid content of subcutaneous adipose tissue was positively associated with risk for breastcancer (44). However, another study suggested a negative association (45), whereas athird case–control study did not find an association between the trans fatty acid contentof subcutaneous adipose tissue and breast cancer risk (46). Human studies investigatingthe relationship between trans fatty acids and other types of cancers are scarce. In theEuropean Community Multicenter Study on Antioxidants, Myocardial Infarction, andCancer study, significant correlations were found between trans fatty acids in adiposetissue and incidence of colon cancer. No association was found with prostate cancer (47).Therefore, from these human studies, no consistent relationship emerged between theintake and/or tissue levels of trans fatty acids and cancer risk.
8. CONCLUSIONS AND RECOMMENDATIONS
The digestion and absorption of trans monounsaturated fatty acids are comparable withthose of their cis-isomers. However, incorporation of various trans monoenoic isomersinto lipid classes and lipoproteins is lower than that of the cis-isomers. Furthermore,both trans monounsaturated acids and PUFAs are desaturated and elongated into longerchain metabolites. At present intakes, trans-isomers do not affect desaturase activity inadults who consume a diet adequate in essential fatty acids. As compared to their ciscounterparts, trans-isomers of oleic and α-linolenic acids are oxidized to the sameextent, whereas isomerization increased the postprandial oxidation of linoleic acid.However, these processes have been investigated mainly in animal and in vitro studies.More human in vivo studies are necessary.
Most studies on the effects of trans fatty acids and health have focused on transmonounsaturated fatty acids, and effects of trans PUFAs are hardly known. Transmonounsaturated fatty acids increase serum LDL cholesterol, triacylglycerols, and Lp(a)concentrations and decrease serum HDL cholesterol compared to oleic acid. The exactunderlying mechanisms for these effects are not known. Furthermore, trans monounsatu-rated fatty acids seem to have no major impact on LDL oxidizability, platelet aggregation,coagulation, and fibrinolysis. Prospective epidemiological studies showed a positive asso-ciation between trans fatty acids and the risk for CHD but not with the risk for cancer.Based on these results, a reduction in the trans fatty acid intake is justified (48).
REFERENCES1. Harnack L, Lee S, Schakel SF, Duval S, Luepker RV, Arnett DK. Trends in the trans-fatty acid com-
position of the diet in a metropolitan area: the Minnesota Heart Survey. J Am Diet Assoc 2003;103:1160–1166.
2. Hulshof KF, Van Erp-Baart MA, Anttolainen M, et al. Intake of fatty acids in Western Europe withemphasis on trans fatty acids: The TRANSFAIR study. Eur J Clin Nutr 1999; 53:143–157.
3. Emken EA. Do trans Acids Have Adverse Health Consequences? In: Nelson G, ed. Health Effectsof Dietary Fatty Acids. American Oil Chemists Society, Champaign, IL, 1991, pp. 245–260.

Chapter 11 / Trans Fatty Acids 289
4. Emken EA, Dutton HJ, Rohwedder WK, Rakoff H, Adlof RO. Distribution of deuterium-labeled cisand trans-12-octadecemoic acids in human plasma and lipoprotein lipids. Lipids 1980; 15:864–871.
5. Emken EA, Adlof RO, Rohwedder WK, Gulley RM. Incorporation of deuterium-labeled trans- andcis-13-octadecenic acids in human plasma lipids. J Lipid Res 1983; 24:34–46.
6. Emken EA, Rohwedder WK, Adlof RO, DeJarlais WJ, Gulley RM. Absorption and distribution ofdeuterium-labeled trans- and cis-11-octadecenoic acid in human plasma and lipoprotein lipids.Lipids 1986; 21:589–595.
7. Emken EA, Adlof RO, Rohwedder WK, Gulley R. Incorporation of trans-8- and cis-8-octadecenoicacid isomers in human plasma and lipoprotein lipids. Lipids 1989; 24:61–69.
8. Kris-Etherton PM, ed. Trans fatty acids and coronary heart disease risk. Am J Clin Nutr 1995;62:655S–708S.
9. Heckers H, Korner M, Tuschen TW, Melcher FW. Occurence of individual trans-isomeric fatty acidsin human myocardium, jejunum and aorta in relation to different degrees of atherosclerosis.Atherosclerosis 1977;28:389–398.
10. Chardigny JM, Sébédio JL, Juanéda P, Vatéle JM, Grandgirard A. Occurrence of n-3 trans polyun-saturated fatty acids in human platelets. Nutr Res1993; 13:1105–1111.
11. Chardigny JM, Wolff RL, Mager E, Sébédio JL, Martine L, Juanéda P. Trans mono- and polyunsat-urated fatty acids in human milk. Eur J Clin Nutr 1995; 49:523–531.
12. Mahfouz MM, Valicenti AJ, Holman RT. Desaturation of isomeric trans-octadecenoic acids by ratliver microsomes. Biochim Biophys Acta 1980; 618:1–12.
13. Pollard MR, Gunstone FD, James AT, Morris LJ. Desaturation of positional and geometric isomersof monoenoic fatty acids by microsomal preparations from rat liver. Lipids 1980; 15:306-14.
14. Beyers EC, Emken EA. Metabolites of cis,trans, and trans,cis isomers of linoleic acid in mice andincorporation into tissue lipids. Biochim Biophys Acta 1991; 1082:275–284.
15. Grandgirard A, Piconneaux A, Sébédio JL, O’Keefe SF, Semon E, Le Quere JL. Occurrence of geo-metrical isomers of eicosapentaenoic and docosahexaenoic acids in liver lipids of rats fed heated lin-seed oil. Lipids 1989; 24:799–804.
16. Cook H, Emken EA. Geometric and positional fatty acid isomers interact differently with desatura-tion and elongation of linoleic and linolenic acids in cultured glioma cells. Biochem Cell Biol 1990;68:653–660.
17. Rosenthal MD, Whitehurst MC. Selective effects of isomeric cis and trans fatty acids on fatty acylΔ9 and Δ6 desaturation by human skin fibroblasts. Biochim Biophys Acta 1983; 753:450–459.
18. Scrimgeour CM, Macvean A, Fernie CE, et al. Dietary trans α-linolenic acid does not inhibit Δ5-and Δ6-desaturation of linoleic acid in man. Eur J Lipid Sci Technol 2001; 103:341–349.
19. DeLany JP, Windhauser MM, Champagne CM, Bray GA. Differential oxidation of individual dietaryfatty acids in humans. Am J Clin Nutr 2000; 72:905–911.
20. Bretillon L, Chardigny JM, Sebedio JL, et al. Isomerization increases the postprandial oxidation oflinoleic acid but not alpha-linolenic acid in men. J Lipid Res 2001; 42:995–997.
21. Katan MB, Mensink RP, Zock PL. Trans fatty acids and their effects on lipoproteins in humans.Annu Rev Nutr 1995; 15:473–493.
22. Mensink RP, Zock PL, Kester ADM, Katan MB. Effects of dietary fatty acids and carbohydrates onthe ratio of serum total to HDL cholesterol and on serum lipids and apoproteins: a meta-analysis of60 controlled trials. Am J Clin Nutr 2003; 77:1146–1155.
23. Mauger JF, Lichtenstein AH, Ausman LM, et al. Effect of different forms of dietary hydrogenatedfats on LDL particle size. Am J Clin Nutr 2003; 78:370–375.
24. Vermunt SH, Beaufrere B, Riemersma RA, et al. Dietary trans alpha-linolenic acid from deodorisedrapeseed oil and plasma lipids and lipoproteins in healthy men: the TransLinE Study. Br J Nutr 2001;85:387–392.
25. Gatto LM, Sullivan DR, Samman S. Postprandial effects of dietary trans fatty acids on apolipopro-tein(a) and cholesteryl ester transfer. Am J Clin Nutr 2003; 77:1119–1124.
26. Subbaiah PV, Subramanian VS, Liu M. Trans unsaturated fatty acids inhibit lecithin: cholesterolacyltransferase and alter its positional specificity. J Lipid Res 1998; 39:1438–1447.
27. Van Tol A, Zock PL, Van Gent T, Scheek LM, Katan MB. Dietary trans fatty acids increase serumcholesteryl ester transfer protein activity in man. Atherosclerosis 1995; 115:129–134.
28. Woollett LA, Daumerie CM, Dietschy JM. Trans-9-octadecenoic acid is biologically neutral anddoes not regulate the low density lipoprotein receptor as the cis isomer does in the hamster. J LipidRes 1994; 35:1661–1673.

290 Part III / Cardiovascular Disease Prevention
29. Cuchel M, Schwab US, Jones PJ, et al. Impact of hydrogenated fat consumption on endogenouscholesterol synthesis and susceptibility of low-density lipoprotein to oxidation in moderately hyper-cholesterolemic individuals. Metabolism 1996; 45:241–247.
30. Almendingen K, Seljeflot I, Sandstad B, Pedersen J. Effects of partially hydrogenated fish oil par-tially hydrogenated soybean oil and butter on hemostatic variables in men. Arterioscl Thromb VascBiol 1996; 16:375–380.
31. Mutanen M, Aro A. Coagulation and fibrinolysis factors in healthy subjects consuming high stearicor trans fatty acid diets. Thromb Haemostasis 1997; 77:99–104.
32. Turpeinen A, Wubert J, Aro A, Lorenz R, Mutanen M. Similar effects of diets rich in stearic acid ortrans-fatty acids on platelet function and endothelial prostacyclin production in humans. ArteriosclThromb Vasc Biol 1998; 18:316–322.
33. Hudgins LC, Hirsch J, Emken EA. Correlation of isomeric fatty acids in human adipose tissue withclinical risk factors for cardiovascular disease. Am J Clin Nutr 1991; 53:474–482.
34. Troisi RJ, Willett WC, Weiss ST. Trans-fatty acid intake in relation to serum lipid concentrations inadult men. Am J Clin Nutr 1992; 56:1019–1024.
35. Siguel E, Lerman RH. Trans-fatty acid patterns in patients with angiographically documented coro-nary artery disease. Am J Cardiol 1993; 71:916–920.
36. Ascherio A, Hennekens CH, Buring JE, Master C, Stampfer MJ, Willett WC. Trans-fatty acids intakeand risk of myocardial infarction. Circulation 1994; 89:94–101.
37. Aro A, Kardinaal AF, Salminen I, et al. Adipose tissue isomeric trans fatty acids and risk of myocardialinfarction in nine countries: the EURAMIC study. Lancet 1995; 345:273–278.
38. Roberts TL, Wood DA, Riemersma RA, Gallagher PJ, Lampe FC. Trans isomers of oleic and linoleicacids in adipose tissue and sudden cardiac death. Lancet 1995; 345:278–282.
39. Hu FB, Stampfer MJ, Manson JE, et al. Dietary fat intake and the risk of coronary heart disease inwomen. N Engl J Med 1997; 337:1491–1499.
40. Pietinen P, Ascherio A, Korhonen P, et al. Intake of fatty acids and risk of coronary heart disease ina cohort of Finnish men. Am J Epidemiol 1997; 145:876,877.
41. Ascherio A, Rimm EB, Giovannucci EL, Spiegelman D, Stampfer M, Willett WC. Dietary fat andrisk of coronary heart disease in men: cohort follow up study in the United States. Br Med J 1996;313:84–90.
42. Oomen CM, Ocke MC, Feskens EJ, van Erp-Baart MA, Kok FJ, Kromhout D. Association betweentrans fatty acid intake and 10-year risk of coronary heart disease in the Zutphen Elderly Study: aprospective population-based study. Lancet 2001; 357:746–751.
43. Holmes MD, Hunter DJ, Colditz GA, et al. Association of dietary intake of fat and fatty acids withrisk of breast cancer. JAMA 1999; 281:914–920.
44. Kohlmeier L, Simonsen N, van ‘t Veer P, et al. Adipose tissue trans fatty acids and breast cancer inthe European community multicenter study on antioxidant, myocardial infarction, and breast cancer.Cancer Epidemiol Biomark Prev 1997; 6:705–710.
45. Petrek JA, Hudgins LC, Ho M, Bajorunas DR, Hirsch J. Fatty acid composition of adipose tissue andindication of dietary fatty acids, and breast cancer prognosis. J Clin Oncol 1997; 15:1377–1384.
46. London SJ, Sacks FM, Stampfer MJ, et al. Fatty acid composition of the subcutaneous adipose tis-sue and risk of proliferative benign breast disease and breast cancer. J Natl Cancer Inst 1993;85:785–793.
47. Bakker N, van ‘t Veer P, Zock PL, et al. Adipose fatty acids and cancers of the breast, prostate andcolon: an ecological study. Int J Cancer 1997; 72:587–591.
48. Expert Panel on Detection, Evaluation, and Treatment of High Blood Cholesterol in Adults.Executive Summary of The Third Report of The National Cholesterol Education Program (NCEP)Expert Panel on Detection, Evaluation, And Treatment of High Blood Cholesterol In Adults (AdultTreatment Panel III). JAMA 2001; 285:2486–2497.

IV DIABETES AND OBESITY


From: Preventive Nutrition: The Comprehensive Guide for Health Professionals, Third EditionEdited by: A. Bendich and R. J. Deckelbaum © Humana Press Inc., Totowa, NJ
293
12 Obesity and Insulin Resistancein Childhood and Adolescence
Erik Bergström and Olle Hernell
KEY POINTS
● Obesity in children and adolescents as well as the related metabolic consequencesof insulin resistance and non-insulin-dependent diabetes mellitus are increasingworldwide.
● Obesity has become a pediatric problem. Tracking of obesity into adulthood increaseswith the degree of obesity and age of the child.
● Genetically determined susceptibility makes certain individuals and familiesmore vulnerable than others regarding the development of obesity and its metabolicconsequences.
● Besides being a storage depot for fat, adipose tissue is also an endocrine organ with akey function in integrating endocrine, metabolic, and inflammatory signals for the controlof energy homeostasis and is mediated through a number of newly discovered bioactivemolecules collectively called adipocytokines.
● Increased concentrations of adipose tissue cortisol caused by excess activity of theenzyme 11β-hydroxysteroid dehydrogenase type 1 may contribute to the developmentof metabolic syndrome in humans.
● Disregarding the molecular mechanisms behind obesity in children, a higher consumptionof energy-dense food in combination with a sedentary lifestyle is the major explanationbehind the “obesity epidemic.”
● Adjusted body mass index is a suitable measure for diagnosis and monitoring of obe-sity in children and adolescents.
● Early identification, monitoring, and intervention are recommended for children andadolescents with weight problems.
● Programs targeting obesity in children and adolescents should focus on parental guid-ance skills regarding diet and physical activity in combination with primary preventiveefforts to change the “obesogenic” environment.

294 Part IV / Diabetes and Obesity
1. INTRODUCTION
This chapter focuses particularly on the etiology and pathology of insulin resistance(IR) but also discusses possible preventive measures. Obesity in adults is an increasinghealth problem in both industrialized and developing countries. In developing countries,obesity coexists with undernutrition, with prevalence rates higher in urban than in ruralpopulations. Women generally have higher rates of obesity than men in both developedand developing countries. In adults, obesity is associated with increased mortality andmorbidity in a number of diseases, the most common being cardiovascular diseases(CVDs) and non-insulin-dependent diabetes mellitus (NIDDM) (1).
In parallel to the development in adults, the prevalence of overweight children andadolescents is also increasing worldwide, illustrating that children and adolescents arepart of the worldwide epidemic of obesity. Recent reports show that the trend has esca-lated in recent decades (2–9). In addition, the proportion of overweight children withsevere weight problems, or obesity, is becoming greater (10). The obesity “epidemic”began in the industrialized world but is now also spreading to developing countries. Inmany countries, about 15 to 35% of the children and adolescents are now classified asbeing overweight and about 5% are classified as obese. Although most infants andyoung children who are overweight become nonobese adults without treatment, it iswell-documented that severe weight problems in childhood and adolescence track intoadulthood. Obesity in childhood has adverse psychological and social consequences(e.g., poor self-esteem, peer problems, and social marginalization; refs. 11 and 12), anda low quality of life that is at the same level as children with cancer (13). It is becom-ing increasingly clear that childhood obesity also has significant adverse effects onsomatic health during childhood (14,15). The risk of becoming an obese adult increasesgradually with the age of the child, the degree of obesity, and the presence of a familyhistory of obesity (2,16) (Fig. 1).
2. INSULIN RESISTANCE SYNDROME
The clinical entity of obesity, dyslipidemia, and hyperinsulinemia combined withhypertension is often referred to as “IR syndrome” or “metabolic syndrome” (Fig. 2);the syndrome was first described in 1966 by Camus (17) and popularized in 1988 byReaven (18). Although the pathogenesis of this syndrome is multifactorial, geneticfactors in combination with a sedentary lifestyle, including a high-energy diet rich insaturated fat and low physical activity leading to obesity, are regarded as majordeterminants (17,18).
Obesity is related to increased cellular resistance to insulin, which in turn affects glu-cose and lipid metabolism, resulting in a secondary hyperglycemia, a compensatoryhyperinsulinemia and dyslipidemia (i.e., hypertriglyceridemia), and low high-densitylipoprotein lipoprotein (HDL) concentration. Insulin-stimulated glucose uptake andutilization is impaired in liver, skeletal muscle, and adipose tissue, and coupled toimpaired suppression of hepatic glucose output. IR also affects the regulation of bloodpressure and the fibrinolysis system (19–21). The exact molecular mechanisms behindIR remain unclear, but there seems to be a genetic component (22). Changes in plasmafree fatty acid (FFA) concentration may be an important link between obesity and IR(23–26). The metabolic disturbances caused by IR are related to increased risk of CVDand NIDDM. One important mechanism could be that IR leads to inadequate intracellular

Chapter 12 / Obesity and IR in Children 295
glucose concentration, which in turn leads to insufficient amounts of adenosine triphos-phate (ATP) that is needed for ion transfer and energy-requiring reactions (27). Thedegree of the weight problem, the change in weight, and the duration of the weightproblem are all separate predictors of NIDDM. The metabolic syndrome seems to berelated more to obesity than to heredity of IR, but it should also be noted that IR isrelated to CVD regardless of obesity (23,28,29). The metabolic disturbances seen in themetabolic syndrome are especially related to abdominal obesity or, more precisely,increased visceral fat, even in normal-weight individuals. Genetic and/or familial
Fig. 1. Odds ratio for obesity in young adulthood according to the child’s age and obesitystatus of the child. Nonobese children served as reference group. (From ref. 16.)
Fig. 2. The insulin resistance syndrome.

296 Part IV / Diabetes and Obesity
nongenetic factors seem to influence both visceral fat mass and plasma insulin levels toa certain degree (30–32). Magnetic resonance imaging appears to be a convenienttechnique to estimate visceral fat mass (33,34).
There is increasing evidence supporting the view that the metabolic aberrations seenin the adult metabolic syndrome can be identified early in childhood and tracked intoyoung adulthood (35–42). Heredity, as well as ethnicity, seems to have an impact, witha stronger effect of obesity on IR in African-American rather than Caucasian adoles-cents (43). However, it is not yet known at what levels serum insulin, serum lipids,blood pressure, or weight problems begin to increase the risk of later adult disease.Indices of obesity (body mass index [BMI], skinfold, waist circumference), independentof age, correlate positively to serum insulin and an atherogenic serum lipid profile (i.e.,elevated total cholesterol, low-density lipoprotein cholesterol [LDL-C], serum triglyceride,and apolipoprotein B [apo-B]) and subnormal HDL cholesterol (HDL-C). Waist-to-hipcircumference or subscapular-to-triceps skinfold ratios seem to have no advantage toBMI or waist circumference alone as an indicator of unfavorable metabolic or physio-logical values. BMI and waist circumference are also easy measures to obtain, makingthem particularly suitable for epidemiological studies (35,44). The importance of com-bining BMI with waist measurements is emphasized by the strong relationship betweenvisceral fat and IR, which is also demonstrated in adolescents (34). Using only BMImay cause underestimation of central obesity (45).
There are no available reference values for serum insulin in healthy children andadolescents. Serum insulin levels increase during puberty, probably as a result of a com-bination of higher secretion, a higher demand of insulin during the pubertal growthspurt, and increased cellular resistance to insulin (46). However, the physiologicalexplanation for increased cellular resistance to insulin in puberty is not known. Still,insulin is known to have a growth hormone-like effect, and increased levels may resultfrom increased secretion of insulin related to the pubertal growth spurt. At any givenage, girls have higher values compared to boys, probably as a result of differences inmaturation (35). There is also an intraindividual diurnal variation in serum insulin,partly caused by variation in daily dietary intake. These variations make comparisonsbetween different studies difficult. Insulin-like growth factor binding protein-1 level isstrongly associated with insulin sensitivity and may be a useful early predictor ofdevelopment of IR in prepubertal obese children (47).
Studies using insulin clamping technique and glucose tolerance tests have shownobese adolescents to have major deficits in insulin-stimulated oxidative and nonoxida-tive glucose metabolism, hyperinsulinemia (both in the fasting state and in response tointravenous glucose), and impaired suppression of total body lipid oxidation and plasmaFFA concentrations in response to insulin (34,38) (Fig. 3). An extension of these meta-bolic changes is NIDDM, and, accompanying the national rise in adolescent obesity,there are reports of increasing incidence of NIDDM among adolescents (48,49). Itseems that the disease develops faster in children than in adults (42).
3. ASSESSMENT OF OBESITY
In adults, the BMI (kg/m2) has become the standard index for assessing obesity (1).Several suggestions have been made on how to assess obesity in children, such asstandard deviation (SDs) scores of weight, weight-to-height ratios or indices, andskinfold measurements and ratios. All of these anthropometric measurements are

Chapter 12 / Obesity and IR in Children 297
dependent on gender, age, and physical development of the individual. Becauseweight is closely related to height, when evaluating obesity, it is always necessary toconsider height and weight together. Of course, in severe cases, obesity is obvioussimply by inspection.
Fig. 3. Mean plasma glucose, insulin, and C-peptide responses during oral glucose-tol-erance test in obese children (A) and adolescents (B) with normal glucose tolerance,impaired glucose tolerance, or type 2 diabetes mellitus. (From ref. 38.)

298 Part IV / Diabetes and Obesity
The height and weight growth chart is the most commonly used instrument in theevaluation of obesity in children and adolescents (50). By comparing the current weightof the child with the reference weight in the chart according to the height of the child,a judgment that the child is overweight may be made. One limitation has been the lackof distinct cut-off values. In the last years, however, BMI also has become used increas-ingly in children and adolescents. Because there is a normal variation in BMI with age(a J-shaped curve with a nadir around age 5 yr and then increasing continuously up toadult values), BMI values in children and adolescents need to be assessed using age-related reference curves. Such curves have been constructed in different countries(51–53). It should be noted that national BMI curves are relevant only for the refer-ence population from which the data was extracted. Therefore, the 85th and 95th per-centile values differ depending on ethnicity and the nutritional status of thepopulation (54). When using BMI in developing countries, it is important to considerthe effect of stunting, as the lower height of the child results in a relatively higher BMIwithout presence of obesity. The 85th and 95th percentiles in BMI have commonly beenused to classify weight problems and obesity, respectively (55). It has been suggestedthat early BMI rebound (age <5 yr) is a useful predictor because it relates to adult obe-sity (56). However, this has been questioned as an “epiphenomenon” because childrenwith higher BMIs do have earlier rebound than those with lower BMIs, indicating thatit is not an early rebound per se but rather a high BMI that increases the risk of laterobesity (57). Recently, a new international standard was introduced called the adjustedBMI (iso-BMI), which is based on pooled international data for BMI of children fromsix countries (58). From these data, percentile curves were derived linking childhoodBMI values for each age and gender to BMIs of 25 and 30 kg/m2 at age 18 yr (iso-25and iso-30; i.e., the commonly used cut-off values for overweight and obese adults,respectively). This new standard is now used for classification of overweight andobese children in international comparative studies (8).
4. ETIOLOGY OF OBESITY
Obesity is the result of energy imbalance; stored energy equals the differencebetween energy intake and energy expenditure (that is, resting metabolic rate and phys-ical activity). Although it is evident that obese individuals eat more than they require,there is increasing evidence that there are genetically determined metabolic differencesbetween individuals who gain extensive weight and those who do not (59–63).However, it is obvious that the increase in obesity prevalence and severity in differentpopulations seen during recent decades cannot be explained by genetic changes; rather,the increases are caused by environmental and societal changes affecting energy intakeand expenditure.
4.1. Regulation of Body WeightBody weight is regulated by complex interactions of endocrine and neural signals
from adipose tissue and the endocrine, neural, and gastrointestinal systems (Fig. 4).Afferent neural (vagal and cholinergic) and hormonal (insulin, cholecystokinin, leptin,glucocorticoids [GCs]) stimuli related to metabolic status are received in the hypothal-amus, where they modulate the release of peptides known to affect food intake andefferent signals to the hypothalamic–pituitary axis, resulting in energy expenditure andinsulin release (61). In the normal state, body weight is regulated so that energy expenditure

Chapter 12 / Obesity and IR in Children 299
equals energy intake. If energy intake exceeds expenditure for a long time period, thesurplus of energy is stored as fat and, if the energy imbalance continues, the result isobesity. Once the obese state is established, the new weight appears to be defended,resulting in an involuntary, physiologically driven increase in energy intake anddifficulties in losing weight (64).
4.2. GeneticsRegulation of body weight is under strong genetic influence. The obesity gene map
shows putative loci on all chromosomes except the Y chromosome (65). Some raredisorders of energy balance have been identified that arise from genetic defects. Thediscovery of these genetic defects has biological and clinical implications beyond theimportance they deserve, because although they are rare diseases, they have the potentialto contribute general knowledge and increase our understanding of mechanismsregulating energy intake and expenditure (66).
Fig. 4. Molecules that affect energy intake and expenditure. (From ref. 61.)

300 Part IV / Diabetes and Obesity
Obesity, diabetes, and CVD aggregate in some families; however, familymembers do not share only the same genes but also, to various extents, the sameenvironment and habits. However, studies on twins, adoptees, and families alsoshow a strong correlation between body weights of relatives when they have notshared the same environment. As much as 70 to 80% of the variance in BMIs maybe attributable to genetic factors. The heritage of obesity is mediated through factorssuch as resting metabolic rate, changes in energy expenditure in response to overeating,lipoprotein lipase activity, maximal insulin-stimulated glyceride synthesis, basalrates of lipolysis, adipose tissue distribution, certain aspects of eating behavior, foodpreferences, and level of physical activity (61). Although there are examples of casesof obesity in rodents resulting from single-gene mutations in metabolic pathways,obesity in humans is rarely attributable to a single gene (e.g., Prader-WilliSyndrome). According to Loos and Boucard (63), human studies to identify the spe-cific genes involved in common obesity currently are dominated by three types ofstrategies: (a) the candidate gene approach, which relies on the current understand-ing of the pathophysiology of obesity related to energy balance and/or to adiposetissue biology; (b) genome-wide linkage scans with a view to identifying chromosomalregions of interest, the so-called quantitative trait locus (QTLs), and eventuallygenes within these QTLs; and (c) tissue-specific gene expression profile comparinglean vs obese individuals and other informative samples (63). Because disturbanceof energy balance is the central pathology of obesity, the search for candidate geneshas focused on those that are involved in energy metabolism, (i.e., genes thatprogram the β3-adrenergic receptor, the GC receptor, and Na+/K+ ATPase), obesitysyndromes in humans, obesity genes in rodents (e.g., genes coding for leptin and theleptin receptor) and genes involved in regulation of response to an obesity-promot-ing environment (61,64,67). Generally, obesity must be considered as a complexpolygenic disease resulting in different genetic predisposition, or susceptibility, forobesity. In a low “obesogenic” environment, i.e., an environment favoring physicalactivity and a balanced energy intake, only individuals with a high predispositionwill become obese, whereas in an environment favoring sedentary behavior andexcess energy intake, individuals with a low predisposition also will become obese.Only a small fraction of the population seems to be genetically “protected” frombecoming obese (63,68).
4.3. AdipocytokinesRather than being merely an inert storage depot for fat, adipose tissue is now being
recognized as an important endocrine organ with a key role in the integration ofendocrine, metabolic, and inflammatory signaling for the control of metabolic home-ostasis. Fat cells synthesize and secrete into the circulation a variety of “bioactiveproteins,” some of which have been identified only recently and are referred tocollectively as “adipocytokines,” e.g., leptin, tumor necrosis factor-α, plasminogenactivator-inhibitor type I, adipsin, resistin, and adiponectin (69). The function of theseand their role in obesity development and IR is currently the subject of intense researchand is beyond the scope of this chapter. However, leptin is discussed here as an exampleof their potential importance.
Leptin was one of the first adipocytokines to be identified and is regarded as a critical linkbetween somatic energy stores and growth and fertility. Leptin is the adipocyte-specific

Chapter 12 / Obesity and IR in Children 301
product of the ob gene (Lep gene), first identified in the leptin-deficient, obese ob/obmouse (70). It is thought to mediate afferent signals from fat stores to the brain, result-ing in subsequent efferent signals that regulate food intake and energy expenditure.Mutations in the leptin or leptin receptor genes result in morbid obesity, infertility, andIR in rodents and humans, but most obese humans do not have abnormal leptin orleptin receptor concentrations or functions. However, plasma leptin concentrations areincreased in obese humans in direct proportion to body fat mass, and leptin is believedto influence whole body glucose homeostasis and insulin action and may be involved inthe pathogenesis of the metabolic syndrome (71–73).
Serum leptin levels are higher in obese than in lean children, higher in girls than inboys, and has been related to IR (74). Obese children, especially girls, tend to matureearlier than lean children, and obese children also have increased adrenal androgen levels,which may partly explain the accelerated growth of these children before puberty.Recent data indicate that leptin has a specific role in stimulating the activity of enzymesthat are essential for the synthesis of adrenal androgens (75).
4.4. GlucocorticoidsAs mentioned earlier, the adverse metabolic consequences of obesity are best pre-
dicted by the quantity of visceral fat. The clinical resemblance between the metabolicsyndrome and Cushing’s syndrome has focused much interest on the potentialcausative role of GCs in obesity and IR. However, in typical obesity, plasma GClevels are not elevated. Recently, the role of GCs gained renewed interest from theobservation that transgenic mice overexpressing the enzyme 11β-hydroxysteroiddehydrogenase type 1 (11β-HSD1) in adipose tissue (which converts inactive circu-lating 11-keto steroids into active glucocorticoids, e.g., cortisone to cortisol) haveincreased intracellular cortisol levels and develop central obesity, IR, hypertension,hyperglycemia, hyperlipidemia, and hyperphagia despite having elevated circulatingleptin levels (22). Conversely, 11βHSD1 knockout mice have low intracellular GClevels and are protected from obesity, diabetes, and dyslipidemia (76). Indeed, in adi-pose tissue of obese humans and rodents, 11β-HSD1 is elevated, indicating thatadipose tissue GC excess resulting from dysregulation of 11βHSD1 may contributeto the development of visceral obesity and the metabolic syndrome in humans(77–79). We recently found higher expression levels of 11βHSD1 in visceral as com-pared to subcutaneous adipose tissue in overweight children, suggesting that such aneffect also might be relevant in childhood obesity (Li X, Lindquist S, Chen R, OlssonT, Hernell O, unpublished).
4.5. Thrifty Genotype and Thrifty PhenotypeAlthough there seems to be a stronger genetic influence in the etiology of obesity
than previously believed, epidemiological data showing large differences in obesityprevalence and trends between countries demonstrate the additional contribution ofenvironmental factors. This is further supported by variation in rates by ethnicity andsocioeconomic status and the shift in rates seen in migrant populations (1). One hypoth-esis that might explain the epidemics of lifestyle-related diseases (e.g., CVD andNIDDM) is the thrifty genotype. As stated by Neel, “Genes and combinations of geneswhich were at some time an asset may in the face of environmental change become aliability” (80). An energy-saving genotype and the preference for energy-dense food

302 Part IV / Diabetes and Obesity
(food rich in fat and sugar) is a survival and reproductive advantage given an environ-ment with a shortage of food but not when confronted with the surplus of Westernlifestyle and society (81). This hypothesis is supported by the absence of CVD and obe-sity in native populations still unaffected by Western lifestyle (82) and by the fact thatthe highest obesity and NIDDM prevalence is found in populations that have undergonerapid alterations in lifestyle (e.g., Australian Aborigines, Native Americans, PacificIslanders, and some migrant populations such as Asian Indians) (1).
There is no doubt that besides genetics, the chief cause of obesity, NIDDM, and CVDis a sedentary lifestyle and excess food intake in adult life. However, increasing evi-dence suggests that nutritional circumstances (both nutritional deficiency and excess)early in life also matter , and that the effect seems to be different depending on in whichphase in fetal life the nutritional disturbance occurs. This hypothesis has been namedthe thrifty phenotype hypothesis (83). In a historical cohort study of young men exposedto the Dutch famine of 1944–1945 and examined at military induction, Ravelli showedthat during the last trimester of pregnancy and the first months of life, exposure tofamine produced significantly lower obesity rates, whereas during the first half of preg-nancy, exposure to famine resulted in significantly higher obesity rates (84). A similarobservation from the 1970s was made by Forsdahl (85), who demonstrated regionalassociations between infant mortality and CVD mortality in adults in the same regionsa generation later. Later retrospective and ecological studies (86–89) confirmed theassociations between reduced physical growth in early life and CVD mortality in adult-hood, extending this also to associations between poor fetal and infant growth andelevated serum lipids, higher blood pressure, impaired glucose tolerance, higher fib-rinogen levels, higher incidence of NIDDM, and the metabolic syndrome. Other reportsshowed that low birth weight in conjunction with rapid postnatal weight gain , espe-cially as subcutaneous fat, is associated with reduced glucose tolerance in childhoodand, consequently, susceptibility for NIDDM later in life (90–93). Furthermore,stunted children seem to have a higher risk of obesity (94).
Referring to animal experiments, Barker (87) proposed a biological explanation forthe association between low birth weight and infant growth and later metabolic dis-eases. Barker suggested that fetal malnutrition results in a permanent underdevelop-ment of certain organs (e.g., the liver and pancreas) or, alternatively, an early metabolicor nutritional “programming.” Both could result in difficulties in coping with a nutri-tional overload later in life. If fetal malnutrition results in increased risk of CVD, thelow occurrence of adult CVD in developing countries with concurrent malnutrition andhigh rates of intrauterine and infant growth retardation may seem paradoxical.However, this could be explained partly by a shorter life span in developing countries(too short for chronic diseases to appear) and by adult populations in these countriesnot having been exposed to nutritional overload. According to Barker (87), transitionfrom nutritional insufficiency to nutritional overload may be particularly harmful. Thismechanism could be an additional explanation for the rapid increase in obesity andCVD in native populations.
The molecular mechanisms underlying the suggested links between fetal andinfant malnutrition and later metabolic disorders are unknown, but it has been demon-strated that supraphysiological doses of GCs retard fetal growth and that humanintrauterine growth retardation is associated with elevated cortisol levels. Exposing ratsto excessive GCs in utero reduces birth weight and causes permanent hypertension in the

Chapter 12 / Obesity and IR in Children 303
adult offspring. Therefore, GCs could be one link between low birth weight and laterdisease (95).
The programming, or imprinting, hypothesis has been disputed; the main criticism isthe lack of proper control for confounding by later dietary and other socially determinedenvironmental factors (96). Even if the programming hypothesis suggests that experiencesin utero or in early life may permanently affect the risk of developing CVD in adult-hood, this hypothesis does not exclude the risk of also being affected by environmentalfactors or lifestyle later in life. One factor that was recently discussed was duration ofbreastfeeding, where an increasing number of studies show that breastfeeding can havelong-term benefits, including prevention of obesity, although clear evidence is stilllacking (97,98).
In contrast to these reports and also indicated in the Dutch Famine study are reportsthat show a positive association between birth weight and BMI in adulthood (99–101).For example, adolescents with high serum insulin levels were heavier and taller at birthand during infancy and childhood compared to those with lower serum insulin values(35) (Fig. 5). A possible explanation for this finding is that high insulin values may stim-ulate growth. Alternatively, tall and heavy children may have higher insulin values. Acorresponding finding, which also illustrates the positive association between physicalgrowth and glucose metabolism, showed higher linear growth prior to the onset ofinsulin-dependent diabetes in children (102). Another possible explanation that shouldbe considered is that a high BMI or weight may also indicate a high lean body mass(103). Furthermore, maternal weight (or BMI) largely explains the associationbetween birth weight and the child’s adult BMI, and it may be a more important riskfactor for obesity in the child than the birth weight of the child (100,104).Intergenerational associations between the mother’s and offspring’s BMIs may be animportant association fueling the obesity epidemic, that is, an increasing numberof mothers having an increasing number of girls who become an increasing numberof obese mothers, and so on.
4.6. DietThe increase in obesity in various populations is associated with a change to a
Western diet. Compared to traditional diets of native populations, a Western diet con-tains increased amounts of total fat—particularly animal fat—animal protein, salt, andsugar, and decreased amounts of vegetable fat, vegetable protein, and complex carbohy-drates. This implies a change in both composition and energy density of the diet (105).
5. ENERGY INTAKE
It is indisputable that a high-energy diet that exceeds the energy demands results inobesity, especially in combination with a low level of physical activity. However, mostdietary studies show no correlation (or one that is inverse) between reported energyintake and body weight (60). The common explanation for this has been a higher degreeof underreporting of dietary intake in obese individuals. Studies in children indicate thatobese children do report a relatively lower energy intake than lean children. Obese ado-lescents underreported their dietary intake more than adolescents of normal weightwhen their 7-d self-reported records were compared with estimated energy expenditureusing the double-labeled water method (106,107). Comparing three dietary surveys inSweden over the past 20 yr, mean energy and fat intakes seemed to decrease, a trend

304 Part IV / Diabetes and Obesity
Fig. 5. Relationship between s-insulin levels in adolescence and previous attainedheights and weights during infancy and childhood. (From ref. 35.)

Chapter 12 / Obesity and IR in Children 305
also reported from other countries (108–111). Thus, another likely explanation forincreased obesity prevalence could be a gradual reduction in physical activity over thepast few decades. However, even if the relatively low energy intakes found in obeseindividuals is partly an effect of underreporting, it may also be a reflection of meta-bolic differences between lean and obese individuals. In fact, there may not be suchlarge difficulties in energy intake between obese and lean individuals.
6. METABOLIC EFFECTS OF COMPOSITION OF DIET
There are some characteristics of macronutrients that may explain part of the diffi-culties of regulating food intake when food is available in excess. Humans seem to havea poor defense against excess intake of fat. Compared to carbohydrates, fat has a lowerability to suppress hunger and bring eating to an end, and there are limited metabolicpathways that transfer excess intake of fat to other compartments, including a low abil-ity to stimulate increased oxidation on intake. At the same time, fat is energy-dense andis easily stored at low energy cost (112). A more fat-dense diet has been related to obe-sity in children (113). Because of rapid growth, infants need a higher energy intake perkilogram of body weight than do children and adults. This is reflected by the highenergy density of human milk, in which fat accounts for about 50% of total energy.However, when the growth rate decreases after infancy, food with too high energy den-sity may result in energy overload. There is also some evidence to support the con-tention that the high intake of protein in the Western diet could, through a specific effecton hormonal status, contribute to the metabolic disturbances behind obesity. Togetherwith a genetic susceptibility for weight gain, this specific effect of high protein intakecould partly explain why obese individuals tend to have energy intakes lower thanwould be expected from their degree of obesity, even when the underreporting of energyintake is accounted for (114). In rats, there is a more persistent increased secretion ofglucagon after protein intake compared to the transient increase of insulin and increasedglycogenolysis (115). However, although the composition of the food may have somespecific effects on development of obesity, the most significant contributing factorappears to be the high energy density of the diet.
6.1. Glycemic IndexThere are some reports showing that IR and hyperinsulinemia may occur prior to other
manifestations of the metabolic syndrome, indicating that high-fat and refined-sugardiets may have a more direct effect. Monosaccharides, disaccharides, and starch aredefined as digestible carbohydrates, because they are digested and absorbed in the humansmall intestine. A second category of carbohydrates, defined as “nondigestible” (e.g.,dietary fiber), cannot be digested by intestinal enzymes. This latter category of carbohy-drates, including a fraction of starch called “resistant starch,” still may have an impor-tant nutritional role because of its inhibitory effect on food intake and, possibly, onweight management. Among the various dietary constituents, the one with the strongestinfluence on blood glucose levels in the postprandial period is the amount of digestiblecarbohydrates in the diet. The glycemic index (GI) is a system to classify carbohydratesaccording to their influence on blood glucose and is defined as the incremental bloodglucose area under the curve after a test product has been ingested, expressed as the per-centage of the corresponding area after a carbohydrate-equivalent amount of white bread(116,117). Compared with a low-GI meal, a high-GI meal results in higher serum insulin

306 Part IV / Diabetes and Obesity
levels, lower plasma glucagon levels, lower postabsorptive plasma glucose and serumfatty acids levels, and elevation in plasma epinephrine. The rapid absorption of glucoseafter consumption of high-GI meals induces hormonal and metabolic changes that pro-mote excessive voluntary food intake in obese subjects (118), (i.e., a rapid increase inblood glucose results in a hyperinsulinemic response with rapidly falling blood glucosecausing increased hunger and overeating) (119). Additional studies are needed to exam-ine the relationship between dietary GI and long-term body weight regulation.
High consumption of carbohydrate-rich foods with high-GIs and sugar may be onecause of the increase in obesity, as the consumption of added sugar, sweeteners, and softdrinks has increased dramatically during the same time period as the obesity epidemichas evolved. However, the evidence is rather weak because data are essentially basedon epidemiological observations (120–122). The link seems to be that soft drinks are aneasily consumed source of energy. Children who are high consumers of soft drinks havehigher total energy intakes than children who are nonconsumers (123), and obese chil-dren consume a larger proportion of their total energy intake from soft drinks incomparison with lean children (110,124).
Dietary constituents may delay the process of digestion and/or absorption of car-bohydrates in the intestine, thus reducing the GI. A diet that is rich in dietary fiber isrecommended to prevent or treat obesity because of its lower energy density, its abilityto induce satiety, and its ability to slow the rate of food ingestion, gastric emptying, anddigestion, thereby lowering insulin levels and also resulting in a more favorable plasmalipid profile (125,126). Although well-documented in adults, there are few useful studiesof these effects of fibers in children. Switching to a diet that is rich in complexcarbohydrates and dietary fiber increases peripheral insulin sensitivity (127–130).
6.2. Fatty AcidsDietary fatty acids have several specific metabolic effects (insulin secretion and
action, hemostatic factors and platelet function, blood pressure, and endothelial activa-tion) related to chronic diseases (130). Lowering fat in the diet to 25% of total energyreduces platelet aggregation and significantly increases fibrinolytic activity (131).Elevations of plasma FFA levels produce peripheral, and probably also hepatic, IR inobese subjects who are healthy as well as those who are diabetic. Elevations alsoincrease glucose-stimulated insulin secretion, and this effect also seems to be dependenton chain length and degree of saturation. The longer and more saturated the fatty acids,the more pronounced the insulin response (26,132). A high proportion of palmitic (16:0)and a low proportion of linoleic (18:2 n-6) acids are associated with the metabolic syn-drome, indicating that there may be a causal relationship between the type of fat in thediet and insulin action (133).
Although there is substantial agreement that diet (predominantly the amount and typeof fat intake) affects serum lipoproteins and, ultimately, the occurrence of CVD, it hasbeen difficult to demonstrate a direct association between dietary fat intake and serumlipid levels (130). An intervention study by Vessby et al. (134) demonstrated that insulinsensitivity was significantly impaired on a saturated fatty acid diet but not on amonounsaturated fatty acid diet. The addition of n-3 fatty acids influenced neitherinsulin sensitivity nor insulin secretion. The favorable effects on insulin sensitivity fromsubstituting a monounsaturated fatty acid diet for a saturated fatty acid diet were onlyseen at a total fat intake below median. LDL-C increased on the saturated fatty acid diet

Chapter 12 / Obesity and IR in Children 307
but decreased on the monounsaturated fatty acid diet. A change of the proportions ofdietary fatty acids (decreasing saturated fatty acid and increasing monounsaturated fattyacid) improved insulin sensitivity but had no effect on insulin secretion, and thereseemed to be no beneficial impact of the fat quality on insulin sensitivity in individualswith a high fat intake (134).
In infants and younger children, the association between dietary fat intake and serumlipids seemed to be stronger than in older children (135,136). However, ecological studiescomparing different countries showed associations between fat intake in the populationand the level of total cholesterol and LDL-C in adolescents. In experimental studies, areduction of fat intake, or a modification of fat composition regarding atherogenic fattyacids, was shown to lower serum lipids in children (137,138).
There are several possible explanations for the difficulties in showing an associationbetween individual fat intakes and serum lipid levels (e.g., poor dietary data, geneticallydetermined differences in response to fat intake). There may also be a threshold effect,as the effect of fat intake on serum lipids is more pronounced in the low range of fatintake and, therefore, is difficult to show when the population level of fat intake is com-paratively high and homogenous (139,140). It should also be considered that atheroscle-rosis develops over decades and the variation in food consumed would be greater if theexposure time and, hence, the cumulative exposure of different diets was considered.Alternatively, there may be other dietary factors (e.g., antioxidants) that may prove moreimportant, or at least equally important, than fat intake for protection against CVD (141).
6.3. Physical ActivityThe major part of daily energy expenditure is explained by basic metabolic energy
expenditure, or basic metabolic rate, which constitutes 50 to 70% of daily energy expen-diture. Voluntary physical activity accounts for less than 25%, implying that the directimpact of voluntary physical activity on energy expenditure is rather low. The increasein obesity in society parallels the increase in sedentary lifestyles; in children, sedentaryactivities, especially watching television, are related to obesity (142), indicating acausal relationship. Although there are reports indicating that high physical activity dur-ing childhood may reduce gain in body fat in early adolescence (143), the evidence isstill inconclusive regarding the link between physical activity and obesity (144). Forexample, the physical activity level of children and adolescents is associated to a numberof social and family factors (145).
Physical exercise, even of short duration and especially when combined with a high-complex carbohydrate diet, increases insulin sensitivity, decreases serum insulin andtriglyceride levels, and increases HDL-C (Fig. 6). Increased participation in nonvigor-ous as well as overall and vigorous physical activity significantly reduces the risk ofdeveloping NIDDM (146,147). Physical activity is believed to influence the fatty acidcomposition of phospholipids in skeletal muscle, affecting skeletal muscle membranefluidity and peripheral insulin sensitivity. Skeletal muscle glucose uptake and metabo-lism are major determinants of whole-body glucose metabolism in response to exerciseand insulin stimulation (148–151).
In epidemiological studies in adults, high levels of physical activity and physical fitness,which usually are not discussed as separate entities, have been associated with lowerprevalence of CVD risk factors and a lower incidence of coronary heart disease (152).The positive effect of physical activity on the CVD process is not fully understood;

308 Part IV / Diabetes and Obesity
however, increases in HDL-C and decreases in very-low-density lipoprotein choles-terol, triglycerides, and blood pressure are thought to be contributing factors.Information on the effect of physical activity and physical fitness on obesity and CVDrisk indicators in children and adolescents indicate that a high level of physical activityand physical fitness have a favorable effect on serum lipids and serum insulinconcentrations and obesity (143,153–155).
6.4. Sociocultural EnvironmentSimilar to many other lifestyle-related diseases (e.g., smoking), obesity first
appeared in the affluent parts of the society and was regarded as a sign of health andprosperity. With increasing awareness and knowledge of the negative health consequences,more well-educated groups with higher socioeconomic status (SES) have adopted more
Fig. 6. (A,B), Effects of high-complex carbohydrate diet and daily aerobic exercise ons-insulin and s-triglyceride level. (From ref. 146.)

Chapter 12 / Obesity and IR in Children 309
healthy dietary and physical activity habits, thus counteracting the development of obe-sity. Therefore, obesity is becoming more prevalent in lower socioeconomic groups(99). Easy access to inexpensive, energy-dense food has contributed to this develop-ment (156). To varying degrees, obesity is a social handicap and a downward socialmobility of obese individuals could contribute to the higher prevalence of obesity inlower socioeconomic groups (157). A parallel development is seen in CVD mortality,where the decline in mortality during the last decades has not occurred in the lowersocial classes, resulting in widening social health inequality (158).
Psychosocial stress may be another link between social environment and obesity.Neuroendocrine responses to psychosocial pressures, especially the defeat reaction, arewell-established, with increased activity of the hypothalamic–pituitary–adrenal axis andincreased cortisol and inhibition of gonadotropin secretion. Such endocrine distur-bances are followed by metabolic aberrations and probably also by the accumulation ofvisceral fat (159).
In Western societies, low SES and educational level of the parents is related to obe-sity in children (99), whereas in developing countries, children in affluent families aremore at risk. Urbanization appears to be an important factor (160). The mechanismbehind this association is probably a combined effect of dietary and physical activityhabits, cognitive stimulation, and economic limitations for a healthy lifestyle (161,162).Low-income mothers do not perceive weight problems in their children negatively andare inclined to think that the weight problem is inherited and not influenced byenvironmental factors (163).
7. TREATMENT AND PREVENTION
Childhood weight problems have long been regarded as a rather benign conditionwith a favorable prognosis even without intervention for the majority of the children,making health professionals rather reluctant and passive when confronted with theoverweight child. The focus in health surveillance and dietary advice and recommen-dations to parents has been on preventing malnutrition to ensure the children eat asmuch as possible. This is also inherited in parenthood, as indicated by phrases suchas. “Be a good boy/girl and clear your plate.” The epidemiological development dur-ing recent decades indicates that the focus must be changed by health professionals,parents, and society.
7.1. TreatmentAlthough it is well-documented that it is possible to reduce obesity by modifying
energy intake and expenditure, treatment of manifest obesity in both adults and childrenhas been disappointing, with very few programs showing lasting weight reduction(164–168). Even if it seems logical that interventions during childhood would be easier,there is only some evidence to support this notion (169). Pharmacological and surgicaltherapies have limited value, especially in children and adolescents, and should be usedexclusively for severe cases in a clinical situation (170). Family- or school-based inter-ventions focusing on changing diet and physical activity are the two major approachesused (166). It has become increasingly clear that information alone is not enough tochange dietary and physical activity habits (171). Eating habits and physical activity aretwo basic human behaviors that are not easily changed. By nature, humans are genetically

310 Part IV / Diabetes and Obesity
driven to move no more than necessary and to eat as much as possible when food isavailable. There seems to be no “defense” against overeating and a sedentary life (81).Therefore, changing and controlling these behaviors requires a voluntary determinationand willpower. As a consequence, behavioral strategies and techniques are used in inter-vention programs. Some specific techniques that seem important include contracting,self-monitoring, social reinforcement, and modeling (165). In younger children, parentalinvolvement is crucial, focusing more on changing parental guidance behavior thanchanging behavior of the individual child. A prerequisite for successful treatment ofobesity in children is a strongly motivated child and family (172). A family history ofobesity is an important argument for intervention. However, as the risk of obesitygradually increases (16), the optimal timing and content of the intervention must beevaluated further.
Concern has been raised that dieting programs could have negative side effects ongrowth and might also provoke eating disorders, but there seems to be little evidence ofthese complications (135,165,173). However, caution is recommended when givingdieting advice during midadolescence, because some adolescents—mostly girls—arevery much concerned with their body weight and may be too responsive to advice aboutlow-fat food and exercise. As part of an anorectic behavior, some of these girls alreadyhave low intake of energy and fat, and further reduction could have a negative influenceon their growth and health (174).
7.2. PreventionThe size of the problem and the poor outcome of treatment imply that prevention is
the only feasible way to cope with the obesity epidemic. Preventive measures may tar-get individuals, groups, or the whole society and environment (166,175–177), and thefocus of prevention is the same as in treatment, that is, controlling energy intake andexpenditure. Primary prevention (preventing obesity development) is, of course, theultimate goal, but the first step is to try to control the epidemic by stopping the increase.Secondary prevention with early identification of children at risk and proper interven-tion is also of great importance. The introduction of BMI curves and standardized cut-offvalues for classifying obesity in children and adolescents gives health professionals anew screening tool for identifying children at risk (58).
At least in theory, schools are a suitable setting to target children and adolescents byencouraging physical activity and other interventions aimed at preventing obesity.Preventive measures for all children may also act as treatment for already obese childrenand can also minimize the stigmatization. However, school intervention programs havebeen as discouraging as treatment programs. Using health education, the school pro-grams have been trying to decrease fat consumption, increase consumption of fruits andvegetables, promote physical activity, and limit sedentary activities (e.g., televisionviewing). Despite intensive broad-scaled efforts most interventions have failed to reduceobesity prevalence, although some behavioral changes have been observed (178). Onelesson learned, which confirms the notion that eating and physical activity behaviors aremore difficult to change as the children get older, is that strategies aimed at younger chil-dren seem to have better long-term effects than those focused at adolescents (175,178).
However, it should, be emphasized that it is not sufficient to tackle the obesity prob-lem only as behavioral problem (i.e., teaching people to control their eating and activitybehavior). The obesogenic society and environment must also be changed, requiring

Chapter 12 / Obesity and IR in Children 311
coordinated efforts from governments and the private sector (179–181). Several envi-ronmental factors in modern society promote excess energy intake and limit energyexpenditure in children, undermining individual efforts to maintain a healthy bodyweight. Meals eaten away from home in the United States have nearly doubled in thepast decade, with a parallel profound increase in fast food and soft drink consumption.Inexpensive fast food of increasing portion sizes is readily available compared tohealthy food choices such as fruits and vegetables. Fast food and sweets also are avail-able in vending machines and school cafeterias. The result of this is an overconsump-tion of sugar and saturated fat and an underconsumption of fruits and starchyvegetables, fiber, and some micronutrients. An important factor behind these dietarychanges is that the food industry has invested huge sums of money on advertising andmarketing campaigns that directly target children and their parents (111,166,182).
In addition to dietary changes, children and adolescents are becoming more sedentary,spending increasingly more time with computers and videos and watching television.Physical education at school has decreased and traffic in the cities has made the envi-ronment too dangerous for children to move around and play outdoors on their ownafter school. Children are brought to and picked up from school and leisure activities bycar or bus. The drive-through window of fast food restaurants, where a maximum ofenergy can be obtained with minimum effort, is the “image” of the obesity problem (166).
What can be done? Perhaps lessons can be learned from epidemiology and publichealth interventions against other epidemics in children (e.g., infectious diseases andinjuries). In many countries, these epidemics are currently controlled by a combinationof individual and environmental programs that increase parental and child knowledge,skills, and risk awareness and environmental programs that reduce the exposure of the“noxious agent.” For obesity, this implies educational and counseling programs thatincrease parental knowledge and skills about nutrition and risk awareness of obesity(17,183,184) combined with governmental nutritional programs (e.g., in schools; ref.185) that support healthy diets and physical activity (180).
8. SUMMARY AND RECOMMENDATIONS
Obesity has been classified as a modern epidemic, evolving during recent decadesin both industrialized and developing countries. The epidemic also includes childrenand adolescents. Obesity is related to increased morbidity and mortality in a numberof diseases, most importantly NIDDM and CVD. The clinical entity of obesity, hyper-glycemia, dyslipidemia, and hypertension, which is also seen in children and adoles-cents, is referred to as the “metabolic syndrome.” Increased resistance to insulin inliver, muscle, and adipose tissue is regarded as an important explanation behind thedisturbances in glucose and lipid metabolism. IR is closely related to obesity, and vis-ceral fat accumulation seems to have a particularly harmful effect. Although geneticand early nutritional factors may influence the susceptibility to weight gain, themajor underlying cause of the obesity epidemic is the spread of a sedentary Westernlifestyle (i.e., a combination of low physical activity and consumption of high-fat,high-sugar, and high-animal protein diets, with energy intake exceeding energyexpenditure). Attempts to achieve lasting weight reductions in obese adults havebeen disappointing. Although it may be easier to treat obesity in children than inadults, it is obvious that the best strategy is primary prevention targeting all children.However, as obesity can be regarded as an epidemic caused by modern lifestyle,

312 Part IV / Diabetes and Obesity
effective preventive measures must not focus only on individual behavior but also onthe social and physical environment for children, supporting more daily physical activities(not only sports) and healthy diets. This will not be an easy task, because there are a num-ber of factors operating in the opposite direction, including: motorization; restrictingphysical activities both for convenience and safety reasons; pursuit of sedentary recre-ations during leisure time, such as computers, video games, and television; and easyaccess to high-fat/-sugar fast foods. Improving parents’ nutritional knowledge andawareness of the risk of obesity through educational programs and counseling could bea way of achieving a useful “immunization program.” However, it is essential that theentire society be changed to be more sensitive to children and their future health.
REFERENCES1. World Health Organization. Obesity. Preventing and managing the global epidemic, Report of a
WHO Consultation on Obesity, WHO Geneva, 1997.2. Kotani K, Nishida M, Yamashita S, et al. Two decades of annual medical examinations in Japanese
obese children: do obese children grow into obese adults? Int J Obes Relat Met Dis 1997; 21:912–921.3. Mo-suvan L, Junjana C, Puetpaiboon A. Increasing obesity in school children in a transitional soci-
ety and the effect the weight control program. Southeast Asian J of Tropical Medicine and PublHealth 1993; 24:590–594.
4. Freedman DS, Srinivasan SR, Valdez RA, Williamson DF, Berenson GS. Secular increases in rela-tive weight and adiposity among children over two decades; the Bogalusa Heart Study. Pediatrics1997; 99:420–426.
5. Ogden CL, Flegal KM, Carrol MD, Johnson CL. Prevalence and trends in overweight among USChildren and adolescents, 1999–2000. JAMA 2002; 288:1728–1732.
6. Rolland-Cachera MF, Castetbon K, Arnault N, et al. Body mass index in 7-9-y-old French chil-dren: frequency of obesity, overweight and thinness. Int J Obes Relat Metab Disord 2002;26:1610–1616.
7. Petersen S, Brulin C, Bergström E. Increasing prevalence of overweight in young schoolchildren inUmea, Sweden, from 1986 to 2001 Acta Paediatr 2003; 92:848–853.
8. Lobstein T, Frelut ML. Prevalence of overweight among children in Europe. Obes Rev 2003;4:195–200.
9. Huang YC, Wu JY, Yang MJ. Weight-for-height reference and the prevalence of obesity for schoolchildren and adolescents in Taiwan and Fuchien Areas. J Chin Med Assoc 2003; 66:599–606.
10. Joliffe D. Extent of overweight among US children and adolescents from 1971 to 2000. Int J ObesRelat Metab Disord 2004; 28:4–9.
11. Hill AJ, Silver EK. Fat, friendless and unhealthy: 9-year old children’s perception of body shapestereotypes. Int J Obes 1995; 19:423–430.
12. Strauss RS, Pollack HA. Social marginalization of overweight children. Arch Pediatr Adolesc Med2003; 157:746–752.
13. Maher E. Health-related quality of life of severely obese children and adolescents. Child Care HealthChild Care Health Dev 2004; 30:94,95
14. Reilly JJ, Methven E, McDowell ZC, et al. Health consequences of obesity. Arch Dis Child 2003;88:748–752.
15. Must A, Jacques PF, Dallal GE, Bajema CJ, Dietz WH. Long-term morbidity and mortality of over-weight adolescents. New Engl J Med 1992; 327:1350–1355.
16. Whitaker RC, Wright JA, Pepe MS, Seidel KD, Dietz WH. Predicting obesity in young adulthoodfrom childhood and parental obesity. N Engl J Med 1997; 337:869–873.
17. Camus JP. Goutte, diabete, hyperlipemie: un-trisyndrome metabolique (Gout, diabetes, hyperlipi-demia: a metabolic trisyndrome). Rev Rhum Mal Osteoartic 1966; 33:10–14 [French].
18. Reaven GM. Banting Lecture 1988. Role of insulin resistance in human disease. Diabetes 1988;37:1595–1607.
19. Hunter SJ, Garvey WT. Insulin action and insulin resistance: diseases involving defects in insulin recep-tors, signal transduction, and the glucose transport effector system. Am J Med 1998; 105:331–345.

Chapter 12 / Obesity and IR in Children 313
20. Bloomgarden ZT. Insulin resistance: current concepts. Clin Ther 1998; 20:216–231.21. Reaven GM. Hypothesis: muscle insulin resistance is the (“not so”) thrifty genotype. Diabetologia
1998; 41:482–484.22. Masuzaki H, Paterson J, Shinyama H, et al. A transgenic model of visceral obesity and the metabolic
syndrome. Science 2001; 294:2166–2170.23. Shaw JT, Levy JC, Turner RC. The relationship between the insulin resistance syndrome and insulin
sensitivity in the first-degree relatives of subjcets with non-insulin dependent diabetes mellitus.Diabetes Res Clin Pract 1998; 42:91–99.
24. Turner NC, Clapham JC. Insulin resistance, impaired glucose tolerance and non-inulin-dependentdiabetes, pathological mechanisms and treatment: current status and therapeutic possibilities. ProgDrug Res 1998; 51:33–94.
25. Fendri S, Roussel B, Lormeau B, Tribout B, Lalau JD. Insulin sensitivity, insulin action, and fibri-nolysis activity in nondiabetic and diabetic obese subjects. Metabolism 1998; 47:1372–1375.
26. Boden G. Free fatty acids (FFA), a link between obesity and insulin resistance. Front Biosci 1998;3:D 169–175.
27. Fournier AM. Intracellular starvation in the insulin resistance syndrome and type II diabetes mellitus.Med Hypotheses 1998; 51:95–99.
28. Ferrannini E, Camastra S. Relationship between impaired glucose tolerance, non-insulin-dependentdiabetes mellitus and obesity. Eur J Clin Invest 1998; 28(Suppl 2):3–6.
29. Yip J, Facchini FS, Reaven GM. Resistance to insulin-mediated glucose disposal as a predictor ofcardiovascular disease. J Clin Endocrinol Metab 1998;83:2773–2776.
30. Carey DG. Abdominal obesity. Curr Opin Lipidol 1998; 9:35–40.31. Ruderman N, Chisholm D, Pi-Sunyer X, Schneider S. The metabolically obese, normal-weight indi-
vidual revisited. Diabetes 1998; 47:699–713.32. Hong Y, Rice T, Gagnon J, et al. Familial clustering of insulin and abdominal visceral fat: the HER-
ITAGE Family Study. J Clin Endocrinol Metab 1998; 83:4239–4245.33. Staten MA, Totty WG, Kohrt WM. Measurement of fat distribution by magnetic resonance imaging.
Invest Radiol 1989; 24:345–349.34. Caprio S. Insulin resistance in childhood obesity. J Pediatr Endocrinol Metab 2002; 15 Suppl
1:487–492.35. Bergström E, Hernell O, Persson LÅ, Vessby B. Insulin resistance syndrome in adolescents.
Metabolism 1996; 45:908–914.36. Bao W, Srinivasan SR, Wattigney WA, Berensson GS. Persistence of multiple cardiovascular risk
clustering related to syndrome X from childhood to young adulthood. Arch Intern Med 1993;154:1842–1847.
37. Vanhala M, Vanhala P, Kumpusalo E, Halonen P, Takala J. Relation between obesity from childhoodto adulthood and the metabolic syndrome: population based study. BMJ 1998; 317:319.
38. Sinha R, Fisch G, Teague B, et al. Prevalence of impaired glucose tolerance among children and ado-lescents with marked obesity. N Engl J Med 2002; 346:802–810.
39. McGill HC Jr., McMahan CA, Malcom GT, Oalmann MC, Strong JP. Relation of glycohemoglobinand adiposity to atherosclerosis in youth. Pathobiological Determinants of Atherosclerosis in Youth(PDAY) Research Group. Arterioscler Thromb Vasc Biol 1995; 15:431–440.
40. Steinberger J, Daniels SR. Obesity, insulin resistance, diabetes, and cardiovascular risk in children:an American Heart Association scientific statement from the Atherosclerosis, Hypertension, andObesity in the Young Committee (Council on Cardiovascular Disease in the Young) and the DiabetesCommittee (Council on Nutrition, Physical Activity, and Metabolism). Circulation 2003;107:1448–1453.
41. Cook S, Weitzman M, Auinger P, Nguyen M, Dietz WH. Prevalence of a metabolic syndrome phe-notype in adolescents: findings from the third National Health and Nutrition Examination Survey,1988–1994. Arch Pediatr Adolesc Med 2003; 157:821–827.
42. Goran MI, Ball GD, Cruz ML. Obesity and risk of type 2 diabetes and cardiovascular disease in chil-dren and adolescents. J Clin Endocrinol Metab 2003; 88:1417–1427.
43. Srinivasan SR, Elkasabani A, Dalferes ER Jr., Bao W, Berenson GS. Characteristics of young off-spring of type 2 diabetic parents in a biracial (black-white) community-based sample: the BogalusaHeart Study. Metabolism 1998; 47:998–1004.
44. Maffeis C, Corciulo N, Livieri C, et al. Waist circumference as a predictor of cardiovascular andmetabolic risk factors in obese girls. Eur J Clin Nutr 2003; 57:566–572.

314 Part IV / Diabetes and Obesity
45. McCarthy HD, Ellis SM, Cole TJ. Central overweight and obesity in British youth aged 11–16 years:cross sectional surveys of waist circumference. BMJ 2003; 326:624–626.
46. Amiel SA, Sherwin RS, Simonsson DC, Lauritano AA, Tamborlane WT. Impaired insulin action inpuberty contributing factor to poor glycemic control in adolescents with diabetes. N Engl J Med1986; 315:215–219.
47. Travers SH, Labarta JI, Gargosky SE, Rosenfeld RG, Jeffers BW, Eckel RH. Insulin-like growth fac-tor binding protein-I levels are strongly associated with insulin sensitivity and obesity in early pubertalchildren. J Clin Endocrinol Metab 1998; 83:1935–1939.
48. Pinhas-Hamiel O, Dolan LM, Daniels SR, Standiford D, Khoury PR, Zeitler P. Increased incidenceof non-insulin-dependent diabetes mellitus among adolescents. J Pediatr 1996; 128:608–615.
49. Fagot-Campagna A, Pettitt DJ, Engelgau MM, et al. Type 2 diabetes among North American childrenand adolescents: an epidemiologic review and a public health perspective. J Pediatr 2000;136:664–672.
50. Vital and health statistics. NCHS growth curves for children, birth-18 years. Hyattsville: Departmentof Health, Education and Welfare; United States series 11 - No 165; DHEW Publication No (PHS)78–1650, 1977.
51. Rolland-Cachera MF, Cole TJ, Sempe M, Tichet J, Rossignol C, Charraud A. Body mass indexvariations—centiles from birth to 87 years. Eur J Clin Nutr 1991; 45:13–21.
52. Hammer LD, Kraemer HC, Wilson DM, Ritter PL, Dornbusch SM. Standardized percentile curvesof body mass index for children and adolescents. Am J Dis Child 1991; 145:259–263.
53. Karlberg J, Luo ZC, Albertsson-Wikland K. Body mass index reference values (mean and SD) forSwedish children. Acta Paediatr 2001; 90:1427–1434. (Erratum in: Acta Paediatr 2002; 91:362.)
54. Reilly JJ. Assessment of childhood obesity: national reference data or international approach? ObesRes 2002; 10:838–840.
55. Must A, Dallal GE, Dietz WH. Reference data for obesity: 85th and 95th percentiles of body massindex (wt/ht2) and triceps skinfold thickness Am J Clin Nutr 1991;53:839–846. (Erratum appears inAm J Clin Nutr 1991; 54:773.)
56. Rolland-Cachera MF, Deheeger M, Bellisle F, Sempe M, Guilloud-Bataille M, Patois E.Adiposity rebound in children: a simple indicator for predicting obesity. Am J Clin Nutr 1984;39:129–135.
57. Dietz WH. “Adiposity rebound”: reality or epiphenomenon? Lancet 2000; 356:2027,2028.58. Cole TJ, Bellizzi MC, Flegal KM, Dietz WH. Establishing a standard definition for child overweight
and obesity worldwide: international survey. BMJ 2000; 320:1–6.59. Bouchard C, Tremblay A, Després JP, et al. The response to long-term overfeeding in identical twins.
N Engl J Med 1990; 322:1477–1482.60. Ravussin E, Swinburn BA. Pathophysiology of obesity. Lancet 1992; 340:404–408.61. Rosenbaum M, Leibel RL, Hirsch J. Obesity. N Engl J Med 1997; 337:396–407.62. Bouchard C, Tremblay A. Genetic influence on the response of body fat and fat distribution to pos-
itive and negative energy balances in human identical twins. J Nutr 1997; 127(Suppl 5):943S–947S.63. Loos RJ, Bouchard C. Obesity—is it a genetic disorder? J Intern Med 2003; 254:401–425.64. Leibel RL, Rosenbaum M, Hirsch J. Changes in energy expenditure resulting from altered body
weight. N Engl J Med 1995; 332:1201–1205.65. Chagnon YC, Rankinen T, Snyder EE, Weisnagel SJ, Perusse L, Bouchard C. The human obesity
gene map: the 2002 update. Obes Res 2003; 11:313–367.66. Farooqi IS, O’Rahilly S. Recent advances in the genetics of severe childhood obesity. Arch Dis Child
2000; 83:31–34.67. Montague CT, Farooqi IS, Whitehead JP, et al. Congenital leptin deficiency is associated with severe
early-onset obesity in humans. Nature 1997; 387:903–908.68. Clement K, Ferre P. Gentics and the pathophysiology of obesity. Pediatr Res 2003; 53:721–725.69. Chandran M, Phillips SA, Ciaraldi T, Henry RR. Adiponectin: more than just another fat cell
hormone? Diabetes Care 2003; 26:2442–2450.70. Zhang Y, Proenca R, Maffei M, Barone M, Leopold L, Friedman JM. Positional cloning of the mouse
obese gene and its human homologue. Nature 1994; 372:425–432 (Erratum, Nature 1995; 374:479. )71. Rosenbaum M, Nicolson M, Hirsch J, et al. Effects of gender, body composition, and menopause on
plasma concentrations of leptin. J Clin Endocrinol Metab 1996; 81:3424–3427.72. Houseknecht KL, Portocarrero CP. Leptin and its receptors: regulators of whole-body energy home-
stasis. Domest Anim Endocrinol 1998; 15:457–475.

Chapter 12 / Obesity and IR in Children 315
73. Margetic S, Gazzola C, Pegg GG, Hill RA. Leptin: a review of its peripheral actions and interac-tions. Int J Obes Relat Metab Disord 2002; 26:1407–1433.
74. Steinberger J, Steffen L, Jacobs DR Jr., Moran A, Hong CP, Sinaiko AR. Relation of leptin to insulinresistance syndrome in children. Obes Res 2003; 11:1124–1130.
75. Shalitin S, Phillip M. Role of obesity and leptin in the pubertal process and pubertal growth—areview. Int J of Obesity 2003; 27:869–874.
76. Morton NM, Holmes MC, Fievet C, et al. Improved lipid and lipoprotein profile, hepatic insulinsensitivity, and glucose tolerance in 11beta-hydroxysteroid dehydrogenase type 1 null mice. J BiolChem 2001; 276:41,293–41,300. Epub 2001 Aug 23.
77. Rask E, Walker BR, Soderberg S, et al. Tissue-specific changes in peripheral cortisol metabolism inobese women: increased adipose 11β-hydroxysteroid dehydrogenase type 1 activity. J ClinEndocrinol Metab. 2002; 87:3330–3336.
78. Walker BR. 11β-hydroxysteroid dehydrogenase type 1 in obesity. Obes Res 2004; 12:1–3.79. Engeli S, Bohnke J, Feldpausch M, et al. Regulation of 11β-HSD genes in human adipose tissue:
influence of central obesity and weight loss. Obes Res 2004; 12:9–17.80. Neel JV. Diabetes mellitus: a “thrifty” genotype rendered detrimental by “”progress”? Am J Hum
Genet 1962; 14:353–362.81. Chakravarthy MV, Booth FW. Eating, exercise, and “thrifty” genotypes: connecting the dots toward
and evolutionary understanding of modern chronic diseases. J Appl Physiol 2004; 96:3–10.82. Lindeberg S, Nilsson-Ehle P, Terént A, Vessby B, Schersten B. Cardiovascular risk factors in a
Melanesian population apparently free from stroke and ischemic heart disease: the Kitava study.J Intern Med 1994; 236: 331–340.
83. Hales CN, Barker DJP. Type 2 (non-insulin-dependent) diabetes mellitus: the thrifty phenotypehypothesis. Diabetologia 1992; 35:595–601.
84. Ravelli GP, Stein ZA, Susser MW. Obesity in young men after famine exposure in utero and earlyinfancy. N Engl J Med 1976; 295:349–353.
85. Forsdahl A. Are poor living conditions during childhood and adolescence an important risk factorfor arteriosclerotic heart disease? Br J Prev Med 1977; 31:91–95.
86. Barker DJP, Hales CHD, Osmond C, Phipps K, Clark PMS. Type 2 (non-insulin dependent) diabetesmellitus, hypertension and hyperlipidemia (syndrome X): relation to reduced fetal growth.Diabetologia 1993; 36:62–67.
87. Barker DJP. Fetal origins of coronary heart disease. BMJ 1995;311:171–174.88. Lithell HO, McKeigue PM, Berglund L, Mohsen R, Lithell UB, Leon DA. Relation of size at birth
to non-insulin dependent diabetes and insulin concentrations in men aged 50–60 years. BMJ 1996;312:406–410.
89. Phillips DI. Birth weight and the future development of diabetes. Diabetes Care 1998; 21(Suppl2):B150–B155.
90. Law CM, Gordon GS, Shiell AW, Barker DJP, Hales CN. Thinness at birth and glucose tolerance inseven-year-old children. Diabet Med 1994; 1224–1229.
91. Yajnik CS, Fall CHD, Vaidya U, et al. Fetal growth and glucose and insulin metabolism in four-year-old Indian children. Diab Med 1995; 12:330–336.
92. Crowther NJ, Cameron N, Trusler J, Gray IP. Association between poor glucose tolerance and rapidpost natal weight gain in seven-year-old children. Diabetologia 1998; 41:1163–1167.
93. Bhargava SK, Sachdev HS, Fall CHD, et al. Relation of serial changes in childhood body-mass indexto impaired glucose tolerance in young adulthood. NEJM 2004; 350:865–875.
94. Popkin BM, Richards MK, Montiero CA. Stunting is associated with overweight in children of fournations that are undergoing the nutritional transition. J Nutr 1996; 126:3009–3016.
95. Nyirenda MJ, Seckl JR. Intrauterine events and the programming of adulthood disease: the role offetal glucocorticoid exposure. Int J Mol Med 1998; 2:607–614.
96. Paneth N. Early origin of coronary heart disease (the “Barker hypothesis”). BMJ 1995;310:411–412.
97. Clifford TJ. Breast feeding and obesity. BMJ 2003; 327:879,880.98. Dietz WH. Breastfeeding may help prevent childhood overweight. JAMA 2001; 285:2506,2507.99. Parsons TJ, Power C, Logan S, Summerbell CD. Childhood predictors of adult obesity: a systematic
review. Int J Obes Relat Metab Disord. 1999; 23(Suppl 8):1S–107S.100. Parsons TJ, Power C, Manor O. Fetal and early life growth and body mass index from birth to early
adulthood in 1958 British cohort: longitudinal study. BMJ 2001; 323:1331–1335.

316 Part IV / Diabetes and Obesity
101. Rogers I, EURO-BLCS Study Group. The influence of birthweight and intrauterine environment onadiposity and fat. Int J Obes Relat Metab Disord 2003; 27:755–777.
102. Blom L, Persson LÅ, Dahlquist G. A high linear growth is associated with an increased risk of child-hood diabetes mellitus. Diabetologia 1992; 35:528–533.
103. Singhal A, Wells J, Cole TJ, Fewtrell M, Lucas A. Programming of lean body mass: a link betweenbirth weight, obesity, and cardiovascular disease? Am J Clin Nutr 2003; 77:726–730.
104. Eriksson J, Forsen T, Osmond C, Barker D. Obesity from cradle to grave. Int J Obes Relat MetabDisord 2003; 27:722–727.
105. World Health Organization. Report of a Joint WHO/FAO Expert consultation. Diet, nutrition, andthe prevention of chronic diseases. Geneva: WHO Tech Rep Ser no 916. WHO: Geneva, 2002.
106. James WPT, Sahakian BJ. Energetic Significance in Relation to Obesity. In: Tsang RC, Nichols BL,eds. Nutrition and Child Health. Perspectives for the 1980s. Alan R Liss, New York, 1981, pp.25–33.
107. Schoeller DA, Bandini LG, Dietz WH. Inaccuracies in self-reported intake identified by comparisonwith the double labelled water method. Can J Physiol Pharmacol 1990; 68:941–949.
108. Bergström E, Hernell O, Persson LÅ. Dietary changes in Swedish adolescents. Acta Paediatr 1993;82:472–480.
109. Whitehead RG, Paul AA, Cole TJ. Trends in food energy intakes throughout childhood from one to18 years. Hum Nutr Appl Nutr 1982; 36:57–62.
110. Troiano RP, Briefel RR, Carroll MD, Bialostosky K. Energy and fat intakes of children and adoles-cents in the united states: data from the national health and nutrition examination surveys. Am J ClinNutr 2000; 72 Suppl 5:1343S–1353S.
111. Cavadini C, Siega-Riz AM, Popkin BM. US adolescent food intake trends from 1965 to 1996. ArchDis Child 2000; 83:18–24.
112. Rolls BJ. The role of energy density in the overconsumption of fat. J Nutr. 2000; 130 (Suppl):268S–271S.
113. McGloin AF, Livingstone MB, Greene LC, et al. Energy and fat intake in obese and lean children atvarying risk of obesity. Int J Obes Relat Metab Disord 2002; 26:200–207.
114. Rolland-Cachera MF, Deheeger M. Nutrient balance and android body fat distribution: why not arole for protein? Am J Clin Nutr 1997; 64:663,664.
115. Gannon MC, Nuttall FQ. Physiological doses of oral casein affect hepatic glycogen metabolism innormal food-deprived rats. J Nutr 1995; 125:1159–1166.
116. Ludwig DS. Dietary glycemic index and the regulation of body weight. Lipids 2003; 38:117–121.117. Foster-Powell K, Holt SH, Brand-Miller JC. International table of glycemic index and glycemic load
values: 2002. Am J Clin Nutr 2002; 76:5–56.118. Ludwig DS, Majzoub JA, Al-Zahrani A, Dallal GE, Blanco I, Roberts SB. High glycemic index
foods, overeating, and obesity. Pediatrics 1999; 103:E26.119. Bell SJ, Sears B. Low-glycemic-load diets: impact on obesity and chronic diseases. Crit Rev Food
Sci Nutr 2003; 43:357–377.120. Coulston AM. Sugar and sugars: myths and realities. J Am Diet Assoc 2002; 102:351–353.121. Murphy SP, Johnson RK. The scientific basis of recent US guidance on sugars intake. Am J Clin
Nutr 2003; 78:827S–833S.122. St-Onge MP, Keller KL, Heymsfield SB. Changes in childhood food consumption patterns: a cause
for concern in light of increasing body weights. Am J Clin Nutr 2003; 78:1068–1073.123. Harnack L, Stang J, Story M. Soft drink consumption among US children and adolescents: nutri-
tional consequences. J Am Diet Assoc 1999; 99:436–441.124. Ludwig DS, Peterson KE, Gortmaker SL. Relation between consumption of sugar-sweetened drinks
and childhood obesity: a prospective, observational analysis. Lancet 2001; 357:505–508.125. Saris WHM, Asp NGL, Björck I, Blaak E, Bornet F, Brouns F, et al. Functional food science and
substrate metabolism. Br J Nutr 1998;80(Suppl):S47–S75.126. Ludwig DS, Pereira MA, Kroenke CH, et al. Dietary fiber, weight gain, and cardiovascular disease
risk factors in young adults. JAMA 1999; 282:1539–1546.127. Grey N, Kipnis DM. Effect of diet composition on the hyperinsulinemia of obesity. N Engl J Med
1971; 285:827–831.128. Fukagawa NK, Anderson JW, Hogeman G, et al. High-carbohydrate, high-fiber diets increase
peripheral insulin sensitivity in healthy young and old adults. Am J Clin Nutr 1990;52:524–528.
Chapter 12 / Obesity and IR in Children 317
129. Barnard RJ, Roberts CK, Varon SM, Berger JJ. Diet-induced insulin resistance precedes otheraspects of the metabolic syndrome. J Appl Physiol 1998; 84:1311–1315.
130. Kris-Etherton P, Daniels SR, Eckel RH, et al. AHA scientific statement: summary of the ScientificConference on Dietary Fatty Acids and Cardiovascular Health. Conference summary from theNutrition Committee of the American Heart Association. J Nutr 2001; 131:1322–1326.
131. Marckman P, Sandström B, Jespersen J. Favorable long-term effect of a low-fat/high-fiber diet onhuman blood coagulation and fibrinolysis. Arterioscler Thromb 1993; 3:306–318.
132. Stein DT, Stevenson BE, Chester MW, et al. The insulinotropic potency of fatty acids is influencedprofoundly by their chain length and degree of saturation. J Clin Invest 1997; 100:398–403.
133. Vessby B. Dietary fat, fatty acid composition in plasma and the metabolic syndrome. Curr OpinLipidol 2003; 14:15–19.
134. Vessby B, Unsitupa M, Hermansen K, et al. KANWU Study. Substituting dietary saturated formonounsaturated fat impairs insulin sensitivity in healthy men and women: The KANWU Study.Diabetologia 2001; 44:312–319.
135. ESPGAN Committee on Nutrition: Aggett PJ, Haschke F, Heine W, et al. Committee report: child-hood diet and prevention of coronary heart disease. J Pediatr Gastroenterol Nutr 1994; 19:261–269.
136. Hornstra G, Barth CA, Galli C, et al. Functional food science and the cardiovascular system. Br JNutr 1998; 80(Suppl 1):S113–S146.
137. Knuiman JT, Westenbrink S, van der Heyden L, et al. Determinants of total and high lipoprotein cho-lesterol in boys from Finland, The Netherlands, Italy, The Philippines and Ghana with special refer-ence to diet. Hum Nutr Clin Nutr 1983; 37C:237–254.
138. Lapinleimu H, Viikari J, Jokinen E, et al. Prospective randomised trial in 1062 infants of diets lowin saturated fat and cholesterol. Lancet 1994; 345:471–476.
139. Pesonen E, Viikari J, Räsänen L, Moilanen T, Turtinen J, Åkerblom HK. Nutritional and genetic con-tributions to serum cholesterol concentration in a children follow-up study. Acta Paediatr 1994;83:378–382.
140. Lehtimäki T, Moilanen T, Porkka K, et al. Associations between serum lipids and apolipoprotein Ephenotype is influenced by diet in a population-based sample of free-living children and youngadults: the Cardiovascular Risk in Young Finns Study. J Lipid Res 1995; 36:653–661.
141. Lorgeril M, Renaud S, Mamelle N, et al. Mediterranean alpha-linolenic acid-rich diet in secondaryprevention of coronary heart disease. Lancet 1994; 343:1454–1459.
142. Andersen RE, Crespo CJ, Bartlett SJ, Cheskin LJ, Pratt M. Relationship of physical activity and tele-vision watching with body weight and level of fatness among children: results from the ThirdNational Health and Nutrition Examination Survey. JAMA 1998; 279:938–942.
143. Moore LL, Gao D, Bradlee ML, et al. Does early physical activity predict body fat change throughoutchildhood? Prev Med 2003; 37:10–17.
144. Reilly JJ, McDowell ZC. Physical activity interventions in the prevention and treatment of paedi-atric obesity: systematic review and critical appraisal. Proc Nutr Soc 2003; 62:611–619.
145. Sallis JF, Prochaska JJ, Taylor WC. A review of correlates of physical activity of children andadolescents. Med Sci Sports Exerc 2000; 32:963–975.
146. Barnard RJ, Wen SJ. Exercise and diet in the prevention and control of the metabolic syndrome.Sports Med 1994; 18:218–228.
147. Helmrich SP, Ragland DR, Leung RW, Paffenbarger RS Jr. Physical activity and reduced occurrenceof non-insulin diabetes mellitus. N Engl J Med 1991; 325:147–152.
148. Mayer-Davies EJ, D’Agostino R Jr., Karter AJ, et al. Intensity and amount of physical activity inrelation to insulin sensitivity; the Insulin Resistance Atherosclerosis Study. JAMA 1998;279:669–674.
149. Andersson A, Sjodin A, Olsson R, Vessby B. Effects of physical exercise on phospholipid fatty acidcomposition in skeletal muscle. Am J Physiol 1998; 274:E432–E438.
150. Goodyear LJ, Kahn BB. Exercise, glucose transport, and insulin sensitivity. Annu Rev Med 1998;49:235–261.
151. Hargraves M. 1997 Sir William Refshauge Lecture. Skeletal muscle glucose metabolism duringexercise: implications for health and performance. J Sci Med Sport 1998; 1:195–202.
152. Bouchard C, Despres JP. Physical activity and health: atherosclerosis, metabolic and hypertensivediseases. Res Q Exerc Sport 1995; 66:268–275.
153. Bergström E, Hernell O, Persson LÅ. Endurance running performance in relation to cardiovascularrisk indicators in adolescents. Int J Sports Med 1997; 18:300–307.

318 Part IV / Diabetes and Obesity
154. Sallis JF, Patterson TL, Buono MJ, Nader PR. Relation of cardiovascular fitness and physical activ-ity to cardiovascular disease risk factors in children and adults. Am J Epidemiol 1988; 127:933–941.
155. Epstein LH, Coleman KJ, Myers MD. Exercise in treating obesity in children and adolescents. MedSci Sports Exerc 1996; 28:428–435.
156. Drenowski A, Specter SE. Poverty and obesity: the role of energy density and energy costs. Am JClin Nutr 2004; 79:6–16.
157. Gortmater SL, Must A, Perrin JM, Sobol AM, Dietz WH. Social and economic consequences ofoverweight in adolescence and young adults. N Engl J Med 1993; 329:1008–1012.
158. Marmot M. Socioeconomic determinants of CHD mortality. Int J Epidemiol 1989; 18(Suppl1):196–202.
159. Björntorp P. Do stress reactions cause abdominal obesity and comorbidities? Obes Rev 2001;2:73–86.
160. Wang Y, Monteiro C, Popkin BM. Trends of obesity and underweight in older children and adoles-cents in the United States, Brazil, China, and Russia. Am J Clin Nutr 2002; 75:971–977.
161. Lissau I, Sorensen TI. Parental neglect during childhood and increased risk of obesity in youngadulthood. Lancet 1994; 343:324–327.
162. Strauss RS, Knight J. Influence of the home environment on the development of obesity in children.Pediatrics 1999; 103:e85.
163. Jain A, Sherman SN, Chamberlin DL, Carter Y, Powers SW, Whitaker RC. Why don’t low-incomemothers worry about their preschoolers being overweight? Pediatrics 2001; 107:1138–1146.
164. Epstein LH, Valoski A, Wing RR, McCurley J. Ten-year follow-up of behavioral, family-based treat-ment for obese children. JAMA 1990; 264:2519–2523.
165. Epstein LH, Myers MD, Raynor HA, Saelens BE. Treatment of pediatric obesity. Pediatrics 1998;101:554–570.
166. Ebbeling CB, Pawlak DB, Ludwig DS. Childhood obesity: public-health crisis, common sense cure.Lancet 2002; 360:473–482.
167. Summerbell CD, Ashton V, Campbell KJ, Edmunds L, Kelly S, Waters E. Interventions for treatingobesity in children. Cochrane Database Syst Rev 2003; (3):CD001872.
168. Gahagan S. Child and adolescent obesity. Curr Probl Pediatr Adolesc Health Care 2004; 34:6–43.169. Epstein LH, Valoski AM, Kalarchian MA, McCurley J. Do children lose and maintain weight easier
than adults: a comparison of child and parent weight changes from six months to ten years. Obes Res1995; 3:411–417.
170. Yanovski JA, Yanovski SZ. Treatment of pediatric and adolescent obesity. JAMA 2003;289:1851–1853.
171. Hart K, Bishop J, Truby H. Changing children’s diets: developing methods and messages. J HumNutr Diet 2003; 16:365,366.
172. Denzer C, Reithofer E, Wabitsch M, Widhalm K. The outcome of childhood obesity managementdepends highly upon patient compliance. Eur J Pediatr 2004; 163:99–104.
173. Olson RE. The dietary recommendations of the American Academy of Pediatrics. Am J Clin Nutr1995; 61:271–273.
174. Borresen R, Rosenvinge JH. Body dissatisfaction and dieting in 4,952 Norwegian children aged11–15 years: less evidence for gender and age differences. Eat Weight Disord 2003; 8:238–241.
175. Campbell K, Waters E, O’Meara S, Summerbell C. Interventions for preventing obesity in child-hood. A systematic review. Obes Rev 2001; 2:149–157.
176. Barlow SE, Dietz WH. Obesity evaluation and treatment: expert committee recommendations. TheMaternal and Child Health Bureau, Health Resources and Services Administration and theDepartment of Health and Human Services. Pediatrics 1998; 102:E29.
177. Krebs NF, Jacobson MS, American Academy of Pediatrics Committee on Nutrition. Prevention ofpediatric overweight and obesity. Pediatrics 2003; 112:424–430.
178. Story M. School-based approaches for preventing and treating obesity. Int J Obes Relat MetabDisord 1999; 23 Suppl 2:S43–S51.
179. Blumenthal SJ. A public health approach to decreasing obesity. JAMA 2002; 288:2178,2179.180. Hill JO, Peters JC. Environmental contributions to the obesity epidemic. Science 1998;
280:1371–1374.181. Larkin M. Can cities be designed to fight obesity? Lancet 2003; 362:1046,1047.182. Nestle M. Food politics: how the food industry influences nutrition and health. University of
California Press, Berkley, 2002.

Chapter 12 / Obesity and IR in Children 319
183. Etelson D, Brand DA, Patrick PA, Shirali A. Childhood obesity: do parents recognize this healthrisk? Obes Res 2003; 11:1362–1368.
184. Maynard LM, Galuska DA, Blanck HM, Serdula MK. Maternal perceptions of weight status of chil-dren. Pediatrics 2003; 111(5 Pt 2):1226–1231.
185. Briggs M, Safaii S, Beall DL, American Dietetic Association, Society for Nutrition Education,American School Food Service Association. Position of the American Dietetic Association, Societyfor Nutrition Education, and American School Food Service Association—nutrition services: anessential component of comprehensive school health programs. J Am Diet Assoc 2003; 103:505–514.


From: Preventive Nutrition: The Comprehensive Guide for Health Professionals, Third EditionEdited by: A. Bendich and R. J. Deckelbaum © Humana Press Inc., Totowa, NJ
321
13 Prevention of Pediatric ObesityExamining the Issues and ForecastingResearch Directions
Myles S. Faith, Christina J. Calamaro,Angelo Pietrobelli, Meredith S. Dolan,David B. Allison, and Steven B. Heymsfield
KEY POINTS
● The prevalence of childhood obesity has dramatically increased during the past 20 to30 yr, paralleling the trends seen in adults.
● Childhood obesity is associated with hypertension, hyperinsulinemia, glucose intoler-ance, type 2 diabetes, dislipidemias, and other comorbidities.
● Identifying specific environmental contributors to childhood obesity may help to guidethe development of novel prevention strategies.
● School-based programs targeting reduced television viewing have been shown to helpprevent weight gain in children.
● Coordinated efforts between the food industry and government policy changes may beat the forefront of future obesity prevention efforts.
1. INTRODUCTION
The obese community is taking a strong stance on the prevention of childhood obe-sity. (We use the term “obesity” in this chapter, but acknowledge Centers for DiseaseControl and Prevention’s definitions of childhood “overweight” as any body mass index[kg/m2] equal to or exceeding the age-sex-specific 95th percentile for BMI, and “at riskfor overweight” as any BMI between the 85th and 95th percentiles.) Unlike other issuesfor which there is less consensus, obesity and other health researchers have placed obe-sity prevention at the top of the research agenda. Given the increasing prevalence ofpediatric obesity in the United States and its pervasive health and economical costs(1,2), various health organizations have clearly prioritized research to better understandthe causes of obesity and to promote the development of innovative prevention strate-gies (3,4). This interest is exemplified by the Healthy People 2010 Objectives, which

322 Part IV / Diabetes and Obesity
aim to decrease the prevalence of excessive weight among adolescents from 11% (therate in 1988–1994) to 5% by 2010 (5).
In an important position paper in 1994, the National Institute of Diabetes and Digestiveand Kidney Diseases’ (NIDDK) National Task Force on Prevention and Treatment ofObesity prepared a call to action, which called the prevention of obesity “the most com-pelling new research need in the obesity field today” (6). Other prominent scientific bod-ies, including the Institute of Medicine at the National Academy of Sciences, also calledfor more research into the prevention of obesity (4). Most recently, a National Institutesof Health (NIH) workshop, “Pathways to Obesity Prevention,” summarized the interimfindings of 20 ongoing pilot obesity prevention studies targeting children and adults (7).This workshop concluded that the existing “treatment” paradigm may not be the optimalmodel for prevention and may need to bridge conceptual frameworks from the fields ofbasic science, health promotion, and risk reduction. Figure 1 highlights this framework.
This chapter examines issues in the prevention of childhood, rather than adulthood,obesity. Therefore, prevention efforts involving worksite programs or large-scale com-munity efforts targeting adults are not included. Detailed discussions on these programsare available elsewhere (8–10). The chapter is broadly divided into four sections. Thefirst section discusses why the prevention of childhood obesity is a high priority. Thesecond section reviews causal mechanisms of childhood obesity, with attention to envi-ronmental factors that may have contributed to the recent increases in prevalence of
Fig. 1. Views of obesity prevention and research from the NIH “Pathways toPrevention” Workshop. (A) depicts a framework in which prevention is essentially con-ceptualized as treatment of subclinical obesity. (B) depicts a framework in which pre-vention is conceptualized as combining knowledge from the obesity research field withknowledge and strategies from the broader field of health promotion. (From ref. 7.)

Chapter 13 / Pediatric Obesity Prevention 323
childhood obesity. The third section reviews existing programs for the prevention ofchildhood obesity as well as their clinical efficacy. Finally, the fourth section examinestheoretical issues for future prevention research regarding children and adolescents. Weconclude by reviewing practical clinical recommendations from the American Academyof Pediatrics. Please also see Chapters 12 and 14.
2. PRIORITIZING THE PREVENTION OF CHILDHOOD OBESITY
2.1. Increasing Prevalence of Childhood ObesityBroadly speaking, obesity can be defined as an excess of adiposity. Although adipose
tissue cannot be directly measured in living humans, various indirect measures are avail-able for use with children and adolescents (11,12). These measures include the BMI (13),weight-for-stature index (13), skinfold measures (14), bioelectrical impedance analysis(15), and dual-energy X-ray absorptiometry (14–16). More detailed descriptions of theadvantages and limitations of these methodologies are provided elsewhere (11,12,17).The most recent data on the prevalence of childhood obesity comes from the fourthNational Health and Nutrition Examination Survey, a nationally representative surveyof the US civilian, noninstitutionalized population. “At risk for overweight” wasdefined as any BMI-for-age score between the 85th and 95th percentiles; using scoresfrom the 1970s as the reference comparison group, 25% of all children ages 6 to 19 yrwho were measured between 1999 and 2000 were classified as “at risk for overweight.”The prevalence of “overweight,” defined as any BMI score greater than or equal to the95th percentile, was 15.5% among 12- to 19-yr-olds, 15.3% among 6- to 11-yr-olds, and10.4% among 2- to 5-yr-olds. Comparable estimates from 1988 to 1994 were 10.5, 11.3,and 7.2%, respectively.
The rise in prevalence of obesity has been particularly prominent among non-HispanicAfrican-American and Mexican-American adolescents. The prevalence in these groupsincreased more than 10% between the years 1988–1994 and 1999–2000, with more than23% of non-Hispanic African-American and Mexican-American adolescents beingclassified as overweight in 1999–2000. This prevalence increased 13% amongMexican-American males during this period. Among males evaluated in 1999–2000,the prevalence of being overweight was 12.8% for non-Hispanic Caucasian adolescents,20.7% for non-Hispanic African-American adolescents, and 27.5% for Mexican-American adolescents.
Studies that have used skinfold measures to assess subcutaneous body fat have alsodocumented an increased prevalence of childhood and adolescent obesity over the pastseveral decades (18–24). Kuczmarski (23) studied changes in the median value of tricepsskinfold thickness between 1963–1965 and 1976–1980. He noted a substantial increase inthe median triceps skinfold measurement over time, particularly among males ages 6 to11 yr and females ages 12 to 17 yr. Changes were less notable for children younger thanage 6 yr. Also noteworthy was the increasing skinfold thickness corresponding to the 95thpercentile of the population. This increase was greatest for males ages 6 to 11 yr.
A more recent study by McCarthy et al. (25) examined changes in waist circumfer-ences in British children ages 11 to 16 yr. Using data from national cross-sectionalnutritional surveys administered in 1977, 1987, and 1997, they found that the averagewaist circumference score sharply increased across the years. Specifically, the meanincreased by 6.9 ± 0.84 cm and 6.2 + 1.02 cm for males and females, respectively. By

324 Part IV / Diabetes and Obesity
1997, 28% of the males and 38% of the females had waist circumference scores thatexceeded the 91st percentiles that existed for boys and girls in 1977–1978.
3. COMORBIDITIES IN CHILDHOOD
A mounting number of studies have documented the health risks of pediatric obe-sity. These risks include elevated blood pressure, glucose intolerance, hyperinsulinimia,dyslipidemias, and type 2 diabetes (26).
3.1. Blood PressureSeveral studies have documented an association between adiposity and elevated
blood pressure among pediatric and adult samples (27–30). For example, the Muscatinestudy of adolescents and young adults found that hypertension was twice as prevalentamong overweight than normal-weight subjects (29). Another study examined datafrom more than 3000 males and females ages 5 to 18 yr (30) and found that fatness inexcess of 25 and 30% of total body mass in males and in females, respectively, wasassociated with increased risk for hypertension. Similar findings were also noted among5- and 6-yr-old Hispanic children (31). A recent study also found that compared to non-obese adolescents, obese adolescents had greater cardiac mass and increased isovolu-mic relaxation time, which are indicative of increased heart work (32). Recently,Daniels et al. (33) examined the predictors of left atrial enlargement in children andadolescents with essential hypertension. This condition is especially concerning givenits association with cardiovascular disease and stroke in adults. In a sample of 112adolescents, BMI was significantly elevated among participants with left atrial enlarge-ment compared to those without the condition.
3.2. Type 2 Diabetes Mellitus, Hyperinsulinemia, and Glucose IntoleranceBody fatness is a reliable correlate of hyperinsulinemia and glucose intolerance
among adolescent males and females (34–38). It has been proposed that hyperinsuline-mia may underlie the association of obesity, hypertension, and glucose intolerance (39).Although most studies have used adult subjects, there are supportive data from pediatricsamples (37,40). To the extent of accuracy in the model, possible mechanisms includeincreased sodium retention, stimulation of the central nervous system, and abnormalvascular regulation (32).
Impaired glucose tolerance (IGT) is a condition that is indicated by elevated bloodsugar levels (but not to levels high enough for a diagnosis of type 2 diabetes). A clinic-based study found IGT in 25% of obese children ages 4 to 11 yr and 21% of obese chil-dren ages 11 to 18 yr (41). Moreover, 14 girls in the sample had polycystic ovarysyndrome (PCOS)—a disorder that is associated with menstrual irregularities, hirsutismcaused by high androgen levels, infertility, and cysts on the ovaries. Compared to obesegirls without PCOS, obese girls with POS are more likely to have metabolic derange-ments that include insulin resistance (IR) (42).
IR, another precursor to type 2 diabetes, is also related to childhood obesity. (43). Ina school-based study of more than 12,000 boys and girls in the fifth to eighth grades,Sinaiko et al. (44) found significant associations between IR and body fat. The authorsfound evidence for increased body fat, elevated trigylcerides and low-density lipoprotein(LDL) cholesterol, reduced high-density lipoprotein (HDL) cholesterol, and elevated

Chapter 13 / Pediatric Obesity Prevention 325
blood pressure among the most insulin-resistant children. This suggests the potentialemergence of a “metabolic syndrome” during childhood.
Pinhas-Hamel and associates (45) reported a striking increase in the number of chil-dren diagnosed with type 2 diabetes mellitus in the primary care setting. In an analysisof 1027 children and adolescents attending a Cincinatti clinic, only 4% were diagnosedwith type 2 diabetes mellitus before 1992. By 1994, 16% of new cases of type 2 dia-betes were diagnosed in that age group, with 10- to 19-yr-olds representing 33% ofthose cases. This translated into a 10-fold increase in the incidence of diabetes withinthe 10- to 19-yr age group. Within this sample, risk factors for a positive diagnosisincluded family history, ethnicity (greater risk in African-Americans), and excessiveweight (45).
3.3. Lipids and LipoproteinsPediatric obesity is associated with elevated levels of total cholesterol, LDL choles-
terol, and triglycerides and decreased levels of HDL cholesterol (46–49). Furthermore,there appears to be an association between central adiposity and adverse lipid profiles thatis independent of total body fat (50). This association is more pronounced among indi-viduals who have already begun sexual development and have moderate-to-high levelsof total body fat (50). Other studies measuring body composition have produced com-parable findings regarding children’s lipid profiles (51,52).
Using nuclear magnetic resonance spectroscopy, Freedman et al. (53) tested the cor-relates of LDL and very low-density lipoprotein (VLDL) in 10- to 17-yr-olds from theBogalusa Heart Study. They found that levels of triglycerides, insulin, and relativeweight were positively associated with the particle size of VLDL and were negativelyassociated with LDL particle size. Children who were at risk for excessive weight orwho were overweight were 2.4 times as likely as normal-weight children to have ele-vated total cholesterol, diastolic blood pressure, LDL cholesterol, systolic blood pres-sure, triglycerides, and fasting insulin. Several of these associations differed betweenCaucasians and Afircan-Americans and by age.
3.4. Respiratory AbnormalitiesIn non-obese individuals, there is usually little fat deposition in the neck and in the
peripharynx regions. Increased neck adiposity has been observed among obese adultsubjects and is associated with respiratory abnormalities, such as hyperventilation andobstructive apnea (54). Similarly, increased neck adiposity is associated with respira-tory abnormalities during sleep among pediatric samples. Examples of conditions thatinterfere with sleep include subclinical nocturnal desaturation or decreased oxygen sat-uration (<90%) in red blood cells (55) and adenoidal tonsillar hypertrophy (56).Respiratory complications associated with childhood obesity include asthma, obstruc-tive sleep apnea, and Pickwickian syndrome (57,58).
3.5. PseudogynecomastiaPseudogynecomastia is excessive deposition of fat in the chest; it is particularly
prevalent during adolescence. Although pseudogynecomastia is of minimal health risk,our clinical experience suggests that it has negative effects on body image among obesemale adolescents. This is an important issue in light of evidence that obesity is relatedto dissatisfaction with body image (59,60).

326 Part IV / Diabetes and Obesity
3.6. Nonalcoholic Fatty Liver DiseasePediatric nonalcoholic fatty liver disease, characterized by accumulation of fat in
the liver, is becoming more common as the prevalence of childhood obesity increases.This disorder typically is associated with obesity, diabetes, hepatotoxicity, and certaingenetic/metabolic diseases in adults. Until recently, it was considered to be rare in chil-dren; however, its occurrence has been linked to the rapid rise in childhood weight.The disorder is more common among males and may present in children as young asage 4 yr (61,62).
3.7. Social Stigma and DepressionThe psychosocial stressors and stigmatization of obesity can be very concerning for
many obese children. Strauss and Pollack (63) recently investigated the social networksof more than 17,000 overweight and normal-weight adolescents (age range: 13–18 yr)enrolled in the National Longitudinal Study of Adolescent Health. They compared thetwo groups and reported fewer friendship nominations and more peripheral peer rela-tions among overweight, rather than normal-weight, adolescents.
Recent studies have suggested a possible association between obesity and depression(64,65), including those studies of adolescent samples (65). Erikson et al. (66) foundthat BMI was significantly positively associated with depression levels in adolescentgirls (r = 0.14; p < 0.01) but not in boys (r = 0.01; p < 0.78) in more than 800 childrenfrom 13 California schools. Eisenberg et al. (67) found that history of weight-teasing bypeers was associated with elevated depression, body-image disparagement, and suicidalideation and attempts.
3.8. Mortality RateFinally, several longitudinal studies have assessed the long-term impact of child-
hood obesity on mortality rate and morbidity (68–71). For example, Must and colleagues(69) used 55-yr of follow-up data to evaluate the relative risks of mortality associatedwith obesity during adolescence. Among males, the relative risks for all-cause mor-tality and atherosclerotic cerebrovascular disease were 1.8 and 13.2, respectively. Theeffect of BMI during adolescence on all-cause mortality among males appeared toindependent of adulthood BMI. Among females, however, the association betweenchildhood obesity and adult mortality was not statistically significant. Such findingssuggest that among males, the health effects of childhood obesity may not be short-term and may persist into later life.
4. MECHANISMS OF CHILDHOOD OBESITY
4.1. Genetic InfluencesIt has been suggested that the acorns do not fall far from the oak tree, implying that
children grow up to be quite similar to their parents. Similarly, it is well-established thatindividuals within families tend to be similar regarding their obtained degree of fatness.This intrafamily similarity could be a result of either genetic influences or a shared com-mon environment. Among animal breeders, it has long been known that selective breed-ing for fatness and leanness is possible, indicating a strong genetic influence onadiposity in domestic animals (72). Among humans, there now is additional substantialevidence that genetic factors exert a strong influence on adiposity (73,74). For most
Chapter 13 / Pediatric Obesity Prevention 327
individuals in the population, obesity is a polygenic disorder that results from the interplayof many genes. However, the topic of genetic influences on childhood obesity is very com-plicated and well beyond the scope of this chapter. Reviews on the association of geneticsand childhood obesity are provided elsewhere (75–77). One potential avenue for futureresearch may be targeting children who are identified as having “obesity-promotinggenes” for prevention strategies. Such possibilities may be unlikely in the immediatefuture but are not inconceivable given the pace of contemporary molecular geneticsresearch.
4.2. Environmental InfluencesObesity is partly an environmentally influenced disorder. Identifying the specific
environmental factors that promote obesity onset may help guide the development ofmore effective prevention strategies. This section reviews data on environmental pre-dictors of childhood obesity.
First, there is a small, but positive, association between socioeconomic status (SES)and obesity among children living in industrialized societies, although this trend maychange during adolescence (78). There is some evidence that girls from low-incomefamilies become heavier after adolescence, whereas girls from high-income familiesbecome leaner after adolescence (79). Indeed, among adult females, there is a negativeassociation between SES and adiposity (78). Second, there is correlational evidence thatfamily discord is associated with increased BMI among children and adolescents(80,81). A European study conducted a 10-yr follow-up of children who apparentlywere either “neglected” or “not neglected” by their parents (82). Neglected childrenwere 9.8 times more likely to become obese adolescents than non-neglected children,suggesting that environmental stressors might contribute to obesity development.
Third, there is strong evidence that television viewing is associated with obesityamong children (83–85). Increased viewing hours may lead to obesity by displacingenergy expenditure of physical activity (86), although other factors related to dietaryintake also are likely (87). One noteworthy study compared the frequency of sports par-ticipation among children living in three towns with differential exposure to television.Compared to children living in towns with television, those living in a town withouttelevision participated in more sports (88).
Fourth, larger portion sizes of foods may promote increased body weight in chil-dren. A study of marketplace foods by Young and Nestle (89) found that the portionsizes of virtually all foods sampled have increased significantly since the 1970s, thusexceeding federal dietary guidelines on a consistent basis. Results are shown in Fig. 2.The largest increase according to US Department of Agriculture (USDA) standardsoccurred in the cookie category, the size of which was 700% greater than USDA rec-ommendations (89). Rolls et al. (90) conducted an experiment in which they servedpreschool children small (150–225 g), medium (263–338 g), and large (376–450 g)portions of a main course entrée at three different lunches. Results indicated that olderchildren (5 yr), but not younger children (3 yr), ate more food when exposed to lunchesthat were larger in portion sizes (90). These results are depicted in Fig. 3. The resultssuggest that children may become more responsive to external cues as they age, whichmay increase susceptibility to obesity.
Finally, it has been suggested that restrictive feeding practices may promote child-hood obesity by impeding a child’s ability to recognize internal feelings of hunger and

328 Part IV / Diabetes and Obesity
satiety. A classic study (91) found that children whose parents had a more controllingstyle of feeding were less adept at self-regulating the calories they consumed in a labo-ratory setting. Compared to children whose parents had a less controlling feeding style,children whose parents had a more controlling feeding style tended to over consumecalories at an experimental lunch meal that followed a liquid “preload” beverage. These
Fig. 2. Actual portion sizes vs USDA portion sizes of seven common foods. (From ref. 89.)
Fig. 3. The effects of meal portion sizes on total energy intake at lunch in 3-yr-old children(A) and 5-yr old children (B). (From ref. 90.)

Chapter 13 / Pediatric Obesity Prevention 329
children were poorer at so-called “caloric compensation,” which in turn was associatedwith increased body fat measures in girls. Restrictive feeding practices by parents alsohave been associated with elevated “eating in the absence of hunger” by children—thatis, the tendency to snack on foods after completing a meal and despite feeling full (92).Eating in the absence of hunger stablizes in children over time (93) and was shown inone prospective study to predict increased body weight in girls (94). On the other hand,disentangling cause-and-effect is a challenge for such studies, because parental feedingrestriction may be responsive to a child’s eating and weight characteristics (95). Thisremains a very active area of scientific investigation, because it has important implicationsfor caregiver-based obesity prevention strategies. Table 1 presents a list of practical rec-ommendation from an expert panel regarding parenting guidelines for parents of obesechildren (17).
5. PREVENTION OF CHILDHOOD OBESITY
Public health researchers traditionally have described three types of prevention: pri-mary prevention, secondary prevention, and tertiary prevention (4). Primary preventionis the closest concept to true prevention, in which a medical condition is preventedthrough early and aggressive intervention. Ideally, intervention completely preemptsor interrupts the emergence of the condition even before its early stages. Thus, the pri-mary prevention of pediatric obesity would require early-life detection of excessiveadiposity or the identification of genetic markers to target individuals who wouldprobably become obese if left untreated. Once adiposity or genetic markers are identified,primary preventive services are aggressively introduced to circumvent the emergenceof obesity.
Secondary prevention refers to early intervention soon after signs of a condition emerge,although this intervention does not occur as immediately as primary prevention. Forexample, the secondary prevention of pediatric obesity entails prompt intervention ser-vices soon after a child is assessed as being obese. Some believe that elementary schoolpersonnel could be effective and practical agents of secondary prevention services (96).However, as discussed later, existent data on this topic are mixed.
Finally, tertiary prevention refers to intervention after a condition has manifesteditself for a period of time. For example, intervention with a 15-yr-old obese teenager
Table 1Expert Panel Recommendations for Parenting Guidelines for Pediatric Obesity Treatment
• Find reasons to praise the child’s behavior.• Never use food as a reward.• Parents can ask for “rewards” for children in exchange for the changes
in their own behavior.• Establish daily family meal and snack times.• Parents or caregivers should determine what food is offered and when, and the child
should decide whether to eat.• Offer only healthy options.• Remove temptations.• Be a role model.• Be consistent.
From ref. 17.

330 Part IV / Diabetes and Obesity
who has been overweight for his or her entire life is an example of tertiary prevention.The encouraging outcomes of several prominent behavioral interventions for pediatricobesity are examples of tertiary intervention (97,98). Ironically, the phrase “tertiary pre-vention” may be a misnomer because the goal is not actually to prevent but, rather, totreat an existent disease (4). On the other hand, the tertiary prevention of childhood obe-sity can be conceptualized as the primary prevention of adulthood obesity (99).
There has been surprisingly little research on the prevention of pediatric obesity despiteits increasing prevalence and associated health risks. Still, there have been attempts to pre-vent pediatric obesity at the primary, secondary, and tertiary levels (100–103).
5.1. Primary Prevention StudiesTo our knowledge, there is only one controlled primary prevention study in the liter-
ature that targeted infants (104). In this study, the researchers used nutrition educationfor the parents of 80 neonates. These parents received a nutritional guide, “The PrudentDiet,” to guide food preparation for the children once they reached age 3 mo and aweight of approx 6 kg. This guide provided very specific recommendations for foodselections, portion sizes, and calorie content. The parents of 50 control infants receivedinstructions on a “conventional” diet for their infants. At a 3-yr follow-up, the dataclearly indicated the effectiveness of the intervention. Among female subjects measuredafter 3 yr, 16.7% of the control infants were overweight compared to no overweightinfants in the experimental group. Among male subjects, 34.8% of the control groupwas overweight compared to 2.56% of the experimental group.
Fitzgibbon and colleagues (105) described an obesity prevention pilot program forAfrican-American mothers and their pre-adolescent daughters. Their report described a6-wk controlled intervention study, with treated families receiving what was describedas an education- and skills-based approach for managing health behaviors. Compared tocontrol subjects, there was a nonsignificant tendency for mothers and daughters in theexperimental group to report a decrease in daily fat intake. Mothers and daughters in theexperimental groups also reported increased nutritional knowledge compared to controlsubjects. Changes in BMI or other indexes of fatness were not reported.
In an intervention designed to prevent adulthood obesity, Epstein et al. (106) con-ducted a randomized controlled trial with 8- to 10-yr-old children who had at least oneobese parent but were not yet obese themselves. Families in one group received abehavioral intervention that explicitly targeted increased fruit and vegetable intake,whereas families in the second group received a behavioral intervention that explicitlytargeted reduced dietary fat intake. Results indicated that children in both groupsshowed significant increases in fruit and vegetable intake and reductions in percentageof excess weight over 12 mo.
5.2. Secondary and Tertiary Prevention Studies5.2.1. SCHOOL-BASED INTERVENTIONS
There have been a variety of school-based programs, some of which were school-wide, that have targeted both obese and non-obese children (107–109), whereas othershave specifically targeted obese children (110,111). These programs tended to be mul-tifaceted, including nutrition education and school-based exercise components.Stimulus-control techniques, self-monitoring, and problem solving were componentsof these programs.

Chapter 13 / Pediatric Obesity Prevention 331
Resnicow (96) reviewed six controlled interventions that specifically targeted over-weight children. With interventions lasting from 12 wk to 18 mo, children in the treatmentgroups gained significantly less weight over time than control subjects in five out of thesix studies. Despite these findings, numerous issues restrict enthusiasm. As Resnicownoted, subjects were not always randomly assigned to groups. Second, moderators oftreatment outcome have not been systematically addressed across studies. Finally, thereare few long-term follow-up data on children undergoing such programs, and the availabledata are not encouraging (111).
The findings from one of the largest and most comprehensive school-based healthinterventions to date, the Child and Adolescent Trial for Cardiovascular Health, areespecially noteworthy (112). This controlled intervention studied more than 5000 eth-nically diverse children from 96 schools in California, Louisiana, Minnesota, and Texas.Despite the magnitude of this program, 3-yr health outcomes on a variety of measures,including BMI and skinfolds, were disappointing. Significant changes were primarilynoted on self-reported measures of food intake and exercise.
Two of the most influential school-based prevention studies in recent years werethose by Robinson (113) and Gortmaker et al. (114). Robinson’s school-based studycompared 192 third- and fourth-grade students (mean age: 8.9 yr) from two Californiaelementary schools. The intervention of the study consisted of an 18-lesson, 6-mo class-room curriculum to reduce television, videotape, and video game use. Compared to thecontrol school, the treatment school demonstrated less of an increase in BMI (interven-tion vs control changes: from 18.38 to 18.67 vs from 18.10 to 18.81 kg/m2), less of anincrease in triceps skinfold measurements (intervention vs control change: from 14.55to 15.47 vs from 13.97 to 16.46 mm), less of an increase in waist-to-hip ratio (inter-vention vs control change: from 0.83 to 0.83 vs from 0.82 to 0.84), and less of anincrease in waist circumference (intervention vs control change: from 60.48 to 63.57 cmvs from 59.51 to 64.73 cm). The intervention group also demonstrated statistically sig-nificant decreases in reported television viewing (intervention vs control change: from15.35 to 8.80 vs from 15.36 to 14.46 h/wk). This study provided a strong illustration ofthe potential role of reduction of television viewing in obesity prevention.
Gortmaker et al.’s (114) “Planet Health” obesity prevention program also emphasizedreduction of television viewing as a central component in their obesity prevention program.The researchers compared five treatment schools against five control schools in a study thatincluded 1,295 ethnically diverse children in grades 6 and 7 in Massachusetts. Over 2 yr,the obesity prevalence among girls in the intervention schools declined from 23.6 to 20.3%,whereas the prevalence among girls in the control schools increased from 21.5 to 23.7%.Moreover, changes in television viewing practices predicted treatment outcome for girls.Each hour of reduced television watching was independently associated with a 15% reduc-tion in the likelihood of obesity (odds ratio = 0.85; p = 0.02). It also should be noted that thecontrol and treatment schools did not differ regarding obesity incidence (i.e., the numberof new obesity cases over time).
5.2.2. BEHAVIORAL WEIGHT-LOSS INTERVENTIONS
In contrast to the discouraging results for adults (115), family-based behavioral inter-ventions can promote long-term weight loss in obese children (97,98,116,117). Thesepromising findings primarily come from Epstein’s research program, which includesdiet modification and exercise promotion. This program has resulted in sustained

332 Part IV / Diabetes and Obesity
weight loss even at 10-yr of follow-up (98). Although these findings do not qualify asprimary prevention, they provide important insights into variables that might moderatethe efficacy of primary prevention programs. For example, the greatest reductions inpercentage of excess weight at 10-yr of follow-up were found in treatments incorporatingparental involvement in treatment as well as activity-promoting lifestyle changes or aer-obic exercise, rather than calisthenics (98). In another study, the greatest reductions inpercentage of excess weight and percentage of body fat were associated with treat-ments targeting the reduction of sedentary behavior rather than exercise promotion or acombination of the two (118).
In a meta-analysis of 39 family-based behavioral interventions that targeted dietaryand/or physical activity modification, Goldfield et al. (119) demonstrated a relationshipbetween treatment duration and reduction in child overweight percentage (see Fig. 4).Using multiple regression techniques, they demonstrated that children treated for 15 mowould be expected to reduce their percentage of excess weight by approx 20% on average.
6. APPROACHES TO PREVENTION: THEORETICAL PERSPECTIVES
There are different strategies for approaching the prevention of pediatric obesity.Four dimensions of prevention effort research include targeting, philosophy, punitive-ness, and timing.
6.1. Target of Prevention Efforts: “Shotgun” vs “Rifle” ApproachesOne fundamental consideration for prevention research is the target of intervention—
that is, prevention efforts can target entire populations or specific individuals within thepopulation (i.e., high-risk individuals). The former, a “shotgun” approach, strives to reachmost people with modest impact, whereas the latter, a “rifle” approach, strives to aggressivelyintervene with an at-risk subgroup. The shotgun approach might use psycho-educational
Fig. 4. Association between months of family-based behavioral treatment for child-hood obesity and change percent of excess weight in child: results of 39-study meta-analysis. (From ref. 119.)

Chapter 13 / Pediatric Obesity Prevention 333
approaches, including information dissemination via mass media and communityactivism, to reach most individuals within a community. Such strategies have traditionallybeen used in community prevention efforts with adults as well as many school-basedprograms with children.
In the “rifle” approach, aggressive prevention services depend on prescreening childrenfor obesity or markers for future obesity. For example, given the high heritability ofobesity, prevention efforts might target children whose parents and other family membersare obese. An expert panel proposed a two-level screening protocol for determining thoseadolescents that might be most appropriate for prevention service (120). The first level ofthese guidelines is a BMI exceeding the 95th percentile for a given age and gender or a BMIgreater than 30—whichever is smaller. The second level assesses the following four criteria:elevated blood pressure, total cholesterol, large increments in BMI, and concern by the ado-lescent about his or her weight. Any adolescent who meets the first-level criterion and anyof the second-level criteria would be considered appropriate for preventive services.
There are advantages and limitations to both the shotgun and rifle approaches. Theshotgun approach has the appealing goal of addressing a mounting public health prob-lem by targeting the majority of children in the population rather than a select, albeithigh-risk, subsample. Despite this ambitious goal, the disappointing outcomes fromcommunity intervention trials with adults and school-based programs with children arequite sobering and do reveal a poor track record. Such data suggest that modification toprevious shotgun efforts may be necessary if such approaches are to have even amodest impact on pediatric obesity.
As noted previously, however, previous shotgun approaches have primarily relied onpsycho-educational information dissemination and community activism to promoteweight change. More aggressive forms of environmental manipulation, including leg-islative changes, appear not to have been attempted on a population level. For example,changes of this magnitude might include raising taxes on high-fat breakfast foods to dis-courage their consumption. The success of the shotgun approach to preventing obesitymight rest on the implementation of broader environmental changes than have beenattempted previously.
Regarding the rifle approach, there is clearly room for more prevention studies in thisarea. However, it should be noted that all interventions using this approach share thecommon challenge of identifying the most appropriate children or adolescents for inter-vention. This challenge is not simple, given that not all obese children become obeseadults, particularly if they are obese at younger ages (121–123). Therefore, researchersrun the risk of intervening with young children who might otherwise “outgrow” theirobesity if left untreated, although the probability of this decreases as children remainobese into the teenage years. Future advances in the molecular genetics of obesity mayhelp to better identify those children who are the best candidates for prevention services.
6.2. Philosophy of Prevention Methods: Inoculation vs EnvironmentalManipulations
Prevention strategies can be fundamentally geared toward changing the child (“inoc-ulation”) or changing the environment (“environmental manipulation”). Inoculationapproaches emphasize teaching children skills to avoid overeating, to select low-fatfoods, and to devote more time to physical exercise despite an increasingly sedentaryenvironment. This philosophy has guided most school-based interventions.

334 Part IV / Diabetes and Obesity
On the other hand, environmental manipulations include prevention strategies, such astaxing fattening foods (124), installing signs in public settings to promote activity oversedentary behaviors (125), prompting in supermarkets to guide food selection (126), chang-ing the marketing of certain food products to subgroups (127), developing and implement-ing fat substitutes and other advances in food science (128), involving parents in interventionto better control their children’s environment (98), and directly providing nutritionally soundmeals to obese individuals in lieu of them shopping for themselves (129).
There appears to be no controlled studies comparing prevention programs differing onrelative efficacy of inoculation versus environmental manipulations for promoting weightloss. However, the disappointing results from community prevention trials with adults andthe limited success of school-based programs suggest that inoculation methods mighthave limited effectiveness for reducing pediatric obesity. Furthermore, as previously men-tioned, environmental influences on body weight are transient (130). More pervasive andsustained inoculation strategies might be necessary before effects on obesity status can bedetected. As noted later, there is currently active interest in governmental policy changesthat would target lifestyle modifications that could impact obesity. These controversialissues will be central to obesity prevention efforts in the near future.
6.3. Punitiveness of Prevention Efforts: Punitive vs Nonpunitive ApproachesPrevention programs can include punitive or nonpunitive strategies. The taxation of fat-
tening foods is an example of a punitive strategy that has already been used to target alco-hol and cigarette sales (131,132). Examples of nonpunitive strategies include subsidizinggymnasium membership fees, price reductions for low- or fat-free foods in restaurants andsupermarkets, and, perhaps, tax rebates for weight loss. Preliminary data from French andcolleagues (133) indicated that reducing the price of fruits and vegetables in school cafe-terias promoted sales of those targeted items. Similar strategies have been used in schooland worksite vending machines to promote the sale of low-fat snack foods (134).
There are no data comparing the relative efficacy of punitive versus nonpunitiveapproaches. Given this absence of data, nonpunitive strategies may be more desirablethan punitive strategies strictly regarding humanitarian grounds.
6.4. Timing of Prevention Efforts: Rifle ApproachInterventions targeting high-risk children must decide the optimal time to begin inter-
vention. One position is that there may be critical periods during the life span that are piv-otal for the development of obesity and might be ideal for prevention services. For example,Dietz (135) suggested three possible critical periods: the first and second trimesters of preg-nancy, the period of “adiposity rebound” between ages 5 and 7, and adolescence.
It has also been suggested that the earliest possible interventions might be the mostefficacious (115). Unlike interventions with older children, efforts targeting youngerchildren may not need to challenge eating patterns that have been practiced over manyyears. Early interventions that provide overexposure to lower fat and lower total calories,rather than to higher fat and higher calorie foods, possibly promote a greater liking forthese foods (136–138).
On the other hand, data to support the critical periods hypothesis of obesity are mixed.For example, Allison and colleagues (139) concluded that the intra-uterine period was acritical period for the development of adulthood height but not BMI. Other genetics stud-ies have also demonstrated that environmental influences on BMI are transient in duration

Chapter 13 / Pediatric Obesity Prevention 335
Table 2Directions for Future Obesity Prevention Research Identified
by the NIH Pilot Studies Investigators
Expand the types of ● Explore approaches such as participatory action research thatinterventions to be encourage community input and have an influence on tested to prevent intervention design and content.obesity and promote ● Develop and test interventions that target multiple societalweight control and levels, individual-based interventions, and their combination,long-term to determine whether public health and individualmaintenance of approaches are interactive.weight loss. ● Develop and test environmental strategies (in homes,
organizations, work sites, neighborhoods), including policy changes.
● Develop and test family-based interventions and interventionsin the primary health care setting, including physician incentives.
Conduct research to ● Determine optimal intervention duration, frequency, andimprove efficacy of mode of delivery (group or individual face-to-face contact,interventions for telephone, mail, internet).obesity prevention ● Use highly controlled study designs to determine optimaland long-term physical activity and dietary prescriptions in adults and inweight control children and adolescents.programs. ● Determine the optimal use of meal replacements for weight
loss and its long-term maintenance.● Test interactive effects of genetic and/or psychosocial
predictors of obesity by stratifying study participants onthese factors.
● Explore and describe approaches to intervention by internet,alone and in combination with other intervention strategies.Gather information on the “dose” of intervention the internetprovides and the ability of the internet to enhance motivationand adherence to interventions.
Conduct observational ● Identify physiological and behavioral characteristics that putstudies to guide individuals at risk for weight gain.interventions for ● Identify physiological and psychosocial characteristics andobesity prevention, other predictors of success in intervention programs.weight control, ● Identify barriers to enrolling and participating in weightand long-term control programs.maintenance of ● Identify approaches and strategies to enhance motivation andweight loss. adherence to intervention in children and adolescents,
women during the prenatal and postpartum period, and other populations.
Use theoretical ● Incorporate theoretical perspectives from other areas ofmodels to design research in the conceptualization and design of obesity obesity prevention prevention studies (e.g., family systems theory, and interventions. organizational behavior theory).
● Conduct studies in which obesity prevention objectives areintegrated with other types of health promotion or behaviorchange objectives.
(Continued)

336 Part IV / Diabetes and Obesity
Table 2 (continued)
● Develop more systematic concepts of how interventions canbe tailored to specific behaviors, populations, and contexts.
● Conduct research to improve measurement methodology forobesity preventionresearch.
● Develop valid and affordable energy balance measurementssuitable for large-scale trials outside of clinical settings.
● Identify psychosocial measures most relevant for obesityresearch and explore whether these psychosocial measurescan be standardized and used in weight control trials.
● Determine a health-related and functional definition obesityin children.
From Kumanyika and Obarzanek (ref. 7).
(130). Such findings are inconsistent with the critical periods hypothesis and suggest thatthe duration of the intervention may be more important than the age at which it is initiated.
7. FUTURE DIRECTIONS
As noted earlier, the NIH “Pathways to Prevention” Workshop convened in 2001 (7) tobrainstorm on innovative approaches to obesity prevention research. A summary of these rec-ommendations is provided in Table 2. Specific recommendations focused on conceptuallyexpanded models of intervention, including those targeting societal and policy level inter-ventions. Workshop participants addressed the importance of differentiating obesity treat-ment from prevention, noting that established paradigms for treatment may notnecessarily translate into effective prevention strategies. Figure 1B presents a conceptualframework for obesity prevention that overlaps with other health promotion domains,including substance abuse, human immunodeficiency virus/acquired immune deficiencysyndrome, and cigarette smoking. The utility of this paradigm and the efficacy of the NIH-funded pilot prevention studies will be evaluated in upcoming years.
The role of government health policy, as well as that of the food industry, in obesity pre-vention will likely remain prominent areas of attention in the foreseeable future. Popularbooks, including Food Fight (140) and Food Policy (141), have drawn public attention tothese issues. Brownell reviewed evidence for the so-called “toxic environment” and whathe perceived to be a range of potential strategies for combating the problem on societal lev-els. Examples include government regulation of advertisements to children, taxation ofselect energy-dense snack foods to generate funds for health promotion campaigns, and theremoval of soft drink vending machines from schools. The potential impact of these rec-ommendations vis-à-vis obesity prevention needs to be studied empirically.
On the other hand, it appears that an increasing number of parent and lay groups maynot wait for the results of controlled studies before getting actively involved. A case inpoint is the debate surrounding the sale of soft drinks in schools. Prospective epidemi-ological studies linked increased carbonated beverage consumption with obesity onsetin children (142), and a policy statement from the American Academy of Pediatrics rec-ommended that pediatricians work with school administrators to decrease availabilityof low-nutrient energy-dense foods in schools (7). Therefore, as of the writing of thischapter, certain New York City and Philadelphia school districts had banned the sale ofsoda in vending machines and cafeterias as a result of the advocacy efforts of parents

Chapter 13 / Pediatric Obesity Prevention 337
and other community leaders. It is important that controlled studies test the effects ofsuch environmental changes on children’s weight change and obesity status.
Finally, the intersection of the legal and health systems, including the effects of litiga-tion, will be an interesting issue for the future trends. For example, recent years have shownan increase in the number of lawsuits brought against certain food franchises. Perhaps themost widely publicized lawsuit was Pelman vs McDonalds, in which the plaintiffs claimedthat a group of children became overweight and developed medical complications as aresult of eating at the franchise. This controversial lawsuit was eventually dismissed from
Table 3 Recommendations for the Prevention of Pediatric Overweight and Obesity American
Academy of Pediatrics Policy Statement 2003
Health Supervision
Identify and track patients at risk by virtue of family history, birth weight,or socioeconomic, ethnic, cultural, or environmental factors.
Calculate and plot BMI once a year in all children and adolescents.
Use change in BMI to identify rate of excessive weight gain relative to linear growth.
Encourage, support, and protect breastfeeding.
Encourage parents and caregivers to promote healthy eating patterns by offering nutritioussnacks, such as vegetables and fruits, low-fat dairy foods, and whole grains; encouragingchildren’s autonomy in self-regulation of food intake and setting appropriate limits onchoices; and modeling healthy food choices.
Routinely promote physical activity, including unstructured play at home, in school, inchild care settings, and throughout the community.
Recommend limitation of television and video time to a maximum of 2 h/d.
Recognize and monitor changes in obesity-associated risk factors for adult chronic dis-ease, such as hypertension, dyslipidemia, hyperinsulinemia, impaired glucose tolerance,and symptoms of obstructive sleep apnea syndrome.
Advocacy
Help parents, teachers, coaches, and others who influence youth to discuss health habits,not body habitus, as part of their efforts to control excess weight and obesity.
Enlist policy makers from local, state, and national organizations and schools to support ahealthful lifestyle for all children, including proper diet and adequate opportunity for regular physical activity.
Encourage organizations that are responsible for health care and health care financing toprovide coverage for effective obesity prevention and treatment strategies.
Encourage public and private sources to direct funding toward research into effectivestrategies to prevent excess weight and obesity and to maximize limited family and community resources to achieve healthful outcomes for youth.
Support and advocate for social marketing intended to promote healthful food choices andincreased physical activity.
American Academy of Pediatrics Policy Statement: Prevention of Pediatric Overweight and Obesity.(From ref. 144.)

338 Part IV / Diabetes and Obesity
court (143); however, the case suggested that some individuals may use litigation to lever-age social changes before research documents the effects of such efforts.
8. SUMMARY AND RECOMMENDATIONS
Prevention of childhood obesity is a national priority in the United States as well asin other countries worldwide where prevalence levels have changed dramatically inrecent decades. The disorder is complicated because it is clearly genetically influenced,although its manifestation may depend on environmental pressures. Few studies havetested obesity prevention programs for children, although intriguing school-based dataimplicate the protective effects of reduced television viewing. Beyond these data, thefield remains at its infancy. Pressure from lay advocacy groups is mounting for changes,at least within school settings. Regarding clinical recommendations for pediatricians,parents, and other health care providers, we conclude by providing the American Academyof Pediatrics’ (144) Policy Statement for the Prevention of Pediatric Overweight andObesity (see Table 3).
ACKNOWLEDGMENTS
This work was supported in part by NIH grants R01 HD-42169 awarded to M. S. Faithand by UAB Clinical Nutrition Research Unit no. P30DK056336 awarded to D. B. Allison.
REFERENCES1. Colditz GA. Economic costs of obesity. Am J Clin Nutr 1992; 55:503S–507S.2. Seidell JC. The impact of obesity on health status: some implications for health care costs. Int J Obes
1995; 19:S13–S16.3. The National Task Force on Prevention and Treatment of Obesity. Towards prevention of obesity:
research directions. Obes Res 1994; 2:571–584.4. Weighing the Options: Criteria for Evaluating Weight–Management Programs. National Institute of
Medicine Academy Press, Washington, DC, 1995.5. Healthy People 2010. US Dept. of Health & Human Services, Washington, DC, 2000. Available at
http://www.healthypeople.gov/document/html/objectives/19-03.htm. Accessed September 22, 2004.6. Hirsch J. Obesity prevention initiative. Obes Res 1994; 2:569,570.7. Kumanyika SK, Obarzanek E. Pathways to obesity prevention: report of a National Institutes of
Health workshop. Obes Res 2003; 11(10):1263–1274.8. Jeffery RW. Community programs for obesity prevention: the Minnesota Heart Health Program.
Obes Res 1995; 3(Suppl. 2):283S–288S.9. Taylor CB, Stunkard AJ. Public Health Approaches to Weight Control. In: Stunkard AJ, Wadden T,
eds. Obesity: Theory and Therapy. Raven, New York, 1993, pp. 335–353.10. Jeffery RW. Public Health Approaches to the Management of Obesity: In: Brownell KB, Fairburn
CO, eds. Eating Disorders and Obesity: A Comprehensive Handbook. Guilford, New York/London,1995, pp. 558–563.
11. Goran M. Obesity in children: recent advances in energy metabolism and body composition. ObesRes 1995; 3:277–289.
12. Heymsfield SB, Allison DB, Heshka S, Pierson RN Jr. Assessment of Human Body Composition.In: Allison DB, ed. Handbook of Assessment Methods for Eating Behaviors and Weight–RelatedProblems. Sage, Thousand Oaks, CA, 1995, pp. 515–560.
13. Hamill PV, Drizd TA, Johnson CL, Reed RB, Roche AF, Moore WM. Physical growth: NationalCenter for Health Statistics percentiles. Am J Clin Nutr 1979; 32:607–629.
14. Goran Ml, Driscoll P, Johnson R, Nagy TR. Hunter G. Cross–calibration of body composition tech-niques against dual X–ray absorptiometry in young children. Am J Clin Nutr 1996; 63:299–305.
15. Gutin B, Cucuzzo N, Islam S, Smith C, Moffatt R. Pargman D. Physical training improves bodycomposition of black obese 7– to 11–year–old girls. Obes Res 1995; 3:305–312.

Chapter 13 / Pediatric Obesity Prevention 339
16. Pietrobelli A, Faith MS, Allison DB, Gallagher D, Chiumcllo G, Heymsfield SB. Body mass indexas a measure of adiposity among children and adolescents: a validation study. J Pediatr 1998;132(2):204–210.
17. Barlow SE, Dietz WH. Obesity evaluation and treatment: expert committee recommendations. TheMaternal and Child Health Bureau, Health Resources and Services Administration and theDepartment of Health and Human Services. Pediatrics 1998; 102(3):E29
18. National Center for Health Statistics. Plan, operation, and response results of a program of chil-dren’s examinations. Vital Health Stat 1967; 1(5):1–56.
19. National Center for Health Statistics, Plan and operation of a Health Examination Survey of USyouths 12–17 years of age. Vital Health Star 1969; 1(8):1–80.
20. Troiano RP, Flegal KM, Kuczmarski RJ, Campbell SM, Johnson CL. Overweight prevalence andtrends for children and adolescents. Arch Pediatr Adolesc Med 1995; 149:1085–1091.
21. CDC. Prevalence of overweight among adolescents—United States, 1988–1991. MMWR 1994;43:818–821.
22. Dietz WH, Gortmaker SL, Sobol AM, Wehler CA. Trends in the prevalence of childhood and ado-lescents obesity in the United States. Pediatr Res 1984; 19:198S.
23. Kuczmarski RJ. Trends in body composition for infants and children in US Clin Rev Food Sci Nutr1993; 33:375–387.
24. Gortmaker SL, Dietz WH, Sobol AM, Wehler CA. Increasing pediatric obesity in the United States.Am J Dis Child 1987; 141:535.
25. McCarthy HD, Ellis SM, Cole TJ. Central overweight and obesity in British youth aged 11–16 years:cross sectional surveys of waist circumference. BMJ 2003; 326:624.
26. Johnston FE. Health implications of childhood obesity. Ann Inter Med 1985; 103:1068–1072.27. Allison DB, Heshka S, Heymsfickl SB. Evidence for a major gene with pleiotropic effects for a
Cardiovascular Disease Risk Syndrome in children under 14. Am J Disabilities Child 1993;147:1298–1302.
28. Falkner B, Kushner H, Onesti G, Angelakos FT. Cardiovascular characteristic in adolescents whodevelop essential hypertension. Hypertension 1981; 3:521–527.
29. Lauer RM, Connor WE, Leaverton PE. Reiter MA, Clarke WR. Coronary heart disease risk factorsin school children: the Muscatine Study. J Pediatr 1975; 86:697–708.
30. Williams DP, Going SB, Lohman TG, et al. Body fatness and risk for elevated blood pressure, totalcholesterol, and serum lipoprotein ratios in children and adolescents. Am J Public Health 1992;82:358–362.
31. Gutin B, Basch C, Shea S, et al. Blood pressure, fitness, and fatness in 5– and 6–year–old children.JAMA 1990; 264:1123–1127.
32. Rocchini AP. Hemodynarnic and Cardiac Consequences of Childhood Obesity. In: Williams CL,Kimm SYS, eds.Prevention and Treatment of Childhood Obesity. The New York Academy ofSciences, New York, 1993, pp. 46–56.
33. Daniels SR, Witt SA, Glascock B, Khoury PR, Kimball TR. Left atrial size in children with hyper-tension: the influence of obesity, blood pressure, and left ventricular mass. J Pediatr 2002;141:186–190.
34. Bandini LG, Schoeller DA. Total body fat distribution and glucose tolerance in adolescents. AmJ Clin Nutr 1986; 43:696.
35. Freedman US, Srinivasan SR, Bnrke GL, et al. Relation of body fat distribution to hyperinsulinemiain children and adolescents: the Bogalusa Heart Study. Am J Clin Nutr 1987; 46:403–410.
36. Jacot JP, Zuppinger KA, Joss EE, Donatin A. Evidence for two types of juvenile obesity on the basisof body composition and insulin release following small doses of glucose. KIm Wochenschr 1973;51:1109–1114.
37. Jiang X, Sathanur R, Weihang Ban, Berenson GS. Association of fasting insulin with blood pressurein young individuals. Arch Intern Med 1993; 153:323–328.
38. Voors AW, Harsha DW, Webber LS, Radhakrishnamurthy B, Srinivasan SR, Berenson GS.Clustering of anthropometric parameters, glucose tolerance, and serum lipids in children with highand low b and pre–b-lipoproteins: Bogalusa Heart Study. Arteriosclerosis 1982; 2:346–355.
39. Modan M, Halkin H, Almog S, et al. Hyperinsulinemia: a link between hypertension, obesity andglucose intolerance, J Clin Invest 1985; 75:809–817.
40. Rocchini AP, Katch V, Kveselis D, et al. Insulin and renal retention in obese adolescents.Hypertension 1989; 14:367–374.

340 Part IV / Diabetes and Obesity
41. Sinaiko AR, Donahue RP, Jacobs DR Jr, Prineas RJ. Relation of weight and rate of increase in weightduring childhood and adolescence to body size, blood pressure, fasting insulin, and lipids in youngadults. The Minneapolis Children’s Blood Pressure Study. Circulation 1999; 11:1471–1476.
42. Lewy VD, Danadian K, Witchel SF, Arslanian S. Early metabolic abnormalities in adolescent girlswith polycystic ovarian syndrome. J Pediatr 2002; 138:38–44.
43. Goran MI. Metabolic precursors and effects of obesity in children: a decade of progress, 1990–1999.Am J Clin Nutr 2001; 73:158–171.
44. Sinaiko AR, Jacobs DR Jr, Steinberger J, et al. Insulin resistance syndrome in childhood: associationsof the euglycemic insulin clamp and fasting insulin with fatness and other risk factors. J Pediatr 2001;139:700–707.
45. Pinhas-Hamiel O, Dolan LM, Daniels SR. Increased incidence of non-insulin-dependent diabetesmellitus among adolescents. J Pediatr 1996; 128:608–615.
46. Baumgartner RN, Siervogel RM, Chumlea WC, Roche AF. Association between plasma lipoproteincholesterols, adiposity and adipose tissue distribution during adolescence. J Obes 1989; 13:31–41.
47. Frerichs RR, Webber LS, Srinivasan SR, et al. Relation of serum lipids and lipoproteins to obesityand sexual maturity in white and black children. Am J Epidemiol 1978; 108:486–496.
48. Fripp RR, Hodgson IT. Kwiterovich PO, Wernwr JC, Sculsler HG, Whitman V. Aerobic capacity,obesity, and arteriosclerotic risk factors in male adolescents. Pediatrics 1985; 75:813–818.
49. Smoak CO, Burke GL, Webber LS, et al. Relation of obesity to clustering of cardiovascular disease riskfactors m children and young adults: the Bogalusa Heart Study. Am J Epidemiol 1987; 125:364–372.
50. Freedman DS, Srinivasan SR, Marsha DW, Webber LS, Berenson GS. Relation of body tat pattern-ing to lipid and lipoprotein concentrations in children and adolescents: the Bogalusa Heart Study AmJ Clin Nutr 1989; 50:930–939.
51. Bellu’ R, Ortisi ML, Scaglioni S, et al. Lipid and apoprotein A–I and B levels in obese school–agechildren: results of a study in the Milan area. J Pediatr Gastroenterol Nutr 1993; 16:446–450.
52. Durant RH, Baranowski T, Rhodes I, et al. Association among serum lipids and lipoprotein concentra-tion and physical activity, physical fitness, and body composition in young children. J Pediatr 1993:123:185–192.
53. Freedman DS, Bowman BA, Srinivasan SR, Berenson GS, Otvos JD. Distribution and correlates ofhigh-density lipoprotein subclasses among children and adolescents. Metabolism: Clin Experiment2001; 50:370–376.
54. Horner RL, Mohiaddin RH, Lowell DO, et al. Sites and sizes of lot deposits around the pharynx in obesepatients with obstructive sleep apnea and weight matched controls, Eur Respir J 1989; 22:613–622.
55. Silvestri IM, Weese–Mayer DE, Bass MT, et al. Polysomnography in obese children with a historyof sleep associated breathing disorders. Pediatr Pulmonol 1993; 16:124–129.
56. Chiumello G, Hramhilla P, Manioni P, Beccaria L, Pictrohelli A. Obesita’ distrettuale e complicanzein eta’ pediatrica ed adoicscenziale. Abstract Book UICO, Naples, 1994.
57. American Academy of Pediatrics, Section on Pediatric Pulmonology Subcommittee on ObstructiveSleep Apnea Syndrome. Clinical practice guideline: diagnosis and management of childhoodobstructive sleep apnea syndrome. Pediatrics 2002; 109:704–712.
58. Rodriquez MA, Winkleby MA, Ahn D, et al. Identification of population subgroups of children andadolescents with high asthma prevalence: findings from the Third National Health and NutritionExamination Survey. Archives of Pediatrics and Adolescent Medicine 2002; 156(3):269–75.
59. Cooperberg J, Faith MS. Treatment of Childhood and Adolescent Obesity. In: Thompson JK, ed.Handbook of Eating Disorders and Obesity. Wiley, New York, 2003.
60. Friedman MA, Brownell KD. Psychological correlates of obesity: moving to the next research gen-eration. Psychol Bull 1995; 17:3–20.
61. Roberts EA. Steatohepatitis in children. Best Practice in Research and Clinical Gastroenterology. 2002;16(5):749–765.
62. Fishbein MH, Miner M, Mogren C, Chalekson J. The spectrum of fatty liver in obese children and therelationship of serum aminotransferases to severity of steatosis. J Pediatr Gastroenterol Nutr 2003;36(1):54–61.
63. Strauss RS, Pollack HA. Social marginalization of overweight children. Arch Pediatr Adolesc Med2003; 157(8): 746–752.
64. Faith MS, Calamaro CJ, Dolan MS, Pietrobelli A. Mood disorders and obesity. Current Opin Psych,2004; 17:9–13.
65. Mustillo S, Worthman C, Erkanli A, et al. Obesity and psychiatric disorder: developmental trajectories.Pediatrics 2003; 111:851–859.

Chapter 13 / Pediatric Obesity Prevention 341
66. Erickson SJ, Robinson TN, Haydel KF, Killen JD. Are overweight children unhappy? Body massindex, depressive symptoms, and overweight concerns in elementary school children. Arch Ped AdolMed 2000; 154(9):931–935.
67. Eisenberg ME, Neumark-Sztainer D, Story M. Associations of weight-based teasing and emotionalwell-being among adolescents. Arch Ped Adol Med 2003; 157:733–738.
68. DiPietro L, Mossberg HO, Stunkard AJ. A 40 year history of overweight children in Stokholm:life–time overweight, morbidity, and mortality Int J Obes 1994; 18:585–559.
69. Must A, Jacques PF, Dallal GE, Bajema CJ, Dietz WH. Long–term morbidity and mortality of over-weight adolescents. New Eng J Med 1992; 327:1350–1355.
70. Nieto FJ, Szklo M, Comstock GW. Childhood weight and growth rate as predictors of adult mortal-ity. Am J Epidemiol 1992; 1116:201–213.
71. Hoffmans MDAF, Kromhout D, deLezenne Coulander C. The impact of body mass index on78,612 18-year old Dutch men on 32–year mortality from all causes. J Clin Epidemiol 1988;41:749–756,
72. Ahplanalp H, Tai C, Vapolitano D. Differences in body fat of six inbred lines ol white leghornsderived from a common base population. Poultry Sci 1984; 63:418–424.
73. Allison DB, Heshka S, Neale MC, Lykken DT, Heymsfield SB. A genetic analysis of weight resid-ualized for height among. 4020 twin pairs with an emphasis on sex specific effects. Health Psychol1994; 13:362–365.
74. Bouchard C. The Genetics of Obesity. CRC, Boca Raton, FL, 1994.75. Allison DB, Pietrobelli A, Faith MS, Fontaine KR, Gropp E, Fernandez JR. Genetic Influences on
Obesity. In: Eckel RH, ed. Obesity: Mechanism and Clinical Management. Lippincott Williams &Wilkins, Philadelphia, 2003, pp. 31–74.
76. Faith MS, Keller KL. Genetic architecture of ingestive behavior in humans. Nutrition 2003; 20:127–133.77. Farooqi IS, O’Rahilly S. Recent advances in the genetics of severe childhood obesity. Arch Dis
Childhood 2000; 83:31–34.78. Sobal J, Stunkard AJ. Socioeconomic status and obesity: a review of the literature. Psychol Bull 1989;
105:260–275.79. Garn SM, Clark DC. Trends in fatness and the origins of obesity: Ad Hoc Committee to Review the
Ten-State Nutrition Survey. Pediatrics 1976; 57:443–456.80. Mendelson BK, White DR, Schliecker F. Adolescents’ weight, sex, and family functioning. Int J Eating
Disord 1995; 17:73–79.81. Kinston W, Loader P, Miller L. Emotional health of families and their members where a child is
obese. J Psychosom Res 1987; 31:583–599.82. Lissau O, Sorensen TIA. Parental neglect during childhood and increased risk of obesity in young
adulthood. Lancet 1994; 343:324–327.83. Dietz WH, Gortmaker SL. Do we fatten our children at the television set? Obesity and television
viewing in children and adolescents. Pediatrics 1985; 75:807–812.84. Loncard E, Mamelle N, Billette A, Miginiac M, Munoz F, Rey S. Risk factors for obesity in a five
year old population. Parental versus environmental effects. Int J Ohes 1992; 16:721–729.85. Satoshi S, Yamada F, Masuda K, Tada M. TV game play and obesity in Japanese school children.
Percept Mat Skills 1993; 76:1121–1122.86. Vara LS, Epstein LII. Laboratory assessment of choice between exercise or sedentary behavior. Res
Q Exerc Sport 1993; 64:356–360.87. Klesges RC, Shelton ML, Klesges LM. Effects of television on metabolic rate: potential implications
for childhood obesity. Pediatrics 1993; 91:281–286,88. Murray JP, Kippax S. Children’s social behavior in three towns with differing television experience.
J Commun 1978; 18:19–29.89. Young LR, Nestle M. The contribution of expanding portion sizes to the US obesity epidemic. Am
J Public Health 2002; 92(2):246–249.90. Rolls BJ, Engell D, Birch LL. Serving portion size influences 5-year-old but not 3-year-old chil-
dren’s food intakes. J Am Diet Assoc 2000; 100(2):232–234.91. Johnson SL, Birch LL. Parent’s and child’s adiposity and eating style. Pediatrics 1994; 94:653–661.92. Fisher JO, Birch LL. Restricting access to foods and children’s eating. Appetite 1999; 32:405–419.93. Fisher JO, Birch LL. Eating in the absence of hunger and overweight girls from 5 to 7 years of age.
Am J Clin Nutr 2002; 76:226–231.94. Birch LL, Fisher JO, Davison KK. Learning to overeat: maternal use of restrictive feeding practices
promotes girls’ eating in the absence of hunger. Am J Clin Nutr 2003; 78(2):215–220.

342 Part IV / Diabetes and Obesity
95. Birch LL. Fisher JO. Mothers’ child-feeding practices influence daughters’ eating and weight. Am JClin Nutr 2000; 71:1054–1061.
96. Resnicow K. School–based obesity prevention. In: Williams CL, Khnin SYS, eds. Prevention andTreatment of Childhood Obesity. The New York Academy of Sciences, New York, 1993,154–166.
97. Epstein LH, Valoski A. Wing RR, McCurley J. Ten-year follow up of behavioral, family–based treat-ment for obese children. JAMA 1990; 264:2519–2523.
98. Epstein LH, Valoski A, Wing ER, McCurley J. Ten–year outcomes of behavioral family–based treat-ment of childhood obesity. Health Psychol 1994: 13:373–383.
99. National Task Force on the Prevention and Treatment of Obesity. Overweight, obesity and healthrisk. Arch Inter Med 2000; 160:898–904.
100. Dicta WH. Prevention of childhood obesity. Pediatr Clin North Am 1986; 33:823–833.101. Epstein LH, Gordy CC, Raynor HA, et al. Increasing fruit and vegetable intake and decreasing fat
and sugar intake in families at risk for childhood obesity. Obesity Research 2001; 9(3):171–8.102. Kanders, BS. Pediatric Obesity. In: Weighing the Options: Criteria for Evaluating Weight–Management
Programs. National Academy Press, Washington, DC, 1995, 210–233.103. Williams SK, Kimm SYS. Prevention and Treatment of Childhood Obesity. Annals of the New York
Academy of Sciences, New York, 1993.104. Pisacano JC, Lichter H, Ritteri, Siegal AP. An attempt at prevention of obesity in infancy. Pediatrics
1978; 61:360–364.105. Fitzgibbon ML, Stolley MR, Kirscheribaum DS. An obesity pilot program for African–American
mothers and daughters. J Nutr Ed 1995; 27:93–99.106. Epstein LH, Gordy CC, Raynor HA, Beddome M, Kilanowski CK, Paluch RA. Increasing fruit and
vegetable and decreasing fat and sugar intake in families at risk for childhood obesity. Obes Res2001; 9:171–178.
107. Killen JO, Robinson TN, Telch MJ. The standard adolescent heart health program. Health Educ Q1989; 16(2):263–283.
108. Resnicow K, Cohn J, Reinhardt J, et al. A three year evaluation of the Know Your Body program inminority school children. Health Educ Q 1992; 19:463–480.
109. Walter EU, Hofman A, Vaughan RD, Wynder EL. Modification of risk factors for coronary heart dis-ease. N Engl J Med 1988; 318:1093–1100.
110. Brownell ND, Kayc PS. A school–based behavior modification, nutrition education, and physicalactivity program for obese children. Am J Clin Nutr 1982; 35:277–283.
111. Foster GD, Wadden TA, Brownell KD. Peer–led program for the treatment and prevention of obe-sity in the schools. J Consult Clin Psychol 1985; 53:538–540.
112. Luepker RV, Perry CL, McKinlay SM, et al. Outcomes of a field trial to improve children’s dietarypatterns and physical activity. The Child and Adolescent Trial for Cardiovascular Health (CATCH).JAMA 1996; 275:768–776.
113. Robinson TN. Reducing children’s television viewing to prevent obesity: a randomized controlledtrial. JAMA 1999; 282(16):1561–1567.
114. Gortmaker S, Peterson K, Wiecha J, et al. Reducing obesity via a school-based interdisciplinaryintervention among youth: Planet health. Arch Pediatr Adolesc Med 1999; 153:409–418.
115. Wilson GT. Behavioral treatment of obesity: thirty years and counting. Adv Behav Res Ther 1994;6:31–75.
116. Epstein LH, Wing KR. Behavioral treatment of childhood obesity. Psychol Bull 1987; 1:331–342.117. Epstein LH. Methodological Issues and Ten-Year Outcomes for Obese Children. In: Williams CL,
Kimm SYS, eds. Prevention and Treatment of Childhood Obesity. The New York Academy ofSciences, New York, 1993, pp. 237–249.
118. Epstein LH, Valoski AM, Vara LS, et al. Effects of decreasing sedentary behavior and increasingactivity on weight change in obese children. Health Psychol 1995; 14(2):109–115.
119. Goldfield GS, Raynor HA, Epstein LH. Treatment of Pediatric Obesity. In: Stunkard AJ, WaddenTA, eds. Obesity: Theory and Therapy (3rd ed.). Guildford Press, New York, 2002, pp. 532–555.
120. Himes JH, Dietz WH. Guidelines for overweight in adolescent preventive services: recommenda-tions from an expert committee. Am J Clin Nutr 1994; 59:307–316.
121. Charney F, Goodman HC, McBride M, Lyon B, Pratt R. Childhood antecedents of adult obesity. Dochubby infants become obese adults? N Engl J Med 1976; 295:6–9.

Chapter 13 / Pediatric Obesity Prevention 343
122. Guo S, Roche AF, Chumlea WC, Siervogel EM, Gardner JD. The predictive value of childhood bodymass index values for adult overweight. Am J Clin Nutr 1994; 159:810–819.
123. Serdula MK, Ivery D, Coates RJ, Freedman DS, Williamson DF, Byers T. Do obese children becomeobese adults? A review of the literature. Prev Med 1993; 22:167–177.
124. Jeffery RW. Population perspectives on the prevention and treatment of obesity in minority popula-tions. Am J Clin Nutr 1991; 53:16,218–16,248.
125. Brownell KD, Stunkard AJ, Albaurn JM. Evaluation and modification of exercise patterns in the nat-ural environment. Am J Psychiatry 1980; 137:1540–1515.
126. Winett RA, King AC, Altman DC, eds. Health Psychology and Public Health. An IntegrativeApproach. Pergamon, New York, 1989.
127. Williams JD, Achterberg C, Sylvester OP. Target Marketing of Food Products to Ethnic MinorityYouth. In: Williams CL, Kimm SYS, eds. Prevention and Treatment of Childhood Obesity. The NewYork Academy of Sciences, New York, 1993, pp. 107–114.
128. Jackson MY, Proulx JM, Pelican S. Obesity Prevention. Am J Clin Nutr 1991; 53:1625S–16308.129. Jeffery RW, Wing RR. Long–term effects of interventions for weight loss using food provision and
monetary incentives. J Consult Clin Psychol 1995; 63:793–796.130. Cardon LR. Genetic Influences on Body Mass Index in Early Childhood. In: Turner JR, Cardon LR,
Hewitt JK, eds. Behavior Genetic Approaches in Behavioral Medicine. Plenum, New York, 1995, pp.133–143.
131. Warner K. Smoking and health implications of a change in the federal cigarette excise tax. JAMA1986; 255:1028–1032.
132. Lev D, Sheflin N. New evidence on controlling alcohol use through price. J Stud Alcohol 1983; 343:929–937.
133. French SA, Story M, Jeffrey RW, et al. Pricing strategy to promote fruit and vegetable purchase inhigh school cafeterias. J Am Diet Assoc 1997; 97:1008–1010.
134. French SA, Jeffrey RW, Story M, et al. Pricing and promotion effects on low-fat vending snack pur-chases: the CHIPS study. Am J Public Health 2001; 91:112–117.
135. Dietz WH. Critical periods in childhood for the development of obesity. Am J Clin Nutr 1994;51:955–959.
136. Johnson SL, Birch LL. Parents’ and children’s adiposity arid eating style. Pediatrics 1994;94:653–661.
137. Fisher JO. Birch LL. 3–5 year–old children’s fat preferences and fat consumption are related toparental adiposity. Am Diet Assoc 1995; 95:759–764.
138. Marinho E. Social influence in the formation of enduring preferences. J Abnorm Soc Psychol 1942;37:448–468.
139. Allison DB, Paultre F, Heymsfield SB, Pi–Sunyer FX. Is the intra–uterine period really a criticalperiod for the development of adiposity? Int J Obes 1995; 19:397–402.
140. Brownell KD, Horgen KB. Food Fight: The Inside Story of the Food Industry, America’s ObesityCrisis, and What We Can Do About It. The McGraw-Hill Companies, New York, 2004.
141. Nestle M. Food Politics: How the Food Industry Influences Nutrition and Health. University ofCalifornia Press, Berkeley, CA, 2002.
142. Ludwig DS, Peterson KE, Gortmaker SL. Relation between consumption of sugar-sweetened drinksand childhood obesity: a prospective, observational analysis. Lancet 2001; 357:505–508.
143. Mello MM, Rimm EB, Studdert DM. The McLawsuit: The Fast-Food Industry and LegalAccountability for Obesity. Health Affairs 2003; 22(6):207–216.
144. AAP. Prevention of Pediatric Overweight and Obesity: American Academy of Pediatrics PolicyStatement; Organizational Principles to Guide and Define the Child Health System and/or Improvethe Health of All Children; Committee on Nutrition. Pediatrics 2003; 112:424–430.


From: Preventive Nutrition: The Comprehensive Guide for Health Professionals, Third EditionEdited by: A. Bendich and R. J. Deckelbaum © Humana Press Inc., Totowa, NJ
345
14 Can Childhood Obesity Be Prevented?Preschool Nutrition and Obesity
Christine L. Williams
KEY POINTS
● In the past three decades the prevalence of obesity among preschool children has doubled.● Obesity in children 3 yr of age and older is an important predictor of adult obesity.● Obesity in preschool children is associated with significant comorbidities as in older
children and adolescents, especially dyslipidemia and elevated blood pressure.● The USDA Food Guide Pyramid for Preschool Children provides a useful general
overview of a nutrient-balanced and energy-adequate diet for 2- to 6-yr-old.● Energy balance in preschool children is of critical importance in the primary prevention
of obesity.
1. INTRODUCTION
Early childhood is a time of rapid growth, development, and learning. These charac-teristics are critical in defining the nutritional needs of preschool children and providethe framework for dietary guidelines and nutrition policy. Early childhood also is a timewhen children begin to develop eating habits that may differentially promote or discour-age the development of chronic disease later in life. Therefore, the goal of preschoolnutrition programs is to promote dietary habits that achieve optimal health, growth, anddevelopment in a manner that also minimizes risk of nutrition-related disease. This chap-ter reviews the primary preschool nutrition programs in the United States and exploresthe impact of recent trends in early childhood obesity, preschool dietary intake, and physicalactivity issues related to dietary guidelines for healthy 2- to 5-yr-old children.
2. EARLY CHILDHOOD OBESITY TRENDS: UNITED STATES
During the last two decades, the proportion of US children who are significantlyoverweight (body mass index [BMI] ≥ 95th percentile) has more than doubled, promptingin-depth reviews of trends in dietary intake and physical activity in childhood. Becausethe obesity epidemic has also extended downward to preschool children, the importanceof energy balance in preschool children becomes of critical importance in the primaryprevention of this disease.

346 Part IV / Diabetes and Obesity
Excessive weight and obesity are independent risk factors for increased morbidity andmortality throughout the life cycle. For example, excessive weight and obesity in womenare predictors of gestational diabetes during pregnancy and newborns with excessivebirth weight (1). High birth weight is a predictor of excessive weight and obesity inadulthood and of cofactors associated with insulin resistance (IR) (2). In parallel with theworldwide increases in obesity prevalence, the prevalence of excessive weight andobesity in children is rising (3). Because obesity in childhood frequently tracks intoadulthood, increases in childhood excessive weight and obesity clearly are major con-tributors to the adult obesity epidemic (4). Children express the same comorbidities thatare associated with being overweight and obese as adults (4,5). Therefore, being over-weight during childhood brings with it comorbidities that will increase the duration ofcomorbidities in an individual by one to two decades, a factor that can increase theimpact of a number of risk factors on adult diseases.
Fig. 1. Percentage of 2- to 3- and 4- to 5-yr old boys at or above the 95th percentile ofthe weight-for-length growth. (From Third National Health and Nutrition ExaminationSurveys [1988–1994].)
Fig. 2. Percentage of 2- to 3- and 4- to 5-yr old girls at or above the 95th percentile ofthe weight-for-length growth. (From Third National Health and Nutrition ExaminationSurveys [1988–1994].)

Chapter 14 / Preschool Nutrition and Obesity 347
The increase in the prevalence of preschool obesity has been observed in the UnitedStates and internationally. These increases have been noted in all racial and ethnicgroups, but some groups have been affected more than others. In the United States, theNational Health and Nutrition Examination Surveys (NHANES) databases providealarming statistics showing substantial increases in the prevalence of excessive weight(defined as the 85th to 95th percentiles of the weight-for-height growth references) (5).Presently in the United States, about 10% of children ages 4 to 5 yr are overweight(Figs. 1 and 2). The increase in prevalence across the US pediatric population generallyhas been similar in girls and boys. Among preschool children, girls were affected morethan boys between the NHANES I and the NHANES III (1988–1994) surveys (a periodof almost 20 yr); excessive weight and obesity in 4- to 5-yr-old girls doubled butincreased only approx 25% among boys who were the same age. However, by theNHANES in 1999 to 2000, preschool boys and girls were similarly affected (about 10%for both genders). Among older children (6–19 yr), there has been an approximate dou-bling of obesity prevalence in boys as well as in girls in the United States in the past30 yr (5) (Fig. 3).
Although the increases in childhood obesity have been noted in all racial and ethnicgroups, some groups appear to be at greater risk of developing this disease. Excessiveweight tends to be highest among Mexican-American and African-American children andlowest among non-Hispanic Caucasian children. Overall, nearly 22% of preschool chil-dren in the United States in 1999 to 2000 were classified as “at risk of overweight”(BMI: 85th to 95th percentile), and 10% were classified as “overweight” (BMI: ≥95thpercentile). This compares with 18.6 and 8.5%, respectively, in 1983.
In the Bogalusa Heart Study in Louisiana, the prevalence of excessive weight among5- to 24-yr-olds from the biracial community increased twofold between 1973 and1994. A fact that is particularly concerning is that the yearly increases and relativeweight and obesity during the latter part of the study (1983–1994) were 50% greaterthan those between 1973 and 1982 (6). Additionally, independent of racial/ethnic dif-ferences, lower socioeconomic status (SES) is another important predictor for the highprevalence of excessive weight and obesity in US children (5).
Fig. 3. Prevalence of excessive weight in US children, NHANES: 1988 to 1994 and 1999to 2000.

348 Part IV / Diabetes and Obesity
Other industrialized settings are recording similar disturbing trends in increasing obe-sity prevalence. In Japan, the frequency of obese school children between ages 6 and 14 yrincreased from 5 to 10% and that of extremely obese children from 1 to 2% between 1974and 1993 (3). Childhood obesity is not limited to the industrialized countries. In a recentreview, De Onis and Blossner (7) reported the rapidly increasing prevalence of excessiveweight and obesity among preschool children in developing countries. Interestingly,certain countries simultaneously demonstrated high percentages of excessive weightand high frequencies of wasted (malnourished) children. Specific examples includeNorthern Africa, where the percentage of overweight children and wasted childrenexceeded 8 and greater than 7%, respectively. Similarly, in Eastern Asia, 4.3% ofpreschoolchildren were overweight, and 3.4% were underweight. In South America,where malnutrition and underweight were once predominant, the percentage of over-weight preschool children was close to 5%, but wasted children comprised only 1.8%.In several countries (e.g., Egypt, Argentina, Malawi, Nigeria, Uzbekistan, Peru, Qatar,South America, Jamaica), the percentage of overweight children exceeds that of theUnited States. In 38 countries where secular data are available, 16 showed a rising trendin obesity prevalence over time, 14 were static, and only 8 showed falling rates in obe-sity prevalence. Rates of increase seem most marked in countries in Northern Africa,such as Morocco and Egypt, as well as in some countries of the Caribbean and SouthAmerica (7). Therefore, obesity in children can no longer be classified as a Westernproblem alone; it is now shared by nearly all industrialized areas and many developingcountries. The economic burden of these trends is also significant (8).
2.1. Tracking of Childhood Obesity Into Later LifeData from a number of studies provide strong evidence that higher levels of BMI dur-
ing childhood can predict excessive weight later in life. This was recently summarized ina review by Goran (9). Data from four longitudinal studies were reviewed and showed thatthe probability of excessive weight at age 35 yr for children with BMI in the 85th to 95thpercentiles increased with increasing age. The prediction for adult weight was most accu-rate for BMI at age 18 yr, with accuracy decreasing for BMI below age 13 yr. Goran (9)concluded that the “persistence of pediatric obesity into adulthood increases according tothe age at which obesity is initially present.” Similarly to what has been recorded in NorthAmerica, obesity during childhood in Japan is associated with increased likelihood of obe-sity during adulthood. In a Japanese study, approximately one-third of obese children grewup to become obese adults (10). Whitaker et al. (11) found that the risk of adult obesity wasgreater in both obese and nonobese children if at least one parent was overweight. Thiseffect was most pronounced in children that were younger than age 10 yr; after age 10 yr,the child’s own overweight/obesity status was a better predictor than having an obeseparent. These studies show the importance of the family environment in contributing to theincreasing prevalence of obesity. These increases are most likely associated with changes(increases) in food supply and caloric intake accompanied by diminishing levels of physi-cal activity. One might consider that these family studies provide strong evidence for thegenetic contribution to obesity. However, it is very unlikely that changing gene pools canexplain the doubling or even tripling of obesity prevalence rates in certain groups over20 yr, which is too short a period to affect the genetic background in affected populations.
Must et al. (12) presented data relating to the outcomes of overweight adolescentsfollowed for up to 50 yr. Both men and women who were overweight at adolescence

Chapter 14 / Preschool Nutrition and Obesity 349
had increased age-related morbidity and mortality relating to cardiovascular and otherchronic diseases. Increased risk was also present even if adolescents who were obesehad lost the excess weight during the adult period (12), suggesting that obesity duringadolescence may set triggers that are associated with adverse risk in the adult.
One emerging area of research involves the potential role of intra-uterine growth andgrowth in the first year of life for predicting the emergence of increased cardiovascularrisk and obesity during adulthood. These potential links were critically reviewed byDietz and Gortmaker (4). In reviewing the Dutch Famine Studies, they noted that indi-viduals who were exposed in utero to famine in the first trimester of pregnancy weremore likely to be overweight at age 18 yr compared with those exposed to famine atother periods during pregnancy. In contrast, individuals exposed to famine late in preg-nancy tended to be underweight at age 18 yr. Although low birth weight and low weightgain in the first year of life may contribute to increased risk of hypertension, dyslipi-demia, and cardiovascular risk in the adult population, Dietz and Gortmaker concludedthat it is unlikely that low birth weight contributes significantly to obesity prevalence inthe adult population. Additionally, although an individual who is born overweight(>4000 g) does have a higher risk of being an overweight adult, these authors suggestedthat less than 5% of adult obesity is caused by individuals born with high birth weights.
2.2. Health Effects of Childhood ObesityObesity-associated chronic disease risk factors are present in adults and also manifest
in overweight and obese children (13,14). For example, data from the Bogalusa HeartStudy showed that approx 60% of overweight 5- to 10-yr-old children had one cardio-vascular risk factor, such as high blood pressure, hyperlipidemia, or elevated insulin levels(15). From the same cohort of 5- to 10-yr-olds, greater than 20% of overweight childrenhad two or more cardiovascular risk factors, which would substantially increase the riskof these individuals for earlier cardiovascular disease (CVD) if they were tracked intoadulthood. Similarly to adults, children who were moderately overweight showed that anelevation of low-density lipoprotein cholesterol (LDL-C) levels and hypercholes-terolemia did not substantially increase with higher degrees of obesity. With more markeddegrees of obesity, rises in plasma triglyceride levels and decreases of high-densitylipoprotein cholesterol are more common, and, similarly to adults, blood pressure eleva-tions in children are more common with significant obesity than with moderately excessiveweight. With the rising prevalence of excessive weight and obesity in children, non-insulin-dependent diabetes mellitus (type 2 diabetes) increasingly becomes a pediatri-cian’s problem. In one report (16), 4% of new diagnoses of diabetes before 1992 wereclassified as type 2 diabetes. In 1994, 16% of new diabetics were classified with type 2diabetes—a fourfold increase. In the Cincinnati area between 1982 and 1994, there wasa 10-fold increase in type 2 diabetes in children, and the African-American populationwas more severely affected than the Caucasian population (16).
Alarming findings are now emerging from Asian countries that are rapidly Westernizingtheir lifestyle habits. For example, in urban Japanese children, plasma total cholesterol lev-els and LDL-C now exceed those found in US children (17). A recent analysis examin-ing differences between the Japanese and US pediatric populations suggests that dietaryhabits, exercise, and adiposity differences do not explain the varying lipid levels betweenJapanese and US children. The hypothesis was raised that the populations not previ-ously exposed to Western diets and lifestyles may demonstrate more adverse effects on

350 Part IV / Diabetes and Obesity
expression of cardiovascular risk factors than longer exposed populations (17). In Japanesechildren, excessive weight and obesity are also associated with substantial elevations ofplasma total cholesterol and LDL-C levels and type 2 diabetes, and in some areas of Japan,type 2 diabetes is now more common in children than type 1 diabetes (18).
Other comorbidities are also associated with childhood obesity. These include ortho-pedic problems, such as Blount’s disease, skin fungal infections and acanthosis nigri-cans, hepatic steatosis and steato-hepatitis; sleep apnea; pseudotumor cerebri; andpsychological and behavioral problems. Psychological problems associated with child-hood obesity include negative self-esteem, withdrawal from interaction with peers,depression, anxiety, and the feeling of chronic rejection (5). Therefore, a strong body ofevidence suggests that BMI in childhood is associated with various adverse biochemical,physiological, and psychological effects, many of which have the possibility of trackinginto chronic disease risk factors in adulthood.
There are different biological effects related to excessive weight and obesity amongdifferent racial/ethnic groups. Evidence is available to suggest that aerobic capacity maybe lower in African-American than in Caucasian children and may be more significantthan energy expenditure leading to obesity (9). Goran (9) concluded that fasting insulinand acute insulin response are significantly higher and insulin sensitivity is significantlylower in African-American than in Caucasian prepubertal children; these differences arenot explained by differences in body fat, body fat distribution, diet, or physical activity.These findings are important because they suggest that prevention and treatment strate-gies may require different approaches in different racial/ethnic populations.
Although hereditability estimates of genetic population studies suggest that 40 to70% of adult obesity results from genetic factors, there is little information available inpediatric populations. Nevertheless, statistics show that a proportionate variance withinadult populations is accounted for by genetic factors; however, this does not reflect theinterplay between genes and environment at the individual level, especially within thedeveloping individual.
Finally, many of the childhood obesity comorbidities result in significant economiccost to society. This is apparent in the proportion of pediatric hospital discharges withobesity-related diagnoses, a figure that has increased dramatically in the past 20 yr.Wang and Dietz (8) analyzed the economic burden of obesity in youths ages 6 to 17 yrand found that obesity-related annual hospital costs (based on 2002 constant dollarvalue) increased more than threefold over the two decades between 1979 to 1981 and1997 to 1999: from $35 million to $127 million. Discharges of obesity-related diabetesnearly doubled (1.43 to 2.36%); obesity-related gallbladder disease tripled (0.36 to1.06%); and obesity-related sleep apnea increased fivefold (0.14 to 0.75%). Asthma andcertain mental disorders were the most common primary diagnoses when obesity waslisted as the secondary diagnosis. Thus, the increasing prevalence and severity of obe-sity among children and adolescents has resulted in significant economic costs as well.
2.3. Prevention of Early Childhood ObesityIn approaching early childhood obesity, it is helpful to consider three levels of pre-
vention: primordial prevention, aimed at maintaining a normal BMI; primary preven-tion, aimed at preventing “at risk of overweight” children (BMI: 85th to 95thpercentiles) from becoming overweight (BMI: ≥95th percentile); and secondary pre-vention, aimed at treating obese children (BMI: ≥95th percentile) to reduce comor-bidities and reduce (or possibly normalize) the severity of excessive weight (5,14).

Chapter 14 / Preschool Nutrition and Obesity 351
2.3.1. PRIMORDIAL PREVENTION
The most desirable prevention goal would be the primordial prevention of obesity,that is, preventing children with desirable BMI (<85th percentile) from becoming “atrisk of overweight “ (BMI: 85th to 95th percentile). Success in achieving this goal ismost likely to occur if prevention strategies and interventions are initiated in the firstfew years of life, perhaps even beginning during the prenatal period and infancy.
There are several reasons for emphasizing primordial prevention, the most significantof which are related to adipocyte physiology, adiposity rebound, and the limited potentialfor reversing metabolic changes associated with obesity. During fetal life, babies beginto develop fat cells (adipocytes) at around 15 wk of gestation (19). Rapid increase in fatcell number and size, especially during the third trimester of pregnancy, results in anincrease in percent body fat from about 5 to 15% (20). Thus, by full-term birth, aboutone-sixth of the infant’s weight is fat (a 6-lb baby would have about 1 lb of fat). Thistranslates into about 5 billion adipocytes—16% of the 30 billion found in adults.
During infancy, fat cells increase primarily in size rather than number. Between ages 2and 14, there is little change in fat cell size in lean children, and there is only a smallincrease in fat cell number from between ages 2 and 10 yr (21–23). Among obese children,however, fat cells continue to increase in size (24). Eventually, this triggers an increase infat cell number when adipocyte lipid content exceeds about 1 μg of lipid per cell (25,26).During therapeutic weight loss, the rate at which new fat cells are formed (from pericapil-lary fibroblasts) slows in obese children but still continues at a rate that is greater than inlean children (27). Therefore, once obesity has developed in childhood, it may berestrained, but perhaps not reversed, giving added impetus for primordial prevention.
2.3.2. INFANT WEIGHT GAIN, ADIPOSITY, AND OBESITY
Numerous studies have demonstrated an association between caloric intake and adi-posity in infancy. Dewey and Lonnerdal (28) found that caloric intake was related toweight-for-length at age 2 mo but not at age 4 or 6 mo. Average energy intake over thefirst 6 mo of life correlated significantly with weight gain and weight-for-length at 6 mo.Others reported that British infants consumed significantly more calories and demon-strated twice the prevalence of excessive weight than comparable Swedish infants (29).For 6- to 9-mo-old infants, no correlation was found between adiposity and caloricintake when using 3-d food intake records (30).
However, rate of weight gain during the first year of life is a powerful predictor ofadiposity at age 7 yr in both boys and girls. Weight gain above the 90th percentile dur-ing infancy was associated with a relative risk of obesity of 3.3 and 1.7 for boys forgirls, respectively, at age 7 yr (31).
Some studies have suggested that mode of infant feeding (i.e., breast vs bottle, earlyvs later introduction of solids) is an important determinant of childhood obesity.Evidence is mixed, however, because studies are confounded by problems, includingthe fact that many infants get mixed feedings of both bottle and breast; bottle-fed babiesoften consume solids earlier, and lack of control for SES, maternal age, and race. Manystudies suggest that bottle-fed infants tend to consume more calories and gain weightmore rapidly than breast-fed infants (32). In a study that controlled for SES, maternalage, and race, Kramer et al. (33) found that breastfeeding conferred a significant long-term protective effect against obesity in childhood. Breastfeeding combined with delayedintroduction of solid foods exerted a protective effect against obesity to age 2 yr (34).Although other studies have not found any differences in development of adiposity

352 Part IV / Diabetes and Obesity
between bottle- and breast-fed infants (35), advocating breastfeeding has other benefitsand can be recommended for these reasons in addition to the possible benefit in preventingaccelerated weight gain.
2.3.3. FEEDING AND ACTIVITY PATTERNS OF OBESE AND LEAN INFANTS AND TODDLERS
Several investigators have explored differences in feeding and activity patterns oflean and obese infants to determine the earliest times at which clear-cut differences canbe identified and also to determine which factors might be etiologically more importantin the initiation of childhood obesity. Roberts et al. (36) measured both energy intakeand expenditure at ages 6, 9, and 12 mo among infants of normal-weight and over-weight mothers. At age 6 mo, infants of overweight mothers consumed 42% morecalories than infants of normal-weight mothers. There was no difference at ages 9 and12 mo. At age 3 mo infants of obese mothers who were becoming overweight alreadyhad a total energy expenditure (TEE) that was an average of 20.7% lower than all nor-mal infants combined. Griffiths et al. (37,38) studied energy intake and expenditure inpreschool children and also found that the children of obese parents had a significantlylower TEE (22% lower) compared with children of normal-weight parents. However, Inthis study, self-reported energy intake was also lower. Collectively, these data suggestthat perhaps both early overfeeding plus reduced TEE contribute to infant obesity orthat infants and children who are susceptible to obesity have a variety of mechanismsfor providing the surplus energy for excessive weight gain, including excess intake ofenergy as well as low TEE in physical activity.
Other investigators have reported evidence that soon after birth, the feeding behav-iors of heavier infants differ from that of leaner infants. Compared with lighter infants,heavier infants suck faster and consume more formula if the formula is sweetened.Babies with medium or increased adiposity showed increased sucking rates and pres-sures (greater avidity of feeding) for sweet-tasting fluids compared with thinner babies,who demonstrated a relative aversion for sweet taste. This behavior predicted relativeweight at age 3 yr. Overall, sucking studies found that infants who suck more frequently athigher pressures and with shorter intervals between bursts of sucking consume morecalories and tend to be fatter. These characteristics explained about 25% of the variance inadiposity (triceps skinfold thickness) at age 2 yr in a multiple regression analysis. Thestrongest positive correlation was between sucking pressure and triceps skinfold thick-ness at age 2 yr. Interestingly, number of feeds per day was negatively correlated withadiposity, with fewer feeds associated with greater triceps skinfold thickness (39).
Tracking studies indicate that the obese infant has an increased risk of becoming anobese older child, although overall only one-fourth to one-third tend to show persistenceof the problem, and the most significant predictor is parental obesity (31,40–42).Generally, the longer that the obesity persists and the more severe the problem, thegreater the likelihood it will persist into adulthood. Parental obesity increases the like-lihood that all of these factors will occur.
2.3.4. ADIPOSITY REBOUND
The importance of primordial prevention is also supported by studies of adiposityrebound in childhood. Normally, BMI increases from birth to age 1 yr, then falls andreaches a low point at around age 6 yr before rebounding again. In several studies to date,the timing of adiposity rebound in childhood was related to risk of adolescent and adultobesity. Rolland-Cachera et al. (43) studied the pattern of BMI changes during childhood

Chapter 14 / Preschool Nutrition and Obesity 353
for 151 children ages 1 mo to 16 yr. They reported that early adiposity rebound before age5.5 yr (vs later adiposity rebound) was associated with significantly greater adiposity at age16 yr (43). They noted that infants who eventually became obese by age 14 yr were slightlyheavier at birth, reached a higher peak BMI slightly later in infancy (14 mo vs 12 mo),showed less of a decline in BMI at about age 2 yr, and began adiposity rebound at a meanage of 4 yr (50 mo) versus 6 yr (70 mo) for lean children/teens. Figure 4 illustrates changesin BMI for an overweight 6-yr-old child in whom adiposity rebound occurred at age 3 yr.
Whitaker et al. (42) conducted a retrospective cohort study using lifelong height andweight measures recorded in outpatient medical records. He found that a younger age at“adiposity rebound” was associated with an increased risk of adult obesity and that therisk was independent of BMI at adiposity rebound and independent of parent obesity (42).Therefore, the earlier the age at which adiposity rebound occurs, the more likely a childwill become an obese adult. Thus, one of the most compelling arguments for initiatingobesity prevention in the first few years of life is the desire to delay adiposity rebound.
Although adiposity rebound was first described 15 yr ago, little is known about whattriggers early adiposity rebound. It is likely to be influenced by a complex interactionof both genetic and environmental factors. In view of the increasing prevalence of earlyadiposity rebound among children and adolescents, the mean age of adiposity reboundmight also be decreasing in the United States. To date, however, no data have reportedtemporal trends for adiposity rebound in the United States or other developed countries.Additional studies are needed to determine if dietary factors (e.g., high fat) promoteearly adiposity rebound or if inactivity also plays a role.
There are some clues that accelerated weight gain in preschool children may be asso-ciated with an increasing proportion of calories from fat in the diet. This might beexpected because fat is very energy-dense relative to protein and carbohydrates, thusfoods high in fat typically are higher in total energy and smaller in volume (an importantsatiety cue). High-fat foods also are very palatable (which encourages overeating) but nothighly satiating; therefore, children may be less likely to adjust subsequent dietary intaketo compensate for having consumed a high-fat (high-calorie) meal. Dietary fat is storedmore efficiently than dietary protein or carbohydrates, and, similarly to carbohydrate andprotein, oxidation of dietary fat does not increase as dietary fat intake increases.
Klesges et al. (44) evaluated determinants of accelerated weight gain over 3 yr in acohort of 146 preschool children. Higher baseline levels of %energy (%E) from fat were
Fig. 4. Adiposity rebound before age 3 yr. Case History: White female, BW 8 lb, 7 oz; 20.5inches; Mom-Ht 66, Wt 225 lb; Dad-Ht 73, Wt 210 lb; TC = 189, HDL = 29, LDL = 99;Trig 309; TC-skinfold 22 mm (age 6); BP 94/64 (approx 90%); Ht 90 to 95%; Wt > 95%.Favorite foods: pizza, cheeseburgers, chicken-nuggets, hotdogs, cookies, pudding, cheese.
354 Part IV / Diabetes and Obesity
associated with greater increases in adiposity and BMI, as were recent increases in %Efrom fat. Total caloric intake did relate to weight gain; however, when fat kcal wereentered into the regression equation, it explained more of the variance in weight gainthan total energy intake. This suggests that for preschool children, the percentage ofcalories from total fat is an important contributor to accelerated weight gain. Baselineaerobic activity and increased leisure activity were also significant predictors of changein BMI. These modifiable diet/activity variables together accounted for 33% more ofthe variance in body mass change than the combined set of nonmodifiable variables(such as parental obesity). In the same study, Eck et al. (45) found that percent of calo-ries from fat, but not total calories, were higher in a high-risk group of 3- to 4-yr-oldchildren who gained more weight over a 1-yr period of time.
Robertson et al. (46) also found that total energy intake was higher among preschoolchildren who had accelerated weight gain over a 2-yr period compared with childrenwhose weight gain for height was normal. Children with accelerated weight gain alsoconsumed a greater proportion of their calories from fat (46). Daheeger et al. (47)reported that number of calories from dietary fat was a significant predictor of fat massfor 4- to 7-yr-old boys (even after controlling for total caloric intake) but not for girls.
Also, obese preschool children often are prompted by their parents to eat more atmealtimes. Klesges et al. (48) sent trained meal observers into homes to observe fami-lies at mealtimes and found that obese children were prompted to eat more, offeredmore food, presented with more food, and encouraged to eat more food twice as oftenor more than lean children.
A major rationale for very early primordial and primary prevention is that obesity inchildren ages 3 yr and older is an important predictor of adult obesity. Whitaker et al. (42)found that this was true regardless of whether the parents were obese. Additionally, parentalobesity more than doubled the risk of adult obesity among both obese and nonobese chil-dren less than age 10 yr. In contrast, obese children younger than age 3 yr whose parentswere not obese were not at increased risk of adult obesity. The fact that parental obesity isa powerful predictor of child obesity has been known for several decades. With the cur-rently increasing rates of adult obesity, however, the prevalence of parental obesityincreases, as does the risk that children of these obese parents will also become obese.
2.3.5. SECONDARY PREVENTION
Secondary prevention is also important, because both duration and severity of obesityare critical predictors of persistent childhood and adolescent obesity and eventual adultobesity and related health problems (i.e., the longer obesity persists during childhood andadolescence, and the more severe it becomes, the greater the likelihood that the problemwill persist into adult life). Thus, there is good rationale for believing that obesity pre-vention efforts should be initiated during the preschool period for maximum effectiveness.
2.3.6. BALANCING ENERGY INPUT WITH ENERGY EXPENDITURE
Because obesity represents the net effect of an imbalance between energy intake(diet) and energy expenditure (physical activity) over time, there is a critical need tohelp susceptible children balance energy intake with energy output. This is often diffi-cult, considering the present lifestyle of children and families in the United States. Forexample, in 45 min of exercise, a 75-lb child may be expected to expend approx 90,135, 180, and 525 calories during continuous bicycling, walking, dancing, and running,respectively. In contrast, a regular size “fast food” meal would provide about 600 calo-ries, but a “supersized fast food” double cheeseburger meal could provide more than

Chapter 14 / Preschool Nutrition and Obesity 355
1800 calories. Therefore, for many children who chose the larger portions (even for achild who is spends an hour a day in moderately vigorous physical activity), the resultis still an excess of caloric intake over expenditure.
Strategies for preventing excess weight gain for height in childhood and preventingovert obesity emphasize plant-based foods, whole grains, fruits and vegetables, low-fatdairy products, lean meats, and less frequent “light” snacks to reduce consumption ofenergy-dense foods and increase consumption of nutrient-rich foods that are lessenergy-dense, or “lighter.” However, at various ages and stages of childhood develop-ment , obesity prevention strategies differ. Table 1 summarizes suggested componentsof obesity prevention initiatives affecting infants and children.
For children who are significantly overweight, the goal should be to reduce severityof obesity and to treat, reduce, and eliminate comorbidities (e.g., hypertension, dyslipi-demia, IR, and type 2 diabetes). For energy balance, measures are needed for childrento lose weight or to slow the rate of gain and to grow into their expected heights. Thisrequires some reduction in energy intake and substantial increases in energy expendi-ture (5,14,49,50). In summary, therefore, childhood obesity is increasing at epidemicrates, even among preschoolchildren, and is accompanied by significant comorbiditiesand health problems. Prevention should be the primary goal and, if successful, will helpreduce adult obesity and obesity-related chronic diseases.
3. DIETARY INTAKE IN EARLY CHILDHOOD:WHAT ARE PRESCHOOL CHILDREN EATING?
3.1. Healthy Eating Index Scores for Preschool Childrenin the United States
The Healthy Eating Index (HEI) developed by the US Department of Agriculture(USDA) has been used to examine the diet of all Americans, including that of preschool
Table 1Goals for Obesity Prevention Initiatives in Childhood
Perinatal: Supply good prenatal nutrition and health care; avoid excessive maternal weightincrease; control diabetes; help mothers lose weight postpartum; and offer nutrition education.
Infancy: Encourage breastfeeding and continue breastfeeding for 6 mo or longer, if possible;provide a balanced diet; avoid an excess of high-calorie desserts and snacks; and followweight increase closely.
Preschool: Provide early experiences with foods and flavors; help develop healthy food preferences; encourage appropriate parental feeding practices; monitor rate of weightincreases to prevent early adiposity rebound; and provide child and parent nutrition education.
Childhood: Monitor weight increase for height (slow down if excessive); avoid excessiveprepubertal adiposity; provide nutrition education in school; provide healthy food choices inthe school food service (fruits, vegetables, whole grains, low saturated-fat content); providedaily physical activity opportunities in gym, recess, and after-school programs for an hour ofmoderately vigorous active play.
Adolescence: Prevent excess weight increase after growth spurt; provide nutrition educationin high school; provide healthy food choices in the cafeteria (fruits, vegetables, wholegrains, low saturated-fat content); provide daily physical activity opportunities in gym andsports program, during and after school.

356 Part IV / Diabetes and Obesity
children. This index consists of 10 components, each representing different aspects of ahealthful diet (51). Components 1 to 5 measure the degree to which a person’s diet con-forms to the USDA’s Food Guide Pyramid serving recommendations for the following fivemajor food groups: grains (bread, cereal, rice, and pasta); vegetables; fruits; milk (milk,yogurt, and cheese); and meat/meat alternatives (meat, poultry, fish, dry beans, eggs, andnuts). Component 6 measures total fat consumption as a percentage of total food energy(calorie) intake. Component 7 measures saturated fat consumption as a percentage of totalfood energy intake. Components 8 and 9 measure total cholesterol intake and total sodiumintake, respectively. Component 10 measures the degree of variety in a person’s diet. Eachcomponent of the HEI has a maximum score of 10 and a minimum score of 0. Intermediatescores are computed proportionately. High component scores indicate intakes close to rec-ommended ranges or amounts. The maximum combined score for the 10 components is100. An HEI score greater than 80 implies a good diet, an HEI score between 51 and 80implies a diet that needs improvement, and an HEI score less than 51 implies a poor diet.
In data collected between 1994 and 1998 as part of the USDA Continuing Survey ofFood Intake in Individuals, only about 25% of children ages 2 to 5 yr consumed a “gooddiet” (HEI score > 80) (Table 2). The majority, about two-thirds, consumed diets ranked
Table 2Healthy Eating Index: Overall and Component Mean Scores and Percentages for Children
(Selected Years 1994 to 1996a, 1998)
1994 to 1996 1998
Ages Ages Ages Ages Ages AgesComponent 2 to 3 4 to 6 7 to 9 2 to 3 4 to 6 7 to 9
HEI score Overall 73.1 66.9 65.9 74.3 68.4 67.9
1. Grains 8.3 7.2 7.7 8.5 7.6 7.92. Vegetables 5.9 4.9 5.1 6.3 5.1 5.63. Fruits 7.1 5.4 4.4 7.4 5.8 5.04. Milk 7.2 7.3 7.6 7.4 7.7 7.65. Meat 6.3 5.3 5.5 6.6 5.6 5.96. Total fat 7.4 7.3 7.2 7.3 7.4 7.37. Saturated fat 5.4 5.6 5.6 5.4 5.7 6.28. Cholesterol 9.0 8.9 8.8 8.6 8.7 8.59. Sodium 8.8 8.1 6.9 8.7 7.5 6.1
10. Variety 7.7 7.0 7.2 8.0 7.5 7.7
Percentage of children meeting the dietary recommendations for each component1. Grains 54 27 30 57 31 342. Vegetables 30 16 20 35 19 223. Fruits 56 30 18 60 35 254. Milk 43 43 49 45 50 505. Meat 28 14 17 29 17 136. Total fat 40 37 35 39 38 387. Saturated fat 27 28 27 30 30 398. Cholesterol 84 83 81 82 81 789. Sodium 65 53 33 61 40 32
10. Variety 49 38 39 53 46 46a The 1994 to 1996 HEI scores reflect an updated HEI methodology, therefore they are not directly
comparable to previously published HEI scores.

Chapter 14 / Preschool Nutrition and Obesity 357
as “needs improvement,” with HEI scores between 51 and 80. “Poor” diets were con-sumed by 7 to 10% of preschoolers (Table 3). For preschool children in families at orbelow poverty, only 22% consumed a “good diet” compared with 29% of preschoolersin families with income above poverty level (51).
3.2. Child and Adult Care Food Program MenusRecently, the USDA compared the macro- and micronutrient content of menus of
young children who participate in the Child and Adult Care Food Program (CACFP) tonutrient standards (52). The standards used in the USDA study included the “DietaryGuidelines for Americans recommendations (53) as the standard for percent of energyfrom total fat and saturated fat. Recommended Daily (Dietary) Allowances (RDAs) (54)provided the desirable levels for calcium, vitamins A and C, iron, and energy. The Dietand Health Report of the National Research Council (55) supplied recommendations forcarbohydrates, sodium, and cholesterol. Analysis of these menus revealed that childrenare being fed meals that are too high in fat. Although all menus that were examined inthe USDA study generally followed the established meal-pattern guidelines for childnutrition programs (56,57), the menus for breakfast served in CACFP programs sup-plied more than one-fourth of the recommended intake for all key nutrients, andalthough goals were met for total fat, cholesterol, carbohydrates, and sodium, they were
Table 3Diet Quality: Percentage of Children Ages 2 to 9 Yr by Age and Diet Quality (as Measured
by the Healthy Eating Index [HEI], Selected Years 1994 to 1996a, 1998)
Characteristic Ages 2 to 5 Ages 6 to 9
1994 to 1996At or below poverty
Good diet 18 10b
Needs improvement 71 81Poor diet 11 9b
Above povertyGood diet 26 14Needs improvement 67 78Poor diet 7 8
1998At or below poverty
Good diet 22 18b
Needs improvement 70 74Poor diet 8 8b
Above povertyGood diet 29 12Needs improvement 66 80Poor diet 5 8b
a The 1994 to 1996 HEI scores reflect an updated HEI methodology, therefore they are not directly com-parable to previously published HEI scores.
b Sample size relatively small to make reliable comparisons.Note that an HEI score above 80 implies a good diet, an HEI score between 51 and 80 implies a diet
that needs improvement, and an HEI score less than 51 implies a poor diet.(From the US Department of Agriculture, Center for Nutrition Policy and Promotion, Continuing
Survey of Food Intakes by Individuals.)

358 Part IV / Diabetes and Obesity
not met for saturated fat and energy. Lunches provided more than one-third of the rec-ommended intake of vitamins A and C and calcium, and although the goal for choles-terol was met, the goals for total fat, saturated fat, iron, sodium, carbohydrates, andenergy were not. Snacks provided 10% or more of the recommended intake for keynutrients and energy. A contemporaneous study conducted in Mississippi provided find-ings that were consistent with the findings in USDA report (58). An analysis of CACFPmenus from these preschool daycare programs indicated that the total fat and saturatedfat content of their lunches exceeded levels recommended in the Dietary Guidelines forAmericans (53).
3.3. National Surveys of Diet Intake Among Preschool Children3.3.1. WHAT ARE US CHILDREN EATING AND HOW DOES THIS COMPARE WITH
CURRENT GUIDELINES?There have been a number of national surveys of dietary intake in the past several
decades, all of which included data on children. Although there are methodological dif-ferences that should be taken into consideration when analyzing secular trends indietary intake, these surveys remain the best source of data available at the present time(59–70) National surveys of dietary intake include the NHANES I, II, III, and1999–2000; the Nationwide Food Consumption Surveys (NFCS) of 1977–1978 and1987–1988; and the USDA Continuing Surveys of Food Intake of Individuals (CSFIIs).
A review of trends in dietary fat intake in children over age 2 yr reveals that: (a)children’s intake of dietary fat, saturated fat, and cholesterol tends to reflect the trendfor the population as a whole; (b) the percent of daily calories from dietary fat (%kcal)has decreased over the past decade, although the total intake of fat (grams per day)may not have decreased because caloric intake also may have increased; (c) a signifi-cant proportion of children still consume amounts of total and saturated fat that areabove currently recommended levels; and (d) although there are some differences infat intake by ethnicity and poverty levels, these differences tend to be small (68).
The nutrient intake of childrens ages 3 to 5 yr who were surveyed in the 1995 CSFII(70) and the 1987–1988 NFCS (71) is summarized in Table 4. Total energy intakeranged between 1390 and 1576 kcal/d, protein intake was 14 to 15% of daily energy,and carbohydrate intake accounted for about 50 to 55% of energy intake. Saturated fatintake (expressed as %E intake) was 12 to 13%E in both surveys, and total fat intakewas 32 to 35%E, with the lower value reported in the more recent 1995 CSFII . Meandietary cholesterol intake was 182 to 201 mg/d, below the usual 300 mg/d goal butabove the more stringent 100 mg/1000 kCal goal. Mean dietary fiber intake was 8.9 to11.2 g per day, meeting the minimal goal of “Age + 5” g per day for this age group(72) but falling short of the more optimal “Age + 10” g per d (72) or the NationalAcademy of Sciences fiber intake goals of 19 and 25 g/d for 1- to 3-yr and 4- to 8-yr-old children (73).
The proportion of US preschool children who met dietary guidelines for total fat, sat-urated fat, and dietary cholesterol intake was reported by geographic areas (74). Thisdata was compared with dietary intake data collected between 1994 and 1996 for 3- to5-yr-old low-income preschool children in nine Head Start Centers in upstate NewYork. Between 31 and 37% of US preschoolers consumed the recommended 30% orless of kcal from total fat, with more children in the northeast meeting the goal than in

Chapter 14 / Preschool Nutrition and Obesity 359
other parts of the United States. Fewer children (21–24%) met the goal for saturated fatintake, consuming less than 10% of kcal from this source. A much higher proportion ofchildren met the goal for dietary cholesterol intake, with 85 to 90% consuming less than300 mg per day. Among the low-income, predominately minority, preschool children inthe New York Head Start Centers (75), a greater proportion were within dietary goalsfor total (46%) and saturated (30%) fat. However, the majority of children still exceededrecommended intakes of both (Table 5).
In a sample of 30 4- to 6-yr-old children, Goran et al. (76) measured TEE by doublylabeled water technique. TEE averaged 1379 calories per day. Fonteville et al. (77) founda TEE of 1383 kcal/d for 5- to 6-yr-old children, and Davies et al. (78) found a TEE of 1172
Table 4Nutrient Intake of Preschool Children in Selected US Dietary Surveys
Age 3 to 5 yr CSFII, 1995 NFCS, 1987 to 1988
Energy, kCal/d 1576 1390Protein, %E 15 14Carbohydrate, %E 50 55Total fat, %E 32 35Saturated fat, %E 12 13Cholesterol, mg/d 182 201Dietary fiber, g/d 11.2 8.9Iron, mg/d 12.9 10.1Zinc, mg/d 9.1 7.5Calcium, mg/d 829 781Vitamin A, μg RE/d 842 naVitamin C, mg/d 102 78Vitamin E, mg/d 5.3 5.3
(From refs. 46 and 47.)Healthy Start, 258 intervention, 213 control children.
Table 5Percent of Preschool Children (Age 3–5 yr) Who Meet Dietary Guidelines for Total Fat,
Saturated Fat, and Cholesterol
Healthy Start NHANES-III (1994–1996):24-h intake 1-d dietary intake for 3- to at baseline 5-yr-old children by geographic region in 3- to 5-yr-olds in the United States
% KCal New York Northeast South Midwest West
Total fat at or less than 30%E 46.3 37.2 31.6 31.5 31.2
Saturated fat below 10%E 30.4 23.6 23.3 23.5 21.4
Cholesterol at or less than 300mg/d 88.3 89.0 86.2 90.7 84.9
Healthy Start Preschool Children (1995–1997) compared with NHANES III data on 3- to 5-yr-oldpreschool children in the United States (1994–1996).
Healthy Start, n = 471 children in nine Head Start centers (New York).

360 Part IV / Diabetes and Obesity
kcal/d for 1- to 4-yr-old children. Thus, the energy intake values obtained in the CSFIIand NFCS are consistent with measured TEE, despite the fact that the RDA for energy for4- to 6-yr-old children is 1800 kcal/d—a 12 to 23% overestimate of energy requirements.
4. DIETARY GUIDELINES FOR PRESCHOOL CHILDREN
4.1. The USDA Preschool Food Guide PyramidThe USDA Food Guide Pyramid for Preschool Children provides a useful general
overview of a nutrient-balanced and energy-adequate diet for 2- to 6-yr-old children. Thisguide is helpful to child health professionals and parents because it highlights the variety offood groups that should be included in the diet of preschool children and also describes por-tion sizes. The key elements of the Preschool Food Guide Pyramid are provided in Fig. 5.
4.2. Specific Recommendations for Nutrient Intake in Preschool ChildrenRecommendations for dietary intake in early childhood account for the child’s
unique growth and developmental patterns, specific nutrient requirements, vulnerabil-ity of sentinel nutrients, factors important to the establishment of healthy eating habits,and nutritional risk factors for childhood- and adult-onset diseases. The role of dietaryfat as a concentrated source of calories as well as essential fatty acids (EFAs) must bebalanced with a desire to avoid excessive fat intake, which is associated with increasedrisk of future chronic disease.
All US national dietary guidelines include the 2- to 5-yr-old preschool group. Littlecontroversy exists regarding recommended intake of most vitamins, minerals, and pro-tein in childhood. More of the controversy exists regarding recommended intakes oftotal fat and types of fat in the diet as well as regarding intakes of total carbohydrate andits constituents (particularly simple sugars and starch). Many health organizations havedeveloped dietary guidelines for children at least partly based on the role of dietary fat(especially saturated fat) in the early development of atherosclerosis (79–83). Thisrationale is strengthened by studies linking a high intake of dietary fat with some humancancers (84–86) and obesity (87–89).
Current US dietary guidelines for children set forth by the American Academy ofPediatrics and others recommend no more than 30%E from total fat, less than 10%Efrom saturated fat, and no more than 300 mg of cholesterol daily (68,79,80). Theseguidelines do not apply to infants and toddlers younger than age 2 yr, because there isa consensus that a higher fat intake is needed to support the rapid growth and caloricrequirements of this age group.
These guidelines were first proposed by the 1985 National ConsensusDevelopment Panel, cosponsored by the National Institutes of Health (NIH) and theAmerican Heart Association (AHA) (83). They recommended numerical guidelinesfor dietary fat intake for all Americans younger than age 2 yr, with total fat intake atno more than 30% of calories and saturated fat at less than 10% of calories. In 1991,these guidelines were endorsed by the National cholesterol Education Program(NCEP) Report of the Expert Panel on Blood Cholesterol Levels in Children andAdolescents (80). The American Academy of Pediatrics, which in 1983 and 1986 haddeclined to recommend numeric fat intake guidelines for children, was represented onthe NCEP panel, and in 1992 also recommended “an average daily intake of 30% oftotal calories from fat, <10% from saturated fat, and <300 mg of cholesterol per day.”

Chapter 14 / Preschool Nutrition and Obesity 361
The National Health Promotion and Disease Prevention Objectives (Healthy People2010) also recommended that Americans reduce dietary fat intake to an average of30%E or less and average saturated fat intake to less than 10%E among people ages2 yr and older (82). Therefore, at present, the American Academy of Pediatrics, theAHA, the NIH, the USDA, the Food and Drug Administration, and at least 26 otherhealth-related organizations recommend numerical limits for dietary fat intake forAmericans older than age 2 yr (80).
The age at which to initiate the fat-controlled or prudent diet varies somewhataccording to the source of the recommendation. The AHA recommends that the prudentdiet be adopted after age 2 yr. NCEP considers age 2 to 3 yr as “transitional” betweenthe high-fat diet of infancy and the fat-modified prudent diet. It suggests that “toddlers2 and 3 years of age may safely make the transition to the recommended eating patternas they begin to eat with the family” (81). The USDA Dietary Guidelines suggest thatpreschool children should gradually reduce dietary fat over a longer period of time,reaching the 30%E from total fat goal at about age 5 yr (68).
Fig. 5. The USDA Preschool Pyramid.

362 Part IV / Diabetes and Obesity
There may be some rationale for establishing a preschool dietary transition period toavoid an abrupt drop in fat intake after age 2 yr and a possible abrupt drop in calories.However, there is sufficient research to show that when intake of calories and essentialnutrients are adequate, dietary fat intake can be safely reduced to 30% of kcal after age2 yr without compromising growth and development (90–96).
4.3. Rationale for Fat/Saturated Fat Guidelines in the Preschool PeriodRecommendations to reduce dietary fat beginning after age 2 yr stem from scien-
tific consensus on the role of dietary fat (especially saturated fat) in the early devel-opment of atherosclerosis. The NCEP panel explained that “a variety of studiesindicate that the process of atherosclerosis begins in childhood; that this process isrelated to elevated levels of blood cholesterol; and that these levels are often predic-tive of elevated blood cholesterol in adults” (97–102). Autopsy studies have demon-strated that early coronary atherosclerosis or precursors of atherosclerosis often beginin childhood and adolescence. In the aorta, fatty streaks begin to develop soon afterbirth and are almost universal by age 3 yr. Fatty streaks in the coronary arteries lagbehind by about a decade. Studies such as the Pathological Determinants ofArtherosclerosis in Youth (PDAY) Autopsy Study have suggested that the criticalstage of the disease process on which we need to focus prevention strategies is dur-ing the conversion of childhood fatty streaks into thicker raised lesions (102). Moreresearch also needs to clarify how the conversion occurs and which risk factors influ-ence it. Although atherosclerosis may not be totally preventable, evidence suggeststhat its progress can be substantially retarded, thus deferring the resulting heartattacks to much later in life.
Dietary fat (and especially saturated fat) is associated with high levels of blood cho-lesterol, a major independent risk factor for atherosclerosis. Elevated cholesterol levelsare highly prevalent in children—even in toddlers over age 2 yr (103–107). In a surveyof 3- to 5-yr-old children in New York, 26% had levels in the borderline-high range(170–199 mg/dL), and 11% were in the high range (<200 mg/dL) (108). National surveydata on cholesterol levels in children are available from NHANES II (1976–1980 ) and,more recently, from NHANES III (1988–1994). Currently, about 10% of adolescentsages 12 to 17 yr have total cholesterol levels exceeding 200 mg/dL (considered “high”);additionally, about 30% have borderline-high levels of 170 to 199 mg/dL. Regional sur-veys provide additional evidence that a higher proportion of children are currently in theelevated risk categories than were there previously (109,110).
Plasma levels of total cholesterol and LDL-C show significant tracking from child-hood to adulthood (111,112). For example, the Bogalusa Heart Study found that about70% of children in the top quintile for blood cholesterol could be found in the top twoquintiles 12 yr later (111). The proportion was similar for children originally on the bot-tom quintile (70% could later be found in the bottom two quintiles for cholesterol) (111).Obesity strengthens the tracking of both elevated cholesterol and elevated blood pres-sure, a factor of some importance as the pediatric population becomes more obese (112).
Numerical guidelines for fat intake in childhood are also based on considerations ofnutritional adequacy. When the dietary intake of children is examined regarding sourcesof excess calories, 15% are derived from fat and 10% are derived from sugar. Thesecalories replace the consumption of fruits, vegetables, and grains, which would result inmeeting RDAs for macro- and micronutrients in the diet. Thus, a moderate reduction in

Chapter 14 / Preschool Nutrition and Obesity 363
fat intake in childhood, if replaced by healthy fruits, vegetables, and grains, wouldimprove the overall quality of children’s diets (113).
4.4. Early Diet Behavior and Diet Behavior in Later ChildhoodThere is some evidence that dietary patterns established in childhood persist into later
life. Children develop food preferences through their early eating experiences, and thesemay be sustained over time. The majority of studies examining dietary patterns overtime have considered tracking of nutrient intake in cohorts of children. Data on suchtracking is available from the Bogalusa Heart Study as well as the FraminghamChildren’s Study (114,115).
In the Bogalusa Heart Study, there were a number of significant correlations for12-yr tracking of macronutrient intake in the range of 0.2 to 0.4. These were signifi-cant despite the fact that they were based on a single 24-h dietary recall at each datacollection point. More recent data from the same group report somewhat highercorrelation coefficients, in the range of 0.4 to 0.5 (114). Similarly, the FraminghamChildren’s Study reported on tracking of nutrient intake in a preschool population.They reported that 40 to 57% of children in the highest quintiles for total and satu-rated fat intake were still in this quintile 2 to 3 yr later (115). Less is known regardingactual food consumption over time—that is, do young children who eat large amountsof fruits, vegetables, milk, cereal, or sweets continue to do so later in adolescence andadult life?
4.5. Dietary Fat and Obesity in ChildhoodThere is some evidence to suggest that a high-fat diet and sedentary lifestyle are the
two key features that have created the current epidemic of obesity in the United Statesand other affluent countries. In physiological studies, fat plays a powerful role in under-mining human body weight regulatory systems. This is partly because the body has theability to increase the rate at which it oxidizes carbohydrate and protein when ingestionof these macronutrients is increased. The body must do so because it has a very limitedability to store these nutrients. However, when large amounts of dietary fat are con-sumed, the body is unable to increase rates of oxidation to re-establish fat balance.Additionally, oxidation of fat is suppressed when an excess energy or any of the othermacronutrients is consumed. Therefore, the human metabolism is not designed to copewith excess fat consumption (87–89).
Dietary fat is also not particularly good at satisfying hunger (i.e., it has low satiatingpower). This is especially true for obese individuals. Manipulation of the fat content ofdiets results in reproducible spontaneous fat loss during low-fat diets and fat gain duringhigh-fat diets. Individuals consuming a high-fat diet develop “passive overconsumption,”because it occurs unintentionally and without consuming excess bulk. Additionally, someobese individuals have a behavior preference for high-fat foods (87,89).
Obesity in US children has been increasing over the past several decades (116–118).Although the percentage of calories consumed as fat has declined, the total amount ofcalories consumed appears to have increased (64,65,68). Therefore, the amount of fatconsumed each day in grams may not have changed. Additionally, relatively low lev-els of physical activity are the norm. Daily physical education in the schools hasdeclined—particularly in high school and especially among older girls (119,120). In1996, 23% of children in grades 4 to 12 had no physical education (120). Therefore,

364 Part IV / Diabetes and Obesity
based on metabolic considerations, physical activity needs to increase and dietary fatneeds to decrease to achieve the synergism needed to prevent childhood obesity.
It is known that the earlier the age at which adiposity rebound occurs, the morelikely a child will become an obese adult (121). Whitaker et al. (11) conducted a ret-rospective cohort study using lifelong height and weight measures recorded in outpa-tient medical records and found that a younger age at “adiposity rebound” wasassociated with an increased risk of adult obesity and that the risk was independent ofBMI at adiposity rebound and of parent obesity. Thus, adult obesity occurs more fre-quently in children who have early adiposity rebound. Additional studies are neededto determine if the age of adiposity rebound among US children has become youngerover the past several decades and also if a high-fat diet promotes early adiposityrebound.
4.6. Heart-Healthy Preschool MealsPromoting heart-healthy behaviors during childhood has become the focus of school-
based programs aimed at the primary prevention of atherosclerosis and coronary heartdisease (CHD) (122–127). The majority of school-based programs have targeted ele-mentary school children and include dietary intervention studies targeting both foodservice and individual dietary behavior change. Generally, these studies demonstratethat the total and saturated fat content of school meals can be improved without com-promising physical growth or micronutrient intake.
In the Healthy Start preschool project (75), the food service intervention was suc-cessful in decreasing the saturated fat content of preschool menus from 12.5 to 8.95%Ein the intervention schools (28.4% decrease), whereas control schools increased satu-rated fat content by 6.6% (Table 6). This intervention was modeled after methods devel-oped by the Child and Adolescent Trial for Cardiovascular Health (CATCH; ref. 122),which also was able to decrease the saturated fat content of school lunch menus from14.8 to 12.0% E in intervention schools (18.9% decrease), whereas control schoolsdecreased only 9.3%. For total fat, the Healthy Start preschool intervention decreasedthe total fat content of school lunch menus from 30.8 to 25.6%E in intervention schools(16.9% decrease), whereas control schools increased by 1.4%. The CATCH interven-tion decreased the total fat content of school lunch menus from 38.7 to 31.9%E in inter-vention schools (17.6% decrease), whereas control schools decreased only 6.9%. BothHealthy Start and CATCH succeeded in decreasing total and saturated fat in schoollunches yet maintained adequate intake of energy and other essential nutrients (75,128).
Although numerous strategies were used in the Healthy Start study to reduce the sat-urated fat content of preschool meals and snacks, reducing the fat content of milk andother dairy products used in the preschool centers was commonly employed. This isconsistent with the findings of Sigman-Grant and others (129,130) who have suggestedthat, although a number of strategies could be effective in lowering the saturated fatcontent of children’s diets, use of only skim milk as a minimum strategy could be effec-tive in achieving saturated fat goals in young children yet maintaining adequate intakeof other essential macro- and micronutrients. Implementing a few key strategies, suchas switching from whole or 2% fat milk to 1% fat milk, draining and rinsing cookedground meat, and removing skin and all other visible forms of fat from poultry and meats,all contribute to the overall reduction of saturated fat content in school meals and dietaryintake by young children.

Chapter 14 / Preschool Nutrition and Obesity 365
The Healthy Start study demonstrated that it is possible to decrease the saturatedfat content of children’s diets in the preschool population without compromisingenergy intake or overall nutrient adequacy of the diet. All nutrient values at baselineand follow-up, with the exception of zinc, met or exceeded one-third of the RDAsand/or Dietary Reference Intakes for the 1- to 3- and 4- to 6- or 4- to 8-yr-old agegroup. Zinc values in the menus as well as in dietary intake were low relative to theother nutrient values attained in the menus and through diet, possibly because of theprominence of milk (a rich source of calcium but not of zinc) in the menus. Therefore,initiatives like Healthy Start demonstrate that targeted food service interventions inpreschool centers can be a safe and effective way of increasing the proportion of chil-dren who consume heart-healthy, lower saturated fat meals and snacks consistent withcurrent dietary guidelines (75). For children, this is one part of an integrated chronicdisease prevention agenda aimed at the primary prevention of atherosclerosis andCHD, obesity, type II diabetes, hypertension, and other chronic diseases linked to dietarypatterns of overnutrition.
4.7. Safety Issues Related to a Fat-Controlled Diet in Early ChildhoodIn the past, concern has been raised that fat-controlled diets in early childhood might
fail to provide adequate energy for normal growth and development. Dietary fat is aconcentrated source of calories, and calories are essential for growth. Studies over thepast decade have sought to determine the relative importance of caloric versus fat intake
Table 6Changes in Total and Saturated Fat Content of School Menus at Baseline
and After a Food Service Intervention: The Healthy Start Preschool Projectand the CATCH Elementary School Project
Intervention Control
% KCal Baseline Follow-up Baseline Follow-up
Preschool/school menus
Total fat 30.8 25.6 29.5 29.9 Healthy Start38.7 31.9 38.9 36.2 CATCH
Saturated fat 12.5 8.95 12.1 12.9 Healthy Start14.8 12.0 15.1 13.7 CATCH
24-h intake
Total fat 30.6 30.0 30.4 30.3 Healthy Start32.7 30.3 32.6 32.2 CATCH
Saturatedfat 11.8 11.4 12.4 12.0 Healthy Start12.7 11.4 12.5 12.1 CATCH
School meal intake
Total fat 26.8 27.2 25 29.4 Healthy Start* * * * CATCH
Saturated fat 9.9 9.4 10.4 11.8 Healthy Start* * * * CATCH
*Not available.

366 Part IV / Diabetes and Obesity
in supporting normal growth and development in childhood. Results of the most recentgrowth and safety studies indicate that growth is adequately supported in diets in whichfat contributes approx 25 to 30% of calories if there is adequate intake of calories, highquality protein, and essential nutrients (90–96).
Reports from the Special Turku Coronary Risk Factor Intervention Project (STRIP)study in Finland are particularly relevant to the safety issue. Their data indicate that a dietlow in saturated fat and cholesterol, even when started in infancy, can be compatible withnormal growth and development as long as caloric and essential nutrient intakes are ade-quate (90,131,132). The STRIP Baby Project is one of the few studies in which dietaryfat reduction was initiated even before age 2 yr. This is an ongoing prospective random-ized trial in 1062 Finnish infants randomly assigned at age 8 mo to usual diet (control)or to a diet with reduced total fat, saturated fat, and cholesterol. Results show thatabsolute energy intakeas well as parental BMI and height best predict child growth pat-terns and that children with consistently low fat intake grow as well as children withhigher fat intake. Additionally, intakes of vitamins, minerals, and trace elements did notdiffer between the intervention and control groups (131). In a recent report, neurologicaldevelopment was similar in intervention and control groups at age 5 yr, providing furtherevidence of the safety of the “heart-healthy” diet in early childhood (132).
Theoretical studies of computer modeling of nutrient adequacy provide specific levelsof dietary fat. These studies indicate that the fat-modified diet need not be deficient incalories or any essential nutrients. However, care must be taken to ensure adequate intakeof some nutrients, such as calcium, iron, and zinc (68). This is supported by the findingsof both observational and intervention studies in children. Some of these studies involvepreschool-age children, whereas others involve older, prepubertal children or adolescents.
The Studies of Childhood Activity and Nutrition studies provided data regarding thenutritional status of children who consumed varying amounts of dietary fat. In a 2-yrstudy of 215 preschool Hispanic children, Basch et al. (133) found no difference incrude measurements of growth between the low-fat and high-fat groups. However, cal-cium levels were below recommended levels in the low-fat group, so the need to keepup intake of low-fat milk was emphasized. Wosje et al. (135) compared growth in tod-dlers who consumed either whole fat milk or 2% milk from age 12 to 24 mo. Theyfound that despite lower intakes of total and saturated fat, total energy intake wassimilar in both groups, as was growth.
A diet limiting fat and cholesterol intake could result in a lack of cholesterol for myelinformation in the nervous system and for production of steroid hormones that use choles-terol as a substrate (134). However, cholesterol is not an essential nutrient. In healthychildren, the body is capable of synthesizing cholesterol for all of it needs. There is alsoconcern that a fat-restricted diet could lead to mineral deficiencies, especially calcium,iron, and zinc (if red meats are avoided). However, when calcium intake is sustained withadequate consumption of low-fat dairy products, both calcium and dietary fat goals canbe achieved. Iron deficiency is most prevalent during the first 2 yr of life, when a low-fatdiet is not recommended. Iron deficiency has been reported to be a problem amongpreschoolers, especially those below poverty levels. For example, 3.9% of 3- to 5-yr-oldchildren above poverty had iron deficiency anemia, compared with 9.7% below poverty(NHANES II 1976–1980). Including lean red meat and iron-fortified products such ascereal in the diet helps prevent this deficiency. Similarly, zinc is often a shortfall nutrientfor children under age 10 yr. Clinical deficiency in US children is not common; however,

Chapter 14 / Preschool Nutrition and Obesity 367
it may be associated with growth retardation in Mexican-American children (136).Fortified cereal products and inclusion of a variety of lean meats, complex carbohydrates,and vegetables would preclude deficiency of this mineral.
Concern exists that deficiencies in fat-soluble vitamins and EFAs may occur ifdietary fat is restricted. Linoleic (18:2 n−6) and α-linolenic (18:3 n−3) acids are EFAsthat cannot be synthesized de novo by humans and must be obtained from the diet. EFAsshould provide at least 3% of the caloric intake in a normal diet. Generally, if about halfof the child’s fat intake comes from plant sources, the EFA requirements are met. In a1- to 3-yr-old child’s diet, 3% would be about 39 calories or 4.3 g of EFA; whereas ina 4- to 6-yr-old child’s diet (which consists of 1800 kcal), 3% would be about 54 calo-ries, or 6 g of EFA (out of the total 60 g of total fat in a 30%E fat diet). Vegetable oilsare good sources of EFAs. However, it should be noted that the trans-isomers of linoleicacid do not have EFA activity. Deficiencies in linoleic acid are rare but include dermatitis(scaly skin), hair loss, diarrhea, and poor wound healing (137).
5. FEDERAL PRESCHOOL NUTRITION PROGRAMSIN THE UNITED STATES
In the United States, two large federally funded nutrition programs are focused heavilyon preschool children: the The Special Supplemental Nutrition Program for Women,Infants and Children (WIC) program (administered by the Food and Nutrition Serviceof the USDA) and the Head Start program (administered by the Head Start Bureau,Administration for Children and Families, Department of Health and Human Services).Both programs are linked through an interagency agreement to coordinate some ser-vices on a local, state, and federal level. Excellent overviews of these programs andsummary statistics may be found on the Internet websites for the programs. Some keyelements of these programs are described here.
5.1. The WIC ProgramWIC is administered by the Food and Nutrition Service of the USDA. WIC was
established in 1972 to counteract the negative effects of poverty and poor nutrition onprenatal and pediatric health. WIC provides a combination of direct nutritional supple-mentation, nutrition education and counseling, and increased access to health care andsocial service providers for pregnant, breastfeeding, and postpartum women, infants,and children up to age 5 yr. In the 10 yr between 1988 and 1998, the WIC program vastlyexpanded, with the number of enrollees growing from 3.4 million to more than 8 million;over the same period, annual WIC food expenditures grew from about $1.4 billion to$2.8 billion. Demographically, Hispanics have become a larger proportion of the caseload(Hispanics were 21% of the caseload in 1988 and 32% in 1998). Other trends over thisdecade showed that pregnant women and infants decreased slightly as a percent of allWIC participants; breastfeeding women more than doubled as participants; and childrenrose as a percentage of all WIC participants, from 47% in 1988 to 51% in 1998. Mostwomen enrolled in WIC are between the ages of 18 and 34 yr; about half are married,and one-third have not completed high school. The average size of the WIC family oreconomic unit is 4.0 persons. Most WIC participants reside in single-family households,but 15% reside with extended family in multifamily households. The income cutoff forWIC eligibility is 185% of the federal poverty level. Nearly two-thirds of WIC participants

368 Part IV / Diabetes and Obesity
reside in families with income below the poverty level, and 23% have income between100 and 150% of the poverty level. Although WIC families are in low-income categories,nearly three-fourths of all WIC participants reside in families with wage earners. MostWIC enrollees receive health insurance from the government’s Medicaid Program (58%);about one-fourth have employer-provided insurance.
5.1.1. NUTRITIONAL ASPECTS OF WIC PARTICIPATION
Nearly one-half (47%) of families with WIC participants receive some other sourceof food assistance at the time that they enroll. USDA programs are the most commonsource of assistance, with 33% of families receiving food stamps, 27% participating inthe National School Lunch Program, and 21% participating in the School BreakfastProgram. Local food pantries are a source of food assistance for less than 5% of WICfamilies. On average, WIC families spend $25 per person on food each week, with thegreat majority (85%) of food spending on food at home. Fifteen percent of WIC partic-ipants report that they are “food insecure without hunger,” 7% are “food insecure withhunger, moderate,” and about 2% are “food insecure with hunger, severe.”
By far, the most prevalent nutrition risk among all WIC enrollees is the failure tomeet dietary guidelines. More than two-thirds of all women and children who enroll inWIC are at dietary risk. The risks that are most common among children, other than fail-ure to meet dietary guidelines, are risk of anemia (24%), excessive weight (17%), andshort stature (14%). Many infants do not exhibit a specific nutrition risk but are enrolledin WIC on the basis of their mother’s current enrollment and documented risk; 42% ofall infants have no other risk. Common nutritional risks for women are excessive weight(43%) and risk of anemia (30%).
WIC participants receive supplemental foods as one of their WIC benefits. Dependingon participant category (pregnant, postpartum, or breastfeeding woman, infant, orchild), WIC provides a monthly set of vouchers for nutritious foods to supplement thediet. Generally, WIC vouchers are for specific foods that are high in protein, calcium,iron, and vitamins A and C. WIC foods include iron-fortified infant formula and infantcereal, iron fortified adult cereal, vitamin C-rich fruit or vegetable juice, eggs, milk,cheese, and peanut butter or dried beans or peas. Although they do not receive WICfoods, exclusively breast-fed infants are included as WIC participants and their mothersreceive an enhanced food package that includes larger quantities of WIC foods, such astuna and carrots.
5.1.2. EXCESSIVE WEIGHT AMONG WIC CHILDREN
The prevalence of excessive weight (BMI: 95th percentile or greater) among WICchildren was 11% in 1992 and 13.2% percent in 1998, according to the revised age- andgender-specific NCHS growth charts (CDC, 2000); this represents a 20% increase overthis 6-yr period. Prevalence of excessive weight among boys exceeded prevalence ofexcessive weight in girls by 1.3 percentage points in both 1992 and 1998. For boys,prevalence excessive weight increased from 11.6 to 13.9% percent over the 6-yr period(a 19.8% percent rise in prevalence); for girls, prevalence of excessive weight increasedfrom 10.3 to 12.4% over the 6-yr period (a 22.3% percent rise in prevalence). Thepercent of WIC children who were overweight in 1998 tended to decrease with age,with 15.6, 14.2, 11.1, and 9.9% overweight at ages 1, 2, 3, and 4 yr, respectively.
Overweight WIC children were similar to other WIC children in that their mostcommon nutritional risks were inadequate or inappropriate nutrient intake and low

Chapter 14 / Preschool Nutrition and Obesity 369
hematocrit or hemoglobin. However, overweight children were more likely to havemultiple nutrition risks compared to other WIC children: 79.1% of overweight WICchildren had two or three nutrition risks, whereas only 48.2% of other children had twoor three risks.
Prevalence of excessive weight among WIC children varies by racial/ethnicgroup, with Hispanic and Native American children having the highest rates ofprevalence of excess weight (16.4 and 18.6%, respectively, in 1998). From 1992 to1998, African-Americans had the smallest increase in prevalence of excessiveweight (0.9 percentage point) and Hispanics had the largest increase (2.0 percentagepoints). In relative terms, however, the increased prevalence for Caucasian children,from 9.2 to 11.1%, was a 20.7% increase over the 6-yr period and was the greatestrelative increase among racial/ethnic groups. Geographical differences in prevalenceof excessive weight have narrowed over time. In 1992, the Northeast and Westernregions had the highest rates of prevalence of excessive weight; however, theseregions experienced the smallest growth in prevalence of excessive weight between1992 and 1998. On a state-by-state basis, 10% percent of WIC children were over-weight in the median state in 1992; by 1998, more than 10% of WIC children wereoverweight in all but five states.
5.2. Head StartHead Start and Early Head Start are comprehensive child development programs
that serve children from birth to age 5 yr, pregnant women, and their families. Theyare child-focused programs and have the overall goal of increasing the school readinessof young children in low-income families. Beginning with a task force recommenda-tion in 1964 for the development of a federally sponsored preschool program to meetthe needs of disadvantaged children, Head Start has grown to serve children frombirth to age 5 yr as well as their families. Section 645 of the Federal Head Start Act(42 U.S.C. 9840) establishes income eligibility for participation in Head Start pro-grams by reference to the official poverty line, adjusted annually according to changesin the Consumer Price Index. In 2002, the federal poverty level for a family of fourwas $18,100.
In 2002, there were 18,735 Head Start Centers in the United States, serving 905,235children, 90% of whom were ages 3 and 4 yr. Approximately equal proportions ofHispanic (29.7%), African-American (33.8%), and Caucasian (29.9%) children wereenrolled in the program, at an average cost per child of $6633. Three-fourths (77%) ofHead Start families had annual incomes less than $15,000, and 60% of the children wereenrolled in Medicaid.
The reauthorization of the Head Start Act in 1994 established a new Early Head Startprogram for low-income families with infants and toddlers. In fiscal year 2001, morethan $550 million was used to support nearly 650 programs to provide Early Head Startchild development and family support services in all 50 states as well as in the Districtof Columbia and Puerto Rico. These programs served more than 55,000 children underage 3 yr.
Head Start programs must provide opportunities for health and nutrition education tochildren and parents. For children, health and nutrition learning activities are integratedinto the overall child development curriculum. Typically, children are involved in dailyhealth activities such as brushing their teeth, washing their hands, and eating family

370 Part IV / Diabetes and Obesity
style meals. Other learning activities such as preparing foods, growing foods, readingstories, singing songs, and playacting around food themes are included throughout theprogram year. These health and nutrition activities are planned and carried out in a man-ner that promotes the individual cognitive, physical, and social-emotional developmentof each child.
As part of Head Start’s focus on parent involvement, the program must also provideparents with the opportunity to learn the principles of preventive health, including theselection and preparation of foods to meet family needs and the management of foodbudgets. Parents must also have opportunities to discuss and learn about the individualnutritional status of their child and how to access services that may be needed to meetidentified nutrition needs. Programs are required to provide ongoing follow-up to ensurethat identified nutritional needs are met and that opportunities for nutrition educationpertaining to individual nutrition concerns are available. A comprehensive preschoolhealth curriculum developed for Head Start centers is the Healthy Start curriculum(www.Healthy-Start.com), which includes two nutrition units for classroom activitieslinked to specific learning objectives and also includes bilingual parental educationalmaterials.
Head Start centers also provide children with nutritious meals and snacks. Everychild in a part-day program receives meals and snacks that provide at least one-thirdof daily nutritional needs. Every child in a full-day program receives meals and snacksthat provide one-half to two-thirds of daily nutritional needs, depending on the lengthof the program. All children in morning programs who have not received breakfast atthe time they arrive at the Head Start Program are served a nourishing breakfast.Infants or toddlers in center-based care must receive food appropriate to their nutri-tional needs and developmental readiness. Meals are provided at no cost and mustmeet USDA Child and Adult Care Food Program meal pattern requirements. Foodsserved must be high in nutrients and low in fat, sugar, and salt. A variety of foods isserved, which broadens each child’s food experiences, and mealtime is considered alearning opportunity that is integrated into the overall curriculum. Opportunities areprovided for children to be involved in food- and mealtime-related activities. Staff,children, and volunteers eat together in a family style and, to the extent possible, sharethe same menu.
5.3. Obesity Prevention Strategies in Preschool and Daycare Settings5.3.1. PRESCHOOL HEALTH EDUCATION
A potentially effective but low-cost public health approach to primordial and primaryobesity prevention at the preschool age would involve dissemination and implementationof comprehensive preschool health education programs in nursery schools, daycare, andHead Start centers in the United States. In 1995, almost two-thirds of mothers with chil-dren younger than age 6 yr were working outside the home (nearly double the rate of20 yr ago), and an increasing proportion of their children (about 3 million presently) arecared for in preschool or daycare centers. The idea of providing universal preschool forall children is gaining momentum.
Health education and interventions aimed at preschoolers are extremely importantfrom a developmental point of view because health habits are acquired and practiced dur-ing the preschool period, health knowledge is gained, and early attitudes about healthbegin to be established during this period. Therefore, comprehensive health education

Chapter 14 / Preschool Nutrition and Obesity 371
should be part of every preschool program as the basic minimal obesity prevention pro-gram for all children and parents.
Preschool children actually acquire a large number of health behaviors, includingsafety behaviors (seatbelts, helmets, hats and sunscreen, avoiding danger); dietarybehaviors (food preferences and choices); physical activity behaviors (preference foractive or inactive play); hygiene behaviors (washing hands, brushing teeth, etc.).
For disease prevention, it is important that health education programs are are com-prehensive in nature, because such programs include health education curriculum forthe children; ; teacher training; parent education; cook training; and adequate physicalactivity. This is in addition to legal and specific program requirements for medical anddental check-ups, immunizations, safety policies, smoking policies, medication andemergency policies, and health professional staff support.
An example of a comprehensive preschool health education program is the “HealthyStart” program (www.Healthy-Start.com) (138). The Healthy Start children’s curricu-lum was developed with a basis in social learning theory (139) and was designed to bedevelopmentally appropriate for children ages 3 and 4 yr. The curriculum has 12 units,which cover a wide variety of health topics such as nutrition, physical activity, self-esteem, and drug abuse prevention, and are designed to be taught in nursery school for20 min three times a week throughout the school year. The emphasis is on exploratoryhands-on activities, games, and acquisition of new skills, knowledge, and healthy atti-tudes (139). Additionally, there is teacher training, take-home education materials forparents, a food service modification manual, and a computer-assisted knowledge quizfor evaluation (75,139–144).
The effectiveness of preschool health education programs in preventing childhoodobesity would likely be significantly enhanced if they were part of a larger national pub-lic health campaign focused on reduction of obesity for the population as a whole. Forchildren, a more global public health campaign would also include identification andearly treatment of at-risk and already obese children and adolescents, which would becarried out by pediatricians and other health professionals in a variety of settings.
Obesity results from a positive net energy balance (more calories are consumed thanexpended), and the major modifiable factors in the equation are caloric intake (diet)and caloric expenditure (physical activity). Therefore, the primary goals of a preschoolprevention strategy must be to help children, parents, and teachers achieve a fat-con-trolled heart-healthy diet as well as daily physical activity goals (at least 30 min a dayfor children over age 2 yr) (145). Dietary goals include reducing the total and saturatedfat in preschool meals and snacks and increasing dietary fiber with more grains, veg-etables, fruits, and legumes as well as helping parents and teachers do the same athome. Physical activity goals include helping preschool centers develop adequate anddevelopmentally appropriate physical activity programs for the children as well ashelping parents and teachers initiate more personal and family physical activities forthemselves and their families.
The dietary fat goals are consistent with the 1998 American Academy of PediatricsGuidelines, which recommend that children ages 2 yr and older consume no more than30% (and no less than 20%) of their daily energy intake (kcal/d) as fat and less than10% of energy intake as saturated fat (146). However, most preschool children still arenot meeting these goals. Data from NHANES III (ph1) indicate that 77 to 85% ofchildren and adolescents ages 2 to 19 yr exceed recommended intake of total fat, and

372 Part IV / Diabetes and Obesity
91 to 93% exceed recommended intake of saturated fat (68). In the 1995 CSFII (139),two-thirds of children still exceeded recommended goals (63–69% exceeded the totalfat goal of < 30%E, and 62–77% exceeded the saturated fat goal of < 10%E).
Dietary fiber is also important in childhood because dietary fiber often replaces someof the fat . According to the “Age + 5” dietary fiber rule (76,147), 3- to 5-yr-old childrenshould be consuming 8 to 10 g of fiber at a minimum (Fig. 6). Only 54% of children inthis age group meet this goal. The Bogalusa Heart Study also found that 10-yr-olds in thetop quartile for dietary fiber intake also had the lowest intake of fat (148).
In the “Healthy Start” project (75), saturated fat in preschool meals and snacks wasreduced from about 10 to 9% of energy in intervention sites (compared with an increasefrom 10 to 12% in control sites), resulting in lower blood cholesterol levels amongpreschool children. Growth rates were not affected, because calorie intake remained normal.Other studies, such as the STRIP study in Finland, have proved that growth depends ontotal energy intake rather than fat intake and that preschool children grow normally as longas a balanced diet with adequate energy and essential nutrients is provided (90,149).
Young children also need more and better physical activity programs. If obesity isincreasing among preschool children, then greater effort is needed to improve theduration and intensity of daily physical activity. In preschool centers, there is atendency to try to make the children “sit down and be quiet!” Even at recess on theplayground, children generally are left to their own devices to run around and play.Experts suggest that preschool children should be actively taught new motor skillsand then helped to practice and perfect them (150). This includes motor skills such asrunning, jumping, hopping, throwing, kicking, standing on one foot, doing a somer-sault, and riding a tricycle. Children who acquire these skills develop a sense ofaccomplishment—and then enjoy being physically active (151). We also need toencourage communities to help their children be more physically active and to pro-vide neighborhoods that are safe for children.
Fig. 6. Current vs recommended fiber intake for children ages 3 to 18 yr (age + 5minimal to age + 10 maximal).

Chapter 14 / Preschool Nutrition and Obesity 373
5.4. Obesity Prevention Strategies for Families With Young Children5.4.1. DIET FOR A HEALTHY 2- TO 6-YR-OLD CHILD
The Food Guide Pyramid for young children from the USDA more clearly defines thenumber of servings of foods from each area of the pyramid that should be consumed byyoung children (152). More importantly, it clarifies portion size for this age group,because in the past, there has been confusion as to what constitutes a portion size for ayoung child. For most 2- to 6-yr-olds, energy requirements as well as macro- andmicronutrient needs will be met if they consume six servings of the grain groups, threeservings of vegetables, two servings of the fruit group, two servings of the milk group,and two servings of the meat group over an average of 3 d. Generally, children ages 2 to3 yr will consume fewer calories and smaller portions (about two-thirds of a regular por-tion size) than older children. By age 4 yr, regular portion sizes apply. The key featuresof healthy “Food Pyramid eating” for preschool children can be summarized as follows:
● A good estimate of a serving for a 2- to 3-yr-old child is about one-third of what countsas a regular Food Guide Pyramid serving.
● Children ages 2 to 3 yr need the same variety of foods as older children but usually needfewer calories.
● Younger children eat smaller portions than older children. They should be offered smallerservings and allowed to ask for more. This will satisfy their hunger and not waste food.
● By the time children are age 4 yr, they can eat amounts that count as regular Food GuidePyramid servings eaten by older family members—that is, one-half cup of fruit or veg-etable, one-fourth cup of juice, one slice of bread, and 2 to 3 ounces of cooked leanmeat, poultry, or fish.
● New foods should be offered in small “try me” portions (e.g., 1–2 tablespoons).Children may not begin to like a new food until they have tasted it many times and havebecome familiar with it.
● Eating a variety of foods every day is important for the whole family. Offer children avariety of foods from the five major food groups, and let them decide how much to eat.
● Children ages 2 to 6 yr need two servings from the milk group each day. After age 2 yr,drinking low-fat (1% or skimmed) milk will help preschoolers achieve a heart-healthydiet and avoid excessive intake of saturated fat.
● Young children’s appetites can vary widely from day to day, depending on growth rates,environmental factors, and energy expenditure in play.
● As long as children have plenty of energy, are healthy, are growing well, and are eatinga variety of foods, they are probably getting enough of the nutrients they need from thefoods they eat.
The USDA Food Guide Pyramid does not specify a recommended fat content formilk and cheese or recommend lean versus fattier meats or grain products. Guidelinesfrom the American Heart Association recommend a fat-modified diet after age 2 yr. TheAcademy of Pediatrics (137) recommends that after age 2 yr, preschool children shouldgradually adopt a fat-modified diet that provides no more than 30%E (and no less than20%) from fat by age 5 yr. One of the easiest ways to achieve this goal is for healthychildren over age 2 yr to consume low-fat dairy products, such as 1% low-fat milk(130). This strategy, coupled with adequate consumption of vegetables, fruits, and fiber-containing grain products and limiting intake of added sugars and fats (the “tip” of thepyramid) will result in an energy-adequate, calorically balanced, and fat-controlled diet(152). In addition to fat-controlled, healthy pyramid eating for preschoolers, daily phys-ical activity is essential (“An hour a day of active play”). These three key heart-healthy

374 Part IV / Diabetes and Obesity
themes for preschool diet and physical activity form the basis for educational messagesfor parents and teachers of young children as well. (Table 7).
Parents can be helped to establish diet and physical activity patterns that becomehealthy habits in the home—habits that promote health rather than increase risk offuture chronic diseases such as obesity, CVD, diabetes, and cancer.
5.5. Principles of PreventionThe programs and activities described in this chapter include potential strategies that
could be incorporated into an effective childhood obesity prevention campaign. Suchstrategies should benefit the vast majority of children as a population approach to the prob-lem, including both those at increased risk of obesity as well as those at low risk. Based onscientific and behavioral considerations, childhood obesity prevention initiatives should:
● Begin early (at least by age 2 yr, if not earlier).● Have no deleterious effects.● Be relatively inexpensive.● Benefit all children, even those at low risk of obesity.● Have a strong child health education component (behavioral orientation).
Table 7Three Key Recommendations for Heart-Healthy Eating and Activity for Preschoolers
Recommendation Theme Rationale
Drink low-fat milk. “If your age is over 2, As a single strategyLow-Fat milk’s the for reducing dietary one for you!” fat, use of non-fat
milk alone may besufficient to meetdietary fat and saturatedfat goals forpreschool children.
Eat vegetables, fruits, and “Vegetables, fruits and Achieving “five-a-day”grains every day. grains are best. (Can you and fiber goals for
pass the fiber test?)”a children will help themreplace excess fat andsugar calories withmore nutritious foods achieve RDAs for more nutrients, and help them meet dietary fat goals as well.
Play hard “Play hard to keep your Children >2 yr old body strong. Run and need 30 min active jump and skip along.” play each day. As
energy expenditure increases; helps prevent obesity.
aAge + 5 g/d dietary fiber for kids over 2 yr.

Chapter 14 / Preschool Nutrition and Obesity 375
The Academy of Pediatrics has also summarized recommendations for obesity pre-vention activities as part of health supervision by pediatricians and other health careproviders. Additionally, it emphasizes the importance of advocacy and funding forchildhood obesity prevention initiatives at all levels of government (153).
● Include a child-healthy (and heart-healthy) diet at home and at preschool (Table 8).● Include adequate daily physical activity (“An hour a day of active play”).● Limit inactivity (2 h TV per day).● Involve the whole family (healthy home environments).● Educate and involve parents, teachers, and older children as role models.● Involve preschool centers in heart-healthy nutrition and physical activity initiatives.
6. SUMMARY AND RECOMMENDATIONS
In summary, prevention of childhood obesity should begin as early in life as possible—at least by age 2 to 3 yr. Preschool programs that include health education, daily physicalactivity, and a child-healthy diet could be an effective public health intervention strategy.Recommendations for dietary intake in early childhood must account for the child’sunique growth and developmental patterns, specific nutrient requirements, vulnerabilityof sentinel nutrients, factors important to the establishment of healthy food acceptability,preference and intake patterns, and nutritional risk factors for disease during early child-hood as well as later in life. All of these considerations are crucial in translating scientificfindings into public policy.
REFERENCES1. Institute of Medicine, National Academy of Sciences, Nutrition During Pregnancy. National
Academy Press, Washington, DC, 1990.2. Curhan GC, Willlett WC, Spiegelman D, et al. Birth weight and adult hypertension and obesity in
women. Circulation 1996; 94:1310–1315.
Table 810 Steps to a Child-Healthy Diet
1 Keep up caloric intake for normal growth.
2 Keep total fat to 30% or less of calories (20–30%); keep saturated fat below 10% of calories; keep cholesterol intake below 300 mg/d.
3 Eat at least five vegetables and fruits each day (three vegetables; two fruits).
4 Keep up adequate calcium intake for bone health.
5 Increase carbohydrates to 50 to 55% of calories; eat a mix of starches, high fiber carbohydrates, and whole grains.
6 Eat at least “Age + 5” g of dietary fiber each day.
7 Increase protein from vegetable sources (soy, grains, etc.); decrease proteinfrom animal sources.
8 Eat fish once a week.
9 Limit added sugar and salt.
10 Serve appropriate portion sizes for age and activity of child: smaller portionsfor preschool children; larger portions for very active children and teens.

376 Part IV / Diabetes and Obesity
3. World Health Organization. Obesity: Preventing and Managing the Global Epidemic. World HealthOrganization Technical Support Series No. 894. World Health Organization, Geneva, Switzerland, 2000.
4. Dietz WH, Gortmaker SL. Preventing obesity in children and adolescents. Annual Rev Public Health2001; 22:337–353.
5. Williams CL. Can Childhood Obesity be Prevented? In: Bendich A, Deckelbaum RJ, eds. Primaryand Secondary Preventive Nutrition. Humana Press, Totowa, NJ, 2001, pp. 185–204.
6. Freedman DS, Srinivasan SR, Valdez RA, Williamson DF, Bernson GS. Secular increases in elativeweight and adiposity among children over two decades: the Bogalusa Heart Study. Pediatrics 1997;99:420–426.
7. De Onis M, Blossner M. Prevalence and trends of overweight among pre-schoolchildren in devel-oping countries. Am J Clin Nutr 2000; 72:1032–1039.
8. Wang G, Dietz WH. Economic burden of obesity in youths aged 6–17 years: 1979–1999. Pediatrics2002; 109(5):e81.
9. Goran MI. Metabolic precursors and effects of obesity in children: a decade of progress, 1990–1999.Am J Clin Nutr 2001; 73:158–171.
10. Kotani K. Nishida M, Yamashita S, et al. Two decades of annual medical examinations in Japaneseobese children: do obese children grow into obese adults? Int J Obes Relat Metab Disord 1997;21:912–921.
11. Whitaker RC, Wright JA, Pepe MS, Seidel KD, Dietz WH. Predicting obesity in young adults fromchildhood and parental obesity. N Engl J Med1997; 337:869–873.
12. Must A. Jacques PF. Dallal GE, Bajema CJ, Dietz WH. Long-term morbidity and mortality of over-weight adolescents: a follow-up of the Harvard Growth Study of 1922 to 1935. N Engl J Med 1992;327:1350–1355.
13. Deckelbaum RJ, Williams CL. Childhood obesity—health issues. Obesity Res 2002; 9:S239–S243.14. Williams CL, Gulli M, Deckelbaum RJ. Prevention and treatment of childhood obesity- an update.
Current Atherosclerosis Reports 2001; 3:486–497.15. Freedman DS,Dietz WH, Srinivasan SR, Berenson GS. The relation of overweight to cardiovascu-
lar risk factors among children and adolescents: the Bogalusa Heart Study. Pediatrics 1999;103:1175–1182.
16. Pinhas-Hamiel O, Dolan LM, Daniels SR, Standiford D, Khoury PR, Zeitler P. Increased incidenceof non-insulin dependent diabetes mellitus among adolescents. J Pediatr 1996; 128:608–615.
17. Couch SC, Cross AT, Kida K, Ross E, Plaza I, Shea S, Deckelbaum R. Rapid Westernization ofchildren’s blood cholesterol in 3 countries: evidence for nutrient–gene interactions? Am J Clin Nutr2000; 72(Suppl):1266S–1274S.
18. Kida K, Ito T, Yang SW, Tahphaichitr V. Effects of Western Diet on Risk Factors of Chronic Diseasein Asia. In: Bendich A, Deckelbaum RJ, eds. Preventive Nutrition: The Comprehensive Guide forHealth Professionals, 2nd ed. Humana Press, Totowa, NJ, 2001, pp. 435–446.
19. Knittle J. Adipose Tissue Development in Man. In: Faulkner F, Tanner JM,eds. Human Growth,Vol 2. Postnatal Growth. Plenum Press, New York, 1978.
20. Rosso P. Prenatal nutrition and fetal growth and development. Ped Ann 1981; 10:21–30.21. Johnston F. Sex Differences in Fat Patterning in Children and Youth. In: Bouchard C, Johnston F,
eds. Fat Distribution During Growth and Later Health Outcomes. Liss, New York, 1988, pp. 85–102.22. Forbes C. Body Composition in Adolescence. In: Faulkner F, Tanner JM,eds. Human Growth: A
Comprehensive Treatise. Vol 2. Plenum Press, New York, 1986.23. Liebel R, Berry E, Hirsch J. Biochemistry and Development of Adipose Tissue in Man. In: Conn HL
Jr, DeFelice EA, Kuo P, eds. Health and Obesity. Raven Press, New York, 1983.24. Knittle J, Timmrs K, Ginsberg-Fellner F. The growth of adipose tissue in children and adolescents.
J Clin Invest 1979; 63:239–246.25. Doglio A, Amri E, Dani C, et al. Effects of Growth Hormone in the Differentiation Process of
Preadipose Cells. In: Isaksson O, Binder C, Hall K, eds. Growth Hormone—Basic and ClinicalAspects. Elsiever Science, Amsterdam, The Netherlands, 1987.
26. Faust I, Miller WJ. Hyperplastic Growth of Adipose Tissue in Obesity. Raven Press, New York,1983, pp. 41–51.
27. Hagar A, Sjostrom I, Arvidsson V. Adipose tissue cellularity in obese school girls before and ofterdietary treatment. Am J Clin Nutr 1978; 31:68–75.
28. Dewey KG, Lonnerdal B. Milk and nutrient intake of breast-fed infants from 1–6 months; relationto growth and fatness. J Pediatr Gastroenterol Nutr 1983; 3:497–506.

Chapter 14 / Preschool Nutrition and Obesity 377
29. Sveger T, Lindberg T, Weibull B, Olsson UL. Nutrition, overnutrition and obesity in the first year oflife in Malmo, Sweden. Acta Pediatr Scand 1975; 64(4):635–640.
30. Shapiro LR, Crawford PB, Clark MJ, Pearson DL, Raz J, Huenemann RL. Obesity prognosis: a lon-gitudinal study of children from age 6 months to 9 years. Am J Public Health 1984; 74 (9):968–972.
31. Melbin T, Vuille JC. The Relative Importance of Rapid Weight Gain in Infancy as a Precursor ofChildhood Obesity. In: Laron Z, Dickman Z, ed. The Adipose Child. Karger, Basel, 1976; W1PE163H v.1 1975.
32. Fomon S, Thomas L, Filer L, et al. Food consumption and growth of normal infants fed milk-basedformulas. Acta Pediatr Scand 1971; 223:1–36.
33. Kramer MS. Do breast-feeding and delayed introduction of solid foods protect against subsequentobesity? J Pediatr 1981; 98(6):883–887.
34. Kramer MS, Barr RG, Leduc DG, Boisjoly C, Pless IB. Infant determinants of childhood weight andadiposity. J Pediatr 1985; 107(1):104–107.
35. Dine MS, Gartside PS, Glueck CJ, et al. Where do the heaviest children come from? A prospectivestudy of white children from birth to 5 years of age. Pediatrucs 1979; 63:(1)1–7.
36. Roberts, SB, Savage J, Coward WA, Chew B, Lucas A. Energy expenditure and energy intake ininfants born to lean and overweight mothers. NEJM 1988; 318:461–466.
37. Griffiths M, Payne PR. Energy expenditure in small children of obese and non-obese parents. Nature1976; 260:698–700.
38. Griffiths M, Payne PR, Stunkard AJ, Rivers JPW, Cox M. Metabolic rate and physical developmentin children at risk of obesity. Lancet 1990; 336:76–78.
39. Waterland RA, Berkowitz RI, Stunkard AJ, Stallings VA. Calibrated-orifice nipples for measurementof infant nutritive sucking. J Pediatr 1998; 132(3 Pt 1):523–526.
40. Mack RW, Johnston FE. The relationship between growth in infancy and growth in adolescence:report of a longitudinal study among urnban black adolescents. Hum Biol 1976; 48(4):493–501.
41. Garn S, Levelle M. Two decade follow-up of fatness in early childhood. Am J Dis Child 1985;139(2):181–185.
42. Whitaker RC,Wright JA, Pepe MS, Seidel KD, Dietz WH. Predicting obesity in young adulthoodfrom childhood and parental obesity. NEJM 1997; 337:869–872.
43. Rolland-Cachera MF, Deheeger M, Bellisle F, Sempe M, Guilloud-Bataille M, Patois E.Adiposity rebound in children: a simple indicator for predicting obesity. Am J Clin Nutr 1984;39:129–135.
44. Klesges RC, Klesges LM, Eck LH, Shelton ML. A longitudinal analysis of accelerated weight gainin preschool children. Pediatrics 1995; 95:126–130.
45. Eck LH, Klesges RC, Hanson CL, Slawson D. Children at familial risk for obesity: an examinationof dietary intake, physical activity and weight status. Int J Obes 1992; 16:71–78.
46. Robertson AM, Cullen KW, Baronowski J, Baranowski T, Hu S, deMoor C . Factors related to adi-posity among three to seven year old children. (Personal communication, 1999).
47. Deheeger M, Rolland-Cachera M, Fontvieille A. Physical activity and body composition in 10 yearold French children: linkages with nutritional intake? Int J Obes 1997; 21:372–379.
48. Klesges R. Parental influences in children’s eating behavior and relative weight. J Appl Behav Anal1983; 16:3731–3718.
49. Wiliams CL, Hayman LL, Daniels SR, Robinson TN, Steinberger J, Paridon S. CardiovascularHealth in Childhood. A statement for health professionals from the Committee on Atherosclerosis,Hypertension, and Obesity in the Young (AHOY) of the Council on Cardiovascular Disease in theYoung, American Heart Association. Circulation 2002; 106:143–160.
50. St Jeor ST, Perumean-Chaney S, Sigman-Grant M, Williams C, Foreyt J. Family-based interventionsfor the treatment of childhood obesity. J Am Dietet Assoc 2002; 102:640–644.
51. US Department of Agriculture. Center for Nutrition Policy and Promotion. Continuing Survey ofFood Intakes by Individuals, 1994–96, 1998. (http://www.usda.gov). Accessed March 2, 2004.
52. United States Department of Agriculture, Food and Consumer Service, Office of analysis andEvaluation. Early Childhood and Child Care Study: Nutritional Assessment of the CACFP, Vols. 1& II: Final Report. US Govt. Printing Office, July 1997.
53. Kennedy E, Meyers L, Layden W. The 1995 Dietary Guidelines for Americans: an overview. JADA1996; 96(3):234–237.
54. Food and Nutrition Board. Recommended Dietary Allowances. 10th ed. National Academy Press,Washington, DC, 1989.

378 Part IV / Diabetes and Obesity
55. National Research Council Committee on Diet and Health. Diet and Health: Implications forReducing Chronic Disease Risk. Food and Nutrition Board, National Research Council. NationalAcademy Press, Washington, DC, 1989, pp. 670–672.
56. Head Start Bureau. Head Start Program Performance Standards (45-CRF-1304). US Dept of Healthand Human Services, Washington, DC, 1994. DHHS publ (ACF) 92-31131.
57. Food and Nutrition Services, US Department of Agriculture. A Planning Guide for Food Service inChild Care Centers. US Dept of Agriculture, Washington, DC, revised July 1989.
58. Oakley CB, Bomba AK, Knight KB, Byrd SH. Evaluation of menus planned in Mississippi child-carecenters participating in the Child and Adult Care Food Program. J Am Diet Assoc 1995; 95:765–768.
59. NHANES I (1971–75): Braitman LE, Adkin EV, Stanton JL. Obesity and caloric intake: the NationalHealth and Nutrition Examination Survey of 1971–1975. (NHANES I). J Chron Dis 1985; 38:727–32.
60. NHANES II: (1976–80): Dietary intake source data: United States, 1976–80. Data from the NationalHealth Survey. Hyattsville, MD. USDHHS, PHS, NCHS, 1983. DHHS Publ (PHS)83–1681, series11, No. 231.
61. NHANES III (1988–91): Daily dietary fat and total food energy intakes—National Health andNutrition Examination Survey (NHANES III), Phase 1:1988–1991. MMWR Morbid Mortal WklyRep 1994; 43:116–117; 123–125.
62. Alaimo K, McDowell MA, Briefel RR. Dietary intake of vitamins, minerals, and fiber of persons 2months and over in the United States. Third National Health and Examination Survey, Phase I,1988–91. Advance Data 1994; 258:1–27.
63. Human Nutrition Information Service. Nationwide food consumption survey of food intakes by indi-viduals, women 19–50 years and their children 1–5 years, 4 days, 1986. US Dept of Agriculture,CSFII Report No., Hyattsville, MD, 1988; 86–83.
64. CFSII, 1989–91: US Department of Agriculture. Food and nutrient intakes by individuals in theUnited States, 1 day, 1989–1991. NFS Report No. 91-2. US GPO, Washington DC, 1995.
65. CSFII, 1994–95. Food and nutrient intakes by individuals in the United States. 1 day, 1989–1991.NFS Rep No. 91-2 (NTIS Acsession No. PB95-272746.).
66. NCFS 1977–78: Nutrient intakes. Individuals in 48 states, year 1977–78. Human NutritionInformation Service, Nutrition Monitoring Division, USDA, 1984. Nationwide Food ConsumptionSurvey, 1977–78 report no.I-2.
67. NFCS 1987–88: US Dept Agriculture, Human Nutrition Information Service, Nutrition MonitoringDivision Nationwide Food Consumption Survey. Continuing Survey of Food Intake by Individuals.Report no. 86–3. Hyattsville MD, 1988.
68. Kennedy E, Goldberg J What are American children eating? Implications for public policy. Nutr Rev1995; 53(5):111–126.
69. Enns CW, Mickle SJ, Goldman JD. Trends in food and nutrition intakes by children in the UnitedStates. Family Economies and Nutrition Rev 2002; 14(2):56–68.
70. Food and Nutrient Intakes by Individuals in the United States, by sex and age, 1994–96. ContinuingSurvey of Food Intakes by Individuals. US Dept of Agriculture, Agricultural Research Service; NFSReport 96-2, 1998.
71. Wright HS, Guthrie HA, Wang MQ, Bernardo V. The 1987–88 Nationwide Food ConsumptionSurvey. An update on the nutrient intake of respondents. Nutr Today 1991; 26:21–27.
72. Williams CL. Importance of dietary fiber in childhood. J Am Diet Assoc 1995; 95:1040–1049.73. National Academy of Sciences. Macronutrient Report Washington DC, 2002.74. McDowell MA, Briefel RR, Alaimo K, et al. Energy and macronutrient intakes of persons ages 2
months and over in the United States: Third National Health and Nutrition Examination Survey,Phase 1, 1988–91. Advance data from vital and health statistics; No 255. National Center for HealthStatistics, Hyattsville, MD, 1994.
75. Williams CL, Bollella MC, Strobino BA, et al. Healthy-Start: outcome of an intervention to promotea heart healthy diet in preschool children. J Amer Coll Nutr 2002; 21(1):62–71.
76. Goran MI, Poehlman ET, Johnson RK: Energy requirements accross the life span: new findingsbased on measurement of total energy expenditure with doubly labelled water. Nutr Res 1995;15(1):115–150.
77. Fonteville AM, Dwyer J, Rauvussin E. Resting metabolic rate and body composition of Pima Indianand Caucasian children. Int J Obes 1992; 16:535–542.
78. Davies PS, Gregory J, White A. Energy expenditure in children 1.5 to 4.5 years. Eur J Clin Nutr1995; 49(5):360–364.

Chapter 14 / Preschool Nutrition and Obesity 379
79. American Academy of Pediatrics, Committee on Nutrition. Statement on cholesterol. Pediatrics1992; 90:469.
80. National Cholesterol Education Panel. Report of the expert panel on blood cholesterol levels in chil-dren and adolescents. Pediatrics 1992;89(Suppl):1–91.
81. American Heart Association. Integrated cardiovascular health promotion in childhood. Circulation1991; 85(4):1638–1650.
82. Healthy People 2000. National health promotion and disease prevention objectives. USDHHS, PHS,1991. DHHS Publ. no:(PHS) 91—50212, Washington, DC.
83. NIH Consensus Development Panel. Lowering blood cholesterol to prevent heart disease. JAMA1985; 253:2080–2086.
84. Williams GM, Wynder EL. Diet and Cancer: A Synopsis of Causes and Prevention Strategies. In:Watson RR, ed. Nutrition and Cancer Prevention. CRC Press, Boca Raton, FL, 1996.
85. Williams CL, Bollella M. Nutrition in Childhood: Primary Cancer Prevention. In: Watson RR, ed.Nutrition and Cancer Prevention. CRC Press, Boca Raton, FL,1996.
86. Williams, CL, Bollella M, Williams GM. Cancer Prevention Beginning in Childhood. In: DeVita VT,ed. Cancer Prevention. JB Lippicott, Philadelphia, 1995.
87. Ravussin E, Tataranni A. Dietary fat and human obesity. JADA 1997; 97(7):S42–S46.88. Klesges RC, Klesges LM, Eck L, Shelton ML. A longitudinal analysis of accelerated weight gain in
preschool children. Pediatrics 1995; 95 (1):126–130.89. Blundell J, Macdiarmid J. Fat as a risk factor for overconsumption: satiation, staiety, and patterns of
living. JADA 91997; 7(7):S63–S69.90. Lapinleimu T, Vikari J, Jokinen E, et al. Prospective randomized trial in 1062 infants of a diet low
in saturated fat and cholesterol. Lancet 1995; 345:471–476.91. Shea S, Basch CE, Stein AD, Contento IR, Irogoyen M, Zybert P. Is there a relationship between
dietary fat and stature or growth in children 3 to 5 years of age? Pediatrics 1992; 92:579–586.
92. Kuehl KS, Cockerham JT, Hitchings M, et al. Effective control of hypercholesterolemia in childrenwith dietary interventions based in pediatric practice. Prev Med 1993; 22: 154–166.
93. Koletzko B. Childhood diet and prevention of heart disease. Eur J Clin Nutr 1991; 45:73–75.94. Luepker RV, Perry CL, McKinley SM, et al. Outcomes of a field trial to improve children’s dietary
patterns and physical activity. JAMA 1996; 275 (10):768–776.95. DISC Collaborative Research Group. Efficacy and safety of lowering dietary intake of fat and
cholesterol in children with elevated low-density lipoprotein cholesterol. JAMA 1995;273:1429–1435.
96. Rask-Nissila L, Jokinen E, Terbo P, et al. Effects of diet on the neirological development of childrenat 5 years of age: the STRIP project. J Pediatr 2002; 140:328–333.
97. Enos W, Holmes R, Beyer J. Coronary artery disease among US soldiers killed in Korea. JAMA1953; 512:1090–1092.
98. McNamara JJ, Molot MA, Stremple JF, et al. Coronary artery disease in combat casualties inVietnam. JAMA 1971; 216:1185–1187.
99. Strong JP, Malcom GT, Oalmann MC. Environmental and genetic risk factors in early human athero-genesis: lessons from the PDAY Study. Pathological Determinants of Atherosclerosis in Youth.Pathol Int 1995; 45(6):403–408.
100. Wissler RW. An overview of the quantitative influence of several risk factors on progression of ath-erosclerosis in young perople in the United States. Pathological Determinants of Atherosclerosis inYouth. Am J Med Sci 1995; 310:S29–S36.
101. Newman WP III, Wattigney W, Berenson GS. Autopsy studies in US children and adolescents.Relationship of risk factors to atherosclerotic lesions. Ann NY Acad Sci 1991; 623:16–23.
102. Cornhill JF, Herderick EE, Vince DG. The clinical morphology of human atherosclerotic lesions.Lessons from the PDAY Study. Pathological Determinants of Atherosclerosis in Youth. Wien KlinWochenschr 1995; 107(18):540–543.
103. Wlliams CL. Prevention of Coronary Artery Disease: Pediatric Preventive Cardiology. In: GewitzMH, ed. Primary Pediatric Cardiology. Futura Publishing. Armonk, NY, 1995.
104. Lauer RM, Shekelle RB. Childhood Prevention of Atherosclerosis and Hypertension. Raven Press,New York, 1980.
105. Williams CL. Clinical Intervention in Childhood. In: Ockene IS, Ockene JK, eds. PreventiveCardiology—A Behavioral Approach. Little Brown 1992.
380 Part IV / Diabetes and Obesity
106. Wynder EL, Berenson GS, Strong WB, Williams CL.Coronary artery disease prevention: a pediatricperspective. Prev Med 1989; 18:323–409.
107. Berenson GS. Cardiovascular Risk Factors in Children. Oxford Press, New York, 1980.108. Williams CL, Strobino B, Brotanek J, Squillace M, Campanaro L. Cardiovascular disease risk fac-
tors in low-income preschool children: Healthy Start. Can J Cardiol 1997; 13(Suppl B):174B.109. Resnicow K, Kotchen JM, Wynder EL. Plasma cholesterol levels of 6585 US children. Results of
the Know Your Body Screening in five states. Pediatrics 1989; 84:969–976.110. Webber LS, Scrinivasan SR, Berenson GS. Tracking of serum lipids and lipoproteins over 12 years
into young adulthood—The Bogalusa Heart Study. Circulation 1988; 78:481.111. Kallio MJT, Salmenpera L, Siimes MA, et al. Tracking of serum cholesterol and lipoprotein levels
from the first year of life. Pediatrics 1993; 91:949–954.112. Lauer R, Clarke WR. Use of cholesterol measurements in childhood for the prediction of adult
hypercholesterolemia. JAMA 1997; 264(23):3034–3038.113. Munoz KA, Krebs-Smith SM, Balland-Barbash R. Cleveland: food intakes of children and adoles-
cents compared with recommendations. Pediatrics 1997; 100(3):323–329.114. Nicklas TA, Bao W, Webber LS, et al. Dietary intake patterns of infants and young children over a
12-year period: the Bogalusa Heart Study. J Advanc Med 1992; 5(2):89–103.115. Singer MR, Moore LL, Garrahie EJ, Ellison RC. Tracking of nutrient intake in young children. AJPH
1995; 85(12):1673–1677.116. Troiano RP, Flegal KM, Kuczmarski RJ, Campbell SM, Johnson CL. Overweight prevalence and
trends for children and adolescents. The National Health and Nutrition Examination Surveys, 1963to 1991. Arch Ped Adoles Med 1995; 149:1085–1091.
117. Update: Prevalence of overweight among children, adolescents and adults U.S., 1988-1994. MMWR1997; 4:199–202.
118. Ogden C, Troiano RP, Briefel R, Kuczmarski RJ, Flegal KM, Johnson CL. Prevalence of overweightamong preschool children in the United States, 1971 through 1994. Ped 1997; 99(4): e1–e13.
119. Grunbaum JA, Kann L, Kinchen S, et al. Youth Risk Behavior Surveillance—United States, 2003.MMWR Surveill 2004; 53(2):1–96.
120. Kann L, Warren CW, Harris WA, et al. Youth Risk Behavior Surveillance—United States, 1995.MMWR Surveill 1996; 45(4):1–84.
121. Rolland-Cachera M, Deheeger M, Guilloud-Bataille M. Tracking the development of obesity fromone month of age to adulthood. Ann Hum Biol 1987; 14(3):219–229.
122. Osganian SK, Ebzery MK, Montgomery DH, et al. Changes in the nutrient content of school lunches:results from the CATCH Eat Smart Food Service Intervention. Prev Med 1996; 25(4):400–412.
123. Luepker RV, Perry CL, McKinley SM, et al: Outcomes of a field trial to improve children’s dietarypatterns and physical activity. JAMA 1996; 275(10):768–776.
124. Stone EJ, Osganian SK, McKinley SM, et al. Operational Design and Quality Control in the CATCHMulticenter Trial. Prev Med 1996; 25(4):384–399.
125. Perry CL Stone EJ, Parcel GS, et al: School-based cardiovascular health promotion: the Child andAdolescent Trial for Cardiovascular Health (CATCH). J Sch Health 1990; 60(8):406–413.
126. Dwyer JT, Hewes LV, Mitchell PD, et al. Improving school breakfasts: effects of the CATCH EatSmart Program on the nutrient content of school breakfasts. Prev Med 1996; 5:413–422.
127. Raizman DJ, Montgomery DH, Osganian SK. CATCH: food service program process evaluation ina multicenter trial. Health Educ Quart 1994; Suppl 2:S51–S71.
128. Nicklas TA, Dwyer J, Mitchell P, et al. Impact of fat reduction on micronutrient density of children’sdiets: the CATCH study. Prev Med 1996; 25:478–485.
129. Obarzanek E, Hunsberger SA, Van Horn L, et al. Safety of a fat-reduced diet: the Dietary InterventionStudy in Children (DISC). Pediatrics 1997; 100:51–59.
130. Sigman-Grant M, Zimmerman S, Kris-Etherton PM. Dietary approaches for reducing fat intake inpreschool children. Pediatrics 1993; 91(5):955–960.
131. Lagstrom H, Seppanen R, Jokinen E, et al. Influence of dietary fat on the nutrient intake and growthof children from 1 to 5 y of age: the Special Turku Coronary Risk Factor Intervention Project. Am JClin Nutr 1999; 69(3):16–23.
132. Rask–Nissila L, Jokinen E, Terho P, et al. Neurological development of 5 year old children receivinga low–saturated fat, low cholesterol diet since infancy: a randomised controlled trial. JAMA 2000;284(8):993–1000.

Chapter 14 / Preschool Nutrition and Obesity 381
133. Basch CE, Shea S, Zybert P. Food sources, dietary behavior, and the saturated fat intake of Latinochildren. AJPH 1992; 82:810–815.
134. Olson RE. The folly of restricting fat in the Diet of Children. Nutr Today 1995; 30(6):234–245.135. Wosje KS, Specker BL, Giddens J. No difference in growth or body composition from age 12 to 24 months
between toddlers consuming 2% milk and toddlers consuming whole milk. JADA 2001; 101(1):53–56.136. Chase HP, Hambidge M, Barnett SE, Houts-Jacobs LB, Lenz K, Gillespie J. Low vitamin A and zinc
concentration in Mexican-American children with growth retardation. Am J Clin Nutr 1983;37:828–833.
137. Williams CL, Spark A, Strobino BA, et al. Cardiovascular risk reduction in a preschool population:the Healthy Start Project. Prev Cardiol 1998; 2:45–55.
138. Bandura A. Social Learning Theory. Prentice-Hall, Englewood Cliffs, NJ, 1977.139. D’Agostino C, D’Andrea T, Lieberman L, Sprance L, Williams CL. Healthy Start: a new compre-
hensive preschool health education program. J Health Ed 1999; 30(1):9–12.140. D’Agostino C, D’Andrea T, Nix S, Williams CL. Increasing nutrition knowledge in preschool chil-
dren: the Healthy Start Project Year 1. J Health Ed 1999; 30(4):217–221.141. D’Agostino C, Nix S, Williams CL. Development and reliabilty of the Healthy Start knowledge
computer quiz for preschool children. J School Health 1999; 69(1):9–11.142. Spark A, Pfau J, Nicklas T, Williams CL. Reducing fat in preschool meals: description of the food
service intervention component of Healthy Start. J Nutr Educ 1998; 30(3):170–177.143. Bollella M, Boccia L, Nicklas T, et al. Dietary assessment of children in preschool: Healthy Start.
Nutr Res 1999; 19(1):37–48.144. Bollella M, Boccia L, Nicklas T, et al. Sources of nutrient intake in diets of Head Start children:
home vs school. J Am Coll Nutr 1999; 18(2):108–114.145. Centers for Disease Control and Prevention. Guidelines for school and community programs to pro-
mote lifelong physical activity among young people. MMWR 1997; 46(No.RR-6):1–36.146. American Academy of Pediatrics, Committee on Nutrition. Statement on cholesterol. Pediatrics
1998; 101(1):141–147.147. Williams CL, Bollella M, Wynder E. A New Recommendation for dietary fiber in childhood.
Pediatrics 1995; 96(5)S:985–988.148. Nicklas T, Myers L, Berenson GS. Impact of ready to eat cereal on the total dietary intake of children.
JADA 1994; 94(3):316–318.149. Niiikoski H, Viikari J, Ronnemaa T, Simell O. Fat and energy intake and children’s growth. Can J
Cardiol 1997; 13(Suppl B): Abstract 0532.150. Gutteridge MA. A study of the motor achievement of young children. Arch Psychol 1939;
244:1–178.151. Bredenkamp S, ed. Developmentally Appropriate Practice in Early Childhood Programs Serving
Children from Birth Through Age 8. National Association for the Education of Young Children.Washington, DC, 1987.
152. United States Department of Agriculture. Center for Nutrition Policy ans promotion. Tips for Usingthe Food Guide Pyramid for Young Children 2 to 6 years old. USDA Program Aid 1647. Washington,DC, March 1999.
153. Prevention of pediatric overweight and obesity. American Academy of Pediatrics. Committee onNutrition. Pediatrics 2003; 112(2):424–430.


From: Preventive Nutrition: The Comprehensive Guide for Health Professionals, Third EditionEdited by: A. Bendich and R. J. Deckelbaum © Humana Press Inc., Totowa, NJ
383
15 Obesity and Chronic DiseaseImpact of Weight Reduction
Henry I. Frier and Harry L. Greene
KEY POINTS
● Obesity continues to rise and is most acute, as a public health issue, in pediatric andadolescent populations.
● Life expectancy, employing years-of-life-lost estimates, is drastically decreased.● Based on NHANES III, approx 1 million overweight/obese teenagers suffer from meta-
bolic syndrome.● Weight reduction coupled with increases in physical activity remains the safest and
most effective means to reduce insulin resistance. ● Obesity continues to be a major public health issue that must be addressed.
1. INTRODUCTION
“Opinion is a flitting thing but truth outlasts the sun.”
—Emily Dickinson
It is impossible to pick up a newspaper or current magazine without being bom-barded with the latest legal or scientific findings linking diet to obesity and disease.Diet, poor eating habits, and a sedentary lifestyle play a significant role in the healthof individuals. Improvements in public health and efficiencies in the processed fooddelivery complex have eliminated most nutrient deficiencies in the United States andreplaced them with diseases involving excess calories. The Surgeon General’s Reporton Nutrition and Health (1988) ranked the leading causes of death in the Unites States(1), with several strongly related to diet (i.e., coronary heart disease [CHD], cancer,stroke, diabetes mellitus, and atherosclerosis). The relatively meek report, SurgeonGeneral’s Call to Action To Prevent Overweight and Obesity 2001 (2), addresses thesocial and community aspects of this epidemic and is countered by the more stronglyworded World Health Organization Technical Report (3), which identifies specificfood components that are directly related to obesity and disease. Despite the recom-mendations of the Surgeon General’s Report (1) to maintain a desirable weight and a

384 Part IV / Diabetes and Obesity
caloric intake keeping with energy expenditure, Americans continue to experienceincreases in body weight- and obesity-related morbidity and mortality. The prevalenceof weight problems and obesity continues to climb and is currently estimated toinclude 65% of the adult population (4). The greatest increase was seen in those clas-sified as obese, represented by the heaviest individuals (now estimated at 23%) with abody mass index (BMI) of greater than 30 (Fig. 1) (5). The recently reported age-adjusted prevalence of 30.5% from the National Health and Nutrition ExaminationSurvey (NHANES) of 1999–2000 demonstrates that this trend is continuing (4). Ofgreatest concern is the increased incidence of obesity in children and adolescents.Evidence suggests that they will be the next generation of obese adults and will expe-rience the accompanying disease risks. In a 1995 report, the incidence was estimatedat 14%, using the 95th percentile of weight (Fig. 2) (6). Newer estimates, based onexamination data from the 1999–2000 NHANES estimated the prevalence at 15.5%for children ages 12 through 19 yr, 15.3% for children ages 6 through 11 yr, and 10.4%for children ages 2 through 5 yr (7).
In 1995, the estimated annual direct cost of obesity and its related comorbidities wasUS$52 billion (8). This accounted for 5.7% of the US national health expenditure. Theauthors again echoed the recommendations of the Surgeon General’s Report to improvethe diet and avoid weight problems and obesity as the most important step in thecontainment of rising health care costs.
The purpose of the earlier chapter, which appeared in the second edition, was toreview the association between excess body weight and its major comorbid conditions,as well as to review the impact of weight reduction on improvement in obesity-relateddiseases. Five major comorbidities were discussed: type 2 diabetes mellitus (DM),
Fig. 1. Trends in class I obesity (BMI: 30–34.9 kg/m2) at different age ranges (yr).NHES, National Health Examination Survey; NHANES, National Health and NutritionExamination Survey. (Adapted from ref. 5.)

Chapter 15 / Impact of Weight Reduction 385
hypertension (HT), cardiovascular disease (CVD), dyslipidemia, and certain types ofcancer. This chapter is updated with the latest findings in specific areas and reviews thelatest developments regarding metabolic syndrome and its implications for disease.
Obesity results from an imbalance in energy consumed and energy expended. It isbelieved that there is a permissive component that is genetic but is promoted by thesocietal and environmental changes occurring in contemporary life (i.e., dietary patternsand decreased physical activity). There is little doubt that a 5 to 10% decrease in bodyweight can significantly improve several risk factors associated with chronic disease(9). However, is there an improvement in mortality associated with the reduction in riskfactors? Intuitively, one would expect that reductions in the risk factors (i.e., bloodlipids, blood pressure, and glycemic control) would improve the health of the popula-tion, thus improving mortality rates. Additionally, because the positive relationship ofweight gain and mortality has been established (10), logic would suggest that reversingthis gain would decrease mortality.
Several recent reviews critically evaluated the epidemiological studies on the associ-ation of weight loss and increased longevity (11–13). Williamson and Pamuk (11)concluded that the prospective studies reporting a positive benefit of weight loss onmortality were not justified by the data, whereas Andres et al. (12) concluded that mod-erate weight gain was associated with the lowest rates of all-cause mortality afteradjusting for weight volition and smoking.
The majority of the studies evaluated by Williamson and Pamuk (11) may have beenmisleading because two key confounders (unintentional weight loss caused by anunderlying illness and habitual smoking) were not considered (11,13). Analyzing dataas a percent of weight lost in a cohort from NHANES I, Williamson (while correctingfor smoking and premature death [13]) found that a greater relative risk (RR) of deathwas present for both genders at each BMI category between 26 and 29 kg/m2 butdecreased for those individuals with a BMI less than 29 kg/m2.
Fig. 2. Trends in obesity in boys and girls ages 6–11 and 12–17 yr. (Adapted from ref. 6.)

386 Part IV / Diabetes and Obesity
In contrast to the reports mentioned earlier on mortality are several studies supportingthe role of weight loss in improving mortality risk. Lean et al. (14) retrospectively analyzedmortality data in diabetics and found that weight loss per se and its relationship with initialBMI actually improved survival. They estimated a 3- to 4-mo increased survival with each1 kg of body weight lost. Goldstein (15) reviewed the available clinical studies reportingweight losses of 10% or less in obese individuals with either type 2 DM, HT, or hyperlipi-demia and also concluded that modest weight loss decreased risk factors and, therefore,should increase longevity. Goldstein theorized that a decrease in BMI from 40 to 38 kg/m2
would improve mortality risk by 12% and that decreasing the BMI from 30 to 28.5 kg/m2
would improve mortality by 7.5% (Fig. 3, shaded areas; ref. 15). More recently, Fontaineet al. (16), employing years-of-life-lost estimates concluded that obesity, especially inyounger age brackets, markedly lessens life expectancy. These data suggest that even themorbidly obese can reduce mortality risk with as little as a 5% weight reduction.
To understand the association between intentional weight loss and longevity,Williamson et al. (17) analyzed prospective data from overweight and obese women inthe Cancer Prevention Study I. Exclusions were a BMI of 27 or less, smoking, and ageolder than 64 and younger than 40 yr. Women who had an obesity-related health condi-tion and intentionally lost weight had a 20% lower all-cause mortality. Diabetes-asso-ciated mortality was also reduced by 44%, and CVD mortality was reduced by 9%.Weight loss of more than 9 kg in women without a pre-existing disease was associatedwith a 25% decrease in cancer and CVD mortality (17).
The benefit of weight loss on mortality remains controversial. Several critical evalu-ations of the published observational data challenge the conventional wisdom thatweight loss improves mortality. On the other hand, the weight of clinical trials (e.g.,cholesterol reduction; see Subheadings 2.3. and 2.4.) and more recent observationalstudies (16,17) suggest otherwise.
Fig. 3. Relationship between all-cause mortality and BMI. Theoretical changes inmortality risk with decreases in BMI are denoted by arrows. (Reproduced from ref. 15.)

Chapter 15 / Impact of Weight Reduction 387
2. OBESITY-RELATED HEALTH RISKS AND THE BENEFITSOF WEIGHT LOSS
2.1. Impaired Glucose Tolerance and Type 2 DMThe medical consequences of obesity can be classified as metabolic (e.g., DM and
dyslipidemia) or mechanical (e.g., joint pain and osteoarthritis). The role of obesity inthe development of the diabetic state is well-established. Type 2 diabetes, via impairedglucose tolerance (IGT) and insulin resistance (IR), is also related to the developmentof several additional risk factors (e.g., HT and dyslipidemia). This relationship plays akey role in the progression to increased risk of macro- and microvascular diseases suchas kidney failure and blindness (18). For example, Ohlson et al. (19) observed thatobese middle-aged Swedish men with IGT were more likely to have both an increase insystolic blood pressure and an elevation in plasma triglycerides.
The prediabetic state is marked by an increased level of fasting-circulating insulin anda diminished response of peripheral insulin-sensitive tissues to oxidize and store glucose(IR) (20). Increased circulating insulin in the obese individual is insufficient to maintainnormal blood glucose because of increased hepatic glucose production coupled with areduced glucose uptake by muscle and adipose tissue. The relation of adiposity to thispathological state is speculative. One early theory (21), “the glucose fatty acid cycle,”suggests that in obesity, an excess of circulating free fatty acids inhibit glucose uptake bymuscle, inducing glucose intolerance. It is believed that an imbalance exists betweenrates of fatty acid esterification in adipose tissue and an accelerated glyceride breakdownin muscle caused by the insulin insensitivity of this tissue.
2.1.1. BMI AND DIABETES RISK
Campbell and Gerich (22) measured both insulin sensitivity, by half-maximal glucosedisposal rates (EC50), and insulin responsiveness in subjects with varying BMI and normalglucose tolerance. They found that BMI must exceed a critical threshold before insulinaction is impaired. Using a broken-line regression model, they estimated a breakpoint inBMI of 26.8 kg/m2, which corresponds to 120% of ideal body weight. In a follow-up study,Campbell and Carlson (23) used similar techniques to compare normal lean subjects toobese type 2 diabetics (52 ± 2 yr; BMI of 28.1 ± 0.8 kg/m2). The results strengthen the ear-lier findings of a relationship between increased BMI and decreased insulin sensitivities intype 2 diabetics. Additionally, hepatic glucose production was correlated with BMI only inthe type 2 diabetics. These findings are consistent with the epidemiological data and thelongheld clinical association between obesity and type 2 diabetes.
2.1.2. VISCERAL ADIPOSITY AND DIABETES RISK
Several lines of evidence suggest that increased visceral adiposity is more likely tobe associated with abnormal glycemic control and subsequent development of diabetesthan simply an increased body weight. Several prospective studies showed an increasedrelative risk of diabetes in both men and women with increased central (visceral) obe-sity. The Gothenburg studies (24,25) focused on the importance of central adiposity andthe increased incidence of diabetes; both men and women had significant correlationswith waist-to-hip ratio (WHR) and total body fat. Using a cohort from the NormativeAging Study, Cassano et al. (26) found a 2.4-fold increase in diabetic risk with increas-ing WHR when adjustments were made for age, BMI, and smoking. These authors

388 Part IV / Diabetes and Obesity
also found a positive association between blood glucose and abdominal fat that wasindependent of total body fat.
2.1.3. METABOLIC ALTERATIONS AND INSULIN RESISTANCE
Other metabolic alterations are commonly associated with obesity and IR. Dyslipidemiamanifested as hypertriglyceridemia, decreased high-density lipoprotein cholesterol (HDL-C), increased very low-density lipoprotein (VLDL) triglyceride, and reduction in low-density lipoprotein (LDL) particle size (increased atherogenic potential) increases the riskfor age-related CHD (27). Although those with type 2 diabetes and good glycemic controlhave normal concentrations of LDL-C, the concentrations of fasting and postprandialtriglyceride-rich particles (VLDL) are often elevated, and HDL-C levels are decreased (28).
2.1.4. WEIGHT LOSS AND GLYCEMIC CONTROL
Weight loss has been shown repeatedly to improve glycemic control in both obese dia-betic and nondiabetic patients (9,20). These improvements have been observed early dur-ing therapy, suggesting that the caloric reduction is the primary promoter for theobserved changes. Wing et al. (29) attempted to separate the effects of caloric restrictionand weight loss in obese patients with type 2 diabetes. These investigators used two levelsof caloric restriction (400 vs 1000 kcal/d). At the point of an 11% weight loss, assessment ofsubjects showed that individuals consuming fewer calories per day had greater reduc-tions in fasting blood glucose and greater insulin sensitivities. Therefore, the degree ofcalorie restriction, independent of the magnitude of weight loss, appeared to play a dom-inant role in improvements in glycemic control. Additional support for the primary roleof calorie reduction is provided by a report of patients with type 2 diabetes who areundergoing gastric bypass surgery for weight loss (30). These patients showed an earlycorrection of hyperglycemia before the appearance of weight loss. The authors relatethese changes to the immediate reduction of food intake following surgery. They werealso able to rule out the interaction of more traditional treatment approaches such as exer-cise, sulfonylureas, and insulin, which were not part of the surgical recovery regimen.
2.1.5. DIABETES AND CHDControversy exists regarding the association between CHD mortality and type 2 dia-
betes. Observational and prospective studies have not demonstrated a clear relationshipbetween the hyperglycemia in type 2 diabetics and CHD (28). However, several studiesshowed an association between glucose-intolerant populations and increased risk ofCHD. Singer et al. (31) also found a significant relationship between hemoglobin A1C(HbA1c) and CVD in female survivors of the original cohort of the Framingham HeartStudy. In addition, HbA1c was strongly related to HT and the ratio of LDL-C to HDL-C.An analysis of the Framingham Offspring Study (32) found several associated metabolicabnormalities. For example, obesity was associated with HT and an elevation in fastinginsulin, low HDL-C, elevated triglyceride concentrations, and a wide range of IGTs.
2.1.6. WEIGHT LOSS AND IMPROVEMENT IN RISK FACTORS
Clinically, improvements in glycemic control accompanying body weight loss arealso mirrored by improvements in plasma insulin concentrations and lipid profiles (33).In type 2 diabetics, long-term weight loss ranging from 2.3 to 13.6 kg was associatedwith significant graded improvements in fasting blood glucose, HbA1c, insulin, triglyc-erides, and HDL-C (Table 1). Weinsier et al. (34) found that 10 d of energy restriction(800 kcal/d) produced significant decreases in plasma total cholesterol, triglycerides,

Chapter 15 / Impact of Weight Reduction 389
LDL-C, and insulin (all at p < 0.05). Strong correlations existed between insulin con-centrations and triglycerides. Several reports evaluated the efficacy of very low-caloriediets in patients with type 2 diabetes (40% or more above their ideal weight) for peri-ods of 4–20 wk (35–37). Serum cholesterol and triglycerides were significantly reducedand were associated with improvements in the fasting blood glucose and glycosylatedhemoglobin. In one of these studies (36), the improvements in the lipid profiles duringactive treatment were negated because of a partial weight regain. However, the regainin weight was not of sufficient magnitude to dampen the improvements observed inglycemic control and HDL-C.
2.2. HypertensionSince the second edition of Preventive Nutrition: The Comprehensive Guide for
Health Professionals, new guidelines have been issued from the National Heart, Lung,and Blood Institute (38) based on several large-scale clinical trials. The new classifica-tion of blood pressure reduces normal blood pressure to less than 120 mmHg systolicand less than 80 mmHg diastolic and provides for a new classification for pre-HT(systolic/diastolic: 120–139/80–89 mmHg). Stage 1 HT (140–159/90–99 mmHg) (39)afflicts more than 60 million Americans and, therefore, is the most common CVD in theUnited States. The regulation of blood pressure is complex and involves the interactionof a number of mechanical and hormonal control mechanisms (40). HT from obesity isassociated with both increased cardiac output and peripheral arteriolar resistance. It alsois strongly associated with the male obesity pattern of upper body adiposity (41).
2.2.1. INCREASED RISK OF HYPERTENSION FROM OBESITY
Population comparisons indicate that HT is strongly associated with societies that alsoexhibit excess body weight. The Hypertension Detection and Follow-Up Study (42) foundthat 60% of HT participants were at least 120% of normal body weight, with BMIs ofapprox 27 kg/m2. On further analysis, this study (43) found that in the 30- to 39-yr agegroup, a threefold greater incidence of HT occurred at body weights greater than or equalto 20% of normal. A 6-yr follow-up analysis of The Multiple Risk Factor InterventionTrial (44) reported a strong independent relation between increasing BMI and systolic anddiastolic blood pressure. The most recent NHANES estimated that age-adjusted bloodpressure increases progressively with increasing BMI in both genders (ref. 9 and Fig. 4).
Table 1Metabolic Improvements in Patients With Type II Diabetes
Following Weight Loss Over 1 Yr
Before 13.6 kg 6.9–13.6 kg 2.4–6.8 kg 0–2.3 kg Weight gain
RBW% 159 121a 143a 152a 157b 164a
HbA1 (%) 9.7 7.1b 8.7a 9.8 10.4 10.6c
Glucose (mg/dL) 190 109a 162b 185 197 217c
Insulin (mU/dL) 20 2.9a 10.5c 11.8c 14.6 14.9Triglyceride (mg/dL) 195 87a 155b 165c 175 204HDL-C (mg/dL) 28.2 48.8a 41.3 40.3 38.4 39.7
p-values, a0.001, b0.01, c0.05. RBW%, relative body weight; HbA, hemoglobin A1C; HDL-C, high-density lipoprotein-cholesterol
(Reproduced with permission from ref. 33.)

390 Part IV / Diabetes and Obesity
2.2.2. EFFECTS OF WEIGHT LOSS ON BLOOD PRESSURE
The benefit of weight loss on blood pressure in obese patients with and without HThas been well-established (9,20,45). A 10-kg body weight loss in obese subjects withHT was accompanied by a significant fall in both systolic and diastolic pressures andwas associated with decreases in several cardiac parameters (e.g. heart rate, cardiac out-put, cardiopulmonary volume) (46). A meta-analysis (47) found an average fall of 6 and3 mmHg in systolic and diastolic blood pressures, respectively, with a 9-kg weight loss.Large-patient multicenter trials, the Trial of Nonpharmacologic Intervention in theElderly (TONE) (48), and the Trials of Hypertension Prevention (TOPH) (49), demon-strated significant and independent effects of weight loss on blood pressure. Elderlyindividuals maintaining a weight loss of approx 4 kg over 30 mo had significantly lowerclinical endpoints (HT, resumption of medication) than controls (48). Subjects in TOPHwho lost weight exhibited half the incidence of HT of the control group (49).
The public health impact of a small downward shift in the population distribution ofblood pressure was shown to reduce the community burden-related CVD risk (50). Inthose ages 35–64 yr, a decrease of 2 mmHg in diastolic blood pressure was estimatedto decrease the prevalence of hypertension by 17% and decrease the annual incidenceof clinically relevant coronary artery disease and stroke by 6 and 14%, respectively(50).
2.3. Cardiovascular Disease2.3.1. DYSLIPIDEMIA
Analysis of the NHANES found that serum total cholesterol levels declined in theadult US population over the last 30 yr (51). This finding suggests that the public health
Fig. 4. Age-adjusted prevalence of HT (mean systolic blood pressure ≥140 mmHg andmean diastolic ≥90 mmHg) with increasing BMI in men and women. (Reproduced fromref. 9.)

Chapter 15 / Impact of Weight Reduction 391
programs designed to lower serum cholesterol have been effective (52). However, thereis some debate regarding the relationship of serum total cholesterol and all-cause andcardiovascular mortality in women (53,54).
2.3.1.1. Obesity and Cardiovascular Risk. The relationship between obesity, CVDrisk factors, and increased risk of CHD and stroke has been demonstrated in severalobservational and prospective studies in both men and women (55–61). Analysis ofNHANES III data demonstrated the increasing prevalence of high serum total cholesterol(Fig. 5) and low HDL-C (Fig. 6) with increasing BMI (9). Using data from NHANES II,Denke et al. (58,59) found that excess body weight resulted in deleterious changes in thelipoprotein profile of both men and women. A linear trend analysis showed that increasedBMI was significantly related to elevations in serum triglycerides, total cholesterol, andLDL concentrations in both genders.
Several recent prospective analyses of the Nurses’ Health Study (55–57,60) estimatedthe risk of CHD and stroke with increased body weight in more than 121,000 women.Similar relative risks of nonfatal myocardial infarction (MI) and fatal CHD in 8-(60) and14-yr (57) follow-ups were 3.3 and 3.6, respectively, for a BMI of 29 kg/m2 or greater.Of greater interest were the changes in relative risk with body-weight gain. Women whogained 8 to 10.9 kg from age 18 yr doubled their risk of CHD and nonfatal MI whencompared to stable weight controls (57). Higher WHR and waist circumference wereindependently associated with greater CHD risk in a cohort of women ages 40 to 65 yrin the Nurses’ Health Study (55).
2.3.1.2. Obesity and the Risk of Stroke. Examination of the risk of stroke withincreasing BMI and weight change (56) in a cohort of registered nurses found thatwomen with a BMI of at least 27 kg/m2 had a significantly increased risk of ischemicstroke. Weight gain from age 18 yr was positively associated with ischemic stroke andwas 1.7 times greater in women who gained 11 to 19 kg compared to stable weightcontrols.
Fig. 5. Age-adjusted prevalence of high serum cholesterol (≥240 mg/dL) with increasingBMI in men and women. (Reproduced from ref. 9.)

392 Part IV / Diabetes and Obesity
Additional evidence for association of increases in body weight, blood lipids, bloodpressure, and mortality was provided in the Framingham Heart Study (61,62). Elevationin serum cholesterol, systolic and diastolic blood pressure, and blood glucose was posi-tively associated with increasing weight gain in both men and women. Although totalmortality did not increase until the highest quintile of BMI, CHD mortality increased lin-early with increasing BMI. Two cross-sectional studies in Swedish women and men(63,64) provided additional support for this association. In women (63), WHR was sig-nificantly and positively associated with the 12-yr incidence of MI, stroke, and death.Similar associations were present for Swedish middle-aged men (64). Central obesity asmeasured by subscapular skinfold thickness in the Honolulu Heart Program was linearlyrelated to the 12-yr incidence of CHD (65). A twofold increase in risk was estimated inthose men with the highest skinfold thickness compared to the lowest. Other CVD riskfactors also increased with increasing tertiles of subscapular skinfold thickness (Table 2).
Modest reductions in body weight are paralleled by significant improvements inplasma lipids. Several reviews of the literature (9,15,20,66) found consistent improve-ments in plasma triglycerides, total cholesterol, and LDL-C. Changes in HDL-C variedamong studies. Goldstein (15) reviewed six studies using various methods of weightreduction and found that HDL-C improved in half of these studies. The changes inHDL-C seem to be dependent on the magnitude of weight loss and gender. A 5% bodyweight loss was insufficient to raise HDL-C unless coupled with an extensive exerciseprogram (66). In a carefully controlled study to evaluate lipid and insulin changes inpostmenopausal women, Weinser et al. (34) found significant improvements in totalcholesterol, LDL-C, and triglycerides. No improvement was observed in either HDL-Cor the LDL-to-HDL ratio with weight loss of 17% of initial body weight.
2.3.2. THROMBOGENESIS
The Northwick Park Heart Study (67) established a separate role for several hemo-static factors in ischemic heart disease. Increasing levels of clotting factor VII is anindependent risk factor for CVD and is associated with obesity and elevated plasma
Fig. 6. Age-adjusted prevalence of low HDL-C (<35 mg/dL) with increasing BMI inmen and women. (Reproduced from ref. 9.)

Chapter 15 / Impact of Weight Reduction 393
triglycerides (66). Landin et al. (68) measured components of the fibrinolytic systeminvolved in the pathogenesis of CHD and atherosclerosis in matched women with glu-teo-femoral or abdominal obesity. They found increased fibrinogen and plasminogenactivator inhibitor (PAI)-1 in those obese women with a WHR of 0.8 or greater. PAI-1was strongly correlated with fasting glucose and insulin levels and negatively correlatedwith insulin sensitivity (euglycemic clamp). A reduction in PAI-1 was demonstrated withenergy restriction and weight reduction in obese patients (67).
2.4. Metabolic SyndromeThe metabolic syndrome is characterized by individuals having three or more of a
cluster of several risk factors based on IR; these risk factors were HT, IGT, hyperinsu-linemia, increased levels of triglycerides, a decreased level of HDL-C, and obesity (cen-tral adiposity). Metabolic syndrome warrants a separate section for discussion becauseof the prevalence of this condition in the US population and the recommended andproven treatments that are available. Based on analyses of the NHANES III database,Ford et al. (69) and Park et al. (70) concluded that approx 20% of adults in the US pop-ulation have this clustering of risk factors. Additionally, a staggering prevalence(28.7%; ref. 71) of overweight adolescents have the metabolic syndrome. These preva-lence figures equate to approx 1 million teenagers and 47 million adults.
Significant attention has been drawn to this syndrome with the latest NationalCholesterol Education Program (NCEP) Adult Treatment Panel III recommendations(72). The NCEP therapy strategy for reducing CVD risk is to lower LDL cholesterolbut suggests that the full benefit of risk reduction can not be visualized without mod-ification of the other metabolic risk factors attendant with this syndrome. It was con-cluded that the target therapy should also address the underlying insulin-resistantstate, which is interrelated to abdominal obesity, elevated triglycerides, loweredHDL-C, and HT.
Weight reduction and increased physical activity remains the safest and most effec-tive means to reduce insulin resistance for the overweight and obese individual (72).Ample evidence exists to support this type of intervention. The Da Qing study (73)found significant reductions in the proportional hazards ratio for the incidence in thedevelopment of diabetes ranging from 31% for diet to 42% for diet and exercisecombined. Poppitt et al. (74) placed overweight subjects with metabolic syndrome onlow-fat complex carbohydrate diets for a 6-mo period. Body weights, BMI, and waist
Table 2Associated Risk Factor and Definite CHD With Increasing Tertiles
of Subscapular Skinfold Thickness
Tertile of subscapular skinfold
Covariate Lowest Middle Highest
BMI (kg/m2) 21.2 (2.2) 24.1 (2.1) 26.3 (2.6)Total cholesterol (mg/dL) 210.1 (37.7) 220.4 (37.2) 223.6 (38.1)Glucose (mg/dL) 151.7 (52.6) 159.4 (57.2) 169.3 (62.9)Triglycerides (mg/dL) 185.1 (168.8) 250.6 (211.2) 278.8 (218.3)Incidence of CHD (no. of events) 97 161 190
Abbreviations: CHD, coronary heart disease; BMI, body mass index.(Adapted from ref. 65.)

394 Part IV / Diabetes and Obesity
circumference were significantly reduced, whereas LDL-C and triglycerides improvedin a nonsignificant manner. This diet did not prevent the further fall in HDL-C as is typ-ically seen with high-carbohydrate diets. The cumulative incidence rate of diabetes insubjects randomized to a lifestyle intervention with IGT was significantly reduced(58%) (75) compared to a control group receiving standard care. The lifestyle interven-tion provided individual guidance on increasing physical activity; approaches to reduc-ing saturated fat intake and increasing consumption of fruits, vegetables, and wholegrains; and advice on achieving at least a 5% weight loss. The Diabetes PreventionProgram (76) found significantly greater reductions in the incidence of diabetes withlifestyle changes when compared to metformin.
2.5. CancerThe rate of breast cancer has been increasing steadily in the United States and is the
second leading cause of cancer death in women (77). There is substantial evidence link-ing breast cancer to obesity, the attendant hormonal changes, and the causes of obesityitself (i.e., excess dietary fat and caloric intakes and decreased physical activity). There is,however, considerable debate over cause and effect.
2.5.1. OBESITY AND THE RISK OF BREAST CANCER
The available case–control studies and large prospective studies are at variance overthe association of BMI and breast cancer (78). Of 13 case–control studies, 12 found arelative risk greater than 1 in postmenopausal women when the highest BMI (>32kg/m2) was compared to the lowest BMI (≤19 kg/m2). However, large prospective stud-ies did not support this relationship. The authors (78) cited a large Norwegian study inwhich the observed relative risk of 1.2 for a 10 kg/m2 increase in Quetelet’s index wasconsidered insignificant given the large BMI change.
Reviewing the associations between site-specific cancers and several anthropometrymeasures, Ballard-Barbash (79) concluded that the observed associations for weight gainafter age 18 yr and central body fat exhibit stronger associations than weight or BMI.Because developed societies have a more sedentary lifestyle and a higher caloric intake,weight gain and increased fat mass, especially visceral, are better predictors of breastcancer. Most—but not all—studies have shown a doubling of breast cancer risk withexpanding stores of visceral fat in postmenopausal, but not premenopausal, women (79).
As stated earlier, obesity can be caused by diet (excess energy intake) and/ordecreased physical activity. The evidence for the role of diet is beyond the scope of thischapter, but the controversy that exists is worth mentioning. Hunter and Willett (78)critically evaluated the strength of the studies implicating the amount of dietary fat asa major factor in breast cancer incidence. The strongest evidence was produced bystudies based on national food disappearance estimates and those based on dietaryrecall. In contrast, several large prospective studies, which are not subject to recallbias, found no relation to breast cancer (RR ≤ 1) when the highest deciles of total fatintake were compared to the lowest. A recent analysis of the Nurses’ Health Study (80)found no difference in relative risk for breast cancer in subjects consuming 20%dietary fat compared to those consuming 30 to 35%. relative risk did not differ for typeof fat consumed.
A central debate also concerns the relative carcinogenic effect of individual fattyacids vs the energy content of fat intake. Excess fat calories could promote primary

Chapter 15 / Impact of Weight Reduction 395
breast cancer by expanding centrally located adipose tissue, which in turn couldincrease the levels of circulating estrogens (higher conversion of adrenal androgens toestrone in female adipose tissue). The increased levels of estrogens have been impli-cated in the etiology of some breast and reproductive cancers (i.e., endometrial cancer)(81,82). Recent studies have also implicated insulin and insulin-like growth factors,which are elevated in obesity, as promoting tumor growth directly or indirectly by theiractions on estrogen and estrogen receptors (79).
The evidence for a relationship between specific fatty acids or classes of triglyceridesand breast cancer is equivocal. In a pooled analysis of case–control studies, the overallassociation of breast cancer with total fat was related to saturated fat intake. However,a pooled analysis of several large prospective studies found no relation of an increasedrisk (83). Case––control and prospective cohort studies failed to find a relationship withbreast cancer (83) for specific fatty acids, that is, long-chain n-3 fatty acids and 18:2n-6 (linoleic acid).
2.5.2. BREAST CANCER SURVIVAL AND OBESITY
Once breast cancer is diagnosed, women with higher BMIs exhibited poorer survivalrates and increased recurrence of disease. In large-population cohorts, obese women withstage I or II disease had an increased risk of dying from breast cancer (70 and 40%,respectively [79]). Obesity is also associated with more advanced cancers at the time ofdiagnosis. In Dutch women, a greater incidence of metastatic disease in auxillary nodeswas associated with significantly heavier body weights in the 50- to 69-yr age group (77).
The data suggest that adult weight gain, whatever the cause, is associated withgreater risks of breast cancer and that the extent of the disease is more highly pro-nounced in patients with the highest quintile of BMI.
2.5.3. WEIGHT LOSS AND CANCER
No prospective human trials have been conducted for to demonstrate a reduction inrisk of cancer from weight loss maintenance. However, Calle et al. (84), in a prospec-tively studied cohort, recently reported a significant association between weight prob-lems and obesity and risk of death from all cancers. These authors estimated that withmaintenance of a normal body weight, 90,000 deaths could be prevented in the UnitedStates each year.
3. INTERVENTION THERAPIES: MANAGEMENT OF OBESEPATIENTS
A review of clinical studies concerning diet and diet plus increased physical activitydemonstrated successful 1- to 2-yr weight loss ranging from 5 to 13% (9). In these stud-ies, reductions in plasma lipids ranged from 0 to −18% for total cholesterol, −2 to −44%for triglycerides, −2 to −22% for LDL-C, and −7 to 27% for HDL-C.
Significant reductions in diameter stenosis of coronary arteries occurred in patientswho made intensive lifestyle changes (diet, physical activity, stress management, andsmoking cessation) when compared to controls who did not make lifestyle changes(−5.3 vs 2.7%) (85). Associated risk factors, BMI, serum total cholesterol, and LDL-Cwere significantly reduced. A 5-yr follow-up of these patients (86) showed continuedimprovement in regression of stenosis in the intervention group and worsening of thestenosis in the control group (−7.9 vs 27.7%).

396 Part IV / Diabetes and Obesity
A 10-wk multicenter trial (87) compared a prepackaged meal program based on theNational Academy of Science-National Research Council (NAS-NRC) dietary recom-mendations to a self-selection diet based on the American Heart Association (AHA)Step I/II diets in 560 patients suffering from dyslipidemia, HT, or diabetes. Weight losswas significant for both groups (−4.7 kg for the NAS-NRC diet and −3.2 kg for theAHA diet) and was accompanied by significant reductions in major CVD risk factors(blood pressure, total cholesterol, glycemic control, and blood lipids). Similar findingsin key risk factors occurred in a group of patients identified with acute MI or unstableangina (88). After 1 yr, those patients randomized to a low-fat high-fruit, grain, and veg-etable diet lost 6.3 kg of body weight and had significantly decreased cardiac events andmortality when compared to those patients in a control group, who were simply advisedto follow a low-fat diet (see Chapter 12).
Improvement in health risk associated with long-term weight loss was studied byDitschuneit et al. (89) in a randomized, controlled trial. These authors reported on a2-yr follow-up of 100 obese patients (average BMI: 33 kg/m2). Average weight loss ofpatients randomized to a traditional low-calorie diet group was 1.3 kg, with no improve-ments in markers of disease risk over the first 3 mo. By contrast, the group receivingthe same prescribed calorie intake but that had two meals replaced with a Slim·Fast®
liquid meal replacement lost an average of 7.1 kg. These patients showed significantimprovements in blood pressure, plasma insulin, glucose, and triglyceride concentra-tions. A 24-mo follow-up of patients replacing an average of one meal per day with aSlim·Fast meal replacement demonstrated continued improvement in these biomarkers,with associated weight losses of 5 to 11.5% of their initial body weight. The authors fol-lowed these patients for another 2 yr (90) and found sustained weight loss and mainte-nance of the improvements in biomarkers.
The use of gastric bypass surgery (30) as a primary method for weight loss (10 yr) inmorbidly obese patients is also instructive. In addition to the improvements in glycemiccontrol, the sustained weight loss also corrected or alleviated a number of other comor-bid conditions associated with obesity (e.g., HT, sleep apnea, arthritis, cardiopulmonaryfailure, and infertility).
4. SUMMARY, CONCLUSIONS, AND RECOMMENDATIONS
The short-term and intermediate benefits of weight loss in the obese have been well-established (9). Improvements in glycemic control in patients with type 2 diabetes occurearly in the weight-loss regimen and mostly result from a reduction in calories ingested(29,30).
Weight losses of 5 to 15% of initial body weight are beneficial for the reduction ofCVD risk factors (66). Cardiac patients making major lifestyle changes showed signif-icant regression in aortic stenosis and cardiac events (85–88). A program of reduceddietary fat intake, smoking cessation, stress management, and increased physical activ-ity were essential to the improvements observed. It is difficult to isolate the individualimpact that each of these changes had; however, the decrease in BMI in these patientswas consistent with improvements in several of the risk factors.
Although it is obvious that weight loss will reduce risk factors for disease, the rela-tionship to mortality remains tentative. The published conclusions discussed earlier in thischapter are troublesome because they suggest that the greater majority of individuals who

Chapter 15 / Impact of Weight Reduction 397
attempt weight loss may be at an increased risk for all-cause mortality. Furthermore, theyimply that the assumption that weight loss improves the risk of mortality may not be asclear-cut as a simple reduction of risk factors (91).
However, insight can be gained from clinical trials demonstrating improvements inCHD mortality with reductions in blood lipids. In a review of 22 clinical trials on cho-lesterol reduction (92), there was a 23% risk reduction in CHD events (nonfatal MI andcardiac death). A meta-analysis of six primary prevention trials found mortality fromCHD tended to be lower in men receiving interventions to reduce cholesterol. Whenanalyzed separately, a significant decrease in mortality was found in each study (93).The Scandinavian Simvastin Survival Study (94) showed significant improvement inlipid profiles in patients taking the drug. During 6 yr of follow-up, there were signifi-cantly more coronary deaths in the placebo group compared to the Simvastin group(189 vs 111, RR of 0.58). Therefore, the reduction of blood lipids that occurs withweight loss should provide similar changes in CHD risk.
Williamson’s (17) 12-yr prospective study on weight loss and mortality added sig-nificantly to the expectation that weight loss, via improvements in risk factors, willimprove mortality. Women with obesity-related comorbidities showed significantreductions in all-cause and diabetes-related mortality with weight loss. Preliminary evi-dence from this study suggest the same results for men (9). Although it is recognizedthat there is limited data supporting improved mortality rates with weight loss (95), thepositive changes in biomarkers for disease risk justifies the public health objective toreduce the weight of the nation.
Recently, the National Institutes of Health (9) created a panel to assess the scientificliterature regarding the severity of the medical problem and the benefits to weight loss.Based on the evidence, the panel concluded that obesity is a major public health prob-lem that can, and should be, addressed. The panel further established the evidence-based guidelines to help physicians and associated health professionals manage theoverweight and obese patient (9).
REFERENCES1. The Surgeon General’s Report on Nutrition and Health. DHHS (PHS) Publ No. 88-50210
Washington DC, 1988.2. The Surgeon General’s Call to Action to Prevent and Decrease Obesity 2001. DHHS (PHS)
Washington DC, 2001.3. WHO Technical Report Series 916. Diet, Nutrition ad the Prevention of Chronic Diseases. World
Health Organization, 2003.4. Flegal KM, Carroll MD, Ogden CL, Johnson CL. Prevalence and trends in obesity among US adults,
1999–2000. JAMA 2002; 288:1723–1727.5. Flegal KM, Carroll MD, Kuczmarski RJ, Johnson CL. Overweight and obesity in the United States:
prevalence and trends, 1960-1994. Int J Obes 1998; 22:39–47.6. Troiano RP, Flegal KM, Kuczmarski RJ, Campbell SM, Johnson CL. Overweight prevalence and
trends for children and adolescents. Arch Pediatr Adolesc Med 1995; 149:1085–1091.7. Ogden CL, Flegal KM, Carroll MD, Johnson CL. Prevalence and trends in overweight among US
children and adolescents, 1999–2000. JAMA 2002; 288:1728–1732.8. Wolf AM, Colditz GA. Current estimates of the economic cost of obesity in the United States. Obes
Res 1998; 6:97–106.9. National Heart, Lung, and Blood Institute. NIH. Clinical guidelines on the identification, evaluation,
and treatment of overweight and obesity in adults. Obes Res 1998; 6(2):51S–180S.10. Bender R, Jöckel KH, Trautner C, Spraul M, Berger M. Effect of age on excess mortality in obesity.
JAMA 1999; 281:1498–1504.

398 Part IV / Diabetes and Obesity
11. Williamson DF, Pamuk ER. The association between weight loss and increased longevity. Ann InternMed 1993; 119:732–736.
12. Andres R, Muller DC, Sorkin JD. Long-term effects of change in body weight on all-cause mortal-ity. Ann Intern Med 1993; 119:737–743.
13. Williamson DF. “Weight cycling” and mortality: how do the epidemiologists explain the role ofintentional weight loss. J Am Coll Nutr 1996; 15:6–13.
14. Lean MEJ, Powrie JK, Anderson AS, Garthwaite PH. Obesity, weight loss and prognosis in type 2diabetes. Diabetic Med 1990; 7:228–233.
15. Goldstein DJ. Beneficial health effects of modest weight loss. Int J Obes 1992; 16:397–415.16. Fontaine KR, Redden DT, Wang C, Westfall AO, Allison DB. Years of life lost due to obesity. JAMA
2003; 289:187–193.17. Williamson DF, Pamuk E, Thun M, Flanders D, Byers T, Heath C. Prospective study of intentional
weight loss and mortality in never-smoking overweight US white women aged 40–64 years. Am JEpidemiol 1995; 141:1128–1141.
18. Blake GH. Control of type II diabetes: reaping the rewards of exercise and weight loss. PostGradMed 1992; 92:129–137.
19. Ohlson L, Larrson B, Eriksson H, Svärdsudd K, Welin L, Tibblin G. Diabetes mellitus in Swedishmiddle-aged men: the study of men born in 1913 and 1923. Diabetologia 1987; 30:386–393.
20. Pi-Sunyer FX. Short-term medical benefits and adverse effects of weight loss. Am Coll Phys 1993;119:722–726.
21. Randle PJ, Garland PB, Hales CN, Newsholme EA. The glucose fatty-acid cycle. Its role in insulinsensitivity and the metabolic disturbances of diabetes mellitus. Lancet 1963; 21:785–789.
22. Campbell PJ, Gerich JE. Impact of obesity on insulin action in volunteers with normal glucose tol-erance: demonstration of a threshold for the adverse effect of obesity. J Clin Endocrinol Metab 1990;70:1114–1118.
23. Campbell PJ, Carlson MG. Impact of obesity on insulin action in NIDDM. Diabetes 1993;42:405–410.
24. Lundgren H, Bengtsson C, Blohme G, Lapidus L, Sjöström L. Adiposity and adipose tissue distrib-ution in relation to incidence of diabetes in women: results from a prospective population study inGothenberg, Sweden. Int J Obes 1987; 13:413–423.
25. Ohlson LO, Larsson B, Svardsudd K, et al. The influence of body fat distribution on the incidenceof diabetes mellitus. Diabetes 1985; 34:1055–1058.
26. Cassano PA, Rosner B, Vokonas PS, Weiss ST. Obesity and body fat distribution in relation to theincidence of non-insulin-dependent diabetes mellitus. Am J Epidemiol 1992; 136:1474–1486.
27. Syvänne M, Taskinen MR. Lipids and lipoproteins as coronary risk factors in non-insulin-dependentdiabetes mellitus. Lancet 1997; 350:20–23.
28. Nathan DM, Meigs J, Singer DE. The epidemiology of cardiovascular disease in type 2 diabetesmellitus: how sweet it is…or is it? Lancet 1997; 350:4–9.
29. Wing RR, Blair EH, Bononi P, Marcus MD, Watanabe R, Bergman RN. Caloric restriction per se isa significant factor in improvements in glycemic control and insulin sensitivity during weight lossin obese NIDDM patients. Diabetes Care 1994; 17:30–36.
30. Pories WJ, Swanson MS, MacDonald MD, et al. Who would have thought it? An operation provesto be the most effective therapy for adult-onset diabetes mellitus. Ann Surgery 1995; 222:339–352.
31. Singer DE, Nathan DM, Anderson KM, Wilson PW, Evans JC. Association of HbA1c with prevalentcardiovascular disease in the original cohort of the Framingham Heart Study. Diabetes 1992;41:202–208.
32. Meigs JB, Singer DE, Nathan DM, Cupples LA, Wilson P WF. Metabolic abnormalities associatedwith glucose intolerance extend across the spectrum of prevalent glucose tolerance in 3297Framingham offspring study subjects. Diabetes 1995; 44:5A.
33. Bosello O, Armellini F, Zamboni M, Fitchet M. The benefits of modest weight loss in type II dia-betes. Int J Obes 1997; 21:S10–S13.
34. Weinsier RL, James D, Darnell BE, Wooldrigde NH, Birch R, Hunter GR, Bartolucci AA. Lipid andinsulin concentrations in obese postmenopausal women: separate effects of energy restriction andweight loss. Am J Clin Nutr 1992; 56:44–49.
35. Inoue S, Okamura A, Okamoto M, Tanaka K, Sugimasa T, Takamura Y. Effects of very low caloriediet (VLCD) on body weight, blood glucose and serum lipid metabolism in severe obesity withglucose intolerance. Int J Obes 1989; 13:183,184.

Chapter 15 / Impact of Weight Reduction 399
36. Wing RR, Marcus MD, Salata R, Epstein LH, Miaskiewicz S, Blair EH. Effects of a very-low-calorie dieton long-term glycemic control in obese type 2 diabetic subjects. Arch Intern Med 1991; 151:1334–1340.
37. Uusitupa M, Laakso M, Sarlund H, Majander H, Takala J, Penttilä I. Effects of a very-low-caloriediet on metabolic control and cardiovascular risk factors in the treatment of obese non-insulin-dependent diabetics. Am J Clin Nutr 1990; 51:768–73.
38. The Seventh Report of the Joint National Committee on prevention, detection, evaluation, and treat-ment of high blood pressure. JAMA 289:2560–2093.
39. 1984 Joint National Committee. The 1984 report of the Joint National Committee on the detection,evaluation, and treatment of high blood pressure. Arch Int Med 1984; 144:1045–1057.
40. Frolich ED. Mechansisms contributing to high blood pressure. Ann Int Med 1983; 98:709–714.41. Bray GA. Obesity, in Present Knowledge in Nutrition In: Ziegler EE, Filer LJ, eds. ILSI Press,
Washington, DC, 1996, pp. 19–32.42. Hypertension Detection and Follow-Up Program Cooperative Group. Race education and preva-
lence of hypertension. Am J Epidemiol 1977; 106:351–361.43. Havlik RJ, Hubert HB, Fabsitz RR, Feinleib M. Weight and hypertension. Ann Intern Med 1983;
98:855–859.44. Stamler J, Caggiula AW, Grandits GA. Relation of body mass and alcohol, nutrient, fiber and caf-
feine intakes to blood pressure in the special intervention and usual care groups in the multiple riskfactor intervention trial. Am J Clin Nutr 1997; 65:338S–365S.
45. Björntorp P. Obesity. Lancet 1997; 350:423–426.46. Reisin E, Frohlich ED, Messerli FH, et al. Cardiovascular changes after weight reduction in obesity
hypertension. Ann Intern Med 1983; 98:315–319.47. MacMahon S, Cutler J, Brittain E, Higgins M. Obesity and hypertension: epidemiological and clin-
ical issues. Euro Heart J 1987; 8:57–70.48. Whelton PK, Appel LJ, Espeland MA, et al Sodium reduction and weight loss in the treatment of
hypertension in older persons: a randomized controlled trial of nonpharmacologic interventions inthe elderly. JAMA 1998; 279:839–846.
49. Whelton PK, Kumanyika SK, Cook NR, et al. Efficacy of nonpharmacologic interventions in adultswith high-normal blood pressure: results from phase 1 of the Trials of Hypertension Prevention. AmJ Clin Nutr 1997; 65:652S–660S.
50. Cook NR, Jerome C, Hebert PR, Taylor JO, Hennekens CH. Implications of small reductions in dias-tolic blood pressure for primary prevention. Arch Intern Med 1995; 155:701–709.
51. Johnson CL, Rifkind BM, Sempos CT, et al. Declining serum total cholesterol levels among USadults. JAMA 1993; 269:3002–3008.
52. Expert Panel on Detection, Evaluation, and Treatment of High Blood Pressure in Adults. Summaryof the second report of the National Cholesterol Education Program (NCEP) Expert Panel on detec-tion, evaluation, and treatment of high blood cholesterol in adults (adult treatment panel II) JAMA1993; 269:3015–3023.
53. Jacobs D, Blackburn H, Higgins M, et al. Report of the conference on low blood cholesterol: mor-tality associations. Circulation 1992; 86:1046–1060.
54. Hulley SB, Walsh JMB, Newman TB. Health policy on blood cholesterol: time to change directions.Circulation 1992; 86:1026–1029.
55. Rexrode KM, Carey VJ, Hennekens CH, et al. Abdominal adiposity and coronary heart disease inwomen. JAMA 1998; 280:1843–1848.
56. Rexrode KM, Hennekens CH, Willett WC, et al. A prospective study of body mass index, weightchange, and risk of stroke in women. JAMA 1997; 277:1539–1545.
57. Willett WC, Manson JE, Stampfer MJ, et alWeight, weight change, and coronary heart disease inwomen. JAMA. 1995; 273:461–464.
58. Denke MA, Sempos CT, Grundy SM. Excess body weight: an under-recognized contributor to dys-lipidemia in white American women. Arch Intern Med 1994; 154:401–410.
59. Denke MA, Sempos CT, Grundy SM. Excess body weight: an under-recognized contributor to highblood cholesterol levels in white American men. Arch Intern Med 1993; 153:1093–1103.
60. Manson JE, Colditz GA, Stampfer MJ, et al. A prospective study of obesity and risk of coronaryheart disease in women. N Engl J Med 1990; 322:882–889.
61. Higgins M, Kannel W, Garrison R, Pinsky J, Stokes III J. Hazards of obesity - the Framingham expe-rience. Acta Med Scand 1988; 723:23–36.

400 Part IV / Diabetes and Obesity
62. Hubert HB, Feinleib M, McNamara PM, Castelli WP. Obesity as an independent risk factor for car-diovascular disease: a 26-year follow-up of participants in the Framingham Heart Study. Circulation1983; 67:968–976.
63. Lapidus L, Bengtsson C, Larsson B, Pennert K, Rybo E, Sjostrom L. Distribution of adipose tissueand risk of cardiovascular disease and death: a 12 year follow up of participants in the populationstudy of women in Gothenburg, Sweden. Br Med J 1984; 289:1257–1261.
64. Larsson B, Svärdsudd K, Welin L, Wilhlemsen L, Björntorp P, Tibblin G. Abdominal adipose tissuedistribution, obesity, and risk of cardiovascular disease and death: 13 year follow up of participantsin the study of men born in 1913. Br Med J 1984; 288:1401–1404.
65. Donahue RP, Bloom E, Yano K, Abbott RD, Reed DM. Central obesity and coronary heart diseasein men. Lancet 1987; 2:821–824.
66. Van Gaal LF, Wauters MA, De Leeuw IH. The beneficial effects of modest weight loss on cardio-vascular risk factors. Int J Obes 1997; 21:S5–S9.
67. Meade TW, Brozovic M, Chakrabarti RR, et al. Haemostatic function and ischaemic heart disease:principal results of the Northwick Park heart study. Lancet 1986; 2:533–537.
68. Landin K, Stigendal L, Eridsson E, et al. Abdominal obesity is associated with an impaired fibri-nolytic activity and elevated plasminogen activator inhibitor-1. Metabolism 1990; 39:1044–1048.
69. Ford ES, Giles WH, Dietz WH. Prevalence of the metabolic syndrome among US adults. JAMA2002; 287:356–359.
70. Park Y-W, Zhu S, Palaniappan L, Heshka S, Carnethon MR, Heymsfield SB. The metabolic syn-drome. Arch Intern Med 2003; 163:427–436.
71. Cook S, Weitzman M Auinger P, Nguyen M, Dietz WH. Prevalence of the metabolic syndrome phe-notype in adolescents. Arch Pediatr Adolesc Med 2003; 157:821–827.
72. National Heart, Lung, and Blood Institute, NIH. Detection, Evaluation, and Treatment of High BloodCholesterol in Adults (Adult Treatment Panel III) – Final Report. NIH Publ No 02-5215, 2002.
73. The Da Qing IGT and Diabetes Study. Effects of diet and exercise in preventing NIDDM in peoplewith impaired glucose tolerance. Diabetes Care 1997; 20:537–544.
74. Poppitt SD, Keogh GF, Prentice AM, et al. Long-term effects of ad libitum low-fat, diets on bodyweight and serum lipids in overweight subjects with metabolic syndrome. Am J Clin Nutr 2002;75:11–20.
75. Tuomilehto J, Lindstrom J, Eriksson JG, et al. Prevention of type 2 diabetes mellitus by changes inlifestyle among subjects with impaired glucose tolerance. N Engl J Med 2001; 344:1343–1350.
76. Diabetes Prevention Program Research Group. Reduction in the incidence of type 2 diabetes withlifestyle intervention or metformin. N Engl J Med 2002; 346:393–403.
77. Nixon DW, Rodgers K. Breast Cancer. In: Heber D, Blackburn GL, Go VLW, eds. NutritionalOncology Academic Press, New York. 1999, pp. 447–451.
78. Hunter DJ, Willett WC. Diet, body build, and breast cancer. Ann Rev Nutr 1994; 14:393–418.79. Ballard-Barbash R. Energy Balance, Anthropometry, and Cancer. In: Heber D, Blackburn GL, Go
VLW, eds. Nutritional Oncology Academic Press, New York, 1999, pp. 137–151.80. Holmes MD, Hunter DJ, Colditz GA, et al. Association of dietary intake of fat and fatty acids with
risk of breast cancer. JAMA 1999; 281:914–920.81. Bjöntorp P. The associations between obesity, adipose tissue distribution and disease. Acta Med
Scand 1988; 723:121–134.82. Heber D, Blackburn G, Go VLW. Introduction: The Principles of Nutritional Oncology. In: Heber D,
Blackburn GL, Go VLW, eds. Nutritional Oncology. Academic Press, New York, 1999, pp. 1–4.83. Willett WC. Specific fatty acids and risks of breast and prostate cancer: dietary intake. Am J Clin
Nutr 1997; 66:1557S–1563S.84. Calle EE, Rodriguez C, Walker-Thurmond K, Thun MJ Overweight, obesity, and mortality from
cancer in a propectively studied cohort of US adults. N Engl J Med 2003; 348:1625–1638.85. Ornish D, Brown SE, Scherwitz LW, et al. Can lifestyle changes reverse coronary heart disease?
Lancet 1990; 336:129–133.86. Ornish D, Scherwitz LW, Billings JH, et al. Intensive lifestyle changes for reversal of coronary heart
disease. JAMA 1998; 280:2001–2007.87. McCarron DA, Oparil S, Chait A, et al. Nutritional management of cardiovascular risk factors. Arch
Intern Med 1997; 157:169–177.88. Singh RB, Rastogi SS., Verma R, et al. Randomised controlled trial of cardioprotective diet in patients
with recent acute myocardial infarction: results of one year follow up. BMJ 1992; 304:1015–1019.

Chapter 15 / Impact of Weight Reduction 401
89. Ditschuneit HH, Flechtner-Mors M, Johnson TD, Adler G. Metabolic and weight-loss effects of along-term dietary intervention in obese patients. Am J Clin Nutr 1999; 69:198–204.
90. Ditschuneit HH, Flechtner-Mors M, Adler G. The effectiveness of meal replacement with diet shakeson long-term weight loss and weight maintenance. Int J Obes 1998; 22:S13.
91. Kassirer JP, Angell M. Losing weight—an ill fated New Year’s resolution. N Engl J Med 1998;338:52–54.
92. Yusuf S, Wittes J, Friedman L. Overview of the results of randomized clinical trials in heart disease.II. Unstable angina, heart failure, primary prevention with aspirin, and risk factor modification.JAMA 1988; 260:2259–2263.
93. Muldoon MF, Manuck SB, Matthews KA. Lowering cholesterol concentrations and mortality: aquantitative review of primary prevention trials. BMJ 1990; 301:309–314.
94. Scandinavian Simvastin Survival Group. Randomized trial of cholesterol lowering in 4444 patientswith coronary heart disease: the Scandinavian Simvastin Survival Study (4S). Lancet 1994;344:1383–1389.
95. Willett WC, Dietz WH, Coditz GA. Guidelines for healthy weight. NEJM 1999; 341:427–434.


V BONE DISEASES


From: Preventive Nutrition: The Comprehensive Guide for Health Professionals, Third EditionEdited by: A. Bendich and R. J. Deckelbaum © Humana Press Inc., Totowa, NJ
405
16 OsteoarthritisRole of Nutrition and Dietary SupplementInterventions
Timothy E. McAlindon
KEY POINTS
● Although there are numerous mechanisms by which micronutrients can be expected toinfluence the development of osteoarthritis (OA), there has been insufficient research todraw definitive conclusions.
● The strongest evidence points to a possible protective effect of vitamin D in the devel-opment of hip OA and the progression of knee OA.
● One observational study suggested a protective effect of vitamin C for progression ofknee OA. Because intake of vitamin E and β-carotene bore no relationship to OA inci-dence or progression in that study, the mechanism of benefit of vitamin C may be medi-ated through nonantioxidant properties.
● Clinical trials of vitamins E, C, and A and selenium have produced negative or incon-sistent results.
● There have been numerous positive clinical trials of glucosamine and chondroitin prod-ucts for OA. Issues of biological plausibility, publication bias, and methodologicalproblems cloud interpretation of these trials.
1. INTRODUCTION: OSTEOARTHRITIS
Osteoarthritis (OA) is the most common form of joint disease and is a leading causeof disability in the elderly. The disease commonly affects the hands, spine, knees, andhips. Multiple joints may be affected in any one individual. OA is strongly associatedwith increasing age and has been estimated to affect between 2 and 10% of alladults (1,2). It is responsible for some 68 million days of work loss per year and morethan 5% of the annual retirement rate (3). Furthermore, OA is the most frequent reasonfor joint replacement, at a cost to the community of billions of dollars per year (4).
Focal cartilage damage is the central feature of OA (5). This may range in severityfrom minor surface roughening to complete erosion of cartilage. The process is generally

406 Part V / Bone Diseases
noninflammatory and is often described as being “degenerative” or caused by “wear-and-tear.” The cartilage damage usually is accompanied by some form of “reaction” inthe surrounding bone. Osteophytes are an early bony response to cartilage damage.These consist of outgrowths of bone from the peripheral margin of the joint. They mayconfer some protection to an OA joint by reducing instability (6). The trabeculae in thebone adjacent to an area of OA cartilage become thickened and are susceptible tomicroscopic fracturing. This gives rise to the appearance of “subchondral sclerosis” ona radiograph. In severe disease, particularly where full thickness cartilage has occurred,circumscribed areas of bony necrosis may develop in the subchondral bone. These maybe filled with marrow fat or with synovial fluid that has tracked from the joint spacethrough the cartilage defect into the subchondral bone. They give rise to the radiographicalappearance of cysts. Ultimately, the subchondral bone itself may be eroded or maycollapse. In some cases, a low-level synovitis develops because of the presence of crystalor other cartilaginous “detritus,” which may contribute to damage in the joint.
Biochemically, cartilage consists of a network of collagen fibrils (predominantlytype II), which constrain an interlocking mesh of proteoglycans that resist compressiveforces through their affinity for water. The tissue is relatively avascular and acellular.Turnover in healthy cartilage is slow and represents a balance between collagen andproteoglycan synthesis and degradation by enzymes such as metalloproteinases. Inearly OA, the chondrocytes (cartilage cells) proliferate and become metabolicallyactive. These hypertrophic chondrocytes produce cytokines (e.g., interleukin [IL]-1,tumor necrosis factor [TNF]-α), degradative enzymes (e.g., metalloproteinases), andother growth factors. Proteoglycan production is increased in early osteoarthritis butfalls sharply at a later stage when the chondrocyte “fails.”
2. RISK FACTORS FOR OSTEOARTHRITIS
The striking relationship of OA with increasing age and heavy physical work has ledto its characterization as a degenerative or wear-and-tear disorder (1). In fact, this par-adigm is inaccurate, because a variety of mechanical, metabolic, and genetic disordersmay lead to OA (7). Thus, there is increasing recognition that OA should be regardedas joint failure, analogous to any other organ failure (8). Established risk factors for OAare listed in Table 1.
3. OSTEOARTHRITIS AND DIET
There is enormous public interest in the relationship between diet and arthritis.Questions regarding nutrition and supplements are among the most frequent posed tophysicians by people with OA. Speculative lay publications on this subject abound, andhealth food stores are full of nutritional supplements touted for their putative ability tohelp those who suffer from arthritis (9).
In contrast, there has been relatively little focus in traditional scientific studies onthe relationship between nutritional factors (other than obesity) and OA. Furthermore,the traditional physician stance regarding this issue has been to assert the lack of evi-dence supporting any association between diet and OA. This gulf between the levels ofinterest among scientists and among the general public is surprising given the largenumbers of studies regarding osteoporosis, another widespread age-related skeletal dis-order, which have shown widely accepted associations with dietary factors. However,

Chapter 16 / Osteoarthritis 407
a more important reason to study the relationship between dietary factors and OA is thatthere are many mechanisms by which certain micronutrients can be hypothesized toinfluence OA processes. Furthermore, there have been several recent studies that haveshown apparent effects of various micronutrients on the natural history of this disorder.
4. MECHANISMS THROUGH WHICH MICRONUTRIENTS CAN BEHYPOTHESIZED TO INFLUENCE OSTEOARTHRITIS PROCESSES
4.1. Antioxidant EffectsThere is considerable evidence that continuous exposure to oxidants contributes to
the development or exacerbation of many of the common human diseases associatedwith aging (10). Such oxidative damage accumulates with age and has been implicatedin the pathophysiology of cataracts (11), coronary artery disease (CAD [12]), and cer-tain forms of cancer (13). As the prototypical age-related degenerative disease, OA mayalso be, in part, a product of oxidative damage to articular tissues.
Reactive oxygen species are chemicals with unpaired electrons. These are formedcontinuously in tissues by endogenous and some exogenous mechanisms (10). Forexample, it has been estimated that 1–2% of all electrons that travel down the mito-chondrial respiratory chain leak, forming a superoxide anion (O2
•–) (14). Other endoge-nous sources include release by phagocytes during the oxidative burst, generation bymixed-function oxidase enzymes, and hypoxia-reperfusion events (15). Reactive oxy-gen species are capable of causing damage to many macromolecules, including cellmembranes, lipoproteins, proteins, and DNA (16). Because these reactive oxygenspecies are identical to those generated by irradiation of H2O, “living” has been likenedto being continuously irradiated (10).
Furthermore, there is evidence that cells within joints produce reactive oxygen speciesand that oxidative damage is physiologically important (17). In laboratory studies, animaland human chondrocytes were found to be potent sources of reactive oxygen species(17,18). Hydrogen peroxide production was demonstrated in aged human chondrocytesafter exposure to the proinflammatory cytokines, IL-1, and TNF-α, and also was observedin live cartilage tissue (19). Superoxide anions were shown to adversely affect collagen
Table 1Factors Associated With Osteoarthritis
Constitutional factorsIncreased ageFemale genderObesity
Mechanical factorsHeavy/repetitive occupationsHeavy physical activityMajor joint injury
Endocrine factorsHemachromatosis
Genetic factorsMutations in the type II collagen gene

408 Part V / Bone Diseases
structure and integrity in vitro and appear to be responsible in vivo for depolymeriza-tion of synovial fluid hyaluronate (18–21). Furthermore, patients with cartilage and/ormeniscal damage associated with OA had increased levels of reactive oxygen speciesand nitric oxide compared with controls (22).
In fact, the human body has extensive and multilayered antioxidant defense systems(10). Intracellular defense is primarily provided by antioxidant enzymes, including super-oxide dismutase, catalase, and peroxidases. In addition to these enzymes, there are a numberof small molecule antioxidants that play an important role, particularly in the extracel-lular space, where antioxidant enzymes are sparse (23). These include the micronutrientsα-tocopherol (vitamin E), β-carotene (a vitamin A precursor), other carotenoids, and ascor-bate (vitamin C). The concentrations of these antioxidants in the blood primarily aredetermined by dietary intake. The concept that micronutrient antioxidants might providefurther defense against tissue injury when intracellular enzymes are overwhelmed has ledto the hypothesis that high dietary intake of these micronutrients might protect againstage-related disorders. Because higher intake of dietary antioxidants appears to be bene-ficial regarding outcomes such as cataract extraction and CAD (11–13,24), it is alsoplausible that they may confer similar benefits for OA.
4.2. Effects on Collagen MetabolismIn addition to being an antioxidant, vitamin C plays several functions in the biosyn-
thesis of cartilage molecules. First, through the vitamin C-dependent enzyme lysylhy-droxylase, vitamin C is required for the posttranslational hydroxylation of specificprolyl and lysyl residues in procollagen—a modification essential for stabilization ofthe mature collagen fibril (11–13,24–26). Vitamin C also appears to stimulate collagenbiosynthesis by pathways independent of hydroxylation, perhaps through lipid peroxi-dation (27). In addition, by acting as a carrier of sulfate groups, vitamin C participatesin glycosaminoglycan synthesis (28). Therefore, relative deficiency of vitamin C mayimpair not only the production of cartilage but also its biomechanical quality.
The results of in vitro and in vivo studies are concordant with this possibility. Studies ofadult bovine chondrocytes showed that addition of ascorbate to the tissue culture results indecreased levels of degradative enzymes and increased synthesis of type II collagen andproteoglycans (28,29). Peterkovsky et al. (30) observed decreased synthesis of cartilagecollagen and proteoglycan molecules in guinea pigs deprived of vitamin C. They alsoreported high levels of insulin-like growth factor (IGF)-1 binding proteins, which normallyinhibit the anabolic effects of IGF-1, a potent growth factor. This suggests that vitamin Cmay also influence growth factors through pathways that remain to be elucidated.
4.3. Effects on Chondrocyte MetabolismVitamin D might have direct effects on chondrocytes in OA cartilage. During bone
growth, vitamin D regulates the transition from growth plate cartilage to bone.Normally, chondrocytes in developing bone lose their vitamin D receptors with theattainment of skeletal maturity. However, it recently has become apparent that thehypertrophic chondrocytes in OA cartilage can redevelop vitamin D receptors (31).These chondrocytes are metabolically active and appear to play an important role in thepathophysiology of OA (32). Although this evidence is indirect, it raises the possibilitythat vitamin D may influence the pathological processes in OA through effects onthese cells.

Chapter 16 / Osteoarthritis 409
4.4. Effects on BoneReactive changes in the bone underlying and adjacent to damaged cartilage are an
integral part of the OA process (33–39). Sclerosis of the underlying bone, trabecularmicrofracturing, attrition, and cyst formation all are likely to accelerate the degenera-tive process as a result of adverse biomechanical changes (40,41). Other phenomena,such as osteophytes (bony spurs), may be attempts to repair or stabilize the process(6,42). It also has been suggested that bone mineral density may influence the skeletalexpression of the disease, with a more erosive form occurring in individuals with“softer” bone (43). Although some cross-sectional studies suggested a modest inverserelationship between OA and osteoporosis, recent prospective studies suggested thatindividuals with lower bone mineral density are at increased risk for OA incidence andprogression (44). The idea that the nature of bony response in OA may determine out-come was advanced further by the recent demonstration that patients with bone scanabnormalities adjacent to an OA knee had a higher rate of progression than thosewithout such changes (45).
Normal bone metabolism is contingent on the presence of vitamin D, a compoundthat is derived largely from the diet or from cutaneous exposure to ultraviolet light.Suboptimal vitamin D levels may have adverse effects on calcium metabolism,osteoblast activity, matrix ossification, and bone density (46,47). Therefore, low tissuelevels of vitamin D may impair the ability of bone to respond optimally to pathophysi-ological processes in OA and predispose to disease progression.
4.5. Anti-Inflammatory PropertiesVitamin E has diverse influences on the metabolism of arachadonic acid, a proin-
flammatory fatty acid found in all cell membranes. Vitamin E blocks formation ofarachidonic acid from phospholipids and inhibits lipoxygenase activity, although it haslittle effect on cyclooxygenase (48). Therefore, it is possible that vitamin E reduces themodest synovial inflammation that may accompany OA.
5. STUDIES OF THE EFFECTS OF NUTRIENTS IN OSTEOARTHRITIS
5.1. Obesity and OsteoarthritisPeople who are overweight are at considerably increased risk for the development of
OA in their knees and may also be more susceptible to both hip and hand joint involve-ment (49). Because overweight individuals do not necessarily have increased loadacross their hand joints, investigators have wondered whether systemic factors, such asdietary factors or other metabolic consequences of obesity, may mediate some of thisassociation. Indeed, early laboratory studies using strains of mice and rats appeared tosuggest an interaction between body weight and genetic factors and diet, althoughattempts to demonstrate a direct effect of dietary fat intake proved inconclusive (50,51).The fact that adipocytes share a common stem cell precursor with connective tissuecells such as osteoblasts and chondrocytes prompted investigation into the possibilitythat the metabolic milieu might influence their phenotypic differentiation (52). Indeed,fat and fatty acids have been associated with OA changes in joints and can influenceprostaglandin and collagen synthesis in vitro (52,53). Preliminary evidence also sug-gests that leptin, an adipose tissue-derived hormone, may have anabolic effects in OAcartilage (54).

410 Part V / Bone Diseases
5.2. The Case for Vitamin C and Other Antioxidant Micronutrients5.2.1. ANIMAL STUDIES
OA can be induced in animals by various surgical procedures. Schwartz and Leveille(55) treated guinea pigs prior to such surgery with either a high (150 mg/d) or low(2.4 mg/d) dose of vitamin C. Guinea pigs treated with the higher dose of vitaminC (which would correspond to at least 500 mg/d of vitamin C in humans) showed“consistently less severe joint damage than animals on the low level of the vitamin.”Features of OA were significantly less frequent in the animals treated with the high doseof vitamin C. Similar findings were reported by Meacock et al. (56) in another surgicallyinduced guinea pig model of OA. In this study, after the surgical procedure, they supple-mented the feeds of half of the animals with vitamin C. They reported, “Extra ascorbic acidappeared to have some protective effect (p = 0.008) on the development of spontaneous[osteoarthritis] lesions...”
5.2.2. EPIDEMIOLOGICAL STUDIES (TABLE 2)We investigated the association of self-reported dietary intake of antioxidant
micronutrients among participants followed longitudinally in the Framingham KneeOA Cohort Study (57), a population-based group derived from the Framingham HeartStudy Cohort (Table 2). Participants had knee X-rays taken at a baseline examination per-formed during1983–1985 and had follow-up X-rays approx 8 yr later, during 1992–1993.Knee OA was classified using the Kellgren and Lawrence grading system (58). Knees
Table 2Epidemiological Studies of Nutritional Factors and Osteoarthritis (OA)
Nutritional factorsAuthor studied Outcome variables Summary
McAlindon (57) Dietary antioxidant Knee OA incidence Vitamin C appeared intake and progression protective for OA
progression but not incidence.
McAlindon (71) Vitamin D: dietary Knee OA incidence Vitamin D appeared and serum and progression protective for
progression butnot incidence.
Baker (61) Vitamin C Knee OA pain Particiants with lowvitamin C intake(especiallysmokers) had more knee pain.
McLauglin (73) Vitamin D and Knee OA and No effect observed.parathyroid hormone progression
Lane (72) Vitamin D: serum Hip OA incidence Vitamin D appearedand progression protective for
hip OA incidenceand progression.

Chapter 16 / Osteoarthritis 411
without OA at baseline (Kellgren and Lawrence grade of 1 or less) were classified asincident OA if they changed to grade 2 or greater by follow-up. Knees with OA at baselinewere classified as progressive OA if their grade increased by 1 or more.
Nutrient intake, including supplement use, was calculated from dietary habits reportedat the midpoint of the study using a food-frequency questionnaire. In our analyses, weranked micronutrient intake into gender-specific tertiles and specifically looked to deter-mine whether higher intakes of vitamin C, vitamin E, and β-carotene were associated withreduced incidence and reduced progression of knee OA, compared with a panel of nonan-tioxidant control micronutrients. The lowest tertile for each dietary exposure was used asthe reference category. Odds ratios (ORs) were adjusted for age, gender, body mass index(BMI), weight change, knee injury, physical activity, energy intake, and health status.
Six-hundred forty participants (mean age: 70.3 yr) had complete assessments.Incident and progressive knee OA occurred in 81 and 68 knees, respectively. We foundno significant association of incident radiographic knee OA with any micronutrient(e.g., adjusted OR for highest vs lowest tertile of vitamin C intake =1.1, 95% confidenceinterval [CI] 0.6–2.2). However, for progression of radiographic knee OA, we found athreefold reduction in risk for those in the middle and highest tertiles of vitamin Cintake (adjusted OR for highest vs lowest tertile = 0.3, 95% CI 0.1–0.6). It is notablethat those in the highest tertile for vitamin C intake also had reduced risk of developingknee pain during the course of the study (OR= 0.3, 95% CI 0.1–0.8). Reduction in riskof progression was also seen for β-carotene (OR= 0.4, 95% CI 0.2–0.9) and vitamin Ebut was less consistent because the β-carotene association diminished substantially afteradjustment for vitamin C, and the vitamin E effect was seen only in men (OR = 0.07, 95%CI 0.01–0.6). No significant associations were observed for any of the micronutrientsamong the nonantioxidant panel.
Therefore, this study did not support the hypothesis that diets high in antioxidantmicronutrients reduce the risk of incident knee OA. However, the data suggest thatsome of these micronutrients, particularly vitamin C, may reduce the risk of OA pro-gression among those who already have some radiographical changes.
If antioxidants are indeed protective for individuals with OA, then why does theeffect appear to be confined to those with existing radiographical changes? One possi-ble explanation relates to differences in the intra-articular environment between healthyand OA knees. For example, several pathological mechanisms—including raised intra-articular pressure (16), low-grade inflammation (59), and increased metabolic activity(15)—increase the opportunity for oxidative damage in an a knee with OA. Therefore,antioxidants could have a greater role in preventing progression rather than incidence,which can result from a variety of nonmetabolic insults, such as knee injury (60).
Another important observation in this study was that the effect of vitamin C wasstronger and more consistent than for those of β-carotene and vitamin E. Vitamin C is awater-soluble compound with a broad spectrum of antioxidant activity resulting from itsability to react with numerous aqueous free radicals and reactive oxygen species (10). Theextracellular nature of reactive oxygen species-mediated damage in joints and the aque-ous intra-articular environment may favor a role for a water-soluble agent such as vitaminC rather than for fat-soluble molecules like β-carotene or vitamin E. In addition, it hasbeen suggested that vitamin C may regenerate vitamin E at the water–lipid interface byreducing α-tocopherol radical back to α-tocopherol. However, the issue of whether thisoccurs in vivo appears controversial. An alternative explanation is that the protective

412 Part V / Bone Diseases
effects of vitamin C relate to its biochemical participation in the biosynthesis of cartilagecollagen fibrils and proteoglycan molecules, rather than its antioxidant properties.
Recently, Baker and colleagues (61) investigated the relationship of vitamin C intake(evaluated using a food-frequency questionnaire) and knee pain among 324 participants(mostly males) over a 30-mo period in a longitudinal study of knee OA. Pain score wascomputed as an average of pain scores reported at all visits in their cross-sectionalanalysis. They found that individuals with low intakes of vitamin C (200 mg for men,150 mg for women) had significantly more knee pain after adjusting for age, BMI, andenergy intake. For example, among smokers in the lowest tertile for vitamin C intake,pain scores were 2.8 times greater than for all other men.
5.2.3. CLINICAL TRIALS (TABLE 3)Benefit from vitamin E therapy has been suggested by several small studies of human
OA (62–65), of which the most rigorous was a company-sponsored, 6-wk, double-blind,placebo-controlled trial of 400 mg of α-tocophorol (vitamin E) in 56 patients with OAin Germany (66). Vitamin E-treated patients experienced greater improvement in everyefficacy measure, including pain at rest (69% better in vitamin E vs 34% better inplacebo; p < 0.05), pain on movement (62% better on vitamin E vs 27% on placebo;p < 0.01), and use of analgesics (52% less on vitamin E vs 24% less on placebo; p < 0.01).The rapid response in symptoms observed in this study precludes a structural effect inthis disorder and suggests that the beneficial effect might result from some metabolicaction, such as inhibition of arachidonic acid metabolism.
Hill and Bird (67) conducted a 6-mo double-blind, placebo-controlled study ofselenium–ACE, a proprietary nutritional supplement in the United Kingdom, among 30patients with unspecified OA (67). The active treatment contained 144 μg of seleniumon average as well as unspecified quantities of vitamins A, C, and E. In fact, the placeboalso contained 2.9 μg of selenium. Pain and stiffness scores remained similar for the twogroups at all time points. The authors concluded that their data did not support efficacyfor selenium–ACE in relieving symptoms of OA.
Wluka et al. (68) tested whether vitamin E (500 IU) affected cartilage volume loss inpatients with knee OA in a 2-yr, double-blind, placebo-controlled trial among 136patients with knee OA (68). Tibial cartilage volume was measured by magnetic reso-nance imaging (MRI) at the beginning and end of the study. A total of 117 subjectscompleted the study. Loss of medial and lateral tibial cartilage, measured by MRI, wassimilar in subjects treated with vitamin E and placebo (e.g., mean loss in the medialcompartment: 157 vs 187 m3; p = 0.5). There also were no significant differencesbetween the vitamin E- and placebo-treated groups in improvement of symptoms frombaseline. They concluded that vitamin E does not appear to benefit cartilage volumeloss or symptoms in people with OA.
5.3. Selenium and Iodine: Studies of Kashin–Beck DiseaseKashin–Beck disease is an osteoarthropathy of children and adolescents that occurs
in geographic areas of China in which deficiencies of both selenium and iodine areendemic. Strong epidemiological evidence exists supporting the environmental natureof this disease (69). Although the clinical and radiological characteristics ofKashin–Beck disease differ from OA, its existence raises the possibility that environ-mental factors also play a role in the occurrence of this disorder.

Tabl
e 3
Clin
ical
Tri
als
of N
utri
tiona
l Pro
duct
s in
Ost
eoar
thri
tis
Com
poun
dR
oute
of
Aut
hor
test
edC
ompa
rato
rSt
udy
nad
min
istr
atio
nO
utco
me
Flyn
n (7
4)Fo
lic a
cid
and
Plac
ebo
30O
ral
No
cons
iste
nt d
iffer
ence
cy
anoc
obal
amin
betw
een
grou
ps.
Hill
(67
)Se
leni
um A
CE
Plac
ebo
30O
ral
No
effe
ct o
bser
ved.
Bla
nken
horn
(66
)V
itam
in E
Plac
ebo
56O
ral
Favo
red
vita
min
E.
Rei
chel
t (96
)G
luco
sam
ine
Plac
ebo
155
Ora
lFa
vore
d gl
ucos
amin
e.V
ajar
adul
(98)
Glu
cosa
min
ePl
aceb
o54
Intr
a-ar
ticul
arFa
vore
d gl
ucos
amin
e.D
rova
nti (
93)
Glu
cosa
min
ePl
aceb
o80
Ora
lFa
vore
d gl
ucos
amin
e.Pu
jalte
(95
)G
luco
sam
ine
Plac
ebo
20O
ral
Favo
red
gluc
osam
ine.
Mul
ler
(105
)G
luco
sam
ine
Obu
prof
en20
0O
ral
Ibup
rofe
n in
itial
ly m
ore
effi
caci
ous;
sim
ilar
effe
cts
by w
eek
4.V
az (
97)
Glu
cosa
min
eO
bupr
ofen
40O
ral
Ibup
rofe
n in
itial
ly m
ore
effi
caci
ous;
sim
ilar
effe
cts
afte
r w
eek
4.L’
hiro
ndel
(10
1)C
hond
roiti
nPl
aceb
o12
5O
ral
Favo
red
chon
droi
tin.
Ker
zber
g (1
02)
Cho
ndro
itin
Plac
ebo
17In
tra-
mus
cula
rFa
vore
d ch
ondr
oitin
.M
azie
res
(103
)C
hond
roiti
nPl
aceb
o12
0O
ral
Favo
red
chon
droi
tin.
Con
rozi
er (
122)
Cho
ndro
itin
Plac
ebo
129
Ora
lFa
vore
d ch
ondr
oitin
.R
ovet
ta (
104)
Cho
ndro
itin
Plac
ebo
40In
tra-
mus
cula
rFa
vore
d ch
ondr
oitin
.C
iber
e (1
07)
Glu
cosa
min
ePl
aceb
o13
7O
ral
No
effe
ct o
bser
ved.
Hug
hes
(109
)G
luco
sam
ine
Plac
ebo
80O
ral
No
effe
ct o
bser
ved.
Mic
hel (
114)
Chr
ondr
oitin
Plac
ebo
300
Ora
lFa
vore
d ch
rond
roiti
n.Pa
velk
a (1
12)
Glu
cosa
min
ePl
aceb
o20
2O
ral
Favo
red
gluc
osam
ine.
Reg
inst
er (
111)
Glu
cosa
min
ePl
aceb
o21
2O
ral
Favo
red
gluc
osam
ine.
Mor
real
e (1
23)
Cho
ndro
itin
Dic
lofe
nac
146
Ora
lFa
vore
d ch
ondr
oitin
.
413

414 Part V / Bone Diseases
Selenium deficiency together with pro-oxidative products of organic matter (mainlyfulvic acid) in drinking water and contamination of grain by fungi have been proposedas environmental causes for Kashin–Beck disease. However, the efficacy of seleniumsupplementation in preventing the disorder is controversial. Because selenium is anintegral component of iodothyronine deiodinase as well as glutathione peroxidase,Moreno-Reyes et al. (70) studied iodine and selenium metabolism in 11 villages in Tibetin which Kashin–Beck disease was endemic and 1 village in which it was not. Theyfound iodine deficiency to be the main determinant of Kashin–Beck disease in thesevillages, although it should be noted that selenium levels were very low in all the sub-groups examined. In an accompanying editorial, Utiger inferred that Kashin–Beck dis-ease probably results from a combination of deficiencies of both of these elements andspeculated that growth plate cartilage is both dependent on locally produced triiodothy-ronine and sensitive to oxidative damage.
It should be noted that there is little, if any, evidence to suggest that Kashin–Beckdisease has any similarities with OA. Furthermore, the single published clinical trial ofsupplemental selenium (selenium-ACE) in the treatment of symptoms associated withOA demonstrated no efficacy from this product (67).
5.4. Studies of Vitamin DIn a separate investigation, we tested the association of vitamin D status on the inci-
dence and progression of knee OA among the cohort of participants in the FraminghamOA Cohort Study described earlier (71). The methodology for this investigation wasessentially identical, with the exception that the analysis was confined to the subset ofindividuals who both participated in the dietary assessment and provided serum for assayof 25-hydroxy vitamin D (25[OH]D; n = 556). Dietary intake of vitamin D and serum25(OH)D levels were modestly correlated in this sample (r = 0.24) and, as in the previ-ous study, were unrelated to incidence of OA. However, risk of progression increasedthreefold for participants in the middle and lower tertiles of both vitamin D intake (ORfor lowest vs highest tertile = 4.0, 95% CI 1.4–11.6) and serum level (OR = 2.9, 95%CI 1.0–8.2). Low serum vitamin D level also predicted cartilage loss, as assessed by lossof joint space (OR = 2.3, 95% CI 0.9–5.5) and osteophyte growth (OR = 3.1, 95%CI 1.3–7.5). We concluded that low serum level and low intake of vitamin D were eachassociated with a highly significant increase in the risk of progression of knee OA.
Lane et al. (72) subsequently examined the relationship of serum 25- and 1,25-hydroxy vitamin D with the development of radiographical hip OA among Caucasianwomen older than age 65 yr who were participating in the Study of OsteoporoticFractures. They measured serum vitamin D levels in 237 subjects randomly selectedfrom 6051 women who had pelvic radiographs taken at both the baseline examinationand after 8 yr of follow-up. Radiographs in this study were graded using a validatedscoring system for hip OA based on individual radiographical features (osteophytesand joint space narrowing). The investigators analyzed the association of vitamin Dlevels (ranked in tertiles) with the occurrence of joint space narrowing, the develop-ment of osteophytosis, and changes in the mean joint space width and individual radi-ographical feature scores (treated as continuous variables) during the study period.Multivariate analyses were adjusted for age, clinic, weight at age 50 yr, and healthstatus. They found a significantly increased risk for development of joint space nar-rowing among those in the lowest tertile for 25(OH)D (OR = 2.5, 95% CI 1.1–5.3) as

Chapter 16 / Osteoarthritis 415
well as associations with continuous measures of progression (β = −0.1, 95% CI –0.2to –0.02). An increased risk was also apparent for development of joint space nar-rowing among those in the middle tertile for 25-hydroxy vitamin D but did not reachstatistical significance.
McLaughlin et al. (55) examined the effects of 25(OH)D and parathyroid hormoneon the risk of progression among a cohort of 312 participants with symptomatic kneeOA at a VA hospital. This study has been reported only in abstract form at this time.Progression was defined as worsening in joint space narrowing by at least one grade(range: 0–3) in either knee over a period of 30 mo or less. Serum levels were only avail-able for 222 of the 312 participants, but there were no apparent significant differencesbetween those for whom samples were or were not available (data are not reported inthe abstract). They found no striking influence of these variables on OA progression intheir analyses. Further data are awaited from this preliminary analysis. However, thereare several important features of this study that might account for the discordance withthe Framingham data. These relate to the characteristics of the VA hospital-based sam-ple and the focus on joint space narrowing as the primary outcome measure. In partic-ular, the levels of 25(OH)D were lower in the VA study such that the cut-point betweenthe middle and upper tertiles (25 ng/mL) corresponded to the cut-point between thelower and middle tertiles for the Framingham cohort. Therefore, the VA sample may nothave had sufficiently high levels of vitamin D to exert a detectable effect. Also, the clas-sification of knee OA progression on the basis of joint space narrowing may havereduced differences toward the null if the biological benefit of vitamin D was exertedthrough bone rather than cartilage. For example, it is notable that in the Framinghamcohort, the influence of serum 25(OH)D predicted osteophyte growth more stronglythan cartilage loss.
Thus, two independent epidemiological studies demonstrated an inverse associationof vitamin D status with risk for OA (71,72). Both of these studies used a prospectivedesign and included relatively robust measures of vitamin D. The studies also wereconcordant for the observation that individuals with the lowest risk exhibited 25(OH)Dlevels greater than 30 ng/mL. On the other hand, one VA hospital-based prospectivestudy of knee OA progression found no such effects (73). However, the individuals inthis study tended to have lower levels of vitamin D. Furthermore, thus far, the analyseshave been confined to prediction of joint space loss as the primary outcome.
5.5. Folic Acid and CobalaminFlynn et al. (74) performed a 2-mo double-blind, randomized, three-arm, crossover
clinical trial of 6400 μg of folate vs 6400 μg of folate with 20 μg of cyanocobalamin ora placebo among 30 individuals with symptomatic hand OA. Participants were assessedfor tender joints, grip strength, symptoms, and analgesic use. In their analyses, theauthors stratified the participants according to their baseline grip strength. Ultimately,some benefits were found among some strata for certain measures of grip strength andtender joints favoring the folate/cyanocobalamin arm. However, few differences werenoted regarding pain scores, global assessments, or analgesic use, suggesting that thisintervention had limited, if any, efficacy.
Dietary intake of folate was also tested as a nonantioxidant control micronutrientin the Framingham Osteoarthritis Study. In this observational study, we found noconvincing effect of this micronutrient on knee OA incidence or progression.

416 Part V / Bone Diseases
6. STUDIES OF OTHER NUTRIENTS IN OSTEOARTHRITIS
6.1. Glucosamine and Chondroitin Sulfate6.1.1. OSTEOARTHRITIS SYMPTOMS
The idea that administration of glucosamine or chondroitin sulfate might havetherapeutic effects in treating OA by providing substrate for reparative processes incartilage has existed since at least the 1960s. These compounds occur naturally in thebody and may be involved in the repair and maintenance of normal cartilage. They havebeen used for many years in veterinary medicine for the symptomatic relief of arthritis.Recently, health and nutrition stores and numerous news shows and popular books havepromoted the use of glucosamine and chondroitin sulfate for the treatment of arthritis.On the basis of anecdotal evidence, the products appear to be gaining popularity amongconsumers. Different formulations of glucosamine are available in nutrition stores,which sell these products as dietary supplements.
Although there has been continuing interest in these compounds, this appears tohave been tempered by lack of a plausible mechanism to explain how they mightachieve a therapeutic effect. In fact, recent laboratory studies have indicated thatglucosamine is absorbed through the gastrointestinal tract (75) and then rapidly dis-tributed throughout the body with selective uptake by articular cartilage (76,77), whereit stimulates both glycosaminoglycan and proteoglycan synthesis (78–80). The biolog-ical fate of orally administered chondroitin sulfate is less clear, but some evidenceexists to suggest that the compound may be absorbed following oral administration,possibly as a result of pinocytosis (81). Chondroitin sulfate can cause an increase inRNA synthesis by chondrocytes (82), which appears to correlate with an increase in theproduction of proteoglycans and collagens (83–86). Additionally, there is evidence thatchondroitin sulfate partially inhibits leukocyte elastase and, therefore, may reduce thedegradation of cartilage collagen and proteoglycans, which is prominent in the OAprocess (87–90).
Glucosamine and chondroitin sulfate have been the subject of numerous clinical trialsin Europe and Asia, all of which had demonstrated favorable effects (until recently; refs.91–105) (see Table 3). We performed a meta-analysis and quality assessment of double-blind, placebo-controlled clinical trials of glucosamine and chondroitin compounds toevaluate their likely efficacy for OA (106). Of the trials we studied, 13 met eligibility cri-teria. Quality scores were substantially lower for abstracts compared with manuscripts,with major deficiencies apparent in descriptions of randomization, blinding, and com-pletion rates. Most, if not all, were sponsored by a manufacturer of the product. No neg-ative studies were found. All studies were classified as positive and demonstrated largeeffects, with mean score reductions compared to placebo of 39.5 and 40.2% for glu-cosamine and chondroitin, respectively. We concluded that clinical trials of glucosamineand chondroitin showed benefits in the treatment of OA symptoms but provided insuffi-cient information about study design and conduct to allow definitive evaluation.
However, the body of evidence concerning the efficacy of glucosamine was recentlyaltered by the publication of four independently funded clinical trials, three of whichhad completely null results (107–110). Rindone et al. (110) recruited 114 patients(mostly men) with knee OA from a VA medical center and randomized them into a 2-moplacebo-controlled trial of glucosamine sulfate, 500 mg tid. The participants had rathersevere radiographical, OA and 56% were using additional analgesia drugs. Sixteen

Chapter 16 / Osteoarthritis 417
participants were lost to follow-up or withdrew from the study. The investigators foundno substantial or significant differences in outcomes between the two groups after either30 or 60 d of treatment (e.g., mean change in knee pain on walking: glucosamine group =–1.4, placebo group = –1.5; p = 0.77, for the difference).
Hughes and Carr (109) performed a double-blind, placebo-controlled, randomized,controlled trial (RCT) of glucosamine sulfate (1.5 g/d) in patients recruited from arheumatology clinic. Participants had relatively severe knee OA from both a sympto-matic and radiographical perspective and were often using nonsteroidal anti-inflammtorydrugs or other analgesics. Of those studied, 80 participants were randomized and 78were included in the efficacy analysis. Adherence was greater than 80% in both treat-ment groups. The two groups were apparently similar regarding baseline demographicaland OA-related variables, although these data were not provided in the paper. No sig-nificant differences were found between groups in any of the primary endpoints in thisstudy. The two treatment groups also were similar for the secondary outcomes, with theexception of range of knee flexion, which showed a mean increase of 4° in the glu-cosamine group and a decrease of 9° in the placebo group ( p = 0.02, for the difference).The authors were skeptical about the credibility of this finding because the magnitudeof the difference is less than the minimal detection limit of a goniometer.
Cibere et al. (107) presented preliminary results of an innovative glucosamine with-drawal trial in people with knee OA who were already using the product and who reportedat least moderate benefit. Enrollees were randomly assigned to continue taking glu-cosamine sulfate or to placebo. The intervention continued for 24 wk or until the sub-ject met predefined criteria for a disease flare. A total of 137 participants were enrolled.Prior use of glucosamine was variable regarding dose and (presumably) manufacturer.Rates of disease flare were essentially identical (43 vs 42%) in the two treatment arms,although a small, nonsignificant reduction in risk was observed after adjustment forgender and radiographical severity (hazard ratio = 0.8, 95% CI = 0.5–1.4). No substantialdifferences were noted between treatment groups regarding the secondary outcomes,including Western Ontario and McMaster Universities scores and level of analgesic use.One of the problems in interpreting the results of this study is that if the duration ofeffectiveness of glucosamine is prolonged (as claimed), then the period of follow-up inmay have been insufficient. Also, the heterogeneity of glucosamine products on themarket could have biased any differences to the null.
6.1.2. STUDIES OF OSTEOARTHRITIS PROCESS MODIFICATION
Rotta Pharmaceuticals sponsored two large, multicenter RCTs to examine the possi-bility that glucosamine might reduce rate of loss of articular cartilage (111,112). Thesetrials enrolled approx 200 outpatients with primary knee OA into 3-yr RCTs comparingRotta glucosamine sulfate (1.5 g taken once daily) with placebo. The primary outcomein each trial was based on joint space measurements obtained from standing anteropos-terior knee radiographs, the recommended radiographical approach at that time. Bothtrials showed quantitatively similar benefits in the glucosamine treatment armsregard-ing the rate of loss of joint-space width and symptoms. Unfortunately, the approach thatwas used to estimate width of joint space in these RCTs has proved to be problematic,although it was the recommended technique at the inception of the trials (113). Precisemeasurement of this variable is contingent on highly reproducible radioanatomicpositioning of the joint and may be biased by the presence of pain.

418 Part V / Bone Diseases
Interestingly, similar influences of chondroitin sulfate on radiographical progressionof knee OA were also reported in abstract form based on results of a 2-yr RCT, placebo-controlled study of 100 participants (114).
7. OTHER NUTRITIONAL PRODUCTS
An increasing number of nutritional remedies have apparently been promulgated forpurported benefits in arthritis. Several of these have been tested in controlled clinical trials.For example, four trials of avocado/soybean unsaponifiables were pooled in a meta-analysis that displayed guardedly positive results (115). Trials of S-adenosylmethioninealso had apparently positive results, although they were somewhat limited by adverseeffects and high drop-out rates (116–120). An 32-wk study of ayurdevic remedy, pre-pared from certain herbs and roots, was also tested in an industry-sponsored, placebo-controlled clinical trial; however, this was presented only as an abstract (121).
8. CONCLUSIONS AND RECOMMENDATIONS
The idea that nutritional factors might influence the occurrence or course of OA isrelatively new to the scientific community (although not to the general public). As a result,research in this field is at an early stage, and few definitive conclusions can be reached.Nevertheless, it is clear that there are many plausible mechanisms through which vari-ous nutritional factors might influence the occurrence and course of this major publichealth problem. Preliminary findings suggest a possible role of vitamin C in reducingOA pain and pathological progression. Apparent benefits from vitamin D were observedfor two different joint sites in two large epidemiological studies, but benefits wereabsent in a third study. The interpretation of clinical trial data regarding the effects ofglucosamine and chondroitin sulfate on OA symptoms was recently clouded by the pub-lication of several independent trials that had negative results.
What might be reasonable nutritional advice for an individual with OA, given theincomplete state of current knowledge? From a pragmatic standpoint, the data suggestinterventions that are largely concordant with general advice about healthy eating, par-ticularly increasing consumption of fresh fruit and vegetables and optimizing vitamin Dstatus. It is notable in the Framingham Osteoarthritis Study that an individual couldmove out of the high-risk tertile for vitamin C intake by increasing consumption by aslittle as an orange per day. For vitamin D, an intake of 400 IU/d or serum levels ofgreater than approx 30 ng/mL appear to confer maximum benefit. Vitamin D is derivedfrom a number of sources, and there is a small risk of toxicity for individuals consum-ing large daily doses. Supplementation with 400–800 IU/d appears to be safe. For peo-ple in whom there are concerns about adequate supplementation, or toxicity, werecommend measurement of serum 25(OH)D levels.
Regarding nutritional products, there appear to be no compelling reasons to discouragethe use of glucosamine and chondroitin sulfate. These products are substantially safer thanmany drugs prescribed in the treatment of OA symptoms; however, they are often expen-sive, lack pharmaceutical-level manufacturing standard controls, and may not work.
REFERENCES1. Lawrence JS, Bremner JM, Bier F. Osteo-arthrosis. Prevalence in the population and relationship
between symptoms and x-ray changes. Ann Rheum Dis 1966; 25(1):1–24.

Chapter 16 / Osteoarthritis 419
2. Cooper C. Osteoarthritis: Epidemiology. In: Klippel JH, Dieppe PA, eds. Rheumatology. Mosby,London, UK, 1994, 7.3.1–5.
3. Mankin HJ. Clinical features of osteoarthritis. In: Kelly WN, Harris EDJ, Ruddy S, Sledge CB, eds.Textbook of Rheumatology. 4th ed. W.B. Saunders Co., Philadelphia, PA, 1993, 1374–1384.
4. The Incidence and Prevalence Database for Procedures. Timely Data Resources, Sunnyvale, CA, 1995.5. Hough AJ. Pathology of Osteoarthritis. In: Koopman WJ, ed. Arthritis and Allied Conditions. 13 ed.
Williams & Wilkins, Baltimore, MD, 1997:1945–1968.6. Pottenger LA, Philips FM, Draganich LF. The effect of marginal osteophytes on reduction of varus-
valgus instability in osteoarthritis knees. Arthritis Rheum 1990; 33:853–858.7. Creamer P, Hochberg MC. Osteoarthritis [see comments]. Lancet 1997; 350(9076):503–508.8. Radin EL, Burr DB, Caterson B, Fyhrie D, Brown TD, Boyd RD. Mechanical determinants of
osteoarthrosis. Semin Arthritis Rheum 1991; 21(3 Suppl 2):12–21.9. Theodosakis J, Adderly B, Fox B. The Arthritis Cure. St. Martin’s Press, New York, 1997.
10. Frei B. Reactive oxygen species and antioxidant vitamins: mechanisms of action. Am J Med 1994;97(Suppl 3A):5S–13S.
11. Jacques PF, Chylack LT, Taylor A. Relationships Between Natural Antioxidants and CataractFormation. In: Frei B, ed. Natural Antioxidants in Human Health and Disease. Academic Press, SanDiego, CA, 1994:515–533.
12. Gaziano JM. Antioxidant vitamins and coronary artery disease risk. Am J Med 1994; 97(Suppl3A):18S–21S.
13. Hennekens CH. Antioxidant vitamins and cancer. Am J Med 1994; 97(Suppl 3A):2S–4S.14. Boveris A, Oshino N, Chance B. The cellular production of hydrogen peroxide. Biochem J 1972;
128:617–630.15. Blake DR, Unsworth J, Outhwaite JM, et al. Hypoxic-reperfusion injury in the inflamed human.
Lancet 1989; 11:290–293.16. Ames BN, Shigenaga MK, Hagen TM. Oxidants, antioxidants and the degenerative diseases of
aging. Proc Natl Acad Sci USA 1993; 90:7915–7922.17. Henrotin Y, Deby-Dupont G, Deby C, Franchimont P, Emerit I. Active oxygen species, articular
inflammation, and cartilage damage. Exs 1992; 62:308–322.18. Henrotin Y, Deby-Dupont G, Deby C, Debruin M, Lamy M, Franchimont P. Production of active
oxygen species by isolated human chondrocytes. Brit J Rheumatol 1993; 32:562–567.19. Rathakrishnan C, Tiku K, Raghavan A, Tiku ML. Release of oxygen radicals by articular chondro-
cytes: a study of luminol-dependent chemoluminescence and hydrogen peroxide secretion. J BoneMiner Res 1992; 7:1139–1148.
20. Greenwald RA, Moy WW. Inhibition of collagen gelation by action of the superoxide radical.Arthritis Rheum 1979; 22:251–259.
21. McCord JM. Free radicals and inflammation: protection of synovial fluid by superoxide dismutase.Science 1974; 185:529–530.
22. Haklar U, Yuksel M, Velioglu A, Turkmen M, Haklar G, Yalcin AS. Oxygen radicals and nitric oxidelevels in chondral or meniscal lesions or both. Clin Orthop 2002(403):135–142.
23. Briviba K, Seis H. Non-Enzymatic Antioxidant Defense Systems. In: Frei B, ed. NaturalAntioxidants in Human Health and Disease. Academic Press, San Diego, 1994:107–128.
24. Hankinson SE, Stampfer MJ, Seddon JM, et al. Nutrient intake and cataract extraction in women: aprospective study. BMJ 1992; 305(6849):335–339.
25. Peterkofsky B. Ascorbate requirement for hydroxylation and secretion of procollagen: relationshipto inhibition of collagen synthesis inscurvy. AM J Clin Nutr 1991; 54:1135S–1140S.
26. Spanheimer RG, Bird TA, Peterkofsky B. Regulation of collagen synthesis and mRNA levels inarticular cartilage of scorbutic guinea pigs. Arch Biochem Biophys 1986; 246:33–41.
27. Houglum KP, Brenner DA, Chijkier M. Ascorbic acid stimulation of collagen biosynthesis indepen-dent of hydroxylation. Am J Clin Nutr 1991; 54:1141S–1143S.
28. Schwartz ER, Adamy L. Effect of ascorbic acid on arylsulfatase activities and sulfated proteoglycanmetabolism in chondrocyte cultures. J Clin Invest 1977; 60:96–106.
29. Sandell LJ, Daniel LC. Effects of ascorbic acid on collagen mRNA levels in short-term chondrocytecultures. Connect Tiss Res 1988; 17:11–22.
30. Peterkofsky B, Palka J, Wilson S, Takeda K, Shah V. Elevated activity of low molecular weightinsulin-like growth factor binding proteins in sera of vitamin C deficient and fasted guinea pigs.Endocrinology 1991; 128:1769–1779.

420 Part V / Bone Diseases
31. Bhalla AK, Wojno WC, Goldring MB. Human articular chondrocytes aquire AU–,25(OH)2 vitaminD-3 receptors. Biochimica et Biophysica Acta 1987; 931:26–32.
32. Poole RA. Imbalances of Anabolism and Catabolism of Cartilage Matrix Components in Osteoarthritis.In: Kuettner K, Goldberg VM, ed. Osteoarthritis Disorders. Amer Acad Orthop Surgeons, Rosemont,IL, 1995:247–260.
33. Radin EL, Paul IL, Tolkoff MJ. Subchondral changes in patients with early degenerative joint disease.Arthritis Rheum 1970; 13:400–405.
34. Layton MV, Golstein SA, Goulet RW, Feldkamp LA, Kubinski DJ, Bole GG. Examination of sub-chondral bone architecture in experimental osteoarthritis by microscopic computed axial tomography.Arthritis Rheum 1988; 31:1400–1405.
35. Milgram JW. Morphological alterations of the subchondral bone in advanced degenerative arthritis.Clin Orthop Rel Res 1983; 173:293–312.
36. Kellgren JH, Lawrence JS. The Epidemiology of Chronic Rheumatism: Atlas of StandardRadiographs. Blackwell Scientific, Oxford, UK, 1962.
37. Anonymous. Cartilage and bone in osteoarthrosis. Brit Med J 1976; 2:4–5.38. Dequecker J, Mokassa L, Aerssens J. Bone density and osteoarthritis. J Rheumatol 1995; 22
(Suppl 43):98–100.39. Dedrick DK, Goldstein SA, Brandt KD, O’Connor BL, Goulet RW, Albrecht M. A longitudinal study
of subchondral plate and trabecular bone in cruciate-deficient dogs with osteoarthritis followed upfor 54 months. Arthritis Rheum 1993; 36:1460–1467.
40. Ledingham J, Dawson S, Preston B, Milligan G, Doherty M. Radiographic progression of hospital-referred osteoarthritis of the hip. Ann Rheum Dis 1993; 52:263–267.
41. Radin EL, Rose RM. Role of subchondral bone in the initiation and progression of cartilage damage.Clin Orthop Rel Res 1986; 213:34–40.
42. Perry GH, Smith MJG, Whiteside CG. Spontaneous recovery of the joint space in degenerative hipdisease. Ann Rheum Dis 1972; 31:440–448.
43. Smythe SA. Osteoarthritis, insulin and bone density. J Rheumatol 1987; 14(Suppl):91–93.44. Zhang Y, Hannan MT, Chaisson CE, et al. Bone mineral density and risk of progressive radiographic
knee osteoarthritis in women: the Framingham Study. J Rheumatol 2000; 27:1032–1037.45. Dieppe P, Cushnaghan J, Young P, Kirwan J. Prediction of the progression of joint space narrowing
in osteoarthritis of the knee by bone scintigraphy. Ann Rheum Dis 1993; 52:557–563.46. Kiel DP. Vitamin D, Calcium and Bone: Descriptive Epidemiology. In: Rosenberg IH, ed.
Nutritional Assessment of Elderly Populations: Measurement and Function. Raven, New York,1995:277–290.
47. Parfitt AM, Gallagher JC, Heaney RP, Neer R, Whedon GD. Vitamin D and bone health in theelderly. AM J Clin Nutr 1982; 36:1014–1031.
48. Pangamala RV, Cornwell DG. The effects of vitamin E on arachidonic acid metabolism. Ann NYAcad Sci 1982; 393:376–391.
49. Felson DT. Weight and osteoarthritis. J Rheumatol 1995; 22(Suppl 43):7–9.50. Sokoloff L, Mickelsen O. Dietary fat supplements, body weight and osteoarthritis in DBA/2JN mice.
J Nutr 1965; 85:117–121.51. Sokoloff L, Mickelsen O, Silverstein E, Jay GE Jr., Yamamoto RS. Experimental obesity and
osteoarthritis. Am J Physiol 1960; 198:765–770.52. Aspden RM, Scheven BA, Hutchison JD. Osteoarthritis as a systemic disorder including stromal cell
differentiation and lipid metabolism. Lancet 2001; 357(9262):1118–1120.53. Lippiello L, Walsh T, Fienhold M. The association of lipid abnormalities with tissue pathology in
human osteoarthritic articular cartilage. Metabolism 1991; 40(6):571–576.54. Dumond H, Presle N, Terlain B, et al. Evidence for a Key Role in Leptin in Ostoearthritis. Arthritis
Rheum 2003; 48(9):S282.55. Schwartz ER, Leveille C, Oh WH. Experimentally induced osteoarthritis in guinea pigs: effect of
surgical procedure and dietary intake of vitamin C. Lab Animal Sci 1981; 31:683–687.56. Meacock SCR, Bodmer JL, Billingham MEJ. Experimental OA in guinea pigs. J Exp Path 1990;
71:279–293.57. McAlindon TE, Jacques P., Zhang Y., et al. Do antioxidant micronutrients protect against the devel-
opment and progression of knee osteoarthritis? Arthritis Rheum 1996; 39(4):648–656.58. Kellgren J, Lawrence JS. The Epidemiology of Chronic Rheumatism: Atlas of Standard
Radiographs. Vol 2. Blackwell Scientific, Oxford, 1963.

Chapter 16 / Osteoarthritis 421
59. Schumacher HR Jr. Synovial inflammation, crystals and osteoarthritis. J Rheumatol 1995; 22(Suppl43):101–103.
60. Felson DT, Zhang Y, Hannan MT, et al. Risk factors for incident radiographic knee osteoarthritis inthe elderly: the Framingham Study. Arthritis Rheum 1997; 40:728–733.
61. Baker K, Niu J, Goggins J, Clancy M, Felson D. The effects of vitamin C intake on pain in kneeosteoarthritis (OA). Arthritis Rheum 2003; 48(9):S422.
62. Hirohata K, Yao S, Imura S, Harada H. Treatment of osteoarthritis of the knee joint at the state ofhydroarthrosis. Kobe Med Sci 1965; 11(Suppl):65–66.
63. Doumerg C. Etude clinique experimentale de l’alpha-tocopheryle-quinone en rheumatologie et enreeducation. Therapeutique 1969; 45:676–678.
64. Machetey I, Quaknine L. Tocopherol in osteoarthritis: a controlled pilot study. J Am Ger Soc 1978;26:328–330.
65. Scherak O, Kolarz G, Schodl C, Blankenhorn G. Hochdosierte vitamin-E-therapie bei patienten mitaktivierter arthrose. Z Rheumatol 1990; 49:369–373.
66. Blankenhorn G. Clinical efficacy of spondyvit (vitamin E) in activated arthroses. A multicenter,placebo-controlled, double-blind study. Z Orthop 1986; 124:340–343.
67. Hill J, Bird HA. Failure of selenium-ace to improve osteoarthritis. Br J Rheumatol 1990; 29(3):211–213.68. Wluka AE, Stuckey S, Brand C, Cicuttini FM. Supplementary vitamin E does not affect the loss of
cartilage volume in knee osteoarthritis: a 2 year double blind randomized placebo controlled study.J Rheumatol 2002; 29(12):2585–2591.
69. Utiger RD. Kashin-Beck disease—expanding the spectrum of iodine-deficiency disorders [editorial;comment]. N Engl J Med 1998; 339(16):1156–1158.
70. Moreno-Reyes R, Suetens C, Mathieu F, et al. Kashin-Beck osteoarthropathy in rural Tibet in rela-tion to selenium and iodine status [see comments]. N Engl J Med 1998; 339(16):1112–1120.
71. McAlindon TE, Felson DT, Zhang Y, et al. Relation of dietary intake and serum levels of vitamin Dto progression of osteoarthritis of the knee among participants in the Framingham Study. Ann InternMed 1996; 125(5):353–359.
72. Lane NE, Gore LR, Cummings SR, et al. Serum vitamin D levels and incident changes of radi-ographic hip osteoarthritis: a longitudinal study. Study of Osteoporotic Fractures Research Group.Arthritis Rheum 1999; 42(5):854–860.
73. McLaughlin S, Jacques P, Goggins J, et al. Effect of 25-hydroxyvitamin D and parathyroid hormoneon progression of radiographic knee osteoarthritis. Arthritis Rheum 2002; 46(9[Suppl]):S299.
74. Flynn MA, Irvin W, Krause G. The effect of folate and cobalamin on osteoarthritic hands. J Am CollNutr 1994; 13(4):351–356.
75. Dones F, Tesoriere G. Intestinal absorption of glucosamine and N-acetyl-glucosamine. Experientia1972; 28:770.
76. Setnikar I, Giachetti C, Zanolo G. Absorption, distribution and excretion of radio-activity after a sin-gle I.V. or oral administration of [14C]glucosamine to the rat. Pharmatherapeutica 1984; 3:358.
77. Setnikar I, Giachetti C, Zanolo G. Distribution of glucosamine in animal tissues. Arzneimittelforschung/Drug Research 1986; 36:729.
78. Karzal K, Domenjoz R. Effects of hexosamine derivatives on glycosaminoglycan metabolism offibroblast cultures. Pharmacology 1971; 5:337.
79. Vidal Y, Plana RR, Karzal K. Glucosamine: its role in articular cartilage metabolism studies on ratand human articular cartilage. Fostscher Med 1980; 98:801–806.
80. Vidal Y, Plana RR, Bizzarri D, Rovati AL. Articular cartilage pharmacology: in vitro studies on glu-cosamine and NSAIDs. Pharmacol Res Commun 1978; 10:557.
81. Theodore G. Untrsuchung von 35 arhrosefallen, behandelt mit chondroitin schwefelsaure. SchweizRundschaue Med Praxis 1977; 66.
82. Vach J, Pesakova V, Krajickova J, Adam M. Efect of glycosaminoglycan polysulfate on the metab-olism of cartilage RNA. Arzneim Forsch/Drug Res 1984; 34:607–609.
83. Ali SY. The degrdation of cartilage matrix by an intracellular protease. Biochem J 1964; 93:611.84. Hamerman D, Smith C, Keiser HD, Craig R. Glycosaminoglycans produced by human synovial cell
cultures collagen. Rel Res 1982; 2:313.85. Lilja S, Barrach HJ. Normally sulfated and highly sulfated glycosaminoglycans affecting fibrilloge-
nesis on type I and type II collage in vitro. Exp Pathol 1983; 23:173–181.86. Knanfelt A. Synthesis of articular cartilage proteoglycans by isolated bovine chondrocytes. Agents
Actions 1984; 14:58–62.

422 Part V / Bone Diseases
87. Baici A, Salgam P, Fehr K, Boni A. Inhibition of human elastase from polymorphonuclear leucocytesby gold sodiumthiomalate and pentosan polysulfate (SP-54). Biochem Pharmacol 1981; 30:703–708.
88. Baici A. Interactions between human leucocytes elastase and chondroitin sulfate. Chem BiolInteractions 1984; 51:11.
89. Marossy K. Interaction of the antitrypsin and elastase-like enzyme of the human granulocyte withglycosaminoglycans. Biochim Biophys Acta 1981; 659:351–361.
90. De Gennaro F, Piccioni PD, Caporali R, Luisetti M, Contecucco C. Effet du traitement par le sulfatede galactosaminoglucuronoglycane sur l’estase granulocytaire synovial de patients atteints d’os-teoarthrose. Litera Rhumatologica 1992; 14:53–60.
91. D’Ambrosio E, Casa B, Bompani R, Scali G, Scali M. Glucosamine sulphate: a controlled clinicalinvestigation in arthrosis. Pharmatherapeutica 1981; 2(8):504–508.
92. Crolle G, D’Este E. Glucosamine sulphate for the management of arthrosis: a controlled clinicalinvestigation. Curr Med Res Opin 1980; 7(2):104–109.
93. Drovanti A, Bignamini AA, Rovati AL. Therapeutic activity of oral glucosamine sulfate inosteoarthrosis: a placebo-controlled double-blind investigation. Clin Ther 1980; 3(4):260–272.
94. Noack W, Fsicher M, Forster KK, Rovatis LC, Senikar I. Glucosamine sulfate in osteoarthitis of theknee. Osteoarthritis Cart 1994; 2:51–59.
95. Pujalte JM, Llavore EP, Ylescupidez FR. Double-blind clinical evaluation of oral glucosamine sul-phate in the basic treatment of osteoarthrosis. Curr Med Res Opin 1980; 7(2):110–114.
96. Reichelt A, Forster KK, Fischer M, Rovati LC, Setnikar I. Efficacy and safety of intramuscular glu-cosamine sulfate in osteoarthritis of the knee: a randomized, placebo-controlled, double-blind study.Drug Res 1994; 44:75–80.
97. Vaz AL. Double-blind clinical evaluation of the relative efficacy of ibuprofen and glucosamine sulphatein the management of osteoarthrosis of the knee in out-patients. Curr Med Res Opin 1982; 8:145–149.
98. Vajaradul Y. Double-blind clinical evaluation of intra-articular glucosamine in outpatients withgonarthrosis. Clin Ther 1981; 3(5):336–343.
99. Tapadinhas MJ, Rivera IC, Bignamini AA. Oral glucosamine sulphate in the management of arthosis:Report on a multi-centre open investigation in Portugal. Pharmatherapeutica 1982; 3(3):157–168.
100. Vetter VG. Glukosamine in der therapie des degenerativen rheumatismus. Duet Med J 1965;16:446–449.
101. L’Hirondel JL. Klinische doppelblind-studie mit oral verabreichtem chondroitinsulfat gegen placebobei der tibiofemoralen gonarthrose (125 patienten). Litera Rhumatologica 1992; 14:77–84.
102. Kerzberg EM, Roldan EJ, Castelli G, Huberman ED. Combination of glycosaminoglycans andacetylsalicylic acid in knee osteoarthrosis. Scand J Rheumatol 1987; 16(5):377–380.
103. Mazieres B, Loyau G, Menkes CJ, et al. [Chondroitin sulfate in the treatment of gonarthrosis andcoxarthrosis. 5-months result of a multicenter double-blind controlled prospective study usingplacebo]. Rev Rhum Mal Osteoartic 1992; 59(7,8):466–472.
104. Rovetta G. Galactosaminoglycuronoglycan sulfate (matrix) in therapy of tibiofibular osteoarthritisof the knee. Drugs Exptl Clin Res 1991; 17:53–57.
105. Muller-Fassbender H, Bach GL, Haase W, Rovato LC, Setnikar I. Glucosamine sulfate compared toibuprofen in osteoarthritis of the knee. Osteoarthritis Cartilage 1994; 2:61–69.
106. McAlindon TE, LaValley MP, Gulin JP, Felson DT. Glucosamine and chondroitin for treatment ofosteoarthritis: a systematic quality assessment and meta-analysis. JAMA 2000; 283:1469–1475.
107. Cibere J, Esdaile JM, Thorne A, Singer J, Kopec JA, Canvin J, et al. Multicenter RandomizedDouble-Blind Placebo-Controlled Glucosamine Discontinuation Trial in Osteoarthritis. ArhritisRheum 2002; 46(9(Suppl)):S1549.
108. McAlindon T, Formica M, Kabbara K, LaValley M, Lehmer M. Conducting clinical trials over theinternet: feasibility study. Bmj 2003; 327(7413):484–487.
109. Hughes R, Carr A. A randomized, double-blind, placebo-controlled trial of glucosamine sulphate asan analgesic in osteoarthritis of the knee. Rheumatology (Oxford) 2002; 41:279–284.
110. Rindone JP, Hiller D, Collacott E, Nordhaugen N, Arriola G. Randomized, controlled trial of glu-cosamine for treating osteoarthritis of the knee. West J Med 2000; 172(2):91–94.
111. Reginster JY, Deroisy R, Rovati LC, et al. Long-term effects of glucosamine sulphate on osteoarthri-tis progression: a randomised, placebo-controlled clinical trial. Lancet 2001; 357(9252):251–256.
112. Pavelka K, Gatterova J, Olejarova M, Machacek S, Giacovelli G, Rovati LC. Glucosamine sulfateuse and delay of progression of knee osteoarthritis: a 3-year, randomized, placebo-controlled, double-blind study. Arch Intern Med 2002; 162(18):2113–2123.

Chapter 16 / Osteoarthritis 423
113. Altman R, Brandt KD, Hochberg MC, Moskowitz R. Design and conduct of clinical trials in patientswith osteoarthritis: recomendations from a task force of the Osteoarthritis Research Society.Osteoarthritis Cartilage 1996; 4:217–243.
114. Michel B, Stucki G, Haeuselmann H, et al. Retardation of Knee Joint Space Narrowing ThroughChrondroitin 4&6. Arthritis Rheum 2003; 48(9):S77.
115. Ernst E. Avocado-soybean unsaponifiables (ASU) for osteoarthritis—a systematic review. ClinRheumatol 2003; 22(4-5):285–288.
116. Muller-Fassbender H. Double-blind clinical trial of S-adenosylmethionine versus ibuprofen in thetreatment of osteoarthritis. Am J Med 1987; 83(5A):81–83.
117. Konig B. A long-term (two years) clinical trial with S-adenosylmethionine for the treatment ofosteoarthritis. Am J Med 1987; 83(5A):89–94.
118. Vetter G. Double-blind comparative clinical trial with S-adenosylmethionine and indomethacin inthe treatment of osteoarthritis. Am J Med 1987; 83(5A):78–80.
119. Maccagno A, Di Giorgio EE, Caston OL, Sagasta CL. Double-blind controlled clinical trial of oralS-adenosylmethionine versus piroxicam in knee osteoarthritis. Am J Med 1987; 83(5A):72–77.
120. Glorioso S, Todesco S, Mazzi A, et al. Double-blind multicentre study of the activity of S-adenosyl-methionine in hip and knee osteoarthritis. Int J Clin Pharmacol Res 1985; 5(1):39–49.
121. Chopra A, Lavin P, Chitre D, Patwardhan B, Polisson R. A clinical study of an ayuvedic medicine(Asian medicine) in OA knees. Arthritis Rheum 1998; 41:S992.
122. Conrozier T, Vignon E. Die Wirkung von Chondroitinsulfat bei der Behandlung derHuftgelenksarthrose Eine Doppelblindstudie gegen Placebo. Litera Reumatologica 1992; 14:69–75.
123. Morreale P, Manopulo R, Galati M, Boccanera L, Saponati G, Bocchi L. Comparison of the antiin-flammatory efficacy of chondroitin sulfate and diclofenac sodium in patients with knee osteoarthritis.J Rheumatol 1996; 23(8):1385–1391.


From: Preventive Nutrition: The Comprehensive Guide for Health Professionals, Third EditionEdited by: A. Bendich and R. J. Deckelbaum © Humana Press Inc., Totowa, NJ
425
17 Calcium Requirements DuringTreatment of Osteoporosis in Women
Richard Eastell
KEY POINTS
● The major studies of osteoporosis therapies have ensured that adequate calcium andvitamin D was available, usually administered as supplements.
● Many patients with osteoporosis have inadequate dietary intake of calcium and vitaminD insufficiency.
● The calcium requirement is increased during treatment with anti-resorptive therapy forosteoporosis.
● Vitamin D deficiency impairs the response to anti-resorptive therapy for osteoporosis.● Calcium supplementation results in a decrease in bone resorption, and this is the likely
mechanism for the decrease in fracture risk.● I recommend that about 1000 mg of calcium and 800 IU of vitamin D be given along
with anti-resorptive therapy for osteoporosis.
1. INTRODUCTION
Almost all of the phase III clinical trials for the treatment of postmenopausal osteo-porosis included a calcium supplement, and most included vitamin D (1). However,when these treatments were approved by the regulatory authorities, the only recom-mendation made was that the diet should contain sufficient calcium and vitamin D. Thischapter considers whether the calcium and vitamin D is simply a placebo in these studies,and whether women with osteoporosis commonly attain adequate intakes of calcium andvitamin D without supplementation.
1.1. How Much Calcium and Vitamin D Was Used in the Key Phase IIIClinical Trials for Osteoporosis?
There have been many clinical trials of drugs for postmenopausal osteoporosis. Asummary of the major clinical trials is included in Table 1. The usual doses of calciumand vitamin D supplementation were between 500 and 1000 mg/d and 250 and 600IU/d, respectively. These amounts of vitamin D would be expected to increase serum25-hydroxyvitamin D [25-(OH)D] by between 6 and 15 nmol/L (2).

426 Part V / Bone Diseases
1.2. Are These Levels Reached in the Habitual Diet?The recommendation in the Fracture Intervention Trial Study was that a food-frequency
questionnaire be used to evaluate dietary calcium (3). If the dietary calcium was below1000 mg/d, then the patient should be given 500 mg of calcium per day. About 82% ofwomen with osteoporosis failed to achieve this level.
In the Vertebral Efficacy with Risedronate Therapy (VERT) Studies, the recommendationwas to measure 25(OH)D and to supplement with vitamin D (up to 500 IU/d) if the value of25(OH)D was below 40 nmol/L. About 36% of patients in the multinational VERT Studyrequired supplementation (4). This threshold is quite low; it is becoming accepted that athreshold of 80 nmol/L is desirable to prevent the biochemical changes of subclinical osteo-malacia (high parathyroid hormone [PTH] and bone turnover markers) (2). Thus, to repro-duce the conditions under which these trials were conducted, it is likely that most peoplereceiving treatment for osteoporosis need supplementation with calcium and vitamin D.
2. RATIONALE FOR SUPPLEMENTATION
2.1. Positive Calcium Balance With TreatmentThere is a positive calcium balance after starting therapy with anti-resorptive therapy.
Thus, the total body bone mineral content increases by 1% at 1 yr after treatment withalendronate plus calcium (500 mg/d) (5). This is equivalent to a positive balance of about20 mg/d. In women given 500 mg/d of calcium alone, there was 0.5% decrease in totalbody mineral content; this is equivalent to a negative calcium balance of about 10 mg/d,so the extra requirement resulting from administration of 10 mg/d of alendronate is30 mg/d. This requirement can be fulfilled by an adaptation of the body by an increasein the fraction of dietary calcium absorbed (6). However, this mechanism is less effective inthe elderly. It can be achieved by the calcium supplement: if about 10% is absorbed, then anextra 50 mg/d of calcium is available to support the positive calcium balance.
2.2. Secondary HyperparathyroidismThe period of positive calcium balance represents a decrease in net bone resorption,
which in turn results in a tendency for serum calcium to decrease. The parathyroidglands compensate for this decrease by increasing serum PTH and, consequently,
Table 1The Level of Calcium and Vitamin D Supplementation in Several Large Clinical Trials
of Postmenopausal Osteoporosis
Name of Antiresorptive Calcium Vitamin D,trial drug (mg/d) IU/day
FIT 1 and 2 (3,24) Alendronate 500a 250VERT MN and NA (4,25) Risedronate 1000 Up to 500b
PROOF (26) Calcitonin 1000 400MORE (27) Raloxifene 500 Up to 600
a If dietary calcium is less than 1000 mg/d (in 82% of subjects in FIT 1).b If 25(OH)D is less than 40 nmol/L (in 36% of subjects in VERT-MN).FIT, Fracture Intervention Trial; VERT, Vertebral Efficacy with Risedronate Therapy; PROOF, Prevent
Recurrence of Osteoporotic Fractures; MORE, Multiple Outcomes of Raloxifene Evaluation; MN, multi-national; NA, North America.

Chapter 17 / Calcium and Osteoporosis Treatment 427
increasing the serum calcitriol level (7). It is unclear whether the effect of the increasein PTH is beneficial or not. The increase in PTH may be attenuated, but not prevented,by the coadministration of supplemental calcium.
2.3. Vitamin D Deficiency Prevents Antiresorptive Effect and ImpairsMuscle Strength
Koster et al. (8) recruited 28 osteopenic patients with vitamin D deficiency [25(OH)D<40 nmol/L) and compared their bone mineral density (BMD) response to 1 yr of cyclicaletidronate with a control group that had normal 25(OH)D. The control group showed anincrease in BMD of 2 to 6% in response to cyclic etidronate, depending on the site of mea-surement. The vitamin D-deficient group had little or no improvement in the BMD andfurther deterioration of the vitamin D deficiency, as indicated by a decrease in serumcalcium and an increase in PTH and osteocalcin. It is likely that the vitamin D defi-ciency prevented the increase in calcitriol. Thus, there would be no increase in calciumabsorption in response to the etidronate therapy.
There is some evidence that vitamin D therapy might reduce the risk of falls in post-menopausal women. Pfeifer et al. (9) reported that 148 women with low 25(OH)D(<50 nmol/L) were given a calcium supplement (1000 mg/d) and randomized to vita-min D (800 IU/d) or placebo for 1 yr. Calcium supplementation with or withoutvitamin D supplementation resulted in a significant decrease in serum PTH; however,the vitamin D supplementation resulted in a further decrease in serum PTH. The vita-min D also resulted in decreases in both body sway and the average number of fallsper subject. Bischoff et al. (10) reported that 122 elderly women were given a calciumsupplement (1200 mg/d) and randomized to vitamin D (800 IU/d) or placebo for 3 mo.The vitamin D resulted in a 49% decrease in the average number of falls per subjectand an improvement in musculoskeletal function. Both studies assessed the number offalls and not the number of subjects who fell; this is a limitation of the studies.Nonetheless, this reduction in the risk of falling could translate into a decrease in therisk of fracture.
3. EFFECTS OF CALCIUM SUPPLEMENTATIONON BONE TURNOVER AND BMD
The effect of calcium supplementation depends on the dose and the population inwhich it is studied. There is a positive effect on BMD in women who are more than6 yr after menopause, and the effect is more clearly seen in those women taking adiet that is low in calcium (<400 mg/d) (11). The effect is present at the usual sitesmeasured—the distal forearm, spine, proximal femur, and total body. The effect ismaximal in the first year and is reversible (once the supplement is stopped, theeffect resolves).
The effect of calcium supplementation is dose-dependent, and it depends on the timeof day the dose is administered. If the calcium is administered in the evening, then thenormal nocturnal increase in bone resorption is prevented and, therefore, the 24-h resorp-tion rate is reduced more than if the supplement is administered in the morning (12).
Nieves et al. (13) determined that hormone-replacement therapy and calcitonin trialsthat included a calcium supplement resulted in an extra 1 to −2% gain in BMD whencompared to those trials without a calcium supplement.

428 Part V / Bone Diseases
3.1. Effect on Bone Turnover3.1.1. MAGNITUDE
Bone resorption can be assessed by measuring the degradation products of type I colla-gen; these include deoxypyridinolone and the telopeptides of type I collagen, NTX andCTX. The effect of calcium (and vitamin D) is to decrease bone turnover markers. The bio-chemical markers of bone resorption decrease within 4 h of administration of the first doseof calcium to the maximum level of suppression (14). The markers remain suppressed foras long as the calcium is administered. The size of the effect depends on the dose and onthe nature of the bone resorption marker. For a marker such as urinary NTX, the decreasein women with postmenopausal osteoporosis averages about 20% (Fig. 1; ref. 15).
Calcium plus risedronate results in a median decrease in urinary NTX of 51% (Fig. 1;ref. 16). However, if women are already taking calcium supplements, then the meandecrease in urinary NTX is only 37% (unpublished data, Improving Measures ofPersistance on “Actonal” Treatment [IMPACT] study).
3.2. Mechanism for the Reduction in Bone TurnoverThe decrease in bone turnover with calcium supplementation is mainly a conse-
quence of the decrease in serum PTH. Thus, within 1 h of administration of calciumsupplements, the serum PTH begins to decrease and is maximal at about 2 h; thischange correlates with the decrease in bone resorption markers at 4 h (17). Ledger et al.(18) conducted a calcium infusion study in older women over a period of 24 h andshowed that the serum PTH and the urinary NTX excretion decreased to the levelsfound in healthy women, indicating that the increase in PTH with aging is an importantcause of the age-related increase in bone resorption.
There could be other mechanisms for the suppression of bone resorption markers. Itmay be that osteoclasts have calcium-sensing receptors and that they respond to the
Fig. 1. The effect of calcium supplementation in postmenopausal osteoporosis. Thelines show the median change in the bone resorption markers urinary NTX and CTX in693 women with osteoporosis treated with calcium (with or without vitamin D) alonein broken lines or with risedronate 5 mg/d (solid lines). (Data from Eastell et al. [15]).
Chapter 17 / Calcium and Osteoporosis Treatment 429
very small increase in serum-ionized calcium after administration of a calcium supple-ment. Another alternative is that the intestine secretes a factor in response to calciumsupplementation. One such factor might be an increase in gastrin that would subse-quently stimulate the secretion of calcitonin.
4. EFFECTS OF CALCIUM SUPPLEMENTATION ON FRACTURE RISK REDUCTION
4.1. Relationship Between the Change in Bone Turnoverand Fracture Risk Reduction
The decrease in the bone resorption markers have explained much of the antifractureeffect of antiresorptive therapy, even more so than the increase in BMD. In one study,the decrease in NTX and CTX appeared to explain up to 66% of the reduction in verte-bral fractures and up to 77% in nonvertebral fractures (15). The same holds true for theeffect of calcium supplementation on vertebral fractures. Thus, the relationship betweenthe change in bone resorption markers and vertebral fracture risk reduction in the groupgiven calcium alone was significant, indicating that with calcium, the greater the reduc-tion in bone resorption markers in an individual, the greater the reduction in vertebralfracture risk (Fig. 2).
4.2. Clinical Trials of Fracture Risk ReductionShea et al. (19) performed a meta-analysis of the studies with calcium alone on BMD
and on fracture. They believed that up to 2000, there were 15 trials of sufficient qualityto include in their analysis. They reported that at 2 yr, calcium supplementation had aneffect on the BMD of the total body (2.1%), lumbar spine (1.6%), proximal femur(1.7%), and distal radius (1.9%). The relative risk of fractures of the vertebrae was 0.77(95% confidence interval [CI] 0.54–1.09), and for nonvertebral fractures, the relativerisk was 0.86 (95% CI 0.43–1.72). However, this analysis omits two of the key studies.These studies included vitamin D and, therefore, were considered in a separate analysisreported by Papadimitropoulos et al. (20). They reported that for nonvertebral fractures,the relative risk for fracture was 0.78 (95% CI 0.55–1.09). It is surprising that the lat-ter result did not reach conventional levels of significance, because it included threetrials, two of which had a significant result (21,22). The main influence on the analy-sis was the trial of Lips (23), which did not include a calcium supplement and used arelatively low dose of vitamin D (400 IU/d as compared to 700 and 800 IU/d for theother two studies).
On balance, it is likely that calcium and vitamin D, when given in adequate doses(e.g., 1000 mg/d of calcium and 800 IU/d of vitamin D) reduce the risk of vertebral andnonvertebral fractures in postmenopausal women. However, this effect is not as great asthe effects of treatments such as risedronate, alendronate, or Raloxifene.
5. CONCLUSIONS AND RECOMMENDATIONS
Almost all of the clinical trials of treatments for osteoporosis included calcium and/orvitamin D as supplements. These supplements are more effective than placebo and actin their own right to reduce the risk of fracture. It is likely, although not proven, thatthey add to the antifracture effects of the antiresorptive drugs with which they are

430 Part V / Bone Diseases
administered. It would appear that the supplemental dose that would help reduce frac-tures and strengthen muscle would be about 1000 mg of calcium and 800 IU of vitaminD per day.
REFERENCES1. Eastell R. Treatment of postmenopausal osteoporosis. N Engl J Med 1998; 338(11):736–746.2. Heaney RP, Weaver CM. Calcium and vitamin D. Endocrinol Metab Clin North Am 2003;
32(1):181–1943. Black DM, Cummings SR, Karpf DB, et al. Randomised trial of effect of alendronate on risk of frac-
ture in women with existing vertebral fractures. Fracture Intervention Trial Research Group. Lancet1996; 348(9041):1535–1541.
4. Reginster J, Minne HW, Sorensen OH, et al. Randomized trial of the effects of risedronate on verte-bral fractures in women with established postmenopausal osteoporosis. Vertebral Efficacy withRisedronate Therapy (VERT) Study Group. Osteopor Int 2000; 11(1):83–91.
5. Liberman UA, Weiss SR, Broll J, et al. Effect of oral alendronate on bone mineral density and theincidence of fractures in postmenopausal osteoporosis. N Engl J Med 1995; 333(22):1437–1443.
6. Adami S, Frijlink WB, Bijvoet OL, O’Riordan JL, Clemens TL, Papapoulos SE. Regulation of cal-cium absorption by 1,25,dihydroxy-vitamin D—studies of the effects of a bisphosphonate treatment.Calcif Tissue Int 1982; 34(4):317–320.
7. Pereda CA, Hannon RA, Naylor KE, Eastell R. The impact of subcutaneous oestradiol implants onbiochemical markers of bone turnover and bone mineral density in postmenopausal women. BJOG2002; 109(7):812–820.
8. Koster JC, Hackeng WH, Mulder H. Diminished effect of etidronate in vitamin D deficientosteopenic postmenopausal women. Eur J Clin Pharmacol 1996; 51(2):145–147.
9. Pfeifer M, Begerow B, Minne HW, Abrams C, Nachtigall D, Hansen C. Effects of a short-term vit-amin D and calcium supplementation on body sway and secondary hyperparathyroidism in elderlywomen. J Bone Miner Res 2000; 15(6):1113–1118.
Fig. 2. The relationship between the change in bone resorption marker (CTX) and therisk of new vertebral fracture. There was a significant relationship overall between thedecrease in bone resorption and the decrease in risk of vertebral fracture, and this wastrue for the calcium group alone (broken line). Solid line represents the calcium plusrisedronate group.

Chapter 17 / Calcium and Osteoporosis Treatment 431
10. Bischoff HA, Stahelin HB, Dick W, et al. Effects of vitamin D and calcium supplementation on falls:a randomized controlled trial. J Bone Miner Res 2003; 18(2):343–351.
11. Dawson-Hughes B, Dallal GE, Drall EA, Sadowski L, Sahyoun N, Tannerbaum S. A controlled trialof the effect of calcium supplementation on bone density in postmenopausal women. N Engl J Med1990; 323(13):878–883.
12. Blumsohn A, Herrington K, Hannon RA, Shao P, Eyre DR, Eastell R. The effect of calcium supple-mentation on the circadian rhythm of bone resorption. J Clin Endocrinol Metab 1994;79(3):730–735.
13. Nieves JW, Komar L, Cosman F, Lindsay R. Calcium potentiates the effect of estrogen and calci-tonin on bone mass: review and analysis. Am J Clin Nutr 1998; 67(1):18–24.
14. Guillemant JA, Accarie CM, de lG, V, Guillemant SE. Different acute responses of serum type I col-lagen telopeptides, CTX, NTX and ICTP, after repeated ingestion of calcium. Clin Chim Acta 2003;337(1–2):35–41.
15. Eastell R, Barton I, Hannon RA, Chines A, Garnero P, Delmas PD. Relationship of early changes inbone resorption to the reduction in fracture risk with risedronate. J Bone Miner Res 2003;18(6):1051–1056.
16. Blumsohn A, Naylor KE, Timm W, Eagleton AC, Hannon RA, Eastell R. Absence of marked sea-sonal change in bone turnover: a longitudinal and multicenter cross-sectional study. J Bone MinerRes 2003; 18(7):1274–1281.
17. Ortolani S, Scotti A, Cherubini R. Rapid suppression of bone resorption and parathyroid hormonesecretion by acute oral administration of calcium in healthy adult men. J Endocrinol Invest 2003;26(4):353–358.
18. Ledger GA, Burritt MF, Kao PC, O’Fallon WM, Riggs BL, Khosla S. Role of parathyroid hormonein mediating nocturnal and age-related increases in bone resorption. J Clin Endocrinol Metab 1995;80(11):3304–3310.
19. Shea B, Wells G, Cranney A, et al. Meta-analyses of therapies for postmenopausal osteoporosis. VII.Meta-analysis of calcium supplementation for the prevention of postmenopausal osteoporosis.Endocr Rev 2002; 23(4):552–559.
20. Papadimitropoulos E, Wells G, Shea B, et al. Meta-analyses of therapies for postmenopausal osteo-porosis. VIII. Meta-analysis of the efficacy of vitamin D treatment in preventing osteoporosis inpostmenopausal women. Endocr Rev 2002; 23(4):560–569.
21. Dawson-Hughes B, Harris SS, Krall EA, Dallal GE. Effect of calcium and vitamin D supplementa-tion on bone density in men and women 65 years of age or older. N Engl J Med 1997;337(10):670–676.
22. Chapuy MC, Arlot ME, Duboeuf F, et al. Vitamin D3 and calcium to prevent hip fractures in elderlywomen. New Eng J Med 1992; 327:1637–1642.
23. Lips P, Graafmans WC, Ooms ME, Bezemer PD, Bouter LM. Vitamin D supplementation and frac-ture incidence in elderly persons. A randomised, placebo-controlled clinical trial. Ann Int Med 1996;124:400–406.
24. Cummings SR, Black DM, Thompson DE, et al. Effect of alendronate on risk of fracture in womenwith low bone density but without vertebral fractures: results from the Fracture Intervention Trial.JAMA 1998; 280(24):2077–2082.
25. Harris ST, Watts NB, Genant HK, et al. Effects of risedronate treatment on vertebral and nonverte-bral fractures in women with postmenopausal osteoporosis: a randomized controlled trial. VertebralEfficacy With Risedronate Therapy (VERT) Study Group. JAMA 1999; 282(14):1344–1352.
26. Chesnut CH, III, Silverman S, Andriano K, et al. A randomized trial of nasal spray salmon calcitoninin postmenopausal women with established osteoporosis: the prevent recurrence of osteoporoticfractures study. PROOF Study Group. Am J Med 2000; 109(4):267–276.
27. Ettinger B, Black DM, Mitlak BH, et al. Reduction of vertebral fracture risk in postmenopausalwomen with osteoporosis treated with raloxifene: results from a 3-year randomized clinical trial.Multiple Outcomes of Raloxifene Evaluation (MORE) Investigators. JAMA 1999; 282(7):637–645.


From: Preventive Nutrition: The Comprehensive Guide for Health Professionals, Third EditionEdited by: A. Bendich and R. J. Deckelbaum © Humana Press Inc., Totowa, NJ
433
18 OsteoporosisProtein, Minerals, Vitamins, and OtherMicronutrients
Robert P. Heaney
KEY POINTS
● Bone health requires total nutrition, because the integrity of bone tissue depends on theintegrity of its cells, which (similarly to most other tissues) need a broad array ofmacro- and micronutrients. Additionally, calcium and protein play key roles, becausethe bulk of the bony material is made up of these substances.
● Bone turns over relatively slowly. Thus, the effects of inadequate nutrition on bone oftenare delayed, and the structural properties of bone tend to reflect past nutrition more thancurrent intakes.
● Calcium is a threshold nutrient. The minimum daily requirement is the intake at whichbony response plateaus. To reach this threshold, calcium intake should be 1500 mg/dboth during growth and after age 50. With lifelong calcium intakes in this range, risk ofosteoporotic hip and other nonspine fractures can be reduced by 30 to 50%.
● Vitamin D is predominantly produced in the skin. Recommended daily oral intakes aresufficient only to prevent the most extreme bony manifestations of vitamin D defi-ciency. Optimal vitamin D status is ensured by serum 25-hydroxyvitamin D [25(OH)D]values of 80 nmol/L (32 ng/mL) or more. Lower values are associated with impairedcalcium absorption and increased osteoporotic fracture risk. Daily use of vitamin D maybe as high as 4000 IU (100 μg). For most elderly individuals, a daily oral dose of 1000IU or higher is necessary to sustain adequate serum 25(OH)D concentrations.
● Protein, once thought to be potentially harmful to bone when ingested in large quanti-ties, is now best understood as complementary to calcium. Together, the two nutrientsprovide the bulk constituents of bony material; to achieve the full benefit of either, theintake of the other must be adequate as well. Protein intakes that optimize bony responseare uncertain but, from available data, appear to be above the current RecommendedDaily Allowance (RDA; 0.8 g/kg of body weight).
● Although typical magnesium intakes are below the RDA (310 and 400 mg/d for womenand men, respectively), there appear to be no skeletal consequences of the shortfall.Supplemental magnesium does not improve calcium absorption in individuals consumingtypical diets and has no effect on calcium balance.

434 Part V / Bone Diseases
● Vitamin K, zinc, manganese, and copper are involved in various aspects of bone matrixformation, but it is not known whether deficiency of any of these contributes to thedevelopment or severity of typical osteoporosis.
● Recovery from hip fracture can be substantially improved with aggressive attention tothe nutritional status of patients with hip fractures, with special emphasis on repairingthe protein malnutrition that is common in such patients.
1. INTRODUCTION
1.1. Nutrition in the Osteoporotic Fracture ContextOsteoporosis currently is defined as a condition of skeletal fragility resulting from
decreased bone mass and microarchitectural deterioration of bone tissue, with consequentincreased risk of fracture. The condition is multifactorial in pathogenesis. Nutrition affectsbone health in two distinct ways. First, bone tissue deposition, maintenance, and repair arethe result of cellular processes, which are as dependent on nutrition, as are the correspond-ing processes of any other tissue. The production of bone matrix, for example, requires thesynthesis and posttranslational modification of collagen and an array of other proteins.Nutrients involved in these cellular activities include not only the amino acid building blocksof the protein itself but vitamins C, D, and K and the minerals phosphorus, copper, man-ganese, and zinc. Additionally, the regulation of calcium homeostasis through modulationof bone resorption requires normal magnesium nutrition. Second, the skeleton serves as avery large nutrient reserve for two minerals, calcium and phosphorus, and the size of thatreserve (ultimately equivalent to the strength of the skeletal structures) is dependent, inpart, on the daily balance between absorbed intake and excretory loss of these two minerals.
Similar to most engineering structures, strength in bone is dependent not only on itsmassiveness but also on the arrangement of its material in space and on the intrinsicstrength of its component material (particularly in bone, because over long periods ofuse, that strength is influenced by the accumulation of unrepaired fatigue damage aswell as by the prevalence and location of remodeling loci, which are locally weak untilfully repaired). All three factors play a role in most low-trauma fractures, and it often isnot possible to say which may be the most important in any given case.
Bone mass and density are influenced by many factors in industrialized nations.Physical activity, gonadal hormones, and nutrition are the three factors that are mostcommonly found to limit achieving the bone mass that is genetically possible. In adultsof these nations, calcium and vitamin D are the nutrients most likely to be in short sup-ply. Specifically, calcium intake may be inadequate because it is low; however, even whenstatistically “normal,” it still may be inadequate because of subnormal absorption (1) orgreater than normal excretory loss (2,3).
Because calcium and vitamin D are the nutrients most likely to be limiting in theindustrialized nations, much of the following discussion focuses on these two nutrients. Itis necessary to stress at the onset that both function mainly as nutrients—not as drugs.Therefore, their beneficial effects are confined to individuals whose intake of either isinsufficient. Also, calcium is not an isolated nutrient; it occurs in foods along with othernutrients, and it has been shown that diets low in calcium also tend to be nutritionallypoor in other respects as well (4). Thus, although it is necessary to deal with nutrients oneby one in an analysis such as this chapter, it is useful to bear in mind that the disorders inour patients are likely to be more complex.

Chapter 18 / Osteoporosis 435
2. CALCIUM
The primitive function of the skeleton is to serve as a source and as a sink for calciumand phosphorus, that is, as a reserve to offset shortages and as a place for safely storingdietary surpluses, at least after periods of depletion. For example, we see this reservefeature of skeletal function expressed in laboratory animals such as cats, rats, and dogs,which, when placed on low-calcium intakes, show reduced bone mass as needed to main-tain near constancy of calcium levels in the extracellular fluid (5). This activity is mediatedby parathyroid hormone (PTH [6]) and involves actual bone destruction, not leaching ofcalcium from bone.
By nature, reserves are designed to tide organisms over external shortages. Whenintake is inadequate, the reserve is the first component of the body content to bedepleted. With most nutrients, this depletion of the reserve has no detectable impacton the health or function of the organism. Only after the reserve is exhausted and themetabolic pool begins to be depleted does clinical disease express itself. For somenutrients (e.g., vitamin A, energy), the reserve can be quite large, and the latentperiod may last many months. However, for others (e.g., the water-soluble vitamins),the reserve may be very small, and detectable dysfunction develops quickly whenintake drops.
Calcium is a unique nutrient in that over the course of evolution of the higher verte-brates, the calcium reserve acquired a second role, namely, internal stiffening and rigid-ity; today, this is the most apparent feature of the skeleton. Calcium is the only nutrientwith a reserve that possesses such a major—if secondary—function, and the size of thereserve is unusually large relative to the cellular and extracellular metabolic pools ofcalcium. As a result, dietary insufficiency virtually never directly impairs tissue func-tions that are dependent on calcium, at least not in ways we now recognize. However,because bone strength is a function of bone mass, it inexorably follows that anydecrease whatsoever in the size of the calcium reserve (any decrease in bone mass) willproduce a corresponding decrease in bone strength. We literally walk on our calciumreserve. It is this unique feature of calcium nutriture that is the basis for the link betweencalcium intake and bone status.
2.1. Ascertaining the Requirement for CalciumCalcium functions as a threshold nutrient, similarly to iron. This means that below
some critical value, the nutrient effect (bone mass for calcium and hemoglobin mass foriron) is limited by available supplies, whereas above that value (i.e., the “threshold,”),no further benefit for that particular function accrues from additional increases inintake. This biphasic relationship is illustrated in Fig. 1, in which the intake–effect rela-tionship is depicted first schematically (Fig. 1A) and then as exemplified by bone cal-cium data derived from a growing animal model (Fig. 1B). Figure 1B directly expressesthe effect of the nutrient as the amount of bone calcium an animal is able to accumulatefrom any given intake. The minimum requirement can be defined as the intake at whichthe curve first becomes flat.
However, the same basic relationship holds throughout life, even when bone may beundergoing some degree of involution. The threshold concept is generalized to all lifesituations in Fig. 2A, which schematically demonstrates what the intake/retentioncurves look like during growth, maturity, and involution. In brief, the plateau occurs at

436 Part V / Bone Diseases
a positive value for retention during growth, at zero retention in the mature individual,and, sometimes, at a negative value in the elderly. (Available evidence suggests that theplateau during involution is negative in the first 3 to 5 yr after menopause, rises to zerofor the next 10 to 15 yr, and then becomes increasingly negative in the elderly.) At all
Fig. 1. Threshold behavior of calcium intake. (A) Theoretical relationship of bone accu-mulation to intake. Below a certain value (the threshold), bone accumulation is a linearfunction of intake (the ascending line); in other words, the amount of bone that can beaccumulated is limited by the amount of calcium ingested. Above the threshold (the hor-izontal line), bone accumulation is limited by other factors and is no longer related tochanges in calcium intake. (B) Actual data from two experiments in growing rats, show-ing how bone accumulation does, in fact, exhibit a threshold pattern. (Redrawn from datain; ref. 7; Copyright Robert P. Heaney, 1992. Reproduced with permission.)
Fig. 2. (A) Schematic calcium intake and retention curves for three life stages.Retention is greater than zero during growth, zero at maturity, and may be negative dur-ing involution. (B) The involution curve only. Point B designates an intake below themaximal calcium retention threshold, and Point A represents an intake above the threshold.(Copyright Robert P. Heaney, 1998. Reproduced with permission.)

Chapter 18 / Osteoporosis 437
life stages, the best representation of the minimum requirement is the intake value justat or above the effect threshold shown in Figs. 1 and 2.
In Fig. 2B, which shows only the involutional curve, there are two points locatedalong the curve, one below (B) and one above (A) the threshold. At point A, calciumretention is negative for reasons intrinsic to the skeleton, whereas at B, involutionaleffects are compounded by inadequate intake, which makes the balance more negativethan it needs to be. Point B (or lower) is probably where most elderly adults in the indus-trialized nations would be situated today (see below). The goal of calcium nutrition inthis life stage is to move to point A and thereby ensure that insufficient calcium intakeis not aggravating any underlying bone loss.
There has been much uncertainty and confusion in recent years about what thatintake may be for various ages and physiological states. With the 1994 ConsensusDevelopment Conference on Optimal Calcium Intake (8) and the dietary referenceintakes (DRIs) released by the Food and Nutrition Board of the Institute of Medicine(9), the bulk of that confusion has been resolved. The evidence for the intakes recom-mended by these expert panels is summarized both in their respective reports and inrecent reviews of the relationship between nutrition and osteoporosis (10,11), and onlythe highlights are mentioned in this chapter.
However, it is worth noting that the recommendations of both panels, althoughexpressed in quantitative terms, are basically qualitative and can be summarized as fol-lows: Contemporary calcium intakes in the United States, by both men and women, aretoo low for optimal bone health. The most persuasive of the evidence leading to this con-clusion came in the form of several randomized controlled trials showing reduction inboth age-related bone loss and in fractures following augmentation of prevailing calciumintakes (12–19). For technical reasons relating to bone remodeling biology (20), random-ized controlled trials are not well-suited to dose ranging. Therefore, although the evidencewas persuasive that prevailing intakes were too low, recommended levels in several casesinvolved ranges and were clearly prudential judgments centered of necessity on intakesemployed in the trials concerned. The consensus panel’s recommendations, the DRIs ofthe Institute of Medicine, and the corresponding 1989 RDAs (21) are set forth in Table 1.
Table 1Various Estimates of the Calcium Requirement in Women
Age 1989 RDA NIHa 1997 DRI (AI)b
1–5 800 800 500/8006–10 800 800–1200 800/130011–24 1200 1200–1500 1300/1000Pregnancy/lactation 1200 1200–1500 100024–50/65 800 1000 1000/120065+ 800 1500 1200
Abbreviations: RDA, recommended daily allowance; NIH, National Institutes of Health; DRI (AI),daily recommended intake (adequate intake).
aRecommendations for women as proposed by the Consensus Development Conference on OptimalCalcium Intake (8).
b“AI” refers to “adequate intake” (9), a value that, in this context, is equivalent to an average require-ment. The corresponding RDA could be 20–30% higher (i.e., 1000 in children, 1600 in adolescents, 1200in adults to age 50 yr, 1200 during pregnancy and lactation, and 1450 in those over age 50 yr). The pres-ence of two values reflects the fact that the age categories for the DRIs overlapped those of the NIH.

438 Part V / Bone Diseases
2.2. Primary Prevention: The Acquisition of Genetically ProgrammedBone Mass
At birth, the human skeleton contains approx 25 to 30 g of calcium; at maturity inwomen, it contains 1000 to 1200 g of calcium. This difference must be provided via thediet. Furthermore, unlike other structural nutrients such as protein, the amount of cal-cium retained is always substantially less than the amount ingested. This is both becauseabsorption efficiency is relatively low even during growth and because calcium is lostdaily through shed skin, nails, hair, and sweat as well as in urine and unreclaimed diges-tive secretions. With the exception of during infancy and the pubertal growth spurt,when retention may be as much as 25 to 30% of intake, only about 4 to 8% of ingestedcalcium is retained each day during most of the growth period. This inefficient retentionis not so much because ability to build bone is limited but because the primitive calciumintake to which our physiologies are adapted was high. An intestinal absorptive barrieris a protection against calcium surfeit, and inefficient cutaneous and renal retentionreflects primitive environmental abundance.
When ingested calcium is less than optimal, the balance between bone formation andresorption, normally positive during growth, falls toward zero. This occurs because PTHaugments bone resorption at the endosteal–trabecular surface of growing bones to sus-tain the level of ionized calcium in the extracellular fluid, which has to meet the demandof ongoing mineralization at the periosteum and growth plates. When this demandexceeds the amount of calcium absorbed from the diet and released from growth-relatedbone modeling, more PTH is secreted, and resorption increases further until the balancebecomes zero or negative. However, growth in bone size continues, and a limited quantityof mineral must now be redistributed over an expanding structural volume.
Net bone accumulation is greater as calcium intake increases, but only to the pointwhere endosteal–trabecular resorption results solely from the genetic program governingthe shaping of bone during growth and is not being driven by body needs for calcium.Above that level, as depicted in the data of Fig. 1B, further increases in calcium intakeproduce no further bony accumulation. The intake required to achieve the full geneticprogram and thus to assure peak bone mass is the intake that corresponds to the beginningof the plateau region in Fig. 1. This value is different for different stages of growth,partly because growth rates are not constant and also because as body size increases,obligatory calcium losses through skin and excreta increase as well.
By combining the many published reports of calcium balance studies during growth,it is possible to demonstrate in humans the pattern of plateau behavior found in laboratoryanimals and then to estimate, from the aggregated data, the intake values that correspondto the threshold (22,23). Figure 3 represents one example of the relationship betweenintake and retention, combining the results of many published studies of calcium balancederived from a subset of the adolescents whose balances were assembled by Matkovic(24). Figure 3 clearly shows the plateau type of behavior that both animal studies andtheoretical considerations predict. It also shows that at intakes less than the plateauthreshold, daily storage is less than optimal (i.e., accumulation of bone is limited byintake). Therefore, any such limiting of intake must be considered inadequate.
As demonstrated in Fig. 3, the daily threshold value for adolescents is about 1500 to1600 mg. The best available estimates for the value of this daily threshold from balancestudies performed at other stages of growth are 1400 mg in children and 1000 mg inyoung adults to age 30 yr (see Subheading 2.3.). The dual intake balance studies of

Chapter 18 / Osteoporosis 439
Jackman et al. (23) found that 1300 mg/d in adolescents was the lowest intake that wasconsistent with their model for the retention plateau.
These values, based on analysis of balance data, are buttressed by several randomizedcontrolled trials of calcium supplementation in children and adolescents (15,16,25,26)and by a longitudinal observational study in young adults (27). The controlled trialsdemonstrated that bone gain during growth was greater when intake was elevated abovethe 1989 RDA (800 mg/d). Some of the gain that was seen within the first 6 to 12 moof augmented calcium intake represented a phenomenon known as the remodeling tran-sient (20), which, although it conferred improved bone strength in its own right, couldnot be used to estimate the requirement because it mainly reflected the transitionbetween two bone remodeling steady states. Nevertheless, computer modeling of thetransient in these trials indicated that not all of the additional gain could be explainedsolely as a transient. Therefore, these data suggest that the 1989 RDAs lie on theascending portion of the threshold curves of Fig. 2 rather than on the plateau, wherethey should lie. This explains the upward revisions reflected in the recommendationsof the National Institutes of Health (NIH) Optimal Intake Panel and of the Food andNutrition Board.
Despite the evidence just cited, pointing to relatively high intake thresholds for max-imal calcium retention during growth, epidemiological data indicate that differences inpeak bone mass related to habitual calcium intake are less than might be anticipated.This discrepancy suggests that individuals with habitually lower intakes may catch upto some extent. This seems to be the case in the controlled trial of Matkovic et al. (28),in which not only did catch-up seem to occur in the unsupplemented adolescent girls,but the calcium benefit was most apparent in the tallest subjects (i.e., those with thegreatest growth need for calcium).
The longitudinal study of young adults (27) showed prospectively that bone aug-mentation continues into the third decade of life. Bone mass gains in this study ranged
Fig. 3. The relationship of calcium intake, on the horizontal axis, to calcium retention(balance), on the vertical axis, for a subset of the adolescents described by Matkovic andHeaney (22). Note that despite the “noisiness” that is inevitable in measurements of bal-ance in humans, there is clear evidence of an intake plateau, as observed in the animalexperiments of Fig. 1. Note also that, for this age, the threshold of the plateau occurs atabout 1500 mg of Ca/d. (Copyright Robert P. Heaney, 1992. Reproduced with permission.)

440 Part V / Bone Diseases
from 0.5% per year for the forearm to 1.25% per year for total body bone mineral. Thesingle most important correlate of the rate of bone accumulation was calcium intake.Although this study lacked the inferential power of a randomized, controlled trial(RCT), it had an advantage over such trials in that it studied individuals on their self-selected intakes (i.e., at a steady state for bone remodeling) and thus avoided the con-founding effect of the remodeling transient. The rate of bone accumulation in this studywas inversely proportional to age; the best estimate of the age at which the rate reachedzero was approx 29 to 30 yr. Therefore, the window of opportunity to achieve the fullgenetic program appears to remain at least partly open until about age 30.
2.3. Secondary Prevention: The Conservation of Acquired Bone MassStudies of calcium requirement in mature, but premenopausal, women generally
have yielded results compatible with the newer recommendations shown in Table 1. Ina meta-analysis of studies in this age group, Welten et al. (29) concluded that calciumintake was positively associated with bone mass. In a study of estrogen-replete womeningesting their habitual calcium intakes, Heaney et al. (30) found zero calcium balanceat a mean intake slightly less than 1000 mg/d. By contrast, Nordin et al. (2) found a figurecloser to 600 mg/d, and in a prospective study of bone mass in premenopausal women,Recker et al. (31) found no detectable bone loss over a 2-yr period on an estimated meancalcium intake of 651 mg. (Corresponding RDAs, meeting the requirement of 95% ofall individuals, were between approx 800 and 1200 mg/d.)
In conclusion, although there may be other health reasons for maintaining an evenhigher calcium intake during the mature years, bone health appears to be supported ade-quately by a calcium intake in the range of 800 to 1200 mg/d; lower intakes may leadto premenopausal bone loss, failure to achieve peak mass, or both.
2.4. MenopauseEstrogen has a bewildering variety of actions. In bone, it seems to adjust the bending
set-point of the mechanical feedback loop that regulates bone mass. (The bending set-point is the amount of bending a bone experiences during loading that is sufficient to trig-ger a bone remodeling response.) Accordingly, whenever women lose ovarian hormones,either naturally at menopause or earlier as a result of anorexia nervosa or athletic amen-orrhea, the skeleton appears to sense that it has more bone than it needs and, therefore,allows resorption to carry away more bone than formation replaces. (The same changeoccurs when men lose gonadal hormones for any reason.) This amounts to raising the set-point of the mechanical feedback loop that functions to maintain bone bending underload within safe limits. Although it varies somewhat from site to site across the skeleton,the downward adjustment in bone mass caused by lack of gonadal hormone at the spineamounts to approx 12 to 15% of the bone a woman had prior to menopause (32).
The importance of this phenomenon in a discussion of nutrient effects is to distinguishmenopausal bone loss from nutrient deficiency loss and to stress that menopausal loss,which mainly results from absence of gonadal hormones and not from nutrient deficiency,cannot be substantially influenced by diet. Almost all of the published studies regarding cal-cium supplementation within 5 yr following menopause failed to prevent bone loss. EvenElders et al. (33), who employed a calcium intake in excess of 3100 mg/d, succeeded onlyin slowing menopausal loss and not in preventing it. Only a few reports, such as the studyof Aloia (19), contain clear evidence for a benefit of a high calcium intake at this life stage;

Chapter 18 / Osteoporosis 441
even in that study, estrogen produced a greater effect. Nevertheless, many of the publishedreports show evidence of small calcium effects even at this life stage, and it may be that inany group of early menopausal women, there are some whose calcium intake is so inadequatethat they are losing bone for two reasons: estrogen lack plus calcium insufficiency.
Despite the importance of menopausal bone loss, it is only a one-time, downwardadjustment, and if nutrition is adequate, the loss continues for only a few years, afterwhich the skeleton is in a new steady state (although at a 12–15% lower bone mass). Inthis context, the importance of achieving a high peak skeletal mass during growthbecomes apparent. One standard deviation (SD) for lumbar spine bone mineral content innormal women is about 12 to 15% of the young adult mean; for total body bone mineral,1 SD is about 10 to 12%,. Hence, a woman at least 1 SD above the mean can sustainthe 12 to 15% menopausal loss and still end up with about as much bone as the averagewoman has before menopause. In contrast, a woman at or below 1 SD below the youngadult mean before menopause drops to 2 SDs below the mean as she crosses menopauseand, therefore, by the World Health Organization criteria (34), is already osteopenic andverging on frankly osteoporotic.
As noted, the menopausal bone mass adjustment theoretically stops with a loss ofabout 15%; however, this is true only when calcium intake is adequate. Therefore, it isimportant to note that estrogen has nonskeletal effects as well (i.e., it improves intestinalcalcium absorption and renal calcium conservation) (32,35,36). As a result, an estrogen-deficient woman has a higher calcium requirement, and unless she raises her calciumintake after menopause, she continues to lose bone after the estrogen-dependent quantumis lost, even if the same diet would have been adequate to maintain her skeleton beforemenopause. In other words, early in the menopausal period, her bone loss is mainly (orentirely) a result of estrogen withdrawal, whereas later it is a result of of inadequate cal-cium intake. Figure 4 assembles, schematically, the set of factors contributing to boneloss in the postmenopausal period. The figure shows both the self-limiting character ofthe loss resulting from estrogen deficiency and the usually slower, but progressive, lossresulting from nutritional deficiency (if present). Unlike the estrogen-related loss, whichmostly plays itself out in 3 to 6 yr, an ongoing calcium deficiency loss continues todeplete the skeleton indefinitely for the remainder of a woman’s life—that is, unlesscalcium intake is raised to a level sufficient to stop it. Furthermore, because bothabsorption efficiency (35) and calcium intake (37) decline with age, the degree of calciumshortfall actually tends to worsen with age.
Therefore, it is important for a woman to increase her calcium intake aftermenopause. Both the 1984 NIH Consensus Conference on Osteoporosis and the 1994Consensus Conference on Optimal Calcium Intake (8) recommended calcium intakes of1500 mg/d for estrogen-deprived postmenopausal women. The “Adequate Intakes” ofthe Food and Nutrition Board (9) for everyone over age 50 yr, when translated intoRDA format (Table 1), are nearly identical (1450 mg/d). It may be that the optimalintake is somewhat higher (see Subheading 2.5.), but median intakes in the United Statesfor women of this age are in the range of 500–600 mg/d (37,38); if the bulk of them couldbe raised even to 1500 mg/d, the impact on skeletal health would be considerable.
2.5. SenescenceAge-related bone loss occurs in both sexes, regardless of gonadal hormone levels,
generally starting at about age 50 yr. However, it is obscured in the years immediately

442 Part V / Bone Diseases
following menopause in women by the substantially larger effect of estrogen withdrawal(see Fig. 4). Nevertheless, it probably occurs (even in women treated with estrogen) atabout the same rate as in men. This rate is generally reported to be approx 0.5 to 1.0%per year during the sixth and seventh decades of life and then accelerates with advancingage. For example, in the study by Chapuy et al. (13), loss from the hip in the controlsubjects (average age: 84 yr) was 3% per year,. Age-related loss involves both corticaland trabecular bone and can occur through several mechanisms (disuse, remodelingerrors, and nutritional deficiency), which are summarized in Fig. 4.
Although nutrient deficiency clearly is only a part of the total problem, it is common.The relationship between nutritional status and the 3% loss in the control subjects in thestudy by Chapuy et al. . is indicated by the fact that this loss was completely obliteratedin the calcium- and vitamin D-supplemented women. Intestinal calcium absorption effi-ciency declines with age (35) at the same time as nutrient intake generally declines (37);the result is that the diet of aging individuals becomes more and more inadequate.McKane et al. (39) showed that the high PTH levels and abnormal PTH secretorydynamics typically found in elderly women result from calcium deficiency and thatPTH function can be entirely normalized by calcium intakes of 2400 mg/d. In a somewhatyounger group of elderly subjects, Peacock et al. (40) showed that elevating calciumintake from approx 550 to 1300 mg/d effectively obliterated bone loss at the hip andtotal body over a 4-yr treatment period.
Also, it is in the elderly age group that the most dramatic and persuasive evidence forfracture prevention by high calcium intakes has been produced (13,17,41,42). This ispartly because most fragility fractures rise in frequency with age, and thus the opportunityto see a fracture benefit (if one exists) is greater in elderly individuals. Chapuy et al.(13) showed a reduction in hip fracture risk of 43% and a 32% reduction in otherextremity fractures by 18 mo after starting supplementation with calcium plus vitamin D.Dawson-Hughes et al. (41) produced a greater than 50% reduction in all fractures by 36
Fig. 4. Partition of age-related bone loss in a typical postmenopausal woman with aninadequate calcium intake. Based on a model described in detail elsewhere (32).(Copyright Robert P. Heaney, 1990. Reproduced with permission.)

Chapter 18 / Osteoporosis 443
mo of supplementation with both calcium and vitamin D. In another study in elderlywomen, Chevalley et al. (17) showed that even when vitamin D was given to bothgroups, extra calcium reduced femoral bone loss and vertebral fracture incidence. In a4-yr, RCT in elderly women (mean age: 73 yr), Recker et al. (42) demonstrated that acalcium supplement reduced both age-related bone loss and incident vertebral fractures.Their subjects all had received a multivitamin supplement as had the subjects ofChevalley et al. (17); hence, the effect in the calcium-supplemented groups of both studiescan be attributed to the extra calcium alone.
These findings do not suggest that vitamin D is unimportant in this age group (seeSubheading 3.). It is likely that intakes of both calcium and vitamin D are inadequate inthe elderly, and the unrecognized prevalence of combined deficiency has made it diffi-cult to study the actual requirements of either nutrient in this age group.
The calcium intakes achieved in the studies by Chapuy et al. (13), Chevalley et al.(17), Dawson-Hughes et al. (41), and Recker et al. (42) were about 1700, 1400, 1300,and 1600 mg/d, respectively. These values are in the range of the intake found byHeaney et al. (30) to be the mean requirement for healthy estrogen-deprived olderwomen (1500–1700 mg/d). Therefore, all these studies are congruent with the newerrecommendations of 1400 to 1500 mg/d (Table 1).
It has been generally considered that the antifracture benefit of calcium observed inthese controlled trials resulted from protection against calcium deficiency-induced boneloss. However, the fracture benefit is substantially larger than the bone mass difference pre-dicts, and the fracture reduction is apparent within a few months of starting calcium (andvitamin D) supplementation (13,41,43)—well before much effect on bone mass couldoccur. A better explanation seems to be reduction in the excessively high remodeling activ-ity that is common in postmenopausal women and generally in the elderly. Remodelingactivity is emerging as an important risk factor for fragility, and any agency that reducesremodeling seems to reduce fracture risk independently of an effect on bone mass (43).
An important feature of these controlled trials in already elderly individuals was thatbone mass was low in both treated and control groups at the start of the study, andalthough a significant difference in fracture rate was produced by calcium supplemen-tation, even the supplemented groups displayed what would have to be considered as anunacceptably high fracture rate. These studies do not establish how much lower thefracture rate might have been if a high calcium intake had been provided for the pre-ceding 20 to 30 yr of these women’s lives. The studies of Matkovic et al. (44) andHolbrook et al. (45), although not randomized trials, strongly suggest that the effect maybe larger than has been found with treatment started in the seventh to ninth decades oflife. Both of these observational studies reported a hip fracture rate that was roughly60% lower in elderly persons whose habitual calcium intakes had been high. Althoughfindings from observational studies such as these had not been considered persuasive inthe absence of proof from controlled trials, many controlled trials have shown a skeletalbenefit of added calcium and have removed that uncertainty.
The aggregate of available studies underscores the importance of achieving at leastthe target figure of 1500 mg calcium for the elderly. It also must be stressed again thatosteoporosis is a multifactorial condition and that removing one of the pathogenic fac-tors (i.e., ensuring an adequate calcium intake) cannot be expected to eradicate allosteoporotic fractures.

444 Part V / Bone Diseases
2.6. Nutrient–Nutrient Interactions: Factors That Influence the RequirementThere are several nutritional factors that influence or have been proposed to influence
the calcium requirement. These are probably less important than once believed, becauseat calcium intakes in the ranges currently recommended, interactions tend to have neg-ligible impact on the calcium economy. Nevertheless, the issue of interactions remains,and, therefore, we briefly address the issue in this section.
The principal interacting nutrients are sodium, protein, caffeine, and fiber. Fiber andcaffeine influence calcium absorption (46–49) and typically exert relatively minoreffects, whereas sodium and protein influence urinary excretion of calcium (49,50) andcan be of much greater significance for the calcium economy when calcium intakes arelow. The net effects of phosphorus and fat in humans are minor to nonexistent.
The basis for the differing importance of these nutritional factors on the calciumeconomy is illustrated in Fig. 5, which partitions the variance in calcium balanceobserved in 560 balances in healthy middle-aged women consuming typical intakes andstudied in the author’s laboratory. As Fig. 5 illustrates, only 11% of the variance in bal-ance among these women is explained by differences in their actual calcium intakes. Incontrast, absorption efficiency explains about 15%, and urinary losses explain morethan 50%.
2.6.1. INFLUENCES ON INTESTINAL ABSORPTION OF CALCIUM
2.6.1.1. Fiber. The effect of fiber is variable and generally small. Many kinds offiber have no influence at all on absorption, such as the fiber in green, leafy vegetables(10). In contrast, the fiber in wheat bran reduces absorption of coingested calcium,although with the exception of extremes of fiber intake (51), the overall effect generallyis relatively small. Often associated with fiber are related plant food constituents suchas phytate and oxalate. Both can reduce the availability of any calcium contained in thesame food; however, unlike bran, phytate and oxalate generally do not affect coingestedcalcium from other foods. For example, for equal ingested loads, the calcium of beansis only about half as available as the calcium of milk (52), whereas the calcium ofspinach and rhubarb is nearly totally unavailable (53). For spinach and rhubarb, theinhibition is mostly a result of oxalate. For common beans, phytate is responsible forabout half the interference, and oxalate is responsible for the other half. Even so, theeffects of phytate and oxalate are highly variable among foods. There is a sufficient
Fig. 5. Partition of variance in calcium balance in normal women among the input-output processes involved in calculation of balance. (Copyright Robert P. Heaney, 1994.Reproduced with permission.)

Chapter 18 / Osteoporosis 445
quantity of both antiabsorbers in beans to complex all the calcium also present, and yetabsorptive interference is only half that expected.
2.6.1.2. Caffeine. Although caffeine is often considered to have a deleterious effecton the calcium economy, it actually has the smallest effect of the known interactingnutrients (47). A single cup of brewed coffee causes deterioration in calcium balance ofapprox 3 mg (48,49,54), mainly by reducing absorption of calcium (48). The effect isprobably on active transport, although this is not known with certainty. This small effectis more than adequately offset by 1–2 tablespoons of milk (48,54).
2.6.2. INFLUENCES ON RENAL CONSERVATION OF CALCIUM
2.6.2.1. Protein and Sodium. As noted earlier, the effects of protein and of sodiumcan be substantial (2,3,49). Both nutrients can increase urinary calcium loss across thefull range of their own intakes, from very low to very high; thus, the concern is notsolely for the harmful effects of an excess of these nutrients. Sodium and calciumshare the same transport system in the proximal tubule, and every 2300 mg of sodiumexcreted by the kidney pulls 20 to 60 mg of calcium out with it. Additionally, everygram of typical protein (whether from animal or vegetable sources) metabolized inadults causes an increment in urine calcium loss of about 1 mg. This latter effect prob-ably results from excretion of the sulfate load produced in the metabolism of sulfur-containing amino acids (and is thus a kind of endogenous analog of the acid rainproblem).
Although much of the literature in this field stresses the role of sodium, it is impor-tant to recognize that most dietary sodium is in the form of table salt (NaCl) and thatthe often ignored anion plays an important role in these interactions. This issue is toocomplex for exhaustive treatment in this chapter, and it is sufficient to note only thatsodium bicarbonate does not have the same hypercalciuric effect as sodium chloride (55)and that potassium bicarbonate completely obliterates the calciuria of a high NaCl intake(56). Figure 6 summarizes the interplay of sodium, potassium, and their respectiveanions on urine calcium.
At low salt and protein intakes, the minimum calcium requirement for an adult pre-menopausal female may be as little as 450 mg/d (50), whereas if her intake of bothnutrients is high, she may require as much as 2000 mg/d to maintain calcium balance.A forceful illustration of the importance of sodium intake is provided by the report of
Fig. 6. Effects of various sodium and potassium salts on urine calcium. (CopyrightRobert P. Heaney, 2003. Used with permission.)

446 Part V / Bone Diseases
Matkovic et al. (57), which shows that urine calcium remains high in adolescent girlson calcium intakes too low to permit bone gain. The principal determinant of urinarycalcium in such young women is sodium intake (58), not calcium intake.
Differences in protein and sodium intake among national groups are perhaps part ofthe reason that studies in different countries have sometimes shown strikingly differentcalcium requirements. At the same time, there is usually a positive correlation betweencalcium intake and bone mass within each national range of intakes (59). Therefore,although sodium (and protein) intake differences between cultures obscure the calciumeffect, they do not obliterate it.
For diets high in calcium (as was the case for our hunter–gatherer ancestors), highprotein and, possibly, high sodium intakes could have been handled perfectly well bythe body. At the low intakes that prevail today, an individual’s absorptive performanceis close to maximal. Augmented loss from increased sodium or protein intake cannot beoffset by increasing extraction from the diet, because there is less in the food to extractand because extraction efficiency is already at the upper end of its possible range. In con-trast, at intake levels typical of those that prevailed during hominid evolution, intestinalabsorption is predominantly passive, and the full range of absorptive adaptation is avail-able to offset increased excretory or cutaneous losses. In brief, these nutrients createproblems for the calcium economy of contemporary adult humans mainly because wetypically have calcium intakes that are low and sodium intakes that are high relative tothose of preagricultural humans.
2.6.2.2. Acid Ash Residue. The acid/alkaline ash characteristic of the diet also maybe important, although to date, the quantitative relationship of this diet feature to thecalcium requirement has been less fully explored. Nevertheless, it has clearly beenshown that substitution of metabolizable anions (e.g., bicarbonate or acetate) for fixedanions (e.g., chloride) in various test diets substantially lowers obligatory urinary cal-cium loss (60,61). This suggests that primarily vegetarian diets create a lower calciumrequirement and provides a further explanation for the seemingly lower requirement inmany nonindustrialized populations. However, it is not yet clear whether vegetarianshave higher bone mass values than omnivores within a population, and some data sug-gest that they may actually have less dense skeletons, possibly because of the com-monly very low calcium levels of such diets (62,63).
2.6.2.3. Phosphorus. Phosphorus is commonly believed to reduce calcium absorp-tion, but the evidence for that effect is scant to nonexistent, and there is much contraryevidence. In analysis of 567 metabolic balances performed in healthy middle-agedwomen studied on their usual diets, variation in phosphorus intake over a nearly sixfoldrange had no detectable effect on calcium absorption efficiency (64). In a controlledmetabolic study, Spencer (65) found no effect of even large increments in phosphateintake on overall calcium balance at low, normal, and high intakes of calcium. In adults,calcium to phosporus ratios (Ca:P) ranging from 0.2 to more than 2.0 are without effecton calcium balance, at least so long as adjustments are made for calcium intake (49,64).
Phosphorus does depress urinary calcium loss and elevate digestive juice secretion ofcalcium by approximately equal amounts, with little or no net effect on balance (66).Although it is true that stoichiometric excesses of phosphate tend to form complexeswith calcium in the chyme, various calcium phosphate salts have been shown to exhibitabsorbability similar to other calcium salts, and phosphate is, of course, a principal anionof the major food source of calcium (dairy products). In any case, phosphate is more

Chapter 18 / Osteoporosis 447
readily absorbed than calcium (by two to five times), and at intakes of both nutrients inthe range of their respective RDAs, absorption leaves a stoichiometric excess of calciumin the ileum, not vice versa. This explains the apparent paradox that high calcium intakescan block phosphate absorption (as in management of end-stage renal disease), whereasachievably high phosphorus intakes have little or no effect on calcium absorption.
2.6.2.4. Aluminum. Although aluminum (Al) is not in any proper sense a nutrient, inthe form of Al-containing antacids, it exerts significant effects on obligatory calcium lossin the urine (67). By binding phosphate in the gut, these substances reduce phosphateabsorption, lower integrated 24-h serum phosphate levels, and, thereby, elevate urinary cal-cium loss. (This is the opposite of the more familiar hypocalciuric effect of oral phosphatesupplements.) Therapeutic doses of Al-containing antacids can elevate urine calcium by50 mg/d or more.
2.7. Calcium SourcesThe best calcium sources are, of course, foods. In a modern, Western diet, food items
that provide more than 100 mg of calcium per serving are limited to dairy products(with the exception of cottage cheese), greens of the mustard family (collards, kale,mustard), calcium-set tofu, sardines, and a few nuts (especially hazelnuts and almonds).Smaller amounts of calcium are ubiquitous in many leafy vegetables; however, with theexception of shellfish, calcium levels are low in most meats, poultry, or fish. As notedearlier, the calcium of beans is only about half as available as the calcium of milk, andthe calcium of high-oxalate vegetables (such as spinach and rhubarb) is almost com-pletely unavailable. Figure 7 displays the available calcium in a variety of foods.“Available” represents the product of the fractional absorbability of the calcium in afood and its total calcium content. Therefore, “available” refers to the actual, gross*amount of calcium a particular food delivers into the blood of the absorbing subject.
In general, most diets without dairy products have total calcium nutrient densitiesbelow 20 mg of calcium per 100 kCal, and available calcium densities are even lower.Because total energy intake for adult American women is approx 1800 kCal/d, it fol-lows that most diets low in dairy products are low in calcium (probably 300–400 mgcalcium/d or less) andfar short of levels currently considered optimal.
In part as a response to this dilemma, the surgeon general, in his 1988 report onNutrition and Health (68), recommended judicious, low-level calcium fortification ofmany items in the food chain. An increasing number of fortified foods are becomingavailable each year, ranging from fruit juice to bread, to breakfast cereals, to potatochips, to rice. Where bioavailability of added calcium has been assured, these foodsshould be useful adjuncts in the attempt to improve calcium intake at the populationlevel. However, satisfactory bioavailability does not automatically follow from simplyadding calcium to a product. Soy beverage fortified to the calcium load of cow milk wasshown to deliver only 75% the amount of calcium as cow milk (69), and recent entriesinto the soy and rice beverage markets as well as several of the calcium-fortified orangejuices exhibited even poorer physical characteristics (70).
The principal calcium supplement in the US market is calcium carbonate, availablealone or as oyster shell or dolomite. When the tablet is competently formulated (so that it
*In the process of digestion, substantial quantities of calcium enter the gut in the form of digestive secre-tions and sloughed mucosa. For this reason, net absorption is always less than gross.

448 Part V / Bone Diseases
disintegrates in gastric juice) or when the supplement is chewed, the carbonate is well-absorbed and generally very well-tolerated. There is no requirement for gastric acid per se,so long as the carbonate salt is taken with meals. Calcium citrate and calcium citrate malate(CCM) also are good sources, but they tend to be more expensive (71). In some studies,CCM was reported to exhibit higher absorption efficiency than calcium carbonate (41); thestudy by Peacock et al. (40), using CCM as the calcium source, reported one of the largestcalcium effects on age-related bone loss observed to date. In the rare case that the carbon-ate seems not well-tolerated, these other sources provide useful alternatives.
Divided doses enhance absorption from both supplements and foods, because absorp-tion fraction is an inverse function of load size. All calcium sources (including food) inter-fere with iron absorption when the two nutrients are ingested at the same meal. However,single-meal studies miss the body’s upregulation of iron absorption in the face of need,and chronic feeding studies have revealed no deterioration of iron status in subjects con-suming high-calcium diets. Perhaps of greater relevance, Matkovic and colleagues (72)have shown convincingly that adolescent girls are able to increase total body iron storesnormally in the presence of 1600-mg calcium intakes. This is a particularly reassuringfinding, because females in this age group currently are among the most vulnerable to irondeficiency in the United States. However, if an adult is iron-deficient (e.g., as a result ofsevere blood loss) and is taking an iron supplement, it may be best if the meal at whichthe iron is taken does not contain a large amount of calcium (in food or supplement form).
3. VITAMIN D
Vitamin D facilitates active transport of calcium across the intestinal mucosa, partlyby inducing the formation of a calcium-binding transport protein in intestinal mucosalcells. This function is particularly important for adaptation to low calcium intakes.Absorption also occurs passively, probably mainly by way of paracellular diffusion.This route is not dependent on vitamin D and has not been studied as well. The propor-tion of absorption by the two mechanisms varies with intake and is not well-characterized
Fig. 7. Available calcium per serving for a variety of foods. “Available calcium” is theproduct the calcium content of a food and its fractional absorbability. (Copyright RobertP. Heaney, 1998. Reproduced with permission.)

Chapter 18 / Osteoporosis 449
in humans; at high calcium intakes (>2400 mg/d), absorption fraction approaches 10 to15% of intake. Under these circumstances, it is likely that active transport contributesrelatively little to the total absorbed load. Nevertheless, it generally is considered thatvitamin D status regulates absorptive performance and thereby influences the calciumrequirement. The quantitative importance of active transport of calcium at prevailingcalcium intakes is illustrated in Fig. 8, which plots the actual net quantity of calciumabsorbed as a function of both calcium intake and active absorption. As demonstratedin Fig. 8, some degree of active absorption is needed to offset excretory losses, even atcalcium intakes as high as 50 mmol (2000 mg)/d.
A principal storage form of the vitamin is 25-hydroxyvitamin D [25(OH)D], and itsplasma level is generally regarded as the best clinical indicator of vitamin D status.Although usually considered to be about three orders of magnitude less potent than cal-citriol in promoting active transport in animal receptor assays, there is growing evidencethat it may possess physiological functions in its own right (73,74); in the only humandose–response studies performed to date, 25(OH)D was found to have a molar potency inthe range of 1/100 to 1/125 that of l,25(OH)2D3 (75,76)—not the 1/2000 amount usuallyconsidered to reflect relative 25(OH)D activity.
Vitamin D status commonly deteriorates in the elderly, in whom plasma 25(OH)Dlevels are generally lower than in young adults (77). This difference results partly from
Fig. 8. Relationship of vitamin D-mediated, active calcium absorption, calcium intake,and net calcium gain across the gut. Each of the contours represents a different level ofactive absorption above a baseline passive absorption of 12.5%. (The values along eachcontour represent the sum total of passive and variable active absorption.) The horizontaldashed lines indicate 0 and 5 mmol/d (200 mg/d) net absorption, respectively. The formeris the value at which the gut switches from a net excretory to a net absorptive mode, andthe latter is the value needed to offset typical urinary and cutaneous losses in matureadults. (Copyright Robert P. Heaney, 1999. Reproduced with permission.)

450 Part V / Bone Diseases
decreased solar exposure, partly from decreased efficiency of skin vitamin D synthesis,and partly from decreased intake of milk, the principal dietary source of the vitamin.Moreover, the elderly exhibit other abnormalities of the vitamin D endocrine systemthat may further impair their ability to adapt to reduced calcium intake. These includedecreased responsiveness of the renal 1-α-hydroxylase to PTH (78) and, possibly,decreased mucosal responsiveness to calcitriol (79).
For these reasons, there is a growing consensus that the requirement for ingested vit-amin D rises with age (9) and a body of data that strongly suggests that relative vitaminD deficiency plays a role in several components of the osteoporosis syndrome.Although a trial by Lips et al. (80) regarding vitamin D supplementation noted no frac-ture reduction, others demonstrated clear benefits from supplementing vitamin D in theelderly. One example is the RCT by Heikinheimo et al. (81), which demonstrated a sig-nificant reduction in all fractures in an elderly Finnish population given a single annualinjection of 150,000 to 300,000 IU of vitamin D each fall (equivalent to approx400–800 IU/d). The impressive fracture reductions noted in the trials of Chapuy et al.(13) and Dawson-Hughes et al. (41) may also have partly resulted from the vitamin Dsupplementation that was a component of both trials. Most recently, in a large prospec-tive study of British elderly subjects, vitamin D at an average dose of approx 820 IU/dreduced typical osteoporotic fracture risk by 33% (82).
The foregoing studies (as well as others [83,84]) strongly suggest that vitamin Dinsufficiency is prevalent in the middle-aged and elderly of northern Europe and NorthAmerica. In one study of north Italian centenarians, severe vitamin D deficiency wasvirtually universal (85). However, with the exception of this latter study, frank osteo-malacia was not reported to be a significant feature of the clinical status of study par-ticipants. This old criterion for true vitamin D deficiency is much too insensitive to beclinically useful today, since it misses most of the cases of clinically important vitamin Ddeficiency.
The issue of how the vitamin D requirement should be defined is another matter.Holick (86) showed that it takes an intake of at least 600 IU/d, from all sources, to sus-tain serum 25(OH)D levels in healthy young adults, and the doses of vitamin D used inthe studies summarized earlier also suggest that an intake in the range of 500 to 800IU/d is required for full expression of the known effects of vitamin D in adults. This issubstantially greater than the RDA from 1989 of only 200 IU for adults (21). The newDRIs for vitamin D (9) reflect this realization, if only to a limited extent. They includedan increase from 200 to 400 IU for adults ages 50 to 70 yr and to 600 IU for those overage 70. Vieth (87) presented evidence that the requirement may be higher still. In con-trolled dosing studies, my colleagues and I (88) showed that the body normally usesapprox 4000 IU (100 μg)/d, most of which must come from cutaneous sources. Thissame study showed that serum 25(OH)D rose by about 0.7 nmol/L for every 1 μg dailyinput of cholecalciferol. Other studies (80,87) provided estimates of rates of increaseranging up to 1.2 nmol/L per microgram of daily input. Taking a value between theseextremes (1 nmol/L per microgram), it follows that an individual with a serum 25(OH)Dof 50 nmol/L will need an additional 30 μg (1200 IU) of cholecalciferol daily to achievea stable level of 80 nmol/L.
Ascertaining the vitamin D requirement is complicated by the mixed input of cuta-neous and dietary vitamin D. Because skin production under ambient conditions islargely unknown, it is difficult to estimate how much must be provided orally in those

Chapter 18 / Osteoporosis 451
who are housebound or excluded from skin exposure to solar radiation; however, itcould be as much as 4000 IU (100 μg)/d.
4. PROTEIN
Two seemingly contradictory facts seem well-established regarding calcium and pro-tein: (a) protein increases urinary calcium loss (49,89,90); and (b) protein aids recoveryfrom hip fracture (91,92) and slows age-related bone loss (92,93). For the most part, thestudies establishing these diverse and, to some extent, contradictory effects were performedby varying only the nutrient concerned. For example, the calciuric effects of protein weredemonstrated most clearly in studies in which purified protein or protein hydrolysateswere used, with each gram of protein resulting in an approximate rise of 1 mg in urinarycalcium excretion. However, Spencer observed that when the protein was fed as groundbeef, urinary calcium did not rise, with the difference in response presumably resultingfrom the fact that the meat contained substantial quantities of phosphorus (94).
Kerstetter et al. (95) reported that high protein intakes enhanced calcium absorption,an effect that would counter a calciuric effect (if there were such). Not everyone hasbeen able to reproduce this finding in chronic feeding studies (64), and it may, to theextent that the phenomenon is operative, apply only acutely. In a very recent controlledfeeding study, Roughead et al. (96) reported no effect of high and low protein intakesfrom meat (117 vs 68 g/d) on either calcium balance or urinary calcium excretion, afinding consistent with that of Spencer et al. (94) and Heaney and Recker (64) but atodds with that of Kerstetter (95).
The very reproducible calciuric effect of pure protein or amino acids led, severalyears ago, to the tentative conclusion that high protein intakes might be deleterious forthe skeleton. However, not only do the studies involving food sources of protein (suchas those just cited) not support that conclusion, but epidemiological studies (such asthose from the Framingham osteoporosis cohort [93]) indicate that age-related boneloss in postmenopausal women is inversely related to protein intake rather than directlyrelated, as might have been predicted from the calciuric effect.
In this connection, it is interesting to examine the interaction of protein and calciumintakes in the study of Dawson-Hughes and colleagues (97). In their randomized con-trolled trial of calcium supplementation, the bone gain associated with calcium supple-mentation was confined to individuals in the highest tertile of protein intake, whereas inthe placebo group, there was a nonsignificant trend toward worsening bone status as pro-tein intake rose. This latter effect is what would be predicted if there were some degree ofprotein-induced calciuria without an offsetting increase in absorbed calcium. Proteinintake in this study spanned only a relatively narrow range and was not randomly assignedto the subjects; therefore, these results cannot be considered final. Nevertheless, they doexhibit two interesting features: (a) high protein intake clearly did not block the positiveeffect of calcium; and (b) most of the protein was from animal sources (as was also true forthe Framingham osteoporosis cohort). This latter point provides no support for the hypoth-esis that animal foods (in contrast with vegetable protein sources) artificially elevate thecalcium requirement by increasing urinary calcium loss.
The importance of achieving an adequate protein intake is at least twofold. First,protein is a bulk constituent of bone. Because of extensive posttranslational modifi-cation of the collagen molecule (e.g., crosslinking, hydroxylation, etc.), many of the

452 Part V / Bone Diseases
amino acids released in bone resorption cannot be recycled. Hence, bone turnoverrequires a continuing supply of fresh protein. Second, protein elevates serum insulin-like growth factor (IGF)-1 (98,99), which is trophic for bone (99). For both reasons, adiet inadequate in protein would be expected to reduce the bony response to calcium.Moreover, several studies of increased protein intake showed rises in serum IGF-1(98,99). Thus, it may be tentatively concluded that protein intakes in the individualsconcerned were suboptimal. To the extent that this is true and that both of the bulk con-stituents of bone (calcium and protein) are ingested at suboptimal intakes, it followsthat the true effect of neither nutrient can be discerned in studies that do not ensure fullrepletion of the other.
The IGF-1 response is of particular interest. IGF-1 rises with protein intake; but abovecertain protein intakes, no further increase in IGF-1 can be produced. This effect is anal-ogous to calcium retention, which rises at suboptimal calcium intakes but plateaus at orabove the individual’s calcium intake requirement. For both nutrients, a rise in retention(for calcium) or a rise in IGF-1 (for protein) can be taken as evidence that the presup-plement intake of the corresponding nutrient was suboptimal. The fact that IGF-1 has notreached its plateau at intakes in the range of current RDAs has led some to conclude thatthe current RDA for protein is set too low, particularly for the elderly. In any case, it isimportant to understand this relationship of nutrient intakes used in various studies to therespective plateaus. Different studies are expected to show more or less of a beneficialeffect of increasing one or both nutrient intakes, depending on whether the presupplementintake were below or above the respective threshold level.
5. VITAMIN K
The chemistry and physiology of vitamin K have been reviewed extensively else-where (100,101). In brief, vitamin K is necessary for the γ-carboxylation of glutamicacid residues in a large number of proteins. Most familiar are those related to coagula-tion, in which seven vitamin K-dependent proteins are involved in one way or another.The γ-carboxyglutamic acid residues in the peptide chain bind calcium, either free or onthe surface layers of crystals, and have been thought to function in varying ways,including catalysis of the coagulation cascade, inhibition of mineralization (as in urine),and generation of osteoclast chemotactic signals.
Three vitamin K-dependent proteins are found in bone matrix: osteocalcin (bone glaprotein[BGP]), matrix gla-protein, and protein S. Only BGP is unique to bone. Therealso is a kidney gla protein (nephrocalcin), which may be involved in renal reabsorp-tion of calcium. BGP binds avidly to hydroxyapatite and is chemotactic for bone-resorbing cells. Roughly 30% of the synthesized BGP is not incorporated into matrixbut instead is released into the circulation, where, similarly to alkaline phosphatase, itcan be measured and used as an indicator of bone turnover. In vitamin K deficiency, asoccurs with coumarin anticoagulants, serum BGP levels decline, and the degree of car-boxylation of the circulating BGP falls dramatically. Although it would therefore seemthat vitamin K deficiency would have detectable skeletal effects, they have been veryhard to demonstrate. Rats reared and sustained to adult life under near total suppressionof BGP γ-carboxylation show only minor skeletal defects, mostly related to abnormalitiesin the growth apparatus (100). In aging humans, the problem of detecting skeletalabnormalities is compounded by the fact that the bulk of the skeleton was formed prior

Chapter 18 / Osteoporosis 453
to the onset of any deficiency, and thus bone tends to be an insensitive indicator of currentnutritional stresses.
Various vitamin K-related abnormalities have been described in association withosteoporosis, but their significance to skeletal status remains unclear. Women with lowdietary vitamin K intakes have significantly lower values for bone mineral density athip and spine (102) and greater risk for hip fracture (103) than do those with higherintakes . Circulating vitamin K and menaquinone levels are low in hip fracture patients(104). BGP is under-carboxylated in osteoporotics, and this defect responds to relativelysmall doses of vitamin K. However, maximal suppression of under-carboxylation hasbeen reported to require in excess of 1000 μg of vitamin K per day (105). Finally, urinecalcium has been reported to be high in osteoporotics and to fall on administeringvitamin K (106).
Whether or not vitamin K is important for bone health, serum vitamin K levels areindicators of general nutritional status, and it may be that the observation of low vita-min K levels in osteoporotics, especially in those with hip fracture, is mainly a reflec-tion of the often poor general nutrition of these individuals.
6. MAGNESIUM
The adult female RDA for magnesium was 280 mg/d in the 1989 RDAs (21) andrevised upward to 320 mg/d in the 1997 DRIs (9). Only about 25% of adult femalesin the United States achieve this level of intake on any given day. Average intakestend to be in the range of 70 to 80% of the RDA. Although severe magnesium defi-ciency is a well-described syndrome (107), interfering both with PTH secretion andPTH action on bone, it is uncertain whether mild departures from the RDA have anyadverse effect or even whether the RDA needs to be as high as it is now set. There isalso a widespread popular belief that magnesium is necessary for optimal calciumabsorption. However, the many studies described earlier that established the benefitof supplemental calcium achieved their effect without adding magnesium to the dietsof their subjects. Furthermore, Spencer (108), in a series of careful metabolic studies,showed that a tripling of magnesium intake had no effect on absorption efficiency forcalcium. Thus, there is no known justification for supplemental magnesium in pre-vention or treatment of osteoporosis. Moreover, magnesium salts, when used as acomponent of a combined supplement tablet (e.g., as in dolomite), displace calciumand make it more difficult (i.e., more pills are required) to get sufficient calcium bythis route.
However, an unknown but probably small proportion of patients with osteoporosishave silent celiac disease as a contributory factor in their disease. These individualscommonly have some degree of magnesium deficiency. Because the underlying prob-lem in such cases is asymptomatic, it usually is unrecognized and, therefore, untreated.For that reason, there may well be a small group of osteoporotic patients who wouldbenefit from supplemental magnesium (as well as from calcium and vitamin D).
7. TRACE MINERALS
Several trace minerals (notably zinc, manganese, and copper) are essential metalliccofactors for enzymes involved in synthesis of various bone matrix constituents. Ascorbicacid (along with zinc) is needed for collagen crosslinkage. In growing animals, diets

454 Part V / Bone Diseases
deficient in these nutrients produce clear-cut skeletal abnormalities (109). Additionally,zinc deficiency is well-known to produce growth retardation and other abnormalities inhumans. However, it is not known whether significant deficiencies of these elementsdevelop in previously healthy adults or, at least, if they do, whether such deficiencies con-tribute detectably to the osteoporosis problem. Copper deficiency is reported to be asso-ciated with osteoporotic lesions in sheep, cattle, and rats (110). Copper has not beenwell-studied in connection with human osteoporosis; however, in one study in whichserum copper was measured, levels were negatively correlated with lumbar spine bonemineral density, even after adjusting for body weight and dietary calcium intake (111).
Copper-deficient animals develop reduced collagen crosslinks, a factor known toweaken bone strength. Oxlund (112) reported reduced extractable crosslinks in the boneof osteoporotic patients, but it is not known whether copper deficiency was the cause.
In one four-way, randomized trial, copper (as a part of a trace mineral cocktail includ-ing also zinc and manganese) slowed bone mineral loss in postmenopausal women whengiven either with or without supplemental calcium (113). There appeared to be a smalladditional benefit from the extra trace minerals; however, the only statistically significanteffect in this study was associated with the calcium supplement. This could mean thattrace mineral deficiency plays no role in osteoporosis, but it could also mean that not allof the women treated suffered from such deficiency. In fact, because both osteoporoticand age-related bone loss are multifactorial and there is no known way to select subjectsfor inclusion on the basis of presumed trace mineral need, one might presume that onlysome of the subjects in such a study might be deficient. Thus, the suggestive findings ofthis study must be considered grounds for further exploration of this issue.
8. NUTRITION AND HIP FRACTURE
Nutrition enters into the hip fracture problem in two ways: (a) in predisposing to frac-ture; and (b) in recovery from the assault of the injury and its surgical repair. Fractures,particularly hip fractures, in the elderly are concentrated in institutionalized personswith multiple disabilities. Generally, the osteoporotic elderly are known to havedepleted lean body mass and fat mass and, when studied, show low circulating valuesfor several key nutritional indicator variables, from serum albumin to ferritin and vita-mins A, D, and K (91). Survival 2 yr after injury is four times higher in patients withserum albumin values over 3.5 g/dL than in patients with values below 3.0 g (91).Additionally, patients with hip fracture often have low calcium intakes, and in themajority of studies evaluating the matter, dietary calcium earlier in life is inversely asso-ciated with hip fracture risk. In brief, hip fracture is a problem concentrated in multiplycompromised individuals, and the prospect of successfully intervening to reduce riskhas proved daunting even to contemplate.
However, one aspect of the problem is partly amenable to change. The relative mal-nutrition of patients suffering hip fracture and coming to hospital for repair contributessignificantly to the often unsatisfactory outcomes for this common fracture (i.e., 15–20%excess mortality; 50% institutionalization of the survivors). In an RCT of a protein-based nutrient supplement given to patients newly hospitalized for hip fracture, Delmiet al. (91) found that only 26% of unsupplemented individuals had outcomes classifiedas “good” at 6 mo after injury, whereas nearly 60% of supplemented individuals had“good” outcomes. The investigators noted that the hospital diets offered to the

Chapter 18 / Osteoporosis 455
unsupplemented individuals were nutritionally adequate but were frequently uncon-sumed, while the investigators ensured the ingestion of the supplement. This is not anisolated observation; others (114) earlier found qualitatively similar benefit from nutri-tional supplementation in such patients. Additionally, protein supplements after fracturewere shown to retard bone loss in the contralateral hip (92). The consistency of thesefindings constitutes a challenge to the health professions to apply these basic nutritionalprinciples in the management of their patients.
9. NUTRITION AND GLUCOCORTICOID-INDUCED OSTEOPOROSIS
Glucocorticoid-induced osteoporosis (GIO) can be one of the most disabling andrapidly progressing forms of the disorder. Severe compression fractures can occur in aslittle as 6 mo after starting corticosteroid therapy. The reasons are not entirely clear.Corticosteroids depress virtually all anabolic activities in the body, including osteoblasticnew bone formation. Excessive bone resorption often occurs as well, which, when takentogether with depressed bone formation, leads to negative bone balance. However, the rateof progression of GIO is too rapid to be explained on bone mass grounds alone. It is likelythat accelerated remodeling, particularly in vertebral cancellous bone, directly compro-mises trabecular strength to an extent out of proportion to the loss in mass. Whatever theultimate mechanism, current standards of practice call for cotherapy with a remodelingsuppressor whenever glucocorticoids are prescribed for a chronic condition.
However, pharmacological prophylaxis of GIO does not negate the need for nutri-tional measures as well. Vitamin D status and calcium absorption commonly are lowin patients taking corticosteroids, and both defects aggravate the tendency toincreased remodeling and bone resorption. Sufficient vitamin D3 should be given toraise the serum 25(OH)D level to 80 nmol/L (32 ng/mL), and calcium intake shouldbe at least 1500 mg/d and perhaps as much as 2500 mg/d. These measures alone arenot sufficient, but pharmacological prophylaxis alone is insufficient as well. Both arenecessary.
10. RECOMMENDATION
Calcium intake should be high throughout life: 1500 mg/d during growth and at leastthat much in the elderly. Foods are the best sources of calcium; given caloric restriction,the best food sources of calcium are fat free milk and yogurt, and then calcium-fortifiedfoods. Supplements are convenient and often necessary but should not be a substitutefor a national nutritional policy or for a good diet. The elderly are commonly vitaminD-deficient as well as calcium-deprived. Conscious efforts must be made to ensure adaily intake of at least 600 to 1000 IU/d. The elderly often suffer some degree of globalundernutrition in addition to their specific deficiencies of calcium and vitamin D. Giventhe common isolation of elderly living alone, this is not an easy problem to solve. At thevery least, we must make an effort to feed them after they develop fractures.
REFERENCES1. Heaney RP, Recker RR. Distribution of calcium absorption in middle-aged women. Am J Clin Nutr
1986; 43:299–305.2. Nordin BEC, Polley KJ, Need AG, Morris HA, Marshall D. The problem of calcium requirement.
Am J Clin Nutr 1987; 45:1295–1304.

456 Part V / Bone Diseases
3. Nordin BEC, Need AG, Morris HA, Horowitz M. Sodium, calcium and osteoporosis In: BurckhardtP, Heaney RP, eds. Nutritional Aspects of Osteoporosis. Raven Press, New York, 1991; 85:279–295.
4. Barger-Lux MJ, Heaney RP, Packard P, Lappe JM, Recker RR. Nutritional correlates of low calciumintake. Clinics App Nutr 1992; 2:39–44.
5. Gershon-Cohen J, Jowsey J. The relationship of dietary calcium to osteoporosis. Metabolism 1964;13:221–226.
6. Jowsey J, Raisz LG. Experimental osteoporosis and parathyroid activity. Endocrinol 1968;82:384–396.
7. Forbes RM, Weingartner KE, Parker HM, Bell RR, Erdman JW Jr. Bioavailability to rats of zinc,magnesium and calcium in casein-, egg- and soy protein-containing diets. J Nutr 1979;109:1652–1660.
8. NIH Consensus Conference: Optimal Calcium Intake. JAMA 1994; 272:1942–1948.9. Dietary Reference Intakes for Calcium, Magnesium, Phosphorus, Vitamin D, and Fluoride. Food and
Nutrition Board, Institute of Medicine. National Academy Press, Washington, DC, 1997.10. Heaney RP. Nutritional factors in osteoporosis. Ann Rev Nutr 1993; 13:287–316.11. Heaney RP. Calcium, dairy products, and osteoporosis. J Am College Nutr 2000; 19:83S–99S.12. Dawson-Hughes B, Dallal GE, Krall EA, Sadowski L, Sahyoun N, Tannenbaum S.A controlled trial of
the effect of calcium supplementation on bone density in postmenopausal women. N Engl J Med 1990;323:878–883.
13. Chapuy MC, Arlot ME, Duboeuf F, et al. Vitamin D3 and calcium to prevent hip fractures in elderlywomen. N Engl J Med 1992; 327:1637–1642.
14. Reid IR, Ames RW, Evans MC, Gamble GD, Sharpe SJ. Effect of calcium supplementation on boneloss in postmenopausal women. N Engl J Med 1993; 328:460–464.
15. Johnston CC Jr, Miller JZ, Slemenda CW, et al. Calcium supplementation and in-creases in bonemineral density in children. N Engl J Med 1992; 327:82–87.
16. Lloyd T, Andon MB, Rollings N, et al. Calcium supplementation and bone mineral density in ado-lescent girls. JAMA 1993; 270:841–844.
17. Chevalley T, Rizzoli R, Nydegger V, et al. Effects of calcium supplements on femoral bone mineraldensity and vertebral fracture rate in vitamin D-replete elderly patients. Osteoporos Int 1994;4:245–252.
18. Reid IR, Ames RW, Evans MC, Gamble GD Sharpe SJ. Long-term effects of calcium supplementa-tion on bone loss and fractures in postmenopausal women: a randomized controlled trial. Am J Med1995; 98:331–335.
19. Aloia JF, Vaswani A, Yeh JK, Ross PL, Flaster E, Dilmanian FA. Calcium supplementation with andwithout hormone replacement therapy to prevent postmenopausal bone loss. Ann Intern Med 1994;120:97–103.
20. Heaney RP. The bone remodeling transient: implications for the interpretation of clinical studies ofbone mass change. J Bone Miner Res 1994; 9:1515–1523.
21. Recommended Dietary Allowances, 10th ed. National Acad. Press, Washington, DC, 1989.22. Matkovic V, Heaney RP. Calcium balance during human growth. Evidence for tbreshold behavior.
Am J Clin Nutr 1992; 55:992–996.23. Jackman LA, Millane SS, Martin BR, et al. Calcium retention in relation to calcium intake and post-
menarcheal age in adolescent females. Am J Clin Nutr 1997; 66:327–333.24. Matkovic V. Calcium metabolism and calcium requirements during skeletal modeling and consoli-
dation of bone mass. Am J Clin Nutr 1991; 54:245S–260S.25. Chan GM, Hoffman K, McMurray M. The effect of dietary calcium supplementation on pubertal
girls’ growth and bone mineral status. J Bone Miner Res 1991; 6:S240.26. Cadogan J, Eastell R, Jones N, Barker ME. Milk intake and bone mineral acquisition in adolescent
girls: randomised, controlled intervention trial. BMJ 1997; 315:1255–1260.27. Recker RR, Davies KM, Hinders SM, Heaney RP, Stegman MR, Kimmel DB. Bone gain in young
adult women. JAMA 1992; 268:2403–2408.28. Matkovic V, Badenhop-Stevens N, Landoll J, Goel P, Li B. Long term effect of calcium supplemen-
tation and dairy products on bone mass of young females. J Bone Miner Res 2002; 19(Suppl1):S172. [abs no. 1200].
29. Welten DC, Kemper HCG, Post GB, van Staveren WA. A meta-analysis of the effect of calciumintake on bone mass in females and males. J Nutr 1995; 2802–2813.

Chapter 18 / Osteoporosis 457
30. Heaney RP, Recker RR, Saville PD. Menopausal changes in calcium balance performance. J LabClin Med 1978; 92:953–963.
31. Recker RR, Lappe JM, Davies KM, Kimmel DB. Change in bone mass immediately beforemenopause. J Bone Miner Res 1992; 7:857–862.
32. Heaney RP. Estrogen-calcium interactions in the postmenopause: a quantitative description. BoneMiner 1990; 11:67–84.
33. Elders PJM, Netelenbos JC, Lips P, et al. Calcium supplementation reduces vertebral bone loss inperimenopausal women: a controlled trial in 248 women between 46 and 55 years of age. J ClinEndocrinol Metab 1991; 73:533–540.
34. Kanis JA, Melton LJ III, Christiansen C, Johnston CC, Khaltaev N. The diagnosis of osteoporosis.J Bone Miner Res 1994; 9:1137–1141.
35. Heaney RP, Recker RR, Stegman MR, Moy AJ. Calcium absorption in women: relationships to cal-cium intake, estrogen status, and age. J Bone Min Res 1989; 4:469–475.
36. Nordin BEC, Need AG, Morris HA, Horowitz M, Robertson WO. Evidence for a renal calcium leakin postmenopausal women. J Clin Endocrinol Metab 1991; 72:401–407.
37. Carroll MD, Abraham S, Dresser CM. Dietary intake source data: US, 1976-80. Vital & HealthStatistics, Serv. 11-NO. 231, DRHS. Publ. No. (PHS) 83-PHS, March 1983. Washington DC, Gov.Printing Office.
38. Alaimo K, McDowell MA, Briefel RR, et al. Dietary intake of vitamins, minerals, and fiber of per-sons ages 2 months and over in the United States: Third National Health and Nutrition ExaminationSurvey, Phase 1,1988–1991. Advance data from vital and health statistics; no. 258. Hyattsville,Maryland: National Center for Health Statistics, 1994.
39. McKane WR, Khosla S, Egan KS, Robins SP, Burritt MF, Riggs BL. Role of calcium intake in mod-ulating age-related increases in parathyroid function and bone resorption. J Clin Endocrinol Metab1996; 81:1699–1703.
40. Peacock M, Liu G, Carey M, et al. Effect of calcium or 25OH vitamin D3 dietary supplementationon bone loss at the hip in men and women over the age of 60. J Clin Endocrinol Metab 2000;85:3011–3019.
41. Dawson-Hughes B, Harris SS, Krall EA, Dallal GE. Effect of calcium and vitamin D supplementa-tion on bone density in men and women 65 years of age or older. N Engl J Med 1997; 37:670–676.
42. Recker RR, Hinders S, Davies KM. Correcting calcium nutritional deficiency prevents spine frac-tures in elderly women. J Bone Miner Res 1996; 11:1961–1966.
43. Heaney RP. Is the paradigm shifting? Bone 2003; 33:457–465.44. Matkovic V, Kostial K, Simonovic I, Buzina R, Brodarec A, Nordin BEC. Bone status and fracture
rates in two regions of Yugoslavia. Am J Clin Nutr 1979; 32:540–549.45. Holbrook TL, Barrett-Connor E, Wingard DL. Dietary calcium and risk of hip fracture: 14-year
prospective population study. Lancet 1988; 2:1046–1049.46. Pilch SM, ed. Physiological effects and health consequences of dietary fiber. Prepared for the
Center for Food Safety and Applied Nutrition, Food and Drug Administration under ContractNo. FDA 223-84-2059 by the Life Sciences Research Office, Federation of AmericanSocieties for Experimental Biology. 1987. Available from FASEB Special PublicationsOffice, Bethesda, MD.
47. Heaney RP. Effects of caffeine on bone and the calcium economy. Food Chem Toxicol 2002;40:1263–1270.
48. Barger-Lux MJ, Heaney RP. Caffeine and the calcium economy revisited. Osteoporos Int 1995;5:97–102.
49. Heaney RP, Recker RR. Effects of nitrogen, phosphorus, and caffeine on calcium balance in women.J Lab Clin Med 1982; 99:46–55.
50. Nordin BEC, Need AG, Morris HA, Horowitz M. The nature and significance of the relationshipbetween urinary sodium and urinary calcium in women. J Nutr 1993; 123:1615–1622.
51. Weaver CM, Heaney RP, Martin BR, Fitzsimmons ML. Human calcium absorption from wholewheat products. J Nutr 1991; 121:1769–1775.
52. Weaver CM, Heaney RP, Proulx WR, Hinders SM, Packard PT. Absorbability of calcium from com-mon beans. J Food Sci 1993; 58:1401–1403.
53. Weaver CM, Heaney RP, Nickel KP, Packard PT. Calcium bioavailability from high oxalate vegeta-bles: Chinese vegetables, sweet potatoes, and rhubarb. J Food Sci 1997; 62:524-525.

458 Part V / Bone Diseases
54. Barrett-Connor E, Chang JC, Edelstein SL. Coffee-associated osteoporosis offset by daily milk con-sumption. JAMA 1994; 271:280–283.
55. Morris RC Jr, Frassetto LA, Schmidlin O, Forman A, Sebastian A. Expression of Osteoporosis asDetermined by Diet-Disordered Electrolyte and Acid-Base Metabolism. In: Burckhardt P,Dawson-Hughes B, Heaney RP, eds. Nutritional Aspects of Osteoporosis,. Academic Press, NewYork, 2001, pp. 357–378.
56. Sellmeyer DE, Schloetter M, Sebastian A. Potassium citrate prevents increased urine calcium excre-tion and bone resorption induced by a high sodium chloride diet. J Clin Endocrinol Metab 2002;87:2008–2012.
57. Matkovic V, Fontana D, Tominac C, Goel P, Chesnut CH III. Factors that influence peak bone massformation: a study of calcium balance and the inheritance of bone mass in adolescent females. AmJ Clin Nutr 1990; 52:878–888.
58. Matkovic V, Ilich JZ, Andon MB, et al. Urinary calcium, sodium, and bone mass of young females.Am J Clin Nutr 1995; 62:417–425.
59. Lau EMC, Cooper C, Woo J. Calcium deficiency—a major cause of osteoporosis in Hong KongChinese. In: Burckhardt P, Heaney RP, eds. Nutritional Aspects of Osteoporosis. Raven Press, NewYork, 1991; 85:175–180.
60. Berkelhammer CH, Wood RJ, Sitrin MD. Acetate and hypercalciuria during total parenteral nutri-tion. Am J Clin Nutr 1988; 48:1482–1489.
61. Sebastian A, Harris ST, Ottaway JH, et al. Improved mineral balance and skeletal metabolism inpostmenopausal women treated with potassium bicarbonate. N Engl J Med 1994; 330:1776–1781.
62. Barr SI, Prior JC, Janelle KC, Lentle BC. Spinal bone mineral density in premenopausal vegetarianand nonvegetarian women: cross-sectional and prospective comparisons. J Am Diet Assoc 1998;98:760–765.
63. Chiu J-F, Lan S-J, Yang C-Y, et al. Long-term vegetarian diet and bone mineral density in post-menopausal Taiwanese women. Calcif Tissue Int 1997; 60:245–249.
64. Heaney RP. Dietary protein and phosphorus do not affect calcium absorption. Am J Clin Nutr 2000;72:758–761.
65. Spencer H, Kramer L, Osis D, Norris C. Effect of phosphorus on the absorption of calcium and onthe calcium balance in man. J Nutr 1978; 108:447–457.
66. Heaney RP, Recker RR. Determinants of endogenous fecal calcium in healthy women. J Bone MinerRes 1994; 9:1621–1627.
67. Spencer H, Kramer L, Norris C, Osis D. Effect of small doses of aluminum-containing antacids oncalcium and phosphorus metabolism. Am J Clin Nutr 1982; 36:32–40.
68. The Surgeon General’s Report on Nutrition and Health. DHHS (PHS) Publication No.88-50211,1988.
69. Heaney RP, Dowell MS, Rafferty K, Bierman J. Bioavailability of the calcium in fortified soy imi-tation milk, with some observations on method. Am J Clin Nutr 2000; 71:1166–1169.
70. Heaney RP, Rafferty K, Bierman J. Not all calcium-fortified beverages are equal. Nutr Today, inpress.
71. Heaney RP, Dowell MS, Bierman J, Hale CA, Bendich A. Absorbability and cost effectiveness incalcium supplementation. J Am Coll Nutr 2001; 20:239–246.
72. Ilich-Ernst JZ, McKenna AA, Badenhop NE, et al. Iron status, menarche, and calcium supplemen-tation in adolescent girls. Am J Clin Nutr 1998; 68:880–887.
73. Barger-Lux MJ, Heaney RP, Lanspa SJ, Healy JC, DeLuca HF. An investigation of sources of vari-ation in calcium absorption physiology. J Clin Endocrinol Metab 1995; 80:406–411.
74. Devine A, Wilson SG, Dick IM, Prince RL. Effects of vitamin D metabolites on intestinal calciumabsorption and bone turnover in elderly women. Am J Clin Nutr 2002; 75:283–288.
75. Colodro IH, Brickman AS, Coburn JW, Osborn TW, Norman AW. Effect of 25-hydroxy-vitamin D3
on intestinal absorption of calcium in normal man and patients with renal failure. Metabolism 1978;27:745–753.
76. Heaney RP, Barger-Lux MJ, Dowell MS, Chen TC, Holick MF. Calcium absorptive effects of vita-min D and its major metabolites. J Clin Endocrinol Metab 1997; 82:4111-4116.
77. Francis RM, Peacock M, Storer JH, Davies AEJ, Brown WB, Nordin BEC. Calcium malabsorptionin the elderly: the effect of treatment with oral 25-hydroxyvitamin D3. Eur J Clin Invest 1983;13:391–396.

Chapter 18 / Osteoporosis 459
78. Slovik DM, Adams JS, Neer RM, Holick MF, Potts JT Jr. Deficient production of 1,25-dihydrox-yvitarnin D in elderly osteoporotic patients. N Engl J Med 1981; 305:372–374.
79. Francis RM, Peacock M, Taylor GA, Storer JR, Nordin BEC. Calcium malabsorption in elderlywomen with vertebral fractures: evidence for resistance to the action of vitamin D metabolites on thebowel. Clin Sci 1984; 66:103–107.
80. Lips P, Graafmans WC, Ooms ME, Bezemer D, Bouter LM. Vitamin D supplementation and frac-ture incidence in elderly persons. Ann Intern Med 1996; 124:400–406.
81. Heikinheimo RJ, Inkovaara JA, Harju EJ, et al. Annual injection of vitamin D and fractures of agedbones. Calcif Tissue Int 1992; 51:105–110.
82. Trivedi DP, Doll R, Khaw KT: Effect of four monthly oral vitamin D3 (cholecalciferol) supplemen-tation on fractures and mortality in men and women living in the community: randomised doubleblind controlled trial. Br Med J 2003; 326:469–474.
83. Thomas MK, Lloyd-Jones DM, Thadhani RI, et al. Hypovitaminosis D in medical inpatients. N EnglJ Med 1998; 338:777–783.
84. LeBoff MS, Kohlmeier L, Hurwitz S, Franklin J, Wright J, Glowacki J. Occult vitamin D deficiencyin postmenopausal US women with acute hip fracture. JAMA 1999; 281:1505–1511.
85. Passeri G, Pini G, Troiano L, et al. Low vitamin D status, high bone turnover and bone fractures incentenarians. J Clin Endocrinol Metab 2003; 88:5109–5115.
86. Holick MF. Sources of Vitamin D: Diet and Sunlight. In: Burckhardt P, Heaney RP, eds. Challengesof Modern Medicine, Nutritional Aspects of Osteoporosis, (Proceedings of 2nd InternationalSymposium on Osteoporosis, Lausanne, May 1994). Ares-Serono Symposia Publications, Rome,Italy, 1995; 7:289–309.
87. Vieth R. Vitamin D supplementation, 25-hydroxyvitamin D levels, and safety. Am J Clin Nutr 1999;69:842–856.
88. Heaney RP, Davies KM, Chen TC, Holick MF, Barger-Lux MJ. Human serum 25-hydroxy-cholecalciferol response to extended oral dosing with cholecalciferol. Am J Clin Nutr 2003;77:204–210.
89. Johnson NE, Alcantara EN, Linkswiler HM. Effect of protein intake on urinary and fecal calciumand calcium retention of young adult males. J Nutr 1970; 100:1425–1430.
90. Chu JY, Margen S, Costa FM. Studies in calcium metabolism. II. Effects of low calcium and vari-able protein intake on human calcium metabolism. Am J Clin Nutr 1975; 28:1028–1035.
91. Delmi M, Rapin C-H, Bengoa J-M, Delmas PD, Vasey H, Bonjour J-P. Dietary supplementation inelderly patients with fractured neck of the femur. Lancet 1990; 335:1013–1016.
92. Schürch M-A, Rizzoli R, Slosman D, Vadas L, Vergnaud P, Bonjour J-P. Protein supplementsincrease serum insulin-like growth factor-I levels and attenuate proximal femur bone loss in patientswith recent hip fracture. Ann Intern Med 1998; 128:801–809.
93. Hannan MT, Tucker KL, Dawson-Hughes B, Cupples LA, Felson DT, Kiel DP. Effect of dietary pro-tein on bone loss in elderly men and women: The Framingham Osteoporosis Study. J Bone MinerRes 2000; 15:2504–2512.
94. Spencer H, Kramer L, Osis D. Effect of a high protein (meat) intake on calcium metabolism in man.Am J Clin Nutr 1978; 31:2167–2180.
95. Kerstetter JE, O’Brien KO, Insogna KL. Dietary protein affects intestinal calcium absorption. Am JClin Nutr 1998; 68:859–865.
96. Roughead ZK, Johnson LK, Lykken GI, Hunt JR. Controlled high meat diets do not affect calciumretention of bone status in healthy postmenopausal women. J Nutr 2003; 133:1020–1026.
97. Dawson-Hughes B, Harris SS. Calcium intake influences the association of protein intake with ratesof bone loss in elderly men and women. Am J Clin Nutr 2002; 75:773–779.
98. Heaney RP, McCarron DA, Dawson-Hughes B, et al. Dietary changes favorably affect bone remod-eling in older adults. J Am Diet Assoc1999; 99:1228–1233.
99. Bonjour JP, Schüch MA, Chevalley T, Ammann P, Rizzoli R. Protein intake, IGF-1 and osteoporo-sis. Osteoporos Int 1997; 7(Suppl 3):S36–S42.
100. Price PA. Role of vitamin-K-dependent proteins in bone metabolism. Ann Rev Nutr 1988; 8:565–583.101. Szulc P, Delmas PD. Is There a Role for Vitamin K Deficiency in Osteoporosis? In: Burckhardt
P, Heaney RP, eds. Challenges of Modern Medicine, Nutritional Aspects of Osteoporosis,(Proceedings of 2nd International Symposium on Osteoporosis, Lausanne, May 1994). Ares-SeronoPublications, Rome, Italy, 1995; 7:357–366.

460 Part V / Bone Diseases
102. Booth SL, Broe KE, Gagnon DR, et al. Vitamin K intake and bone mineral density in women andmen. Am J Clin Nutr 2003; 77:512–516.
103. Feskanich D, Weber P, Willett WC, Rockett H, Booth SL, Colditz GA. Vitamin K intake and hipfractures in women: a prospective study. Am J Clin Nutr 1999; 69:74–79.
104. Hodges SJ, Pilkington MJ, Stamp TCB, et al. Depressed levels of circulating menaquinones inpatients with osteoporotic fractures of the spine and femoral neck. Bone 1991; 12:387–389.
105. Binkley NC, Krueger DC, Kawahara TN, Engelke JA, Chappell RJ, Suttie JW. A high phylloquinoneintake is required to achieve maximal osteocalcin γ-carboxylation. Am J Clin Nutr 2002;76:1055–1060.
106. Knapen MHJ, Hamulyak K, Vermeer C. The effect of vitamin K supplementation on circulatingosteocalcin (bone gla protein) and urinary calcium excretion. Ann Int Med 1989; 111:1001–1005.
107. Shils ME. Magnesium. In: Shils ME, Olson JA, Shike, M, eds. Modern Nutrition in Health andDisease-8th ed., Vol.1. Lea & Febiger, Philadelphia, PA, 1994, pp. 164–184.
108. Spencer H, Fuller H, Norris C, Williams D Effect of magnesium on the intestinal absorption of cal-cium in man. J Am College Nutr 1994; 13:485–492.
109. Mertz W, ed. Trace elements in human and animal nutrition, 5th ed. Academic Press, San Diego, CA,1987.
110. Strain JJ. A reassessment of diet and osteoporosis—possible role for copper. Med Hypotheses 1988;27:333–338.
111. Howard G, Andon M, Bracker M, Saltman P, Strause L. Low serum copper, a risk factor additionalto low dietary calcium in postmenopausal bone loss. J Trace Elements Experimental Med 1992;5:23–31.
112. Oxlund H, Barckman M, Ørtoft G, Andreasen TT. Reduced concentrations of collagen cross-linksare associated with reduced mechanical strength in bone. J Bone Miner Res 1995; 10:S179.
113. Strause L, Saltman P, Smith K, Andon M. The Role of Trace Elements in Bone Metabolism. In:Burckhardt P, Heaney RP, eds. Nutritional Aspects of Osteoporosis, Serono Symposia PublicationVol. 85, Raven Press, New York, 1991, pp. 223–233.
114. Bastow MD, Rawlings J, Allison SP. Benefits of supplementary tube feeding after fractured neck offemur. Br Med J 1983; 287:1589–1592.

VI PREVENTION OF MAJOR DISABILITIES:IMPROVEMENT IN HEALTH OUTCOMES


From: Preventive Nutrition: The Comprehensive Guide for Health Professionals, Third EditionEdited by: A. Bendich and R. J. Deckelbaum © Humana Press Inc., Totowa, NJ
463
19 Antioxidant Statusand Risk for Cataract
Mark Siegal, Chung-Jung Chiu, and Allen Taylor
KEY POINTS
● Oxidative insult to lens proteins and proteases, together with limited ability to removethe damaged proteins, are involved in the etiology of age-related cataract.
● Observational studies indicate elevated levels of intake of antioxidants is associatedwith diminished prevalence, incidence, or progress of age-related cataract. They implythat having a daily intake of about 250 mg of vitamin C and 90 mg of vitamin E is asso-ciated with diminished risk for cataract. Much of this can be obtained from diet.
● There have been six intervention trails. The results from these are generally inconsis-tent with the results from the observational trials. It would be worthwhile to determinewhy the various types of studies are not yielding similar results.
● Most studies indicate associations between poverty, lack of education, lower socioeco-nomic status, and increased risk for age-related eye diseases. For such persons, a supple-ment might be indicated, failing remediation of the situation.
1. INTRODUCTION
Oxidative stress is associated with compromises to the lens, including risk for cataract(reviewed in ref. 1). This chapter briefly describes the etiology of cataract and reviewsthe epidemiological information regarding nutrition and cataract, with an emphasis onthe roles of nutritional antioxidants such as vitamins C and E and carotenoids.
Cataract is one of the major causes of preventable blindness worldwide (2–4). In theUnited States, the prevalence of visually significant cataract increases from approx 5%at age 65 yr to about 50% for persons older than 75 yr (5–7). In less developed coun-tries, such as India (8), China (9), and Kenya (10), cataracts are more common anddevelop earlier in life than in more developed countries (7,8). The impact of cataract onimpaired vision is much greater in less developed countries, where more than 90% ofthe cases of blindness and visual impairment are found (11,12) and where there is adearth of ophthalmologists to perform lens extractions. Rates of increase in cataract

464 Part VI / Prevention of Major Disabilities
increase as life expectancy extends. About 1.4 million extractions were performed in1995; this number is expected to double by 2030.
A more optimistic vantage point estimates that a delay in cataract formation of about10 yr would reduce the prevalence of visually disabling cataract by about 45% (2). Sucha delay would enhance the quality of life for much of the world’s elderly population andsubstantially reduce the economic burden (about $5 billion annually in the UnitedStates) of cataract-related disability and cataract surgery (13).
1.1. Organization of This ChapterThe chapter begins with a description regarding what we currently know about the
etiology of cataract and a summary of the pertinent biochemistry of antioxidants. Theavailable epidemiological data are then described, with particular emphasis on the rela-tions between specific antioxidant nutrients and cataract. Each of these sections beginswith a general overview. Decriptions of the relationships between intake of the nutrientand risk for specific forms of cataract follow. A summary of data from recent large inter-vention trials is a new feature.
2. ETIOLOGY OF CATARACT
The primary function of the eye lens is to collect and focus light on the retina. To per-form this function, it must remain clear throughout life (Fig. 1A). The lens is exquis-itely organized. A single layer of epithelial cells is located directly under the anteriorsurface of the collagenous membrane in which it is encapsulated (Fig. 1B). The epithe-lial cells at the germinative region divide, migrate posteriorly, and differentiate into lensfibers. As their primary gene products, the fibers elaborate the predominant proteins ofthe lens, called crystallins. New cells form throughout life, but older cells usually arenot lost. Instead, they are compressed into the center or nucleus of the lens. With agingor stress caused by light exposure (14) or smoking (15), the proteins are photo-oxidativelydamaged and aggregate. High-energy radiation, reactive oxygen species, sunlight, andfailure of secondary defense systems are among the oxidative insults (see Subheadings 2.1.and 2.2.) (Fig. 2). There is a coincident dehydration of the proteins and the lens itself.Consequently, protein concentrations rise to hundreds of milligrams per milliliter (16).Because of age-related modifications of the protein (such as glycation, glycoxidation,modification of proteins by lipid, oxidation of these moieties, and crosslinking), the lensbecomes less flexible, with limited accommodative capability. Eventually, the aggregatedproteins precipitate in lens opacities, or cataracts.
The term “age-related cataract” distinguishes lens opacification associated with oldage from opacification associated with other causes such as congenital and metabolicdisorders or trauma. There are several systems for evaluating and grading cataracts. Mostof these use an assessment of extent (or density) and location of the opacity (17,18).Opacities are usually evaluated in the posterior subcapsular (PSC), nuclear, cortical, andmultiple (mixed) locations; coloration may also be evaluated (19,20). However, it has notbeen established whether cataract at each location has a completely different etiology.
2.1. Antioxidants as Primary Defenses Against Lens DamageWhat systems are available to protect the lens? Protection against photo-oxidative
insult can be conceived as being the result of two interrelated processes (Fig. 2).Antioxidants and antioxidant enzymes provide primary protection against insults by

465
Fig
. 1.
Cle
ar a
nd c
atar
acto
us le
ns.(
A)
Cle
ar le
ns a
llow
s an
uno
bstr
ucte
d vi
ew o
f th
e w
ire
grid
pla
ced
behi
nd it
. (B
)C
arto
on o
fth
e st
ruct
ure
of th
e le
ns. T
he a
nter
ior
surf
ace
of th
e le
ns h
as a
uni
cell
ular
laye
r of
epi
thel
ial c
ells
(yo
unge
st ti
ssue
). C
ells
at t
hean
teri
or e
quat
oria
l reg
ion
divi
de a
nd m
igra
te to
the
cort
ex a
s th
ey a
re o
verl
aid
by le
ss m
atur
e ce
lls.
The
se c
ells
pro
duce
a m
ajor
-it
y of
the
crys
tall
ins.
As
deve
lopm
ent a
nd m
atur
atio
n pr
ocee
d, th
e ce
lls
denu
clea
te a
nd e
long
ate.
Tis
sue
orig
inal
ly f
ound
in th
eem
bryo
nic
lens
is
foun
d in
the
cor
e or
nuc
leus
(ol
dest
tis
sue)
. (C
)T
he c
atar
acto
us l
ens
proh
ibit
s vi
ewin
g th
e w
ire
grid
beh
ind
it. (
D)
Art
ist’
s vi
ew t
hrou
gh a
cle
ar, u
ncol
ored
you
ng l
ens.
The
im
age
is c
lear
and
cri
sp. (
E)
Art
ist’
s vi
ew t
hrou
gh a
len
s w
ith
deve
lopi
ng c
atar
act.
The
imag
e is
par
tial
ly o
bscu
red
and
the
fiel
d is
dar
kene
d as
a r
esul
t of
brow
ning
of
the
lens
that
acc
ompa
-ni
es a
ging
.

466 Part VI / Prevention of Major Disabilities
attenuating the insult or repairing the protein. Recent research indicates that there iscooperation between the antioxidants, particularly under stress (21). Secondary defensesinclude proteolytic and repair processes, which degrade and eliminate damaged proteinsand other biomolecules in a timely fashion (22).
The major aqueous antioxidants in the lens are ascorbate and glutathione (GSH) (23–32).Both are present in the lens at millimolar concentrations. Ascorbate is probably the mosteffective and least toxic antioxidant identified in mammalian systems (23,25,33–36).Ocular levels of ascorbate are related to dietary intake in humans and animals thatrequire ascorbate (35,36). Interestingly, the concentration of vitamin C in the lens wasincreased with dietary supplements beyond levels achieved in persons who alreadyconsumed more than two times the Recommended Daily Allowance (RDA; 70 mg/d)for vitamin C (23,32).
Feeding-elevated ascorbate delayed progress of or prevented galactose cataract in guineapigs (37,38) and rats (39), selenite-induced cataracts in rats (40), and lens opacification inGSH-depleted chick embryos (41) and delayed ultraviolet-induced protein and proteasedamage in guinea pig lenses (42–45). Much of the damage that was prevented by increas-ing ascorbates only twofold was similar to lens protein damage found in cataracts.
Because ascorbate is a carbohydrate, it is biochemically plausible that vitamin Cinduces damage in the lens in vivo (46–48). However, presently, there are no data to
Fig. 2. Proposed interaction between lens proteins, oxidants, light, smoking, antioxidantenzymes, and proteases. Lens proteins are extremely long-lived and subject to alterationby light and various forms of oxygen. They are protected indirectly by antioxidantenzymes: superoxide dismutase, catalase, and GSH reductase/peroxidase. Thoseenzymes convert active oxygen to less-damaging species. Direct protection is offeredby the following antioxidants: GSH, ascorbate (vitamin C), tocopherol (vitamin E), andcarotenoids. Levels of reduced and oxidized forms of some, but perhaps not all, of thosemolecules are determined by an interaction between the three and with the environment(17–20,23,77). In many systems, GSH and ascorbate levels are related, but we did notfind this to be the case in ascorbate-sufficient, ascorbate-requiring rats (24,25). Whenthe proteolytic capability is sufficient, obsolete and damaged proteins might be reducedto their constituent amino acids. With aging, some of the eye antioxidant supplies arediminished, antioxidant enzymes are inactivated, and proteases are less active. Thataction appears to be related to the accumulation, aggregation, and eventual precipitationin cataractous opacities of damaged proteins. GSH, glutathione; hv, light.

Chapter 19 / Cataract Risk 467
support this as a medical concern. Although we found that glycohemoglobin levelsincreased with increasing dietary ascorbate in ascorbate-requiring rats, the rat lenseswere not cataractous (28). Furthermore, mice fed 8% of the weight of their diet as ascor-bate did not develop cataract (49).
GSH levels in the eye are several-fold greater than the levels found in whole blood andorders of magnitude greater than the concentration observed in the plasma. Similarly toascorbate, GSH levels also diminish in the older and cataractous lens (26). Preliminaryevidence from studies with galactose-induced cataract indicated some advantages inmaintaining elevated GSH status in rats (29). However, it is not clear whether feedingGSH is associated with higher ocular levels of this antioxidant (29). In many systems,GSH and ascorbate levels are related. We verified this relationship under stress conditionsand when ascorbate levels were limited (50) but not in ascorbate-sufficient rats (28).
Tocopherols and carotenoids are lipid-soluble antioxidants (51,52) with probable roles inmaintaining membrane integrity (53) and GSH recycling (54). Concentrations of tocopherolin the whole lens are in the micromolar range, and levels are elevated in younger tissues(55), but lens and dietary levels of tocopherol do not appear to be related (56). Becausemost of the compound is found in the membranes, the concentrations may be orders ofmagnitude higher. Other than differential distribution within lenses (51), age-relatedchanges in levels of tocopherol and carotenoids have not been documented. Tocopherol hasbeen reported to be effective in delaying various induced cataracts in animals, includingthose induced by galactose (57,58), and aminotriazole-induced cataracts in rabbits (59).
Relationships between carotenoids and eye health were reviewed recently (1,52). Levelsof β-carotene and lycopene in lenses are extremely low (near vanishing) (51,55). Instead,lutein and zeaxanthin are the major lens and macular carotenoids (present at 11–44 ng/g ofwet weight) (52,60,61). Retinol, retinyl ester (21–50 ng/g of wet weight), and tocopherols(1232–2550 ng/g of wet weight) are also present. The carotenoids, such as vitamin A, alsoare natural lipid-soluble antioxidants (53,62–64). β-carotene is the most well-knowncarotenoid because of its importance as a vitamin A precursor. Data that relate carotenoidsupplement use to risk for cataracts are growing, and carotenoid supplements have alreadybeen included in several “eye vitamin” preparations, including the Age-Related EyeDisease Study (AREDS) and the Roche European American Cataract Trial (REACT).
The lens also contains antioxidant enzymes (GSH peroxidase/reductase, catalase,and superoxidase dismutase) and enzymes of the GSH redox cycle (65–69). These inter-act with the high-energy forms of oxygen and with the antioxidants (GSH is a substratefor GSH peroxidase). The activities of many antioxidant enzymes are compromisedwith development, aging, and cataract formation (70).
2.2. Proteolytic Enzymes Provide Secondary Defenses Against Lens DamageThe accumulation of damaged proteins is cytotoxic, as has been well-documented in
many age-related neurodegenerative diseases including Alzheimer’s and Pick’s diseases(71). However, nowhere is the cytotoxicity more obvious than in cataract, which iscaused by the precipitation of damaged proteins. Proteolytic systems can be consideredsecondary defense capabilities that remove cytotoxic damaged or obsolete proteinsfrom lenses and other tissues (22,62,72–76). These proteolytic systems exist in youngerlens tissue and the outer tissues in all lenses and are probably protected by the primaryantioxidants. However, with aging or oxidative stress, most of these enzymatic capabil-ities are found in a state of reduced activity (1,77). The observed accumulation of oxi-dized (and/or otherwise modified) proteins in older lenses is consistent with the failure

468 Part VI / Prevention of Major Disabilities
of these protective systems to keep pace with the insults that damage lens proteins. Thisoccurs partly because, similarly to bulk proteins, enzymes that comprise some of theprotective systems are damaged by photo-oxidation (1,42,74,78–80).
Several studies have suggested interactions between antioxidants in which one mightspare the other (Fig. 2). Direct sparing effects of ascorbate and GSH on (photo)-oxida-tively induced compromises of proteolytic function have been demonstrated(42,72,74,79). From these data, it is clear that the young lens has significant primaryand secondary protection. However, age-related compromises in the activity of antiox-idant enzymes, concentrations of the antioxidants, and activities of secondary defensesprobably lead to diminished protection against oxidative insults. This diminished pro-tection leaves the long-lived proteins and other constituents vulnerable. As the damagedproteins aggregate and precipitate, lens opacities develop. We predicted that elevatedantioxidant intake can be exploited to extend the function of some of these proteolyticcapabilities, and this might be associated with prolonged lens clarity in vivo (42).
3. EPIDEMIOLOGICAL STUDIES REGARDING ANTIOXIDANTS AND CATARACT
Within the last two decades, considerable effort has been dedicated to determiningwhether antioxidants can diminish the risk for cataract. The overall impression createdby the observational data is that nutrient intake or blood nutrient levels are related torisk for cataract and that nutrition might be exploited to diminish the risk for this debility.The data from the intervention trials are less encouraging upon first inspection. Here, weattempt to summarize both sets of information.
In this chapter, the data regarding a specific nutrient are grouped together. Because ofthe assumption that the opacities in the PSC, cortical, and nuclear zones of the lens havedifferent etiologies, the data are subdivided to consider cataracts separately for thesemetabolically and developmentally distinguishable areas . In some studies, the cataractis purely of the type described, whereas in others, additional types of cataract in the lenszone under study or in other lens zones may be present. Future reviews should separatethe data from these two designs because there may be some mechanistic similaritiesbetween various types of cataract. Data also are considered separately for mixed cataract(involving more than one zone of the lens) and cataract extraction. As compared with ourprior reviews, the category “any cataract” has been omitted, with the exception of casesof cataract extraction, because this category obscures potential etiological distinctionsbetween cataract types. Nutrition status was assessed with various questionnaires and/orby measuring blood nutrient levels. Differences in nutrient intake assessment instrumentsshould be considered when the data are considered. Within a cataract type, we discussthe effects of supplements, diet (including supplements), and blood levels.
Comparisons of the data from various studies are not straightforward, because studiesdiffer in design, definitions of cataract, cataract classification schemes, definitions of highand low levels of nutrients, ages of subjects, and stages of the cataracts. Duration of mea-surement of dietary intake of nutrients and frequency of assessment also can affect theaccuracy of these analyses, because cataract develops over many years, and one measuremay not provide as accurate an assessment of usual intake as multiple measures over time.
Most studies have been observational, but results from six intervention trials werepublished recently (see Table 1). The following sections describe both types of studies.Assets and limitations of various epidemiological designs were discussed in ref. 81.

Chapter 19 / Cataract Risk 469
Some studies were retrospective case-control or cross-sectional studies in which levelsof intake of nutrients in patients with cataract were compared with levels of intake inindividuals with clear lenses (82–101). Our ability to interpret data from retrospectivestudies is limited by the concurrent assessment of lens status and nutrient levels. Priordiagnosis of cataract might influence the behavior of cases, including diet and biasreporting of the usual diet.
Table 1Studies Reviewed in This Chapter
Researcher(s)/Name of study Year Type of study n Reference
AREDS 2001 Intervention 4596 102Brown et al. 1999 Prospective 36,644 103Chasan-Taber et al. 1999a Prospective 73,956 104Chasan-Taber et al. 1999b Prospective 77,466 105Christen et al. 2003 Intervention 20,968 107Chylack et al. 2002 Intervention 445 106Cumming et al. 2000 Retrospective 2900 82Gale et al. 2001 Retrospective 372 83Hankinson et al. 1992 Prospective 50,828 108Italian-American Cataract Study 1991 Retrospective 1477 84Jacques and Chylack 1991 Retrospective 112 85Jacques et al. 1997 Retrospective 294 86Jacques et al. 2001 Retrospective 478 87Jacques et al. 2004 Prospective 407 109Knekt et al. 1992 Prospective 141 110Kuzniarz et al. 2001 Retrospective 385 88Leske et al. 1991 Retrospective 1380 89Leske et al. 1995 Retrospective 1380 90Leske et al. 1997 Retrospective 4314 91Leske et al. 1998 Prospective 764 111Lyle et al. 1999a Prospective 1354 113Lyle et al. 1999b Prospective 252 112Mares-Perlman et al. 1994 Retrospective 1862 92Mares-Perlman et al. 1995a Retrospective 1919 93Mares-Perlman et al. 1995b Retrospective 400 94Mares-Perlman et al. 1996 Prospective 3220 114Mares-Perlman et al. 2000 Prospective 2434 115Mohan et al. 1989 Retrospective 1990 96McCarty et al. 1999 Retrospective 3271 95McNeil et al. 2004 Intervention 1193 116Nadalin et al. 1999 Prospective 1111 117Robertson et al. 1989 Retrospective 304 97Rouhiainen et al. 1996 Prospective 410 118Seddon et al. 1994 Prospective 17,744 119Sperduto et al. 1993 Intervention 2141; 3249 120Tavani et al. 1996 Retrospective 913 98Teikari et al. 1998 Intervention 28,934 121Taylor et al. 2002 Retrospective 492 99Valero et al. 2002 Retrospective 677 100Vitale et al. 1993 Retrospective 671 101

470 Part VI / Prevention of Major Disabilities
Table 2Comparison of Intervention Trials
Study AREDS (2001) (102); n = 4629
Design A randomized, placebo-controlled, clinical trial
Subjects Median: 68 yr; range: 55–80 yr
Place United States
Evaluation of lens opacity An extension of the Wisconsin System for SubjectiveClassifying Cataracts from photographs; the area of lensinvolvement is used to assess the severity of cortical andPSC opacities. Optical density of nuclear opacity is gradedagainst a series of seven standard photographs. Progressionof lens opacity (nuclear, cortical, and/or PSC) is defined asfollows—nuclear: 1.5-unit increase from baseline on a scaleranging from 0.9 to 6.1; cortical: 10% absolute increase inarea from baseline within the central 5-mm diameter circleof the lens; PSC: 5% absolute increase in area from baselinewithin the central 5-mm diameter circle of the lens. Onlyrelatively advanced cataracts were rated as “lens events.”The “lens event rates” were relatively high, ranging from0.7% for cortical to 21.3% for mixed.
Baseline opacity Nuclear: <2.0: 37%; 2.0–3.9: 48%; ≥4.0: 15%. Cortical:<0.1: 48%; 0.1–4.9: 41%; ≥5.0: 11%. PSC: <0.1: 90%;0.1–4.9: 8%; ≥5.0: 2%
Supplement 500 mg of vitamin C, 400 IU of vitamin E, 15 mg of β-carotene, 80 mg of zinc (zinc oxide), 2 mg of copper(cupric oxide). Sixty-six percent of participants tookCentrum (containing a RDA amount of vitamins C and E, β-carotene, and zinc). This may have reduced the difference invitamin concentrations between the treated and placebo groups.
Duration 6.3 yr of AREDS supplement use
Result No significant protective or adverse effect was found.
Conclusion Use of a high-dose formulation of vitamins C and E and β-carotene in a relatively well-nourished older adult cohorthad no apparent effect on the 7-yr risk of development orprogression of age-related nuclear, cortical, or PSC lensopacities or visual acuity loss.
Study REACT Chylack et al. (2002) (106); n = 445
Design A randomized, placebo-controlled, clinical trial
Subjects 297 randomized from the United States and UnitedKingdom. Before the start of the study, the UK cohort warelatively poorer in nutritional status. US age mean: 65 yr,UK age mean: 68 yr; p = 0.0046
Evaluation of lens opacity Standardized digital lens images (CASE 2000 CCD) graded using computer-assisted (objective) image analysis. Cortical: % area opaque (0 to 100); PSC: % area opaque
(Continued)

Chapter 19 / Cataract Risk 471
Table 2 (Continued)
(0 to 100); nuclear dip: ln:sd (10 to 36); scatter density anterior 1 mm and posterior 1 mm: sd (200 to 1000). Theprimary endpoint was the percentage increase in pixels opaqueopaque, used as a continuous variable. More advanced cataractprogression was found in the UK cohort than in the US cohort.
Baseline opacity Nuclear dip (pixel density) mean:16.7; LOCS III nuclear grade mean: 2.4; LOCS III cortical grade mean: 1.8; LOCSIII PSC grade mean: 0.58.
Supplement 750 mg vitamin C, 600 IU of vitamin E, 18 mg of β-carotene
Duration 3 yr of supplement use
Result There was about half as much change in the overall cohortwho took the supplement for 3 yr. The protection was significant in the US cohort (which had earlier opacities)and in the overall cohort (US+UK) at 3 yr; at no time wasprotection significant in the UK cohort alone.
Conclusion Dietary use of the vitamins C and E and β-carotene for 3 yrproduced a small deceleration in progression ofage-related mixed cataract.
Study VECAT, McNeil et al. (2004) (116) n = 1193
Design A randomized, placebo-controlled, clinical trial.
Subjects 1193 subjects with early or no cataract, ages 55–80 yr (mean:65 yr)
Evaluation of lens opacity The eye with the more advanced opacity; Nidek EAS 1000(Software version 3.01c; fixed mask); Wilmer lens gradingsystem. Cortical: (integral) 0 (0), 0.5 (1/16), 1 (1/8), 2 (1/4), 3 (1/2), 4 (≥1/2); nuclear: 0–4.9; PSC: multiply the verticaland horizontal dimensions measured by thecalibration of the slit beam height. The cutoff points fordefining cataract were: cortical: 2.0; nuclear: 2.0; PSC:greater or equal to 1 mm2. The criteria for cataract pro-gression were: cortical: increase more than 1; nuclear: increase more than 0.5; PSC: increase 1 mm2 or more.
Baseline opacity Wilmer grade: cortical: median = 0, mean = 0.5, range:0–4.0; nuclear: median, mean = 1.5, range: 0.5–4.5.Digital grade: nuclear: mean = 8.015 (95% CI 7.99–8.03).
Supplement 500 IU of vitamin E in soybean oil encapsulated in gelatin.
Duration 4 yr of vitamin E supplement use.
Result For cortical cataract, the 4-yr cumulative incidence rate was4.5% among those randomized to vitamin E and 4.8%among those randomized to placebo (p = 0.87). Fornuclear cataract, the corresponding rates were 12.9 and12.1% (p = 0.77). For PSC cataract, they were 1.7 and3.5% (p = 0.08). For any of these forms of cataract, theywere 17.1 and 16.7%, respectively. Progression of corticalcataract was seen in 16.7% of the vitamin E-group and
(Continued)

472 Part VI / Prevention of Major Disabilities
Table 2 (Continued)
18.4% of the placebo group (p = 0.76). Corresponding ratesfor nuclear cataract were 11.4 and 11.9% (p = 0.84), andthose of any cataract were 16.5 and 16.7%, respectively.There was no difference in the rate of cataract extractionbetween the two groups (p = 0.87).
Conclusion Vitamin E given for 4 yr at a dose of 500 IU daily did notreduce the incidence or progression of nuclear, cortical, or posterior subcapsular cataracts. These findings do not support the use of vitamin E to prevent the developmentor slow the progression of age-related cataracts.
Study ATBC, Teikari et al. (1998) (121) n = 28,934
Design A randomized, double-blind, placebo-controlled, 2 × 2 factorial trial in male smokers.
Subjects 28,934 male smokers ages 50–69 yr.
Evaluation of lens opacity Cataract extraction, ascertained from the National HospitalDischarge Registry.
Baseline opacity Does not apply.
Supplement 50 mg of α-tocopherol (vitamin E) per day, 20 mg of β-carotene per day.
Duration 5–8 yr (median: 5.7 yr).
Result Neither α-tocopherol (RR = 0.91, 95% CI 0.74–1.11) nor β-carotene (RR = 0.97, 95% CI 0.79–1.19) supplementationaffected the incidence of cataract surgery.
Conclusion Supplementation with α-tocopherol or β-carotene does notaffect the incidence of cataract extractions among male smokers.
Study Linxian, Sperduto et al. (1993) (120)
Design Two randomized, double-masked trials with end-of-trial eyeexaminations.
Subjects Trial 1: 2141 subjects ages 45–74 yr; Trial 2: 324 subjectsages 45–74 yr.
Evaluation of lens opacity The Lens Opacities Classification System II, which usesphotographic standards for grading cataract type and severity, was used to evaluate lens status at the slit lamp.The system provides ordinal scores for separately gradingnuclear (NO, NI, NII, NIII, or NIV), cortical (CO, Ctr, CICII, CIII, CIV, OR CV), and PSC (PO, PI, PII, PIII, orPIV) opacities. A person was judged to have a nuclearcataract if either eye had a grade of NII or greater, a cortical cataract if either eye had a grade of CII or greater,and a PSC cataract if either eye had a grade of PI orgreater. The remaining lens was used to classify personswith unilateral aphakia.
Baseline opacity Does not apply.(Continued)

Chapter 19 / Cataract Risk 473
Table 2 (Continued)
Supplement Multivitamin/mineral supplement or matching placebo intrial 1; factorial design to test the effect of four different vitamin/mineral combinations in trial 2 (retinol/zinc, riboflavin/niacin, ascorbic acid/molybdenum, and selenium/α-tocopherol/β-carotene).
Duration 5–6 yr.
Result In the first trial, there was a statistically significant 36%reduction in the prevalence of nuclear cataract for persons ages 65–74 yr who received the supplements. In the second trial, the prevalence of nuclear cataract was significantly lower in persons receiving riboflavin/niacin compared with persons not receiving these vitamins. Again, persons in the oldest group (65–74 yr) benefited the most (44% reduction in prevalence). No treatmenteffect was noted for cortical cataract in either trial.
Although the number of PSC cataracts was very small, there was a statistically significant deleterious effectof treatment with riboflavin/niacin.
Conclusion Increased β-carotene intake and supplement use is notrelated to diminished risk for nuclear, cortical,
or PSC cataract. Increased riboflavin intake or supplement use is related to diminished risk for nuclear cataract. Increased multivitamin supplement use or antioxidant index intake is notrelated to diminished risk for cortical cataract.
Study Physician’s Health Study, Christen et al. (2003) (107) Intervention.Design A randomized, double-masked, placebo-controlled trial.
Subjects Male US physicians ages 40–84 yr, (n = 22,071)
Evaluation of lens opacity Does not apply.
Baseline opacity Does not apply.
Supplement 50 mg of β-carotene.
Duration Alternate days for 12 yr.
Result Christen et al. found a 27% reduced rate of cataract extraction (RR = 0.73, 95% CI 0.53–1.0) between men who were current smokers who took the β-carotene supplement versus those on a placebo, in a prospectivestudy of 20,968 subjects for 12 yr.
Conclusion Randomized trial data from a large population of healthymen indicated no overall benefit or harm of 12 yr of β-carotene supplementation on cataract or cataract extraction. However, among current smokers at baseline, β-carotene appeared to attenuate their excess risk ofcataract by about one-fourth.

474 Part VI / Prevention of Major Disabilities
Other studies were prospective and assessed nutrient intake levels and/or supplementuse and then followed individuals with intact lenses for up to 13 yr (102–121). In theNutrition and Vision Project (NVP), we used retrospectively gathered nutrient intake datain a prospective analysis regarding odds for early lens opacities (87,99). Such prospectivestudies are less prone to bias because assessment of exposure is performed before the out-come is known. Some of those studies (103–105,108,110,119) used cataract extraction orreported diagnosis of cataract as a measure of cataract risk. Although risk ratios, which arepresented in some studies, are adjusted for many potentially confounding variables, othersare not. Data from retrospective and prospective studies are separated in the figures.
Theoretically, the best studies are randomized, double-blind, placebo-controlled, inter-vention trials. We review six interventions of this type, with follow-ups ranging from 3 to13 yr (102,106,107,116,120,121). (See Section 3.1. and Table 2.)
Most prospective studies used one or more fixed endpoints for their outcome crite-ria, such as incidence of new cataract, progression to a given opacity gradem or progressof a fixed amount. However, two prospective studies did not use fixed endpoints(106,109) (see Table 3) but quantified the average change over time in a computer-assisted measurement of opacification.
This chapter features data from studies that found statistically significant correlationsbetween nutrient intake or plasma level of nutrients and risk for opacities. We also dis-tinguish “suggestive associations” between nutrient intake and risk for opacities when
Table 3Results From Studies That Did Not Use Fixed Endpoints
Change
Difference Type of Not (not supp
Study Design Change supplemented Supplemented –supp) p
REACTa, Placebo- % Pixels 3.3% Pixels 1.7% Pixels 1.6% 0.05Chylack controlled opaque opaque in opaque inet al. intervention during placebo in supple-(2002), trial using 3 yr ment usersn = 158 daily supp:
18 mg of β-carotene,750 mg of vitamin C,600 mg of vitamin E
NVP, Vitamin E Change in 17 12 5 0.004Jacques supplement pixels et al. use ≥10 yr opaque (2004), over 5 yrn = 407aA double-masked, randomized, placebo-controlled. Subjects older than age 40 yr had some early
cataract at baseline in one eye, cataract was more severe in the United Kingdom than in the UnitedStates. Subjects in the United Kingdom had two-thirds lower plasma vitamin C, vitamin E, and lycopene,and one-third lower cryptoxanthin. In the subjects from the United Kingdom, 23% were smokers; in thesubjects from the United States, 15% were smokers. The difference in pixels opaque in the United Stateswas 0.0014 after 3 yr; the difference in pixels opaque in the United Kingdom was not significant.

Chapter 19 / Cataract Risk 475
there is a statistically significant p-trend but no such individually significant odds ratio(OR) or risk ratio. The other studies were reviewed recently (1). For convenience, allratios are presented as risk ratios in the text, and only studies that show statistically sig-nificant risk or odds ratios are discussed in detail.
3.1. InterventionsSix randomized, double-blinded, placebo-controlled intervention trials assessed the
effect of vitamin supplements on cataract risk, with mixed results. The AREDS, Vitamin E,Cataract and Age-related Macular Degeneration (VECAT), and α-Tocopherol β-Carotene(ATBC) trials all found no statistically significant association. The Linxian, Physician’sHealth Study, and REACT trials each found associations, primarily protective effects,for certain subgroups (Table 2 and Fig. 3).
Fig. 3. Intervention studies and cataract risk ratio for intervention supplement group versusplacebo group. Log scale. See also Table 3 for results of studies without fixed endpoints.

476 Part VI / Prevention of Major Disabilities
Although the AREDS design did not support for the conclusion that use of nutrientsupplements decreases risk for progress of opacities, it is possible that early interven-tion with higher doses of vitamins C and E and β-carotene might be the effective strat-egy if (a) there was not such widespread use of other vitamin supplements, such asCentrum, among the controls, (b) earlier grades of opacities were observed, and (c)more sensitive grading methods were employed (122).
As a result of the use of different cataract assessment methods, different ages, andnatural histories of the opacities within each study group at baseline, it is difficult tocompare the studies. However, it appears that the chances of finding relationships maybe greater if younger age groups are employed in which the cataracts are at earlystages—particularly study groups in which supplement use can be evaluated over a longperiod of time (i.e., 10 yr) prior to significant levels of cataract. A biochemical corol-lary of finding suggests that, similarly to aggregation of protein (which, in fact, closelydescribes a cataract), once the process has started, it is difficult to stop. Another corol-lary is that good eating practices early in life may have health dividends regarding delayof cataract as well as a host of other age-related debilities. These data corroborate obser-vations from the NVP that use of supplements for 10 yr or more relatively early in life(starting before age 50 yr) is required to obtain the benefit of diminishing chances foronset or progress of lens opacities (87,99,109).
3.1.1. NUCLEAR
Three intervention studies examined risk for nuclear cataract. One study found statisti-cally significant data to support the hypothesis that supplement interventions are related todiminished risk for nuclear cataract (120). The two other studies showed no effect (102,116).
In an intervention study of 2141 subjects, Sperduto et al. (120) found a 43% reduced rateof nuclear cataract (risk ratio [RR] = 0.57, 95% confidence interval [CI] 0.36–0.9) betweensubjects ages 65–74 yr using a multivitamin supplement and those on a placebo. The studyalso produced a 41% reduced rate of nuclear cataract (RR = 0.59, 95% CI 0.45–0.79) amongall subjects on a riboflavin and niacin supplement and a 55% reduced rate (RR = 0.45, 95%CI 0.31–0.64) between subjects ages 65–74 yr on a riboflavin and niacin supplement.
3.1.2. CORTICAL
None of the three intervention studies that examined risk for cortical cataract showedan effect (102,116,120).
3.1.3. POSTERIOR SUBCAPSULAR
Two intervention studies examined risk for PSC cataract. One study found statisti-cally significant data indicating that supplement interventions are related to increasedrisk for PSC cataract (120).
In an intervention study of 3249 subjects, Sperduto et al. (120) found a 64%increased rate of PSC cataract (RR = 2.64, 95% CI 1.31–5.35) between subjects on ariboflavin and niacin intervention and those on a placebo.
3.1.4. MIXED
In an intervention study of 445 subjects examining risk for mixed cataract, statisti-cally significant data were demonstrated to support the hypothesis that vitamins C andE and β-carotene interventions diminished risk for mixed cataract in US subjects but notin the less well-nourished British subjects (Table 3; 106).

Chapter 19 / Cataract Risk 477
3.1.5. EXTRACTION
Three intervention studies examined risk for cataract extraction. One study found sta-tistically significant data indicating that supplement interventions in male current smok-ers were related to diminished risk for cataract extraction (107). The other two studiesshowed no effect (116,121).
In a prospective study of 20968 subjects, Christen et al. (107) found a 27% reducedrate of cataract extraction (RR = 0.73, 95% CI 0.53–1.0) between current male smok-ers on a β-carotene intervention and those on a placebo.
3.2. Observational Studies Regarding Vitamin C (Fig. 4)The greatest number of studies involved those investigating relations between vita-
min C intake and risk for cataract (82–87,89,92,93,96–102,104,106,108,111,113,119).Biochemical data indicates potential anticataractogenic and cataractogenic roles for vit-
amin C, but the epidemiological record is far more supportive of the former(85–87,89,92,93,96,97,99,100,106,108,113). In several human epidemiological studies ofvitamin C, supplement use and elevated blood levels of vitamin C were inversely associ-ated with at least one type of cataract (85–87,89,92,93,96,97,99,100,106,108,113). Dietsrich in fruits and vegetables, which are also rich in antioxidant nutrients, appear to conferdiminished risk for nuclear cataract or cataract extraction. The optimal level of vitamin Cintake seems to be more than 130 mg; intakes of more than 300 mg provide no added
Fig. 4. (Continued)

478 Part VI / Prevention of Major Disabilities
benefit (87). Studies suggest that supplement intake must be maintained for 10 yr to obtainthis result (87,99,115).
3.2.1. NUCLEAR
Thirteen studies examined relations between vitamin C and risk for nuclear cataract.Seven studies found statistically significant data to support the hypothesis that increasedvitamin C intake, supplement use, or blood level is related to diminished risk for nuclearcataract (86,87,89,92,93,100,113). The remaining six studies, including the AREDSintervention trial, showed no effect (82–84,101,102,111).
In a retrospective study of 478 subjects, Jacques et al. (87) found a 69% reduced rateof nuclear cataract (RR = 0.31, 95% CI 0.16–0.58; p-trend = 0.003) between women withthe highest (>362 mg/d) and lowest (<140 mg/d) vitamin C intake. In a retrospective studyof 1380 subjects, Leske et al. (89) found a 52% reduced rate of cataract (RR = 0.48, 95%CI 0.24–0.99) between subjects with the highest and lowest vitamin C intake. Valero et al.(100) found a 44% reduced rate of cataract (RR = 0.56, 95% CI 0.38–0.82) between sub-jects with the highest and lowest vitamin C intake in a retrospective study of 677 subjects,and Mares-Perlman et al. (93) found a 38% reduced rate of cataract (RR = 0.62, 95% CI0.39–0.97) between men with the highest and lowest vitamin C intake in a retrospective
Fig. 4. (Continued)

Chapter 19 / Cataract Risk 479
study of 1919 subjects. In a prospective study of 1354 subjects, Lyle et al. (113) found a70% reduced rate of cataract (RR = 0.3, 95% CI 0.1–0.8; p-trend = 0.02) between smok-ers with the highest and lowest vitamin C intake.
The “intake” studies were corroborated by associations between plasma levels ofvitamin C and risk for nuclear opacities. The study by Jacques et al. (87) was sug-gestive of a 46% reduced rate of cataract (RR = 0.54, 95% CI 0.28–1.02; p-trend = 0.04)between women with the highest and lowest vitamin C plasma. The study by Valeroet al. (100) demonstrated a 68% reduced rate of cataract (RR = 0.32, 95% CI0.21–0.51) between subjects with the highest and lowest vitamin C blood.
In the observational studies, vitamin C supplement use often was associated with dimin-ished risk for nuclear opacities. In a retrospective study of 294 subjects, Jacques et al. (86)found a 90% reduced rate of moderate cataract (RR = 0.1, 95% CI 0–0.47; p-trend = 0.004)and a 78% reduced rate of cataract (RR = 0.22, 95% CI 0.09–0.56; p-trend = 0.003)between women who used vitamin C supplements for more than 10 yr vs those who didnot. In a more recent study, Jacques et al. (87) found a 60% reduced rate of cataract (RR =0.4, 95% CI 0.19–0.83; p-trend = 0.02) between women who used vitamin C supplementsfor more than 10 yr and those who did not. In a retrospective study of 1862 subjects, Mares-Perlman et al. (92) found a 30% reduced rate of cataract (RR = 0.7, 95% CI 0.5–1.0;p-trend = 0.002) among nondiabetics who used vitamin C supplements.
Fig. 4. (Continued)

480 Part VI / Prevention of Major Disabilities
3.2.2. CORTICAL
Ten studies examined relationships between vitamin C and risk for cortical cataract.Three studies found statistically significant data to support the hypothesis that increasedvitamin C intake, supplement use, or blood level is related to diminished risk for corti-cal cataract (85, 99,100). One study found statistically significant data indicating thatincreased vitamin C supplement use is related to increased risk for cortical cataract(92). The remaining six studies, including the AREDS intervention, showed no effect(82–84,89,101,102).
Valero et al. (100) found a 62% reduced rate of cortical cataract (RR = 0.38, 95% CI0.23–0.64) between subjects with the highest and lowest blood vitamin C. In a retrospec-tive study of 492 subjects, Taylor et al. (99) found a 57% reduced rate of cataract (RR =0.43, 95% CI 0.2–0.93; p-trend = 0.02) between women (younger than age 60 yr) with thehighest and lowest vitamin C intake and a 60% reduced rate of cataract (RR = 0.4, 95%CI 0.18–0.87; p-trend = 0.008) between women (<60 yr) who used vitamin C supplementsfor more than 10 yr and those who did not.. Mares-Perlman et al. (92) found an 80%increased rate of cataract (RR = 1.8, 95% CI 1.2–2.9; p-trend = 0.007) in users of vitaminC supplements.
Fig. 4. (Continued)

Chapter 19 / Cataract Risk 481
Fig. 4. Vitamin C and cataract risk ratio for high vs low intake (with or without supple-ments), blood levels, or supplement use. Data for retrospective and prospective studies arepresented independently. OR or RR in log scale. See also Table 3 for results of studieswithout fixed endpoints.
3.2.3. POSTERIOR SUBCAPSULAR
Seven studies examined relationships between vitamin C and risk for PSC cataract. Twostudies found statistically significant data to support the hypothesis that increased vitaminC intake or blood levels is related to diminished risk for PSC cataract (85,100). The remain-ing five studies, including the AREDS intervention, showed no effect (82,83,89,99,102).
Valero et al. (100) found a 64% reduced rate of PSC cataract (RR = 0.36, 95% CI0.23–0.57) between subjects with the highest and lowest blood vitamin C. In a retro-spective study of 112 subjects, Jacques and Chylack (85) found a 90% reduced rate ofcataract (OR = 0.1) between subjects with the highest and lowest vitamin C intake.
3.2.4. MIXED
Three studies examined relationships between vitamin C and risk for mixed cataract. Twostudies, including the REACT intervention, found statistically significant data to support the

482 Part VI / Prevention of Major Disabilities
hypothesis that increased vitamin C supplement use or blood levels is related to diminishedrisk for mixed cataract (96,106). In contrast, the study by Leske et al. showed no effect (89).
Mohan et al. (96) found an 88% reduced rate of mixed cataract (RR = 0.12, 95% CI0.03–0.56) between subjects with the highest and lowest plasma vitamin C in a retro-spective study of 1990 subjects. (Tables 1 and 2 for REACT intervention data.)
3.2.5. EXTRACTION
Six studies examined relationships between vitamin C and risk for cataract extraction.Two studies found statistically significant data to support the hypothesis that vitamin Csupplement use is related to diminished risk for cataract extraction (97,108). The remain-ing four studies, including the AREDS intervention, showed no effect (98,102,104,119).
In a retrospective study of 304 subjects, Robertson et al. (97) found a 70% reducedrate of cataract extraction (RR = 0.3, 95% CI 0.12–0.75) between subjects who did usevitamin C supplements and those who did not.
Hankinson et al. (108) found a 45% reduced rate of cataract (RR = 0.55, 95% CI0.32–0.96) among women who used vitamin C supplements for 10 or more years in aprospective study of 50,828 subjects.
3.3. Observational Studies Regarding Vitamin EOften, vitamin E supplements provide significantly higher levels of this nutrient than
can be obtained in the diet. A variety of studies examined relationships between vitaminE supplement use, dietary intake and plasma levels, and risk for various forms ofcataract. The results from the observational studies were mixed (Fig. 5; 109).
3.3.1. NUCLEAR
Eighteen studies examined relationships between vitamin E and risk for nuclearcataract. Five studies found statistically significant data to support the hypothesis thatincreased vitamin E intake, supplement use, or blood level is related to diminished riskfor nuclear cataract or cataract progress (87,90,101,109,111). One study found statisti-cally significant data indicating that increased vitamin E blood levels in men are relatedto increased risk for nuclear cataract (94). Of the remaining studies, 2 were suggestiveof decreased risk (92,93) and 10, including the AREDS and VECAT interventions, pro-duced no effect (83,89,95,100,102,112,113,116,117).
Jacques et al. (87) found a 55% reduced rate of nuclear cataract (RR = 0.45, 95% CI0.23–0.86) between women with the highest (>90 mg/d) and lowest (<12 mg/d) vitaminE intake. Data from Mares-Perlman et al. (93) was suggestive of a 33% reduced rate ofcataract (RR = 0.67, 95% CI 0.43–1.03; p-trend = 0.03) between men with the highestand lowest vitamin E intakes.
Plasma levels of vitamin E were also related to odds or risk of cataract. Leske et al.(90) found a 56% reduced rate of cataract (RR = 0.44, 95% CI 0.21–0.9) between sub-jects with the highest and lowest plasma level of vitamin E. Jacques et al. (87) found a52% reduced rate of cataract (RR = 0.48, 95% CI 0.25–0.95) between women with thehighest and lowest vitamin E plasma level. In a retrospective study of 671 subjects,Vitale et al. (101) found a 48% reduced rate of cataract (RR = 0.52, 95% CI 0.27–0.99)between subjects with the highest and lowest plasma level of vitamin E. Mares-Perlmanet al. (94) found a 3.7-fold increase in the rate of cataract (RR = 3.74, 95% CI 1.25–11.2)between men with the highest and lowest serum vitamin E levels. In a prospective study

Fig
. 5.
Vita
min
E a
nd c
atar
act
risk
rat
io, f
or h
igh
vs l
ow i
ntak
e (w
ith o
r w
ithou
t su
pple
men
ts),
blo
od l
evel
s, o
r su
pple
men
t us
e.D
ata
for
retr
ospe
ctiv
e an
d pr
ospe
ctiv
e st
udie
s ar
e pr
esen
ted
inde
pend
ently
. OR
or
RR
in lo
g sc
ale.
See
als
oTa
ble
3 fo
r re
sults
of
stud
ies
with
out f
ixed
end
poin
ts.
483

484 Part VI / Prevention of Major Disabilities
of 764 subjects, Leske et al. (111) found a 42% reduced rate of cataract (RR = 0.58, 95%CI 0.36–0.94) between subjects with the highest and lowest plasma levels of vitamin E.
Data from Jacques et al. (87) showed a statistically significant trend (p = 0.03) for a rela-tionship between the period of use of vitamin E supplements and decreased odds for opac-ities. In a subsequent study of 40 subjects, we found that use of vitamin E supplements formore than 10 yr is associated with decreased progress of nuclear opacities (109).Supplement use also was related to prevalence or progress of nuclear cataract. The studyby Mares-Perlman et al. (92) suggested a 10% reduced rate of nuclear cataract (RR = 0.9,95% CI 0.6–1.5; p-trend = 0.02) between users and nonusers of vitamin E supplements. Ina prospective study of 764 subjects, Leske et al. (111) found a 57% reduced rate of cataract(RR = 0.43, 95% CI 0.19–0.99) between users and nonusers of vitamin E supplements.
3.3.2. CORTICAL
Fourteen studies examined relationships between vitamin E and risk for corticalcataract. Three studies found statistically significant data to support the hypothesis thatincreased vitamin E intake, supplement use, or blood level is related to diminished riskfor cortical cataract (89,117,118). The remaining 11 studies showed no effect, includ-ing the AREDS and VECAT interventions (83–85,90,92,94,99–102,116).
Leske et al. (89) found a 41% reduced rate of cortical cataract (RR = 0.59, 95% CI0.35–0.99) between subjects with the highest and lowest vitamin E intakes. In aprospective study of 410 subjects, Rouhiainen et al. (118) found a 73% reduced rate ofcataract (RR = 0.27, 95% CI 0.08–0.83) between subjects with the highest and lowestplasma levels of vitamin E. Nadalin et al. (117) found a 56% reduced rate of cataract(RR = 0.44, 95% CI 0.25–0.77) between users and nonusers of vitamin E supplementsin a prospective study of 1111 subjects.
3.3.3. POSTERIOR SUBCAPSULAR
Eight studies examined relationships between vitamin E and risk for PSC cataract.One study of 3271 subjects found statistically significant data indicating that increasedvitamin E intake was related to a 47% increased risk for PSC cataract (RR = 1.47, 95%CI 1.04–2.09) (95). The remaining seven studies, including the AREDS intervention,produced no effect (83,85,89,90,99,100,102).
3.3.4. MIXED
Three studies examined relationships between vitamin E and risk for mixed cataract.Two studies (The Lens Opacities Case-Control Study [89] and and the REACT interven-tion [106]) found statistically significant data supporting the hypothesis that increased vit-amin E intake or supplement use is related to diminished risk for mixed cataract. Theremaining study showed no effect (90). (Tables 1 and 2 for REACT intervention data.)
Leske et al. (89) found a 42% reduced rate of mixed cataract (RR = 0.58, 95% CI0.37–0.93) between subjects with the highest and lowest vitamin E intakes. In an inter-vention study of 445 subjects, Chylack et al. (106) found a reduced rate of mixed cataractin US subjects from the REACT intervention but not in the less-than-well-nourished UKsubjects (see Tables 1 and 2).
3.3.5. EXTRACTION
Nine studies examined relationships between vitamin E and risk for cataract extrac-tion. Two studies found statistically significant data to support the hypothesis that

Chapter 19 / Cataract Risk 485
increased vitamin E intake or supplement use is related to diminished risk for cataractextraction (97,98). The remaining seven studies, including the AREDS, VECAT, andATBC interventions, showed no effect (102,104,108,110,116,119,121).
In a retrospective study of 913 subjects, Tavani et al. (98) found a 50% reduced rateof cataract extraction (RR = 0.5, 95% CI 0.3–1.0) between subjects with the highestand lowest vitamin E intakes. Robertson et al. (97) found a 56% reduced rate ofcataract extraction (RR = 0.44, 95% CI 0.24–0.77) between subjects who used vitaminE supplements and those who did not in a retrospective study of 304 subjects.
3.4. Observational Studies Regarding CarotenoidsThe major carotenoids found in the lens and those that have been related to lens
health are lutein, zeaxanthin, and riboflavin. Levels of β-carotene are extremely low(near vanishing). Lutein and zeaxanthin are important carotenoid components of thehuman diet, and several investigations have suggested that elevated intake of foods richin lutein, such as spinach, is related to decreased risk for cataract. Results are mixed forlutein and zeaxanthin as well as for other carotenoids (Figs. 6–9).
3.4.1. TOTAL CAROTENOIDS (FIG. 6)3.4.1.1. Nuclear. Three studies examined relationships between total carotenoids and
risk for nuclear cataract. One study (94) found statistically significant data indicating thatincreased serum levels of total carotenoids are related to a 2.95-fold increased rate ofcataract in women (RR = 3.95, 95% CI 1.65–9.47) but, curiously, to a 45% risk in men(RR = 0.55, 95% CI 0.2–1.49; p-trend = 0.002) . The two remaining studies showed noeffect (87,105).
3.4.1.2. Cortical. Three studies examined relationships between total carotenoidsand risk for cortical cataract. One study found statistically significant data to support thehypothesis that an increase in total carotenoids blood levels is related to diminished riskfor cortical cataract (85). Of the remaining studies, one was suggestive of an increasedrisk with blood levels in women (94) and the other produced no effect (99). Therefore,Jacques and Chylack (85) found significantly higher odds (OR = 7.2) of cortical cataractamong subjects with the lowest plasma or caratenoid level compared to the highest lev-els, whereas, Mares-Perlman et al. (94) indicated a 3.3-fold increase in the rate ofcataract (RR = 3.26, 95% CI 0.92–11.5; p-trend = 0.05) in women with the highest vsthose with the lowest serum level of carotenoids.
3.4.1.3. Posterior Subcapsular. All three studies that examined relationshipsbetween total carotenoids and risk for PSC cataract found statistically significant datasupporting the hypothesis that an increase in total carotenoids blood levels or intake isrelated to diminished risk for PSC cataract (85,99,105).
Taylor et al. (99) found an 81% reduced rate of PSC cataract (RR = 0.19, 95% CI0.05–0.68; p-trend = 0.01) in women who had never smoked and who had the highest vslowest intake of carotenoids. We corroborated this data with an observation of a 59%reduced rate of cataract (RR = 0.41, 95% CI 0.17–0.99) in women with the highest vslowest plasma level of carotenoids. In a prospective study of 77,466 subjects, Chasan-Taber et al. (105) showed a 31% reduced rate of cataract (RR = 0.69, 95% CI 0.49–0.98)between women with the highest and lowest carotenoids intakes.
3.4.1.4. Extraction. Four studies examined relationships between total carotenoidsand risk for cataract extraction. Two studies documented statistically significant data to

486 Part VI / Prevention of Major Disabilities
support the hypothesis that increased total carotenoid intake is related to diminished riskfor cataract extraction (105, 108). One study suggested a decreased risk with intake inmen (103), and the other produced no effect (104).
Hankinson et al. (108) found a 27% reduced rate of cataract extraction (RR = 0.73,95% CI 0.55–0.97) between women with the highest and lowest intakes of carotenoidsin a prospective study of 50,828 subjects. In a prospective study of 77,466 subjects,Chasan-Taber et al. (105) found a 15% reduced rate of extraction (RR = 0.85, 95% CI0.72–1.0) between women with the highest and lowest intakes of carotenoids. Aprospective study of 36,644 subjects by Brown et al. (103) suggested a 15% reduced
Fig. 6. Total carotenoids and cataract risk ratio for high vs low intake (with or withoutsupplements), blood levels, or supplement use. Data for retrospective and prospectivestudies are presented independently. OR or RR in log scale.

Fig
. 7.
Lut
ein/
zeax
anth
in a
nd c
atar
act
risk
rat
io f
or h
igh
vs l
ow i
ntak
e (w
ith o
r w
ithou
t su
pple
men
ts),
blo
od l
evel
s, o
r su
pple
-m
ent u
se. D
ata
for
retr
ospe
ctiv
e an
d pr
ospe
ctiv
e st
udie
s ar
e pr
esen
ted
inde
pend
ently
. OR
or
RR
in lo
g sc
ale.
487

488 Part VI / Prevention of Major Disabilities
rate of extraction (RR = 0.85, 95% CI 0.68–1.07; p-trend = 0.05) between men with thehighest and lowest intakes of carotenoids.
3.4.2. LUTEIN AND ZEAXANTHIN (FIG. 7)3.4.2.1. Nuclear. Seven studies examined relationships between lutein/zeaxanthin
and risk for nuclear cataract. Two studies found statistically significant data supportingthe hypothesis that increased lutein/zeaxanthin intake is related to diminished risk fornuclear cataract (87,113). One study found statistically significant indicating thatincreased lutein/zeaxanthin blood levels in women increase the risk for nuclear cataract(94). One study suggested a decreased risk of nuclear cataract for increased intake oflutein/zeaxanthin in women (93). The remaining three studies produced no effect(83,105,112).
Jacques et al. (87) found a 48% reduced rate of nuclear cataract (RR = 0.52, 95%CI 0.29–0.91) between women with the highest and lowest lutein/zeaxanthin intakes.In a prospective study of 1354 subjects, Lyle et al. (113) found a 60% reduced rate ofcataract (RR = 0.4, 95% CI 0.2–0.8) between subjects (ages <65 yr) with the highestand lowest lutein intakes. A retrospective study of 1919 subjects by Mares-Perlman etal. (93) suggested a 27% reduced rate of nuclear cataract (RR = 0.73, 95% CI0.5–1.06; p-trend = 0.02) between women with the highest and lowest lutein intakes.In contrast, in a retrospective study of 400 subjects, Mares-Perlman et al. (94) founda fourfold increased rate of nuclear cataract (RR = 4.09, 95% CI 1.67–10.03; p-trend =0.006) between women with the highest and lowest serum levels of lutein. Finally,Lyle et al. (113) found that persons in the highest quintile of lutein intake in the dis-tant past were half as likely to have an incident of cataract as persons in the lowestquintile of intake in a prospective study of 1354 subjects (RR = 0.5, 95% CI 0.3–0.8,p-trend = 0.002).
3.4.2.2. Cortical. Three studies examined relationships between lutein/zeaxanthinblood levels or intake and cortical cataract. Two studies produced no effect (83,99),whereas the study by Mares-Perlman et al. (94) suggested a 4.8-fold increased rate ofcortical cataract (RR = 4.84, 95% CI 0.83–28.1; p-trend = 0.03) between men with thehighest and lowest lutein serum levels.
3.4.2.3. Posterior Subcapsular. Three studies examined relationships betweenlutein/zeaxanthin and risk for PSC cataract. Two studies found statistically significantdata supporting the hypothesis that increased lutein/zeaxanthin intake or blood levelswas related to diminished risk for PSC cataract (83,105). The remaining study producedno effect (99).
Gale et al. (83) found a 50% reduced rate of PSC cataract (RR = 0.5, 95% CI 0.2–1;p-trend = 0.012) between subjects with the highest and lowest plasma levels of lutein ina retrospective study of 372 subjects. Chasan-Taber et al. (105) found a 32% reducedrate of cataract (RR = 0.68, 95% CI 0.48–0.97) between women with the highest andlowest intakes of lutein/zeaxanthin.
3.4.2.4. Extraction. Two studies examined relationships between lutein/zeaxanthinintake and risk for cataract extraction. Data from a prospective study of 36,644 subjectsby Brown et al. (103) suggested a 19% reduced rate of extraction (RR = 0.81, 95% CI0.65–1.01; p-trend = 0.03) between men with the highest and lowest intakes of lutein +zeaxanthin. The other study showed no effect (105).

Fig
. 8.
β-ca
rote
ne a
nd c
atar
act r
isk
ratio
for
hig
h vs
low
inta
ke (
with
or
with
out s
uppl
emen
ts),
blo
od le
vels
, or
supp
lem
ent u
se.
Dat
a fo
r re
tros
pect
ive
and
pros
pect
ive
stud
ies
are
pres
ente
d in
depe
nden
tly. O
R o
r R
R in
log
scal
e. S
ee a
lso
Tabl
e 3
for
resu
lts o
fst
udie
s w
ithou
t fix
ed e
ndpo
ints
.
489

490 Part VI / Prevention of Major Disabilities
3.4.3. β-CAROTENE (FIG. 8)3.4.3.1. Nuclear. Of the 10 studies that examined relationships between β-
carotene and risk for nuclear cataract, 2 found statistically significant data support-ing the hypothesis that increased β-carotene intake or supplement use is related todiminished risk for nuclear cataract (87,93), and 1 study found statistically signifi-cant data indicating that an increase in β-carotene blood levels is related to increasedrisk for nuclear cataract (94). Of the remaining studies, one was suggestive of dimin-ished risk (83) and the others, including the AREDS and Linxian interventions,showed no effect (101,102,105,112,113,120).
Mares-Perlman et al. (93) found a 71% reduced rate of cataract (RR = 0.29, 95%CI 0.1–0.84) between men with the highest and lowest intakes of β-carotene, and we(87) demonstrated a 48% reduced rate of cataract (RR = 0.52, 95% CI 0.28–0.97)between women with the highest and lowest intakes of β-carotene.
Data from Gale et al. (83) suggested a 30% reduced rate of cataract (RR = 0.7, 95%CI 0.4–1.4; p-trend = 0.033) between subjects with the highest and lowest plasma lev-els of β-carotene. In contrast, Mares-Perlman et al. (94) found an 80% increased rate ofcataract (RR = 2.8, 95% CI 1.21–6.48) between women with the highest and lowestserum levels of β-carotene.
3.4.3.2. Cortical. Six studies examined relationships between β-carotene and riskfor cortical cataract. Data from Mares-Perlman et al. (94) suggested a 72% reduced rateof cataract (RR = 0.28, 95% CI 0.06–1.24; p-trend = 0.05) between men with the high-est and lowest serum levels of β-carotene. The remaining five studies, including theAREDS and Linxian interventions, produced no effect (83,99,101,102,120).
3.4.3.3. Posterior Subcapsular. Five studies examined relationships between β-carotene and risk for PSC cataract. Taylor et al. (99) found a 72% reduced rate ofcataract (RR = 0.28, 95% CI 0.08–0.96; p-trend = 0.02) between women who had neversmoked who had the highest and lowest intakes of β-carotene. The remaining studies,including the AREDS and Linxian interventions, produced no effects (83,102,120). Ina prospective study of 77,466 subjects, Chasan-Taber et al. (105) found a 32% reducedrate of cataract (RR = 0.68, 95% CI 0.48–0.97) between women with the highest andlowest intakes of β-carotene,.
3.4.3.4. Mixed. Only one study that examined relationships between β-carotene andrisk for mixed cataract produced significant results. In an intervention study of 445 sub-jects, Chylack et al. (106) found statistically significant data supporting the hypothesisthat β-carotene interventions (along with vitamins C and E) diminished risk for mixedcataract in US subjects but not in less well-nourished UK subjects (Table 3).
3.4.3.5. Extraction. Six studies examined relationships between β-carotene and riskfor cataract extraction. In a prospective study of 20,968 physicians, Christen et al. (107)found a 27% reduced rate of extraction (RR = 0.73, 95% CI 0.53–1.0) between currentmale smokers who did and did not take the 50-mg β-carotene supplement on alternatedays. The five remaining studies, including the AREDS and ATBC interventions,showed no effect (98,102,103,105,110,121).
3.4.4. α-CAROTENE (FIG. 9)3.4.4.1. Nuclear. Seven studies examined relationships between α-carotene and risk
for nuclear cataract. Four studies showed no effect (87,105,112,113). Mares-Perlman et al.found a 39% reduced rate of cataract (RR = 0.61, 95% CI 0.39–0.95; p-trend = 0.04)

Fig
. 9.
α-ca
rote
ne a
nd c
atar
act r
isk
ratio
for
hig
h vs
low
inta
ke (
with
or
with
out s
uppl
emen
ts),
blo
od le
vels
, or
supp
lem
ent u
se.
Dat
a fo
r re
tros
pect
ive
and
pros
pect
ive
stud
ies
are
pres
ente
d in
depe
nden
tly. O
r or
RR
in lo
g sc
ale.
491
492 Part VI / Prevention of Major Disabilities
between men with the highest and lowest intakes of α-carotene (93) but found a 2.62-foldincrease in the rate of cataract (RR = 2.62, 95% CI 1.12–6.13) between women with thehighest and lowest serum levels of α-carotene in a retrospective study of 400 subjects (94).In contrast, Gale et al. (83) found a 50% reduced rate of cataract (RR = 0.5, 95% CI0.3–0.9; p-trend = 0.006) between subjects with the highest and lowest plasma levels of α-carotene.
3.4.4.2. Cortical. None of the three studies that examined relationships between α-carotene and risk for cortical cataract found statistically significant data (83,94,99).
3.4.4.3. Posterior Subcapsular. Three studies examined relationships between α-carotene and risk for PSC cataract. Taylor et al. (99) obtained data that suggested a 71%reduced rate of cataract (RR = 0.29, 95% CI 0.08–1.05; p-trend = 0.02) between the high-est and lowest intakes of α-carotene in women who had never smoked. The remainingtwo studies found no effect (83, 105).
3.4.4.4. Extraction. Neither of the two studies that examined relationships betweenα-carotene intake and risk for cataract extraction found statistically significant data(103,105).
3.4.5. RIBOFLAVIN (Fig. 10)3.4.5.1. Nuclear. Seven studies examined relationships between riboflavin and risk
for nuclear cataract. Four studies, including the Linxian intervention, found statisti-cally significant data supporting the hypothesis that increased riboflavin intake or sup-plement use is related to diminished risk for nuclear cataract (82,87,93,120). One studysuggested a decreased risk in nondiabetic subjects (92). The two remaining studiesfound no effect (88,89).
Jacques et al. (87) found a 63% reduced rate of cataract (RR = 0.37, 95% CI0.19–0.73; p-trend = 0.03) between women with the highest and lowest intakes ofriboflavin. Similarly, Cumming et al. (82) found a 50% reduced rate of cataract (RR =0.5, 95% CI 0.3–0.9; p-trend = 0.01) between subjects with the highest and lowestintakes of riboflavin, and Mares-Perlman et al. (93) found a 44% reduced rate ofcataract (RR = 0.56, 95% CI 0.36–0.87; p-trend = 0.009) between men with the highestand lowest intakes of riboflavin.
Mares-Perlman et al. (93) also found a 33% reduced rate of cataract (RR = 0.67, 95%CI 0.46–0.98; p-trend = 0.026) between women with the highest and lowest intakes ofriboflavin. Another study by Mares-Perlman et al. (92) suggested a 20% reduced rate ofcataract (RR = 0.8, 95% CI 0.5–1.3; p-trend = 0.02) in nondiabetics with the highest andlowest riboflavin supplements.
Sperduto et al. (120) found a 55% reduced rate of nucleic cataract (RR = 0.45, 95%CI 0.31–0.64) in 65- to 74-yr-old poorly nourished Chinese subjects who took supplements containing riboflavin and niacin. In all subjects of this portion of theLinxian study, there was a 41% reduction in risk for cataract (RR = 0.59, 95% CI0.45–0.79) in users of this supplement.
3.4.5.2. Cortical. Five studies examined relationships between riboflavin and riskfor cortical cataract. Two studies, including the Linxian intervention, found no effect(99, 120). Leske et al. (89) found a 41% reduced rate of cataract (RR = 0.59, 95% CI0.36–0.97) between subjects with the highest and lowest intakes of riboflavin, andCumming et al. (82) found a 30% reduced rate of cataract (RR = 0.7, 95% CI 0.5–1.0)between subjects with the highest and lowest intakes of riboflavin. However, data

Chapter 19 / Cataract Risk 493
Fig. 10. Riboflavin and cataract risk ratio for high vs low intake (with or without supple-ments), blood levels, or supplement use. Data for retrospective and prospective studies arepresented independently. Log scale.

494 Part VI / Prevention of Major Disabilities
from a study by Mares-Perlman et al. (92) suggested a 70% increased rate of cataract(RR = 1.7, 95% CI 0.9–3.1; p-trend = 0.05) in nondiabetics with the highest vs low-est riboflavin supplements.
3.4.5.3. Posterior Subcapsular. Four studies examined relationships betweenriboflavin and risk for PSC cataract. Three studies produced no effect (82,89,99).However, in an intervention study of 3249 subjects, Sperduto et al. (120) found a 2.6-fold increase in the rate of cataract (RR = 2.64, 95% CI 1.31–5.35) between subjectswho used the niacin and riboflavin supplement and those who did not.
3.4.5.4. Mixed. The only study that examined relationships between riboflavinintake and risk for mixed cataract did not find statistically significant data (89).
3.5. Observational Studies Regarding Multivitamins and Antioxidant IndexIn addition to multivitamin supplement use, this section includes studies using
“antioxidant indices” that approximate combined effects of the multiple antioxidantscontained in food intake on risk for cataract. However, single nutrients appear to havestrong influences on the indices, and we now question the usefulness of the indices.
3.5.1. NUCLEAR
Ten studies examined relationships between multivitamins or antioxidant index andrisk for nuclear cataract. Six studies, including the Linxian intervention, found statisti-cally significant data supporting the hypothesis that increased multivitamin supplementuse or antioxidant index intake is related to diminished risk for nuclear cataract(88,89,92,111,115,120). The remaining four studies showed no effect (87,91,93,101).
Kuzniarz et al. (88) found a 90% reduced rate of nuclear cataract (RR = 0.1, 95% CI0–1.0; p-trend = 0.02) between subjects who did and did not use multivitamin supple-ments. Leske et al. (89) found a 45% reduced rate of cataract (RR = 0.55, 95% CI0.33–0.92) in users of multivitamin supplements and, in her prospective study, found a31% reduced rate of cataract (RR = 0.69, 95% CI 0.48–0.99) in users of multivitaminsupplements (111).
Mares-Perlman et al. (92) found a 40% reduced rate of cataract (RR = 0.6, 95% CI0.5–0.8) in nondiabetics with the highest and lowest multivitamin supplements and a40% reduced rate of cataract (RR = 0.6, 95% CI 0.4–0.9) between subjects who did anddid not use multivitamins for more than 10 yr (115). Sperduto et al. (120) found a 43%reduced rate of cataract (RR = 0.57, 95% CI 0.36–0.9) in 65- to 74-yr-old Chinese peo-ple who used multivitamins for 6 yr.
3.5.2. CORTICAL
Nine studies examined relationships between multivitamins or antioxidant index andrisk for cortical cataract. Four studies found statistically significant data supporting thehypothesis that increased multivitamin supplement use or antioxidant index intake orblood levels is related to diminished risk for cortical cataract (85,89,114,115). Onestudy found statistically significant data indicating that increased multivitamins supple-ment use is related to increased risk for cortical cataract (92). The remaining four stud-ies, including the Linxian intervention, showed no effect (91,99,101,120).
In a retrospective study of 112 subjects, Jacques and Chylack (85) found a 84%reduced rate of cortical cataract (OR = 0.16) between subjects with the highest and low-est antioxidant index. Leske et al. (89) found a 58% reduced rate of cortical cataract

Fig
. 11.
Mul
tivita
min
s/an
tioxi
dant
inde
x an
d ca
tara
ct r
isk
ratio
for
hig
h vs
low
inta
ke (
with
or
with
out s
uppl
emen
ts),
blo
od le
v-el
s, o
r su
pple
men
t use
. Dat
a fo
r re
tros
pect
ive
and
pros
pect
ive
stud
ies
are
pres
ente
d in
depe
nden
tly. L
og s
cale
.
495

496 Part VI / Prevention of Major Disabilities
(RR = 0.42, 95% CI 0.18–0.97) between subjects who did and did not use the highestand lowest antioxidant intake index and found a 48% reduced rate of cataract (RR = 0.52,95% CI 0.36–0.75) among subjects who did and did not use multivitamin supple-ments.In a retrospective study of 1862 subjects, Mares-Perlman et al. (92) found a 60%increased rate of cortical cataract (RR = 1.6, 95% CI 1.1–2.1) in nondiabetics with thehighest vs lowest multivitamin supplements.
In contrast, in a prospective study of 3220 subjects, Mares-Perlman et al. (114) founda 30% reduced rate of cataract incidence (RR = 0.7, 95% CI 0.5–1.0) and a 20% reducedrate of cataract progress (RR = 0.8, 95% CI 0.6—1.0) between users and nonusers ofmultivitamin supplements. In a more recent prospective study of 2434 subjects, Mares-Perlman et al. (115) found a 60% reduced rate of cataract (RR = 0.4, 95% CI 0.2–0.8;p-trend = 0.002) in subjects who took multivitamin supplements or supplements of vit-amin C or E for more than 10 yr.
3.5.3. POSTERIOR SUBCAPSULAR
Seven studies examined relationships between multivitamins or antioxidant indexand risk for posterior subcapsular cataract. Three studies found statistically significantdata supporting the hypothesis that increased multivitamin supplement use or antioxi-dant index intake or blood levels is related to diminished risk for PSC cataract(85,89,96). The remaining four studies, including the Linxian intervention, showed noeffect (92,99,115,120).
Jacques and Chylack (85) found that adjusted prevalence for PSC cataract wasdecreased by 80% (RR = 0.16, 95% CI 0.04–0.82) for persons with mgh antioxidantindex scores, based on combined intake of vitamins C and E and carotenoids. Leske etal. (89) found a 60% reduced rate of cataract (RR = 0.4, 95% CI 0.21–0.77) among usersof multivitamin supplements, and Mohan et al. (96) found a 77% reduced rate of PSCcataract (RR = 0.23, 95% CI 0.06–0.88) between subjects with the highest and lowestantioxidant indices in a retrospective study of 1990 subjects.
3.5.4. MIXED
Two studies examined relationships between multivitamins or antioxidant index andrisk for mixed cataract. Leske et al. (89) found a 61% reduced rate of cataract (RR = 0.39,95% CI 0.19–0.8) between subjects with the highest and lowest antioxidant intakeindices and found a 30% reduced rate of cataract (RR = 0.7, 95% CI 0.51–0.97) in usersof multivitamin supplements. In a retrospective study of 1990 subjects, Mohan et al.(96) found an 87% increased rate of cataract (RR = 1.87, 95% CI 1.29–2.69) betweensubjects with the highest and lowest antioxidant plasma indices.
3.5.5. EXTRACTION
Four studies examined relationships between multivitamins or antioxidant indexand risk for cataract extraction. Knekt et al. (110) found a 62% reduced rate of cataract(RR = 0.38, 95% CI 0.15–1.0) between subjects with the highest and lowest levels ofvitamin E and β-carotene in the multivitamin serum. In a prospective study of 17,744subjects, Seddon et al. (119) found a 27% reduced rate of cataract (RR = 0.73, 95%CI 0.54–0.99) between physicians who did and did not use multivitamins—but notvitamin C or E supplements alone. The remaining two studies produced no effect(104,108).

Chapter 19 / Cataract Risk 497
4. CONSIDERATIONS FOR FUTURE RESEARCH
Because intake or plasma measures are highly variable and the effects of diet are likelyto be cumulative, studies should be performed on populations for which long-term dietaryrecords or multiple measures of plasma levels of nutrients are available. If a single mea-sure of status must be chosen, intake studies seem to be preferable to the use of plasmameasures. Identifying the best means to quantify nutrient intake also would be beneficial.
Comparison of information from the NVP substudy of the Nurse’s Health Study indi-cates that the greatest opportunity to observe benefits from antioxidants is when cataractsare at an early stage. This is also supported by comparison of results from the Americanvs English arms of the REACT trial. Additionally, our results and those of several otherinvestigators, including the ARM of the AREDS trial, clearly indicate that modified andconsistent intake over prolonged periods is essential to observe benefits from nutrients.
Further definition and refinement of techniques to quantify progress of cataract (andAMD) would be helpful, and greater ability to compare among studies would beinvaluable regarding analysis of data from multiple studies.
5. CONCLUSIONS AND RECOMMENDATIONS
Why study relationships between risk for cataract and nutrition when there arealready economic, safe surgical procedures to replace and remediate the opacified lensin the United States? There are several important reasons, including: (a) it is likely thatthe same nutritional practices that are associated with prolonged lens function will alsobe associated with delayed age-related compromises to other organs and, perhaps, agingper se; (b) there are not sufficient surgical resources to provide economic, safe surgeriesworldwide; and (c) there will be considerable financial savings and improvements inquality of life if health, rather than old age, is extended—particularly given the rapidlygrowing elderly segment of our population. For instance, data from the AMD arm of theAREDS intervention trial predict that if persons with moderate AMD take the AREDSsupplement, 350,000 cases of blindness may be avoided over 5 yr (Table 2) (102).
Oxidative stress clearly is involved in the etiology of cataract. This involves bothdamage to the structural proteins of the lens as well as compromises to the proteolyticmachinery that might otherwise remove the damaged proteins that aggregate and formcataractous precipitates. Given the correlation between oxidative damage and this age-related debility, it is not surprising that more than 25 studies have attempted to relateantioxidant intake to risk for cataract. Although data from the observational studies gen-erally is consistent in finding a benefit to be gained from maintaining higher levels ofantioxidants either in diet or plasma, the data from the intervention trials are far lessencouraging regarding limiting risk for cataract prevalence or cataract progress. Withoutmore information, it is difficult to parse these results. Are the observational studiesflawed? Are the intervention trials less than what might be expected from the ideal explo-ration? Were any of them of long enough duration to provide the data sought?
It seems clear that good nutrition (based on diets that are rich in fruits and vegeta-bles), coupled with healthy lifestyles (which preclude known risk factors for eye diseasesuch as smoking, excessive weight, and poverty) must be started early in life to obtainthe benefit of prolonged sight later in life. Because the same dietary practice also opti-mizes many aspects of health, including immune function, there should be good incen-tive to strive for healthier practices.

498 Part VI / Prevention of Major Disabilities
If good nutrition and sufficient resources for lifestyles that are associated with dimin-ished risk for cataract are not available (i.e., among the impoverished), some supplemen-tation might be considered. Started early in life, dietary intake of about 250, 90, and 3 mg/d of vitamins C and E and lutein, respectively, should provide sufficient reserves toprovide the health benefit. These levels are considerably higher than the current RDAs.The lutein recommendation is based on our observational data (87). To date, lutein has notbeen tested in any of the interventions published. Because the bioavailability of ascorbatemay decrease with age, slightly higher intakes might be required in the elderly. Defininguseful levels of the other nutrients requires further studies.
Although women appear to be more prone to eye disease than men (95,123), there ispresently no reason to think that nutrient intake or blood levels of nutrients would affectthe genders differently.
Levels of β-carotene in the lens are below detection limits. This calls into questionprior observations that this nutrient is associated with lens health. Together with datafrom the ATBC Study, which indicated higher levels of cancer in smokers who tooksupplements of β-carotene, it would appear that there is no reason to use supplementsof this carotenoid and that the original data that associated diminished risk for cataractwith elevated intake of this nutrient should be re-examined. However, if relationshipsare found between these carotenoids and lens health, then this would imply a mecha-nism of action that includes activities other than direct antioxidant function. This is auseful concept to retain as we search for other agents to prolong lens function.Therefore, we have started testing associations between dietary pattern and eye health.
In conclusion, the data from the diverse epidemiological and biochemical studiessuggest that in widely disparate tissues, there are many common insults and mechanis-tic compromises associated with aging and that proper nutrition early in life mayaddress some of these compromises and provide extended youthful function later in life.Indeed, proper nutrition, possibly including use of antioxidant vitamin supplements forthe nutritionally impoverished, along with healthy lifestyles (see earlier) may providethe least costly and most practical means to delay cataract.
ACKNOWLEDGMENTS
The authors acknowledge the assistance of Candace Willett in the preparation of thismanuscript and support from NIH grant EY13250, an NEI core grant EY13078, the USDepartment of Agriculture, under agreement No. 58-1950-9-001, Kemin Foods, andRoche Vitamins.
REFERENCES1. Taylor A. Nutritional and Environmental Influences on Risk for Cataract. In: Taylor A, ed.
Nutritional and Environmental Influences on the Eye. CRC Press, Boca Raton, FL, 1999, pp. 53–93.2. Kupfer C. The conquest of cataract: a global challenge. Trans Ophthalmol Soc UK 1985; 104:1–10.3. Schwab L. Cataract blindness in developing nations. Int Ophthalmol Clin 1990; 30:16–18.4. World Health Organization. Use of intraocular lenses in cataract surgery in developing countries:
memorandum from a WHO meeting. Bull World Health Organ 1991; 69:657–666.5. Klein BE, Klein R, Linton KL. Prevalence of age-related lens opacities in a population: the Beaver
Dam Eye Study. Ophthalmology 1992; 99:546–552.6. Klein R, Klein BE, Linton KL, DeMets DL. The Beaver Dam Eye Study: the relation of age-related
maculopathy to smoking. Am J Epidemiol 1993; 137:190–200.

Chapter 19 / Cataract Risk 499
7. Leibowitz HM, Krueger DE, Maunder LR, et al. The Framingham Eye Study monograph: an oph-thalmological and epidemiological study of cataract, glaucoma, diabetic retinopathy, macular degen-eration, and visual acuity in a general population of 2631 adults, 1973–1975. Surv Ophthalmol 1980;24:335–610.
8. Chatterjee A, Milton RC, Thyle S. Prevalence and aetiology of cataract in Punjab. Br J Ophthalmol1982; 66:35–42.
9. Wang GM, Spector A, Luo CQ, et al. Prevalence of age-related cataract in Ganzi and Shanghai. TheEpidemiological Study Group. Chin Med J (Engl) 1990; 103:945–951.
10. Whitfield R, Schwab L, Ross-Degnan D, Steinkuller P, Swartwood J. Blindness and eye disease inKenya: ocular status survey results from the Kenya Rural Blindness Prevention Project. Br JOphthalmol 1990; 74:333–340.
11. Taylor A. Nutritional and Environmental Influences on the Eye. CRC Press, Boca Raton, FL, 1999.12. Taylor A. Lens and Retina Function: Introduction and Challenge. In: Taylor A, ed. Nutrition and
Environmental Influences on the Eye. CRC Press, Boca Raton, FL, 1999, pp. 1–4.13. Young RW. The Charles F. Prentice Medal Award Lecture 1992: optometry and the preservation of
visual health. Optom Vis Sci 1993; 70:255–262.14. McCarty C, Taylor HR. Light and Risk for Age-Related Diseases. In: Taylor A, ed. Nutritional and
Environmental Influences on the Eye. CRC Press, Boca Raton, FL, 1999, pp. 135–150.15. West SK. Smoking and the Risk of Eye Disease. In: Taylor A, ed. Nutritional and Environmental
Influences on the Eye. CRC Press, Boca Raton, FL, 1999, pp. 151–164.16. Taylor A, Tisdell FE, Carpenter FH. Leucine aminopeptidase (bovine lens): synthesis and kinetic prop-
erties of ortho-, meta-, and para-substituted leucyl-anilides. Arch Biochem Biophys 1981; 210:90–-97.17. Chylack LT Jr, Wolfe JK, Singer DM, et al. The Lens Opacities Classification System III. The
Longitudinal Study of Cataract Study Group. Arch Ophthalmol 1993; 111:831–836.18. Chylack LT, Jr. Function of the Lens and Methods of Quantifying Cataract. In: Taylor A, ed.
Nutritional and Environmental Influences on the Eye. CRC Press, Boca Raton, FL, 1999, pp. 25–52.19. Chylack LT Jr, Wolfe JK, Friend J, Singer DM, Wu SY, Leske MC. Nuclear cataract: relative con-
tributions to vision loss of opalescence and brunescence (abstract). Invest Ophthalmol Vis Sci 1994;35:42632.
20. Wolfe JK, Chylack LT, Leske MC, Wu SY. Lens nuclear color and visual function. Invest.Ophthalmol Vis Sci 1993; 34(Suppl.):2550.
21. Shang F, Lu M, Dudek E, Reddan J, Taylor A. Vitamin C and vitamin E restore the resistance ofGSH-depleted lens cells to H2O2. Free Radic Biol Med 2003; 34:521–530.
22. Shang F, Taylor A. Function of the ubiquitin proteolytic pathway in the eye. Exp Eye Res 2004;78:1–14.
23. Taylor A, Jacques PF, Nadler D, Morrow F, Sulsky SI, Shepard D. Relationship in humans betweenascorbic acid consumption and levels of total and reduced ascorbic acid in lens, aqueous humor, andplasma. Curr Eye Res 1991; 10:751–759.
24. Bunce GE, Kinoshita J, Horwitz J. Nutritional factors in cataract. Annu Rev Nutr 1990; 10:233–254.25. Taylor A, Jacques P. Antioxidant Status and Risk for Cataract. In: Bendich A, Deckelbaum RJ, eds.
Preventive Nutrition: The Guide for Health Professionals. Humana Press, Totowa, NJ, 1997, pp.267–228.
26. Reddy VN. Glutathione and its function in the lens—an overview. Exp Eye Res 1990; 50:771–778.27. Mune M, Meydani M, Jahngen-Hodge J, et al. Effect of calorie restriction on liver and kidney glu-
tathione in aging Emory mice. Age 1995; 18:43–49.28. Smith D, Shang F, Nowell TR, et al. Decreasing ascorbate intake does not affect the levels of glu-
tathione, tocopherol or retinol in the ascorbate-requiring osteogenic disorder shionogi rats. J Nutr1999; 129:1229–1232.
29. Sastre J, Meydani M, Martin A, Biddle L, Taylor A, Blumberg J. Effect of glutathione monoethylester administration on galactose-induced cataract in the rat. Life Chem Rep 1994; 12:89–95.
30. Taylor A, Jahngen-Hodge J, Smith DE, et al. Dietary restriction delays cataract and reduces ascor-bate levels in Emory mice. Exp Eye Res 1995; 61:55–62.
31. Taylor A, Lipman RD, Jahngen-Hodge J, et al. Dietary calorie restriction in the Emory mouse:effects on lifespan, eye lens cataract prevalence and progression, levels of ascorbate, glutathione,glucose, and glycohemoglobin, tail collagen breaktime, DNA and RNA oxidation, skin integrity,fecundity, and cancer. Mech Ageing Dev 1995; 79:33–57.

500 Part VI / Prevention of Major Disabilities
32. Taylor A, Jacques PF, Nowell T, et al. Vitamin C in human and guinea pig aqueous, lens and plasmain relation to intake. Curr Eye Res 1997; 16:857–864.
33. Levine M. New concepts in the biology and biochemistry of ascorbic acid. N Engl J Med 1986;314:892–902.
34. Frei B, Stocker R, Ames BN. Antioxidant defenses and lipid peroxidation in human blood plasma.Proc Nat Acad Sci USA 1988; 85:9748–9752.
35. Berger J, Shepard D, Morrow F, Taylor A. Relationship between dietary intake and tissue levels ofreduced and total vitamin C in the nonscorbutic guinea pig. J Nutr 1989; 119:734–740.
36. Berger J, Shephard D, Morrow F, Sadowski J, Haire T, Taylor A. Reduced and total ascorbate inguinea pig eye tissues in response to dietary intake. Curr Eye Res 1988; 7:681–686.
37. Yokoyama T, Sasaki H, Giblin FJ, Reddy VN. A physiological level of ascorbate inhibits galactosecataract in guinea pigs by decreasing polyol accumulation in the lens epithelium: a dehydroascor-bate-linked mechanism. Exp Eye Res 1994; 58:207–218.
38. Kosegarten DC, Maher TJ. Use of guinea pigs as model to study galactose-induced cataract forma-tion. J Pharm Sci 1978; 67:1478–1479.
39. Vinson JA, Possanza CJ, Drack AV. The effect of ascorbic acid on galactose-induced cataracts. NutrRep Int 1986; 33:665–668.
40. Devamanoharan PS, Henein M, Morris S, Ramachandran S, Richards RD, Varma SD. Prevention ofselenite cataract by vitamin C. Exp Eye Res 1991; 52:563–568.
41. Nishigori H, Lee JW, Yamauchi Y, Iwatsuru M. The alteration of lipid peroxide in glucocorticoid-induced cataract of developing chick embryos and the effect of ascorbic acid. Curr Eye Res 1986;5:37–40.
42. Blondin J, Taylor A. Measures of leucine aminopeptidase can be used to anticipate UV-induced age-related damage to lens proteins: ascorbate can delay this damage. Mech Ageing Dev 1987; 41:39–46.
43. Blondin J, Baragi V, Schwartz E, Sadowski JA, Taylor A. Delay of UV-induced eye lens proteindamage in guinea pigs by dietary ascorbate. J Free Radic Biol Med 1986; 2:275–281.
44. Taylor A, Jacques PF, Epstein EM. Relations among aging, antioxidant status, and cataract. Am JClin Nutr 1995; 62:1439S–1447S.
45. Blondin J, Baragi VJ, Schwartz E, Sadowski J, Taylor A. Dietary vitamin C delays UV-induced age-related eye lens protein damage. Ann NY Acad Sci 1987; 498:460–463.
46. Tessier F, Obrenovich M, Monnier VM. Structure and mechanism of formation of human lens fluo-rophore LM-1. Relationship to vesperlysine A and the advanced Maillard reaction in aging, diabetes,and cataractogenesis. J Biol Chem 1999; 274:20,796—20,804.
47. Garland DL. Ascorbic acid and the eye. Am J Clin Nutr 1991; 54:1198S-1202S.48. Nagaraj RH, Monnier VM. Isolation and characterization of a blue fluorophore from human eye lens
crystallins: in vitro formation from Maillard reaction with ascorbate and ribose. Biochim BiophysActa 1992; 1116:34–42.
49. Bensch KG, Fleming JE, Lohmann W. The role of ascorbic acid in senile cataract. Proc Natl AcadSci USA 1985; 82:7193–7196.
50. Shang F, Gong X, Egtesadi S, et al. Vitamin C prevents hyperbaric oxygen-induced growth retarda-tion and lipid peroxidation and attenuates the oxidation-induced up-regulation of glutathione inguinea pigs. J Nutr Biochem 2002; 13:307–313.
51. Yeum KJ, Shang FM, Schalch WM, Russell RM, Taylor A. Fat-soluble nutrient concentrations indifferent layers of human cataractous lens. Curr Eye Res 1999; 19:502–505.
52. Schalch W, Dayhaw-Barker P, Barker FM. II. The Carotenoids of the Human Retina. In: Taylor A, ed.Nutritional and Environmental Influences on the Eye. CRC Press, Boca Raton, FL, 1999, pp. 215–250.
53. Machlin LJ, Bendich A. Free radical tissue damage: protective role of antioxidant nutrients. Faseb J1987; 1:441–445.
54. Costagliola C, Iuliano G, Menzione M, Rinaldi E, Vito P, Auricchio G. Effect of vitamin E on glu-tathione content in red blood cells, aqueous humor and lens of humans and other species. Exp EyeRes 1986; 43:905–914.
55. Yeum KJ, Taylor A, Tang G, Russell RM. Measurement of carotenoids, retinoids, and tocopherols inhuman lenses. Invest Ophthalmol Vis Sci 1995; 36:2756–2761.
56. Stephens RJ, Negi DS, Short SM, van Kuijk FJ, Dratz EA, Thomas DW. Vitamin E distribution inocular tissues following long-term dietary depletion and supplementation as determined bymicrodissection and gas chromatography-mass spectrometry. Exp Eye Res 1988; 47:237–245.

Chapter 19 / Cataract Risk 501
57. Creighton MO, Ross WM, Stewart-DeHaan PJ, Sanwal M, Trevithick JR. Modelling corticalcataractogenesis VII: Effects of vitamin E treatment on galactose-induced cataracts. Exp Eye Res1985; 40:213–222.
58. Bhuyan DK, Podos SM, Machlin LT, et al. Antioxidant in therapy of cataract II: Effect of all-roc-α-tocopherol (vitamin E) in sugar-induced cataract in rabbits (ARVO abstracts). Invest Ophthalmol VisSci 1983; 24:74.
59. Bhuyan KC, Bhuyan DK. Molecular mechanism of cataractogenesis: III. Toxic metabolites of oxy-gen as initiators of lipid peroxidation and cataract. Curr Eye Res 1984; 3:67–81.
60. Hammond BR, Jr., Wooten BR, Snodderly DM. Density of the human crystalline lens is related tothe macular pigment carotenoids, lutein and zeaxanthin. Optom Vis Sci 1997; 74:499–504.
61. Snodderly DM, Hammond BR, Jr. In Vivo Psychophysical Assessment of Nutritional andEnvironmental Influences on Human Ocular Tissues: Lens and Macular Pigment. In: Taylor A, ed.Nutritional and Environmental Influences on the Eye. CRC Press, Boca Raton, FL, 1999, pp. 251–285.
62. Shang F, Gong X, Palmer HJ, Nowell TR Jr, Taylor A. Age-related decline in ubiquitin conjugationin response to oxidative stress in the lens. Exp Eye Res 1997; 64:21–30.
63. Curran Celentano J, Burke JD, Hammond BR Jr. In vivo assessment of retinal carotenoids: macular pig-ment detection techniques and their impact on monitoring pigment status. J Nutr 2002; 132:535S–539S.
64. Krinsky NI. Possible biologic mechanisms for a protective role of xanthophylls. J Nutr 2002;132:540S–542S.
65. Zigler JS, Jr., Goosey JD. Singlet oxygen as a possible factor in human senile nuclear cataract devel-opment. Curr Eye Res 1984; 3:59–65.
66. Varma SD, Chand D, Sharma YR, Kuck JF, Jr., Richards RD. Oxidative stress on lens and cataractformation: role of light and oxygen. Curr Eye Res 1984; 3:35–57.
67. Rathbun WB, Killen CE, Holleschau AM, Nagasawa HT. Maintenance of hepatic glutathione home-ostasis and prevention of acetaminophen-induced cataract in mice by L-cysteine prodrugs. BiochemPharmacol 1996; 51:1111–1116.
68. Fridovich I. Oxygen: aspects of its toxicity and elements of defense. Curr Eye Res 1984; 3:1–2.69. Giblin FJ, McCready JP, Reddy VN. The role of glutathione metabolism in the detoxification of
H2O2 in rabbit lens. Invest Ophthalmol Vis Sci 1982; 22:330–335.70. Berman ER. Biochemistry of the Eye. Plenum Press, New York, 1991:210–308.71. Goldberg AL. Protein degradation and protection against misfolded or damaged proteins. Nature
2003; 426:895–899.72. Obin M, Shang F, Gong X, Handelman G, Blumberg J, Taylor A. Redox regulation of ubiquitin-
conjugating enzymes: mechanistic insights using the thiol-specific oxidant diamide. Faseb J 1998;12:561–569.
73. Obin M, Mesco E, Gong X, Haas AL, Joseph J, Taylor A. Neurite outgrowth in PC12 cells.Distinguishing the roles of ubiquitylation and ubiquitin-dependent proteolysis. J Biol Chem 1999;274:11,789–11,795.
74. Jahngen-Hodge J, Obin MS, Gong X, et al. Regulation of ubiquitin-conjugating enzymes by glu-tathione following oxidative stress. J Biol Chem 1997; 272:28,218–28,226.
75. Shang F, Gong X, Taylor A. Activity of ubiquitin-dependent pathway in response to oxidative stress.Ubiquitin-activating enzyme is transiently up-regulated. J Biol Chem 1997; 272:23,086–23,093.
76. Guo W, Shang F, Urim L, West-Mays J, Zelenka P, Taylor A. Differential regulation of componentsof the ubiquitin-proteasome pathway during lens cell differentiation. Invest Ophthalmol Vis Sci2004, in press.
77. Taylor A, Davies KJ. Protein oxidation and loss of protease activity may lead to cataract formationin the aged lens. Free Radic Biol Med 1987; 3:371–377.
78. Taylor A, Jacques PF, Dorey CK. Oxidation and aging: impact on vision. Toxicol Ind Health 1993;9:349–371.
79. Shang F, Taylor A. Oxidative stress and recovery from oxidative stress are associated with alteredubiquitin conjugating and proteolytic activities in bovine lens epithelial cells. Biochem J 1995;307:297–303.
80. Shang F, Gong X, Taylor A. Changes in ubiquitin conjugation activities in young and old lenses inresponse to oxidative stress. Inv Ophthalmol Vis Sci 1995; 36:S528.
81. Christen WG. Evaluation of Epidemiologic Studies of Nutrition and Cataract. In: Taylor A, ed.Nutritional and Environmental Influences on the Eye. CRC Press, New York, 1999, pp. 95–104.

502 Part VI / Prevention of Major Disabilities
82. Cumming RG, Mitchell P, Smith W. Diet and cataract: the Blue Mountains Eye Study.Ophthalmology 2000; 107:450–456.
83. Gale CR, Hall NF, Phillips DI, Martyn CN. Plasma antioxidant vitamins and carotenoids and age-related cataract. Ophthalmology 2001; 108:1992–1998.
84. Italian-American Cataract Study. Risk factors for age-related cortical, nuclear, and posterior sub-capsular cataracts. Am J Epidemiol 1991; 133:541–553.
85. Jacques PF, Chylack LT Jr. Epidemiologic evidence of a role for the antioxidant vitamins andcarotenoids in cataract prevention. Am J Clin Nutr 1991; 53:352S–355S.
86. Jacques PF, Taylor A, Hankinson SE, et al. Long-term vitamin C supplement use and prevalence ofearly age-related lens opacities. Am J Clin Nutr 1997; 66:911–916.
87. Jacques PF, Chylack LT Jr, Hankinson SE, et al. Long-term nutrient intake and early age-relatednuclear lens opacities. Arch Ophthalmol 2001; 119:1009–1019.
88. Kuzniarz M, Mitchell P, Cumming RG, Flood VM. Use of vitamin supplements and cataract: theBlue Mountains Eye Study. Am J Ophthalmol 2001; 132:19–26.
89. Leske MC, Chylack LT Jr, Wu SY. The Lens Opacities Case–Control Study. Risk factors for cataract.Arch Ophthalmol 1991; 109:244–251.
90. Leske MC, Wu SY, Hyman L, et al. Biochemical factors in the lens opacities. Case–control study.The Lens Opacities Case-Control Study Group. Arch Ophthalmol 1995; 113:1113–1119.
91. Leske MC, Wu SY, Connell AM, Hyman L, Schachat AP. Lens opacities, demographic factors andnutritional supplements in the Barbados Eye Study. Int J Epidemiol 1997; 26:1314–1322.
92. Mares-Perlman JA, Klein BE, Klein R, Ritter LL. Relation between lens opacities and vitamin andmineral supplement use. Ophthalmology 1994; 101:315–325.
93. Mares-Perlman JA, Brady WE, Klein BE, et al. Diet and nuclear lens opacities. Am J Epidemiol1995; 141:322–334.
94. Mares-Perlman JA, Brady WE, Klein BE, et al. Serum carotenoids and tocopherols and severity ofnuclear and cortical opacities. Invest Ophthalmol Vis Sci 1995; 36:276–288.
95. McCarty CA, Mukesh BN, Fu CL, Taylor HR. The epidemiology of cataract in Australia. Am JOphthalmol 1999; 128:446–465.
96. Mohan M, Sperduto RD, Angra SK, et al. India-US case–control study of age-related cataracts.India-US Case–Control Study Group. Arch Ophthalmol 1989; 107:670–676.
97. Robertson JM, Donner AP, Trevithick JR. Vitamin E intake and risk of cataracts in humans. Ann NYAcad Sci 1989; 570:372–382.
98. Tavani A, Negri E, La Vecchia C. Food and nutrient intake and risk of cataract. Ann Epidemiol 1996;6:41–46.
99. Taylor A, Jacques PF, Chylack LT, Jr., et al. Long-term intake of vitamins and carotenoids and oddsof early age- related cortical and posterior subcapsular lens opacities. Am J Clin Nutr 2002;75:540–549.
100. Valero MP, Fletcher AE, De Stavola BL, Vioque J, Alepuz VC. Vitamin C is associated with reducedrisk of cataract in a Mediterranean population. J Nutr 2002; 132:1299–1306.
101. Vitale S, West S, Hallfrisch J, et al. Plasma antioxidants and risk of cortical and nuclear cataract.Epidemiology 1993; 4:195–203.
102. Age-Related Eye Disease Study Research Group. A randomized, placebo-controlled, clinical trial ofhigh-dose supplementation with vitamins C and E and beta carotene for age-related cataract andvision loss: AREDS report no. 9. Arch Ophthalmol 2001; 119:1439–1452.
103. Brown L, Rimm EB, Seddon JM, et al. A prospective study of carotenoid intake and risk of cataractextraction in US men. Am J Clin Nutr 1999; 70:517–524.
104. Chasan-Taber L, Willett WC, Seddon JM, et al. A prospective study of vitamin supplement intakeand cataract extraction among US women. Epidemiology 1999; 10:679–684.
105. Chasan-Taber L, Willett WC, Seddon JM, et al. A prospective study of carotenoid and vitamin Aintakes and risk of cataract extraction in US women. Am J Clin Nutr 1999; 70:509–516.
106. Chylack LT, Jr., Brown NP, Bron A, et al. The Roche European American Cataract Trial (REACT):a randomized clinical trial to investigate the efficacy of an oral antioxidant micronutrient mixture toslow progression of age-related cataract. Ophthalmic Epidemiol 2002; 9:49–80.
107. Christen WG, Manson JE, Glynn RJ, et al. A randomized trial of beta carotene and age-relatedcataract in US physicians. Arch Ophthalmol 2003; 121:372–378.
108. Hankinson SE, Stampfer MJ, Seddon JM, et al. Nutrient intake and cataract extraction in women: aprospective study. BMJ 1992; 305:335–339.

Chapter 19 / Cataract Risk 503
109. Jacques PF, Chylack LT, Jr., Hankinson SE, et al. Effect of nutrients on change in early lens nuclearopacity grades after five years. Arch Ophthalmol 2004, in press.
110. Knekt P, Heliovaara M, Rissanen A, Aromaa A, Aaran RK. Serum antioxidant vitamins and risk ofcataract. BMJ 1992; 305:1392–1394.
111. Leske MC, Chylack LT, Jr., He Q, et al. Antioxidant vitamins and nuclear opacities: the longitudinalstudy of cataract. Ophthalmology 1998; 105:831–836.
112. Lyle BJ, Mares-Perlman JA, Klein BE, et al. Serum carotenoids and tocopherols and incidence ofage-related nuclear cataract. Am J Clin Nutr 1999; 69:272–277.
113. Lyle BJ, Mares-Perlman JA, Klein BE, Klein R, Greger JL. Antioxidant intake and risk of incidentage-related nuclear cataracts in the Beaver Dam Eye Study. Am J Epidemiol 1999; 149:801–809.
114. Mares-Perlman JA, Brady WE, Klein BEK, Klein R, Palta M. Supplement use and 5-year progres-sion of cortical opacities. Inv Ophthalmol Vis Sci 1996; 37:S237.
115. Mares-Perlman JA, Lyle BJ, Klein R, et al. Vitamin supplement use and incident cataracts in apopulation-based study. Arch Ophthalmol 2000; 118:1556–1563.
116. McNeil JJ, Robman L, Tikellis G, Sinclair MI, McCarty CA, Taylor HR. Vitamin E supplementationand cataract: randomized controlled trial. 2004, in press.
117. Nadalin G, Robman LD, McCarty CA, Garrett SK, McNeil JJ, Taylor HR. The role of past intake ofvitamin E in early cataract changes. Ophthalmic Epidemiol 1999; 6:105–112.
118. Rouhiainen P, Rouhiainen H, Salonen JT. Association between low plasma vitamin E concentrationand progression of early cortical lens opacities. Am J Epidemiol 1996; 144:496–500.
119. Seddon JM, Christen WG, Manson JE, et al. The use of vitamin supplements and the risk of cataractamong US male physicians. Am J Public Health 1994; 84:788–792.
120. Sperduto RD, Hu TS, Milton RC, et al. The Linxian cataract studies. Two nutrition intervention trials.Arch Ophthalmol 1993; 111:1246–1253.
121. Teikari JM, Rautalahti M, Haukka J, et al. Incidence of cataract operations in Finnish male smokersunaffected by alpha tocopherol or beta carotene supplements. J Epidemiol Community Health 1998;52:468–472.
122. Schalch W, Chylack LT. [Antioxidant micronutrients and cataract.Review and comparison of theAREDS and REACT cataract studies]. Ophthalmologe 2003; 100:181–189.
123. Leske MC, Wu SY, Nemesure B, Hennis A. Risk factors for incident nuclear opacities.Ophthalmology 2002; 109:1303–1308.


From: Preventive Nutrition: The Comprehensive Guide for Health Professionals, Third EditionEdited by: A. Bendich and R. J. Deckelbaum © Humana Press Inc., Totowa, NJ
505
20 Antioxidant Nutrientsand Prevention of Oxidant-MediatedDiseases
Ronald Anderson
KEY POINTS
● Chronic exposure to excessive levels of atmospheric pollution in the workplace, envi-ronment, and home (especially from cigarette smoke) is accompanied by increasedoxidative stress.
● Inhalation of cigarette smoke has a profoundly irritant effect on phagocytic cells, causingan increase in both the number and oxidant-generating activities of these cells.
● Smoking-induced oxidative stress is associated with increased turnover of the antioxi-dant nutrients vitamin C, β-carotene, and vitamin E in the circulation and lungs.
● Relatively moderate increases in the numbers of circulating phagocytes has consistentlybeen shown to be an independent predictor of decline in pulmonary function, develop-ment of several cardiovascular conditions (including myocardial infarction, suddencardiac death, all coronary heart disease (CHD) combined, stroke, and essential hyper-tension), lung cancer incidence and mortality, possibly cancer at all sites, and death fromall causes. Adequate intake of vitamin C, vitamin E, and β-carotene is necessary tocounteract the development of oxidant-mediated tissue damage, organ dysfunction, anddisease.
1. INTRODUCTION
Certain high-risk occupations, adverse socioeconomic and sociocultural circumstances,and unhealthy, avoidable aspects of lifestyle may—individually or collectively—result inheightened levels of oxidative stress, predisposing the individual to future developmentof oxidant-mediated organ dysfunction and disease (1,2). Outdated and/or poorlyregulated industrial practices; unacceptably high levels of vehicle exhaust emissions;overpopulation associated with overcrowded, poorly ventilated, nonelectrified dwellings;and poor dispersal of atmospheric pollutants caused by unfavorable climate conditionsand/or topography are problems commonly encountered in, but not limited to, manydeveloping countries (3,4). In these circumstances, chronic exposure to excessive levels
506 Part VI / Prevention of Major Disabilities
of atmospheric pollution in the workplace, environment, and home is accompanied byincreased oxidative stress. Unhealthy lifestyles such as poor dietary habits (especiallylow intake of fresh fruits and vegetables [5] ), cigarette smoking (2), and, in some cases,excessive exposure to ultraviolet radiation (6) also accelerate the onset of those degenera-tive diseases (cataracts, cardiovascular diseases [CVDs], cancer, pulmonary dysfunction,and emphysema) that have a suspected oxidant-mediated etiology (1,2).
Cigarette smoking is the most common and eminently avoidable cause of lifestyle-related oxidative stress associated with accelerated onset of degenerative disease andpremature death. Moreover, the toxicology of cigarette smoke inhalation is probablybroadly similar to that of many other inhaled, pro-oxidative irritants. For these reasons,this chapter focuses primarily on cigarette smoking to review the relationships that existbetween atmospheric pollution, nutrition, and oxidant-mediated diseases.
2. CIGARETTE SMOKING
The magnitude of the ongoing, and apparently increasing, threat posed to publichealth by cigarette smoking is emphasized by the following comment, which remainsvalid 10 yr after being recorded:
Smoking represents a great failure in public health; more than 40 yr after the hazardswere first established, cigarettes are still responsible for 30% of deaths in middle agein Britain and the United States, and worldwide sales are increasing (7).
This statement is based on data derived from an epidemiological study designed toinvestigate mortality in relation to smoking over a 40-yr period in British male doctors(8). Alarmingly, the results of this study demonstrated that the hazards of long-term useof tobacco were substantially underestimated in previous studies conducted over shorterperiods; a revised estimate shows that about half of all regular cigarette smokers willeventually be killed by their habit (8). The average decrease in life expectancy of smokersrelative to nonsmokers is 8 yr (8). If current smoking trends persist, it is predicted thatsmoking will be one of the largest causes of premature death worldwide (7).
2.1. Origins of Oxidants During Smoke ExposureThere are two major sources of oxidative stress in smoke-exposed individuals. First, the
gas and tar phases of cigarette smoke contain extremely high levels of organic radicals; therespective, approximate concentrations are 1015/puff and 1017/g. Second, inhalation ofcigarette smoke has a profoundly irritant effect on the phagocytic cells of the immunesystem, causing an increase in both the number and oxidant-generating activities of thesecells (9–11), and the high iron content of cigarette smoke may favor generation of thehighly toxic hydroxyl radical by these cells in the airways of smokers (12). Consequently,chronic exposure of the smoker to high levels of reactive oxidants is accompanied by anincreased risk of oxidant-mediated diseases. These events are summarized in Fig. 1.
2.2. Proinflammatory Effects of Cigarette SmokingCigarette smoking causes an acute localized inflammatory reaction characterized by
the accumulation of phagocytes (neutrophils and macrophages) in the membranousbronchioles and alveoli of the lungs, leading to destruction of the peribronchiolar alve-olar attachments and pulmonary dysfunction (13,14). However, these inflammatory

Chapter 20 / Antioxidants and Disease 507
events are not confined to the lung, and systemic, proinflammatory effects of cigarettesmoking have also been demonstrated in numerous studies. Compared to nonsmokers,cigarette smokers have significantly increased circulating leukocyte counts, which areinversely correlated with the degree of airflow limitation (9,15). Additionally, thedecline in forced expiratory flow in 1 s (FEV1), an important measure of pulmonaryfunction, is inversely correlated with both the initial peripheral leukocyte count (16) andthe change in leukocyte count over time, independently of the smoking habit (17). Thenormal tempo of neutrophil production in the bone marrow is about 0.5 to 1.5 × 10⁹/kgof body weight daily. These short-lived phagocytes are released into the circulation andaccount for up to 70% of the circulating leukocyte population. The normal range for cir-culating leukocyte counts in apparently healthy adult humans is 4 to 11 × 106 mL ofblood, which is an underestimate because approx 50% of the circulating neutrophil poolis adherent to vascular endothelium. On average, cigarette smoking increases the num-bers of circulating leukocytes (mainly neutrophils and monocytes) by 20 to 30%; however,in some cases, the increase may exceed 100%. Cigarette smoking not only increases thenumbers of circulating and pulmonary phagocytes but also enhances the pro-oxidativeand adhesive properties of these cells. Phagocytes from cigarette smokers are sensitizedfor increased production of reactive oxidants (11,12,18), which is attributable, at leastin part, to increased content of the pro-oxidative enzyme myeloperoxidase (MPO) (20)and is closely correlated with the degree of pulmonary dysfunction (19). Cigarettesmoke-mediated activation of neutrophils in vivo causes delayed transit of these cellsthrough the pulmonary microcirculation (21,22), which is probably a result of oxidant-mediated adhesion of these cells to vascular endothelium (23,24), altered expression ofcellular adhesion molecules (25), intravascular aggregation of neutrophils and platelets(23,26), and increased release of MPO and elastase (22,27).
3. HARMFUL ACTIVITIES OF OXIDANTS
Phagocyte-derived reactive oxidants, as well as those present in cigarette smoke,have a range of harmful activities. These oxidants have been reported to be cytotoxicfor a wide variety of eukaryotic cells (28,29) and are also immunosuppressive, carcino-genic, proproteolytic, proadhesive, and proatherogenic. The biochemical mechanisms
Fig. 1. Events leading to pulmonary dysfunction in smokers.

508 Part VI / Prevention of Major Disabilities
involved in the etiology of oxidant-mediated disorders are summarized in Table 1.Whereas the relative contributions of oxidants derived directly from cigarette smokeand those from smoke-activated phagocytes to the oxidative events involved in thepathogenesis of smoking-related diseases are unknown; the combined assault fromthese two sources is unremitting and difficult to counteract.
3.1. Oxidants as CarcinogensGiven the complexity and range of reactive oxidants that it contains, it is hardly
surprising that several pro-oxidative mechanisms have been proposed to account for theobserved direct DNA-damaging effects of cigarette smoke (2,29,30). It has beenproposed that polyhydroxy aromatic compounds present in tar bind to the genetic mate-rial, leading to generation of hydrogen peroxide (H2O2), which in turn causes DNAstrand breaks by a hydroxyl radical (•OH)-dependent mechanism (30).
The association between chronic inflammation, phagocyte-derived oxidants, anddevelopment of epithelial cancers is well recognized (31). Activated phagocytes havebeen identified as potential carcinogens because they oxidatively damage DNA andpromote malignant transformation in bystander cells in tissue culture (22). Hydrogenperoxide is the oxidant primarily responsible for phagocyte-mediated DNA damageto neighboring cells. This permeant oxidant interacts with intracellular transitionmetals to generate •OH in close proximity to DNA, leading to oxidative damage toadenine, guanine, thymine, and cytosine as well as DNA strand breaks (31). AlthoughDNA damage in living cells is subject to cellular repair, it may occasionally escaperepair, or repair may be incorrect. In such cases, unrepaired or misrepaired DNAcould have deleterious consequences, leading to gene modifications that may ulti-mately promote cellular transformation (32). Ominously, it also has been reported thatthe permeant, phagocyte-derived reactive oxidant hypochlorous acid (HOCl) oxida-tively inactivates the DNA repair enzyme poly(ADP ribose) polymerase in bystandercells exposed to activated neutrophils (33), indicating that phagocyte-derived oxidantsnot only damage DNA but also compromise DNA repair mechanisms.
Table 1Mechanisms Involved in the Etiology of Oxidant-Mediated Disorders
Disease Pro-oxidative mechanism
Cancer Oxidative damage to DNAInactivation of DNA repair enzymes
Pulmonary emphysema and tissue damage Potentiation of the activity ofin autoimmune diseases such as phagocyte-derived proteasesrheumatoid arthritis
Cardiovascular disease Oxidative modification oflow-density lipoprotein
Adhesion of phagocytes to vascularendothelium
Acquired immunosuppression Oxidative inactivation of theprotective activities of B and Tlymphocytes, as well as naturalkiller cells

Chapter 20 / Antioxidants and Disease 509
3.2. Proteolytic Activities of OxidantsReactive oxidants present in cigarette smoke as well as those released by activated
phagocytes have been reported to potentiate the activity of neutrophil-derived prote-olytic enzymes. Neutrophil granules contain a large family of more than 20 enzymes;however, 4 proteolytic enzymes (the neutral serine proteases elastase and proteinase 3and the two metalloproteinases collagenase and gelatinase) seem to have the greatestpotential to act as mediators of tissue injury (34). These proteases are released extracellu-larly by activated neutrophils (27), and each cleaves key components of the extracellularmatrix, which is composed of a complex mix of collagens, elastin, proteoglycans, andglycoproteins and lies under epithelia and surrounds connective tissue cells (34).Extracellular release of proteases and generation of reactive oxidants by activated neu-trophils are concomitant and interrelated events. Reactive oxidants, especially phagocyte-derived HOCl (34), as well as poorly defined oxidants present in cigarette smoke (2)dramatically potentiate the proteolytic activity of these neutrophil proteases by directand indirect mechanisms. In the case of elastase and proteinase 3, HOCl and cigarettesmoke promote the oxidative inactivation of α-1-protease inhibitor (API), the majorplasma and tissue inhibitor of these enzymes. On the other hand, collagenase and gelati-nase are secreted in a latent form by neutrophils and undergo oxidative activation onexposure to HOCl (34,35). When oxidatively activated, collagenase and gelatinasepotentiate the activity of elastase and proteinase 3 by cleaving API within its active siteloop, causing irreversible inactivation of this protease inhibitor (34,35). The conse-quence is uncontrolled elestolysis in the lungs of cigarette smokers, leading to pulmonarydysfunction and emphysema.
3.3. Proatherogenic Properties of OxidantsReactive oxidants are believed to be intimately involved in the pathogenesis of ath-
erosclerosis by promoting oxidative modification of low-density lipoprotein (LDL),which then accumulates in the arterial intima and appears to be the major contributor tothe formation of the atherosclerotic lesion (36). Oxidized LDL is selectively chemotac-tic for monocytes/macrophages and, unlike native LDL, is taken up by these cells,resulting in the formation of cytokine-producing foam cells (36). Interestingly, oxidizedLDL has been described to be immunogenic, initiating the formation of autoantibodiesagainst neoepitopes on the oxidatively modified molecule (36,37). The nature of theinvolvement (i.e., primary or secondary) of these autoantibodies in the etiology andprogression of atherosclerosis remains to be established.
There are several possible mechanisms by which inhalation of cigarette smoke maypromote oxidative modification of LDL, including direct oxidation of this molecule bysmoke-derived oxidants. However, because plasma contains high concentrations ofantioxidants, it seems improbable that meaningful oxidation of LDL would occur in thecirculation. Alternatively, cigarette smoking may predispose to atherosclerosis as a sec-ondary consequence of accelerated consumption of circulating nutritional antioxidants,such as ascorbate and β-carotene, rendering LDL vulnerable to phagocyte- and endothe-lial cell-derived reactive oxidants as it passes through the arterial wall (36,38).
3.4. Proadhesive Activity of OxidantsExposure of vascular endothelium to superoxide (O2
–) or H2O2 in vitro inducesprolonged expression of the adhesion molecules P- and E-selectins on endothelial cells,

510 Part VI / Prevention of Major Disabilities
with resultant adherence of neutrophils (23,24). Oxidant-mediated activation of neu-trophil adhesion to vascular endothelium probably is intimately involved in the patho-genesis of postichemic vascular injury. In this setting, however, the proadhesiveoxidants originate primarily from the endothelial cells. Ischemia and hypoxia promotethe proteolytic conversion of xanthine dehydrogenase to the superoxide-generatingenzyme xanthine oxidase in endothelial cells. Subsequent activation of this enzymeduring reperfusion/reoxygenation leads to generation of O2
– and H2O2:
These oxidants (O2– and H2O2) not only cause direct vascular injury but also upreg-
ulate expression of P- and E-selectins on vascular endothelium, leading to adherenceand activation of neutrophils, which contribute to vascular damage by pro-oxidativemechanisms. These events may explain the involvement of neutrophils in the exacerbationof myocardial damage that accompanies restoration of circulation and reoxygenationduring the postinfarct period.
An additional mechanism of oxidant-mediated proadhesive activity was describedin smoke-exposed rodents. Using a dorsal skinfold chamber combined with intravitalfluorescence microscopy to study the microcirculation in fine-striated skin muscle, itwas demonstrated that exposure of hamsters to cigarette smoke resulted in rapid adhe-sion of leukocytes to the endothelium of postcapillary venules and arterioles as well asthe formation of intravascular aggregates of leukocytes and platelets (23). Although theexact mechanisms of these smoke-induced adhesive interactions between circulatingleukocytes and vascular endothelium were not established, it was suggested that reac-tive oxidants present in cigarette smoke may have upregulated expression of P-selectinon endothelial cells (23). These proadhesive events are probably mechanisticallyinvolved in the etiology of smoking-related pulmonary disease and CVDs.
3.5. Immunosuppressive Properties of OxidantsReactive oxidants are also potent antiproliferative agents. Permeant oxidants, such as
H2O2 and HOCl, inhibit the proliferative activity and functions of B and T lymphocytesand natural killer (NK) cells in vitro, probably by interfering with the activity of severalenzymes involved in cellular energy metabolism (39,40). Smoking-related pro-oxidativeevents may compromise pulmonary defense mechanisms, because smokers have decreasedantibody responses to inhaled microbial antigens as well as abnormal NK function (41,42).However, the precise mechanisms and relative contributions of smoke- and phagocyte-derived oxidants to smoking-related immunosuppression remain to be established.
4. ANTIOXIDANT NUTRIENTS AND SMOKING-RELATED DISEASES
It is abundantly clear that radical and nonradical reactive oxidants are intimatelyinvolved in the etiology of smoking-related pulmonary dysfunction, bronchial carcinoma,and cardiovascular disorders. The rate at which these diseases develop in individualsmokers probably involves a dynamic interplay between oxidants and other toxins presentin cigarette smoke, the numbers and pro-oxidative activities of circulating and residentpulmonary phagocytes, and the efficiency of the smoker’s antioxidant defenses (43–45).
Moreover, oral administration of vitamin C to active smokers as well as to individualsexposed to environmental tobacco smoke resulted in a decline in the concentrations of

Chapter 20 / Antioxidants and Disease 511
circulating and intracellular biomarkers of oxidative stress, as well as attenuation ofactivation of genes encoding antioxidative enzymes such as catalase, glutathione per-oxidase, and superoxide dismutase (46,47). These observations suggest that inadequateintake of vitamin C, and possibly vitamin E and β-carotene, may be determinants ofsusceptibility to development of smoking-related diseases (43–45).
4.1. Vitamin CThe negative impact of cigarette smoking on plasma vitamin C levels is well-recognized
(43) and is caused, at least in part, by increased turnover of the vitamin, which explainsthe observed dose–response relationship between the number of cigarettes smoked perday and the decline in plasma vitamin C (48,49). Neutralization of oxidants present incigarette smoke (43) as well as those released by smoke-activated phagocytes (50) arethe probable mechanisms of accelerated consumption of the vitamin. Because vitaminC has been demonstrated to protect API against oxidative inactivation by both cigarettesmoke (51) and activated phagocytes (52) in vitro and to prevent activation of latentmetalloproteinases (53) and cigarette smoke-mediated adhesion of leukocytes to vascu-lar endothelium in hamsters (23), this vitamin probably is critically involved in pro-tecting the lungs against oxidant-inflicted damage and dysfunction. Indeed, data froman epidemiological study highlighted a clear and significant positive correlationbetween dietary intake of vitamin C and pulmonary competence (54). Interestingly andimportantly, the association between vitamin C and pulmonary function persisted afteradjustment for cigarette smoking, indicating that this protective activity of the vitaminis not limited to smoke-mediated oxidative stress (54). This contention is supported byobservations that deficiencies of vitamins C and E are associated with wheezing symptomsin both smokers and nonsmokers (55).
4.2. Vitamin E and β-CaroteneVitamin E has also been reported to regulate both the production and reactivity of
reactive oxygen species by activated neutrophils in vitro and ex vivo (56–58), whereasβ-carotene is a scavenger of phagocyte-derived singlet oxygen (59) and HOCl (57).Although neither of these antioxidants appears to be an efficient scavenger of smoke-derived oxidants (38), dietary intake of vitamin E and β-carotene, similarly to vitaminC, may be a determinant of pulmonary competence in cigarette smokers by protectingthe lungs against the destructive effects of smoke-activated phagocytes. This contentionwas supported by data from a study that described significant positive correlationsbetween plasma levels of β-carotene and several spirometric parameters in asympto-matic, male cigarette smokers but not in nonsmokers (60). Distinct relationshipsbetween plasma levels of vitamin E and pulmonary function were also reported in bothsmokers and nonsmokers (61). In nonsmoking males, plasma vitamin E was positivelyand significantly correlated with pulmonary competence, whereas, somewhat surpris-ingly, inverse correlations were observed between these parameters in a matched groupof cigarette smokers (61). It was proposed that in the physiological setting (typified bynonsmokers), maintenance of vitamin E homeostasis is probably adequate to protect thelungs against routine, environmental, and endogenous oxidative stress, accounting forthe positive relationship with pulmonary function. However, sustained and excessiveoxidative stress may necessitate mobilization of tissue stores of the vitamin and diver-sion to the lungs, which would explain the apparent inverse association between plasma

512 Part VI / Prevention of Major Disabilities
vitamin E and pulmonary competence in smokers (61). This type of mobilization of vit-amin E to the lungs was described in rats experimentally exposed to cigarette smoke(62) and ozone (63).
4.3. Antioxidant Nutrients and CVDAn association between adequate dietary intake of β-carotene and the antioxidant vit-
amins (particularly vitamin E) and reduced incidence of and mortality from CVD hasbeen demonstrated in a number of large epidemiological studies (64–67). Althoughsmoking has been identified as a major risk for development of CVD, these associationspersisted after adjustment for smoking status, demonstrating the predisposing role ofadditional factors, especially low dietary intake of these antioxidant nutrients. Moreover,physiological levels of vitamin C were reported to inhibit the oxidative modification ofLDL in vitro (68), whereas short-term oral administration of relatively high doses of thisvitamin or of vitamin E prevented (69) or retarded (36) peroxidative alteration of LDLex vivo. Identification of autoantibodies to oxidized LDL in individuals with athero-sclerosis and the possible involvement of these in the etiology of this condition (70)suggests that antioxidant nutrient status may determine the susceptibility of LDL tooxidative, autoantigenic modification. To support this finding, we detected increasedlevels of circulating autoantibodies to both oxidized LDL and cardiolipin in asympto-matic cigarette smokers older than age 30 yr. The levels of these autoantibodies weresignificantly and inversely correlated with plasma levels of vitamin C, indicating thatintake of this antioxidant nutrient may be a determinant of development of atherescle-rosis in smokers (71).
There is mounting and compelling evidence that antioxidants, particularly vitamin C,at relatively high intakes can both prevent and restore the endothelial dysfunction thatleads to the development of CVDs such as hypertension, diabetes, atherosclerosis, idio-pathic dilated cardiomyopathy, and congestive heart failure (72). Although they are notexactly clear, there are several—albeit probably related—mechanisms by which vita-min C improves the defective endothelium-dependent vasodilatation that underliesthese cardiovascular disorders. These include antagonism of endothelial cell apoptosis(73); protection of nitric oxide (NO), an important regulator of vasomotor tone, againstoxidative inactivation (74); potentiation of NO synthesis (75,76); antagonism of homo-cysteine (77); inhibition of the production of proatherogenic phospholipids (78,79); andprevention of the pro-oxidative and proapoptotic effects of hyperglycemia (80–82).These protective effects of vitamin C on endothelial integrity and function are likely toinvolve, at least in part, vitamin-mediated neutralization of phagocyte-derived reactiveoxidants (69,79,80).
4.4. Antioxidant Nutrients and CancerDecreased dietary intake and/or accelerated metabolism of the antioxidant vitamins
and β-carotene during sustained oxidative stress probably is a common cause of can-cer (83). Cigarette smoking is the primary cause of lung cancer and is also associatedwith the development of cancer at several other sites (mouth, larynx, esophagus, blad-der, pancreas) (7). Significant inverse correlations between the dietary intake and/orplasma levels of the antioxidant nutrients and development of cancer at various siteshave been reported in numerous epidemiological studies. The consistency of thesereports in conjunction with corroborative laboratory studies has prompted requests for

Chapter 20 / Antioxidants and Disease 513
the implementation of nutrient-based preventive public health strategies (5,83).However, these laboratory and epidemiological studies have not been supported by datafrom some of the completed antioxidant nutrient intervention studies (84,85). Althoughaspects of the design of these intervention studies may have inadvertently obscured thepossible preventive effects of vitamin C, vitamin E, and β-carotene, it is clear that defin-itive answers about the anticancer properties of these agents await the outcome of large-scale ongoing studies. Moreover, detection of beneficial effects of antioxidants mayrequire intervention at a relatively young age with monitoring over several decades, asopposed to intervention in middle-age spanning only several years (86,87).
5. PREDICTORS OF OXIDANT-MEDIATED DISEASE
Although cigarette smoking has been used in this chapter as the prototype cause oflifestyle-related oxidative stress, the mechanisms of smoking-associated oxidant-mediated tissue damage and disease probably are broadly operative in other settings,including environmental and occupational exposure to excessive levels of atmosphericpollution. Even in these settings, however, active (88) and passive (89) exposure tocigarette smoke often may be the primary offender.
Interestingly, the inverse relationships between dietary intake and/or plasma levels ofthe antioxidant nutrients vitamin C, vitamin E, and β-carotene and future developmentof degenerative disease and cancer described in major epidemiological studies remainafter adjustment for smoking history. Therefore, there must be a common mechanismthat is operative in both smokers and nonsmokers but that is clearly exacerbated by cig-arette smoking, which determines susceptibility to oxidant-mediated disease. Thismechanism may involve a dynamic interplay between dietary intake of antioxidantnutrients and the numbers and reactivities of the abundant, highly aggressive, oxidant-generating phagocytic cells of the immune system. Although critically involved in hostdefense against microbial pathogens, the sheer numbers of these cells and the undis-cerning nature of their arsenal of toxic antimicrobial oxidants constitutes an unrelentingthreat to other host cells and tissues. Coexistence between the host and the phagocyticcells of his of her immune system is probably fragile, and minor imbalances maycompromise the containment (damage limitation) functions of vitamins C and E andβ-carotene, creating the potential hazard of phagocyte-inflicted oxidative damage.
Such imbalances may be caused by several common, often avoidable, aspects oflifestyle that disrupt oxidant/antioxidant homeostasis. Poor dietary habits may impairantioxidant defenses through decreased intake of the antioxidant vitamins and β-carotene,whereas cigarette smoking, occupational and environmental atmospheric pollution, andexcessive exposure to ultraviolet radiation (6) may cause a futile, potentially harmfulincrease in the numbers and pro-oxidative activities of resident and circulating phagocytes.
5.1. Phagocytes, Antioxidants, and Degenerative DisordersThe health threat posed by sustained, relatively moderate increases in the numbers of
circulating phagocytes is emphasized by evidence from numerous epidemiologicalstudies that have consistently shown that the circulating leukocyte count, and, particu-larly, the neutrophil count, measured well before the onset of manifest clinical diseaseis an independent predictor of decline in pulmonary function (17), development of sev-eral cardiovascular conditions (including myocardial infarction, sudden cardiac death,

514 Part VI / Prevention of Major Disabilities
all CHD combined, stroke, and essential hypertension [90–92]), lung cancer incidenceand mortality, possible development of cancer at all sites (93,94), and death from allcauses (95). For each decrease in the circulating leukocyte count of 1000 mL of blood,the risk of CHD death decreased by 14% (90), although the relative odds for a 2000-mLdifference in leukocyte count for development of lung cancer ranged from 1.20 to 1.58in three different populations (93). The circulating leukocyte count was found to besuperior to systolic blood pressure, cholesterol levels, and smoking history and was sec-ond only to age as a predictor of mortality (95). It must be emphasized that the incre-ments in circulating leukocyte counts that seemingly predispose to degenerative diseaseand cancer are relatively modest, because they are within the normal range for apparentlyhealthy adults.
It is interesting, and probably not coincidental, that clinical disorders for whichelevated circulating leukocyte counts are predictive are essentially the same as thosethat have been demonstrated in epidemiological studies to be associated with decreaseddietary intake and/or plasma levels of the antioxidant nutrients. This implied mechanis-tic relationship by which sustained, albeit modest, increases in the numbers and pro-oxidative activities of circulating leukocytes cause depletion of nutritional antioxidantsand accelerated onset of degenerative diseases and cancer, as well as decline in pul-monary function, remains to be established. Nevertheless, such a relationship is sup-ported by observations that plasma levels of vitamin C are inversely related tocirculating total leukocyte and neutrophil counts in smokers and nonsmokers and posi-tively correlated with plasma vitamin E (50). Plasma levels of β-carotene have beenreported to correlate inversely with circulating neutrophil counts in young, asymptomaticcigarette smokers but not in nonsmokers (96).
In the setting of sustained increases in the circulating leukocyte count, chronic, exces-sive production of reactive oxidants by phagocytes may be linked to pulmonary and car-diovascular damage, as well as carcinogenesis. Increased destruction of antioxidants asa result of elevated numbers and activities of leukocytes may also increase the vulnera-bility of LDL and DNA to oxidative damage in other cell types simply by depleting bloodand tissues of these protective agents. Therefore, the circulating leukocyte count, whichhas surprising predictive power for future development of degenerative diseases andcancer, may be a primary determinant of optimum intake of antioxidant nutrients.
6. CIRCULATING LEUKOCYTE COUNTS AND RECOMMENDEDDAILY INTAKE OF VITAMINS C AND E AND β-CAROTENE
The proposed dynamic, inverse association between the levels of the antioxidantnutrients and the circulating leukocyte count remains to be conclusively established.However, if the relationship is substantiated, it may be possible to use the circulatingleukocyte count to formulate optimum intakes of vitamins C and E and β-carotene. Weused data from a study conducted on asymptomatic, young male cigarette smokers tocalculate “optimum” daily intake of these antioxidant nutrients based on the numbersand pro-oxidative activities of circulating leukocytes. The average increase in the cir-culating leukocyte count of smokers in our study was 2 × 10⁶/mL (6.2 × 10⁶/ml and8.2 × 106/mL for 85 male nonsmokers and 100 age- and gender-matched cigarettesmokers, respectively). The average increase in the smoking-related phagocyte-mediatedoxidant burden was calculated to be 71% (because of increased numbers and pro-oxidative

Chapter 20 / Antioxidants and Disease 515
activities of circulating leukocytes). Based on this increase in the oxidant burden and onRecommended Daily Allowances (RDAs) of 60 mg/d and 15 mg/d (these are not thecurrent RDAs for vitamin C and vitamin E), respectively, and a proposed intake of 6mg/d for β-carotene, the estimated increases in the daily intakes (above the RDA levels)for each increment of 1 × 10⁶/mL in the circulating leukocyte count above 6.2 × 10⁶/mLare 20 mg of vitamin C, 5 mg of vitamin E, and 2 mg of β-carotene. Given that the upperlimit of the normal range for circulating leukocyte counts for apparently healthy adulthumans is approx 11 × 106/mL, the estimated daily intakes of the antioxidant nutrientsrequired to protect all individuals with leukocyte counts less than or equal to this valueare 160 mg, 40 mg, and 16 mg for vitamin C, vitamin E, and β-carotene, respectively.Admittedly, there are several flaws in the calculation, such as: (a) it is based on RDAsthat may or may not be optimal; (b) in vivo activation of phagocytes may not be repre-sentative of the in vitro situation; and (c) it may not be necessary to increase the dailyintake of all three antioxidants. This may be particularly important in the case of β-carotene, for which a daily intake in excess of 6 mg probably is not justified and mayeven be hazardous for cigarette smokers (74). However, despite these limitations, it isnoteworthy that these values are in good agreement with intake estimates based ondata from metabolic (97), experimental (98), and epidemiological studies (43).Modest, daily supplementation above normal dietary intake levels, with 60 mg ofvitamin C, 30 mg of vitamin E, and 3 mg of β-carotene in combination with zinc,selenium, and copper for 60 d has been reported to protect nonsmokers against theharmful pro-oxidative effects (DNA damage and lipid peroxidation) of exposure toenvironmental tobacco smoke in the workplace (99). Until such time as the potentialbenefits of vitamin supplementation in disease prevention are clearly established ordiscounted, it has been proposed that it may be prudent for all adults to practice routine,modest supplementation (100).
However, it must be emphasized that several settings exist in which short-termadministration of vitamins C and E at supra-RDA levels have clear health benefits forcertain subgroups. These include the critically ill (101,102); those with endothelial dys-function associated with atherosclerosis, hypercholesterolemia, smoking, and hypertension(72,87); and, possibly, those with tuberculosis and/or HIV/AIDS (103,104).
7. CONCLUSIONS
Lipoproteins, extracellular matrix proteins (such as elastin), and many cellular mol-ecules (including DNA, membrane lipids, and enzymes involved in DNA repair andenergy production) are extremely vulnerable to oxidant-mediated damage. Therefore,certain avoidable and unavoidable aspects of lifestyle, because they are associated withaccelerated destruction and/or decreased intake of antioxidant nutrients, may predisposeto development of acquired immune dysfunction and increased risk of infection (105),cancer, and degenerative diseases such as atherosclerosis, cataracts, and pulmonaryemphysema.
8. RECOMMENDATIONS
Avoidance of unhealthy aspects of lifestyle, such as low intake of fresh fruits andvegetables, cigarette smoking, and excessive exposure to sunlight, are essential formaintenance of antioxidant homeostasis and prevention of oxidant-mediated diseases.

516 Part VI / Prevention of Major Disabilities
Because some of these objectives are difficult to achieve, even in affluent societies(106), modest supplementation with antioxidant nutrients represents a potentially effi-cient and inexpensive strategy to counteract the potential threat of oxidant-inflicted diseases.Daily intakes of about 200 mg, 40 mg, and 6–16 mg of vitamin C, vitamin E, and β-carotene, respectively, seem appropriate.
REFERENCES1. Fulton M, Thomson M, Elton RA, Brown S, Wood DA, Oliver MF. Cigarette smoking, social class
and nutrient intake: relevance to coronary heart disease. Eur J Clin Nutr 1988; 42:797–803.2. Pryor WA, Stone K. Oxidants in cigarette smoke. Ann NY Acad Sci 1993; 686:12–28.3. Godlee R. Air pollution I. From pea soup to photochemical smog. Br Med J 1991; 303:1459–1461.4. Melia RJ, Florey C de V, Altman DG, Swan AV. Association between gas cooking and respiratory
disease in children. Br Med J 1977; 2:149–152.5. Block G. Micronutrients and cancer: time for action? J Natl Can Inst USA 1993; 85:846–848.6. Savage JE, Theron AJ, Anderson R. Activation of neutrophil membrane-associated oxidative metab-
olism by ultraviolet radiation. J Invest Dermatol 1993; 101:532–536.7. Peto R. Smoking and death: the past 40 years and the next 40. Br Med J 1994; 309:937–939.8. Doll R, Peto R, Wheatley K, Gray R, Sutherland I. Mortality in relation to smoking: 40 years’ obser-
vations on male British doctors. Br Med J 1994; 309:901–911.9. Corrè F, Lellouch J, Schwartz D. Smoking and leucocyte counts. Lancet 1971; 2:632–634.
10. Hoidal JR, Niewoehner DE. Lung phagocyte recruitment and metabolic deterioration induced bycigarette smoke in humans and hamsters. Am Rev Resp Dis 1982; 126:548–552.
11. Hoidal JR, Fox RB, Lemarbe PA, Perri R, Repine JE. Altered oxidative metabolic responses in vivoof alveolar macrophages from asymptomatic cigarette smokers. Am Rev Resp Dis 1981;123:85–87.
12. Quinlan GJ, Evans TW, Gutteridge JMC. Iron and the redox status of the lungs. Free Rad Biol Med2002; 33:1306–1313.
13. Wright JL, Hobson JE, Wiggs B, Pare PD, Hogg JC. Airway inflammation and peribronchiolarattachments in the lungs of non-smokers, current and ex-smokers. Lung 1988; 166:277–286.
14. Ludwig PW, Schwartz BA, Hoidal JR, Niewoehner DE. Cigarette smoking causes accumulation ofpolymorphonuclear leukocytes in alveolar septum. Am Rev Resp Dis 1985; 131:828–830.
15. Chan-Yeung M, Dy Buncio A. Leukocyte count, smoking and lung function. Am J Med 1984;76:31-37.
16. Chan-Yeung M, Abbound R, Dy Buncio A, Vedal S. Peripheral leukocyte count and longitudinaldecline in lung function. Thorax 1988; 43:462–466.
17. Sparrow D, Glynn RJ, Cohen M, Weiss ST. The relationship of the peripheral leukocyte count andcigarette smoking to pulmonary function among adult men. Chest 1984; 86:383–386.
18. Ludwig RW, Hoidal JR. Alterations in leukocyte oxidative metabolism in cigarette smokers. Am RevResp Dis 1982; 126:977–980.
19. Richards GA, Theron AJ, Van der Merwe CA, Anderson R. Spirometric abnormalities in youngsmokers correlate with increased chemiluminescence responses of activated blood phagocytes. AmRev Resp Dis 1989; 139:181–187.
20. Bridges RB, Fu MC, Rehm SR. Increased neutrophil myeloperoxidase activity associated with cig-arette smoking. Eur J Resp Dis 1985; 67:84–93.
21. MacNee W, Wiggs B, Belzberb AS, Hogg JC. The effect of cigarette smoking on neutrophil kinet-ics in human lungs. N Engl J Med 1989; 321:924–928.
22. Bosken CH, Doerschuk CM, English D, Hogg JC. Neutrophil kinetics during active cigarette smok-ing in rabbits. J Appl Physiol 1991; 71:630–637.
23. Lehr H-A, Frei B, Arfors KE. Vitamin C prevents cigarette smoke-induced leukocyte aggregationand adhesion to endothelium in vivo. Proc Natl Acad Sci USA 1993; 91:7688–7692.
24. Lehr H-A, Kress E, Menger MD, et al. Cigarette smoke elicits leukocyte adhesion to endothelium inhamsters: inhibition by Cu-Zn SOD. Free Rad Biol Med 1993; 14:573–581.
25. Klut ME, Doerschuk CM, Van Eeden SF, Burns AR, Hogg JC. Activation of neutrophils within pul-monary microvessels of rabbits exposed to cigarette smoke. Am J Resp Cell Mol Biol 1993;9:82–89.

Chapter 20 / Antioxidants and Disease 517
26. Bridges AB, Hill A, Belch JJF. Cigarette smoking increases white blood cell aggregation in wholeblood. J Royal Soc Med 1993; 86:139–141.
27. Hind CRK, Joyce H, Tennent GA, Pepys MG, Pride NB. Plasma leucocyte elastase concentrationsin smokers. J Clin Pathol 1991; 44:232–235.
28. Babior BM. Oxidants from phagocytes: agents of defense and destruction. Blood 1984; 64:959–964.29. Leanderson P. Cigarette smoke-induced DNA damage in cultured human lung cells. Ann NY Acad
Sci 1993; 686:249–261.30. Borish ET, Cosgrove JP, Church DF, Deutch WA, Pryor WA. Cigarette tar causes single strand
breaks in DNA. Biochem Biophys Res Comm 1985; 133:780–786.31. Weitzman SA, Gordon LI. Inflammation and cancer: role of phagocyte-generated oxidants in car-
cinogenesis. Blood 1990; 76:655–663.32. Jackson JH, Gajewski E, Schraufstatter U, et al. Damage to the bases in DNA induced by stimulated
human neutrophils. J Clin Invest 1989; 84:1644–1649.33. Van Rensburg CEJ, Van Staden AM, Anderson R. Inactivation of poly(ADP-ribose)polymerase by
hypochlorous acid. Free Rad Biol Med 1991; 11:285–291.34. Weiss SJ. Tissue destruction by neutrophils. N Engl J Med 1989; 320:365–376.35. Desrochers PE, Mookhtiar K, Van Wart HE, Hasty KA, Weiss SJ. Proteolytic inactivation of α-1-
proteinase inhibitor and α-1-chymotrypsin by oxidatively activated human neutrophil metallopro-teinases. J Biol Chem 1992; 267:5005–5012.
36. Witztum JL. The oxidation hypothesis of atherosclerosis. Lancet 1994; 344:793–795.37. Lopes-Virella MF, Virella G. Atherosclerosis and autoimmunity. Clin Immunol Immunopathol 1994;
73:155–167.38. Cross CE, O’Neill CA, Reznick AZ, et al. Cigarette smoke oxidation of human plasma constituents.
Ann NY Acad Sci 1993; 686:72–90.39. El-Hag A, Lipsky PE, Bennett M, Clark RA. Immunomodulation by neutrophil myeloperoxidase and
hydrogen peroxide: differential susceptibility of human lymphocyte functions. J Immunol 1987;139:1406–2413.
40. Anderson R, Smit MJ, Jooné GK, Van Staden AM. Vitamin C and cellular immune functions: pro-tection against hypochlorous acid-mediated inactivation of glyceraldehyde-3-phosphate dehydroge-nase and ATP generation in human leukocytes as a possible mechanism of ascorbate mediatedimmunostimulation. Ann NY Acad Sci 1990; 587:34–48.
41. McSharry C, Wilkinson PC. Cigarette smoking and the antibody response to inhaled antigens.Immunol Today 1986; 7:98.
42. Ferson M, Edwards A, Lind A, Milton DW, Hersey P. Low natural killer cell activity andimmunoglobulin levels associated with smoking in human subjects. Int J Cancer 1979; 23:603–609.
43. Schectman G. Estimating ascorbic acid requirements for cigarette smokers. Ann NY Acad Sci 1993;686:335–346.
44. Bridges RB, Chow CK, Rehm SR. Micronutrient status and immune function in smokers. Ann NYAcad Sci 1990; 587:218–231.
45. Pacht ER, Kaseki H, Mohammed JR, Cornwell DG, Davis WB. Deficiency of vitamin E in the alve-olar fluid of cigarette smokers. J Clin Invest 1986; 77:789–796.
46. Ueta E, Tadokoro Y, Yamamoto T, et al. The effect of cigarette smoke exposure and ascorbic acidintake on gene expression of antioxidant enzymes and other related enzymes in the livers and lungsof Shionogi rats with osteogenic disorders. Toxicol Sci 2003; 73:339–347.
47. Dietrich M, Block G, Benowitz NL, et al. Vitamin C supplementation decreases oxidative stress bio-marker F-2 isoprostanes in plasma of nonsmokers exposed to environmental tobacco smoke. NutrCancer 2003; 45:176–184.
48. Tribble DL, Builiano L, Formann SP. Reduced plasma ascorbic acid concentrations in nonsmokersregularly exposed to environmental tobacco smoke. Am J Clin Nutr 1993; 58:886–890.
49. Van Antwerpen VL, Theron AJ, Richards GA, Anderson R. Plasma vitamin C in male smokers.J Smoking-Related Dis 1994; 5:167–170.
50. Van Antwerpen VL, Theron AJ, Myer MS, et al. Cigarette smoke-mediated oxidative stress, phago-cytes, vitamin C, vitamin E and tissue injury. Ann NY Acad Sci 1993; 686:53–65.
51. Pryor WA, Dooley MM. Inactivation of human α-1-proteinase inhibitor by cigarette smoke: effectof smoke phase and buffer. Am Rev Resp Dis 1983; 131:941–943.
52. Theron AJ, Anderson R. Investigation of the protective effects of the anti-oxidants ascorbate, cys-teine and dapsone on the phagocyte-mediated oxidative inactivation of human α-1-protease inhibitorin vitro. Am Rev Resp Dis 1985; 132:1049–1054.

518 Part VI / Prevention of Major Disabilities
53. Suomalainen K, Sorsa T, Lindy O, Saari H, Konttinen YT, Uitto VJ. Hypochlorous acid activationof human neutrophil and gingival crevicular fluid collagenase can be inhibited by ascorbate. ScandJ Dent Res 1991; 99:397–405.
54. Schwartz J, Weiss ST. Relationship between dietary vitamin C and pulmonary function in the FirstNational Health and Nutrition Examination Survey (NHANES 1). Am J Clin Nutr 1994;59:110–114.
55. Bodner C, Godden D, Brown K, Little J, Ross S, Seaton A. Antioxidant intake and adult-onsetwheeze: a case-control study. Eur Resp J 1999; 13:22–30.
56. Baehner RL, Boxer LA, Ingraham LM, Buetterick C, Haak RA. The influence of vitamin E onhuman polymorphonuclear cell metabolism and function. Ann NY Acad Sci 1982; 293:237–250.
57. Richards GA, Theron AJ, Van Rensburg CEJ, et al. Investigation of the effects of oral administrationof vitamin E and β-carotene on the chemiluminescence responses and the frequency of sister chromatidexchanges in circulating leukocytes from cigarette smokers. Am Rev Resp Dis 1990; 142:648–654.
58. Anderson R, Theron AJ, Myer MS, Richards GA, Savage JE. Vitamin E is a potent inhibitor ofsuperoxide generation by neutrophils activated with soluble, but not particulate stimuli of membrane-associated oxidative metabolism. J Nutr Immunol 1992; 1:43–63.
59. Steenbeck MJ, Khan AU, Karnovsky MJ. Intracellular singlet oxygen generation by phagocytosingneutrophils in response to particles coated with a chemical trap. J Biol Chem 1992; 267:13,425–13,433.
60. Van Antwerpen VL, Theron AJ, Richards GA, Van der Merwe CA, Van der Walt R, Anderson R.Relationship between the plasma levels of β-carotene and lung functions in cigarette smokers. IntJ Vir Nutr Res 1995; 65:231–235.
61. Van Antwerpen VL, Theron AJ, Richards CA, et al. Vitamin E, pulmonary functions and phagocyte-mediated oxidative stress in smokers and non-smokers. Free Rad Biol Med 1995; 18:935–941.
62. Chow CK, Aiiriess GR, Changchit C. Increased vitamin E content in the lungs of chronic cigarette-smoked rats. Ann NY Acad Sci 1989; 570:425–427.
63. Elsayed NM. Mobilization of vitamin E to the lung under oxidative stress. Ann NY Acad Sci 1989;570:439–440.
64. Trout DL. Vitamin C and cardiovascular risk factors. Am J Clin Nutr 1991; 53(Suppl):322S–325S.65. Hallfrisch J, Singh VN, Muller DC, Baldwin H, Vannon ME, Andres R. High plasma vitamin C
associated with high plasma HDL- and HDL2 cholesterol. Am J Clin Nutr 1994; 60:100–105.66. Gey KF, Puska P, Jordan P, Moser UK. Inverse correlation between plasma vitamin E and mortality
from ischemic heart disease in cross-cultural epidemiology. Am J Clin Nutr 1991;53(Suppl):326S–334S.
67. Riemersma RA, Wood DA, MacIntyre CCA, Elton RA, Gey KF, Oliver MF. Risk of angina pectorisand plasma concentrations of vitamins A, C and E and β-carotene. Lancet 1991; 337:1–5.
68. Jailal I, Veg GL, Grundy SM. Physiologic levels of ascorbate inhibit the oxidative modification oflow density lipoprotein. Atherosclerosis 1990; 82:185–191.
69. Harats D, Ben-Naim M, Dabach Y, et al. Effect of vitamin C and vitamin E supplementation on sus-ceptibility of plasma lipoproteins to peroxidation induced by acute smoking. Atherosclerosis 1990;85:47–54.
70. Salonen JT, lä-Herttuala S, Yamamoto R, et al. Autoantibody against oxidised LDL and progressionof carotid atherosclerosis. Lancet 1992; 339:883–887.
71. Fickl H, Van Antwerpen VL, Richards GA, et al. Increased levels of autoantibodies to cardiolipinand oxidized low density lipoprotein are inversely associated with plasma vitamin C in cigarettesmokers. Atherosclerosis 1996; 124:75–81.
72. May JM. How does ascorbic acid prevent endothelial dysfunction? Free Rad Biol Med 2000;28:1421–1429.
73. Rossig L, Hoffmann J, Hugel B, et al. Vitamin C inhibits endothelial cell apoptosis in congestiveheart failure. Circulation 2001; 104:2182–2187.
74. Richartz BM, Werner GS, Ferrari M, Figulla HR. Reversibility of coronary endothelial vasomotordysfunction in idiopathic dilated cardiomyopathy: acute effects of vitamin C. Am J Cardiol 2001;88:1001–1005.
75. Heller R, Unbehaun A, Schellenberg B, Mayer B, Werner-Felmayer G, Werner ER. L-ascorbic acidpotentiates endothelial nitric oxide synthesis via a chemical stabilization of tetrahydrobiopterin.J Biol Chem 2001; 276:40–47.
76. Smith AR, Visioli F, Hagen TM. Vitamin C matters: increased oxidative stress in cultured aorticendothelial cells without supplemented ascorbic acid. FASEB J 2002; 16:125–144.

Chapter 20 / Antioxidants and Disease 519
77. Nappo F, De Rosa N, Marfella R, et al. Impairment of endothelial functions by acute hyperhomo-cysteinemia and reversal by antioxidant vitamins. JAMA 1999; 281:2113–2118.
78. Carr AC, Frei B. Human neutrophils oxidize low density lipoprotein by a hypochlorous acid-dependent mechanism. The role of vitamin C. Biol Chem 2002; 383:627–636.
79. Lloberas NR, Torras J, Herrero-Fresneda I, et al. Postischemic renal oxidative stress induces aninflammatory response through PAF and oxidized phospholipids: prevention by anti-oxidant treat-ment. FASEB J 2002; 16:358–377.
80. Root-Bernstein R, Busik JV, Henry DN. Are diabetic neuropathy, retinopathy and nephropathycaused by hyperglycemic exclusion of dehydroascorbate uptake by glucose transporters? J TheoretBiol 2002; 216:345–359.
81. Lee IK, Kim HS, Bae JH. Endothelial dysfunction: its relationship to hyperglycemia and hyperlipi-demia. Int J Clin Prac 2002; 129(Suppl):59–64.
82. Price KD, Price CSC, Reynolds RD. Hyperglycemia–induced ascorbic acid deficiency promotesendothelial dysfunction and the development of atherosclerosis. Atherosclerosis 2001; 158:1–12.
83. Packer L. Health effects of nutritional antioxidants. Free Rad Biol Med 1993; 15:685,686.84. The Alpha-Tocopherol and Beta-Carotene Prevention Study Group. The effects of vitamin E and β-
carotene on the incidence of lung cancer and other cancers in male smokers. N Engl J Med 1994;330:1029–1035.
85. Greenberg ER, Baron JA, Tosteson TD, et al. A clinical trial of antioxidant vitamins to prevent col-orectal adenoma. N Engl J Med 1994; 331:141–147.
86. Jacbos EJ, Henion AK, Briggs PJ, et al. Vitamin C and vitamin E supplement use and bladder can-cer mortality in a large cohort of US men and women. Am J Epidemiol 2002; 156:1002–1010.
87. Engler MM, Engler MB, Malloy MJ, et al. Antioxidant vitamins C and E improve endothelial func-tion in children with hyperlipidemia—Endothelial assessment of risk from lipids in youth (EARLY)trial. Circulation 2003; 108:1059–1063.
88. Theron AJ, Richards GA, Myer MS, et al. Investigation of the relative contributions of cigarettesmoking and mineral dust exposure to activation of circulating phagocytes, alterations in plasmaconcentrations of vitamin C, vitamin E and β-carotene, and pulmonary dysfunction in South Africangold miners. Occup Environ Med 1994; 51:564–567.
89. Richards GA, Terblanche APS, Theron AJ, et al. Health effects of passive smoking in adolescentchildren. S Afr Med J 1996; 86:143–146.
90. Grimm RH Jr, Neaton JD, Ludwig W. Prognostic importance of the white blood cell count for coro-nary, cancer and all-cause mortality. JAMA 1985; 254:1932–1937.
91. Phillips AN, Neaton JD, Cook DG, Grimm RH, Shaper AG. Leukocyte count and risk of major coro-nary heart disease events. Am J Epidemiol 1992; 136:59–70.
92. Friedman GD, Selby JV, Quesenberry DP Jr. The leukocyte count: a predictor of hypertension. J ClinEpidemiol 1990; 43:907–911.
93. Phillips AN, Neaton JD, Cook DG, Grimm RH Shaper AG. The leukocyte count and risk of lungcancer. Cancer 1992; 69:680–684.
94. Friedman GD, Fireman BH. The leukocyte count and cancer mortality. Am J Epidemiol 1991;133:376–380.
95. De Labry LO, Campion EW, Glynn RJ, Vokonas PS. White blood cell count as a predictor of mor-tality: results over 18 years from the normative aging study. J Clin Epidemiol 1990; 43:153–157.
96. Van Antwerpen VL, Theron AJ, Richards GA, et al. Plasma levels of β-carotene are inversely correlatedwith circulating neutrophil counts in young male cigarette smokers. Inflammation 1995; 19:405–414.
97. Kalner AB, Hartmann D, Hornig DH. On the requirements of ascorbic acid in man: steady-stateturnover and body pool in smokers. Am J Clin Nutr 1981; 34:1347–1355.
98. Frei B, England L, Ames BN. Ascorbic acid is an outstanding anti-oxidant in blood plasma. ProcNatl Acad Sci USA 1989; 86:6377–6381.
99. Howard DJ, Ota RB, Briggs LA, Hampton H, Pritsos CA. Oxidative stress induced by environmen-tal smoke in the workplace is mitigated by antioxidant supplementation. Cancer Epidemiol BiomarkPrev 1998; 7:981–988.
100. Fletcher RH, Fairfield KN. Vitamins for chronic disease prevention in adults–Clinical applications.JAMA 2002; 287:3127–3129.
101. Hunt C, Chakravorty NK, Annan G, Habibizadeh N, Schorah CJ. The clinical effects of vitamin Csupplementation in elderly hospitalised patients with acute respiratory infections. Int J Vitamin NutrRes 1994; 64:212–219.

520 Part VI / Prevention of Major Disabilities
102. Nathens AB, Neff MJ, Jurkovich GJ, et al. Randomized, prospective trial of antioxidant supplemen-tation in reducing the rate of pulmonary morbidity and organ dysfunction in critically ill patients.Ann Surg 2002; 236:814–822.
103. Plitt ML, Theron AJ, Fickl H, van Rensburg CEJ, Pendel S, Anderson R. Influence of antimicrobialchemotherapy and smoking status on the plasma concentrations of vitamin C, vitamin E, β-caroteneacute phase reactants, iron and lipid peroxides in patients with pulmonary tuberculosis. Int J TubercLung Dis 1998; 2:590–596.
104. Madebo T, Lindtjorn B, Aukrust P, Berge RK. Circulating antioxidants and lipid untreated tubercu-losis patients in peroxidation products in Ethiopia. Am J Clin Nutr 2003; 78:117–122.
105. Nuorti JP, Butler JC, Farley MM, et al. Cigarette smoking and invasive pneumococcal disease.N Engl J Med 2000; 342:681–689.
106. Block G. Micronutrients and cancer: time for action? J Natl Cancer Inst (USA) 1993; 85:846–848.

From: Preventive Nutrition: The Comprehensive Guide for Health Professionals, Third EditionEdited by: A. Bendich and R. J. Deckelbaum © Humana Press Inc., Totowa, NJ
521
21 Nutritional Supplements and UpperRespiratory Tract Illnesses in YoungChildren in the United States
Linda A. Linday
KEY POINTS
● In the United States, children have lower blood levels than adults of eicosapentaenoicacid (EPA), an important ω-3 fatty acid that helps decrease inflammation; vitamin A,the “anti-infective” vitamin; and selenium (Se), a trace metal that is an intrinsic part ofglutathione peroxidase, an important free-radical scavenging enzyme.
● EPA, vitamin A, and Se are important in controlling inflammation and can be suppliedby oral nutritional supplements.
● Cod liver oil contains EPA (and other important ω-3 fatty acids), and vitamin A as wellas vitamin D.
● Fish oil contains ω-3 fatty acids (including EPA) but no vitamins.● Our clinical research demonstrates that daily supplementation with a flavored cod liver
oil (which meets European purity standards) and a children’s multivitamin-mineral withtrace metals, including Se, can decrease morbidity from upper respiratory tract ill-nesses, otitis media, and sinusitis in young children living in the United States.
● These supplements can be used by practitioners on an individual basis, when clinicallyindicated; the supplements can be purchased in the United States without a prescription.
● Socioeconomically disadvantaged children are at risk for micronutrient deficiencies.However, their families may not be able to afford to purchase these supplements, whichare not available through Medicaid, The Special Supplemental Nutrition Program forWomen, Infants and Children, or the Food Stamp Program.
● If our results are confirmed in larger studies, a system change will be needed to providethese supplements to nutritionally vulnerable, socioeconomically disadvantaged chil-dren living in the United States.
1. INTRODUCTION
Upper respiratory tract illnesses, otitis media (OM), and sinusitis are common andcostly disorders among young children living in the United States. Inflammation is a

key element in the pathophysiology of these disorders. This chapter discusses the roleof essential fatty acids, vitamins, and trace metals in the pathophysiology of inflamma-tion; reviews our clinical research on the use of a lemon-flavored cod liver oil (whichmeets European purity standards) and a children’s chewable multivitamin-mineral withSe for the prevention and adjunctive treatment of these disorders; reviews the history ofcod liver oil, including its importance in the discovery of vitamin D and the anti-infectiveproperties of vitamin A; and discusses the current clinical use of these supplements. Ifadditional research confirms the utility of these supplements in improving the health ofyoung children, the problem of access to these supplements by socioeconomically dis-advantaged children in the United States will need to be addressed.
2. BACKGROUND
2.1. Upper Respiratory Tract Illnesses, Otitis Media, and Sinusitisin Children in the United States
Children under age 5 yr had an average of 20.7 million ambulatory care visits peryear for upper respiratory conditions in the United States from 1993 to 1995, withanother 14.5 million visits per year for OM during the same time period (1). In additionto their cost, unnecessary health care visits for the treatment of colds generate a signif-icant number of inappropriate antibiotic prescriptions (2,3), although the situation isnow improving (4,5). Bacterial antibiotic resistance is considered to be a major publichealth problem in the United States, and an interagency federal action plan has identi-fied the decrease of unnecessary antibiotic prescriptions as critical to combating antimi-crobial resistance (6).
In 1996, Gates (7) estimated that the total annual cost of treating OM with effusionin the United States was $5 billion, including both direct and indirect costs. This esti-mate included the cost of surgical placement of tympanostomy tubes (ventilation tubesplaced in the tympanic membrane of the ear), a procedure that is commonly performedfor the treatment of this disorder (8). Frequent OM with effusion in early childhood maybe associated with later speech and language problems, although causative relationshipshave not been definitively established (9,10).
Sinusitis also is a common and costly condition (11); in 1996, overall health careexpenditures for sinusitis in the United States were estimated to be $5.8 billion, ofwhich $1.8 billion was for children age 12 yr or younger. The primary treatment ofsinusitis in children is medical management. Adenoidectomy may be helpful (12),although endoscopic sinus surgery is reserved for chronic, refractory cases (13,14).Chronic sinusitis has a major negative impact on the quality of life of children whosedisease is sufficiently severe to require endoscopic sinus surgery (15).
2.2. Viruses and VaccinesViral illnesses usually are brief and self-limited conditions. However, viral infec-
tions produce inflammation, enhance nasopharyngeal bacterial colonization andadherence, alter the host’s immune defenses, and are associated with bacterial com-plications, including acute OM (16), sinusitis, and pneumonia (17,18). Acute OMoccurs in about 20% of children with viral upper respiratory infections (17). Althoughviral vaccines are in development, the use of vaccines to prevent upper respiratorytract infections is hampered by the large number of different viruses causing these
522 Part VI / Prevention of Major Disabilities

infections (17). The US Advisory Committee on Immunization Practices voted to rec-ommend influenza vaccination for children ages 6 to 23 mo for the coming influenzaseason of 2004 to 2005; the impact of this recommendation remains to be seen (19).Despite the fact that Streptococcus pneumoniae is the most common cause of bacter-ial acute OM, the heptavalent pneumococcal polysaccharide conjugate vaccine onlyproduced a 6% reduction in the overall number of episodes of acute OM from anycause (20).
2.3. Free Radicals, Trace Metals, and InflammationFree radicals are molecules, or molecular fragments, with one or more unpaired elec-
trons in their outer orbit; they are highly reactive chemical entities that can initiateoxidative stress and damage lipid membranes by a process known as lipid peroxidation.Free radicals are important in the pathophysiology of inflammation; they can also dam-age proteins and DNA, and have been linked to numerous disease states (21). Thebody’s free-radical scavenging capacity is determined by the levels of free radical scav-enging enzymes, as well as their related trace metals and vitamins; this system protectsmembranes from peroxidation (21). The trace metals Se, zinc, copper, and manganeseare critical for the function of these enzymes; oral supplements of trace metals canincrease the activity of the free radical scavenging enzymes.
Glutathione peroxidase (GSH-Px) is one of the key enzymes in the protective free-radical scavenging system, and Se is a structural component of the active center ofGSH-Px (22). GSH-Px activity decreases during Se depletion and increases during Serepletion (22–24). Superoxide dismutase (SOD) is another important free-radical scav-enging enzyme. Two SOD isoenzymes have been identified in mammalian cells. Anisoenzyme containing copper and zinc has been found in the cytosol; the SOD isoen-zyme found in the mitochondria contains manganese. These isoenzymes are dependenton their respective trace metals for their activity (24). Vitamins, especially vitamins Aand C and the B vitamins, are important cofactors in this system. Other free-radicalscavenging enzymes include glutathione reductase, glutathione transferase, and catalase,discussed in refs. 24 and 25.
2.4. Essential Fatty AcidsFatty acids containing more than one double bond are classified as polyunsaturated
fatty acids (PUFAs). There are two series of PUFAs, the ω-3 and ω-6 fatty acids,named for the distance of the first double bond from the methyl end of the molecule(26). The two essential fatty acids (EFAs) are linoleic acid, the parent compound of theω-6 series, and α-linolenic acid, the parent compound of the ω-3 series. They are essen-tial because humans, like all mammals, cannot make them and must obtain them fromtheir diet. Once consumed, linoleic acid and α-linoneic acid may be elongated furtherand desaturated to form long-chain PUFAs (26). The ω-3 and -6 series are not inter-convertible in the human body; they are metabolically and functionally distinct, com-pete for the same enzymes, have opposing physiological functions, and their properbalance is important for homeostasis and normal development (26).
EPA and docosahexaenoic acid (DHA) are two important ω-3 fatty acids. The brainand retina are rich in DHA (27), which is necessary for normal visual and neural devel-opment (ref. 28; see Chapter 26). EPA is an important precursor of anti-inflammatoryeicosanoids, whereas the ω-6 fatty acids (especially arachidonic acid [AA]) are precursors
Chapter 21 / Supplements, URIs, and US Children 523

of inflammatory eicosanoids (29). The level of ω-3 fatty acids and other PUFAs islargely determined by diet, unlike proteins, whose structure is genetically determined(26,30).
Changes in dietary habits in the United States in the last 20 to 30 yr have markedlyincreased the amount of ω-6 EFA consumed (as in vegetable oils), whereas the amountof consumed ω-3 EFA (as in cod liver oil and fish oil) has decreased (26,31,32). Theoptimal ratio of ω-6/ω-3 EFA in the diet is 3 to 4:1; in the United States, it is currently10 to 20:1. This abnormal ratio has been linked with numerous disease states, especiallythose associated with inflammation. ω-3 fatty acid levels can be increased by eatingmore fatty fish and by consuming nutritional supplements such as cod liver oil, algal-derived long-chain fatty acids, or fish oils (26,31,32).
2.5. Inflammation in Animal Models of Otitis Media and SinusitisFree radical-induced lipid peroxidation may play a role in the acute (33–35) and
chronic inflammation (36) of a guinea pig model of acute, unilateral OM caused by infec-tion with S. pneumoniae. Inflammatory mediators have been demonstrated in both exper-imental and human middle ear effusions; these mediators include leukotrienes andprostaglandins, which are metabolites of AA and are derived from phospholipids in cellmembranes. Treatment with specific inhibitors of these mediators has prevented thedevelopment of OM in some animal models of OM (37). Free radicals are significantcomponents of the inflammatory response, which is part of the pathophysiology of pneu-mococcal infections (38) and the influenza A virus (39); the latter are important causes ofOM. Reactive oxygen species (ROS) (40) have also been implicated in sinusitis.
2.6. Nutritional Supplements and InfectionThe association between respiratory virus infections and acute OM in children is
well-established (41,42). Oral supplementation with EFAs (43) and zinc (44) has beenshown to decrease the incidence of respiratory infections in children. Trace elements(including zinc and Se) have been shown to have important effects on the regulation ofimmune responses (45). Supplementation with ω-3 fatty acids has been reported to bebeneficial in preventing infection in surgical patients (46). The importance of ω-3 fattyacids and trace metals (including zinc and Se) is already recognized in the relativelynew field of “immunonutrition” (47–49). The clinical efficacy of antioxidants in thetreatment of OM has been reported by two groups of Russian investigators (50,51). Ofinterest is the work of Ginsburg (52), who proposed that the main cause of tissue dam-age in infectious and inflammatory conditions is synergistic interactions among ROS,microbial hemolysins, enzymes, and cytokines.
2.7. Anti-Inflammatory Properties of AntibioticsAntibiotics may have anti-inflammatory actions in additional to their antibacterial
effects (53,54). Macrolide antibiotics, effective in the treatment of adults with chronicrhinosinusitis (55), have anti-inflammatory properties that contribute to this effect.However, the overuse of antibiotics is associated with the development of bacterialantibiotic resistance. In Finland, the prevalence of macrolide-resistant group A strepto-cocci diminished after the heavy use of macrolide antibiotics decreased (56). In this ageof antibiotic resistance, it is preferable to use antibiotics for their antibacterial effectsrather than as anti-inflammatory agents.
524 Part VI / Prevention of Major Disabilities

Chapter 21 / Supplements, URIs, and US Children 525
3. CLINICAL RESEARCH
3.1. Blood Levels of Fatty Acids, Trace Metals, and Vitamin AIn our first study (57), we obtained blood samples from 44 children undergoing clin-
ically indicated ambulatory surgery at The New York Eye & Ear Infirmary (NYEE).There were 39 subjects in the tympanostomy tube group (TT); these children wereundergoing placement of tympanostomy tubes for frequent ear infections and/or persis-tent middle ear effusion, with or without concomitant adenoidectomy and/or tonsillec-tomy. Their mean (± standard deviation [SD]) age was 3.8 ± 1.8 yr; 72% were male;approximately half were Hispanic and half were white; approximately half were privatepatients; and almost half were taking vitamin supplements.
The comparison group (COMP) was composed of children undergoing eye-musclesurgery as well as those undergoing ear, nose, and throat procedures such as bron-choscopy or laryngoscopy that did not involve the ears, adenoids, or tonsils. These sub-jects were slightly older, with a mean age of 5.7 ± 1.8 yr, and there was a lowerpercentage (20%) of private patients.
No demographical information was available for the six adults in the adult control group(AC), supplied by Ann Moser of the Peroxisomal Disease Section of the Kennedy KriegerInstitute Genetics Laboratory (Baltimore, Maryland). Data regarding red blood cell (RBC)fatty acids, trace metals, and vitamin A were available for subsets of these subjects.
3.1.1. RED BLOOD CELL FATTY ACIDS
The RBC fatty acid data are summarized in Table 1. The mean values for EPA werelower in both groups of NYEE children than in the ACs supplied by Kennedy Krieger.The mean RBC EPA values were: (a) TT = 0.31% ± 0.02% (standard error [SE]),(n = 16); (b) COMP = 0.31% ± 0.04% (SE), (n = 5); and (c) AC = 0.48% ± 0.4% (SE),(n = 6). These differences were statistically significant when analyzed by both para-metric (ANOVA, p < 0.002; F[2,24] = 8.336) and nonparametric (Kruskal-WallisANOVA by Ranks, p = 0.007; H[2, n = 27] = 9.924) tests. No other significant differ-ences in RBC fatty acids were noted among the three groups, although additional dif-ferences might become apparent with larger sample sizes.
In 1986, Japanese investigators reported lower plasma levels of ω-3 fatty acids inyoung normal and atopic children than in adults (58). They ascribed these findings todietary changes in Japan in the 30 yr prior to the study.
3.1.2. TRACE METALS
Data for plasma Se, zinc, and copper for the children in the TT group are summarizedin Table 2; data from the published literature for children (59) and adults (25) for theseparameters is also included, as are International System Units. There was no statisticallysignificant difference between the mean plasma Se for study subjects (TT = 110 ng/mL ±16.3 SD; n = 39) and the published values for children. Both groups of children had lowerSe levels than published values for adults (p < 0.005, ANOVA; F = 20.442; F[0.005]3140 = 4.47) (60). Statistical analyses were performed only for Se because only the vari-ances for Se were homogeneous (Bartlett’s test for homogeneity of variances (60).
3.1.3. VITAMIN AThe mean plasma vitamin A (retinol) level for the TT group was 39.1 μg/dL ± 10.8
(SD); (range: 23.6–72.1 μg/dL; n = 39). (Multiply conventional units by 0.0349 to convert

526 Part VI / Prevention of Major Disabilities
to international units [61]). Ballew (62) defined an inadequate vitamin A level as lessthan 20 μg/dL and a suboptimal vitamin A level as less than 30 μg/dL. The upper limitof the pediatric reference range for vitamin A is 80 μg/dL (61). Therefore, overall, thevalues for our subjects were within the reference range. Russell (63) stated that a vita-min A level of 40 μg/dL predicted normal dark adaptation 95% of the time; 69% (27/39)of our subjects had vitamin A levels less than or equal to 40 μg/dL, although parentsdenied symptoms of night blindness for all children. Our finding is consistent withBallew’s (62) report that the 75th percentile for serum retinol levels in children ages 4to 8 yr was 39.0 μg/dL. In addition, 15% (6/39) of our sample had suboptimal levels(<30 μg/dL), although none were inadequate (62). In this suboptimal group, five of sixchildren were not taking vitamin supplements, five of six children were Hispanic, fiveof six children were general service patients, and four of six children were female (allof whom were Hispanic). The overrepresentation of Hispanic children in the sub-group of children with suboptimal vitamin A levels was also consistent with previousreports (62).
On a group basis, there was no statistically significant difference in the mean vitaminA levels between the subgroup of children whose families reported that they were tak-ing vitamin supplements (39.7 μg/dL ± 11.6 SD; n = 17) and the subgroup of childrenwhose families reported that they were not taking vitamin supplements (38.7 μg/dL ± 10.4SD; n = 22). Our subjects took a variety of prescription and over-the-counter vitaminpreparations; no children were receiving or had taken cod liver oil; only one child in thefatty acid subgroup had a history of fish oil ingestion. Of the eight different children’svitamin preparations examined, all contained vitamin A palmitate, vitamin A acetate,and/or β-carotene.
Table 1Red Blood Cell Levels of Fatty Acids
Tympanosotomy Comparison Adult controltube group (NYEE group (NYEE groupa (Kennedy
Fatty acids children; n = 16) children; n = 5) Krieger; n = 6)
ω-6 18:2 ω-6 (linoleic) 9.35 ± 0.28 9.46 ± 0.50 8.55 ± 0.4520:3 ω-6 (dihomo-γ-linolenic) 1.57 ± 0.08 1.69 ± 0.15 1.70 ± 0.1420:4 ω-6 (AA) 15.94 ± 0.36 15.44 ± 0.64 16.36 ± 0.59ω-3 18:3 ω-3 (α-linolenic) 0.29 ± 0.06 0.23 ± 0.10 0.29 ± 0.0920:5 ω-3 (EPA) 0.31 ± 0.02b 0.31 ± 0.04b 0.48 ± 0.0422:6 ω-3 (DHA) 3.78 ± 0.33 3.65 ± 0.60 3.97 ± 0.54Total ω-6 33.49 ± 0.40 33.38 ± 0.72 32.31 ± 0.66Total ω-3 6.35 ± 0.36 6.10 ± 0.65 6.79 ± 0.60Total ω-9 13.56 ± 0.26 13.44 ± 0.47 13.76 ± 0.43
Data are mean percentage of total fatty acids ± SE.aAdult Control data supplied by Ann Moser of Peroxisomal Diseases Section of Kennedy Krieger
Institute Genetics Laboratory (Baltimore, Maryland).bValues for NYEE groups are less than those for adult control group; p = 0.007, Kruskal-Wallis analy-
sis of variance by ranks.NYEE, New York Eye and Ear Infirmary; AA, arachidonic acid; EPA, eicosapentaenoic acid; DHA,
docosahexaenoic acid.(Reprinted with permission from ref. 57.)

Chapter 21 / Supplements, URIs, and US Children 527
3.1.4. Summary of Blood-Level Data and Choice of Nutritional SupplementsThe blood-level data (57) revealed that (a) study children had lower levels of RBC
EPA than adult controls; (b) 69% of study children had plasma vitamin A (retinol) lev-els in the lower reference range, with 15% in the suboptimal range; and (c) study sub-jects, like other children, had lower levels of plasma Se than adults.
Therefore, for our clinical studies, we chose cod liver oil as a source of both vitaminA and EPA and used it in conjunction with a marketed children’s chewable multivita-min/mineral preparation containing Se. We specifically chose cod liver oil as a sourceof vitamin A on the basis of our blood-level data, which revealed no significant differ-ence in the vitamin A levels between the subgroups of children who were taking vita-min supplements and those who were not. Although we could have used fish oil as thesource of EPA, fish oil does not contain vitamin A or D. The detailed contents of thesesupplements are shown in Table 3. The vitamin A content of cod liver oil used in ourinitial pilot study on OM was 2000 to 2500 IU/teaspoon (5 mL); in the subsequent twostudies, the vitamin A content was decreased to 1000 to 1250 IU/5 mL.
3.2. Pilot Clinical Research on Otitis MediaTo explore the clinical utility of these supplements, we then performed an open-label
secondary prevention study, in which each child served as his or her own control (64). Westudied one OM season, from September 1, 2000 to March 31, 2001 (57). All childrenwere patients of the Soho Pediatrics Group, a private group practice in lowerManhattan, New York. Children were required to have had at least one episode of OMfrom September 1 to November 30, 2000 (the early portion of OM season under con-sideration). Children with a known allergy to fish were excluded.
Eight children were enrolled, ranging in age from 0.8 to 4.4 yr; seven wereCaucasian, half were female, and all families were English-speaking. After enroll-ment, subjects received 1 teaspoon of lemon-flavored Norwegian cod liver oil andone-half of a tablet of Carlson’s Scooter Rabbit chewable multivitamin-mineral(MVM) tablet per day (see Table 3). Mothers were instructed to crush the MVM
Table 2Plasma Levels of Selenium, Zinc, and Copper
Tympanostomy tube group Adult Long Adult West(57) (NYEE Island Jewish CoastChildren; Children (59) Controls (25) Controls (25)n = 39) (n = 83) (n = 12) (n = 14)
Selenium (ng/mL) 110 ± 16a 106 ± 18a 129 ± 22 142 ± 18(μmol/L) 1.40 ± 0.21 1.35 ± 0.23 1.64 ± 0.27 1.81 ± 0.23
Zinc (μg/mL) 0.9 ± 0.1 1.0 ± 0.2 1.3 ± 0.2 1.8 ± 0.5(μmol/L) 13.9 ± 2.0 15.3 ± 3.1 19.9 ± 3.1 27.5 ± 7.6
Copper (μg/mL) 1.3 ± 0.2 1.2 ± 0.3 1.1 ± 0.2 1.3 ± 0.5(μmol/L) 20.7 ± 3.3 18.8 ± 4.7 17.3 ± 3.1 20.4 ± 7.8
Data are mean ± SD.aChildren less than adults (p < 0.005, analysis of variance).(Reprinted with permission from ref. 57.)

528 Part VI / Prevention of Major Disabilities
tablet, measure the cod liver oil, and mix both in a small amount of food (such asapplesauce, yogurt, or rice cereal) to administer the supplements to their children.Parents were informed verbally and in writing that supplements were to be given onlyin the amounts required by the study and that study supplements were to be kept outof reach of children.
Table 3Contents of Supplements
Carlson’s lemon-flavored cod liver oil (1 teaspoon; 5 mL):ω-3 essential fatty acids:
DHA 500–550 mgEPA 460–500 mgα-Linolenic acid 45–50 mg
Vitamins:Vitamin A 1000–1250 IU: randomized pediatric sites (83)
1000–1250 IU: Sinusitis Pilot Study (81)2000–2500 IU: Otitis Media Pilot Study (57)
Vitamin D 400–500 IUVitamin E 1 IU
One-half of a tablet of Carlson’s Scooter Rabbit chewable vitamins and mineralsa:Vitamins:
Vitamin A (palmitate) 2500 IUVitamin D3 200 IUVitamin E 30 IUVitamin K 20 μgVitamin C 60 mgThiamin (B1) 0.75 mgRiboflavin (B2) 0.85 mgNiacin 2.5 mgVitamin B6 (pyridoxine) 1.0 mgFolate (folic acid) 100 μgVitamin B12 (cyanocobalamin) 3 μgBiotin 15 μgPantothenic acid 5 mg
Minerals:Calcium 25 mgIron 4.5 mgPhosphorus 11 mgIodine 37.5 μgMagnesium 12.5 mgZinc 3.75 mgSelenium 17.5 μgCopper 0.5 mgManganese 0.88 mgChromium 30 μgMolybdenum 19 μgPotassium 1.25 mgLemon bioflavenoids 5 mg (daily value not established)
aEquivalent to one tablet of Carlson’s new Mini Scooter Rabbit chewable vitamins and minerals. (Fromref. 57.)

Chapter 21 / Supplements, URIs, and US Children 529
Of the eight children who entered the study, one could not tolerate the taste of cod liveroil. The remaining seven children received antibiotics for OM for 12.3 ± 13.4 (p < 0.05;mean ± SD) fewer days during supplementation than before supplementation during theOM season under study (see Fig. 1). Five of seven subjects had no additional episodes ofOM during supplementation, although it had no apparent effect on established serousmiddle ear effusions in two children. However, because our study lacked a randomized,parallel control group, we could not exclude the possibility that the decreased antibioticusage we found might have occurred without the use of study supplements.
3.3. Effect of these Supplements on Upper Respiratory Pediatric Visits byYoung, Inner-City, Latino Children: Randomized Pediatric Sites
Based on our prior research (discussed in ref. 57) and the historical studies on codliver oil and upper respiratory illnesses (65), we hypothesized that use of the study sup-plements by young children would decrease their doctor visits for upper respiratory ill-nesses during the late fall, winter, and early spring. We studied the effect of daily use ofthese supplements on the number of pediatric visits by young, inner-city, Latino chil-dren from late autumn 2002 to early spring 2003 (83).
Fig. 1. Otitis Media Pilot Study: percent days of antibiotics. Subjects receivedantibiotics for OM for 12.3 ± 13.4 (SD) fewer days during supplementation (ON%)than before (BEFORE%); (p < 0.05, Wilcoxon Matched Pairs Test). (Reprinted withpermission from ref. 57.)

530 Part VI / Prevention of Major Disabilities
We did not have a matched placebo for liquid cod liver oil. Although adults and olderchildren can swallow capsules, infants and toddlers cannot. Furthermore, if capsuleswere cut open to administer the contents, the distinctive odor and taste of cod liver oilwould immediately become apparent (57).
The absence of a matching placebo for liquid cod liver oil precluded our performing aclassical double-blind, placebo-controlled study. Lack of a placebo coupled with the factthat cod liver oil can be purchased without a prescription by interested parties (57,66) ledus to choose a study design in which we randomized pediatric sites, rather than individualpatients. This type of design has been used in the worldwide studies of vitamin A supple-mentation, which are discussed in Subheading Section 5.3, that have included randomiza-tion by ward, household, village, or district (67). It was also used in a food-consumptionstudy to avoid changes in food habits resulting from knowledge of the other treatment (68).Randomized site design is commonly used in behavioral and educational studies where noplacebo is possible (69–72); a recent study of herd immunity and the pediatric heptavalentpneumococcal vaccine also used a randomized site design (73). To minimize the influenceof the study on the behavior of the participating families (69), we used a “no-contact” con-trol group (74,75), which has also been used in behavioral and educational studies.
The study was performed at Pediatrics 2000, a multisite, private, pediatric grouppractice in New York City. Two of the offices with similar demographics (low-incomeLatino families), located 1.1 miles apart in upper Manhattan, were randomized to a sup-plementation site and a medical records control site. Study participants were childrenages 6 mo to 5 yr of either gender and any race, religion, or nationality who werepatients enrolled at the two offices where the study was being performed. Study partic-ipants were required to be in New York City from enrollment through April 2003 (withthe exception of brief vacations), and to have some type of medical insurance. Patientswho routinely received additional health care at other practices or medical centers wereexcluded; children with known fish allergy, a chronic, life-threatening condition (suchas HIV/AIDS or cancer), feeding disorders, and epilepsy were also excluded. Studymaterials were available in both English and Spanish. Per practice routine, two profes-sional coders reviewed all charts from both sites, coded the visits, and entered the datainto a computer with NDC Medisoft™ Network Professional 7.02 software (76).
Participants in the medical records control group were enrolled from October 21 toNovember 10, 2002; those in the supplementation group were enrolled from November11 to December 12, 2002. We were unable to randomize enrollment at the two sitesbecause the lemon-flavored cod liver oil used in the study (which was manufactured inNorway) had been reformulated with less vitamin A (77) and was delayed in the USCustoms Office. The study follow-up/supplementation period ended on May 1, 2003.
A total of 94 children (47 at each site) were enrolled in the study. The mean age ofthe supplementation group was 2.03 yr (±1.04 SD), and the mean age of the controlgroup was 2.08 yr (±1.10 SD). There were no statistically significant differences in thedemographical characteristics of the study participants in the two groups: most wereLatino children from low-income families (as indicated by health insurance), and theirmothers were predominantly unmarried immigrants from the Dominican Republicwhose first language was Spanish.
Children of at least 1 yr of age received 1 teaspoon of Carlson’s lemon-flavored codliver oil per day and one-half tablet of Carlson’s Scooter Rabbit chewable MVM, thesame doses used in our previous research administered in the same manner (57).

Chapter 21 / Supplements, URIs, and US Children 531
However, the vitamin A content of the cod liver oil was approximately half that used inour first pilot study of OM (see Table 3). Thus, the full dose of supplements provided atotal of 3750 IU of vitamin A and 700 IU of vitamin D per day. However, in the currentstudy, the starting dose of supplements was halved for children ages 6 mo to 1 yr .Visitswere classified as upper respiratory visits, other illness visits, or visits not analyzed onthe basis of the ICD-9 visit code (78). The primary outcome measure was upper respi-ratory visits during the follow-up/supplementation period; other illness visits during thesame time period were considered as secondary outcome measures.
As shown in Figs. 2 and 3 and Table 4, the supplementation group had a statistically sig-nificant decrease in the mean number of upper respiratory visits over the course of thefollow-up/supplementation period (p = 0.042; r = 0.893; r2 = 0.797; y = 0.602 −0.002x),whereas the medical records control group had no change in this parameter (p = 0.999;r = 0.0006; r2 = 0.0000; y = 0.259 + 1.43 × 10⁻⁶x). There was no statistically significantchange in the mean number of other illness visits for either study group during the same timeperiod. Although there was a significant difference in the pattern of decreasing upper respi-ratory visits over time in the supplementation group, there was no difference in the totalnumber of visits made by the two groups. Data were analyzed on an intention-to-treat basis.
As reported by their parents, 70% of our subjects completed a 5- to 6-mo course oflemon-flavored cod liver oil. By comparison, only 47% of families reported compliance
Fig. 2. Randomized pediatric sites: the supplementation group had a statistically sig-nificant decrease in the mean number of upper respiratory visits over the course of thefollow-up/supplementation period (p = 0.042; r = 0.893; r2 = 0.797; y = 0.602 − 0.002x).(Reprinted with permission from ref. 83.)

532 Part VI / Prevention of Major Disabilities
with antibiotic prophylaxis for OM in a study of Latino children who attended an oto-laryngology clinic (79). Our favorable compliance rates may partly result from the factthat young children in the Dominican Republic are often given cod liver oil or similar sup-plements, although families rarely continue this practice after moving to the United States.
3.4. Adjunctive Therapy for Children With Chronic/Recurrent Sinusitis:Pilot Research
Inflammation and edema of the sinonasal mucosa are important in the pathophysiol-ogy of sinusitis. Based on our previous research and the similarities between OM andsinusitis (80), we hypothesized that these nutritional supplements would also be effec-tive adjunctive therapy for the treatment of children with chronic and/or recurrentsinusitis. Therefore, we performed a 4-mo, open-label, dose-titration study in whicheach patient served as his or her own control (64,81).
Study participants were private pediatric otolaryngology outpatients of Jay N. Dolitsky,MD, who resided in the New York Metropolitan area and had a clinical diagnosis ofchronic and/or recurrent sinusitis as well as symptoms of at least 3 mo of duration thatwere refractory to treatment with antibiotics. Subjects were between ages 2 and 18 yr, ofeither gender and any race, religion, or nationality. Children with known allergy to fish;chronic, life-threatening condition (such as HIV/AIDS or cancer); feeding disorder;
Fig. 3. Randomized pediatric sites: the medical records control group had no change inthe mean number of upper respiratory visits over the course of the follow-up/supple-mentation period (p = 0.999; r = 0.0006; r2 = 0.0000; y = 0.259 + 1.43 × 10⁻⁶x).(Reprinted with permission from ref. 83.)

Tab
le 4
Ran
dom
ized
Ped
iatr
ic S
ites
: Upp
er R
espi
rato
ry V
isit
s an
d O
ther
Illn
ess
Vis
its
Dur
ing
the
Follo
w-U
p/Su
pple
men
tati
on P
erio
d
Upp
er r
espi
rato
ry v
isit
sO
ther
ill
ness
vis
its
Supp
lem
enta
tion
Med
ical
rec
ords
Su
pple
men
tati
on
Med
ical
rec
ords
gr
oup
(n =
47)
cont
rol
grou
p (n
=47
)gr
oup
(n =
47)
cont
rol
grou
p (n
=47
)
No.
M
ean
No.
M
ean
No.
Mea
n N
o.
Mea
n D
ates
Stud
y da
ysof
vis
its
visi
ts/s
ubje
ctof
vis
its
visi
ts/s
ubje
ctof
vis
its
visi
ts/s
ubje
ctof
vis
its
visi
ts/s
ubje
ct
12/1
3/20
02to
1/9
/200
354
–81
210.
4512
0.26
30.
060
01/
10/2
003
to 2
/6/2
003
82–1
0914
0.30
160.
346
0.13
30.
062/
7/20
03to
3/6
/200
311
0–13
716
0.34
40.
096
0.13
20.
043/
7/20
03to
4/3
/200
313
8–16
58
0.17
180.
382
0.04
30.
064/
4/20
03to
5/1
/200
316
6–19
39
0.19
a11
0.23
b1
0.02
c2
0.04
d
ap
=0.
042;
r=
0.89
3; r
2 =
0.79
7; y
=0.
602
−0.
002x
bp
=0.
999;
r=
0.00
06; r
2 =
0.00
00; y
=0.
259
+1.
43×
10–6x
c p=
0.33
7; r
=-0
.550
; r2 =
0.30
3; y
=0.
160
−0.
61×
10−3
xdp
=0.
369;
r=
0.52
0; r
2 =
0.27
1; y
=0.
72×
10-3
+0.
31×
10−3
x(R
epri
nted
with
per
mis
sion
fro
m r
ef. 8
3.)
533

seizure disorder; known cystic fibrosis; aspirin-intolerant asthma; and family plans tomove outside the metropolitan area during the course of the study were excluded. Subjectswere enrolled from late January to early March 2003 and received supplements for 4 mofrom the time of enrollment. Primary endpoints were the number of doctor visits for acuterespiratory illnesses and the child’s sinus symptoms, which were quantified using a pedi-atric sinusitis symptom questionnaire (82).
The starting dose of supplements in the current study was the same as in our previousresearch (57): 1 teaspoon (5 mL) of Carlson’s lemon-flavored cod liver oil and one-half ofa tablet of Carlson’s Scooter Rabbit chewable multivitamin-mineral per day (providing atotal of 3750 IU of vitamin A and 700 IU of vitamin D per day). The vitamin A content ofthe cod liver oil was lower than in our first pilot study of OM (57) but was the same as thatused in our study of Latino children (83; see Table 3). Supplement doses could be doubledto an intermediate dose (providing 7500 IU of vitamin A and 1400 IU of vitamin D per day)within 2 to 3 wk . If higher doses were needed, cod liver oil was discontinued and fish oilwas administered instead (fish oil does not contain vitamin A or D). The maximum dose offish oil was 3 g/d, and the maximum dose of multivitamin-minerals was four half-tabletsper day (providing 10,000 IU of vitamin A and 800 IU of vitamin D per day). The titrateddoses of vitamins A and D were higher than those used in our previous study (57) but werewell-below the lowest daily toxic doses of these vitamins (61) (19,860 IU/d for vitamin Aand 2800 IU/d for vitamin D). The US Food and Drug Administration (FDA) considers fishoil at dosages up to 3 g per day as safe for adults and children (84).
Our four subjects were Caucasian males, ranging in age from 4.2 to 9.8 yr, withchronic/recurrent sinusitis for at least 3 yr prior to entry in the study. Three subjects had apositive response; one subject dropped out for administrative reasons. The responders haddecreased sinus symptoms, fewer episodes of acute sinusitis, and fewer doctor visits foracute illnesses at 4, 6, and 8 wk after beginning study supplements. Their parents reportedthat they had begun to recover from upper respiratory illnesses without complications,which was unusual for these children, as was improvement in springtime; their improve-ment had previously been limited to the summer months or periods of home-schooling.
Our findings are consistent with prior work by other clinical investigators. In a studyof upper respiratory tract infections in young children, Wald and colleagues (85) notedthat an inflamed respiratory mucosa may not completely recover between episodes ofinfection. Parsons (86) hypothesized that inflammation and edema of the sinonasalmucosa was the primary event in sinusitis, with bacterial infection as a secondaryphenomenon.
Chronic/recurrent sinusitis is a debilitating disorder that may require treatment withintravenous antibiotics and/or endoscopic surgery. Use of these supplements as adjunc-tive therapy for children with chronic/recurrent sinusitis is an inexpensive, noninvasiveintervention that clinicians can use for selected patients, pending the outcomes of defin-itive, large, well-controlled studies.
3.5. SafetyIn the 1930s, during the pre-antibiotic era, lipoid aspiration pneumonia was
reported with cod liver oil, mineral oil, and egg yolk, which were used at that time totreat sick and debilitated infants (87). In 1950, Caffey (88) reported vitamin A toxicityin children who were mistakenly treated with high-dose, long-term vitamin A admin-istered in highly concentrated fish liver oil preparations that were available at that
534 Part VI / Prevention of Major Disabilities

Chapter 21 / Supplements, URIs, and US Children 535
time. However, none of Caffey’s patients had received cod liver oil, and the highlyconcentrated fish liver oil preparations they received are no longer available in theUnited States.
In our clinical studies, parents were instructed to crush the half-tablet of MVM, mea-sure the cod liver oil, and mix both with a small amount of food (such as applesauce,yogurt, or rice cereal) before administering the supplements to their child. Additionally,parents were informed both verbally and in writing that supplements were to be givenonly in the amounts required by the study and that study supplements were to be keptout of reach of children. The principal investigator spoke Spanish, and all parental studymaterials were available in both Spanish and English. To date, we have not encounteredproblems with aspiration or overdose in our studies.
3.6. Implications for AsthmaThere is a clear association between viral respiratory infections and acute exacerba-
tions of asthma in both children and adults (17). There is also a link between sinusitisand asthma (89,90), with rhinovirus infections linked to both sinusitis and exacerbationsof asthma (90). Additionally, Latino children have a high incidence of asthma (91). Inview of the results of our studies (57,81,83), we believe that these supplements couldbe clinically useful for young children (particularly Latino children) with asthma, andwe are currently beginning to organize research in this area.
3.7. Nutritional Supplements for Socioeconomically Disadvantaged Childrenin the United States
Similarly to other countries worldwide (92), socioeconomically disadvantagedchildren in the United States are at risk for micronutrient deficiencies (57,62,93).Although the supplements used in our research can be purchased in the United Stateswithout a prescription, their cost may pose an excessive financial burden to low-income families.
Cod liver oil does not have a National Drug Code number, it is not available throughMedicaid in New York, and the children’s vitamins we have located that are availablethrough this system do not contain Se or other trace metals. Additionally, cod liver oilis not available through the United States Department of Agriculture (USDA) SpecialSupplemental Nutrition Program for Women, Infants and Children (WIC); our request forsuch availability can be found online at http://www.fns.usda.gov/wic/anprmcomments/ihp-06.pdf. Furthermore, purchase of vitamins with US food stamps is not permitted(see http://www.fns.usda.gov/fsp/faqs.htm#9). If our results are confirmed in largerstudies, a system change will be required to provide these supplements to nutritionallyvulnerable, socioeconomically disadvantaged children living in the United States.
4. HISTORICAL PERSPECTIVE
4.1. History of Cod Liver OilEgyptian and Greek physicians may have understood the value of liver (high in vita-
min A) for the treatment of night blindness, an early ocular manifestation of vitamin Adeficiency (94,95). The use of fish oils in medicine was mentioned by Hippocrates, andPliny discussed the use of dophin liver oil for the treatment of chronic skin eruptions (96).However, these classical physicians did not appear to know about the use cod liver oil.

536 Part VI / Prevention of Major Disabilities
The coastal fishermen of northern Europe apparently used cod liver oil for manyyears for the treatment of aches and pains (96,97). However, the first recorded use ofcod liver oil by physicians was from the Manchester Infirmary in England during the1780s (96,97), where it was found to be very effective for “old pains” and “rheuma-tism,” which were probably cases of osteomalacia (a bone disease of adults) (96). Thepattern of discovery was that the use of cod liver oil by fishing folk and peasants wasaccidentally observed by a physician, who then tried it and made it known to the medicalprofession (96).
Guy (96) states that there was no further mention of cod liver oil in the English med-ical literature until its revival in 1841 by Bennett, who had observed its use in Germany.Bennett reported that in Holland, cod liver oil had obtained a wide reputation as a curefor rickets (a bone disease of children) “long before its remedial properties wereacknowledged by physicians” (see ref. 97, p. 67). In the 1820s, Schenk and Schuette pub-lished independent reports in the German literature regarding the value of cod liver oilfor curing rickets (97), and Schuette reported that he used cod liver oil successfully for25 yr. Cod liver oil for the treatment of rickets was introduced in France by Trousseauin the 1830s (97). The demand for cod liver oil was so great that all types of substituteswere used, and reports of failure, contamination, and substitutes for cod liver oil beganto appear in the literature before the middle of the 19th century.
4.2. The Discovery of Vitamin AVitamin A was discovered as the result of a long, incremental process with contribu-
tions by numerous investigators (95,98). At the end of the 19th century and the begin-ning of the 20th century, nutritional theories were tested under well-controlledlaboratory conditions through the administration of experimental diets to animals, andspecific factors necessary for their growth and survival began to be identified. Duringthis time, Frederick Hopkins, at Cambridge University, proposed that there were “acces-sory factors” in foods that were necessary for life but that had not been previously iden-tified; Casimir Funk named these factors “vital amines” or “vitamines” (65).
In 1913, in the same issue of the Journal of Biological Chemistry, two groups inde-pendently reported the existence of a fat-soluble factor that was essential for the growthof rats (65,99–101). McCollum and Davis of the University of Wisconsin (99) demon-strated that after a certain age, the growth of rats was dependent on an ether extract fromeggs or butter. Using a different experimental diet, Osborne and Mendel (100), of YaleUniversity, found that there was an “essential accessory factor” in butter needed for thenormal growth of rats. This fat-soluble growth factor, originally termed “fat-soluble A,”soon became known as “vitamine A” (65).
4.3. The Discovery of Vitamin DThe discovery of vitamin D was closely tied to work on the prevention and treatment
of rickets. During the Industrial Revolution, rickets spread rapidly throughout Europe,particularly among the urban poor, who lived in the sunless alleys of factory towns andurban slums (97).
In 1918, Mellanby (102), an English physician and professor of pharmacology,reported the first animal model of rickets, which he developed in puppies. In a simple,two-page report to the Physiological Society, he noted that the daily administration of

Chapter 21 / Supplements, URIs, and US Children 537
foods such as butter, cod liver oil, or 500 cc of milk (among others) was effective in pre-venting rickets in his model, whereas casein and linseed oil were among the substancesthat were ineffective. Mellanby felt that rickets was a deficiency disease and stated that“the anti-rachitic accessory factor has characters related to the growth accessory factor[vitamin A], although it is not identical with the latter …” (ref. 102, p. xi). However,Mellanby was not able to distinguish these two factors; this was accomplished byMcCollum and his new collaborators at Johns Hopkins University.
In the 1920s, McCollum and his colleagues developed a rat model of rickets thatcould also be cured with cod liver oil. They were then faced with the same question thatperplexed Mellanby: Was the anti-rachitic factor vitamin A, or was it another substancewith a similar distribution as fat-soluble vitamin A (103)? It was known that the vitaminA-deficient animals in these studies often developed ocular abnormalities, includingdryness of the eyes, corneal ulceration, and blindness, similar to xeropthalmia inhumans (65). Additionally, Hopkins demonstrated that oxidation destroyed fat-solubleA (103). Using these facts, in 1922, McCollum and his colleagues (104) reported thatwhen cod liver oil was oxidized for 12 or 20 h, it could no longer cure xerophthalmia,although it could prevent rickets. Therefore, they concluded that the anti-xerophthalmicand the anti-rachitic properties were a result of two distinct substances, and that the anti-rachitic factor, which specifically regulated bone metabolism, was the more heat-stablefactor. Because this was the fourth vitamin to be discovered, McCollum’s group namedit vitamin D in 1925 (97).
The fact that both exposure to sunlight and cod liver oil could prevent or curerickets was perplexing and controversial (105). Careful experiments by Chick andcoworkers (103), working in Vienna from 1919 to 1922, confirmed the value ofboth cod liver oil and sunlight in the prevention and treatment of rickets in younginfants.
In 1919, Huldschinsky (97), a pediatrician in Berlin, used light from a mercury-vapor quartz lamp (which includes ultraviolet [UV] wavelengths) to cure four casesof advanced rickets in children with up to 2 mo of treatment. When Huldschinskyexposed one arm of a rachitic child to the UV irradiation, he found that the ricketsin the child’s other arm was cured to the same degree as in the exposed arm.Therefore, he concluded that phototherapy was not a local effect and speculated thatas a result of exposure to UV light, something was formed in the skin that was thencarried to other sites, where it had its anti-rachitic effect (105). In 1925, Hess andWeinstock (97) reached similar conclusions based on experimental work in animals.These theories were confirmed in 1936, when Windaus, working in Germany,demonstrated that skin contains the natural prehormone of vitamin D, which is con-verted to vitamin D3 when the skin is exposed to UV irradiation (including lightfrom a mercury-vapor lamp) (97).
4.4. Rickets and Respiratory DiseasesHistorical investigators were well-aware of an association between rickets and respi-
ratory diseases. In their 1917 paper on rickets, Hess and Unger stated that “rickets is apredisposing cause of these respiratory diseases (pulmonary tuberculosis, pneumonia,and whooping cough)” (ref. 106, p. 1583). In her 1927 paper on community control ofrickets, Eliot stated that “susceptibility to upper respiratory infections, such as colds,

538 Part VI / Prevention of Major Disabilities
bronchitis and pneumonia, is greatly increased in infancy and early childhood by rickets”(ref. 107, p. 114). Based on prior animal studies and clinical work by German investi-gators, Ellison discounted the contribution of vitamin D in the efficacy of cod liver oilfor measles. Nonetheless, he acknowledged that “it is possible that some adjuvant effectwas obtained from the co-operation of the two factors [vitamins A and D]” (ref. 108,p. 710). In a 1936 study of vitamins A and D (individually or combined) for childrenhospitalized with measles, Mackay noted “there is much to indicate that resistance toinfections is reduced in children suffering form an overt deficiency of either of thesevitamins [vitamin A or D]” (ref. 109, p. 127).
4.5. Cod Liver Oil for TuberculosisSemba noted that cod liver oil, a rich source of vitamins A and D, was used as a treat-
ment for tuberculosis for more than 100 yr (110). In the 1840s, Charlotte Brontë, theauthor of Jane Eyre, suffered from tuberculosis, and her treatment included cod liver oil(111). A 1917 textbook on tuberculosis, although recognizing that there was no specifictreatment for tuberculosis at that time, stated that “one of the oldest and best establishedremedies for the treatment of tuberculosis is cod liver oil” (ref. 112, p. 467); however,the mechanism of action of cod liver oil was unknown. The situation had changed littleby 1946, when Goldberg’s textbook stated that cod liver oil “has been used empiricallyfor many centuries in the treatment of pulmonary tuberculosis without any definiteknowledge of its action” (ref. 113, p. C-81). However, the use of cod liver oil for tuber-culosis faded as specific treatments were developed, and “cod liver oil” is not listed inthe index of a modern textbook on tuberculosis (114).
4.6. Historical Research on the Anti-Infective Properties of Vitamin AMellanby (see Section 4.3.) had a large colony of dogs that were maintained on exper-
imental diets. In 1926, Mellanby reported, “at one period in the course of my experimen-tal investigations on dogs, the work was greatly hampered by the development of aninflammatory condition of the lungs” (ref. 115, p. 518), which was bronchopneumonia.On postmortem examination, the pneumonia was largely restricted to the vitamin A-deficient dogs, and he speculated that this might be relevant to respiratory illness inchildren (65,115). In 1928, Green and Mellanby reported that a deficiency of vitaminA, but not vitamin D, caused increased infections in a rat model, leading them to callvitamin A an “anti-infective” agent; they speculated that this was related to the epithe-lial changes caused by vitamin A deficiency (116).
In 1932, Ellison (65,108) reported the results of a study of concentrated cod liver oilfor children who were hospitalized with measles. Ellison was aware of Mellanby’s workon the anti-infective properties of vitamin A and also knew that vitamin A deficiencydamaged epithelial cells in the respiratory tract (117,118). Ellison specifically chose tostudy measles because it was “a disease which attacks epithelial defences and whoseincidence is greatest in those members of the community who are most likely to be suf-fering from various grades of vitamin deficiency…the children of the poorest classes”(ref. 108, p. 709). He studied 600 children under age 5 yr who were admitted to theGrove Hospital (London) with measles. The cases were randomized by ward to treatmentwith a highly concentrated cod liver oil preparation or a control treatment of standardtreatment (no placebo was used). Treatment with cod liver oil reduced measles mortality

Chapter 21 / Supplements, URIs, and US Children 539
by approximately one-half, from 8.7% in the control group to 3.7% in the treated group(65,108). Based on animal studies and German clinical work, Ellison attributed the effi-cacy of cod liver oil to vitamin A, although he did concede that some adjuvant effectcould have been obtained from the cooperation of the two factors (108).
A subsequent study published in 1936 (65,109) reported that neither vitamins A andD together nor vitamin D alone had an effect on reducing the mortality rate frommeasles. However, the control mortality rate in this later study decreased to 2.6%, mak-ing it difficult to demonstrate an improvement.
By 1940, numerous studies had been conducted to evaluate the ability of vitamin A(usually given as cod liver oil) to decrease the incidence of respiratory infections. Theresults were mixed, with about half showing a positive impact and the rest demonstrat-ing no effect (65). However, cod liver oil did have a significant impact on decreasingindustrial absenteeism (65). In a 1935 study of cod liver oil for the prevention of thecommon cold in school children, the investigator was not able maintain a control groupgiven no supplements because enthusiastic families purchased cod liver oil for theirchildren outside of the study (65,66); this finding is relevant to our current work.
With the introduction of sulfa antibiotics and penicillin in the 1930s to 1940s (65), aswell as the improvements in diet in industrialized countries in the late 1930s, interest inanti-infective therapy shifted to antibiotics and away from vitamin A (98).
4.7. Fortification of Milk With Vitamin D and Synthetic Vitamin AIn the mid-1920s, UV radiation of food and a variety of other substances was demon-
strated to produce anti-rachitic properties (105). Steenbock patented the addition ofprovitamin D to foods followed by UV irradiation to produce anti-rachitic activity. Inthe 1930s, the addition of provitamin D2 to milk followed by UV irradiation was widelypracticed in the United States and Europe. Rickets was eradicated as a significant pub-lic health problem in the countries that used this vitamin D fortification process (105).
In the late 1940s, Otto Isler and his collaborators in Basel reported the synthesis ofall-trans-vitamin A from the inexpensive precursor β-ionone (95). In the same timeperiod, Arens and van Dorp (94) reported the synthesis of retinoic acid. Within a fewyears, the price of vitamin A fell 10-fold, and it became economically feasible to addvitamin A more generally to foods.
4.8. Cod Liver Oil in the United StatesDuring the latter part of the 19th century, cod liver oil was rarely used in America,
although the reason for this lack of use is not clear (96,97). However, there was a resur-gence in interest, and in 1917, Hess and Unger wrote, “For many years cod liver oil hasbeen regarded as the sovereign remedy for rickets” (ref. 106, p. 1583). They successfullyprevented rickets with cod liver oil in susceptible African-American babies in a low-income neighborhood in New York City (106,119). Hess urged officials to dispense codliver oil at the baby health stations at cost, but they declined because it would be too expen-sive, and they thought that additional milk would be preferable to cod liver oil (106).
Cod liver oil and sunlight were highly valued for the prevention of rickets, and nursestaught mothers of infants how to use these remedies for their infants (107). From the1920s to the 1940s, many children in the United States were given cod liver oil eachday (26,65) with orange juice (which was know to prevent scurvy). However, older

540 Part VI / Prevention of Major Disabilities
preparations of cod liver oil had an unpleasant taste, the quality of different preparationswas erratic (119), and medical professionals became concerned about lipoid aspirationpneumonia (87) and vitamin A toxicity (88). By the 1950s, cod liver oil had been largelyreplaced by synthetic vitamins in the United States; however, the latter do not containω-3 fatty acids, which have anti-inflammatory properties (26) and important effects onimmune function (47,120). In Norway, the Norwegian Nutrition Council continues torecommend supplementation with cod liver oil beginning at age 4 wk, because it pro-vides ω-3 fatty acids in addition to vitamin D (121).
5. THE MODERN ERA
5.1. Over-Fishing of the OceansBefore Columbus made his first voyage to America, Basque fisherman were secretly
fishing the massive stocks of cod and other groundfish off the New England coast(122,123). Their salt cod was a staple in Mediterranean markets, and cod was a staple ofthe European diet for more than 400 yr (122). Although fishermen exploited cod for cen-turies, the technological innovations of the 20th century led to the collapse of cod stocks inNorth America. Motorized boats dragged the ocean floor with massive trawl nets, destroy-ing both cod fish and their habitat. Factory ships with refrigeration have almost erased thelimit to the amount of cod that can be caught and sold internationally without spoiling(123); increasingly powerful and accurate sonar produces detailed readouts of nooks whereschools of fish may lurk; and shipping fleets can position themselves precisely through useof the satellites of the Global Positioning System (124).
Despite growing regulations on allowable catches and fishing equipment, cod stockshave continued to decrease across the North Atlantic. In 1992, the Canadian govern-ment declared a temporary moratorium on cod fishing; the moratorium was extended in1994. In 2003, with cod stocks showing no sign of recovery, the Canadian governmentbanned all cod fishing off its Eastern provinces and identified some cod populations asendangered. The US government also imposed restrictions on cod fishing (123).However, it is unclear whether North Atlantic cod stocks will recover.
5.2. Pollutants in the OceanThe level of polychlorinated biphenyls (PCBs) and dioxins in fish and fish oils has
become a concern as oceans have become progressively contaminated with industrialwaste. This issue was addressed in the United Kingdom and Europe by purity standards(125), which were revised and made more strict in 2002 (126). In the same year, the UKFood Standards Agency reported that exposure to dioxins had decreased by 75% overthe previous 20 yr and that the levels of dioxins and PCBs found in most of the samplesin their most recent fish oil survey were lower than in previous surveys that were per-formed in 1994 and 1996 (126). Mercury contamination of fish is also a concern, andthe FDA advises that young children and women of childbearing age should avoid tile-fish, swordfish, shark, and king mackerel because of their elevated levels of mercury(127). However, an analysis of US fish oil supplements revealed no detectable mercury,with a limit of detection of 0.1 μg of mercury per gram (128).
5.3. Modern Clinical Studies of Vitamin A SupplementationAfter a 40-yr hiatus, interest in the anti-infective properties of vitamin A was rekin-
dled in the 1980s by the observation of increased mortality in Indonesian children who

Chapter 21 / Supplements, URIs, and US Children 541
had vitamin A deficiency and xerophthalmia (65,129). The first symptom of eye diseasefrom vitamin A deficiency is night blindness; at this stage, Bitot’s spots (superficial,foamy gray, triangular spots) may be present on the conjunctiva (129,130). This is fol-lowed in later stages by xerophthalmia (dryness of the conjunctiva), keratomalacia(corneal ulceration), and blindness (77).
Since the 1980s, numerous studies have been performed regarding the effect of vita-min A supplementation on the health of children in developing countries. For a com-plete review of this subject, the reader is referred to Chapter 23, as well as reviews(110,131,132), and meta-analyses (67,133,134). For the purpose of this chapter, thefindings are summarized to provide a basis of comparison to the status of vitamin A inthe developed world as well as to provide a perspective on the results of our research.
Vitamin A supplementation of children in developing countries decreased overallchildhood mortality by about 30% (67,132). Community-based studies of vitamin A sup-plementation have indicated that it may decrease the severity, but not the incidence, ofdiarrhea (131). In children hospitalized with measles in the developing world, vitamin Asupplementation decreased mortality by an average of 60% (67,132,135); the decrease inmortality from measles-related pneumonia was particularly noteable (67). The modernstudies are consistent with the results of Ellison’s historical study of cod liver oil for chil-dren who are hospitalized with measles (see Section 4.6.). The role of vitamin A supple-mentation in measles is also consistent with the fact that infectious diseases that inducethe acute-phase response transiently depress serum retinol concentrations, that vitamin Adeficiency impedes the normal regeneration of mucosal barriers damaged by infection,and that it also diminishes the immune function of white blood cells (136,137).
However, several placebo-controlled trials have demonstrated that high-dose vitaminA supplementation is not effective in decreasing the severity of pneumonia in hospital-ized children in developing countries and that large doses of vitamin A may be harmfulwhen given to well-nourished children in these areas (132,134). Additionally, vitaminA supplementation is not effective for children who are hospitalized with pneumoniacaused by respiratory syncytial virus, which is a paramyxovirus similar to measles andan important cause of infantile bronchiolitis and pneumonia (138,139). In a multicenterstudy performed in the United States, patients who received vitamin A actually hadlonger hospital stays than those who received placebo (138).
Infection with HIV has become increasingly prevalent in many developing countries.Vitamin A supplementation of children younger than age 5 yr who are HIV-positivedecreases AIDS-related deaths as well as total mortality and morbidity from diarrhea(140). Small, frequent doses of vitamin A may be more protective than large, periodicdoses. Additionally, adequate dietary vitamin A intake is associated with a significantdecrease in mortality (141), diarrheal and respiratory infections (142), and stunting(143). New strategies in vitamin A supplementation in developing countries include tar-geting at-risk populations, improving dietary sources of vitamin A, using horticulturalapproaches, fortifying food, and addressing multinutrient deficiencies (140).
5.4. Nonclassical Functions of Vitamin DModern studies of vitamin D indicate that calcitriol (1,25 dihydroxyvitamin D), the
active form of vitamin D, has important nonclassical effects beyond the regulation of cal-cium metabolism. These include the modulation of hormone and cytokine production andsecretion as well as the regulation of proliferation and differentiation (144). Calcitriol, apotent inhibitor of human T-lymphocyte proliferation (145,146), and vitamin D analogs

542 Part VI / Prevention of Major Disabilities
have been shown to be effective in the prevention and treatment of some models of autoim-mune disease in rodents—particularly autoimmune diabetes in mice (144,147,148). In1997, Muhe and colleagues (110,149) reported the importance of nutritional rickets in thedevelopment of pneumonia in developing countries. This is consistent with the work of his-torical authors discussed earlier, who were also aware of this association.
5.5. Discrepancies in Vitamin A Status in the Developed WorldVitamin A deficiency that is severe enough to cause blindness is uncommon in the devel-
oped world (62). However, some segments of the US population, particularly socioeconomi-cally disadvantaged children (93) as well as African- and Mexican-American children (62),may have suboptimal levels of vitamin A. In 1932, Ellison recognized that children from low-income households were the most likely to have vitamin deficiencies (see Section 4.6.) (108).Consistent with these reports, in our original study, five of six children with suboptimal levelsof vitamin A were Hispanic general-service patients (57). Additionally, young children in theUnited States—particularly those in the toddler and preschool age groups—may not haveadequate dietary intakes of vitamin A (150).
In developed countries, high intakes of vitamin A (but not β-carotene) by pregnantwomen have been associated with teratogenesis (151), leading to recommendationsthat prenatal vitamins should contain no more than 8000 IU of preformed vitamin A(152). Additionally, high intakes of vitamin A by postmenopausal women in theUnited States (153) and 49- to 51-yr-old men in Sweden (154) have been associatedwith a higher risk of hip fractures. As a result, vitamin A supplementation and fortifi-cation of food with vitamin A in Western countries has been questioned (77). Asdiscussed under Section 3.3., the amount of vitamin A in Norwegian cod liver oil hasbeen reduced. Nonetheless, the Norwegian Nutrition Council continues to recommendsupplementation with cod liver oil beginning at age 4 wk, because it provides ω-3 fattyacids in addition to vitamin D (121).
5.6. Deficiencies of Multiple MicronutrientsNumerous investigators have stated that vitamin A deficiency rarely exists alone and
that it is usually accompanied by variety of other nutritional deficiencies(92,131,132,134,155–158). In a 1986 review, Mejía (92) noted that vitamin A deficiencyprimarily affects the world’s most underprivileged populations, which, because of theirlimited socioeconomic condition, also lack a variety of other essential nutrients. Heemphasized the importance of the interaction between nutrients and reviewed the estab-lished relationships of vitamin A status to protein, dietary fat, vitamin E, zinc, and iron(92). Mejía also mentioned the more controversial links of vitamin A to iodine metabo-lism; vitamins C, K, and D; calcium, and copper. Realizing that the relationships mightbe direct or indirect, he emphasized the importance of considering these interactions when“treating or preventing vitamin A deficiency both at the clinical and at the populationlevels” (ref. 92, p. 95). Olson (155) reported that deficiencies of various other nutrients,including protein, α-tocopherol (vitamin E), iron, and zinc, adversely affects the trans-portation, storage, and utilization of vitamin A. He also noted that the absorption of vita-min A and carotenoids is markedly reduced when diets contain very little fat (<5 g/d).
More recently, Villamor and Fawzi (132) stated that supplementation with vitamins andminerals in addition to vitamin A is likely to “reduce the burden of adverse health out-comes,” because of the physiological interactions between nutrients and overlapping

Chapter 21 / Supplements, URIs, and US Children 543
micronutrient deficiencies, including iron and zinc. Semba (98) noted that antenatal sup-plementation with multivitamins reduced fetal deaths and low birthweight in pregnantwomen who were infected with HIV, but vitamin A alone had no significant effect. Semba(110) also discussed the role that other deficiencies of vitamin D (149) and zinc (159) mayhave in susceptibility to respiratory infections. We agree with Semba, who stated that “furtherstudies are needed to address the use of vitamin Ain multi-micronutrient supplements, as thereis increasing evidence that other coexisting micronutrient deficiencies may limit the effi-cacy of vitamin A” (ref. 131, p. 105).
6. SUMMARY AND RECOMMENDATIONS
Our work is consistent with the historical uses of cod liver oil, vitamin A as the “anti-infective” vitamin, the link between rickets and respiratory tract infections, the modernunderstanding of immunomodulatory effects of vitamin D, the importance of ω-3 fattyacids and trace metals in decreasing inflammation, the clinical observation thatinflamed respiratory mucosa may not completely recover between episodes of infec-tion, and the current concept of the importance of multiple micronutrient deficiencies.
We have demonstrated that use of flavored cod liver oil (which meets European puritystandards) and a chewable children’s multivitamin-mineral with trace metals, includingSe, can decrease morbidity from upper respiratory tract illnesses, OM, and sinusitis inyoung children living in the United States. These supplements were particularly well-accepted by Latino families from the Caribbean, where use of cod liver oil is a culturaltradition. Currently, there is adequate information for practitioners to recommend the useof these supplements, when indicated, to their individual patients; information for practi-tioners and families is available online at http://www.drlinday.com. The supplements canbe purchased in the United States without a prescription. Further research is needed toevaluate the effect of the supplements on antibiotic prescription for these illnesses and toexplore their role as adjunctive therapy in asthma. Additionally, our findings need to beconfirmed in larger studies to facilitate large-scale, policy decision making.
Use of these supplements has the potential to improve children’s health and decreasethe cost of their health care. However, cod liver oil does not have a National Drug Codenumber and is not available through Medicaid in New York, and the children’s vitamins wehave located that are available through this system do not contain Se or other trace metals.Also, cod liver oil is not available through the USDA WIC Program; our request forsuch availability can be found online at http://www.fns.usda.gov/wic/anprmcomments/ihp-06.pdf. Furthermore, purchase of vitamins with US food stamps is not permitted(see http://www.fns.usda.gov/fsp/faqs.htm#9).
Socioeconomically disadvantaged children living in the United States are at risk formicronutrient deficiencies. Although the supplements used in our research can be pur-chased in the United States without a prescription, their cost may pose an excessivefinancial burden to low-income families. If our results are confirmed in larger studies,a system change will be needed to provide these supplements to nutritionally vulnerable,socioeconomically disadvantaged children living in the United States.
ACKNOWLEDGMENTS
This work was supported in part by the Department of Otolaryngology of The NewYork Eye and Ear Infirmary (New York, NY). J. R. Carlson Laboratories, (Arlington

544 Part VI / Prevention of Major Disabilities
Heights, IL) donated the nutritional supplements used in this research but had no otherrole in the design or conduct of the study. Information for practitioners and familiesregarding this research is available at http://www.drlinday.com.
REFERENCES1. Freid VM, Makuc DM, Rooks RN. Ambulatory health care visits by children: principal diagnosis
and place of visit. Vital Health Stat 1998; 13:1–23.2. Nyquist AC, Gonzales R, Steiner JF, Sande MA. Antibiotic prescribing for children with colds, upper
respiratory tract infections, and bronchitis. JAMA 1998; 279:875–877.3. Lee GM, Friedman JF, Ross-Degnan D, Hibberd PL, Goldmann DA. Misconceptions about colds
and predictors of health service utilization. Pediatrics 2003; 111:231–236.4. McCaig LF, Besser RE, Hughes JM. Trends in antimicrobial prescribing rates for children and ado-
lescents. JAMA 2002; 287:3096–3102.5. Finkelstein JA, Stille C, Nordin J, et al. Reduction in antibiotic use among US children, 1996–2000.
Pediatrics 2003; 112:620–627.6. Interagency Task Force on Antimicrobial Resistance: a public health action plan to combat antimi-
crobial resistance. Part 1: domestic issues. www.cdc.gov/drugresistance/actionplan. Accessed4/27/2004.
7. Gates GA. Cost-effectiveness considerations in otitis media treatment. Otolaryngol Head Neck Surg1996; 114:525–530.
8. Coyte PC, Croxford R, McIsaac W, Feldman W, Friedberg J. The role of adjuvant adenoidectomyand tonsillectomy in the outcome of the insertion of tympanostomy tubes. N Engl J Med 2001;344:1188–1195.
9. Bluestone CD, Klein JO. Otitis Media in Infants and Children. Second ed. W.B. Saunders,Philadelphia, 1995.
10. Paradise JL, Dollaghan CA, Campbell TF, et al. Language, speech sound production, and cognitionin three-year-old children in relation to otitis media in their first three years of life. Pediatrics 2000;105:1119–1130.
11. Ray NF, Baraniuk JN, Thamer M, et al. Healthcare expenditures for sinusitis in 1996: contributionsof asthma, rhinitis, and other airway disorders. J Allergy Clin Immunol 1999; 103:408–414.
12. Rosenfeld RM. Pilot study of outcomes in pediatric rhinosinusitis. Arch Otolaryngol Head NeckSurg 1995; 121:729–736.
13. Don DM, Yellon RF, Casselbrant ML, Bluestone CD. Efficacy of a stepwise protocol that includesintravenous antibiotic therapy for the management of chronic sinusitis in children and adolescents.Arch Otolaryngol Head Neck Surg 2001; 127:1093–1098.
14. Wald ER. Sinusitis in children. N Engl J Med 1992; 326:319–323.15. Cunningham JM, Chiu EJ, Landgraf JM, Gliklich RE. The health impact of chronic recurrent rhi-
nosinusitis in children. Arch Otolaryngol Head Neck Surg 2000; 126:1363–1368.16. Bluestone C, Klein J. Otitis Media, Atelectasis, and Eustachian Tube Dysfunction. In: Bluestone C, Stool
S, Kenna M, eds. Pediatric Otolaryngology. WB Saunders Philadelphia, 1996, pp. 388–582.17. Heikkinen T, Jarvinen A. The common cold. Lancet 2003; 361:51–59.18. Chonmaitree T, Heikkinen T. Viruses and acute otitis media. Pediatr Infect Dis J 2000;
19:1005–1007.19. O’Brien MA, Uyeki TM, Shay DK, et al. Incidence of outpatient visits and hospitalizations related
to influenza in infants and young children. Pediatrics 2004; 113:585–593.20. Eskola J, Kilpi T, Palmu A, et al. Efficacy of a pneumococcal conjugate vaccine against acute otitis
media. N Engl J Med 2001; 344:403–409.21. Halliwell B, Gutteridge J. Free Radicals in Biology and Medicine. Second ed. Clarendon Press,
Oxford, 1989.22. Zachara BA. Mammalian selenoproteins. J Trace Elem Electrolytes Health Dis 1992; 6:137–151.23. Cohen HJ, Chovaniec ME, Mistretta D, Baker SS. Se repletion and glutathione peroxidase—
differential effects on plasma and red blood cell enzyme activity. Am J Clin Nutr 1985; 41:735–747.24. Pippenger C, Meng X, Rothner A, Cruse R, Erenberg G, Solano R. Free Radical Scavenging Enzyme
Activity Profiles in Risk Assessment of Idiosyncratic Drug Reactions. In: Levy R, Penry J, eds.

Chapter 21 / Supplements, URIs, and US Children 545
Idiosyncratic Reactions to Valproate: Clinical Risk Patterns and Mechanisms of Toxicity. RavenPress, Ltd, New York, 1991, pp. 75–88.
25. Linday LA, Pippenger CE, Howard A, Lieberman JA. Free radical scavenging enzyme activity andrelated trace metals in clozapine-induced agranulocytosis: a pilot study. J Clin Psychopharmacol1995; 15:353–360.
26. Simopoulos AP. Omega-3 fatty acids in health and disease and in growth and development. Am JClin Nutr 1991; 54:438–463.
27. Morley R. Nutrition and cognitive development. Nutrition 1998;14:752-754.28. Carlson SE. Functional effects of increasing omega-3 fatty acid intake. J Pediatr 1997; 131:173–175.29. James MJ, Gibson RA, Cleland LG. Dietary polyunsaturated fatty acids and inflammatory mediator
production. Am J Clin Nutr 2000; 71:343S–348S.30. Horrobin DF. DNA-protein and membrane-lipid: competing paradigms in biomedical research. Med
Hypotheses 1995; 44:229–232.31. Erasmus U. Fats that Heal, Fats that Kill. Alive Books, Burnaby, Canada, 1993.32. Simopoulos AP. The importance of the ratio of omega-6/omega-3 essential fatty acids. Biomed
Pharmacother 2002; 56:365–379.33. Haddad J Jr. Lipoperoxidation as a measure of free radical injury in otitis media. Laryngoscope
1998; 108:524–530.34. Parks RR, Huang CC, Haddad J, Jr. Evidence of oxygen radical injury in experimental otitis media.
Laryngoscope 1994; 104:1389–1392.35. Takoudes TG, Haddad J, Jr. Hydrogen peroxide in acute otitis media in guinea pigs. Laryngoscope
1997; 107:206–210.36. Haddad J Jr., Egusa K, Takoudes TG. Effects of 21-aminosteroid U-74389G on acute otitis media in
a guinea pig model. Otolaryngol Head Neck Surg 1998; 118:44–48.37. Goldie P, Jung TT, Hellstrom S. Arachidonic acid metabolites in experimental otitis media and
effects of anti-inflammatory drugs. Ann Otol Rhinol Laryngol 1993; 102:954–960.38. Tuomanen EI. Pathogenesis of pneumococcal inflammation: otitis media. Vaccine2000; 19(Suppl
1):S38–S40.39. Julkunen I, Melen K, Nyqvist M, Pirhonen J, Sareneva T, Matikainen S. Inflammatory responses in
influenza A virus infection. Vaccine 2000; 19(Suppl 1):S32–S37.40. Doner F, Delibas N, Dogru H, Sari I, Yorgancigil B. Malondialdehyde levels and superoxide dismu-
tase activity in experimental maxillary sinusitis. Auris Nasus Larynx 1999; 26:287–291.41. Pass RF. Respiratory virus infection and otitis media. Pediatrics 1998; 102:400,401.42. Pitkäranta A, Virolainen A, Jero J, Arruda E, Hayden FG. Detection of rhinovirus, respiratory syn-
cytial virus, and coronavirus infections in acute otitis media by reverse transcriptase polymerasechain reaction. Pediatrics 1998;102: 291–295.
43. Venuta A, Spano C, Laudizi L, Bettelli F, Beverelli A, Turchetto E. Essential fatty acids: the effectsof dietary supplementation among children with recurrent respiratory infections. J Int Med Res 1996;24:325–330.
44. Sazawal S, Black RE, Jalla S, Mazumdar S, Sinha A, Bhan MK. Zinc supplementation reduces theincidence of acute lower respiratory infections in infants and preschool children: a double-blind,controlled trial. Pediatrics 1998; 102:1–5.
45. Chandra R, Dayton D. Trace element regulation of immunity and infection. Nutr Res 1982;2:721–733.
46. Bower RH, Cerra FB, Bershadsky B, et al. Early enteral administration of a formula (Impact) sup-plemented with arginine, nucleotides, and fish oil in intensive care unit patients: results of a multi-center, prospective, randomized, clinical trial. Crit Care Med 1995; 23:436–449.
47. Alexander JW. Immunonutrition: the role of omega-3 fatty acids. Nutrition 1998; 14:627–633.48. Hummell DS. Dietary lipids and immune function. Prog Food Nutr Sci 1993; 17:287–329.49. Levy J. Immunonutrition: the pediatric experience. Nutrition 1998; 14:641–647.50. Karabaev KE, Antoniv VF, Bekmuradov RU. [Pathogenetic validation of optimal antioxidant therapy
in suppurative inflammatory otic diseases in children]. Vestn Otorinolaringol 1997; 1:5–7.51. Khakimov AM, Arifov SS, Faizulaeva FN. [Efficacy of antioxidant therapy in patients with acute
and chronic purulent otitis media]. Vestn Otorinolaringol 1997; 5:16–19.52. Ginsburg I. Could synergistic interactions among reactive oxygen species, proteinases, membrane-
perforating enzymes, hydrolases, microbial hemolysins and cytokines be the main cause of tissuedamage in infectious and inflammatory conditions? Med Hypotheses 1998; 51:337–346.

546 Part VI / Prevention of Major Disabilities
53. Darrow DH, Keithley EM. Reduction of endotoxin-induced inflammation of the middle ear bypolymyxin B. Laryngoscope 1996; 106:1028–1033.
54. Enomoto F, Ichikawa G, Nagaoka I, Yamashita T. [Evaluation of the effect of erythromycin on oti-tis media with effusion in experimental rat models]. Nippon Jibiinkoka Gakkai Kaiho 1996;99:1126–1135.
55. Wallwork B, Coman W, Feron F, Mackay-Sim A, Cervin A. Clarithromycin and prednisolone inhibitcytokine production in chronic rhinosinusitis. Laryngoscope 2002; 112:1827–1830.
56. Seppala H, Klaukka T, Vuopio-Varkila J, et al. The effect of changes in the consumption ofmacrolide antibiotics on erythromycin resistance in group A streptococci in Finland. Finnish StudyGroup for Antimicrobial Resistance. N Engl J Med 1997; 337:441–446.
57. Linday LA, Dolitsky JN, Shindledecker RD, Pippenger CE. Lemon-flavored cod liver oil and a mul-tivitamin-mineral supplement for the secondary prevention of otitis media in young children: pilotresearch. Ann Otol Rhinol Laryngol 2002; 111:642–652.
58. Sakai K, Ueno K, Ogawa Y, Okuyama H. Fatty acid compositions of plasma lipids in young atopicpatients. Chem Pharm Bull (Tokyo) 1986; 34:2944–2949.
59. Glauser TA, Titanic-Schefft M, Pippenger CE. Racial differences in free radical scavenging enzymeactivity in children. J Child Neurol 1999; 14:382–387.
60. Zar JH. Biostatistical Analysis. Prentice-Hall, Englewood Cliffs, NJ, 1974.61. Kleinman R, ed. Pediatric Nutrition Handbook. Fourth ed. American Academy of Pediatrics, Elk
Grove, Illinois, 1998.62. Ballew C, Bowman BA, Sowell AL, Gillespie C. Serum retinol distributions in residents of the
United States: third National Health and Nutrition Examination Survey, 1988–1994. Am J Clin Nutr2001; 73:586–593.
63. Russell RM. The vitamin A spectrum: from deficiency to toxicity. Am J Clin Nutr 2000;71:878–884.
64. Kazdin AE. Single-Case Research Designs. Oxford University Press, New York, 1982.65. Semba RD. Vitamin A as “anti-infective” therapy, 1920–1940. J Nutr 1999; 129:783–791.66. Tress EM. Vitamin “A” as a prophylactic against the common “cold” in groups of school children.
Am J Dig Dis Nutr 1935; 1:795–796.67. Fawzi WW, Chalmers TC, Herrera MG, Mosteller F. Vitamin A supplementation and child mortality.
A meta-analysis. JAMA 1993; 269:898–903.68. de Pee S, West CE, Muhilal, Karyadi D, Hautvast JG. Lack of improvement in vitamin A status with
increased consumption of dark-green leafy vegetables. Lancet 1995; 346:75–81.69. Community Intervention Trial for Smoking Cessation (COMMIT): summary of design and inter-
vention. COMMIT Research Group. J Natl Cancer Inst 1991; 83:1620–1628.70. Zucker DM, Lakatos E, Webber LS, et al. Statistical design of the Child and Adolescent Trial for
Cardiovascular Health (CATCH): implications of cluster randomization. Control Clin Trials 1995;16:96–118.
71. Arbes SJ, Jr., Sever M, Archer J, et al. Abatement of cockroach allergen (Bla g 1) in low-income,urban housing: A randomized controlled trial. J Allergy Clin Immunol 2003; 112:339–345.
72. English DR, Burton RC, del Mar CB, Donovan RJ, Ireland PD, Emery G. Evaluation of aid to diag-nosis of pigmented skin lesions in general practice: controlled trial randomised by practice. BMJ2003; 327:375.
73. O’Brien KL, Moulton LH, Reid R, et al. Efficacy and safety of seven-valent conjugate pneumococ-cal vaccine in American Indian children: group randomised trial. Lancet 2003; 362:355–361.
74. Jobe JB, Smith DM, Ball K, et al. ACTIVE: a cognitive intervention trial to promote independencein older adults. Control Clin Trials 2001; 22:453–479.
75. Ball K, Berch DB, Helmers KF, et al. Effects of cognitive training interventions with older adults: arandomized controlled trial. JAMA 2002; 288:2271–2281.
76. NDC Medisoft™ Network Professional program. Version 7.02. NDCHealth Physician Services; 2002.77. Lips P. Hypervitaminosis A and fractures. N Engl J Med 2003; 348:347–349.78. American Medical Association International Classification of Diseases, 9th Revision Clinical
Modification. Medicode, Chicago, 1997.79. Goldstein NA, Sculerati N. Compliance with prophylactic antibiotics for otitis media in a New York
City clinic. Int J Pediatr Otorhinolaryngol 1994; 28:129–140.80. Parsons DS, Wald ER. Otitis media and sinusitis: similar diseases. Otolaryngol Clin North Am 1996;
29:11–25.

Chapter 21 / Supplements, URIs, and US Children 547
81. Linday LA, Dolitsky JN, Shindledecker RD. Nutritional supplements as adjunctive therapy for chil-dren with chronic/recurrent sinusitis: pilot research. Int J Pediatr Otorhinolaryngol 2004; 68:785–793.
82. Garbutt JM, Gellman EF, Littenberg B. The development and validation of an instrument to assessacute sinus disease in children. Qual Life Res 1999; 8:225–233.
83. Linday LA, Shindledecker RD, Tapia-Mendoza J, Dolitsky JN. Effect of daily cod liver oil and amultivitamin-mineral with Se on upper respiratory pediatric visits by young, inner-city, Latino chil-dren: Randomized pediatric sites. Ann Otol Rhinol Laryngol 2004, in press.
84. Department of Health and Human Services, Food and Drug Administration: Substances affirmed asgenerally recognized as safe: Menhaden oil. Fed Reg1997; 62:30,751–30,757.
85. Wald ER, Guerra N, Byers C. Upper respiratory tract infections in young children: duration of andfrequency of complications. Pediatrics 1991; 87:129–133.
86. Parsons DS. Chronic sinusitis: a medical or surgical disease? Otolaryngol Clin NAm 1996; 29:1–9.87. Pierson JW. Pneumonia due to the aspiration of lipoids. JAMA 1932; 99:1163–1165.88. Caffey J. Chronic poisoning due to excess of vitamin A. Pediatrics 1950; 5:672–688.89. Goldsmith AJ, Rosenfeld RM. Treatment of pediatric sinusitis. Pediatr Clin N Am 2003;
50:413–426.90. Osur SL. Viral respiratory infections in association with asthma and sinusitis: a review. Ann Allergy
Asthma Immunol 2002; 89:553–560.91. Flores G, Fuentes-Afflick E, Barbot O, et al. The health of Latino children: urgent priorities, unan-
swered questions, and a research agenda. JAMA 2002; 288:82–90.92. Mejía LA. Vitamin A-nutrient interrelationships. In: Bauernfeind JC, ed. Vitamin A Deficiency and
Its Control. Academic Press, Orlando, 1986, pp. 69–100.93. Spannaus-Martin DJ, Cook LR, Tanumihardjo SA, Duitsman PK, Olson JA. Vitamin A and vitamin
E statuses of preschool children of socioeconomically disadvantaged families living in the mid-western United States. Eur J Clin Nutr 1997; 51:864–869.
94. Ross A. Vitamin A and retinoids. In: Shils M, Olson J, Shike M, Ross A, eds. Modern Nutrition inHealth and Disease. Ninth ed. Williams & Wilkins, Baltimore, 1999, pp. 305–327.
95. Olson JA. Vitamin A. In: Machlin LJ, ed. Handbook of Vitamins. Second ed. New York: MarcelDekker, 1991, pp. 1–57.
96. Guy RA. The history of cod liver oil as a remedy. A J Dis Children 1923; 26:112–116.97. Cone T, Jr. 200 Years of Feeding Infants in America. Ross Laboratories, Columbus, OH, 1976.98. Semba RD. Impact of vitamin A on immunity and infection in developing countries. In: Bendich A,
Deckelbaum RJ, eds. Preventive Nutrition: The Comprehensive Guide for Health Professionals.Third ed. Humana Press, Totowa, NJ, 2005, in press.
99. McCollum EV, Davis M. The necessity of certain lipins in the diet during growth. J Biologic Chem1913; 15:167–175.
100. Osborne TB, Mendel LB. The relation of growth to the chemical constitutents of the diet. J BiologicChem 1913; 15:311–326.
101. Marcus R, Coulston AM. Fat-Soluble Vitamins. In: Hardman JG, Limbird LE, eds. Goodman &Gilman’s The Pharmacological Basis of Therapeutics. 10th ed. McGraw-Hill, New York, 2001, pp.1773–1791.
102. Mellanby E. The part played by an “accessory factor” in the production of experimental rickets.J Physiol 1918; 52:xi–xii.
103. Rajakumar K. Vitamin D, cod-liver oil, sunlight, and rickets: a historical perspective. Pediatrics2003; 112:e132–e135.
104. McCollum EV, Simmonds N, Becker JE, Shipley PG. Studies on experimental rickets. XXI: an exper-imental demonstration of the existence of a vitamin which promotes calcium deposition. J BiologicChem 1922; 53:293–312.
105. Holick M. Vitamin D. In: Shils M, Olson J, Shike M, Ross A, eds. Modern Nutrition in Health andDisease. Ninth ed. Williams & Wilkins, Baltimore, 1999, pp. 329–345.
106. Hess AF, Unger LJ. Prophylactic therapy for rickets in a Negro community. JAMA 1917;69:1583–1586.
107. Eliot M. The New Haven demonstration of community control of rickets. Pub Health J 1926;17:114–116.
108. Ellison JB. Intensive vitamin therapy in measles. Br Med J 1932; 2:708–711.109. Mackay HMM, Linford HM, Mitman M, Wild MH. The therapeutic value of vitamins A & D in
measles. Arch Dis Childhood 1936; 11:127–142.

548 Part VI / Prevention of Major Disabilities
110. Semba RD. Vitamin A and immunity to viral, bacterial and protozoan infections. Proc Nutr Soc1999; 58:719–727.
111. Dubos R, Dubos J. The White Plague. Little, Brown, Boston, 1952, pp. 139–140.112. Pottenger FM. Clinical Tuberculosis. Vol. II. C. V. Mosby, St. Louis, 1917, pp. 467,468.113. Goldberg B. Medicinal, Symptomatic and Tuberculin Therapy. In: Goldberg B, ed. Clinical
Tuberculosis. Vol. One. F. A. Davis, Philadelphia, 1946, pp. C81,C82.114. Davies PDO, ed. Clinical Tuberculosis. Third ed. Arnold, London, 2003.115. Mellanby E. Diet and disease. Br Med J 1926; 1:515–519.116. Green HN, Mellanby E. Vitamin A as an anti-infective agent. Br Med J 1928; 2:691–696.117. Wolback SB, Howe PR. Tissue changes following deprivation of fat-soluble A vitamin. J Exp Med
1925; 42:753–777.118. Goldblatt H, Benischek M. Vitamin A deficiency and metaplasia. J Exp Med 1927; 46:699–707.119. Weick MT. A history of rickets in the United States. Am J Clin Nutr 1967;20:1234-1241.120. Zuin G, Principi N. Trace elements and vitamins in immunomodulation in infancy and childhood.
Eur J Cancer Prev 1997; 6(Suppl 1):S69–S77.121. The Norwegian National Council on Nutrition and Physical Activity: Feeding Recommendations for
Infants for Health Care Workers (in Norwegian). Norwegian Board of Health, Oslo, Norway, 2001.122. Kurlansky M. Cod: A Biography of the Fish That Changed the World. Penguin Books, New York, 1997.123. Bhargava M. The common cod. Blue Planet Quarterly, 2004, pp. 38–40.124. Broad WJ, Revkin AC. Overfishing imposes a heavy toll. The New York Times July 29, 2003.125. PCBs and dioxins—Food Standards Agency statement—16 November 2001. http://www.food.gov.uk/
news/pressreleases/pcbsanddioxins. Accessed 4/27/2004.126. Dioxin levels down, fish oil supplement survey finds—Food Standards Agency, June 21, 2002.
http://www.foodstandards.gov.uk/news/newsarchive/fishsupplement. Accessed 4/4/2004.127. Gorman J. Does mercury matter? Experts debate the big fish question. The New York Times July 29,
2003.128. Schaller JL. Mercury and fish oil supplements; Letter, April 13, 2001. http://medscape.com/
viewarticle/408125. Accessed 4/7/2004.129. Sommer A, Tarwotjo I, Hussaini G, Susanto D. Increased mortality in children with mild vitamin A
deficiency. Lancet 1983; 2:585–588.130. Dorland’s Illustrated Medical Dictionary. 28th ed. W. B. Saunders, Philadelphia, 1994.131. Semba R. Vitamin A and infectious diseases. In: Livrea M, ed. Vitamin A and retinoids: an update of bio-
logical aspects and clinical applications. Birkhauser Verlag, Basel (Switzerland), 2000, pp. 97–108.132. Villamor E, Fawzi WW. Vitamin A supplementation: implications for morbidity and mortality in
children. J Infect Dis 2000; 182:S122–S133.133. Glasziou PP, Mackerras DE. Vitamin A supplementation in infectious diseases: a meta-analysis. BMJ
1993; 306:366–370.134. Grotto I, Mimouni M, Gdalevich M, Mimouni D. Vitamin A supplementation and childhood mor-
bidity from diarrhea and respiratory infections: a meta-analysis. J Pediatr 2003; 142:297–304.135. Hussey GD, Klein M. A randomized, controlled trial of vitamin A in children with severe measles.
N Engl J Med 1990; 323:160–164.136. Ross AC, Stephensen CB. Vitamin A and retinoids in antiviral responses. FASEB J 1996;
10:979–985.137. Stephensen CB. Vitamin A, infection, and immune function. Annu Rev Nutr 2001; 21:167–192.138. Bresee JS, Fischer M, Dowell SF, et al. Vitamin A therapy for children with respiratory syncytial
virus infection: a multicenter trial in the United States. Pediatr Infect Dis J 1996; 15:777–782.139. Dowell SF, Papic Z, Bresee JS, et al. Treatment of respiratory syncytial virus infection with vitamin
A: a randomized, placebo-controlled trial in Santiago, Chile. Pediatr Infect Dis J 1996; 15:782–786.140. Villamor E, Mbise R, Spiegelman D, et al. Vitamin A supplements ameliorate the adverse effect of
HIV-1, malaria, and diarrheal infections on child growth. Pediatrics 2002;109:E6.140. Villamor E, Mbise R, Spiegelman D, et al. Vitamin A supplements ameliorate the adverse effect of
HIV-1, malaria, and diarrheal infections on child growth. Pediatrics 2002;109:E6.141. Fawzi WW, Herrera MG, Willett WC, et al. Dietary vitamin A intake and the risk of mortality among
children. Am J Clin Nutr. 1994; 59:401–408.142. Fawzi WW, Herrera MG, Willett WC, Nestel P, el Amin A, Mohamed KA. Dietary vitamin A intake
and the incidence of diarrhea and respiratory infection among Sudanese children. J Nutr 1995;125:1211–1221.

Chapter 21 / Supplements, URIs, and US Children 549
143. Fawzi WW, Herrera MG, Willett WC, Nestel P, el Amin A, Mohamed KA. Dietary vitamin A intakein relation to child growth. Epidemiology 1997; 8:402–407.
144. Mauricio D, Mandrup-Poulsen T, Nerup J. Vitamin D analogues in insulin-dependent diabetes mel-litus and other autoimmune diseases: a therapeutic perspective. Diabetes Metab Rev 1996; 12:57–68.
145. Rigby WF, Yirinec B, Oldershaw RL, Fanger MW. Comparison of the effects of 1,25-dihydroxyvit-amin D3 on T lymphocyte subpopulations. Eur J Immunol 1987; 17:563–566.
146. Rigby WF. The immunobiology of vitamin D. Immunol Today 1988; 9:54–58.147. Mathieu C, Laureys J, Sobis H, Vandeputte M, Waer M, Bouillon R. 1,25-Dihydroxyvitamin D3 pre-
vents insulitis in NOD mice. Diabetes 1992; 41:1491–1495.148. Mathieu C, Waer M, Laureys J, Rutgeerts O, Bouillon R. Prevention of autoimmune diabetes in
NOD mice by 1,25 dihydroxyvitamin D3. Diabetologia 1994; 37:552–558.149. Muhe L, Lulseged S, Mason KE, Simoes EA. Case–control study of the role of nutritional rickets in
the risk of developing pneumonia in Ethiopian children. Lancet 1997; 349:1801–1804.150. Stephens D, Jackson PL, Gutierrez Y. Subclinical vitamin A deficiency: a potentially unrecognized
problem in the United States. Pediatr Nurs 1996; 22:377–389, 456.151. Rothman KJ, Moore LL, Singer MR, Nguyen US, Mannino S, Milunsky A. Teratogenicity of high
vitamin A intake. N Engl J Med 1995; 333:1369–1373.152. Oakley GP, Jr., Erickson JD. Vitamin A and birth defects. Continuing caution is needed. N Engl J
Med 1995; 333:1414,1415.153. Feskanich D, Singh V, Willett WC, Colditz GA. Vitamin A intake and hip fractures among post-
menopausal women. JAMA 2002; 287:47–54.154. Michaelsson K, Lithell H, Vessby B, Melhus H. Serum retinol levels and the risk of fracture. N Engl
J Med 2003; 348:287–294.155. Olson JA. Recommended dietary intakes (RDI) of vitamin A in humans. Am J Clin Nutr 1987;
45:704–716.156. Norum K, James P. Discussion. Nutr Rev1994; 52:S74–S86.157. Wasantwisut E. Nutrition and development: other micronutrients’ effect on growth and cognition.
Southeast Asian J Trop Med Public Health 1997; 28:78–82.158. Muñoz EC, Rosado JL, Lopez P, Furr HC, Allen LH. Iron and zinc supplementation improves indi-
cators of vitamin A status of Mexican preschoolers. Am J Clin Nutr 2000; 71:789–794.159. Ruel MT, Rivera JA, Santizo MC, Lonnerdal B, Brown KH. Impact of zinc supplementation on mor-
bidity from diarrhea and respiratory infections among rural Guatemalan children. Pediatrics 1997;99:808–813.


From: Preventive Nutrition: The Comprehensive Guide for Health Professionals, Third EditionEdited by: A. Bendich and R. J. Deckelbaum © Humana Press Inc., Totowa, NJ
551
22 Micronutrients and Immunity in Older People
John D. Bogden and Donald B. Louria
KEY POINTS
● Placebo-controlled clinical trials, despite their limitations, are the best approach forstudying effects of micronutrients on immunity.
● High doses of some single nutrients may improve immunity in relatively short timeperiods (weeks to months), but persistence of these effects is not currently known. Highdoses of other micronutrients may adversely affect immunity.
● Some micronutrients may interfere with the beneficial effects of other micronutrientson immunity; this effect depends on relative doses.
● Low- to moderate-dose multivitamin/mineral supplements may require considerabletime (6 mo to 1 yr or more) before they enhance immune functions and potentiallyreduce susceptibility to infectious diseases, and the timing of their effects may differbetween men and women.
● High- and even low-dose micronutrient supplements may enhance immunity even inthe absence of evidence of underlying deficiencies.
● Micronutrient supplements are not a substitute for a good diet and regular exercise but,rather, are a complementary measure.
● Long-term ingestion of single nutrient supplements, especially at high doses, may havebeneficial and/or adverse effects on immunity and other outcomes.
1. INTRODUCTION
Aging has been described as a group of processes that promotes vulnerability to chal-lenges, thereby increasing the likelihood of death. Because there is evidence thatdepressed immunity can increase the risk of death, it is likely that changes in immunitywith age are key factors in the aging process (1).
Theories of aging include the free radical, programmed senescence, and immunolog-ical theories (1,2). Evidence for the immunological theory of aging is based largely onthe well-described changes that occur with age in various species that have been studied,including man, and on observations from cross-sectional studies that demonstrate an

552 Part VI / Prevention Major Disabilities
association between maintenance of good immune function and longevity (1,2). A lim-itation of this theory is that it lacks the universality of other theories, such as the free rad-ical theory of aging, because it is not applicable to lower organisms that do not havewell-developed immune systems. Of course, the complexity of aging may require theuse of more than one theory to understand it, and the various theories are not neces-sarily independent of one another. For example, there is evidence that demonstratesthat antioxidant nutrients that reduce free-radical damage can improve immunity inolder people (3), suggesting that the free radical and immunological theories may becomplementary.
2. AGING AND IMMUNITY
2.1. General Changes in Immunity With AgingIt is useful to distinguish between primary changes that develop as a result of the age-
dependent intrinsic decline of immunity and secondary changes that are the result of“environmental” factors such as prescription and nonprescription drug use, physicalactivity, and diet. In fact, Lesourd and Mazari (4) suggested that secondary, rather thanprimary, changes in immunity with age are more likely to explain the increased inci-dence and severity of infectious diseases in older people.
Changes in immunity with aging include inhibited T-lymphocyte functions,decreased antibody production and responses, increased autoimmune activity with com-promised self- and nonself-discrimination, and greater heterogeneity in immunologicalresponses (5–9). Regarding the latter, depressed T-cell function is the most common andmay begin as early as the sixth decade. However, T-cell dysfunction is neither inevitablenor predictable. For example, we (8) measured delayed hypersensitivity skin testresponses in 100 people ages 60 to 89 yr. We found that although 41% were anergic toa panel of seven skin-test antigens and an additional 29% were “relatively anergic”(responding to only one of the seven antigens), the remaining 30% were reactive,responding to two or more of the skin-test antigens, often with sizable reactions.
2.2. Specific Changes in Immunity With Aging2.2.1. INVOLUTION OF THE THYMUS
The most striking changes in immunity with increasing age are inhibited T-cell func-tions (Table 1). These are likely related to the well-known involution of the thymus (10).The differentiation process by which stem cells become T lymphocytes occurs in thethymus. It is a two-lobed structure in mammals, located in the thorax above the heart.
There are several stages in the process by which immature stem cells (pre-T cells)become mature T cells. These include migration to the thymus, where some cells arestimulated to grow and others die; differentiation, in which the mature phenotype ofT cells develops in the thymus, including surface expression of accessory molecules;positive selection, in which self-major histocompatibility complex (MHC)-restrictedT cells are selected and other cells rejected; and negative selection, which ensures thatsurviving mature T cells are self-tolerant. The selective survival or death of cells resultsin a self-MHC-restricted, self-antigen-tolerant, mature T-cell population (10).
The thymus is the principal site of T-cell maturation. Involution with age occurs soonafter puberty. Because some maturation of T cells continues throughout adult life, it islikely that a remnant of the thymus or some other tissue continues to effect T-cell

Chapter 22 / Immunity in Older People 553
maturation (10). However, because memory T cells have a long life span (20 yr or more)(10), the involution of the thymus does not cause compromised immunity in youngadults but is likely to contribute to depressed immunity as the time since thymic invo-lution increases.
The involution of the thymus prior to the peak reproductive years suggests that thisprocess may provide an evolutionary advantage. One hypothesis is that involution pro-vides a net benefit, because it reduces the risk of autoimmune reactions (11). Accordingto this theory, the increased risk of cancer or infectious diseases resulting from depressedcellular immunity is a detriment that is offset by a reduced risk of autoimmune diseasethat accompanies thymic involution. Although attractive, this theory of immunological“trade-offs” as an adaptation to aging requires additional supporting evidence.
An alternative hypothesis was proposed by Siskind (12), who suggested that adapta-tion to environmental pathogens occurs early in life and, thereafter, relative constancy ofimmune function rather than adaptability may be most beneficial. He further speculatedthat efforts to modify cellular immunity in later life (e.g., by pharmacological or nutri-tional means) possibly does more harm than good. Although interesting, this hypothesisis not widely supported and not consistent with the known association between goodcellular immunity and reduced morbidity and mortality in older individuals.
2.2.2. T-LYMPHOCYTE FUNCTIONS
Changes in T lymphocytes with aging include a shift in relative percentages of subpopu-lations and qualitative changes in cell surface receptors (13). In comparison to T cells fromyounger people, cells of the elderly are deficient in in vitro production of certain T-cellgrowth factors such as interleukin (IL)-2 and have a decreased ability to bind and respondto it (14–17). McMurray (15) outlined evidence that implicated nutrient-mediated effects atvirtually every step in the development and expression of T-cell immunity, from direct effectson the thymus and thymic hormone production through T-cell maturation and distribution,antigen reactivity, lymphokine production, and even composition of the T-cell membrane.
Delayed hypersensitivity skin test (DHST) responses involve T-lymphocyte prolifer-ation, production of IL-2 and other lymphokines, and infiltration of the test site withmononuclear cells, resulting in induration and erythema 24 to 72 h later; it is the T-cellparameter that is most consistently and profoundly affected by nutritional status (15).Reduced DHST responses are also the immune parameter most consistently associated
Table 1Some Specific Changes in Immunity With Aging
Involution of the thymusDecreased thymic hormone concentrationsDecreased DHST responsesDecreased IL-2 secretionDecreased LPRs to mitogensLower antibody titers after vaccinationIncreased serum autoantibodiesIncreased soluble IL-2RsReduced phagocytosis by polymorphonuclear leukocytesReduced intracellular killing by polymorphonuclear leukocytes
DHST, delayed hypersensitivity skin test; IL, interleukin; LPR, lymphocyte proliferative response; IL-2R,interleukin-2 receptor.

554 Part VI / Prevention Major Disabilities
with increased infectious disease morbidity and mortality from all causes in older peo-ple, as discovered by Meakins et al. (18); and Christou et al. (19) in surgery patients,and Wayne et al. (20) and Roberts-Thomson et al. (21) for initially healthy people ages60 yr or older.
In their investigation, Christou et al. (19) studied the relationship between presurgicalDHST responses and postsurgical sepsis-related death in 245 subjects with a median ageof 67 yr and a range in age of 24 to 98 yr. Initially, anergic subjects experienced signifi-cantly more postsurgical mortality than those who were reactive. Because all the subjectshad gastrointestinal cancers that prompted the decision to operate, it could be argued thatthe initial severity of the disease increased both the incidence of anergy and the risk ofdying postoperatively. Thus, initial disease severity could explain the apparent strong rela-tionship between preoperative DHST responses and postsurgical mortality. However, thestudy by Wayne et al. (20) did not possess this confounder, because they looked prospec-tively at healthy adults over a 10-yr period. In this investigation, the authors followed 273initially healthy subjects ages 60 yr or older who had no history of serious medical prob-lems. DHST responses to four recall antigens were measured at enrollment. Anergy (fail-ure to respond to any skin-test antigen) at enrollment in the study was associated with asignificantly increased risk of dying in the 10-yr follow-up period. For example, at the endof 10 yr, 89% of the initially reactive subjects were still alive, but 22% of the anergic sub-jects had died. The study demonstrates that anergy to skin-test antigens, even when pre-sent in healthy older people, is associated with subsequent increased all-cause mortality.The authors also found a 2.5-fold increase in cancer mortality in the initially anergic groupin comparison to the reactive group. However, this was not statistically significant,probably because of the relatively small number of cancer deaths observed.
Fig. 1. Kaplan-Meier curves of all-cause mortality for initially anergic and reactive olderpeople during 10 yr follow-up period. Subjects (n = 273) were aged 60 or older and appar-ently healthy at enrollment. Participants were considered anergic if their response to eachof four skin test antigens were less than 5 mm of induration. Most of the excess mortalityin the anergic group occurred within 5 yr of enrollment. (Adapted from Wayne et al. [20]).

Chapter 22 / Immunity in Older People 555
Evidence for the decline in T-cell function with age includes a considerable numberof studies that demonstrate reduced lymphocyte proliferative responses (LPRs) to mito-gens or antigens, as well as depressed DHST responses to recall antigens (7,16–23).Indeed, these two measures of T-cell function have been the most widely studied func-tional tests performed in conjunction with assessment of the effects of nutritional inter-vention on immunity. A problem with LPRs to mitogens is the considerable variabilityof these assays, even in laboratories with rigid quality-control procedures.
There is some evidence for changes in T-lymphocyte subsets with aging—particu-larly decreases in CD4+, increases in CD8+ cells, and decreases in the CD4+/CD8+ ratio(9). There also is evidence that lymphocyte subsets are altered in elderly people who areill. For example, Markewitz et al. (24) found that immunosuppression in cardiopul-monary bypass surgery patients ages 55 yr or older was associated with decreased CD4+
T cells and increases in CD8+ T cells. Higa et al. (25) found that increases in CD8+
T cells predicted a longer period of recovery after onset of acute herpetic pain duringherpes zoster infection. The increased incidence of this disease in older people isbelieved to result from the depressed cellular immunity that occurs with age (14).
Measurement of lymphocyte subsets is a key component in evaluation of immune func-tion (26,27). Knowledge of lymphocyte subset numbers (cells/milliliter and percent oftotal) allows determination of relationships between immune functions and the number andpercentage of cells responsible for these functions. This can permit one to distinguishbetween effects caused by increased numbers of a particular subgroup of cells vs enhancedactivity by the same number of cells. The latter could be related to antigen-binding capac-ity per cell. Indeed, changes in antigen-binding capacity per cell could be a mechanism bywhich micronutrients influence immune functions. However, the importance of changes inantigen-binding capacity per cell in declining immunity with age is largely unexplored.
2.2.3. OTHER IMMUNE SYSTEM CHANGES WITH AGING
There is some evidence for a decline in B-cell functions with age, although it is likelyrelated, at least in part, to the T-cell dependence of B-cell functions. Older people vac-cinated with tetanus toxoid, varicella-zoster, or hepatitis B antigens demonstrate reducedantibody production as well as a greater percentage of nonresponders compared toyoung adults. This may also be true after pneumococcal and influenza virus immunization,although the evidence is not as convincing (28).
Perskin and Cronstein (29) reported that aging produces alterations in neutrophilplasma membrane viscosity that may result in compromised neutrophil function andincreased susceptibility to infection with specific pyogenic bacteria. This is consistentwith studies of Nagel et al. (30), Shoham-Kessary and Gershon (31), and Corberand et al.(32) that suggest compromised in vitro activity of neutrophils from older people.Depending on the microorganism studied, the neutrophil activity that was depressedwas phagocytosis or intracellular killing.
A review by Makinodan et al. (33) suggested that although antigen-responsive cellssuch as B cells, monocytes, and natural killer cells are vulnerable to aging, T cells areclearly the most vulnerable. Therefore, most studies regarding nutrition, immunity, andaging have focused on T-cell functions.
Sen et al. (28) published an insightful review that distinguished between an increasedincidence vs greater severity of infectious diseases in elderly people. For example, theyreported an increased case-fatality ratio for bacterial meningitis and pneumococcalpneumonia in older people as well as an increased incidence of diseases such as urinary

556 Part VI / Prevention Major Disabilities
tract infections and varicella zoster. Other diseases such as influenza virus infection andGram-negative sepsis are both more frequent and more severe in older people. Theysuggested that in addition to changes in immunity with age, local urinary tract, respira-tory tract, and neurological changes possibly contribute to the increase in infectiousdisease morbidity and mortality in older people.
Relationships among the ILs, their receptors, and immunity have been discussedwidely in the recent literature. Of particular interest in the elderly is IL-2, because itsproduction is decreased in older individuals (9). Interestingly, soluble IL-2 receptor(IL-2R) levels are higher in older than in younger adults (34), and it has been suggestedthat this may be a factor in the decline of cellular immunity with age, because highserum concentrations of soluble IL-2R may compete with and decrease IL-2 binding toT-cell IL-2Rs and thereby compromise immunity (35,36). We found that serum IL-2Rconcentrations are relatively lower in physically active older people compared withsedentary seniors and that exercise/physical activity habits and multivitamin supple-mentation may interact to influence soluble serum IL-2R concentrations (37). We alsoverified the higher levels of soluble IL-2R in older people (unpublished data, 1998).
There may be a “survivor” aspect to the relationship between advanced age and immunecapacity. The oldest people, including centenarians studied by Sansoni et al. (38), tend tohave well-preserved immune functions, such as natural killer (NK) cell activity, that areoften better than those of 50- to 80-yr-olds. In addition, those above age 90 tend to havelower serum auto-antibody concentrations than those in the 60- to 80-yr range (14,39).Thus, enhanced immunity and reduced autoimmunity appear to be associated with the abilityto live to age 90 yr and beyond.
3. MICRONUTRIENTS AND IMMUNITY
3.1. Nutrition, Immunity, and AgingScrimshaw and San Giovanni (40) noted that infections, no matter how mild, can
adversely affect nutritional status, which in turn can compromise immunity and exac-erbate the effects of infection. They discussed evidence for the effects of variousmicronutrient deficiencies on immunity, including β-carotene; pyridoxine; folic acid;pantothenate; vitamins A, B12, C, D, and E; the trace elements iron, zinc, and copper;and magnesium. Generally, cell-mediated and nonspecific immune functions are moresensitive to single micronutrient deficiencies than humoral immunity.
Fraker (41) noted that the immune system is a large “organ” comprised of theblood, spleen, lymphatic system, thymus, and other components. Additionally, mil-lions of new immune system cells are produced daily. Its large size and high cellularturnover combine to make the immune system a major consumer of nutrients.Therefore, it is not surprising that some aspects of immunity are very sensitive tonutritional deficiencies.
One key issue is whether the decline in immunity with aging results, at least in part,from nutritional deficiencies and/or increased requirements. Another possibility is thatmicronutrient supplementation might improve immunity even in the absence of anunderlying “deficiency,” defined by factors such as low circulating nutrient concentrationsor consistently low intakes.
Human studies of protein-calorie malnutrition in underdeveloped countries or in hos-pitalized adults demonstrate a causal association between undernutrition and secondary

Chapter 22 / Immunity in Older People 557
immunodepression that results in diminished resistance to infectious diseases(14,15,42,43). This association is consistent enough to permit the use of DHST respon-ders as a predictor of clinical prognosis in medical and surgical patients (19). Thus,there appears to be little doubt that severe malnutrition has a major impact on resistanceto disease that is partly mediated through the immune system. There is also evidencethat moderate-to-marginal undernutrition may compromise immunity (44,45).
McMurray (15) noted that dietary deficiencies, both moderate and severe, of specificnutrients profoundly altered cell-mediated immune responses in humans and experi-mental animals. Diets with inadequate contents of calories, protein, vitamin A, pyri-doxine, biotin, or zinc can result in depressed production of thymic hormones criticalfor T-lymphocyte differentiation. Reduced numbers and depressed in vitro function ofT cells also have been reported in experimental deficiencies of zinc, copper, iron, andvitamins A and E. Depressed DHST responses are a consistent result of dietary inade-quacies of protein, pyridoxine, iron, zinc, and vitamins A and C.
The classic review by Beisel (46) extensively examined the literature up to 1982 onsingle nutrients and immunity. The water-soluble vitamins that appear to be most criti-cal for maintaining immunity are vitamin B6, folate, vitamin B12, and vitamin C.Among the lipid-soluble micronutrients, vitamins A and E appear to exert the most sig-nificant impacts. Recent studies have shown that vitamin D is also an important immunemodulator. Trace metals that exert substantial influences on immune functions are iron,zinc, selenium, and copper (15,46).
Because the variability in immune responses increases with aging, subgroups thathave impaired immunity because of nutrient deficiencies are more likely to be observedin the elderly than in other age groups. Additionally, when episodes of nutritional vul-nerability overlap with suboptimal immune function, an adverse synergistic interactionis possible (15). These factors make it more rewarding to study nutrition–immunityrelationships in older rather than younger adults. Beisel (47) noted that individual stud-ies of immunity in humans were not systematic or comprehensive. This is no doubt dueto the very considerable expense that would be incurred in studying multiple immuneresponses in a sizeable number of older people.
It can be useful to compare relationships between nutrition and immunity in olderpeople with those of people with diseases in which immune functions are compromised.In the case of HIV infection, we (48) found that compromised nutritional and antioxi-dant status began early in the course of infection and possibly contributed to diseaseprogression. This observation can be compared to the decline in cellular immunity thatbegins in many older people in the fifth or sixth decade and eventually is associatedwith a reduced life span (2,5,20).
3.2. Cross-Sectional Studies on Micronutrient Nutrition and ImmunityGoodwin and Garry (49) compared immunological functions of healthy elderly New
Mexico residents consuming higher than Recommended Daily Allowance (RDA) lev-els (five times the RDA or greater) of micronutrients with similar individuals not takingsupplements. Micronutrients evaluated were vitamins A, C, D, and E, the B vitamins,iron, calcium, and zinc. There was no significant difference between the two groups inDHST responses or in vitro LPRs to mitogens. The authors suggested that the immune-enhancing properties of high doses of vitamins might be the result of a nonspecificadjuvant effect that does not persist with time.

558 Part VI / Prevention Major Disabilities
More recently, the same authors (50) studied 230 healthy older men and women todetermine if subclinical micronutrient deficiencies could contribute to the depressedimmunity found in many of the elderly. Immune functions studied included DHSTresponses, in vitro LPRs to phytohemagglutin (PHA), lymphocyte counts, and levels ofserum auto-antibodies. Spearman correlation coefficients were calculated to assess asso-ciations between blood micronutrient concentrations and selected immune functions.The authors also compared subjects with the lowest responses to those with the highest.There were no significant associations between low serum micronutrient concentrationsand immune functions, and the authors suggested that subtle nutrient differences did notappear to contribute to the immunodeficiency of aging. However, the population samplestudied was relatively affluent; people taking prescription drugs or daily over-the-countermedications, as well as those with a serious medical problem, were excluded. Therefore,the study may have excluded those subjects who might benefit most from micronutrientsupplements. Kawakami et al. (51) studied 155 healthy subjects ages 20–99 yr and sug-gested that cell-mediated immunity was reduced as a result of malnutrition.
In a more recent study, (52) we examined relationships between immunity anddietary and serum antioxidants, B vitamins, essential trace metals, and serum homo-cysteine in 65 older men and women ages 53 to 86 yr. Subjects who had used vitaminor mineral supplements in the preceding 3 mo were excluded. Soluble serum IL-2R con-centrations (sIL-2R) were positively associated with body mass index and serum concen-trations of homocysteine and vitamin B6 and negatively associated with serum β-caroteneand dietary lycopene. In a multiple regression model, these five factors explained 52% ofthe variability in sIL-2R. A total of 25% of subjects displayed anergy to a panel of sevenrecall skin antigens, and these responses were negatively associated with T-helper cellnumber, suggesting the reduced numbers of the latter was a possible factor that may havecontributed to the anergy of the subjects. T-helper cell numbers were positively associatedwith serum copper, and NK cell numbers were positively associated with dietary folateand vitamin B6. The results document relationships between nutrition and immunity andsuggest that IL-2 may be influenced by dietary antioxidants and B vitamins, includingthose that modify homocysteine metabolism.
The studies mentioned earlier were not attempts to intervene by provision of micronu-trient supplements; rather, they were assessments of associations between the subjects’usual intakes or blood concentrations and selected immune functions. Variables that can-not be controlled in cross-sectional studies may mask associations between nutritionalfactors and immunity, especially because immunity is likely to be dependent on a num-ber of factors, only one of which is nutritional status. Such studies are valuable as a wayto identify nutrients for more intensive study but can only provide statistical associationsthat may not be cause–effect relationships. The latter can be assessed by standardplacebo-controlled, double-blind clinical trials.
3.3. Clinical Trials of Single MicronutrientsSeveral clinical trials have been conducted in recent years. These have included
depletion—repletion studies in young volunteers and provision of micronutrient sup-plements to older people who did not appear to have pre-existing deficiencies.
Jacob et al. (53) studied the effects of short-term ascorbate depletion on immunity andother factors in young adult males confined to a metabolic ward. Ascorbate depletion wasachieved using daily doses of 5 to 20 mg/d, whereas repletion was achieved with doses of

Chapter 22 / Immunity in Older People 559
60 to 250 mg/d (60 mg was the RDA at that time). Although LPRs to mitogens were notaffected by ascorbate depletion–repletion, delayed DHST responses to a panel of sevenrecall antigens were markedly depressed by ascorbate depletion. Repletion for 28 d at either60 or 250 mg/d did not restore the mean antigen score to the predepletion level, althoughthere was some improvement in induration in three of the eight men studied. These resultssuggest that DHST responses are more sensitive to ascorbate depletion than mitogenresponses. They further suggest that the repletion period was of insufficient duration to pro-duce a return of DHST to baseline levels and/or the repletion doses were not large enough.
Fuller et al. (54) studied the effect of β-carotene supplementation on the ultraviolet(UV) radiation-induced photosuppression of DHST responses in 24 young adult males,ages 19 to 39 yr. They found that exposure to a UV A/B light source over a 16-d periodsignificantly reduced DHST responses in a control (placebo) group to 39% of the initialvalues, but did not induce significant reductions in a group given 30 mg of β-caroteneper day. Because young men were studied, the question of whether these results wouldoccur in young women or in older men and women was not known. This group thenrepeated the study in elderly men and found similar effects of UV suppression that wasprevented with β-carotene supplementation, although there was more variability inDHST responses in the older subjects compared to young adults (55,56).
Watson et al. (57) investigated the effects of β-carotene on lymphocyte subpopula-tions in male and female subjects with a mean age of 56 yr. β-carotene was given atdoses of 15, 30, 45, or 60 mg/d for 2 mo. Using monoclonal antibodies to identify lym-phocyte subsets, they found that the percentages of T-helper and NK cells, as well ascells with IL-2 and transferrin receptors, were increased in a dose-related fashion. Therewere no significant effects of β-carotene on T-suppressor cells. However, the number ofsubjects in each treatment group was only three to five; thus, further investigation isneeded to confirm these findings.
Santos et al. (58) found that men participating in the Physicians’ Health Study who con-sumed 50 mg of β-carotene on alternate days for an average of 12 yr had significantlygreater NK cell activity than controls given placebos. Surveillance by NK cells is consid-ered to protect against the development of cancer. However, two large intervention trialsfound an association between high doses of β-carotene and the development of lung can-cer in cigarette smokers (59,60). The role of the immune system in leading to the develop-ment of lung cancer in these studies is not known, but the results suggest that there are risksassociated with the long-term use of high doses of β-carotene supplements in smokers.
In a pilot study, Talbott et al. (61) investigated the impact of pyridoxine supplementa-tion on lymphocyte responses in 15 older (ages 65–81 yr), mostly female subjects andfound that administration of 50 mg/d of pyridoxine hydrochloride significantly increasedin vitro LPRs to PHA, pokewood mitogen, and Staphylococcus aureus.
Meydani et al. (62) reported that vitamin B6 deficiency impaired IL-2 production andlymphocyte proliferation in older adults. Each of these measurements was reduced byabout 50% by depletion, whereas repletion with near-RDA levels of B6 eventuallyincreased values to about the baseline levels. Although only eight subjects were stud-ied, this well-designed investigation supports a number of other studies that suggest thatvitamin B6 may play a key role in immune responses (63).
In another study, Meydani et al. (64) gave older people 50, 200, or 800 mg of vita-min E daily for 4 to 5 mo. This resulted in improved antibody titers to hepatitis B vac-cine and enhanced DHST responses, especially in the group consuming 200 mg of
560 Part VI / Prevention Major Disabilities
vitamin E per day. This suggests 200 mg as a recommended dose, although lower dosesmay be equally effective when administered for longer periods of time. In a more recentstudy, Pallast et al. (65) investigated the effects of supplementation of healthy older men(ages 65–80 yr) with vitamin E for 6 mo at doses of 50 and 100 mg daily. There was adose-related trend of increased DHST responses, especially in those subjects with ini-tially low responses, suggesting that there are subgroups of older people that might ben-efit most from vitamin E supplements.
There has been considerable interest in the potential for zinc to improve immunefunctions in older people. It is clear that severe zinc deficiency in animals and peo-ple (e.g., as found in the disease acrodermatitis enteropathica) can greatly compro-mise cellular immunity and lead to the development of life-threatening opportunisticinfections (66). There are also reports of significant associations between plasma orcellular zinc concentrations and immune functions such as DHST responses in olderpeople (8,67). However, recent studies of the impact of zinc supplementation onimmunity in older people have not been encouraging. They have demonstrated eitherno beneficial effect of zinc supplements on immunity or an adverse effect even whenthe supplements contained modest doses of zinc in the range of 15 to 25 mg/d(68,69). In the absence of an underlying deficiency, use of zinc supplements by oldersubjects, especially at doses that exceed 15 mg/d, is more likely to adversely affectimmunity than improve it. The effects of zinc on immunity in the elderly wererecently reviewed (70).
Doherty et al. (71) studied the effect of low (1.5 mg/kg) vs higher (6.0 mg/kg) zincsupplementation on mortality in 141 young children in Bangladesh with protein-energymalnutrition, and weight-for-age z scores of about −4.6. Mortality was significantlygreater in the high-dose group, with sepsis a frequent contributing factor. The resultssuggest that high-dose zinc supplementation may contribute to increased risk of sepsisand mortality in severely malnourished children. Although this study involved onlyvery young children (ages 6 mo to 3 yr), it suggests caution in the use of high-dose zincsupplements by any age group.
3.4. Clinical Trials of Combinations of MicronutrientsThe studies discussed earlier focused on the effects of relatively large doses of indi-
vidual micronutrients on immune functions. There have been a limited number of pub-lished placebo-controlled trials on the effects of multivitamin/mineral supplements onimmune functions in older people.
In the first of these studies, we investigated the effects of zinc given in combinationwith a multivitamin on immune functions in 63 older subjects (72). All subjectsreceived a standard multivitamin/mineral supplement that contained all of the essentialmicronutrients, with the exception of zinc. Additionally, subjects received 15 or 100 mgof zinc or a placebo. Daily consumption of the multivitamin/mineral supplement for1 yr was associated with enhanced DHST and mitogen responses, but these effects werereduced and delayed by ingestion of 15 and, especially, 100 mg of zinc each day. Thesedata suggest that interactions among micronutrients may influence their effects onimmunity and that some individual micronutrients—even at modest doses—may haveunexpected adverse effects. The adverse impact of zinc is consistent with other previ-ously cited recent studies that indicated that zinc supplements in healthy older individ-uals either do not improve immunity or adversely affect it (68,69).

Chapter 22 / Immunity in Older People 561
Penn et al. (73) studied the effects on immune functions of a supplement containingvitamin C (100 mg), vitamin A (8000 IU), and vitamin E (50 mg); it was given for 28 dto half of the 30 elderly subjects studied. All subjects were patients who had been hos-pitalized for at least 3 mo. The number and percent of CD4+ and CD8+ T cells were sig-nificantly increased in the supplemented group but not in a placebo group. Proliferativeresponses of lymphocytes to the mitogen PHA were also significantly increased in thesupplemented group by 64 to 283% but were not affected by the placebo. There wasbiochemical evidence of deficiencies of vitamins A, C, and/or E in 5 to 47% of the sup-plemented subjects at enrollment into the study. Therefore, it is possible that theimprovement in cellular immunity in these subjects with short-term administration ofvitamins A, C, and E was the result of correction of underlying deficiencies that aremore likely to be present in hospitalized than in independently living older people.These results suggest that this group of micronutrients may be particularly important forenhancement of immune responses in older people.
In another study, Chavance et al. (74) enrolled 218 subjects ages 60 yr or older whowere living independently and had not used any vitamin supplements for at least 3 moprior to the study. They were given a low-dose multivitamin or placebo for 4 mo. Noclinical or laboratory assessments of immune function were conducted. The authorsfound no significant effects of supplementation on the incidence of infections; however,effects on the duration of each infection or the total number of days of infection werenot assessed. As suggested by the authors, the failure to find any significant effects onthe incidence of infections may have resulted from the short duration of supplementa-tion. This is consistent with our results (72), which suggest that periods of supplemen-tation of about 12 mo are required before improvements in immune functions occur inolder people.
We also conducted a randomized, placebo-controlled, double-blind trial of the effectsof RDA-level micronutrient supplementation on plasma vitamin and trace metal con-centrations and immune functions in independently living healthy older subjects (75).The over-the-counter micronutrient supplement used in the study contained RDA levelsof each of the essential vitamins and low-to-moderate doses of minerals.
Of the 65 subjects enrolled, 56 (86%) completed the 1-yr study. About two-thirdswere females. As expected, there were no statistically significant effects of the placeboon plasma micronutrient concentrations. In contrast, the data for the micronutrient sup-plement group show statistically significant increases at 6 and/or 12 mo for plasmaconcentrations of ascorbate, β-carotene, folate, vitamin B6, and α-tocopherol. Thesedata verify that supplementation with RDA levels of the latter micronutrients canincrease their plasma concentrations in older individuals.
Table 2 contains the data on DHST responses for all study subjects combined and formales and females separately. For induration in the placebo group, there were no statis-tically significant differences between the 0- and 6-mo results, 0- and 12-mo results, or6- and 12-mo data. Similar results were obtained for the analyses of the data for theplacebo group regarding the number of positive responses.
For the micronutrient supplement group, there was also no significant difference for thedata on induration at 0 and 6 mo. However, there was a statistically significant differencebetween the 0- and 12-mo induration results (p = 0.005). There was an increase in indura-tion between 6- and 12-mo, but this did not achieve statistical significance (p = 0.056).Similar trends were observed for the individual skin-test antigens.

Tab
le 2
Del
ayed
-Hyp
erse
nsit
ivit
y Sk
in-T
est
Res
pons
es o
f P
lace
bo a
nd M
icro
nutr
ient
Gro
upsa
Subg
roup
and
Pla
cebo
gro
upM
icro
nutr
ient
gro
up
resp
onse
typ
e0
mo
6 m
o12
mo
0 m
o6
mo
12 m
o
All
subj
ects
Posi
tive
resp
onse
s1.
65±
0.30
1.42
±0.
251.
73±
0.29
1.45
±0.
25b
1.76
±0.
27b
,c2.
38±
0.33
c
Tota
l ind
urat
ion,
mm
5.37
±1.
024.
76±
0.93
5.80
±0.
955.
21±
0.98
b5.
73±
0.94
b,c
8.40
±1.
25c
Mal
esPo
sitiv
e re
spon
ses
2.93
±0.
601.
93±
0.30
2.50
±0.
781.
64±
0.33
b2.
59±
0.43
b,c
2.86
±0.
53c
Tota
l im
dura
tion,
mm
8.86
±1.
916.
36±
1.29
8.88
±2.
516.
23±
1.15
8.85
±1.
5810
.91
±2.
08Fe
mal
esPo
sitiv
e re
spon
ses
1.18
±0.
291.
24±
0.31
1.45
±0.
271.
33±
0.36
b1.
25±
0.29
b,c
2.08
±0.
42c
Tota
l ind
urat
ion,
mm
4.08
±1.
094.
17±
1.16
4.67
±0.
834.
58±
1.41
b3.
83±
0.95
b6.
86±
1.49
c
aM
ean
±S
E;
n=
26 f
or p
lace
bo g
roup
(7
mal
es,
19 f
emal
es),
n=
29 f
or m
icro
ntri
ent
grou
p (1
1 m
ales
, 18
fem
ales
). P
osit
ive
resp
onse
s ar
e th
e m
ean
num
ber
of a
ntig
ens
elic
itin
g a
resp
onse
fro
m a
tot
al o
f se
ven
anti
gens
. To
tal
indu
rati
on i
s th
e su
m o
f th
e in
dura
tion
s of
all
pos
itiv
e re
spon
ses.
Wit
hin
grou
ps, v
alue
s in
the
sam
e ro
w w
ith
diff
eren
t let
ter
supe
rscr
ipts
are
sig
nifi
cant
ly d
iffe
rent
, p<
0.05
(W
ilcox
on s
igne
d-ra
nk te
st).
562

Chapter 22 / Immunity in Older People 563
Similar results also were obtained for the number of positive responses in the micronu-trient treatment group. The mean number of positive responses in the placebo groupincreased by only 4.8% between 0 and 12 mo, and induration increased by 8%. In contrast,in the micronutrient supplement group, the mean number of positive responses increasedby 64% and induration by 61% between 0 and 12 mo. These data provide strong evidencefor the enhancement of DHST responses after 1 yr of micronutrient supplementation.
The results also suggest that some enhancement of DHST responses occurred sooner(at 6 mo) in the male subjects than in the females (Table 2). The male subjects had sig-nificantly greater DHST responses than the females at enrollment; this is consistent withprevious data that suggest that DHST responses in males may differ from those infemales (76). The diets of the male subjects differed from the females because they werehigher in energy intake as well as intake of individual micronutrients, and it is possiblethat this factor may have interacted with micronutrient supplementation to influenceDHST responses.
There was an increase between 0 and 12 mo in the number of subjects in the placebogroup with low blood concentrations of some of the micronutrients measured, specifi-cally β-carotene, retinol, folate, and vitamin B6. This trend differed significantly fromthe micronutrient group, for which the number of low values changed very littlebetween 0 and 12 mo. Therefore, the improvement in skin-test responses in themicronutrient group did not result from the correction of underlying micronutrient defi-ciencies for the nine micronutrient concentrations that we determined in blood, at leastas defined by current guidelines for low circulating concentrations. The increased num-ber of low values in the placebo group suggests that older people who do not take vita-min supplements for 1 yr may have an increased risk of developing one or more lowconcentrations—particularly for vitamin B6, folate, and β-carotene.
Our data suggest that enhancement of immune functions in older subjects by low-dose micronutrient supplementation takes approx 1 yr. These results also suggest thatthe diets of older people are inadequate in one or more micronutrients and/or that thecurrent RDAs for one or more micronutrients may be too low to support optimal immu-nity in older adults. For optimal responses, they required the RDA level of the vitaminsin the supplement in addition to the amounts in their food.
It could be argued that a 60% increase in DHST responses over a 1-yr period is onlya mean increase of about 5% per month. However, this increase far exceeds the declinein DHST responses per year that occurs with aging and, thus, may completely preventit. These results suggest that older subjects who take a “one-a-day”-type multivitaminsupplement faithfully for at least 6 to 12 mo may experience a substantial improvementin measures of cellular immunity such as DHST responses. It is possible that more rapidand/or larger increases in DHST responses would occur if higher doses of micronutri-ents were used.
More recently, Girodon et al. (77) studied the effects of trace element and vitaminsupplementation on immunity and infections in institutionalized subjects ages 65 yr andolder in France. Daily for 2 yr, subjects (n = 725) received a placebo; a trace-elementsupplement containing 20 mg of zinc and 100 μg of selenium; a vitamin supplementwith 120 mg of vitamin C, 6 mg of β-carotene, and 15 mg of vitamin E; or both the vit-amin and trace-element supplements. DHST responses were not significantly influ-enced by any treatment, but antibody responses to influenza vaccine were improved inthe groups given zinc and selenium, and the incidence of respiratory tract infection was

564 Part VI / Prevention Major Disabilities
marginally lower (p = 0.06) in these groups. The vitamin and trace-element supplementsalso reduced the prevalence of underlying deficiencies of these nutrients. Because thesewere institutionalized subjects with a high frequency of low blood micronutrient con-centrations, the applicability of these results to healthy independently living people isuncertain. Nevertheless, this large study provides the first evidence that selenium maybe a key nutrient in the maintenance of immunity in older people.
3.5. Limitations of Current KnowledgeThe previously mentioned studies that focused on the effects of multivitamins on
immune functions, in combination with the short-term higher dose single nutrient studiessuch as those of Meydani (62,64), Watson (57), and Talbott (61), provide solid evidencethat micronutrient supplements can enhance immune functions in older people, but dataregarding effects on the incidence and prevalence of infectious diseases are quite limited.Despite the evidence provided by these studies, we do not know if long-term daily use ofmultivitamin/mineral supplements enhances immune functions and reduces the inci-dence and severity of infectious diseases in older people beyond the 1- to 2-yr durationof the longest studies done to date. This is an unfortunate gap in our knowledge, becausemillions of older Americans currently consume a multivitamin/mineral supplement daily,either alone or in combination with one or more single nutrients at higher doses (78,79).This situation is partly the result of the limited objectives of all previously completedstudies. All of the single nutrient studies have been of short duration, usually using highdoses of one micronutrient given to a relatively small number of subjects. Most of thesestudies have not assessed the impact of single nutrient supplementation on the incidenceof infectious diseases—a limitation related to the small number of subjects enrolled inthese studies and their short duration, with a consequent lack of statistical power toassess disease incidence. The studies multivitamin and/or trace element supplementsalso have the following limitations:
1. The study by Chavance et al. (74) was only 4 mo in duration. Although, this studyassessed the impact of multivitamin supplementation on the incidence of infectiousdiseases, it did not include any measures of immune function,
2. The study of Penn (73) was only 1 mo in duration and included only older people whohad been hospitalized for at least 3 mo.
3. Our studies (71,75) assessed DHST responses, LPRs to mitogens, and NK cell activ-ity; however, we could not examine other measures of immunity or clinical outcomes,and the period of supplementation was limited to 1 yr.
4. The 2-yr study by Girodon et al. (77), although promising, included only institutional-ized subjects.
Thus, additional studies of micronutrient—immunity—disease relationships arerequired, particularly studies that focus on clinical outcomes.
4. FACTORS THAT CAN INFLUENCE NUTRITION–IMMUNITY RELATIONSHIPS
Factors that may influence micronutrient—immunity relationships in older peopleinclude gender, stress, disease, physical activity and exercise, obesity, and food choices.
In our recent study (75) of the effects of low-dose micronutrient supplements onimmunity in older people, improvements in DHST responses occurred sooner in the

Chapter 22 / Immunity in Older People 565
males than the females. Although the reason for this is not known, one possibility is thatthe higher intake of micronutrients from food in the men results in a larger totalmicronutrient intake. As mentioned previously, this effect may be a consequence of thegenerally greater energy and micronutrient intakes of males.
There is a considerable number of reports that psychological and physiological stressin experimental animals and people can depress cellular immune functions (80,81),although it is beyond the scope of this chapter to assess these studies in any detail. Asan example, death of a spouse has been associated with depressed immune functions(81). However, virtually all studies of relationships between stress and immunity havenot adequately assessed nutritional factors that may be altered by stress and, in mostcases, have completely ignored nutrition. Physical and psychological stress can modifyfood intake in animals and people; thus, studies of stress—immunity relationships usu-ally are confounded by nutritional factors that have not been adequately evaluated.
There is considerable evidence that physical activity/exercise patterns can influenceimmunity (82–86). Generally, the data suggest that very strenuous exercise can acutelydepress immunity. For example, various studies have demonstrated that participants inmarathons have a significantly increased risk of respiratory infections in the 1- to 2-wkperiod following the race (85,86). Chronic overtraining also has been associated withdepressed immunity (84). In contrast, regular moderate exercise appears to enhanceimmune functions (84). One hypothesis is that regular exercise contributes to the main-tenance of muscle mass, and muscle is the source of a key nutrient, glutamine, which isrequired by lymphocytes (87). Additionally, alterations in cytokine levels as a result ofregular exercise may be a factor (88,89).
In a review, Nieman (90) concluded that infection risk following intensive exerciselikely is related to acute nonpersistent changes in immunity. However, unless the ath-lete exceeds his or her usual training limits, immunocompromise is unlikely, althoughfurther research is needed to confirm this conclusion. Generally, studies of macronutri-ent or micronutrient supplements in combination with exercise have shown no effectson immunity, with the exception of attenuated humoral and cellular immune responsesassociated with carbohydrate consumption. For example, in a randomized trial of 112elderly (mean: 79.2 ± 5.9 yr) men and women, Paw et al. (91) reported that exercisingtwo times a week improved DHST responses to recall antigens, but consumption ofmicronutrient-enriched foods (25–100% of the RDA for various micronutrients) did notenhance the effect of exercise.
Stallone (92) outlined studies that indicated that excess body weight in humans orexperimental animals was associated with impairments in host defense mechanisms.Definitive studies have not been done, but there are data suggesting both beneficial anddetrimental effects of weight loss on immunity. In experimental animals, it is well-known that chronically reduced energy intake without malnutrition can profoundlyameliorate the detrimental effects of aging on immunity and can increase mean andmaximum life span (93).
The well-established importance of some micronutrients, such as vitamin E, in themaintenance of immune function suggests that choices of foods high in these micronu-trients may be beneficial, but this has not been validated in well-controlled studies.
In recognition of the evolutionary development of humans as hunter–gatherers whoconsumed foods but not supplements, it has been argued that appropriate food choices aresufficient to achieve optimal health, including optimal immunity. A substantial body of

566 Part VI / Prevention Major Disabilities
evidence supports the finding that wise food choices, including diets high in fruit and veg-etable intake and low in saturated fat, are key factors to the prevention of some chronicdiseases. However, arguments based on evolution are compromised by two factors. First,evolution has programmed humans and other species to live through our peak repro-ductive years but not necessarily beyond them. Second, our preagricultural ancestorshad intakes of some nutrients (e.g., calcium, iron, and zinc) much higher than those ofmodern humans (94). Olshansky et al. (95) used the term “manufactured time” todescribe use of prescription drugs and other methods to increase the odds of livingbeyond our reproductive years. Therefore, it should not be surprising that micronutrientsupplements may be particularly beneficial to the immune and other organ systems ofolder individuals.
Goodwin (96) suggested that the relationship between depressed cellular immunefunction and subsequent increased mortality may result from compromised immunity asa marker for clinically latent diseases or poor overall physiological function. However,impaired immunity may also contribute to a reduced ability to defend against infections,cancers, and, perhaps, cardiovascular heart disease.
5. RESEARCH NEEDED ON MICRONUTRIENTS AND IMMUNITY IN OLDER PEOPLE
As previously discussed, several cross-sectional studies have been performed in thelast 12 yr that assess relationships between micronutrient nutrition and immunity(49,50). Generally, significant associations between serum micronutrient concentrationsor use of micronutrient supplements and various measures of immunity were found insome studies but not others (49–52). However, these studies compared micronutrientsupplement users with nonusers but did not evaluate use of specific supplements, and itis likely that some individual or combinations of micronutrients can improve immunityand others cannot.
The clinical trials performed to date regarding micronutrient supplementation andimmunity usually have involved healthy older subjects consuming their usual diets. In thecase of some single nutrient studies, subjects lived in metabolic units and consumed stan-dardized meals that contained about the RDA of all essential micronutrients. It is possiblethat the improvement in immunity found in some studies was a result of correction ofunderlying deficiencies. However, it is also likely that micronutrient supplements enhanceimmunity even in the absence of underlying deficiencies, at least based on current conceptsof “deficiency.” This should not be surprising, because optimal immune function was nota factor in establishment of the current Dietary Reference Intakes (DRIs) or in defining lab-oratory normal ranges for circulating micronutrient concentrations. In fact, daily intakesthat optimize immunity may differ from both the current DRIs and intakes that may preventchronic diseases. For example, the current DRI/RDA for vitamin E (equivalents of 15 mg ofα-tocopherol for adult females and males) is substantially lower than amounts that opti-mize immune functions or are associated with a reduced risk of cardiovascular heart dis-ease (64,65,97,98). Similarly, the current RDA for vitamin C is adequate to preventdevelopment of scorbutic lesions but appears to be less than the intake that could optimizeimmunity or provide other health benefits (4,99). Recommendations for an optimal intakeof any micronutrient need to balance the impact of that nutrient on various health outcomesas well as consider possible adverse effects of relatively high doses.

Chapter 22 / Immunity in Older People 567
New studies are needed, particularly those that focus on clinical outcomes and haveconsiderable statistical power. An example is the recent investigation of Graat et al.(100). They conducted a randomized, double-blind, placebo-controlled trial of 652Dutch men and women older than age 60 yr who were given either a placebo, multivi-tamin/mineral supplement, 200 mg of vitamin E as α-tocopherol, or both supplements.The multivitamin/mineral supplement included 24 essential micronutrients and one“possibly essential” trace element (silicon). The primary outcome measures were theincidence and severity of acute respiratory tract infections. The mean duration of par-ticipation was 441 d, and 84% of subjects were compliant with the protocol. The inci-dence of acute respiratory tract infections did not differ significantly among treatmentgroups. Surprisingly, infection severity (measured as duration of infection, restriction ofactivities, number of symptoms, and presence of fever) actually increased significantly(p = 0.03–0.009) in the groups ingesting vitamin E supplements. This study focused ona clinical outcome but did not include laboratory evaluation of immunity. Therefore,immune system assays that might explain the study results were not available. Only0.2% of study subjects had low plasma α-tocopherol concentrations at enrollment, andthis may have precluded a beneficial effect of vitamin E supplements. The adverseeffects on infection severity may have resulted from the long duration of high-dose sup-plementation in a cohort with normal plasma α-tocopherol concentrations at enrollmentand was consistent with previously cited (59,60) studies on β-carotene that demon-strated adverse effects after long-term high-dose supplementation. These studies sug-gest caution in the long-term use of high-dose single micronutrients.
There is considerable evidence that patterns of physical activity and exercise caninfluence immunity both acutely and chronically; however, very few studies haveaddressed interactions among physical activity, immunity, and micronutrient nutrition.
It should be emphasized that the potential of micronutrient supplements to improveimmunity or exert other beneficial effects must be considered in relation to their con-sumption from food. This is especially true for low- to moderate-dose supplements, forwhich the intake from food and supplements may be similar. Clearly, supplement useshould be encouraged in conjunction with a sound diet that emphasizes fruits, vegeta-bles, whole grains, and other sources of micronutrients and limits the intake of satu-rated fats. However, it is likely that beneficial intakes of some nutrients, such asvitamin E, may not be possible from a relatively low-fat diet in the absence of supple-ment use.
The promising but variable results of studies performed to date suggest that contin-ued research is needed regarding nutrition and immunity in older people. Such effortsshould include the following:
1. A focus on long-term, placebo-controlled, double-blind clinical trials and prospectiveepidemiological studies that have sufficient statistical power.
2. Study of interactions among physical activity/exercise patterns, immunity, and nutrition.3. Evaluation of effects of nutrition on both humoral (e.g., antibody responses to vac-
cination) and cellular (e.g., DHST responses) immunity using clinically relevantassays and on clinical outcomes (e.g., infectious disease incidence, duration, andseverity).
4. Evaluation of dietary modification alone or in combination with low doses of supple-mental micronutrients. Studies of older individuals consuming their usual diets are alsoneeded.

568 Part VI / Prevention Major Disabilities
5. Long-term studies that address the persistence of the effects of micronutrients onimmunity both during and after micronutrient supplementation.
6. Use of appropriate inclusion and exclusion criteria in identification of subjects forstudy.
7. Study of both single micronutrients and multivitamin/minerals, with a focus on theantioxidant micronutrients and other widely used single or multiple micronutrientsupplements.
8. Identification of host-specific factors (e.g., gender, age) that influence micronutrient––immunity interactions as well as the basis for these effects.
9. Identification of the molecular mechanisms and genes that determine the effects ofmicronutrients on immunity. This will become increasingly important as new genesthat influence aging are identified.
About 100 million Americans (approx 40% of the population) take multivitamin/mineral supplements either alone or in combination with higher doses of the antioxidantvitamins (78,79). Well-designed studies that assess the health impacts of this practice areurgently needed and should include evaluation of effects on the immune system.
6. RECOMMENDATIONS
Physicians and other health care providers should advise their patients to eat dietslow in saturated fat and high in fruits and vegetables. This will ensure consumption ofsignificant quantities of the micronutrients (and phytochemicals) that can favorablyaffect immunity. Additionally, older subjects should be encouraged to take a low-dosemultivitamin/mineral supplement, especially those with poor diets. Higher daily doses ofthe antioxidant micronutrients vitamin C (200–500 mg) and vitamin E (200–400 IU) mayalso be appropriate for some, but not all, older individuals. Taking high supplementaldoses of other micronutrients that can adversely affect immunity (e.g., zinc) should bepersuasively discouraged. High doses of supplemental β-carotene are not recommendedfor smokers because of their association with the development of lung cancer and areunwise for other people, as recently concluded by the US Preventive Services Task Force(101) The favorable effects of regular exercise on immunity also should be mentioned topatients. This advice (low-fat diet, high intake of fruits and vegetables, regular exercise,and supplemental vitamins) may not only promote optimal immunity but is also likely toreduce the risk of cardiovascular heart disease and some cancers.
In a widely publicized article, Fletcher and Fairfield (102) reviewed the health effectsof vitamin supplements and concluded, “All adults (should) take one multivitamindaily.” They based this recommendation on beneficial health effects other than effectson immunity. The likely beneficial impact on immunity in older people, as discussed inthis chapter and another recent review (103), is an additional benefit that further sup-ports this recommendation.
REFERENCES1. Bogden JD, Louria DB. Micronutrients and Immunity in Older People. In: Bendich A, Deckelbaum
RJ, eds. Preventive Nutrition: The Comprehensive Guide for Health Professionals, 2nd ed. HumanaPress, Totowa, NJ, 2001, pp. 307–327.
2. Warner HR, Butler RN, Sprott RL, Schneider EL. Modern biological theories of aging. Raven Press,New York, 1987.

Chapter 22 / Immunity in Older People 569
3. Bendich A. Antioxidant micronutrients and immune responses. Ann NY Acad Sci 1990; 587:168–180.4. Lesourd B, Mazari L. Nutrition and immunity in the elderly. Proc Nutr Soc 1999; 58:685–695.5. Ben-Yehuda A, Weksler ME. Immune senescence: mechanisms and clinical implications. Cancer
Invest 1992; 10:525–531.6. Makinodan T. Patterns of age-related immunologic changes. Nutr Rev 1995; 53:S27–S34.7. Effros RB, Walford RL. Infection and Immunity in Relation to Aging. In: Goidl EA, ed. Aging and
the Immune Response. Marcel-Dekker, New York, 1987, pp. 45–65.8. Bogden JD, Oleske JM, Munves EM, et al. Zinc and immunocompetence in the elderly: baseline
data on zinc nutriture and immunity in unsupplemented subjects. Am J Clin Nutr 1987; 45:101–109.9. Kuvibidilia S, Yu L. Ode D, Warrier RP. The Immune Response in Protein-Energy Malnutrition and
Single Nutrient Deficiencies. In: Klurfeld DM, ed. Nutrition and Immunology. Plenum Press, NewYork, 1993, pp. 121–155.
10. Abbas AK, Lichtman AH, Pober JS. Cellular and Molecular Immunology. WB Saunders,Philadelphia, 1994, pp. 166–186.
11. Aronson M. Involution of the thymus revisited: immunological trade-offs as an adaptation to aging.Mechan Ageing Develop 1993; 72:49–55.
12. Siskind GW. Aging and the Immune System. In: Warner HR, Butler RN, Sprott RL, Schneider EL,eds. Modern Biological Theories of Aging. Raven Press, New York, 1987, pp. 235–242.
13. Makinodan T, Kay MB. Age influence on the immune system. Adv Immunol 1980; 29:287–330.14. Weksler ME. The senescence of the immune system. Hospital Practice 1981, pp. 53–64.15. McMurray DN. Cell-mediated immunity in nutritional deficiency. Prog Food Nutr Science 1984;
8:193–228.16. Schwab R, Weksler ME. Cell biology of the impaired proliferation of T cells from elderly
humans. In: Goidl EA, ed. Aging and the immune response. Marcel Dekker, New York, 1987, pp.67–80.
17. James SJ, Makinodan T. Nutritional Intervention During Immunologic Aging: Past and Present. In:Armbrecht HJ, Prendergast JM, Coe RM, eds. Nutritional Intervention in the Aging Process.Springer-Verlag, New York, 1984, pp. 209–227.
18. Meakins JL, Pietsch JB, Bubenick O, et al. Delayed hypersensitivity: indicator of acquired failure ofhost defenses in sepsis and trauma. Ann Surg 1977; 186:241–250.
19. Christou NV, Tellado-Rodriguez J, Chartrand L, et al. Estimating mortality risk in preoperative patientsusing immunologic, nutritional, and acute-phase response variables. Ann Surg 1989; 210:69–77.
20. Wayne SJ, Rhyne RL, Garry PJ, Goodwin JS. Cell-mediated immunity as a predictor of morbidityand mortality in subjects over 60. J Gerontol 1990; 45:M45–M48.
21. Roberts-Thomson IC, Whittingham S, Youngchaiyud U, McKay IR. Aging, immune response, andmortality. Lancet 1974; 2:368–370.
22. Hicks MJ, Jones JF, Thies AC, Weigle KA, Minnich LL. Age-related changes in mitogen-inducedlymphocyte function from birth to old age. Am J Clin Pathol 1983; 80:159–163.
23. Murasko DM, Nelson BJ, Silver R, Matour D, Kaye D. Immunologic response in an elderly popu-lation with a mean age of 85. Am J Med 1986; 81:612–618.
24. Markewitz A, Faist E, Lang S, et al. Successful restoration of cell-mediated immune response aftercardiopulmonary bypass by immunomodulation. J Thorac Cardiovas Surg 1993; 105:15–24.
25. Higa K, Noda B, Manabe H, Sato S, Dan K. T-lymphocyte subsets in otherwise healthy patients withherpes zoster and relationships to the duration of acute herpetic pain. Pain 1992; 51:111–118.
26. Stites DP. Clinical Laboratory Methods for Detection of Cellular Immunity. In: Stites DP, Terr AI,eds. Basic and Clinical Immunology. 7th ed. Appleton & Lange, Norwalk, CT, 1991, pp. 263–283.
27. Giorgi JV. Lymphocyte Subset Measurements: Significance in Clinical Medicine. In: Rose NR,Friedman H, Fahey JL, eds. Manual of Clinical Laboratory Immunology, 3rd ed. American Societyfor Microbiology, Washington, DC, 1986, pp. 236–246.
28. Sen P, Middleton JR, Perez G, et al. Host defense abnormalities and infection in older persons. InfectMed 1994; 11:364–370.
29. Perskin MH, Cornstein BN. Age-related changes in neutrophil structure and function. MechanAgeing Develop 1992; 64:303–313.
30. Nagel JE, Han K, Coon PJ, Adler WH, Bender BS. Age differences in phagocytosis by polymor-phonuclear leukocytes measured by flow cytometry. J Leukoc Biol 1986; 39:399–407.
31. Shoham-Kesary H, Gershon H. Impaired reactivity to inflammatory stimuli of neutrophils fromelderly donors. Aging Immunol Infect Dis 1992; 3:169–183.

570 Part VI / Prevention Major Disabilities
32. Corberand J, Ngyen F, Laharrague P, et al. Polymorphonuclear functions and aging in humans. J AmGeriatr Soc 1981; 29:391–397.
33. Makinodan T, Lubinski J, Fong TC. Cellular, biochemical, and molecular basis of T-cell senescence.Arch Pathol Lab Med 1987; 111:910–914.
34. Rubin LA, Nelson DL. The soluble interleukin-2 receptor: biology, function, and clinical application.Ann Intern Med 1990; 113:619–627.
35. Manoussakis MN, Papadopoulos GK, Drosos AA, Moutsopoulos HM. Soluble interleukin-2 recep-tor molecules in the serum of patients with autoimmune diseases. Clin Immunol Immunopathol1989; 50:321–332.
36. Lahat N, Shtiller R, Zlotnick AY, Merin G. Early IL-2/sIL-2R surge following surgery leads to tem-porary immune refractoriness. Clin Exp Immunol 1993; 92:482–486.
37. Bogden JD, Kemp FW, Liberatore BL, et al. Serum interleukin-2 receptor concentrations, physicalactivity, and micronutrient nutrition in older people. J Cell Biochem 1993; 17B:86.
38. Sansoni P, Brianti V, Fagnoni F. NK cell activity and T-lymphocyte proliferation in healthy cente-narians. Ann NY Acad Sci 1992; 663:505–507.
39. Mariotti S, Sansoni P, Barbesino G, et al. Thyroid and other organ-specific autoantibodies in healthycentenarians. Lancet 1992; 339:1506–1508.
40. Scrimshaw NS, SanGiovanni JP. Synergism of nutrition, infection, and immunity: an overview. AmJ Clin Nutr 1997; 66:464S–477S.
41. Fraker P. Nutritional immunology: methodological considerations. J Nutr Immunol 1994; 2:87–92.42. Chandra RK. Nutrition and immunity. Contemp Nutrition 1986; 11:1–4.43. Chandra RK. Immunodeficiency in undernutrition and overnutrition. Nutr Rev 1981; 39:225–231.44. McMurray DN, Loomis SA, Casazza LJ, Rey H, Miranda R. Development of impaired cell-mediated
immunity in mild and moderate malnutrition. Am J Clin Nutr 1981; 34:68–77.45. Dowd PS, Heatley RV. The influence of undernutrition on immunity. Clin Sci 1984; 66:241–248.46. Beisel WR. Single nutrients and immunity. Am J Clin Nutr 1982;35:417–468.47. Beisel WR. Nutrition and Infection. In: Linder MC, ed. Nutritional Biochemistry and Metabolism.
Elsevier, New York, 1985, pp. 369–394.48. Bogden JD, Kemp FW, Han S, et al. Status of selected nutrients and progression of human immun-
odeficiency virus type 1 infection. Am J Clin Nutr 2000; 72:809–815.49. Goodwin JS, Garry PJ. Relationships between megadose vitamin supplementation and immunolog-
ical function in a healthy elderly population. Clin Exp Immunol 1983; 51:647–653.50. Goodwin JS, Garry PJ. Lack of correlation between indices of nutritional status and immunologic
function in elderly humans. J Gerontol 1988; 43:M46–M49.51. Kawakami K, Kadota J, Iida K, et al. Reduced immune function and malnutrition in the elderly.
Tohoku J Exper Med 1999; 187: 157–171.52. Kemp FW, DeCandia J, Li W, et al. Relationships between immunity and dietary and serum antiox-
idants, B vitamins, and homocysteine in elderly men and women. Nutr Res 2002; 22: 45–53.53. Jacob RA, Kelley DS, Pianalto FS, et al. Immunocompetence and oxidant defense during ascorbate
depletion of healthy men. Am J Clin Nutr 1991; 54:1302S–1309S.54. Fuller CJ, Faulkner H, Bendich A, Parker RS, Roe DA. Effect of beta-carotene supplementation on
photosuppression of delayed-type hypersensitivity in normal young men. Am J Clin Nutr 1992;56:684–690.
55. Herraiz L. Rahman A, Paker R, Roe D. The role of beta-carotene supplementation in prevention ofphotosuppression of cellular immunity in elderly men. FASEB J 1994; 8:A423.
56. Herraiz LA, Hsieh WC, Parker RS, et al. Effect of UV exposure and β-carotene supplementation ondelayed-type hypersensitivity response in healthy older men. J Am Coll Nutr 1998; 17:617–624.
57. Watson RR, Prabhala RH, Plezia PM, Alberts DS. Effect of beta-carotene on lymphocyte subpopu-lations in elderly humans: evidence for a dose-response relationship. Am J Clin Nutr 1991; 53:90–94.
58. Santos MS, Meydani SN, Leka L, et al. Natural killer cell activity in elderly men is enhanced byβ-carotene supplementation. Am J Clin Nutr 1996; 64:772–777.
59. Omenn GS, Goodman GE, Thornquist MD, et al. Risk factors for lung cancer and for intervention effectsin CARET, the Beta-Carotene and Retinol Efficacy Trial. J Natl Cancer Instit 1996; 88: 1550–1559.
60. Albanes D, Heinonen OP, Taylor PR, et al. Alpha-tocopherol and beta-carotene supplements andlung cancer incidence in the alpha-tocopherol, beta-carotene cancer prevention study: effects ofbaseline characteristics and study compliance. J Natl Cancer Instit 1996; 88:1560–1570.

Chapter 22 / Immunity in Older People 571
61. Talbott MC, Miller LT, Kerkvliet NI. Pyridoxine supplementation: effect on lymphocyte responsesin elderly persons. Am J Clin Nutr 1987; 46:659–664.
62. Meydani SN, Ribaya-Mercado JD, Russell RN, et al. Vitamin B-6 deficiency impairs interleukin 2production and lymphocyte proliferation in elderly adults. Am J Clin Nutr 1991; 53:1275–1280.
63. Rall LC, Meydani SN. Vitamin B6 and immune competence. Nutr Rev 1993; 51:217–225.64. Meydani SN, Meydani M, Blumberg JB, et al. Vitamin E supplementation and the in vivo immune
response in healthy elderly subjects. J Am Med Assoc 1997; 277:1380–1386.65. Pallast EG, Schouten EG, de Waart FG, et al. Effect of 50- and 100- mg vitamin E supplements on
cellular immune function in noninstitutionalized elderly persons. Am J Clin Nutr 1999; 69:1273–1281.
66. Oleske JM, Westphal ML, Shore S, et al. Correction with zinc therapy of depressed cellular immu-nity in acrodermatitis enteropathica. Am J Dis Child 1979; 133:915–918.
67. Fraker PJ, Gershwin ME, Good RA, Prasad A. Interrelationships between zinc and immune func-tion. Fed Proc 1986; 45:1474–1479.
68. Bogden JD, Oleske JM, Lavenhar MA, et al. Zinc and immunocompetence in elderly people: effectsof zinc supplementation for 3 months. Am J Clin Nutr 1988; 48:655–663.
69. Chandra RK, Hambreaus L, Puri S, Au B, Kutty KM. Immune responses of healthy volunteers givensupplements of zinc or selenium. FASEB J 1993; 7:A723.
70. Bogden, JD. Influence of zinc on immunity in the elderly. J Nutr Health Aging 2004; 8:48–54.71. Doherty CP, Kashein MA, Shakur MS, et al. Zinc and rehabilitation from severe protein-energy malnu-
trition: higher-dose regimens are associated with increased mortality. Am J Clin Nutr 1998; 68:742–748.72. Bogden JD, Oleske JM, Lavenhar MA, et al. Effects of one year of supplementation with zinc and
other micronutrients on cellular immunity in the elderly. J Am College Nutr 1990; 9:214–225.73. Penn ND, Purkins L. Kelleher J, et al. The effect of dietary supplementation with vitamins A, C, and
E on cell-mediated immune function in elderly long-stay patients: a randomized controlled trial. AgeAgeing 1991; 20:169–174.
74. Chavance M, Herbeth B, Lemoine A, Zhu BP. Does multivitamin supplementation prevent infectionsin healthy elderly subjects? A controlled trial. Int J Vitamin Nutr Res 1993; 63:11–16.
75. Bogden JD, Bendich A, Kemp FW, et al. Daily micronutrient supplements enhance delayed-hypersensitivity skin test responses in older people. Am J Clin Nutr 1994; 60:437–447.
76. Kniker WT, Anderson CT, McBryde JL, Roumiantzeff M, Lesourd B. Multitest CMI for standard-ized measurement of delayed cutaneous hypersensitivity and cell-mediated immunity. Normal val-ues and proposed scoring system for healthy adults in the USA. Ann Allergy 1984; 52:75–82.
77. Girodon F, Galan P, Monget AL, et al. Impact of trace elements and vitamin supplementation onimmunity and infections in institutionalized elderly patients. Arch Intern Med 1999; 159:748–754.
78. Park YK, Kim I, Yetley EA. Characteristics of vitamin and mineral supplement products in theUnited States. Amer J Clin Nutr 1991; 54:750–759.
79. Block G, Cox C, Madans J, et al. Vitamin supplement use, by demographic characteristics. Am JEpidemiol 1988; 127:297–309.
80. Cooper EL. Stress, Immunity, and Aging. Marcel-Dekker, New York, 1984.81. Solomon GF. Emotions, Immunity, and Disease. In: Copper EL, ed. Stress, Immunity and Aging.
Marcel Dekker, New York, 1984, pp. 1–10.82. Watson RR, Eisinger M. Exercise and Disease. CRC Press, Boca Raton, 1992, pp. 71–178.83. Keast D, Cameron K, Morton AR. Exercise and the immune response. Sports Med 1988; 5:248–267.84. Fry RW, Morton AR, Keast D. Overtraining in athletes. Sports Med 1991; 12:32–65.85. Nieman DC, Johanssen LM, Lee JW, Arabatzis K. Infectious episodes in runners before and after the
Los Angeles marathon. J Sports Med Phys Fitness 1990; 30:316–328.86. Peters EM, Bateman ED. Ultramarathon running and upper respiratory tract infections. S Afric Med
J 1983; 64:582–584.87. Barry-Billings M, Blomstrand E, McAndrew N, Newsholme EA. A communication link between
skeletal muscle, brain, and cells of the immune system. Int J Sports Med 1990; 11:S122–S128.88. Rubenoff R, Rall LC. Humoral mediation of changing body composition during aging and chronic
inflammation. Nutr Rev 1993; 51:1–11.89. Meydani S. Dietary modulation of cytokine production and biologic functions. Nutr Rev 1990;
48:361–368.90. Nieman DC. Exercise immunology: future directions for research related to athletics,nutrition, and
the elderly. Int J Sports Med. 2000; 21(Suppl 1): S61–S68.

572 Part VI / Prevention Major Disabilities
91. Paw MJ, deJong N, Pallast EG, et al. Immunity in frail elderly: a randomized controlled trial of exer-cise and enriched foods. Med Sci Sports Exer 2000; 32: 2005–2011.
92. Stallone DD. The influence of obesity and its treatment on the immune system. Nutr Rev 1994;52:37–50.
93. Spear-Hartley A, Sherman AR. Food restriction and the immune system. J Nutr Immunol 1994;3:27–50.
94. Eaton SB, Eaton SB III, Konner MJ, Shostak M. An evolutionary perspective enhances understand-ing of human nutritional requirements. J Nutr 1996; 126:1732–1740.
95. Olshansky SJ, Carnes BA, Grahn D. Confronting the boundaries of human longevity. Amer Scientist1998; 86:52–61.
96. Goodwin JS. Decreased immunity and increased morbidity in the elderly. Nutr Rev 1995;53:S41–S46.
97. Rimm EB, Stampfer MJ, Ascherio A, et al. Vitamin E consumption and the risk of coronary heartdisease in men. N Engl J Med 1993; 328:1450–1456.
98. Stampfer MJ, Hennekens CB, Manson JE, et al. Vitamin E consumption and the risk of coronary dis-ease in women. N Engl J Med 1993; 328:1444–1449.
99. Bendich A, Langseth L. Health effects of vitamin C supplementation: a review. J Am Coll Nutr 1995;14:124–136.
100. Graat JM, Sohouten EG, Kok FJ. Effect of daily vitamin E and multivitamin-mineral supplementa-tion on acute respiratory tract infections in elderly persons. JAMA 2002; 288:715–721.
101. US Preventive Services Task Force. Routine vitamin supplementation to prevent cancer and cardio-vascular disease: recommendations and rationale. Ann Intern Med 2003; 139:51–55.
102. Fairfield KM, Fletcher RH. Vitamins for chronic disease prevention in adults. JAMA 2002;287:3116–3129.
103. Mitchell BL, Ulrich CM, McTiernan A. Supplementation with vitamins or minerals and immunefunction: can the elderly benefit? Nutr Res 2003; 23:1117–1139.

From: Preventive Nutrition: The Comprehensive Guide for Health Professionals, Third EditionEdited by: A. Bendich and R. J. Deckelbaum © Humana Press Inc., Totowa, NJ
573
23 Vitamin A and the Prevention of Morbidity, Mortality, and Blindness
Richard D. Semba
KEY POINTS
● Vitamin A deficiency remains a leading cause of morbidity, mortality, and blindnessamong preschool children in developing countries worldwide.
● Consequences of vitamin A deficiency include impaired immune function, growthretardation, anemia, xerophthalmia, and blindness.
● The impaired immunity resulting from vitamin A deficiency results in increased mor-bidity and mortality from some infectious diseases such as measles, diarrheal disease,and human immunodeficiency virus infection.
● Periodic high-dose vitamin A capsule distribution has been implemented by somedeveloping countries as a short-term strategy to prevent vitamin A deficiency amongpreschool children.
● Diverse long-term strategies, including nutrition education, food fortification, andhomestead food production, are needed to prevent vitamin A deficiency in developingcountries. Ultimately, family-based approaches are required to address vitamin A defi-ciency, because pregnant women and women of childbearing age are at high risk of vit-amin A deficiency in many countries and are not reached by vertical programs such asvitamin A capsule distribution.
1. INTRODUCTION
Vitamin A deficiency is a major cause of morbidity, mortality, and blindness amonginfants and young children and a considerable cause of morbidity among pregnant womenand women of childbearing age in developing countries worldwide. Vitamin A deficiencyoccurs when the dietary intake of vitamin A is inadequate to meet the metabolic demandsfor vitamin A. Periods of rapid growth, inflammation, malabsorption, and episodes ofinfection can increase the need for vitamin A. The main dietary sources of vitamin Ainclude liver; butter, egg yolk, and dairy products; and dark green leafy vegetables, yel-low fruits, and carrots. Vitamin A deficiency is characterized by impaired immune func-tion, growth retardation, anemia, and xerophthalmia, and the immunosuppression of

574 Part VI / Prevention Major Disabilities
vitamin A deficiency is associated with increased morbidity and mortality from someinfectious diseases. As early as the 1920s and 1930s, improved dietary vitamin A intakeor vitamin A supplementation was shown to reduce mortality in children and reduce mor-bidity in pregnant women (1,2). Improving vitamin A intake, whether through improveddiet, fortification of foods, or periodic supplementation, is expected to reduce morbidityand mortality for millions of children and perhaps women of childbearing age, and theremay be many other therapeutic applications for vitamin A that have not yet been realized.This chapter provides health professionals with a concise review of the epidemiology,pathophysiology, diagnosis, treatment, and prevention of vitamin A deficiency.
2. METABOLISM OF VITAMIN A
2.1. Absorption of Vitamin AVitamin A, or all-trans retinol, is a fat-soluble substance found in animal foods and
dairy products. Vitamin A is available as preformed vitamin A (contained in high con-centrations in such foods as liver, cod liver oil, butter, or egg yolks) or as provitamin Acarotenoids (found in dark green leafy vegetables, carrots, papaya, and mangos).Retinyl esters contained in animal foods are hydrolyzed to retinol in the intestinal lumenby pancreatic triglyceride lipase and phospholipase B (3). Free retinol is taken up byenterocytes in a process that may involve both diffusion and protein-mediated facili-tated transport (3). In the enterocyte, retinol is complexed with cellular retinol-bindingprotein type 2 and is then re-esterified by the enzyme lecithin:retinol acyltransferase(3,4). The retinyl esters are incorporated into chylomicrons and carried to the liver viathe lymphatic circulation (5). Provitamin A carotenoids such as β-carotene may be con-verted to retinaldehyde through cleavage by carotenoid-15,15′-dioxygenase or by anexcentric cleavage pathway. Approximately 50 of more than 600 carotenoids found innature may be converted to vitamin A (6). The bioavailability of provitamin Acarotenoids is much less than that of preformed vitamin A for a variety of reasons,including differences in efficacy of absorption, the plant matrix, and biochemical con-version (7). Although carotenoids, such as β-carotene, and vitamin A often are popularlyregarded to be equivalent, there may be large differences in biological functions of thesetwo nutrients. Provitamin A carotenoids have many metabolic products that result fromexcentric cleavage; therefore, a large portion of provitamin A carotenoids are not sim-ply metabolized to vitamin A. In relation to antioxidant properties, vitamin A is a lesspotent antioxidant than β-carotene.
2.2. Storage and Transport of Vitamin AApproximately 90% of the vitamin A in the body is stored in the liver as retinyl esters
(8). The liver has the capacity to store enough vitamin A to last for several months, withlonger storage capacity among adults than children. Periodic high doses of vitamin Aare largely effective in preventing vitamin A deficiency for long periods because of theliver’s ability to store vitamin A (9). Retinol is released from the liver in combinationwith plasma retinol-binding protein (RBP) and transthyretin (TTR). Retinol is poorlysoluble in water and is carried in the blood sequestered inside the carrier proteins RBPand TTR. Retinol appears to enter cells via specific receptors, although it is unclearwhether all cells contain these receptors (10).

Chapter 23 / Impact of Vitamin A 575
2.3. The Retinoid ReceptorsVitamin A exerts its effects through retinoid receptors found in the nucleus of the cell
that are members of the nuclear hormone receptor superfamily (11). These receptorsresemble steroid and thyroid hormone receptors. In the cell, retinol is converted to itsactive metabolite, all-trans-retinoic acid. Retinoic acid influences gene activationthrough specific receptors that belong to the superfamily of thyroid and steroid recep-tors (11). Retinoic acid receptors (RARs) act as transcriptional activators for specifictarget genes. The RAR is expressed as several isoforms, referred to as RAR α, β, and γ;retinoid-x receptor (RXR) is also expressed as several isoforms, referred to as RXR α,β, and γ (12). All-trans retinoic acid is a high-affinity ligand for RARs, and 9-cis-retinoic acid is a high-affinity ligand primarily for RXRs, but it can also bind withRARs. 9-cis-retinoic acid seems to be functionally distinct from all-trans-retinoic acid,and interconversion may exist between the two isomers. Each RAR and RXR has a spe-cific DNA-binding domain by which these nuclear receptors may affect transcriptionalactivity. The DNA sequences required for action by RAR and RXR are known asretinoic acid response elements (RAREs). RAR and RXR receptors form heterodimers(RAR/RXR) that bind to DNA and control gene activity (13). In addition, RXR recep-tors can form heterodimers with the thyroid hormone receptor, vitamin D3 receptor(VDR), peroxisome proliferator-activated receptors (PPAR), and a number of orphannuclear receptors. Most RAREs seem to occur in the regulatory region of genes. In thepresence of 9-cis-retinoic acid, RXR/RXR homodimers may form and recognize a sub-set of RAREs or inhibit the formation of certain heterodimers.
Orphan nuclear receptors (gene products that embody structural features of nuclearreceptors that were identified without any prior knowledge of their association with aputative ligand) (14), such as chicken ovalbumin upstream promoter transcription factor(15), apolipoprotein AI regulatory protein-1, transforming growth factor-β-activatedkinase 1 (TAK1) (16), RVR (17), retinoid Z receptor (18), retinoid-related orphan recep-tors (19), and thymus orphan receptor (20) may repress or modulate the induction ofgenes by retinoic acid. Thus, RARs and RXRs may interact with multiple transcrip-tional mediators and/or corepressors, adding an enormous level of complexity to regu-lation of retinoic acid responses (21). About 40 vertebrate orphan nuclear receptors havebeen identified (14). In the scientific literature, the number of genes regulated eitherdirectly or indirectly by retinoids is growing rapidly (22). Other vitamin A metabolitesin the retroretinoid family may support biological functions via a pathway that is dis-tinct from the retinoic acid pathway. 14-hydroxy-4,14-retro retinol supports cell growth,whereas anhydroretinol inhibits cell growth (23–25) and induces cell death (26).Additionally, the oxoretinoids may play a role as RAR ligands (27).
Recently described nuclear receptor-associated proteins, such as SMRT/N-CoR,Sin3, and histone deacetylases-1 and -2), and histone acetylases (CBP/p300 andP/CAF), appear to function as corepressors and coactivators of transcription. A binaryparadigm has emerged as an attempt to explain how these proteins work. Unligatedreceptors bind to response elements of target genes and repress transcription throughrecruitment of a repressor complex containing corepressors. Ligand binding causes thedissociation of corepressor proteins and promotes the association of coactivators withliganded receptors. The formation of these regulatory complexes may prove critical indetermining which signaling pathway is followed at a given time (28).

576 Part VI / Prevention Major Disabilities
3. EFFECTS OF VITAMIN A DEFICIENCY
3.1. Immunity3.1.1. INFECTIOUS DISEASES
Clinical vitamin A deficiency and/or low circulating vitamin A concentrations consistentwith vitamin A deficiency have been described in a variety of infectious diseases, includ-ing chicken pox (29), diarrhea (30), endometritis (31), human immunodeficiency virus(HIV) infection (32), leprosy (33), malaria (34), measles (35), meningococcal disease (36),otitis media (37), pneumonia (38), respiratory syncytial virus infection (39), rheumaticfever (40), tuberculosis (41), schistosomiasis (42), and whooping cough (43). Serum retinolconcentrations may drop during infection because of decreased intake and absorption ofdietary vitamin A caused by diarrhea or intestinal pathogens, decreased mobilization ofhepatic reserves of retinol, accelerated utilization by target tissues, and increased urinarylosses of vitamin A during the acute phase response (29,44,45). Overall, episodes of infec-tion seem to hasten the depletion of vitamin A stores (29,46,47). Given the close relation-ship between immune effector cell function and the availability of vitamin A, low serumvitamin A concentrations during infection may have detrimental effects on the immuneresponse. Infectious diseases that have been associated with vitamin A deficiency areshown in Table 1.
Low serum vitamin A concentrations have been associated with night blindness andincreased infectious disease morbidity (48). Individuals with low vitamin A concentra-tions have increased risk of morbidity and mortality during measles (35), HIV infection(32,49), respiratory syncytial virus infection (39), and meningococcal disease (36).Impairment of immune responses during infections may be related to the inability of Tand B cells to function without adequate levels of retinol (50). Night blindness in preg-nant women has been associated with increased infectious disease morbidity and ele-vated acute phase proteins (48,51).
3.1.2. INCREASED MORTALITY
The biological consequences of vitamin A deficiency during infection include increasedmorbidity and mortality (52). After an extensive global survey of vitamin A deficiency, in1964, Oomen et al. recognized that there was a vicious cycle of vitamin A deficiency andinfection: “Not only may deficiency of vitamin A itself play an important role in loweringthe resistance to infection...but infectious diseases themselves predispose to and actually pre-cipitate xerophthalmia” (53). The idea of a “vicious cycle” was revived again in the late1980s (54). Longitudinal studies in Indonesia showed that the mortality rate for childrenwith mild xerophthalmia was four times greater than age-matched controls. The higher mor-tality was apparent even after accounting for differences in concurrent illnesses and protein-energy status. In addition, children with pre-existing xerophthalmia had higher rates ofsubsequent diarrhea and respiratory disease, whereas children who developed diarrhea andrespiratory disease were at increased risk of subsequently developing xerophthalmia (55,56).Other studies also showed an association between mild vitamin A deficiency and increasedmorbidity in children (57,58).
3.1.3. MUCOSAL IMMUNITY
Vitamin A deficiency may cause a breakdown in mucosal immunity through patho-logical changes in the epithelia of respiratory, gastrointestinal, and urinary systems.

Chapter 23 / Impact of Vitamin A 577
This includes keratinizing metaplasia and loss of goblet cells and mucus (50,59). Loss ofintestinal brush border and goblet cells and squamous metaplasia as well as destructionof ciliated epithelia in the respiratory system have been reported in vitamin A-deficientanimals. Decreased levels of secretory immunoglobulin (Ig)A in saliva have beenreported in vitamin A-deficient children. Animal models suggest that vitamin A defi-ciency is associated with lower total IgA concentrations in the gut (60) and impairedantigen-specific IgA responses (61–63).
3.1.4. CELLULAR IMMUNITY
Atrophy of the thymus, spleen, and lymphoid tissues has been observed in childrenwho died with vitamin A deficiency (50,59). Mild vitamin A deficiency is associated withunderlying alterations in circulating T-cell subpopulations, such as decreasedCD4+CD45RA+ T cells (or “naïve” CD4 T cells), and decreased CD4/CD8 ratios (64).During HIV-1 infection, vitamin A-deficient adults had lower circulating numbers ofCD4+ lymphocyte compared to adults with normal vitamin A levels. Lower plasma vita-min A concentrations also are associated with alterations of T-cell subpopulations duringacute meningococcal infection in children and during HIV-1 infection in adults (36,65).
Vitamin A and its metabolites, including T cells of the thymus, lymphocytes in lym-phoid tissue, and peripheral blood lymphocytes, are essential for immune effector cellfunction (66). Retinoic acid is involved in the expression of interleukin (IL)-2 receptor onT cells. Retinol is essential for growth and differentiation of B cells and the production ofantibodies (67,68). Retinoic acid may enhance immunoglobulin synthesis by cord bloodmononuclear cells through increased T-cell help, that is, modulation of cytokines, whichinduce B cells to differentiate into greater numbers of immunoglobulin-secreting cells(69). In vitro studies suggest that vitamin A modulates growth and function of T and Bcells either directly or through its active metabolite, all-trans retinoic acid.
Vitamin A and β-carotene supplementation are associated with changes in lymphocytenumbers and T-cell subpopulations. The depression in circulating lymphocytes followingsurgery has been reversed in adults by administration of high-dose vitamin A (50).
Table 1Infectious Diseases Associated With Vitamin A Deficiency
Disease Subjects References
Chicken pox Children 29Diarrhea Children 30Endometritis Adults 31Human immunodeficiency virus type 1 Adults 32Leprosy Adults 33Malaria Children 34Measles Children 35Meningococcal disease Children 36Otitis media Children 37Pneumonia Children, adults 30, 38Respiratory syncytial virus Children 39Rheumatic fever Children 40Tuberculosis Children 41Schistosomiasis Adults 42

578 Part VI / Prevention Major Disabilities
Children with clinical and subclinical vitamin A deficiency who received vitamin A hadincreases in circulating CD4+ lymphocytes, especially CD4+CD45RA+, and an increasein CD4/CD8 ratio 5 wk after dosing (64). Measles infection is characterized by immunesuppression, leukopenia, and decreased circulating CD4+ lymphocytes. Administrationof high-dose vitamin A to children with measles has been shown to increase total cir-culating lymphocytes and enhance IgG responses to measles (70). Vitamin A and relatedmetabolites are potent enhancers of cellular differentiation, and vitamin A-related dif-ferentiation of lymphocytes may be a possible mechanism for the increase in CD4+
lymphocytes.
3.1.5. ANTIBODY RESPONSES
A hallmark of vitamin A deficiency is the impaired ability to mount an antibodyresponse against T cell-dependent protein antigens (50,65,71). Other types of immuneresponses may be unaffected by vitamin A deficiency (71,72). The antibody response toimmunization with tetanus toxoid or other antigens has been used to examine immunecompetence. Vitamin A-deficient children in Indonesia showed reduced antibodyresponses to tetanus toxoid (73). Supplementation with high-dose vitamin A (200,000 IUor the equivalent of 60 mg of retinol) was associated with a more than twofold enhance-ment of both primary and secondary IgG responses to tetanus toxoid compared to chil-dren who received placebo. Vitamin A potentiated IgG1 subclass responses to tetanustoxoid, which is the subclass usually involved in the protective antibody response totetanus (50). These findings suggest that the administration of vitamin A or relatedretinoids improves the ability to mount an IgG response to T cell-dependent antigens.Vitamin A supplementation given simultaneously with childhood immunization contactsenhanced antibody responses to diphtheria vaccine in infants younger than age 6 mo(74). Vitamin A supplementation did not appear to interfere with antibody responses tolive trivalent oral polio vaccine when given to infants in India (75) and Indonesia (76).
3.2. GrowthVitamin A deficiency is characterized by both stunting and wasting (77). This type of
relationship is not surprising, because the gene for growth hormone is activated byretinoic acid (78). However, the reported effects of vitamin A supplementation on childgrowth are not consistent (79). A randomized controlled clinical trial involving morethan 2000 preschool children in Indonesia demonstrated that vitamin A supplementationhad a selective effect on ponderal growth in boys but not girls (79). Improved lineargrowth among both boys and girls was noted in a controlled trial of vitamin A-fortifiedmonosodium glutamate in more than 1600 children (80). Another trial of vitamin A sup-plementation showed no effect on growth in 592 preschool children, but this small sam-ple size may have lacked sufficient power to examine the impact of vitamin A on growth(81). Vitamin A supplementation appeared to improve linear but not ponderal growth ina controlled clinical trial in Indonesia that studied 1047 preschool children (82).
3.3. Reproduction and PregnancyVitamin A is essential for normal reproduction (83). Animals deficient in vitamin A
are unable to produce sperm, and vitamin A deficiency also may affect fertility in thefemale. In both human and animal models, vitamin A deficiency is associated withincreased placental infections. Pregnancy increases the risk of vitamin A deficiency for

Chapter 23 / Impact of Vitamin A 579
both mother and newborn. Epidemics of night blindness among pregnant women werewell-known in Europe in the early part of this century (84), and night blindness is socommon in some cultures in developing countries that it has been considered to be a nor-mal associate of pregnancy, similarly to morning sickness. Maternal vitamin A statusmay be important to birth outcome, because increased mortality and low birth weighthave been reported among HIV-infected pregnant women with low serum vitamin Alevels during pregnancy (85). Low serum vitamin A concentrations in pregnant women(who are confirmed HIV-negative) also have been associated with increased infant mor-tality (86). A recent clinical trial showed that the infants of women who received vitaminA supplementation (10,000 IU/d) during pregnancy had an increase in birth weight (87).
3.4. HematopoiesisVitamin A deficiency is associated with anemia in children and adults (88). Vitamin
A appears to be involved in the pathogenesis of anemia through diverse biologicalmechanisms, such as the enhancement of growth and differentiation of erythrocyteprogenitor cells, potentiation of immunity to infection and reduction of the anemia ofinfection, and mobilization of iron stores from tissues (89). Vitamin A supplementationor fortification has been shown to improve iron status and reduce anemia among chil-dren and pregnant women (89,90). The combination of vitamin A and iron in a singlesupplement appears to reduce anemia more effectively than either iron or vitamin Aalone (89,90). Studies in knockout mice have suggested that RAR activity is not neces-sary for normal hematopoiesis; however, all-trans retinoic acid and RARs play a role inmodifying hematopoiesis (91).
3.5. VisionVitamin A deficiency is the leading cause of blindness among children worldwide.
The term “xerophthalmia” is used to describe the wide spectrum of eye disease associ-ated with vitamin A deficiency, and “keratomalacia” refers to the most severe stage, inwhich the cornea undergoes ulceration and often suffers blindness (92). Vitamin A isessential for generation of rhodopsin, a visual pigment necessary for vision. The earli-est clinical manifestation of vitamin A deficiency is night blindness (92). Vitamin Adeficiency generally has an effect on mucosal epithelia, including the conjunctiva andcornea. Mild vitamin A deficiency causes squamous metaplasia of the conjunctiva (whichmay be detectable microscopically) or may form a Bitot’s spot (a well-demarcated area ofkeratinizing squamous metaplasia on the temporal or nasal bulbar conjunctiva). Bitot’sspots are considered pathognomonic for mild vitamin A deficiency. Severe xeroph-thalmia is characterized by classic, punched-out, full-thickness corneal ulceration; theseulcers may be sterile or may rapidly become secondarily infected with melting of thecorneal stroma. The ocular manifestations of vitamin A deficiency are described indetail in refs. 30, 45, and 92.
4. EPIDEMIOLOGY OF VITAMIN A DEFICIENCY
4.1. PrevalenceThe World Health Organization (WHO) and the United Nations Children’s Fund
(UNICEF) estimate that there are 2.8 million preschool children with clinical vitamin Adeficiency and 251 million preschool children with subclinical vitamin A deficiency

580 Part VI / Prevention Major Disabilities
worldwide (93). Another recent estimate suggests that there are 4.4 million preschoolchildren with xerophthalmia and 127 million preschool children with serum retinol con-centrations of less than 0.70 μmol/L or abnormal impression cytology (94). An esti-mated 7.2 million pregnant women are deficient in vitamin A (defined as having serumor breast milk vitamin A concentrations less than 0.70 μmol/L) (94). An estimated 6 mil-lion pregnant women develop night blindness each year (94). The risk of vitamin A defi-ciency is highest among populations in south Asia, southeast Asia, sub-Saharan Africa,parts of Central and South America, and some areas of the Western Pacific (94,95).
The global prevalence of blindness resulting from vitamin A deficiency is not well-known. Much of the blindness from vitamin A deficiency occurs in children with acute,complicated measles, and in surveys from schools for the blind or visually impaired andin community-based surveys, it is often not possible to distinguish between corneal scar-ring resulting from vitamin A deficiency alone or corneal scarring from vitamin A defi-ciency combined with measles; often, this diagnosis is combined (96). Measles blindnessis the single leading cause of blindness among children in low-income countries, account-ing for an estimated 15,000 to 60,000 cases of blindness per year (96), and the blindnessthat occurs with measles can be prevented with high-dose vitamin A supplementation.Worldwide, vitamin A capsule distribution programs and other improvements in sanita-tion and hygiene may be reducing the prevalence of xerophthalmia (97,98).
4.2. Risk Factors for Vitamin A DeficiencyPreschool children, pregnant women, and nonpregnant women of childbearing age
are at highest risk for vitamin A deficiency. Among preschool children, boys are athigher risk than girls (99–102). Early weaning or not breastfeeding are risk factors forvitamin A deficiency among infants in developing countries (101,103–105), because themain source of vitamin A for young infants is the retinol contained in breast milk.Vitamin A deficiency tends to occur among the poorest families; therefore, low socioe-conomic status is a strong risk factor for vitamin A deficiency. Concomitant protein-energy malnutrition also is a risk factor for vitamin A deficiency (101,103). The risk ofvitamin A deficiency can increase with the change of seasons in some areas, with thehighest risk corresponding to the lowest availability of dietary vitamin A (98).
5. DIAGNOSIS OF VITAMIN A DEFICIENCY
5.1. Eye Signs and SymptomsAlthough vitamin A deficiency has a wide spectrum of clinical manifestations (Table 2),
the clinical diagnosis in children is most commonly made through recognition of ocularsigns and symptoms, including night blindness, Bitot’s spots, corneal xerosis, or cornealulceration/keratomalacia (92). The detection of night blindness and/or Bitot’s spots is oftenuseful for determining the prevalence of mild xerophthalmia among children in developingcountries. Among pregnant women in developing countries, assessment of night blindnessis an important screening test for vitamin A deficiency. Night blindness also can be used todiagnose vitamin A deficiency among nonpregnant women of childbearing age (106).
5.2. Serum Retinol ConcentrationsSerum vitamin A concentrations remain the most widely used indicator of vitamin A sta-
tus (107) and are especially useful in large epidemiological studies. Vitamin A levels less

Chapter 23 / Impact of Vitamin A 581
than 0.7 μmol/L in children, and less than 1.05 μmol/L in adults are considered to be con-sistent with vitamin A deficiency. Factors contributing to low serum vitamin A concentra-tions include poor intake and absorption, inadequate liver stores, liver disease, increasedutilization, and the acute phase response. During the acute phase response, RBP may dis-sociate from the RBP–transthyretin–retinol complex in circulating blood, allowing abnor-mal vitamin A losses in the urine and decreased circulating vitamin A levels (44). Highurinary losses of vitamin A have been reported in individuals with pneumonia, nephritis,tuberculosis, sepsis, and malaria (44). Biological function may be compromised whenserum vitamin A concentrations fall below 1.05 μmol/L (107,108); however, further stud-ies are needed to determine whether threshold effects exist in human vitamin A deficiency.
The measurement of acute phase proteins, such as C-reactive protein and α1-acidglycoprotein, has been advocated to improve the interpretation of serum vitamin A lev-els in populations with a high prevalence of infection (109). Elevated acute phase pro-teins and infections are more common in pregnant women with night blindness (48) andin preschool children with night blindness and/or Bitot’s spots (110). These studiesshow that clinical vitamin A deficiency, infections, elevated acute phase proteins, andlow serum vitamin A concentrations are closely associated. Although acute phase pro-teins do not provide any mutually exclusive information about whether low serum vit-amin A concentrations are the result of true vitamin A deficiency or an acute phaseresponse in an individual with inflammation or infection, the argument has been madethat acute phase proteins can identify those individuals with low serum retinol concen-trations who are “misclassified” as vitamin A-deficient (111).
5.3. Breast Milk Retinol ConcentrationsBreast milk vitamin A concentrations have been advocated as an indicator of vitamin A
status in women because the technique is fairly simple, is noninvasive, and is considered
Table 2Clinical Features of Vitamin A Deficiency
Organ system Clinical features
Eye Night blindness, Bitot’s spots, corneal xerosis, corneal ulcers,fundus xerophthalmicus, keratomalacia, blindness.
Immune system Atrophy of thymus, lymph nodes, spleen; depressed antibodyand cell-mediated responses, T-cell subset alterations,increased morbidity and mortality.
Hematological Anemia, impaired lymphopoiesis.
Lungs Loss of ciliated epithelium, squamous metaplasia, goblet cells,and mucus; increased pulmonary infections.
Gastrointestinal tract Loss of brush border, atrophy of Peyer’s patches, loss of gobletcells and mucus, greater severity of diarrhea.
Genitourinary Squamous metaplasia of bladder epithelium, increasedinfections.
Reproductive Reproductive failure, low birth weight, placental infections.
Growth Stunting, wasting.

582 Part VI / Prevention Major Disabilities
more responsive to dietary or supplementary vitamin A than other indicators (112). Thepresence of vitamin A in human milk has been established for nearly eight decades (113)and has been considered to reflect maternal dietary intake of vitamin A (114,115).Supplementation of both pregnant women (116) and lactating women (117) with oral vit-amin A increases breast milk vitamin A concentrations. The response of breast milk vita-min A concentrations following oral vitamin A supplementation has been characterizedamong pregnant women with a high prevalence of infections (118). Breast milk vitamin Aconcentrations of less than 0.70 μmol/L and 1.00 μmol/L have been proposed as cut-offsfor low levels of vitamin A in breast milk (112).
5.4. Other Methods of DiagnosisVitamin A status can be measured by other techniques that measure end organ
effects of vitamin A (conjunctival impression cytology, dark adaptation) and liverreserves of vitamin A (relative dose—response [RDR], modified relative dose—response [MRDR]). Conjunctival impression cytology, a technique proposed as earlyas the 1950s (119,120), is based on cytological examination of cells removed from theconjunctiva of the eye (121). Dark adaptation has been recognized for decades to beuseful, in various forms, for measuring vitamin A deficiency (122). The RDR (123)and the MRDR tests (124) are indirect measures of hepatic vitamin A stores. Generally,abnormal RDRs and MRDRs correlate well with low serum vitamin A concentrations.MRDR may have limited sensitivity in individuals with malnutrition (125). Anothertechnique, which originally was proposed in the 1940s, involves the measurement ofpupillary diameter. This technique has advantages of being simple, rapid, and nonin-vasive, and early results have been promising (126,127). The molar ratio of RBP toTTR has been proposed as a method to diagnose vitamin A deficiency during inflam-mation (128). However, the molar ratio of RBP to TTR was not useful for diagnosingvitamin A deficiency in a large study of hospitalized children with infections (129) andwas shown to have poor sensitivity and specificity as a tool for diagnosis of vitamin Adeficiency (130).
6. OTHER
6.1. Vitamin A and Bone FracturesHigher intake of retinol (> 1500 μg/d compared with < 500 μg/d) has been associated
with an increased risk of hip fracture in older adults in Northern Europe (131). For com-parison, in the Third National Health and Nutrition Examination Survey (NHANES III)in 1988–1994, the 90th percentiles of total retinol intake from foods for men and womenages 51 to 70 yr were 1523 μg/d and 1281 μg/d, respectively (132). Median intake of vit-amin A in Scandinavian countries is reportedly higher than in Southern Europe, and across-sectional study of 175 women suggested that the risk of hip fracture increased by68% for every 1000-μg increase in daily intake of vitamin A (131). In the Nurses’ HealthStudy in the United States, women in the highest quintile of total vitamin A intake(approx 3000 μg/d of retinol equivalents) had an increased relative risk (RR) of hipfracture (RR = 1.48, 95% confidence interval [CI] 1.05–2.07) (133). However, poten-tial confounding may exist in the Nurses’ Health Study, because moderate alcohol con-sumption has been associated with a lower risk of hip fracture, and women with highervitamin A intake consumed less alcohol (134) (see Chapter 28).

Chapter 23 / Impact of Vitamin A 583
In a population-based longitudinal study of 2322 men ages 49 to 51 yr, serum retinolconcentrations in the highest quintile (>2.64 μmol/L) were compared with the middlequintile (2.17–2.36 μmol/L), and men in the highest quintile had an increased RR offracture (RR = 1.64, 95% CI, 1.12–2.41) (135). In NHANES III, serum retinol concen-trations at the 75th percentile for non-Hispanic Caucasian men and women ages 51–70 yrwere 2.55 and 2.37 μmol/L, respectively; for non-Hispanic African-American men andwomen ages 51–70 yr, retinol concentrations were 2.44 and 2.27 μmol/L, respectively(136). Serum retinol concentrations greater than 2.64 μmol/L (as reported in Sweden;ref. 135) are not exceptionally high, and even the upper limit of normal is 3.5 μmol/L(137). The association between retinol intake and levels has not been corroborated byother large studies. In NHANES III, there was no association between serum retinylesters and bone mineral density (138). Additionally, a recent randomized trial involving80 healthy men ages 18–58 yr showed that vitamin A supplementation (25,000 IU/d) didnot alter serum markers of skeletal bone turnover (139).
7. VITAMIN A AS A PUBLIC HEALTH INTERVENTION
7.1. Brief HistoryThe use of liver extracts as a cure for night blindness has been described in antiquity.
In the 19th century, cod liver oil—a potent source of vitamins A and D—was empiri-cally recognized to have therapeutic value in the treatment of anemia, tuberculosis, andother disorders. In the 18th and 19th centuries, there were numerous reports associatingnight blindness with increased morbidity and mortality. The existence of vitamin A wasdemonstrated through a long incremental process that included contributions byMagendie (140); Lunin (141); Socin (142); Pekelharing (143); Stepp (144); Hopkins(145); Osborne and Mendel (146,147); McCollum, Davis, Simmonds, Becker, andShipley (148,149); Karrer (150); Holmes and Corbett (151); and others. Different inves-tigators claimed to have “discovered” vitamin A, but the development of scientificthought occurred only through many cumulative steps and separate contributions bymany individuals (152).
By the 1920s, increased susceptibility to infection and high child mortality were attrib-uted to the lack of vitamin A (153), and provision of vitamin A was shown to reduce childmortality (43). In 1924, Erik Widmark, a professor at the University of Lund, concluded,“There must be in a population in which xerophthalmia occurs a much larger number ofcases in which the deficiency in vitamin A, without producing the eye disease, is the causeof a diminished resistance to infections,” (154). Nutritional deprivation experiments sug-gested that vitamin A deficiency increased the risk of infections, and in 1928, vitamin Awas termed the “anti-infective” vitamin (155). In the 1920s and 1930s, at least 30 trialswere conducted to determine whether vitamin A could reduce the morbidity and mortal-ity from respiratory infections, measles, puerperal sepsis, tuberculosis, and other infec-tions (156). These early trials did not provide definitive information regarding the use ofvitamin A for infections, with the exception of the important discovery by Joseph Ellisonthat vitamin A supplementation reduced mortality in children with measles (2,157).Scientific interest in use of vitamin A as anti-infective therapy appeared to wane withthe advent of the sulfa antibiotics and improvements in diet in industrialized countriesin the late 1930s. The League of Nations recognized that vitamin A deficiency con-tributed to higher mortality rates from infectious diseases, and public health programs

584 Part VI / Prevention Major Disabilities
were aimed at improving vitamin A status to reduce infectious disease morbidity andmortality (1,158).
7.2. Recent Clinical Trials of Vitamin A for Reducing Infections and Mortality
In studies conducted in the 1970s, the association of xerophthalmia with mortalityagain was observed among preschool children in Indonesia (52). A large community-based trial demonstrated that regular vitamin A supplementation reduced childhoodmortality by 34% in Indonesia (159). The Indonesian study was followed by a largeseries of clinical trials in Indonesia, India, Nepal, Sudan, and Ghana (80,160–166).These studies demonstrated that periodic vitamin A supplementation or fortificationreduced child mortality. The sole exception was the study conducted in the Sudan,which reported that high-dose vitamin A capsules had no impact on either child mortal-ity or vitamin A deficiency itself (165).
The impact of vitamin A supplementation on morbidity and mortality during measlesis striking. Worldwide, measles infection affects approx 30 million children per year,and up to 1 million children may die annually from measles and associated complica-tions. In developing countries, case-fatality rates of 10 to 20% are not uncommon, anda measles episode may result in diarrhea, pneumonia, encephalitis, blindness, anddelayed morbidity and mortality after an attack. High-dose vitamin A supplementationto children with acute, complicated measles reduces mortality by approx 50% (Table 3;refs. 157,167,168). Similarly, the morbidity of diarrhea and pneumonia associated withmeasles is reduced by vitamin A supplementation (169,170). One study using a lowertotal dose of vitamin A did not detect any impact of vitamin A supplementation onmeasles (171). It is notable in these studies that high-dose vitamin A supplementationwas shown to reduce morbidity and mortality in children without any clinical signs ofvitamin A deficiency.
Vitamin A supplementation has a dramatic impact on the severity of infectious diseasemorbidity and childhood mortality; however, it seems to have less effect on mild-to-mod-erate morbidity. Community-based trials of vitamin A supplementation have not demon-strated a consistent effect on the incidence of mild respiratory disease and diarrhea.Morbidity from respiratory infection, fever, and diarrhea (as measured by a historyobtained from the mother or father) tend to be subjective and imprecise. Studies that useweekly or even more frequent monitoring of morbidity are unable to address the issue ofsevere morbidity, because children who are ill usually are treated. Preschool children indeveloping countries are constantly being exposed to new pathogens and have high ratesof respiratory disease and diarrhea in the first years of life. The dramatic reductions insevere morbidity and mortality noted in hospital- and community-based studies of vitaminA may have led to the inflated expectation that vitamin A possibly reduces the incidence ofrespiratory disease and diarrhea among children. On an immunological basis, there is littleevidence that vitamin A prevents infection by a pathogen that is new to the host and thushas a measurable impact on incidence of infection. However, vitamin A-related immuneenhancement may result in a vigorous host response, shorter duration of infection, and lesscomplications. This suggestion comes from clinical trials that show that vitamin A supple-mentation reduces the severity of infectious disease morbidity as well as mortality (172).
Vitamin A supplementation also has been evaluated as disease-targeted therapy forother types of infections. Several clinical trials have been conducted to determine

Chapter 23 / Impact of Vitamin A 585
Table 3Vitamin A Supplementation Trials for Specific Infections or Populations
Location Year Sample size Results Reference
Vitamin A for MeaslesLondon 1932 600 58% decrease in mortality 157
during measlesTanzania 1987 180 46% decrease in mortality 167
during measlesSouth Africa 1990 189 80% decrease in mortality 168
during measlesSouth Africa 1991 60 Decrease in morbidity 169
during measlesKenya 1994 235 Decrease in morbidity 170
during measlesZambia 1996 200 No effect 171
Vitamin A and Diarrheal DiseaseBangladesh 1992 83 No effect on watery diarrhea 173China 1993 172 Decrease in incidence 174
of diarrheaBrazil 1994 1,240 Decrease in severity 175
of diarrheaIndia 1994 174 Decrease in duration 176
of diarrheaIndia 1995 216 Decrease in duration 177
of diarrheaBrazil 1996 25 Decrease in duration 178
of diarrheaBangladesh 1998 83 Decrease in morbidity of 179
shigellosis
Vitamin A for Acute Respiratory InfectionsGuatemala 1995 263 No effect 180Bangladesh 1996 165 Decrease in duration 181
of diseaseBrazil 1997 472 No effect 182Tanzania 1998 687 No effect 183Peru 1998 95 Increase in morbidity 184
Vitamin A for Respiratory Syncytial Virus InfectionChile 1996 180 No effect 185United States 1996 239 No effect 186United States 1996 32 No effect 187
Vitamin A for TuberculosisSouth Africa 1997 85 No effect 139
Vitamin A for HIV InfectionSouth Africa 1995 118 Decrease in morbidity 190
in infantsTanzania 1997 72 Decrease in mortality 191Tanzania 1998 1075 No effect on birth outcomes 192Uganda 2001 181 Decrease in mortality in 193
preschool children
(Continued)

586 Part VI / Prevention Major Disabilities
whether vitamin A supplementation reduces the severity and duration of diarrhea(173–179). Generally, these studies showed that high-dose vitamin A supplementationreduced the duration of diarrhea, and there was consensus that vitamin A supplementationreduced diarrheal morbidity. Trials of high-dose vitamin A supplementation suggest thatthere is little to no effect on the duration or severity of acute lower respiratory infectionsin children (180–184) or on respiratory syncytial virus infection in infants and children(185–187). Analysis of data from the large community-based studies suggests that vita-min A supplementation has no impact on acute lower respiratory infections (188). Asmall study suggested that high-dose vitamin A supplementation had no impact on pul-monary tuberculosis in children (189). During HIV infection, vitamin A supplementationhas been shown to reduce diarrheal morbidity in infants (190), and a stratified analysisfrom a clinical trial suggested that vitamin A supplementation reduced mortality amongHIV-infected children with pneumonia (191). Antenatal supplementation with multivi-tamins reduced fetal deaths and low birth weight among HIV-infected pregnant women,but no significant effect was noted with vitamin A alone (192). A recent controlled clin-ical trial showed that periodic high-dose vitamin A supplementation reduced mortalityby 46% among HIV-infected children in Uganda (193).
Table 3 (Continued)
Location Year Sample size Results Reference
Vitamin A Given at Time of Childhood ImmunizationsIndonesia 1995 336 Decrease in seroconversion to 194
measles vaccine, 6 moIndonesia 1997 394 No effect on seroconversion 195
to measles vaccine, 9 moGuinea Bissau 1997 312 No effect on seroconversion 196
to measles vaccine, 9 moGhana, India 1998 9424 No effect on morbidity, 197
and Peru mortalityIndonesia 1999 467 No interference with 76
seroconversion to live oral poliovirus vaccine
India 2002 399 No interference with 75seroconversion to live oralpoliovirus vaccine
Vitamin A Given at BirthIndonesia 1996 2067 Decrease in mortality 198India 1996 909 No effect on morbidity 200India 2003 11,619 22% decrease in mortality 199
Vitamin A Supplementation During PregnancySheffield 1931 550 Reduction in morbidity 31
of womenNepal 1999 19,131 30% decrease in 143
pregnancy-related mortality
Vitamin A in a Malaria Endemic AreaPapua 1999 484 Decrease in morbidity 203New Guinea

Chapter 23 / Impact of Vitamin A 587
The institution of childhood immunization programs, such as the Expanded Programmeon Immunization (EPI), has been suggested for the delivery of vitamin A supplements toinfants. It was found that high-dose vitamin A supplementation interfered with serocon-version to standard titer live measles vaccine in 6-mo-old infants who had high titers ofmaternally acquired antibodies to measles (194); however, subsequent studies showed thathigh-dose vitamin A supplementation did not interfere with seroconversion in 9-mo-oldinfants (195,196). A multicenter trial showed that vitamin A supplementation administeredthrough the EPI had no effect on morbidity and mortality (197). Vitamin A supplementa-tion given simultaneously with live trivalent oral poliovirus vaccine did not interfere withseroconversion to any of the three poliovirus types (75,76). The available data suggest thatintegration of vitamin A supplementation with childhood immunization programs at 6, 10,and 14 wk as well as at 9 mo improves vitamin A status of infants and does not have anydeleterious effects on response to immunization.
Vitamin A supplementation at the time of birth reduced infant mortality in Indonesia(198). A controlled clinical trial of 11,619 newborn infants showed that those whoreceived 24,000 IU of vitamin A on days 1 and 3 after delivery had 22% lower mortalitythan infants who received placebo (199). Another study showed that vitamin A supple-mentation to mother and infant had no effect on infant morbidity (200). Currently, it isunclear whether vitamin A supplementation has an effect on the morbidity or mortality ofinfants, especially those infants younger than age 6 mo (197,201).
A large community-based trial in lowland Nepal showed that weekly vitamin A orβ-carotene supplementation to women of childbearing age reduced maternal mortalityby about 30 to 50% (202). This trial raises the possibility that improving micronutrientstatus of women during pregnancy may reduce maternal mortality.
A recent trial conducted in Papua, New Guinea demonstrated a novel approach towardthe immense morbidity and mortality of Plasmodium falciparum malaria. Periodic high-dose vitamin A supplementation in a malaria-endemic region was shown to significantlyreduce malaria-related morbidity in preschool children (203). Most efforts directed towardmalaria have focused on insecticide-impregnated bednets and malaria vaccines, althoughvitamin A supplementation—an extremely inexpensive and simple intervention—mayhave comparable effects at a much lower cost. The presumed mechanism by whichvitamin A reduces malaria morbidity is by accelerating the acquisition of immunity tomalaria. Further studies of the effects of vitamin A on immunity to malaria are underway.
7.3. Current Indications for Use of Vitamin A Supplements in DevelopingCountries
High-dose oral vitamin A supplements are recommended for children in three gen-eral situations: (a) for the treatment of xerophthalmia, (b) for the treatment of acutemeasles, and (c) as periodic supplementation for the prevention of vitamin A deficiency(204,205). For the treatment of xerophthalmia or acute measles, 200,000 IU (the equiv-alent of 60 mg of retinol) of vitamin A is administered upon diagnosis, the followingday, and 1 mo after for children over age 1 yr, adolescents, and adults (except womenof reproductive age). For children under age 1 yr or children of any age who weigh lessthan 8 kg, the aforementioned guidelines are followed using 100,000 IU (the equivalentof 30 mg of retinol)-capsules. Many developing countries have instituted periodic high-dose vitamin A capsule distribution, and these programs generally use 200,000 IU capsulesevery 3 to 6 mo for children ages 1 to 6 yr.

588 Part VI / Prevention Major Disabilities
For women of reproductive age, pregnant or nonpregnant, the WHO/UNICEF/International Vitamin A Consultative Group recommendations are a daily dose of10,000 IU of vitamin A for 2 wk. Although this is a general recommendation, this doseoften is unavailable in many developing countries. The daily value for vitamin A inantenatal vitamins in the United States is 8,000 IU/d, and many commercial vitaminscontain this dose in the form of vitamin A, β-carotene, or a combination of both. Ingeneral, high-dose vitamin A capsules should not be used for pregnant women orwomen of reproductive age who are not using reliable contraception because of con-cerns regarding the theoretical teratogenicity of vitamin A. It is also important to rec-ognize that there are well-defined therapeutic indications in which vitamin A has beendemonstrated to be efficacious, and indiscriminate use of vitamin A supplementsshould be discouraged.
7.4. Other Studies of Vitamin A in InfantsA large, multicenter, controlled clinical trial was conducted to determine whether vit-
amin A (5000 IU administered intramuscularly three times a week) could reduce mor-tality and chronic lung disease among 807 extremely low birth-weight infants whoneeded respiratory support after birth (206). Infants who received vitamin A hadreduced risk of death or chronic lung disease at 36 wk postmenstrual age (RR = 0.89,95% CI 0.80–0.99) (206). The mean birth weights in the vitamin A and control groupswere 770 and 769 g, respectively. A subsequent, relatively small trial involving 154preterm infants (birth weight: <1000 g) showed that 5000 IU of vitamin A given orallydid not reduce the incidence of chronic lung disease after 28 d (207). Meta-analysis ofvitamin A trials for very low birth-weight infants showed that vitamin A supplementa-tion resulted in benefits in reducing death or oxygen requirement at age 1 mo (208).Recently, a case–control study showed an association between lack of vitamin A sup-plementation and sudden infant death syndrome (SIDS) (209). This study suggested apossible link between vitamin A deficiency and SIDS, although further studies areneeded to confirm this relationship.
8. PREVENTION OF VITAMIN A DEFICIENCY
8.1. Nutrition EducationThe richest dietary sources of vitamin A are liver, egg yolk, butter, cheese, and
whole milk, and in most developing country settings, these foods tend to be relativelyexpensive. Provitamin A carotenoids are found in dark green leafy vegetables, carrots,and citrus fruits such as mango and papaya; however, the bioavailability of theseprovitamin A carotenoids may be lower than previously thought (210–213). Manyefforts have been made to improve knowledge and attitudes regarding food sourcesthat are rich in vitamin A, but it may be difficult for poor families in developing coun-tries to increase consumption of vitamin A-rich foods, especially from animal foodsources.
8.2. Food FortificationVitamin A deficiency was relatively common in the United States and Europe in the
early part of the 20th century, and efforts to improve vitamin A intake included fortifi-cation of centrally distributed food products with vitamin A. In 1939, the Council on

Chapter 23 / Impact of Vitamin A 589
Foods and Nutrition of the American Medical Association (AMA) recommended thatmargarine be fortified with vitamin A (214). In the early 1950s, skim milk (which lackedvitamin A) was fortified with 2000 IU of vitamin A per quart; in 1961, the Food andNutrition Board of the US National Nutrition Council and the Council on Foods andNutrition of the AMA reaffirmed their endorsement that margarine, fluid skim milk, and drynonfat milk be fortified with vitamin A (215).
In some developing countries, such as Guatemala, fortification of sugar with vitaminA has been successful in reducing vitamin A deficiency (216). Vitamin A-fortified mar-garine improved the vitamin A status of preschool children in the Philippines (217).Similarly, fortification of wheat flour with vitamin A improved vitamin A status of schoolchildren (218). Other mechanisms for fortification with vitamin A include instant noodles,edible oils, and monosodium glutamate. Fortified foods appear to make an important con-tribution toward vitamin A intake in young children. Among poor families in Guatemala,fortified foods contributed half of the recommended vitamin A intake (219). The lowprevalence of vitamin A deficiency among preschool children in the Cook Islands hasbeen attributed partially to the requirement that certain imported foodstuffs be fortified(220). Fortified foods may help to overcome insufficient dietary intake of vitamin A inpopulations where consumption of meat and dairy products is low.
8.3. Homestead Food ProductionHomestead food production includes the production of animal foods (such as poul-
try, small animal production, and fish ponds) and the practice of homestead gardeningto grow food for the family and to provide additional income (221). In the current bio-medical model for nutrition and health in developing countries, local and family levelinitiatives often have been ignored in favor of vertical health programs. Homestead foodproduction is an attractive strategy that may be sustainable and may allow empower-ment of poor families and communities. The health and nutritional status of the lowestincome families usually is the poorest; therefore, homestead food production may havethe greatest benefit where such an impact is needed (222). In many developing coun-tries worldwide, vitamin A, iron, and zinc deficiencies are considered a public healthproblem among women and preschool children and are associated with increased infec-tious disease morbidity, maternal and child anemia, and child growth retardation.
Although homestead food production has been advocated as a strategy to improvevitamin A status, there are limited data demonstrating an impact of this strategy onmicronutrient status and health (223,224). Homestead food production may be a basicfactor that increases food availability and intrahousehold food distribution andimproves household economic status, with an immediate effect on nutritional status andinfectious disease morbidity (224). A recent study from South Africa suggests that homegardening may improve vitamin A status in preschool children (225).
8.4. Other StrategiesThe gene for β-carotene synthesis in Narcissus pseudonarcissus, a daffodil, has been
incorporated into the rice genome, yielding golden rice (226,227). This β-carotene-richvariety of rice has the potential to reduce vitamin A deficiency in Southeast Asia—thepart of the world where the prevalence of vitamin A deficiency has been high amongchildren. The safety and efficacy of golden rice in improving vitamin A status of preschoolchildren have not yet been characterized. Potential hurdles in the implementation of this

590 Part VI / Prevention Major Disabilities
promising strategy include special interest groups that are opposed to any form of genet-ically engineered crop. Treatment for intestinal parasites such as Ascaris lumbricoidesmay help to improve the vitamin A status of children who consume a diet high in provi-tamin A carotenoids (228,229).
9. SUMMARY AND RECOMMENDATIONS
Vitamin A is a potent immune enhancer that has shown efficacy in reducing morbid-ity and mortality from some infectious diseases among children in developing countriesand has reduced blindness among children worldwide. Improved vitamin A nutriture isexpected to prevent 1.3 to 2.5 million deaths worldwide each year, and periodic high-dose vitamin A supplementation is now widely practiced in many developing countrieswhere vitamin A deficiency is endemic. High-dose vitamin A supplementation for chil-dren with acute, complicated measles may also contribute to a reduction in child mor-tality, given the estimated 1 million deaths from measles each year, and may alsocontribute to a reduction in measles blindness (96). A variety of approaches, such asfood fortification, supplementation, nutrition education, and home gardening may beused in developing countries to combat vitamin A deficiency and increase resistance toinfectious diseases.
As a disease-targeted therapy, vitamin A supplementation has been shown to enhanceimmunity and reduce the morbidity of measles and diarrheal disease, and there are otherpotential applications for vitamin A, such as adjunct therapy for tuberculosis. A recentclinical trial suggests that enhancement of immunity to malaria using high-dose vitaminA may be a potential strategy to reduce morbidity and mortality by P. falciparummalaria. In situations where daily supplements could be delivered, the use of multivita-mins including vitamin A is being evaluated for improvement of birth outcomes andreduction of maternal mortality.
ACKNOWLEDGMENTS
This work was supported in part by grants from the National Institutes of Health(HD30042, HD32247, AI41956, DA15022, DA10252), the Fogarty InternationalCenter.
REFERENCES1. Semba RD. The vitamin A and mortality paradigm: past, present, and future. Scand J Nutr 2001;
45:46–50.2. Semba RD. On Joseph Bramhall Ellison’s discovery that vitamin A reduces measles mortality.
Nutrition 2003; 19:390–394.3. Harrison EH, Hussain MM. Mechanisms involved in the intestinal digestion and absorption of
dietary vitamin A. J Nutr 2001; 131:1405–1408.4. Noy N. Retinoid-binding proteins: mediators of retinoid action. Biochem J 2000; 348:481–495.5. Goodman DS. Biosynthesis, Absorption, and Hepatic Metabolism of Retinol. In: Sporn MB, Roberts
AB, Goodman DS, eds. The Retinoids, Vol. 2. Academic,New York, 1984, pp. 1–39.6. Blaner WS, Olson JA. Retinol and Retinoic Acid Metabolism. In: Sporn MB, Roberts AB, Goodman DS
eds. The Retinoids: Biology, Chemistry, and Medicine, 2nd ed. Raven, New York, 1994, pp. 229–255.7. Castenmiller JJ, West CE. Bioavailability and bioconversion of carotenoids. Annu Rev Nutr 1998;
18:19–38.8. Olson JA, Gunning DB, Tilton RA. Liver concentrations of vitamin A and carotenoids, as a function
of age and other parameters, of American children who died of various causes. Am J Clin Nutr 1984;39:903–910.

Chapter 23 / Impact of Vitamin A 591
9. West KP Jr, Sommer A. Periodic, large oral doses of vitamin A for the prevention of vitamin A defi-ciency and xerophthalmia: a summary of experiences. Nutrition Foundation, Washington, DC, 1984,pp. 1–44.
10. Soprano DR, Blaner WS. Plasma Retinol-Binding Protein. In: Sporn MB, Roberts AB, Goodman DS,eds. The Retinoids: Biology, Chemistry, and Medicine, 2nd ed. Raven, New York, 1994, pp. 257–281.
11. Aranda A, Pascual A. Nuclear hormone receptors and gene expression. Physiol Rev 2001;81:1269–1304.
12. Kliewer SA, Umesono K, Mangelsdorf DJ, Evans RM. Retinoid X receptor interacts with nuclearreceptors in retinoic acid, thyroid hormone and vitamin D3 signalling. Nature 1992; 355:446–449.
13. Rastinejad F. Retinoid X receptor and its partners in the nuclear receptor family. Curr Opin StructBiol 2001; 11:33–38.
14. Giguère V. Orphan nuclear receptors: from gene to function. Endocrine Rev 1999; 20:689–725.15. Tran P, Zhang XK, Salbert G, Hermann T, Lehmann JM, Pfahl M. COUP orphan receptors are neg-
ative regulators of retinoic acid response pathways. Mol Cell Biol 1992; 12:4666–4676.16. Hirose T, Apfel R, Pfahl M, Jetten AM. The orphan receptor TAK1 acts as a repressor of RAR-,
RXR- and T3R-mediated signaling pathways. Biochem Biophys Res Comm 1995; 211:83–91.17. Retnakaran R, Flock G, Giguère V. Identification of RVR, a novel orphan nuclear receptor that acts
as a negative transcriptional regulator. Mol Endocrinol 1994; 8:1234–1244.18. Carlberg C, van Huijsduijnen RH, Staple JK, DeLamarter JF, Becker-André M. RZRs, a new fam-
ily of retinoid-related orphan receptors that function as both monomers and homodimers. MolEndocrinol 1994; 8:757–770.
19. Jetten AM, Kurebayashi S, Ueda E. The ROR nuclear orphan receptor subfamily: critical regulatorsof multiple biological processes. Prog Nucleic Acid Res Mol Biol 2001; 69:205–247.
20. Ortiz MA, Piedrafita FJ, Pfahl M, Maki R. TOR: a new orphan receptor expressed in the thymus thatcan modulate retinoid and thyroid hormone signals. Mol Endocrinol 1995; 9:1679–1691.
21. Wei LN. Retinoid receptors and their coregulators. Annu Rev Pharmacol Toxicol 2003; 43:47–72.22. Balmer JE, Blomhoff R. Gene expression regulation by retinoic acid. J Lipid Res 2002;
43:1773–1808.23. Buck J, Derguini F, Levi E, Nakanishi K, Hämmerling U. Intracellular signaling by 14-hydroxy- 4,
14-retro retinol. Science 1991; 254:1654–1655.24. Buck J, Grün F, Kimura S, Noy N, Derguini F, Hämmerling U. Anhydroretinol: a naturally occur-
ring inhibitor of lymphocyte physiology. J Exp Med 1993;178:675–680.25. Eppinger TM, Buck J, Hämmerling U. Growth control or terminal differentiation: endogenous pro-
duction and differential activities of vitamin A metabolites in HL-60 cells. J Exp Med 1993;178:1995–2005.
26. Chen Y, Buck J, Derguini F. Anhydroretinol induces oxidative stress and cell death. Cancer Res1999; 59:3985–3990.
27. Blumberg B, Bolado J Jr, Derguini F, et al. Novel retinoic acid receptor ligands in Xenopus embryos.Proc Natl Acad Sci USA 1996; 93:4873–4878.
28. Nagy L, Thomazy VA, Heyman RA, Davies PJA. Retinoid-induced apoptosis in normal and neo-plastic tissues. Cell Death Dif 1998; 5:11–19.
29. Campos FACS, Flores H, Underwood BA. Effect of an infection on vitamin A status of children asmeasured by the relative dose response (RDR). Am J Clin Nutr 1987; 46:91–94.
30. Sommer A. Nutritional Blindness. Oxford University Press, New York, 1982.31. Green JM, Pindar D, Davis G, Mellanby E. Diet as a prophylactic agent against puerperal sepsis with
specific reference to vitamin A as an anti-infective agent. Brit Med J 1931; 2:595–598.32. Semba RD, Graham NMH, Caiaffa WT, et al. Increased mortality associated with vitamin A defi-
ciency during human immunodeficiency virus type 1 infection. Arch Intern Med 1993;153:2149–2154.
33. Sher R, Shulman G, Baily P, Politzer WM. Serum trace elements and vitamin A in leprosy subtypes.Am J Clin Nutr 1981; 34:1918–1924.
34. Stürchler D, Tanner M, Hanck A, et al. A longitudinal study on relations of retinol with parasiticinfections and the immune response in children of Kikwawila village, Tanzania. Acta Tropica 1987;44:213–227.
35. Markowitz LE, Nzilambi N, Driskell WJ, et al. Vitamin A levels and mortality among hospitalizedmeasles patients, Kinshasa, Zaire. J Trop Pediatr 1989; 35:109–112.
36. Semba RD, Bulterys M, Munyeshuli V, et al. Vitamin A deficiency and T-cell subpopulations in chil-dren with meningococcal disease. J Trop Pediatr 1996; 42:287–290.

592 Part VI / Prevention Major Disabilities
37. Lloyd-Puryear M, Humphrey JH, West KP Jr, et al. Vitamin A deficiency and anemia amongMicronesian children. Nutr Res 1989; 9:1009–1016.
38. Lindquist T. Untersuchungen über das Vitamin A bei Pneumonie. Klin Wochenschr 1937;39:1345–1348.
39. Neuzil KM, Gruber WC, Chytil F, Stahlman MT, Engelhardt B, Graham BS. Serum vitamin A lev-els in respiratory syncytial virus infection. J Pediatr 1994; 124:433–436.
40. Shank RE, Coburn AF, Moore LV, Hoagland CL. The level of vitamin A and carotene in the plasmaof rheumatic subjects. J Clin Invest 1944; 23:289–295.
41. Solon FS, Popkin BM, Fernandez TL, Latham MC. Vitamin A deficiency in the Philippines: a studyof xerophthalmia in Cebu. Am J Clin Nutr 1978; 31:360–368.
42. Abdelgani SM, Hussein L, Shaaban S. Vitamin A status in different stages of schistosomal cases andthe effectiveness of oral vitamin A therapy. Z Ernahrungswiss 1990; 29:249–255.
43. Blegvad O. Xerophthalmia, keratomalacia, and xerosis conjunctivae. Am J Ophthalmol 1924;7:89–117.
44. Stephensen C, Alvarez J, Kohatsu J, et al. Vitamin A is excreted in the urine during acute infection.Am J Clin Nutr 1994; 60:388–392.
45. West KP Jr. Vitamin A deficiency: health, survival, and vision. Oxford University Press, New York,1996.
46. Mitra AK, Alvarez JO, Guay-Woodford L, Fuchs GJ, Wahed MA, Stephensen CB. Urinary retinolexcretion and kidney function in children with shigellosis. Am J Clin Nutr 1998; 68:1095–1103.
47. Mitra AK, Alvarez JO, Stephensen CB. Increased urinary retinol loss in children with severe infec-tions. Lancet 1998; 351:1033–1034.
48. Christian P, Schulze K, Stoltzfus RJ, West KP Jr. Hyporetinolemia, illness symptoms, and acutephase protein response in pregnant women with and without night blindness. Am J Clin Nutr 1998;67:1237–1243.
49. Semba RD, Caiaffa WT, Graham NMH, Cohn S, Vlahov D. Vitamin A deficiency and wasting aspredictors of mortality in human immunodeficiency virus-infected injection drug users. J Infect Dis1995; 171:1196–1202.
50. Semba RD. Vitamin A, immunity, and infection. Clin Infect Dis 1994; 19:489–499.51. Christian P, West KP Jr, Khatry SK, et al. Night blindness of pregnancy in rural Nepal—nutritional
and health risks. Int J Epidemiol 1998; 27:231–237.52. Sommer A, Tarwotjo I, Hussaini G, Susanto D. Increased mortality in children with mild vitamin A
deficiency. Lancet 1983; 2:585–588.53. Oomen HAPC, McLaren DS, Escapini H. Epidemiology and public health aspects of hypovita-
minosis A. Trop Geogr Med 1964; 4:271–315.54. Sommer A. Vitamin A status, resistance to infection, and childhood mortality. Ann NY Acad Sci
1990; 587:17–23.55. Sommer A, Katz J, Tarwotjo I. Increased risk of respiratory disease and diarrhea in children with
preexisting mild vitamin A deficiency. Am J Clin Nutr 1984; 40:1090–1095.56. Sommer A, Tarwotjo I, Katz J. Increased risk of xerophthalmia following diarrhea and respiratory
disease. Am J Clin Nutr 1987; 45:977–980.57. Milton RC, Reddy V, Naidu AN. Mild vitamin A deficiency and childhood morbidity—An Indian
experience. Am J Clin Nutr 1987; 46:827–829.58. Bloem MW, Wedel M, Egger RJ, et al. Mild vitamin A deficiency and risk of respiratory tract dis-
eases and diarrhea in preschool and school children in northeastern Thailand. Am J Epidemiol 1990;131:332–339.
59. Nauss KM. Influence of Vitamin A Status on the Immune System. In: Bauernfeind JC, ed. VitaminA Deficiency and Its Control. Academic Press, Orlando, FL, 1986, pp. 207–243.
60. Rombout JH, Sijtsma SR, West CE, et al. Effect of vitamin A deficiency and Newcastle disease virusinfection on IgA and IgM secretion in chickens. Brit J Nutr 1992; 68:753–763.
61. Ahmed F, Jones DB, Jackson AA. Effect of vitamin A deficiency on the immune response to epi-zootic diarrhoea of infant mice (EDIM) rotavirus infection in mice. Brit J Nutr 1991; 65:475–485.
62. Wiedermann U, Hanson LÅ, Holmgren J, Kahu H, Dahlgren UI. Impaired mucosal antibodyresponse to cholera toxin in vitamin A-deficient rats immunized with oral cholera vaccine. InfectImmun 1993; 61:3952–3957.
63. Gangopadhyay NN, Moldoveanu Z, Stephensen CB. Vitamin A deficiency has different effects onimmunoglobulin A production and transport during influenza A infection in BALB/c mice. J Nutr1996; 126:2960–2967.

Chapter 23 / Impact of Vitamin A 593
64. Semba RD, Muhilal, Ward BJ, et al. Abnormal T-cell subset proportions in vitamin A-deficient chil-dren. Lancet 1993; 341:5–8.
65. Semba RD, Park S, Royal W, Griffin DE. Vitamin A deficiency and T-cell subpopulations in HIV-infected adults. Nutr Res 1996; 16:915–923.
66. Semba RD. The role of vitamin A and related retinoids in immune function. Nutr Rev 1998;56(Suppl 2):S38–S48.
67. Buck J, Ritter G, Dannecker L, et al. Retinol is essential for growth of activated human B cells.J Exp Med 1990; 171:1613–1624.
68. Wang W, Napoli JL, Ballow M. The effects of retinol on in vitro immunoglobulin synthesis by cordblood and adult peripheral blood mononuclear cells. Clin Exp Immunol 1993; 92:164–168.
69. Wang W, Ballow M. The effects of retinoic acid on in vitro immunoglobulin synthesis by cord bloodand adult peripheral blood mononuclear cells. Cell Immunol 1993; 148:291–300.
70. Coutsoudis A, Kiepiela P, Coovadia HM, Broughton M. Vitamin A supplementation enhances spe-cific IgG antibody levels and total lymphocyte numbers while improving morbidity in measles.Pediatr Inf Dis J 1992; 11:203–209.
71. Ross AC. Vitamin A status: relationship to immunity and the antibody response. Proc Soc Exp BiolMed 1992; 200:303–320.
72. Ross AC, Hämmerling UG. Retinoids and the Immune System. In: Sporn MB, Roberts AB,Goodman DS, eds. The Retinoids: Biology, Chemistry, and Medicine, 2nd ed. Raven, New York,1994: pp. 521–543.
73. Semba RD, Muhilal, Scott AL, et al. Depressed immune response to tetanus in children with vita-min A deficiency. J Nutr 1992; 122:101–107.
74. Rahman MM, Mahalanabis D, Hossain S, et al. Simultaneous vitamin A administration at routineimmunization contact enhances antibody response to diphtheria vaccine in infants younger than sixmonths. J Nutr 1999; 129:2192–2195.
75. Bahl R, Bhandari N, Kant S, Molbak K, Ostergaard E, Bhan MK. Effect of vitamin A administeredat Expanded Program on Immunization contacts on antibody response to oral polio vaccine. EurJ Clin Nutr 2002; 56:321–325.
76. Semba RD, Muhilal, Mohgaddam NE, et al. Integration of vitamin A supplementation with theExpanded Program on Immunization does not affect seroconversion to oral poliovirus vaccine ininfants. J Nutr 1999; 129:2203–2205.
77. West KP Jr. Dietary vitamin A deficiency: effects on growth, infection, and mortality. Bull Food Nutr1991; 13:119–131.
78. Bedo G, Santisteban P, Aranda A. Retinoic acid regulates growth hormone expression. Nature 1989;339:231–234.
79. West KP Jr, Djunaedi E, Pandji A, et al. Vitamin A supplementation and growth: a randomized com-munity trial. Am J Clin Nutr 1988; 48:1257–1264.
80. Muhilal, Permeisih D, Idjradinata YR, et al. Vitamin A-fortified monosodium glutamate and health,growth, and survival of children: a controlled field trial. Am J Clin Nutr 1988; 48:1271–1276.
81. Ramakrishnan U, Latham MC, Abel R. Vitamin A supplementation does not improve growth ofpreschool children: a randomized, double-blind field trial in South India. J Nutr 1995; 125:202–211.
82. Hadi H, Stoltzfus RJ, Dibley MJ, et al. Vitamin A supplementation selectively improves the lineargrowth of Indonesian preschool children: results from a randomized controlled trial. Am J Clin Nutr2000; 71:507–513.
83. Eskild W, Hansson V. Vitamin A functions in the reproductive organs. In: Blomhoff R, ed. VitaminA in Health and Disease. Marcel Dekker, New York, 1994; pp. 531–559.
84. Birnbacher T, Klaften E. Die Hemeralopie der Schwangeren. Z Augenheilk 1923; 51:309–324.85. Semba RD, Miotti PG, Chiphangwi JD, et al. Infant mortality and maternal vitamin A deficiency
during human immunodeficiency virus infection. Clin Infect Dis 1995; 21:966–972.86. Semba RD, Miotti PG, Chiphangwi JD, et al. Maternal vitamin A deficiency and infant mortality.
J Trop Pediatr 1998; 44:232–234.87. Kumwenda N, Miotti PG, Taha TE, et al. Antenatal vitamin A supplementation increases birth
weight and reduces anemia among infants born to human immunodeficiency virus-infected womenin Malawi. Clin Inf Dis 2002; 35:618–624.
88. Bloem MW, Wedel M, van Agtmaal EJ, et al. Vitamin A intervention: short-term effects of a single,oral, massive dose on iron metabolism. Am J Clin Nutr 1990; 51:469–478.
89. Semba RD, Bloem MW. The anemia of vitamin A deficiency: epidemiology and pathogenesis. EurJ Clin Nutr 2002; 56:271–281.

594 Part VI / Prevention Major Disabilities
90. Suharno D, West CE, Muhilal, Karyadi D, Hautvast JGAJ. Supplementation with vitamin A and ironfor nutritional anaemia in pregnant women in West Java, Indonesia. Lancet 1993; 342:1325–1328.
91. Collins SJ. The role of retinoids and retinoic acid receptors in normal hematopoiesis. Leukemia2002; 16:1896–1905.
92. Sommer A. Vitamin A Deficiency and Its Consequences: A Field Guide to Detection and Control.3rd ed. World Health Organization, Geneva, 1995.
93. WHO/UNICEF. Global Prevalence of Vitamin A Deficiency. Micronutrient Deficiency InformationSystem Working Paper 2. World Health Organization, Geneva, 1995.
94. West KP Jr. Extent of vitamin A deficiency among preschool children and women of reproductiveage. J Nutr 2002; 139(Suppl 9):2857S–2866S.
95. McLaren DS, Frigg M. Sight and Life Manual on Vitamin A Deficiency Disorders (VADD). 2nd ed.Task Force Sight and Life, Basel, 2001.
96. Semba RD, Bloem MW. Measles blindness. Surv Ophthalmol 2004; 49:243–255.97. Muhilal, Tarwotjo I, Kodyat B, et al. Changing prevalence of xerophthalmia in Indonesia, 1977 to
1992. Eur J Clin Nutr 1995; 48:708–714.98. Semba RD, Susatio B, Muhilal, Natadisastra G. The decline of admissions for xerophthalmia at
Cicendo Eye Hospital, Indonesia, 1981–1992. Int Ophthal 1995; 19:39–42.99. Brink EW, Perera WD, Broske SP, et al. Vitamin A status of children in Sri Lanka. Am J Clin Nutr
1979; 32:84–91.100. Bloem MW, Wedel M, Egger RJ, et al. A prevalence study of vitamin A deficiency and xeroph-
thalmia in northeastern Thailand. Am J Epidemiol 1989; 129:1095–1103.101. Schaumberg DA, O’Connor J, Semba RD. Risk factors for xerophthalmia in the Republic of
Kiribati. Eur J Clin Nutr 1996; 50:761–764.102. Rosen DS, al Sharif Z, Bashir M, al Shabooti A, Pizzarello LD. Vitamin A deficiency and xeroph-
thalmia in western Yemen. Eur J Clin Nutr 1996; 50:54–57.103. Hussain MA, Ahmed SM, el Sheikh EH. Xerophthalmia in malnourished Sudanese children. Trop
Doct 1991; 21:138–141.104. Upadhyay MP, Gurung BJ, Pillai KK, Nepal BP. Xerophthalmia among Nepalese children. Am
J Epidemiol 1985; 121:71–77.105. Khatry SK, West KP Jr, Katz J, et al. Epidemology of xerophthalmia in Nepal. A pattern of house-
hold poverty, childhood illness, and mortality. Arch Ophthalmol 1995; 113:425–429.106. Semba RD, De Pee S, Panagides D, Poly O, Bloem MW. Risk factors for nightblindness among
women of childbearing age in Cambodia. Eur J Clin Nutr 2003; 57: 1627–1632.107. Underwood BA. Methods for assessment of vitamin A status. J Nutr 1990; 120:1459–1463.108. Pilch SM. Analysis of vitamin A data from the health and nutrition examination surveys. J Nutr
1987; 117:636–640.109. Filteau SM, Morris SS, Abbott RA, et al. Influence of morbidity on serum retinol of children in a
community-based study in northern Ghana. Am J Clin Nutr 1993; 58:192–197.110. Semba RD, Muhilal, West KP Jr, et al. Hyporetinolemia and acute phase proteins in children with
and without xerophthalmia. Am J Clin Nutr 2000; 72:146–153.111. Stephensen CB, Gildengorin G. Serum retinol, the acute phase response, and the apparent misclas-
sification of vitamin A status in the third Natinal Health and Nutrition Examination Survey. AmJ Clin Nutr 2000; 72:1170–1178.
112. Stoltzfus RJ, Underwood BA. Breast-milk vitamin A as an indicator of the vitamin A status ofwomen and infants. Bull World Health Organ 1995; 73:703–711.
113. Kennedy C, Palmer LS, Schultz FW. The vitamin content of breast milk. Trans Am Pediatr Soc 1923;35:26–33.
114. McCosh SS, Macy IG, Hunscher HA, Erickson BN, Donelson E. Human milk studies. XIII. Vitaminpotency as influenced by supplementing the maternal diet with vitamin A. J Nutr 1934; 7:331–336.
115. Muelemans O, de Haas JH. The carotene and vitamin A contents of mother’s milk at Batavia. IndianJ Pediatr 1936; 3:133–145.
116. Hrubetz MC, Deuel HJ Jr, Hanley BJ. Studies on carotenoid metabolism. V. The effect of a high vit-amin A intake on the composition of human milk. J Nutr 1945; 29:245–254.
117. Sobel AE, Rosenberg A, Kramer B. Enrichment of milk vitamin A in normal lactating women. Acomparison following administration of vitamin A in aqueous and oily mediums. Am J Dis Child1950; 80:932–943.
118. Semba RD, Kumwenda N, Taha TE, et al. Plasma and breast milk vitamin A as indicators of vitaminA status in pregnant women. Int J Vit Nutr Res 2000; 70:271–277.

Chapter 23 / Impact of Vitamin A 595
119. Agarwal LP, Malhoutra RL. Conjunctival smear cytology in xerosis. Ophthalmologica 1955;130:378–386.
120. Pereira da Silva WB. Carência vitamínica A. Índice de ceratinização da conjuntiva bulbar como meiode diagnóstico precoce: Estudo clínico e experimental. O Hospital 1956; 49:403–407.
121. Keenum DG, Semba RD, Wirasasmita S, et al. Assessment of vitamin A status by a disk applicatorfor conjunctival impression cytology. Arch Ophthalmol 1990; 108:1436–1441.
122. Edmund C. Some methods of testing dark-vision. Acta Ophthalmol 1926; 3:153–169.123. Flores H, Campos F, Araújo CRC, Underwood BA. Assessment of marginal vitamin A deficiency in
Brazilian children using the relative dose response procedure. Am J Clin Nutr 1987; 46:91–94.124. Tanumihardjo SA, Muhilal, Yuniar Y, et al. Vitamin A status in preschool-age Indonesian children as
assessed by the modified relative dose response (MRDR) assay. Am J Clin Nutr 1990;52:1068–1072.
125. Wahed MA, Alvarez JO, Khaled MA, Mahalanabis D, Rahman MM, Habte D. Comparison of themodified relative dose response (MRDR) and the relative dose response (RDR) in the assessment ofvitamin A status in malnourished children. Am J Clin Nutr 1995; 61:1253–1256.
126. Congdon N, Sommer A, Severns M, et al. Pupillary and visual thresholds in young children as anindex of population vitamin A status. Am J Clin Nutr 1995; 61:1076–1082.
127. Sanchez AM, Congdon MG, Sommer A, et al. Pupillary threshold as an index of population vitaminA status among children in India. Am J Clin Nutr 1997; 65:61–66.
128. Rosales FJ, Ross AC. A low molar ratio of retinol binding protein to transthyretin indicates vitaminA deficiency during inflammation: studies in rats and a posterior analysis of vitamin A-supplementedchildren with measles. J Nutr 1998; 128:1681–1687.
129. Donnen P, Dramaix M, Brasseur D, Bitwe R, Bisimwa G, Hennart P. The molar ratio of serumretinol-binding protein (RBP) to transthyretin (TTR) is not useful to assess vitamin A status duringinfection in hospitalised children. Eur J Clin Nutr 2001; 55:1043–1047.
130. Filteau SM, Willumsen JF, Sullivan K, Simmank K, Gamble M. Use of the retinol-binding protein:transthyretin ratio for assessment of vitamin A status during the acute-phase response. Br J Nutr2000; 83:513–320.
131. Melhus H, Michaelsson K, Kindmark A, et al. Excessive dietary intake of vitamin A is associate withreduce bone mineral density and increased risk for hip fracture. Ann Intern Med 1998; 129:770–778.
132. Food and Nutrition Board, Institute of Medicine: Dietary Reference Intakes for Vitamin A, VitaminK, Arsenic, Boron, Chromium, Copper, Iodine, Iron, Manganese, Molybdenum, Nickel, Silicon,Vanadium, and Zinc: A Report of the Panel on Micronutrients. National Academy Press, Washington,DC, 2001.
133. Feskanich D, Singh V, Willett WC, Colditz GA. Vitamin A intake and hip fractures among post-menopausal women. JAMA 2002; 287:47–54.
134. Denke MA. Dietary retinol—a double-edged sword. JAMA 2002; 287:102–104.135. Michaëlsson K, Lithell H, Vessby B, Melhus H. Serum retinol levels and the risk of fracture. N Engl
J Med 2003; 348:287–294.136. Ballew C, Bowman BA, Sowell AL, Gillespie C. Serum retinol distributions in residents of the
United States: third National Health and Nutrition Examination Survey, 1988–1994. Am J Clin Nutr2001; 73:586–593.
137. Semba RD. Safety of daily oral vitamin A supplementation for individuals with retinitis pigmentosa.Ann Ophthalmol 2002; 34: 194–198.
138. Ballew C, Galuska D, Gillespie C. High serum retinyl esters are not associated with reduced bonemineral density in the third National Health and Nutrition Examination Survey, 1988–1994. J BoneMiner Res 2001; 16:2306–2312.
139. Kawahara TN, Krueger DC, Engelke JA, Harke JM, Binkley NC. Short-term vitamin A supplemen-tation does not affect bone turnover in men. J Nutr 2002; 132:1169–1172.
140. Magendie F. Mémoire sur les propriétés nutritives des substances qui ne contiennent pas d’azote.Bulletin des Sciences par la Société philomatique de Paris 1816; 4:137,138.
141. Lunin N. Über die Bedeutung der anorganischen Salze für die Ernährung des Thieres. Zeitschrphysiol Chem 1881; 5:31–39.
142. Socin CA. In welcher Form wird das Eisen resorbirt? Zeitschr physiol Chem 1891; 15:93–139.143. Pekelharing CA. Over onze kennis van de waarde der voedingsmiddelen uit chemische fabrieken.
Nederlandsch Tijdschr Geneeskunde 1905; 41:111–124.144. Stepp W. Experimentelle Untersuchungen über die Bedeutung der Lipoide für die Ernährung. Z Biol
1911; 57:136–170.

596 Part VI / Prevention Major Disabilities
145. Hopkins FG. Feeding experiments illustrating the importance of accessory factors in normaldietaries. J Physiol 1912; 44:425–460.
146. Osborne TB, Mendel LB. Feeding experiments with isolated food-substances. Washington, DC,Carnegie Institute of Washington, Publication 156, 1911.
147. Osborne TB, Mendel LB. The relationship of growth to the chemical constituents of the diet. J BiolChem 1913: 15:311–326.
148. McCollum EV, Davis M. The necessity of certain lipins in the diet during growth. J Biol Chem 1913;15:167–175.
149. McCollum EV, Simmonds N, Becker JE, Shipley PG. Studies on experimental rickets. XXI. Anexperimental demonstration of the existence of a vitamin which promotes calcium deposition. J BiolChem 1922; 53:293–312.
150. Karrer P, Morf R, Schöpp K. Zur Kenntnis des Vitamins-A aus Fischtranen. Helv Chim Acta 1931;14:1036–1040.
151. Holmes HN, Corbet RE. The isolation of crystalline vitamin A. J Am Chem Soc 1937;59:2042–2047.
152. Harris LJ. Vitamins in Theory and Practice. Cambridge University Press, Cambridge, 1935.153. Bloch CE. Blindness and other diseases in children arising from deficient nutrition (lack of fat sol-
uble A factor). Am J Dis Child 1924; 27:139–148.154. Widmark E. Vitamin-A deficiency in Denmark and its results. Lancet 1924; 1: 1206–1209.155. Green HN, Mellanby E. Vitamin A as an anti-infective agent. Brit Med J 1928; 2:691–696.156. Semba RD. Vitamin A as “anti-infective” therapy, 1920–1940. J Nutr 1999; 129:783–791.157. Ellison JB. Intensive vitamin therapy in measles. Brit Med J 1932; 2:708–711.158. League of Nations. Final Report of the Mixed Committee of the League of Nations on the Relation
of Nutrition to Health, Agriculture and Economic Policy. Publication A.13.1937.II.A. League ofNations, Geneva, 1937.
159. Sommer A, Tarwotjo I, Djunaedi E, et al. Impact of vitamin A supplementation on childhood mor-tality: a randomised controlled community trial. Lancet 1986; 1:1169–1173.
160. Vijayaraghavan K, Radhaiah G, Prakasam BS, et al. Effect of massive dose vitamin A on morbidityand mortality in Indian children. Lancet 1990; 336:1342–1345.
161. Rahmathullah L, Underwood BA, Thulasiraj RD, et al. Reduced mortality among children in south-ern India receiving a small weekly dose of vitamin A. N Engl J Med 1990; 323:929–935.
162. West KP Jr, Pokhrel RP, Katz J, et al. Efficacy of vitamin A in reducing preschool child mortality inNepal. Lancet 1991; 338:67–71.
163. Kothari G. The effect of vitamin A prophylaxis on morbidity and mortality among children in urbanslums in Bombay. J Trop Ped 1991; 37:141.
164. Daulaire NMP, Starbuck ES, Houston RM, et al. Childhood mortality after a high dose of vitamin Ain a high risk population. BMJ 1992; 304:207–210.
165. Herrera MG, Nestel P, El Amin A, et al. Vitamin A supplementation and child survival. Lancet 1992;340:267–271.
166. Ghana VAST Study Team. Vitamin A supplementation in northern Ghana: effects on clinic atten-dances, hospital admissions, and child mortality. Lancet 1993; 342:7–12.
167. Barclay AJG, Foster A, Sommer A. Vitamin A supplements and mortality related to measles: a ran-domised clinical trial. BMJ 1987; 294:294–296.
168. Hussey GD, Klein M. A randomized, controlled trial of vitamin A in children with severe measles.N Engl J Med 1990; 323:160–164.
169. Coutsoudis A, Broughton M, Coovadia HM. Vitamin A supplementation reduces measles morbidityin young African children: a randomized, placebo-controlled, double-blind trial. Am J Clin Nutr1991; 54:890–895.
170. Ogaro FO, Orinda VA, Onyango FE, Black RE. Effect of vitamin A on diarrheal and respiratory com-plications of measles. Trop Geograph Med 1993; 45:283–286.
171. Rosales FJ, Kjolhede C, Goodman S. Efficacy of a single dose of 200,000 IU of oil-soluble vitaminA in measles-associated morbidity. Am J Epidemiol 1996; 143:413–422.
172. Beaton GH, Martorell R, L’Abbé KA, et al. Effectiveness of Vitamin A Supplementation in theControl of Young Child Morbidity and Mortality in Developing Countries. University of Toronto,Toronto, Canada, 1992, 1–108.
173. Henning B, Stewart K, Zaman K, Alam AN, Brown KH, Black RE. Lack of therapeutic efficacy of vit-amin A for non-cholera, watery diarrhoea in Bangladeshi children. Eur J Clin Nutr 1992; 46:437–443.

Chapter 23 / Impact of Vitamin A 597
174. Lie C, Ying C, Wang EL, Brun T, Geissler C. Impact of large dose vitamin A supplementation onchildhood diarrhoea, respiratory disease and growth. Eur J Clin Nutr 1993: 47:88–96.
175. Barreto ML, Santos LMP, Assis AMO, et al. Effect of vitamin A supplementation on diarrhoea andacute lower-respiratory-tract infections in young children in Brazil. Lancet 1994; 344:228–231.
176. Biswas R, Biswas AB, Manna B, Bhattacharya SK, Dey R, Sarkar S. Effect of vitamin A supple-mentation on diarrhoea and acute respiratory tract infection in children. Eur J Epidemiol 1994;10:57–61.
177. Dewan V, Patwari AK, Jain M, Dewan N. A randomized controlled trial of vitamin A supplementa-tion in acute diarrhea. Indian Pediatr 1995; 32:21–25.
178. Walser BL, Lima AAM, Guerrant RL. Effects of high-dose oral vitamin A on diarrheal episodesamong children with persistent diarrhea in a northeast Brazilian community. Am J Trop Med Hyg1996; 54:582–585.
179. Hossain S, Biswas R, Kabir I, et al. Single dose vitamin A treatment in acute shigellosis inBangladeshi children: randomised double blind controlled trial. BMJ 1998; 316:422–426.
180. Kjolhede CL, Chew FJ, Gadomski AM, Marroquin DP. Clinical trial of vitamin A as adjuvant treat-ment for lower respiratory tract infections. J Pediatr 1995; 126:807–812.
181. Rahman MM, Mahalanabis D, Alvarez JO, et al. Acute respiratory infections prevent improvementof vitamin A status in young infants supplemented with vitamin A. J Nutr 1996; 126:628–633.
182. Nacul LC, Kirkwood BR, Arthur P, Morris SS, Magalhães M, Fink MCDS. Randomised, doubleblind, placebo controlled clinical trial of efficacy of vitamin A treatment in non-measles childhoodpneumonia. BMJ 1997; 315:505–510.
183. Fawzi WW, Mbise RL, Fataki MR, et al. Vitamin A supplementation and severity of pneumonia inchildren admitted to the hospital in Dar es Salaam, Tanzania. Am J Clin Nutr 1998; 68:187–192.
184. Stephensen CB, Franchi LM, Hernandez H, Campos M, Gilman RH, Alvarez JO. Adverse effects ofhigh-dose vitamin A supplements in children hospitalized with pneumonia. Pediatrics 1998;101:915,916.
185. Dowell SF, Papic Z, Bresee JS, et al. Treatment of respiratory syncytial virus infection with vita-min A: a randomized, placebo-controlled trial in Santiago, Chile. Pediatr Infect Dis J 1996;15:782–786.
186. Bresee JS, Fischer M, Dowell SF, et al. Vitamin A therapy for children with respiratory syncytialvirus infection: a multicenter trial in the United States. Pediatr Infect Dis J 1996; 15:777–782.
187. Quinlan KP, Hayani KC. Vitamin A and respiratory syncytial virus infection. Serum levels and sup-plementation trial. Arch Pediatr Adolesc Med 1996; 150:25–30.
188. The Vitamin A and Pneumonia Working Group. Potential interventions for the prevention of child-hood pneumonia in developing countries: a meta-analysis of data from field trials to assess theimpact of vitamin A supplementation on pneumonia morbidity and mortality. Bull WHO 1995;73:609–619.
189. Hanekom WA, Potgieter S, Hughes EJ, Malan H, Kessow G, Hussey GD. Vitamin A status and ther-apy in childhood pulmonary tuberculosis. J Pediatr 1997; 131:925–927.
190. Coutsoudis A, Bobat RA, Coovadia HM, Kuhn L, Tsai WY, Stein ZA. The effects of vitamin A sup-plementation on the morbidity of children born to HIV-infected women. Am J Publ Health 1995;85:1076–1081.
191. Fawzi W, Mbise FL, Hertzmark E, et al. A randomized trial of vitamin A supplements in relation tomortality among human immunodeficiency virus-infected and uninfected children in Tanzania.Pediatr Infect Dis J 1999; 18:127–133.
192. Fawzi WW, Msamanga GI, Spiegelman D, et al. Randomised trial of effects of vitamin supplementson pregnancy outcomes and T cell counts in HIV-1-infected women in Tanzania. Lancet 1998;351:1477–1482.
193. Semba RD, Ndugwa C, Perry RO, Clark TD, Jackson JB, Olness K, Melikian G, et al. Effect of vit-amin A on morbidity and mortality of HIV-infected children. Abstracts of the 23rd InternationalCongress of Pediatrics, Beijing, China, September 9–14, 2001, abstract 0A-F2-2.
194. Semba RD, Munasir Z, Beeler J, et al. Reduced seroconversion to measles in infants given vitaminA with measles vaccination. Lancet 1995; 345:1330–1332.
195. Semba RD, Akib A, Beeler J, et al. Vitamin A supplementation and measles vaccination in nine-month-old infants. Public Health 1997; 111:245–247.
196. Benn CS, Aaby P, Balé C, et al. Randomised trial of effect of vitamin A supplementation on antibodyresponse to measles vaccine in Guinea-Bissau, West Africa. Lancet 1997; 350:101–105.

598 Part VI / Prevention Major Disabilities
197. WHO/CHD Immunisation-Linked Vitamin A Supplementation Study Group. Randomised trial toassess benefits and safety of vitamin A supplementation linked to immunisation in early infancy.Lancet 1998; 352:1257–1263.
198. Humphrey JH, Agoestina T, Wu L, et al. Impact of neonatal vitamin A supplementation on infantmorbidity and mortality. J Pediatr 1996; 128:489–496.
199. Rahmathullah L, Tielsch JM, Thulasiraj RD, et al. Impact of supplementing newborn infants withvitamin A on early infant mortality: community based randomised trial in southern India. BMJ 2003;327:254–259.
200. Venkatarao T, Ramakrishnan R, Nair NG, Radhakrishnan S, Sundaramoorthy L, Koya PK, KumarSK. Effect of vitamin A supplementation to mother and infant on morbidity in infancy. Indian Pediatr1996; 33:279–286.
201. West KP Jr, Katz J, Shrestha SR, et al. Mortality of infants < 6 mo of age supplemented with vita-min A: a randomized, double-masked trial in Nepal. Am J Clin Nutr 1995; 62:143–148.
202. West KP Jr, Katz J, Khatry SK et al. Double blind, cluster randomised trial of low dose supplemen-tation with vitamin A or beta carotene on mortality related to pregnancy in Nepal. BMJ 1999;318:570–575.
203. Shankar AH, Genton B, Semba RD, et al. Effect of vitamin A supplementation on morbidity due toPlasmodium falciparum in young children in Papua New Guinea: a randomised trial. Lancet 1999;354: 203–209.
204. WHO/UNICEF/IVACG Task Force. Vitamin A Supplements. A Guide to Their Use in the Treatmentand Prevention of Vitamin A Deficiency and Xerophthalmia. World Health Organization, Geneva,1988, pp. 1–24.
205. International Vitamin A Consultative Group. Guidelines for the Eradication of Vitamin A Deficiencyand Xerophthalmia. The Nutrition Foundation, Washington DC, 1988, pp. I1–IV7.
206. Tyson JE, Wright LL, Oh W, et al. Vitamin A supplementation for extremely-low-birth-weightinfants. National Institute of Child Health and Human Development Neonatal Research Network. NEngl J Med 1999; 340:1962–1968.
207. Wardle SP, Hughes A, Chen S, Shaw NJ. Randomised controlled trial of oral vitamin A supplemen-tation in preterm infants to prevent chronic lung disease. Arch Dis Child Fetal Neonatal Ed 2001;84:F9–F13.
208. Darlow BA, Graham PJ. Vitamin A supplementation for preventing morbidity and mortality in verylow birthweight infants. Cochrane Database Syst Rev 2002; (4): CD000501.
209. Alm B, Wennergren G, Norvenius SG, et al. Vitamin A and sudden infant death syndrome inScandinavia, 1992–1995. Acta Paediatr 2003; 92:162–164.
210. West CE. Meeting requirements for vitamin A. Nutr Rev 2000; 58:341–345.211. De Pee S, West CE, Muhilal, Karyadi D, Hautvast JG. Lack of improvement in vitamin A status with
increased consumption of dark-green leafy vegetables. Lancet 1995; 346:75–81.212. De Pee S, Bloem MW, Gorstein J, et al. Reappraisal of the role of vegetables in the vitamin A status
of mothers in Central Java, Indonesia. Am J Clin Nutr 1998; 68:1068–1074.213. De Pee S, West CE. Dietary carotenoids and their role in combating vitamin A deficiency: a review
of the literature. Eur J Clin Nutr 1996; 50(Suppl 3):S38–S53.214. Council on Foods and Nutrition, American Medical Association. Fortification of foods with vitamins
and minerals. J Am Med Assoc 1939; 113:681.215. Bauernfeind JC, Arroyave G. Control of Vitamin A Deficiency by the Nutrification of Food
Approach. In: Bauernfeind JC, ed. Vitamin A Deficiency and Its Control. Academic Press, NewYork, 1986, pp. 359–388.
216. Arroyave G. The Program of Fortification of Sugar With Vitamin A in Guatemala. Some FactorsBearing on its Implementation and Maintenance. In: Scrimshaw NS, Wallerstein MB, ed. NutritionPolicy Implementation: Issues and Experience. Plenum Press, New York, 1982, pp. 75–88.
217. Solon FS, Solon MS, Mehansho H, et al. Evaluation of the effect of vitamin A-fortified margarineon the vitamin A status of preschool Filipino children. Eur J Clin Nutr 1996; 50:720–723.
218. Solon FS, Klemm RD, Sanchez L, et al. Efficacy of a vitamin A-fortified wheat-flour bun on the vit-amin A status of Filipino schoolchildren. Am J Clin Nutr 2000; 72:738–744.
219. Krause VM, Delisle H, Solomons NW. Fortified foods contribute one half of recommended vitaminA intake in poor urban Guatemalan toddlers. J Nutr 1998; 128:860–864.
220. Schaumberg DA, Linehan M, Hawley G, et al. Vitamin A deficiency in the South Pacific. PublicHealth 1995; 109:311–317.

Chapter 23 / Impact of Vitamin A 599
221. Helen Keller International/Asia Pacific. Homestead Food Production—A Strategy to CombatMalnutrition and Poverty. Helen Keller International, Jakarta, Indonesia, 2001.
222. De Pee S, Bloem MW, Kiess L. Evaluating food-based programmes for their reduction of vitamin Adeficiency and its consequences. Food Nutr Bull 2000; 21:232–238.
223. Allen L, Gillespie S. What Works? A Review of the Efficacy and Effectiveness of NutritionInterventions. United Nations Administrative Committee on Coordination Sub-Committee onNutrition (ACC/SCN) and the Asian Development Bank. Asian Development Bank, Manila, 2001.
224. Bloem MW, de Pee S, Darnton-Hill I. New issues in developing effective approaches for the pre-vention and control of vitamin A deficiency. Food Nutr Bull 1998; 19:137–148.
225. Faber M, Phungula MAS, Venter SL, Dhansay MA, Benadé AJS. Home gardens focusing on the pro-duction of yellow and dark-green leafy vegetables increase the serum retinol concentrations of 2-5-y-old children in South Africa. Am J Clin Nutr 2002; 76:1048–1054.
226. Ye X, Al-Babili S, Kloti A, et al. Engineering the provitamin A (beta-carotene) biosynthetic pathwayinto (carotenoid-free) rice endosperm. Science 2000; 287:303–305.
227. Beyer P, Al-Babili S, Ye X, et al. Golden rice: introducing the beta-carotene biosynthesis pathwayinto rice endosperm by genetic engineering to defeat vitamin A deficiency. J Nutr 2002;132:506S–510S.
228. Jalal F, Nesheim MC, Agus Z, Sanjur D, Habicht JP. Serum retinol concentrations in children areaffected by food sources of beta-carotene, fat intake, and anthelmintic drug treatment. Am J ClinNutr 1998; 68:623–629.
229. Persson V, Ahmed F, Gebre-Medhin M, Greiner T. Increase in serum beta-carotene following darkgreen leafy vegetable supplementation in mebendazole-treated school children in Bangladesh. Eur JClin Nutr 2001; 55:1–9.


VII OPTIMAL PREGNANCY/INFANCY
OUTCOMES


From: Preventive Nutrition: The Comprehensive Guide for Health Professionals, Third EditionEdited by: A. Bendich and R. J. Deckelbaum © Humana Press Inc., Totowa, NJ
603
24 Folic Acid-Containing Multivitaminsand Primary Prevention of BirthDefects
Andrew E. Czeizel
KEY POINTS
● Neural-tube defects are preventable by periconceptional folic acid or multivitaminsupplementation.
● The incidence of some other structural birth defects also can be reduced by folic acid-containing multivitamin use during the periconception period.
● All women of childbearing age who are capable of becoming pregnant should consumefolic acid and/or folic acid-containing multivitamins during the periconception period.
● The primary prevention of birth defects by periconceptional folic acid/multivitaminsupplementation is much better than the so-called secondary prevention (i.e., the termi-nation of pregnancy because of severe fetal defects).
● In addition to other benefits, periconceptional care is optimal for the introduction ofpericonceptional folic acid/multivitamin supplementation.
● Food (flour) fortification is the most practical means of supplementation of folic acidand other vitamins for all women.
● Proper preparation for conception is the earliest and most effective method for theprevention of birth defects.
1. INTRODUCTION
The deficiency or overdosage of certain nutrients has a possible role in the origin ofbirth defects. In 1932, Hale (1) demonstrated that a vitamin A-free diet during early preg-nancy in sows resulted in offspring that lacked eyes. Some of the pigs also had otherdefects such as oral clefts, accessory ears, malposition of kidney, and defects of hindlegs. Hale’s concluded, “The condition is illustrative of the marked effect that a defi-ciency may have in the disturbance of the internal factors that control the mechanism ofdevelopment.” Further development of experimental teratology became possible whensmall rodents were introduced for this purpose. Joseph Warkany, one of the founders of

604 Part VII / Optimal Pregnancy/Infancy Outcomes
teratology, recognized the importance of purified diets and used these to test various vit-amin deficiencies for their teratogenic effects. Warkany (2,3) found that maternaldietary deficiency can induce structural birth defects, that is, congenital abnormalities.Marjorie Nelson (4) introduced the use of antimetabolites, which enabled conversion oflong-term nutritional experiments into short-term chemical testing. First, antimetabo-lites of folic acid were used and folic acid deficiency was proved highly teratogenic inpregnant rats (5–7), producing multiple congential abnormalities, neural tube defects(NTDs), orofacial clefts (OFCs), and other congenital abnormalities. This finding waslater confirmed in man (8–10) as well. This research approach also had strong supportfrom the French investigator Giroud (11,12). In 1964, Hibbard (13) reported a higherrate of congenital abnormalitiess (3%) in the infants of folate-deficient mothers than incontrols (1.6%); Hibbard and Smithells (14) later showed a relationship between humanembryopathies and a deficiency of folate metabolism. Therefore, these findings high-lighted the developmental importance of folate and/or folic acid. However, this firstphase of history of malnutritional teratology including folate deficiency was followedby a longer, silent period.
The second phase of history regarding malnutritional teratology is related to the inter-vention studies to check the efficacy of folic acid or folic acid-containing multivitaminuse for the primary prevention of recurrent NTDs and cleft lip ± palate in the 1980s.
Anencephaly and spina bifida (aperta or cystica) are the major classes of NTDs.Although the genetic (polygenic) background of nonsyndromic NTDs (the so-calledisolated NTDs; 92% of all cases) obviously results from the fact that recurrence in first-degree relatives is 10 times greater than their occurrence (15), this group of congenitalabnormalities is very sensitive to environmental factors. The latter is indicated by thevery wide range (0.5–12/1000) of NTD incidences in different populations, rapid secu-lar changes in their occurrence, seasonal variation of births with NTD, and, mainly, bytheir obvious socioeconomic status dependence (the risk of NTDs was found to increasefrom a low risk in the highest class to an above-average risk in the lowest class in theUnited Kingdom and some other countries [16]).
OFCs are also differentiated as isolated (nonsyndromic) or syndromic (multiple)groups. The most frequent types of isolated OFCs are cleft lip ± palate (about 1/1000)and posterior cleft palate (about 0.5/1000). Both types of OFCs are caused by polygene–environmental interaction (17).
2. INTERVENTION STUDIES FOR REDUCTION OF RECURRENTNTDS AND OFCS
The documented start of the second phase of folic acid history occurred in 1976.Smithells (18) hypothesized that among triggering environmental factors in the originof NTDs, undernutrition could be the common denominator, and his group tested thishypothesis: a lower concentration of red cell folate, riboflavin, and vitamin C was foundduring the first trimester of pregnancy in women who later gave birth to an infant withan NTD compared to matched controls. These findings prompted Smithells and hisgroup to organize the first intervention study to test the effect of diet supplemented withfolic acid and some other vitamins (19). Generally, NTDs occur between postconcep-tional days 15 and 28 in humans; most women are unaware of their pregnancy at this“critical period” of NTDs. Thus, this supplementation should commence at least 28 d

Chapter 24 / Folic Acid-Containing Multivitamins 605
prior to conception and continue to the date of the second missed menstrual period (i.e.,during the periconceptional period).
The final results of the Smithells study were published separately for the Yorkshireregion of the United Kingdom (20) and Northern Ireland (21). However, the 91 and83% reductions in NTD recurrence (Table 1), respectively, were not accepted by someexperts because of possible selection bias. Two ethical committees refused to give per-mission for the original protocol of a randomized controlled trial; therefore, the controlgroup was made up of women who had already given birth to one or more infants withNTDs and were already pregnant when referred to the study centers or of women whodeclined to take part in the intervention portion of the trial.
The study performed by Laurence et al. (22) in Wales was a randomized, double-blind trial; however, the difference between the number of NTDs in the active andplacebo groups was not significant because of the small number of women.
Thus, in the early 1980s, the Medical Research Council (MRC) in the UnitedKingdom decided to organize a multicenter (43% of participants came from Hungary),randomized, double-blind controlled trial (RCT) (Table 1; ref. 23). The MRC VitaminStudy found that a pharmacological dose (4 mg) of folic acid supplementation alonereduced NTD recurrence significantly by 71% (relative risk [RR] = 0.29, 95% confi-dence interval [CI] 0.12–0.71). There was some reduction in the recurrent NTD after theuse of other vitamins (2.6%), but it did not differ significantly from the unsupplementedgroup (4.3%). Based on these results, the Centers for Disease Control (CDC) (24) rec-ommended daily supplementation with 4 mg of folic acid under medical supervision inthe periconception period for women at high risk (i.e., those who previously gave birthto one or more offspring with NTD) for the reduction of NTD recurrence. The RCT ofthe Irish Vitamin Study Group was interrupted (25).
In 1982, Tolarova (26) reported a protective effect of multivitamins and folic acid forthe recurrence of cleft lips . She used a very high dose (10 mg) of folic acid during thepericonceptional period.
There were two major questions following the publications of the above “recurrence”studies. First, does folic acid or folic acid-containing multivitamin supplementation alsoreduce the risk of first occurrence of NTD and/or OFC? About 95% of women whodeliver infants with NTD or OFC have no previous NTD or OFC pregnancies; therefore,the prevention of first occurrence of these congenital abnormalities would be a signifi-cant public health success. The second question regarded the dose. The pharmacologicaldose (e.g., 4 mg) of folic acid may have some adverse effects, and, thus, it cannot be rec-ommended for the population at large and/or without medical supervision. TheHungarian randomized, double-blind controlled trial attempted to provide data to answerthese questions. The Hungarian RCT was based on the periconception service, thus it isworth summarizing the goals and steps of this new medical service.
3. PERICONCEPTION CARE: PLANNING FOR PREGNANCYFOR BOTH PARTNERS
The provision of preconception care was included in the National Health Promotionand Disease Prevention Objectives for 2000 in the United States (27). We prefer to usethe term periconception rather than preconception because prenatal care usually beginsin about weeks 8–12 of pregnancy; thus, the early postconceptional period would be

Tab
le 1
The
Dat
a Fr
om I
nter
vent
ion
Stud
ies
for
the
Red
ucti
on o
f N
TD
Rec
urre
nces
Wit
h su
pple
men
tW
itho
ut s
uppl
emen
t
Met
hod
Cou
ntry
Supp
lem
ent
No.
%N
o.%
Ris
k re
duct
ion
(%)
Non
rand
omiz
edY
orks
hire
(20
)1/
187
0.5
18/3
205.
691
Mul
tivita
min
a
Nor
ther
n Ir
elan
d (2
1)4/
511
0.8
17/3
534.
883
Ran
dom
ized
Wal
es (
22)
Folic
aci
d (4
mg)
2/60
3.3
4/51
7.8
58M
ultic
ente
r M
RC
(23
)Fo
lic a
cid
(4 m
g)2/
298
0.7
13/3
004.
384
Folic
aci
d +
othe
r4/
295
1.4
13/3
004.
367
vita
min
sTo
geth
er6/
593
1.0
21/6
02b
3.5
71O
ther
vita
min
s8/
302
2.6
13/3
004.
340
Iris
h V
itam
in S
tudy
(25
)Fo
lic a
cid
(0.4
mg)
0/17
20.
01/
851.
2–
aIn
clud
ed 0
.36
mg
of f
olic
aci
d.bIn
clud
ing
case
s su
pple
men
ted
with
“ot
her”
vita
min
s.
606

Chapter 24 / Folic Acid-Containing Multivitamins 607
omitted from medical health service in the United States. Therefore, during their mostsensitive and vulnerable early period (from the third postconceptional week until theeighth week), fetuses are uncared for and generally unprotected.
The Hungarian Periconception Service (HPS) (28) begins 3 mo before pregnancyand continues for 3 mo in the postconceptional period. The HPS was launched in 1984and includes information counseling, examinations, and interventions performed orsupervised by qualified nurses. The main goal is to provide information and care forprospective parents to protect the health of the mother; reduce untoward pregnancy out-comes, birth defects, and developmental disabilities; and increase the potential forinfants to be born as healthy as possible.
The HPS consists of three steps (Table 2):
1. Check-up of reproductive health: A medical check-up as a “preconceptional screening”is an essential component for risk identification and assessment and referral of couplesor persons to appropriate secondary care. This time and occasion also is optimal forpredictive genetic testing of prospective parents followed by risk estimation for theirchildren’s future lives. We have made an extra effort to incorporate males into the HPSto help in the development of responsible fatherhood, and it appears to be successful:86% of females were accompanied by their husbands or partners.
2. The 3-mo preparation for conception: The preparation for conception is an appropriateperiod to stop smoking, drinking alcohol, and taking unnecessary drugs with hazardsto germ cells and later the fetus. This 3-mo preparation period is an optimal time forthe launch of periconceptional folic acid or multivitamin supplementation. All womenwere supplied with a folic acid-containing multivitamin (Elevit pronatal®), free ofcharge.
3. The better protection of early pregnancy: In the past, pregnancies were diagnosedafter the second missed menstrual period; therefore, the most sensitive period ofearly fetal development was not recognized and protected. In the HPS, after the 3-mopreparation for conception, females are asked to continue the intake of the multivit-amin, to achieve conception on the optimal day (1 d prior to ovulation), and to visitthe HPS immediately after the first missed menstrual period. The goal of this visit ispregnancy confirmation by a sensitive pregnancy test. At that time, an ultrasoundscanning is suggested for 2 wk later (nearly all ectopic pregnancies were diagnosedas a result of this examination, such an early phase assessment allowed for conserv-ative treatment instead of surgery). Women with known occupational hazards wereexempted and informed regarding how to avoid other risks (e.g., heat bathing, expo-sure to infected cats), and pregnant women were asked to continue multivitamin sup-plementation and were referred to the prenatal care clinic with the dischargesummary of the HPS.
The periconception care is appropriate for the detection of infertile couples and totreat them sooner; to provide a more effective identification of couples with positivefamily history, case history, and/or sexually transmitted infections/disorders; and toprovide the appropriate secondary care. The HPS is optimal for the introduction of peri-conceptional multivitamin/folic acid supplementation and predictive genetic testing, forimprovement in the diet, and for cessation of smoking and alcohol consumption beforeconception. Obviously, proper preparation for conception is the earliest and probablythe most important method of health promotion in general and for the prevention ofbirth defects in particular.

608 Part VII / Optimal Pregnancy/Infancy Outcomes
4. THE HUNGARIAN RANDOMIZED CONTROLLED TRIAL
The Hungarian RCT was performed in the coordinating center of the HPS in my pre-vious department. The goal was to test the preventive effect of a physiological dose(0.8 mg) of folic acid as one component of a multivitamin (Elevit prenatal) used duringthe periconceptional period for the first occurrence of NTD and OFC. The multivitamincontained 12 vitamins, including folic acid (0.8 mg), vitamin B12 (4.0 μg), B6 (2.6 mg),B2 (1.8 mg), C (100.0 mg), four minerals, and three trace elements. The use of trueplacebo was not allowed by the ethical committee, thus a placebo-like trace elementcombination (including the three trace element components: copper, manganese, andzinc of Elevit prenatal) was used. The Hungarian RCT was launched on February 1,1984, and the recruitment was closed on April 30, 1991; pregnancy outcomes wereevaluated until the end of April 1993.
Table 2Three Steps and Different Items of the HPS
1. Check-up of reproductive healtha. Family history of females and males.b. Case history of females (e.g., epilepsy, diabetes, etc.)c. Vaginal and cervical smear examination for the screening of sexually
transmitted infections/disorders.d. Sperm analysis for the detection of subfertility and pyosperm.e. Psychosexual exploration of couples.f. Blood examination for the revealing of rubella seronegative women (they are
vaccinated), anemia and HIV positivity, in addition recently for predictivegene diagnostic tests.
2. The 3-mo preparation for conceptiona. Necessary further examinations and/or treatments in the disorders of couples
detected at the check-up examination.b. Protection of germ cells: avoidance of smoking, alcohol, and unnecessary drugs.c. Discontinuation of contraceptive pills to restore the internal hormonal
balance of females (condoms are provided).d. Occupational history to reveal occupational hazards (to contact occupational
doctor).e. Measurement of basal body temperature for detection of hormonal
dysfunction (and treatment, if necessary) and determination of the optimalday of conception.
f. Preconceptional multivitamin supplementation.g. Suggestion to check dental status.h. Guidelines for physical exercise.i. Guidelines for healthy diet.
3. The better protection of early pregnancya. To achieve conception on the optimal day.b. Early pregnancy confirmation.c. Periconceptional multivitamin supplementation.d. Avoidance of teratogenic and other risks.e. Referral of pregnant women to prenatal care clinics.
HPS, Hungarian Periconceptional Service; HIV, human immunodeficiency virus.

Chapter 24 / Folic Acid-Containing Multivitamins 609
As demonstrated in Table 3, no NTD case was found among informative offspring(liveborn infants until age 1 yr, stillborn fetuses, and prenatally diagnosed malformedfetuses after the elective termination of pregnancy) in the multivitamin group,whereas six informative offspring with NTD occurred in the placebo-like trace ele-ment, (p = 0.01). Therefore, the Hungarian RCT demonstrated that a multivitamincontaining 0.8 mg of folic acid prevented about 90% of the first occurrences of NTD(29). However, the reduction of OFC was not confirmed after the use of the folic acid-containing multivitamin (Table 4).
Based on the Hungarian RCT and some observational studies, in September1992, the CDC (30) recommended that “all women of childbearing age who arecapable of becoming pregnant should consume 0.4 mg of folic acid per day for thepurpose of reducing their risk of having a pregnancy affected with spina bifida orother neural tube defects,” and this recommendation was subsequently followed byseveral countries.
The great majority of the women in the Hungarian RCT were healthy and not mal-nourished (31); therefore, this trial was appropriate to study several other effects of peri-conceptional folic acid-containing multivitamin supplementation.
During the preconceptional multivitamin supplementation, the female cycle becamemore regular, that is, the variance was lower (32). Thus, multivitamin supplementationmay have a beneficial effect for women with irregular menstrual cycles.
There was no difference in the sexual activity (measured by the rate of weekly sex-ual intercourse) of couples between the multivitamin and the no multivitamin groups inthe preconceptional period (33). However, only women were supplemented, and sexualactivity often is determined by males.
Table 3First Occurrence of NTDs in Informative Offspring of Study Groups in the Two
Hungarian Intervention Studies
Intervention trials Supplement No supplement
Randomized controlled trialNo. of offspring 2471 2391Expected/observed number of NTD 6.9/0 6.7/6a
RR (with 95% CI) 0.07 (0.04–0.13)
Two-cohort controlled studyNo. of offspring 3056 3056Expected/observed number of NTDs 8.5/1b 8.5/9c
OR (with 95% CI) 0.11 (0.01–0.91)
Pooled dataNo. of offspring 5527 5447Expected/observed number of NTDs 15.4/1 15.2/15OR (with 95% CI) 0.08 (0.01–0.47)aAnencephaly 2. anencephaly + spina bifida (lumbal, thoracolumbal) 2. Spina bifida (thoracolumbal,
lumbosacral) 2.bAnencephaly 1.cAnencephaly 1, Spina bifida 8 (thoracolumbal 1, lumbal 4, lumbosacral 3).NTDs, neural tube defects; RR, relative risk; CI, confidence interval; OR, odds ratio.

Tab
le 4
The
Eff
icac
y of
Per
icon
cept
iona
l Fol
ic A
cid-
Con
tain
ing
Mul
tivi
tam
in (
Mic
ronu
trie
nt)
Supp
lem
enta
tion
in t
he P
rim
ary
Prev
enti
on o
f So
me
Maj
or C
onge
nita
l Abn
orm
alit
ies
Gro
ups
Hun
gari
an in
terv
enti
on tr
ials
RC
TT
CS
Pool
ed d
ata
No
No
No
supp
lem
ent
Supp
lem
ent
supp
lem
ent
supp
lem
ent
Supp
lem
ent
Supp
lem
ent
Con
geni
tal a
bnor
mal
itie
s gr
oups
(n=
2391
)(n
=24
71)
(n=
3056
)(n
=30
56)
(n=
5447
)(n
=55
27)
Uri
nary
trac
t con
geni
tal
abno
rmal
ities
Ren
al a
/dys
gene
sis
30
02
32
Cys
tic k
idne
y1
10
21
3O
bstr
uctiv
e co
ngen
ital
abno
rmal
ities
Pelv
ic u
rete
ric
junc
tion
40
132
172
Oth
er lo
catio
ns1
16
87
9To
tal
92
1914
2816
OR
(95
% C
I)0.
21 (
0.05
–0.9
5)0.
71 (
0.33
–1.5
0)0.
56 (
0.30
–1.0
4)
Car
diov
ascu
lar
cong
enita
l ab
norm
aliti
esC
onot
runc
alV
entr
icul
ar s
epta
l def
ect
82
195
277
Oth
ers
21
13
34
Subt
otal
103
208
3011
Oth
ers
107
3023
4030
Tota
l20
1050
3170
41O
R (
95%
CI)
0.42
(0.
19–0
.98)
0.60
(0.
38–0
.96)
0.57
(0.
39–0
.85)
610

Con
geni
tal l
imb
defi
cien
cies
Term
inal
tran
sver
se2
13
15
2O
ther
s3
00
03
0To
tal
51
31
82
OR
(95
% C
I)0.
19 (
0.03
–1.1
8)0.
33 (
0.01
–3.7
1)0.
25 (
0.05
–1.1
6)
Con
geni
tal p
ylor
ic s
teno
sis
82
20
102
OR
(95
% C
I)0.
24 (
0.05
–1.1
4)0.
00 (
0.00
–26.
8)0.
20 (
0.04
–0.9
0)
Ana
l/rec
tal a
tres
ia/s
teno
sis
10
41
51
OR
(95
% C
I)—
0.31
(0.
02–2
.52)
0.20
(0.
02–1
.69)
Oro
faci
al c
left
sC
left
lip
±pa
late
34
23
57
Post
erio
r cl
eft p
alat
e2
01
13
1To
tal
54
34
88
OR
(95
% C
I)0.
77 (
0.22
–2.6
9)1.
63 (
0.31
–2.8
8)0.
99 (
0.37
–2.6
3)
Dow
n sy
ndro
me
52
88
1310
OR
(95
% C
I)0.
39 (
0.07
–1.9
9)0.
76 (
0.33
–1.7
3)0.
76 (
0.33
–1.7
3)
Uni
dent
ifie
d m
ultip
leco
ngen
ital a
bnor
mal
ities
56
1512
2018
OR
(95
% C
I)1.
16 (
0.35
–3.8
1)0.
89 (
0.45
–1.6
8)0.
89 (
0.47
–1.6
8)
611

612 Part VII / Optimal Pregnancy/Infancy Outcomes
A 7% higher rate of conceptions occurred in women who were treated with the mul-tivitamin preconceptionally compared with those who were not supplemented. The timetaken to become pregnant was slightly but significantly shorter in the multivitamingroup (34).
A significantly lower rate of treated morning sickness (nausea and vomiting) occurredin early pregnancy after periconceptional multivitamin supplementation (3 vs 6.6% in theno multivitamin group) (35). There was no difference in maternal weight gain betweenthe multivitamin and no multivitamin groups before and during pregnancy (36).
All possible side effects were monitored continuously. Until January 1999, the numberof female participants in the Coordinating Center of the HPS was 14,540, and patients withpernicious anemia were not recorded among these reproductive-aged women. Amongfemale participants, 66 (0.46%) were epileptic, and 60 wanted to use multivitamin supple-mentation. There was no case with multivitamin-related side effects of epilepsy during thepericonception period (37). However, a 22-yr-old woman with epilepsy was treated con-tinuously with carbamazepine and another folic acid-containing multivitamin (1 mg) fromthe 20th wk of gestation, and she had status epilepticus and later developed symptoms ofsystemic lupus erythematosus (37). Autoimmune disease of pregnant women with epilepsycould damage the blood–brain barrier, and the pharmacological dose (≥1 mg) of folic acidmay trigger a cluster of seizures. Of 14,540 female participants, 4 (0.03%) had severe aller-gic exanthema; of these, 3 discontinued the use of multivitamin (all had a history of drug-induced allergic diseases). Among all other possible side effects, constipation (1.8 vs 0.8%)and diarrhea (1.4 vs 0.4%) were reported somewhat more often after multivitamin supple-mentation in the preconceptional period (36).
The rate of multiple births, namely twins, was about 40% higher after periconcep-tional multivitamin supplementation (38). The higher rate of twin conceptions could notbe explained by maternal factors (e.g., age, parity) or by a higher rate of infertility druguse (39). This finding was confirmed later in the United States (40) and Sweden (41)but not in China (42). However, the prevalence of twins is lowest in the Asian race(including the Chinese population), and Chinese people have an extremely high occur-rence (55%) of TT genotype of the methylenetetrahydrofolate-reductase (MTHFR) gene(43), and this genotype associates with a very low dizygotic twin rate (44). There wasa somewhat higher prevalence of multiple pregnancies after periconceptional folicacid/multivitamin supplementation in the 38,151 controls of the Hungarian Case-Control Surveillance of Congenital Abnormalities, which took place in 1980–1996 (45).
There was no significant difference in pregnancy outcomes of singletons, including fourtypes of fetal deaths: (a) chemical pregnancies (positive pregnancy test without clinicalsymptoms of pregnancy later), (b) ectopic pregnancies, (c) miscarriages (including the so-called missed abortions or blighted ova), and (d) late fetal death (stillbirths) and five vari-ables of liveborn infants (gender ratio, birth weight, gestational age, proportion of low birthweight, and preterm birth) (46), between the multivitamin and no multivitamin groups. Therates of all kinds of fetal deaths were somewhat, but not significantly, higher in the multi-vitamin group, and together the difference reached the 0.05 level of significance betweenthe multivitamin and no multivitamin groups. Additionally, the ratio of boys to girlsshowed a slight excess of girls in the multivitamin group, whereas the well-known boy pre-dominance was seen in the no multivitamin group. Thus, a small change in the pattern ofprenatal selection cannot be excluded. This finding was confirmed in the United States (47)but not in China (48). In my opinion, the slightly higher rate of fetal death may be explained

Chapter 24 / Folic Acid-Containing Multivitamins 613
by the higher proportion of multiple conceptions in the multivitamin group (49) becausethese pregnancies have some excess in the occurrence of fetal death.
Postnatal somatic (body weight, body length, head circumference) and mental (mea-sured by three tests) development until ages 1 (50) and 6 yr (51) did not show any sig-nificant difference between the multivitamin and no multivitamin groups. Therefore, thehigher rate of worrying, fussiness, and fearfulness found previously in girls born afterpericonceptional multivitamin supplementation (52) was not confirmed.
Finally, there was a significant reduction in the total rate of informative offspring withcongenital abnormalities after periconceptional multivitamin supplementation. The rate ofmajor congenital abnormalities was 20.6 and 40.6 per 1000 in the multivitamin and in theno multivitamin groups, respectively (RR = 0.53, 95% CI 0.35–0.70) (53). After theexclusion six NTD cases, the difference in the rate of major congenital abnormalitiesbetween the two study groups remained very highly significant (p < 0.0001). In conclu-sion, periconceptional multivitamin supplementation reduced not only the occurrence ofNTD but also the rate of other major congenital abnormalities (54).
The final data set of the Hungarian RCT indicated a significant reduction in two con-genital abnormalities groups (55) beyond NTD (Table 4). Nine cases with congenitalabnormalities of the urinary tract were found in the no multivitamin group, and only twowere found in the multivitamin group. The difference was most obvious in the obstruc-tive congenital abnormalities of the urinary tract. There were 10 infants with cardio-vascular congenital abnormalities in the multivitamin group and 20 in the nomultivitamin group. This difference was explained mainly by two cases of ventricularseptal defect in the multivitamin group and eight cases in the no multivitamin group.The difference in the rate of conotruncal congenital abnormalities (3 vs 10) also wassignificant (RR = 0.29 95%CI 0.09–0.97).
There was also some reduction in the prevalence at birth of congenital limb defi-ciencies and congenital pyloric stenosis; however, the difference did not reach the levelof significance between the multivitamin and no multivitamin groups (Table 4).
5. TWO-COHORT CONTROLLED STUDY
For ethical reasons, RCTs could not be continued; therefore, a two-cohort controlledintervention study (TCS) (56) was designed to collect more data to confirm or reject thepreventive effect of periconceptional folic acid-containing multivitamin supplementa-tion for the reduction of urinary tract and cardiovascular congenital abnormalities, limbdeficiencies, and congenital pyloric stenosis. Additionally, we wanted to get a moreaccurate estimation for the magnitude of NTD prevention and to collect more dataregarding OFCs.
Supplemented women were recruited via HPS; however, beyond the coordinatingcenter in Budapest, the TCS included all the 31 countryside centers between May 1,1993 and April 30, 1996. The examination of cases with congenital abnormalities wasperformed until April 30, 1999, because of the 1-yr follow-up of infants. These centerssupplied all participants with the same folic acid-containing multivitamin (0.8 mg;Elevit pronatal) during the periconceptional period. Final recruitment of supplementedcohort occurred at the 14th wk of gestation. Unsupplemented women were recruited atthe 14th wk of pregnancy from the standard regional prenatal care clinics. They werematched to each pregnant woman of the supplemented cohort on the basis of age,

614 Part VII / Optimal Pregnancy/Infancy Outcomes
socioeconomic status, and place of residence. Similarly to the RCT, congenital abnor-malities were evaluated in the informative offspring of both cohorts based on well-defined diagnostic criteria of congenital abnormalities during three time windows(during pregnancy, at birth, and during the first postnatal year).
A total of 3056 informative offspring pairs were evaluated in the cohort of supple-mented and unsupplemented matched mothers. There were 14 and 19 informative off-spring with congenital abnormalities of the urinary tract in the supplemented andunsupplemented cohort, respectively. In the group with obstructive congenital abnor-malities (10 vs 19), the stenosis of pelvicureteric junction (2 vs 13) showed a signifi-cant difference (OR = 0.19, 95% CI 0.04–0.86). The occurrence of cardiovascularcongenital abnormalities (31 vs 50) was significantly reduced, explained mainly by thelower occurrence of ventricular septal defect (5 vs 19; OR = 0.26, 95% CI 0.09–0.72)in the supplemented cohort. Limb deficiencies also did not show a real differencebetween the supplemented and unsupplemented cohort (1 vs 3). However, it is worthmentioning that all cases had terminal transverse type. Congenital pyloric stenosis wasdiagnosed in two infants of the unsupplemented cohort, whereas this congenital abnor-malities did not occur in the supplemented cohort.
The protective effect of folic acid-containing multivitamin for the reduction of NTDwas confirmed (one offspring in the supplemented vs nine offspring in the unsupple-mented cohort) (Table 3). The occurrence of OFCs (4 vs 3) showed no significant dif-ference between the two cohorts (Table 4).
There was no difference in the rate of multiple congenital abnormalities and Down’ssyndrome between the supplemented and unsupplemented cohorts (Table 4).
The total number of informative offspring with congenital abnormalities was 41.56per 1000 in the supplemented cohort and 55.30 per 1000 in the unsupplemented cohort(OR = 0.74, 95% CI 0.38–0.94). The higher total rates are explained by the use of moresensitive ultrasound scanning and the different spectrum of congenital abnormalities.
The comparison of maternal morbidity and previous pregnancy outcomes between the twocohorts showed differences. The cohort of supplemented pregnant women recruited from theHPS had a higher rate of morbidity and considerably more previously unsuccessful preg-nancy outcomes (fetal death and congenital abnormalities) compared to the cohort of unsup-plemented pregnant women recruited at the prenatal care clinics. This possibly results fromthe good reputation of the HPS in support of a healthy pregnancy, which might attract womenwith previous pregnancy problems. However, the results of this cohort study are consistentwith the findings of the previous RCT that periconceptional multivitamin supplementationprovides a protective effect, beyond NTD, for some cardiovascular congenital abnormalities—mainly ventricular septal defects and obstructive congenital abnormalities of urinary tract,particularly stenosis of pelvicureteric junction. These preventive effects were demonstrateddespite the fact that the supplemented pregnant women was a cohort at high risk because ofhigher maternal morbidity and more unsuccessful previous pregnancy events.
Table 4 shows the pooled number of different congenital abnormalities in theHungarian RCT and TCS as well, with ORs at 95% CIs.
6. OTHER NTD STUDIES
Another intervention study to check the efficacy of a physiological dose of folic acidfor the prevention of first occurrence of NTD was performed in China (57). This study

Chapter 24 / Folic Acid-Containing Multivitamins 615
was part of a public health campaign conducted from 1993 to 1995 that stressed the factthat intake of 0.4 mg of folic acid daily can reduce the risk of NTD (about 79%) in areaswith high rates of NTD (3.3–5.5/1000), whereas this reduction was about 16% in areaswith low rates (0.8–1.0/1000). However, the NTD risk was reduced by 41% after thepericonceptional use of folic acid in the low-rate area.
The results of many observational studies were also published regarding the preven-tion of NTD in the international literature; however, this review summarizes only thedata of intervention trials.
The available epidemiological and biochemical evidence suggests that the origin ofNTD is not primarily the lack of sufficient folate in the diet but arises from geneticallydetermined changes in the uptake, metabolism, or both in maternal and, particularly, fetalcells (58). Thus, a gene–environmental interaction between vitamin dependency (e.g., aninborn error of folate metabolism) and nutrition (such as dietary deficiency) may have acausal role in the origin of NTDs. Supplementation with folic acid-containing multivita-mins or folic acid alone may cause an increase in folate metabolite concentrations of tis-sue fluids, and it may overcome the failure of the local folate metabolite supply.
Obviously, some genes and several environmental factors contribute to the origin ofNTD. This chapter discusses only hyperhomocysteinemia (the most established hypothe-sis), because the primary prevention of NTD by folic acid or folic acid-containing multivi-tamin is partly connected with the reduction of hyperhomocysteinemia. There are severalstudies that provide evidence of the confirmation of hyperhomocysteinemia-related NTDs.
The causes of hyperhomocysteinemia require a longer explanantion. When meat,fish, or plant proteins are digested, amino acids (e.g., methionine) are released. Duringthe conversion of methionine to cysteine, homocysteine (a toxic metabolite) is formed,and humans neutralize it normally as soon as possible. On one hand, homocysteine canbe metabolized via the transsulfuration pathway to form cystathionine caused by thecondensation with serine and catalyzed by cystathionine β-synthase. This enzymerequires pyridoxal 5′–phosphate, the biologically active form of vitamin B6 as a cofac-tor. On the other hand, remethylation of homocysteine to methionine is catalyzed bymethionine-synthase. This enzyme requires vitamin B12 as a cofactor and 5-methyl-tetrahydrofolate as the methyl donor. The latter explains the importance of folate–folicacid deficiency in the origin of NTD.
This vitamin was discovered by Wills (59) in 1931, and she stressed the similarity ofthis “curative agent” with vitamin B12 as a “twin” vitamin. The generic term “folate”describes the many different naturally occuring polyglutamate forms of the vitamin,whereas folic acid is the synthesized monoglutamate form, chemically designated aspteroylglutamic acid. The different name of two forms of the same vitamin is disturb-ing and are confused frequently, thus their joint name as vitamin B11 has been used insome countries (e.g., the Netherlands), whereas their name is vitamin B9 in France.
Humans cannot produce folate. The major dietary sources of folates are fresh andfrozen green leafy vegetables, citrus fruits and juices, liver, wheat bread, and legumes.Food folates are converted to monoglutamates by conjugases in the upper part of thesmall intestine. However, monoglutamate folic acid can be absorbed directly. After theactive and passive absorption of monoglutamates, they are converted to dihydrofolate andthen to tetrahydrofolate (THF) by reductase enzymes. THF is the parent compound of allbiological active folates. The most important cause of hyperhomocysteinemia and/or lackof methionine is the polymorphism of the MTHFR gene (60,61). A 677C→T mutation has

616 Part VII / Optimal Pregnancy/Infancy Outcomes
been identified in the MTHFR gene, and it results in the thermolabile variant (Ala225Val)of MTHFR (62) with 30 to 50% activity of the allelic form. This enzyme variant cannoteffectively catalize the pathway of 5,10,methylene-THF to 5,methyl-THF (i.e., the methyldonor for methionine-synthase), and it may have a role in the origin of NTD (63). TheHungarian population has a moderate total prevalence of NTD (3/1000), whereas the fre-quencies of TT and CT genotypes within MTHFR genes are 11.1 and 45.2%, respectively(43). The MTHFR gene polymorphism is so common in different populations (43) that itneeds some explanation. The highly significant excess of CT heterozygosity in male first-degree relatives of patients with NTD may demonstrate CT heterozygote advantage in thecontext of their genetic background (64). Thus, the thermolabile variant of MTHFR andthe polymorphism of the MTHFR gene is an obvious risk factor for NTD. However, othercommon mutations of the MTHFR gene and other genes in folate metabolism may alsohave a role in the origin of NTD (65). The point is that there is an inverse relation betweenhomocysteine and folate levels in the humans.
Hyperhomocysteinemia and/or lack of methionine can induce NTD in animal exper-iments (66,67). Mothers who gave birth to a child with NTD have higher blood (68)and amniotic fluid (69) levels of homocysteine. Low maternal folate status is a riskfactor for NTD. Folic acid-containing multivitamins and folic acid alone are able toreduce the hypermomocysteinemia and, consequently, the hyperhomocysteinemia-related NTDs.
The history of NTD shows that we can modify our destiny with the help of science.Before the 1960s, nearly all victims of NTDs had fatal outcomes. In the 1960s, physiciansintroduced very early complex surgical and medical interventions, and the lives of victimswere saved in the majority of spina bifida cases (of course, anencephaly is lethal). In the1970s, the selective criteria of surgical intervention was introduced to reduce the produc-tion of multiple handicapped children. In the 1980s, prenatal screening based on mater-nal serum α-fetoprotein (MS-AFP) and/or ultrasonography was introduced. In thelow-risk populations, the detection rate (i.e., sensitivity) of MS-AFP testing for open NTDvaries from 72 to 91% and the specificity varies from 96.2 to 98.7% (70). This prenatalscreening resulted in a significant drop in the birth of NTD fetuses; however, it increasedthe number of pregnancy terminations and fetal death resulting from amniocentesis,which was about 0.5 to 1.0% risk for miscarriage. Finally, since the 1990s, we have hada chance to reduce the maldevelopment of the neural tube because of the intentional mod-ification (supplementation) of the diet, at least in the periconceptional period of the life.Currently, the periconceptional folic acid or folic acid-containing multivitamin supple-mentation as a primary preventive method of NTD offers an appropriate alternative withthe same efficacy of the so-called secondary prevention (i.e., the prevention of the birthbirth of babies with NTD). The evaluation of adverse effects regarding primary and sec-ondary prevention shows an obviously better picture for multivitamin supplementation.Very rare adverse effects may occur only after the use of pharmacological doses of folicacid. The cost is much lower in primary compared to secondary prevention. The mainmoral and medical advantages are the lack of pregnancy termination in primary preven-tion. Thus, primary prevention obviously is much better than the termination of preg-nancy after the prenatal diagnosis of fetal defect.
The periconceptional multivitamin supplementation containing a physiologicaldose (0.8 mg) of folic acid is very effective in reducing the first occurrence of NTD.About 90% of NTDs seem to be preventable in Hungary using this method (Table 3).

Chapter 24 / Folic Acid-Containing Multivitamins 617
The US–Chinese study had two important messages (51). On one hand, 0.4 mg of folicacid alone was also able to significantly reduce the first occurrence of NTD. On theother hand, the efficacy of prevention by folic acid depended on the incidence of NTD.The data of TCS showed the preventive effect of multivitamin containing 0.8 mg offolic acid for the recurrence of NTD as well. In the data set of the TCS, 41 informativeoffspring had previous siblings or parents with NTD without recurrence in the supple-mented cohort. However, the statistical power is limited. Additionally, the data set ofour genetic counseling clinic included 93 cases that had siblings or parents with NTD,and there was no recurrent NTD after the periconceptional folic acid-containing multi-vitamin supplementation. We expected 6.7 recurrent NTDs in these 134 families; fortu-nately, there was no recurrence. The study of Smithells et al. (19,20) also clearlydemonstrated the high efficacy (about 90% reduction in the recurrence of NTDs) of amultivitamin containing 0.36 mg of folic acid in the prevention of recurrent NTDs.Finally, the study of Daily et al. (71) showed that there was no obvious greater reductionof NTD after the use of higher doses of folic acid.
Several studies indicated the efficacy of folic acid-containing multivitamin supple-mentation for the prevention of other congenital abnormalities as well, and it isextremely important from the public health aspect because NTDs represent only 3 to12% of all major congenital abnormalities.
7. HISTORICAL PERSPECTIVE
Presently, 20 to 25% of infant mortality in industrialized countries is caused by con-genital abnormalities. However, congenital abnormalities are among the leading causesof death, with a high number of life years lost and impaired life (72). Another impor-tant feature of congenital abnormalities is that they represent a defect condition, becauseit is difficult to achieve a complete recovery. Therefore, prevention is considered theonly optimal solution.
Periconceptional use of a multivitamin with less than 1 mg of folic acid did not resultin a reduction of OFCs in the Hungarian RCT and TCS (Table 4). However, a significantreduction was demonstrated in the prevalence of OFCs at birth in the data set of theHungarian Case–Control Surveillance of Congenital Abnormalities after the use of a highdose (generally 6 mg) of folic acid alone (73). Hungarian obstetricians generally recom-mend 6 mg of folic acid for all women in the early phase of pregnancies after the first visitin the prenatal care. Among 22,843 cases with congenital abnormalities and 38,151matched controls without congenital abnormalities, we were able to identify some womenwith periconceptional or early postconceptional use of a high dose of folic acid. Thus, adose-dependent preventive effect of folic acid for OFCs cannot be excluded. Tolarova (26)used 10 mg of folic acid in her study. The results of observational studies are controver-sial (74,75), because beyond the dose, the efficacy of this primary preventive methodsdepends on the genetic background of population, socioeconomic status, and lifestyle(particularly the diet) of mothers (76).
Cardiovascular congenital abnormalities were reduced in infants born to supplementedmothers both in RCT and TCS (Table 4). The diagnostic criteria and method of “blind”cardiological examination were similar between the RCT and TCS. Ventricular septaldefect had an even statistically significant lower rate after periconceptional multivitaminuse. Our findings regarding the protective effect of folic acid-containing multivitamins for

618 Part VII / Optimal Pregnancy/Infancy Outcomes
cardiovascular congenital abnormalities—mainly conotruncal defects, including ventric-ular septal defects—were confirmed by three US studies (77–79). These results as well asours suggest that periconceptional use of multivitamins was associated with about a 40%reduction in risk for cardiovascular congenital abnormalities. However, one US study didnot show this protective effect for cardiovascular congenital abnormalities (80). The pro-tective effect of early postconceptional supplementation of a pharmacological dose (6 mg)of folic acid for cardiovascular congenital abnormalities was also seen in the data set ofthe Hungarian Case–Control Surveillance of Congenital Abnormalities (81). Cardiovascularcongenital abnormalities were induced by pteroyglutamic acid deficiency during gesta-tion in rat fetuses (82,83).
The occurrence of obstructive congenital abnormalities of the urinary tract, morespecifically the stenosis of pelvicureteric junction, was reduced in newborn infants bornto mothers with multivitamin supplementation in both the RCT and TCS (Table 4). Inthe 1950s, Monie et al. (84,85) produced congenital abnormalities of the urinary tractin rat embryos by folic acid deficiency. In human studies, Li et al. (86) and Werler et al.(80) also found a significant reduction in the rate of urinary tract defects after multivita-min use in the first trimester of pregnancy.
There was some reduction of cases with congenital limb deficiencies, particularlyunimelic terminal transverse type, after multivitamin supplementation both in the RCTand TCS (Table 4). Three US studies showed a significant reduction of congenital limbdeficiencies after multivitamin supplementation (77,87,80). The teratogenic effect offolic acid deficiency resulting from folic acid antagonists such as aminopterin andmethotrexate caused, among other congenital abnormalities, limb deficiencies in humanembryos (8–10).
There was a lower rate of cases with congenital pyloric stenosis after multivitaminsupplementation both in the RCT and TCS (Table 4); however, the numbers were lim-ited. This finding was not confirmed in a US study (80).
In the China–US Collaborative Project for Neural Tube Defect Prevention (57), asomewhat lower occurrence of rectal atresia/stenosis was found after periconceptionalfolic acid supplementation (88). The Hungarian RCT and TCS showed a similar trend(1 vs 5) (Table 4).
There was no difference in the rate of multiple congenital abnormalities between thesupplemented and unsupplemented groups in the Hungarian RCT and TCS (Table 4);therefore, our data do not confirm the finding of Shaw et al. (89) regarding a higheroccurrence of multiple congenital abnormalities after periconceptional intake of multi-vitamin supplements (90). The rate of Down syndrome also was not lower in the infor-mative offspring of supplemented women in the Hungarian RCT and TCS (Table 4),although recent publications showed an association between polymorphism in genesinvolved in folate metabolism and maternal risk for Down syndrome (91–93). However,the high dose of folic acid indicated some preventive effect for Down syndrome in theHungarian Case–Control Surveillance of Congenital Abnormalities (94).
Obviously, these findings could have major implications in the general use of peri-conceptional folic acid-containing multivitamin supplementation to prevent congenitalabnormalities. It is strange that although the data concerning the prevention of NTDwere accepted with enthusiasm in the international scientific literature in the early1990s and prompted new recommendations for their practical implementation, the newdata regarding the prevention of other congenital abnormalities have been received with

Chapter 24 / Folic Acid-Containing Multivitamins 619
some reservation and without any further recommendations. Recent studies of antifo-late drugs have also confirmed their role not only in the origin of NTD (95) but in theorigin of cardiovascular and urinary tract congenital abnormalities and limb deficien-cies (96,97). However, different congenital abnormalities have different etiologies;therefore, it is necessary to clearly identify the association of periconceptional folicacid/folic acid-containing multivitamin use with the specific reduction of the abovecongenital abnormalities.
The second phase of malnutrition teratology provided scientific evidence of the pri-mary prevention of NTD and other congenital abnormalities by periconceptional mul-tivitamin or folic acid supplementation. However, it is worth stressing that the totalreduction in congenital abnormalities without NTD cases was 19.93 per 1000 in theRCT, which exceeded the total prevalence of NTD (2.78/1000) by 7.2-fold in Hungary.This reduction resulted mainly from the partial prevention of cardiovascular congeni-tal abnormalities and the prevalence at birth of the latter congenital abnormalitiesgroup in 3.5 times higher than the total prevalence of NTD. Additionally, the so-calledsecondary prevention of cardiovascular congenital abnormalities is more limited thanthat of NTD. Thus, the prevention of other congenital abnormalities by this new primarypreventive method has a similar significant public health importance to the preventionof NTDs.
In conclusion, folic acid or folic acid-contaning multivitamin supplementation offersa breakthrough in the primary prevention of NTDs and some other congenital abnor-malities, because their use in the periconceptional period can reduce about one-third ofcongenital abnormalities and provide a better alternative than secondary prevention(i.e., the termination of pregnancy after the diagnosis of severe fetal defect).
8. RECOMMENDATIONS FOR NUTRITIONAL INTERVENTIONTO REDUCE BIRTH DEFECT RISKS
The primary prevention of NTDs and other congenital abnormalities by dietary sup-plements represent the third phase of malnutritional teratology; this public health actionis a milestone in the history of nutritional science and preventive nutrition. Presently,there are three possibilities to provide appropriate folic acid and other B vitamin intakefor women of childbearing age who are capable of becoming pregnant.
8.1. Consumption of Folate-Rich and Other Vitamin-Rich DietsThe preconceptional period is an appropriate time to change the dietary habit and to
improve the lifestyle of prospective parents, particularly mothers because of their goodcompliance resulting from their desires to have a healthy baby. Thus, it is an importanttask to advise all women to have a diet rich in folate and other vitamins from the pre-conceptional time onward.
There is evidence that appropriate nutritional status of pregnant women can promotethe postnatal—including adult health—of offspring. The origin of many common com-plex diseases (hypertension, coronary heart disease, diabetes mellitus, obesity) may berelated to the quality of fetal and infant life (98). Appropriately preparing parents forpregnancy can also help to educate children at the earliest point (i.e., birth) of liferegarding a healthy diet and lifestyle, and there is a good chance that these habits willbe fixed later in life.

620 Part VII / Optimal Pregnancy/Infancy Outcomes
A study by McPartlin et al. (99) suggested that the optimal daily intake of folate/folicacid in the pre- and postconceptional period is about 0.66 mg. This quantity is muchhigher than the recent Recommended Daily Allowance (RDA), because there is anincreased requirement for folate during pregnancy as a result of (a) decreased absorption,(b) accelerated breakdown of folate to p-aminobenzoylglutamate and its acetylatedderivative p-acetamidobenzoylglutamate, (c) increased urinary loss, and (d) fetal trans-fer. The calculated total fetal and placental THF content is 0.8 mg/100 g at term (100);therefore, fetal blood has a higher THF level than maternal blood and is indicative ofactive placental transfer (101).
However, the usual daily intake of folate is about 0.18–0.20 mg (31), and it is diffi-cult to imagine a 3.3- to 3.7-fold increase in folate intake every day in anticipation ofconception, which would require about 15 servings of broccoli or Brussel’s sprouts.Additionally, an extreme increase in the consumption of extra folate from natural foodis relatively ineffective at increasing folate status (102).
Three other B vitamins play important roles in folate and/or homocysteine metabo-lism. The methyl group of 5-methyl-THF is used by methionine synthase to recyclehomocysteine back to methionine, and methionine synthase is a vitamin B12-dependentenzyme. Vitamin B11 is important for DNA and RNA biosynthesis as well. These func-tions may explain why vitamin B11 deficiency is an independent factor in the origin ofNTD (103,104). Vitamin B11 completely abolished the embryotoxicity of L-homocysteinein rat embryos, which was demonstrated to be mediated by catalysis of the sponta-neous oxidation of L-homocysteine to the less toxic L-homocystine (67). Thus, ahypothesis was developed that L-homocysteine embryotoxicity is explained by theinhibition of transmethylation reactions by increased embryonic 5-adenosylhomocysteinelevel.
MTHFR is a key factor in the neutralization of homocysteine, and it is a vitamin B2
(riboflavin)-dependent enzyme. The function of thermolabile MTHFR is impairedbecause of lack of riboflavin (105). The conversion of homocysteine to cystathione bycystathione synthase requires pyridoxine (a vitamin B6-dependent enzyme). A distur-bance in the above processes results in decreased homocysteine remethylation, causinghyperhomocysteinemia and the shortage of methionine; therefore, cells are not able tomethylate important compounds such as proteins, lipids, and myelin. In Hungary, thedaily intake of vitamin B12 is good, but the consumption of riboflavin and, particularly,vitamin B6 is lower than the RDA. Additionally, vitamin C plays an important role inpreventing the oxidation of THF, thus helping to keep the folate metabolic pool com-plete (106). Folate conjugase is a zinc metalloenzyme, and folate polyglutamates are notwell-absorbed by the intestine in zinc-deficient humans (107). In conclusion, a diet richin vitamins and minerals, particularly folate, is important for the prevention of NTDsand other congenital abnormalities, but cannot completely neutralize the genetic pre-disposition for these congenital abnormalities alone.
8.2. Periconceptional SupplementationGood evidence is available to advise all women who are capable of becoming preg-
nant to have periconceptional (i.e., at least 1 mo before and until 3 mo after conception)folic acid or multivitamin (including 0.4–0.8 mg of folic acid) supplementation toreduce the occurrence of NTDs and some other major congenital abnormalities. Theabsorption of folic acid in the gastrointestinal tract is quick and easy. Thus, it would be

Chapter 24 / Folic Acid-Containing Multivitamins 621
a simple and useful approach; however, about 50% of pregnancies in the United States,Hungary and many other industrialized countries are unplanned. Only the Netherlandshas a 90% rate planned and/or wanted pregnancies. If women have unplanned preg-nancies and have not used a supplement routinely, then they cannot take advantage ofthis new primary preventive method during preconceptional period.
Therefore, the use of periconceptional folic acid or multivitamins needs a strong andwidespread educational campaign. However, this has resulted in only limited success.It is worth suggesting the start of the use of folic acid or multivitamins immediatelyafter the discontinuation of oral contraceptive pills or other contraceptive methods.Unfortunately, generally, appropriate periconceptional care is not available and thepractical delivery of periconceptional multivitamin/folic acid supplementation oftendoes not occur. The establishment of periconception care is feasible and, on the basis ofavailable experiences, economical; the network provides an appropriate opportunity fornutritional interventions as well.
Presently, there is no universal consensus of official recommendations regarding thetype of supplementation and the dose of folic acid. As mentioned earlier, in 1992 the USPublic Health Service (30) recommended that all women who are capable of becomingpregnant should consume 0.4 mg of folic acid/d to prevent NTDs. However, the fol-lowing are some arguments against this recommendation.
1. The use of multivitamins containing folic acid and other B vitamins in the HungarianRCT (29) and TCS (56) and the studies of Smithells et al. (19–21) showed a higherefficacy (about 90%) in the reduction of NTDs than the MRC Vitamin Study (23) usinga high dose of folic acid alone (about 70%) and Chinese–US Study using a low doseof folic acid (41–79%) (57) for the prevention of NTDs.
2. Folic acid-containing multivitamins seem to be effective in the reduction of cardiovas-cular, urinary tract, and limb reduction congenital abnormalities; however, there are nodata concerning a similar preventive effect of folic acid alone for these congenitalabnormalities.
3. Hyperhomocysteinamia may play role in the origin of some NTDs; vitamin B12, B2,and B6 are important cofactors in the folate-homocysteine metabolism, and low vita-min B12 is an independent risk factor in the origin of NTDs (103,104).
The dose of folic acid and vitamin B12 also is debated. Daly et al. (71) did not find adose-dependent preventive effect of folic acid for NTDs in their study, whereas Waldet al. (108) suggested a dose-dependent relationship between folic acid and the pre-ventable part of NTDs in their theoretical calculation, and ecommended 5.0 mg of folicacid daily for all potentially pregnant women. This high dose may have some adverseeffects in patients with pernicious anemia (109) and epileptic women affected withautoimmune diseases (37) as well. Additionally, this dose may increase the prevalenceof twin births (38–41,45), with a higher rate of perinatal morbidity and mortality.However, the early diagnosis of multiple pregnancies followed by specific antenatalcare and delivery method can reduce the previously found risks (45). In contrast, theupper tolerable dose of folate/folic acid for healthy persons, including pregnant women,is 1 mg according to the US National Academy of Sciences’ Dietary Reference Intake(DRI) book (110). Therefore, it is necessary to differentiate the physiological dose offolic acid (<1 mg/d) for preventive purposes and the pharmacological dose of folic acid(>1 mg/d) for the treatment of patients. The US National Academy of Sciences (110)

622 Part VII / Optimal Pregnancy/Infancy Outcomes
recommended that all adult men and women need 0.4 mg of folate daily, but it is cru-cial that women ages 19 to 50 yr ingest a further 0.4 mg of synthetic folic acid to reducethe risk of having a baby with NTDs. However, it is difficult to achieve the consump-tion of 0.4 mg of folate by diet, thus it is worth increasing the dose of folic acid to0.6 mg via supplement. There is no vitamin B12 deficiency in Hungary and industrial-ized countries; however, the major concern regarding higher doses of folic acid is theso-called masking effect in patients with pernicious anemia. Therefore, the combineduse of folic acid and vitamin B12 can prevent this possible adverse effect, but only 1 to3% of an oral dose of vitamin B12 can be absorbed from the gastrointestinal tract, anda higher dose (e.g., 10 or 25 μg) of vitamin B12 is needed for this purpose (111) ratherthan the usual low doses (generally 4 μg).
On the other hand, folic acid is much cheaper than multiviamins. Only a few coun-tries (e.g., Turkey) reimburse the major part of cost of multivitamins used during thepericonceptional period.
8.3. Food FortificationFood fortification seems to be the most practical means of supplementation with folic
acid and other vitamins for women with unplanned pregnancies. This public health ini-tiative is comparable to the prevention of goiter by the addition of iodine to salt.
In Ireland, vitamin B12 (in 1981) and folic acid (in 1987) were added to breakfastcereals, which constitute a significant part of the diet. This fortification probably con-tributed to the significant fall in the prevalence of NTDs at birth in the 1980s (from 4.7to 1.3/1000), because only a small part of this decline could be attributed to terminationof affected pregnancies (103).
In February 1996, the US Department of Health and Human Services (112)ordered food fortification with folic acid of all cereal grain products at a level of0.14 mg/100 g from January 1998. This adds only about 0.1 mg of folic acid to theaverage daily diet of women of reproductive age; nevertheless, the mean plasmafolate concentrations increased from 4.6 to 10.0 μg/mL, and the prevalence of lowfolate levels (<3 μg/mL) decreased from 20 to 1.7%. Additionally, the mean total homo-cysteine concentration decreased from 10.1 to 9.4 μmol/L, and the prevalence ofhigh homocysteine concentrations (>13 μmol/L) decreased from 18.7 to 9.8% (113).At the same time, there was a 19 to 30% reduction in the total (birth + fetal) preva-lence of NTDs (114). Canada also introduced a mandatory fortification of flour withfolic acid, and a 50% reduction was found in the total prevalence of NTDs (115).Chile also has a mandatory flour fortification project using a higher dose of folicacid (116).
In Hungary, three vitamins (folic acid [160 μg] and vitamins B12 [0.8 μg] and B6
[864 μg]) are added to 100 g of flour from the third quarter of 1998 (117). The dailyintake of folic acid and vitamins B12 and B6 is about 200, 1, and 1080 μg, respectively,in 200 g of bread. The use of vitamin B12 has two goals. First, it is an independent fac-tor in the origin of NTD. Second, the oral intake of vitamin B12 can protect the mask-ing effect of folic acid in patients with pernicious anemia. The consumption of fortifiedbread with folic acid and vitamins B12 and B6 is especially important for the large pro-portion of women with lower levels of education and income who generally have dif-ficulties buying food rich in folate and other vitamins and who have unplannedpregnancies. Another goal of this food fortification is the prevention of coronary artery,

Chapter 24 / Folic Acid-Containing Multivitamins 623
cerebrovascular, and peripheral vascular diseases caused by hyperhomocysteinemia.However, plans are underway to change the too-conservative regulations concerningthe doses of B vitamins in food fortification (e.g., 0.24 or 0.33 mg/100 g folic acid inflour fortification) would result in a much better benefit/cost ratio without any possi-ble hazard if a higher dose of vitamin B12 (e.g., 10 or 25 μg) were introduced in flourfortification (118).
9. CONCLUSION AND RECOMMENDATIONS
A considerable number of birth defects are preventable, and food fortification withfolic acid and some other B vitamins appears to be the most effective method to achievethis goal. Therefore, we agree with Oakley (119): inertia on folic acid fortificationequals public health malpractice.
REFERENCES1. Hale F. Pigs born without eyeballs. J Hered 1932; 24:105–109.2. Warkany J. Congenital malformations induced by maternal dietary deficiency: experiments and their
interpretation. Harvey Lecture, 1952–1953. 1971; 18:89–102.3. Warkany J. Congenital Malformations. Notes and Comments. Year Book Medical Publications,
Chicago, IL, 1971.4. Nelson MM. Mammalian Fetal Development and Antimetabolities. In: Rhoads EP, ed.
Antimetabolites and Cancer. American Association for the Advancement of Science Monograph.Washington DC, 1955.
5. Evans HM, Nelson MM, Asling CV. Multiple congenital abnormalities resulting from acute folicacid deficiency during gestation. Science 1951; 114:479.
6. Nelson MM, Asling CW, Evans HM. Production of multiple congenital abnormalities in young bymaternal pteroylglutamic acid deficiency during gestation. J Nutr 1952; 48:61–79.
7. Nelson MM, Wright HV, Asling CW, Evans HM. Multiple congenital abnormalities resultingfrom transitory deficiency of pteroylgutamic acid during gestatin in the rat. J Nutr 1955;56:349–369.
8. Thiersch JB. Therapeutic abortions with a folic acid antagonist, 4-aminopteroylglutamic acid(4-amino PGA) administered by the oral route. Am J Obstet Gynecol 1952; 63:1298–1304.
9. Meltzer HJ. Congenital anomalies due to attempted abortion with 4-aminopteroglutamic acid. J AmMed Ass 1956; 161:1253.
10. Warkany J, Beaudry PH, Hornstein S. Attempted abortion with 4-aminopteroglutamic acid(aminopterin): malformations of the child. Am J Dis Child 1959; 97: 274–281.
11. Giroud A, Lefevres-Boisselot J. Influence tératogéne de la carence en acide folique. Compt RendSoc Biol 1951; 145:526–529.
12. Giroud A. The Nutrition of the Embryo. Charles C. Thomas, Springfield, IL, 1970.13. Hibbard BM. The role of folic acid in pregnancy with particular reference to anaemia, abruption and
abortion. J Obstet Gynecol 1964; 71:529–542.14. Hibbard ED, Smithells RW. Folic acid metabolism and human embryopathy. Lancet 1965; 1:1254.15. Czeizel AE, Tusnády G. Aetiological Studies of Isolated Common Congenital Abnormalities in
Hungary. Akadémiai Kiadó, Budapest, 1984.16. Elwood JM, Little J, Elwood JH. Epidemiology and Control of Neural Tube Defects. Oxford
University Press, Oxford, 1992.17. Wyszinsky DF, ed. Cleft Lip and Palate: From Origin to Treatment. Oxford University Press, New
York, 2002.18. Smithells RW, Sheppard S, Schorah CJ. Vitamin deficiencies and neural tube defects. Arch Dis Child
1976; 51:944–949.19. Smithells RW, Sheppard S, Schorah CJ, et al. Possible prevention of neural tube defects by pericon-
ceptional vitamin supplementation. Lancet 1980; 1:339,340.20. Smithells RW, Sheppard S, Wild J, Schorah CJ. Prevention of neural tube defect recurrences in
Yorkshire: final report. Lancet 1989; 2:498,499.

624 Part VII / Optimal Pregnancy/Infancy Outcomes
21. Nevin NC, Seller MJ. Prevention of neural tube defect recurrences. Lancet 1990; 1: 178,179.22. Laurence KM, James N, Miller MH, et al. Double-blind randomised controlled trial of folate treat-
ment before conception to prevent rcurrence of neural-tube defects. Br Med J 1981; 282:1509–1511.23. MRC Vitamin Study Research Group. Prevention of neural tube defects: results of the Medical
Research Council Vitamin Study. Lancet 1991; 338:131–137.24. CDC. Use of folic acid for prevention of spina bifida and other neural tube defects. J Am Med Ass
1991; 266:1191,1192.25. Kirke PN, Daly LE, Elwood JH. A randomised trial of low dose folic acid to prevent neural-tube
defects. The Irish Vitamin Study Group. Arch Dis Child 1992; 67:1442–1446.26. Tolarova M. Periconceptional supplementation with vitamins and folic acid to prevent recurrence of
cleft lip. Lancet 1982; 2:217.27. Healthy People 2000. National health population and disease prevention objectives. US Department
of Health and Human Service. Public Health Service. DHHS Publ No.91-502. 13.28. Czeizel AE, Dobó M, Dudás I, et al. The Hungarian periconceptional service as a model for com-
munity genetics. Community Genetics 1998; 1:252–259.29. Czeizel AE, Dudás I. Prevention of the first occurrence of neural-tube defects by per iconceptional
vitamin supplementation. N Engl J Med 1992; 327:1832–1835.30. CDC. Recommendations for the use of folic acid to reduce the number of cases of spina bifida and
other neural tube defects. MMWR 1992; 41:1233–1238.31. Czeizel AE, Susánszky E. Diet intake and vitamin supplement use of Hungarian women during the
preconceptional period. Int J Vitam Nutr Res 1994; 64:300–305.32. Dudás I, Rockenbauer M, Czeizel AE. The effect of preconceptional multivitamin supplementation
on the menstrual cycle. Arch Gynecol Obstet 1995; 256:115–123.33. Czeizel AE, Rockenbauer M, Susánszky E. No change in sexual activity during periconceptional
multivitamin supplementation. Brit J Obst Gynecol 1996; 103:569–573.34. Czeizel AE, Métneki J, Dudás I. The effect of preconceptional multivitamin suppelementation on
fertility. Int J Vitam Nutr Res 1996; 66:55–58.35. Czeizel AE, Dudás I, Fritz G, et al. The effect of periconceptional multivitamin-mineral supplemen-
tation on vertigo, nausea and vomiting in the first trimester of pregnancy. Arch Gynecol Obstet 1992;251:181–185.
36. Czeizel AE. Randomized, Controlled Trial of the Effect of Periconceptional MultivitaminSupplementation on Pregnancy Outcome. In: Wharton BA, ed. Maternal-Child Issues in NutritionWyeth-Ayerst Nutritional Seminar Series. Excerpta Medica, Princeton, NJ. 1993, pp. 13–24.
37. Erös E, Géher P, Gömör B, Czeizel AE. Epileptogenic activity of folic acid after drug induces SLE.(Folic acid and epilepsy). Eur J Obstet Gynec Reprod Biol 1998; 80:75–78.
38. Czeizel AE, Métneki J, Dudás I. Higher rate of multiple births after periconceptional multivitaminsupplementation. N Engl J Med 1994; 330:1687,1688.
39. Czeizel AE, Métneki J, Dudás I. The higher rate of multiple births after periconceptional multivita-min supplementation: An analysis of causes. Acta Genet Gemmellol 1994; 43:175–184.
40. Werler MM, Cragan JD, Wasserman CR, et al. Multivitamin supplementation and multiple births.Am J Med Genet 1997; 71:93–96.
41. Erickson A, Källen B, Aberg A. Use of multivitamins and folic acid in early pregnany and multiplebirths in Sweden. Twin Res 2001; 4:63–66.
42. Zhu L, Gindler J, Wang H, et al. Folic acid supplementation during early pregnancy and likelihoodof multiple births: a population-based cohort study. Lancet 2003; 361:380–384.
43. Botto LD, Yang G. 5,10,methylenetetrahydrofolate reductase gene variants and congenital abnormalities.A huge review. Am J Epidem 2000; 15:862–877.
44. Hasbargen U, Lohse P. Thaler CJ. The number of dichorionic twin pregnancies is reduced by thecommon MTHFR G77C→T mutation. Hum Reprod 2000; 15:2059–2662.
45. Czeizel AE, Vargha P. Periconceptional folic acid/multivitamin supplementation and twins. Am JObst Gynecol, in press.
46. Czeizel AE, Dudás I, Métneki J. Pregnancy outcomes in a randomised controlled trial of pericon-ceptional multivitamin supplementation. Final report. Arch Gynecol Obstet 1994; 255:131–139.
47. Windham GC, Shaw GM, Todoroff K, Svan SH. Miscarriage and use of multivitamins or folic acid.Am J Med Genet 2000; 90:261,262.
48. Gindler J, Li Z, Berry RJ, et al. Folic acid supplements during pregnancy and risk of miscarriage.Lancet 2001; 358:796–800.

Chapter 24 / Folic Acid-Containing Multivitamins 625
49. Czeizel AE. Miscarriage and use of multivitamins or folic acid. Am J Med Genet 2001; 104:179.50. Czeizel AE, Dobó M. Postnatal somatic and mental development after periconceptional multivita-
min supplementation. Arch Dis Child 1994; 70:229–233.51. Dobó M, Czeizel AE. Longterm somatic and mental development of children after periconceptional
multivitamin supplementation. Eur J Pediat 1998; 157:719–723.52. Holmes-Siedle M, Dennis J, Lindenbaum RH, Galliard A. Long-term effects of periconceptional
multivitamin supplementation for prevention of neural tube defects: a seven to 10 year follow up.Arch Dis Child 1992; 67:1436–1441.
53. Czeizel AE. Prevention of congenital abnormalities by periconceptional multivitamin supplementa-tion. Brit Med J 1993; 306:1645–1648.
54. Czeizel AE. Periconceptional folic acid-contanining multivitamin supplementation. Eur J ObstetGynec Reprod Biol 1998; 75:151–161.
55. Czeizel AE. Reduction of urinary tract and cardiovascular defects by periconceptional multivitaminsupplementation. Am J Med Genet 1996; 62:179–183.
56. Czeizel AE, Dobó M, Vargha P. Hungarian two-cohort controlled study of periconceptional multivi-tamin supplementation to prevent certain congenital abnormalities. Birth Defects Research, A. Clinicand Molec Terat, 2004. In press.
57. Berry RJ, Li Z, Erickson JD et al. Prevention of neural-tube defects with folic acid in China. China-US Collaborative Project for Neural Tube Defect Prevention. N Engl J Med 1999; 341:1485–1490.
58. Yates RW, Ferguson-Smith MA, Shenkin A et al. Is disordered folate matabolism the basis forgenetic predisposition to neural tube defects? Clin Genet 1987; 31:279–287.
59. Wills L. Treatment of “pernicious anaemia” of pregnancy and “tropical anaemia” with special refer-ence to yeast extract as a curative agent. Brit Med J 1931; i:1059–1064.
60. Frosst P, Blom HJ, Milos R. A candidate genetic risk-factor for vascular disease: a common muta-tion in methylenetetrahydrofolate reductase. Nature Genet 1995; 10:111–113.
61. Goyette D, Summer JS, Milos R. Human methylenetetrahydrofolate reductase: isolation of cDNA,mapping and mutation identification. Nature Genet 1994; 7:195–200.
62. Van der Put NM, Steegers-Theunissen RPM, Frosst P, et al. Mutated methylentetrahydrofolatereductase as a risk factor for spina bifida. Lancet 1995; 346:1070,1071.
63. Ou CY, Stevenson RF, Brown VK, et al. V677T homozygosity associated with thermolabile 5,10-methylenetetrahydrofolate reductase as a risk factor for neural tube defects. Am J Hum Genet 1995;57(Suppl):A 223.
64. Weitkamp LR, Tackels DC, Hunter AGW, et al. Heterozygote advantage of the MTHFR gene inpatients with neural-tube defects and their relatives. Lancet 1998; 351:1554–1555.
65. van der Put NMJ, Gabreels F, Stevens EMB, et al. A second common mutation in the methylenete-trahydrofolate reductase gene: An additional risk factor for neural-tube defect? Amer J Hum Genet1998; 62:1044–1046.
66. Coelho CND, Klein NW. Methionine and neural-tube closure in cultured rat embryos: morphologi-cal and biochemical analysis. Teratology 1990; 42:437–451.
67. Vanaerts LAGJM, Blom hJ, Deabreu R et al. Prevention of neural tube defects by and toxicity of L-homocysteine in cultured postimplantation rat embryos. Teratology 1994; 50:348–360.
68. Steegers-Theunissen RPM, Boers GHJ, Trijbels FJM, Eskes TKAB. Neural-tube defects andderangement of homocysteine metabolism. N Engl J Med 1991; 324:199,200.
69. Steegers-Theunissen RP, Boers GH, Blom HJ, et al. Neural tube defects and elevated homocysteinelevels in amniotic fluid. Am J Obstet Gynecol 1995; 172:1436–1441.
70. Canadian Task Force on the Periodic Health Examination. Periodic health examination, 1994update. 3. Primary and secondary prevention of neural tube defects. Can Med Assoc J 1994;151:21–28.
71. Daly S, Mills JL, Molloy AM et al. Minimum effective dose of folic acid for food fortification toprevent neural-tube defects. Lancet 1997; 350:1666–1669.
72. Czeizel AE, Sankaranarayanan K. The load of genetic and partially genetic disorders in man. I.Congenital anomalies: estimates of detriment in terms of years of life lost and years of impaired life.Mut Res 1984; 128:499–503.
73. Czeizel AE, Tímár L, Sárközi A. Dose-dependent effect of folic acid on the prevention of orofacialclefts. Pediatrics 1999; 104:e66.
74. Shaw GM, Lammer EJ, Wasserman CR, et al. Risks of orofacial clefts in children born to womenusing multivitamins containing folic acid periconceptionally. Lancet 1995; 345:393–396.

626 Part VII / Optimal Pregnancy/Infancy Outcomes
75. Hayes C, Werler MM, Willett WC, Mitchell AA. Case–control study of periconceptional folic acidsupplementation and oral clefts. Am J Epidemiol 1996; 143:1229–1234.
76. Van Rooij IALM, Vermeij-Keers C, Kluijtmans LAJ, et al. Does the interaction between maternalfolate intake and the methylenetetrahydrofolate reductase polymorphism affect the risk of cleft lipwith or without cleft palate? Am J Epidemiol 2003; 157:583–591.
77. Shaw GW, O’Malley CD, Wasserman CR, et al. Maternal periconceptional use of multivitamin andreduced risk for conotruncal heart defects and limb deficiencies among offspring. Am J Med Genet1995; 59:536–545.
78. Botto LD, Khoury MJ, Mulinare J, Erickson JD. Periconceptional multivitamin use and the occur-rence of conotruncal heart defects. Results from a population-based case-control study. Pediatrics1996; 98:911–917.
79. Botto LD, Mulinare J, Erickson JD. Occurrence of congenital heart defects in relation to maternalmultivitamin use. Am J Epidemiol 2000; 151:878–884.
80. Werler MM, Hayes C, Louik C. Multivitamin use and risk of birth defects. Am J Epidemiol 1999;150:675–682.
81. Czeizel AE, Tóth M, Rockenbauer M. A case–control analysis of folic acid supplementation duringpregnancy. Teratology 1996; 53:345–351.
82. Baird CD, Nelson MM, Monie IW, Evans HM. Congenital cardiovascular anomalies induced bypteroylgutamic acid deficiency during gestation in the rat. Circ Rev 1954; 2:544–548.
83. Monie IW, Nelson MM. Abnormalities of pulmonary and other vessels in rat fetuses from maternalpteroylglutamic acid deficiency. Anat Rec 1963; 147:397–401.
84. Monie IW, Nelson MM, Evans HM. Abnormalities of the urinary system of rat embryos resultingfrom maternal pteroylglutamic acid deficiency. Anat Rec 1954; 120:119–136.
85. Monie IW, Nelson MM, Evans HM. Abnormalities of the urinary system of rat embryos resultingfrom transitory deficiency of pteroylglutamic acid during gestation in the rat. Anat Rec 1957;127:711–724.
86. Li D-K, Daling JR, Mueller BA, et al. Periconceptional multivitamin use in relation to the risk ofcongenital urinary tract anomalies. Epidemiology 1995; 6:212–218.
87. Yang Q, Khoury MJ, Olney RS, et al. Does periconceptional multivitamin use reduce the risk forlimb deficinecy in offspring? Epidemiology 1997; 8:157–161.
88. Myers MF, Li S, Correa-Villasenon A, et al. Folic acid supplementation and risk for imperforate anusin China. Am J Epidemiol 2001; 154:1051–1056.
89. Shaw GM, Croen LA, Todoroff K, Tolarova MM. Periconceptional intake of vitamin supplementand risk of multiple congenital anomalies. Am J Med Genet 2000; 93:188–193.
90. Czeizel AE, Medveczki E. No difference in the occurrence of multimalformed offspring after peri-conceptional multivitamin supplementation. Obstet Gynec 2003; 102:1255–1261.
91. James SJ, Pogribna J, Pogribny IP, et al. Abnormal folate metabolism and mutation in the methyl-enetetrahydrofolate-reductase gene may be maternal risk factors for Down syndrome. Am J ClinNutr 1999; 70:495–501.
92. Hobbs CA, Sherman SL, Yi P, et al. Polymorphisms in genes involved in folate metabolism as mater-nal risk factors for Down syndrome. Am J Hum Genet 2000; 67:623–630.
93. Barkai G, Arbuzova S, Berkenstadt M et al. Frequency of Down’s syndrome and neural-tube defectsin the same family. Lancet 2003; 361:1331–1335.
94. Czeizel AE, Puhó E. Case–control study of preconceptional pregnancy supplements regarding theetiology of Down’s syndrome. Nutrition 2004. In press.
95. Hernandez-Diaz S, Werler MM, Walker AM, Mitchell AA. Neural-tube defects in relation to use offolic acid antagonists during pregnancy. Am J Epidemiol 2001; 153: 961–968.
96. Hernandez-Diaz S, Werler MM, Walker AM, Mitchell AA. Folic acid antagonists during pregnancyand risk of birth defects. N Engl J Med 2000; 343:1608–1614.
97. Czeizel AE, Rockenbauer M, S�rensen HAT, Olsen J. Teratogenic risk of trimethoprim-sulfon-amides. A population-based case-control study. Reprod Toxicol 2001; 15:637–646.
98. Barker DJP, ed. Fetal and Infant Origins of Adult Disease. British Medical Journal Publication,London, England, 1992.
99. McPartlin J, Halligan A, Scott JM, et al. Accelerated folate breakdown in pregnancy. Lancet 1993;341:148,149.
100. Iyengar L, Apte SV. Nutrient stores in human foetal livers. Brit J Nutr 1972; 27:313–317.101. Strelling MK. Transfer of folate to the fetus. Dev Med Child Neurol 1976; 28:533–535.

Chapter 24 / Folic Acid-Containing Multivitamins 627
102. Cuskelly GJ, McNulty H, Scott JM. Effect of increasing dietary folate on red-cell folate: implica-tions for prevention of neural tube defects. Lancet 1996; 347:657–659.
103. Kirke PN, Molloy AM, Daly LE, et al. Maternal plasma folate and vitamin B12 are independent riskfactors for neural tube defects. Q J Med 1993; 86:703–708.
104. Mills JL, McPartlin JM, Kirke PN, et al. Homocysteine metabolism in pregnancies complicated byneural-tube defects. Lancet 1995; 345:149–151.
105. McNulty H, McKinely, Wilson B et al. Impaired functioning of thermolabile methylenetetrahydro-folate reductase is dependent on riboflavin status: Implications for riboflavin requirements. Am JClin Nutr 2002; 76:436–441.
106. Stokes PL. Folate metabolism in scurry. Am. J. Clin. Nutr. 1975; 28:126–129.107. Tamura T, Shane B, Baer MT et al. Absorption of mono- and polyglutamyl folates in zinc-depleted
man. Am J Clin Nutr 1978; 31:1984–1987.108. Wald NJ, Law MR, Morris JK, Wald DS. Qualifying the effects of folic acid. Lancet 2001;
358:2069–2073.109. Butterworth CE, Tamura T. Folic acid and toxicity: a brief review. Am J Clin Nutr 1989; 50:353–358.110. US National Academy of Sciences. Dietary Reference Intakes: Folate, Other B Vitamins and
Choline. National Academy Press. Washington DC, 1998.111. Herbert V, Bigaouette J. Call for endorsement of petition to the Food and Drug Administration to
always add vitamin B12 to any folate fortification or supplement. Am J Clin Nutr 1997; 65:572,573.112. US Department of Health and Human Services. Food standards: amendment of standards of identity
for enriched grain products to require addition of folic acid. Federal Register 1996; 61:8781–8787.113. Jacques PF, Selhub J, Bostom AG, et al. The effect of folic acid fortification on plasma folate and
total homocysteine concentrations. N Engl J Med 1999; 340:1449–1454.114. Honein MA, Paulozzi LJ, Methens TJ et al. Impact of folic acid fortification of the US Food Supply
on the occurrence of neural tube defects. J Am Med Ass 2001; 285:2981–2986.115. Ray JG, Vermeulen MJ, Boss SC, Cole DEC. Increased red cell folate concentrations in women of
reproductive age after Candian folic acid food fortification. Epidemiology 2002; 13:238–240.116. Freire WB, Hertrampf E, Cortes F. Effect of folic acid fortification in Chile: preliminary results. Eur
J Pediatr Surg 2000; 10:42,43.117. Czeizel AE, Merhala Z. Bread fortification with folic acid, vitamin B12 and vitamin B6 in Hungary.
Lancet 1998; 352:1225.118. Czeizel AE, Kökény M. Bread fortification with folic acid in Hungary. Br Med J 2002; 325:391.119. Oakley GP. Inertia on folic acid fortification: Public health malpractice. Teratology 2002; 66:44–54.


From: Preventive Nutrition: The Comprehensive Guide for Health Professionals, Third EditionEdited by: A. Bendich and R. J. Deckelbaum © Humana Press Inc., Totowa, NJ
629
25 Maternal Nutritionand Preterm Delivery
Theresa O. Scholl
KEY POINTS
● The rate of preterm delivery in the United States has increased by more than 25% in thepast 20 yr.
● Low weight before pregnancy may be associated with increased risk for preterm delivery.● Inadequate weight gain, particularly in the third trimester, may be associated with
increased risk for preterm delivery.● Fasting and intervals longer than 12 h between meals may be associated with increased
risk for preterm delivery.● Maternal anemia and iron deficiency anemia in the first and second trimesters may be
associated with increased risk for preterm delivery.● High hemoglobin, hemitocrit, or ferritin in the third trimester may be associated with
increased risk for preterm delivery.● Low intake of calcium, ω-3 fatty acids, antioxidants, folate, zinc, and iron may be asso-
ciated with increased risk for preterm delivery.● High maternal levels of homocysteine may be associated with increased risk for preterm
delivery.● Failure to take prenatal vitamin/mineral supplements may be associated with increased
risk for preterm delivery.
1. DEFINITION AND IMPORTANCE OF PRETERM DELIVERY
The United States has an infant mortality rate that ranks 28th worldwide (1). Thecause of many of these early deaths is an excess of preterm deliveries to US womencompared to women from countries suchs as Norway (2). Preterm delivery (<37 com-pleted weeks of gestation) is an important underlying cause of infant death (3).Although congenital defects are the most important cause of mortality during the firstyear, in the United States, shortened gestation and low birth weight ranks as the leadingcause during the neonatal period (first 28 d) and the second leading cause of death duringinfancy (4).

630 Part VII / Optimal Pregnancy/Infancy Outcomes
There has been a long-term decline in neonatal and infant mortality in the UnitedStates over recent decades. In contrast, the rate of preterm birth increased by 27%between 1981 (when 9.1% of all births were preterm) and 2001 (when a zenith of 11.9%was reached) (5). Over the same interval, there has been less change (a 7.7% increase)in the incidence of very preterm birth (<32 completed weeks of gestation) (5). The reasonfor the improvement in survival despite the rise in preterm delivery is better and moreintensive perinatal and neonatal care, which includes procedures such as assisted venti-lation and the use of corticosteroids and surfactants.
In addition to increased mortality, infants delivered preterm are at greater short-term riskof complications, including respiratory distress syndrome, bronchopulmonary dysplasia,intraventricular hemorrhage, and necrotizing enterocolitis, among others. In the longerterm (1–3 yr), preterm children are at increased risk of seizure disorders, disabilities ofthe special senses (blindness and deafness), cerebral palsy, and mental retardation.Learning and behavioral deficits persist (6,7) and are associated with greater risks ofhyperactivity, placement in special education programs, and grade retention amongschool children who entered life preterm (8,9).
There is no way to prevent preterm delivery that is universally effective and yieldsconsistent results. The few interventions that reduce risk are not applicable to mostwomen or all populations. For example, treatment of bacterial vaginosis with antibiotics,even in high-risk populations, does not consistently reduce the risk of preterm delivery (10).Although the injection of 17 α-hydroxyprogesterone has been shown to reduce risk, itsuse is limited to those women with a history of delivering before term (11). Therefore,it is important to prevent preterm delivery; to do so, it is necessary to understand itsetiology. This chapter examines the influence of maternal nutrition and nutritionalstatus on risk of preterm birth.
2. RISK FACTORS ASSOCIATED WITH PRETERM DELIVERY
One problem hampering the identification of risk factors is the heterogeneous natureof preterm delivery. The most common cause is spontaneous labor, which culminates ina preterm delivery. Another etiology involves preterm premature rupture of the fetalmembranes (PROM) before labor and delivery. Additionally, there are numerous com-plications, such as pre-eclampsia, that lead to a medically indicated preterm birth (12).Each of the proximate causes may have separate risk factors. Consequently, only a frac-tion of the factors and exposures have been identified that give rise to preterm and verypreterm delivery. These include a history of preterm delivery, poverty, African-Americanethnicity, cigarette smoking, the extremes of maternal age, and inflammation and infection.Of the recognized risk factors, several implicate maternal nutrition and nutritional status(e.g., underweight, inadequate weight gain during pregnancy, anemia) as importantissues regarding preterm delivery (13).
3. MATERNAL WEIGHT AND WEIGHT GAIN
Most research on maternal nutritional status has focused on the relationship betweenpregravid weight, total weight gain, and birth weight, and the body of evidence on thistopic has been reviewed extensively by the Institute of Medicine (IOM) (14). Studieshave been virtually unanimous (in developing countries and among different ethnicgroups) in showing a positive relationship between pregravid weight or body mass

Chapter 25 / Nutrition and Preterm Delivery 631
index (BMI), weight gain, and birth weight (14,15). Maternal pregravid weight or BMI andweight gain appear to have independent and additive effects on birth weight. Correlationsbetween weight gain and birth weight range between 0.20 and 0.30. The average magnitudeof the effect on birth weight (in women with a normal weight-for-height) is approx 20 gof birth weight for every 1 kg of total gain, and pregravid weight-for-height is a strongeffect modifier on birth weight (16).
Several studies showed an association between being underweight and increasedrisk of preterm delivery, especially when gestation duration was estimated from fun-dal height or ultrasound criteria (17–19). Although the finding is fairly consistent,the extent to which it represents a size bias in the estimation of gestation or to whichgestational weight gain and diet during pregnancy can overcome the deficit is notwell-known.
The relationship between gestational weight gain and preterm delivery appearsmore complex and is even more controversial. Although cumulative (or total)weight gain is an important predictor of birth weight, the pattern of weight gainand rate of gain also appear to play significant roles in predicting preterm delivery.Both early and later weight gain have independent effects on outcome during preg-nancy (20,21). In pregnant adolescents, an early inadequate weight gain increasesthe risk of small-for-gestational age infants who are below the 10th percentile for stan-dards (20). Preterm delivery appeared unaffected by early weight gain but wasincreased with inadequate weight gain rates (<400 g/wk) late in pregnancy. Thisoccurred even when the total pregnancy weight gain did not fall below the targets setin clinical standards.
Other studies of adult gravidas have also indicated that low rates of weight gain, pri-marily in the latter half of pregnancy, are associated with preterm delivery (17,18,22–24).
A study of more than 17,000 low-income African-American and Caucasian gravidasfrom Alabama found that rates of weight gain of less than 0.24 kg/wk after 20 wk ofgestation increased the risk for preterm delivery (odds ratio [OR] = 1.52; p < 0.05)compared with rates between 0.58 and 0.74 kg/wk. Interestingly, Wen et al. (17) alsonoted that women with high or excessive rates of gain (≥ 0.75 kg/wk) had an increasedrisk of preterm delivery (OR = 1.71; p < 0.05), although they speculated that this asso-ciation might be a function of late edema caused by pregnancy-induced hypertension(PIH). Confirming the association between low weight gain late in pregnancy andpreterm delivery, Siega-Riz et al. (18) found, for a predominately Hispanic sample(80%) of nearly 5000 women from the West Los Angeles area, that inadequate weightgain during the third trimester was predictive of preterm delivery (more than two foldincreased risk).
A third study of Alabama women (23) found that although low gain or low rates ofgain in the first two trimesters were not associated with preterm delivery, a low rate inthe third trimester (<0.38 kg/wk with a pregravid BMI < 19.8 and <0.37 kg/wk with apregravid BMI of 19.8–26.0) was associated with an increased risk of preterm delivery(OR = 2.46, 95% confidence interval [CI] 1.53–3.92).
Most recently, Carmichael and Abrams (24) reviewed and summarized the extantliterature (13 published studies) regarding gestational weight gain and preterm delivery.They found that 11 of these studies reported a significant association between maternalweight gain and preterm delivery—principally, risk increased when gestational weightgain was inadequate. In their summary, gestational weight gain in later pregnancy was

632 Part VII / Optimal Pregnancy/Infancy Outcomes
consistently associated with increased preterm delivery, whereas inadequate gain inearly pregnancy was not.
Low rates of weight gain may not reflect maternal nutrition or may reflect it indirectly.Low intakes of iron and zinc are related to an increased risk of preterm delivery as wellas to inadequate weight gain (25,26). In the case of zinc, the risk of preterm deliverywith low dietary zinc intake was particularly strong (threefold increased risk) for thosewhose rupture of membranes preceded labor (26). If, for example, maternal infectionincreased nutrient requirements for zinc, then that infection could reduce circulatingzinc levels as part of an acute phase response; infection might also increase the risk ofan inadequate gestational weight gain. Conversely, maternal zinc deficiency mightreduce the mother’s appetite and limit weight gain while making her more susceptibleto infection. Alternatively, inadequate weight gain may be a marker for maternal infectionthat is unrelated to maternal nutrition.
The low rates of gestational gain shown by the mother might also reflect the fact thatfetuses delivered preterm grow more slowly than those delivered at term. Therefore, themother would only seem to gain weight at a lower rate. Slowed fetal growth is foundfairly consistently among gravidas who deliver preterm (27–30). In Camden, NewJersey (27), in a sample of young, minority mothers, we found that infants who weredelivered preterm were already significantly smaller in all fetal growth dimensions by32 wk of gestation compared with fetuses at 32 wk of gestation who were later deliv-ered at term. The diminished fetal growth occurred from about 16–32 wk. When strati-fied by the proximate cause of preterm delivery, infants delivered preterm for medicalor obstetric indications (placental abruption, severe pre-eclampsia, nonreassuring heartrate patterns, chorioamionitis, oligohydramnios) had asymmetrical growth patterns,which suggested a growth failure late in pregnancy. On the other hand, infants deliveredpreterm after PROM or after failed or no tocolytic therapy to halt their spontaneouspreterm labor were proportionately smaller in all dimensions, implying an overall slow-ing of growth that may have originated early in pregnancy that may have been causedby a more chronic stress.
4. DIET AND GESTATIONAL WEIGHT GAIN
Maternal diet is one reason that maternal weight gain during pregnancy and gestationduration may be positively correlated. Although this association appears to be reason-able, a relationship between energy intake and weight gain during pregnancy has notbeen described often.
The first report of a positive relationship between diet and weight gain was made byThomson (31), who found a correlation of 0.30 between intake and weight gain in Scottishprimigravidas eating “to appetite.” Among Camden gravidas, a significantly lower energyintake (about 300 kcal/d less) was associated with an inadequate gestational gain (32).After controlling for energy, women with an inadequate gestational weight gain showedlittle difference in macronutrients (protein, calories) or total grams of food ingested. Thisrelationship was subsequently confirmed with three 24-h dietary recalls taken during thecourse of pregnancy (26). Because intakes were obtained throughout gestation, overallintake was higher (+160 kcal/d) than in the prior study. After controlling for confoundingvariables, women with inadequate gestational weight gain consumed fewer kcal per day(−173 kcal/d) than women whose pregnancy weight gain was adequate. Recently, women

Chapter 25 / Nutrition and Preterm Delivery 633
from upstate New York were asked a series of behavioral questions regarding changes infood intake during pregnancy; results from these questions confirmed and extended thesefindings (33). Consuming “a little or a lot less food” during pregnancy was associatedwith a greater than twofold increase in weight gain below IOM guidelines. Conversely,eating “much more food” was associated with a twofold increased risk of an excessiveweight gain. By comparison, a reduction in physical activity was associated with a 70%increase in the risk of an excessive weight gain.
5. DIET AND PRETERM DELIVERY
The relationship between poor diet and inadequate gestational weight gain and theobservation that slowed fetal growth, low prepregnant weight or low BMI, and lowrates of weight gain were each associated with preterm delivery suggests that a poormaternal diet may be a risk factor. During the Dutch Famine of 1944–1945, expo-sure to intense famine in the third trimester shortened gestation by about 4 d,whereas exposure during the first trimester was associated with a clear excess ofpreterm birth (34). The famine was better known for its effect on fetal growth andmaternal weight. The identification of preterm births probably was made difficult byfamine-related amenorrhea, which would have made gestational dating less securefor many women.
Fasting during pregnancy may produce effects analogous to famine. In sheep, a shortinterval of food deprivation around the time of conception–(from 2 mo before to the1 mo after conception) increased the risk of preterm birth. The nutritional restrictionwas brief: it reduced maternal weight by about 15% and was followed by ad libitum feed-ing for the remainder of gestation (35). Because the nutritional demands of the fetuswere modest early in gestation, the trigger of preterm delivery was unclear. The authorsspeculated that the shortage of an essential nutrient(s) was a more likely cause than alack of calories (36).
Later in pregnancy, a fast of 24 to 48 h elicits labor and/or delivery, and this has beendemonstrated across species in ewes (37,38), mares (37–39), and primates (40). In theseanimals, maternal starvation reduced circulating glucose levels and increased free fattyacid production; these, in turn, correlated with higher fetal cortisol and greaterprostaglandin production by both mother and fetus (40). Fasting may elicit a similarresponse in humans: abstaining from food and water during the Yom Kippur fast is asso-ciated with an increased risk of labor onset for women who are close to term (41). Inaddition to lower prepregnancy weight and weight gain, one study suggested that womenin preterm labor were more likely to have detectable ketone bodies than controls (42).Although this could mean that women eat less early in labor, it is also possible thatmany of the pregnant women may have been experiencing so-called “accelerated star-vation” and may have been metabolizing fat stores (43).
A pattern of infrequent eating and snacking throughout the day also may increaserisk for preterm birth. In one study, women who consumed less than three meals andtwo snacks during the third trimester increased their risk of preterm delivery by 30%(44). Similarly, periods of extended fasting–(13 h or more during the second and thirdtrimesters) were associated with increased levels of corticotropin-releasing hormone(CRH) (45). In this and other studies, higher CRH concentrations correlated withshorter gestation duration and an increased risk of preterm delivery (46). Therefore,

634 Part VII / Optimal Pregnancy/Infancy Outcomes
famine and fasting—perhaps in concert with low levels of maternal glucose and othercirculating nutrients—may influence CRH production and increase the risk ofpreterm delivery.
6. IRON
Iron is as essential element in the production of hemoglobin for the transport of oxygento tissues and in the synthesis of enzymes that are required to use oxygen for the pro-duction of cellular energy (14). Supplementation with iron generally is recommendedduring pregnancy to meet the energy needs of both the mother and the rapidly growingfetus. Anemia (low hemoglobin levels) and iron deficiency anemia (IDA) sometimesserve as indicators of overall poor maternal nutritional status during pregnancy. Anemiaappears to be one of the most obvious symptoms when overall dietary intake is inadequate.However, not all anemia is nutritional in origin—some arises from infection.
When detected early in pregnancy, IDA is associated with a lower energy and ironintake, an inadequate gestational weight gain over the whole of pregnancy, and a greaterthan twofold increase in the risk of preterm delivery (25,47). Maternal anemia, whendiagnosed before midpregnancy, is also associated with an increased risk of preterm birth(48–50). During the third trimester, anemia may be a good prognostic sign reflectingexpansion of the maternal plasma volume. Therefore, during the third trimester, anemiaoften is associated with decreased, rather than increased, risk of preterm birth (51).
Scanlon and colleagues (52) used data from Pregnancy Nutritional Surveillance toexamine the relationship between maternal anemia and preterm delivery in 173,031 low-income gravidas. Preterm delivery was increased for anemic women and women withlow hemoglobin during the first or second trimester. For women with moderate-to-severeanemia, risk was approximately doubled; for the others, risk of preterm delivery wasincreased between 10 and 40%. During the third trimester, the association reversed: ane-mia and low hemoglobin each were associated with a decreased risk of preterm birth, andthere was little relationship between high maternal hemoglobin and preterm delivery (53).The association of maternal anemia in early pregnancy with preterm delivery and otherpoor outcomes was confirmed in recent studies from the developing world, includingChina, Nepal, and Egypt (51,54,55).
The increased risk of preterm delivery may be specific to IDA and not anemia fromcauses other than iron deficiency. Scholl (25) reported data from 755 pregnant womenreceiving initial antenatal care at 16.7 ± 5.4 wk of gestation in Camden. Serum ferritin<12.0 μg/L) was used to characterize iron deficiency anemia (14). Although anemiabased on low hemoglobin was high (27.9%) at the initial antenatal visit, prevalenceIDA (anemia with serum ferritin concentrations <12.0 μg/L) was low, amounting to3.5%. After controlling for confounding variables, for women with IDA early in ges-tation, the risk for preterm delivery increased more than twofold, whereas anemia fromother causes was not associated with any increased risk for preterm delivery.Consistent data were obtained from Papua, New Guinea. Severe anemia (<80 g/L) inearly pregnancy (which was attributed to iron deficiency) increased risk of low birthweight about sixfold among primiparous women. Risk was not increased when IDAwas diagnosed at delivery (55).
Thus, it seems reasonable to presume that some, but not all, of what appears to beanemia or IDA is caused by the expansion of the maternal plasma volume. Currently,

Chapter 25 / Nutrition and Preterm Delivery 635
this state is poorly differentiated from anemia or IDA late in pregnancy but is easier todistinguish during the first or second trimester.
Later in pregnancy, high levels of hemoglobin or hematocrit are associated with anincreased risk of preterm delivery. High hemoglobin levels often correlate clinicallywith increased risk of pre-eclampsia and suggest failure of the plasma volume toexpand. Numerous studies have documented such a “U-shaped” relationship betweenlow and high maternal hemoglobin or hematocrit and preterm delivery (Table 1). Garnet al. (56) noted the relationship in data from the National Collaborative PerinatalProject. Using the lowest recorded pregnancy values of hemoglobin and hematocrit,they demonstrated an increased risk of preterm delivery with hemoglobin levels lessthan 100 g/L and greater than 120 g/L. Murphy et al. (57) studied nearly 55,000 womenfrom the Cardiff Births Survey and found the same “U-shaped” relationship at entry toprenatal care (booking). Risk of preterm birth was increased with low hemoglobin levels(<104 g/L) for women entering care before 13 wk and after 20 wk of gestation, whereasfor late entrants to care (weeks 20–24), risk was also increased when hemoglobin lev-els were high. In a multiethnic study of moer than 150,000 women from the North WestThames region of London, Steer et al. (51) demonstrated an increased risk of pretermdelivery with both low (≤85 g/L) and high (<115 g/L) hemoglobin levels among all ethnicgroups. Although African, Afro-Caribbean, and Indo-Pakistani women had higher rates ofpreterm delivery, their higher rates of anemia did not account for the increased risk.
A high concentration of the iron storage protein ferritin during the third trimester ofpregnancy also is associated with an increased risk for preterm and very preterm delivery.In studies of Alabama women, Goldenberg (58) found that high levels of serum ferritin(>40 ng/L) during the third trimester was a marker for an increased risk for preterm andvery preterm delivery. There is a trend for serum ferritin to rise with advancing gestationin women who deliver preterm (59). In Camden (60), high ferritin levels (>41.5 ng/L)during the third trimester (stemming from the failure of ferritin to decline as plasmavolume expands) increased risk of very preterm delivery more than eightfold. High fer-ritin has been associated with indicators of maternal infection, including clinicalchorioamnionitis (60) and infant sepsis (61). Maternal anemia and IDA earlier in pregnancywith inadequate expansion of maternal plasma volume appeared to underlie high ferritinduring the third trimester in the Camden study (60). In studies of nonanemic gravidas,high levels of maternal ferritin correlated with maternal iron status but not infection (62).A recent clinical trial of supplemental iron among nonanemic women participating inWomen, Infants and Children program produced a puzzling result: there were increases inbirth weight and gestation duration in the absence of change in maternal iron status (63).Prophylactic iron supplementation from entry (before week 20) to week 28 did notincrease serum ferritin or reduce risk of either maternal anemia or IDA or any othermeasures of maternal iron status in iron-supplemented women compared to controls.However, women who received iron (as 30 mg/d of ferrous sulfate) had significantlylonger gestation duration (0.6 wk), increased infant birth weight (206 g), and decreasedrisks of infant low birth weight and preterm low birth weight. Risk of preterm delivery(reckoned from the mother’s unconfirmed last menstrual period alone) was not reducedby supplementation with iron.
The reason that maternal anemia in the first and second trimesters is associated withan increased risk of preterm delivery is not known. Allen (64) suggested that the under-lying mechanism(s) possibly involve alterations in the growth and development of the

Tab
le 1
Mat
erna
l Nut
riti
on a
nd P
rete
rm D
eliv
ery,
Stu
dy C
hara
cter
isti
cs
Stud
y de
sign
,siz
e,So
cioe
cono
mic
Nut
rien
tR
efer
ence
and
sett
ing
Age
(yr
)st
atus
Rac
e/E
thni
city
Fin
ding
s
Iron
/Ane
mia
Gar
n et
al.
Obs
erva
tiona
l stu
dy o
f —
Mix
edC
auca
sian
s an
dM
ater
nal H
gb a
nd H
ct(5
6)ov
er 5
0,00
0 w
omen
A
fric
an-
leve
ls h
ad “
U-s
hape
d”
follo
wed
in th
e N
atio
nal
Am
eric
ans
rela
tions
hip
to p
rete
rmC
olla
bora
tive
Peri
nata
l de
liver
y (≤
37 w
k),
Proj
ect (
NC
PP),
w
ith th
e ri
sk b
eing
lo
wes
t pre
gnan
cy v
alue
s hi
gher
at H
gb
of h
emog
lobi
n (H
gb)
<100
g/L
and
and
hem
atoc
rit (
Hct
).>1
20 g
/L. T
he
incr
ease
d ri
sk w
ith
Hgb
indi
cate
d a
failu
re
of p
lasm
a-vo
lum
e ex
pans
ion.
Mur
phy
et a
l. O
bser
vatio
nal s
tudy
of
—M
ixed
Wel
shPr
eter
m d
eliv
ery
(57)
near
ly 5
5,00
0 w
omen
in
(<37
com
plet
ed w
eeks
)th
e C
ardi
ff B
irth
s sh
owed
a U
-sha
ped”
Surv
ey, H
gb le
vels
re
latio
nshi
p to
Hgb
asce
rtai
ned
at e
ntry
to
leve
ls. A
t <13
wk,
ris
kpr
enat
al c
are
(boo
king
).w
as in
crea
sed
abou
t 50
% w
ith H
gb <
104
g/
L; a
t wee
ks 1
3 to
19
risk
was
not
in
crea
sed;
at w
eeks
20
to 2
4, r
isk
was
in
crea
sed
for
low
(1
04 g
/L)
and
high
(>
145
g/L
) H
gb b
y ov
er 5
0%.
636

Kle
bano
ff e
t al.
Cas
e–co
ntro
l stu
dy o
f —
—14
% A
sian
Hct
val
ues
fell
duri
ng
(49)
1706
(72
5 pr
eter
m,
28%
Afr
ican
-ea
rly
seco
nd tr
imes
ter
981
term
) de
liver
ies
Am
eric
anan
d be
gan
incr
ease
fr
om K
aise
r 21
% M
exic
anag
ain
at 3
1 to
33
wk.
Pe
rman
ente
Bir
ths
37%
Cau
casi
anM
oder
ate
rela
tions
hip
Def
ects
Stu
dy, H
ct
betw
een
seco
nd
leve
ls m
easu
red
trim
este
r an
emia
(H
ct <
th
roug
hout
ges
tatio
n.10
th p
erce
ntile
for
et
hnic
ity a
nd g
esta
tion)
an
d pr
eter
m d
eliv
ery.
Stee
r et
al.
Ret
rosp
ectiv
e an
alys
is o
f—
Mix
ed73
% C
auca
sian
Incr
ease
d ri
sk o
f pr
eter
m
(51)
mor
e th
an 1
50,0
00
14%
Ind
o de
liver
y (<
37 w
k w
omen
fro
m th
e N
orth
Pa
kist
ani
com
plet
ed)
with
Hgb
W
est T
ham
es r
egio
n of
5%
Afr
ican
-le
vels
≤85
g/L
Lon
don,
low
est
Am
eric
an
(AO
R=
1.62
, re
cord
ed H
gb d
urin
g 8%
Oth
erC
I95%
:1.3
5–2.
18)
pr
egna
ncy.
and
>115
g/L
.Z
hou
et a
l.O
bser
vatio
nal s
tudy
of
27.7
±4.
7 yr
—C
hine
seIn
vers
e “U
-sha
ped
(50)
829
wom
en f
rom
re
latio
nshi
p” b
etw
een
Shan
ghai
. Pop
ulat
ion
mat
erna
l Hgb
at
hom
ogen
eous
for
rac
e,
4–8
wk
and
pret
erm
pa
rity
, pre
nata
l car
e,
deliv
ery
and
low
bir
th
smok
ing.
Hgb
sam
pled
w
eigh
t. O
dds
of
at 4
–8, 1
6–20
, and
pr
eter
m d
eliv
ery
28–3
2 w
k of
ges
tatio
n.in
crea
sed
2.5-
fold
for
w
omen
with
Hgb
>
130
g/L
or b
etw
een
90 a
nd 9
9g/
L.
Odd
s in
crea
sed
3.5-
fold
for
ent
ry H
gb
betw
een
60 a
nd 8
9g/
L.
Ris
k of
fet
al
grow
th r
etar
datio
n un
rela
ted
to e
ntry
Hgb
(Con
tinu
ed)
637

Tab
le 1
(Con
tinu
ed)
Stud
y de
sign
,siz
e,So
cioe
cono
mic
Nut
rien
tR
efer
ence
and
sett
ing
Age
(yr
)st
atus
Rac
e/E
thni
city
Fin
ding
s
Scan
lon
et a
l.R
etro
spec
tive
anal
ysis
of
70%
Low
55%
Cau
casi
anR
isk
of p
rete
rm d
eliv
ery
(52)
data
fro
m 1
73,6
31
20–3
5 yr
20%
Afr
ican
-in
crea
sed
with
low
pr
egna
nt W
IC
Am
eric
anH
gb in
fir
st a
nd s
econ
dpa
rtic
ipan
ts.
19%
His
pani
ctr
imes
ter.
Seve
re
6% O
ther
anem
ia 1
–68
SGA
not
asso
ciat
ed w
ith a
nem
ia.
AO
R o
f pr
eter
m
deliv
ery
with
fir
st
trim
este
r se
vere
ane
mia
in
crea
sed
1.7
times
.C
ogsw
ell e
t al.
Ran
dom
ized
, pla
cebo
-24
.3 ±
5 yr
Low
56%
Cau
casi
anIr
on s
uppl
emen
tatio
n di
d (6
3)co
ntro
lled
tria
l of
25%
Afr
ican
-no
t red
uce
anem
ia o
r W
IC p
artic
ipan
ts,
Am
eric
anin
crea
se f
erri
tin o
r no
t ane
mic
at e
ntry
16
% H
ispa
nic
othe
r ir
on s
tatu
s (<
20 w
k). P
artic
ipan
ts
3% O
ther
mea
sure
s. I
ron
supp
lem
ente
d un
til
supp
lem
enta
tion
wk
28, 3
0 m
g FE
as
incr
ease
d bi
rth
wei
ght
ferr
ous
sulp
hate
or
(206
g)
and
decr
ease
d pl
aceb
o. A
t wk
28
risk
of
low
bir
th w
eigh
tco
ntro
ls w
ith lo
w
and
pret
erm
low
bir
th
ferr
itin
rece
ived
iron
w
eigh
t but
not
pre
term
(30
or 6
0 m
g/d)
.de
liver
y.ID
ASc
holl
et a
l. O
bser
vatio
nal s
tudy
of
18.4
±3.
778
% M
edic
aid
77%
Afr
ican
-ID
A(f
ound
in 1
2.5%
of
(25,
47)
IDA
(ID
A, a
nem
ia
(ane
mia
)(a
nem
ia)
Am
eric
anth
ose
with
ane
mia
) w
ith s
erum
fer
ritin
18
.4 ±
3.9
(ane
mia
)w
as f
ound
to b
e<1
2 μg
/L)
amon
g 77
9 (n
o an
emia
)56
% A
fric
an-
asso
ciat
ed w
ith
wom
en f
rom
Cam
den,
A
mer
ican
lo
wer
ene
rgy
and
iron
N
J.(n
o an
emia
)in
take
s ea
rly
in
preg
nanc
y. T
he r
isk
or
pret
erm
del
iver
y w
as
638

bette
r th
an tw
o tim
es
with
ID
A, b
ut w
as n
ot
incr
ease
d w
ith a
nem
ia
from
oth
er c
ause
s.Ir
on/F
erri
tinG
olde
nber
gO
bser
vatio
nal s
tudy
of
—10
0% L
ow10
0%
Ferr
itin
in th
e hi
ghes
tet
al.
(58)
seru
m f
erri
tin a
t 19,
26,
Afr
ican
-qu
artil
e at
wee
k 28
and
36 w
k an
d pr
eter
mA
mer
ican
was
ass
ocia
ted
with
ade
liver
y in
580
gra
vida
stw
ofol
d in
crea
se in
who
par
ticip
ated
in a
odds
or
pret
erm
rand
omiz
ed s
tudy
of
zin
(<37
wk)
del
iver
y an
d su
pple
men
tatio
nin
fant
low
bir
thw
eigh
t, a
thre
efol
din
crea
se in
odd
s of
ve
ry p
rete
rm (
≤32
wk)
de
liver
y, a
nd a
fou
rfol
d in
crea
se in
bir
thw
eigh
t ≤15
00 g
.Sc
holl
(60)
Obs
erva
tiona
l stu
dy o
f 12
to 2
9 yr
100%
Low
33.3
% H
ispa
nic
At w
eek
28 h
igh
seru
m f
erri
tin (
15 a
nd
57.3
% A
fric
an-
conc
entr
atio
ns o
f 28
wk)
in 1
162
Am
eric
anfe
rriti
n (>
90th
fro
m
grav
idas
fro
m th
e 9.
4% C
auca
sian
failu
re o
f ge
stat
ion
was
Cam
den
Stud
y.as
soci
ated
with
a
nine
fold
incr
ease
in
very
pre
term
del
iver
y,
a fo
urfo
ld in
crea
se in
pr
eter
m d
eliv
ery,
and
a
five
fold
incr
ease
in
low
bir
th w
eigh
t (p
<0.
01 f
or e
ach)
.G
olde
nber
gO
bser
vatio
nal s
tudy
of
24.8
±5.
9 yr
—A
mer
ican
Plas
ma
ferr
itin
incr
ease
d et
al.
(61)
223
grav
idas
with
be
twee
n ad
mis
sion
for
PRO
M b
efor
e 32
wk.
PRO
M a
nd d
eliv
ery.
Dat
a fr
om r
ando
miz
edFe
rriti
n le
vels
wer
e
639
(Con
tinu
ed)

Tab
le 1
(Con
tinu
ed)
Stud
y de
sign
,siz
e,So
cioe
cono
mic
Nut
rien
tR
efer
ence
and
sett
ing
Age
(yr
)st
atus
Rac
e/E
thni
city
Fin
ding
s
antib
iotic
tria
ls a
t fiv
esi
gnif
ican
tly h
ighe
r (b
ycl
inic
al c
ente
rs.
36 μ
g/L
) in
wom
enw
hose
infa
nts
deve
lope
d se
psis
.Z
inc
Che
rry
et a
l. R
ando
miz
ed, c
ontr
olle
d 17
.6 y
r L
ow95
% A
fric
an-
With
str
atif
icat
ion
by
(71)
tria
l of
zinc
(r
ange
: A
mer
ican
mat
erna
l wei
ght a
t su
pple
men
tatio
n am
ong
13.5
to
deliv
ery,
zin
c pe
gnan
t tee
nage
rs f
rom
19
.6 y
r)su
pple
men
tatio
n w
as
New
Orl
eans
who
wer
e re
late
d to
a lo
wer
ris
k as
sign
ed to
pla
cebo
of
pre
term
del
iver
y (n
=55
6) o
r 30
mg
of
(38
wk)
am
ong
zin
supp
lem
enta
tion
norm
al-w
eigh
t wom
en(n
=58
1)(1
8.3
vs 2
8%;p
<0.
05).
Zin
c-su
pple
men
ted
low
-wei
ght m
ultip
aras
ha
d in
crea
sed
gest
atio
n du
ratio
n (+
1.2
wk;
p
<0.
008)
. The
re w
as
a te
nden
cy (
p<
0.15
) fo
r w
eigh
t gai
n ra
tes
to
be g
reat
er a
mon
g zi
nc
supp
lem
ente
d w
omen
(0
.52
kg/w
k) c
ompa
red
with
pla
cebo
(0
.42
kg/w
k).
Gol
denb
erg
Ran
dom
ized
, con
trol
led
23.9
±5.
5 yr
Low
100%
Afr
ican
-B
irth
wei
ght i
ncre
ased
et
al.
(72)
tria
l of
zinc
(z
inc)
Am
eric
ans
with
zin
c su
pple
men
tatio
n am
ong
22.8
±5.
4su
pple
men
tatio
n by
pr
egna
nt A
laba
ma
(zin
c)12
6 g
(p<
0.05
) an
d
640

wom
en w
ith p
lasm
a ge
stat
ion
dura
tion
by
zinc
bel
ow m
edia
n at
0.
5 w
k (p
=0.
06).
en
try
to p
rena
tal c
are,
W
omen
with
pre
grav
id
assi
gned
to m
ultiv
itam
in
BM
I le
ss th
an 2
6 ha
d a
tabl
et w
ith a
n ad
ditio
nal
birt
h w
eigh
t inc
reas
e 25
mg
of z
inc
of 2
48 g
(p
<0.
005)
(n
=29
4) o
r pl
aceb
o an
d an
incr
ease
in
(n=
286)
gest
atio
n of
0.7
wk
(p=
0.08
).N
egge
rs e
t al.
Obs
erva
tiona
l stu
dy o
f 21
.8 ±
4.9
Low
76.5
% A
fric
an-
Low
pla
sma
zinc
at e
ntry
(68)
476
Ala
bam
a w
omen
.A
mer
ican
to p
rena
tal c
are
(7.0
–12.
2 μm
ol/L
) in
crea
sed
risk
of
infa
nt
low
bir
th w
eigh
t eig
ht
times
com
pare
d w
ith w
omen
in th
e hi
ghes
t qua
rtile
(15.
9–25
.4μm
ol/L
;p
<0.
05).
Pla
sma
zinc
was
line
arly
rel
ated
toge
stat
ion
dura
tion
(0.1
7 w
k/μm
ol/L
zinc
;p
<0.
05).
Scho
ll et
al.
Obs
erva
tiona
l stu
dy o
f 19
.2 (
�6
mg
Low
60%
Afr
ican
-L
ow d
ieta
ry z
inc
inta
ke
(26)
diet
ary
zinc
inta
ke in
of
zin
c pe
r A
mer
ican
asso
ciat
ed w
ith tw
ice
818
preg
nant
wom
en
day)
grea
ter
pret
erm
fr
om C
amde
n, N
J.18
.7 (
>15
mg
(<37
wk)
del
iver
y an
d of
zin
c pe
r in
fant
low
bir
th
day)
wei
ght,
thre
e to
fou
r tim
es g
reat
er v
ery
earl
y pr
eter
m (
<33
wk)
deliv
ery
(p <
0.05
fo
r ea
ch).
Ris
k fo
r pr
eter
m d
eliv
ery
with
(Con
tinu
ed)
641
Tab
le 1
(C
onti
nued
)
Stud
y de
sign
,siz
e,So
cioe
cono
mic
Nut
rien
tR
efer
ence
and
sett
ing
Age
(yr
)st
atus
Rac
e/E
thni
city
Fin
ding
s
PRO
M in
crea
sed
3.5
times
with
low
zin
c (p
<0.
05).
Siko
rski
et a
l.O
bser
vatio
nal s
tudy
of
26 ±
4.4
yr—
Polis
hZ
inc
inde
x co
mpi
led
from
(70)
zinc
sta
tus
in 7
0 zi
nc a
ssay
ed in
blo
od,
wom
en w
ith te
rm
scal
p an
d pu
bic
hair
de
liver
ies.
and
colo
stru
m. Z
inc
inde
x in
pat
ient
s w
ith
PRO
M w
as lo
wer
(4
.33
±1.
18)
com
pare
d w
ith p
atie
nts
with
out P
RO
M
(5.9
7±
1.39
; p<
0.05
).
Zin
c in
dex
was
in
vers
ely
corr
elat
ed
with
par
ity(r
=−0
.61)
.Fo
lic a
cid/
Tche
rnia
et a
l.O
bser
vatio
nal s
tudy
of
——
Fren
chSe
rum
fol
ate
low
er b
y fo
late
(87)
seru
m f
olat
e in
100
1.
1 μg
/Lin
wom
en
wom
en u
sing
iron
or
deliv
erin
g ≤3
9 ir
on a
nd v
itam
in C
.w
k (p
<0.
01).
Obs
erva
tiona
l stu
dy o
f —
—Fr
ench
Ges
tatio
n du
ratio
n re
d ce
ll fo
late
in 1
00
redu
ced
by 0
.8 w
k in
hi
gh-r
isk
wom
en.
wom
en w
ith R
BC
fo
late
≤20
0 μg
/L(p
<0.
025)
.Su
pple
men
tatio
n tr
ial
——
Fren
chG
esta
tion
dura
tion
(ope
n) o
f ir
on v
s ir
on +
incr
ease
d by
0.8
wk
fola
te (
350
μg/d
) in
am
ong
iron
and
fol
ate
108
wom
en.
supp
lem
ente
d w
omen
(p
<0.
001)
.
642

Blo
t et a
l.N
onra
ndom
ized
, 27
.5 ±
4.5
34%
Low
Fren
chG
esta
tion
dura
tion
(86)
doub
le-b
lind
stud
y of
in
crea
sed
by 0
.8 w
kir
on a
nd a
scor
bic
acid
w
ith f
olat
e (3
50 μ
g/d)
vs ir
on, a
scor
bic
acid
, su
pple
men
tatio
n, b
irth
and
fola
te a
t 6 m
o of
w
eigh
t inc
reas
ed b
yge
stat
ion
in 2
00 w
omen
. 15
8 g,
bir
th le
ngth
by
1.7
cm (
p <
.05)
.Sc
holl
et a
l.O
bser
vatio
nal s
tudy
of
18.8
Med
icai
d 80
%67
% A
fric
an-
Wom
en w
ith lo
w f
olat
e(6
5)fo
late
fro
m d
iet a
nd
Am
eric
anin
take
(≤2
40 μ
g/d)
supp
lem
ents
and
gr
eate
r pr
eter
mse
rum
fol
ate
in
deliv
ery
and
had
thre
eC
amde
n, N
J (n
=83
2).
times
infa
nt L
BW
(p <
0.05
). R
isk
ofpr
eter
m d
eliv
ery
with
out P
RO
Min
crea
sed
thre
e tim
es(p
<0.
05).
Odd
s of
pret
erm
del
iver
yin
crea
sed
1.5%
per
unit
decr
ease
in s
erum
fola
te (
p <
0.05
).Fo
lic a
cid
Gile
s et
al.
Ran
dom
ized
stu
dy o
f fo
lic
24.9
±5.
2 —
Aus
tral
ian
Folic
aci
d gr
oup
(85)
acid
(5
mg/
d) o
r ir
on
yr (
iron
)(M
elbo
urne
)co
ntai
ned
mor
e su
pple
men
tatio
n in
692
25
.1 ±
5.7
prim
igra
vida
s th
an
grav
idas
. Pat
ient
s yr
s. (
folic
pl
aceb
o gr
oup.
No
stra
tifie
d by
ges
tatio
n ac
id +
iron
)di
ffer
ence
bet
wee
n at
ent
ry to
car
e:
grou
ps in
ges
tatio
n <1
0 w
k, 1
0–20
w,
dura
tion
or b
irth
20
–30
wk,
>30
wk.
w
eigh
t.Fl
etch
er e
t al.
Dou
ble-
blin
d, r
ando
miz
ed
27.2
±5.
7—
Eng
lish
Ges
tatio
n du
ratio
n (8
4)st
udy
of f
olic
aci
d pl
us
yr (
folic
(39.
7 w
k [L
ondo
n])
643
(Con
tinu
ed)

Tab
le 1
(Con
tinu
ed)
Stud
y de
sign
,siz
e,So
cioe
cono
mic
Nut
rien
tR
efer
ence
and
sett
ing
Age
(yr
)st
atus
Rac
e/E
thni
city
Fin
ding
s
iron
(5
mg/
d) o
r ir
on
acid
+ir
on)
iron
vs
39.7
fol
ic a
cid
in 6
43 g
ravi
das.
27.4
±5.
7+
iron
) an
d pr
opor
tion
yrs.
(ir
on)
less
than
38
wk
(8.7
vs
8.7%
) w
ere
not d
iffe
rent
.Fl
emin
g et
al.
Ran
dom
ized
con
trol
led
——
Wes
tern
Sm
all s
ampl
e si
zes
in
(83)
tria
l of
folic
aci
d A
ustr
ialia
each
of
the
five
tria
l (0
.5 m
g or
5 m
g/d)
ar
ms
(n∼
20).
No
with
and
with
out i
ron
diff
eren
ce in
ges
tatio
n pl
us a
pla
cebo
gro
up
or b
irth
wei
ght w
as
in 1
46 g
ravi
das.
dete
cted
am
ong
grou
ps.
Folic
aci
d/M
alin
ow (
92)
Obs
erva
tiona
l stu
dy o
f 24
.2 ±
5.9
yr—
Am
eric
anIn
uni
vari
able
ana
lyse
s,
hom
ocys
tein
eci
rcul
atin
g se
rum
m
ater
nal h
omoc
yste
ine
hom
ocys
tein
e an
d co
rrel
ated
sig
nifi
cant
lyse
rum
fol
ate
in 3
5 (p
<0.
05)
with
gest
atio
nhe
alth
y nu
llipa
rous
du
ratio
n (r
=–0
.42)
gr
avid
as a
t del
iver
y.se
rum
fola
te c
orre
late
d si
gnif
ican
tly (
p<
0.05
) w
ith g
esta
tion
(r=
0.23
).M
ater
nal
fola
te a
nd h
omoc
yste
ine
corr
elat
ed s
igni
fica
ntly
(r
=0.
54)
with
eac
hot
her
(p<
0.05
).M
ater
nal s
erum
B1
2
was
not
rel
ated
toge
stat
ion
dura
tion
(r=
0.08
; p=
0.67
).
644

645
Raj
kovi
c (8
9)O
bser
vatio
nal s
tudy
of
20 ±
4 yr
—45
% A
fric
an-
Pre-
ecla
mpt
ic g
ravi
das
plas
ma
hom
ocys
tein
e A
mer
ican
had
high
erin
20
nulli
paro
us
55%
Cau
casi
anho
moc
yste
ine
grav
idas
with
(8
.66
vs 4
.99
g m
ol/L
),pr
e-ec
lam
psia
and
20
and
deliv
ered
cont
rols
.si
gnif
ican
tly e
arlie
rth
an c
ontr
ols
(35
±4
vs 4
0 ±
1 w
k)
(p<
0.05
for
eac
h).
Vol
lset
et a
l. R
etro
spec
tive
coho
rt
40–4
2 yr
—N
orw
egia
nC
urre
nt h
omoc
yste
ine
(90)
anal
ysis
of
5883
(h
ighe
st q
uart
ile)
wom
en li
nkin
g cu
rren
t as
soci
ated
with
his
tory
ho
moc
yste
ine
to p
ast
of a
dver
se p
regn
ancy
pr
egna
ncy
outc
omes
.ou
tcom
e in
clud
ing
pre-
ecla
mps
ia, p
rete
rm
deliv
ery,
low
bir
th
wei
ght,
still
birt
h,
neur
al tu
be d
efec
ts a
nd
club
foo
t.R
onne
nber
gC
ase–
cont
rol s
tudy
of
24–2
7 yr
—
100%
Chi
nese
Ris
k of
pre
term
del
iver
y et
al.
(91)
prep
regn
ancy
(2
3.0–
34.2
)in
crea
sed
3.6-
fold
for
ho
moc
yste
ine
B
wom
en w
ith e
leva
ted
vita
min
s (B
6, B
12,
hom
ocys
tein
e (≥
12.4
fo
late
) an
d pr
egna
ncy
μμ/L
). Pr
eter
m d
eliv
ery,
outc
ome
in 4
05 w
omen
50
–60%
low
er
from
Anq
uin,
Chi
na.
for
wom
en w
ith
nond
efic
ient
leve
ls o
fB
12
and
B6. S
erum
fola
te n
ot a
ssoc
iate
dw
ith p
rete
rm d
eliv
ery.
Cal
cium
Lop
ez-
Ran
dom
ized
, con
trol
led
19.4
±1.
8L
ow-i
ncom
e G
esta
tion
dura
tion
long
erJa
ram
illo
tria
l of
calc
ium
E
cuad
oria
n fo
r 22
sup
plem
ente
det
al.
supp
lem
enta
tion
amon
g cl
inic
pat
ient
s w
omen
(2
g ca
lciu
m/d
)(9
9,10
0)56
nul
lipar
as a
t ris
k w
ith o
vera
ll vs
pla
cebo
gro
up
(Con
tinu
ed)

Tab
le 1
(C
onti
nued
)
Stud
y de
sign
,siz
e,So
cioe
cono
mic
Nut
rien
tR
efer
ence
and
sett
ing
Age
(yr
)st
atus
Rac
e/E
thni
city
Fin
ding
s
for
preg
nanc
y-in
duce
d lo
w c
alci
um
(n=
34).
Ges
tatio
n hy
pert
ensi
on in
Qui
to,
inta
ke.
39.2
±1.
2 w
k fo
r E
cuad
or.
calc
ium
sup
plem
ente
d,37
.4 ±
2.3
wk
for
plac
ebo
(p<
.01)
.V
illar
and
Ran
dom
ized
, con
trol
led
≤17
Low
-inc
ome
Ges
tatio
n du
ratio
n lo
nger
R
epke
(10
1)tr
ial o
f ca
lciu
m
clin
ic
for
94 s
uppl
emen
ted
supp
lem
enta
tion,
190
pa
tient
s,
teen
ager
s (2
g c
alci
um
teen
ager
s in
Bal
timor
e,
93.7
%
per
day)
vs
plac
ebo
MD
.A
fric
an-
grou
p (n
= 9
5).G
esta
tion
Am
eric
an39
.2 ±
2.7
wk
for
calc
ium
sup
plem
ents
,37
.9 ±
3.9
wk
for
plac
ebo
(p<
.01)
Low
erpe
rcen
tage
of
pret
erm
de
liver
y (<
37 w
k)
amon
g su
pple
men
ted
(7.4
%)
vs p
lace
bo
(21.
1%; p
<0.
01).
Bel
izan
et a
l. R
ando
miz
ed, c
ontr
olle
d 23
.7 ±
5.5
Mix
edA
rgen
tinia
nPe
rcen
t with
pre
term
(9
6)tr
ial o
f ca
lciu
m
(cal
cium
)de
liver
y(<3
7 w
k)
supp
lem
enta
tion
23.7
±5.
7am
ong
579
calc
ium
-am
ong1
194
grav
idas
(p
lace
bo)
supp
lem
ente
d w
omen
in
Ros
ario
, Arg
entin
a.(2
g c
alci
um/d
)6.
3 vs
6.8
% f
or 5
88
wom
en r
ecei
ving
pl
aceb
o.B
uche
r et
al.
Med
line
and
Em
base
—
Mix
ed—
The
sum
mar
y od
ds r
atio
(1
02)
sear
ches
for
fo
r pr
eter
m d
eliv
ery
646

rand
omiz
ed tr
ials
of
was
0.6
9 (9
5% C
I ca
lciu
m a
nd
0.48
–1.0
1) a
nd n
ot
pre-
ecla
mps
ia d
urin
g st
atis
tical
ly s
igni
fica
nt.
preg
nanc
y (2
459
Whi
le a
ll th
e tr
ials
su
bjec
ts e
nrol
led
in
whi
ch in
clud
ed
14 tr
ials
) fo
r pr
eter
m d
eliv
ery
met
a-an
alys
is.
show
ed a
red
uced
ris
k w
ith c
alci
um
supp
lem
enta
tion
duri
ng p
regn
ancy
onl
y on
e w
as s
tatis
tical
ly
sign
ific
ant.
Lev
ine
et a
l. R
ando
miz
ed tr
ial o
f 21
±4
yrM
ixed
35%
Cau
casi
anC
alci
um-s
uppl
emen
ted
(103
)ca
lciu
m
17%
His
pani
cgr
avid
as d
eliv
ered
su
pple
men
tatio
n 47
% A
fric
an-
at 3
8.9
±2.
5 vs
(5
00 m
g/d)
or
plac
ebo
Am
eric
an38
.9 ±
2.4
wks
for
in
458
9 he
alth
y 2%
Oth
erpl
aceb
o (N
S).
nulli
para
s at
13–2
1 w
k Pr
eter
m d
eliv
ery
gest
atio
n. E
ligib
le
(<37
wks
) an
d ve
ry
wom
en u
nder
wen
t tes
t pr
eter
m d
eliv
ery
of c
ompl
ianc
e be
fore
(<
34 w
k) o
ccur
red
in
enro
llmen
t in
tria
l.10
.8 a
nd 4
.2%
of
supp
lem
ente
d vs
10.
0 an
d 3.
7% o
f co
ntro
ls
(NS)
. low
bir
th w
eigh
t (<
2500
gm
) w
as 8
.8%
in
sup
plem
ente
d, 9
.6%
in
con
trol
s (N
S).
Cro
wth
er e
t al.
Ran
dom
ized
tria
l of
25 ±
5 yr
Mix
edA
ustr
alia
nT
reat
men
t with
cal
cium
(1
04)
calc
ium
sup
plem
enta
tion
redu
ced
risk
of
(1.8
g/d
) or
pla
cebo
in
pree
clam
psia
and
45
6 nu
llipa
rous
with
pr
eter
m b
irth
with
si
ngle
ton
preg
nanc
ies.
mor
e th
an tw
o fo
ld
redu
ctio
n in
ris
k fo
r ea
ch.
(Con
tinu
ed)
647

Tab
le 1
(C
onti
nued
)
Stud
y de
sign
,siz
e,So
cioe
cono
mic
Nut
rien
tR
efer
ence
and
sett
ing
Age
(yr
)st
atus
Rac
e/E
thni
city
Fin
ding
s
Fish
oils
O
lsen
et a
l. R
ando
miz
ed, c
ontr
olle
d 29
.4 ±
4.4
—D
anis
hM
ean
gest
atio
n du
ratio
n (n
-3 f
atty
(1
05)
tria
l of
supp
lem
enta
tion
(fis
h oi
l)lo
nger
(p
<0.
006)
for
ac
ids)
with
fis
h oi
l, 53
3 29
.7 ±
4.3
the
266
wom
en
wom
en a
ssig
ned
2, 1
, (o
live
oil)
rece
ivin
g fi
sh o
il an
d 1
to f
ish
oil,
oliv
e 29
.1 ±
4.1
(283
.3 ±
11.1
d)
oil,
or n
o oi
l (n
o oi
l)co
mpa
red
with
oliv
e oi
lsu
pple
men
tatio
n,
(279
.4 ±
13.1
d)
resp
ectiv
ely,
in A
arhu
s,
or n
o oi
l gro
ups
Den
mar
k.(2
81.7
±11
.6 d
).M
ultiv
itam
in/
Scho
ll et
al.
Obs
erva
tiona
l stu
dy o
f 12
–29
yrL
ow58
.9%
Afr
ican
-Pr
enat
al s
uppl
emen
t use
M
iner
als
(112
)14
30 g
ravi
das
from
the
Am
eric
anas
soci
ated
with
two-
toC
amde
n St
udy
who
fo
urfo
ld r
educ
tion
in
ente
red
care
dur
ing
odds
of
pret
erm
tr
imes
ters
one
and
two.
de
liver
y an
d ve
ry
Pren
atal
sup
plem
ent
pret
erm
del
iver
y us
ers
com
pare
d to
(p
<.00
1). S
igni
fica
ntgr
avid
as e
nter
ing
care
re
duct
ions
in o
dds
ofin
sam
e tim
e fr
ame
very
LB
W(s
ix-
to
who
did
not
use
se
venf
old)
and
infa
nt
supp
lem
ents
.lo
w b
irth
wei
ght
(tw
ofol
d) (
p<
0.00
1).
Pren
atal
sup
plem
ent
use
corr
obor
ated
by
assa
y of
cir
cula
ting
mic
ronu
trie
nts
at 1
5 an
d 28
wk
(p<
0.05
).
648

Faw
zi e
t al.
Ran
dom
ized
stu
dy o
f —
Low
Tanz
ania
nW
omen
rec
eivi
ng
(115
)10
75 H
IV-1
-inf
ecte
d m
ultiv
itam
ins
had
grav
idas
fro
m T
anza
nia
sign
ific
antly
dec
reas
edra
ndom
ly a
ssig
ned
to
(p<
0.01
) in
fant
low
pl
aceb
o, v
itam
in A
, bi
rth
wei
ght b
y (4
4%),
or
mul
tivita
min
s in
ve
ry p
rete
rm b
irth
a 2
×2
fact
oria
l des
ign
(39%
), an
d fe
tal g
row
thre
stri
ctio
n (4
3%)
CD
4,C
D8,
and
CD
3 co
unts
wer
e si
gnif
ican
tlyin
crea
sed
(p<
0.05
).V
itam
in A
had
no e
ffec
ton
thes
e ou
tcom
es.
Wu
et a
l. L
iveb
irth
s fr
om 1
988
25.5
±5.
9 yr
Mix
edA
mer
ican
No
diff
eren
ce b
etw
een
(114
)N
MIH
Sur
vey
smok
ers
who
reg
ular
ly
(n ∼
9000
) an
alyz
ed to
us
ed m
ulti-
vita
min
s ex
amin
e ef
fect
of
and
thos
e us
ing
them
re
gula
r us
e of
le
ss in
odd
s of
pre
term
m
ultiv
itam
in/m
iner
al
deliv
ery,
LB
Wor
fet
alsu
pple
men
ts a
nd
grow
th r
etar
datio
n.sm
okin
g. G
ravi
das
regu
larl
y us
ing
supp
lem
ents
(3
+tim
es/w
k)
com
pare
d to
thos
e w
ho
used
them
less
oft
en.
Chr
istia
n et
al.
Clu
ster
ran
dom
ized
55
% 2
0–29
yr
Low
Nep
ales
eN
one
of th
e su
pple
men
ts
(116
)co
ntro
lled
tria
l of
426
redu
ced
risk
of
pret
erm
rura
l com
mun
ities
in
deliv
ery.
In
com
pari
son
SE N
epal
. to
vita
min
Aco
ntro
l,C
omm
uniti
es
mul
tiple
mic
ronu
trie
nts
rand
omiz
ed to
fiv
e in
crea
sed
birt
h w
eigh
t
(Con
tinu
ed)
649

Tab
le 1
(Con
tinu
ed)
Stud
y de
sign
,siz
e,So
cioe
cono
mic
Nut
rien
tR
efer
ence
and
sett
ing
Age
(yr
)st
atus
Rac
e/E
thni
city
Fin
ding
s
regi
mes
of
(+64
g)
and
redu
ced
supp
lem
enta
tion
vs
low
bir
th w
eigh
t by
vita
min
Aco
ntro
l.14
%. F
olic
aci
d pl
usir
on a
lso
incr
ease
dbi
rth
wei
ght (
+37
g, N
S)an
d re
duce
d lo
w b
irth
wei
ght b
y 16
%.
Ram
akri
shna
n R
ando
miz
ed tr
ial o
f 23
±5
yrL
owM
exic
anM
ultiv
itam
in a
nd ir
on
et a
l. (1
17)
mul
tivita
min
su
pple
men
ts d
id n
ot
supp
lem
ents
vs
iron
.yi
eld
diff
eren
ces
in
birt
hwei
ght,
gest
atio
n du
ratio
n, lo
w b
irth
w
eigh
t, IU
GR
, or
pond
eral
inde
x.A
ntio
xida
nts
Cha
ppel
l et a
l. R
ando
miz
ed p
lace
bo
29 ±
5M
ixed
61%
Eur
opea
nSu
pple
men
ts w
ith
(120
,121
)co
ntro
lled
tria
l of
21%
Afr
ican
vita
min
s C
and
E
supp
lem
enta
tion
with
15
% C
arib
bean
redu
ced
risk
of
antio
xida
nt v
itam
ins
C
3% O
ther
pree
clam
psia
an
d E
in g
ravi
das
2.5-
fold
. No
diff
eren
ces
(n=
283)
at r
isk
of
in p
rete
rm d
eliv
ery,
pree
clam
psia
.SG
Are
duce
d by
28
% (
NS)
.Sh
arm
a et
al.
Ran
dom
ized
pla
cebo
22
Mix
edIn
dian
Supp
lem
enta
tion
with
(122
)co
ntro
lled
tria
l of
lyco
pene
red
uced
ris
ksu
pple
men
tatio
n w
ith
of p
reec
lam
psia
by
lyco
pene
in N
ew D
elhi
50
%, r
educ
ed d
iato
licpr
impa
ras
(n=
251)
.bl
ood
pres
sure
, and
risk
of
SGA
(by
50%
) an
d in
crea
sed
gest
atio
n du
ratio
n by
1 to
2 w
k.
650

Chapter 25 / Nutrition and Preterm Delivery 651
placenta and fetus that are related to hypoxia. Chronic hypoxia activates the stressresponse and, in theory, the release of CRH by the placenta, the increased production ofcortisol by the fetus, and an early delivery. Another plausible mechanism involvedincreased oxidative stress in iron-deficient women that was not offset by endogenous ordietary antioxidants, with subsequent damage to the maternal–fetal unit (64). A thirdcredible hypothesis involved infection, that is, reduced immune function and increasedrisk of infection among iron-deficient women, with increased production of inflamma-tory cytokines, secretion of CRH, and production of prostaglandins (64).
7. MICRONUTRIENTS
During pregnancy, low intakes of two micronutrients—zinc (26) and folate (65)—areassociated with lower energy intake, IDA at entry to care, an inadequate gestational gainduring pregnancy, and an increased risk of preterm delivery. Zinc is an element involvedeither directly (as a metalloenzyme) in the production of enzymes, including DNA andRNA polymerase, or as a catalyst in the synthesis of other enzymes (66). Folic acidfunctions as a coenzyme in the transfer of single-carbon atoms to intermediates in thesynthesis of amino acids and nucleic acids (67). Although many other nutrients alsowould be limited in a marginal maternal diet, inadequate intake of zinc, folate, or bothpotentially leads to impaired cell division and alterations in protein synthesis. Suchalterations are most notable and have the greatest potential to do harm during times ofrapid tissue growth, such as pregnancy (14).
7.1. ZincNeggers et al. (68) used plasma zinc as an indicator of zinc status and demonstrated
a positive association between the maternal serum zinc at 16 wk of gestation and birthweight in a large population of low-income women from Alabama. Serum zinc in thelowest quartile was associated with an eightfold increased risk of low birth weight,suggesting a threshold effect for circulating levels of zinc during pregnancy (Table 1).Kirksey et al. (69) examined the relationship of maternal zinc nutriture to birth weightand found that plasma zinc concentrations in the second trimester, along with pregnancyweight at 3 mo of gestation, formed the best predictor model of birth weight for thesepregnancies, accounting for 39% of the variance. Scholl and colleagues (26) examinedthe relationship of dietary zinc intake in 818 Camden women and reported increasedrisks of complications and adverse pregnancy outcomes in association with low intakesof dietary zinc (6 mg/d or less). These complications included increased inadequate ges-tational weight gain and a greater risk of IDA at entry to care. Poor outcomes associ-ated with low zinc intake included risks of low birth weight, preterm delivery, and verypreterm delivery two-to-three times greater than controls. In the presence of IDA, therisk of very preterm delivery was greater than fivefold. Sikorski et al. (70) also reporteda lower zinc index at delivery (composite of zinc in hair, colostrum, and plasma) inwomen with premature rupture of the membranes at term (Table 1).
Although observational studies have been suggestive, clinical trials of zinc supple-mentation have focused on entire groups of low-income women in which the mean zincintake is below the Recommended Daily Allowance (RDA) for pregnancy. These trialshave yielded equivocal results, perhaps because of an approach that selects a population,rather than individuals, at risk.

652 Part VII / Optimal Pregnancy/Infancy Outcomes
Two trials showed effects of zinc that were conditional on maternal weight (71,72)—that is, a lower rate of preterm delivery in zinc-supplemented women who were notoverweight (Table 1). Cherry et al. (71) reported a response to zinc in pregnant adoles-cents supplemented from before 25 wk of gestation. Low serum zinc concentrationswere more common in underweight and multiparous women. The frequency of pretermdelivery was reduced in the zinc-treated normal-weight women compared to theplacebo group. Zinc treatment of underweight multiparous women also was associatedwith a gestational age increase of nearly 3 wk.
The trial conducted by Goldenberg and colleagues (72) took a more targetedapproach and recruited women with plasma zinc levels below the median and randomlyassigned them to zinc or placebo. The analysis was stratified by BMI (BMI ≥ 26 andBMI < 26). Zinc supplementation was associated with increased gestation duration ofapproximately half a week (p = 0.06) and an increase in birth weight (about half ofwhich was explained by the longer duration of gestation). Women with a BMI <26 bene-fited most from zinc treatment with a 248-g increase in infant birth weight and a 0.7 cm-larger infant head circumference. Consistent with earlier results, effects were increasedfor women with lower pregravid BMI (Table 1).
In contrast, two recent trials from the developing world (Peru, Bangladesh), whereone might suppose that zinc deficiency would be prevalent, were negative (73,74). It ispossible that if gravidas from the developing world have multiple nutritional deficien-cies, then these may reduce the bioavailability of zinc or otherwise limit fetal growth.
However, low plasma zinc has a number of potential causes. In addition to its effecton protein synthesis, zinc also has an antiseptic action. In theory, a low zinc intake couldbe associated with an increased risk of infection during pregnancy, leading to fragilefetal membranes (and PROM). A genetic polymorphism in matrix metalloproteinase-9,one of the genes that codes for zinc-dependent enzymes, was recently associated withan increased risk of PROM (75). Conversely, a low plasma zinc level could be an acutephase response to a stressor, such as maternal infection (66). Keen (76) recentlycommented on the importance and need for distinguishing a secondary zinc deficiencyarising as an acute phase response to infection or inflammation from a primary (dietary)deficiency in zinc.
7.2. FolateDuring gestation, marginal maternal folate nutriture has the potential to impair cel-
lular growth and replication in the fetus and/or the placenta, which in turn couldincrease the risk of preterm delivery and infant low birth weight (14). Such adverse out-comes are more prevalent among poor women than those who are affluent. Pregnantwomen living under circumstances in which preterm delivery is prevalent have beenreported to consume diets with a lower density of vitamins and minerals, includingfolate (77), and to limit consumption of folate-containing dietary supplements (78,79).
In the United States, it is recommended that women consume 600 μg of folic acidper day during pregnancy (which includes 400 μg of synthetic folic acid from supple-ments or fortified cereals) to reduce risk of neural tube defects (NTDs). Unfortunately,less than one-third of women of childbearing age follow this recommendation (80).Also in the United States, fortification of flour and cereals with folic acid (1998–pre-sent) has been associated with a 19% decline in the risk of liveborn infants with NTDsalong with increases in serum and red cell folate and a decline in homocysteine levels(81,82) (see Chapter 24).

Chapter 25 / Nutrition and Preterm Delivery 653
The influence of dietary and circulating folate on preterm delivery and infant low birthweight was studied in 832 women from Camden, one of the poorest cities in the continentalUnited States. (65). Low intakes of folate from diet and supplements were associated withmaternal characteristics reflecting poorer maternal nutritional status, including lowerenergy intake, low rate of gestational weight gain, and a higher frequency of IDA at entryto prenatal care. After controlling for gestation at entry and the time in pregnancy when thesamples were drawn, there was a significant relationship between dietary folate intake andserum folate at week 28 (r = 0.17). Low folate intake (<240 μg/d) was associated with agreater than threefold increase in risk of low birth weight and preterm delivery, after con-trolling for maternal age, smoking, other factors (including energy), and other nutrients(zinc, fiber, and vitamin B12). Circulating folate at week 28 also was associated with risk;the adjusted odds for low birth weight increased by 1.5% and preterm delivery increasedby 1.6% per unit (nmol/L) decrease in serum folate at week 28 (Table 1). Therefore, lowerconcentrations of serum folate at week 28 were also associated with a greater risk ofpreterm delivery and low birth weight.
Randomized studies of routine folate supplementation in combination with iron sug-gested increased maternal hemoglobin, greater gestational weight gain, and an increasein mean gestation duration (Table 1). Fleming (83) enrolled 146 Australian womenbefore midpregnancy (week 20) into a randomized trial that included folic acid at a highand a low dose (5 and 0.5 mg/d of folic acid, respectively) as two of the study arms.Eighty-nine women completed the study, with sample sizes of 15 to 20 per group. Therewere no significant differences in placental weight, birth weight, or gestation durationamong the groups. Small sample size and poor statistical power would limit the abilityto detect an effect of folate, if any.
Fletcher (84) conducted a randomized controlled study comparing iron (200 mg offerrous sulphate) to iron with folate (5 mg). Supplements were administered to 643women in London at entry to care. No significant differences were found in birthweight, gestation, or the incidence of congenital defects.
Giles (85) performed a double-blind, randomized controlled trial of 692 women fromMelbourne, Australia, who were assigned to folate (5 mg/d) or placebo. There weresmall differences in birth weight and gestation between the groups. However, none werestatistically significant.
Blot and colleagues (86) assigned 200 French women to iron (105 mg of elementaliron) alone or in combination with folic acid (350 μg/d). Of these, 109 were re-evaluatedat delivery. Women treated with folate had higher serum and red cell folate at delivery.The main effect of folic acid was to extend gestation by nearly 1 wk; gestation dura-tion was increased among the folate-supplemented women (40.7 ± 1.2 vs 39.9 ± 1.2wk), as was birth weight (3461 ± 430 g vs 3303 ± 375 g) and placental weight (660± 130 g vs 604 ± 115 g). Tscherina and colleagues (87) also found that shortergestation correlated with lower serum and red cell folate.
A meta-analysis of existing supplementation studies (88) recommended further studyof the effect of folate during pregnancy on reducing the rate of preterm delivery and lowbirth weight as an “urgent priority.” Many of the trials demonstrated a beneficial effectwhen a folate supplement was used in combination with iron during pregnancy.
7.3. HomocysteineAn elevation of homocysteine is a metabolic effect of folate deficiency.
Hyperhomocysteinemia can occur when dietary folate intake is low. In other cases,

654 Part VII / Optimal Pregnancy/Infancy Outcomes
genetic factors and the interaction between genes and the environment may increase themetabolic requirement for folate and the risk of spontaneous abortion, preterm delivery,and other untoward gestational events. This may include many women with medicallyindicated preterm delivery caused by serious complications in which higher levels ofhomocysteine have been reported (89).
Homocysteine levels from more than 5000 Norweigan women were linked to previ-ous data in birth registries (90). Higher maternal homocysteine correlated with older ageat delivery, higher cholesterol, less multivitamin usage, lifestyle factors (cigarette smok-ing and high coffee consumption), and a reproductive history that included pre-eclampsiaand preterm delivery. In China, preconceptional levels of homocysteine were associatedwith a substantially increased risk of preterm delivery, as were low levels of the otherB vitamins (B6, B12), whereas folate was not. (91).
Malinow (92) assessed the influence of maternal homocysteine and serum folate atterm (37–42 wk) on infant birth weight and gestation duration in 35 healthy nulliparas.They reported that higher maternal homocysteine was associated with significantlylower infant birth weight and shorter gestation, whereas higher maternal folate corre-lated with increased birth weight (univariate analyses). A concentration gradient wasdetected, suggesting fetal uptake of maternal homocysteine.
In summary, although observational studies of folate and pregnancy suggest a potentialbenefit of folate supplementation during pregnancy (i.e., a decrease in serious complica-tions and an improvement in birth weight and gestation), randomized trials indicate thatroutine folate supplementation is not uniformly beneficial. Some individuals at risk becauseof common genetic polymorphisms that alter folate metabolism or because of environ-mental factors associated with diet appear to benefit most. Homocysteine may prove to bea more sensitive indicator of risk of low birth weight than either serum or red cell folate.
8. OTHER NUTRIENTS
8.1. CalciumAnother element that has received attention for its possible association with preterm
delivery is the macromineral calcium. During pregnancy, there is an increased physio-logical demand for calcium. A full-term infant accretes about 30 g of calcium, primarilyin the third trimester when the fetal skeleton is actively ossifying; to meet these needs,there is enhanced absorption of calcium from the gut (93,94). Diets low in calcium bothin general and particularly during pregnancy have been associated with increased bloodpressure levels, because smooth muscle reactivity is heightened. During pregnancy, thisresults in an increased risk of PIH, and thus, hypothetically, leads to preterm delivery.Calcium supplementation trials during pregnancy have been shown to lower bloodpressure levels (95,96).
Maternal growth and pregnancy often coincide, and approximately half of all preg-nant teenagers continue to grow during pregnancy (97). Bone ultrasound measures ofthe os calcis during pregnancy have shown greater loss for growing teenage gravidas(–5.5%) than for mature women (–1.9%) (98). Therefore, in the case of an adolescentpregnancy, calcium may be limited by maternal diet but simultaneously driven by theneed to retain enough calcium to mineralize two skeletons.
Two calcium supplementation trials among high-risk women (women with very lowintakes in Quito, Ecuador and teenagers in Baltimore) showed promising results in

Chapter 25 / Nutrition and Preterm Delivery 655
decreasing the incidence of preterm delivery (Table 1). In Ecuador (99,100), length ofgestation was increased from 37.4 ± 2.3 wk for the placebo group (n = 34) to 39.2 ±1.2 wk (p < 0.01) for the calcium-supplemented group (n = 22). Among teenagers (age:16 yr) in Baltimore (101), with similar overall dietary calcium intakes, the calcium-sup-plemented group had a lower incidence of preterm delivery (7.4%) compared with theplacebo group (21.1%; p < 0.007). Furthermore, life-table analysis demonstrated anoverall shift to a higher gestational age in the calcium-supplemented group (Table 1).On the other hand, a large calcium supplementation trial of more than 1000 adultwomen from Argentina showed the expected decrease in the incidence of PIH but noeffect on preterm delivery (96).
A meta-analysis (102) of 14 randomized controlled trials of calcium supplementationinvolving several thousand gravidas showed significant reductions in systolic and dias-tolic blood pressure with the administration of calcium salts. Risk of pre-eclampsia wasreduced more than twofold among calcium-supplemented women in these trials. Anexamination of the studies indicated that only two of nine examined yielded statisticallysignificant findings. However, Bucher’s analysis yielded no effect of calcium intake onpreterm delivery or fetal growth restriction (Table 1 [102]).
A large, randomized, double-blind, placebo-controlled trial studied more than 5000low-risk nulliparous women who were enrolled as patients at medical centers through-out the United States after a prescreen for compliance with supplement use (103).Women were supplemented with 2000 mg/d of elemental calcium or placebo frombefore midpregnancy until they delivered. Calcium did not reduce risk of pre-eclampsia,PIH, or blood pressure elevation. Similarly, calcium had no effect on obstetrical out-comes, including preterm delivery or infant birth weight. However, it should be notedthat the women recruited in this trial had calcium intakes that were atypically high,averaging 1100 mg/d before supplementation.
Recently, a trial of calcium supplementation in Australian gravidas (n = 456) with appar-ently adequate dietary calcium intakes (median: 1100–1200 g/d) and other characteristicsvery similar to those in the US study (103) reported a positive effect (104). Calcium sup-plementation resulted in a greater than twofold reduction in the risk of pre-eclampsia anda reduction in the risk of preterm delivery from 10% (placebo) to 4.4% (calcium supple-mented) as well as a reduction in low birth weight (105). There also were reductions inadmissions for threatened preterm labor (p = 0.03) and preterm PROM (p = 0.08).
The settings in which dietary calcium may reduce risk of preterm delivery areunclear. It is possible that the ability of supplemental calcium to decrease risk may beconfined to high-risk populations, where there is either a dietary restriction of calciumintake or, as in the case of adolescents, there is an increased demand for calcium bothto meet the needs of the growing fetus and the mother herself.
8.2. n-3 Fatty AcidsConsumption of marine foods that are rich in n-3 fatty acids is also associated with
a longer gestation duration. Ecological data from the Faroe Islands, where 50% of thediet is derived from marine sources, show that island women bear infants with substan-tially higher birth weights (about 200 g higher) and longer gestations than Danes (105).This difference in gestation was hypothesized to arise from a reduction in prostaglandinF2 and E2 production or an increase in prostacyclin production with high consumptionof n-3 fatty acids.

656 Part VII / Optimal Pregnancy/Infancy Outcomes
The clinical trial conducted by the People’s League of Health (106) in 5022 womenin London during 1938–1939 suggested that supplementing the usual diet of Britishwomen with minerals, vitamins, and halibut oil extended gestation. Fewer infants wereborn to the supplemented women before the 40th wk of gestation (20% among supple-mented women were born before week 40 vs 24% among the unsupplemented),although there was no difference in mean birth weight.
A trial (107) of 533 Danish women who received fish oil, olive oil, or no supplementby week 30 of gestation showed that women taking the fish oil supplement had longeraverage gestations (4 d) and bore infants with higher average weights (+107 g), whichwas mostly attributable to the change in gestation. The effect of fish oil was strongestfor women with low fish consumption at entry and amounted to an increase of 7.4 d inthis group. There was little effect of the supplement on women with high consumptionat entry (–1.6 d; Table 1). Thus, the hypothesized effect of n-3 fatty acids on gestationappears to have a threshold, beyond which there is no effect. Furthermore, in this trial,the effect appeared to be specific to the mechanism underlying the initiation of idio-pathic preterm labor rather than PROM.
Recently, a multicenter trial of high-risk women enrolled gravidas with a history ofpreterm delivery, fetal growth restriction, or pre-eclampsia. Women were randomized toeither fish oil or olive oil. Fish oil reduced the recurrence risk of preterm deliveryapproximately twofold but did not alter the recurrence of the other poor pregnancy out-comes (108). A recent prospective and observational study of seafood intake in earlypregnancy bolstered this relationship: By week 16 of gestation, risk of preterm deliverywas increased nearly fourfold among women with little or no intake of fish (109).
Finally, ecological studies have indicated that the consumption of large quantities offish during pregnancy is associated with lower blood pressure and thus, in theory, witha lower the incidence of PIH (110). The reduction in the incidence of pre-eclampsiain the People’s League of Health Study (106) is consistent with this finding.However, because of the multiple supplementation regimen, it could not be attributedto the use of the fish oil per se. The recent multicenter trial of fish oil had no effecton the recurrence risk of pre-eclampsia or on maternal blood pressure (108).
8.3. Multivitamin/Mineral SupplementsIn the United States, there is limited supplement use by women of reproductive age;
overall, about one-fourth of women (26% Caucasian, 15.5% African-American) reporttaking vitamin or mineral supplements regularly (111). In one study (79), only 16% oflow-income Massachusetts gravidas took vitamins before pregnancy. This varied byethnicity; with Caucasian gravidas (23%) reporting use about twice as frequently asAfrican-Americans (11%) or Hispanics (10%). During pregnancy, 9% of Caucasians,20% of African-Americans, and 13% of Hispanics used prenatal vitamins erratically(one to three times per week) or not at all. Reasons for noncompliance included maternalconfidence that the current diet was good, an unstable home life, side effects attributedto the supplement by the women.
In Camden, 17% of low-income minority gravidas reported using supplementsbefore they got pregnant (112). Periconceptional use was more likely to occur amongwomen with a history of an adverse pregnancy outcome (principally spontaneous abor-tion in previous pregnancies) and was associated with increased spotting and bleed-ing during the current pregnancy. Therefore, low-income women appeared to use

Chapter 25 / Nutrition and Preterm Delivery 657
supplements when they previously had or currently anticipated a problem with theirpregnancies. Based on data from the Maternal Infant Health Survey (113), other pre-dictors of the failure to use vitamin/mineral supplements before or during pregnancyinclude African-American ethnicity, unmarried status, and age younger than 20 yr withan education below the high school level. In Camden, multiparity and late entry toprenatal care were additional factors associated with supplement nonuse (112).
Information is limited regarding the effects of prenatal multivitamin/mineral supple-ments on pregnancy outcome. Camden women who use such supplements during preg-nancy have reduced risks of preterm delivery (twofold lower than controls) and verypreterm delivery (fourfold reduction in risk with first trimester use, twofold reductionwith second trimester use). Prenatal supplement use was corroborated by assays ofcirculating micronutrients. At entry to care, there were no differences among womenwho went on to use supplements or not, whereas at week 28, circulating levels of fer-ritin and folate were higher for supplement users (112).
A second observational study (114) examined multivitamin use from survey data (the1988 National Maternal and Infant Health Survey). They reported no effect of multivi-tamin use on pregnancy outcomes, including preterm delivery; multivitamin use alsodid not ameliorate the effect of maternal smoking on the fetus. However, these conclu-sions are limited by the fact that the survey questionnaire was geared toward regularmultivitamin use (3 d/wk or more) and did not differentiate between women who usedvitamins and those who did not.
Fawzi and colleagues (115) examined the effect of supplementing more than 1000women from Tanzania who were positive for the human immunodeficiency virus withmultivitamins, vitamin A, or placebo in a double-blind, placebo-controlled trial. Thetrial also used a factorial design, which allowed the quantification of the effect of mul-tivitamins with and without vitamin A. Multivitamin supplementation decreased therisk of very preterm delivery by approximately twofold and decreased risk of infant lowbirth weight and fetal growth restriction.
However, two contemporary clinical trials of multivitamin supplementation (one inNepal and the other in Mexico) found no effect of multivitamins on preterm delivery.In Nepal, a quasi-experimental study assigned pregnant women by their community tovitamin A plus folic acid; folic acid and iron; folic acid , iron, and zinc; or multiplemicronutrients (116). The control group received vitamin A alone. The multivitaminformulation increased birth weight by 64 g and decreased low birth weight by 16%;both changes were statistically significant. The folic acid and iron regimen alsodecreased low birth weight by 16%, but the increase in infant birth weight (37 g) wasnot significant. Folic acid without iron had no effect on pregnancy outcome. None ofthe regimens decreased risk of preterm delivery.
A second randomized study was conducted in Mexico (117). Women were randomlyassigned to receive iron with or without multivitamins. Compared to iron alone, multi-vitamins did not alter birth weight, decrease risk of low birth weight, or decrease riskpreterm delivery (117).
8.4. AntioxidantsPre-eclampsia is a serious complication of pregnancy that is marked by placental
insufficiency, the reduced transfer of nutrients from mother to fetus, and an increasedrisk of fetal growth restriction and preterm delivery. It has been suggested that poor

658 Part VII / Optimal Pregnancy/Infancy Outcomes
placental perfusion, secondary to abnormal placental implantation, is the underlyingproblem and that products from the fetal-placental unit damage endothelial cells (118).In pre-eclampsia, the balance of antioxidant and pro-oxidant forces is disturbed.Concentrations of the products of oxidative stress and lipid peroxidation (such as iso-prostanes, malonyldialdehyde and free-radical reaction products) are usually increasedand antioxidant activity is usually decreased. Diet may also be a factor in pre-eclampsia.Intake of vitamin C, the first antioxidant to be exhausted by oxidative stress, as well ascirculating levels of plasma ascorbic acid are reduced in many women with pre-eclamp-tic pregnancies (119). Recent clinical trials from England (120,121) and India (122)suggest that supplementation with high doses of the antioxidants C and E or lycopenefrom early pregnancy may reduce the risk of pre-eclampsia. In lycopene-supplementedwomen, fetal growth restriction was reduced 50% (p < 0.05) and gestation durationincreased by 1–2 wk (p < 0.05). In Camden gravidas with adverse pregnancy outcomes(not only those with pre-eclampsia), there was increased oxidative damage to DNAfrom the maternal––fetal unit early in the third trimester (123). However, all the stud-ies had small samples of women, and further research is needed to confirm and extendtheir findings.
9. RECOMMENDATIONS
Although the relationship between nutrition and growth—both pre- and postnatal—iswell-established, maternal nutrition has emerged as a factor that may increase risk ofpreterm delivery. Few observational and experimental studies have examined the influ-ence of maternal diet and nutritional status on gestation duration and preterm birth; there-fore, for greater confidence, the preliminary positive findings require much more work.
In the developing world, the interaction between nutrition and infection is a well-known cause of childhood malnutrition, morbidity from infectious disease, and death.Similarly, infection/inflammation is an important risk factor for preterm delivery. It isplausible that women who develop infection/inflammation during pregnancy have animpaired immune response associated with subclinical micronutrient deficits; however,there is virtually no research in this important area from either the developed or thedeveloping world (124). Similarly, inflammation may alter the mother’s nutritionalrequirements or lead to low circulating levels of some micronutrients and increased lev-els of others (125). Thus, it is important to distinguish between a primary and secondarynutrient deficit (76). Again, virtually no research has been done on this topic in preg-nant women. In animals, fasting during early or later pregnancy was shown to increasethe risk of preterm delivery. In humans, data from the Dutch Famine (34) suggested thatearly starvation increased risk, but fasting or a longer interval between meals increasesrisk as well (44,45); although the mechanism(s) for this risk is not known, maternalnutrition is clearly implicated.
Populations at high risk of preterm birth appear to have a poor-quality diet, but it isunclear if the maternal diet is a risk factor or a risk marker. For example, among minor-ity groups from the inner cities of the United States, the consumption of fresh fruits andvegetables and whole grains is virtually nonexistent (126). Similarly, diets of women inthe lower social class from London failed to meet “...basic maternal needs for a rangeof nutrients characteristic of whole grain, vegetable and fruit and dairy produce”(77). Vitamin and mineral supplements, an alternative nutrient source, are used more

Chapter 25 / Nutrition and Preterm Delivery 659
frequently by the middle classes than the lower classes (79). Therefore, it is prudent toeat a healthful diet that includes fish and to complement the diet with folate-containingmultivitamin/mineral supplements both before pregnancy and during its course.Additionally, because a poor diet rarely occurs in isolation, it is also important to seekprenatal care and to maintain a lifestyle free of cigarettes, alcohol, and drugs.
REFERENCES1. Pastor PN, Maduc DM, Reuben C, Xia H. Chartbook in trends in the health of Americans. National
Center for Health Statistics, Hyattsville, MD, 2002.2. Wilcox A, Skjaerven R, Buekens P, Kiely J. Birth weight and perinatal mortality. A comparison of
the United States and Norway. JAMA 1995; 273:709–711.3. Rush RW, Keirse MJN, Howat P, et al. Contribution of preterm delivery to perinatal mortality.
Br Med J 1976; 2:965–968.4. Anderson RN. Deaths: leading causes for 2000. National vital statistics report. National Center for
Health Statistics, Hyattsville, MD, 2002; 50:1–86.5. Martin JA, Hamilton BE, Venture SJ, Menacker F, Park MM, Sutton PD. Births: final data for 2001.
National vital statistics report. National Center for Health Statistics, Hyattsville, MD, 2002;51:1–103.
6. Aylward G, Pfeiffer S, Wright A, Velhurst S. Outcome studies of low birth weight infants publishedin the last decade: a meta analysis. J Pediatr 1989; 115:515–518.
7. Saigal S, Szatmari P, Rosenbaum P, et al. Intellectual and functional status at school entry of childrenwho weighed 1000 grams or less at birth: a regional perspective of births in the 1980’s. J Pediatr1990; 116:409–416.
8. Astbury J, Orgill A, Bajuk B, et al. Determinants of developmental performance of very low birthweight survivors at one and two years of age. Develop Med Child Neurol 1983; 25:709–711.
9. Blackman J, Lindgren S, Hein H, et al. Long term surveillance of high risk children. Am J Dis Child1987; 141:1293–1298.
10. Carey JC, Klebanoff MA, Hauth JC, et al. Metronidazole to prevent preterm delivery in pregnantwomen with asymptomatic bacterial vaginosis. National Institute of Child Health and HumanDevelopment Network of Maternal-Fetal Medicine Units. N Engl J Med 2000; 342:534–540.
11. Meis PJ, Klebanoff M, Thom E, et al. Prevention of recurrent preterm delivery by 17 α-hydroxyprogesterone caproate. N Engl J Med 2003; 348:2379–2385.
12. Savitz DA, Blackmore CA, Thorp JM. Epidemiologic characteristics of preterm delivery: etiologicheterogeneity. Am J Obstet Gynecol 1991; 164:467–471.
13. Berkowitz GS, Papiernik E. Epidemiology of preterm birth. Epidemiol Rev 1993; 15:414–443.14. Institute of Medicine, National Academy of Sciences. Nutrition During Pregnancy. National
Academy Press, Washington, DC, 1990.15. Johnston EM. Weight changes during pregnancy and the postpartum period. Prog Food Nutr Sci
1991; 15:117–157.16. Abrams BF, Laros RK. Prepregnancy weight, weight gain, and birth weight. Am J Obstet Gynecol
1986; 154:503–509.17. Wen SW, Goldenberg RL, Cutter GR, et al. Intrauterine growth retardation and preterm delivery:
prenatal risk factors in an indigent population. Am J Obstet Gynecol 1990; 162:213–218.18. Siega-Riz AM, Adair LS, Hobel CJ. Institute of Medicine maternal weight gain recommendations
and pregnancy outcome in a predominantly Hispanic population. Obstet Gynecol 1994; 84:565–573.19. Kramer MS, Coates AL, Michoud MC, Dagenais S, Hamilton EF, Papageorgiou A. Maternal anthro-
pometry and idiopathic preterm labor. Obstet Gynecol 1995; 86:744–748.20. Hediger ML, Scholl TO, Belsky DH, Ances IG, Salmon RW. Patterns of weight gain in adolescent
pregnancy: effects on birth weight and preterm delivery. Obstet Gynecol 1989; 74:6–12.21. Hediger ML, Scholl TO, Salmon RW. Early weight gain in pregnant adolescents and fetal outcome.
Am J Hum Biol 1989; 1:665–672.22. Abrams B, Newman V, Key T, Parker J. Maternal weight gain and preterm delivery. Obstet Gynecol
1989; 74:577–583.23. Hickey CA, Cliver SP, McNeal SF, et al. Prenatal weight gain patterns and spontaneous preterm birth
among nonobese black and white women. Obstet Gynecol 1995; 85:909–914.

660 Part VII / Optimal Pregnancy/Infancy Outcomes
24. Carmichael S, Abrams B. A critical review of the relationship between gestational weight gain andpreterm delivery. Obstet Gynecol 1997; 89:865–873.
25. Scholl TO, Hediger ML, Fischer RL, Shearer JW. Anemia vs iron deficiency: increased risk ofpreterm delivery in a prospective study. Am J Clin Nutr 1992; 55:985–988.
26. Scholl TO, Hediger ML, Schall JI, Fischer RL, Khoo CS. Low zinc intake during pregnancy: itsassociation with preterm and very preterm delivery. Am J Epidemiol 1993; 137:1115–1124.
27. Hediger ML, Scholl TO, Schall JI, Miller LW, Fischer RL. Fetal growth and the etiology of pretermdelivery. Obstet Gynecol 1995; 85:60–64.
28. Ott WJ. Intrauterine growth retardation and preterm delivery. Am J Obstet Gynecol 1993;168:1710–1717.
29. Bukowski R, Gahn D, Denning J, Saade G. Impairment of growth in fetuses destined to deliverpreterm. Am J Obstet Gynecol 2001; 185:463–467.
30. Gilbert WM, Danielsen B. Pregnancy outcomes associated with intrauterine growth restriction. AmJ Obstet Gynecol 2003; 188:1596–1601.
31. Thomson AM. Diet in relation to the course and outcome of pregnancy. Br J Nutr 1959; 13:509–523.32. Scholl TO, Hediger ML, Khoo CS, et al. Maternal weight gain, diet and infant birth weight:
Correlations during adolescent pregnancy. J Clin Epidemiol 1991; 44:423–428.33. Olson CM, Strawderman MS. Modifiable behavioral factors in a biopsychosocial model predict
inadequate and excessive gestational weight gain. J Am Diet Assoc 2003; 103:48–54.34. Stein Z, Susser M, Saenger G, et al. Famine and Human Development: The Dutch Hunger Winter of
1944/45. Oxford University Press, New York, 1975.35. Bloomfield FH, Oliver MH, Hawkins P, et al. A periconceptional nutritional origin for noninfectious
preterm birth. Science 2003; 300:606,607.36. Miller G. Hungry Ewes. Science 2003; 300:50–52.37. Fowden AL, Ralph MM, Silver M. Nutritional regulation of uteroplacental prostaglandin production and
metabolism in pregnant ewes and mares during late gestation. Exp Clin Endocrinol 1994; 102:212–221.38. Fowden AL, Silver M. The effect of the nutritional state on uterine prostaglandin F metabolite con-
centrations in the pregnant ewe during late gestation. Quarterly J Exp Physiol 1983; 68:337–349.39. Silver M, Fowden AL. Uterine prostaglandin F metabolite production in relation to glucose avail-
ability in late pregnancy and a possible influence of diet on time of delivery in the mare. J ReprodFert 1982; 32(Suppl):511–519.
40. Binienda Z, Massmann A, Mitchell MD, Gleed RD, Figueroa JP, Nathanielsz PW. Effect of foodwithdrawal on arterial blood glucose and plasma 13,14-dihydro-15 keto-prostaglandin F2α concen-trations and nocturnal myometrial electromyographic activity in the pregnant rhesus monkey in thelast third of gestation: a model for preterm labor? Am J Obstet Gynecol 1989; 160:746–750.
41. Kaplan M, Eidelman AI, Aboulafia Y. Fasting and the precipitation of labor. JAMA 1983;250:1317,1318.
42. Frentzen BH, Johnson JWC, Simpson S. Nutrition and Hydration: relationship to preterm myome-trial contractility. Obstet Gynecol 1987; 70:887–891.
43. Metzger B, Vileisis RA, Ravnikar V, Freinkel N. Accelerated starvation and the skipped breakfast inlate normal pregnancy. Lancet 1982; 319:588–592.
44. Siega-Riz AM, Herrmann TS, Savitz DA, Thorp JM. Frequent of eating during pregnancy and itseffect on preterm delivery. Am J Epidemiol 2001; 153:647–652.
45. Herrmann TS, Siega-Riz AM, Hobel CJ, Aurora C, Dunkel-Schetter C. Prolonged periods withoutfood intake during pregnancy increase risk for elevated maternal corticotropin-releasing hormoneconcentrations. Am J Obstet Gynecol 2001; 185:403–412.
46. Smith R, Mesiano S, McGrath S. Hormone trajectories leading to human birth. Regulatory Peptides2002; 108:159–164.
47. Scholl TO, Hediger ML. Anemia and iron-deficiency anemia: compilation of data on pregnancyoutcome. Am J Clin Nutr 1994; 59(Suppl):492S–501S.
48. Klebanoff MA, Shiono PH, Berendes HW, Rhoads GG. Facts and artifacts about anemia and pretermdelivery. JAMA 1988; 262:511–515.
49. Klebanoff MA, Shiono PH, Selby JV, et al. Anemia and spontaneous preterm birth. Am J ObstetGynecol 1991; 164:59–63.
50. Zhou LM, Yang WW, Hua JZ, Deng CQ, Tao X, Stolzfus RJ. Relation of hemoglobin measured atdifferent times in pregnancy to preterm birth and low birth weight in Shanghai, China. Am JEpidemiol 1998; 148:998–1006.

Chapter 25 / Nutrition and Preterm Delivery 661
51. Steer P, Alam A, Wadsworth J, Welch A. Relation between maternal haemoglobin concentration andbirth weight in different ethnic groups. Br Med J 1995; 310:489–491.
52. Scanlon KS, Yip R, Schieve LA, et al. High and Low hemoglobin levels during pregnancy: differ-ential risks for preterm birth and small for gestational age. Obstet Gynecol 2000; 96:741–748.
53. Bondevik GT, Lie RT, Kvale G. Maternal hematological status and risk of low birth weight andpreterm delivery in Nepal. Acta Obstet Gynecol Scand 2001; 80:402–408.
54. Arafa M, Abou-Zied H, Attia AF, et al. Maternal haemoglobin and premature child delivery. La RevSante Med Orient 1998; 4:480–486.
55. Brabin B, Ginny M, Supau J, et al. Consequences of maternal anaemia on outcome of pregnancy inmalaria endemic area in Paoua, New Guinea. Ann Trop Med Parisatol 1990; 84:11–24.
56. Garn SM, Ridella SA, Petzold AS, Falkner F. Maternal hematologic levels and pregnancy outcomes.Semin Perinatol 1981; 5:155–162.
57. Murphy JF, O’Riordan J, Newcombe RG, et al. Relation of haemoglobin levels in first and secondtrimesters of pregnancy. Lancet 1986; 1:992–995.
58. Goldenberg RL, Tamura T, DuBard M, Johnston KE, Copper RL, Neggers Y. Plasma ferritin andpregnancy outcome. Am J Obstet Gynecol 1996; 175:1356–1359.
59. Goel A, Jain V, Gupta I, Varma N. Serial serum ferritin estimation in pregnant women at risk ofpreterm labor. Acta Obstet Gyneol Scand 2003; 82:129–132.
60. Scholl TO. High third-trimester ferritin concentration: associations with very preterm delivery, infec-tion, and maternal nutritional status. Obstet Gynecol 1998; 92:161–165, 93:156,157.
61. Goldenberg RL, Mercer BM, Miodovnik M, et al. Plasma ferritin, premature rupture of membranes,and pregnancy outcome. Am J Obstet Gynecol 1998; 179:1599–1604.
62. Lao TT, Tam KF, Chan LY. Third trimester iron status and pregnancy outcome in non-anaemic women;pregnancy unfavourably affected by maternal iron excess. Human Reprod 2000; 15:1843–1848.
63. Cogswell ME, Parvanta I, Ackes L, Yip R, Brittenham GM. Iron supplementation during pregnancy,anemia and birth weight: a randomised controlled trial. Am J Clin Nutr 2003; 78:773–781.
64. Allen LH. Biological mechnisms that might ynderlie iron’s effects on fetal growth and preterm birth.J Nutr 2001; 131:581–589S.
65. Scholl TO, Hediger ML, Schall JI, Khoo CS, Fischer RL. Dietary and serum folate: their influenceon the outcome of pregnancy. Am J Clin Nutr 1996; 63:1–6.
66. Pilch SM, Senti FM, eds. Assessment of the zinc nutritional status of the US population based on datacollected in the Second National Health and Nutrition Examination Survey, 1976—Bethesda, MD.Life Sciences Research Office, Federation of American Societies for Experimental Biology, 1984.
67. Pilch SM, Senti FM, eds. Assessment of the folate nutritional status of the US population based on datacollected in the Second National Health and Nutrition Examination Survey, 1976—Bethesda, MD. LifeSciences Research Office, Federation of American Societies for Experimental Biology, 1984.
68. Neggers YH, Cutter GR, Acton RT, et al. A positive association between maternal serum zinc con-centration and birth weight. Am J Clin Nutr 1990; 51:678–684.
69. Kirksey A, Wachs T, Yunis F, Srinath U, Rahmanifar A, McCabe G, Galal O, Harrison G, Jerome N.Relationship of maternal zinc nutriture to pregnancy outcome and infant development in an Egyptianvillage. Am J Clin Nutr 1994; 60:782–792.
70. Sikorski R, Juszkiewicz T, Paszkowski T. Zinc status in women with premature rupture of mem-branes at term. Obstet Gynecol 1990; 76:675–677.
71. Cherry FF, Sanstead HH, Rojas P, et al. Adolescent pregnancy: association among body weight, zincnutriture and pregnancy outcome. Am J Clin Nutr 1989; 50:945–954.
72. Goldenberg RL, Tamura T, Neggers Y, et al. The effect of zinc supplementation on pregnancy out-come. JAMA 1995;274:463–468.
73. Osendarp SJM, van Raaiji JMA, Wahed MA, et al. A randomized, placebo controlled trial of theeffect of zinc supplementation during pregnancy on pregnancy outcome in Bangladeshi urban poor.Am J Clin Nutr 2000; 71:114–119.
74. Caufield LE, Zavaleta N, Figueroa A, et al. Maternal zinc supplementation does not affect size atbirth or pregnancy outcome. J Nutr 1999; 129:1563–1568.
75. Ferrand PE, Parry S, Sammel M, et al. A polymorphism in the matrix metalloproteinase-9 promoteris assocated with increased risk of preterm premature rupture of membranes in African Americans.Molecular Human Reprod 2002; 8:494–501.
76. Keen CL, Clegg MS, Hanna LA, et al. The plausibility of micronutrient deficiencies being a signifi-cant contributing factor to the occurrence of pregnancy complications. J Nutr 2003; 133:1597S–1605S.

662 Part VII / Optimal Pregnancy/Infancy Outcomes
77. Wynn SW, Wynn AM, Doyle W, Crawford MA. The association of maternal social class with mater-nal diet and the dimensions of babies in a population of London women. Nutr Health 1994;9:303–315.
78. Subar AF, Block G. Use of vitamin and mineral supplements: demographics and amounts of nutri-ents consumed (the 1987 Health Interview Survey). Am J Epidemiol 1990; 133:1091–1101.
79. Suitor CW, Gardner JD. Supplement use among culturally diverse group of low-income pregnantwomen. J Am Diet Assn 1990; 90:268–271.
80. Centers for Disease Control. Knowledge and use of folic acid by women of childbearing age.MMWR 1999; 48:325–327.
81. Honein MA, Paulozzi LJ, Mathews TJ, et al. Impact of folic acid fortification on the US food sup-ply on the occurrence of neural tube defects. JAMA 2001; 285:2981–2986.
82. Neuhouser ML, Beresford SAA. Folic acid: are current fortification levels adequate? Nutrition 2001;17:868–872.
83. Fleming AF, Martin JD, Hahnel JR, Westlake AJ. Effects of iron and folic acid antenatal supplementson maternal haematology and fetal wellbeing. Med J Aust 1974; 2:429–436.
84. Fletcher J, Gurr A, Fellingham FR, Prankerd TAJ, Brant HA, Menzies DN. The value of folic acidsupplements in pregnancy. J Obstet Gynaecol Br Commwlth 1971; 78:781–785.
85. Giles PFH, Harcourt AG, Whiteside MG. The effect of prescribing folic acid during pregnancy onbirth-weight and duration of pregnancy. Med J Aust 1971; 2:17–21.
86. Blot I, Papiernik E, Kaltwasser JP, et al. Influence of routine administration of folic acid and ironduring pregnancy. Gynecol Obstet Invest 1981; 12:294–304.
87. Tcherina G, Blot I, Rey A, et al. Maternal folate status, birthweight and gestational age. DevelopPharmacol Therap 1982; 4(Suppl 1):58–65.
88. Mohammed K. Routine Folate Supplementation in Pregnancy. In:Enkin MW, Keirse MJCN, RenfreqMJ, Nielson JP, eds. Pregnancy and Childbirth Module. “Cochrane Database of Systematic Reviews”Review No. 03158, April 1993.
89. Rajkovic A, Catalano PM, Malinow MR. Elevated homocyst(e)ine levels with preeclampsia. ObstetGynecol 1997; 90:168–171.
90. Vollset SE, Refsum H, Emblem BM, et al. Plasma total homocysteine, pregnancy complications andadverse pregnancy outcomes: The Hordaland homocysteine study. Am J Clin Nutr 2000; 71:962–968.
91. Ronnenberg AG, Goldman MB, Chen D, Aitken IW, Willett WC, Selhub J, Xu X. Preconceptionhomocysteine and B vitamin status and birth outcomes in Chinese women. Am J Clin Nutr 2002;76:1385–1391.
92. Malinow MR, Rajkovic A, Duell PB,Hess DL, Upson BM. The relationship between maternal andneonatal umbilical cord plasma homocyst(e)ine suggests a potential role for maternal momocyst(e)inein fetal metabolism. Am J Obstet Gynecol 1998; 178:228–233.
93. Repke JT. Calcium magnesium, and zinc supplementation and perinatal outcome. Clin Obstet Gynecol1991; 34:262–267.
94. NIH Consensus Development Panel on Optimal Calcium Intake. Optimal calcium intake. JAMA1994;272:1942–1948.
95. Repke JT, Villar J. Pregnancy-induced hypertension and low birth weight: the role of calcium. Am JClin Nutr 1991; 54:237–241S.
96. Belizán JM, Villar J, Conzalez L, et al. Calcium supplementation to prevent hypertensive disordersof pregnancy. N Eng J Med 1991; 325:1399–1405.
97. Scholl TO, Hediger ML, Schall JI. Maternal growth and fetal growth: pregnancy course and outcomein the Camden Study. Ann NY Acad Sci 1997; 817:281–291.
98. Sowers MF, Scholl TO, Harris L. Bone loss in adolescent and adult pregnant women. ObstetGynecol 2000; 96:189–193.
99. López-Jaramillo P, Narváez M, Weigel RM, Yépez R. Calcium supplementation reduces the risk ofpregnancy-induced hypertension in an Andes population. Br J Obstet Gynaecol 1989; 96:648–655.
100. López-Jaramillo P, Narváez M, Felix C, López A. Dietary calcium supplementation and preventionof pregnancy hypertension. Lancet 1990; 335:293.
101. Villar J, Repke JT. Calcium supplementation during pregnancy may reduce preterm delivery in high-risk populations. Am J Obstet Gynecol 1990; 163:1124–1131.
102. Bucher HC, Guyatt GH, Cook RJ, et al. Effect of calcium supplementation on pregnancy-inducedhypertension and preeclampsia. JAMA 1996; 275,1113–1117.
103. Levine RJ, Hauth JC, Curet LB, et al. Trial of calcium to prevent preeclampsia. N Engl J Med 1997;337:69–76.

Chapter 25 / Nutrition and Preterm Delivery 663
104. Crowther CA, Hiller JE, Pridmore B, et al. Calcium supplementation in nulliparous women forthe prevention of pregnancy-induced hypertension, preeclampsia and preterm birth: an Australianrandomized trial. FRACOG and the ACT Study Group. Aust NZ J Obstet Gynaecol 1999;39:12–8.
105. Olsen SF, Hansen HS, Sorensen T, et al. Intake of marine fat, rish in (n-3) polyunsaturated fattyacids, may increase birthweight by prolonging gestation. Lancet 1986; 2:367–369.
106. People’s League of Health. Nutrition of expectant and nursing mothers. Lancet 1942; 2:10–12.107. Olsen SF, Sorensen JD, Secher NJ, et al. Randomized controlled trial of effect of fish-oil supple-
mentation on pregnancy duration. Lancet 1992; 339:1003–1007.108. Olsen SF, Secher NJ, Tabor A, et al. Randomized clinical trials of fish oil supplementation in high-
risk pregnancies. Br J Obstet Gynecol 2000; 107:382–395.109. Olsen SF Secher NJ. Low consumption of seafood in early pregnancy as a risk factor for preterm
delivery: Prospective cohort study. BMJ 2002; 234:1–5.110. Popeski D, Ebbeling LR, Brown PB, et al. Blood pressure during pregnancy in Canadian Inuit: com-
munity differences related to diet. Can Med Assoc J 1991; 145:445–454.111. Block G, Cox C, Madans J, Schreiber GB, Licitra L, Melia N. Vitamin supplement use, by demo-
graphic characteristics. Am J Epidemiol 1988; 127:297–309.112. Scholl TO, Hediger ML, Bendich A, Schall JI, Smith WK, Krueger PM. Use of multivitamin/min-
eral prenatal supplements: influence on the outcome of pregnancy. Am J Epidemol 1997;146:134–141.
113. Yu SM, Keppel KG, Singh GK, Kessel W. Preconceptional and prenatal multivitamin-mineral sup-plement use in the 1988 National Maternal and Infant Health Survey. Am J Public Hlth 1996;86:240–242.
114. Wu T, Buck G, Mendola P. Can regular multivitamin\mineral supplementation modify the relationbetween maternal smoking and select adverse birth outcomes. Ann Epidemiol 1998;8:179–183.
115. Fawzi WW, Msamanga GI, Spiegelman D, et al. Randomized trial of effects of vitamin supplementson pregnancy outcomes and T cell counts in HIV-1-infected women in Tanzania. Lancet 1998;351:1477–1482.
116. Christian P, Khatry SK, Katz J, et al. Effects of alternative maternal micronutrient supplements onlow birth weight in rural Nepal: double blind randomised community trial. BMJ 2003; 326:1–6.
117. Ramakrishnan U, Gonzalez-Cossio T, Neufeld LM, Rivera J, Martorell R. Multiple micronutrientsupplementation during pregnancy does not lead to greater infant birth size than does iron-only sup-plementation: a randomized controlled trial in a semirural community in Mexico. Am J Clin Nutr2003; 77:720–725.
118. Roberts JM, Balk JL, Bodnar LM, Belizan JM, Bergel E, Martinez A. Nutrient involvement inpreeclampsia. J Nutr 2003; 133:1684S–1692S.
119. Zhang C, Williams MA, King IB, et al. Vitamin C and the risk of preeclampsia—results from dietaryquestionnaire and plasma assay. Epidemiology 2002; 13:409–416.
120. Chappell LC, Seed PT, Briley AL, et al. Effect of antioxidants on the occurrence of pre-eclampsia inwomen at increased risk: a randomised trial. Lancet 1999; 354:810–816.
121. Chappell LC, Seed PT, Kelly FJ, et al. Vitamin C and E supplementation in women at risk ofpreeclampsia is associated with changes in indices of oxidative stress and placental function. Am JObstet Gynecol 2002; 187:777–784.
122. Sharma JB, Kumar A, Malhotra M, Arora R, Prasad S, Batra S. Effect of lycopene on pre-eclampsiaand intra-uterine growth retardation in primigravidas. Int J Gynaecol Obstet 2003;81:257–262.
123. Scholl TO, Stein TP. Oxidant damage to DNA and pregnancy outcome. J Maternal-Fetal Med 2001;10:182–185.
124. Goldenberg RL. The plausibility of micronutrient deficiency in relationship to perinatal infection.J Nutr 2003; 133:1645S–1648S.
125. Tomkins A. Assessing micronutrient status in the presence of inflammation. J Nutr 2003;133:1649S–1655S.
126. Rogers MA, Simon DG, Zucker LB. Indicators of poor dietary habits in a high risk population. J AmColl Nutr 1995; 14:159–164.


From: Preventive Nutrition: The Comprehensive Guide for Health Professionals, Third EditionEdited by: A. Bendich and R. J. Deckelbaum © Humana Press Inc., Totowa, NJ
665
26 Dietary Polyunsaturated Fatty Acidsfor Optimal NeurodevelopmentRecommendations for Perinatal Nutrition
Ricardo Uauy, Patricia Mena, Adolfo Llanos,and Patricio Peirano
KEY POINTS
● The supply of dietary n-3 and n-6 fatty polyunsaturated fatty acids (PUFAs) affects thecomposition of plasma and red blood cell membrane lipids of term and preterm infants.
● Human infants require docosahexaenoic acid (DHA) in their diet because they are unableto form this in sufficient quantity from the linoleic acid provided from vegetable oils.
● Dietary n-3 fatty acid deficiency affects eye and brain function of preterm and terminfants as measured by electrorelinogram, cortical visual-evoked potentials, and behav-ioral testing of visual acuity.
● Technological procedures based on chemical and physical separation of the unsaturatedfatty acids have permitted the elaboration of nearly pure eicosapentaenoic acid, DHA,and arachidonic acid (AA) for clinical use.
● The development of single-cell oil sources and, more recently, genetically modifiedplants and animals provides novel forms of long-chain PUFA (LCPUFA) delivery.
● Human milk is the best and only time proven source of fat and essential fatty acids andLCPUFAs in the infant diet.
● Supplementation of formula with both DHA and AA has been demonstrated to supportgrowth and development closer to that of human milk-fed infants without evidence ofadverse effects.
● The public health implications of these changes need to be fully evaluated to supportthis practice on a global scale.
1. INTRODUCTION
Multiple studies over the past four decades have addressed the evaluation of effects ofearly human malnutrition on central nervous system (CNS) development in experimental

666 Part VII / Optimal Pregnancy/Infancy Outcomes
animals and man. The results of these studies have led to the conclusion that reductionsin energy and/or essential nutrient supply during the first stages of life have profoundeffects on somatic growth and organ structural and functional development, especiallyfor the brain. Malnutrition impairs brain development, leading to reduction of cellreplication cycles and dendritic connections. Different regions of the brain are impactedin specific ways: cell number (as measured by DNA content) is especially affected byintra-uterine malnutrition and early postnatal malnutrition, and synaptic connectivityis particularly affected if malnutrition occurs after birth but before the third year oflife (1).
After the “brain’s growth spurt,” alterations in dietary precursors may partially deter-mine neurotransmitter levels (serotonin, norepinephrine, dopamine, acetylcholine) inspecific brain regions, and essential and nonessential lipid supply may affect the struc-tural composition of the brain and of myelin sheaths (2).
The link between retarded somatic growth and altered brain development is strong ifthe nutritional deprivation model is one of early protein-energy malnutrition (PEM).This principle has guided many experimental studies and epidemiological evaluationsof the nutrition––mental development relationships. However, there are multipleinstances in which somatic growth may proceed unabated while brain structure andfunctions are significantly altered. The effect of early anemia on brain function does notaffect somatic growth; the impact of taurine deficiency on retinal and brain developmenton nonhuman primates and on human infants is not dependent on structural proteinsbecause this sulfur amino acid is not incorporated in protein synthesis. The role of n-3fatty acids as structural components of the brain is not associated with effects on growthbut, rather, on modifying membrane function and electrical responses. Examples in theopposite direction—namely, of normal mental development and poor growth—aremore difficult to find, suggesting that somatic growth is a necessary but insufficientcondition to attain normal mental development. Early malnutrition from pyloric steno-sis or cystic fibrosis illustrates the capacity of the brain to recover from malnutrition butalone is not sufficient to negate the effect of sustained nutritional deprivation on thedeveloping CNS. The concept that the direct effects of PEM on child development areno longer evident is an important contribution to the relationship between nutritionaldeficiencies and brain development, because PEM co-exists with other nutritionaldeficiencies that can also disrupt child development (3).
The study of the influence of specific nutrients on brain development in pretermneonates is in its infancy. Fetal growth retardation is not an isolated nutritional depri-vation but, rather, is a combination of many restrictions: oxygen, blood supply, overallnutrients, and various growth factors and hormones. It is likely that better nutritionalpractices in early life contribute significantly not only to improved survival but also tobetter growth and development of very premature infants. However, this rather obviousconclusion is not well-substantiated by objective data. One of the few controlled obser-vations in premature infants revealed that head size at age 12 mo was related to the timeafter birth when very-low-birth-weight infants reached full caloric intake. The relation-ship between head size and later development in preterm infants is indirect evidence foran effect of better nutrition on developmental indices in later life. Additional supportiveevidence can be derived from a study of 526 full-term infants born in Groningen,Holland between 1975 and 1979 and who were followed for 9 yr. There was a significantlylower occurrence of neurological dysfunction in the 135 breast-fed infants (fed for more

Chapter 26 / PUFAs and Neurodevelopment 667
than 3 wk) after adjusting for obstetric, perinatal, neonatal, neurological, and social dif-ferences (4). Randomized studies by Lucas in preterm infants who were fed controlleddiets confirmed the long-term effects on IQ of even just 1 mo of nutritional interven-tion. Male infants are biologically more vulnerable; they have a lower IQ at age 7 to 8 yrif fed a routine formula as compared to those receiving a nutrient-enriched preparation.Additionally, the risk of cerebral palsy and a verbal IQ less than 85 was lower in thegroup fed the enriched formula. It is possible that suboptimal nutrition does not permitfull CNS recovery after an early insult (5–7). An example of the complexity of thisproblem involved a study in the late 1940s, which showed that the increase in proteinintake required to optimize somatic growth in preterm infants was associated to lowerIQ scores in later life (8). The classic Harlem Columbia Study revealed that higher proteinintake fed to pregnant women who were at risk of delivering a low-birth-weight infantwas associated with increased prevalence of prematurity and to lower developmentalindices at 12 mo (9). The research on the effects of energy and caloric intake wasreviewed in classic publications (1–3,10). This chapter primarily addresses the role ofessential polyunsaturated fatty acids (PUFAs) on neural development in the fetus as wellas in preterm and term infants.
2. BACKGROUND ON THE ESSENTIAL POLYUNSATURATED FATTYACIDS AND THEIR METABOLISM
2.1. Essentiality of Polyunsaturated Fatty AcidsIn 1929, George and Mildred Burr (11) introduced the concept that specific compo-
nents of fat may be necessary for the proper growth and development of animals and,possibly, humans . The essential fatty acids (EFAs) were considered of marginal nutri-tional importance for the human until the 1960s, when clinical signs of EFA deficiencybecame apparent in infants who were fed skim milk-based formula and in those whowere given lipid-free parenteral nutrition. In a clinical and biochemical study of 428infants who were fed cow milk-based formulations with different types of fat, Hansen(12) firmly established that linolenic acid is essential for normal infant nutrition. Dailylinolenic acid intake ranged from 10 to 800 mg/kg in the infants, who were fed a fullyskimmed milk or a corn/coconut oil-based preparation, respectively. Hansen observeddryness, desquamation and thickening of the skin, and growth faltering as frequentmanifestations of linolenic acid deficiency in young infants. More subtle clinical symp-toms appear in n-3 EFA deficiency. These include skin changes unresponsive tolinolenic acid supplementation, abnormal visual function, and peripheral neuropathy(13,14). The nervous system manifestations of n-3 deficiency are likely caused by aninsufficiency of the specific metabolic derivative of linolenic acid (LNA)—namely,docosahexaenoic acid (DHA). Indeed, the high concentrations of DHA in the cerebralcortex and retina suggest its participation in neural and visual function (15,16).
2.2. Long-Chain Polyunsaturated Fatty Acid Metabolic PathwayThe structural role of long-chain polyunsaturated fatty acids (LCPUFAs) derived
from EFAs and the functional correlates of specific fatty acids are being increasinglyrecognized. The LCPUFAs arachidonic acid (AA; 20:4 n-6), eicosapentaenoic acid (EPA;20:5 n-3), and DHA (22:6 n-3) are important membrane components and precursors ofpotent bioactive oxygenated products. Eicosanoids (such as prostaglandins, leukotrienes,

668 Part VII / Optimal Pregnancy/Infancy Outcomes
and epoxides) derived from AA and EPA modulate or are required in numerous physi-ological processes. Several clinical correlates associated with deficient or excessiveEFA intake have been observed (17–21).
Animal tissues, especially the liver, are capable of further elongating and desaturat-ing the parent EFAs, which generate a family of compounds for the respective families,as shown in Fig. 1. As depicted in the figure, AA can be formed from linolenic acid.AA becomes essential only if the capacity for elongation and desaturation of linolenicacid is limited. This occurs in the cat and other felines. Further details on EFA metab-olism can be found in other reviews (20–23). The competitive desaturation of the n-3,n-6, and n-9 series by Δ-6 desaturase is of major significance, because this is the con-trolling step of the pathway. If n-3 fatty acids are absent or deficient in the diet, theelongation/desaturation of the n-6 compounds generates a significant elevation ofdocosapentaenoic acid (DPA; 22:5 n-6); if both EFAs are lacking, eicosatrienoic acid(ETA; 20:3 n-9) accumulates (22,23).
The conversion of parent EFAs to LCPUFA is under active regulation; therefore, pro-viding the equivalent amount of linolenic acid or LNA (24,25) cannot reproduce theeffects of providing AA, EPA, or DHA. The unique biological effects that feedinghuman milk has on EFA metabolism are based on the direct supply of LCPUFAsbypassing the regulatory step of the δ-6 desaturase. Excess dietary linolenic acid asso-ciated with some vegetable oils (particularly safflower, sunflower, and corn oils) maydecrease the formation of DHA from LNA and the formation of AA from linolenic acid,
Fig. 1. LCPUFA and EFA metabolism. Parent EFAs are derived from dietary sourcesfor both n-3 (18:3, LNA) and n-6 series (18:2, LA). De novo synthesis is able to pro-duce only n-9 LCPUFAs. Elongation occurs two carbons at a time and δ desaturasesintroduce double bonds at 9,6, and 5 carbons from the carboxylic end of the fatty-acidchain. The final step in the formation of n-3 and n-6 end-products is catalyzed by a per-oxisomal β-oxidation. LCPUFAs of interest include 18:3 n-6 (GLA), 20:4 n-6 (AA),22:5 n-6 (DPA), 20:3 n-9 (ETA), 20:5 n-3 (EPA), and 22:6 n-3 (DHA), EPA, AA, and20:3 n-6 are immediate precursors of prostaglandins (PG) and other eicosanoids.

Chapter 26 / PUFAs and Neurodevelopment 669
because the δ-6 desaturase is inhibited by excess linolenic acid (22–25). Similarly,excess EPA has an inhibitory effect on δ-5 desaturase activity; this is probably the rea-son for the lower AA content of membranes that are observed when high EPA marineoil is consumed. Excess linolenic acid (as seen in enterally or parenterally fed infantsreceiving corn or safflower oil as the predominant fatty acid supply) inhibits the elon-gation/desaturation of the parent EFAs and thus lowers the LCPUFA supply, which isnecessary for membrane synthesis.
2.3. Studies of Essential Fatty Acid Metabolism Using Stable IsotopePrecursors
Through the use of stable isotope-labeled precursors, several groups have evaluatedthe formation of LCPUFA in full-term and preterm neonates (26–30). We administereda single dose of 50 mg/kg of deuterated precursors orally; labeled precursors and prod-ucts were measured in plasma using negative ion mass spectrometry of pentafluoroben-zyl derivatives. Peak concentrations of labeled precursor EFAs were reached on the firstday after dosing, and deuterated products increased in concentration with time, reachingpeak by 48 h in the term infants and closer to 96 h in the preterm infants. The ratio ofconcentration of labeled products relative to precursors and indexes of metabolic con-version was approx 1:100 for the n-6 series and 1:40 for the n-3 series (31). There wasalso evidence for metabolic retroconversion in these studies. The results of all these stud-ies suggest that there is greater biosynthesis of LCPUFA at younger gestational and post-natal ages and indicate a reduced turnover rate for LCPUFA with advancing age. Thiscould be related to the decrease in growth rate and overall metabolic rate during the firstyear of life (30). These results were limited by the lack of evaluation of tissue pools,especially neural tissue accretion. High activity of δ-6 desaturase in neural tissues sug-gested a high LCPUFA synthesis in those tissues (32). However, present information onboth chemical composition and functional assessment indicates that endogenous synthesisfrom precursors is insufficient to meet the needs imposed by rapid growth, especially inpremature infants.
We have recently characterized formation of LCPUFAs in intra-uterine growth-restricted (IUGR) infants. Our results indicated that after receiving labeled linolenicacid and LNA, there were significantly lower product/precursor ratios in the IUGRgroup relative to the control groups, which were matched by birth weight and by gesta-tional age. There was a significant decrease in the formation of DHA from LNA for thebirth weight-matched control group (p < 0.01) but no difference for the gestational age-matched control group. The DHA/LNA ratio was twofold greater in the gestational agecontrols and threefold higher in the birth weight controls relative to the IUGR infants.The elongation step forming DPA from EPA appeared to be relatively insensitive tobirth weight or gestational age, whereas the marked differences in the DHA/DPA ratioindicated that the peroxisomal partial β-oxidation step was clearly affected in IUGRinfants. The metabolism of the n-6 LCPUFAs and the various ratios of AA to its precur-sors did not differ significantly between the IUGR and the two comparison groups. Theformation of AA did not require peroxisomal β-oxidation (33). The study of infants whodied suddenly as a result of unexplained causes served to document that a strong corre-lation existed between the composition of the brain cortex and red blood cell (RBC) totallipids and that brain cortex composition was clearly affected by early dietary LCPUFAsupply (34,35).

670 Part VII / Optimal Pregnancy/Infancy Outcomes
2.4. Effects of Polyunsaturated Fatty Acids on Neural Membrane FunctionThe dry weight of the human brain is predominantly lipid; 22% of the cerebral cortex
and 24% of white matter consist of phospholipids. Studies of several animal species andrecent evidence from humans have established that when linolenic acid and LNA oronly n-3 fatty acids are deficient in the diet, brain phospholipid AA and DHA decrease,whereas n-9 and n-7 monounsaturated fatty acids and PUFAs increase (25,34–36).Typically, n-3 fatty acid-deficient cells have decreased DHA and increased levels of theend product of n-6 metabolism, DPA. Within the subcellular organelles, synaptosomesand mitochondria seem to be more sensitive to a low dietary n-3 supply as demonstratedby the relative abundance of DHA and the changes in composition of these organellesin response to dietary deprivation.
The functional implications of diet-induced changes in structural lipids have been thesubject of much research (37–39). Fatty acid composition of structural membrane lipidscan affect membrane function by modifying membrane fluidity, affecting membranethickness, changing lipid phase properties, or by specifically interacting with membraneproteins (37–41). The changes in neural membranes that are of the greatest potentialsignificance during development are those related to changes in physical properties andchanges that affect membrane excitability. Diet-induced changes in structural lipidsaffect the functional characteristics of excitable membranes in several animal species aswell as in human neural cell lines (42,43).
A deficiency of n-3 fatty acids can change membrane physical properties, includingmembrane-bound enzymes, receptor activity, antigenic recognition, and signal trans-duction. (44,45). Also, n-3 fatty acid deficiency affects rotational mobility (as measuredby fluorescent diphenylhexatriene probes) less than lateral mobility (as measured bypyrene dimer formation within the lipid bilayer) (46). We found that excited dimer(eximer) pyrene formation in human retinal cells, which occurs when two monomerscollide, is increased by DHA supplementation of the culture media (47). Membranecomposition changes that occur in human retinoblastoma and neuroblastoma cell linesalso affect membrane transport mechanisms. A higher DHA content increases the affinityand transport rates for choline and taurine (48). Furthermore, preliminary studies havesuggested that the dietary n-3 fatty acid supply may affect nucleotide cyclase activityand rybosylation of guanine nucleotide binding proteins (50).
The role of membrane lipid composition in determining the electrical properties ofcultured neuronal cells exposed to exogenous fatty acids has been investigated (50,51).Both n-3 and n-6 fatty acids induced slower rates of rise and, to a lesser extent, loweramplitude of Na+ action potentials. The reverse effects were observed when saturated ortrans monoenoic fatty acids were added. It seems likely that these effects were mediatedby a change in the number of active Na+ channels; a change in membrane compositionor altered fatty acid availability to the cells may explain these findings (50).
These functions are very important for brain development. LCPUFAs have a role ingrowth-related events in the neurons and also affect the development of synapticprocesses for neural cell interaction. DHA is a major constituent of synaptic end sites,whereas AA is present in growth cones and synaptosomes (52). AA is preferentiallyreleased from membrane phospholipids by the action of endogenous phopholipase A2and participates in signal transduction events that regulate growth cone activity and, ulti-mately, conversion of growth cones to mature synaptic endings (53). DHA plays a roleas a structural component of the membranes—particularly at the synapse site, where the

Chapter 26 / PUFAs and Neurodevelopment 671
membrane microenvironment influences neurotransmitter uptake and release (43). AAand DHA also affect the process of interaction between nerve cells during developmentby activating the transcription of genes that are responsible for brain lipid binding protein.This protein is crucial in a signaling pathway of the response of glial cells to neurons;DHA binding regulates its activity (54). AA is also specifically released by glutamate andN-methyl-D-aspartate by stimulating calcium-dependent phopholipase A2. These receptorshave been implicated in long-term potentiation, which is considered a likely mechanismfor memory and learning (55). Additionally, fatty acids—specifically DHA—affect theexpression of genes that regulate cell differentiation and growth of retinal neuronal differ-entiation. Our recent studies in human fetal retinal explants demonstrated a threefold orgreater overexpression for 14% of the nearly 3000 genes that were evaluated when phys-iological amounts of DHA were added to the serum-free culture media, compared tooverexpression in 1% of genes when oleic acid was used (56).
2.5. Sources of Dietary Essential Polyunsaturated Fatty AcidsThe principal source of PUFAs for infants is human milk. The amount of PUFAs in
human milk depends principally on the mother’s diet during pregnancy and lactationand varies according to postpartum age, preterm or term delivery, and maternal diseasesthat affect lipid metabolism—such as diabetes, cystic fibrosis, and abetalipoproteine-mia. AA is the main n-6 PUFA, and DHA is the most important of the n-3 LCPUFAseries. The usual ratio of total n-6 to n-3 is 5 to 10:1; however, the ratio may increaseto 18:1 if high linoleic acid oils are consumed. The AA/DHA ratio is most commonly1.5 to 2:1. The variability in LCPUFA in human milk is high and is mainly determinedby diet. EPA is found in minimal amounts, the exception being in populations consuminga high fish intake (57). DHA levels range from nearly 0.1% (reported from Germany)to 1.4% (reported in Inuits of North America); however, typical values range from 0.3to 0.4% (23,57). Makrides reported a longitudinal reduction in breast milk DHA inAustralian women on Western diets—from 0.32% in 1981 to 0.21% in 1995 (58). A higherconsumption of fish in the maternal diet or DHA supplementation can increase the DHAcontent of human milk within a short time-frame (59,60).
Vegetable oils derived from corn, safflower, and sunflower predominantly containlinoleic acid; others, such as soy and linseed oils, contain LNA. The latter has higherconcentrations of chloroplast membranes, rather than oily seeds, in green leafy vegeta-bles. Thus, products from animals fed in the wild have different compositions of fattyacids than products from grain-fed animals. This is of interest because of the higherDHA content of eggs from range-fed chickens. The introduction of egg yolk as a wean-ing food in some areas of the world may represent a useful dietary practice to ensureLCPUFA supply in early infancy. Additionally, the use of evening primrose oil or blackcurrant oil provides 18:3 n-6 γ-linolenic acid (GLA), thus bypassing the controllingenzyme, Δ-6 desaturase, which is necessary for AA formation. This approach has beenused by some formula manufacturers to improve AA status in young infants.
n-3 PUFAs of marine origin are formed in the chloroplast of the phytoplankton ormicro-algae consumed by fish. The main sources for the de novo synthesis of n-3 fattyacids are marine autotrophic bacteria, micro-algae, and protozoa, which constitute thezooplankton and phytoplankton. Fish that are higher in the food chain incorporatethe n-3 PUFAs and further elongate them to 20 and 22 carbon atom fatty acids con-taining four, five, and six six double-bonds through the action of specific desaturases.

672 Part VII / Optimal Pregnancy/Infancy Outcomes
Therefore, fish concentrate EPA and DHA as triglycerides, mainly in the adipose tissueand in the fat of muscle and visceral organs. The higher the fat content of fish, the higherits content of n-3 fatty acids. Some marine mammals such as seals and polar bears,which feed predominantly on fish, also accumulate relatively high quantities of n-3 fattyacids in their adipose tissue (61,62). Another important source of LCPUFAs is egg yolkphospholipids. The concentrations of PUFAs are different depending on the feed given;the ample use of fish meal in chicken feed has increased egg yolk DHA (63). LCPUFAproducts for blending in infant formulas can be successfully produced if chicken feed iscarefully monitored and refined lipid extraction procedures are used. Egg yolk is currentlyan important LCPUFA source used in European infant formulas.
Bacterial strains and micro-algae isolated from the intestinal content of some fish showa remarkably high content of EPA and DHA; therefore, efforts have been made to growthese microorganisms in natural or artificial sea water to obtain EPAand DHAfor nutritionalor pharmacological use. Additionally, selected fungal strains produce concentrated AAthat is suitable for human consumption (64,65). The industrial production of AA, EPA,and DHA from strains of these single-cell organisms has been successful; however, theexpanded use of these acids depends on price and demand for them relative to the con-centrates obtained from marine oils. Single-cell oils provide a safe and abundant sourceof LCPUFAs, and their mass production has become commercially profitable (65). Veryrecently, n-3 desaturase transgenic mice (obtained by inserting the n-3 desaturase [fat-1]gene from the invertebrate Caenorhabditi elegans in mice) were used to illustrate thepotential modification of n-3 content of animal tissues and milk independent of the diet. Thisoffered a novel alternative to change n-3 fatty acid intake by genetically modifying thefoods consumed without altering the selection of foods consumed (66). Table 1 summarizesthe main sources of LCPUFAs for use in supplementation.
The question of how much LCPUFA to provide to infants is not answered simply bydeciding how much breast-fed babies receive in the upper, lower, or the middle point ofLCPUFA content of human milk. Rather, the amount must be based on functionalresponse to a given level of DHA. If the effort is primarily focused on demonstratingefficacy, then selecting a value in the upper range is preferable. On the other hand, if seri-ous safety concerns were an issue, selecting a value in the lower range would be moreappropriate. Supplementation of formula-fed preterm infants with graded levels of AA(0–1.1% of total fat) and DHA (0–0.76% of total fat) compared to supplementation of
Table 1Sources of PUFAs for Use in Infant Formula
n-6 n-3
Black current seed GLABorage oil GLAEgg phospholipids AA DHAEvening primrose oil GLAFish oil EPA/DHAMarine oil fractions DHAAnimal phospholipids AA DHASingle cell oil AA DHATransgenic plants/animals AA DHA

Chapter 26 / PUFAs and Neurodevelopment 673
human milk-fed babies demonstrated that plasma and RBC LCPUFA levels could bemimicked by supplementing formula at levels close to 0.5% AA and 0.3% DHA (59,67).
3. PUFA IN HUMAN GROWTH AND DEVELOPMENT
3.1. Significance of PUFAs During Fetal DevelopmentThe fetus and the placenta are fully dependent on the maternal EFA supply for their
growth and development. The major fat deposition in the human fetus occurs during thethird trimester, but key phospholipids in placental vessels and uterine vasculature aredependent on EFA supplied by the mother for eicosanoid formation from the momentof conception (68,69).
Maternal dietary linoleic acid and LNA supply serve as precursors for n-3 and n-6LCPUFA synthesis by the maternal liver. The placental transfer of fatty acids is partiallyregulated by the transplacental fatty acid gradient. Serum albumin concentration and α-fetoprotein have a high binding affinity for free fatty acids and, therefore, may beimportant for placental fatty acid transfer (70,71). Mammalian fetuin is a placental pro-tein with a 50-fold greater efficiency in binding fatty acids compared to albumin.Lipoprotein lipase on the maternal surface of the sincytiotrophoblast hydrolyzes mater-nal triacylglicerol, releasing free fatty acids. Fetal erythrocytes also appear to perform a
Table 2Formula With LCPUFAs
% Total fatty acids
n-6 n-3
Preterm InfantsAletemil. PreNidal Beba (Nestle) 0.5 GLA 0.1 EPA
0.1 AA 0.5 DHANutriprem Cow & Gate (Nutricia) 0.6 GLA 0.2 EPA
0.3 DHAPrematil (Milupa) 0.2 GLA
0.4 AA 0.2 DHAHumana OF + (Humana) 0.2 AA 0.2 DHANenatal (Nutricia) 0.6 AA 0.4 DHAPremilon (Nutricia) 0.45 AA 0.3 DHAEnfamil Premature LIPIL (Mead Johnson) 0.64 AA 0.32 DHASimilac Special Care (Abbott) 0.40 AA 0.25 DHA
Term InfantsAlete PreBeba 0.5 GLA 0.1 EPABeba HA (Nestle) 0.1 AA 0.5 DHAPreAptamil (Milupa) 0.2 GLA 0.2 DHA
0.4 AAAdapta 90 Inicio (Wander) 0.2 EPA
0.2 DHASimilac Advance (Abott) 0.4 AA 0.15 DHAEnfalmil LIPIL (Mead Johnson) 0.64 AA 0.32 DHAGood Start (Nestle, USA) 0.64 AA 0.32 DHA

674 Part VII / Optimal Pregnancy/Infancy Outcomes
significant role in the placental DHA transfer (71). There is a progressive enrichment inthe concentration of AA and DHA in circulating lipids in the fetus during the thirdtrimester—a time when fetal demands for vascular and especially neural growth aregreatest (72). Significant increases have been observed in the AA and DHA content offetal brain tissue during the last trimester of gestation and initial postnatal months (73).A total of 600 g of EFAs are transferred from mother to fetus during a full-term gestation;net uptake approximates 2.2 g per day. AA and DHA are supplied to the fetus from thematernal diet and by endogenous fetal biosynthesis (liver desaturation/elongation).
Studies conducted in different populations that use similar methodologies have shownthat the pattern of change in fatty acid composition during gestation and pregnancy is sim-ilar among different ethnic/diet groups (74). Populations with higher maternal plasma con-centrations of n-6 fatty acids have lower n-3 content and vice versa. DHA concentrationsdecrease during late gestation, unless the mother’s diet is very high in DHA. n-6 cord lev-els in full-term infants are less dependent on maternal levels than cord DHA. Most n-3 fattyacids, which come into the fetal circulation, are accrued by the fetus despite low maternaln-3 concentrations. These results suggest a need for adequate dietary LCPUFA duringpregnancy. This may be particularly important for populations with low n-3 EFA intake, formultiparous women, or during multiple pregnancies (69,75). The changes in maternalfatty acid plasma and RBC content are paralleled by changes in fetal levels measured bycordocentesis. The latter are similar to values obtained at birth, with the exception that a
Fig. 2. Rod electrorelinogram (ERG) threshold at 36 wk postconceptional age and visualevoked potential (VEP) and forced-choice preferential looking (FPL) visual acuities ofpreterm study infants at 57 wk postconceptional age. Rod ERG threshold is the light inten-sity measured in scotopic troland-seconds (Scot dt-s) required to induce a b-wave ampli-tude of 2 μV; higher thresholds are associated with lower photoreceptor sensitivity. Largerlog minimum angle of resolution (MAR) visual acuity values are associated with poorervisual acuity. Asterisks within a functional measure indicate significantly different fromhuman milk mean values using ANOVA. For experimental details and data see refs. 67,68.

Chapter 26 / PUFAs and Neurodevelopment 675
significantly higher cord linolenic acid level is measured during centesis (72). The resultsconfirm that fetal DHA relative blood content and absolute concentration increase withgestational age. In the case of AA, levels increase or decrease during gestation dependingon the study, although there is a better positive correlation with birth weight than thatobserved with DHA (76,77). Differences in fatty acid profiles at 34 wk of gestation inwomen delivering preterm full-term babies have shown that RBC and plasma AA arehigher in mothers delivering preterm babies. The comparison suggests that maternal AAmobilization and availability may be altered in women who deliver preterm. Pretermmaternal n-3/n-6 ratios suggest that perinatal n-3 EFA metabolism plays an important rolein preterm birth (78). The fatty acid profile of pre-eclamptic pregnant women shows alower unsaturation index and is particularly low in n-6 LCPUFAs relative to controls (79).
The PUFA status in pregnancy is of special significance because prostaglandins playa key role in the onset of labor and also induce abortion and labor. AA in amniotic fluidincreases at the initial process of human parturition. The use of marine oil supplemen-tation has been proposed in the prevention of pre-eclampsia because maternal bloodpressure responses are dependent on AA/EPA balance in the vessel wall. EPA-derivedprostanoids oppose the action of AA derivatives; namely, EPA has vasodilatory effectsand decreases rather than enhances platelet aggregation. Epidemiological studies and arandomized controlled trial of fish oil supplementation in normal pregnancy demon-strated prolonged gestation with higher birth weight in the group supplemented with n-3(80). Despite the lack of efficacy of fish oil supplements given during the secondtrimester of gestation in reducing the risk of pre-eclampsia, IUGR, and preterm labor,the potential benefit of supplementation given periconceptionally remains open (81).Recent data from Norway indicate that there may be important benefits for childrenwhen mothers are supplemented with LCPUFAs. Children born to mothers who had takencod liver oil during pregnancy and lactation scored 4 points higher on the MentalProcessing Composite of the K-ABC at age 4 yr compared to children whose mothers hadtaken corn oil. Furthermore, the children’s mental processing scores at age 4 yr correlatedsignificantly with maternal intake of EPA and DHA during pregnancy. In a multipleregression model, maternal intake of DHA during pregnancy was the only variable ofstatistical significance for the children’s mental processing scores at age 4 yr (82).
3.2. Significance of Polyunsaturated Fatty Acids for Preterm InfantsThe brain growth and LCPUFA deposits during the last trimester of pregnancy sug-
gests that preterm infants may be especially vulnerable to insufficient access to EFAs.Preterm infants show a progressive decrease in LCPUFAs in plasma and RBC lipids,especially if the early diet lacks LCPUFAs. Human milk-fed infants and infants receivingDHA and AA in formula had higher levels in plasma, RBCs, and buccal mucosal cellsthan infants fed DHA- and AA-free formula (83–87).
3.2.1. CONTROLLED STUDIES IN PRETERM INFANTS
We studied preterm infants who received human milk or were randomly assigned toformulas with different EFA contents from 30 wk of gestation to early infancy. Thefunctional impact of n-3 fatty acid supplementation included enhanced retinal maturationof the rod photoreceptor responses in supplemented infants, which mimicked matchedhuman milk-fed preterm infants of similar postconceptional age (36 wk). By 57 wk (atime when retinal development is nearly complete), the difference in photoreceptor

676 Part VII / Optimal Pregnancy/Infancy Outcomes
function was not apparent, with the exception of changes in oscillatory potentials, whichreflect inner retinal signal processing. Visual acuity tests throughout the 6-mo study alsowere less mature in infants who received formula that was devoid of DHA, despite ampleprovision of LNA. The n-3 LCPUFA-supplemented group had significantly better visualacuity (as measured by visually evoked potential [VEP] and forced-choice preferentiallooking [FPL]) than the control group. Highly significant correlations were found for bothVEP and FLP visual acuity when compared to the level of DHA in multiple lipid fractionsfrom study infants (88–90). Our more recent studies conducted in Chile demonstratedno LCPUFA effect on auditory brainstem-evoked responses, which is in agreement withthe study by Faldella (91). There was an increased maturation of the sleep–wake cycleregarding less indeterminate sleep and more quiet (non-rapid eye movement) sleep in thehuman milk-fed group compared with the randomized formula-fed groups. At 18 mo, theBayley scale demonstrated better developmental indices in the human milk-fed group butno differences within formula-fed groups. The findings in developmental indices suggestthat environmental influences may have a greater effect than the early diet.
Carlson’s randomized clinical study of preterm infants who were supplemented withLCPUFA demonstrated better visual acuity using behavioral measures in infants up toage 4 mo. After this time, control infants “caught-up” in visual function measures.These investigators also reported evidence of more rapid visual processing, as measuredby the Fagan test of visual recognition at age 6 to 12 mo in LCPUFA-supplementedinfants (92,93). The reduction in AA when fish oil was provided as a source of n-3 fattyacids was associated with reduced weight and growth in length (94). In a second preterminfant study that used low EPA marine oil for up to 2 mo corrected age, Carlson demon-strated improved visual development at the 2-mo follow-up and a 10-point IQ differencethat favored the DHA-supplemented group at 12 mo (95–97). No significant drop in AAor deleterious effects on growth was observed when low EPA marine oil was used. TheDHA-supplemented group had shorter look-times in the novelty preference test at 9 mo,which is suggestive of better visual processing.
The largest, collaborative, multicenter study of a large group of preterm infantsincluded 450 preterm infants fed LCPUFA formula that was supplemented with differ-ent AA and DHA sources: fish oil and egg phospholipids or fungal oil. The level ofDHA was 0.25% of total fat in preterm formulas and 0.15% in follow-up formula; bothformulas contained 0.4% AA. Significant differences were found in sweep VEP at 6 mo,favoring the LCPUFA-supplemented formula group rather than the control formulagroup. No differences were found in behavioral test of visual acuity (Teller cards) or inFagan habituation or Macarthur vocabulary tests. An advantage in the Bayley score wasobserved at 12 mo for infants who weighed less than 1250 g at birth in the LCPUFA-supplemented group. There were no consistent differences in weight, length, head cir-cumference, anthropometric gains, or preterm morbidity (98). Neither long-term follow-upof these infants nor other studies have been reported.
3.3. Significance of Polyunsaturated Fatty Acids for Full-Term InfantsSimilar questions to those addressed in the previous section on low-birth-weight infants
have been posed for healthy full-term infants. The finding of lower plasma DHA concen-trations in infants who were fed formula compared to breast-fed infants suggests that pre-sent formulas provide insufficient LNA or that chain elongation/desaturation enzymes arenot sufficiently active during early life to support tissue accretion of DHA. Furthermore,

Chapter 26 / PUFAs and Neurodevelopment 677
necropsy studies in infants born at full-term who died from Sudden Infant Death Syndromerevealed that brain composition is affected by type of feeding. Human milk feeding resultedin higher DHA content in the brain cortex than cow milk-based formula feeding (34,36,99).The first controlled randomized study compared infants fed a formula that was supple-mented with 0.36% DHA, a formula providing ample LNA but no DHA, and a breast-fedreference group. This study revealed delayed visual acuity at ages 4 and 6 mo in the grouptaking formula that lacked DHA, relative to those receiving formula that was supplementedwith LNA plus DHA; infants receiving formula that was supplemented with LNA andDHA displayed results similar to the breast-fed control group (100).
Studies by Innis (101–103) concluded that the need for DHA supplementation shouldnot be based on the alleged improved visual acuity of breast-fed infants, because despitedifferences in DHA content in blood, no differences were found in preferential lookingacuity between breast-fed and unsupplemented formula-fed infants. The formula usedin this study contained 2.1% of total fat as LNA but no LCPUFAs. On the other hand,a multicenter trial using formula supplemented with 0.2% DHA and 0.4% AA did notshow an effect of this level of supplementation on visual acuity or growth (104). A studywith different levels of LNA (0.4 to 3.2% of total lipids) in full-term infants did notshow an effect on transient visual-evoked responses at ages 120 and 240 d (105). In asmall trial with LCPUFA-supplemented formula-fed and breast-fed infants, the visualacuity (measured by swept steady-state visual-evoked potential) was different. TheLCPUFA-supplemented formula-fed group had better results than groups receivingstandard formula and worse results than breast-fed infants (106).
A beneficial effect of DHA, AA, and GLA supplementation on psychomotor devel-opment has been reported at ages 4 and 12 mo, but not at 24 mo, as assessed by theBrunet-Lezine method (107,108). The authors reported a strong association between theerythrocyte phosphatidylcholine arachidonic/linoleic acid ratio and developmental quo-tient at age 24 mo, but there was no relationship with the dietary intervention during thefirst 4 mo of life (109).
A randomized trial in full-term infants who were fed formula that contained no LCP-UFA or formula that contained DHA or AA plus DHA found no differences on Bayley Scalescores at 12 mo but found lower language comprehension and production scores measuredon the MacArthur Communicative Development Inventory in the DHA-supplementedgroup compared to the AA plus DHA-supplemented group (110). These children havebeen followed to age 3 yr and have not demonstrated differences on psychomotor devel-opment and vocabulary (111).Willats studied 44 full-term infants who were fed formulasupplemented with DHA and AA or formula with no LCPUFAs during the first 4 mo oflife. Infant cognitive behavior was assessed at age 10 mo by a means-end problem-solvingtest. The supplemented group had significantly more intentional solutions and scores thaninfants who were fed non-LCPUFA formula. Higher problem-solving scores in infancyare related to higher childhood IQ scores (112). In an interesting model that studied theeffects of DHA present in human milk, Gibson supplemented mothers to produce breastmilk with DHA concentration that ranged from 0.1 to 1.7% of total fatty acids. Infants’plasma and erythrocytes phospholipids were related to breast milk DHA in a saturablemanner. Specifically, there was no further increase in breast milk DHA above 0.8% oftotal fatty acids. At 12 mo, the developmental quotient had a low but significant correla-tion with erythrocyte DHA. This correlation was not evident at 24 mo (58). Innis et al.(113) addressed whether the natural variability in human milk DHA is important for

678 Part VII / Optimal Pregnancy/Infancy Outcomes
visual and neural development in infants. Visual acuity at ages 2 and 12 mo, but not 4 and6 mo, was significantly related to blood lipid DHA at 2 mo. No relationship was foundbetween infant AA or DHA status and scores on the Bayley Developmental indexes ornovelty preferences; however, LCPUFA was related to language production and com-prehension assessed at ages 14 and 18 mo (113). In a 3-yr follow-up of visual acuity mat-uration study, we found that formula-fed full-term infants had lower operant preferentiallooking (OPL) than human milk-fed infants (114). The cohorts were breast-fed frombirth to at least age 4 mo or fed for 12 mo with formula that contained ample linolenicacid and 0.5% of the total fat as LNA. The breast-fed group was weaned to an oleic acid(18:1)-predominant formula and received egg yolk through age 12 mo. The breast-fedgroup maintained higher plasma and RBC membrane phospholipid DHA concentrationsthroughout the first year of life. At age 3 yr, stereo acuity, as measured by OPL tech-niques, was more mature in the breast-fed infants compared to the formula-fed group;92% of the breast-fed group had mature OPL stereo acuity, whereas 35% of the infantsin the formula-fed group met the maturity criteria. Visual recognition in the breast-fedgroup was also better: whereas only 61 % of the formula-fed infants had a perfect score,93% of the breast-fed group had a perfect score (114).
Human milk provides a unique nutrient mix, hormones, and special growth-promotingfactors; these, along with LCPUFAs, may play a role in CNS development. Other obser-vational studies of breast-fed and formula-fed infants in relation to cognitive develop-ment have been published since 1929 (115–124). A long-term effect of early feeding onbrain development was suggested by results from the controlled trial of preterm infants,which indicated that feeding human milk that contained LCPUFAs by nasogastric tubefor 28 d was associated with an 8.3-point increase in IQ at age 8 yr compared to a for-mula-fed group (which was devoid of LCPUFAs), after controlling for socioeconomicand other maternal variables (5). These controlled observations in preterm infants indi-cate that human milk may offer unique advantages for brain development. With the excep-tion of this study, which was performed with human milk by tube feeding, all other studieshave been performed with nonrandomized breast-fed infants. On average, mothers whosucceed at breastfeeding are different from those who use formula: they have a highersocioeconomic status, better educational level and educational achievement, higher intel-ligence, less symptoms indicative of maternal depression, and greater preoccupation withinfant development. The act of breastfeeding provides a mode of mother–infant interac-tion, contributes to bonding, and may enhance cognitive development. The most recentstudy using extensive covariate adjustment showed that the benefit of breastfeeding oncognitive development at age 11 yr was no longer significant after maternal IQ andhome environment were incorporated into the analysis (125).
Results from studies in Dallas indicated a persistent benefit on visual acuity devel-opment for the first year of life in DHA-supplemented formula-fed infants comparedwith infants who were fed formula that had ample LNA but no LCPUFA (126). Thedietary effects on visual acuity development were evident using sweep VEP acuities butwere absent if the FPL behavioral measure of acuity was used. The differences were sig-nificant during the periods of rapid changes in development of VEP acuity, (i.e., in thefirst 20 wk and near age 12 mo). The developmental outcome of these infants alsoshowed important differences (127). Scores on the Bayley Mental Development IndexII at age 18 mo for the DHA plus AA group were significantly better than thoseobserved in the non-LCPUFA formula-fed infants. A 7-point difference in normalized

Chapter 26 / PUFAs and Neurodevelopment 679
mental development index score was highly significant, despite the relatively smallsample size (n = 20 per group). The small variability in developmental score obtainedlikely resulted from the highly homogenous population studied and the fact that oneobserver evaluated mental development in all subjects. The DHA-only group had mar-ginally higher mental development index scores than controls. This was the first ran-domized controlled study that reported an effect of LCPUFA on mental development atage 18 mo. Moreover, positive significant correlations were noted between blood DHAlevels at 4 mo with measures of visual acuity at 1 yr and mental development at 18 mo.The existence of a relationship between early biochemical and later functional data sug-gests that visual function and neurodevelopment may be related but do not constituteproof of causality. Using LCPUFA-enriched and control formulas, Makrides et al. (128)did not find diet-induced differences in VEP acuity or Bayley Mental DevelopmentIndex scores during the first year of life. In this case, breast-fed infants had higher MentalDevelopment Index scores than formula-fed infants at age 2 yr, even after adjusting forenvironmental variables (128).
In one of the largest controlled full-term infant studies to date, Lucas et al. (129) didnot find a beneficial effect of LCPUFA supplementation on cognitive development in agroup of 309 infants who were randomized to formula diets with or without LCPUFA.A reference group of 138 breast-fed infants were included for comparative purposes. Nobiochemical data on fatty acid composition of plasma or tissues were obtained in thisstudy, which limited the assessment of compliance to the test formula. Follow-up stud-ies at age 18 mo revealed no benefit on cognitive or motor development. No adverseeffects of LCPUFA supplementation were noted regarding infection, atopy, or formulatolerance. Unfortunately, the interpretation of these data is limited by the fact that studyformulas differed not only by the presence or absence of LCPUFAs but also by the pres-ence or absence of several other fatty acids and key components, such as choline and cho-lesterol content. The expected higher mental development index score in breast-fed infantscompared to standard formula-fed infants was not apparent in this study, and becausethere was no plasma or tissue biochemical evaluation of infant EFA status, a relation-ship between LCPUFA status and neurodevelopment could not be established. Additonally,the population studied had a low educational level—that is, close to 20% had no formaleducation at all, and about 70 % had not completed a high school education. Mean mentaldevelopment index values for all groups were 4 to 6 points below the norm, suggestingthat these groups may not have been representative of the normal population in the UnitedKingdom but, rather, were a group subjected to an environmental factor that restrictedtheir neurodevelopment.
Austead et al. (130) conducted a parallel double-masked, randomized trial of 239full-term infants who were fed formulas with or without AA and DHA for 1 yr. A groupof breast-fed infants (n = 165) who were weaned to formulas with and without AA andDHA was also studied as a reference. Infants in the formula groups were randomizedbefore age 10 d to a control formula with no LCPUFAs (n = 77) or to one of two oth-erwise identical formulas that contained AA plus DHA (AA, 0.46% and DHA, 0.14%of total fatty acids) from either egg-derived triglyceride (n = 80) or fish oil and fungaloil as a source of LCPUFAs (n = 82) at levels similar to the average found in breast milksamples (as measured in the reference group). All formulas contained 50% of energyfrom fat with the essential dietary fatty acids: linolenic acid (20% fatty acids) and LNA(2% of total fatty acids). The main study outcomes were AA and DHA levels in plasma

680 Part VII / Optimal Pregnancy/Infancy Outcomes
and RBCs, and multiple measures of infant development at multiple ages from birth to14 mo (growth, visual acuity, information processing, general development, language,and temperament). AA and DHA levels in plasma and RBCs were higher in groups sup-plemented with AA plus DHA than in the control formula group and were comparableto those in the breast-fed reference groups. No developmental test results distinguishedthese groups. Expected differences were found regarding family demographics associatedwith breastfeeding, but no advantages to breastfeeding were demonstrated on any of thedevelopmental outcomes. The authors of this large study concluded that the findings didnot support adding AA plus DHA to formulas that contained 10% of energy as linolenicacid and 1% of energy as LNA to enhance growth, visual acuity, information processing,general development, language, or temperament in healthy full-term infants during thefirst 14 mo of life (130).
The results of a meta-analysis conducted regarding the effect of LCPUFAs onvisual acuity maturation in full-term infants showed a positive effect for assessmentsconducted during the first 2 to 4 mo of life; the results at 6 mo were equivocal, andsome studies showed a significant beneficial effect at 12 mo. San Giovanni et al.(131,132) concluded that there was a significant overall advantage for the LCPUFA-supplemented infants regarding visual acuity. In an attempt to explain the differences invisual acuity responses from the randomized studies, we conducted a “meta-regression”considering the effective DHA supplied by the formula in each study as a key variableto explain visual acuity maturation. This analysis was used to define the role of aDHA dose in establishing the magnitude of the effect on visual acuity; the DHA dosewas used as the independent variable, and visual acuity was used as the dependentvariable. To date, no controlled study has been conducted regarding dose–response ofDHA on visual acuity. However, if we consider that the main dietary determinants ofDHA status are the LNA and EPA provided and the preformed DHA consumed, wecan attempt to define the DHA-equivalent dose across studies and compare the visualacuity effect. To estimate DHA equivalents from LNA and EPA, we used conversion ratiosderived from our stable isotope studies (31). This approach, termed “meta-regression,”revealed that visual acuity maturation measured at age 4 mo is positively andstrongly related in a linear fashion with the estimated DHA supply expressed as DHAequivalents (133).
The follow-up of phenylketonuric infants treated with early protein restriction mayalso serve to evaluate the effect of LCPUFA deficiency. The effect of 12 mo of DHAsupplementation on functional developmental shows a weak but significantly positiveassociation between plasma LCPUFAs at diagnosis (higher in breast-fed infants) andneurodevelopmental indices through the first year of life (134). Additionally, diseaseslinked to peroxisomal disorders (where there is an altered peroxisomal β-oxidation nec-essary to form DHA) provide an opportunity to assess DHA effects on brain develop-ment. Supplementation with preformed DHA but not with EPA has been demonstratedto be beneficial, especially if less generalized disease is present (135). The benefit ofDHA supplementation in patients with peroxisomal diseases suggests that DHA is alsoinvolved in myelogenesis, because there is an improvement of myelination seen in mag-netic resonance images after long-term DHA supplementation (136). This could beimportant in white matter diseases of micropremies. Recent evidence has suggested thatthe weaning diet has progressively become depleted of n-3 LCPUFAs; therefore, sev-eral studies have indicated a potential need for DHA supplementation through age

Chapter 26 / PUFAs and Neurodevelopment 681
12 mo for optimal neurodevelopment. Even fully breast-fed infants randomized at thetime of weaning (age 4–6 mo) to formula with and without LCPUFA supplementationrevealed measurable biochemical and functional effects in terms of RBC DHA contentand improved visual acuity maturation at age 12 mo (137–139).
4. CONCLUSIONS
Studies presented in this chapter provide clear evidence that dietary n-3 fatty acid defi-ciency affects eye and brain function of preterm infants as measured by ERG, corticalvisual-evoked potentials, and behavioral testing of visual acuity. Preterm infants requireDHA in their diets because they are unable to form these in sufficient quantity from LNAprovided by soy oil-based formula products. Dietary n-3 and n-6 fatty PUFAs supplyresults through discernible differences in the fatty acid composition of plasma and RBCmembrane lipids in full-term and preterm infants. Changes in membrane structure likelyare responsible for the observed functional effects. The evidence from full-term infantsindicates that in several, but not all, studies the DHA-supplemented groups have enhancedvisual acuity and, possibly, better cognitive development as compared to nonsupplementedinfants. Supplementation with both DHA and AA has been demonstrated to support growthand development closer to that of human milk-fed infants, without evidence of adverseeffects. Human milk is the best and only time-proven source of fat and EFAs in the infantdiet. Technological procedures based on chemical and physical separation of the unsatu-rated fatty acids have permitted the elaboration of nearly pure EPA, DHA, and AA for clin-ical use. The development of single-cell oil sources and, more recently, geneticallymodified animals has allowed the provision of novel forms of LCPUFA delivery. Beforethe 1990s, low LNA was found in most infant formulas; currently, virtually all infant for-mulas in developed countries are supplemented with LNA, and most manufacturers inEurope, Japan, and North America have added either DHA, DHA plus AA, or these fattyacids plus GLA to preterm and full-term formulas as a choice for infant feeding. The pub-lic health implications of these changes need to be fully evaluated to support this practiceon a global scale.
5. RECOMMENDATIONS FOR FORMULA-FED INFANTS
Exclusively breast-fed infants receive sufficient EFA and LCPUFAs from breast milkduring the first 6 mo of life to support normal eye and brain development. Consideringthat both n-6 and n-3 are essential nutrients for premature and full-term infants, the fol-lowing recommendations are suggested for formula fed infants:
1. The total EFA requirement (n-6 + n-3) for premature infants should be set at 5 to 6%of total energy, although up to 10 % can be provided safely. This represents approx 0.6to 0.8 g/kg per day, with an upper limit of 1.5 g/kg.
2. The parent n-6 EFA (linoleic acid) supply should be 0.5 to 0.6 g/kg daily, and becausedesaturase and elongating enzymatic activity are limited in early life, formulas forinfants should provide 60 to 100 mg/kg per day as preformed AA.
3. The total n-3 fatty acid supply should be 70 to 150 mg/kg daily. Because desaturaseand elongase enzyme activity are limited in early life, formulas for infants shouldprovide 35 to 70 mg of n-3 LCPUFA per kilogram of body weight per day as DHA.
4. The total linoleic acid supply should not exceed 12% of total energy, because excesslinoleic acid may adversely affect the formation of LCPUFAs.

682 Part VII / Optimal Pregnancy/Infancy Outcomes
5. The ratio of total n-6 to n-3 fatty acids that is present in the early diet should be main-tained within a range of 5:1 to 15:1. The ratio of DHA to AA should be from 1:1 to 1:2,because excess DHA may lower conversion of linoleic acid to AA.
6. After age 6 mo, weaning foods (formula and or solid foods) should contain LCPUFAsto continue to support neurodevelopment.
ACKNOWLEDGMENT
Grant Fondecyt no. 1040945 provided support for this chapter.
REFERENCES1. Dobbing J, Hopewell JW, Lynch A. Vulnerability of developing brain. VII. Permanent deficit of neurons
in cerebral and cerebellar cortex following early mild undernutrition. Exp Neurol 1971; 32:439–447.2. Levitsky DA, Strupp BJ. Malnutrition and the brain: changing concepts, changing concerns. J Nutr
1995; 125:2212S–2220S.3. Pollitt E. A Critical View of Three Decades of Research on the Effects of Chronic Energy
Undernutrition on Behavioral Development. In: Schurch B, Scrimshaw N eds. Chronic EnergyDeficiency. IDECG, Laussane Switzerland, 1988
4. Lanting CI, et al. Neurological differences between 9 year-old children fed breast-milk or formula-milk as babies. Lancet 1994; 344:1319–1322.
5. Lucas A, Morley R, Cole TJ, et al. Early diet in preterm babies and developmental status at 18months. Lancet 1990; 335:1477–1481.
6. Lucas A, Morley R, Cole TJ. Randomised trial of early diet in preterm babies and later intelligencequotient. BMJ 1998; 317:1481–1487.
7. Brandt I, Sticker EJ, Lentze MJ. Catch-up growth of head circumference of very low birth weight, smallfor gestational age preterm infants and mental development to adulthood. J Pediatr 2003; 142:463–468.
8. Goldman HI, Goldman JS, Kaufman Y, Lieberman OB. Late effects of early dietary protein intakeon low-birth-weight infants. J Pediatr 1974; 85:764–769.
9. Rush D, Stein Z, Susser M. A randomized controlled trial of prenatal, nutritional supplementation inNew York City. Pediatrics 1980; 65:683–697.
10. Grantham-McGregor S. A review of studies of the effect of severe malnutrition on mental develop-ment. J Nutr 1995; 125:2233S–2238S.
11. Burr GO, Burr MM. A new deficiency disease produced by rigid exclusion of fat from the diet. J BiolChem 1929; 82:345–367.
12. Hansen AE, Wiese HF, Boelsche AN, Haggard ME, Adam DJD, Davis H. Role of linoleic acid ininfant nutrition: clinical and chemical study of 428 infants fed on milk mixtures varying in kind andamount of fat. Pediatrics 1963; 31:171–192.
13. Holman RT, Johnson SB, Hatch TF. A case of human linolenic acid deficiency involving neurologicalabnormalities. Am J Clin Nutr 1982; 35:617–623.
14. Simopoulos AP: Omega-3 fatty acids in health and disease and in growth and development. Am JClin Nutr 1991; 54:438–463.
15. Anderson RE, Benolken RM, Dudley PA, Landis DJ, Wheeler TG. Polyunsaturated fatty acids ofphotoreceptor mambranes. Exp Eye Res 1974; 18:205–213.
16. Ballabriga A. Essential fatty acids and human tissue composition. An overview. Acta Paediatr Suppl1994; 402:63–68.
17. Brenner RR, Peluffo RO. Regulation of unsaturated fatty acid biosynthesis. Biochim Biophys Acta1969; 176:471–479.
18. Sprecher H. Biochemistry of essential fatty acids. Prog Lipid Res 1981; 20:13–22.19. Willis AL. Essential Fatty Acids, Prostaglandins, and Related Eicosanoids. Present Knowledge in
Nutrition. The Nutrition Foundation, Washington, DC, 1984, pp. 90–113.20. Glomset JA. Fish, fatty acids and human health. N Engl J Med 1985; 312:1253,1254.21. Lee AG, East JM, Froud RJ. Are essential fatty acids essential for membrane function? Prog Lipid
Res 1986; 25:41–46.22. Uauy R, Mena P, Rojas C. Essential fatty acids in early life: structural and functional role. Proc Nutr
Soc 2000; 59:3–15.

Chapter 26 / PUFAs and Neurodevelopment 683
23. Innis SM. Essential Fatty Acids in growth and development. Prog Lipid Res 1991; 30:39–103.24. Bourre JM, Francois M, Youyou A. The effects of dietary alfa-linolenic acid on the composition of
nerve membranes, enzymatic activity, amplitude of electrophysiological parameters, resistance topoisons and performance of learning task in rats. J Nutr 1989; 119:1880–1892.
25. Sheaff Greiner RC, Winter J, Nathanielsz PW, Brenna T. Brain docosahexaenoate accretion in fetalbaboons: bioequivalence of dietary alfa linolenic and docosahexaenoic acids. Pediatr Res 1997;42:826–834.
26. Salem N, Wegher B, Mena P, Uauy R. Arachidonic and docosahexaenoic acids are biosynthesizedfrom the 18-carbon precursors in human infants. Proc Natl Acad Sci USA 1996; 93:49–54.
27. Demmelmair H, Schenck UV, Behrendt, Sauerwald T, Koletzko B. Estimation of arachidonic acidsynthesis in full term neonates, using natural varaition of 13C content. J Pediatr Gastroenterol Nutr1995; 21:31–36.
28. Carnielli VP, Wattimena DJL, Luijendijk I, Boerlage A, Degenhart HJ, Sauer PJJ. The very low birthweight premature infant is capable of synthesizing arachidonic and docosahexaenoic acids fromlinoleic and linolenic acids. Pediatr Res 1996; 40:169–174.
29. Sauerwald Tu, Hachey D, Jensen CL, Anderson RE, Heird WC. Intermediates in endogenous synthesisof C22:n-3 and C20:n-6 by term and preterm infants. Pediatr Res 1997; 441:183–187.
30. Demmelmair H, Sauerwald T, Koletzko B, Richter T. New insights into lipid and faty acidmeabolism via stable isotopes. Eur J Pediatr 1997; 156:S70–S74.
31. Uauy R, Mena P, Wegher B, Nieto S, Salem N. Long chain polyunsaturated fatty acid formation inneonates: Effect of gestational age and intrauterine growth. Ped Res 2000; 47:127–135.
32. Bourre J, Dinh L, Boithias C, Dumont O, Piciotti M, Cunnane S. Possible role of the choroid plexusin the supply of brain tissue with polyunsaturated fatty acids. Neurosc Lett 1997; 224:1–4.
33. Llanos A, Lin Y, Mena P , Salem N, Uauy R. Intrauterine Growth Retarded Infants Have ImpairedAccretion of Docosahexaenoic Acid in Early Neonatal Life: A Stable Isotope Study. 2004, submitted.
34. Farquharson J, Cockburn F, Patrick WA, Jamieson EC, Logan RW. Infant cerebral cortex phospholipidfatty-acid composition and diet. Lancet 1992; 340:810–813.
35. Byard RW, Makrides M, Need M, Neumann MA, Gibson RA. Sudden infant death syndrome: effectof breast and formula feeding on frontal cortex and brainstem lipid composition. J Pediatr ChildHealth 1995; 31:14–16.
36. Galli C, Trzeciak HI, Paoletti R. Effects of dietary fatty acids on the fatty acid composition of brainethanolamine phosphoglyceride: reciprocal replacement of n-6 and n-3 polyunsaturated fatty acids.Biochim Biophys Acta 1971; 248:449–454.
37. Galli C, Simopoulos AP, Tremoli E. Effects of fatty acids and lipids in health and disease. World RevNutr Diet 1994; 76:1–149.
38. Holh CM, Rosen P. The role of arachidonic acid in rat heart cell metabolism. Biochem Biophys Acta1987; 921:356–363.
39. Mitchell DC, Niu SL, Litman BJ. DHA-rich phospholipids optimize G-protein-coupled signaling.J Pediatr 2003; 143:S80–S86
40. Salem N Jr, Shingu T, Kim HY, Hullin F, Bougnoux P, Karanian JW. Specialization in MembraneStructure and Metabolism With Respect to Polyunsaturated Lipids. In: Karnovsky ML, Leaf A,Bollis LC, eds. Biological Membranes: Aberrations in Membrane Structure and Function. Alan R.Liss, New York, 1988, pp. 319–333.
41. Stubbs CD, Smith AD. The modification of mammalian polyunsaturated fatty acid composition inrelation to fluidity and function. Biochim Biophys Acta 1984; 779:89–137.
42. Wheeler TG, Benolken RM, Anderson RE. Visual membranes: especificity of fatty acid precursorsfor the electrical response to illumination. Science 1975; 188:1312–1314.
43. Foot M, Cruz TF, Clandinin MT. Effect of dietary lipid on synaptosomal acetylcholinesterase activity.Biochem J 1983; 211:507–509.
44. Murphy MG. Dietary fatty acids and membrane protein function, J Nutr Biochem 1990; 1:68–79.45. Wood JN. Essential Fatty acids and their metabolites in signal transduction. Biochem Soc Trans
1990; 18:755–786.46. Lands WEM. Renewed questions about polyunsaturated fatty acids. Nutr Rev. 1986; 44:189–195.47. Treen M, Uauy RD, Jameson DM, et al. Effect of docosahexaenoic acid on membrane fluidity and
function in intact cultured Y-79 retinoblastoma cells. Arch Biochem Biophys 1992; 294:564–570.48. Yorek MA, Bohnker RR, Dudley DT, Spector AA. Comparative utilization of N-3 polyunsaturated
fatty acids by cultured human Y-79 retinoblastoma cells. Biochim Biophys Acta 1984; 795:277–285.

684 Part VII / Optimal Pregnancy/Infancy Outcomes
49. Distel RJ, Robinson GC, Spiegelman BM. Fatty acid regulation of gene expression.Transcriptionaland post-transcriptional mechanism. J Biol Bioch 1992; 267:5937–5941.
50. Love JA, Saurn WR, McGee R. The effects of exposure to exogenous fatty acids and membrane fattyacid modification on the electrical properties of NG108-15 cells. Cell Molec Neurobiol 1985;5:333–352.
51. Evers AS, Elliott WJ, Lefkowitz JB, Needleman P. Manipulation of rat brain fatty acid compositionalters volatile anesthetic potency. J Clin Invest 1986; 77:1028–1033.
52. Martin RE, Bazan NG. Changing fatty acid content of growth cone lipids prior to synaptogenesis.J Neurochem 1992; 59:318–325.
53. Kim HY, Edsall L, Ma YC. Specificity of polyunsaturated fatty acid release from rat brain synapto-somes. Lipids 1996; 31:S229–S233.
54. Xu LZ, Sanchez R, Sali A, Heintz N. Ligand specificity of brain lipids-binding protein. J Biol Chem1996; 271:24,711–24,719.
55. Kurlak LO, Stephenson TJ. Plausible explanations for effects of long chain polyunsaturated fattyacids (LCPUFA) on neonates. Arch Diseases Child 1999; 80:f148–f154.
56. Rojas C, Martìnez J, Flores I, Hoffman D, Uauy R. Gene Expression Analysis in Human FetalRetinal Explants Treated with Docosahexaenoic Acid. Invest Ophthalmol Visual Science 2003;44:3170–3177.
57. Jensen RG. The lipids in human milk. Prog Lipids Res 1996; 35:53–92.58. Makrides M, Simmer K, Neumann M, et al. Changes in the polyunsaturated fatty acids of breast milk
from mothers of full-term infants over 30 wk of lactation. Am J Clin Nutr 1995; 61:1231–1233.59. Gibson R, Neumann M, Makrides M. Effect of increasing breast milk docosahexaenoic acid on
plasma and erythrocyte phospholipid fatty acids and neural indices of exclusively breast fed infants.Eur J Clin Nutr 1997; 51:578–584.
60. Cherian G, Sim JS. Changes in the breast milk fatty acids and plasma lipids of nursing mothersfollowing consumption of n-3 polyunsaturated fatty acid enriched eggs. Nutrition 1996; 12: 8–12.
61. Ackman RG. Structural homogeneity in unsaturated fatty acids of marine lipids. A review. J Fish ResBoard Canada 1964; 21:247–254.
62. Brockenhorff H, Ackman RG, Hoyle RJ. Specific distribution of fatty acids in marine lipids. ArchBiochem Biophys 1963; 100:93–100.
63. Simopoulos AP, Salem N. Egg yolk as a source of long-chain polyunsaturated fatty acids in infantfeeding Am J Clin Nutr 1992; 55:411–414.
64. Iwamoto H, Sato G. Production of EPA by freshwater unicellular algae. J Am Oil Chem Soc 1986;63:434–438.
65. Akimoto M, Ishii T, Yamagaki K, Ohtaguchi K, Koide K, Yazawa K. Production of eicosapentaenoicacid by a bacterium isolated from mackerel intestines. J Am Oil Chem Soc 1990; 67:911–915.
66. Kang JX, Wang J, Wu L, Kang ZB. Fat-1 mice convert n-6 to n-3 fatty acids. Nature 2004; 427:504.67. Maurage C, Guesnet P, Pinault M, et al. Effect of two types of fish oil supplementation on plasma
and erythrocyte phospholipids in formula-fed term infants Biol Neonate 1998; 74:416–429.68. Ongari MA, Ritter JM, Orchard MA, et al. Correlation of prostacyclin synthesis by human umbili-
cal artery with status of essential fatty acid. Am J Obstet Gynec 1984; 149:455–460.69. Honstra G, Al MDM, Van Houwelingen AC, et al. Essential Fatty Acids, Pregnancy and Pregnancy
Outcome. Bindels JC, Goededhart AC, Visser HKA, eds. Recent Development in Infant Nutrition, 51–63.70. Dutta-Roy AK. Fatty acid transport and metabolism in the feto placental unit and the role of fatty
acid binding protein. J Nutr Biochem 1997; 8:548–557.71. Kimura R. Lipid Metabolism in the Fetal–Placental Unit. In: Cowett R, ed. Principles of Perinatal
Neonatal Metabolism. Springler-Verlag, New York, 1998, p. 389.72. Houwelingen A, Foreman Drongelen M, Nicolini U, et al. Essential fatty acid status of fetal plasma
phospholipids: similar to postnatal values obtained at comparable gestational ages. Early Hum Dev1996; 46:141–152.
73. Clandinin MT, Chappell JE, Leong S, et al. Intrauterine fatty acid accretion rates in human,brain:implication for fatty acid requirements. Early Hum Dev 1980; 4:121–130.
74. Otto S, Houwelingen A, Antal M, et al. Maternal and neonatal essential fatty acid status in phos-pholipids: an international comparative study. Eur j Clin Nutr 1997; 51:232–242.
75. Foreman-van Drogelen M, Al MDM, Van Houweligen A, et al. Comparison between the essentialfatty acid status of preterm and full-term infants, measured in umbilical vessels. Early Hum Dev1995; 42:241–251.

Chapter 26 / PUFAs and Neurodevelopment 685
76. Zeijdner EE, Houwelingen AC, van Kester ADM, Honstra G. The essential fatty acid status inplasma phospholipids of mother and neonate after multiple pregnancy. Prost Leukotr Ess Fatty acids1997; 56:395–401.
77. Al MDM, Houwelingen AC, Honstra G. Relation between birth order and the maternal and neonataldocosahexaenoic acid sstatus. Eur J Clin Nutr 1997; 51:548–553.
78. Reece M, McGregor J, Allen K, et al. Maternal and perinatal long-chain fatty acids: Possible rolesin preterm birth. Am J Obstet Gynecol 1997; 176:907–914.
79. Oostenburg GS, Mensink RP, van Houwelingen AC, Al MDM, Honstra G. Pregnancy-inducedhypertension: maternal and neonatal plasma lipid-soluble antioxidant levels and it relationship withfatty acid unsaturation. Eur J Clin Nutr 1998, 52:754–759.
80. Olsen SF, Sorensen JD, Secher NJ, et al. Randomized controlled trial of effect of fish oil supple-mentation on pregnancy duration. Lancet 1992; 339:1003–1007.
81. Salvig JD, Olsen SF, Secher NJ Effects of fish oil in late pregnancy on blood pressure a randomisedtrial Br. J Obstet Gynaecol 1996; 103:529–533.
82. Helland IB, Smith L, Saarem K, Saugstad OD, Drevon CA. Maternal supplementation with very-long-chain n-3 Fatty acids during pregnancy and lactation augments children’s IQ at 4 years of age.Pediatrics 2003; 111:e39–e44.
83. Koletzko B, Schmidt E, Brenner HJ, Haug M, Harzer G. Effects of dietary long chain polyunsatu-rated fatty acids on the essential fatty acid status of preterm infants. Eur J Pediatr 1989; 148:669,670.
84. Clandinin MT, Parrot A,Van Aerde JE,Hervada AR, Lien E. Feeding preterm infants a formula con-taining C-20 and C-22 fatty acids simulates plasma phospholipid fatty acid composition of infantsfed human milk. Early Hum Dev 1992; 31:41–51.
85. Ghebremeskel K, Leightfields M, Leaf A, Costelone K, Crawford M. Fatty acid composition ofplasma and red cell phospholipids of preterm babies fed on breast milk and formulae. Eur J Pediatr1995; 154:46–52.
86. Clandinin M, Van Aerde J, Parrott A, Field C, Euler A, Lien E. Assesment of the efficacious dose ofarachidonic and docosahexanoic acids in preterm infant formulas: fatty acid composition of ery-throcyte membrane lipìds.Pediatr Res 1997; 42:819–825.
87. Hoffman DR, Birch EE, Birch DG, Uauy R. Fatty acid profile of buccal cheek cell phospholipids asan index for dietary intake of docosahexanoic acid in preterm infants. Lipids 1999; 34:337–342.
88. Birch EE, Birch DG, Hoffman DR, et al. Dietary essential fatty acid supply and visual acuity devel-opment. Invest Ophthal Vis Sci 1992; 33:3242–3253.
89. Uauy R, Birch DG, Birch EE ,Tyson JE, Hoffman DR. Effect of dietary omega 3 fatty acids onretinal function of very low birth weight neonates. Pediatr Res 1990; 28:485–492.
90. Uauy R, Hoffman D, Birch EE, et al. Safety and efficacy of omega-3 fatty acids in nutrition ofVLBW infants: soy oil and marine oil supplementation of formula. J Pediatr 1994; 124:612–620.
91. Faldella G, Govoni M, Alessandroni R, et al. Visual evoked potentials and dietary long chain polyun-saturated fatty acids in preterm infants. Arch Dis Child 1996; 75:F108–F112.
92. Carlson SE, Cooke RJ, Rhodes PG, et al. Long-term feeding of formulas high in linolenicacid and marine oil to very low birth weight infants: phospholipid fatty acids. Pediatr Res1991;30:404–441.
93. Carlson SE, Werkman SH, Rhodes PG, Tolley EA. Visual-acuity development in healthy preterminfants: effect of marine-oil supplementation. Am J Clin Nutr 1993; 58:35–42.
94. Carlson SE, Werkman SH, Peeples JM, et al. Arachidonic acid status correlates with first yeargrowth in preterm infants. PNAS USA 1993; 90:1073–1077.
95. Carlson SE, Werkman SH, Tolley EA. Effect of long chain n-3 fatty acid supplementation on visualacuity and growth of preterm infants with and without bronchopulmonary dysplasia. Am J Clin Nutr1996; 63:687–697.
96. Carlson SE, Werkman SH. A randomized trial of visual attention of preterm infants fed docosa-hexanoic acid until two months. Lipids 1996; 31:85–91.
97. Werkman SH, Carlson SE. A randomized trial of visual attention of preterm infants fed docosa-hexanoic acid until nine months. Lipids 1996; 31:91–97.
98. O’Connor D, Adamkin D, Auestad N, et al. Growth and development in preterm infants fed long-chain polyunsaturated fatty acids: A prospective randomized control trial. Pediatrics 2001; 108:359–371.
99. Makrides M, Neumann MA, Byard RW, Simmer K, Gibson RA. Fatty acid composition of brain,retina, and erythrocytes in breast- and formula-fed infants. Am J Clin Nutr 1994; 60:189–194.

686 Part VII / Optimal Pregnancy/Infancy Outcomes
100. Makrides M, Neumann M, Simmer K, Pater J, Gibson R. Are long-chain polyunsaturated fatty acidsessential nutrients in infancy? Lancet 1995; 345:1463-1468.
101. Innis SM, Nelson CM,Rioux MF, King J. Development of visual acuity in relation to plasma and ery-throcyte n-6 and n-3 fatty acids in healthy term gestation infants Am J Clin Nutr 1994; 60:347–352.
102. Innis S, Nelson C, Lwanga D, et al. Feeding formula without arachidonic acid and docosahexaenoicacid has no effect on preferential looking acuity or recognition memory in healthy full- term infantsat 9 months of age. Am J Clin Nutr 1996;64:40–46.
103. Innis SM, Akrabawi S, Diersen Schade D, et al. Visual acuity and blood lipids in term infants fedhuman milk or formulae. Lipids 1997; 32:63–72.
104. Auestad N, Montaldo M, Hall R, et al. Visual acuity, erythrocyte fatty acid composition, and growthin term infants fed formulas with long chain polyunsaturated fatty acid for one year. Pediatr Res1997; 41:1–10.
105. Jensen C, Prager T, Fraley J, et al. Functional effects of dietary linoleic/linolenic acid ratio in terminfants. J Pediatr 1997; 130:200–204.
106. Horby Jorgensen M, Holmer G, Lund P, Hernell O, Fleisher K. Effect of formula supplemented withdocosahexaenoic acid and gamma-linolenic acid on fatty acid status and visual acuity in term infants.J Pediatr Gastroenter Nutr 1998; 26:412–421.
107. Agostini C, Trojan S, Bellu R, Riva E, Giovannini M.Neurodevelpmental quotient of healthy terminfants at 4 months and feeding practice: the role of long chain polyunsaturated fatty acids. PediatrRes 1995; 38:262–266.
108. Agostini C, Riva E, Trojan S, Bellu R, Giovannini M. Docosahexaenoic acid status and developmentquotient of healthy term infants. Lancet 1995; 346:868.
109. Agostini C, Trojan S, Bellu R, Riva E, Bruzzese MG, Giovannini M. Developmental quotient at24 months and fatty acid composition of diet in early infancy: a follow up study. Arch Dis Child1997; 76:421–424.
110. Janowsky JS, Scott DT, Wheeler RE, Auestad N. Fatty acids affect early language development. PedResearch 1995; 37:310A.
111. Scott DT, Janowsky JS , Hall RT, et al. Cognitive and language assessment of 3,25 yr old childrenfed formula with or without LCPUFA in the first year of life. Ped Res 1997; 41:240A.
112. Willatts P, Forsyth JS, DiModugno MK, Vaarma S, Colvin M. Influence of long chain polyunsatu-rated fatty acids in infant formula on problem solving at 10 months of age. Lancet 1998; 352:688–691.
113. Innis SM, Gilley J, Werker J. Are human milk long-chain polyunsaturated fatty acids related to visualand neural development in breast-fed term infants? J Pediatr 2001; 139:532–538.
114. Birch E, Birch D, Hoffman D, Hale L, Uauy R. Breast-feeding and optimal visual development.J Pediatr Ophthalmol Strabismus 1993; 30:33–38.
115. Hoeffer C, Hardy MC. Later development of breast fed and artificially fed infants. JAMA 1929;92:615–620.
116. Rodgers B. Feeding in infancy and later ability and attainment; a longitudinal study. Dev Med ChildNeurol 1978; 20:421–426.
117. Fergusson DM, Beautrais AL, Silva PA. Breast feeding and cognitive development in the first sevenyears of life. Soc Sci Med 1982; 16:1705–1708.
118. Taylor B, Wadsworth J. Breast feeding and child development at five years. Dev Med Child Neurol1984; 26:73–80.
119. Lanting CI, Fidler V, Huisman M, Touwen BCL, Boersma ER. Neurological differences between9-year-old children fed breast-milk or formula-milk as babies. Lancet 1994, 344:1319–1322.
120. Rogan JM, Gladen BC. Breast feed the first seven years of life. Soc Sci Med 1982;16:17.121. Morrow-Tlucak M,HaudeRH, Enhart CB. Breastfeeding and cognitive development in the first two
years of life. Soc Sci Med 1988; 26:635–639.122. Temboury MC, Otero A, Polanco I, Arribas E. Influence of breast-feeding on the infant’s intellectual
development. J Pediatr Gastroenterol Nutr 1994; 18:32–36.123. Jacobson SW, Jacobson JL. Breast feeding and intelligence. Lancet 1992; 339:926.124. Florey CV, Leech AM, Blackhall A. Infant feeding and mental and motor development at 18 months
of age in first born singletons. Int J Epidemiol 1995; 24:s21–s26.125. Jacobson SW, Chiodo LM, Jacobson JL. Breastfeeding effects on intelligence quotient in 4 and 11
years old children. Pediatrics 1999; 103:e71.126. Birch EE, Hoffman DR, Uauy R, Birch DG, Prestidge C. Visual acuity and the essentiality of docosa-
hexaenoic acid and arachidonic acid in the diet of term infants. Pediatr Res 1998; 44:201–209.

Chapter 26 / PUFAs and Neurodevelopment 687
127. Birch EE, Garfield S, Hoffman DR, Uauy R, Birch DG. A randomized controlled trial of earlydietary supply of long-chain polyunsaturated fatty acids and mental development in term infants.Dev Med Child Neurol 2000; 42:174–181.
128. Makrides M, Neumann MA, Simmer K, Gibson RA. A critical appraisal of the role of dietary long-chain polyunsaturated fatty acids on neural indices of term infants: a randomized, controlled trial.Pediatrics 2000; 105:32–38.
129. Lucas A, Stafford M, Morley R, et al. Efficacy and safety of long-chain polyunsaturated fatty acidsupplementation of infant-formula milk: a randomised trial. Lancet 1999; 354:1948–1954.
130. Auestad N, Halter R, Hall RT, et al. Growth and development in term infants fed long-chain polyun-saturated fatty acids: a double-masked, randomized, parallel, prospective, multivariate study.Pediatrics 2001; 108:372–381.
131. SanGiovanni JP, Berkey CS, Dwyer JT, Colditz GA. Dietary essential fatty acids, long-chain polyun-saturated fatty acids, and visual resolution acuity in healthy fullterm infants: a systematic review.Early Hum Dev 2000; 57:165–188.
132. SanGiovanni JP, Parra-Cabrera S, Colditz GA, Berkey CS, Dwyer JT. Meta-analysis of dietaryessential fatty acids and long-chain polyunsaturated fatty acids as they relate to visual resolution acu-ity in healthy preterm infants. Pediatrics 2000; 105:1292–1298.
133. Uauy R, Hoffman D, Mena P, Llanos A, Birch E. Term infants studies of DHA and ARA suplemen-tation on neurodevelopment: results of randomized controlled trials. J Pediatr 2003; 143:S17–S25.
134. Agostoni C, Verduci E, Massetto N, Radaelli G, Riva E, Giovannini M. Plasma long-chain polyun-saturated fatty acids and neurodevelopment through the first 12 months of life in phenylketonuria.Dev Med Child Neurol 2003; 45:257–261.
135. Martinez M, Vasquez E, García Silva MT, et al. Therapeutic effects of docosahexanoic acid ethylester in patiens with generalized peroxisomal disorders . Am J Clin Nutr 2000; 7:376S–385S.
136. Martinez M, Vazquez E. MRI evidence that docosahexanoic acid ethyl ester improves myeliniationin generalized peroxisomal disorders. Neurology 1998; 51:26–32.
137. Birch E, Hoffman D, Castañeda Y, Fawcett S, Birch D, Uauy RD. A randomized controlled trial oflong chain polyunsaturated fatty acid supplementation of formula in term infants following weaningat 6 weeks of age. Am J Clin Nutr 2002; 75:570–580.
138. Uauy R, Castillo C. Lipid requirements of infants: implications for nutrient composition of fortifiedcomplementary foods. J Nutr 2003; 133: 2962S–2972S.
139. Hoffman DR, Birch EE, Castaneda YS, et al. Visual function in breast-fed term infants weaned toformula with or without long-chain polyunsaturates at 4 to 6 months: a randomized clinical trial.J Pediatr 2003; 142:669–677.


From: Preventive Nutrition: The Comprehensive Guide for Health Professionals, Third EditionEdited by: A. Bendich and R. J. Deckelbaum © Humana Press Inc., Totowa, NJ
689
27 Micronutrient Deficienciesand Maternal ThinnessFirst Chain in the Sequence of Nutritionaland Health Events in Economic Crises
Martin W. Bloem, Saskia de Pee,and Ian Darnton-Hill
KEY POINTS
● There is an important and potentially severe health and nutrition impact resulting fromeconomic crises that are erupting around the globe, which are especially affecting thequality of diets.
● Such impacts can cause a disadvantage for the neuro-intellectual and physical develop-ment of an entire generation.
● Surveillance of changes in micronutrient status offers a sensitive means of trackinghealth and nutrition crises.
● Tracking mothers’ body mass index measurements at a population level reflects changesin food consumption better than measurements of changes in underweight children.
● Childhood anemia levels (reflecting iron deficiency) and maternal night blindness(reflecting vitamin A deficiency) are sensitive indicators of a change in intake ofmicronutrient-rich, more expensive foods.
1. INTRODUCTION
The scale of crises affecting populations has moved from the local level, inhunter–gatherer societies, to subcontinental epidemics and famines (e.g., the “BlackDeath” in medieval Europe), to world wars. These were clear disasters for thoseinvolved, both individuals and nations, and this has been reflected in high mortalitylevels and, usually, malnutrition. In the latter half of the 20th century, these crises haveoften become more subtle, such as those caused by differing political and economicsystems. It is now well-recognized that political restructurings in the early 1980s hadmeasurable impacts on malnutrition levels and national health, particularly among those

690 Part VII / Optimal Pregnancy/Infancy Outcomes
most vulnerable (1). However, the most recent national economic crises are again dif-ferent and have devastated the economies and social structures of several Asian soci-eties and countries such as Argentina and the Russian Federation, with repercussionsfelt throughout an increasingly globalized world. This chapter shows that these crises notonly result in an immediate impact in these countries but can also result in a “lost gen-eration” in countries such as Indonesia. Furthermore, using the Indonesian example, thischapter shows that such crises are often best characterized and tracked by using micronu-trient and maternal malnutrition, rather than childhood malnutrition, as indicators. Weillustrate that these types of crises are felt more strongly among the urban poor thanamong the rural population. Finally, we discuss the global significance of these findings.
2. POVERTY AND DEVELOPMENT
The second half of the 20th century has been called the “era of development” (2).This era of development coincided with the “era of the Cold War.” The two superpow-ers (the United States, which championed Capitalism, and the USSR which championedState-led Socialism) competed for influence among the newly independent, ex-colonies.Throughout this period, development was mainly applied to one part of the world: theso-called “Third World.” In the early 1970s, the Third World developed a nonalignedphilosophy based on three basic principles: peaceful co-existence, anti-colonialism andthe struggle for economic independence. However, political polarization and economicdifferentiation in the following years largely destroyed these alliances.
In the 1980s, neoliberalism became the dominant philosophy in (economic) devel-opment, and these divisions became even more prominent. During that decade, marketsin Latin America were not functioning well, their gross national product declined for3 yr consecutively, and budget deficits and inflation were very high (3). In 1989, JohnWilliamson coined the term “Washington Consensus” to refer to a set of economic policyprescriptions to Latin American countries, which had emerged by consensus among theUS politicians, technocrats of the International Monetary Fund (IMF) and World Bank(4–6). In Williamson’s original paper, he summarized this advice in 10 propositions: fis-cal discipline; a redirection of public expenditure priorities toward fields offering bothhigh economic returns and the potential to improve income distribution, such as primaryhealth care, primary education, and infrastructure; tax reform; interest rate liberaliza-tion; a competitive exchange rate; trade liberalization; liberalization of inflow of for-eign direct investment; privatization; deregulation; and secure property rights. Thesepropositions were a reflection of the fact that many economists had become convincedthat the key to rapid economic development lay not in a country’s natural resources oreven in its physical or human capital but, rather, in the economic policies that it pur-sued. Therefore, the Washington Consensus places economic growth as a predominantpart of of its strategy, arguing that it typically promotes human development. The timingof the Washington Consensus coincided with the collapse of the Soviet system and itsideological apparatus.
In 1996, Lester Thurow, a professor of economics and former Dean of MIT’s SloanSchool of Management wrote about “the future of capitalism.” In the summer of 1994,Mexico was the “star pupil” in its pursuit of neoliberal reforms; the budget was balanced,more than 1000 State-owned companies had been privatized, government regulationshad been slashed, and tariffs and quotas were dramatically reduced. Private capital was

Chapter 27 / Maternal Thinness 691
pouring in. However, by April 1995, Mexico’s economy had collapsed; the average pur-chasing power had declined by 30%, and 500,000 Mexicans had lost their jobs. Mexicohad implemented all the policies that economists had recommended, as had Argentinamore recently. Clearly, the nature of economic crises was changing.
Thurow borrowed two concepts from the physical sciences: the punctuated equilib-rium theory of evolution from biology and plate tectonics from geology. Punctuatedequilibrium is the phenomenon in which the dominant species dies out rapidly as theenvironment suddenly changes. An analogy for this theory might include the economicera of agriculture, which existed for thousands of years and was then replaced by theIndustrial Revolution within 100 yr.
Earthquakes and volcanic explosions are a result of the invisible movement of thecontinental plates beneath the surface of the earth. In his book, Thurow recognized fiveeconomic “plates”: the end of communism; a technological shift to an era dominated byman-made brainpower industries; a demographic never seen before; a truly global econ-omy; and an era in which there is no dominant economic, political, or military power.Recent events and the current militarism and status of the United States as the oneglobal superpower demonstrate that this presumption, at least, was premature.Nevertheless, he concluded that as the “Second World” collapsed, the Third World hadsplintered. Within it, there were clear winners (the little tigers of Hong Kong,Singapore, Taiwan, and South Korea), potential winners (Thailand and Malaysia), thoserapidly integrating with global Capitalism (China), and the losers (most African coun-tries). The Third World was said to be gone just as the Second World was gone (7).
One year later, in 1997, the Asian economic crisis began. Not only had the predictedeconomic instability happened earlier than predicted, it also hit hardest among the so-called “clear winners.” In the three decades before 1997, the economic development andthe reduction of poverty in east Asia was greater than in any other region. However, theregion had been successful despite the fact that the countries had not followed most of thedictates of the Washington Consensus. Macro-economic stability, one of the key elementsof the success of the east Asian miracle, was brought about by the important role that thegovernment played in east Asia’s economies (8). Many observers were surprised thatwhen the Asian economic crisis broke out, the IMF was very critical of the east Asiancountries because, not long before, the IMF had forecast strong growth for the region (9).
As expected, the IMF recommended a tight monetary policy, stringent fiscal policy,and structural and banking reforms in exchange for multibillion dollar bailout schemes.Not only were these prescriptions relatively unsuccessful in the short-term, the effectson health (as measured by the impact on malnutrition, among other human factors)were—and, to some extent, continued to be—seriously underestimated (10). As the eco-nomic recession spread to other countries of Asia and adjoining regions, fear of a muchlarger meltdown continued in eastern Europe and Latin America. Even the United Statescurrently carries the greatest financial deficit ever seen globally. It is important thatlessons be learned from these events, not only from the political and economic pointsof view but also regarding how to predict, judge, and track their effects on the health,nutrition, and potential development of populations.
The work of Amartya Sen in the 1980s significantly advanced the notion that humanand social development are key aspects in the overall development of nations. Theseideas led to the relatively new measure known as the Human Development Index, whichwas developed by the United Nations Development Programme to describe social

692 Part VII / Optimal Pregnancy/Infancy Outcomes692 Part VII / Optimal Pregnancy/Infancy Outcomes
development indicators of countries. A further sign of increasing distrust in theWashington Consensus and its relatively little regard for human capital was demonstratedin the criticism leveled by Joseph Stiglitz regarding the Washington Consensus-basedapproach of the IMF and its heavy emphasis on painful economic growth policies,which came at the expense of immediate human and social welfare needs in the face ofthe Asian economic crisis.
In light of Sen’s human development paradigm and Stiglitz’s technical critique ofIMF policies, it is important to determine whether there is hard data to support the ideathat human and/or social needs are disrupted by the introduction of stringent economicgrowth-focused policies and how that possible disruption affects the overall developmentof an affected country. As demonstrated in Asia, very large numbers of people in coun-tries affected by economic crisis have (or will have) less purchasing power. What willbe the impact on the health and nutritional status of these segments of the population?Furthermore, how would an impact on health and nutritional status among these countries’human resources affect its future development?
3. MICRONUTRIENT DEFICIENCIES, HUMAN CAPITAL,AND LOST GENERATION
It is clear from the previous section that there are a growing number of economistswho believe that the economic development and well-being of the populations of lessdeveloped countries partly depend on their human capital, which includes the level ofeducation received. For several decades, it has been known that micronutrient deficiencies(such as vitamin A deficiency, iodine deficiency, and iron deficiency) are associatedwith poverty and that these deficiencies have had major effects on populations all overthe world, including premature death, poor health, blindness, stunting, mental retardation,learning disabilities, and low work capacity (11,12).
Iron deficiency is one of the most common micronutrient deficiencies in the world. Thehuman body needs iron to produce hemoglobin, the protein in red blood cells responsiblefor carrying oxygen. Iron is also a component of many enzymes that are essential for theadequate functioning of brain, muscle, and immune system cells (13). Iron deficiency isstrongly correlated with poverty, because the main sources of bioavailable iron are animalproducts, which are relatively more expensive than nonanimal food products.
The economic cost of iron deficiency has only recently been recognized. A review byHorton and Ross (14) analyzed the economic cost of iron deficiency anemia (IDA)based on two outcomes. The first outcome is the lower future productivity of childrenwith IDA (based on studies that show long-term reduced cognitive development resultingfrom IDA among children below age 2 yr). The second outcome is the immediate-termeffect of lower productivity among adults who are anemic.
3.1. Lower Future Productivity of Iron-Deficient Children (Lost Generation)Although the relationships are complex, there is ample scientific evidence to show that
IDA is associated with impaired performance in a range of cognitive and physical coordi-nation functions in children of different age groups (15). These functions include mentaldevelopment, motor coordination development, cognitive (awareness and judgment) abili-ties, social and emotional development, and school achievement. Evidence from animalstudies also indicates that the behavioral and developmental effects of IDA may not be aseasy to correct in infants, compared with preschool or school-aged children and adolescents.

Chapter 27 / Maternal Thinness 693
Grantham-McGregor and Ani (16) concluded that, although the causal relationship was stilluncertain, longitudinal studies indicated that children who were anemic in infancy continuedto have poor cognitive and motor development and school performance into middle child-hood. Observational studies found similar results among older children, but treatment studieswith iron were more effective in this age group.
Another important consequence of iron deficiency is an apparent increased risk oflead poisoning in children. Children who are iron deficient have a greater susceptibilityto toxicity from heavy metals, including lead (17). Lead is very toxic during the fetalstage of life as well as during early childhood and causes long-term damage to the nervoussystem (18–20). In urban areas in developing countries, the poor are exposed to highlevels of lead from chipped lead paints, pollution from automobile fumes, or otherexcessive exposure to lead in the environment.
3.2. Lower Current Productivity of AdultsStudies have shown that although the cardiovascular and metabolic effects of mild
IDA are limited at rest, these effects are quite dramatic during strenuous exercise (21).After treatment with iron, work capacity rapidly returns to normal, and several inter-vention trials have shown that iron supplementation increased work output among roadworkers, rubber tappers, tea pickers, and industrial workers (22).
The economies of countries in southeast Asia depend more on industries, such asagriculture, manufacturing, and construction, in which physical labor is a crucial com-ponent; iron deficiency can exert a strong negative influence in the productivity of theseindustries and the country’s economy. As urbanization increases, the service and knowl-edge industries will be increasingly more important for these economies in the next 10 yr,and the need for a more educated labor force will also increase.
In light of this, it is understandable that health and nutrition experts, including thoseof the World Bank, have attempted to address economists regarding the need formicronutrient interventions in both children and adults to support the economic devel-opment in these countries (23).
4. THE INDONESIAN CRISIS
Indonesia is the world’s fourth most populous country, with an estimated populationof 231 million in 2002. It is a geographically vast country that extends for more than4800 km from west to east and 2000 km from north to south and is located between theAsian mainland and Australia. It has a highly diverse archipelagic structure consistingof some 17,000 islands, of which 6000 are inhabited. Approximately 55% of Indonesia’stotal population lives in Java, the most densely populated region. Java is divided intosix provinces: Banten, West Java, Central Java, Yogyakarta, East Java, and the capital—Jakarta.
The country is endowed with substantial agricultural potential; thus, agriculture,including forestry and fisheries, is the most important sector of the economy in terms ofemployment. Additionally, there is a vast range of mineral resources, including oil.Since the mid-1980s, the manufacturing sector has dramatically expanded, and in 1996its share in gross domestic product (GDP) exceeded that of agriculture.
In the past 30 yr, Indonesia has been frequently hailed as a leading economic successstory. For the decade since 1987, real GDP growth averaged more than 7% per year. In 1996,

694 Part VII / Optimal Pregnancy/Infancy Outcomes694 Part VII / Optimal Pregnancy/Infancy Outcomes
GDP per capita surpassed $1000, compared with $70 in 1965. The rupiah was stable.Annual inflation was reported in single digits, and foreign capital was pouring in. As aresult, the prevalence of poverty, measured against the official poverty line, declined fromabout 40% in 1976 to 11.3% in 1996—a remarkable decline given that the populationincreased from 120 million to 195 million. Over the same period, the infant mortalityrate declined from an estimated 145 to 52 infant deaths per thousand live births, and themortality rate for children younger than age 5 yr declined from approx 217 to 75 per1000. Indonesia was one of the first developing countries to identify that its high levelsof severe vitamin A deficiency constituted a serious public health problem. Over the last30 yr, the country has come a long way in reducing the levels of severe vitamin A defi-ciency, and prior to the crisis, Indonesia, with the exception of three provinces, no longerconsidered vitamin A deficiency a public health problem (24).
However, in 1997, Indonesia experienced a severe drought (El Nino), low world oilprices, regional financial instability, domestic social unrest, and, ultimately, a change ofgovernment.
The El Nino-induced drought was a remarkable drought because it had two distinctpeaks and was extremely severe. It began between February and April 1997 and reachedits first peak in July and August. This coincided with large-scale forest fires in Sumatraand Kalimantan. However, only the magnitude (not the origin) of these fires can beblamed on El Nino. Plantation operators, transmigration contractors, timber conces-sionaries, and, to a smaller extent, small farmers were responsible for land clearingactivities using fire. Some 500,000 hectares were affected by the drought, of which85,000 hectares experienced severe crop losses. In late 1997, the El Nino phenomenonbegan to develop toward a second peak and continued its increase until March 1998.Total rice production in 1997 fell by 4%, but some provinces in the country registeredsharper declines.
By the end of 1996, the macro-economic conditions of Thailand appeared to be veryshaky, with large external deficits, increasing short-term foreign indebtedness, and thefragile financial conditions of corporate firms and finance companies that had borrowedheavily abroad to finance the speculative boom in real estate and equity investments. Atthe end of 1996, the Thai Baht had already come under attack. In the beginning,Indonesia was an unaffected bystander to the crisis in Thailand. However, in August1997, the Indonesian rupiah began to come under pressure and rapidly depreciated inthe following months. The Indonesian rupiah, which was trading 2450 to the US dollarin July 1997, plunged to a low of 17,000 in January 1998 before strengthening to around8000 in October 1998. Although the United States was in a strong cyclical upswing dur-ing the Mexican crisis and was able to help Mexico, the weakness of Japan’s economyin 1997 exacerbated the Asian crisis and worsened the unfolding of the currency crisis.For many businesses, exchange rate volatility made planning almost impossible. Annualinflation ran at an estimated 80%. Foreign capital fled, closing off access to new foreignlending. Between 1992 and July 1997, about 85% of the increase in external debt wasa result of borrowing in the private sector. This mostly resulted from the continuous eco-nomic growth that attracted private foreign resources. With the increasingly unfavorableexchange rates, businesses were struggling to service existing foreign debts.
As soon as it was called upon, the IMF quickly moved to help Indonesia formulatereform programs aimed at tackling the roots of its problems and restoring investor con-fidence. The Indonesian government signed its first letter of intent to the IMF on

Chapter 27 / Maternal Thinness 695
October 31, 1997. However, the economic situation only worsened, and Indonesia’sagreement with the IMF was revised several times during the following months. In May1998, after fuel prices increased and protesting students were shot, riots and lootingswept across Jakarta and other cities, leading to the resignation of President Soehartoon May 21 and his replacement by his vice president, B. J. Habibie.
5. HELEN KELLER INTERNATIONAL NUTRITIONAL SURVEILLANCE
The impact of macro-economic adjustment programs and economic crises on foodsecurity and the nutritional status of the poor is not well-documented (25). Helen KellerInternational had extensive experience in establishing natural disaster impact assess-ment in Bangladesh (26), and in December 1995, Helen Keller International was giventhe unique opportunity to set up a nutritional surveillance system in the Central JavaProvince. Data were collected every 3 mo thereafter, for the duration of 1 yr (untilJanuary 1997) (27,28). The purpose of that surveillance system was to assess the impactof a large-scale social marketing program that promoted the consumption of vitamin A-richfoods (28). As a response to the crisis, the surveillance system was revived in June 1998,and expanded to seven more provinces: Jakarta, West Java, East Java (including a specialfocus on the poor in its capital, Surabaya), West Nusa Tenggara (specifically, the island ofLombok), South Sulawesi (including a specific focus on the poor in its capital, Makassar),West Sumatra, and Lampung. The data presented in this chapter were collected betweenJune 1996 and September 2003.
6. CONCEPTUAL FRAMEWORK FOR CAUSES OF MALNUTRITION
In the 1990s, the United Nations Children’s Fund (UNICEF) developed a conceptualframework to determine the most likely causes of malnutrition (29). The framework isa very useful concept and consists of the following key elements:
● Nutritional status is identified as an outcome of processes in society.● Malnutrition is a result of immediate, underlying, and basic causes in a hierarchical
manner.● Delivery services (e.g. feeding programs, oral rehydration therapy, vitamin A supple-
mentation, expanded program of immunization, etc.) primarily address the immediatecauses.
● Access to food, adequate care of women and children, and access to basic health servicestogether with a healthy environment, are necessary conditions for nutritional securityand are considered the underlying factors. The inadequate access to food may result inshortages of both macro- (carbohydrates, protein, and fat) and micronutrients (vitaminsand minerals).
● The basic causes are defined by the economic, political, and ideological superstructure.
We have modified the UNICEF conceptual framework to include factors that affecta country’s political and ideological superstructure (see Fig. 1) but that may be outsidethe direct control of the country’s government and other national agencies. Here, wewill use the conceptual framework to understand how the coping strategies of theIndonesian population work, to examine how food price policies affect malnutri-tion, and to hypothesize and assess which indicators of nutritional status are the mostcrisis-sensitive.

696 Part VII / Optimal Pregnancy/Infancy Outcomes696 Part VII / Optimal Pregnancy/Infancy Outcomes
6.1. Basic CausesConsidering Indonesia’s situation since mid-1997, the so-called “basic causes” of the
increase in malnutrition were the El Nino drought and the Asian economic crisis.Although the two phenomena are distinct, both had the same effect—namely, a decreasein the real income of many groups of the population. The prices of most food items dra-matically increased in the period between January and July 1998, and the inflation ratewas 78% in 1998. The economic crisis had serious, adverse social impacts. Urban areaswere hit hardest, mainly as a result of massive contraction in the manufacturing andconstruction sectors in particular. In Jakarta, one of every three workers was unem-ployed in 1998, and nationwide unemployment reached 20% (30). The high inflationand increased unemployment rates resulted in a sharp decline in real earnings and the
Fig. 1. Conceptual framework of immediate, underlying. and basic causes of malnutrition.(Modified from ref. 29.)

Chapter 27 / Maternal Thinness 697
consequent rise in the prevalence of poverty. The proportion of households without anysavings increased from approx 60% in June 1998 to nearly 80% in September 1998(31). Although proportionally the poor were more affected than the middle class, the crisisaffected all socioeconomic strata.
A World Bank report also indicated an increase in the prevalence of poverty (10). TheWorld Bank reported that the social impacts were very unequally distributed acrosssectors and regions. The manufacturing and construction sectors located in the urbanand peri-urban areas were hit hardest. Among the regions, Java was most affected.
6.2. Underlying CausesAs mentioned previously, inadequate access to food, inadequate care for mothers and
children, and insufficient health services and unhealthy environments are the underly-ing causes of malnutrition.
What was the impact of increased poverty (reported earlier) on access to food?Although rice prices increased considerably, rice consumption did not change. Also, thepoorer households consumed more rice per capita than households of higher socioeco-nomic status. This implies that the absolute as well as relative expenditure on riceincreased.
What happened to the consumption of the more expensive food items, such as ani-mal products? In 1996, the government of Indonesia, in close collaboration with HelenKeller International and UNICEF, carried out a social marketing campaign to promotethe consumption of eggs as an important food source for vitamin A. Based on formativeresearch, these groups determined that eggs were the most affordable animal source ofmicronutrients in Central Java. The program was very successful, indicated by the factthat serum retinol levels, an indicator of vitamin A status, increased as a result of thecampaign (28). However, a comparison of the data collected in Central Java before andafter the start of the crisis showed that egg consumption decreased as a result of thecrisis and that this occurred for all socioeconomic strata (31).
The economic crisis resulted in a decrease in the real income of large segments of thesociety, and, as a result, these segments were forced to increase their expenditure onfood as a percentage of their total expenditure. Although the expenditure on staple foodsincreased because of unchanged consumption but an increased price, expenditure onmore expensive foods, such as animal products, declined.
Data from the Bangladesh Nutritional Surveillance Program of Helen KellerInternational and the Institute of Public Health and Nutrition showed a very clear relation-ship between changes of the price of staple food and nutritional status and showed that thiswas not related to the consumption of the staple food itself but, rather, to the concurrentexpenditure on nonstaple foods (32). Figure 2 illustrates how the changes of proportion ofunderweight children between 1992 and 2000 very closely followed the fluctuation inexpenditure on rice. Although rice consumption did not change, a decrease in the price ofrice meant that less money was spent to consume the same amount of rice and, therefore,more money was available for the purchase of other food items. As shown in Fig. 3, whennon-rice food expenditure increased as a consequence of a lower expenditure on rice, theprevalence of malnourishment decreased. Although malnourishment in children youngerthan age 5 yr was a very good indicator for change of nutritional status in response tochanges of the price of rice in Bangladesh between 1992 and 2000, the issue dealt withwhether it would be as sensitive for assessing the impact of the crisis in Indonesia.

698 Part VII / Optimal Pregnancy/Infancy Outcomes698 Part VII / Optimal Pregnancy/Infancy Outcomes
The type of impact that the Indonesian crisis had on the other underlying causes (inad-equate care, insufficient health services, and unhealthy environments) is still unclear.Regarding health care services, the vitamin A capsule distribution program, for childrenunger age 5 yr, is a program that has been in place since the early 1970s. The capsule dis-tribution (as evaluated between June 1998 and January 1999 and compared to 1996)showed only a slight decline in its coverage. Access to health care services that requirepayment may have declined somewhat more as a result of the reduction of purchasing powerand limited availability of safety-net programs, particularly in urban areas. Caring practicesmay have suffered less, because knowledge is not affected by a crisis, and time available forchild care was not likely to have been reduced much because of the increased lack ofemployment opportunities. Environmental hygiene was also less likely to deterioratemuch, because there was no disaster or total disruption of public services. Therefore, itappears that of the underlying causes of malnutrition, the Indonesian crisis mostlyaffected access to food, primarily resulting in reduced dietary intake.
6.3. Immediate CausesOf the two immediate causes of malnutrition, dietary intake and morbidity,
Indonesia’s crisis primarily affected dietary intake through the reduced access to food.Morbidity could have increased as a result of the reduction of quality and quantity ofthe diet and/or from a possible reduced access to health care services. However, themain impact of the economic crisis was on purchasing power, which largely affectedaccess to food and, therefore, reduced quality and quantity of the diet.
Fig. 2. The percentage of underweight children (Z-score weight-for-age <−2 SDs) ages6 to 59 mo and the weekly expenditure on rice per capita in US dollars in ruralBangladesh during the month of June 1992 to 2000. Values for underweight are per-centage ± 95% confidence interval, and values for expenditure on rice are means ± 95%confidence interval (r = 0.91; p = 0.001; n = 9). (Reprinted with permission from ref 32.© 2003 American Society for Nutritional Sciences.)

Chapter 27 / Maternal Thinness 699
7. INDICATORS OF CHANGES OF MALNUTRITION RESULTINGFROM THE CRISIS
The UNICEF conceptual framework can also be used to hypothesize about the mostcrisis-sensitive indicators of a change of nutritional status. As explained earlier, the greatesteffect of the crisis was a drop in the real income of the population, resulting from theincrease in prices of several commodities and from increase in unemployment. Furthermore,the IMF program included measures to reduce government spending on food subsidies andother social programs (see bottom part of conceptual framework shown in Fig. 1). The urbanpopulation in Indonesia was mainly dependent on the market as the main source of food.Affordable prices of food and the ability to earn a cash income are generally crucial to theachievement of food security in urban areas (33). However, the prices of these food itemsbecame two to three times more expensive, and the urban poor hardly had any coping mech-anisms for acquiring food in another way. Furthermore, despite the fact that this finding wasrecognized in September 1998, the safety-net programs of the government mainly focusedon the rural areas. Therefore, the impact of the crisis on access to food was larger in theurban than the rural population, and largest among the urban poor. The NSS data of theurban areas were collected from households in the poorest neighborhoods and slums. Mostof the people living in these areas had jobs in the construction industry, which was one ofthe first sectors that collapsed as a result of the economic crisis. The following sectionsexamine the impact of the crisis on the nutritional status of the urban poor of Jakarta.
The diagrams shown in Fig. 4 are derived considerations regarding how reduced pur-chasing power can affect food intake and how that can affect nutritional status of different
Fig. 3. The percentage of underweight children (Z-score weight-for-age <−2 SDs) ages6 to 59 mo and the percentage of food expenditure spent on non-rice foods in ruralBangladesh during the month of June 1992 to 2000. Values for underweight are per-centage ± 95% confidence interval, and values for expenditure on non-rice foods aremeans ± 95% confidence interval (r = 0.91; p = 0.001; n = 9). (Reprinted with permis-sion from ref 32. © 2003 American Society for Nutritional Sciences.)
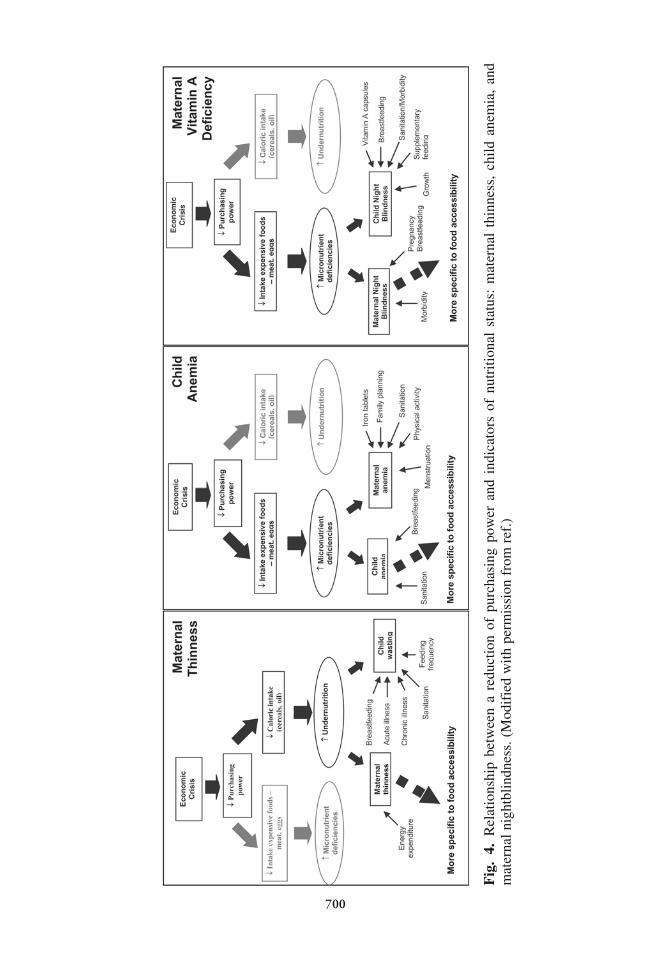
Fig
.4.
Rel
atio
nshi
p be
twee
n a
redu
ctio
n of
pur
chas
ing
pow
er a
nd i
ndic
ator
s of
nut
ritio
nal
stat
us:
mat
erna
l th
inne
ss,
child
ane
mia
, an
dm
ater
nal n
ight
blin
dnes
s. (
Mod
ifie
d w
ith p
erm
issi
on f
rom
ref
.)
700
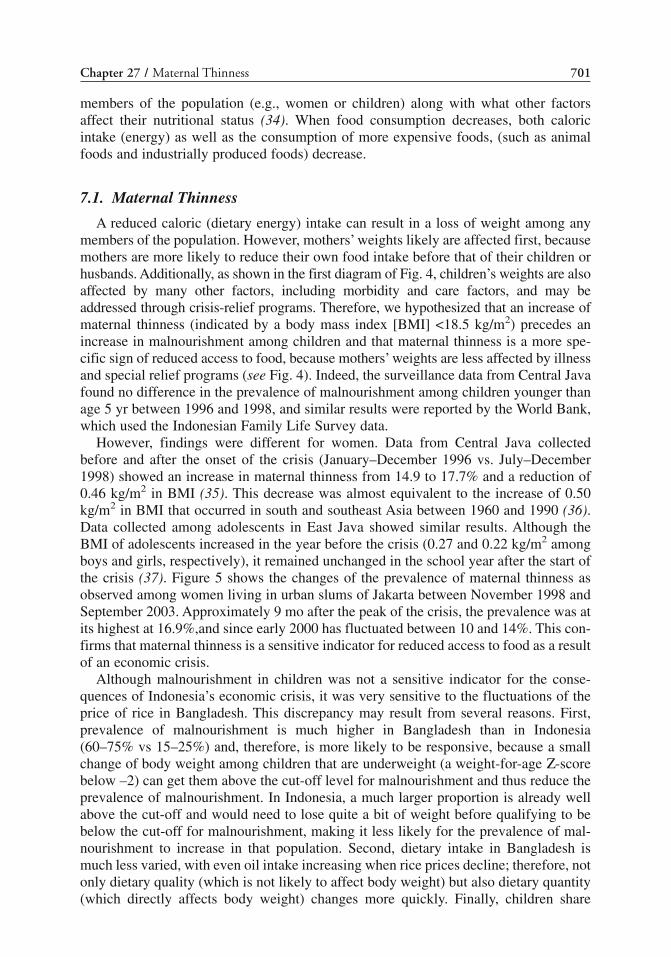
Chapter 27 / Maternal Thinness 701
members of the population (e.g., women or children) along with what other factorsaffect their nutritional status (34). When food consumption decreases, both caloricintake (energy) as well as the consumption of more expensive foods, (such as animalfoods and industrially produced foods) decrease.
7.1. Maternal Thinness
A reduced caloric (dietary energy) intake can result in a loss of weight among anymembers of the population. However, mothers’ weights likely are affected first, becausemothers are more likely to reduce their own food intake before that of their children orhusbands. Additionally, as shown in the first diagram of Fig. 4, children’s weights are alsoaffected by many other factors, including morbidity and care factors, and may beaddressed through crisis-relief programs. Therefore, we hypothesized that an increase ofmaternal thinness (indicated by a body mass index [BMI] <18.5 kg/m2) precedes anincrease in malnourishment among children and that maternal thinness is a more spe-cific sign of reduced access to food, because mothers’ weights are less affected by illnessand special relief programs (see Fig. 4). Indeed, the surveillance data from Central Javafound no difference in the prevalence of malnourishment among children younger thanage 5 yr between 1996 and 1998, and similar results were reported by the World Bank,which used the Indonesian Family Life Survey data.
However, findings were different for women. Data from Central Java collectedbefore and after the onset of the crisis (January–December 1996 vs. July–December1998) showed an increase in maternal thinness from 14.9 to 17.7% and a reduction of0.46 kg/m2 in BMI (35). This decrease was almost equivalent to the increase of 0.50kg/m2 in BMI that occurred in south and southeast Asia between 1960 and 1990 (36).Data collected among adolescents in East Java showed similar results. Although theBMI of adolescents increased in the year before the crisis (0.27 and 0.22 kg/m2 amongboys and girls, respectively), it remained unchanged in the school year after the start ofthe crisis (37). Figure 5 shows the changes of the prevalence of maternal thinness asobserved among women living in urban slums of Jakarta between November 1998 andSeptember 2003. Approximately 9 mo after the peak of the crisis, the prevalence was atits highest at 16.9%,and since early 2000 has fluctuated between 10 and 14%. This con-firms that maternal thinness is a sensitive indicator for reduced access to food as a resultof an economic crisis.
Although malnourishment in children was not a sensitive indicator for the conse-quences of Indonesia’s economic crisis, it was very sensitive to the fluctuations of theprice of rice in Bangladesh. This discrepancy may result from several reasons. First,prevalence of malnourishment is much higher in Bangladesh than in Indonesia(60–75% vs 15–25%) and, therefore, is more likely to be responsive, because a smallchange of body weight among children that are underweight (a weight-for-age Ζ-scorebelow –2) can get them above the cut-off level for malnourishment and thus reduce theprevalence of malnourishment. In Indonesia, a much larger proportion is already wellabove the cut-off and would need to lose quite a bit of weight before qualifying to bebelow the cut-off for malnourishment, making it less likely for the prevalence of mal-nourishment to increase in that population. Second, dietary intake in Bangladesh ismuch less varied, with even oil intake increasing when rice prices decline; therefore, notonly dietary quality (which is not likely to affect body weight) but also dietary quantity(which directly affects body weight) changes more quickly. Finally, children share

702 Part VII / Optimal Pregnancy/Infancy Outcomes702 Part VII / Optimal Pregnancy/Infancy Outcomes
immediately in an improvement of a family’s diet but are less likely to be the first tohave a lower caloric intake when a family has to reduce the quantity of its diet.Therefore, when rice prices decrease and access to food increases, children’s diets alsoimmediately improve. However, in the case of a reduced access to food because of theeconomic crisis, the quality of children’s diets are affected sooner than the quantity, andthe quantity of the diet of other family members is affected before that of the children.
7.2. Micronutrient Deficiencies
It is well-established that without fortification or supplementation, communicationstrategies for dietary behavior change are unlikely to be adequate by themselves ineither treating or preventing IDA (37). Meats (beef, pork, lamb, fowl, etc), fish, andliver, which are rich in heme-iron, are the best sources of iron but are also relativelyexpensive and unaffordable for the poor (38). Similarly, recent research from Indonesiaand Vietnam has shown that plant sources of vitamin A are four to five times less effec-tive in improving vitamin A status than previously believed (39–41). Therefore, animalproducts are essential for improving micronutrient status in poorer populations, espe-cially where the contribution from fortified foods to micronutrient intake is small.Animal products, such as eggs and liver, are rich in micronutrients, including not only ironand vitamin A but also zinc and Β-vitamins.
As mentioned previously, the economic crisis showed a decline in the consumptionof animal products such as eggs, whereas the consumption of the staple foods remained
Fig. 5. Prevalence of maternal thinness (BMI <18.5 kg/m2) among nonpregnant womenin urban slums in Jakarta between November 1998 and March 2003 (n = 45,162). Barsindicate 95% confidence intervals, corrected for design effect.

Chapter 27 / Maternal Thinness 703
the same. Based on these data, an increase of micronutrient deficiencies was expected.We used anemia, which in Indonesia is largely a result of iron deficiency, as a proxy formicronutrient status in general, and we used night blindness, which is the first clinicalsign of vitamin A deficiency, as a proxy for more severe forms of micronutrient defi-ciencies. The second and third diagram boxes in Fig. 4 show that child anemia andmaternal night blindness are likely the most sensitive indicators to a change in intake ofmicronutrient-rich, more expensive foods, because these are not affected much by otherunderlying factors such as performance of health care services, other feeding or caringpractices, varying biological factors, or environmental hygiene.
7.2.1. IRON DEFICIENCY ANEMIA
Although more than 22 countries have adopted public health policies calling for ironsupplementation of infants and preschool children, very few programs exist. Infants bornto mothers with IDA are more likely to have low iron stores. In fact, NSS data showedthat nearly 40% of infants, ages 3 to 5 mo, in Java are already anemic (Hb <100 g/L)even if they had a normal birth weight and that their risk of being anemic is higher whentheir mother is anemic (42). Birth weight is another important determinant of an infant’siron status at the time of birth. Therefore, low-birth-weight infants need iron supple-mentation from age 2 mo up to at least age 24 mo (43). Although breastfeeding remainskey to the health and nutrition of infants, after 6 mo, even infants with normal iron storeshave used the iron stores they had at birth, and breast milk does not provide the amountneeded as they continue to rapidly grow and develop. Thus, the high prevalence of irondeficiency among infants and young children is largely the result of maternal anemia dur-ing pregnancy and subsequent inadequate dietary intake to meet the relatively high ironrequirements of early childhood. Where children do not widely and regularly consumeiron-fortified complementary foods and iron-rich animal foods, IDA in children ages 6 moto at least 24 mo is virtually certain to be an important public health problem.
There is an array of evidence demonstrating that moderate-to-severe anemia ininfancy has a longlasting impact on mental development, whereas iron deficiency at anyage has adverse effects on cognitive performance and work capacity (14–16,44–48).
As mentioned earlier, there are no programs in Indonesia that address anemia amongyoung children. Also, as mentioned previously regarding the difference of the preva-lence of malnourishment in Bangladesh and in Indonesia, the prevalence of anemia ismuch larger among young children than among mothers and is therefore more respon-sive to changes. Because there are also fewer other factors that impact on their likeli-hood of having anemia as compared to women, child anemia was believed to be a moresensitive indicator of a reduced consumption of micronutrient-rich foods. Figure 6demonstrates that this was indeed the case; the prevalence of anemia in Central Javabefore and after the start of the crisis changed more among young children than amongmothers. The change of the prevalence of anemia among young children in Jakartabetween November 1998 and September 2003 is shown in Fig. 7. At 9 mo after the peakof the crisis, the prevalence of anemia was at its highest and has since declined to about55 to 65%. However, it appeared to have increased again in 2003, which probably indi-cates the continuing effects of the Bali Bombing in October 2002 on the stock marketand the decrease in the influx of foreign currencies as a result of the decline in tourism.
It should be noted that the prevalence of anemia, even at the observed lower levels,is still extremely high and warrants immediate action. In fact, it is recommended that if

704 Part VII / Optimal Pregnancy/Infancy Outcomes704 Part VII / Optimal Pregnancy/Infancy Outcomes
the prevalence of anemia is greater than 40%, all children should be supplemented dailyuntil age 24 mo (44).
Apart from the devastating impact of iron deficiency and anemia on the infant andyoung child, these children also are at higher risk of lead poisoning. Similarly to all othermegacities of the world, Jakarta has a high level of lead pollution, and the data shownare from children that live in the poorest areas of urban Jakarta, close to the roads.Although we have no data regarding the prevalence of lead poisoning, it can be assumedthat the prevalence is very high among these iron-deficient infants and young children.
7.2.2. VITAMIN A DEFICIENCY
Vitamin A is required for the proper maintenance and function of the immune systemand is essential to ensure the integrity of the respiratory and digestive epithelia that pro-tect people from acute infections. Vitamin A supplementation among children reducesthe risk of mortality by 23% (49). A recent study showed that vitamin A supplementationmay also reduce maternal mortality by 40 to 50% (50).
In 1978, Indonesia’s first national vitamin A survey showed that xerophthalmia wasa public health problem, and Indonesia became one of the first developing countries torecognize that its high levels of severe vitamin A deficiency constituted a serious pub-lic health problem. The country then began implementing programs to eliminate the
Fig. 6. Proportion of mothers, infants ages 6 to 11 mo, and children ages 12 to 23 moin Central Java suffering from anemia (using World Health Organization cut-offpoints for hemoglobin levels) before and after the start of the economic crisis. Barsindicate 95% confidence interval corrected for design effect. *p < 0.05, ***p < 0.001(Chi-square test).

Chapter 27 / Maternal Thinness 705
problem, including supplementing young children (ages 12–59 mo) through the existinghealth system. Over the past 30 yr, the country has been considered a major successstory in reducing the level of severe vitamin A deficiency, and prior to the crisis, xeroph-thalmia among children younger than age 5 yr was no longer considered a public healthproblem, although a considerable part of the population still had serum retinol levelsthat were too low (24), which was associated with an increased mortality risk.
Although anemia among young children is a very sensitive indicator for a change ofdietary quality (as mentioned earlier), their vitamin A status is not because of this success-ful distribution of high-dose vitamin A capsules twice per year and a relatively unchangedperformance of this supplementation program during the crisis. For mothers, however, vit-amin A capsule distribution is virtually nonexistent because it is only done within 6 wk afterdelivery and coverage of that program is low (10–30%, unpublished observations fromHelen Keller International). Figure 8 demonstrates that maternal night blindness was at itshighest between November 1998 and February 2000. Those levels were comparable to the2.2% observed among women in rural Bangladesh in 1997 to 1998 (51). Since April 2000,night blindness has declined, reaching 0% in September 2002 and remaining there.
8. INDONESIA: 1999 TO 2003
Indonesia achieved a growth of 0.8% in the GDP in 1999; by 2000, the economicrecovery had a broader base, with exports and fixed investment contributing to the turn-around. Similarly to many countries in southeast Asia, however, Indonesia’s economicgrowth experienced a slowdown in 2001. Despite positive news (including the peaceful
Fig. 7. Prevalence of anemia (Hb < 110 g/L) among children ages 3 to 59 mo and 12 to23 mo in urban slums in Jakarta between November 1998 and March 2003 (n = 10,707and 2826, respectively).

706 Part VII / Optimal Pregnancy/Infancy Outcomes706 Part VII / Optimal Pregnancy/Infancy Outcomes
change in government and the steady, incremental progress in some aspects of economicpolicy), exports fell, responding quickly to weakening external markets—first, as a resultof the bursting technology stock market “bubble,” and then as a result of the terroristattacks in the United States on September 11, 2001.
Signs of some rebound in market confidence were apparent in late 2001 and early2002, with improvements in stock and bond market indexes. However, although growthaccelerated over the first three quarters of 2002, it was set back by the October terror-ist attacks in Bali. The currency and stock market reacted sharply, and the effects of theconsequent decline in tourism were observed in early 2003. This downturn, monitoredby financial observers such as the Asian Development Bank, coincided with an increaseof childhood anemia and maternal thinness observed by the Helen Keller Internationalsurveillance system (see above).
The bombing of the J.W. Marriot hotel in Jakarta in September 2003 may have fur-ther contributed to similar uncertainties in the economic and social situation, and theelections scheduled for mid-2004 may involve an increasingly politicized debate oneconomic policy. It is clear is that the country remains vulnerable to external shocks, andit is essential to monitor the impact of such shocks on the health and nutritional statusof vulnerable groups in Indonesia.
9. CONCLUSIONS AND RECOMMENDATIONS
The first health impact of the Indonesian economic crisis was observed on foodintake, as the consumption of animal products decreased to maintain the consumptionof the main staple, rice. This resulted in a dramatic increase in the prevalence of child-hood anemia in both urban and rural parts of Indonesia. Because animal products arerich in other micronutrients as well, the data suggest that affected children are alsolikely to be deficient in these other micronutrients. IDA among children in areas withoutextensive iron fortification efforts and/or iron supplementation programs proved to be avery sensitive indicator for measuring the change and impact of structural adjustmentprograms or of economic crises similar to that in Indonesia (Fig. 7).
The urban areas were more affected by the Indonesian crisis than the rural areas. TheIndonesian economic crisis resulted in the collapse of the construction sector and theincrease of food prices. Because the urban poor were dependent on food prices andthe ability to earn cash income, we predicted an increase in malnutrition rates. About30% of Jakarta’s urban poor are not officially registered as citizens of Indonesia’s capitalcity, perhaps explaining why safety-net programs did not prevent the most vulnerableurban groups from falling into poverty.
Table 1Major Economic Indicators, Indonesia, 1997–2003
Economic indicator (%) 1997 1998 1999 2000 2001 2002 2003
GDP growth 4.7 −13.1 0.8 4.9 3.4 3.7 3.4Inflation rate 6.2 77.6 −1.9 3.7 11.5 13.1 7.7Current account balance/GDP −2.4 4.3 4.1 5.2 3.1 1.5 0.7
(From Asian Development Outlook, 2002: II. Economic Trends and Prospects in Developing Asia.ADB, Indonesia, 2002.
Abbreviations: GDP, gross domestic product.

Chapter 27 / Maternal Thinness 707
During the crisis, however, the vitamin A capsule distribution program remainedmostly intact, which is presumed to account for the fact that there was only a slightincrease detected in childhood night blindness (data not shown). Mothers generally do nothave access to vitamin A capsules, which is why a change in the prevalence of maternalnight blindness has proved to be a more useful indicator in such situations but is still lesssensitive for monitoring change than maternal thinness and/or childhood anemia (Fig. 8).
9.1. Recommendations
According to Stiglitz, an economy in deep recession may grow faster as it recovers,but it never makes up for the lost time. There seems to be an association between thedepth of the recession and future income. Therefore, the effects of a recession arelonglasting (9). Similarly, the data on childhood anemia showed that the impact of aneconomic crisis on the immediate health status of children will also have longlasting effectson the human capital of countries.
The Indonesian crisis had specific effects on the nutritional and health status of itspopulation. There are many lessons to be learned from these data. Based on what wehave learned so far, it is recommended that in such economic crises, the most efficientway of detecting nutritional distress—and hence, likely increased morbidity andimpaired development—is to track the following indicators: child hemoglobin levels,maternal night blindness, and maternal thinness. It is less useful to rely on signs of protein-energy malnutrition, as has been done customarily in other forms of emergencies.
In 1993, the World Bank published its report, Investing in Health. The report high-lighted the extent to which health interventions were cost-effective, at least in economic
Fig. 8. Prevalence of nightblindness among non-pregnant women in urban slums inJakarta between November 98 and March 2003 (n = 45,148).

708 Part VII / Optimal Pregnancy/Infancy Outcomes708 Part VII / Optimal Pregnancy/Infancy Outcomes
terms. Besides the fact that micronutrient deficiencies may result in an increased risk ofboth childhood and maternal mortality, these deficiencies also have a longer termimpact on poor development of human resources (i.e., of people not being allowed toreach their intellectual and growth potential). This is something that is very often for-gotten in economic adjustment programs, and we would argue for more emphasis onmicronutrient deficiency control as part of safety-net programs.
Countries cannot afford to lose a generation. Iron deficiency has a massive but, untilrecently, almost totally unrecognized economic cost (14). In 2004, Indonesia only partlyrecovered from the economic crisis; however, it already must compete economicallyboth with other countries in the region and globally (most specifically with the People’sRepublic of China and Vietnam) (52). This competition depends, to a large extent, onhuman resources and the adequacy of their health and nutrition.
Williamson noted that the Washington Consensus was forged in a time when econo-mists were convinced that the key to economic development was in economic policiesrather than in physical and human capital. This view of development is increasinglybeing challenged by critics, such as Stiglitz, who have observed that economic policyprescriptions imposed on Indonesia by the IMF and intended to lead the country out ofits crisis led, in fact, to more instability. As the Helen Keller International surveillancesystem found, this instability contributed to large-scale micronutrient malnutrition,which will have longlasting effects on the human capital of the country and will diminishits potential recovery. The lessons from the Indonesian crisis are of critical importancefor many other Third World countries, which will be struggling in the next 15 yr toreach their millennium development goals.
REFERENCES1. Editorial. Structural adjustment too painful? Lancet 1994; 344:1377–1378.2. Thomas Alan. Poverty and the “End” of Development. In: Allen T, Thomas A, eds. Poverty and
Development into the 21st century. The Open University Oxford University Press, UK, 2000.3. Stiglitz Joseph. The Rebel Within. Anthem Press, London, 2001.4. Williamson, John. “What Washington Means by Policy Reform.” In: Williamson J, ed. Latin
America Adjustment, How Much Has Happened? Institute for International Economics, WashingtonDC, 1990.
5. Williamson John. What should the World Bank think about the Washington Consensus? World BankResearch Observer 2000; 15(2): 251–264.
6. Naim M. Fads and Fashion in Economic Reforms: Washington Consensus or WashingtionConfusion? Foreign Policy Magazine, October 26, 1999.
7. Thurow LC. The Future of Capitalism: How Today’s Economic Forces Shape Tomorrow’s World.Penguin, New York, 1996.
8. World Bank. The East Asian Miracle: Economic Growth and Public Policy. Oxford UniverstityPress, New York, 1993.
9. Stiglitz, Joseph E. Globalization and its discontents. Penguin Books, 2002.10. Poppele J, Sumarto S, Pritchett L. Annex VII. Social Impacts of the Indonesian Crisis: New Data and
Policy Implications (A Background Note for a Social Safety Net Adjustment Loan). The WorldBank, 1999.
11. Howson CP, Kennedy ET, Horwitz A. Prevention of Micronutrient Deficiencies, Tools forPolicymakers and Public Health Workers. National Academy Press, Washington DC, 1998.
12. Ramakrishnan U, Huffman SL. Multiple Micronutrient Malnutrition. In: Semba RD, Bloem MW,eds. Nutrition and Health in Developing Countries. Humana Press, Totowa NJ, 2001.
13. Dallman PR, Yip R, Oski FA. Iron Deficiency and Related Nutritional Anaemias. In: Nathan DG,Oski RA, eds. Hematology of Infancy and Childhood. WB Saunders, Philadephia, 1992, pp. 413–450.

Chapter 27 / Maternal Thinness 709
14. Horton S, Ross J. The economics of iron deficiency. Food Policy 2003; 28:51–75.15. Lozoff B, Jimenez E, Hagen J, Mollen E, Wolf AW. Poorer behavorial and development outcome
more than 10 years after treatment for iron deficiency in infancy. Pediatrics 2000; 105(4):E5.16. Grantham-McGregor S, Ani C. A review of studies of the effect of iron deficiency on cognitive
development in children. J. Nutr 2001;131:649s-668s.17. UNU/UNICEF/WHO/MI. Preventing Iron Deficiency in Women and Children. Consensus on Key
Technical Issues. New York, 1999.18. Goyer RA. Nutrition and metal toxicity. Am J Clin Nutr 1995; 61(Suppl 3):646S–650S.19. Goyer RA. Results of lead research: prenatal exposure and neurological consequences. Environment
Health Perspect 1996; 104(10):1050–1054.20. Peraza MA, Rael LT, Casarez E, Barber DS, Ayala-Fierra F. Effects of micronutrients on metal toxicity.
Environment Health Perspect 1998; 106(Suppl 1):203–216.21. Basta SS, Soekirman, Karyadi D, Scrimshaw N. Iron deficiency anemia and the productivity of adult
males in Indonesia. Am J Clin Nutr 1979; 32:916–925.22. World Health Organization, United Nations Children’s Fund United Nations University. Iron
Deficiency Anaemia, Assessment, Prevention, and Control. WHO/NHD/01.3, 2001.23. World Bank Investing in Health World Development Report 1993. Washingtion DC, 1993.24. Muhilal, Tarwotjo I, Kodyat B, et al. Changing prevalence of xerophthalmia in Indonesia 1977–1992.
Eur J Clin Nutr 1994; 48:708–714.25. Pinstrup-Andersen P. Assuring food security and adequate nutrition for the poor. Health, nutrition
and economic crises: approaches to policy in the Third World. Can J Dev Stud 1998; 19(specialissue):147–175.
26. Bloem MW, Hye A, Gorstein J, et al. Nutrition surveillance in Bangladesh: a useful tool for policyplanning at the local and national levels. Food Nutr Bull 1995; 16:131–138.
27. De Pee S, Bloem MW, Gorstein J, et al. Re-appraisal of the role of vegetables in the vitamin A statusof mothers in Central Java, Indonesia. Am J Clin Nutr 1998; 68:1068–1074.
28. De Pee S, Bloem MW, Satoto, et al. Impact of a social marketing campaign promoting dark-greenleafy vegetables and eggs in Central Java, Indonesia. Internat. J Vit Nutr Res 1998; 68:389–398.
29. Johnsson U. Towards an improved strategy for nutrition surveillance. Food Nutr Bull 1995; 16:102–111.30. http://www.usaid.gov/pubs/cp2000/ane/indonesia.html. Accessed 3/3/2004.31. Bloem MW, Darnton-Hill I. Micronutrient Deficiencies. First Link in a Chain of Nutritional and
Health Events in Economic Crises. In: Bendich A, Deckelbaum RJ. Primary and SecondaryPreventive Nutrition. Human Press, Totowa, NJ.
32. Torlesse H, Kiess L, Bloem MW. Association of household rice expenditure with child nutritionalstatus indicates a role for macroeconomic food policy in combating malnutrition. J Nutr 2003;133:1320–1325.
33. Hadded L, Ruel MT, Garrett JL. Are urban poverty and undernutrition growing? Some newlyassembled evidence. IFPRI Discussion Paper 63 (Discussion Paper Brief). Food consumption andnutrition division of the International Food Plicy Research Institute. IFPRI, Washington, DC, 1999.
34. Kiess L, Moench-Pfanner R, Bloem M, de Pee S, Sari M, Kosen S. New conceptual thinking aboutsurveillance: Using micronutrient status to assess the impact of economic crises on health and nutri-tion. Mal J Nutr 2000; 6:223–232.
35. De Pee S, Bloem MW, Sari M, et alIndonesia’s crisis causes considerable weight loss among mothersand adolescents. Mal J Nutr 2000; 6:203–214.
36. Pelletier DL, Rahn M. Trends in body mass index in developing countries. Food Nutr Bull 1998;19:223–229.
37. Yip R. The challenge of improving iron nutrition: limitations and potentials of major interventionapproaches. Eur J Clin Nutr 1997; 51:S16–S24.
38. UNU/UNICEF/WHO/MI. Preventing Iron Deficiency in Women and Children: Consensus on KeyTechnical Issues. Micronutrient Inititative, Ottawa, 1999.
39. De Pee, West CE, Permaesih D, et al. Increasing intake of orange fruits is more effective thanincreasing intake of dark-green leafy vegetables increasing serum concentrations of retinol andβ-carotene in school children in Indonesia. Am J Clin Nutr 1998.
40. Khan NC, West CE, de Pee S, Khoi HH. Comparison of the effectiveness of carotenoids from dark-green leafy vegetatables and yellow and orange fruits in improving vitamin A status of breastfeedingwomen in Vietnam. Report of the XVIII International vitamin A consultative group meeting(abstract). International Life Sciences Institute, Washington, DC, 1998.

710 Part VII / Optimal Pregnancy/Infancy Outcomes
41. West CE, Eilander A, van Lieshout M. Consequences of revised estimates of carotenoid bioefficacyfor dietary control of vitamin A deficiency in developing countries. J Nutr 2002; 132:2920S–2926S.
42. De Pee S, Bloem MW, Sari M, Kiess L, Yip R, Kosen S. High prevalence of low hemoglobin con-centration among Indonesian infants aged 3–5 months is related to maternal anemia. J Nutr 2002;132:2215–2221.
43. Stoltzfus RJ, Dreyfuss ML. Guidelines for the Use of Iron Supplements to Prevent and Treat IronDeficiency Anemia. INACG/WHO/UNICEF. ILSI Press, Washington, DC, 1998.
44. Politt E, Gorman KS, Engle PL, Martorell R, Rivera J. Early Supplementary Feeding and Cognition.Monographs of the Society for Research and Child Development. Serial 235. 1993; 58(7).
45. Lozoff B, Jimenez E, Wolf AW. Long-term developmental outcome of infants with iron deficiency.N Engl J Med 1991; 325:687–695.
46. Scrimshaw NS. Malnutrition, brain development, learning, and behavior. Nutr Res 1998;18:351–379.
47. Holst M. Nutrition and life cycle: developmental and behavioral effects on iron deficiency anemiain infants. Nutrition Today 1998; 13(1):27–36.
48. Yip R. Iron Deficiency and Anemia. In: Semba RD, Bloem MW, eds. Nutrition and Health inDeveloping Countries. Humana Press, Totowa, NJ, 2001.
49. Sommer A, West KP Jr. Vitamin A Deficiency, Health, Survival, and Vision. Oxford UniversityPress, New York, 1996.
50. West KP, Katz J, Khatry SK, et al. Double blind, cluster randomized trial of low dose supplementa-tion with vitamin A or Beta-carotene on mortality related to pregnancy in Nepal. BMJ 1999;318:570–575.
51. Helen Keller International, Bangladesh. Vitamin A status throughout the lifecycle in ruralBangladesh. National vitamin A survey 1997–98. Helen Keller International, Bangladesh. 1999.
52. ADB. Modest Economic Growth for Indonesia in 2003 and 2004. Asian development Bank.Adb.org/media.
710 Part VII / Optimal Pregnancy/Infancy Outcomes

VIII PREVENTIVE NUTRITION:GLOBAL PERSPECTIVES


From: Preventive Nutrition: The Comprehensive Guide for Health Professionals, Third EditionEdited by: A. Bendich and R. J. Deckelbaum © Humana Press Inc., Totowa, NJ
713
28 Potential Benefits of PreventiveNutrition StrategiesLessons for the United States
Walter C. Willett
KEY POINTS
● Staying lean and physically active throughout adult life has major health benefits.● Diets low in the percentage of energy from fat have not been associated with lower risks
of heart disease, cancer, or better long-term weight control.● Replacing trans and saturated fats with unsaturated fats substantially reduces risks of
heart disease.● Consuming grains in their original high-fiber/whole grain form is likely to reduce risks
of type 2 diabetes and heart disease.● High intake of fruits and vegetables reduces risks of cardiovascular disease, but the
benefits for cancer reduction appear modest.
1. INTRODUCTION
For years, the Recommended Daily Allowances (RDAs) served as nutritional guide-lines for individuals and institutions (1). However, the RDAs developed from minimalistcriteria primarily aimed at prevention of clinical deficiencies. These guidelines were latersupplemented with recommendations to reduce dietary fat and cholesterol. In recent years,attention has focused on specific types of fat and suboptimal intake of dietary factors, evenin the absence of recognized clinical deficiency. Dietary factors, including substances notgenerally considered to be nutrients, now appear involved in the cause or prevention ofconditions as diverse as coronary heart disease (CHD), stroke, many cancers, cataracts,and birth defects. The National Research Council (NRC), the Surgeon General’s Office,and the US Dietary Guidelines Committee (2–4) examined the relation of diet to healthmore broadly and issued new recommendations. This brief overview builds on the 1989NRC Report on Diet and Health (2) and emphasizes subsequent findings.

714 Part VIII / Preventive Nutrition: Global Perspectives
2. SOURCES OF EVIDENCE
Traditionally, animal experiments and small human metabolic studies formed thebasis of dietary recommendations. Inevitably, the study of chronic disease in humanshas required epidemiological approaches. Initially, investigations compared dietaryintakes and disease rates among populations in various countries. These analyses high-lighted the large differences in disease rates worldwide and provided many hypotheses;however, such studies were limited, because many other factors, besides diet, variedacross cultures, and the data were inherently aggregated. The next generation of studieswere primarily case––control investigations, which mainly examined dietary factorsretrospectively regarding risk of cancer and other diseases. Now, large prospective stud-ies involving many thousands of people are beginning to provide data based on bothbiochemical indicators of diet and dietary questionnaires that have been rigorously val-idated (5). Prospective studies are less subject to biases that result from the retrospec-tive reporting of dietary intakes or the effects of disease on biochemical indicators.Micronutrient supplements can potentially be evaluated in randomized trials; however,trials of dietary interventions often may be infeasible because of difficulties in main-taining compliance for long periods, which are necessary and could last decades. Recentadvances in molecular biology have yet to contribute substantially to dietary recom-mendations; however, in the future, these approaches may provide useful intermediaryendpoints, allow the study of gene––diet interactions, and enhance our understanding ofthe mechanisms by which dietary factors influence disease. Ultimately, our knowledge isbest based on a synthesis of epidemiological, metabolic, animal, and mechanistic studies.
3. SPECIFIC DIETARY COMPONENTS
3.1. Dietary FatUntil recently, major reviews on diet and health have consistently recommended
reducing total fat intake, usually to 30% of energy or less (2,3), to decrease CHD. Theclassical diet––heart hypothesis has rested heavily on the repeated observation thatserum total cholesterol levels predict CHD risk; thus, serum cholesterol has functionedas a surrogate marker of risk in hundreds of metabolic studies. These studies, summa-rized as equations by Keys (6) and Hegsted (7), indicated that compared to carbohy-drates, saturated fats and dietary cholesterol increase and polyunsaturated fat decreasesserum cholesterol, whereas monounsaturated fat has no influence. These widely usedequations, although valid for total cholesterol, have become less relevant as surrogatevariables for CHD risk with the recognition that the high-density lipoprotein (HDL)cholesterol fraction is strongly and inversely related to CHD risk and that the ratio oftotal cholesterol to HDL is a better predictor (8–11).
Substitution of carbohydrate for saturated fat (the basis of the American HeartAssociation [AHA] diets) tends to reduce HDL as well as total and low-density lipoprotein(LDL) cholesterol; therefore, the ratio does not change appreciably (12). In contrast, sub-stituting monounsaturated for saturated fat reduces LDL without affecting HDL, thus pro-viding an improved ratio (12). Additionally, compared to carbohydrates, monounsaturatedfats reduce blood sugar and triglycerides in adult-onset diabetics (13). Questions have beenraised regarding whether the reductions in HDL caused by a high-carbohydrate diet havethe same adverse effect as reductions caused by other factors (14). Although this issue is

Chapter 28 / Preventive Nutrition Strategies 715
difficult to address directly, other factors that influence HDL levels—including alcohol,estrogens, obesity, smoking, exercise, and medications—affect CHD risk in the predicteddirection (15,16). The use of the usual cholesterol prediction equations has been furthercomplicated by the recognition that different saturated fats vary in their influence on LDLlevels: 18:0, stearic acid (the main fat in chocolate and a major saturated fat in beef fat) haslittle effect; 16:0, palmitic acid (the main fat in palm oil also found in beef fat) modestlyincreases LDL; and 14:0, myristic acid (the main saturated fat in butter and other dairy fats)most strongly increases LDL (11,17). However, this usually does not have practical impor-tance because intakes of the various saturated fats are strongly correlated with each other,and there is no good evidence that stearic acid is less atherogenic (18).
The optimal amount of polyunsaturated fat intake in the diet remains uncertain. Theearlier metabolic studies predicting total serum cholesterol (6,7) suggested that intakesshould be maximized, and the AHA recommended intakes of 10% of energy (comparedto US averages of about 3% in the 1950s and 6% presently). Concerns have risen fromanimal studies in which ω-6 polyunsaturated fat (typically as corn oil) has promotedtumor growth (19) and from the possibility that high intakes of ω-6 relative to ω-3 fattyacids might promote coronary thrombosis (20,21). However, as described here, avail-able evidence from human studies has not supported these concerns at levels of ω-6fatty acid intake up to about 10% of calories. Many studies have examined dietary fatin relation to CHD incidence. In Keys’ pioneering study of diets and CHD in sevencountries (22,23), total fat intake showed little association with population rates ofCHD; indeed, the lowest rate occurred in Crete, which had the highest fat intake as aresult of the large consumption of olive oil. However, saturated fat intake was positivelyrelated to CHD in Keys’ study. In contrast to international comparisons, little relation-ship has been demonstrated with saturated fat intake in prospective studies of individu-als (5,24,25). However, some studies tend to support a modest association betweendietary cholesterol and CHD risk (26), and inverse associations have been found withpolyunsaturated fat (24,25). Similarly, dietary intervention trials generally have shownlittle effect on CHD incidence when carbohydrate replaces saturated fat, but replacingsaturated fat with polyunsaturated fat has reduced the incidence of CHD (27–30). In thetrial that most clearly reduced CHD mortality (31) in an initially healthy population,many components of the diet, as well as weight and smoking, changed simultaneously.
High intake of ω-3 fatty acids (found primarily in marine fish but also in some veg-etable oils and plants) reduces platelet aggregability and prolongs bleeding time (21),slightly reduces blood pressure (32), decreases serum triglycerides, and increases LDL-cholesterol (33). Consumption of fish was associated with a greatly reduced risk ofmyocardial infarction (MI) in one prospective study (34) and in a randomized trialamong postinfarction patients (35). Subsequent data have been less supportive of a majoreffect of fish consumption on overall risk of CHD (36–38), but the benefits of ω-3 fattyacids appear to occur primarily in prevention of fatal arrhythmias that can complicateCHD, rather than in prevention of infarction (39–41). The amount of ω-3 fatty acidsneeded to prevent arrhythmia is remarkably small—on the order of 1 g per day (41).
Trans-fatty acids are formed by the partial hydrogenation of liquid vegetable oils dur-ing the production of margarine and vegetable shortening and can account for as muchas 40% of these products. Intake of partially hydrogenated vegetable fats (whichincreased from nothing in 1900 to a peak of about 5.5% of total fat by about the 1960s)has closely paralleled the epidemic of CHD during this century; this has occurred in

716 Part VIII / Preventive Nutrition: Global Perspectives
contrast to intake of animal fat, which has steadily declined over this period (42). Trans-fatty acids increase LDL, decrease HDL (42–47), and raise lipoprotein(a), another lipidfraction implicated in the etiology of CHD (46,48). Positive associations between intakeof trans-fatty acids and CHD were demonstrated among regions in the Seven CountriesStudy (49), a case––control study of men and women (50), and a cross-sectional angio-graphical study (51). In a multicenter European case––control study, adipose levels oftrans-fatty acids were, by far, the lowest in Spain, which is also the country with thelowest CHD rates (52). In the same study, the risk of CHD within countries was 40 to50% higher among individuals with the highest trans-fatty acid levels, but this did notquite obtain statistical significance. In the most detailed prospective study, trans-fattyacid intake was strongly associated with risk of CHD (25), and, as predicted by meta-bolic studies, this association was stronger than for saturated fat. The associationbetween trans-fatty acid intake (53) and risk of CHD has been confirmed in otherprospective studies, and the Food and Drug Administration has announced that by 2005,food labels will be required to include the trans-fat content (see Chapter11).
Understanding of the interrelationships among dietary fats, blood lipids, and CHDrisk has been further complicated by the recognition that antioxidants may play a criti-cal role in preventing atherosclerosis. Experimental evidence suggests that lipid-solubleantioxidants such as vitamin E can block the oxidative modification of LDL, an impor-tant step in atherogenesis (54). Within Europe, countries with higher blood antioxidantlevels have lower rates of CHD (55), and, as described here, vitamin E supplementshave been inversely associated with CHD risk, although not in several large randomizedtrials. Because liquid vegetable oils, particularly those that are minimally processed, arethe primary source of vitamin E in our diets, reduction of these fats could have adverseeffects on CHD risk. Soybean oil may be an exception, because although it is highlypolyunsaturated, its primary form of vitamin E, γ-tocopherol, is rapidly excreted andpoorly incorporated into tissues and lipoproteins. Therefore, diets high in soybean oil,the major fat in the US diet, might result in LDL that is particularly susceptible to oxi-dation. In contrast, LDL particles formed from a diet high in monounsaturated fat in theform of olive oil appear to be relatively resistant to oxidation (56,57).
3.2. Dietary Fat and CancerAnticipated reductions in the risk of cancers of the breast, colon and rectum, and prostate
provide another major justification for decreasing dietary fat (2,58). The primary evidencefor this reduction has been that countries with low fat intake (also the less affluent areas)have had low rates of these cancers (58,59). These correlations have been demonstrated pri-marily with animal fat and meat intake, rather than with vegetable fat consumption.
The hypothesis that fat intake increases breast cancer risk has been supported bymost animal models (60,61), although no association was shown in a large study thatdid not use an inducing agent (62). Moreover, much of the effect of dietary fat in theanimal studies appears to be to the result of an increase in total energy intake, andenergy restriction profoundly decreases incidence (19,60,62). In most case––controlstudies, no association between fat intake and breast cancer was observed, although aweak positive association (relative risk approx 1.07 for 40 vs 30% of energy from fat[63]) was found in the pooled data from 12 such studies (64). However, the relevanceof these studies is now diminishing because data from many large prospective studieshave been published, including approx 8000 cases involving more than 300,000 women

Chapter 28 / Preventive Nutrition Strategies 717
(65–71). None of these studies showed significant elevation of the risk of breast canceramong those with the highest fat intake, and the summary relative risk for the highestvs lowest category of dietary fat composition was 1.03 (71,72). In the largest study (73),no reduction in risk was seen even below 20% of energy from fat. Therefore, over therange of fat intake consumed by middle-aged women in these studies (which includedthe present dietary recommendations), dietary total fat did not appear to increase breastcancer risk. Recently, higher intake of animal fat, but not vegetable fat, was associatedwith a greater risk of breast cancer, suggesting that some components of animal foodrather than fat per se may increase risk (74).
The large (approximately fivefold) differences in breast cancer rates among countriesprobably result from many factors. High consumption of soy products, which containanti-estrogenic isoflavonoids (75), has been hypothesized to account for the low rates ofbreast cancer in Japan. Although deserving further research, similarly low rates of breastcancer are uniformly seen in nonindustrialized countries, most of which do not consumesoy products. No relationship between intake of soy products and breast cancer risk wasseen in two earlier case––control studies in China (76), but a more recent study suggestedthat soy consumption during adolescence may reduce risk (77). Indirect evidence isgrowing to support the finding that the powerful effect of energy and growth restrictionon mammary cancer incidence in animals also applies to humans. Adult height (in part amarker of early energy balance) is associated with breast cancer rates both internation-ally and in many case––control and cohort studies (78–80). Part of this effect is medi-ated through delayed ovulation (81); childhood weight gain is the primary determinantof age at which menstruation occurs (82), which still averages about 18 yr in China (83).
Associations between animal fat consumption and colon cancer incidence have beendocumented in some (84–86)—but not all (87)—studies, whereas little relation hasbeen demonstrated with vegetable fat. Positive associations with animal fat also havebeen observed for adenomatous polyps, a precursor lesion (88). However, the associa-tions between red meat consumption and colon cancer have been even stronger than theassociation of fat in some analyses (85,86), suggesting that relationships with red meatmay be caused by other components of cooked flesh, such as heat-induced carcinogens(89) or the high content of readily available iron (90). Associations between processedmeat and colon cancer have been stronger than with total red meat (91).
Similarly to breast and colon cancer, prostate cancer rates are much higher in afflu-ent compared to poor and Eastern countries (59). More detailed epidemiological stud-ies are few; in subsets of several case––control studies, men with prostate cancerreported higher fat intake than did controls (92,93), and associations with red meat con-sumption have been suggested in some prospective studies (94,95). A positive associa-tion has been observed between intake of α-linolenic acid risk of prostate cancer; thisassociation is primarily attributable to consumption of fat from red meat (96).
3.3. Dietary Fat and Body FatnessExcessive weight is an important cause of morbidity and mortality (see Section 4.),
and short-term studies have suggested that reducing the fat content of the diet inducesweight loss. However, population differences in weight do not appear to be result pri-marily from fat intake; in Europe, southern countries with relatively low fat intakeshave higher rates of obesity than northern European countries (97). Also, among 65counties in China, no correlation was observed between body weight and fat intake,

718 Part VIII / Preventive Nutrition: Global Perspectives
which varied from approx 6 to 30% of energy (83). Inconsistent associations have beenobserved in cross-sectional and prospective studies within countries, but such observa-tions are particularly prone to distortion because subjects may alter their diets to mod-ify their weight. In randomized trials of fat reduction (the optimal way to study thisrelationship), modest weight reductions typically are seen in the short-term. However,in randomized studies lasting 1 yr or longer, reductions in fat to the range of 20 to 25%of energy had minimal effects on overall long-term body weight (98–101). In a trialamong obese women, a reduction in fat intake to less than 18% of energy reducedweight by only 3.4 kg, and no effect was observed on waist/hip ratio or percent body fat(102). Very low fat intakes (less than 10% of energy), in conjunction with a high vol-ume of bulky food (as consumed by some traditional societies), may induce weight loss(103), but long-term studies are needed to confirm this finding. However, available evi-dence suggests that reductions in dietary fat composition over the ranges currently rec-ommended are not likely to have sustained and substantial effects on body fatness.
What can we currently say about dietary fat and health? As noted—but generallyignored—in the executive summary of the NRC report (98), there is little evidence thatdietary fat per se is associated with risk of CHD. Metabolic and epidemiological dataare consistent in suggesting that intake of partially hydrogenated vegetable fats shouldbe minimized. Metabolic and epidemiological data support a reduction in saturated fats,particularly from dairy sources, to as low as feasible; however, these data suggest thatthe benefits will be small if carbohydrate, rather than unsaturated fats, replace the satu-rated fat. Definitive data are not available regarding the optimal intake of polyunsatu-rated and monounsaturated fats, but the metabolic data as well as the experience ofsouthern European populations suggest that consuming a substantial proportion of energyas monounsaturated fat would be desirable. Available evidence also suggests that total fatreduction would have little effect on breast cancer risk, although reducing red meat intakemay well decrease the incidence of colon cancer.
3.4. Vegetables and FruitsRecommendations to eat a generous amount of vegetables and fruits (2) are sup-
ported by epidemiological data regarding both cardiovascular and cancer incidence. Inmore than 200 studies, persons consuming higher amounts of these foods or displayinghigher levels of carotenoids in their blood experienced reduced risk of various malig-nancies (104,105). However, most of these studies were case–control investigations,and more recent cohort studies have tended to show much weaker—or no—relation-ships between overall fruit and vegetable consumption and risks of common cancers(106). An inverse relationship with lung cancer had been most strongly suggested (107).This led to the suggestion that β-carotene might be the protective factor (108), but thiswas not supported by randomized trials (109–111). Intake of fruits and vegetables alsohas been related to lower risk of stomach cancer in many case––control studies(3,105,112), although not in a prospective study (113); mechanistic studies (114) sug-gest a possible protective role for vitamin C. Vegetable and fruit consumption has alsobeen inversely related to risk of colon cancer (115) in case–control studies, but, again,this was not supported in a large prospective analysis (106). Considerable evidence sug-gests that folic acid reduces risk (86,116), but vitamin supplements and fortification arenow greater sources than fruits and vegetables in the United States. Although thereare fewer studies to support apparent protective effects of greater fruit and vegetable

Chapter 28 / Preventive Nutrition Strategies 719
consumption, these effects also have been observed for cancers of the oral cavity, larynx,pancreas, bladder, and cervix (104,105,112) but require prospective confirmation. Inprospective studies, there appears to be little relationship between consumption of fruitsand vegetables and risk of breast cancer (117).
In addition to the micronutrients noted earlier, plants contain numerous componentsthat have potential anticancer activity (105); such chemicals could reduce the formationof carcinogens, induce detoxifying enzymes, and block the effects of endogenous estro-gens. Further details about the amounts of these substances in foods could permit moreinformative investigations, as lumping fruits and vegetables together has little biologicalrationale.
In the growing literature on CHD, fiber intake consistently has been related todecreased risk (5,118–120), but the possibility that this association could have resultedfrom other factors in plants generally has not been explored. Evidence that elevatedblood homocysteine is an independent risk factor for CHD and cerebrovascular disease(121–123) and that levels can be reduced by supplements of folic acid and vitamin B6
(124,125) suggest one mechanism. Vegetarians generally have reduced blood pressures,and higher intake of fruits and vegetables has been associated with lower blood pres-sure even in nonvegetarians (126); the active factor remains unclear, but potassium is alikely contributing factor (127).
Suboptimal dietary folic acid, which is mainly obtained from fortified breakfast cere-als, vegetables, and fruits, definitively increases risk of neural tube defects (NTDs), themost common severe birth defect (128,129), and may account for more than half ofthese cases. The effect of low folate intake may be particularly adverse among theapprox 10% of the population that is genetically less efficient in using the ingested formof this vitamin (130).
In both case–control (131) and prospective studies (132,133), intake of dietaryantioxidants, including the carotenoids lutein and zeaxanthin, and vitamin C has beeninversely related to risk of cataracts. Because cataract formation, which is increased bysunlight and cigarette smoking (134), involves the accumulation of oxidized and dena-tured proteins, this lesion may represent a convenient marker of long-term oxidativedamage. High intake of lutein and zeaxanthin in the form of spinach has been associ-ated with a decreased risk of advanced macular degeneration (135). This is particularlynotable, because lutein and zeaxanthin are the carotenoids specifically concentrated inthe macula, where they apparently play a protective role against photodamage (136).
3.5. Starches and Complex CarbohydratesBecause protein varies only modestly across a wide range of human diets, a higher
carbohydrate consumption is, in practice, the reciprocal of a low-fat diet. For reasonsdiscussed under the topic of fat (see Section 3.1.), a high-carbohydrate diet may haveadverse metabolic consequences. In particular, such diets are associated with an increasein triglycerides and a reduction in HDL cholesterol (11). These adverse responses maybe aggravated in the context of insulin resistance (137,138), which is highly prevalentin Western populations.
Although direct evidence for benefit in reducing disease risk is limited, several reasonsexist to emphasize whole grain and other less-refined complex carbohydrates as opposedto the highly refined products and sugar that are generally consumed in the United States.Adverse consequences of highly refined grains appear to result both from the rapid digestion

720 Part VIII / Preventive Nutrition: Global Perspectives
and absorption of these foods as well as from the loss of fiber and micronutrients in themilling process. The glycemic response after carbohydrate intake, which has been char-acterized by the glycemic index, is greater with highly refined foods as compared to less-refined, whole grains (139). The greater glycemic response resulting from highly refinedcarbohydrates is accompanied by increased plasma insulin levels and augment the otheradverse metabolic changes caused by carbohydrate consumption (139) to a greater degreethan with less refined foods. Diets with a high glycemic index, particularly when associ-ated with low-fiber intake, appear to increase the risk of noninsulin-dependent diabetes(140,141) and, possibly, the risk of CHD, particularly among women with greater insulinresistance (142). Anticipated reductions in colon cancer risk from diets high in grain fiberhave been difficult to document epidemiologically (143–145). However, reduced consti-pation and risk of colonic diverticular disease (134) are clear benefits of such diets. Therole of soluble fiber (found in oat bran and some other plant foods) in lowering bloodlipids has been the topic of hot debate; current evidence suggests that a small effect mayexist with large intakes (146,147). Risk of MI appears to be reduced by higher intake ofdietary fiber from grains to a greater degree than can be explained by the effect of fiberon blood lipids alone (148).
The importance of micronutrients in the prevention of many chronic conditions (dis-cussed in Section 6.) has re-emphasized the problem of “empty calories” that are asso-ciated with diets high in sugar and highly refined carbohydrates. In the standard millingof white flour, as much as 60 to 90% of vitamins B6 and E, folate, and other nutrientsare lost (149); this may be nutritionally critical for persons with otherwise marginalintakes. Thiamin, riboflavin, folate, and niacin presently are replaced by fortification,but other nutrients remain substantially reduced.
3.6. ProteinAverage protein consumption in the United States substantially exceeds conventional
requirements (2), and adequate intake can be maintained on most reasonable diets,including those without animal products. High intake of animal protein can increase uri-nary calcium loss (150), contribute to homocysteinemia (151), and has been hypothe-sized to increase risk of various cancers (152); however, evidence for the latter effect islimited. Substituting protein for carbohydrate improves blood lipids and has been asso-ciated with lower risk of CHD (153).
3.7. Calcium and Dairy ProductsRecommendations to maintain adequate calcium intake (2) and to consume dairy
products on a daily basis (154) are derived primarily from the importance of calcium inmaintaining bone strength. Calcium supplements, in conjunction with vitamin D, havereduced fracture incidence in older adults (155,156), but benefits of calcium cannot bedistinguished from those of vitamin D. Uncertainty remains regarding the optimalintake. Intakes as high as 1500 mg/d have been recommended for postmenopausalwomen who are at risk of fractures (157); these intakes are difficult to achieve withoutsupplements. However, many populations have low fracture rates despite minimal dairyproduct consumption and low overall calcium intake by adults (158). Milk and otherdairy products may not be directly equivalent to calcium from supplements, becausethese foods contain a substantial amount of protein, which can enhance renal calciumlosses (150). Several prospective studies have directly addressed the relationship of

Chapter 28 / Preventive Nutrition Strategies 721
dairy product consumption to fracture incidence; with the exception of one small study(159), higher consumption of calcium or dairy products as an adult has not been asso-ciated with lower fracture incidence (160,161). At best, the benefits of high calciumintake are minor compared with those from regular physical activity (162–165).
Inverse associations have been reported between calcium intake and blood pressurein some studies (166), but in a review of trials of supplementation, little overall effectwas observed (167). Low calcium intake has been associated with risk of colon cancer,although evidence has not been consistent (168). Larger prospective studies suggest amodest benefit of higher calcium, but the relationship appears nonlinear, with mostbenefit achieved with about 800 mg/d. Evidence from a randomized trial that calciumsupplementation modestly reduces colon adenoma recurrence contributes importantevidence of causality to the epidemiological studies (169).
Although recommended calcium intakes can be achieved by a high consumption ofgreens and certain other vegetables, greatly increased intakes would be required formost women to achieve currently recommended levels through the diet without regu-lar use of milk and other dairy products. Calcium supplements are an inexpensive formof calcium that do not include the accompanying calories or saturated fat. Therefore,dairy product consumption can be considered an optional, rather than a necessary,dietary component. Enthusiasm regarding high dairy consumption should also be tem-pered by the suggestion of many studies that this is associated with increased risks ofovarian and prostate cancer (170,171). The issue of whether an increased risk resultsfrom the calcium, lactose, or endogenous hormones in milk remains unclear.
3.8. Salt and Processed MeatsReduction of salt (sodium chloride) intake from an average of approx 8 to 10 g/d to
less than 6 g/d will, on average, decrease blood pressure to a small degree. In a recentreview, Law et al. (172) concluded that a reduction of 3 g/d would reduce the incidencesof stroke and CHD by 22 and 16%, respectively. Although the decrease in risk of car-diovascular disease (CVD) achieved by reducing salt consumption is small for mostindividuals, the overall number of potentially avoided deaths is large, supporting poli-cies to reduce the salt consumption—particularly in processed foods and by institutions.
In a number of case–control studies, the consumption of salty and pickled foods hasbeen associated with stomach cancer (173). However, because this cancer is relativelyrare in the United States, further benefit from reducing salt intake would be small.
4. BODY WEIGHT
Until recently, the issue of optimal body weight was controversial because of analysesthat did not account for confounding influences from factors such as smoking (which isa strong cause of premature death and is also associated with low body weight) or forthe fact that many individuals, particularly at older ages, have low body weightsbecause of chronic illness (174,175). More detailed analyses indicate that middle-agedpersons of even average weight have a high prevalence of abnormalities of bloodglucose, lipids, and blood pressure (176) and experience substantial increases in MI(177,178), diabetes (179), hypertension (180), many cancers (181,182), gallstones(183), and total mortality rates (184,185) compared to their leaner counterparts.Therefore, the current guidelines based on a body mass index range of 19 to 25 kg/m2
are probably closer to optimal, and the best health experience is achieved by avoiding

722 Part VIII / Preventive Nutrition: Global Perspectives
increases in weight during adulthood (174). As noted earlier, dietary fat compositionover a wide range appears to have little relationship with weight maintenance; in con-trast, regular exercise and avoidance of extreme inactivity (e.g., excessive televisionwatching) is crucial (186).
5. ALCOHOL
Many adverse influences of heavy alcohol consumption are well-recognized, butmoderate consumption has both beneficial and harmful effects; this combination ofeffects greatly complicates decisions for individuals (see Chapter 33). Overwhelmingepidemiological data indicate that moderate consumption reduces risk of MI (187,188),and one to two drinks a day decrease risk by approx 30 to 40%. Although it has been sug-gested that this effect may be a result of antioxidants in red wine (189), similar protectiveeffects for equivalent amounts of alcohol have been observed for all types of alcoholicbeverages (190,191). On the other hand, modest positive associations with risk of breastcancer incidence have been observed in more than 30 studies (192–194) for similar lev-els of alcohol intake, possibly because alcohol appears to increase endogenous estrogenlevels (195,196). The overall effect of alcohol (as represented by total mortality) appearsbeneficial for up to about two drinks per day in men (197). Overall, a similar relation-ship with total mortality is demonstrated among women, but no net benefit was observedamong those at low risk of CHD because of younger age or lack of coronary risk factors(198). Furthermore, the risk of transition from moderate alcohol consumption to addictionand uncontrolled drinking has not been well-quantified.
6. VITAMIN SUPPLEMENTS
Because populations can be identified with very low rates of almost every major disease,vitamin supplements may not further enhance health among populations consumingideal diets. Only recently have data emerged that address the effects of vitamin supple-ments against the background of actual diets in the United States, which appear to be farfrom ideal (112).
The most firmly established benefit, based on case–control, cohort, and randomized stud-ies, is that folic acid supplements in the amounts contained in multiple vitamins can reducethe risks of NTDs by approx 70% (128,199). This is probably only a sentinel indicator ofsuboptimal folate intakes, as inverse associations also have been seen with colonic neo-plasias (200), and low folate intake, along with suboptimal amounts of vitamin B6, is likelyto contribute to elevated blood homocysteine levels and risk of CVD (122,123,201).
In prospective epidemiological studies, men and women who consumed the highestamounts of vitamin E (mostly from supplements) had an approx 40% lower risk of MIcompared to those who consumed low vitamin E intakes (202,203). The maximumreduction in risk appeared to occur at levels of 100 IUs or more per day, which is wellabove intakes achievable by diet alone. However, in randomized trials, mainly amongpatients with existing CHD, little benefit has been seen (204). The apparent differencemay relate to the study populations, because persons with existing CHD were excludedfrom the epidemiological studies, and they were typically on many drugs that couldoverlap in mechanisms with vitamin E. In one case–control study, use of vitamin E sup-plements was associated with a 50% reduced risk of oral cancer (205).

Chapter 28 / Preventive Nutrition Strategies 723
Vitamin C supplementation was associated with lower risk of CHD in one interna-tional comparison (206), but the available data did not distinguish vitamin C fromother supplements. The association between vitamin C and CHD risk has been incon-sistent in other prospective studies (203,207). Apart from a possible reduction in riskof cataracts (134), only limited evidence exists at present that high doses of vitamin Chave substantial benefits.
No overall benefit of supplemental vitamin A was observed in a large prospectivestudy of breast cancer (208). Higher intake of preformed vitamin A (retinol) was asso-ciated with an excessive risk of hip fracture in prospective studies (209,210), possiblyby competing with vitamin D at the receptor level, and elevated risks were seen for useof both multiple vitamins and specific supplements of vitamin A. Serum levels of retinylesters have not been associated with bone mineral density (211), but these findings aredifficult to interpret because retinyl esters are highly variable, and the degree to whicha single measure represents long-term vitamin A intake is unclear.
In a randomized trial conducted in a region of China with low consumption of fruitsand vegetables, a supplement containing β-carotene, vitamin E, and selenium reducedincidence of stomach cancer (212).
Although far from complete, current evidence suggests that supplements of folate andpossibly other vitamins at the RDA level (contained in most nonprescription multivita-min preparations) may have substantial benefits at least for an important, but unidenti-fied, subgroup of the US population, perhaps characterized by increased requirements aswell as by suboptimal diets. Because intakes of folate as well as other micronutrientsappear marginal for many Americans (104, 112), the risks of using multivitamins appearlow, and the cost of supplements is low (especially compared to that of fresh fruits andvegetables), the use of a daily multiple vitamin or one taken several times per weekappears rational for the majority of Americans, given current knowledge. A similar argu-ment can be made for vitamin E supplements at levels above the RDA (15 IU), althoughbenefits do not appear to exist for patients with established CHD and further data arehighly desirable. For other vitamins and minerals, there presently is limited evidence ofbenefit of supplements above the RDA levels. Intake of vitamins A and D at levels sub-stantially above the RDA can be potentially harmful, but the safe intake of vitamin Dappears to be higher than once believed (213). In one study, intake of supplements con-taining more than 10,000 IU of preformed vitamin A per day was associated with risk ofspecific birth defects (214). Therefore, women planning pregnancy should be counseledto take multiple vitamins with folic acid that do not contain vitamin A above the RDAlevel (8000 IU/d) (215).
7. RECOMMENDATIONS
Any set of dietary recommendations must be made with the clear qualification thatinformation is currently incomplete and conclusions are subject to change with new data.Most of the major causes of morbidity and mortality in the United States have developedover many decades, and large-scale nutritional epidemiological studies have only begunin the last 25 yr; a full picture of the relationship between diet and disease requires addi-tional decades of careful investigation. Nevertheless, combining metabolic, clinical, andepidemiological evidence, the following is a list of several general recommendations that

724 Part VIII / Preventive Nutrition: Global Perspectives
are unlikely to change substantially for those who are interested in consuming a healthydiet (see Fig. 1):
1. Stay lean and active throughout life. For most individuals, body weight should notincrease by more than 5 to 10 pounds after age 21 yr. Because most of us work atsedentary jobs, weight control usually requires conscious regular daily exercise as wellas some effort to avoid overconsumption of calories.
2. Trans-fatty acids from partially hydrogenated vegetable oils should be avoided com-pletely, and intake of dairy and red meat fat should be consumed sparingly. Unlessexplicitly stated otherwise, it is safest to assume that deep-fried fast foods and mostcommercially prepared foods contain trans-fatty acids. These unhealthy fats can bereplaced with a combination of vegetable oils that include a mix of monounsaturatedand polyunsaturated fats. These should include good sources of ω-3 fatty acids, suchas canola (rapeseed) or soybean oil.
3. Grains should be consumed primarily in a minimally refined, whole grain form, andintake of simple sugars should be low.
4. Vegetables and fruits should be consumed in abundance (5 servings per day is minimal)and should include green leafy and orange vegetables daily.
5. Red meat should be consumed only occasionally and in low amounts, if at all; nuts andlegumes as well as poultry and fish (in moderation) are healthy alternatives.
6. The optimal consumption of dairy products and calcium intake is not known, and dairyproducts should be considered as optional. High consumption of milk (e.g., more than 2servings per day) is not likely to be beneficial for middle-aged and older adults andmay increase risk of prostate and ovarian cancer. Adequate calcium intake may be par-ticularly important for growing children, adolescents, and lactating women; supplementsshould be considered if dietary sources are low.
Fig. 1. USDA food pyramid, annotated. Optimal food intakes for children and pregnantor lactating women may need further consideration. (Modified figure reproduced withpermission of Nasco Nutrition Teaching Aids.)

Chapter 28 / Preventive Nutrition Strategies 725
7. Unless one is extremely careful about a healthy food selection at every meal, consum-ing a daily RDA-level (DV) multivitamin that contains folic acid provides a sensiblenutritional safety net. Definitive evidence exists that use of a folic acid-containing mul-tivitamin supplement during the early weeks of pregnancy can prevent a large fractionof NTDs, and the Public Health Service recommends that women of childbearing ageconsume 400 μg of synthetic folic acid daily—the level found in most multivitaminsupplements (216). For most people, this level of intake is difficult and unreliable toachieve by diet alone. As noted earlier, benefits of folic acid supplementation mayextend to prevention of MI, stroke, and colon cancer, although this is not proven.Because menstrual losses of iron may not be adequately replaced by iron intake fromthe low-energy diets of women in a sedentary society, it makes sense for most pre-menopausal women to use a multivitamin that also contains iron. Because of evidenceregarding fracture risk, the amount of preformed vitamin A (retinol) in a multiple vit-amin should not exceed the Institute of Medicine RDA of 3000 IU/d, and consumingpart of this as β-carotene would be prudent. Pending further data, the use of a vitaminE supplement at a dose of 400 to 800 IU/d is reasonable for most middle-aged andolder healthy persons because available evidence suggests that this may reduce risk ofMI. Although not proven, evidence also suggests that use of vitamin C supplements atthe level of 300 to 500 mg/d may reduce risk of cataract, which may be sufficient rea-son for some individuals to consider using this supplement. Although there is no doc-umented harm from these supplements at the levels of intake suggested, further studiesneed to examine long-term effects. Also, personal physicians should be made aware ofany nutritional supplements that are being consumed in the event of possible interactionswith medications or diagnostic tests. Furthermore, use of supplements should not beconsidered as an alternative to eating a healthy diet, because foods contain a wide varietyof additional factors that are likely to contribute to good health.
8. Finally, be adventuresome in eating! Unfortunately, most of the US population hasinherited to the rather monotonous northern European dietary tradition, which is cen-tered on the consumption of meat, dairy products, and potatoes. Contemporary foodprocessing has added to the deleterious effects of this diet by the removal of dietaryfiber and micronutrients through over-refining of foods and has profoundly andadversely altered the biological effects of vegetable oils through the process of partialhydrogenation. To further aggravate matters, the worst aspects of diet tend to be themost heavily marketed and promoted. Fortunately, healthy diets do not have to beinvented or discovered through new technological advances. Existing foods, togetherwith the lessons of various cultural models of eating based primarily around minimallyprocessed foods from plant sources, provide a means of achieving a diet that is bothhealthy as well as interesting and enjoyable.
REFERENCES1. Food and Nutrition Board. Recommended Dietary Allowances, 10th revised ed. National Academy
of Sciences, Washington, DC, 1989.2. National Research Council—Committee on Diet and Health. Diet and Health: Implications for
Reducing Chronic Disease Risk. National Academy Press, Washington, DC, 1989.3. Department of Health and Human Services: The Surgeon General’s Report on Nutrition and Health.
Washington, DC, US Government Printing Office, (DHHS publication [PHS] 50210), 1988.4. US Department of Agriculture, US Department of Health and Human Services. Nutrition and Your
Health: Dietary Guidelines for Americans, Fifth ed. Report No.: Home and Garden Bulletin No. 232.Washington, DC, US Government Printing Office, 2000.
5. Willett WC. Nutritional Epidemiology, Second ed. Oxford University Press, New York, 1998.

726 Part VIII / Preventive Nutrition: Global Perspectives
6. Keys A. Serum-cholesterol response to dietary cholesterol. Am J Clin Nutr 1984; 40:351–359.7. Hegsted DM. Serum-cholesterol response to dietary cholesterol: a re-evaluation. Am J Clin Nutr
1986; 44:299–305.8. Castelli WP, Abbott RD, McNamara PM. Summary estimates of cholesterol used to predict coronary
heart disease. Circulation 1983; 67:730–734.9. Ginsberg HN, Barr SL, Gilbert A, et al. Reduction of plasma cholesterol levels in normal men on an
American Heart Association Step 1 diet or a Step 1 diet with added monounsaturated fat. N EnglJ Med 1990; 322:574–579.
10. Mensink RP, Katan MB. Effect of monounsaturated fatty acids versus complex carbohydrates onhigh-density lipoprotein in healthy men and women. Lancet 1987; 1:122–125.
11. Mensink RP, Katan MB. Effect of dietary fatty acids on serum lipids and lipoproteins: a meta-analysisof 27 trials. Arterioscler Thromb1992; 12:911–919.
12. Mensink RP, Zock PL, Kester AD, Katan MB. Effects of dietary fatty acids and carbohydrates on theratio of serum total to HDL cholesterol and on serum lipids and apolipoproteins: a meta-analysis of60 controlled trials. Am J Clin Nutr 2003; 77(5):1146–1155.
13. Garg A, Grundy SM, Koffler M. Effect of high carbohydrate intake on hyperglycemia, islet cellfunction, and plasma lipoproteins in NIDDM. Diabetes Care 1992; 15:1572–1580.
14. Brinton EA, Eisenberg S, Breslow JL. Increased apo A-I and apo A-II fractional catabolic rate inpatients with low high density lipoprotein-cholesterol levels with or without hypertriglyceridemia.J Clin Invest 1991; 87:536–544.
15. Sacks FM, Willett WC. More on chewing the fat—the good fat and the good cholesterol. N EnglJ Med 1991; 325:1740–1742.
16. Mänttäri M, Huttunen JK, Koskinen P, et al. Lipoproteins and coronary heart disease in the HelsinkiHeart Study. European Heart J 1990; 11:26h–31h.
17. Denke MA, Grundy SM. Effects of fats high in stearic acid on lipid and lipoprotein concentrationsin men. Am J Clin Nutr 1991; 54:1036–1040.
18. Hu FB, Stampfer MJ, Manson JE, et al. Dietary saturated fats and their food sources in relation tothe risk of coronary heart disease in women. Am J Clin Nutr 1999; 70:1001–1008.
19. Welsch CW. Relationship between dietary fat and experimental mammary tumorigenesis: a reviewand critique. Cancer Res 1992; 52(Suppl 7):2040S–2048S.
20. Renaud S, Kuba K, Goulet C, Lemire Y, Allard C. Relationship between fatty-acid composition ofplatelets and platelet aggregation in rat and man. Relation to thrombosis. Circ Res 1970;26:553–564.
21. Leaf A, Weber PC. Cardiovascular effects of n-3 fatty acids. N Engl J Med 1988; 318:549–557.22. Keys A. Seven countries: a multivariate analysis of death and coronary heart disease. Harvard
University Press, Cambridge, MA, 1980.23. Verschuren WM, Jacobs DR, Bloemberg BP, et al. Serum total cholesterol and long-term coronary
heart disease mortality in different cultures. Twenty-five-year follow-up of the Seven CountriesStudy. J Am Med Assoc 1995; 274:131–136.
24. Shekelle RB, Shryock AM, Paul O, et al. Diet, serum cholesterol, and death from coronary heart dis-ease: the Western Electric Study. N Engl J Med 1981; 304:65–70.
25. Hu F, Stampfer MJ, Manson JE, et al. Dietary fat intake and the risk of coronary heart disease inwomen. N Engl J Med 1997; 337:1491–1499.
26. Shekelle RB, Stamler J. Dietary cholesterol and ischemic heart disease. Lancet 1989; 1:1177–1179.27. Multiple Risk Factor Intervention Trial Research Group. Multiple Risk Factor Intervention Trial:
risk factor changes and mortality results. J Am Med Assoc 1982; 248:1465–1477.28. Stamler J, Wentworth D, Neaton JD. Is the relationship between serum cholesterol and risk of pre-
mature death from coronary heart disease continuous and graded? Findings in 356,222 primaryscreenees of the Multiple Risk Factor Intervention Trial (MRFIT). JAMA 1986; 256:2823–2828.
29. Frantz IDJ, Dawson EA, Ashman PL, et al. Test of effect of lipid lowering by diet on cardiovascu-lar risk: the Minnesota Coronary Survey. Arteriosclerosis 1989; 9:129–135.
30. Sacks F. Dietary fats and coronary heart disease. Overview. J Cardiovasc Risk 1994; 1:3–8.31. Hjermann I, Holme I, Leren P. Oslo Study Diet and Antismoking Trial: results after 102 months. Am
J Med 1986; 80:7–11.32. Bonaa KH, Bzerve KS, Staume B, Gram IT, Thelle D. Effect of eicosapentaenoic and docosa-
hexaenoic acids on blood pressure in hypertension: a population-based intervention trial from theTromso study. N Engl J Med 1990; 322:795–801.

Chapter 28 / Preventive Nutrition Strategies 727
33. Kestin M, Clifton P, Belling GB, Nestel PJ. N-3 fatty acids of marine origin lower systolic bloodpressusre and triglycerides but raise LDL cholesterol compared with N-3 and N-6 fatty acids fromplants. Am J Clin Nutr 1990; 51:1028–1034.
34. Kromhout D, Bosscheiter EB, de Lezenne Coulander C. The inverse relation between fish con-sumption and 20-year mortality from coronary heart disease. N Engl J Med 1985;312:1205–1209.
35. Burr ML, Fehily AM, Gilbert JF, et al. Effects of changes in fat, fish, and fibre intakes on death andmyocardial reinfarction: diet and reinfarction trial (DART). Lancet 1989; 2:757–761.
36. Vollset SE, Heuch I, Bjelke E. Fish consumption and mortality from coronary heart disease (letter).N Engl J Med 1985; 313:820,821.
37. Ascherio A, Rimm EB, Stampfer MJ, Giovannucci E, Willett WC. Dietary intake of marine n-3 fattyacids, fish intake and the risk of coronary disease among men. N Engl J Med 1995; 332:977–982.
38. Morris MC, Manson JE, Rosner B, Buring JE, Willett WC, Hennekens CH. Fish consumption andcardiovascular disease in the Physicians’ Health Study: a prospective study. Am J Epidemiol 1995;142:166–175.
39. de Lorgeril M, Renaud S, Mamelle N, et al. Mediterranean alpha-linolenic acid-rich diet in sec-ondary prevention of coronary heart disease. Lancet 1994; 343:1454–1459.
40. Leaf A. Omega-3 fatty acids and prevention of ventricular fibrillation. Prostaglandins LeukotrienesEssential Fatty Acids 1995; 52:197,198.
41. GISSI-Prevention Investigators. Dietary supplementation with n-3 polyunsaturated fatty acids andvitamin E after myocardial infarction: results of the GISSI-Prevenzione Trial. Lancet 1999;354:447–455.
42. Booyens J, Louwrens CC. The Eskimo diet. Prophylactic effects ascribed to the balanced presenceof natural cis unsaturated fatty acids and to the absence of unnatural trans and cis isomers of unsat-urated fatty acids. Med Hypoth 1986; 21:387–408.
43. Mensink RPM, Katan MB. Effect of dietary trans fatty acids on high-density and low-densitylipoprotein cholesterol levels in healthy subjects. N Engl J Med. 1990; 323:439–445.
44. Zock PL, Katan MB. Hydrogenation alternatives: effects of trans fatty acids and stearic acid versuslinoleic acid on serum lipids and lipoproteins in humans. J Lipid Res 1992; 33:399–410.
45. Judd JT, Clevidence BA, Muesing RA, Wittes J, Sunkin ME, Podczasy JJ. Dietary trans fatty acids:effects of plasma lipids and lipoproteins on healthy men and women. Am J Clin Nutr 1994;59:861–868.
46. Nestel P, Noakes M, Belling Bea. Plasma lipoprotein and Lp[a] changes with substitution of elaidicacid for oleic acid in the diet. J Lipid Res 1992; 33:1029–1036.
47. Sundram K, Ismail A, Hayes KC, Jeyamalar R, Pathmanathan R. Trans (elaidic) fatty acids adverselyaffect the lipoprotein profile relative to specific saturated fatty acids in humans. J Nutr 1997;127:514S–520S.
48. Mensink RP, Zock PL, Katan MB, Hornstra G. Effect of dietary cis and trans fatty acids on serumlipoprotein [a] levels in humans. J Lipid Res 1992; 33:1493–1501.
49. Kromhout D, Menotti A, Bloemberg B, et al. Dietary saturated and trans fatty acids and cholesteroland 25-year mortality from coronary heart disease: the Seven Countries Study. Prev Med 1995;24:308–315.
50. Ascherio A, Hennekens CH, Buring JE, Master C, Stampfer MJ, Willett WC. Trans fatty acids intakeand risk of myocardial infarction. Circulation 1994; 89:94–101.
51. Siguel EN, Lerman RH. Trans-fatty acid patterns in patients with angiographically documentedcoronary artery disease. Am J Cardiol 1993; 71:916–920.
52. Aro A, Kardinaal AF, Salminen I, et al. Adipose tissue isomeric trans fatty acids and risk of myocar-dial infarction in nine countries: the EURAMIC study. Lancet 1995; 345:273–278.
53. Ascherio A, Katan MB, Zock PL, Stampfer MJ, Willett WC. Trans fatty acids and coronary heartdisease. N Engl J Med 1999; 340:1994–1998.
54. Steinberg D, Witztum JL. Lipoproteins and atherogenesis: current concepts. J Am Med Assoc 1990;264:3047–3052.
55. Gey KF, Brubacher GB, Stahelin HB. Plasma levels of antioxidant vitamins in relation to ischemicheart disease and cancer. Am J Clin Nutr 1987; 45(s):1368–1377.
56. Reaven P, Parthasaranthy S, Grasse BJ, Miller E, Steinberg D, Witztum JL. Effects of oleate-rich andlinoleate-rich diets on the susceptibility of low density lipoprotein to oxidative modification inmildly hypercholesterolemic subjects. J Clin Invest 1993; 91:668–676.

728 Part VIII / Preventive Nutrition: Global Perspectives
57. Berry EM, Eisenberg S, Friedlander Y, et al. Effects of diets rich in monounsaturated fatty acids onplasma lipoproteins—the Jerusalem Nutrition Study: monousaturated vs saturated fatty acids. NutrMetab Cardiovasc Dis 1995; 5:55–62.
58. Prentice RL, Sheppard L. Dietary fat and cancer. Consistency of the epidemiologic data, and diseaseprevention that may follow from a practical reduction in fat consumption. Cancer Causes Control1990; 1:81–97.
59. Armstrong B, Doll R. Environmental factors and cancer incidence and mortality in different coun-tries, with special reference to dietary practices. Int J Cancer 1975; 15:617–631.
60. Ip C. Quantitative Assessment of Fat and Calorie as Risk Factors in Mammary Carcinogenesis in anExperimental Model. In: Mettlin CJ, Aoki K, eds. Recent Progress in Research on Nutrition andCancer: Proceedings of a Workshop Sponsored by the International Union Against Cancer, Held inNagoya, Japan, November 1–3, 1989. Wiley-Liss, New York, 1990, pp. 107–117.
61. Freedman LS, Clifford C, Messina M. Analysis of dietary fat, calories, body weight, and the devel-opment of mammary tumors in rats and mice: a review. Cancer Res 1990; 50:5710–5719.
62. Appleton BS, Landers RE. Oil gavage effects on tumor incidence in the National ToxicologyProgram’s 2-year carcinogenesis bioassay. Adv Experim Med Biol 1986; 206:99–104.
63. Neural tube defect surveillance and folic acid intervention—Texas-Mexico border, 1993–1998.MMWR Morb Mortal Wkly Rep 2000; 49(1):1–4.
64. Howe GR, Hirohata T, Hislop TG, et al. Dietary factors and risk of breast cancer: combined analy-sis of 12 case-control studies. J Natl Cancer Inst 1990; 82:561–569.
65. Willett WC, Hunter DJ, Stampfer MJ, et al. Dietary fat and fiber in relation to risk of breast cancer:an 8-year follow-up. J Am Med Assoc 1992; 268:2037–2044.
66. Mills PK, Beeson WL, Phillips RL, Fraser GE. Dietary habits and breast cancer incidence amongSeventh-day Adventists. Cancer 1989; 64:582–590.
67. Kushi LH, Sellers TA, Potter JD, et al. Dietary fat and postmenopausal breast cancer. J Natl CancerInst 1992; 84:1092–1099.
68. Howe GR, Friedenreich CM, Jain M, Miller AB. A cohort study of fat intake and risk of breast can-cer. J Natl Cancer Inst 1991; 83:336–340.
69. Graham S, Zielezny M, Marshall J, et al. Diet in the epidemiology of postmenopausal breast cancerin the New York State cohort. Am J Epidemiol 1992; 136:1327–1337.
70. Van den Brandt PA, Van’t Veer P, Goldbohm RA, et al. A prospective cohort study on dietary fat andthe risk of postmenopausal breast cancer. Cancer Res 1993;53:75–82.
71. Smith-Warner SA, Spiegelman D, Adami HO, et al. Types of dietary fat and breast cancer: a pooledanalysis of cohort studies. Int J Cancer 2001; 92:767–774.
72. Hunter DJ, Willett WC. Diet, body size, and breast cancer. Epidemiol Rev 1993; 15:110–132.73. Holmes MD, Hunter DJ, Colditz GA, et al. Association of dietary intake of fat and fatty acids with
risk of breast cancer. JAMA 1999; 281:914–920.74. Cho E, Spiegelman D, Hunter DJ, et al. Premenopausal fat intake and risk of breast cancer. J Natl
Cancer Inst 2003; 95:1079–1085.75. Adlercreutz H. Western diet and western diseases: some hormonal and biochemical mechanisms and
associations. Scand J Clin Lab Invest 1990; 50 (Suppl 201):3–23.76. Yuan JM, Wang QS, Ross RK, Henderson BE, Yu MC. Diet and breast cancer in Shanghai and
Tianjin, China. Br J Cancer 1995; 71:1353–1358.77. Dai Q, Shu XO, Jin F, et al. Population-based case-control study of soyfood intake and breast can-
cer risk in Shanghai. Br J Cancer 2001; 85(3):372–378.78. Micozzi MS. Nutrition, body size, and breast cancer. Yearbook Phys Anthropol 1985; 28:175–206.79. Vatten LJ, Kvinnsland S. Body height and risk of breast cancer. A prospective study of 23,831
Norwegian women. Br J Cancer 1990; 61:881–885.80. Swanson CA, Jones DY, Schatzkin A, Brinton LA, Ziegler RG. Breast cancer risk assessed by
anthropometry in the NHANES I epidemiological follow-up study. Cancer Res 1988;48:5363–5367.
81. Henderson BE, Ross RK, Pike MC. Toward the primary prevention of cancer. Science 1991;254:1131–1138.
82. Meyer F, Moisan J, Marcoux D, Bouchard C. Dietary and physical determinants of menarche.Epidemiology 1990; 1:377–381.
83. Chen X, Yang GQ, Chen J, Chen X, Wen Z, Ge K. Studies on the relations of selenium and Keshandisease. Biol Trace Element Res 1980; 2:91–107.

Chapter 28 / Preventive Nutrition Strategies 729
84. Whittemore AS, Wu-Williams AH, Lee M, et al. Diet, physical activity and colorectal cancer amongChinese in North America and China. J Natl Cancer Inst 1990; 82:915–926.
85. Willett WC, Stampfer MJ, Colditz GA, Rosner BA, Speizer FE. Relation of meat, fat, and fiber intaketo the risk of colon cancer in a prospective study among women. N Engl J Med 1990; 323:1664–1672.
86. Giovannucci E, Rimm EB, Ascherio A, Stampfer MJ, Colditz GA, Willett WC. Alcohol, low-methionine-low-folate diets, and risk of colon cancer in men. J Natl Cancer Inst 1995; 87:265–273.
87. Phillips RL, Snowdon DA. Association of meat and coffee use with cancers of the large bowel,breast, and prostate among Seventh-Day Adventists: Preliminary results. Cancer Res 1983;43(Suppl):2403S–2408S.
88. Giovannucci E, Stampfer MJ, Colditz GA, Rimm EB, Willett WC. Relationship of diet to risk of col-orectal adenoma in men. J Natl Cancer Inst 1992; 84:91–98.
89. Gerhardsson de Verdier M, Hagman U, Peters RK, Steineck G, Overik E. Meat, cooking methodsand colorectal cancer: a case-referent study in Stockholm. Int J Cancer 1991; 49:520–525.
90. Babbs CF. Free radicals and the etiology of colon cancer. Free Radic Biol Med 1990; 8:191–200.91. Norat T, Lukanova A, Ferrari P, Riboli E. Meat consumption and colorectal cancer risk:
dose–response meta-analysis of epidemiological studies. Int J Cancer 2002; 98:241–256.92. Kolonel LN, Yoshizawa CN, Hankin JH. Diet and prostatic cancer: a case–control study in Hawaii.
Am J Epidemiol 1988; 127:999–1012.93. Graham S, Haughey B, Marshall J, et al. Diet in the epidemiology of carcinoma of the prostate gland.
J Natl Cancer Inst 1983; 70:687–692.94. Kolonel LN. Nutrition and prostate cancer. Cancer Causes Control 1996; 7:83–94.95. World Cancer Research Fund, American Institute for Cancer Research. Food, Nutrition and the
Prevention of Cancer: a Global Perspective. American Institutue for Cancer Research, Washington,DC, 1997.
96. Giovannucci E, Rimm EB, Stampfer MJ, Colditz GA, Ascherio A, Willett WC. Intake of fat, meat,and fiber in relation to risk of colon cancer in men. Cancer Res 1994; 54:2390–2397.
97. Seidell JC, Derenberg I. Obesity in Europe - prevalences and consequences for use of medical care.Pharmacoeconomics 1994; 5(Suppl 1):38–44.
98. National Diet-Heart Study Research Group. The National Diet–Heart Study Final Report.Circulation 1968; 18(s):1–154.
99. Sheppard L, Kristal AR, Kushi LH. Weight loss in women participating in a randomized trial of low-fat diets. Am J Clin Nutr 1991; 54:821–828.
100. Lee-Han H, Cousins M, Beaton M, et al. Compliance in a randomized clinical trial of dietary fatreduction in patients with breast dysplasia. Am J Clin Nutr 1988; 48:575–586.
101. Willett WC, Leibel RL. Dietary fat is not a major determinant of body fat. Am J Med 2002;113(Suppl 9B):47S–59S.
102. Kasim SE, Martino S, Kim PN, et al. Dietary and anthropometric determinants of plasma lipopro-teins during a long-term low-fat diet in healthy women. Am J Clin Nutr 1993; 57:146–153.
103. Shintani TT, Hughes CK, Beckman S, O’Connor HK. Obesity and cardiovascular risk interventionthrough the ad libitum feeding of a traditional Hawaiian diet. Am J Clin Nutr 1991; 6:1647s–1651s.
104. Block G, Patterson B, Subar A. Fruit, vegetables, and cancer prevention: a review of the epidemio-logical evidence. Nutr Cancer 1992; 18:1–29.
105. Steinmetz KA, Potter JD. Vegetables, fruit and cancer. I. Epidemiology. Cancer Causes Control1991; 2:325–357.
106. Michels KB, Giovannucci E, Joshipura KJ, et al. Fruit and vegetable consumption and colorectalcancer incidence. IARC Sci Publ 2002; 156:139–140.
107. Willett WC. Vitamin A and lung cancer. Nutr Rev. 1990; 48:201–211.108. Peto R, Doll R, Buckley JD, Sporn MB. Can dietary beta-carotene materially reduce human cancer
rates? Nature 1981; 290:201–208.109. The Alpha-Tocopherol Beta-Carotene Cancer Prevention Study Group. The effect of vitamin E and
beta carotene on the incidence of lung cancer and other cancers in male smokers. N Engl J Med1994; 330:1029–1035.
110. Omenn GS, Goodman GE, Thornquist MD, et al. Effects of a combination of beta carotene and vit-amin A on lung cancer and cardiovascular disease. N Engl J Med 1996; 334:1150–1155.
111. Hennekens CH, Buring JE, Manson JE, et al. Lack of effect of long-term supplementation with betacarotene on the incidence of malignant neoplasms and cardiovascular disease. N Engl J Med 1996;334:1145–1149.

730 Part VIII / Preventive Nutrition: Global Perspectives
112. Block G, Abrams B. Vitamin and mineral status of women of childbearing potential. Ann N Y AcadSci 1993; 678:244–254.
113. Botterweck AA, van den Brandt PA, Goldbohm RA. A prospective cohort study on vegetable andfruit consumption and stomach cancer risk in the Netherlands. Am J Epidemiol 1998;148:842–853.
114. Correa P, Haenszel W, Cuello C, Tannenbaum S, Archer M. A model for gastric cancer epidemiology.Lancet 1975; 2:58–60.
115. Trock B, Lanza E, Greenwald P. Dietary fiber, vegetables, and colon cancer: critical review andmeta-analyses of the epidemiologic evidence. J Natl Cancer Inst 1990; 82:650–661.
116. Giovannucci E, Stampfer MJ, Colditz GA, et al. Folate, methionine, and alcohol intake and risk ofcolorectal adenoma. J Natl Cancer Inst 1993; 85:875–884.
117. Smith-Warner SA, Spiegelman D, Yaun SS, et al. Intake of fruits and vegetables and risk of breastcancer: a pooled analysis of cohort studies. JAMA 2001; 285:769–776.
118. Morris JN, Marr JW, Clayton DG. Diet and heart: a postscript. Br Med J 1977; 2:1307–1314.119. Khaw KT, Barrett-Connor E. Dietary fiber and reduced ischemic heart disease mortality rates in men
and women: a 12-year prospective study. Am J Epidemiol 1987; 126:1093–1102.120. Hu FB, Willett WC. Optimal diets for prevention of coronary heart disease. JAMA 2002;
288(20):2569–2578.121. Stampfer MJ, Malinow MR, Willett WC, et al. A prospective study of plasma homocyste(e)ine and
risk of myocardial infarction in US physicians. J Am Med Assoc 1992; 268:877–881.122. Kang SS, Wong PWK, Norusis M. Homocysteinemia due to folate deficiency. Metabolism 1987;
36:458–462.123. Selhub J, Jacques PF, Bostom AG, et al. Association between plasma homocysteine concentrations
and extracranial carotid-artery stenosis. N Engl J Med 1995; 332:286–291.124. Kang SS, Wong PWK, Cook HY, Norusis M, Messer JV. Protein bound homocyst(e)ine—a possible
risk factor for coronary artery disease. J Clin Invest 1986; 77:1482–1486.125. Wilcken DEL, Dudman NPB, Tyrrell PA. Homocystinuria due to cystathionine B-synthase
deficiency—the effects of betaine treatment in pyridoxine-responsive patients. Metabolism 1985;34:1115–1121.
126. Ascherio A, Stampfer MJ, Colditz GA, Rimm EB, Litin L, Willett WC. Correlations of vitamin Aand E intakes with the plasma concentrations of carotenoids and tocopherols among American menand women. J Nutr 1992; 122:1792–1801.
127. Sacks FM, Willett WC, Smith A, Brown LE, Rosner B, Moore TJ. Effect on blood pressure of potas-sium, calcium, and magnesium in women with low habitual intake. Hypertension 1998; 31:131–138.
128. MRC Vitamin Study Research Group. Prevention of neural tube defects: results of the MedicalResearch Council Vitamin Study. Lancet 1991; 338:131–137.
129. Werler MM, Shapiro S, Mitchell AA. Periconceptional folic acid exposure and risk of occurrentneural tube defects. JAMA 1993; 269:1257–1261.
130. van der Put NM, Steegers-Theunissen RP, Frosst P, et al. Mutated methylenetetrahydrofolate reduc-tase as a risk factor for spina bifida. Lancet 1995; 346:1070–1071.
131. Jacques PF, Hartz SC, Chylack LT, McGandy RB, Sadowski JA. Nutritional status in persons withand without senile cataract: blood vitamin and mineral levels. Am J Clin Nutr 1988; 48:152–158.
132. Hankinson SE, Stampfer MJ, Seddon JM, et al. Nutrient intake and cataract extraction in women: aprospective study. Br Med J 1992; 305:335–339.
133. Chasan-Taber L, Willett WC, Seddon JM, et al. A propective study of carotenoid and vitamin Aintakes and risk of cataract extraction in US women. Am J Clin Nutr 1999; 70:509–516.
134. Hankinson SE, Willett WC, Colditz GA, et al. A prospective study of smoking and risk of cataractsurgery in women. J Am Med Assoc 1992; 268:994–998.
135. Seddon JM, Ajani UA, Sperduto RD, et al. Dietary carotenoids, vitamins A, C, and E, and advancedage-related macular degeneration. J Am Med Assoc 1994; 272:1413–1420.
136. Schalch W. Carotenoids in the retina: a review of their possible role in preventing or limiting dam-age caused by light and oxygen. In: Emerit I, Chance B, eds. Free Radicals and Aging. Vol. 62. Basel,Switzerland: Birkhauser Verlag; 1992, pp. 280–298.
137. Jeppesen J, Hollenbeck CB, Zhou MY, et al. Relation between insulin resistance, hyperinsulemia,postheparin plasma lipoprotein lipase activity, and postprandial lipemia. Arterioscler Thromb VascBiol 1995; 15:320–324.
138. Jeppesen J, Chen YDI, Zhou MY, Schaaf P, Coulston A, Reaven GM. Postprandial triglyceride andretinyl ester responses to oral fats effects of fructose. Am J Clin Nutr 1995; 61:787–791.

Chapter 28 / Preventive Nutrition Strategies 731
139. Jenkins DJ, Wolever TM, Taylor RH, et al. Glycemic index of foods: a physiological basis for car-bohydrate exchange. Am J Clin Nutr 1981; 34:362–366.
140. Salmeron J, Manson JE, Stampfer MJ, Colditz GA, Wing AL, Willett WC. Dietary fiber, glycemic load,and risk of non-insulin-dependent diabetes mellitus in women. J Am Med Assoc 1997; 277:472–477.
141. Salmeron J, Ascherio A, Rimm EB, et al. Dietary fiber, glycemic load, and risk of NIDDM in Men.Diabetes Care 1997; 20:545–550.
142. Liu S, Willett WC, Stampfer MJ, et al. A prospective study of dietary glycemic load, carbohydrateintake, and risk of coronary heart disease in US women. Am J Clin Nutr 2000; 71:1455–1461.
143. Willett W. The search for the causes of breast and colon cancer. Nature 1989; 338:389–394.144. Fuchs CS, Colditz GA, Stampfer MJ, et al. Dietary fiber and the risk of colorectal cancer and adenoma
in women. N Engl J Med 1999; 340:169–176.145. Terry P, Giovannucci E, Michels KB, et al. Fruit, vegetables, dietary fiber, and risk of colorectal cancer.
J Natl Cancer Inst 2001; 93(7):525–533.146. Jenkins DJ, Wolever TM, Rao AV, et al. Effect of blood lipids of very high intakes of fiber in diets
low in saturated fat and cholesterol. N Engl J Med 1993; 329:21–26.147. Brown L, Rosner B, Willett WC, Sacks FM. Cholesterol-lowering effects of dietary fiber: a meta-
analysis. Am J Clin Nutr 1999; 69:30–42.148. Rimm EB, Ascherio A, Giovannucci E, Spiegelman D, Stampfer MJ, Willett WC. Vegetable, fruit,
and cereal fiber intake and risk of coronary heart disease among men. J Am Med Assoc 1996;275:447–451.
149. Schroeder HA. Losses of vitamins and trace minerals resulting from processing and preservation offoods. Am J Clin Nutr 1971; 24:562–573.
150. Lutz J, Linkswiler HM. Calcium metabolism in postmenopausal women and osteoporotic womenconsuming two levels of dietary protein. Am J Clin Nutr 1981; 34:2178–2186.
151. Gruberg ER, Raymond SA. Beyond Cholesterol. St. Martin’s, New York, 1981.152. Youngman LD, Campbell TC. The sustained development of preneoplastic lesions depends on high
protein intake. Nutr Cancer 1992; 18:131–142.153. Hu FB, Stampfer MJ, Manson JE, et al. Dietary protein and risk of ischemic heart disease in women.
Am J Clin Nutr 1999; 70:221–227.154. Welsh S, Davis C, Shaw A. Development of the food guide pyramid. Nutr Today 1992; 27:12–23.155. Chapuy MC, Arlof ME, Duboeuf F, et al. Vitamin D3 and calcium to prevent hip fractures in elderly
women. N Engl J Med 1992; 327:1637–1642.156. Heaney RP. Thinking straight about calcium. N Engl J Med 1993; 328:503,504.157. Office of Medical Applications of Research—National Institutes of Health. Osteoporosis. JAMA
1984; 252:799.158. Nordin BEC. International patterns of osteoporosis. Clin Orthop 1966;45:17–20.159. Holbrook TL, Barrett-Conner E, Wingard DL. Dietary calcium and risk of hip fracture: 14-year
prospective population study. Lancet 1988; 2:1046–1049.160. Feskanich D, Willett WC, Colditz GA. Calcium, vitamin D, milk consumption, and hip fractures: a
prospective study among postmenopausal women. Am J Clin Nutr 2003; 77(2):504–511.161. Michaelsson K, Melhus H, Bellocco R, Wolk A. Dietary calcium and vitamin D intake in relation to
osteoporotic fracture risk. Bone 2003; 32(6):694–703.162. Feskanich D, Willett W, Colditz G. Walking and leisure-time activity and risk of hip fracture in post-
menopausal women. JAMA 2002; 288(18):2300–2306.163. Wickham CAC, Walsh K, Cooper C, et al. Dietary calcium, physical activity, and risk of hip fracture:
a prospective study. Br Med J 1989; 299:889–892.164. Michaelsson K, Holmberg L, Mallmin H, et al. Diet and hip fracture risk: a case–control study. Intl
J Epidemiol 1995; 24:771–782.165. Feskanich D, Willett WC, Stampfer MJ, Colditz GA. Milk, dietary calcium, bone fractures in
women: a 12-year prospective study. Am J Public Health 1997; 87:992–997.166. McCarron DA, Morris CD, Henry HJ, Stanton JL. Blood pressure and nutrient intake in the United
States. Science 1984; 224:1392–1398.167. The Trials of Hypertension Prevention Collaborative Research Group. The effects of nonpharmaco-
logic interventions on blood pressure of persons with high normal levels. J Am Med Assoc 1992;267:1213–1220.
168. Martinez ME, Willett WC. Calcium, vitamin D, and colorectal cancer: a review of the epidemiologicevidence. Cancer Epidemiol Biomark Prev 1998; 7:163–168.

732 Part VIII / Preventive Nutrition: Global Perspectives
169. Baron JA, Beach M, Mandel JS, et al. Calcium supplements for the prevention of colorectal adenomas.The Calcium Polyp Prevention Study Group. N Engl J Med 1999; 340:101–107.
170. Giovannucci E, Rimm EB, Wolk A, et al. Calcium and fructose intake in relation to risk of prostatecancer. Cancer Res 1998; 58:442–447.
171. Giovannucci E. Nutritional and Environmental Epidemiology of Prostate Cancer. In: Kantoff PW,Carroll PR, D’Amico AV, eds. Prostate Cancer: Principles and Practice. Lippincott Williams &Wilkins Philadelphia, PA, 2002, pp. 117–139.
172. Law MR, Frost CD, Wald NJ. By how much does dietary salt reduction lower blood pressure?III-Analysis of data from trials of salt reduction. Br Med J 1991; 302:819–824.
173. Correa P, Fontham E, Pickle LW, Chen V, Lin Y, Haenszel W. Dietary determinants of gastric can-cer in south Louisiana inhabitants. J Natl Cancer Inst. 1985; 75:645–654.
174. Willett WC, Dietz WH, Colditz GA. Guidelines for healthy weight. N Engl J Med 1999;341:427–434.
175. Manson JE, Stampfer MJ, Hennekens CH, Willett WC. Body weight and longevity. A reassessment.J Am Med Assoc 1987; 257:353–358.
176. Garrison RJ, Kannel WB. A new approach for estimating healthy body weights. Int J Obesity 1993;17:417–423.
177. Lew EA, Garfinkel L. Variations in mortality by weight among 750,000 men and women. J ChronicDis 1979; 32:563–576.
178. Willett WC, Manson JE, Stampfer MJ, et al. Weight, weight change, and coronary heart disease inwomen: risk within the ‘normal’ weight range. J Am Med Assoc 1995; 273:461–465.
179. Colditz GA, Willett WC, Stampfer MJ, et al. Relative weight and increased risk of diabetes in acohort of US women (abstract). Am J Epidemiol 1987; 126:750,751.
180. Witteman JC, Willett WC, Stampfer MJ, et al. Relation of moderate alcohol consumption and riskof systemic hypertension in women. Am J Cardiol 1990; 65:633–637.
181. International Agency for Research on Cancer. Weight Control and Physical Activity. Vol. 6;. In:Vainio H, Bianchini F, eds. IARC Handbooks of Cancer Prevention IARCPress, Lyon, 2002.
182. Call e EE, Rodriguez C, Walker-Thurmond K, Thun MJ. Overweight, obesity, and mortality fromcancer in a prospectively studied cohort of U.S. adults. N Engl J Med 2003; 348(17):1625–1638.
183. Maclure KM, Hayes KC, Colditz GA, Stampfer MJ, Speizer FE, Willett WC. Weight, diet and riskof symptomatic gallstones in middle-aged women. N Engl J Med 1989; 321:563–569.
184. Lindsted K, Tonstad S, Kuzma J. Body mass index and patterns of mortality among Seventh-dayAdventists. Int J Obesity 1991; 15:397–406.
185. Manson JE, Willett WC, Stampfer MJ, et al. Body weight and mortality among women. N Engl JMed 1995; 333:677–685.
186. Gortmaker SL, Dietz WH, Cheung LW. Inactivity, diet, and the fattening of America. J Am DietAssoc 1990; 90:1247–1252.
187. Klatsky AL, Armstrong MA, Friedman GD. Risk of cardiovascular mortality in alcohol drinkers,ex-drinkers, and nondrinkers. Am J Cardiol 1990; 66:1237–1242.
188. Rimm EB, Giovannucci EL, Willett WC, et al. Prospective study of alcohol consumption and risk ofcoronary disease in men. Lancet 1991; 338:464–468.
189. Renaud S, de Lorgeril M. Wine, alcohol, platelets, and the French paradox for coronary disease.Lancet 1992; 339:1523–1526.
190. Maclure M. Demonstration of deductive meta-analysis: ethanol intake and risk of myocardial infarction.Epidemiol Rev 1993; 15:328–351.
191. Mukamal KJ, Conigrave KM, Mittleman MA, et al. Roles of drinking pattern and type of alcoholconsumed in coronary heart disease in men. N Engl J Med 2003; 348:109–118.
192. Longnecker MP. Alcoholic beverage consumption in relation to risk of breast cancer: meta-analysisand review. Cancer Causes Control 1994; 5:73–82.
193. Longnecker MP, Newcomb PA, Mittendorf R, et al. Risk of breast cancer in relation to lifetime alco-hol consumption. J Natl Cancer Inst 1995; 87:923–929.
194. Smith-Warner SA, Spiegelman D, Yaun S-S, et al. Alcohol and breast cancer in women: a pooledanalysis of cohort studies. J Am Med Assoc 1998; 279:535–540.
195. Reichman ME, Judd JT, Longcope C, et al. Effects of alcohol consumption on plasma and urinaryhormone concentrations in premenopausal women. J Natl Cancer Inst 1993; 85:722–727.
196. Hankinson SE, Willett WC, Manson JE, et al. Alcohol, height, and adiposity in relation to estrogenand prolactin levels in postmenopausal women. J Natl Cancer Inst 1995; 87:1297–1302.

Chapter 28 / Preventive Nutrition Strategies 733
197. Boffetta P, Garfinkel L. Alcohol drinking and mortality among men enrolled in a American CancerSociety prospective study. Epidemiology 1990; 1:342–348.
198. Fuchs CS, Stampfer MJ, Colditz GA, et al. Alcohol consumption and mortality among women. NEngl J Med 1995; 332:1245–1250.
199. Willett WC. Folic acid and neural tube defect: Can’t we come to closure? Am J Publ Health 1992;82:666–668.
200. Giovannucci E. Epidemiologic studies of folate and colorectal neoplasia: a review. J Nutrition 2002;132:2350S–2355S.
201. Rimm E, Willett W, Manson J, Speizer F, Hennekens C, Stampfer M. Folate and vitamin B6 intake andrisk of myocardial infarction among US women (abstract). Am J Epidemiol 1996; 143(Suppl):S36.
202. Stampfer MJ, Hennekens CH, Manson JE, Colditz GA, Rosner B, Willett WC. Vitamin E consump-tion and the risk of coronary disease in women. N Engl J Med 1993; 328:1444–1449.
203. Rimm EB, Stampfer MJ, Ascherio A, Giovannucci E, Colditz GA, Willett WC. Vitamin E con-sumption and the risk of coronary heart disease in men. N Engl J Med 1993; 328:1450–1456.
204. Yusuf S, Dagenais G, Pogue J, Bosch J, Sleight P. Vitamin E supplementation and cardiovascularevents in high-risk patients. The Heart Outcomes Prevention Evaluation Study Investigators. N EnglJ Med 2000; 342:154–160.
205. Gridley G, McLaughlin JK, Block G, Blot WJ, Gluch M, Frauneril JF. Vitamin supplement use andreduced risks of oral and pharyngeal cancer. Am J Epidemiol 1992; 135:1083–1092.
206. Enstrom JE, Kanim LE, Klein MA. Vitamin C intake and mortality among a sample of the UnitedStates population. Epidemiology 1992; 3:194–202.
207. Osganian SK, Stampfer MJ, Rimm E, et al. Vitamin C and risk of coronary heart disease in women.J Am Coll Cardiol 2003; 42(2):246–252.
208. Hunter DJ, Manson JE, Colditz GA, et al. A prospective study of the intake of vitamins C, E and Aand the risk of breast cancer. N Engl J Med 1993; 329:234–240.
209. Feskanich D, Singh V, Willett WC, Colditz GA. Vitamin A intake and hip fractures among post-menopausal women. JAMA 2002; 287(1):47–54.
210. Melhus H, Michaelsson K, Kindmark A, et al. Excessive dietary intake of vitamin A is associatedwith reduced bone mineral density and increased risk for hip fracture. Ann Intern Med 1998;129:770–778.
211. Ballew C, Galuska D, Gillespie C. High serum retinyl esters are not associated with reduced bonemineral density in the Third National Health and Nutrition Examination Survey, 1988-1994. J BoneMiner Res 2001; 16(12):2306–2312.
212. Blot WJ, Li JY, Taylor PR, et al. Nutrition intervention trials in Linxian, China: supplementationwith specific vitamin/mineral combinations, cancer incidence, and disease-specific mortality in thegeneral population. J Natl Cancer Inst 1993; 85:1483–1492.
213. Vieth R, Chan P, MacFarlane G. Efficacy and safety of vitamin D3 intake exceeding the lowestobserved adverse effect level. Am J Clin Nutr 2001; 73(2):288–294.
214. Rothman KJ, Moore LL, Singer MR, et al. Teratogenicity of high vitamin A intake. N Engl J Med1995; 333:1369–1373.
215. Oakley GP, Erickson JD. Vitamin A and birth defects. N Engl J Med 1995; 333:1414,1415.216. Anonymous. Recommendations for the use of folic acid to reduce the number of cases of spina bifida
and other neural tube defects (review). MMWR Morbid Mortal Wkly Report 1992; 41(RR-14):1–7.


From: Preventive Nutrition: The Comprehensive Guide for Health Professionals, Third EditionEdited by: A. Bendich and R. J. Deckelbaum © Humana Press Inc., Totowa, NJ
735
29 Nutrition and Food Policy in NorwayEffects on Reduction of Coronary Heart Disease
Kaare R. Norum, Gunn-Elin Aa. Bjørneboe,Arne Oshaug, Grete Botten, and Lars Johansson
KEY POINTS
● The Norwegian Nutrition and Food Policy has its roots in the 1930s. A NationalNutrition Council (NNC) was established in 1937 and re-organized in1946. Since then,it has had a mandate to give advice to the government regarding nutrition.
● After 1950, there was a substantial increase in mortality from coronary heart diseases(CHDs) that was associated with changes in food habits and lifestyle. In 1963, thisincrease resulted in an official Norwegian report on the relationship between dietary fatand cardiovascular disease. The report formed a basis for subsequent work, with the for-mulation of an official integrated Norwegian Nutrition and Food Policy.
● A White Paper was presented to the Storting (Norwegian Parliament) through ReportNo. 32 (1975–1976) “On Norwegian Nutrition and Food Policy.” In 1981, the govern-ment presented a follow-up White Paper. Later, the Nutrition and Food Policy was inte-grated into the health policy in reports to the Storting in 1993 and 2003.
● These four White Papers define the nutritional goals to be achieved for Norway and themeasures that the government intends to employ to improve the Norwegian diet.
● The most recent White Paper advocated a broad health policy. It drew attention to theconnections between the individual’s and the community’s responsibility for and possi-bility of influencing the health situation. At the ministerial level, two official bodies aregiven the responsibility to coordinate the implementation of the Nutrition and FoodPolicy: the National Food Control Authority and the NNC.
● The official nutrition and food policy White Papers have been central political andstrategic documents in the efforts to improve public health in Norway during the last 30 yr.Currently, we can see several changes in Norwegian eating habits. Fat consumption hasdecreased from 40 to 34% of the food energy, mainly by a reduction of saturated andtrans fat. Concomitantly, blood cholesterol has decreased, and mortality from CHDamong middle-aged individuals has decreased by 60% during the last 30 yr.
● However, the prevalence of cancer, obesity, and type 2 diabetes has increased in theNorwegian population. The most recent White Paper was seriously concerned with

736 Part VIII / Preventive Nutrition: Global Perspectives
these problems and provided suggestions and measures both for the society and theindividual for improving the diet and increasing physical activity in daily life duringthe whole lifetime.
1. THE EARLY HISTORY OF THE NORWEGIAN NUTRITIONAND FOOD POLICY
Nutrition and Food Policy has a relatively long history in Norway. It began around 1930when an official school breakfast was introduced for all children in primary schools (1).Meanwhile, the Norwegian Medical Association took the initiative to study the inter-relationbetween income, nutrition, and health (2). This issue created an intense debate in the soci-ety, and both medical doctors and leading economists contributed to the discussion. It isinteresting that prominent economists, two of whom (3) later received Nobel Prizes, pub-lished papers on diet, nutrition, and income (3,4). Simultaneously, the League of Nationsraised the issue that it should be a collective duty of a society to take on the responsibilityfor a nutrition and food policy. In Norway, the Director General of Health, Karl Evang,strongly subscribed to that idea, arguing that the question of the diet of the people was anational responsibility and demanding solutions through appropriate measures in manysectors in the society. The idea of disease prevention and health promotion as intersector-ial work has since gained support in Norway and is now a platform in the health policy.The establishment of a National Nutrition Council (NNC) in Norway in 1937 was closelyrelated to suggestion by the League of Nations. A specific task of the NNC was to create anutrition and food policy that the government and Parliament could adopt.
The nutritional problems in Norway at that time were caused by poverty, and themeasures in the nutrition policy were closely linked to stimulate economic growth andequal distribution of goods and services. Nutritional education, information, and commu-nication also were considered very important.
In 1939, Norway took a major initiative to improve the nutritional situation of thepopulation with the participation of the Ministries of Health, Agriculture, Fishery, andTrade. This initiative was mainly taken to prepare the population for difficulties ifNorway were to be involved in the war in Europe. Norway was involved in the war andwas occupied by Germany for 5 yr.
During this occupation, the national food supplies were scarce. However, few negativenutritional effects on health were observed in the adult population; in fact, the mortalityfrom coronary heart disease (CHD) decreased (5).
The idea behind the establishment of the Food and Agricultural Organization of theUnited Nations (FAO) in 1945 was a “marriage” between food production and healthpromotion through better nutrition. FAO requested each of its member nations to establisha nutrition council that could prepare and coordinate implementation of an intersectorialfood and nutrition policy. Evang played an important role in the planning of the FAO,and in 1946, he re-organized the NNC. The new NNC was established within theMinistry of Health and Social Affairs. In some other FAO member countries, similarcouncils were established within the Ministries of Agriculture.
Since its reorganization in 1946, the NNC has always had a mandate to give adviseto the government concerning nutrition and dietary issues (i.e., to formulate recommendeddietary allowances and guidelines on fortification of food with vitamins and othermicronutrients). The fortification policy has always been very restrictive.

Chapter 29 / Norwegian Nutrition and Food Policy 737
Until about 1950, the main challenge for the Norwegian Nutrition and Food Policywas to ensure enough food for the population. After 1950, however, the dietary prob-lems changed in character. The country’s economy improved significantly, and themarket flourished with foods. People could eat the formerly recommended energy-richfood in abundance, with no knowledge or warning that these foods could create healthproblems. However, problems connected with overnutrition and unbalanced dietbecame more prevalent. There was a substantial increase in mortality from CHDs (6),an increase that was associated with changes in food habits and lifestyle. The respon-sibility for the society to address this problem became more obvious. The DirectorGeneral of Health established an expert advisory committee. This resulted in an offi-cial Norwegian report on the relationship between dietary fat and cardiovascular dis-ease (CVD) in 1963. The experts recommended a decrease in the fat content of the dietto 30% of the dietary energy, mainly through reduction of the intake of saturated fat(7). The report formed a basis for subsequent work (i.e., the formulation of an officialintegrated Norwegian Nutrition and Food Policy). However, it took quite some timebefore this new nutritional challenge became an important target in an official nutri-tion and food policy, mainly because of a resistance from the agriculture and dairyindustry.
2. THE STRUGGLE FOR INTRODUCING NEW RECOMMENDATIONSIN GOVERNMENT POLICIES
As the suggested relationship between diet and CHDs gradually gained acceptance,the NNC made several attempts to influence government policy goals to align with thenew knowledge. The major effort was a suggestion to the Directorate of Health in 1964to prepare a White Paper on nutrition policy. The proposal gained no political support.
Toward the end of the 1960s, the NNC redefined its approach to a more politicallyoriented strategy, seeking support among members of the Parliament. By lobbying, theNNC persuaded members of the Parliament to use their opportunities to directly questionministers (Cabinet members) in the Parliament about diet and health. Also, consumerinterests and concern with food and health were growing. This brought nutritionalissues to the attention of not only the members of the Parliament and ministers but alsothe media and the general public.
These efforts brought considerable attention to the issues of nutrition, health, andagriculture. However, they were not sufficient in creating actual changes at a policylevel. Until 1973, the main actors responsible for the nutrition policy, the Ministry ofSocial Affairs and the Directorate of Health, were still rather passive and made noexplicit effort to bring about policy changes. Parallel to the increased attention onnutritional issues, a concern regarding agricultural policy was growing both at thepolitical and public levels. There was fear that the support for the most peripheral ruralareas would decrease due to the economic cost of having agricultural production inremote areas.
3. GOVERNMENTAL WHITE PAPERS ON NUTRITION AND FOOD POLICY
At the FAO/World Health Organization (WHO) World Food Conference in Rome in1974, it was again stated that each nation should have a nutrition and food policy. The

738 Part VIII / Preventive Nutrition: Global Perspectives
Norwegian delegation at the conference was headed by the Minister of Agriculture, whostated in his main address to the conference that the industrialized countries should alsoformulate a nutrition policy. When the minister returned to Norway, he took the initiativeto form a Norwegian Nutrition and Food Policy. A White Paper was presented to theParliament through Report No. 32 (1975–1976) “On Norwegian Nutrition and FoodPolicy” from the Ministry of Agriculture (8). To the best of our knowledge, this was thefirst official White Paper in the world regarding an integrated Nutrition and Food Policy.
The goals and considerations that this policy was supposed to coordinate may besummed up in the following four major objectives:
1. Healthy dietary habits should be encouraged.2. A nutrition and food policy should be formulated in accordance with the recommen-
dations of the World Food Conference.3. The policy should aim at increased production and consumption of domestic food and
at strengthening the ability to rapidly increase the degree of self-sufficiency in the foodsupply.
4. As a result of regional policy, the highest priority should be given to using the foodproduction resources in the economically weaker areas.
Furthermore, it was stated that a primary task of the Nutrition and Food Policy wasconsidered to be an active coordination of these four major goals.
3.1. Objective 1: Encourage Healthy Dietary HabitsIn 1975, the government said that:
“The relationship between diet and health, for instance between diet and cardiovas-cular diseases, is not yet entirely understood. However, there is sufficient knowledgeof this relationship to recommend alterations in the diet which are desirable from thepoint of view of preventing these diseases...
The Government will prepare a policy which will contribute to the following:
● The beneficial aspects of the diet are to be preserved. Conditions will be arranged sothat the diet is better adapted to nutritional requirements, while general demands fortaste, variety and diversity are stressed. The different nutritional requirements of specialgroups such as children and young people, pregnant and breastfeeding mothers, theelderly, etc. must also be taken into consideration.
● In order to obtain a better adaptation of the diet to nutritional requirements it is especiallyimportant to curtail the proportion of fat in the energy supply. An objective should beto reduce the proportion of fat to 35 % of the energy supply through a gradual alterationof the diet.
● The decrease in the supply of fat should be replaced by foods containing starch—primarily cereals and potatoes. There should be an attempt to limit the proportion ofsugar in the energy supply.
● The proportion of polyunsaturated fatty acids in the total fat intake should be increased.”
It should be noted that the goal for the average fat consumption in the policy documentwas 35% of the energy intake, whereas the NNC had advocated for 30% of energyintake. The official goal was a compromise between the NNC and the agriculturallobby, which feared that a lower fat target would lead to a reduced consumption of meatand dairy products.

Chapter 29 / Norwegian Nutrition and Food Policy 739
In this first White Paper, it was suggested that the central issue was which means shouldbe taken to influence the production and consumption of food products in accordance withthe goals and objectives of the policy. Emphasis was put on collaboration between thepublic sector; the organizations, enterprises, and employees in the relevant economicsectors; the voluntary organizations; and the various categories of households. Theinformation/education/training measures were particularly emphasized, aiming at moti-vating people to adopt better dietary habits, securing a broad general knowledge of themain principles of a nutritionally healthy diet, and providing the possibility to acquirethe necessary skills.
Therefore, the means used have addressed a wide range of areas, such as educatingand informing the public and professional arenas (at universities, for teachers, adulteducation, mass media, consumer organization media, conferences and meetings withprimary schools and professional groups); setting consumer and producer price andincome subsidies together in nutritionally justifiable ways; adjusting absolute and rel-ative consumer food price subsidies; guaranteeing low prices for food grain, skimmedand low fat milk, vegetables, and potatoes; avoiding low prices for sugar, butter, andmargarine; marking regulations to promote provision of healthy foods by retail stores,street vendors, and institutions; and regulating food processing and labeling (8,9).
The NNC was responsible for the follow-up of the National Nutrition and FoodPolicy. It did not have any decentralized organization to instruct, and funds and staffwere limited. In implementing activities, cooperation with other sectors and organizationswas important. NNC took responsibility for contact with the school system, the healthsector, the local food control authority, the consumer organizations, nongovernmentalorganizations (NGOs)/voluntary organizations, the food industry, food retailers andwholesalers, and mass media.
The NNC had regular meetings with major companies in the food industry, organi-zations dealing with restaurants and institutional catering, politicians, and the massmedia. The NNC focused on providing services (such as printed material), giving lec-tures, arranging seminars, and stimulating activities by providing funds for informa-tion and public education campaigns and new methods for health promotion at themunicipal level.
One of the successes of the Norwegian National Nutrition and Food Policy was theinformation and public education performed by the NNC, especially by the use of pro-grams on the national public TV and nationwide, longlasting nutrition campaigns.
Higher training or education at university level was also important. The Universityof Oslo has trained nutritionists since 1965. They form a cadre of professionals who areworking in many different organizations and at different levels and are key in the imple-mentation of many nutrition-related activities.
The development at the Medical Faculty at the University of Oslo was also important,because in the early 1970s, nutrition education there was virtually nonexistent. Nutrition asa subject developed first as an elective and later as a compulsory course in which studentswere exposed to nutrition as an area of applied biochemistry and physiology, with somelectures that included diet, clinical nutrition, and nutrition policy. Teachers instructing thecourse also produced a tailor-made text book for nutrition in medical training (10). Thewide contacts that medical doctors have with the public, their role in preventive and cura-tive health work, and the status they have in the minds of the public make them importantcommunicators of nutrition.

740 Part VIII / Preventive Nutrition: Global Perspectives
Two other projects in the health sector were of great importance for the implementa-tion of the nutrition policy. First, a randomized prospective study called the “OsloStudy” showed that a change in diet reduced CHD in middle-aged men with initiallyhigh blood cholesterol levels (11). The results of the Oslo Study convinced both thepopulation and the politicians about the importance of changing to a more lean diet.Second, the National Health Screening Service conducts health surveys in all areas ofNorway (12). All inhabitants age 40 yr are offered a health examination that includesmeasurement of blood lipids, blood pressure, and chest X-ray. Persons with high riskfactors for CHD are referred to the local health authorities for follow-up. Until recently,the health surveys have been done at intervals of a few years; they have provided valu-able information on CHD risk factors, body mass index, and other health parameters indifferent parts of Norway and have documented changes in these parameters during theperiod that the country has had an active nutrition policy (13). These surveys are nowbeing re-organized.
3.2. Objective 2: Formulate a Nutrition and Food Policy in AccordanceWith the Recommendations of the World Food Conference
In 1975, the government said:
“Taking the recommendations from the World Food Conference as a starting point, itwould be right to view the nutrition and food policy in relation to the global situationas regards production and supplies. As part of solving the world’s food problems, thedeveloped countries were recommended to increase their food production and toimplement measures for improving their own pattern of consumption. Such measuresmust, however, make allowances for the developing countries’trade interests as promotedthrough international organizations.”
The means used to achieve this include earmarking emergency grain in Norway,providing aid and support to poor countries, supporting United Nations agencies, andcontributing to the World Food Program (9).
3.3. Objective 3: Increase Production and Consumptionof Domestic Food and Strengthen the Ability to Rapidly Increase Degree of Self-Sufficiency in the Food Supply and Objective 4: Give High Priority to UsingFood Production Resources in Economically Weaker Areas
The Norwegian government encouraged farmers to increase production of foodgrain, potatoes, vegetables, and low-fat milk. Measures were introduced to stabilizemilk and meat production to avoid overproduction. In collaboration with farmer’s orga-nizations, an attempt was made to produce more grass-fed, rather than grain-fed, beef.Furthermore, the pork produced was less fatty than before.
There also has been an integration of support, such as support to fisheries and to fod-der production for dairy cattle in northern mountain areas and in remote regions;encouragement of wheat production and discouragement of dairy production in thesouthern part of the country; provision of transport and other subsidies to retailers inoutlying regions; and an integration of agriculture and food policy with other economicplanning initiatives.
The link between the food policy and district policy is a reflection of an official policyin Norway that has been in place for the last 50 yr: support to remote areas of the country

Chapter 29 / Norwegian Nutrition and Food Policy 741
to diminish migration to centers and cities. This district policy was also a part of theNorwegian defense policy during the Cold War.
4. RESISTANCE AGAINST THE NUTRITION AND FOOD POLICY
The progress in implementing the nutrition policy was slow during the first years afterits approval by the Parliament in 1976. Two main reasons were that the diary and meatindustry were against the policy and that the NNC had little power and political influence.
The diary industry tried to counteract the policy by inviting foreign experts whoclaimed that milk, butter, and other dairy products had no influence on risk factors forCHD and, therefore, the Norwegian nutrition policy was built on false premises. Thisled to a survey among leading scientists in the field of atherosclerosis and lipid metab-olism (14). The survey clearly showed that the Norwegian National Nutrition and FoodPolicy was built on a solid scientific basis. (Interestingly, this survey came to play animportant role in the US Congressional hearings on March 23, 1977, regarding McGovern’sdocument on dietary goals for the United States.)
The NNC tried to push the diary industry to produce low-fat milk for the Norwegianmarket. But the dairy industry resisted. However, after the NNC organized a successfulconsumer-based campaign for consumption of skimmed milk instead of whole milk, thedairy industry relented, and, in collaboration with the NNC, low-fat milk was intro-duced in 1984. Since then, there has mainly been good collaboration between the NNCand the dairy industry, which have gradually produced several low-fat dairy products.
The Norwegian Nutrition and Food Policy also has internal conflicts. Therefore, theobjective to increase local food production led to more Norwegian wheat for humanconsumption. However, Norwegian grain was more expensive than wheat on the inter-national market, and, simultaneously with an official campaign to eat more cereals, thebread got more expensive.
The first White Paper on the National Nutrition and Food Policy gave the task of coordi-nating the implementation of the nutrition policy to two official agencies: the NNC and theInter-Ministerial Coordinating Committee on Nutrition (IMC). The latter was formed tocoordinate all political sectors involved in the National Nutrition and Food Policy. The IMCwas supposed to be chaired by the Deputy Minister of Health and Social Affairs and was toconsist of leading civil servants from nine ministries. However, the IMC was never formedas it was planned, probably because of competing priorities among the different ministries.At first, the inactivity of IMC also deactivated the NNC, rendering it a body with a lot ofgood intentions but with little power and political influence. Later, however, because of theinactivity of the IMC, the NNC took direct political contact with the government and mem-bers of the Parliament. Thus, NNC gradually gained both power and political influence.
In 1981, the government presented a follow-up White Paper: Report No. 11(1981–1982) “On the Follow-Up of Norwegian Nutrition Policy” (15). The Ministry ofHealth and Social Affairs was responsible for this report. Note that the word “Food”was removed from the title. This was a sign that the main issue of the policy was morehealth and less agricultural policy.
The Nutrition and Food Policy was integrated into the health policy in Report No. 37to the Storting (Norwegian Parliament; 1992–1993), “Challenges in Health Promotionand Prevention Strategies,” (16) and Report No. 16 (2002–2003), “Prescriptions for aHealthier Norway—A Broad Policy for Public Health” (17).

742 Part VIII / Preventive Nutrition: Global Perspectives
These four White Papers have defined and still define the nutritional goals for Norwayand the measures that the government intends to employ to improve the Norwegian diet.All four reports underline that dietary changes should be voluntary.
5. THE CURRENT NUTRITION AND FOOD POLICY IN NORWAY
The goals for the Norwegian Food and Nutrition Policy that were established in 1992are still valid today. The current Norwegian Nutrition and Food Policy has the followingfour main goals:
1. Reduce the prevalence of dietary-related diseases and to achieve the following objectives:
● A national diet in line with the recommendations of the NNC.● Breastfeeding of babies should continue at a high level.● The nutrition-related differences in health status in the population should be
reduced.● Dietary treatment should be integrated in primary and secondary prevention of diet-
related diseases within the health services.
The goals deal with the national diet, including that of the infants; the present inequal-ity in health, especially CVDs; and mechanisms to change approaches within the healthservices. Food consumption should fulfill the following nutritional goals:
● Reduce the proportion hard fats (the sum of saturated and trans fats) to about 10%of energy intake and to reduce the total fat in the diet to about 30% of energy intake.
● The fiber content of the diet should be increased to 25 g per person per day byincreasing the consumption of cereals, potatoes, vegetables, and fruit.
● Sugar should contribute no more than 10% of the energy.● Salt intake should be reduced to 5 g per person per day.● Increased consumption of fish.● A change in dairy products, meat, and meat products in favor of those with lower
fat content.● The consumption of butter, hard margarine, high-fat potato products, and snacks
should be reduced.● A frequent intake of grilled, fried, smoked, or salted foods should be avoided.
2. Ensure food safety. The policy shall facilitate the following objectives:
● Foods should be free of infectious agents and should not contain approved foodadditives in quantities that are a risk to health.
● Consumer demands for food quality, safety, and security should be met.
3. Strengthen consumers’ influence on the Nutrition and Food Policy, the government willensure that the consumers have a real possibility of providing themselves with a health-promoting diet. To maintain this, a consumer policy that stimulates a health-promotingdiet through differential prices, food availability, food labeling/claims, and informationand marketing will be implemented.
4. Contribute to safe production, distribution, and marketing of food products and tosafe consumption patterns regarding health, the environment, and appropriate use ofresources. Food production shall satisfy society’s requirements for safe and ethicalacceptable norms and allow for protection of animals and plants, genetic resources,and environmental resources. This aspect of the National Nutrition and Food Policy

Chapter 29 / Norwegian Nutrition and Food Policy 743
is an adjustment to sustainable development. Therefore, it is appropriate to quotefrom The Brundtland Commission: “The industrialized countries must reduce over-production of agricultural products, so that world market prices will reflect the realproduction costs. In the short term this implies higher costs for food-importing fromdeveloping countries. But it will mean a real stimulus to increase production indeveloping countries” (18).
The White Paper of 2003 (17) gives even more emphasis on health promotion anddisease prevention. This White Paper draws up strategies for a healthier Norway.
There are several reasons that 10 yr after the Storting debated the White Paper No.37 (1992–1993) Challenges in health-promoting and preventive work, theNorwegian Government submitted a new White Paper that contained strategies forthe next 10-yr period. New trends in society bring new health challenges. The latestWhite Paper is called “Prescriptions for a Healthier Norway. A Broad Policy forPublic Health.” Some of the reasons for a new White Paper include globalization, amulticultural society, a demanding workplace, and drug and alcohol problems. TheWHO has shown that one-third of the total burden of disease in industrialized coun-tries is caused by five risk factors: tobacco, alcohol, high blood pressure, cholesterol,and excess weight (19).
Against this background, the government wants to revitalize public health work. Itsobjective is a healthier Norway through a policy that contributes to more years ofhealthy life for the population as a whole and a reduction in health disparities betweensocial classes, ethnic groups, and the genders.
This new White Paper aims for a more systematic and holistic policy than whatexisted before. The government attaches importance to the connection between thecommunity’s and the individual’s responsibilities for, and possibility of, influencingthe health situation and to showing what the individual and the community can gainfrom effective preventive health care. The government calls for a national public healthchain, which will also provide a basis for a far more systematic cooperation with vol-untary organizations, educational institutions and other bodies. Work must also bedone to further develop and reinforce preventive work as a central instrument withinthe health services. Additionally, the focus will be on ensuring that the measures imple-mented are based on experience and new knowledge acquired, for example, fromresearch and pilot projects. A better understanding of complex causal relations willprovide more effective measures.
The new White Paper advocates a broad health policy. It addresses the many factorsthat play a part in creating health problems and that help to protect us from disease. Itseeks to draw attention to the connections between the individual’s and the community’sresponsibilities for, and possibility of, influencing the health situation and it attempts tomake responsibility visible in a number of sectors and policy areas.
The government gives particular emphasis to the following general strategies forpublic health:
● Make it easier for people to take responsibility for their own health.● Build alliances to promote public health.● Encourage more prevention, rather than cure, in the health service.● Build new knowledge.

744 Part VIII / Preventive Nutrition: Global Perspectives
6. GOVERNMENTAL IMPLEMENTATION BODIES
At the ministerial level, the responsibilities to coordinate the implementation of theNational Nutrition and Food Policy are given to two official bodies: the National FoodControl Authority and the NNC. The IMC mentioned earlier did not fulfill its intentionsand has been abandoned from the current nutrition policy.
The National Food Control Authority was established in 1988 to administer legislationrelated to food. It is responsible for coordinating and guiding the executive control system,which consists of 89 Local Food Control Authorities covering all municipalities inNorway. The local food control is responsible for inspecting production, processing,import, storage, and transport of food. The National and the Local Food ControlAuthorities have, in cooperation with the NNC, involved themselves in a broader nutri-tional work (e.g., in schools and catering). In 2004, The National Food Control Authorityjoined with several other organizations and was re-organized into a new NorwegianFood Safety Authority.
The NNC was established in 1937 and re-organized in 1946. The appointed membersand organization of the NNC have changed over time. During 1999 to 2003, it wasnamed the National Council on Nutrition and Physical Activity. Today, two separatecouncils (National Council on Physical Activity and NNC) are appointed for the periodof 2003 to 2007. The NNC is currently an expert body that consists of 15 members withcompetence in nutritional biology, clinical nutrition, epidemiology, public nutrition, andnutrition policy. The NNC cooperates closely with research institutions. Main featuresin the mandate for the council are:
● Act as an advisory body to ministries and others in matters concerning food supply andnutrition.
● Describe and evaluate the nutritional situation in Norway.● Propose new strategies and measures to reach nutritional goals.● Provide assistance and proposals to research councils and research institutions.● Contribute to the promotion and coordination of professional work on diet and nutri-
tion, both nationally and internationally.● Be actively engaged in nutrition education and ensure that public information on nutri-
tion is in accordance with recommendations.
One important task for the NNC is the development and revision of the NorwegianDietary Guidelines. These guidelines were first published in 1954 and have been thetheoretical basis for nutrition-related health promotion and incorporated as the scientificbasis in the National Nutrition and Food Policy. Since 1980, these guidelines have beenprepared in cooperation with the other Nordic countries (the latest preparation occurredin 1996) (20).
During the 1990s, the administration of the NNC was strengthened from being a smallsecretariat to an efficient administrative body with broad knowledge about nutrition andphysical activity, operating in close contact with both the Ministry of Health and theCouncil and its members. In 2002, the Directorate for Health and Social Affairs wasestablished and the administration of the Council was incorporated in the Directorate astwo separate departments for nutrition and physical activity. It has been very importantfor the NNC to have a strong and competent administration so that it may implementand coordinate nutrition-related activities in many different sectors of the society. An

Chapter 29 / Norwegian Nutrition and Food Policy 745
intersectorial approach is one of the most important elements in the Norwegian NationalNutrition and Food Policy.
7. SOME RESULTS OF THE NORWEGIAN NATIONAL NUTRITIONAND FOOD POLICY
Nutrition and food policy is clearly a field of conflicting interests. Nevertheless, gov-ernment policy documents have helped to further cooperation between the various sectorsthat have an impact on the diet of Norwegians. We can see promising dietary changes(see Tables 1 and 2). However, we are still far from fulfilling the goals of the policy.
Dietary data are obtained from the annual reports of the Directorate for Health andSocial Affairs (21), which present food consumption data based on wholesale figures,and from the household consumption surveys published by Statistics Norway, whichprovide figures concerning food entering the household. Although figures are somewhatuncertain for some food groups (i.e., fish, vegetables, and fruits), they provide a basison which to draw certain conclusions regarding development and trends in food con-sumption during the last 20 yr (Table 1).
The consumption of cereal products showed a positive trend until the beginning ofthe 1980s. After a decrease for some years, consumption has increased again. The pro-portion of cereals of Norwegian origin have risen considerably; flour milled fromNorwegian cereals now comprise approx 40 to 50% of total food flour consumption,whereas in 1975, not a single grain produced in Norway was consumed by humans andwas only used for animal feed.
The total milk consumption has decreased. From 1970 to 1985, the consumption ofskimmed milk rose, and the use of whole milk decreased. After an initiative from theNNC, the Norwegian Dairies introduced partially skimmed milk (low-fat milk) with afat content of 1.5% into the Norwegian market in 1984. Compared to whole milk andskimmed milk, partially skimmed milk rapidly took a considerable share of the market.In 2000, a low-fat milk (with a fat content of 0.7%) fortified with vitamin D was marketed.The consumption of cream has remained at a stable level, but the consumption of cheesehas increased. Milk and other dairy products are still the major sources of saturated fatin the Norwegian diet. The NNC advocated that partially skimmed milk should replacewhole milk in school milk programs. In 1984, most of the school milk was whole milk.Soon, most of the whole milk in schools was replaced by low-fat milk and skimmedmilk, and in 2002, 86% of the school milk was low-fat milk.
Consumption of vegetables has increased over a long period. Wholesale figures forfruit have not increased, but data from household consumption surveys indicate a 25%increase in fruit consumption since 1975. Norwegian-produced vegetables comprise 60%of total consumption of vegetables, whereas import comprises about 90% of the totalamount of fruit consumed. The consumption of potatoes has decreased, and the share ofprocessed potato products is increasing. Potatoes as raw materials for further process-ing now comprise about 50% of all potato sales compared to 10% in 1975. The sale ofpotato chips has particularly increased.
Meat consumption has increased considerably. However, the meat produced containsless fat than before. The basis for estimation of fish consumption is uncertain, but estimateswere made on the basis of household panel surveys indicating a consumption of about34 kg per person per year in 2002.

746 Part VIII / Preventive Nutrition: Global Perspectives
Table 1Food Consumption at Wholesale Level (kg/Person/Year)
1970 1975 1980 1985 1990 1995 2000 2002
Cereals 71 75 80 75 79 81 85 86Potatoes, unrefineda 79 71 63 63 52 45 34 29Potatoes, refinedb 7 8 12 17 19 21 30 32Vegetables 40 37 46 47 53 58 59 60Fruits and berries 67 74 76 85 78 79 69 73Meat 43 52 54 54 53 62 64 67Egg 10 10 11 13 12 10 10 10Fishc 28 31 34Whole milk (3.9%) 172 169 160 124 64 45 35 33Low-fat milk (0.7 + 1.5%) 28 79 85 70 70Skimmed milk (0.1%) 14 26 26 30 32 26 19 18Cheese 9 10 12 13 13 14 15 15Cream 6.7 6.7 6.6 6.7 6.9 6.7 6.6 7.2Butter 5.4 4.7 5.4 4.8 3.4 3.0 2.8 2.9Margarine, total 19 18 15 14 13 13 11 10Low fat margarine 0 0.5 0.2 0.2 1.9 2.6 3.0 3.0Oil and other fatsd 4.4 4.2 4.9 4.1 4.0 4.0 4.0 4.0Sugar, syrup, honey, etc. 42 32 45 42 41 41 42 43
aPotatoes not for industrial usesbPotatoes used to produce potato products.cFish consumption estimated by household panel surveys. Food Balance Sheet figures for fish con-
sumption not available.dIncludes cooking oils, cooking fats, and fat used in food manufacturing for mayonnaise, salads,
chocolate, biscuits, etc.(From Directorate for Health and Social Affairs, Oslo, Norway.)
Table 2Dietary Energy and Energy-Providing Nutrients at Wholesale Level (Person/d)
1970 1975 1980 1985 1990 1995 2000 2002
Energy, kcal 2870 2920 3180 3040 2920 2870 2870 2870Protein, g 85 87 94 94 94 93 95 95Fat, g 126 129 135 122 111 115 110 111Carbohydrate total, g 352 345 390 378 375 361 378 371Sugar, g 115 91 120 118 118 117 120 122Dietary fiber, g — 21 23 22 22 23 24 23Percentage distribution
of energyProtein 12 12 12 13 13 13 13 13Fat 39 40 38 37 35 36 34 34Carbohydrate, total 49 48 50 51 52 51 52 52Sugar 16 13 15 16 17 17 17 17
(From Directorate for Health and Social Affairs, Oslo, Norway.)
Chapter 29 / Norwegian Nutrition and Food Policy 747
The consumption of edible fat has dropped steadily since the 1950s. The decrease hasresulted from reduced consumption of margarine and butter. The proportion of mar-garine with a relatively large content of vegetable oils and low-fat margarine hasincreased. Furthermore, the consumption of edible oils and oil-containing products suchas mayonnaise is still increasing.
Calculations based on wholesale figures and consumer consumption studies showthat the energy of fat in the diet increased from about 20% in 1900 to 40% in 1975 (21).It currently has decreased to 34% of energy of fat (Table 2).
The dietary fatty acid pattern has improved. Calculations based on household con-sumption surveys from 1977 to 1979 and 1999 to 2001 showed a decrease in dietarycontent of trans fatty acids from approx 4 to 1% of energy and a decrease in saturatedfatty acids from 17 to 14% of energy (21). The dietary content of cholesterol per 1000kcal increased from below 100 mg (in the beginning of the century) to 180 mg (1950)and later decreased to approx 110 mg per 1000 kcal (22).
For the past 20 yr, sugar has comprised 15 to 17% of the energy content at wholesale leveland 14 to 15% of energy intake in household consumption surveys. According to nationaldietary surveys, adult Norwegians have an intake of 8 to 9% of energy from sugar. Amongadolescents, sugar intake has increased from approx 12 to 18% of energy from 1993 to 2000.The annual consumption of soft drinks and sweets has increase several-fold in the last 25 yr.In 2002, Norwegians consumed an average of 91 L of sugar-containing soft drinks (21).
8. IMPORTANT CHARACTERISTICS OF THE NATIONALNUTRITION AND FOOD POLICY AND ITS IMPLEMENTATION
A basis for the National Nutrition and Food Policy is an agreement regarding the ideathat many factors affect the diet and the prevalence of diet-related health problems. Theconsensus achieved about the goals and the strategies of the Norwegian NationalNutrition and Food Policy is of major importance for the implementation of the policy.This has been achieved by forming the goals of the policy on a scientific basis and bystimulating scientists to participate in the implementation of the policy. The Norwegianexperience has shown that the content of a strategy intended to influence the diet in adesired direction should define the following:
1. Goals and objectives: Thematically, the objective should be linked to reduced risk ofdisease, better growth and development, more optimal supply of nutrients, or a health-ier diet in general. The target groups should be identified.
2. Strategies and measures: Strategies should be expressed generally and should be linkedto the goals and objectives. The measures should be specified as part of each strategy,and may be implemented in a number of arenas. Often, several arenas will be usedsimultaneously in a total effort to achieve the goals. The best area in which to investthe efforts depends on knowledge of nutrition problems in the population.Epidemiological surveys are required to provide information regarding relevant condi-tions. It is particularly important to identify groups that may be more susceptible tonutritionally related health problems than the population in general. The monitoring ofthe Norwegian nutrition and food situation has been strengthened considerably throughseveral nationwide nutrition surveys and screening programs.
It is important to encourage a nutritionally adequate diet through recommending con-sumption of healthy food. The NNC has worked to influence consumer choices by

748 Part VIII / Preventive Nutrition: Global Perspectives
information and advice through various communication channels. The goal has been toinfluence what consumers purchase by, for example, adequate labeling, marketing, andchanging the relative prices and the availability of different foods. Cooperation withmanufacturers and merchants has been important during this process.
The strategies for disease prevention and health promotion often are grouped into massstrategies, target group strategies, and high-risk group strategies. The mass strategy involvesthe whole population. Several longlasting nationwide campaigns have been important ele-ments of the mass strategy initiated by the NNC. In these campaigns, the public radio andtelevision frequently have been used to dispense information about how to prepare and con-sume a healthy and low-fat diet. In target group strategies, the focus has been directed at var-ious groups of the population, such as infants, school children, the elderly, and immigrants.The national high-risk strategies have been based on screening of large groups of the adultpopulation to identify persons at high risk for nutrition-related disorders and then introduc-ing measures directed specifically toward the identified individuals (12,13).
The choices of strategy and measures include identifying arenas for intervention.Relevant arenas include public services, especially the health and social welfare services(curative and preventive), schools, shops, and the mass media. Governmental organiza-tions, employers and employee’s organizations, and the various NGOs have beenimportant actors in the work to promote health through a better nutrition. The foodindustry and the retailers have also been of major importance
9. CONCLUSION AND RECOMMENDATIONS
In our opinion, the official National Nutrition and Food Policy White Papers(8,15–17) have been central political and strategic documents in the efforts to improvepublic health in Norway over the past 30 yr, as documented earlier. The NNC has playedan important role in the implementation by developing a consistent and scientific basisfor the policy. The NNC has often been consulted in connection with widespread effortsin various sectors (also outside the health sector) and has developed a basis for variouspolitical decisions.
We have learned the following about forming and carrying out a nutrition and foodpolicy:
● It takes time to get politicians interested in the issue. To get a comprehensive and long-term policy, the government needs to develop a policy that has broad political supportand that is not subject to changes linked to specific governments in power.
● A nutrition and food policy must address both problems related to inequality and lackof food (malnutrition) as well as CVDs and other health problems that are related to toomuch food, unbalanced diets, and changes in lifestyle (overnutrition).
● The nutrition message to the public must be scientifically based, consistent, credible, andrelevant for the target groups of the population. It must be practical and easy to understand.
● An effective administrative body (e.g., a nutrition council) and a strong secretariat areneeded so that it is clear who has the daily responsibility to implement the policy.
● The nutrition council must regularly report to the ministry in charge and the Parliament.● The members of the nutrition council should be independent experts in nutrition, diet,
and health with broad experience.● Cooperation between the nutrition council, NGOs, the food industry, and other key
actors is important.

Chapter 29 / Norwegian Nutrition and Food Policy 749
Today, we can see several changes in Norwegian eating habits. The consumption ofcereals, vegetables, fruit, and low-fat milk has increased. Furthermore, there has been areduction in the intake of margarine, butter, and whole milk. This has led to a reductionof total fat from 40 to 34% of the food energy, mainly by a reduction of saturated andtrans fat.
Concomitantly with these changes, the surveys done by the National HealthScreening Service have shown that blood cholesterol has decreased by about 10% in theNorwegian population (6,13). These changes have probably contributed to the 60%reduction in the mortality of CHD among middle-aged men and women during the last30 yr (Fig. 1). The mortality of CHD among Norwegians is now approaching the levelin Greece, but it is still much higher than reported in France and Japan (23).
In the beginning, the nutrition policy in Norway was, to a large extent, aimed at areduction in premature CHD.
It is most probable that the Norwegian National Nutrition and Food Policy has playedan important role in changing dietary habits and has thus contributed to the decline inheart disease. This goal has been obtained to some extent, and, therefore, the currentnutrition policy has been changed somewhat compared to what was formulated in 1975.One reason for this is that the prevalence of cancer (24), obesity (25), and type 2 dia-betes (26) has increased in the population. In fact, the increase in body weight has beenso substantial and rapid that we may soon see an increase in CHD, both in men and women.The diet for the Norwegian population has been improved. However, the consumptionof energy-dense foods, such as sweets and soft drinks, has increased dramatically. The
Fig. 1. Mortality from coronary heart disease in Norway. The data are compiled fromNorwegian National Bureau of Statistics.

750 Part VIII / Preventive Nutrition: Global Perspectives
increase in excessive weight most likely results from an inability to adjust energy intaketo a decreasing level of physical activity within the population. The most recent WhitePaper (17) seriously addresses these problems and provides suggestions and measuresboth for the society and the individual for increasing physical activity in daily life duringthe entire lifetime.
REFERENCES1. Natvig H. Textbook in Hygiene. Fabritius, Oslo 1958, pp. 496–498.2. Hertzberg G. Ernæring, helse, miljø (Nutrition, Health and Environment). Garnæs’s Boktrykkeri,
Bergen, 1934.3. Frisch R, Haavelmo T. Efterspørslen efter melk i Norge (Demand for Milk in Norway).
Statsøkonomisk Tidsskr 1938, pp. 1–62.4. Wold KG. Kosthold og levestandard. En økonomisk undersøkelse (Nutrition and the Standard of
Living. An Economic Investigation). Fabritius, Oslo, 1941.5. Strøm A, Jensen RA. Mortality from Circulatory Diseases in Norway 1940–45. Lancet 1950;
I:126–29.6. Pedersen JI, Tverdal A, Kirkhus B. Diet and the rise and fall of cardiovascular disease mortality
in Norway. Have changes in dietary habits played a role? Tidsskr Nor Lægeforen 2004; 124:1532–1536.
7. Nicolaysen R, Eeg-Larsen N, Jervell A, Owren PA, Hjort PR, Eggen Øgrim M, Gran FC. Betenkningom forholdet mellom fett og hjerte-kar-sykdommer (Fat and Coronary Heart Disease).Nasjonalforeningen for folkehelsen/Det Norske råd for hjerte- og karsykdommer. Oslo, 1963.
8. Ministry of Agriculture. Report No. 32 to the Storting (1975–76). On Norwegian Nutrition and FoodPolicy. Royal Norwegian Ministry of Agriculture, Oslo, 1975.
9. Oshaug A. Nutrition Security in Norway? A Situation Analysis. Scand J Nutr 1994; 38(Suppl 28):1–68.10. Bjørneboe GE, Drevon CA, eds. Mat og medisin. Generell og klinisk ernæring (Food and Medicine.
General and Clinical Nutrition). Høyskoleforlaget, Kristiansand, Norway. 1999, pp. 1–727.11. Hjermann I, Holme I, Velve Byre K, Leren P. Effect of diet and smoking intervention on the inci-
dence of coronary heart disease. Report from the Oslo Study Group of a randomized trial in healthymen. Lancet 1981; II:1303–1310.
12. Bjartveit K, Foss OP, Gjervig T, Lund-Larsen P. The cardiovascular disease study in Norwegiancounties. Background and organization. Acta Med Scand 1979; (Suppl 634):1–38.
13. National Health Screening Service. Cardivascular Disease Risk Factors in Norway. Results FromSurveys in 18 Counties. National Health Screening Service, Oslo, Norway, 1997.
14. Norum KR. Some present concepts concerning diet and prevention of coronary heart disease. NutrMetabol 1978; 22:1–7.
15. Ministry of Health and Social Affairs. Report No. 11 to the Storting (1981–82). On the Follow-Upof Norwegian Nutrition Policy. Royal Norwegian Ministry of Health and Social Affairs, Oslo, 1981.
16. Ministry of Health and Social Affairs. Utfordringer i helsefremmende og forebyggende arbeid(Challenges in Health Promoting and Preventive Work). Report No. 37 to the Storting (1992–93).Royal Norwegian Ministry of Health and Social Affairs, Oslo, 1993.
17. Ministry of Health. Report No. 16 (2002–2003) to the Storting. Prescriptions for a HealthierNorway—A broad policy for public health. Royal Norwegian Ministry of Health, Oslo, 2003.
18. World Commission on Environment and Development (The Brundtland Commission): OurCommon Future. Palais Wilson, Geneve, 1987.
19. World Health Report 2002: Reducing Risks, Promoting Healthy Life. Geneva, World HealthOrganization, 2002.
20. Nordic Committee on Food. Nordic nutrition recommendations. 1996. Scand J Nutr 1996;40:161–165.
21. Directorate for Health and Social Affairs. Trends in the Norwegian Diet. Oslo, Norway, 2003.22. Johansson L, Drevon CA, Bjørneboe GE. The Norwegian diet during the last hundred years in
relation to coronary heart disease. Eur J Clin Nutr 1996; 50:277–283.23. Petersen S, Peto V, Rayner M. Coronary heart disease statistics. British Heart Foundation, London,
2004. www.heartstats.org. Accessed September 21, 2004.

Chapter 29 / Norwegian Nutrition and Food Policy 751
24. Cancer in Norway 2000. Cancer Registry of Norway. Oslo, Norway, 2002. www.kreftregisteret.no/forekomst. Accessed September 21, 2004.
25. Tverdal A. Prevalence of obesity among persons aged 40–42 years in two periods. Tidskr NorLaegeforen 2001; 121:667–672.
26. Midthjell K, Kruger O, Tverdal A,. et al. Rapid changes in the prevalence of obesity and known dia-betes in an adult Norwegian population. The Nord-Trondelag Health Surveys: 1984–1986 and1995–1997. Diabetes Care 1999; 11:1813–1820.


Prevention of Malnutrition in Chile
Fernando Mönckeberg Barros
From: Preventive Nutrition: The Comprehensive Guide for Health Professionals, Third EditionEdited by: A. Bendich and R. J. Deckelbaum © Humana Press Inc., Totowa, NJ
753
KEY POINTS
● Chile has been successful in reducing infant mortality and malnutrition in recentdecades.
● Targeted health, nutrition, and education programs have been key for this reduction.● Results show that to be successful, a nutrition and health policy must adapt to the
socioeconomic strategy of the government.● Food distributed by health centers has improved attendance of the public to those centers
and can be used for other health-related measures.● School feeding programs have decreased school desertion in Chile.
1. INTRODUCTION
During the last 40 yr, a progressive and continuous improvement in the health andnutrition of infants and preschool children has occurred in Chile. Biomedical indicatorsshow that Chile has reached one of the highest levels in the region, although during thefirst two decades per capita gross national product (GNP) had not substantially changed.Also during this 40-yr period, economic policies have changed drastically, ranging froma planned, centralized economy, to an open, liberal economy, which has been in placesince 1976. In the last 30 yr, the country has confronted many severe economic andpolitical crises. In 1973, a Socialist government was overthrown by a military coup.Two severe economic crises occurred in 1975 and 1982, associated with high unem-ployment rates that in the latter period reached 20% of the total labor force. Despitethese numerous changes and crises, malnutrition and infant and preschool child mortalityhave continued to decrease.
The situation was quite different prior to the early 1960s (1). Chile had one of thehighest infant mortality rates in Latin America (120 per 1000). This decreased to 11 per1000 in 1994 and 9 per 1000 in 2002, the lowest rate in the region (Fig. 1). This declinein the infant death rate resulted from a remarkable decrease in infant mortality caused
30

754 Part VIII / Preventive Nutrition: Global Perspectives
by respiratory and diarrheal disease in children less than age 1 yr (Table 1). A similartrend has been observed in preschool child mortality, which has declined from 14 per1000 in 1960 to 0.6 per 1000 in 1994 and 0.4 per 1000 in 2002.
Meanwhile, the percentage of children with malnutrition has also been reduced dra-matically, from 37% in 1960 to 2.9% in 2002. Second- and third-degree malnutritionsimilarly decreased from 5.9 to 0.2% (Table 2). Maternal nutrition has improved if weconsider that the percentage of newborns with low birth weight (below 2.5 kg) hasdiminished from 11.6 to 4.8% from 1975 to 2000.
2. GENERAL CONSIDERATIONS
It is self-evident that malnutrition is the result of poverty and underdevelopment.Many authors have demonstrated that in any given country, there is a close relationship
Table 1Chile: Infant Mortality (Age 0 to 1 Yr) as a Result of Respiratory and/or Diarrheal Disease,
1960 to 2000 (per 100,000 Live Births)
Year Respiratory disease Diarrheal disease
1960 4.318 1.3651970 2.793 1.4761980 502 1611990 86 2102000 36 12
Source: Informe Anual, 2000 (Santiago, Chile: Ministry of Health).Note: The figures for infant mortality reflect the deaths of children ages 0 to 12 mo.
Fig. 1. Decline in infant mortality in Chile from 1940 to 1988. (Source: Ministry ofHealth, Chile.)

Chapter 30 / Malnutrition in Chile 755
between the level of underdevelopment and the percentage of children suffering frommalnutrition. In Chile, however, this correlation does not exist. The nutritional conditionof children up to age 5 yr is much better than the socioeconomic realities of the countrywould predict (Fig. 2) (2).
Similarly, studies have shown a close relationship between life expectancy and GNP percapita. Again, this relationship is not observed in the case of Chile, where the life expectancyis much higher than what would be expected from the GNP per capita (Fig. 3) (3).
This anomaly calls for close analysis, because it demonstrates that under certain con-ditions, it is possible to improve health and nutrition even when there is no substantialeconomic development. These facts, as observed in Chile, contradict the claims of manyeconomists who believe that progress in health and nutrition only can be achievedthrough a substantial degree of sustained economic development. From this view, eco-nomic growth creates new resources that permeate the different strata of the society,ultimately improving living conditions, even among the lowest socioeconomic groups.
From our viewpoint, however, this economic analysis is not plausible. Developmentitself cannot be achieved if a high percentage of the population is already damaged as aconsequence of poverty and malnutrition and is barely able to survive because of poorhealth conditions. Malnutrition, poverty, and underdevelopment constitute a truly viciouscycle that works to hinder economic growth.
Considering these two different viewpoints and given an environment of limitedresources, two different strategies arise for preventing malnutrition and improving healthconditions: (a) focusing the effort on achieving large-scale economic growth and devel-opment; and (b) focusing efforts on targeted health, nutrition, and education interventionsto improve the well-being of the population, especially the most deprived groups.
Regarding the first strategy, one might conclude that if a society were to devote allefforts to economic development and to generating expanded economic resources, thenincreases in wealth would benefit greater numbers of individuals over time, eventuallyreaching the entire population. However, two questions arise from this approach. First,how long would it take under the best circumstances for this wholesale improvement tooccur, accounting for the realities existing in poor countries? Poor countries, for the mostpart, lack adequate technologies and the capability for either generating or acquiringthese technologies. These countries tend to have inefficient infrastructures, lack trainedworkers, and have a low savings capacity and little investment capital. Also, they are bur-dened by a large foreign debt. Thus, the logical answer is that on average, economicdevelopment would take a long time, probably many generations, to accomplish. Second,is it is possible to have significant and continuous development in countries in which 30
Table 2Percentage of Malnourished Children (Ages 0 to 6 Yr) in Chile From 1960 to 2000
Year Total Mild Moderate Severe
1960 37.0 31.1 4.1 1.81970 19.3 15.8 2.5 1.01980 11.5 10.0 1.4 0.21990 8.0 7.7 0.2 0.12000 2.9 2.6 0.2 0.1
Source: Informe Anual, 2000 (Santiago: Ministry of Health).

756 Part VIII / Preventive Nutrition: Global Perspectives
to 60% of the population has been physically and psychologically damaged over gener-ations as a result of poverty and malnutrition? The answer, again, is negative.
If we seek to achieve socioeconomic development, which is the ultimate objective,the essential point is to break out of the vicious cycle created by underdevelopment,malnutrition, and poor health conditions. Human resources are one of the most important,albeit insufficiently recognized, factors for social development. Modern society hasbecome very complex, and the demands on the knowledge and skills of its membersgrow constantly. Incorporating individuals as useful members of the community isunlikely if the environment deprives them of well-being and impedes full expression oftheir genetic potentialities.
Under these conditions, even if some economic improvement occurs, it is not likelyto reach the lowest socioeconomic strata, where malnutrition and disease are mostprevalent. This assertion is confirmed by many observations. For example, during thedecade from 1970 to 1980, economic progress was observed in Latin America, but thisonly led to a widening gap in economic circumstances among different groups.Therefore, although the poorest 20% of the population did not increase its per capitaincome, the richest 10% increased its income by an avergae of about $400 (4).
Fig. 2. Correlation between nutritional status of children below age 6 yr and degree ofdevelopment in selected countries. Note: Degree of development has been calculatedusing an indicator developed by the Institute of Social Development of the UnitedNations, based on 80 different items. Lower numbers indicate less development. Theinfant and preschool mortality rates have been selected as indicators of nutritional status.(From ref. 2.)
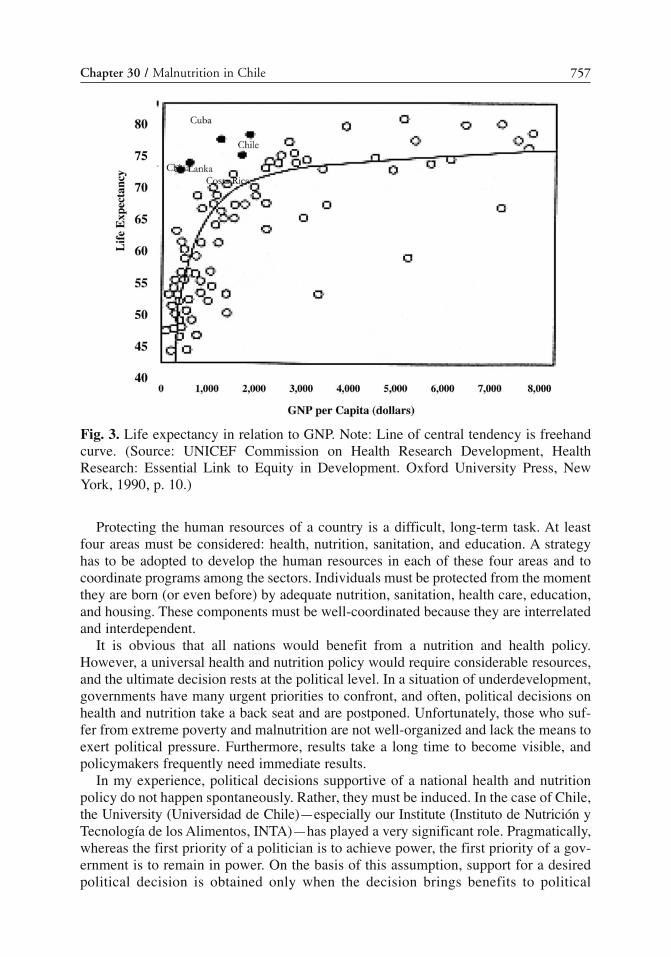
Chapter 30 / Malnutrition in Chile 757
Protecting the human resources of a country is a difficult, long-term task. At leastfour areas must be considered: health, nutrition, sanitation, and education. A strategyhas to be adopted to develop the human resources in each of these four areas and tocoordinate programs among the sectors. Individuals must be protected from the momentthey are born (or even before) by adequate nutrition, sanitation, health care, education,and housing. These components must be well-coordinated because they are interrelatedand interdependent.
It is obvious that all nations would benefit from a nutrition and health policy.However, a universal health and nutrition policy would require considerable resources,and the ultimate decision rests at the political level. In a situation of underdevelopment,governments have many urgent priorities to confront, and often, political decisions onhealth and nutrition take a back seat and are postponed. Unfortunately, those who suf-fer from extreme poverty and malnutrition are not well-organized and lack the means toexert political pressure. Furthermore, results take a long time to become visible, andpolicymakers frequently need immediate results.
In my experience, political decisions supportive of a national health and nutritionpolicy do not happen spontaneously. Rather, they must be induced. In the case of Chile,the University (Universidad de Chile)—especially our Institute (Instituto de Nutrición yTecnología de los Alimentos, INTA)—has played a very significant role. Pragmatically,whereas the first priority of a politician is to achieve power, the first priority of a gov-ernment is to remain in power. On the basis of this assumption, support for a desiredpolitical decision is obtained only when the decision brings benefits to political
Fig. 3. Life expectancy in relation to GNP. Note: Line of central tendency is freehandcurve. (Source: UNICEF Commission on Health Research Development, HealthResearch: Essential Link to Equity in Development. Oxford University Press, NewYork, 1990, p. 10.)

758 Part VIII / Preventive Nutrition: Global Perspectives
supporters, that is, to provoke a favorable political decision, malnutrition and healthproblems must become visible political issues.
For many years, we have developed a defined communications strategy to createawareness of nutritional and health problems in the community. With this purpose in mind,for years we have used the mass media, including the training of journalists, to createawareness about the adverse effects of malnutrition and poor health on individuals andthe whole society.
Only when this communications stage has been reached will politicians become dis-posed to incorporate health and nutrition programs or interventions into their politicalplatforms. Although their actions are sometimes employed for propaganda purposes,substantive policy and technical criteria have slowly gained ground in this way.Therefore, a stage is reached when practically all the candidates for public office haveprograms aimed at eradicating malnutrition and improving health conditions. In thissense, election periods are especially important.
Generally, to be successful as a planner, it is necessary to calculate not only the nutri-tional or the health cost–benefit relationship of a given program but also the politicalcosts and benefits. Only those professionals who have calculated the nutritionalcost–benefit ratio of a given program are be able to translate that data into a politicalequation, having proved that they are successful in getting their ideas implemented.
Another notable consideration is to implement nutritional and health policies that lastover time, beyond the tenure of the current government. Very frequently in LatinAmerica, new governments have a tendency to change what the previous governmentshave done. The success observed in Chile exists because, in great part, programs havebeen maintained and perfected over time. In this respect, our institute has played acrucial additional role (5). Every political system or government has its supporters andenemies. Programs, with their successes and failures, necessarily come to be identifiedwith the government in power. Therefore, professional planners responsible for theseprograms will also come to be identified with a particular government.
The crucial point for the professional is to reach an acceptable balance between polit-ical involvement and independence. This is perhaps the key point: to keep the programsrunning beyond the term of the government in power. In this sense, we have been in anexceptional position, because our interventions have been carried out in a university set-ting and from the vantage point of a highly respected institution. It is essential to gainthe confidence of the government in power as well as of the community. The wholeteam of experts participating in a health and nutrition program must be cautious not toget involved with contingent, changing, and short-lived issues. This is extremely difficult,especially in Latin American universities, because they can easily become instrumentsto promote a particular political point of view, despite the essential need to remainoutside of the power struggle. Therefore, it is important for professionals to win supportfrom all sides and to remain aloof from partisan political battles.
Finally, a nutritional and health policy must be flexible in that it must be adaptable tothe socioeconomic strategy of the government. Often, planners try to do exactly the oppo-site, that is, to adapt government socioeconomic policies to the needs of a nutrition andhealth policy. Lack of flexibility is unrealistic and underlies many failures. Policy must bedeveloped in a way that it is compatible with different political philosophies and realities,ranging from a Socialist economic system to a liberal, market economy. This has been thecase in Chile, where nutritional and health policies have survived shifts from one extreme

Chapter 30 / Malnutrition in Chile 759
to the other. During the past 40 yr, despite changing governments and economic strate-gies, the basic principles behind health and nutrition have been maintained, and programefficiency and coverage have been improved. Additionally, new interventions have beenimplemented regardless of changing circumstances. This means that health and nutritionpolicies were flexible and were not linked to any particular political group or ideology.
3. PRIMARY HEALTH CARE
In a underdeveloped country, a high percentage of people are born into extremelyimpoverished conditions and are subject to high risk. They also are totally marginalized,living outside the socioeconomic structures of society. Therefore, it is difficult to reachthem with the basic services provided by the government. For most families, this povertyhas persisted for many generations. Furthermore, they do not anticipate any change intheir circumstances, nor do they perceive the benefits that they could obtain from the ser-vices provided by the government. People living in extreme poverty frequently lack thecapacity to become organized, and they do not and cannot exert political pressure toobtain favorable legislation. Many governments have organized health systems forgroups that can exert pressure, such as blue- or white-collar workers, the military, and themiddle class, but ignore or pay little heed to marginal rural and urban groups.
From our viewpoint, the first step in a sound nutrition and health policy is to orga-nize a national health infrastructure. This would cover the entire population, especiallythe lower socioeconomic groups, and offer free services for those who cannot affordthem. This policy has taken effect in Chile. In 1952, several organizations that providedhealth care were merged and transformed into the National Health Service. Since then,preventive medicine has been provided, at no charge, to the entire population.
In the beginning, only a small percentage of the population was covered; however,coverage has extended to the whole country, excluding only those who can afford privatemedical care. Presently, the National Health Service has 38,563 hospital beds and 1520health clinics and health centers throughout the country. The National Health Serviceemploys 58,000 persons, including 5300 physicians, 1602 dentists, 4002 registerednurses, 1690 midwives, 836 social workers, 790 nutritionists, and 30,200 nurses aides.
In the 30 yr that the service has been operating, coverage has been not only extendedbut has been made more effective. The personnel has developed an attitude of serviceand commitment to the community and have gained its respect. In turn, the populationhas become aware of its rights and responsibilities regarding health care. For example,examinations during pregnancy have increased considerably, 99.9% of births now takeplace in hospitals, and an estimated 97% of all children are administered immunizationsregularly. As a consequence, the incidence of diseases such as whooping cough hasdeclined considerably, and poliomyelitis, measles, and tetanus neonatorum have beeneradicated. Regular check-ups of children have become routine and provide weight-for-age data for more than 96% of preschool children, who are evaluated every 3 mo.
Family planning has been included among health activities since 1966 and hasresulted in a considerable decrease in fertility. Currently, a large percentage of womenare using contraceptives, which has contributed to a decline in population growth froman annual rate of 2.9% to the present rate of 1.32%. The decrease has taken place mainlyin the low socioeconomic groups. Because of this, a significant decrease has beenobserved in infant mortality and malnutrition. From 1962 to 1981, the crude birth rate

760 Part VIII / Preventive Nutrition: Global Perspectives
decreased from 38 to 23 per 1000, particularly among families with four or more children,in which the greatest incidences of malnutrition are usually found. There also have beenfewer births to women age 35 yr or older, a situation that has contributed to the declinein neonatal mortality. The decrease in the birth rate is responsible for 20% of the reductionin the infant mortality rate (6).
From the beginning, a program of nutritional intervention was implemented through-out the National Health Service. It includes free distribution of powdered milk for everychild up to age 2 yr and weaning foods for children between ages 2 and 5 yr. The programalso includes powdered milk distribution to lactating and pregnant mothers (Table 3).
The food is distributed through the primary health care centers and acts as a motiva-tion for undertaking other health care activities. Food distribution has been extremelyimportant not only from the nutritional point of view but also as a mechanism to attractmothers to the health care centers. To achieve these goals, the products distributed andtheir packaging and display have been of excellent quality. Special care has been takento avoid the feeling that these programs are designed for poor people. The same prod-ucts and services compete successfully in the open market.
The food distribution program began in 1951. In the beginning, the amount of milkthat was dispensed was limited but increased gradually as the National Health Servicedeveloped. Figures 4 and 5 show that a close relationship exists between the amount offood distributed and the number of visits to a primary health care facility. The linkagebetween food distribution and attendance at health care centers means that in the pub-lic mind, both programs are interrelated and complementary.
In short, an efficient health care infrastructure and rational nutritional programs havebeen two basic factors that explain the dramatic decline in malnutrition and infant andpreschool mortality in Chile between 1960 and 1974. The improvements during thisperiod served as a foundation for later progress. The implementation of the health system,with its broad coverage, has led not only to effective nutritional programs that are orientedat target groups but also to other interventions, such as family planning, health controls,immunizations, health and nutrition education, and the promotion of breastfeeding. Thefact that the community has developed a true “culture of health” and has become awareof the need to preserve this culture through the health service is of paramount importance.
Table 3Amounts of Food Distributed Monthly by National Health Service
to Children and Mothers
Composition per 100 g
Group Product Amount (kg/mo) Calories Protein (g)
Children0–5 mo Milk 26% fat 3 496 276–23mo Milk 26% fat 2 496 272–5 yr Weaning food 1.5 420 20
WomenPregnant Milk 12% fat 2 410 31.6Nursing Milk 26% fat 3 496 27
(From ref. 2.)Note: In each instance, “milk” means powdered milk.

Chapter 30 / Malnutrition in Chile 761
Fig. 4. Prenatal visit and amount of food distributed. Note: As food distributionincreases, so does the number of visits of pregnant women. (From ref. 12.)
Fig. 5. Children attended by the National Health Service and amount of milk distributed.Note: As milk distribution increases, utilization of medical services. (From ref. 12.)

762 Part VIII / Preventive Nutrition: Global Perspectives
4. OUR EXPERIENCE IN NUTRITIONAL POLICY
Despite all of these advances, in 1974, malnutrition in Chile still affected 19% of thepreschool children, and infant and preschool mortality was 64 per 1000. Therefore, anew strategy was required, and for this purpose, the government created the Council forFood and Nutrition (Consejo Nacional para la Alimentación y Nutrición; CONPAN) in1974. This was an autonomous, interministerial agency entrusted with the preparationand coordination of a nutritional policy for the country. The agency had a council thatwas composed of the ministers of health, economy, education, agriculture, work, socialwelfare, and planning. CONPAN had an executive coordinator to supervise the techni-cal and administrative coordination of the agency’s activities, a position that I had theprivilege of undertaking.
CONPAN resulted in a new nutrition policy with the aim of ensuring the best possiblenutritional situation for the entire population within the limits of the country’sresources. Special emphasis was placed on protecting the most vulnerable groups. Thenew policy encompassed the entire food chain as well as the concerns for food security,food production, imports, food marketing, income, quality control, nutrition education,micronutrient disorders, nutritional diseases, and sanitation (7).
We soon realized that these concepts were absolutely theoretical. To articulate a nutri-tion policy is one thing, to try to implement it is a completely different issue. Numerousobstacles became apparent. Resources were limited; bureaucratic resistance surfaced;vested interests emerged; and, finally, rivalries among different ministers arose, reflect-ing the fact that few would accept interference in their own areas of responsibility. Welearned the hard way that an ideal nutrition policy may be an impossible dream and thatit may be unnecessary after all. Therefore, we concentrated our efforts on specific inter-ventions aimed at improving the nutritional condition of specific target groups.
CONPAN had a short life and was disbanded by a government decree. Thereafter, wechanged the strategy to establish direct relationships with particular ministers and key peo-ple in the different sectors. This approach proved to be much more effective. Our conclu-sion was that we should not pretend to have a comprehensive nutrition policy or an officialbody to coordinate the interventions of the different sectors. Coordination and evaluationare extremely difficult tasks in any government. The essential points are to exert leadership;to have credibility based on scientific and technical authority; and to exhibit flexibility,and—most of all—persistence and patience. Again, it should be noted that this has been thecritical role played by the university and, more specifically, by INTA.
In retrospect, I think the rather brief existence of CONPAN was necessary.Methodologies for solving significant problems were developed, and many of the inter-ventions that were designed have since been successfully implemented. Above all, thegovernment became aware of the need for scientifically based programs that seek tohelp groups that have been excluded from the economic and political structures of thecountry. After describing this experience, I must say that ultimately, considerableprogress was achieved during this recent period, which I attempt to summarize here bysectors—health and nutrition, education, and agriculture.
4.1. Health and Nutrition SectorA data collection system was developed that was specifically targeted to the nutri-
tional condition of children up to age 6 yr. Every child under the care of the National

Chapter 30 / Malnutrition in Chile 763
Heath Service (an estimated 1.35 million children) is measured every 3 mo and his orher weight-for-age is calculated. Basic family information is gathered to examinesocioeconomic conditions and related health risk factors. Information about weight atbirth is regularly collected for all the deliveries in the hospitals of the country.
4.1.1. FOOD AND NUTRITION INTERVENTIONS
Targeted food interventions have been developed for families in extreme poverty. Forthese groups, a food distribution program that includes staples such as rice, wheat flour, andoil was established through the primary health care centers. The objective of this program isto improve the nutrition of both the children and their families. This program selects fami-lies with low-birth-weight children (2.5 kg), children whose weight increase has been inad-equate for 2 mo, and children born to mothers under age 20 yr. Families with five or morechildren and those with severe socioeconomic problems also participate in the program.
4.1.2. TREATMENT OF MALNOURISHED CHILDREN
Children suffering from severe malnutrition now have access to treatment. This pro-gram has had a direct influence on infant mortality. A study performed in 1974 showedthat an average of approx 8200 children per year became severely malnourished. A follow-up study confirmed that infants with severe malnutrition prior to age 6 mo had an 85%chance of dying before they were age 1 yr. Analysis of cases of severe malnutritionshowed that almost all occurred in children under age 2 yr, and 80% of the affected chil-dren were age 6 mo.
In 1975, a pilot project was started to tackle this program, with the aim of rehabilitatinginfants with severe malnutrition. For this purpose, a specialized Nutritional Recovery Centerwas set up with 40 beds for infants. Each malnourished infant remained an inpatient until heor she fully recovered; he or she was given appropriate food and underwent a program ofcognitive, affective, and motor stimulation. The mother was involved in the treatment andreceived education and training. The results of this pilot study were impressive. Althoughinpatient mortality previously had been about 25%, no deaths occurred among the childrenin treatment, and very satisfactory rehabilitation was attained in both nutritional and psy-chomotor status (Table 4 and Fig. 6).
In view of the successes of the pilot project, INTA set up a private foundation knownas the Chilean Nutrition Foundation (Corporación para la Nutrición Infantil; CONIN)to extend the pilot program throughout the country. Within 3 yr, with funds provided bythe community (amounting to $9 million), 33 centers were built, equipped, and put intooperation in different cities in the country. The installed capacity covers all needs. With1500 beds, it is possible to treat 34,000 severely malnourished children annually, thusbringing them to full recovery.
Each center has 40 to 60 beds, full medical facilities, a kitchen with milk distribu-tion, and a laundry. The staff encompasses a full-time manager and six health profes-sionals, including a pediatrician, nutritionist, registered nurse, nursery teacher, and asocial worker. Forty nurses aides work in three shifts, and 80 volunteers work on indi-vidual stimulation programs and follow-up visits at home. Operational costs arefinanced under an agreement with the National Health Service (which covers 80% ofthe costs) and by CONIN-raised funds (8). The actual cost per day is $13.00 per child,and the total cost of rehabilitating one severely malnourished infant is $1170. CONINhas a staff of 1400 in addition to 2300 voluntary workers.

764 Part VIII / Preventive Nutrition: Global Perspectives
The program has had a notable impact in reducing the number of children sufferingfrom severe malnutrition and in reducing the incidence of infant malnutrition. It is esti-mated that CONIN helps prevent almost 2000 deaths annually among infants under age12 mo. Thus, in terms of overall infant mortality the program is responsible for over20% of the reduction in infant mortality. During the years in which the program hasbeen operational (1975–2002), more than 85,000 infants have been rehabilitated, withan average mortality rate of 2%. Follow-up studies show that 98% of the children whohave recovered continue to have satisfactory weight gain at home, and only 1.8% haverequired re-admission in a center.
Table 4Clinical Progress of Marasmic Infants During 4 Mo of Treatment
Statistic At admission At 50 d At 100 d At 150 d
Weight deficit for age (g)Group A 56 ± 8 54 ± 13 48 ± 12 40 ± 13Group B 55 ± 5 35 ± 8 21 ± 6 16 ± 3
Height deficit for age (cm)Group A 76 ± 10 70 ± 17 65 ± 14 65 ± 14Group B 82 ± 13 50 ± 14 32 ± 6 21 ± 7
p < 0.001 p < 0.001 p < 0.001Psychomotor development quotient
Group A 56 ± 8 60 ± 11 64 ± 14 65 ± 12Group B 55 ± 5 71 ± 10 80 ± 8 85 ± 1
p < 0.001 p < 0.001 p < 0.001
Note that group A consisted of 80 infants treated in a conventional pediatric hospital and group B con-sisted of 80 infants treated in a CONIN center.
(From: Mönckeberg F. Nutrition in the 1980s. Liss, 1980, p. 141.)
Fig. 6. Weight increase in 70 severely malnourished infants after 4 mo of treatment.(From ref. 8.)

Chapter 30 / Malnutrition in Chile 765
CONIN now has embarked on a new program that rehabilitates low-birth-weightbabies before returning them to their mothers. Studies have shown that this is a high-riskgroup that significantly contributes to mortality during the first 2 mo of life. Affectedinfants remain in a center for 30 d, during which time the mothers receive instruction onchild care (9).
4.1.3. BREASTFEEDING
Because a large share (85%) of Chile’s population lives in urban areas, and perhaps asa result of the system of free milk distribution, there has been an abrupt decline in thepractice of breastfeeding. In 1940, 85% of the infants were breast-fed up to age 6 mo. By1967, this proportion had decreased to 25%, and by 1974, the proportion was only 19%(10). This decline undoubtedly contributed to the increase in early, severe malnutrition.Consequently, an extensive program was introduced to promote breastfeeding, usingboth the mass media (e.g., radio, television, magazines) and formal education. In partic-ular, the professional medical community and the schools that train child health careworkers (such as midwives, nurses, and health educators) took a firm stand regarding thisissue. Professional and auxiliary personnel have received instruction provided by theNational Health Service. Printed materials have been prepared and distributed that illus-trate the importance of breastfeeding and how to advance its occurrence.
As a consequence, there has been a noticeable change of attitude in the populationand among health care personnel. Breastfeeding has significantly increased. More than70% of mothers now breastfeed their children during the first 90 d of life, representingan 88% increase in breastfeeding during the first 3 mo of life (11).
4.1.4. NUTRITION EDUCATION
A nutrition education program was created by CONPAN and included nutritiontraining at both the elementary and intermediate school levels. Textbooks have beenprepared, although they have not been used. However, in the health sector, there hasbeen considerable progress with nutrition training. It has been possible to staff eachnational health service clinic with a nutritionist, who is responsible for implementingthe nutrition education program. Nutritionists, who are required to undergo 5 yr ofuniversity courses, have carried out important work in both the prevention and thetreatment of malnutrition.
4.1.5. RURAL HEALTH CARE
Because 85% of Chile’s population is urban, the National Health Service has ade-quate coverage in urban areas; however, it has been more difficult to provide coveragein rural areas, especially in the most isolated regions. Medical and nutritional care forrural communities is provided by health posts, each of which has a full-time healthworker whose activities are complemented by regular visits from health teams. Thesehealth posts also provide nutrition programs.
To increase the availability of health care for pregnant rural women and to provideadequate access to the nearest maternity facility, a program known as Hostels for RuralMothers was implemented. The idea was to build these accommodations near maternityhospitals and to allow pregnant women from rural areas to stay there during the 15 dprior to and up to 10 d after the delivery. The women also receive instruction from hos-pital staff concerning nutrition, breastfeeding, and child care. Sixty-four of these hostels

766 Part VIII / Preventive Nutrition: Global Perspectives
have been established in conjunction with maternity hospitals in primary health careareas. Together with other measures, they have significantly decreased neonatal mortalityby reducing the risks inherent in delivery.
4.2. Educational Sector4.2.1. PRIMARY EDUCATION
During the past 30 yr, a considerable improvement has occurred in elementary edu-cation. In 1960, more than 30% of the population was illiterate; the illiteracy rate nowstands at less than 2%. Only 10% of the children in 1960 had completed elementaryeducation. Today, 100% of children complete 8 yr of elementary education.
It is particularly important to draw attention to the emphasis that has been placed oneducation for mothers, because this has a strong bearing on malnutrition and infant mor-tality. The latter is five times higher among mothers who have not completed elementaryeducation than among those who have (12). Progress in the educational field is partic-ularly noticeable among women who were illiterate during their childbearing years.This figure fell to 6% by 1982 and 1% in 2002. In the period from 1969 to 1982, therewas a noticeable decrease in the number of births to women with a low level of education(i.e., either without education or with only elementary level education).
4.2.2. SCHOOL FOOD PROGRAMS
The school feeding program, although not technically a nutritional intervention pro-gram because it only can provide limited daily calories and protein, has had a veryimportant effect in reducing school desertion. CONPAN reviewed the program andreached the conclusion that its implementation should be transferred to private agenciesthat could provide the complete service and left the role of evaluation and control to theMinistry of Education. This re-organization improved the quality of the service andaccomplished the goal of combating school desertion. Presently, the program, whichtakes place during 180 d of the school year, supplies 1,350,000 breakfasts and 830,000lunches daily to 5000 schools across the country.
4.2.3. PRESCHOOL FOOD PROGRAMS
The largest proportion of malnourished children in Chile live in deprived urban areasas a result of the massive migration to the cities, which took place during the pastdecade. Almost every city has a belt of shantytowns surrounding it. Experience showsthat it is difficult to prevent malnutrition in children from population groups with a lowsocioeconomic and educational level, even when free food is provided. Moreover, sev-eral studies indicate that extreme poverty causes damage to the physical and intellectualcapabilities of individuals. This damage is the result not only of malnutrition but ofother factors inherent in chronic poverty.
Against this background, CONPAN supported the development of a day care centerprogram for preschool children living in extreme urban poverty. Children attending thecenters during the day have all food provided and also undergo psychomotor and affec-tive stimulation. During the past 15 yr, 1500 such centers have been built andequipped, covering 360,000 preschool children between ages 2 and 6 yr. According toearlier estimates by CONPAN, the program will eventually cover 380,000 children, whichis the number believed to be at risk of malnutrition and living in extreme poverty inurban areas (13).

Chapter 30 / Malnutrition in Chile 767
4.2.4. HOMELESS CHILDREN
A program for homeless and troubled children was designed to provide care in live-incenters for children ages 2 to 12 yr. These children include orphans, abandoned chil-dren, and children who display maladjusted behavior. The goal is to restore the child toa normal behavioral situation, to combat child vagrancy, and to improve the conditionsof life. The program has been extended and improved through the building of new centersand now provides coverage to 52,000 children.
4.3. Sanitation SectorOvercrowding and inadequate sanitation in urban areas are common to all Latin
American countries. The situation has become worse in the past few decades as a resultof the explosive growth of the population and increased migration to the cities. In 1974,a high percentage of the population in Chile lived in extremely impoverished areas thatlacked sanitation facilities. Inadequate sanitation adversely affects child nutrition andgives rise to gastrointestinal and other infectious diseases. Diluted, contaminated infantformulas are one of the main contributors to a shift in the incidence of malnutrition tothe early months of life, and this, in turn, is associated with high risk of death.
For these reasons, CONPAN developed a program that emphasized the importanceof sanitation in preventing early malnutrition. During the initial stage of this program,a brick-and-timber sanitary unit was built on the plots of 300 families that lived in aslum area. Each unit had a kitchen, a bathroom, and an outdoor sink for washingclothes. The kitchen was equipped with shelves and a sink; the bathroom had a lavatory,a flush toilet, and a shower. Hot water was also supplied. The unit was connected to thegeneral sewage system (14).
The results demonstrated a significant causal link between environmental sanitationand improvements in both nutrition and the quality of life. The most significant resultmay have been the striking change that occurred in the attitudes of the families. The pes-simistic and fatalistic approach to life, the hopelessness, and the acceptance of the mis-erable lifestyle that prevailed in the community that existed before the sanitary unit wasinstalled changed into a sincere and deeply felt desire for improvement in living conditions.This resulted in increased individual efforts and in motivation to meet the challenge ofimproving the quality of life.
The results led to the development of a nationwide sanitation program to improve thesanitary situation of the urban population. In the past 15 yr, 250,000 sanitary units havebeen built in different cities of the country. In 1960, only 40% of the population haddrinking water in their homes, and only 35% had an adequate sewage system. At pre-sent, 99% of the population have drinking water at home, and 93% live in housing con-nected to a sewage system (Table 5). There is no doubt that improved sanitary conditionsalso have been important factors in the decrease in malnutrition and in the improve-ments in health conditions.
4.4. Agricultural SectorAgriculture and food production are fundamental elements in any nation’s develop-
ment process and a precondition to raising the state of health and nutrition among peo-ple. As I emphasized earlier, the economic development of Chile (as expressed in GNPper capita) for the most part has not been very considerable during the past 40 yr. Fromthe beginning of the 21st century, the Chilean economy has been primarily based on the

768 Part VIII / Preventive Nutrition: Global Perspectives
export of raw materials—first nitrates and later copper. Industrial development beganonly after World War II, but this development was based on import substitution, with ahigh degree of protectionism. Agricultural development was retarded because of artifi-cially fixed prices, the high cost of imported commodities, and the lack of incentives.As a consequence, agricultural production increased less than population growth, andthe failure of agricultural production to keep pace resulted in the ever-increasingimportation of food.
In 1970, a Socialist government was elected, and an agrarian reform was imple-mented. This reform resulted in the expropriation of more than 60% of the total landunder cultivation in the country. Agricultural production fell almost totally under gov-ernment control. A year later, agricultural production had nearly collapsed. Enormousamounts of food (equivalent to 70% of all the requirements) had to be imported (14).
Three years later, in 1973, a military defeated the Socialist government, and a freeand open market economy was created. In 1974, CONPAN and the Ministry ofAgriculture established a new agricultural policy based on the following principles:
1. Transfer of state-owned land to peasants and farmers.2. Free market prices for every agricultural product and elimination of all state subsidies.3. Guaranteed prices for basic products.4. Technology transfer to farmers.5. Construction of an irrigation infrastructure.6. A new credit policy.
As a result of these changes, a rapid increase in agricultural production was achieved,with an annual growth rate of 7% during the past 10 yr. The value of annual foodimports fell from 700 million in 1973 to 195 million at present. In the past 11 yr, aremarkably strong agricultural sector has been established that consists of fruit and veg-etable production and agroindustrial development. Currently, this has become one of themost dynamic economic sectors, which in 1995 accounted for $400 million in exportsper year. The success of Chile’s agricultural sector has led not only to a sharp decline incostly food imports but also to a substantial increase in rural employment and incomeand, correspondingly, to a marked improvement in health and nutrition.
5. FINAL COMMENTS AND RECOMMENDATIONS
The Chilean experience demonstrates that it is possible to implement targeted inter-ventions in health, sanitation, education, and food production and distribution, whichwill result in substantial improvements in the health and nutrition status of the popula-tion despite the persistence of poverty and underdevelopment. This concept is important
Table 5Urban Coverage of Potable Water and Sewage Services (1970–2000)
Year Potable water (%) Sewage (%)
1970 72.3 41.21980 92.5 65.31990 97.3 78.11994 98.9 88.72000 99.2 93

Chapter 30 / Malnutrition in Chile 769
because it shows that in Chile, it was possible to create conditions that prevented thenegative physical and psychological consequences of an unfavorable situation thataffected a large number of infants and children. By hindering the full expression of thegenetic potential of the population, the prevalent negative societal and environmentalfactors impeded development. We maintain that the potential and capabilities of thepopulation constitute the most precious asset of any country. To attain satisfactory lev-els of development, these resources must be carefully protected and nurtured. Of course,the successful application of our experience in other countries requires a careful analysisof the local realities and the adaptation of the programs to these realities.
In the early 1960s, Chile had one of the highest infant mortality rates in Latin America(120/1000) as well as the highest rate of malnutrition among children under age 5 yr(46%). Since then, a progressive, steady improvement occurred in the health and nutritionof infants and preschool children and this has continued to today. Biomedical indicatorsshow that Chile currently enjoys some of the best indices in the region. The largest pro-portion of these improvements was achieved at a time (1970–1987) during which theGNP “per capita” did not change substantially and during which poverty persisted almostunchanged. Later, from 1986 to 2000, the situation in Chile began to improve from theeconomical viewpoint (as a consequence of a shift in the economic model) from aplanned, centralized economy to an open, free market-oriented, liberal economy. As aresult, during the past 15 yr, the GNP has increased at rates between 7 and 9% per year(15). During the same period, the percentage of population living in poverty has decreasedfrom 40.7 to 16.2%. The infant mortality rate is now close to 9 per 1000, and the per-centage of malnourished children under age 6 yr decreased from 8 to 2.9% (Table 2).
Currently, 100% children finish 8 yr of basic education, and 83% finish high school.There is no doubt that this socioeconomic progress is explained by a number of factors;however, it is also possible to postulatethat the change and improvement in the qualityof the human resource has played a very important role during this process (althoughthis may be difficult to prove). As an additional parameter of this change, it is worth not-ing that the average 18-yr-old Chilean male is 11 centimeters taller than his homolog of30 yr ago. In other words, a higher percentage of children currently are expressing theirfull potential for growth.
The Chilean experience demonstrates that it is possible to prevent the damage causedto the population by this adverse environment, although underdevelopment and povertypersist. At a later stage, if the quality of the human capital is preserved and has a satis-factory level of education, it is possible to achieve substantial changes in the standardof living through sustained economic and social development.
REFERENCES1. Mönckeberg FS, Valiente S, Mardones F. infant and preschool nutrition: economical development
versus intervention strategies, the case of Chile. Nutr Res 1987; 7:327.2. Mönckeberg F. The possibilities for nutrition intervention in Latin America. Food Tech 1981;
35:115–121.3. Commissions on Health Research Development. Health Research: Essential Link to Equity in
Development. Oxford University Press, 1990, pp. 10.4. Terra JP. Situación de la Infancia en Latinoamérica y el Caribe Remarks at the Annual Meeting of
UNICEF, México City, May 16–18, 1979.5. Mönckeberg F. Socioeconomic Development and Nutritional Status: Efficiency of Intervention
Programs. In: Underwood, BA ed. Nutrition Intervention Strategies in National Development.Academic Press, New York, 1983, p. 31.

770 Part VIII / Preventive Nutrition: Global Perspectives
6. Taucher E. Effects of Declining Fertility on Infant Mortality Levels (unpublished report).Rockefeller Foundation, New York, 1986.
7. Mönckeberg F, Valiente S, eds. Food and Nutrition Policy in Chile Santiago: Instituto de Nutrición yTecnología de los Alimentos, 1976.
8. Mönckerberg F, Riumallo J. Nutrition Recovery Centers: The Chilean Experience. In: UnderwoodBA, ed. Nutrition Intervention Strategies in National Development. Academic Press, New York,1983, pp. 31–42.
9. Mönckeberg F. Treatment of Severe Malnutrition During the First Year of Life. In: Nutrition in the1980s: Constraints on Our Knowledge. New York, 1981, p. 141.
10. González N, et al. Evaluación preliminar del programa de fomento a la lactancia materna. RevChilean Pediatr 1982; 54:360.
11. Valiente S, et al. Evolución de la mortalidad infantil y otros indicadores Conexos en Chile, entre1962 y 1981 (unpublished report.).
12. González N, Infante A, Schiesinger L, Mönckeberg F. Effectiveness of Suplementary FeedingPrograms in Chile. In: Underwood BA, ed. Nutrition Intervention Strategies in National Development.,Academic Press, New York, 1983, pp. 101–109.
13. Schiesinger L, et al. Environmental Sanitation: A Nutrition Intervention. In: Nutrition InterventionStrategies in National Development. Underwood Academy, 1983, p. 241.
14. Mönckeberg F. Crear para competir y Competir para Seguir Creando. Santiago: Editorial AndrésBello, 1980.

From: Preventive Nutrition: The Comprehensive Guide for Health Professionals, Third EditionEdited by: A. Bendich and R. J. Deckelbaum © Humana Press Inc., Totowa, NJ
771
31 Effect of Westernization of NutritionalHabits on Obesity Prevalence in Latin AmericaAnalysis and Recommendations
Jaime Rozowski, Oscar Castillo,and Manuel Moreno
KEY POINTS
● Nutritional habits of Latin Americans show a trend toward a Western-type diet.● There is a clear tendency of increased consumption of fats, saturated fats, and animal
proteins and of decreased consumption of fruits and vegetables in the diet.● Prevalence of obesity is high in many countries of the region in all age groups, with a
clear tendency to increase.● Prevention programs should be implemented from childhood, with a strong political
backing and the involvement of the community.● Recommendations on objectives and goals to increase nutrition education and promote
exercise in the population are proposed.
1. INTRODUCTION
Latin American countries, although located in the same region, show a substantialheterogeneity in their ethnicity, socioeconomic level, and health. The region (includingthe Caribbean) is home to 542 million inhabitants and is the most urban region in thedeveloping world (1). The region shows great inequalities in socioeconomic level, withmore than one-third of the population living in poverty. For these reasons, it isextremely hard to discuss average values of any indicator used. For instance, althoughthe average infant mortality rate in the region is 19.7 per 1000 live births, the rangeobserved in the different countries is between 3.7 and 129.3 per 1000 live births.Similarly, life expectancy at birth, although showing an average of 70 yr, ranges from56.8 to 79 yr, a 22-yr difference (1).

772 Part VIII / Preventive Nutrition: Global Perspectives
Urbanization has been a major issue in Latin America during recent decades, involv-ing currently more than 70% of the population. Of this 70%, almost 80% of them livein cities with more than 700,000 inhabitants. Although urbanization in industrializedcountries usually brings along progress in technology and social development, in devel-oping countries, the benefits of urban growth tend to be present only in the highersocioeconomic levels. In the low-income groups, urbanization usually leads to a rela-tive decrease in income, which, from the nutritional point of view, produces a shifttoward consumption of high-calorie foods with a reduced nutrient density, producing atrend to incorporate food into the diet that is more commonly consumed in industrial-ized nations. In fact, this trend is observed in the majority of the countries in theLatin American region in what could be called the “Westernization of eating habits”(see Section 3.); this trend is characterized by an increased consumption of the so-called“fast foods” coupled with a tendency to decrease physical activity.
The incorporation of these new trends has led the Latin American region as a wholeand every country in particular to change morbidity and mortality profiles, producingan increase in the prevalence of chronic diseases greater than that of infectious diseases,the common killers of the past. Currently, chronic diseases are the main cause of deathin most Latin American countries (1). An example is the case of Chile, where the infantmortality rate in 1955 was approx 120 per 1000 live births, mainly as a result of malnu-trition and infectious diseases. At that time, cancer and cardiovascular diseases (CVDs)accounted for 25.8% of all deaths in the country (2). Currently, the infant mortality rateis around 10 per 1000 live births, with cancer and CVDs accounting for more than 50%of all deaths. Additionally, the mortality rates attributed to diarrhea and gastroenteritis ofpresumed infectious origin decreased from 20 to 0.035 per 1000 live births in the sameperiod of time (2). A similar pattern has been observed in other countries of the region.Figure 1 shows the infant mortality rates from 1960 to 2000 in five countries repre-senting a range of socioeconomic levels. Although all of these countries show a reductionin infant mortality rates, this decline has been variable, with Chile demonstrating thelargest relative decrease in the last four decades. These data are also reflected in the
Fig. 1. Infant mortality rates in selected Latin American countries, 1960–2000. (FromPan American Health Organization [1].)

Chapter 31 / Obesity in Latin America 773
proportion of individuals older than age 65 yr, as shown in Fig. 2, which also depictsdata since 1960. The proportion of the group older than age 65 yr has increased 66% inBrazil and 50% in Chile and Uruguay since the 1960 (3). In countries with slowerdevelopment, such as Bolivia and Guatemala, the increase in this segment of the popu-lation has been minimal. Aging of the population, coupled with a decline in earlydeaths, forecasts an increase in the prevalence of the chronic diseases of the aged.
The increase in adult population causes a growing demand on health services, notonly to take care of the nutritional needs of the mother and child (undernutrition andmicronutrient deficiency) but also to provide for the treatment of nontransmissiblechronic diseases and their associated risk factors. Therefore, it is very important todecrease the nutrition-related risk factors involved in these diseases, such as excessiveweight and high intake of saturated fats, through health promotion and nutrition educa-tion in the community.
2. SOCIOECONOMIC CHANGES
A thorough discussion of socioeconomic changes in the Latin American region isbeyond the scope of this chapter. However, it is important to discuss some aspects thatare relevant from the nutritional point of view. The gross national product (GNP) of thecountries in Latin America has increased substantially in recent decades. Nevertheless,this increase has not always been accompanied by an improvement in the health situa-tion. For instance, Brazil, which in 1990 had one of the largest GNPs per capita in LatinAmerica, still had an infant mortality rate of 57.5 per 1000 live births, higher than therates of countries with lower GNPs, such as Chile and Uruguay (4).
The improvement in GNP and in the general well-being of many countries in theregion has produced an influx of foreign fast food enterprises that offer a wide range offood items at very low cost and, therefore, at the reach of people from all socioeconomiclevels. For instance, a chain of fast food restaurants had a recent offer in Santiago, Chilein which hamburgers were advertised for the equivalent of $0.60. At this price, practi-cally everyone was able to take advantage of this offer.
Fig. 2. Proportion of people older than age 65 yr in selected Latin American countries.(From the Economic Commission for Latin America [3].)

774 Part VIII / Preventive Nutrition: Global Perspectives
Another important factor has been the increase in portion sizes, which have become pro-gressively larger in recent decades. Recently, Rolls et al. (5) showed that larger food por-tions led to greater energy intake in volunteers, independently of body mass index (BMI).
The problem becomes more complex upon examination of the availability of nutri-tionally balanced foods. For example, in the case of Costa Rica, the proportion ofincome necessary to purchase the basic food basket in 1987–1988 was such that 20%of the population needed far more than the average income to purchase the basket (6).Another 40% of the population needed between 40 and 60% of their income for thesame purchase, indicating that for a large proportion of the population, it takes a majoreffort to properly feed themselves. It is obvious that this induces people to consumecheaper foods that usually are low in nutrient density and high in calories.
3. FOOD HABITS
A thorough analysis of food habits in Latin America is hampered by the lack ofnational food-consumption surveys. With the exception of a few countries, most infor-mation available is from small surveys that often are not representative of the popula-tion. Additionally, most of these surveys are published in local journals that are notalways widely available.
There is a great diversity of national nutritional habits in Latin America. In theSouthern Cone countries (Chile, Argentina, and Uruguay), wheat represents the maincomponent of the national diets, with the addition of meat and dairy products inArgentina and Uruguay. Corn is the main staple in Mexico and Central America (withthe exception of Costa Rica). The rest of the countries in that area have a rather diversediet, combining the three main cereals (wheat, corn, and rice). In the Andean countries(Peru, Bolivia, Ecuador) and Paraguay, potatoes represent an important component ofthe diets. In many countries, sugar has become an important contributor of calories, rep-resenting about 10% of caloric intake on average. However, in some groups, it can pro-vide as much as 20% of dietary calories (7).
Socioeconomic level is a major determinant of food intake. The structure of nationaldiets has shown a tendency to change in most of the countries when income per capitahas increased (8). Availability of lipid calories has increased because of a higher supplyof fat (butter, margarine, and different types of oils), with a high proportion of thiscoming from animal fat. Calories from complex carbohydrates have shown a tendencyto decrease in time, whereas the calories from sugar and other caloric sweeteners tendto increase, as has been shown worldwide across different socioeconomic levels (9).
Protein calories tend to remain stable or to increase slowly but show a rapid rise inthe intake of proteins from animal origin. One example of this is demonstrated in Fig. 3,which shows changes in consumption in Brazil. The decrease in intake of fruits and theincrease in the consumption of dairy products and vegetable oil is remarkable.Generally, the higher income group consumes a diet richer in saturated fats when com-pared with the groups with lesser income (10). Additionally, increases in BMI parallelincreases in income and dietary fat content (11).
In Chile, the last national nutrition survey in 1974 showed that although only 5% ofthe population in the highest income quintile was consuming less than the requirementof protein (0.75 g/kg of body weight), 51% of the poorest quintile consumed less proteinthan the requirement (12).

Chapter 31 / Obesity in Latin America 775
Generally, family income and urbanism are important determinants of the differencesin food regimens among families within the same country. Urban families from lowsocioeconomic levels have an intake that is about 40% greater in cereal calories thanthat of high socioeconomic level families. People in the upper socioeconomic level havean intake of animal proteins that is 80% greater than the poorer levels (7). As averageincome increases, countries tend to adopt a food model that is characterized by a highintake of energy, animal proteins, and fats, with a tendency to replace simple and tradi-tional foods by industrialized and widely distributed products (13).
Here, we compare the availability of different nutrients in countries of LatinAmerica. We have chosen to use availability of food provided by the Food andAgricultural Organization rather than compare nutrition surveys, which are often basedon different methods (24-h recall, food registry, etc.), usually done in small populations,and may not always be reliable (14).
3.1. EnergyThere is great variation in the amount of calories available in the different countries
from the Latin American region. Most countries have shown an increase in availabilityof calories—particularly in the case of Peru and Ecuador, which showed an increase ofalmost 400 calories between 1981 and 2001 (Fig. 4). In other countries, availability ofcalories has slightly decreased or showed no significant change.
3.2. FatsThere is a clear tendency in the region to increase the availability of fats, with 14 coun-
tries showing an increase over 20 yr (Fig. 5). Nevertheless, only two countries, Argentineand Uruguay, display an average proportion of calories from fats that could be considered
Fig. 3. Average changes in food consumption in Brazil, 1962–1988. (Adapted fromref. 10.)

776 Part VIII / Preventive Nutrition: Global Perspectives
elevated, although their availability has not increased. The increase in fat consumptionis a hallmark of the Westernization of the diet. This has been confirmed in several coun-tries (11,15,16). This particular pattern of fat consumption has been shown to correlatewith an increase in blood lipids (17). Regarding the type of fats consumed, there hasbeen a shift from fats of vegetable origin to animal fats, probably because of theincreased consumption of meat and prepared foods, which consequently has led to anincreased intake of saturated fats.
3.3. CarbohydratesGenerally, most countries from the region show a decrease in carbohydrate con-
sumption, with the exception of Cuba. More importantly, they also show a shift fromcomplex to refined carbohydrates (mainly sugar). This results partly from a changefrom traditional dishes to the more readily available prepared foods that usually areready-to-eat.
3.4. ProteinsProtein availability in the region has remained constant over the past 20 yr, with a
tendency to consume relatively more protein of animal origin, which results in anincreased intake of saturated fats (data not shown).
The changes in food availability are the result of a transition from consumption oftraditional dishes (usually based mainly on cereals) to a more convenient and fasterpattern of eating that tends to increase the consumption of calorie-rich products, fats, andsalt. As mentioned earlier, cereals historically have been the main staple in LatinAmerica, followed by vegetables, fruits, and roots. However, this pattern is changing toa diet that is more refined and has more sugar, fats, animal proteins, salt and less fruits,vegetables, and roots.
Fig. 4. Changes in availability of energy in Latin American countries, 1981 and 2001.(From FAO [14].)

Chapter 31 / Obesity in Latin America 777
A notable case occurred in Chile. The last national survey of food intake was per-formed in 1974 (12). That survey divided the country in regions and included a socioe-conomic analysis of the population. Important differences were found in the consumptionof protein according to income. More recent data can be found in the surveys of theNational Institute of Statistics (INE), which conducts family budget surveys based onamount of money actually spent on different items. Surveys were performed in 1969,1978, 1988, and 1997. Across socioeconomic levels, calorie consumption decreased inthe first three surveys. However, it showed a remarkable increase in the 1997 survey.Table 1 shows an analysis of food consumption based on the 1988 and 1997 INE surveys(18,19). Macronutrient intake increased in all income levels from 1989 to 1997, theincrease being most pronounced for lipids (50% on the average). Although the averageincrease in calories was 25%, it was more pronounced in the poorer groups (quintile I to III).The same was observed in proteins and lipids, which is consistent with the higher preva-lence of obesity observed in that group (see Section 4.).
The direct, positive relationship between income and food intake was also observedin smaller studies published in Chile. However, the pattern of food consumption inChile is more confusing. The proportion of calories from fat has steadily increased andis in direct correlation with socioeconomic level, reaching almost 29% of calories in therichest groups. Even the poorest groups, which usually had intakes of fat below 25%,are already surpassing that limit (20). Qualitatively, the foods consumed in Chile by therich and the poor are essentially the same. Over time and throughout socioeconomiclevels, the main contributors to calories have been bread and, to a minor extent, othercereals. It is estimated that average bread consumption in Chile in 1998 was 93.7 kg perperson per year; however, in the rural zones, the mean intake was 140.8 kg per person
Fig. 5. Changes in fats availability in Latin American countries, 1981 and 2001. (FromFAO [14].)

778 Part VIII / Preventive Nutrition: Global Perspectives
per year (21). In comparison, developed countries consume an average of 50 kg per per-son per year. Besides being a traditional part of the Chilean diet, bread is an inexpen-sive item that is widely used by the poorer sectors to satiate hunger.
The consumption of specific items in low-income populations can be determined asmuch by availability as by price. The choice of food available has usually been morelimited in low-income than in high-income neighborhoods, where the presence of largesupermarkets allows for a wider availability of different types of food.
Based on the recommendations to lower the risk of chronic diseases, the averageChilean diet could be considered a relatively healthy one. However, the differences inconsumption trends between the different socioeconomic groups are substantial. Thewealthier 60% of the population consumes a diet quantitatively different from thepoorer 40% of the population. Additionally, the prevalence of obesity in poorer groups(see Section 4.) suggests a pattern of consumption or intrahousehold distribution of foodthat is not reflected in the average values given in the different studies. Nutritional stud-ies that concentrate on these populations and that can accurately determine intrafamilyvariations are necessary to clarify the risks for these populations.
4. PREVALENCE OF OBESITY
Obesity is a nutritional disease with serious consequences. Its prevalence increaseswith age, and, although the increase with age has been accepted as inevitable, data showthat this weight gain augments the risk of mortality (22). The treatment of obesity is dif-ficult and usually unsatisfactory, therefore its prevention is very important (23).
It is well-accepted that obesity is a major risk factor for mortality, particularly fromCVD (24). An association has been found between obesity and hypertension, diabetes,lipid disorders, and ischemic heart disease. This condition is also related to otherchronic diseases such as cholelithiasis, certain types of cancer, osteoarthritis, and pul-monary disease (25,26). Therefore, obesity is a major public health concern that, if pre-vented, would certainly have a multiplying effect on the improvement of adult health.
Recent decades have witnessed a dramatic increase in the prevalence of obesity not onlyin developed countries but also in developing countries, including those of Latin America.
Table 1Apparent Daily Consumption of Calories and Proteins Per Person,
Chile 1988 and 1998
Quintile ofCalories Proteins (g) Lipids (g)
income 1988 1997 1988 1997 1998 1997
I 1640 1961 44.5 56.3 42.2 56.7II 1617 2083 43.3 60.2 43.3 62.8III 1734 2143 47.4 61.0 47.5 64.8IV 1988 2324 55.5 67.8 57.3 73.0V 2200 2513 65.0 73.9 72.1 82.3All 1869 2335 51.9 74.2 52.0 78.2
Based on food expenses in Greater Santiago (n = 5076 households for 1988 and 8445 household for 1998).(Adapted from ref. 18).

Chapter 31 / Obesity in Latin America 779
Table 2 summarizes the prevalence of obesity observed in several selected countries ofthe Latin American region. Note that only in some cases is this prevalence at thenational level, whereas other data are obtained from smaller studies that neverthelessinvolve a substantial number of individuals. There are countries in the region where theprevalence of obesity in adults and children has grown substantially, such as in Brazil(11,27,28) and Chile (29).
A recent study of 3305 individuals (ages 35–64 yr) from Mexico City showed that ina 7-yr period (with no intervention), the total prevalence of excessive weight(BMI ≥25 kg/m2) increased from 77.8 to 80%, and the prevalence of obesity(BMI ≥30 kg/m2) increased from 26.61 to 34.7% (30). In the same country in the cityof Morelos, prevalence of obesity in the 11- to 24-yr age group was 21.2% (31).
Brazil, the largest country in the region, has shown a steady decrease in malnutritionand an increase in the prevalence of obesity. A national survey was conducted in 1989in Brazil using a representative sample of 14,455 households and was compared with aprevious survey of 55,000 households performed in 1974–1975 (11). An increase inprevalence was observed in both excessive weight and obesity in the period of timebetween the two surveys. Women were 2.5 times as likely as men to be obese, but thehighest relative increase was seen in men, where prevalence almost doubled over 15 yr.In men, the prevalence was much higher in urban areas than in rural areas and showeda direct relationship with income. In both sexes, the more developed regions were asso-ciated with a higher prevalence of excessive weight/obesity (11).
Compared with the survey in Brazil from 1989, data from the survey performed in 1997show an increase in obesity in lower socioeconomic groups but a decrease in the preva-lence of obesity in affluent women. Actually, this seems to be the only favorable changepresently observed in the Latin American region (28). In their analysis of different areas,the authors showed that in women, obesity was positively associated with income andnegatively associated with education. Men from the same region showed only a posi-tive association with income. In the more developed regions, prevalence of obesity wasassociated negatively only with education, whereas in men, it was positively associatedwith income. Recently in urban Peru, Jacoby et al. (32) also showed that in women, edu-cation was negatively associated with excessive weight and obesity (32).
The prevalence of obesity is particularly high in Chile. Figure 6 shows the results ofthree studies of adults conducted in Chile. The studies from Berrios et al. took place in apopulation in Santiago in 1987 and 1992 (33,34), whereas the third study was carried outin Valparaiso in 1998 (35). All three studies were harmonized to cut-off points of a
Table 2Prevalence of Obesitya in Adults From Selected Latin American Countriesb
Men Women Reference
Brazil 8.2% 12.6% 28Chile 15.7% 23.0% 35Mexico 23.8% 42.3% 30Peru 16.0% 23.0% 32Paraguay 22.9% 35.7% 27
aBody mass index 30 kg/m2 or greater.bMore details are given in the text.

780 Part VIII / Preventive Nutrition: Global Perspectives
BMI >27.3 kg/m2 for females and >27.8 kg/m2 for males (the cut-off points used byBerrios et al.). The prevalence of excessive weight and obesity has increased with timeand is almost consistently higher in women than in men; it shows an inverse correlationwith socioeconomic level in women but not in men (data not shown).
The prevalence of obesity observed in Valparaiso in 1998 (measured as BMI ≥30 kg/m2)was 15.7% in men and 23% in women. Furthermore, this study showed that 72.8% ofmales and 94.1% of females did not exercise in their spare time (35).
Martorell et al. (36) reviewed the prevalence of obesity in nonpregnant women fromLatin America and found that it ranged from 2.6% in Haiti to 12.1% in the DominicanRepublic (Table 3). In all countries, urban women had a higher prevalence of obesitythan rural women. Interestingly, a more recent study in Peru showed that 23% of womenwere obese (32), indicating a remarkable increase in this condition from the 9.4% citedby Martorell in 1998 for this country (36).
Fig. 6. Prevalence of obesity in Chilean women (A) and men (B). (Adapted fromrefs. 33–35).

Chapter 31 / Obesity in Latin America 781
A serious problem encountered currently is the remarkable prevalence of obesity inyoung children. The reasons for this are diverse. Nowadays, children from developedcountries and from late-developing countries perform much less physical activity andtend to eat or drink high-fat, high-carbohydrate foods. For instance, in public schoolsin Chile, only 3 h of exercise are programmed each week. A study in Brazil showedthat from 1974 to 1997, the prevalence of obesity increased from 4.9 to 17.4% and 3.7to 6%, in children ages 6 to 9 yr and 10 to 18 yr, respectively; prevalence of obesityalso increased from 4.9 to 18.4% in urban children (37). Similarly, the prevalence ofobesity in preschool children in Brazil has increased from 3.7 to 5.2% in the wealthierregion (38).
In Chile, the increase of obesity in children entering school has been notoriously rapid,rising from 6.5 to 17% in boys and from 7.8 to 18.6% in girls, respectively, between 1987and 2000 (20). De Onis et al. (39) published a review of obesity in preschool children indifferent countries of the world, including Latin America (Table 4). In the Latin Americanregion, the highest prevalence of obesity was observed in Argentina, Chile, Peru, andBolivia, whereas the lowest prevalence was observed in Haiti. Although it would seemthat there is a correlation between obesity and GNP per capita, evidence does not supportthis conclusion, as seen in the case of Argentina, which has one of the highest GNPs inthe region and a prevalence of obesity of 7.3% (the highest), and Bolivia, which has aprevalence of 6.3% and one of the lowest GNPs per capita in the area (39).
What is the cause of such a high prevalence of obesity in preschool children?Although it is hard to establish the precise reasons for its increase, the prevalence ofobesity seems to result from an increased amount of time spent in activities that do notrequire any effort (such as television watching or computer use) in detriment of regularphysical activity. A recent study in Mexico showed that adolescents spend an average of3.7 h/d watching television (31), and at least 90% of Chilean school children have beenreported to watch television for an average of 2 h on weekdays (40). An extensiveanalysis of the literature showed that food is the most advertised product category inchildren’s television, with most of the advertisements directed to sweetened productsand fast food restaurants (41).
Safety concerns of the parents regarding their children playing on the street certainlycontributes the decrease in physical activity, although the attraction for stationary activi-ties appear to be more important. Fortunately, programs are being developed that promoteexercise, and preliminary results hint that they are successful (see the next section).
Table 3Obesity Prevalence in Latin American Women Ages 15–49 Yearsa
Bolivia 7.6%Brazil 9.7%Colombia 9.2%Dom. Rep. 12.1%Guatemala 8.0%Haiti 2.6%Honduras 7.8%Peru 9.4%
a Data from 1994–1996.(From ref. 36.)

782 Part VIII / Preventive Nutrition: Global Perspectives
Another aspect that has often been blamed for the increase in the prevalence of obe-sity in children is the consumption of fast foods. One study in Europe even showed thatthere was a positive significant correlation between consumption of sugar-sweeteneddrinks and obesity in children (42). This is worrisome because, for instance, marketingdata indicate that Chile has one of the largest consumptions of soda per person world-wide (43). In the United States, French et al. showed that in women and adolescents,fast food restaurant use is positively associated with energy, fat as percent of energy, andsoft drinks and is inversely associated with the intake of fruits and vegetables (44,45).In the same country, percent of total calories from food prepared away from homeincreased from 18 to 32% from 1977–1978 to 1994–1996, bringing an increase in theamount of total fat, saturated fats, and sodium (46).
Nevertheless, it is hard to place the blame for the increase of obesity in Latin Americamainly on the food industry. Rather, it is probably the whole environment (including lackof exercise, lack of nutrition education, and consumption of high-calorie foods) that isconducive to this condition. It is important to note that obesity in young children increasesthe probability of obesity in adult life. Obese boys and girls at age 1 yr have 21 and 20%probability, respectively, of being obese at age 35. However, if young men and womenare obese at age 18 yr, the probability increases to 78 and 66%, respectively (47).
The effect of early nutrition on the appearance of obesity at later years must be con-sidered when discussing obesity. The studies of Barker (48) strongly suggested that earlyundernutrition resulted in increased adiposity and complications in later life. Stunting inchildren also has been shown to correlate with excessive weight (49). Additionally, stud-ies also revealed that children with heavy birth weights had greater chances of being over-weight when they reached adult life (50). All of these studies predict that, considering the
Table 4Prevalence of Obesity (%) in Preschool Children From Selected Latin American
Countries (W/H >95%)
Country Prevalence
Argentina 7.3%Bolivia 6.5%Brazil 4.9%Chile 7.0%Colombia 2.6%Costa Rica 6.2%Dominican Rep. 2.8%El Salvador 2.2%Guatemala 4.0%Haiti 2.8%Mexico 3.7%Nicaragua 2.8%Panama 3.7%Paraguay 3.9%Peru 6.4%Uruguay 6.2%Venezuela 3.0%
(From ref. 39.)

Chapter 31 / Obesity in Latin America 783
prevalence of undernutrition present in South America in recent decades, in the futurewe will be faced with a very heavy burden on health systems when these children reachadulthood.
The success of obesity prevention programs is very limited and they tend to be verylabor-intensive and costly, which makes them very difficult to apply to the community. Toprevent obesity, it is necessary to develop programs that combine intervention in nutritioneducation and promotion of exercise. A search of the Cochrane database for obesity pre-vention in children showed that there is scant high-quality data, and no general conclu-sion can be established. The chapter stresses the need for well-designed studies (51).
5. CONCLUSION
The social and economic changes that are occurring in Latin American countrieshave a strong influence on the eating habits of the population. This has been correlatedwith an increase in the incidence of the chronic diseases. The prevalence of obesity inmany countries of the region is reaching levels similar of those of industrialized countries.Nevertheless, in most cases, the available resources make it difficult to treat and preventobesity. Obviously, the main aspects that have to be improved are nutrition educationand the promotion of physical activity. The need to counteract the changes that areoccurring in lifestyle and nutrition should be of utmost importance to governments,which should aim to create a level of nutrition literacy and a “consciousness” in the pop-ulation toward appropriate food choices and physical activity. Only these will be ableto maximize health benefits and minimize health hazards in the future.
6. PROGRAMS AND RECOMMENDATIONS
Given the variation in conditions in the different countries of Latin America, it is diffi-cult to give general recommendations to prevent obesity. However, as economic develop-ment progresses in each country, all will eventually be faced with a wide range of problemsin adults that will require attention. To diminish the expenses involved in this care, coher-ent prevention programs must be implemented to reduce the impact of diseases of “nutritionalexcess” on the health system and to improve the quality of life of the population as it ages(52). An additional concern to remember is that the chronic, prolonged illness of an adulthas an effect the health and well-being of the other members of the household (53,54).
How do we tackle this problem? People that achieve economic progress increase theirfood-purchasing power, which correspond to an increased availability of food by industry.Although the role of food companies in health has long been debated, the reality is that theirfunction (as viewed by their shareholders) is to make a profit. In reality, their advertisementbudget is many times higher than what any government can spend on prevention. Onlypublic education is capable of changing eating trends, and, to a substantial extent, foodcompanies will respond to them. The influence of foreign food styles and imports in LatinAmerican countries has been steadily increasing and will certainly continue to grow. As anexample, a well-known international fast food chain increased the number of outlets inChile from 1 in 1990 to 70 in 2002. This trend appears to be similar in other countries ofthe Latin American region. Consumption of prepared foods, either from large supermarketsor from fast food outlets, will be more prevalent because of convenience, price, or both.Popkin and Nielsen (9) analyzed the consumption of caloric sweeteners in 103 countriesand observed a direct relationship between GNP and intake of sweeteners (9). The authors

784 Part VIII / Preventive Nutrition: Global Perspectives
also showed trends in caloric sweetener intake in Americans ages 2 yr and older, whichincreased from 235 calories in 1977–1978 to 318 calories in 1994–1996. Calories from softdrinks increased 102% in the same period of time, from 52 to 105 calories/d.
We must consider special care when we propose programs to prevent obesity. In theUnited States, billions of dollars have been spent to prevent obesity, and, nevertheless,its prevalence continues to increase (55). We are fighting not only environmental com-ponents such as availability of food at a low price but also natural components, becausethe signal to eat is stronger than the signal not to eat, brought about by millions of yearsof adaptation to a hunter–gatherer lifestyle (23).
6.1. Current ProgramsOne of the few prevention programs currently present in the Latin American region pro-
moting physical activity in Brazil is the Agita Sao Paulo experience (56). This is an inter-vention program directed to promote physical activity in a community-wide interventiondesigned to increase knowledge about the benefits and the level of physical activity. Themain message is that everyone should accumulate at least 30 min of physical activity ofmoderate intensity on most days of the week. Activities aren’t encouraged in three settings:home, transport, and leisure time. The program is research-oriented and includes culture-linked social marketing with the inclusion of nonpaid media. There are more than 160 com-munity groups involved, and the Brazilian government decided to make it a nationwideprogram (Agita Brazil). The impact of the program has reached outside Brazil, and similarprograms have been implemented in other countries in Latin America.
An evaluation of the Agita program showed that the message reached 55.7% of the pop-ulation; among these, 23.1% were aware of the main message (56). Knowledge of the pro-gram’s purpose was well-distributed among different socioeconomic levels, known by 67%of the most educated individuals. The prevalence of people reaching the recommendationwas 54.8% (men: 48.7%; women: 61%), and the risk of being sedentary was smaller amongthose who knew the message (7.1%) compared with those who did not know (13.1%).Based on this experience, it appears that a multilevel, community-wide intervention topromote physical activity may produce good results as a prevention strategy.
An important aspect of this program is the political commitment. The Brazilian gov-ernment has addressed the prevention of nutrition-related noncommunicable diseasesthrough innovative legislative and regulatory actions, mass communications, and capac-ity building, all of which create a comprehensive approach for addressing poor dietaryand activity patterns related to obesity in Brazil. The measures include labeling foodappropriately, shifting the types of food purchased for the school food program, usingmass media to communicate components of the food guidelines, establishing a smartshopping initiative, and training teachers and health workers. This represents an entireeffort that took several years to institute (57).
The Pan American Health Organization has implemented the project CARMEN,aimed at improving the health status of the population by reducing risks factors associ-ated with noncommunicable diseases (1). Regarding prevention of the behavioral riskfactors in individuals, it focuses on smoking, unhealthy diet, physical inactivity, andobesity. The program develops partnership with countries in the region that diagnose theproblem and sets up far-reaching interventions through the community, health profes-sionals, and policymakers. Current partners of the network are Argentina, Brazil,

Chapter 31 / Obesity in Latin America 785
Chile, Costa Rica, Cuba, Colombia, and Peru (1). To our knowledge, there is currentlyno thorough evaluation of the interventions.
Another experience in obesity prevention has been initialized in some Caribbean coun-tries through the Lifestyle Project, developed by the Caribbean Food and NutritionInstitute (58). This program is based on the assumption that healthy lifestyle habits shouldbegin early in life to provide a lasting impact. The program is developed at the schoollevel, and the general objective is to promote health and good nutritional habits in schoolchildren from the Caribbean. The objectives include the collection of information to guidethe development and implementation of school-based intervention programs; the designof an intervention program for primary school children in urban and rural areas, with anemphasis on diet, physical activity, and positive self-esteem; the implementation of inter-vention programs to impart knowledge and skills necessary for practicing positive healthbehaviors; and the evaluation of the effectiveness of the program in modifying behavior.
The project Interhealth Chile (called Mírame) is an educative intervention programthat promotes healthy lifestyles among school children (59). It is based on the princi-ples of the social learning theory, namely: (a) children learn by looking at and imitatingother people; (b) children are influenced by the environment; (c) children need skills todevelop and strengthen a healthy and positive concept about themselves; and (d) chil-dren need to develop social skills to face daily life. Although the program does not havea nutritional component, one is expected to be added in the near future. Some of theresults from 9- and 10-yr-old children in the basal analysis showed a high rate of seden-tary lifestyle, which increases with age. Other biological risk factors, such as hyperten-sion and lipid disorder, were high for this age group and usually coexisted with thepresence of obesity. The intervention has had very positive results regarding cessationof smoking and alcohol consumption, and it is considered a good educational strategyto promote other healthy lifestyles, such as adequate nutrition and physical activity.
Vida Chile is a program that concentrates on developing programs for healthy lifeand healthy environment (2). It includes the participation of a wide range of govern-mental and nongovernmental Chilean institutions. The objectives of this program,directed to schools and the community, include the diminution of the prevalence of obe-sity and the promotion of exercise. When schools comply with the requirements, theybecome part of a network. Although the program was initiated a few years ago, it stillhas not had a thorough evaluation, which is expected soon.
The Obesity Program of the Catholic University of Chile is a university-based pro-gram. Although initially conceived as a treatment program, thousands of patients havereceived support from this multiprofessional approach that includes education andhealth promotion. A high prevalence of comorbidities associated with the patient popu-lation has been reported (60). Although this type of program cannot be applied to thecommunities, prevention and treatment programs located at universities can be veryuseful regarding the training of adequate professionals to provide a better knowledge ofthe local reality and implement programs. However, the funds available for this typeof activity are usually limited in developing countries.
6.2. RecommendationsBecause of the limited resources available, an effective program of obesity preven-
tion should be focused on “multiple-disease,” and have the general goal of creating a

786 Part VIII / Preventive Nutrition: Global Perspectives
level of awareness that will guide individuals in the food choices they make in daily liv-ing. An effective program should involve all levels of education (starting in elementaryschools—both public and private) as well as local health facilities and communitygroups. The program should also stimulate and welcome the participation of the foodindustry to improve labeling (for which regulations do not exist in the majority of coun-tries in the region, to our knowledge), to diminish the use of food items known to havean undesirable effect on health, and to stimulate the production of food items that arehealthy.
The program must be part of a coherent health and nutrition policy that has clear tar-gets for promoting the concept of healthy nutrition (61,62). The general framework ofa prevention program can be defined by the following goals:
1. Develop a general awareness of the problem.2. Identify those groups that are at risk in the public.3. Remove or add those factors that affect the development of the disease (e.g., to instruct
people on the consumption of saturated fats [remove], to promote physical activity [add]).4. Treat those individuals in whom the disease is already present.
The goals of a particular program should be clearly defined and attainable, takinginto account the different socioeconomic groups and the realities of daily living. This isan important aspect because the implementation of many programs that have beendescribed as effective are much too expensive for the health system to apply at thenational or local level. The goals and objectives outlined here concentrate on two majorareas: nutrition education and the promotion of exercise. Regarding cost–benefit, theseseem to be the most advantageous for developing countries.
Although a previous diagnosis is important, the high prevalence of obesity in mostcountries of the Latin American region calls for initiation of prevention programs evenbefore a complete diagnosis is made. There is enough available information that clearlyindicates the burden that this disease imposes on the health system; therefore, it isimperative that well-formulated programs be implemented immediately.
Several programs and recommendations were used to formulate the goals and spe-cific objectives outlined here. These include the North Karelia Program in Finland(62,63), the Multiple Risk Factor Intervention Trial in the United States (64,65), and theHonolulu Heart Program in Hawaii (66) as well as the recommendations of the NationalAcademy of Sciences (67), the Agita Program in Brazil (56,57), and others (68–72).
6.2.1. NUTRITION EDUCATION
The nutrition literacy of Latin Americans is low. An education program directed tothe general population in each country can create an awareness directed to the properfood choices. The vehicles for the program should include:
1. Posters disseminated in public places like health clinics and hospital waiting rooms,government offices, schools, banks, pharmacies, public transportation, and other placeswhere people have the opportunity to read announcements.
2. Nutrition education leaflets with simple and specific messages for distribution throughhealth services, voluntary organizations, and schools.
3. Articles in newspapers.4. Radio announcements of short duration (1–2 min) dedicated to a particular subject
(e.g., high-calorie foods).

Chapter 31 / Obesity in Latin America 787
5. School programs to provide nutrition instruction to the students and to transfer themessage to the family (e.g., in the North Karelia Project, school children gave theirfathers a Father’s Day card with a health message).
6. Television “shorts” with specific messages and development of specific televisionprograms.
Although the costs of some of these components can be very high, they can be dimin-ished by enlisting governmental and nongovernmental organizations (e.g., government-owned radio and television stations and private media as a public service).
The goals of this program should be as follows:
1. Increase awareness of the relationship between diet and heart disease, high blood pres-sure, diabetes, certain cancers, and other conditions.
2. Increase awareness regarding the ideal range of body weight and provide informationon sound weight control strategies.
3. Provide information and education on healthy food choices at the point of purchase,home, the workplace, and school.
4. Provide information on selection and preparation of healthy diets.5. Stimulate the food industry to make a wide choice of low-fat, low-sodium processed
foods available to the public and to develop clear labels for these products. This alsoinvolves the establishment of government policy in terms of food labeling.
Although the time frame can vary according to the situation of each country, the spe-cific objectives should be as follow:
1. The proportion of the population that can identify the principal dietary factors relatedto chronic disease should be at least 60%.
2. At least 75% of the schools should be able to provide sound nutritional education intheir curriculum.
3. At least 60% of adults should be able to identify foods that are low in sodium, low insaturated fats, high in calories, and good sources of fiber.
4. At least 75% of adults should be able to understand the concept of losing weight byreducing calorie intake, increasing physical activity, or both.
5. At least 75% of adults should be able to read nutrition labels to make nutritious foodselections.
6. At least 60% of adults should have at least a basic idea of the food guidelines andshould make an effort to increase the intake of complex carbohydrates and fiber-containing foods.
7. At least 50% of the population should be able to maintain a fat consumption below25% of calories, and saturated fats should be less than 10% of calories. (Although asubstantial proportion of the population in the region seems to be at these levelsalready, there is a trend to increase fat consumption in the region, as indicated earlier.)
8. At least 50% of home food preparers should know not to add salt during preparation,and 75% of the individuals should know not to add salt to food before tasting it.
6.2.2. THE PROMOTION OF EXERCISE
The vehicles to be used in a program of exercise promotion are very similar to theones indicated earlier. One strategy that produces good results is to enroll a sport per-sonality (for instance, a soccer player) as the visible spokeperson for the program.
The goals of this program are as listed here:

788 Part VIII / Preventive Nutrition: Global Perspectives
1. Stimulate government to develop a policy directed toward developing a coherent exer-cise policy to stimulate exercise in children and adults.
2. Provide safe environments and appropriate facilities for exercise.3. Incorporate in the school curriculum a sound physical activity program with the par-
ticipation of teachers and parents.4. Involve the community in activities and to transmit the concept that moderate exercise
is beneficial in the prevention of coronary heart disease, hypertension, and obesity.
The specific objectives of this program should be as follow:
1. Incorporate physical activity as an integral part of the curriculum of at least 80% of allpublic and private schools.
2. Increase the proportion of people that engage in at least 30 min of moderate exerciseper day to 60%.
3. Increase the proportion of overweight people that are engaged in some form of physicalactivity combined with appropriate dietary practices to achieve ideal body weight to 50%.
4. Increase the proportion of people older than age 20 yr who are aware that physicalactivity reduces the risk of heart disease, helps maintain appropriate body weight,retards the development of osteoporosis, and enhances self-esteem to at least 50%.
REFERENCES1. Panamerican Health Organization. Health Conditions in the Americas. 2002 ed. Washington, DC.
www.paho.org. Accessed March 18, 2003.2. Ministry of Health. www.minsal.cl. Accessed December 20, 2003.3. CELADE (Economic Commission of Latín America and the Caribean). Anuario Estadístico, 2001.4. The World Bank. World Tables 1992. Johns Hopkins University Press, Baltimore, MD, 1992.5. Rolls BJ, Morris EL, Roe SR. Portion size of food affects energy intake in normal weight and over-
weight men and women. Am J Clin Nutr 2002; 76:1207–1213.6. Costa Rica. Informe Conferencia Internacional de Nutrición, 1992.7. FA0/PAHO. Situación Alimentaria y Nutricional de América Latina. Santiago, Chile: Food and
Organization of the United Nations and Pan-American Health Organization, 1993.8. Bermudez O, Tucker K. Trends in dietary patterns in Latin American populations. Cad Saude Pub
2003; 19(Suppl 1):S87–S99.9. Popkin BM, Nielsen SJ. The sweetening of the world’s diet. Obes Res 2003; 11:1325–1332.
10. Monteiro C. The Epidemiologic Transition in Brazil. In: Peña M, Bacallao J, eds. Obesity andPoverty: A New Public Health Challenge. Pan American Health Organization, Washington DC,2000, pp. 67–76.
11. Sichieri R, Coitinho DC, Leao MM, et al. High temporal, geographic and income variation in bodymass index among adults in Brazil. Am J Public Health 1994; 84:793–798.
12. Ministry of Health, Chile. Encuesta Continuada Sobre el Estado Nutricional de la Población Chilena(ECEN). July 1974–June 1975.
13. World Health Organization. Diet, Nutrition, and the Prevention of Chronic Diseases. TechnicalReport Series Nr. 797. World Health Organization, Geneva, 1990.
14. Food and Agricultural Organization of the United Nations. www.fao.org.Accessed 12/29/2003.15. Aguirre-Arenas J, Escobar-Perez M, Chavez-Villasana A. Evaluación de los patrones alimentarios
y la nutrición en cuatro comunidades rurales. Salud Publica Mex 1998; 40(5):398–407.16. Castillo O, Rozowski J. Tendencias en el consumo de grasas. Rev Chil Nutr 2000; 27(Suppl 1):
105–112.17. Fornes NS, Martins IS, Hernan M, Velasquez-Melendez G, Ascherio A. Frequency of food con-
sumption and lipoprotein serum levels in the population of an urban area, Brazil. Rev Saude Publica2000; 34(4):380–387.
18. Crovetto MM. Cambios en la estructura alimentaria y consumo aparente de nutrients de los hogaresdel Gran Santiago 1988–1997. Rev Chilena Nutr 2002; 29:24–32.

Chapter 31 / Obesity in Latin America 789
19. Albala C, Vio F, Kain J, Uauy, R. Nutrition transition in Chile: determinants and consequences.Public Health Nutr 2002; 5:123–128.
20. Kain J, Uauy R, Vio F, Albala C. Trends in overweight and obesity prevalence in Chilean children:comparison of three definitions. Pub Health Rep 2002; 56:200–204.
21. Investmarc. Annual Report. Santiago, Chile, 1999.22. Manson JA, WilIet WC, Stampfer Mi, et al. Body weight and mortality among women. N Engl J Med
1995; 333:677–685.23. Pi-Sunyer X. A clinical view of the obesity problem. Science 2003; 299:859–860.24. Pi-Sunyer X. Health implications of obesity. Am J Clin Nutr 1991; 53:1595S–1603S.25. Garrow JS. Obesity and Related Diseases. Churchill Livingston, London, 1988.26. World Health Organization. Obesity. Preventing and managing the global epidemics. Report of a
WHO consultation. WHO, Geneva, 1997.27. Braginsky J. Prevalencia de obesidad en América Latina. Anales Sis San Navarra 2002; 25(Suppl.
1):109–115.28. Monteiro CA, Conde WL, Popkin BM. Independent effects of income and education on the risk of
obesity in Brazilian adult population. J Nutr 2001; 131:881–886.29. Rozowski J, Arteaga A. El problema de la obesidad y sus alarmantes características en Chile. Rev
Med Chile 1997; 125:1217–1224.30. Gonzales-Villalpando C, Rivera-Martinez D, Cisneros-Castólo M, et al. Seven-year incidence and
the progression of obesity. Characterization of body fat pattern evolution in low-income Mexico Cityurban population. Arch Med Res 2003; 34:348–353.
31. Lazcano-Ponce EC, Hernandez B, Cruz-Valdez A, et al.Chronic disease risk factors among healthyadolescents attending public schools in Morelos, Mexico. Arch Med Res 2003; 34:222–236.
32. Jacoby E, Goldstein J, Lopez A, Nunez E, Lopez T. Social class, family, and life-style factors asso-ciated with obesity among adults in Peruvian cities. Prev Med 2003; 37:396–405.
33. Berrios X, Jadue L, Zenteno J. Prevalencia de factores de riesgo de enfermedades crónicas.Estudio en población general de la región metropolitana 1986–1987. Rev Med Chile 1990;118:597–604.
34. Berrios X. Las enfermedades crónicas del adulto y sus factores de riesgo. Un ejemplo de investi-gación epidemiólogica. Bol Esc Med PU Católica de Chile 1994; 23:73–89.
35. Jadue L, Vega J, Escobar MC, et al. Factores de riesgo para las enfermedades no transmisibles:Metodología y resultados globales de la encuesta de base del programa CARMEN. Rev Med Chile1999; 127:1004–1013.
36. Martorell R, Kettel-Kahn L, Hughes ML, Grummer-Srawn ML. Obesity in Latin American womenand children. J Nutr 1998; 128:1464–1473.
37. Wang Y, Monteiro C, Popkin B. Trends of obesity and underweight in older children and adolescentsin the United States, Brazil, China, and Russia. Am J Clin Nutr 2002; 75:971–977.
38. Monteiro C, Woolney A, Conde N, Popkin B. Is obesity replacing or adding to undernutrition?Evidence from different social classes in Brazil. Pub Health Nutr 2002; 5:105–112.
39. De Onis M, Blossner M. Prevalence of trends of overweight among preschool children in develop-ing countries. Am J Clin Nutr 2000; 72:1032–1039.
40. Olivares S, Albala C, Garcia F, Jofre I. Television publicity and food preferences of school age chil-dren of the Metropolitan Region. Rev Med Chile 1999; 127:791–799.
41. Coon KA, Tucker KL. Television and children’s consumption patterns. A review of the literature.Minerva Pediatr 2002; 54:423–436.
42. Ludwig DS, Petersen KE, Gortmaker SL. Relation between consumption of sugar-sweetened drinksand childhood obesity: a prospective, observational analysis. Lancet 2001; 357:505–508.
43. Nielsen AC. Markets and Trends 2002. Santiago, Chile, 2002.44. French SA, Harnack L, Jeffery LW. Fast food restaurant use among women in the Pound of Prevention
study: dietary, behavioral and demographic correlates. Int J Obes Relat Metab Disord 2000; 24:1353.45. French SA, Story M, Neumark-Sztainer D, Fulkerson JA, Hannan P. Fast food restaurant use among
adolescents: associations with nutrient intake, food choices and behavioral and psychological vari-ables. Int J Obes Relat Metab Disord 2001; 25:1823–1833.
46. Guthrie JF, Lin BH, Frazao E. Role of food prepared away from home in the American diet, 1977–78versus1994–96: changes and consequences. J Nutr Educ Behav 2002; 34:140–150.
47. Guo SS, Roche AF, Cameron Chumlea W, Gardner JD, Siervogel MR. The predictive value of child-hood body mass index values for overweight at age 35 y. Am J Clin Nutr 1994; 59:810–819.

790 Part VIII / Preventive Nutrition: Global Perspectives
48. Godfrey KM, Barker DJP. Fetal programming and adult health. Public Health Nutr 2001; 4(2B):611–624.49. Popkin B, Richards MK, Monteiro C. Stunting is associated with overweight in children in four
nations that are undergoing the nutrition transition. J Nutr 1996; 126:3009,3010.50. Martorell R, Stein AD, Schroeder DG. Early nutrition and later adiposity. J Nutr 2001;
131:874S–880S. 200151. Campbell K, Waters E, O’Meara S, Kelly S, Summerbell C. Interventions for Preventing Obesity in
Children (Cochrane Review). In: The Cochrane Library, Issue 1. John Wiley & Sons, Chichester,UK, 2004.
52. WHO. Technical Report Series 916. Diet, nutrition and the prevention of chronic diseases. Geneva,2003.
53. Kane RL, Radosevich DM, Vaupel JW. Compression of Morbidity: Issues and Irrelevancies. In:Kane RL, Evans JO, Macfayden F, eds. Improving the Health of Older People. Oxford UniversityPress on Behalf of The World Health Organization, New York, 1990, pp. 30–49.
54. Over M, Ellis RP, Huber JI, Solon O. The consequences of adult health. In: Feachem RGA,Kjellstrom T, Murray CJL, Over M, and Prillips MA, eds. The Health of Adults in the DevelopingWorld. The World Bank, Washington, DC, 1991.
55. Flegal KM, Carroll MD, Ogden CL, Johnson CL. Prevalence and trends in obesity among US adults,1999–2000. JAMA 2002; 288:1728–1732.
56. Matsudo V, Matsudo S, Andrade D, et al. Promotion of physical activity in a developing country: theAgita Sao Paulo experience. Pub Health Nutr 2002; 5:253–261.
57. Coitinho D. Monteiro CA. Popkin BM. What Brazil is doing to promote healthy diets and activelifestyles. Pub Health Nutr 2002; 5:263–267.
58. Fitzroy H. Combatiendo la obesidad en escolares de El Caribe. In: Albala C, Kain J, Burrows R, DiazE, eds. Monografía: Obesidad: un desafío pendiente. 2000, pp. 294–296.
59. Berrios X. Proyecto Interhealth Chile—“Mírame”. In: Albala C, Kain J, Burrows R, Diaz E, eds.Monografía: Obesidad: un desafío pendiente. 2000, pp. 297–300.
60. Moreno M, Manrique M, Guzman S, Maiz A, Patino P, Valdes R, Feuchtmann C. Cambios en losfactores de riesgo metabólicos en pacientes obesos en tratamiento. Rev Med Chile 2000;128:193–200.
61. Glasunov IS, Grabauskas V, Holland WW, Epstein FH. An integrated programme for the preventionand control of noncommunicable diseases. A Kaunas repon. J Chron Dis 1983; 36:419–436.
62. Kottke TE, Nissinen A, Puska P, et al. Message dissemination for a community-based cardiovascu-lar disease prevention programme (the North Karelia Project). Scand J Prim Health Care 1984;2:99–104.
63. Pietinen P, Vartiainen E, Korhonen HJ, et al. Nutrition as a component in community control ofcardiovascular disease (the North Karelia Project). Am J Clin Nutr 1989; 49:1017–1024.
64. Benfari RC, for the MRFIT. The Multiple Risk Factor Intervention Trial (MRFIT). III. The modelfor intervention. Prev Med 1981; 10:426–442.
65. Multiple Risk Factor Intervention Trial Research Group. Mortality after 10 1/2 years for hyperten-sive participants in the Multiple Risk Factor InterventionTrial. Circulation 1990; 82:1616–1628.
66. Curb JD, Marcus EB. Body fat, coronary heart disease, and stroke in Japanese men. Am J Clin Nutr1991; 53:1612S–1615S.
67. Committee on Diet and Health, National Research Council. Diet and Health: Implications forReducing Chronic Disease Risk. National Academy Press, Washington, DC, 1989.
68. Department of Health and Human Services (USDHHS). Healthy People 2000. National HealthPromotion and Disease Prevention Objectives. Public Health Service, Washington, DC, 1990.
69. American Public Health Association. Healthy Communities 2000: Model Standards. APHA,Washington, DC, 1991.
70. Nestle M, Jacobson MF. Halting the obesity epidemic: a public health policy approach. Pub HealthRep 2000; 115:12–24
71. March of Dimes. Nutrition Today Matters Tomorrow. March of Dimes, New York, 2002.72. Lobstein T, Baur L, Uauy R, eds. Childhood Obesity. The New Crisis in Public Health (Draft). IASO
International Obesity Task Force, London, 2003.

From: Preventive Nutrition: The Comprehensive Guide for Health Professionals, Third EditionEdited by: A. Bendich and R. J. Deckelbaum © Humana Press Inc., Totowa, NJ
791
32 Effects of Western Diet on RiskFactors of Chronic Diseases in Asia
Kaichi Kida, Koji Takemoto, Sei Won Yang,and Supawadee Likitmaskul
791
KEY POINTS
● The high-fat “Western diet” has caused an increase of childhood obesity in Asia.● Hypercholesterolemia and type 2 diabetes in children are associated with obesity.● Low-fat and well-balanced Asian diets are recommended for children.● School programs are effective lifestyle interventions against risks for chronic diseases.
1. INTRODUCTION
Infectious diseases and malnutrition were the major health problems in most Asiancountries before World War II and still are today in some parts of Asia. The structureof diseases changed dramatically in many Asian countries after World War II, in par-allel with a rapid development of the economy followed by Westernization of lifestyles.From 1970 to 2000, the gross domestic product increased by 23 times in Japan, 52times in Korea, and 17 times in Thailand, and lifestyles regarding housing, clothing,eating habits, and physical activities were Westernized in these countries. TheWesternization of diets is demonstrated in an increase of protein and fat consumptionat meals and the prevalence of American-style fast foods, such as hamburgers andfried chicken.
In Japan, Korea, and Thailand, the three leading causes of death today are neoplasms,heart disease, and cerebrovascular disease, similarly to Europe and North America. Thecost of cardiovascular diseases (CVDs) and diabetes, which are closely related withlifestyles, was US$60 billion in Japan in 2001, accounting for 7.3% of the national bud-get. These chronic diseases, which often the result of lifestyles—particularly the diet—are not only a medical but also a growing economic problem in Asian as well as Westerncountries. Therefore, more attention is required to prevent risk factors for these lifestyle-related chronic diseases through nutritional intervention.

792 Part VIII / Preventive Nutrition: Global Perspectives
This chapter reviews the relationship between Westernization of diets and lifestyle-related chronic diseases or their risk factors in Asian countries. Nutritional recommen-dations are described regarding prevention of risk factors for chronic diseases that oftenresult from lifestyle choices.
2. EPIDEMIOLOGY OF CHRONIC DISEASES AND THEIR RISK FACTORS
2.1. Chronic DiseasesHeart disease, which develops from atherosclerosis and/or hypertension, has been
increasing linearly each year and recently has become one of the major causes of death inJapan, Korea, and Thailand (1). Although the death rate from ischemic heart disease (IHD)has increased several-fold in Japan and Korea in the last 20 to 50 yr, it is still substantiallylower than in Europe and North America (9.9/100,000 in 1950 to 56.4/100,000 in 2001 inJapan [2] and 2.2/100,000 in 1983 to 12.5/100,000 in 1992 in Korea; see Fig. 1 and ref. 3).In Thailand, the death rate from heart disease increased from 40.3 per 100,000 people in1987 to 56 per 100,000 in 1992, a period of only 5 yr. The prevalence of IHD in one seri-ally studied Thai community increased from 7 per 1000 in 1976 to 17 per 1000 in l983 (4).
Cerebrovascular diseases also are emerging as a leading cause of death in Japan andother Asian countries (1; Fig. l). Although the death rate from total cerebrovascular dis-eases in Japan has gradually decreased during the past 30 yr, the death rate from cerebralinfarction and its contribution to total cerebrovascular diseases have greatly increasedover 50 yr (from 4/100,000 in 1950 to 65.3/100,000 in 2001; see Fig. 1 and ref. 2). InKorea, the death rate from cerebrovascular diseases increased from 65.4 per 100,000 in1983 to 80.4 per 100,000 in 1992 (3). In Thailand, the death rate from hypertension andcerebrovasular diseases increased from 12.8 per 100,000 in l987 to 16.9 per 100,000 in1992, and the prevalence of hemiplegia as a result of cerebrovascular diseases in onetown increased from 1.5 per 1000 in l976 to 6.6 per 1000 in 1983 (4).
Type 2 diabetes is caused mostly by insulin resistance (IR) associated with obesityand it is steeply increasing in many parts of the world, particularly in Asian countries,in parallel with an increase of obesity resulting from Westernization of lifestyles regard-ing eating habits and physical activities. The total number of patients with type 2 diabetesworldwide was estimated to be 133 million in 1995 and is anticipated to be 300 millionin 2025, although its will occur more rapidly in Asia than in Europe and North America(5). In Japan, the number of patients with type 2 diabetes whose HbA1c was 6.1% orhigher or who were on treatment of type 2 diabetes increased from 6.9 million in 1997to 7.4 million in 2001 (6). Type 2 diabetes (a major type of adulthood diabetes) wasbelieved not to develop in childhood; however, it is emerging rapidly in children insome ethnic groups, including Asian populations, Native Canadians, Native Americans,African-Americans, and Hispanics, who are known to be genetically more insulin-resistantthan Caucasians (7–14).
In Japan, all school children ages 6 to 15 yr are screened for diabetes every yearwith a urine test according to the Law of School Health; data obtained from the dia-betes screening program for school children have revealed a steep linear increase oftype 2 diabetes in school children in parallel with an increase of obesity of this agegroup in Japan (see Fig. 2 and refs. 7 and 15). Childhood type 2 diabetes has increasedby 2.5 times over the past 25 yr, and its incidence is now significantly higher than that

Chapter 32 / Effects of the Western Diet on Chronic Diseases 793
of childhood type 1 diabetes in Japan (5–7/105 vs 1.5/105 per year) (7,16–18).Similarly, in Thailand, childhood type 2 diabetes (newly diagnosed in Siriraji Hospital,the biggest hospital in Bangkok) increased from 5.9 cases per year between 1987 and1996 to 15.9 cases per year between 1997 and 1999 (19). In Singapore, childhood type2 diabetes (newly diagnosed in the second biggest hospital) was five times greater overthe past 3 yr (20).
In New Zealand, type 2 diabetes was reported to account for 35% of diabetes diag-nosed before age 30 yr among Northland Maori, whereas in previous studies in the
Fig. 1. Yearly change in death rates from ischemic heart diseases and cerebral infarc-tion in Japan.
Fig. 2. Incidence of type 2 diabetes in Japanese school children.

794 Part VIII / Preventive Nutrition: Global Perspectives
1980s, the majority of young New Zealand Maori patients had type 1 diabetes; thischange indicates an increasing rate of type 2 diabetes in young New Zealand Maori(21). Similarly, in a 5-yr follow-up study with Australian Aborigines, it was reportedthat the prevalence of impaired glucose tolerance and type 2 diabetes was 1.4 and 1.4%,respectively, at a mean age of 13.3 yr and 8.1 and 2.7%, respectively, at a mean age of18.5 yr after 5 yr of follow-up (22). Therefore, it is evident that rapid Westernizationof lifestyles, particularly eating habits that increase fat intake, has magnified IR andcaused an epidemic of type 2 diabetes in children as well as in adults among these ethnicgroups. Type 2 diabetes should be recognized as one of the important health problemsof children in these ethnic groups, because chronic complications such as retinopathyand nephropathy develop in childhood type 2 diabetes as fast as or even faster than inchildhood type 1 diabetes (23–25).
2.2. Risk FactorsBoth hypercholesterolemia and hypertension are major risk factors for IHD and
cerebrovascular diseases among Japanese people, similarly to Caucasian populations(26,27). Nationwide surveys demonstrated that serum total cholesterol levels increasedby 10–35 mg/dL between 1960 and 2001 in both adults and children in Japan (Table 1;Fig. 3; refs. 28–32). Currently, the average total cholesterol levels of Japanese adults arestill lower than those of American adults, but those of Japanese children are now simi-lar or even slightly higher than those of American children (33). All school childrenages 9 to 12 yr (approx 10,000 school children) have been screened for serum choles-terol, blood pressure, and obesity in the town of Matsuyama every year since 1989.Their serum total cholesterol levels have increased by 10 mg/dL over 15 yr. The preva-lence of hypercholesterolemia (>220 mg/dL) is 6.7% (343 of 5085) in school childrenages 9 to 10 yr and 3.9% (174 of 4414) in those ages 12 to 13 yr in Matsuyama; theiraverage total cholesterol levels are 176 ± 28 mg/dL in boys (n = 2619) and 177 ± 27mg/dL in girls (n = 2466) at age 9–10 yr and 166 ± 27 mg/dL in boys (n = 2309) and171 ± 27 mg/dL in girls (n = 2105) at age 12 to l3 yr (7).
The prevalence of hypertensive diseases (hypertension and diseases from hyperten-sion) in Japan increased from 8.0 per 1000 people in 1965 to l5.6 per 1000 in 1975 and30.7 per 1000 in 1985 (34). In 1990, the prevalence of hypertension among adults age30 yr or older was 29.7 and 26.2% in men in women, respectively (31). Among schoolchildren, the prevalence of hypertension was l9 per 1000 in boys and 13 per 1000 ingirls ages 9–10 yr and 18 per 1000 in boys and 13 per 1000 in girls ages 12–13 yr (7). Itis well-established that obesity is associated with hyperlipidemia and hypertensionamong Japanese people (35,36). The average body mass index (BMI; weight:height2)among Japanese adults has increased during the past 40 yr, and estimated prevalence ofadulthood obesity (BMI > 30) in Japan was 2.1 and 3.1% in men and women, respec-tively, in 1994 and 2.8 and 3.2% in men in women, respectively, in 2002, which is stilllower than that in Western countries (32,37). Nevertheless, the prevalence of obesity(20% overweight or more) among Japanese school children has increased remarkably(2.5 times) during the past 30 yr (see Fig. 4 and ref. 38).
School children with hypercholesterolemia or obesity in Matsuyama are providedwith health education, including diet and exercise recommendations, by school dietitiansand school nurses. Significant improvement of serum total cholesterol or obesity isachieved in more than 50% of children after this instruction (7; see Figs. 5 and 6, Table 2).

Tab
le 1
Year
ly C
hang
e in
Ser
um T
otal
Cho
lest
erol
Lev
els
in J
apan
1960
(28
)19
70 (
29)
1980
(30
)19
90 (
31)
2001
(32
)
Mal
es30
–39
yr16
7 (n
= 6
76)
188
±33
(n
= 2
39)
192
±38
(n
= 8
97)
196
±35
(n
= 6
20)
202
±31
(n
= 2
43)
40–4
9 yr
175
(n=
104
3)19
4 ±
45 (
n=
104
3)19
7 ±
38 (
n=
153
3)20
4 ±
37 (
n=
788
)20
9 ±
38 (
n =
366
)50
–59
yr17
5 (n
= 8
78)
181
±45
(n
= 6
23)
199
±39
(n
= 1
081)
200
±37
(n
= 7
58)
204
±33
(n
= 4
06)
60–6
9 yr
179
(n=
428
)16
9 ±
43 (
n=
334
)19
3 ±4
0 (n
= 5
94)
197
±38
(n
= 6
74)
202
±32
(n
= 5
15)
Fem
ales
30–3
9 yr
187
(n=
396
)18
4 ±
42 (
n=
184
)17
8 ±
34 (
n=
591
)18
6 ±
32 (
n=
992
)18
6 ±
30 (
n=
522
)40
–49
yr19
2 (n
= 3
25)
179
±36
(n
= 3
77)
191
±39
(n
= 7
05)
200
±36
(n
= 1
124)
201
±32
(n
= 5
92)
50–5
9 yr
207
(n=
216
)19
4 ±
44 (
n=
142
)21
1 ±
41 (
n=
735
)21
8 ±
37 (
n=
995
)22
1 ±
36 (
n=
684
)60
–69
yr19
4 (n
= 1
04)
189
±44
(n
= 3
3)21
3 ±
39 (
n=
597
)22
3 ±
38 (
n=
870
)21
6 ±
34 (
n=
691
)
795

796 Part VIII / Preventive Nutrition: Global Perspectives
Fig. 3. Change in serum total cholesterol levels in Japanese children.
Fig. 4. Nutrition and childhood obesity in Japan.
This suggests that school-based programs for motivation and education play animportant role in reducing risk factors for lifestyle-related chronic diseases that occurlater in life.
In Korea, the average total cholesterol levels of children are comparable with thoseof Japanese or American children, and the prevalence of hypercholesterolemia (>200mg/dL) among school children is reported to be 5–23% (39). The prevalence of obe-sity has increased by 70% in boys and by 35% in girls over only 4 yr, from 1984 to1988; these rates are now 12.4% among boys and 11.6% among girls in Seoul andCheju (40,41). In Thailand in 1985, a survey of coronary risk factors and nutritionalconditions was performed among 3495 workers and reported that the prevalence ofhypercholesterolemia (>200mg/dL), hypertension (>141/91) and obesity (BMI > 25)was 7l.3, 9.6, and 25.5%, respectively, in men and 65.4, 4.3, and 21.4%, respectively,

Chapter 32 / Effects of the Western Diet on Chronic Diseases 797
in women. In 1991, another survey was taken among 519 hospital staff workers, whowere expected to be more health conscious. This study demonstrated that the prevalenceof hypercholesterolemia, hypertension, and obesity was 33.4, 4.6, and 18.2%, respec-tively, in men and 40.2, 1.8, and 27.0%, respectively, in women—lower than those in theformer survey but still high (4,42). Therefore, risk factors for lifestyle-related chronicdiseases, including hypercholesterolemia, hypertension, and obesity, have increasedover only a few decades in Asian countries and are now compatible with or even exceedthose in Western countries.
Fig. 5. Effect of intervention on LDL-cholesterol levels and ratio of apoB/apoA1.Children with 140 mg/dL or more of serum LDL cholesterol and those with anapoB/apoA1 ratio of 018 or higher were given nutritional education bu school dietitiansand followed-up for 2 yr.
Fig. 6. Effect of school program on obesity and hypercholesterolemia in school children(2 yr follow-up).

798 Part VIII / Preventive Nutrition: Global Perspectives
2.3. Obesity and Insulin ResistanceIt is well-established that IR causing type 2 diabetes, dyslipidemia, and hyperten-
sion is associated with obesity not only in adults but also in children (7). The home-ostasis model assessment of IR (HOMA-R) is a conventional index for assessment ofIR that is calculated by a formula of fasting blood glucose (mg/dL) × fasting seruminsulin (μunit/mL)/450. The IR assessed by HOMA-R is highly correlated with BMI(r = 0.77; p < 0.01) or percent body fat measured by the bioimpedance method (r = 0.88;p < 0.01) in children (unpublished data), which suggests that IR develops according toprogression of obesity in children, similarly to IR development in adults. It wasrecently discovered that the IR associated with obesity is regulated by the adipocy-tokines secreted by the fat cells in the adipose tissues tumor necrosis factor-α andresistin, which induce the IR, and adiponectin and leptin, which suppress the IR.Obesity (as expressed in BMI or percent body fat) associates with the decreased levelof serum adiponectin ( r = −0.31; p < 0.01 or r = −0.32; p < 0.01) and leptin resistance,shown by the increased levels of serum leptin (r = 0.81; p < 0.01 or r = 0.88; p < 0.01)in children (n = 109)(unpublished data).
3. NUTRITIONAL STATES
In Japan, the total energy intake per capita per day has not changed or graduallydecreased for the past 40 yr (2098, 2184, 2119, and 1948 kkcal in 1950, 1965, 1980,and 2000, respectively; see Fig. 7; ref 32). On the other hand, the percent energy intakefrom fat has increased 3.3 times over the past 40 yr (7.7, 14.8, 23.6, and 26.5% in 1950,1965, 1980, and 2000, respectively). Intake of fat from animal, plant, and ash origin hasincreased by 4.2, 1.9, and only 1.7 times, respectively, over 35 yr, and the ratio of fatfrom animal, plant, and fish is now 4:5:1 in Japan (see Fig. 7; ref. 32). The percentenergy intake from saturated fatty acids (S), monounsaturated fatty acids (M), andpolyunsaturated fatty acids (PUFA) in Japan was 2, 3, and 4%, respectively, in 1955;however, these percentages rose to 8, 9, and 9%, respectively, in 1985, which indicatesthat fat intake, particularly fat of animal origin, greatly increased over 30 yr (43). Theratio of n-6 PUFAs/n-3 PUFAs increased from 2.8 in 1955 to 3.8 in 1985 (43) and 4.1in 1990 (44). The increase in the ratio of n-6 PUFAs/n-3 PUFAs might to the result of
Table 2Effect of Intervention of Obesity Among School Children in Matsuyama
(Longitudinal Study)
Percent overweight
9–10 yr 12–13 yr
Intervention groupBoys (n = 339) 33.0 ± 2 0.6 → 30.1 ± 0.9a
Girls (n = 261) 31.0 ± 0.7 → 23.4 ± l.0b
Nonintervention groupBoys (n = 82) 31.1 ± 1.3 → 33.9 ± 1.6Girls (n = 111) 31.2 ± 1.0 → 30.0 ± 1.6ap < 0.05, mean ± SE.bp < 0.001, mean ± SE.

Chapter 32 / Effects of the Western Diet on Chronic Diseases 799
a relative decrease in intake of fat of fish origin and an increase in intake of plant oilscontaining a large amount of linoleic acid. In fact, the energy intake from linoleic acidincreased 2.5 times, from 2.6% in 1955 to 6.4% in 1985 in Japan (43,45). The proteinintake per capita per day did not change in the past 30 yr in Japan, but protein of ani-mal origin increased 1.7 times and protein of plant origin decreased by 34% during thisperiod (32). The change in the quantity and quality of nutrients might reflectWesternization of diets of Japanese people. Furthermore, occasions to eat meals out-side at restaurants or even at American-style fast food bars, where fat-rich foods suchas hamburgers and bed chicken are served, have remarkably increased in Japan duringthe past 30 yr (1l.3, 16.9, and 18.5% in l965, 1980, and 2001, respectively) (32).Therefore, the eating habits of Japanese have been Westernized in quantity, quality,and manner.
A similar pattern is evident in Korea (46) (Table 3). Eating habits have been greatlyWesternized during the past 20 yr. The total energy intake per capita per day has slightlydecreased, whereas the percent energy from fat has increased threefold (5.7, 9.6, and16.6% in 1971, 1981, and 1992, respectively) (46). The ratio of fat from animal, plant,and ash was 19:69:12 in 1971 and 25:62:13 in 1990. The ratio of S:M:P was reportedto be 2:2.8:1 and that of n-6/n-3 was 4.9 in 1990 (46). The protein intake per capita perday was increased only 1.1-fold, whereas protein of animal origin increased 4.4 timesfrom 1981–1992 (46). The expense for fast foods and instant foods increased from 7.7%in 1973 to 12.9% in 1983, and occasions to eat meals outside the home also increased,from 2.8% in 1977 to 8.9% in 1986 (46). In Thailand, Westernization of diets can beseen in increased fat intake by people in Bangkok. Fat currently accounts for 30% oftotal energy intake there (46).
4. ATHEROSCLEROSIS AND NUTRITION
It is well-established that the origin of dietary fat and its composition of fatty acidsare related to the risk of CVDs resulting from atherosclerosis. The epidemiological
Fig. 7. Yearly change in energy distribution of nutrients and origin of intaken fat in Japan.

800 Part VIII / Preventive Nutrition: Global Perspectives
study of Eskimos in Greenland and many other studies demonstrated that fish oils or n-3PUFAs could play a role in preventing CVDs (see Chapter 9 and refs. 47–51).Epidemiological studies of Japanese subjects showed similar results. The death ratesfrom IHD and cerebral infarction were 2.6 and 9.2 times lower, respectively, in the townof Higashi-Izu, where people eat more fish than in Tokyo (52). More recently, a large-scale epidemiological investigation was performed to determine the effect of eating fishon the risk of chronic diseases among adults in Japan. From 1966 to 1982, the 55,523deaths out of a cohort of 265,l18 were analyzed regarding their intake of fish. The studyrevealed that the total death rate and the death rate from cerebrovascular disease, heartdisease, hypertension, and cancer were significantly lower in people who ate fish everyday compared to those who did so sometimes, rarely, or never (Table 4; ref. 53).
The degree of development of atherosclerosis in living subjects (measured by pulsewave velocity of the aorta) was 7.0 ± 1.1 m/s in a fishermen’s village, where 90% ofinhabitants ate fish every day and death from IHD was low. The pulse wave velocitywas significantly slower (less sclerotic) than the value of 7.7 ± 1.3 m/s in a farmer’svillage, where only 11% of inhabitants ate fish every day and death from IHD was high(54). Furthermore, renarrowing of coronary arteries after percutaneous transluminalcoronary angioplasty for IHD was significantly decreased, from 37% in controls (n = 43)to 20% in subjects who were given 1.6 g/d of eicosapentenoic acid (EPA) orally for 3to 4 mo (n = 30) (55), as confirmed by a large-scale, double-blind investigation (56). Amulticenter study in Japan demonstrated that EPA was effective in arteriosclerosisobliterans (7.4 ± 1.87 mm in controls [n = 25] vs 6.0 ± 1.59 mm in subjects treated with1.8 g/d of EPA for 6 wk [n = 18]), as assessed by the diameter of ulcers on the skin (57).These data indicate that oils of fish origin or n-3 PUFAs could be beneficial in pre-venting atherosclerosis and related chronic diseases.
Another characteristic of the Japanese diet is a high intake of salt (NaCl), whichlikely plays an essential role in hypertension as an important risk factor for atheroscle-rosis. The current NaCl intake per capita per day in Japan is 12.2 g/d (i.e., 6.2 g/1000kcal/d) and has not changed in the past 30 yr (32). About 50% of total NaCl is from soysauce, soy bean paste, and salted vegetables (32). People in the eastern part of Japanconsume 1.3 times more salt than those in the Kinki district, including Osaka and Kyoto(32). Public education in a community for 8 wk successfully reduced NaCl intake of theresidents by 3.8 g/d and lowered the systolic and diastolic blood pressure by 4.7 mmHgand 3.9 mmHg, respectively (58).
Table 3Yearly Change in Intake of Nutrients Per Capita Per Day in Korea
Nutrients 1971 1976 1981 1986 1991 1992
Energy, kcal 2072 1926 2052 1930 1930 1875Carbohydrate, g 422 380 394 343 325 313
% Energy 81.5 78.9 76.8 71.0 67.4 66.8Fat, g 13.1 20.0 21.8 28.1 35.6 34.5
% Energy 5.7 9.3 9.6 13.1 16.6 16.6Protein, g 67.0 60.4 67.2 74.2 73.0 74.2
% Animal origin 11.6 20.2 32.2 41.2 42.7 46.6

Chapter 32 / Effects of the Western Diet on Chronic Diseases 801
5. NUTRITIONAL RECOMMENDATIONS
Taking the rapid increase in lifestyle-related chronic diseases and Westernization ofdiets into consideration, much attention should be given to reduction of these chronicdiseases by establishing a nutritionally appropriate lifestyle in Japan. The most recentrecommendations appear in the sixth edition of Recommended Dietary Allowance forJapanese issued by the Ministry of Health and Welfare of Japan in 1999 (Table 5; ref. 59).The recommended energy intake (E:kcal/d) was calculated by the formula:
E(Kcal/d) = Standard Basal Metabolic Rate for Age (kcal/kg/d)× Body Weight (kg) × Intensity of Life (1.3–1.9)
The recommended energy intake from fat is 45% of total energy intake for infantsunder age 6 mo, 30 to 40% for infants between 6 and 12 mo, 25 to 30% for young peo-ple ages 1 to 17 yr, and 20 to 25% for adults ages 18 yr and older. The recommendedratio of S:M:P among fatty acids is 3:4:3, and the recommended ratio of n-6 PUFAs/n-3of PUFAs is 4.0, according to the results of analyses of the present nutritional condi-tions of Japanese people. The recommendation of S:M:P is in contrast to the previousrecommendation, which was 1:1.5:1 (60). The recommended intake of NaCl is 10 g/dor less and should be reduced to 7–8 g/d, if possible. There are a few arguments regard-ing these recommendations. There are no apparent reasons to elevate the upper limit offat intake to 30% of the total energy for young people from 25% for adults. In fact,hypercholesterolemia is found in 8.2 to 9.6% of school children (Kida K, MatsuyamaStudy, 2003). Furthermore, pathological studies in Japan as well as in the United Statesrevealed that atherosclerosis occurred with high frequency even in young people andwas related to blood cholesterol levels (61–63). Therefore, our study group ofMatsuyama recommends that fat intake should not exceed 25% of the total energy inschool children and adolescents ages 6–17 yr. Even infants, with the exception of babiesand young infants, should not be exposed to fat-rich diets, because the period of infancyis critical toward setting eating habits in later life (Table 5). Although no definite con-sensus has been established regarding the ideal composition of fat and fatty acids, it isobvious from animal experiments and epidemiological studies that fat of animal origin
Table 4Cohort Study on Eating of Fish and Sex-, Age-Adjusted Death Rate
(Relative Risk) From Chronic Diseases in Japan, 1966–1982
Eating of fish
Cause of death Every day Sometimes Rarely Never x2 p
Total death 1.0 1.07 1.12 1.32 9.13 <0.0001Cerebrovascular diseases 1.0 1.08 1.10 1.10 4.54 <0.0001Heart diseases 1.0 1.09 1.13 1.24 3.92 <0.0001Hypertension 1.0 1.55 1.89 1.79 4.14 <0.0001Liver cirrhosis 1.0 1.21 1.30 1.74 3.77 <0.0001Stomach cancer 1.0 1.04 1.04 1.44 2.14 <0.05Liver cancer 1.0 1.03 1.16 2.62 2.11 <0.05Uterus cervix cancer 1.0 1.28 1.71 2.37 4.14 <0.0001Observed l person year 1,412,740 2,186,368 203,945 28,943

802 Part VIII / Preventive Nutrition: Global Perspectives
should be reduced and the ratio of n-6 PUFAs/n-3 of PUFAs should be lowered as muchas possible. It might be feasible for Japanese to take more fat of fish origin and less of ani-mal origin while also reducing linoleic acid (n-6 PUFA) intake by avoiding oil or food for-tified with linoleic acid; thus, the ratio of n-6 PUFAs/n-3 of PUFAs may be lowered to thelevel of 2.8, which was the ratio in 1955. Accordingly, our study group recommends thatthe ratios of S:M:P among fatty acids and of n-6 PUFAs/n-3 PUFAs be 1:1.5: 1.5 and3.0–2.0, respectively (Table 5). Regarding salt intake, the recommended intake of salt(10.0 g/d) is still high compared with those in many other parts of the world. We recom-mend salt intake to be 7–8 g/d (3.5–4.0g/1000 kcal) for adults and children above age 6 yr.
In Korea, the recommended fat intake is 20% of total energy intake and recommendedratios of S:M:P and n-6 PUFAs/n-3 PUFAs are 1.0:l.0–1.5:l.0 and 4–10, respectively(64). In Thailand, it is recommended that the fat intake should not exceed 30% of totalenergy intake, with equal distribution of S, M, and PUFAs among fatty acids (65).
REFERENCES1. WHO: World Health Statistics Annual, 1996.2. Statistics and Information Department, Minister’s Secretariat, Ministry of Health and Welfare of
Japan:Vital Statistics of Japan (2001), 2003.3. National Statistics Office, Republic of Korea: Annual Report on Case of Death Statistics, 1994.4. Leelagul P, Tanphaichitr V. Current status on diet-related chronic diseases in Thailand. Intern Med
l995; 11:28–33.5. King H, Aubert RE, Herman WH. Global burden of diabetes, 1995–2025, nemerial estimates, and
projection. Diabetes Care 1998; 21:1414–1431.6. Ministry of Health, Welfare and Labor of Japan: Rapid Report on the Survey of Diabetes (2002), 2003.7. Kida K. Type 2 Diabetes in Children and Adolescents in Asia. In: Silink M, Kida K, Rosenblom A,
eds. Type 2 Diabetes in Childhood and Adolescence. Martin Duniz, London, 2003, pp. 51–61.8. Rosenbloom AL, Young RS, Joe JR, Winter WE. Emerging epidemic of type 2 diabetes in youth.
Diabetes Care 1999; 22:345–354.9. Fagot-Campagna A, Pettitt DJ, Engelgau MM, et al. Type 2 diabetes among North American children
and adolescents: epidemiologic review and a public health perspective. J Pediatr 2000; 136:664–672.10. Dabelea D, Hanson RL, Bennett PH, Roumain J, Knowler WC, Pettitt DJ. Increasing prevalence of
type II diabetes in American Indian children. Diabetologia 1998; 41:904–910.11. Blanchard JF, Dean H, Anderson K, Wajda A, Ludwig S., Depew N. Incidence and prevalence of
diabetes in children aged 0–14 years in Manitoba, Canada, 1085–1993. Diab Care 1997; 20:512–515.
Table 5Nutritional Recommendations in Japan, Korea, and Thailand
JapanJapan (59) (Matsuyama) Korea (64) Thailand (65)
Fat Intake 25–30 (1–17 yr) 25–30 (1–5 yr) 20 >30(% total energy) 20–25 (18 yr) 20–25 (>6 yr)Fat intake from 4:5:1 3:4:2
animal:plant:fishFish meat (g)animal meat (g) 1.0–1.5S:M:P 3:4:3 1:1.5:1.5 1:1–1.5:1 1:1:1n-6 polyunsaturated
fatty acid/n-3 polyunsaturated 4 3
fatty acid

Chapter 32 / Effects of the Western Diet on Chronic Diseases 803
12. Neufeld ND, Chen Y-DI, Raffel LJ, Vadheim CM, Landon C. Early presentation of type 2 diabetesin Mexican-American youth. Diabetes Care 1998; 21:80–86
13. Pinhas-Hamiel O, Dolan LM, Daniels SR, Standiford D, Khoury PR, Zeitler P. Increased incidenceof non-insulin-dependent diabetes among adolescents. J Pediatr 1996; 128:608–615.
14. Scott CR, Smith JM, Cradock MM, Pihoker C. Characteristics of youth-onset noninsulin-dependentdiabetes mellitus at diagnosis. Pediatrcs 1997; 100:84–91.
15. Kida K. Japanese school programs combat type 2 diabetes. Diabetes Voice, (International DiabetesFederation) 2003; 48:51–51.
16. Kitagawa T, Owada M, Urakami T, Yamauchi K. Increased incidence of non-insulin dependentdiabetes mellitus among Japanese school children correlates with an increased intake of animal pro-tein and fat. Clin Pediatr 1998; 37:111–116.
17. Kikuchi N, Shiga K, Tokuhiro E. Epidemiology of childhood onset NIDDM. Clin Endocrinol (Tokyo)1997; 45:823–827 (in Japanese).
18. Kida K, Mimura G, Ito T, Murakami K, Ashkenazi I, Laron Z, Data Committee of ChildhoodDiabetes of the Japan Diabetes Society (JDS). Incidence of type 1 diabetes mellitus in children aged0–14 in Japan, 1986–1990, including an analysis for seasonality of onset and month of birth: JDSstudy. Diabet Med 2000; 17:59–63.
19. Likitmaskul S, Tuchinda C, Punnakanta L, Kiattisakthavee P, Chaichanwattanakul K, AngsusinghaK. An increase of type 2 diabetes in Thai children and adolescents in Thailand J Pediatr EndocrinolMetab 2000; 13 (Suppl. 4):1210.
20. Lee WRW, Yap KPF, Loke KY, Hamidah K, Chia YY, Ang S. Characteristics of childhood onset type2 diabetes in Asia and Singapore. J Pediatr Endocrinol Metab 2000; 13(Suppl. 4):1209.
21. McGrath NM, Parker GN, Dawson P. Early presentation of type 2 diabetes mellitus in young NewZealand Maori. Diab Res Clin Prac 1999; 43:205–209.
22. Braun B, Zimmermann MB, Kretcher N, Spargo RM, Smith RM, Gracey M. Risk factors for diabetesand cardiovascular disease in young Australian aborigines. Diabetes Care 1996; 19:472–479.
23. Takahashi H, Sato Y, Matsui M, Urakami T. Ocular fundus findings and systemic factors by type ofchildhood diabetes. J Jap Soc Ophthalmol 1995; 46:695–699, (in Japanese).
24. Yokoyama H, Okudaira M, Otani T, et al. Existence of early-onset NIDDM Japanese demonstratingsevere diabetic complications. Diabetes Care 1997; 20:844–847.
25. Yokoyama H, Okudaira M, Otani T, et al. Higher incidence of diabetic nephropathy in type 2 dia-betes than in type 1 diabetes in early-onset diabetes in Japan. Kid Int 2000; 58:302–311.
26. Tarui S. Distribution of phenotypes of hyperlipidemia and relationship between serum lipid levelsand development of cardiovascular complications in Japan. Report of Study Group on PrimaryHyperlipidemia, Ministry of Health and Welfare of Japan, 1987, pp. 17–26.
27. Ueda K, Omae T, Hasuo Y, et al. Progress and outcome of elderly hypertensives in a Japanesecommunity: results from a long-term prospective study. J Hyperten 1988; 6:991–997.
28. Research Committee on Atherosclerosis in Japan, Ministry of Education and Culture of Japan. Totalserum cholesterol levels in normal subjects in Japan. Jpn Circ J 1965; 29:505–510.
29. Research Committee on Hyperlipidemia in Japan, Ministry of Education and Culture of Japan. Totalserum cholesterol and triglyceride levels in normal subjects in Japan. J Jpn Atherosclerosis Soc l973;1:101–108.
30. Research Committee on Familial Hyperlipidemia in Japan, Ministry of Education and Culture ofJapan. Changes of serum total cholesterol and triglyceride levels in normal subjects in Japan in thepast twenty years. Jpn Circ J 1983; 47:1351–1358.
31. Ministry of Health and Welfare of Japan: Report of the 4th National Survey of CardiovascularDiseases (1990), l993.
32. Division of Health Promotion and Nutrition, Ministry of Heath and Welfare of Japan: Report of NationalNutrition Survey (2002), 2003.
33. Couch SC, Cross AT, Kida K, et al. Rapid westernization of children’s blood cholesterol in 3 countries:evidence for nutrient–gene interaction. Am JClin Nutr 2000; 72:1266s–1272s.
34. Heath and Welfare Statistics Association of Japan: Trends Public Health, l991.35. Tarui S. Study on etiology and pathophysiology of obesity in adults and children. Report of Sogo-
Kenkyu, Ministry of Education and Culture of Japan, 1991.36. Tokunaga K, Fujioka S, Matsuzawa Y. Ideal body weight estimated from body mass index with lowest
morbidity. Int J Obes 1991; 15:1.37. Division of Health Promotion and Nutrition, Ministry of Health and Welfare of Japan: Report of
Epidemiological Studies on Obesity (1994), 1995.

804 Part VIII / Preventive Nutrition: Global Perspectives
38. Division of Statistics, Ministry of Education and Science of Japan: Report on Statistics of SchoolHealth (2000), 2003.
39. Yang MK. Childhood hyperlipidemia in Korea—a review. J Korean Pediatr Soc 1993; 36: 1049–1058.40. Cho KB, Park SB, Park SC, Lee DH, Lee SJ. The prevalence and trend of obesity in children and
adolescents. J Korean Pediatr Soc 1989; 32:597–605.41. Ham BH, Kin DH, Park YK, Lee JH, Kin HS. Incidence and complications of obesity in pubescent
school children. J Korean Pediatr Soc 1995; 38:500–528.42. Tanphaichitr V, Leelahagul P. Role of nutrition on healthy lifestyle. Intern Med (Bangkok) 1995;
11:31–40.43. Sakai K, Ishikawa A, Okuyarna H. Yearly change in quality and quantity of fat intaken in Japan. Abura-
Kagaku (Oil Chemistry) 1990; 39: 196–201.44. Hirahara F. Yearly change in quality and quantity of dietary fat of Japanese. Fat Nutr (Toyama, Japan)
1995; 4:73–82.45. Lands WE, Hamazaki T, Yamazaki K, et al. Changing dietary patterns. Am J Clin Nutr 1990; 51:
991–993.46. Ministry of Health and Social Affairs: Republic of Korea (1992) National Nutrition Survey Report, 1994.47. Bang HO, Dyeberg J, Sinc1air HM. Tue composition of the Eskimo food in northwestem Greenland.
Am J Clin Nutr 1980; 33:3657–3661.48. Kromhout D, Bosschieter EB, Coulander CDL. The inverse relation between ash consumption and
20-years mortality from coronary heart disease. N Engl J Med 1985; 3 (12):1205–1209.49. Burr ML, Fehily AM, Gilbert JF, et a1. Effects of changes in fat, fish, and fiber intakes on death and
myocardial infarction: diet and reinfarction trial (DART). Lancet 1989; ii:757–761.50. Dolecek TA, Grandits G. Dietary polyunsaturated fatty acids and mortality in the mutiple risk factor
intervention trial (MRFrr). World Rev Nutr Diet 1991; 66:205–216.51. de Lorgeri1 M, Renaud S, Mamele N, et al. Mediterranean alpha-linolenic acid-rich diet in secondary
prevention of coronary heart disease. Lancet 1994; 343:1451–1459.52. Yasugi T. Serum Lipid Level and Incidences of Ischemic Arteriosclerotic Diseases in Japanese
Population Through the Past 30 Years With Special Reference on Serum Lipids and EicosapentaenoicAcid Levels. In: Fidge NH, Nestel PJ, eds. Atherosclerosis VII. Elsevier, Amsterdam, 1986, pp. 55–59.
53. HirayamaT. Fish consumption and health—the cause-specific death rate in reference to frequency ofeating of fish. Med Chugai (Tokyo) 1992; 46:157–162.
54. Hamazaki T, Urakaze M, Sawazaki S, Yamazaki K, Taki H, Yano S. Comparison of pulse wavevelocity of the aorta between inhabitants of fishing and farming village in Japan. Atherosclerosisl988; 73:157–160.
55. Yamaguchi T, Ishiki T, Nakamura M, Saeki F. Effect of fish oil on restenosis after PTCA. Atherosclerosis(Tokyo) 1990; 18:416.
56. Bairati I, Roy L, Meyer F. Double-blind, randomized, controlled trial of fish oil supplements inprevention of recurrence of stenosis after coronary angioplasty. Circulation 1992; 85:950–956.
57. Sakurai K, Tanabe T, Mishima Y, et al. Clinical evaluation of MND-21 on chronic arterial occlusion-double-blind study in comparison with ticlopidine. Myakkangaku (Angiology) (Tokyo) 1988; 28:597JO4.
58. Tanaka H, Date C, Yamaguchi M. Salt intake and hypertension. Igaku-no-Ayumi (Tokyo) 1994;169:533–536.
59. Division of Health Promotion and Nutrition, Ministry of Health and Welfare of Japan: RecommendedDietary Allowance for the Japanese, 6th Rev., 1999.
60. Division of Health Promotion and Nutrition, Ministry of Health and Welfare of Japan: RecommendedDietary Allowance for the Japanese, 5th Rev., 1994.
61. Sakurai I, Miyakawa K, Komatsu A, Sawada T. Atherosclerosis in Japanese youth with reference todifferences between each artery. Ann NY Acad Sci 1990; 598:410–417.
62. Tanaka K, Masuda J, Imamura T, et al. A nation-wide study of atherosclerosis in infants, childrenand young adults in Japan. Atherosclerosis 1988; 72:143–l56.
63. Newman WP, Wattigney W, Berenson GS.Autopsy studies in the United States Children andAdolescents;Relationship of Risk Factors to Atherosclerotic Lesion. In: Williams CL, Wynder EL, eds. Hyperlipidemiain Children and the Development of Atherosclerosis, Vol 623. Ann NY Acad Sci 199l, pp. 16–25.
64. The Korean Nutrition Society: Recommended Dietary Allowance for Koreans, 6th Rev., 1995.65. Department of Health, Ministry of Public Health of Thailand: Recommended Daily Dietary Allowance
and Dietary Guideline for Healthy Thais, 2nd ed., 1989.

IX CRITICAL ISSUES
FOR THE 21ST CENTURY


From: Preventive Nutrition: The Comprehensive Guide for Health Professionals, Third EditionEdited by: A. Bendich and R. J. Deckelbaum © Humana Press Inc., Totowa, NJ
807
33 AlcoholThe Balancing Act
William E. M. Lands
KEY POINTS
● Excessive alcohol consumption contributes to 4 of the 10 leading causes of death in theUnited States.
● Alcohol consumption is split, with 33% of the population consuming 95% of the alco-holic beverages and 33% abstaining. The US population median intake is much lessthan the average (mean) intake.
● An increase in average alcohol intake could increase the harm to the vulnerable sub-group that seems to be a predictable portion of the population.
● One alcohol drink per day gives little detectable blood alcohol for 22 of the 24 h in aday, leading to uncertain mechanisms for hypotheses regarding its long-term benefit.
● In 2000, exposure to alcohol caused 3.2% of deaths and 4% of disability worldwide.● The dramatic difference in deaths resulting from ischemic heart disease in France (com-
pared to the United States and England) is much less when combined with deaths fromalcohol-associated causes.
● A causal role for alcohol in decreasing cardiovascular mortality has not been proven.
1. INTRODUCTION
Intakes of nutrients by individuals are customarily described with a broad range ofacceptable choice between some average required lower limit and an average safe upperlimit. Safe upper limits of average alcohol consumption by individuals have been a prin-cipal focus of national dialogue for 200 yr, and moderation has been repeatedly urged.The Dietary Guidelines for Americans (1) cautions against more than one drink per dayfor women or two drinks per day for men (with a standard drink being either 12 oz ofregular beer, 5 oz of wine, or 1.5 oz of distilled spirits, each of which contains about14 g [100 calories] of ethanol). The Dietary Guidelines changed wording from 1980 to2000 to give more clear advice and cautions (2). Presently, no major scientific body rec-ognizes a nutritional need for alcohol nor recommends that those who do not drinkshould begin to do so.

808 Part IX / Critical Issues for the 21st Century
The widely discussed hypothesis that moderate alcohol intake might decrease car-diovascular death rates prompted this review of evidence to guide future preventivenutrition advice. A useful context is in balancing possible benefits and risks. This chap-ter examines the risk for developing alcohol use disorders by individuals who we arestill unable to identify a priori against the proposed benefits from drinking alcohol. Therisk of alcohol disorders has a long history of inadequate intervention, and the possiblebenefit of less cardiovascular mortality has uncertain proof. Insufficient evidence aboutthe many mechanisms for cardiovascular disease (CVD) processes parallel insufficientevidence on how alcohol may diminish those processes—or even whether alcohol actu-ally diminishes CVD. The onset and progression of CVD is not caused by a deficiencyof alcohol intake that needs to be corrected. Rather, the chronic nutritional imbalancesthat exacerbate inflammatory atherogenesis, myocardial arrhythmia, and plateletthrombosis are rational targets for primary and secondary prevention. Readers inter-ested in designing preventive nutrition interventions or in making personal decisionsbased on a fully informed choice will find that the slow progress in defining preciseterms and in acquiring evidence of causal mechanisms (3) makes setting policies seempremature at this time. The information assembled here does not form a smooth, solidseries of proofs but, rather, presents key concepts arrayed as beads on a string for thereader’s contemplation.
2. BALANCING CAUSES AND CONSEQUENCES
2.1. The Importance of ContextsCauses and consequences are the makings of science. They are the way that scien-
tists interpret events by converting instinctive questions of purpose (i.e., “Why?” intothe dimensions of “How come?” and “So what?”). By balancing new controlled infor-mation about things and events with earlier accumulated associations and memories, welearn to understand life and our surroundings. Experience provides each of us with anew balance of positive and negative associations from which our mind produces con-scious and subconscious outcomes that shape our interpretations, emotions, and actions.That balance is the context within which new evidence is assimilated to create the cog-nitive and emotional significance of that information for each individual. Each of usbelieves that we know some things with certainty and that we can use that knowledgeto choose a rational course of action. This chapter examines some of that knowledge ina context that can aid informed choices.
Scientific procedures are designed to systematically assemble, within a defined con-text, the evidence needed to convert conjectures into conclusions. When possible, wedesign controlled interventions to gain certainty about how an event can directly cause aconsequence. There is a constant challenge in such experiments to recognize which evi-dence proves a direct cause–effect link, which evidence reflects a secondary conse-quence, and which evidence marks an unrelated associated event. All three types ofinformation occur in an uncertain balance as the observational science of epidemiologycollects and records diverse events associated with alcohol consumption. The strength ofepidemiological observation is in its ability to define boundaries of a problem and toprompt new hypotheses about causes. However, testing those new hypotheses requiresinterventions in the context of well-defined terms and well-designed positive and nega-tive control measurements. These are often hard to obtain with volunteer human subjects.

Chapter 33 / Alcohol 809
In balancing information on preventive nutrition and the possible benefits and risks ofdrinking beverage alcohol, we need to consider information of an association that issuitable for suggesting a hypothetical cause separately from information of a controlledintervention that can prove a causal relationship. However, even careful considerationsare confounded by heterogeneity among diverse individuals in society and by hetero-geneity in perception of the severity of alcohol-related risks.
2.2. Individuals Within PopulationsHuman life is the complex consequence of about 35,000 genes producing products
in different amounts at different times in response to gene–gene and gene–environmentinteractions. Although the genomic sequence for each individual is finite, adaptationsproduced from interactions between the 35,000 genes and the remaining 95% of thehuman genome include such a vast number of possible outcomes that they are com-pletely unpredictable in detail. Imprecision is further assured by another layer of com-plexity regarding neuronal adaptation during learning and memory storage. Each thingwe learn is through neural associations that involve thousands of synaptic links, and“learning from experience” inevitably differs for each individual. As a result, the com-bined associative memories that link events together have a different balance of cogni-tive and emotional valence for each individual. This leads to diverse interpretationswhen attempting to answer complex questions like “Is drinking alcohol beneficial orharmful?” and “Why do some people drink so much?” The diverse interpretations andpriorities confound efforts at consensus regarding possible causes, and they requireopen evaluation in scientific dialog (discussed further in Section 6.). In fact, consensusmay be further confounded because the questions truly have different answers for different individuals.
Above and beyond the complex adaptive response systems of the living body and thememories and emotions of the mind is an added level of complexity of collective soci-etal adaptations to perceived problems. Democratic societies struggle to balance thepreferences and priorities of diverse individuals within the overall heterogeneous soci-ety. Public health efforts in preventive nutrition seek to maximize the number of peoplewho are free from harm and to minimize the degree of overall harm to the community.The efforts inevitably develop into conflict when balancing each individual’s freechoice with the effort to decrease perceived risk to the group. To develop a consensusfor interventions, the physiological condition to be prevented and the causal mediatorsto be targeted need careful definition. However, statistical descriptions of an aggregatecommunity do not precisely describe any individual within a heterogeneous communityfor which a balanced consensus is desired.
As epidemiologists gather more information on larger numbers of subjects toincrease the certainty of an average association, they also increase the number of peo-ple who are not precisely described by the population mean value. Thus, a struggle forbalance is evident in efforts to develop scientifically credible targets for acceptablecommunity intervention that could also be credibly sound advice for individuals. Theresultant compromise regarding possible causes of good and bad health is demonstratedin a nation’s guidelines for healthy lifestyles. For example, the Surgeon General’sReport on Nutrition and Health (4) described a situation and a state of knowledge in1988 that is similar to that which exists currently: “Excessive alcohol intake is a promi-nent contributor to 4 of 10 leading causes of death in the United States.” Also, the

810 Part IX / Critical Issues for the 21st Century
Dietary Guidelines for Americans (1) are intended to meet nationwide nutrient require-ments, promote health, support active lives, and reduce chronic disease risks by com-bining available, affordable, and enjoyable foods to create healthful diets that fitappropriate physical activity. The Dietary Guidelines for Americans recommends that“if you drink alcoholic beverages, do so in moderation,” and defines “moderation” asnoted in the Introduction.
A “healthy diet indicator” developed from World Health Organization dietary adviceevaluated dietary patterns and mortality in different cultures (5). For different regions(Finland, Italy, and the Netherlands), the 20-yr mortality was lowest in men who hadthe highest healthy diet indicator. The indicator was positively associated with alcoholintake and had a strong inverse association with mortality from CVD. It is important todecide which data define how much benefit should be allocated to each dietary andlifestyle factor. Do the data assign healthiness to the diet or the alcohol? An irony liesin the fact that the dietary energy provided by alcohol was set aside and not included incalculations for macronutrients as a percentage of energy intake (5). In developingsocial policy, do alcohol calories count or not? This question echoes the longstandinguncertainty regarding how to interpret alcohol calories (6), which is described further inSection 4.
2.3. Lifestyle ChoicesA 6-yr longitudinal study of 43,757 male health professionals provided useful insight
into clustered patterns of voluntary food choice (7). When choices of these well-informed individuals were ranked by increasing quintiles of mean saturated fat intake(grams per day), there were corresponding progressively increasing gradients of meansaturated fat and total fat intake as percent of energy, servings of high-fat dairy food,and servings of red meat, whereas there were progressively decreasing gradients ofservings of fruits, vegetables, and fish. Interestingly, the percent of individuals whosmoked increased with higher quintiles of saturated fat intake, whereas mean physicalactivity and mean alcohol consumption decreased. The coupled lifestyle choices ofthese well-informed individuals create difficulty in unraveling the web of factors thatcontribute to the overall health status of each individual. If lifestyle choices clustertogether in a healthy lifestyle, what evidence indicates the degree to which each vari-able was a causal factor for CVD mortality? Could attributing lower relative CVD riskto more alcohol intake be attributed to parallel choices favoring exercise, fruits, veg-etables, and fish or to inverse choices of high-fat dairy, total fat, or smoking? In thisregard, an earlier report on these subjects (8) noted that increased alcohol intake wasalso associated with an increased percentage of individuals who regularly used aspirin,an agent well-known to decrease thrombotic mechanisms and CVD mortality. Thisillustrates another lifestyle feature that might impact on the interpretation. The earlierreport (8) showed a parallel rise in the percentage of individuals who smoked withhigher alcohol intakes, whereas Ascherio et al. (7) reported opposing smoking anddrinking gradients when subjects were stratified by saturated fat intake. Compared toconsumers of other alcoholic beverages, wine drinkers tend to have a lower prevalenceof smoking; higher education and household incomes; higher intakes of dietary fiber,potassium, vitamin E, and total carotenoids; higher amounts of fruits, vegetables, andgrain products; and lower total fat intakes (9). Conversely, beer and liquor drinkers hadsomewhat lower education and household incomes; higher rates of current smoking;

Chapter 33 / Alcohol 811
higher energy and total fat intakes; and consumed lower amounts of fruits, vegetables,and grain products. Such clustering of attributes illustrates the well-known need for cau-tion in interpreting associative relationships in observational epidemiological data(10,11). Controlled interventions are needed to provide a conclusive test of an indepen-dent causal role.
3. BALANCING DIVERSITY AND COLLECTIVITY
3.1. Medians, Means, and ModerationDiversity among individuals is frequently reflected in measures of variance, such as
standard deviations around a mean value that is commonly displayed in Gaussian bell-shaped distributions. Such distributions mold our concept of average attributes of aver-age people. Familiarity with such curves leads us to easily use the bell-shaped paradigmas a first approximation in judging new situations with which we are unfamiliar.However, published patterns of alcohol consumption in many different communitiesapproximate a skewed distribution that is similar to the pattern shown in Fig. 1. The figureschematically indicates that 33% of Americans drink 95% of the alcoholic beverages (4),whereas about 33% abstain from comsumption of alcoholic beverages. Additionally, theaverage (mean) weekly intake of 10 drinks per week is much greater than the middleperson’s (median) intake of 1 to 2 drinks per week and much less than that for individ-uals in the upper 5% of alcohol intake, who may account for almost 50% of total alco-hol consumption (4).
Thus, a tendency to think of alcohol intakes in terms of a Gaussian distribution pro-duces dissonance among people who are evaluating aggregate information on benefitsand risks for a population of individuals. In this situation, concepts about “average”behavior or “average” consequences need careful and patient description to avoid mis-representing the actual evidence. Although people may regard the mean value as that ofan “average” person, the median value is probably closer to their intent. Social policyabout “moderation” in an open democratic society might be expected to relate more tomedian rather than mean values. Serious ethical issues accompany the urging of medianindividuals to act like those at the mean.
3.2. Public Health Aspects of CollectivityThe skewed relationship of median and mean values creates another important pub-
lic health question: “Will the incidence of heavy ‘problem’ drinking in a community begreater when the mean value is greater?” This question about collectivity gains impor-tance as communities consider preventive nutrition advice that is based on putative ben-efits of moderate drinking on the risk of cardiovascular disease. Encouraging this tacticmay cause median and mean alcohol consumption to rise if abstainers feel encouragedto begin drinking alcohol.
Reports of an almost lognormal distribution of alcohol consumption among adultsin France (12) led to suggestions that some collective social mechanism may affectdrinking patterns within a population, possibly linking an increase in heavy drinkingwith an increase in mean consumption. Subsequent studies confirmed a close relation-ship between mean and heavy consumption of alcohol for diverse populations (13).Ledermann’s lognormal hypothesis (12) provides a useful predictive rough estimate of thepositively skewed distribution. A recent report examined health surveys for 32,333 adults

812 Part IX / Critical Issues for the 21st Century
from 14 separate regions in England and found a strong positive association betweenmean regional consumption and the prevalence of heavy drinking (14). The associationswere similar for men and women, and they were similar in magnitude when the analy-sis was restricted to those under age 65 yr and when abstainers were excluded. Valuesfor mean alcohol consumption by men in the different regions ranged from 15 to 22.7units per week, with an English alcoholic beverage unit equivalent to 8 g of ethanol(contrasting with the 14-g standard in the US Dietary Guidelines). A 1-unit per weekhigher mean consumption of alcohol was associated with 6.3% more men drinkinggreater than 21 units per week. A serious implication for public health is that heavydrinkers may not be indifferent to the acceptability of drinking in their culture. Thesocial determinants for abstention may differ from determinants for heavy drinking (14)in ways that do not permit assuming that adverse consequences of more heavy drinkingwill be offset by beneficial effects on CVD.
An alternate study of collectivity used data from the US National LongitudinalAlcohol Epidemiologic Survey (NLAES) with a sophisticated multiple linear logisticalregression model fitted to major significant predictive variables to project possible out-comes of different public policies (15). Different prevention strategies were comparedto test their possible effect on the predicted prevalence of alcohol abuse and dependencein the population, and predictions were comparable for either the collective populationor the high-risk individual strategy. A 25% reduction in average daily intake of all cur-rent drinkers reduced the predicted prevalence from 16.7 to 13%. Alternatively, a 28%reduction in average daily intakes of all drinkers who occasionally or usually exceededthe moderate drinking cut-point lowered the predicted prevalence to 12.6%. Finally,reducing the consumption of usually immoderate drinkers by 41% resulted in a 13%predicted prevalence of alcohol abuse and dependence within the drinking population.The authors concluded that reducing neither overall consumption nor high-risk con-sumption appeared to be superior to the other in reducing the prevalence of alcoholabuse and dependence.
Fig. 1. Is alcohol everybody’s problem? The figure represents results reported in TheSurgeon General’s Report on Nutrition and Health (1988). Each small rectangular sym-bol represents one standard alcoholic beverage (14 g of ethanol) consumed per week,and each human figure represents 12 million Americans age 14 yr or older. The popu-lation in July 1998 was about 270 million, of whom about 80% were 14 yr or older.

Chapter 33 / Alcohol 813
Another important finding from the NLAES that had implications for preventionpolicies was that more than 40% of respondents who initiated drinking before age 15 yrwere classified with alcohol dependence at some time in their lives (16). Furthermore,the odds of lifetime alcohol dependence were 14% lower with each increasing year ofage at first use. Efforts to prevent automobile accidents by limiting access to alcohol foradolescents who are newly introduced to driving skills and judgements can also be eval-uated as a possible strategy to decrease the prevalence of alcohol use disorders. Is earlyonset a potentially modifiable risk factor in development of disorders or is it only amarker of an inevitable, possibly unmodifiable, development of alcohol use disorders?More controlled evidence needs to be evaluated to resolve these alternatives, and theyshould be resolved if preventive strategies are to be based on proven causal factors.
Another indication of a possible collective population influence exists in the strongpositive association of mean apparent alcohol consumption in the 50 different US states(17) with two indices of heavy drinking: the prevalence of total ethanol-related diseaseand chronic liver disease in each state (18). Similarly to the results from England, theseresults suggest that heavy drinkers may be a predictable portion of a population.Collectivity was also evident in the standardized data from the Intersalt Study. TheIntersalt Study was an international, multicenter study of adults representing 52 popula-tions in 32 countries that showed close and independent associations between the popu-lation mean and the prevalence of deviance for each of the variables examined:correlation coefficients were 0.85 for blood pressure, 0.94 for body mass index (BMI),0.97 for alcohol intake, and 0.78 for sodium intake (19). These findings imply that distri-butions of health-related characteristics increase and decrease as a whole. Therefore, anincrease in average alcohol intake that is intended for the health and well-being of thegeneral population could be responsible for increased harm to the vulnerable subgroup.
3.3. Temporal Variance in Alcohol Intake PatternsAnother feature of diversity in alcohol consumption that impacts on health outcomes
is the pattern of intake within the period of time being used for comparisons. The bio-logical impact of one drink per day for 7 d clearly differs from that of seven drinkson 1 d per week, although both lifestyles have mean intakes of one drink per day.Unfortunately, few epidemiological reports note such temporal variances in intake.Because aggregate data fail to give clear insight into the daily intensities of alcoholexposure that occur in individual cases, the credibility of general interpretations that aremade from aggregate data may be compromised by that failure. To avoid that weakness,careful, systematic records of daily intake were obtained from 50 heavily drinking vol-unteers enrolled at the Vermont Alcohol Research Center who reported their alcoholintake for 112 d using a computer-automated interactive voice simulation systemaccessed by touchtone telephone through a dedicated 800 number (20). Subsequentreports have confirmed the value of interactive voice responses in assigning valid pat-terns of individuals’ alcohol intake (21,22), an important aspect in avoiding inappropri-ate stereotypes of alcoholism (23).
Results from 5151 self-reports of daily drinking (20) documented a wide variance,with somewhat greater drinking on weekends than weekdays (Friday = 5.7 ± 5;Saturday = 5.7 ± 4; Sunday = 4.2 ± 4; Monday = 3.6 ± 3; Tuesday = 3.5 ± 3; Wednes-day = 4.2 ± 4; Thursday = 4.2 ± 3). Other data collected by traditional methods imme-diately after the study confirmed the expectation that subjects who drank more heavily

814 Part IX / Critical Issues for the 21st Century
retrospectively under-reported their consumption significantly more than subjects whodrank more lightly. A more detailed analysis of individual daily alcohol intake (24) wasmade for 12 subjects with comparable quantity and frequency of alcohol consumption:6 lighter drinking alcohol-dependent and 6 heavy drinking nondependent subjects.Alcohol consumption by nondependent heavy drinkers had long-term variations (weeksor months, perhaps reflecting social occasions), whereas the dependent subjects had sta-ble, characteristic 7-d drinking cycles. Alcohol drinking was rather homogeneousthroughout the week in France, whereas Fridays and Saturdays accounted for 60% oftotal alcohol consumption in Northern Ireland (25). Consumption of wine was higher inFrance, whereas consumption of beer and spirits was higher in Northern Ireland.Weekend drinking demonstrates the inability of mean aggregate values to describe thestate of an individual at a given time. Average volume of alcohol consumption relatesto many major disease outcomes in a detrimental fashion, and the pattern of drinking isan additional influential factor for coronary heart disease and injury. The influence ofpatterns of drinking may be underestimated because pattern measures have not beenincluded in many epidemiological studies (26).
Each person metabolizes alcohol in a fairly reproducible and consistent manner, withcharacteristic rising and falling curves of tissue alcohol levels (27) and most ingestedalcohol apparently converted to carbon dioxide within hours. The transitory period ofelevated tissue alcohol levels constitutes a controversial period within which scientistsattempt to interpret how alcohol has its impact. With one drink per day, blood alcoholwill probably be very low for 22 of the 24 h in the day (28). Dietary guidelines empha-size drinking alcohol with meals (1). Are benefits and risks of alcohol drinking linkedto ambient alcohol levels in tissues, or are they linked to some associated aspect ofmetabolizing alcohol during prandial or postprandial states? These questions need to beaddressed in explaining how alcohol consumption can cause the effects that are attrib-uted to it.
Very low levels of alcohol may influence human physiology in ways not widely rec-ognized, discussed, or even carefully documented. When preventing physiologicalsigns of alcohol withdrawal, alcohol was infused intravenously (nearly equivalent toseven drinks per day) without elevating blood alcohol levels beyond that regarded as“nondetectable” (29). More controlled analytical monitoring during similar intravenoustreatment to prevent alcohol withdrawal (30) noted success when arterial levels werenear 0.1 mg/mL (often regarded as “undetectable” with standard methods). However,treatment failed when the alcohol levels were essentially zero. To answer questionsregarding how beneficial physiology results from alcohol levels near 0.1 mg/mL, weneed to determine the still unknown causal mechanism by which such effects can beinterpreted. Much evidence from controlled clinical interventions exists to supportrationales or mechanisms for benefits caused by alcohol. Claims that one drink per daycan prevent CVD need plausible mechanisms to gain credibility.
3.4. The Disease Concept of AlcoholismDuring the 18th century, the balance in attitudes toward chronic drunkenness grad-
ually shifted away from it being a voluntary choice that people made toward emphasison alcoholism as a progressive, addictive disease for which total abstinence was theonly remedy (reviewed in ref. 31). In 1785, Benjamin Rush (reviewed in ref. 32) describedalcoholism as an addictive disease associated with toxic consequences of alcohol.

Chapter 33 / Alcohol 815
Linked with the disease concept was another concept that re-appeared in teachings bythe Temperance Movement in the 19th century and by Alcoholics Anonymous andJellinek in the 20th century: total abstinence was needed once a drinker became help-less with the appetite for alcohol. Although the requirement for abstinence by vulner-able individuals acquired many proponents for more than a century, optimism aboutmoderate, controlled drinking seems prevalent among the majority of the populationthat has not experienced alcohol dependency. However, it may not be useful for indi-viduals in the majority to rely on their own personal experience to balance the bene-fits and risks of moderate alcohol intake for individuals among the 5 to 10% who arevulnerable.
The concept of collectivity might be regarded an external result (phenotype) of mul-tiple gene–environment interactions that are characteristic of the general human geno-type. In that sense, different populations around the world that have open access toalcohol might have roughly similar aggregate alcohol intakes, with about 5 to 10% ofpeople being vulnerable to heavy drinking. Such an approximate general outcome mightoccur from collective interactions of the heterogeneous mixtures of alleles among thediverse individuals of the population. For example, the prevalence, incidence, and life-time risk of schizophrenia has been remarkably consistent across various populationsand geographic areas during the past century (33).
A broad look at mean alcohol consumption for people in different countries and cul-tural periods shows more similarity than might be expected. For example, Batel (34)noted that aggregate average annual per capita intake of alcohol in France is now near3 gallons, and the prevalence of alcohol dependence may be about 6%. Average alcoholintake by the US population in 1994 was about 2.2 gallons, and the prevalence of alco-hol abuse and dependence was about 7.4% (35). These values are similar to those inother developed countries for which alcohol is second only to tobacco as a risk factorfor disability-adjusted life years (DALYs; ref 36; see Section 5.). Additionally, the cur-rent average annual consumption per capita in the United States is about 2 to 2.5 gallonsof ethanol (17); this amount remained at similar levels in the face of major cultural andlifestyle changes that occurred in the time preceding the Civil War (1850–1870; 2.2 gal-lons) and during the Industrial Revolution, with its waves of immigration, the advent ofthe automobile, and electric power (1881–1910; 2.2 gallons). Then, after limited accessto alcohol during two World Wars, Prohibition, and the Depression, per capita con-sumption remained at similar levels during widespread social change that accompanieda shift from trains, radio, and movies (1945–1950; 2.1 gallons) to air travel and televi-sion (1960–1969; 2.2 gallons), space exploration and changing roles for women(1970–1989; 2.6 gallons), and home computers and the Internet (1990–1994; 2.3 gallons).One might wonder if there is some aspect of human biology that creates a characteristic5 to 10% risk of alcohol use disorders.
Clear evidence for the heritable nature of alcohol dependency (e.g., ref. 37) promptedan extensive genomic search to identify genes that contribute to the risk of the alcoholdependency disease, which appears in about 5 to 10% of the population. The study ini-tially found suggestive evidence for genes that increase susceptibility to alcoholism onchromosomes 1, 2, and 7 as well as the possibility of a gene that decreases the risk ofsusceptibility to alcoholism on chromosome 4 (38). Subsequently, three phenotypicalfactors were developed to account for 68% of the total variance in in more than 9000individuals from alcoholic and control families (39). These novel phenotypes may more

816 Part IX / Critical Issues for the 21st Century
accurately model the effects of influential genes and help detect genes that are involvedin this complex disorder. The most promising regions of linkage were on chromosomes1 and 15. Progress in identifying genes for disorders and traits with complex inheritancehas been slower than experts initially expected (40,41). Slow progress is likely whenmany genes are involved for each phenotype and the effect of any one gene is small.More attention to defining narrower phenotypes is needed to detect genetic links incomplex behavioral diseases.
4. BALANCING NUTRIENTS AND TOXINS
4.1. A Useful Nutrient?Although biochemistry and physiology began developing insight into the three prin-
cipal uses of alcohol (medical, nutritional, and recreational) during the 19th century,attitudes about alcohol shifted widely, ranging from it being a useful nutrient to a harm-ful toxin. The balance between academic theory and clinical practice shifted as newinformation developed. Physiological theories changed rapidly in the middle of the cen-tury, with scientific reports postulating a nutritive value for alcohol, then regarding it asworthless for nourishment purposes, and still later promoting its ability to lower bodytemperature (42). However, most physicians remained unchanged in their clinical useof alcohol, balancing their continued belief in prior practice with the changing contra-dictory theories. Research results were accepted in constructing medical theoriesregarding how alcohol works, but they were largely irrelevant in the balance of opin-ions that formulated therapeutic practice. It may be humbling for scientists to realizethat no matter how much scientific research results may change theories of alcoholaction, theories may not be the basis on which clinicians recommend alcohol use northe basis on which the public uses alcohol. Alcohol remained a widely prescribed ther-apeutic agent through the end of the 19th century despite the uncertainty regarding itsnutritive value. A low public awareness of that uncertainty contrasts with widespreadspeculation about alcohol’s putative role in preventing heart attacks.
By the end of the 19th century, an intense polarization had developed in the balanceof attitudes between nutrient and toxin status of alcohol. The balance of power shiftedduring an unusual human tragedy involving Mary Hunt, National Superintendent of theScientific Department of the Woman’s Christian Temperance Union (WCTU), andWilbur Atwater, first head of the United States Department of Agriculture (USDA)Experimental Stations (32). Publishers of public school textbooks were under intensepolitical pressure (led by Hunt) to include information on “hygienic physiology,” whichpresented the viewpoint of the WCTU movement. The WCTU characterized alcohol asa dangerous and seductive poison of no useful value that could create an addictiveappetite apt to become an uncontrollable disease. Alcohol addicts were regarded to havelost control and required complete abstinence from alcohol, renewing the concepts pro-posed by Rush a century earlier and preceding the positions by Jellinek and AlcoholicsAnonymous in the 20th century (31). For a generation of school children, these conceptswere presented in textbooks as proven scientific findings.
However, by 1895, the political struggle for a new balance in power over alcohol phys-iology moved to include Atwater’s unique calorimetric research on human alcohol metab-olism (43). Atwater campaigned vigorously that the public should regard alcohol as avaluable nutrient (although he agreed that it was not a food), and he attempted to reduce
Chapter 33 / Alcohol 817
negative teaching about alcohol in the public schools. He reported that alcohol was almostfully oxidized and replaced the caloric equivalent of either fat or carbohydrate (i.e., itacted as a food) (44). Although Atwater (in concert with academic physiologists) suc-ceeded in removing the polarized teaching about alcohol’s toxicity from the schools, thepolitical struggle led the Secretary of Agriculture to remove support for further alcoholexperiments or for publishing the results in USDA bulletins. Eventually, limited supportfrom the Carnegie Institution of Washington and the National Academy of Sciencesassisted in distributing the experimental research results (43; also reviewed in ref. 32).Atwater was joined by a “Committee of Fifty” academic physiologists, which claimed tofocus on scientific studies of physical and social facts “without reference to the conclu-sions to which they might lead” (45). The committee was an expression of the 19th cen-tury Liberal Movement. It attempted to integrate concepts of rational reform with foursubcommittees: Physiological Aspects, Legislative Aspects, Economic Aspects, andSubstitutes for the Saloons. Ironically, events combined to create a paradox in which,insisting on their lack of knowledge (and needs for more studies), the academicians“eliminated physiology from school curricula, and who, in the course of asserting theirexpertise over alcohol, made themselves irrelevant to the one American constitutionalquestion (i.e., Prohibition) with a substantial physiological component” (32). The intensepublic struggle between Hunt and Atwater came to an abrupt end in 1904 when Hunt lostpower with the WCTU (and died in 1906) and Atwater was incapacitated by a series ofpossible strokes (and died in 1907).
The harsh political conditions may have diminished support for alcohol research formany years, and the advent of Prohibition in 1918 removed much motivation for acad-emics to pursue scientific curiosity further. In 1935, the absence of organized continu-ing research led Mitchell to note (46) that the physiological value of alcohol was in astate of “utmost confusion,” and World et al. (6) later suggested that alcohol-derivedcalories should possibly be disregarded completely as an energy source in predictingdietary-induced changes in weight. Later results from 89,538 women in the Nurses’Health Study and 48,493 men in the Health Professionals Follow-up Study showed thatalcohol intake did not appear to contribute to overall body mass in women or men (47).In fact, women had a clear inverse relationship between total energy intake of alcoholconsumption and BMI.
This counterintuitive situation was supported by other studies (48) and by cumulativeevidence from 31 separate surveys, which showed that reduced alcohol consumptionprobably would not help achieve or maintain a lower body weight (49). Amazingly, thebalance of information about alcohol as a nutrient remains uncertain (50,51), with thenutritive value of alcohol calories still the subject of much debate and proposedresearch. Somehow, all of the scientific effort still has not provided a convincing res-olution of the uncertainty. The debate at the Sixth European Congress on Obesity bySchutz (52) and Westererp (53) helped the scientific community become familiar witha topic that has remained unsettled for over a century (reviewed in refs. 54 and 55). Itseems likely that the issue of whether alcohol is a useful nutrient whose calories countthe same as other calories will remain uncertain and controversial among scientists forsome time.
Although since Atwater’s study (43), calorimetric results have been believed to indi-cate that the energy of alcohol is handled similarly to that of other macronutrients,caloric compensation (in which one nutrient satiates appetite for other nutrients)

818 Part IX / Critical Issues for the 21st Century
does not seem to occur with alcohol (55–61). For example, men reported no decreasedintake of average food energy (7555 kJ/d) or amounts of various macronutrients irre-spective of an alcohol-altered average total energy intake, which ranged from 7576 to9822 kJ/d (47). Similarly, Rose et al. (62) reported that alcohol drinkers added alcoholenergy to their diet rather than displacing food with alcohol, and there was no increasein BMI for women despite increased total energy intake with increased alcohol con-sumption. Alternatively, recent USDA results (obtained nearly 100 yr after Atwater’sstudy) described alcohol being metabolized similarly to other foods (63). Clearly, epi-demiological surveys seem to contradict laboratory calorimetric studies, and one of themethods will eventually prove to give a correct interpretation. A hundred years ofresearch still has not provided concurrence on alcohol’s value as a nutrient, and seriousquestions about the consequences of alcohol intake perturbing metabolism and fuelselection require explanation.
4.2. Moderate Doses of a Toxic Substance?The rationale of assigning the controversy over alcohol’s toxic status to scientific
examination by university professors diminished the flow of temperance-oriented edu-cation on alcohol as a toxin but did not provide alternative explanations, becauseresearchers lost interest in the questions (32). The balance of information on alcohol asa toxin shifted over the years with attention to the dose and to conditional toxic statesin which foods and nutrients balance toxic actions of alcohol. When arguing for main-tenance or repeal of Prohibition, different scientific arguments were used on both sidesof the debate regarding intoxicating effects of alcohol (64). Experimental psychologistWalter Miles measured impaired performance and urged maximizing human efficiency.In contrast, Carlson used low doses for which low signal-to-noise ratios prevented sta-tistical proof of any alcohol effect. Support for ending Prohibition came from the chem-ical physiologist Yarnell Henderson, who focused on minimum performance necessaryfor the smooth operation of society. This view of “moderation” prevailed in the end,partly because its view of intoxication and the degree of hazard it represented was con-sistent with the personal experience of a majority of Americans (rather than the muchsmaller proportion that suffers from alcohol use disorders). Ironically, current maxi-mum accepted exposures of toxicants are appreciably below the levels that wereaccepted when repeal was achieved in 1933. Modern scientists urge policies that mini-mize as much exposure to any known deleterious substance as possible (64).
Efforts to interpret actions of alcohol have been confounded for decades by controversyover whether alcohol is toxic per se or whether it has a conditional effect that depends oninteraction with foods and nutrients. Academic arguments continue over whether or not thediet during a given study was adequate in nutrients (such as choline, methionine, folic acid,thiamine, zinc, antioxidant vitamins, or carbohydrate) to prevent toxicity (65). For exam-ple, animal models showed more alcohol toxicity with high-fat, low-carbohydrate diets(66–68), and molecular mechanisms for impaired growth and liver pathology with alcoholremain the subject of controversy (see ref. 69, Symposium on Nutritional Factors andOxidative Stress in Experimental Alcoholic Liver Disease). Unfortunately, the develop-ment of documented mechanisms by which alcohol and its metabolite, acetate, perturb nor-mal carbohydrate and fat metabolism has been slow (28). Alternatively, progress inrecognizing the complex network of cellular mediators and oxidant stress during alcohol-induced liver injury (70) was recently extended by detection of significant isoprostane

Chapter 33 / Alcohol 819
formation (a marker of tissue oxidant stress) during conditions similar to social drinking(71). Results with such biomarkers are alerting the biomedical community to previouslyunsuspected alcohol-induced peroxidation (72) during intakes that many people regard asbenign and “moderate.” The paradoxical aspects of evidence for alcohol’s possible antiox-idant and pro-oxidant health benefits now border on the ironic.
For example, red wine has been central in many discussions about the possible car-diovascular benefits from alcoholic beverages (73), particularly regarding preventinginflammatory vascular plaque formation. The published reports form an ambivalentbalance in attributing the apparent success to ethyl alcohol (whether in wine, beer, orspirits) or to polyphenol antioxidants. The possible antioxidant suppression of transientoxidant stress during postprandial lipemia by red wine but not vodka (74) seems con-tradicted by the fact that endothelium-based, flow-mediated dilation is positively asso-ciated with non-wine alcohol consumption and negatively associated with smoking(75). In contrast, polyphenols in de-alcoholized red wine reduced in vivo lipid peroxi-dation (as measured by isoprostanes in smoking subjects) (76). A randomized controlledtrial that reduced alcohol intake from 72 to 8 g/d showed no effect on endothelial-based,flow-mediated dilation (77). However, median C-reactive protein (CRP) levels (possiblylinked to inflammatory events) of 2.60, 2.20, 1.70, 1.60, and 1.80 mg/L were associatedwith alcohol intakes of less than one drink per month, one to three drinks per month, oneto four drinks per week, five to seven drinks per week, and two or more drinks daily,respectively (78). The decreasing CRP levels likely result from some lifestyle featureother than blood alcohol, and oxidant stress with more than one drink daily may raiseCRP levels. The contradictory clues and the known risks of alcohol-related problemscreate uncertainty about the nature of possible benefits from alcoholic beverages.
5. BALANCING RISK FACTORS AND CAUSES
5.1. Death and Disease BurdensDeath is generally accepted as a precise condition, although the complexity of life
makes it inevitable that there are a near infinite number of ways in which the complexadaptive living system arrives at death. Nevertheless, despite the multiple factorsinvolved, each fatality is conventionally characterized by a single “cause of death.”Statistical epidemiology associates factors with the listed cause of death. The associa-tion is predictive but is not proof of a causal role. Interpretations about associated riskfactors need to be made with caution. For example, the risk factor most powerfully asso-ciated with all deaths is age, and tables of vital statistics are careful to stratify informa-tion by age groups to permit more meaningful age-adjusted interpretations.Nevertheless, age itself usually is not the direct cause of death, and health experts exam-ine other causes when they design appropriate public health interventions. In the samesense, gender and socioeconomic status are important risk factors that are strongly asso-ciated with health outcomes for an individual, but they are not readily modifiable forintervention studies. Knowing mechanisms in the causal chain of disease events givestargets for successful intervention and ensures the likelihood of a credible solution.Epidemiologists must carefully examine the balance among risk factors and find moredirect causal factors for which interventions can be arranged.
Social values and preferences of different populations require careful and prominentinclusion when discussing health problems and priorities linked to a possibly successful

820 Part IX / Critical Issues for the 21st Century
intervention. To facilitate this inclusion, one recent study developed a standard unitknown as the DALY to aid comparisons in a standardized approach to epidemiologicalassessment (ref. 79, as reviewed in ref. 36), and DALYs were estimated for eachage–sex group to designate leading risk factors for death and disability in each majorsocioeconomic region. In this analysis, alcohol was a major risk factor, tied with unsafesex as the third-ranked worldwide risk factor (3.5%) behind malnutrition (15.9%) andpoor water, sanitation, and hygiene (6.8%). In established market economies, alcoholwas second only to tobacco as a risk factor for DALY. In these economies, a possibleprotective effect of alcohol may have averted as many deaths as it caused (via its harmfuleffects), but worldwide alcohol caused 750,000 more deaths than it averted (36). In 2000,exposure to alcohol caused 3.2% of the global deaths and 4.0% of the global DALYs(80). Although age is strongly associated with mortality, it also has important effects onalcohol as a risk factor at different stages of life.
5.1.1. PREGNANCY
Relatively low levels of alcohol disturb cellular signals in the developing fetus,causing serious lifelong physical and mental abnormalities for the individual; this find-ing led to national requirements for warning labels on alcoholic beverages. Late 19th-century reports showed that offspring of dogs who were given alcohol died young orwere deformed, and inebriated inmates had more miscarriages and defective childrenthan nonalcoholic inmates (81). Researchers then demonstrated that alcohol impairedrat pup viability and guinea pig fertility and viability. Despite evidence of alcohol-impaired reproduction, experts asserted a lack of evidence that alcohol causes anyabnormality in offspring (81). Research on this topic was neglected for decades, untilJones (82) described Fetal Alcohol Syndrome, and the newly formed National Instituteon Alcohol Abuse and Alcoholism shifted the balance of interest toward investigationof this important problem. Currently, the scientific community knows of fetal alcoholrisks, but the information still is not uniformly transmitted or perceived by the public inways that sufficiently alter behavior.
5.1.2. INFANTS AND CHILDREN
Nursing infants had less active sleep during the 3.5 h immediately after exposure toalcohol in mothers’ milk. Compensatory increases in active sleep were then observed inthe next 20.5 h, when mothers refrained from drinking alcohol (83). Infants also con-sumed less milk during the 4 h immediately after exposure to alcohol in mothers’ milk(84). Additionally, children in a household where one or both parents admitted drinkingalcohol to change their state of mind or reduce dysphoric feelings (i.e., to escape) weremore likely to dislike the odor of alcohol compared to children whose parents did notdrink to escape (85). Perceptions and priorities for alcohol are affected by early envi-ronmental interactions (86).
5.1.3. ADOLESCENTS AND YOUNG ADULTS
Early access to alcohol is strongly associated with the eventual acquisition of alcoholdependence (16), which has associated high social costs. In this regard, age restrictionson access to alcoholic beverages have been regarded as a useful preventive nutritionstrategy. The very high DALYs and loss of life in traffic accidents (ranked ninth as acause of worldwide DALYs) led to adoption by the United States of a nationwide, uni-form, legal 21-yr age limit to restrict access to alcohol. In West Germany, Denmark,

Chapter 33 / Alcohol 821
Italy, and East Germany, traffic accidents involving alcohol and young men are thelargest contributor to alcohol-related deaths (87). Approximately 30% of deaths amongmales ages 25 to 44 yr are to the result of alcohol consumption.
5.1.4. OLDER ADULTS
Changes in personal priorities during life seem evident in the finding that 22% ofheavy drinkers who previously met the Diagnostic and Statistical Manual of MentalDisorders IV criteria for alcohol dependence subsequently achieved total abstinence(88), and an additional 50% reduced their consumption to a level matching that of per-sons who had never been classified as dependent. Most reduction occurred in individu-als not participating in any type of alcohol treatment program, suggesting thatindividual current heavy drinkers may eventually voluntarily curtail their drinking. Inthis case, an eventual reduction in the proportion of heavy drinkers in the populationmight be achieved by continued prevention of new individuals from becoming heavydrinkers. Unfortunately, the worldwide history of collective attempts to diminish heavyalcohol drinking provides few encouraging examples of successful long-term tactics.Social support for total abstinence is an approach long-espoused by the 12-step facili-tation therapy used in Alcoholics Anonymous. A recent large-scale clinical trial com-paring outcomes from well-controlled therapeutic interventions showed sustained,modest success rates with matching treatment modality to different subtypes ofpatients, but it provided little indication of better successes than had been obtainedwith the 12-step facilitation therapy (89).
5.2. Disease Risks Associated With Alcohol UseAn important confounding factor in interpreting results from epidemiological studies
is the clustering of variables in patterns that reflect linked voluntary “lifestyle” choices,which prevents the variables from being treated as independent variables. This phe-nomenon was evident in the recent report on health professionals noted earlier (7). Withthe commonality of linked lifestyle choices, one might ask the question: “When (and bywhat mechanism) during the wide variations in tissue alcohol levels could people obtainthe putative benefits or risks associated with and attributed to alcoholic beverages?”Instinctive questions regarding the reason that the associative phenomenon occurs needto identify some causal mechanism before the effect can truly be understood. Inapproaching such questions, more precision in defining the attributes that are used inthe statistical comparisons can greatly aid the interpretations. Clustering all cancerdeaths or all cardiovascular deaths together fails to handle the diverse processesinvolved, and it greatly interferes with attempts to discuss preventive nutritional inter-ventions that might decrease the prevalence of selected subtypes of tumor or cardio-vascular process. Hypotheses about benefits and risks of drinking alcoholic beverages needto be examined with more precision than current epidemiological information provides.The following sections provide examples that illustrate some current knowledge aboutrisks and possible benefits.
5.2.1. CIRRHOSIS
Alcohol drinking is associated with a dose-related risk of liver cirrhosis that pro-gressively increases to dramatically high rates with heavier drinking levels, with rela-tively little risk associated with moderate drinking (90). Mechanisms by which alcohol

822 Part IX / Critical Issues for the 21st Century
can cause liver injury have been studied extensively, possible therapeutic targets havebeen suggested (70), and recent evidence of oxidant stress at moderate drinking levels(71) points to a need for more detailed examination of underlying mechanisms (91).
5.2.2. CANCER
Alcohol consumption has a clear association with cancer of the oral cavity, pharynx,larynx, esophagus, and liver and a suggestive association with cancer of the large boweland breast (92). Mortality from breast cancer is 30% higher among women who reportconsuming at least one drink daily compared to nondrinkers (93). The finding that“moderate” intake of beer or spirits, but not of wine, was associated with considerablerisk of cancer among Danes (94) might reflect an effect of different components of thebeverages (rather than alcohol per se), or it might reflect associated lifestyle events thataffected the risk of cancer. The similar finding that a lower risk for stroke existed amongDanes who drank wine but not beer or spirits (95) seems provocative regarding possi-ble lifestyle interactions. In contrast, a progressively increased relative risk for breastcancer was described for a different set of people (90). With 3% of all cancers attrib-uted to alcohol consumption (96), there is a need to identify mechanisms whereby alco-hol acts to increase or decrease the risk. One mechanism explored recently is thatalcohol may increase risk of breast cancer by elevating plasma estrogen levels (97) intwo ways: (a) through decreased clearance of plasma estrogen (98), and (b) throughincreased absorption during hormone replacement therapy (99). If these mechanismscause increased breast cancers, then a prevention program aimed at women who are athigh risk for breast cancer must be weighed against the possible cardiovascular benefitsfor moderate drinkers.
5.2.3. HYPERTENSION, STROKE, AND HEART ATTACKS
Reducing these major causes of death in the United States motivates a careful exam-ination of all possible alternatives. Of 48 centers worldwide in which some peoplereported consuming at least 300 mL of alcohol per week, 35 centers had positive regres-sion coefficients that linked heavy alcohol consumption to blood pressure (100).Overall, alcohol consumption is associated with increased blood pressure, especially atthe highest intake. The significant association of heavy drinking (three to four or moredrinks per day) to blood pressure that was observed in both men and women and inyounger and older men was independent of and added to the effect of BMI and urinaryexcretion of sodium and potassium on blood pressure. Therefore, hypertension appearsto have many alternative causal factors as targets for preventive nutrition tactics, one ofwhich is to decrease alcohol intake for some individuals. Different factors may be piv-otal for different individuals, and each patient with hypertension must discern whichfactor is causal in his or her life.
Chronic alcohol intakes also appear to be linked with cardiac arrhythmias and atrialfibrillation in sudden cardiac death (101), although no mechanism is known. Alternatively,among 22,071 men in the Physicians’ Health Study, using those who consumed lessthan 1 alcoholic drink per week for comparison, the relative risks of all-cause mortalitywere 0.72, 0.79, 0.98, and 1.51 for those who consumed 2 to 4, 5 to 6, 7, and 14 or moredrinks per week, respectively (102). Similarly, a large cancer prevention study produceda 30 to 40% lower CVD death rate associated with moderate drinking (93).Additionally, a population-based case–control study concluded that the relative risk of

Chapter 33 / Alcohol 823
a major coronary event was lowest among men who report one to four drinks daily on5 or 6 d/wk and among women who report one or two drinks daily on 5 or 6 d/wk (103).However, a much more cautious position was provided by Svarsudd (104), who notedconcerns over selection bias and limits in transferring conclusions from small subgroupsto the general population.
Interventions for targeted individuals or situations in the form of therapeutic steps forclearly demonstrated pathology probably will have more overall support than generalpreventive interventions, for which the small minority that is at risk is unidentified anduncertain. In this case, individuals among the majority not at risk can easily lose confi-dence in the credibility of using preventive tactics that succeed only for a minority.Credibility is further strained when the mechanism of the disease or the intervention isnot clear or has multiple alternatives—a situation encountered in balancing cardiovas-cular death and alcohol drinking. Interpreting cardiovascular death must overcome dif-ferences in understanding about whether blood cholesterol level is only a predictive riskmarker associated with dietary and metabolic imbalance or whether it has a causal rolein mediating the disease processes (4,105; see also Section 6.).
The certainty of diminishing thrombosis with low-dose aspirin has no counterpart forlow-dose alcohol. Preventive nutrition approaches to decreasing cardiovascular mortal-ity have long been regarded to involve reducing calories as total fat and saturated fat(4), and molecular mediators of thrombosis, arrhythmia, and atherogenesis have beenidentified (106). In fact, decreasing the formation and function of the n-6 eicosanoidthromboxane with low-dose aspirin inhibition of platelet cyclooxygenase is a strikinglyeffective tactic. This known mechanism has a parallel nutritional intervention in elevat-ing the ratio of dietary n-3:n-6 essential fatty acids. Mechanisms by which alcoholmight diminish fatal cardiovascular events remain unknown.
In considering the often discussed “French paradox” of low cardiovascular deathrates relative to average blood cholesterol values, it is instructive to know that for sub-groups of men ages 40 to 44 yr in 1960, 34% in France had died before reaching theages of 70 to 74 yr, compared with 37% in the United States and 36% in England andWales (107). Although these overall rates appear similar, there was a dramatic differ-ence in death rates resulting from ischemic heart disease (IHD): 4.5, 14.1, and 15.2%,respectively. However, if all men who died early of alcohol-associated causes had diedof IHD, the rates would have been 21, 26, and 25%, respectively. Although the smallunexplained residual difference in the three populations requires explanation, it is evi-dent that the large portion of French men who die early from the serious negativeimpacts of alcohol tends to balance the low IHD death rate in the French population.That balanced “trade-off” is often ignored when discussing possible protection by mod-erate drinking. In 1990, estimates of 19 and 13% of all premature deaths in French menand women were attributed to alcohol (108). Red wine consumption is not associatedwith reduced all-cause mortality in European countries, and, despite abundant observa-tional data, proof that alcohol reduces CVD risk is weak in the absence of randomizedcontrolled trials. Alcohol remains the third highest cause of preventable premature deathin the United States (109), and the risk of alcohol habituation, abuse, and adverse effectsmust be considered in any patient counseling. More controlled information on causalmechanisms (such as patterns of alcohol intake and mechanisms of cardiovasculardeath) needs to be weighed when balancing benefits and risks for complex multivariantsituations.

824 Part IX / Critical Issues for the 21st Century
6. BALANCING IGNORANCE AND KNOWLEDGE
The history of handling the “totality” of evidence on alcohol-related physiology pro-vides interesting, and sometimes perplexing, examples of waxing and waning attentionto evidence that presumably reflects changing attitudes and priorities. Developing wide-scale recommendations and social policies involves much more than scientific infor-mation, although such information can make the decision process more rational (110).The information needed to alter behavior often is more than a statement of risk, and theways by which behavior-modifying information travels within society requires deeperanalysis. For example, people initially believed that warning labels on beverage bottleswould alter behavior, but a postpolicy analysis of the value of the labels showed littleeffect (111). The labels seemed to increase public awareness without appearing to havea major influence on drinking behavior (reminiscent of the use of alcohol by physiciansin the late 19th century). In contrast to uncertain results with labels, restricting accessto alcohol by changing the minimum legal drinking age from 18 to 21 yr significantlydecreased the incidence of alcohol-related automobile crashes (112). Additionally,young people then continued to drink less through their early 20s.
Expectations about possible personal benefits of moderate drinking by the majority(which is not particularly vulnerable to alcohol use disorder) rests on a balance withinformation about personal risks of moderate drinking. A thorough analysis of the risksand protective effects of alcohol on the individual was recently provided at a state-of-the-art conference sponsored by the Swedish Medical Research Council (113). Theorganizers noted that each community or professional group has to examine the scien-tific literature to make policies that fit its own perceptions and priorities. The assembledreports of the conference facilitate such an examination. One overview balancing therisks and benefits of alcohol consumption (90) concluded by noting that younger andelderly adults are now advised to drink less than other adults and that men below age35 yr, premenopausal women, and older persons who are not in good health are notlikely to benefit from light-to-moderate drinking. A similar view of risks and benefitsover the life span (114) noted the limited portion of the population that is likely toachieve demonstrable benefits from alcohol consumption, concluding with a reminderthat priorities other than health are likely to continue to motivate alcohol drinking.
With Atwater’s calorimetry, moderate alcohol intake was presented as scientificallyproven to have beneficial effects on health (similarly to some current attitudes regard-ing cardiovascular risks). Hindsight permits recognition of the struggle to balancehighly inflexible attitudes over positions that are now regarded as common knowledge:many people can drink moderately, although alcohol does cause major problems forsome people (31,32). The current awareness of genetic diversity and a shift away fromthe “melting pot” concept of creating a uniform, homogeneous American society sug-gest that revisiting the struggle between the Liberal Movement and the TemperanceMovement might avoid the overpolarized positions that created historic weaknesses andlack of credibility. Currently, society still has no sure way to identify and assist the 5 to10% of the population that is vulnerable to alcohol use disorders, and health benefits ofalcohol remain unproved. Hopefully, the chronic lack of a solution for this large prob-lem will spur sharper attention to causal factors and mediators for the disorders, therebyallowing for selection of targets for successful preventive interventions. With no certainanswers, individuals remain free to choose their own personal accommodation to a riskfor vulnerability.

Chapter 33 / Alcohol 825
Two recent large-scale public education efforts at preventive nutrition illustrated thechallenge of advising a diverse population about heterogeneous disorders for whichmechanisms are mostly not known and for which a large minority that is at risk in thepopulation cannot be identified prior to disease initiation. The first effort was analyzedin a lengthy analysis of the National High Blood Pressure Education Program. Taubes(115) noted a philosophical clash between the public health policy requirement to actand the requirement of good science for institutionalized skepticism. Limiting the flowof information about alternative explanations to advance a single public health optionmay decrease some distractions, but it intensifies the risk of impaired credibility.Although some factors for various aspects of hypertension are recognized, controversycontinues over general interventions that seem to oversimplify a complex issue in whichmany different factors act in different individuals. The decades-long debate (115,116)about salt intake and population-wide blood pressure management involves situationsthat are instructive for people who are contemplating preventive nutrition with alcohol.The second effort, which was even more relevant to the issue of whether alcoholdecreases cardiovascular deaths, was the National Cholesterol Education Program (117).In this effort, the clinical measure of elevated blood cholesterol associated withincreased risk became a target for intervention (118), and considerable controversy con-tinued (105,119) over whether the elevated level caused the disease or was merely anassociated marker. Were physicians treating the cause of the disease or only a symptomof it? With multiple mechanisms involved, CVD, like hypertension, should not be over-simplified when designing credible interventions. Although some causal mechanismsfor various aspects of cardiovascular mortality (inflammatory atherogenesis, myocar-dial arrhythmia, platelet thrombosis) are recognized and are targets for intervention(106), there is still no accepted hypothesis or mechanism by which moderate drinkingof alcohol decreases risk. However, decreasing dietary saturated fats (4,120) andincreasing dietary n-3 fats (106,121) or using low-dose aspirin (122) are effective pre-ventive alternatives for decreasing causes of CVD. The onset and progression of CVDis not caused by a deficiency of alcohol intake that needs to be corrected. Rather, thechronic nutritional imbalances that exacerbate inflammatory atherogenesis, myocar-dial arrhythmia, and platelet thrombosis are rational targets for primary and secondaryprevention (106,123).
7. RECOMMENDATIONS
Exercising informed choice about foods from the wide range of acceptable optionsrequires careful assessment of the context within which information about them wasobtained and will be applied. Because a risk/benefit ratio for using alcohol in a preven-tive nutrition tactic involves balancing risks for developing one or more diseases againstrisks for developing alcohol use disorders, the following points should be considered.
A majority of individuals do not seem to be at risk for alcohol use disorders, but cur-rent insight into human genetic diversity allows recognition and acceptance that theeffect of alcohol differs greatly among individuals. The risk from increased averagedrinking of alcohol involves a vulnerability to consume high levels that is not uniformlydistributed among individuals. Generalizations from population medians or means donot adequately describe individuals in the vulnerable minority.
The median intake of alcohol in the United States may be about one to two drinks perweek; this is much less than the proposed preventive level of one to two drinks per day,

826 Part IX / Critical Issues for the 21st Century
which is currently consumed by only a small fraction of the population. Such intakesgive very little tissue alcohol for most of the day.
People not yet exposed to alcohol (which includes every young person growingtoward adulthood) are unable to predict whether or not they are among the 5 to 10%who are at risk for developing alcohol use disorders. Therefore, their election to drinkcan never be a fully informed choice between benefits and risks. The best guess aboutrisk comes from an imprecise extrapolation from a family history of alcohol use disorder.As a result, majority acceptance of a restrictive alcohol policy for young people seemslikely to continue as a primary prevention policy because of concern for the unidentifi-able vulnerable minority.
Once genetic vulnerability collides with environmental facilitation, efforts at primaryprevention end for that individual, and attention shifts to treatment and secondary pre-vention, for which total abstinence remains the principal successful option.
Risks associated with high levels of drinking are clearly evident for cancer, cirrhosis,and hypertension. However, the variance in those risks is wide enough for the results atlow levels of alcohol consumption to permit many hypotheses to apply, including thenull hypothesis. As a result, uncertain logic could alter the balance between designatingalcohol as harmful or harmless, because what appears “true” for the complete generalset may not be true for a specific subset.
Information on an observed associative relationship is suitable for hypothesizingabout possible causes, but interventions with positive and negative controls are neededto prove a causal mechanism. Lifestyle choices of multiple variables confound associa-tive relationships, decreasing the likelihood of assigning any one variable as the appar-ent cause. Currently, a causal role for alcohol in decreasing cardiovascular mortality hasnot been proved by controlled intervention studies.
Fully informed choice regarding the use of moderate drinking to prevent CVDrequires weighing evidence of possible benefits and risks, much of which is currentlyindirect and imprecise. Health benefits of alcohol comsumption have been hypothesizedfrom associative data, but no well-defined hypothetical mechanism is generallyaccepted for alcohol’s actions, and no results from a well-controlled intervention haveproved that alcohol causes the apparent benefit. To lower cardiovascular risks, preven-tive nutrition tactics other than alcohol consumption are available.
ACKNOWLEDGMENT
The author gratefully acknowledges helpful advice from past conversations withLoren Archer, Deborah Dawson, Mary Dufour, Michael Eckardt, Richard Fuller, EnochGordis, Brenda Hewitt, Robert Karp, and Norberta Schoene.
REFERENCES1. Nutrition and Your Health: Dietary Guidelines for Americans, Fifth ed., Home and Garden Bulletin
No. 232, US Dept. Agriculture, Washington, DC 20250, 2000, pp. 36–37.2. Dufour MC. If you drink alcoholic beverages do so in moderation: What does this mean? J Nutr
2001; 131:552S–561S.3. de Lorgeril M, Salen P, Guiraud A, Boucher E, de Leiris J. Resveratrol and non-ethanolic compo-
nents of wine in experimental cardiology. Nutr, Metabol Cardiovasc Dis 2003; 13:100–103.4. The Surgeon General’s Report on Nutrition and Health, 1988. DHHS(PHS) Publication No. 88-50210,
US Government Printing Office, Washington, DC, 20402

Chapter 33 / Alcohol 827
5. Huijbregts P, Feskens E, Rasanen L, et al. Dietary pattern and 20 year mortality in elderly men inFinland, Italy, and the Netherlands: longitudinal cohort. Brit Med J 1997; 315:13–17.
6. World MJ, Ryle PR, Pratt OE, Thomson AD. Alcohol and body weight. Alcohol Alcoholism 1984;19:1–6.
7. Ascherio A, Rimm EB, Giovannucci EL, Spiegelman D, Stampfer M, Willett WC. Dietary fat andrisk of coronary heart disease in men: cohort follow up study in the United States. Brit Med J 1996;313:84–90.
8. Rimm EB, Giovannucci EL, Willett WC, et al. Prospective study of alcohol consumption and risk ofcoronary disease in men. Lancet 1991; 338:464–468.
9. McCann SE, Sempos C, Freudenheim JL, et al. Alcoholic beverage preference and characteristics ofdrinkers and nondrinkers in western New York (United States). Nutr Metabol Cardiovasc Dis 2003;13:2–11.
10. Taubes G. Epidemiology faces its limits. Science 1995; 269:164–169.11. Willett W, Greenland S, MacMahon B, et al. The discipline of epidemiology. Science 1995;
269:1325,1326.12. Ledermann S. Alcohol, Alcoholism, Alcoholization, Vol I, PUF, Paris (1956) as described by M.
Bresard, In: International Encyclopedia of Pharmacology and Therapeutics, Section 20, Vol II,Pergamon Press, Oxford, 1970, pp. 352–355.
13. Schmidt W, Popham RE. Discussion of a Paper by Parker and Harman. In: Harford TC, Parker DA,Light L, eds. Normative Approaches to the Prevention of Alcohol Abuse and Alcoholism. NIAAAResearch Monograph 3. DHEW Publication No.(ADM) 79-847, 1980, pp 89–105.
14. Colhoun H, Ben-Schlomo Y, Dong W, Bost L, Marmot M. Ecological analysis of collectivity ofalcohol consumption in England: importance of average drinker. Brit Med J 1997; 314:1164–1168.
15. Dawson DA, Archer LD, Grant BF. Reducing alcohol-use disorders via decreased consumption: acomparison of population and high-risk strategies. Drug Alc Depend 1996; 42:39–47.
16. Grant BF, Dawson DA. Age at onset of alcohol use and its association with DSM-IV alcohol abuseand dependence: results from the National Alcohol Epidemiologic Survey. J Substance Abuse 1997;9:103–110.
17. Surveillance Report #39. Apparent per capita alcohol consumption: National, state, and regionaltrends, 1977–94. Williams GD, Stinson FS, Lane JD, Tunson SL, Dufour MC, National Institute onAlcohol Abuse and Alcoholism, December, 1996.
18. State trends in alcohol-related mortality, 1979–92. NIH Publication No. 96-4174, National Instituteon Alcohol Abuse and Alcoholism, September, 1996.
19. Rose G, Day S. The population mean predicts the number of deviant individuals. Brit Med J 1990;301:1031–1034.
20. Searles JS, Perrine MW, Mundt JC, Helzer JE. Self-report of drinking using touch-tone telephone:extending the limits of reliable daily contact. J Stud Alcohol 1995; 56:375–382.
21. Searles JS, Helzer JE, Rose GL, Badger GJ. Concurrent and retrospective reports of alcohol con-sumption across 30, 90 and 366 days: interactive voice response compared with the timeline followback. J Studies Alcohol 2002; 63:352–362.
22. Mundt JC, Bohn MJ, King M, Hartley MT. Automating standard alcohol use assessment instrumentsvia interactive voice response technology. Alcoholism—Clin Exp Res 2002; 26:207–211.
23. Schuckit MA, Tipp JE, Smith TL, Bucholz KK. Periods of abstinence following the onset of alco-hol dependence in 1,853 men and women. J Stud Alcohol 1997; 58:581–589.
24. Mundt JC, Searles JS, Perrine MW, Helzer JE. Cycles of alcohol dependence: frequency-domainanalyses of daily drinking logs for matched alcohol-dependent and nondependent subjects. J StudAlcohol 1995; 56:491–499.
25. Marques-Vidal P, Arveiler D, Evans A, et al. Patterns of alcohol consumption in middle-aged menfrom France and Northern Ireland. The PRIME study. Eur J Clin Nutr 2000; 54:321–328.
26. Rehm J, Room R, Graham K, Monteiro M, Gmel G, Sempos CT. The relationship of average vol-ume of alcohol consumption and patterns of drinking to burden of disease: an overview. Addiction2003; 98:1209–1228.
27. Wilkinson PK, Sedman AJ, Sakmar E, Kay DR, Wagner JG. Pharmacokinetics of ethanol after oraladministration in the fasting state. J Pharmacokin Biopharm 1977; 5:207–224.
28. Lands WEM. A review of alcohol clearance in humans. Alcohol 1998; 15:147–160.29. Craft PP, Foil MB, Cunningham PRG, Patselas PC, Long-Snyder BM, Collier MS. Intravenous
ethanol for alcohol detoxification in trauma patients. Southern Med J 1994; 87:47–54.

828 Part IX / Critical Issues for the 21st Century
30. Eggers V, Tio J, Neumann T, et al. Blood alcohol concentration for monitoring ethanol treatment toprevent alcohol withdrawal in the intensive care unit. Intensive Care Med2002; 28:1475–1482.
31. Levine HG. The discovery of addiction: changing conceptions of habitual drunkenness in America.J Stud Alcohol 1978; 39:143–174.
32. Pauly PJ. The struggle for ignorance about alcohol: American physiologists, Wilbur Olin Atwater,and the Woman’s Christian Temperance Union. Bull Hist Med 1990; 64:366–392.
33. Jablensky A. The 100-year epidemiology of schizophrenia. Schizophr Res 1997; 28:111–125.34. Batel P. The treatment of alcoholism in France. Drug Alc Depend 1995; 39(Suppl 1):S15–S21.35. Grant BF, Harford TH, Dawson DA, Chou SP, Dufour M, Pickering R. Prevalence of DSM-IV alcohol
abuse and dependence, United States, 1992. Alcohol Health Res World 1994); 18:243–248.36. Murray CJL, Lopez AD. Global mortality, disability, and the contribution of risk factors: Global
Burden of Disease Study. Lancet 1997; 349:1436–1442.37. Heath AC, Bucholz KK, Madden PAF, et al. Genetic and environmental contributions to alcohol
dependence risk in a national twin sample consistency of findings in women and men. Psychol Med1997; 27:1381–1396.
38. Reich T, Edenberg HJ, Goate A, et al. Genome-wide search for genes affecting the risk for alcoholdependence. Am J Med Genet (Neuropsych Genet) 1998; 81:207–215.
39. Dick DM, Numberger J, Edenberg HJ, et al. Suggestive linkage on chromosome 1 for a quantitativealcohol-related phenotype. Alcoholism–Clin Exp Res 2002; 26:1453–1460.
40. Plomin R, McGuffin P. Psychopathology in the postgenomic era. Ann Rev Psychol 2003; 54:205–228.41. van den Bree NBM, Owen MJ. The future of psychiatric genetics. Ann Med 2003; 35:122–134.42. Warner JH. Physiological theory and therapeutic explanation in the 1860s: the British debate onthe
medical use of alcohol. Bull Hist Med 1980; 54:235–257.43. Atwater WO, Benedict FG. An experimental inquiry regarding the nutritive value of alcohol. Mem
Nat Acad Sci 1902; 8:231–397.44. Carpenter KJ. The life and times of Atwater, W.O. (1844–1907) J Nutr 1994; 124:S1707–S1714.45. Billings JS, Eliot CW, Farnam HW, Greene JL, Peabody FG. The liquor problem: a summary of
investigations conducted by the Committee of Fifty, 1893–1903. Boston: Houghton Mifflin Co.(1905) (see Pauly, ref. 23).
46. Mitchell HH. The food value of ethyl alcohol. J Nutr 1935; 10(3):311–335.47. Colditz GA, Giovannucci E, Rimm EB, et al. Alcohol intake in relation to diet and obesity in women
and men. Am J Clin Nutr 1991;54:49–55.48. Williamson DF, Forman MR, Binkin NJ, Gentry EM, Remington PL, Trowbridge FL. Alcohol and
body weight in United States adults. Am J Public Health 1987;77:1324–1330.49. Hellerstedt WL, Jeffery RW, Murray DM. The association between alcohol intake and adiposity in
the general population. Am J Epidem 1990;132(4):594–611.50. Pirola RC, Lieber CS. The energy cost of the metabolism of drugs, including ethanol. Pharmacology
1972;7:185–196. See also: Hypothesis: energy wastage in alcoholism and drug abuse: possible roleof hepatic microsomal system Am J Clin Nutr 1976; 29:90–93.
51. Suter PM, Hasler E, Vetter W. Effects of alcohol on energy metabolism and body weight regulation:is alcohol a risk factor for obesity? Nutr Rev 1997; 55:157–171.
52. Schutz Y. Alcohol calories count the same as other calories. Int J Obesity 1995;19(Suppl 2):12,13.53. Westerterp KR. Alcohol calories do not count the same as other calories. Int J Obesity 1995;
19(Suppl 2):14,15.54. Lands WEM. Alcohol and energy intake. Am J Clin Nutr 1995; 62(Suppl):1101S–1106S.55. Lands WEM. Alcohol, calories, and appetite. Vitamins Hormones 1998; 54:31–49.56. Camargo CA, Vranizan KM, Dreon DM, Frey-Hewitt B, Wood PD. Alcohol, calorie intake, and adi-
posity in overweight men. J Am College Nutr 1987; 6(3):271–278.57. deCastro JM, Orozco S. Moderate alcohol intake and spontaneous eating patterns of humans:
evidence of unregulated supplementation. Am J Clin Nutr 1990; 52:246–253.58. Jaques PF, Sulsky S, Hartz SC, Russell RM. Moderate alcohol intake and nutritional status in non-
alcoholic elderly subjects. Am J Clin Nutr 1989; 50:875–883.59. Jones BR, Barrett–Connor E, Criqui MH, Holdbrook MJ. A community study of calorie and nutri-
ent intake in drinkers and nondrinkers of alcohol. Am J Clin Nutr 1982; 35;135–139.60. Tremblay A, St–Pierre S. The hyperphagic effect of a high–fat diet and alcohol intake persists after
control for energy density. Am J Clin Nutr 1996; 63(4):479–482.61. Mattes RD. Dietary compensation by humans for supplemental energy provided as ethanol or car-
bohydrate in fluids. Physiol Behav 1996; 59:179–187.

Chapter 33 / Alcohol 829
62. Rose D, Murphy SP, Hudes M, Viteri FE. Food energy remains constant with increasing alcoholintake. J Am Diet Assoc 1995; 95(6):698–700.
63. Rumpler WV, Rhodes DG, Baer DJ, Conway JM, Seale JL. Energy value of moderate alcohol con-sumption by humans. Am J Clin Nutr 1996; 64(1):108–114.
64. Pauly PJ. Is liquor intoxicating? Scientists, prohibition, and the normalization of drinking. Am JPublic Health 1994; 84:304–313.
65. Lieber CS. Alcohol, liver and nutrition. J Am Coll Nutr 1991; 10:602,603.66. Derr RF. The quantities of nutrients recommended by the NRC abate the effects of a toxic alcohol
dose administered to rats. J Nutr 1989; 119:1228–1230.67. Lieber CS, DeCarli LM. Recommended amounts of nutrients do not abate the toxic effects of an
alcohol dose that susteains significant blood levels of ethanol. J Nutr 1989; 119:2038–2040.68. Rao GA, Riley DE, Larkin EC. Dietary carbohydrate stimulates alcohol diet ingestion, promotes
growth and prevents fatty liver in rats. Nutr Res 1987; 7:81–87.69. Porta EA. Symposium on nutritional factors and oxidative stress in experimental alcoholic liver
disease, J Nutr 1997; 127:893S–915S.70. Lands WEM Cellular signals in alcohol-induced liver injury: a review. Alcoholism, Clin Exper Res
1995; 19:928–938.71. Meagher EA, Barry OP, Burke A, et al. Alcohol-induced generation of lipid peroxidation products
in humans. J Clin Invest 1999; 104 (6):805–813.72. Rigamonti C, Mottaran E, Reale E, et al. Moderate alcohol consumption increases oxidative stress
in patients with chronic hepatitis C. Hepatology 2003; 38:42–49.73. Goldfinger TM. Beyond the French paradox: the impact of moderate beverage alcohol and wine con-
sumption in the prevention of cardiovascular disease. Cardiol Clin 2003; 21(3):449–457.74. Blanco-Colio LM, Valderrama M, Alvarez-Sala LA, et al. Red wine intake prevents nuclear factor-
kappaB activation in peripheral blood mononuclear cells of healthy volunteers during postprandiallipemia. Circulation 2000; 102(9):1020–1026.
75. Teragawa H, Fukuda Y, Matsuda K, et al. Effect of alcohol consumption on endothelial function inmen with coronary artery disease. Atherosclerosis 2002; 165:145–152.
76. Caccetta RAA, Burke V, Mori TA, Beilin LJ, Puddey IB, Croft KD. Red wine polyphenols, in theabsence of alcohol, reduce lipid peroxidative stress in smoking subjects. Free Radical Biol Med2001; 30:636–642.
77. Zilkens RR, Rich L, Burke V, Beilin LJ, Watts GF, Puddey IB. Effects of alcohol intake on endothe-lial function in men: a randomized controlled trial. J Hypertension 2003; 21:97–103
78. Albert MA, Glynn RJ, Ridker PM. Alcohol consumption and plasma concentration of C-reactiveprotein. Circulation 2003; 107:443–447.
79. Murray CJL, Lopez AD, eds. The Global Burden of Disease: a comprehensive assessment of mor-tality and disability from diseases, injuries, and risk factors in 1990 projected to 2000. Cambridge,Harvard University Press, 1996
80. Rehm J, Room R, Monteiro M, et al. Alcohol as a risk factor for global burden of disease. Eur AddictRes 2003; 9:157–164.
81. Pauly PJ. How did the effects of alcohol on reproduction become scientifically uninteresting? J HistBiol 1996; 29:1–28.
82. Jones KL, Smith DW. Recognition of the fetal alcohol syndrome in early infancy. Lancet 1973;2:999–1001.
83. Mennella JA, Garcia-Gomez PL. Sleep disturbances after acute exposure to alcohol in mothers’milk. Alcohol 2001; 25(3):153–158.
84. Mennella JA. Regulation of milk intake after exposure to alcohol in mothers’ milk. Alcohol Clin ExpRes 2001; 25(4):590–593.
85. Mennella JA, Garcia PL. Children’s hedonic response to the smell of alcohol: effects of parentaldrinking habits. Alcohol Clin Exp Res 2000; 24(8):1167–1171.
86. Bachmanov AA, Kiefer SW, Molina JC, et sl. Chemosensory factors influencing alcohol perception,preferences, and consumption. Alcohol Clin Exp Res 2003; 27(2):220–231.
87. Britton A, Nolte E, White IR, et al. A comparison of the alcohol-attributable mortality in fourEuropean countries. Eur J Epidemiol 2003; 18:643–651.
88. Dawson DA. Correlates of past-year status among treated and untreated persons with former alco-hol dependence: United States, 1992. Alcohol Clin Exp Res 1996; 20:771–779.
89. Project MATCH Research Group. Matching alcoholism treatments to client heterogeneity: ProjectMATCH three-year drinking outcomes. Alcohol Clin Exp Res 1998; 22(6):1300–1311.

830 Part IX / Critical Issues for the 21st Century
90. Thakker KD. An overview of health risks and benefits of alcohol consumption. Alcohol Clin ExperRes 1998; 22:285S–298S.
91. Lands WEM, Pawlosky RJ, Salem N. Alcoholism, Antioxidant Status, and Essential Fatty Acids. In:Papas AM, ed. Antioxidant Status, Diet, Nutrition and Health CRC Press, Boca Raton, FL, 1998, pp.299–344.
92. Ringborg U. Alcohol and cancer risk. Alcohol Clin Exp Res 1998; 22;323S–328S.93. Thun MJ, Peto R, Lopez AD, et al. Alcohol consumption and mortality among middle-aged and
elderly U.S. adults. N Engl J Med 1997; 337:1705–1714.94. Gronbaeck M, Becker U, Johansen D, Tonnesen H, Jensen G, Sorensen TIA. Population based
cohort study of the association between alcohol intake and cancer of the upper digestive tract. BritMed J 1998; 317:844–848.
95. Truelsen T, Gronbaeck M, Schnohr P, Boysen G. Intake of beer, wine, and spirits and risk of stroke.Stroke 1998; 29:2467–2472.
96. Rothman KJ. Research and prevention priorities for alcohol carcinogenesis. Environ Health Perspect1995; 103(Suppl 8):161–163.
97. Zumoff B. Editorial: the critical role of alcohol consumption in determining the risk of breast can-cer with postmenopausal estrogen administration. J Clin Endocrinol Metab 1997; 82:1656–1658.
98. Ginsburg ES, Gao X, Walsh BW, et al. The effects of ethanol on the clearance of estradiol in post-menopausal women. Fertil Steril 1995; 63:1227–1230.
99. Ginsburg ES, Mello NK, Mendelson JH, et al. Effects of alcohol ingestion on estrogens in post-menopausal women. J Am Med Assoc 1996; 276:1747–1751.
100. Marmot MG, Elliott P, Shipley MJ, et al. Alcohol and blood pressure: the INTERSALT study.Br Med J 1994; 308(6939):1263–1267.
101. Rosenqvist M. Alcohol and cardiac arrhythmias. Alcohol Clin Exp Res 1998; 22:318S–322S.102. Camargo CA, Hennekens CH, Gaziano JM, Glynn RJ, Manson JE, Stampfer MJ. Prospective study of
moderate alcohol consumption and mortality in US male physicians. Arch Int Med 1997; 157:79–85.103. McElduff P, Dobson AJ. How much alcohol and how often? Population based case-control study of
alcohol consumption and risk of a major coronary event. Br Med J 1997; 314:1159–1164.104. Svarsudd K. Moderate Alcohol consumption and cardiovascular disease: Is there evidence for a pro-
tective effect? Alcohol Clin Exp Res 1998; 22:307S–314S.105. Moore TJ. Prevention. In: Heart Failure: A Critical Inquiry into American Medicine and the
Revolution in Heart Care Random House, New York, 1989, pp. 25–95.106. Lands WEM. Primary prevention in cardiovascular disease: moving out of the shadows of the truth
about death. Nutr Metabol Cardiovasc Dis 2003; 13:154–164.107. Balkau B, Eschwege F, Eschwege E. Ischemic heart disease and alcohol-related causes of death: a
view of the French paradox. Ann Rev Epidemiol 1997; 7:490–497.108. Zureik M, Ducimetiere P. High alcohol-related premature mortality in France: concordant estimates
from a prospective cohort study and national mortality statistics. Alcohol Clin Exp Res 1996;20(3):428–433.
109. Vogel RA. Alcohol, heart disease, and mortality: a review. Rev Cardiovasc Med 2002; 3(1):7–13.110. Gordis E. Alcohol research and social policy: an overview. Alcohol, Health Res World 1996;
20:208–212.111. Hilton ME. An overview of recent findings on alcoholic beverage warning labels. J Pub Policy
Market 1993; 12:1–9.112. Toomey TL, Rosenfeld C, Wagenaar AC. The minimum legal drinking age: history, effectiveness,
and ongoing debate. Alcohol, Health ResWorld 1996; 20:213–218.113. Allebeck P, Rydberg U. Risks and protective effects of alcohol on the individual. Alcohol Clin Exp
Res 1998; 22:269S.114. Dufour MC. Risks and benefits of alcohol use over the life span. Alcohol Health Res World 1996;
20:145–151.115. Taubes G. The (political) science of salt. Science 1998; 281:898–907.116. McCarron DA. Diet and blood pressure—the paradigm shift. Science 1998; 281:933,934.117. National Cholesterol Education Program. Report of the National Cholesterol Education Program
Expert Panel on Detection, Evaluation, and Treatment of High Blood Cholesterol in Adults. Arch IntMed 1988; 148:36–69.
118. Consensus Development Panel. Lowering blood cholesterol to prevent heart disease. JAMA 1985;253:2080–2086.

Chapter 33 / Alcohol 831
119. Ravnskov U. The Cholesterol Myths. New Trends Publishing, Washington, DC, 2000.120. Ornish D, Scherwitz LW, Billings JH, et al. JAMA Intensive Lifestyle Changes for Reversal of
Coronary Heart Disease JAMA 1998; 280; 2001–2007.121. Lands WEM, Culp BR, Hirai A, Gorman R. Relationship of thromboxane generation to the aggre-
gation of platelets from humans: effects of eicosapentaenoic acid. Prostaglandins 1985; 30:819–825.122. Ridker PM, Manson JE, Buring JE, Goldhaber SZ, Hennekens CH. The effect of chronic platelet
inhibition with low–dose aspirin on atherosclerotic progression and acute thrombosis: clinical evi-dence from the Physicians’ Health Study. Am Heart J 1991; 122(6):1588–1592.
123. Lands WEM. Functional foods in primary prevention or nutraceuticals in secondary prevention?Current Topics Nutraceutic Res 2003; 1(2):113–120.


From: Preventive Nutrition: The Comprehensive Guide for Health Professionals, Third EditionEdited by: A. Bendich and R. J. Deckelbaum © Humana Press Inc., Totowa, NJ
833
34 Influence of Medicationon Nutritional Status
Joseph I. Boullata
KEY POINTS
● Drug-induced changes to nutritional status may be considered a subclass of adversedrug effects.
● Medication may alter food intake, as well as cause weight loss or weight gain.● Medication may alter macronutrient digestion, absorption, metabolism, and excretion.● Medication may alter micronutrient absorption, distribution, metabolism, and excretion.● Significant drug-induced alterations in nutritional status can be prevented or managed by
selecting a therapeutic alternative without the unwanted nutritional effect or providingsupplementation, in the case of nutrient losses.
1. INTRODUCTION
Preventive medicine includes nutritional approaches for promoting health and forpreventing, delaying, or modifying disease processes. Avoiding poor nutritional statusis one aspect of this that has wide ranging benefits to health outcomes. Recognition ofrisk factors for poor nutritional status is vital to this goal. Alterations in nutritional statusmay occur for a number of reasons, one of which is the result of drug–nutrient interactions.This chapter provides a perspective for clinicians on the potential changes in nutritionalstatus resulting from medication use.
1.1. Medication UseUse of medicines is a part of daily life for many people. It is estimated that about
80% of American adults use medication (1). It should not come as a surprise that somany people use pharmaceutical products, whether prescription drugs, over-the-countermedicines, or natural health/dietary supplement products. However, aside from thepromise of benefit, these products each have their own set of potential adverse effectsresulting from the active ingredients and excipients—whether dose-related or not.Many of these adverse drug effects can impact on nutritional status. Interestingly, someof the well-recognized adverse effects of individual drugs occur as a direct result of

834 Part IX / Critical Issues for the 21st Century
alterations in nutritional status. So, in fact, drug-induced changes in nutritional statusmay be considered as a subclass of adverse drug effects. Given the enormous economicimpact of drug use and the untoward consequences of this use, it is amazing that moreattention is not regularly paid to their impact on nutritional status. Of the many issuesinfluencing patient safety within the health care system that were catalogued in a recentnational report, drug–nutrient interactions were not included among them (2).
1.2. Interactions Between Drugs and NutrientsThere is a wide universe of potential drug–nutrient interactions that occur through var-
ious mechanisms, some of which can be clinically significant. A drug–nutrient interactioncan be defined as the result of a physical, chemical, physiological, or pathophysiologicalrelationship between a drug and nutrient, multiple nutrients, or food in general (3). Aninteraction is considered significant from a clinical perspective if therapeutic response isaltered or if nutritional status is compromised. Classification of the many interactionsis often mechanistically based, with an identified precipitating factor and an object of theinteraction, providing a management strategy for each (Table 1). Newly identified inter-actions can be categorized using this classification scheme. However, it seems that eventhe many known interactions are not well recognized by many health care providers or areonly understood in more limited fashion (e.g., timing of drug administration with mealsor specific foods). Based on a survey of health care providers, knowledge of a commondrug–nutrient interaction was poor (4). Few health care professionals even provide coun-seling about interactions to the majority of their patients (5). Given the number of indi-viduals with poor nutritional status, whether protein-calorie malnourished or obese or withspecific deficits of individual nutrients (e.g., hypokalemia), each interaction may impactthe potential safety and efficacy of commonly used medications.
The breadth of this topic is not only overlooked by some clinicians but also by reg-ulatory agencies. This is particularly true in terms of identifying the nutritional conse-quences of each newly approved drug beyond simply the effect on appetite or bodyweight. Several less well-acknowledged alterations in nutritional status do exist. In fact,some side effects of medication may be the result of an imbalance of one or more nutri-ents. Such an effect, if clinically manifest, may be just as likely to be initially identifiedby nutrition specialists as a nutritional disorder as it would a drug side effect. The inter-ference of drugs with nutritional status or status of a specific nutrient is often less read-ily evident clinically and more insidious in developing. Although not all drug-inducedchanges to nutritional status are overtly manifest (particularly with chronic medicationuse), even marginal deficits or tissue-specific deficits may have profound clinicaleffects (6). Non-nutrient supplements (e.g., herbal medicines) have the same potentialto alter nutritional status and nutrient disposition as other medicines (7).
The impact of select drugs on nutritional status has been recognized for many years, par-ticularly as synthetic drug development grew (8,9). A few circumstances account for mostclinically common drug-induced changes to nutritional status. These include drugs that causesignificant gastrointestinal (GI) effects, including anorexia and malabsorption, or are nutri-ent antagonists by virtue of similar chemical structure and function as well as nutrients thatare involved in multiple pathways. Anti-vitamin attributes have been ascribed to a numberof drugs, yet even this may be the result of one or more different factors, including decreasedabsorption, reduced conversion to active form, interference with vitamin-dependent path-ways, or increased vitamin clearance. An interaction is more likely with nutrients not stored

Chapter 34 / Medication and Nutrition 835
in great amounts (e.g., thiamin); those with complex absorption (e.g., vitamin B12), distri-bution (e.g., zinc), and metabolism (e.g., vitamin B6) characteristics; or those required forrapidly dividing tissues (e.g., folic acid, iron). Nutritional effects involving a few drugclasses have been more frequently described. This is partly results from their chronic usein individual patients as a result of being in clinical use for decades or from their obviousimpact on the GI tract. These drugs include antimicrobial agents (especially those used tomanage tuberculosis), anticonvulsants, antineoplastics, and cardiovascular agents. Mostother drug classes are likely implicated as well, but the drug approval process does notrequire studies to evaluate short- or long-term influences on nutritional status.
1.3. Clinical ImplicationsAdverse drug effects may not be attributed to a nutrient deficit but rather to the drug
itself or the disease states being managed. An impact on the status of a nutrient may beclinically subtle, typically not resulting in a classic deficiency syndrome. Impact ofmedication in causing subclinical states of nutrient deficits is not as well appreciated asclassic deficiencies. The lack of a wider recognition of drug-induced nutritional deficitsmay partly relate to the inadequate preparation of some clinicians for identifying mal-nutrition, especially poor micronutrient status. Therefore, sensitive and specific para-meters for nutrient status need to be assessed regularly. In fact, alterations should beidentified long before that degree of deficit is manifest, as the goal is to maintain orimprove nutritional status. Ideally, every clinician should make an attempt to identifyor predict drug–nutrient interactions to maximize patient outcome.
Other factors may increase the risk of drug-induced malnutrition. The clinicalinfluence of a drug on nutritional status is not necessarily a fixed property of thedrug itself but involves patient-related variables as well. The latter would includephysiologically altered nutrient requirements, pharmacogenetic variability, a mar-ginal diet, malabsorption, a chronic or catabolic disease, altered organ function, andconcurrently ingested substances or environmental exposures. In other words, clini-cally significant outcomes of an interaction are patient-specific, not necessarily onlydrug-specific. All this presumes that nutritional status of patients receiving medicationis regularly assessed in all health care settings (10). A complete drug history is alsorequired to identify all pharmacologically active substances administered—whether
Table 1Approach to Drug–Nutrient Interactions
Precipitating factor Object of interaction Clinical management strategy
Altered nutritional status Drug Aim to minimize treatmentfailure or drug toxicity
Food or food component Drug Aim to minimize treatmentfailure or drug toxicity
Specific nutrient Drug Aim to minimize treatmentfailure or drug toxicity
Drug Nutritional status Aim to maintain or improvenutritional status
Drug Specific nutrient Aim to maintain or improvestatus of individual nutrient

836 Part IX / Critical Issues for the 21st Century
prescription drugs, over-the-counter medicine, or dietary supplements. The latter groupincludes nutrient supplements, herbals and other botanicals, and non-nutrient/nonherbalsupplements. A complete medical history and physical examination should be per-formed to identify diseases also associated with reduced nutritional status.
Recommendations to patients for improving or altering dietary patterns need to takeinto account any influence that this may have on medication use. Evidence-based nutri-tional recommendations should help prevent adverse drug reactions and maximize drugbenefit. For example, this can include taking drugs appropriately with or without food,altering the drug dose in states of malnutrition, and avoiding or supplementing specificnutrients for specific medication regimens. Significant drug-induced alterations innutritional status can be prevented or managed by selecting a therapeutic alternativewithout the unwanted nutritional effect or providing supplementation in the case of nutri-ent losses. However, data supporting the use of nutrient supplementation are still limitedin most cases. Individuals using pharmaceutical products must ensure that their dietaryhabits and nutrient intakes reduce their risk of adverse drug effects.
This chapter is not intended to be exhaustive; additional lists of drug-induced nutrientdepletions and more in-depth discussions are available (11–13). Special mention needs tobe made of examples that are not discussed further in the chapter. The many potential meta-bolic derangements (macro- and micronutrient) associated with the use of parenteral nutri-tion, a pharmaceutically complex prescription drug preparation after all, are well-recognized(14). Ethanol is another drug responsible for significant alterations in nutritional status.Although this chapter does not address these, it should be remembered that use of ethanolincreases the risk of the drug-induced nutritional deficits discussed in this chapter. Goodreviews of the effect of alcohol consumption on nutritional status can be found elsewhere(15,16; see Chapter 33). Along these lines, it should be kept in mind that toxic ingestions(beyond the therapeutic use) of medications and related substances can also cause nutrientderangements. For example, acetaminophen overdose depletes glutathione and its rate-limiting amino acid cysteine, isopropyl alcohol ingestion causes hypoglycemia, and ethyleneglycol causes hypocalcemia and depletes several B vitamins as well (17).
2. MECHANISMS OF ALTERED NUTRITIONAL STATUS
Several mechanisms exist to explain drug-induced changes to nutritional status.These may involve influences on food intake, digestion, and absorption. Additionalmechanisms involve influences on nutrient distribution, metabolism, and excretion.More than one mechanism can be in play for a given drug and nutrient. For example,the anti-epileptic agent carbamazepine decreases biotin status both by inhibiting intesti-nal absorption and accelerating metabolism to inactive catabolites (18,19). A single nutri-ent may be influenced by more than one drug through a combination of mechanisms. Forexample, folate status may be affected by drugs that impair its absorption, alter proteinbinding in the circulation, block release from tissue sites, or enhance hepatic metabolism(20). A single drug can have an influence on more than one nutrient through a single ormultiple mechanisms. For example, by inducing a general malabsorption, colchicineincreases loss of fat, nitrogen, sodium, and potassium in the feces with decreases inabsorption of xylose, vitamin B12, and, possibly, some carotenoids (21). Corticosteroids,which are used in a wide variety of disorders, offer a further example. They have beennoted to reduce levels of several nutrients (e.g., folate, vitamin B12, selenium, andcalcium) (22,23). However, consideration needs to be given to the role played by the

Chapter 34 / Medication and Nutrition 837
pathophysiology that originally prompted the use of the drug (e.g., corticosteroids).This is not always evaluated in published reports, which makes it less clear whetherthe mechanism of altered nutritional status is exclusively drug-induced. Other factors,including poor dietary habits and lifestyle, may increase the risk of illness and subse-quently require medication use; this topic is rarely discussed but is potentially relevant.The exact mechanism of altered nutritional status is not always fully understood. Forexample, the use of kava (Piper methysticum) may cause a yellowing of the skin that isunrelated to the hepatotoxic potential of this herbal medicine. It has been suggested thatthis may occur because of a niacin deficiency, although the mechanism remains unclear(24). Of course, the influence of some drugs on nutritional status is the primary thera-peutic action sought clinically (e.g., orlistat decreases fat absorption, pamidronate lowersserum calcium, warfarin reduces vitamin K availability).
Aside from appreciating the mechanism of an interaction, the clinical significance ofmany drug-induced alterations to nutritional status is described less frequently thanmost clinicians desire. This alone limits the ability to make recommendations, such assupplementation of the affected nutrient(s). Clinical judgment is needed in combinationwith available evidence to assess individual risk from an interaction.
The impact of drugs on nutritional status is not always predicted from animal stud-ies and, as mentioned previously, is not routinely assessed during the drug approvalprocess. Given the poor likelihood that each new drug will be evaluated for nutritionaleffects prior to marketing, clinicians should operate on the assumption that any vari-ability in a patient’s nutritional status is the result of a drug-induced change, unlessproven otherwise. Manifestations typically are acute for a drug that interferes with anutrient’s metabolic activities, compared to interactions with nutrient intake, absorp-tion, or clearance, which are expected to take longer to manifest. The biochemical, func-tional, or clinical manifestations depend on the degree of nutrient deficit (or excess) andthe tissue compartment affected. Naturally, gender, age, and genetic factors all need tobe considered. There is increased risk if the effects on nutritional status are additive andthe result of chronic medication use or if the patient has marginal nutritional status tobegin with. Risk to a patient from acute use of a single drug is expectedly less (espe-cially in the face of adequate nutritional status) than that of an elderly patient with poornutritional status requiring long-term use of one or more medications that impact on thestatus of a nutrient. Indeed, for many nutrients, subclinical deficits (i.e., nonclassic defi-ciency) may still be significant even when not recognized or identified.
There is no single best way to present information on drug-induced changes to nutritionalstatus; for example, it could be described by drug class (If I take this drug what might happen?)or by nutrient class (If I have this deficit, what drug might have caused it?). Varying degreesof drug-induced changes in nutritional status are described in the following sections on foodintake and digestion. This is followed by sections on the influence of drugs on macronutri-ent, vitamin, and mineral absorption, distribution, metabolism, and excretion.
3. FOOD INTAKE
A wide number of medications have the potential to alter food intake, therebyincreasing the risk for poor nutritional status. Table 2 provides a list of select drugs thatinfluence food intake. In addition to drugs with an obvious impact on appetite control,there are those that influence GI tract structure and function and some with an even lessapparent role.

838 Part IX / Critical Issues for the 21st Century
Table 2Select Drugs That Alter Food Intake
Appetite stimulantsAntihistamines MirtazapineBenzodiazepines Oral hypoglycemicsCannabinoids OxandroloneClozapine PhenothiazinesCorticosteroids Tricyclic antidepressantsInsulin Valproic acidLithium
Appetite suppressantsAmphetamines LevodopaAnticonvulsants MethylphenidateAntineoplastics MetronidazoleAtomexetine NaloxoneBethionol NicotineCaffeine PerhixilineDacarbazine PimozideDigoxin SibutramineEpirubicin TemozalomideEtoposide ThiazidesFenfluramine TrazadoneFluoxetine ZonisamideFluvoxamine
DrowsinessAntidepressants AntipsychoticsAnti-emetics BenzodiazepinesAntihistamines Skeletal muscle relaxants
DepressionAnticonvulsants ClonidineBarbiturates DigoxinBenzodiazepines Levodopaβ-blockers Neuroleptics
Dry mouthAmantadine Decongestants OxybutyninAntihistamines Didanosine PentoxifyllineAntipsychotics Diuretics ProcainamideAtropine Flecainide PropanthelineBenzodiazepines Flunitrazepam RimantadineBrompheniramine Granisetron SelegileneCaptopril Isoniazid SertralineCetirzine Mesalamine TrazadoneClonidine Molindone Tricyclic antidepressantsCyclopentolate Nizatidine TrimethobenzamideCyproheptadine Ondansetron
Altered taste and smellAngiotensin-converting
enzyme inhibitors Chlorpromazine MetronidazoleAcetazolamide Clarithromycin NifedipineAlbuterol Clofibrate Opioid analgesics
(Continued)

Chapter 34 / Medication and Nutrition 839
Drugs that alter vision or gait may limit the ability to gather food and preparemeals. Excessive hypotension and dizziness caused by medication may also restrictthis ability. Cognitive disturbances caused by medication (e.g., psychotropics, cloni-dine, metoclopramide) also may lead to reduced food intake and subsequent weightloss. Consideration should even be given to drug-induced tremor as a cause for reduc-ing food intake. Although unrelated to pharmacological effect, the impact (particularlyfor chronic medications) that out-of-pocket drug expense has on food choice compro-mise cannot be overlooked, especially in the elderly (25).
Given the wide range of innervating neural pathways that affect the function of theGI tract, it is easy to appreciate that medication with pharmacological effects on cholin-ergic, histaminic, dopaminergic, opiate, serotonergic, or benzodiazepine receptors caninfluence GI function. Any drug that causes altered taste, dry mouth, oral pain, anorexia,nausea, vomiting, altered gastric emptying, diarrhea, or constipation can lead toimpaired oral intake and nutrient absorption, which increases the risk for malnutrition.
Change in taste perception can have a significant influence on subsequent dietary intake.Medications can cause loss of taste (aguesia), distortion of taste (dysguesia), decreased
Table 2 (Continued)
Allopurinol Digoxin PenicillamineAmphotericin B Diltiazem PentamidineAntihistamines Diuretics PhenytoinAspirin Ethambutol PropranololAzathioprine Flurazepam Rifabutinβ-Lactam antibiotics Gold QuinidineBaclofen Griseofulvin SelegileneBismuth salts Iron SulfasalazineBromocriptine Levodopa ThioridazineCarbamazepine LithiumChloral hydrate Metformin
DysphagiaAldendronate IronAnticholinergic drugs Lidocaine (local)Antineoplastics NSAIDsAntipsychotics Neuromuscular blockersCentral nervous system depressants PotassiumCorticosteroids QuinidineImmunosuppressants Salicylates
Delayed gastric emptyingAnticholinergics NitratesCaffeine OpiatesCalcium channel blockers OxybutyninClonidine TheophyllineDicyclomine Tricyclic antidepressantsIron VerapamilMeperidine
Increased gastric emptyingBethanachol MetoclopramideErythromycin MisoprostolLaxatives

840 Part IX / Critical Issues for the 21st Century
sense of taste (hypoguesia), and even gustatory hallucination (phantoguesia) (13,26,27).Xerostomia as a result of inhibited saliva production (most commonly a result of drugs withanticholinergic properties) can also alter taste sensation. The list of drugs that cause drymouth and altered taste sensation includes amitriptyline, bumetanide, cetirizine, didano-sine, diphenhydramine, granisetron, imipramine, isoniazid, loratidine, mesalamine, nor-triptyline, ondansetron, oxybutinin, pentoxifylline, selegiline, sertraline, trazodone, andtrimethobenzamide (13,27). Metered-dose inhalers that deliver medication allow somedrug to precipitate in the oropharynx. This may also directly alter taste and reduce foodintake. In the case of corticosteroid inhalers, the potential exists for fungal overgrowth inthe region that also can reduce food intake. Oropharyngeal candidiasis may occur withchronic use of broad-spectrum antibiotics as well. If the causative agent cannot be discon-tinued or reduced in dose, then use of breath mints, lozenges, and sugarless gum may offerrelief. Oral care regimens should be encouraged for those using metered-dose inhalers, andappropriate treatment should be implemented for candidiasis. If taste disturbances are thedirect result of zinc deficiency, then supplementation of this mineral may benefit the individ-ual (26,28). Cytotoxic drugs can create inflammation of the oropharyngeal mucosal surface.This stomatitis severely curtails food intake because of the pain associated with eating.Additionally, several agents from this group of medications can cause a profound degreeof nausea and vomiting.
Significant nausea may be centrally mediated (e.g., cytotoxic agents, opioid anal-gesics) or the result of local GI irritation. Vomiting may be a reported side effect of manymedications; however, in most patients, continued intolerance to the medication onlyoccurs with a select number of these drugs. Interference with nutritional status isobserved with severe and prolonged emesis, as seen with cytotoxic chemotherapy.Poorly controlled nausea and vomiting significantly impact not only nutritional status butquality of life. Among the antineoplastic agents, some are much more emetogenic thanothers. The most likely to cause emesis—immediate or delayed—include aldesleukin,altretamine, carboplatin, carmustine, cisplatin, cyclophosphamide, dacarbazine, dactino-mycin, daunorubicin, doxorubicin, epirubicin, idarubicin, ifosphamide, irinotecan,lomustine, mechlorethamine, mitoxantrone, pentostatin, and streptozocin (29).
Drugs that increase GI motility are most likely to cause abdominal pain and diarrheathat, if severe or prolonged, will impair nutritional status by reducing intake, limitingabsorption, and increasing nutrient losses. Drugs with direct effects on the GI tractmucosa include the nonsteroidal anti-inflammatory drugs and iron, whereas metoclo-pramide, erythromycin, and cisapride increase motility.
Again, although many drugs are known to cause diarrhea by one or more mechanisms,a recalcitrant few cause the most severe form. Diarrhea may be secretory or osmotic innature; however, in either case, if diarrhea is severe, it will decrease dietary intake and cre-ate fluid, electrolyte, and other mineral losses. Drugs commonly associated with diarrheainclude magnesium-containing antacids, antibiotics, antineoplastics, cholinergics (bethane-chol, neostigmine), colchicine, digoxin, gold salts, mycophenolate mofetil, prostaglandinsincluding misoprostol, quinidine, and the laxatives (30). Some infrequently used antihy-pertensive agents (reserpine, guanethidine, methyldopa, guanabenz, guanadrel) can alsocause diarrhea.
Constipation can be caused most commonly by agents that induce an ileus (e.g., opioidanalgesics, anticholinergics, calcium or aluminum-containing antacids, barium sulfate,calcium channel blockers, clonidine, diuretics, ganglionic blockers, iron preparations,

Chapter 34 / Medication and Nutrition 841
nonsteroidal anti-inflammatory drugs, and polystyrene sodium sulfonate) (30). Drugs withanticholinergic properties (including amitriptyline, atropine, belladonna, benztropine,diphenhydramine, hyoscyamine, imipramine, ipratropium, isopropamide, olanzapine,oxybutynin, procainamide, scopolamine, trihexyphenidyl, and zotepine) can reduceGI motility.
Weight loss has been associated with a number of medications beyond those that causeGI dysfunction. Decreased food intake can occur as a result of primary appetite suppres-sion. Most of these are drugs that stimulate the nervous system centrally and peripherallyand include the amphetamines, caffeine, methylphenidate, and theophylline. Intake mayalso be reduced by secondary effects of medication. Other agents that can produce ananorexic effect include the antihistamines, bethionol, dacarbazine, epirubicin, etoposide,fenfluramine, fluoxetine, fluvoxamine, levodopa, naloxone, nicotine, perhixiline, pimozide,sibutramine, temozalomide, trazodone, and zonisamide. Other causes of weight loss stillneed to be ruled out in patients using any of these medications.
Numerous drugs are associated with weight gain. This is most commonly reportedwith psychotropic medications, which may reinforce negative self-images held by somepatients (31). These drugs include amitriptyline, chlorpromazine, clozapine, imipramine,lithium, mirtazapine, and valproic acid (32). Additional medications include insulin,oxandrolone and other steroids, and β-blockers. Drug-induced weight gain can beaccompanied by the increased risk of morbidity associated with increased body weightfrom other causes. The weight gain from β-blockers results predominantly from accu-mulation of abdominal fat and may be more likely in younger patients and those withβ-adrenergic receptor polymorphisms (33). Weight gain induced by medication may bedifficult to reverse, given that much of it is adipose tissue gain.
4. DIGESTION
The impact of medications on digestive processes is not well-documented. Drugs that areassociated with pancreatitis or that cause damage to specialized cells of the GI tract can play arole in reducing digestion. Many drugs have been reported to cause pancreatitis, but the asso-ciation is strongest for only a few. These include azathioprine/mercaptopurine, didanosine, theestrogens, ethanol, furosemide, metronidazole, pentamidine, the sulfonamides, thiazidediuretics, and valproic acid (34). Maldigestion of fat is most likely to occur before impaireddigestion and absorption of other macronutrients. The effect on digestion is expected to bemost significant if chronic or recurrent bouts of pancreatitis are experienced. Any drug thatcreates a barrier between food particles and digestive components can also reduce digestion.Micronutrient malabsorption associated with changes in the digestive process includes thediminished availability of dietary vitamin B12 in the presence of chronic pharmacologicalacid suppression (35,36). It can be expected that rapid intestinal transit induced by drugsthat increase GI motility also increase the risk for maldigestion and subsequent malab-sorption. This has the potential to influence both macro- and micronutrients.
5. MACRONUTRIENTS
5.1. Absorption and DistributionMedication may cause malabsorption of carbohydrates, fats, and protein. Malabsorption
of carbohydrates and fats is an expected therapeutic effect from the use of acarbose andorlistat, respectively. Both oral neomycin and colchicine are associated with carbohydrate

842 Part IX / Critical Issues for the 21st Century
and fat malabsorption. Neomycin produces the classic example of dose-related drug-induced malabsorption (37). By causing brush-border damage, an enteropathy arises,partly because of disaccharide intolerance and bile acid precipitation. Cytotoxic drugs(e.g., antineoplastics) can damage the absorptive surface of the GI mucosa. For exam-ple, methotrexate can cause macronutrient malabsorption following epithelial celldesquamation. The effects of antimicrobials (which alter the gut flora) on recovery ofcarbohydrates in the colon are not well-investigated.
The direct influence of drug use on the distribution or partitioning of monosaccha-rides, triglycerides and fatty acids, peptides, and amino acids between organs or tissuesis not well-described. Lipodystrophy, including Fat Redistribution Syndrome, associ-ated with the highly active antiretroviral therapy regimens used in patients with humanimmunodeficiecny virus (HIV) infection likely is multifactorial (38).
5.2. MetabolismInterference with metabolism of the macronutrients may result in altered circulating
levels of glucose, cholesterol, triglycerides, or amino acids. Medications with a primarytherapeutic effect of reducing blood glucose, triglycerides, or cholesterol are well-known and not mentioned further. In many cases, metabolic changes are transient butcan be life-threatening.
Several drugs are associated with hyperglycemia or hypoglycemia (Table 3) (39–41).Clinically, hyperglycemia is seen most commonly, caused by corticosteroids, β-blockers,thiazide diuretics, caffeine, calcium channel blockers, cyclosporine, growth hormone, mor-phine, nicotine, octreotide, phenytoin, protease inhibitors, sympathomimetics, tacrolimus,theophylline, and thyroid products (39,41). The atypical antipsychotic agents (aripiprazole,clozapine, olanzapine, quetiapine, risperidone, and ziprasidone) have the potential to causehyperglycemia and may increase the risk of diabetes (42,43). The conventional antispy-chotics also may cause glucose intolerance, although they are more likely related to weightgain than to central glucose dysregulation (43). As expected, hypoglycemia is most oftenassociated with insulin and oral hypoglycemics; however, it is also associated with anabolicsteroids, angiotensin-converting enzyme inhibitors, insulin-like growth factor (IGF)-1,octreotide, salicylates, tetracycline, and warfarin (40,41).
Hyperlipemia is an adverse effect resulting from a number of drugs, including ana-bolic hormones, β-blockers, diuretics, progestins (including those in combination oralcontraceptives), danazol, immunosuppressive agents, and protease inhibitors (44).
Corticosteroids increase endogenous protein catabolism, most likely by increasingactivity of the ubiquitin-proteosome proteolytic pathway (45,46). Protein synthesis canbe increased as a result of growth hormone, anabolic hormones, and IGF-1 withoutimpacting on protein degradation (47). Azotemia as a manifestation of drug-inducedeffect is more likely a result of impairing renal excretory function than interfering withprotein metabolism. Very little information is available regarding the impact of med-ication on specific amino acid absorption, transport, or metabolism. Some significantadverse effects attributed to valproic acid (e.g., hepatotoxicity, teratogenicity) mayinvolve drug-induced alteration in the methionine cycle (48), and oral contraceptivesmay increase tryptophan metabolism (49).
A drug that is used in the management of tardive dyskinesia was found clinically tocause severe lactic acidosis, hypoglycemia, hyperammonemia, and acute hepaticencephalopathy in patients. This set of adverse drug effects was eventually traced not to

Chapter 34 / Medication and Nutrition 843
altered macronutrient disposition but to the induction of pantothenic acid deficiency bythe drug (50). This illustrates the complexity of drug-induced changes in nutrient statusas well as the difficulty in identifying them.
5.3. ExcretionDrug-induced diarrhea or impairment of renal function (reabsorption or concentrat-
ing ability) leads to the unrecoverable loss of macronutrients, possibly with significantconsequences.
6. VITAMINS
A number of drugs can influence vitamin status through effects on absorption, distri-bution, metabolism, and excretion. These drugs are discussed in the following sections,and a list of select changes in vitamin status can be found in Table 4.
Table 3Drug-Induced Changes to Blood Glucose
HyperglycemiaAcetazolamide MinoxidilAtypical antipsychotics Morphineβ2-Agonists Nicotineβ-Blockers OctreotideCaffeine Oral contraceptivesCalcium channel blockers PentamidineCorticosteroids PhenothiazinesCyclosporine PhenytoinCyproheptadine Protease inhibitorsDapsone RifampicinDiazoxide SympathomimeticsGrowth hormone TacrolimusIsoniazid TheophyllineLithium Thiazide diureticsLoop Diuretics Thyroid hormone
HypoglycemiaAngiotensin-converting
enzyme inhibitors Monoamine oxidase inhibitorsAcetaminophen Mebendazoleβ-Agonists Nonselective β-blockersBenzodiazepines OctreotideBiguanides PentamidineCotrimoxazole QuinidineDisopyramide QuinineEthanol SalicylatesFluoxetine SertralineGanciclovir SulfonylureasGatifloxacin TetracyclineInsulin Tricyclic antidepressantsLithium Warfarin

844 Part IX / Critical Issues for the 21st Century
Table 4Drugs That Alter Vitamin Status
Vitamin ACholestyramine Mineral oilEthanol Neomycin
Vitamin DAluminum antacids Isoniazid PhenytoinBisphosphonates Mineral oil RifampicinCholestyramine Orlistat SunscreenCimetidine Phenobarbital
Vitamin EAspirin Gemfibrozil Oral contraceptivesCholestryramine Loop diuretics OrlistatCorticosteroids Mineral oil
Vitamin KAminoglycosides Fluoroquinolones PhenytoinBarbiturates Mineral oil SulfonamidesCephalosporins Oral contraceptives TetracyclinesCholestyramine Orlistat
ThiaminAminoglycosides Fluoroquinolones SulfonamidesCephalosporins Loop diuretics TetracyclinesDigoxin Oral contraceptives TheophyllineEthanol Phenytoin
RiboflavinAminoglycosides Doxorubicin QuinacrineAmitriptyline Fluoroquinolones SulfonamidesCephalosporins Imipramine TetracyclinesChlorpromazine Oral contraceptives
NiacinAminoglycosides Isoniazid Valproic AcidCephalosporins SulfonamidesFluoroquinolones Tetracyclines
PyridoxineAminoglycosides Ethanol Oral contraceptivesCephalosporins Fluoroquinolones PenicillamineCycloserine Hydralazine SulfonamidesDopamine Isoniazid TetracyclinesEstrogen Loop diuretics Theophylline
Vitamin B12
Aminoglycosides Fluoroquinolones PhenytoinAntivirals H2 antagonists Proton pump inhibitorsCephalosporins Metformin SulfonamidesCholestyramine Neomycin TetracyclinesColchicine Oral contraceptives Zidovudine
Folic AcidAspirin Metformin PhenytoinCarbamazepine Methotrexate Potassium-sparing diureticsCelecoxib NSAIDS Primidone
(Continued)

Chapter 34 / Medication and Nutrition 845
6.1. AbsorptionHundreds of transporter genes have been identified in the human genome, many of
which express transport proteins at the GI tract for vitamins, amino acids, peptides, andothers; some of which may also be used by drugs (51). This points to the potential formany drug–nutrient interactions that have not yet been investigated. The degree ofinfluence that a drug may have on the absorption of a micronutrient may depend onmeal composition.
6.1.1. WATER-SOLUBLE VITAMINS
Nutrients with a carrier-mediated intestinal transport system pose a potential risk foran interaction with drugs using the same or associated transport mechanisms for absorp-tion. For example, some P-glycoprotein substrates (e.g., cyclosporine, verapamil, nifedip-ine, daunomycin) may inhibit choline uptake directly or indirectly (52). Additionally,intestinal absorption of biotin can be limited by competition with carbamazepine for thesame transporter (18).
Several drugs that use the folic acid transporters, include sulfasalazine, olsalazine, andmethotrexate, have the potential to decrease absorption of folic acid (53). Methotrexatecompetes with folic acid for absorption and contributes to folate deficiency in patientstreated even with low doses of this drug (54,55). The folate deficit can account for someof the toxicity of the drug, and repletion of folic acid during methotrexate therapy doesnot interfere with drug efficacy (56,57). Triamterene has been reported to cause mega-loblastosis, which may result from competitive inhibition of folic acid absorption(58–60). However, folate depletion does not occur in all patients treated with this diuretic(61). Pancreatic extracts can impair folic acid absorption as well (62). Cholestyramine hasalso been reported to reduce bioavailability of folic acid (63,64).
Many gut microorganisms, including several strains of Bifidobacteria, can synthesizeB vitamins—particularly thiamin, niacin, and folate (65,66)—and can be a source ofseveral vitamins (67). Although the relative importance of bacterially derived B vita-mins or vitamin K to human nutrition remains unclear, antimicrobials, which severelyreduce the number of bacteria that produce these nutrients in the GI lumen, may impactindividuals with borderline status of these vitamins.
Reversible vitamin B12 malabsorption has been described for colchicine—whetheradministered orally or parenterally (21,68). It is not clear whether this represents a specific
Table 4 (Continued)
Cholestyramine Olsalazine PyridoxineCorticosteriods Oral contraceptives SulfasalazineH2 antagonists Pancreatic enzymes Valproic acidIndomethacin Phenobarbital
CholineCyclosporine NifedipineDaunomycin Verapamil
BiotinCarbamazepine PhenytoinPhenobarbital Primidone
Vitamin CHydrocortisone Oral contraceptives Salicylates

846 Part IX / Critical Issues for the 21st Century
inhibition of transport involving the intrinsic factor-vitamin B12 receptor or if it is a resultof general mucosal damage described previously (69,70). Serum vitamin B12 concen-trations remain normal, although given the potentially large body stores of vitamin B12,normality depends on the baseline status of this vitamin and duration of drug treatment(71). Although vitamin B12 malabsorption is identified among individuals with advancedstages of HIV infection, subnormal serum concentrations of this vitamin may occur morefrequently in those receiving zidovudine therapy (72). Biguanides (e.g., metformin) caninduce malabsorption of vitamin B12 in as many as 30% of patients using them (73,74).Although this may be reversible in some patients, it is likely that about half of patientsexhibit depressed secretion of intrinsic factor that may not be reversible (73). Despite thefact that not all patients exhibit clinically symptomatic deficiency, it may be associatedwith increased total serum homocysteine levels (74,75). Furthermore, hematological andespecially neurological complications of vitamin B12 deficiency may not become evidentfor several years.
Histamine-type 2 (H2) receptor antagonists and proton pump inhibitors (now also avail-able without a prescription) significantly decrease dietary vitamin B12 absorption as aresult of decreased cleavage from food in the presence of lower levels of gastric acid andpepsin (35,36,76–78). H2 receptor antagonists may even reduce intrinsic factor secretion(79). This reduction is expected to become clinically evident following at least 1 to 2 yrof therapy, particularly in patients with inadequate intake. Adequate bioavailability fromvitamin B12-containing meals that contain an acidic beverage may account for variabilityof time to present with clinical deficiency (if present) (35,80). As expected, this therapydoes not interfere with the absorption of crystalline vitamin B12 preparations (76).Consideration should be given to vitamin B12 supplementation in patients using thesemedications chronically. Closer examination is needed to determine whether drug-induced increases in gastric pH influence the absorption of other nutrients. For example,β-carotene absorption may be reduced at lower levels of gastric acidity (81).
6.1.2. LIPID-SOLUBLE VITAMINS
Orally administered mineral oil can cause gross malabsorption of nutrients. Lipid-soluble nutrients, including vitamins A, D, E, and K as well as the carotenoids, solubilizein the oil and become trapped within the lumen. Given the rapid GI transit, digestion isincomplete and absorption is reduced, partly because of the rapid transit but also as a resultof the mechanical barrier formed around food particles (82). Probucol and cholestyraminetreatment has been reported to significantly reduce serum β-carotene and lycopene con-centrations (83). By binding bile acids, cholestyramine reduces the absorption of thefat-soluble vitamins (63,84). The potential for developing osteomalacia and bleedingdisorders has been suggested (85). One study suggested no significant effect on vitaminD status in patients using cholestyramine chronically, although bone density measure-ments were not performed, and vitamin D samples were obtained during spring andsummer (86).
By inhibiting lipase action, orlistat not only induces lipid malabsorption but alsodecreases the absorption of fat-soluble vitamins (87). Vitamin E absorption may bereduced by over 50%, whereas vitamin A is not as significantly influenced (88). Vitaminsupplementation may be required for some patients. However, in a study in whichpatients received a lipid-soluble vitamin-containing supplement during treatment withorlistat, serum concentrations of both vitamins D and K were still reduced (89). In fact,

Chapter 34 / Medication and Nutrition 847
the reduction in vitamin D despite supplementation warranted a recommendation forregular monitoring in patients receiving orlistat, even when supplementation is includedas part of the regimen. The absorption of a pharmacological dose of β-carotene may alsobe reduced by about one-third during treatment with orlistat (90).
Hepatic menaquinone (vitamin K) content may be reduced following broad spectrumantibiotic use (91), but it remains to be determined whether this is a cause–effect rela-tionship or if it is clinically significant. In fact, alternative explanations to vitamin Kdeficits have been offered for changes in blood clotting in patients receiving antibiotics,which includes cases of bleeding following cephalosporin use (92).
6.2. Distribution6.2.1. WATER-SOLUBLE VITAMINS
Red blood cell folate levels are lower in patients treated with the anticonvulsants pheny-toin and carbamazepine, but this is not correlated with dietary folate intake (93). Phenytoinmay actually reduce tissue uptake of folate (94). Additionally, thiamin levels in the cere-brospinal fluid are lower in patients being treated with phenytoin compared to controls(95). Uptake of thiamin and its phosphoesters may vary by nervous tissue region duringphenytoin treatment (96). Intracellular loss of thiamin from cardiac cells occurs in the pres-ence of furosemide or digoxin, with reduced ability of the cells to take up the vitamin (97).
Folate binding and serum folate may be reduced in patients who are using aspirin,with a possible rise in urinary folate excretion (98,99). Aspirin also inhibits the uptakeof ascorbic acid into tissues, including white blood cells. This can reduce tissue satura-tion, possibly leading to tissue depletion in patients chronically treated with aspirin andcreating opportunity for greater renal excretion (100–102). The saturable, high-affinityascorbic acid transporter may be inhibited by hydrocortisone (103).
Zidovudine can deplete carnitine in muscle, which is associated with drug-inducedmyopathy (104). Tissue carnitine depletion during treatment with valproic acid maypartly result from an inhibition of tissue uptake (105).
6.2.2. LIPID-SOLUBLE VITAMINS
The mechanism that leads to decreased levels of α-tocopherol, γ-tocopherol, andubiquinone-10 (co-enzyme Q10) that are described with gemfibrozil therapy remainsunclear (106). The dose-dependent reduction in tissue and circulating levels of ubiquinone-10 levels with hydroxy-methylglutaryl-co-enzyme A reductase inhibitors (e.g., lovastatin,pravastatin, simvastatin) likely result from inhibited synthesis (107–109). The lowerubiquinone levels may contribute to impaired mitochondrial function, as determined bylactate-to-pyruvate ratio (110). This may partly explain the drug-induced hepatic dys-function seen with this class of agents. However, the decline may be the natural result oftotal cholesterol decline, which does not require further attention (111). Supplementationwith an appropriate co-enzyme Q-containing product may prevent the depletion, althoughthe clinical value of this intervention has yet to be determined (112).
6.3. Metabolism6.3.1. WATER-SOLUBLE VITAMINS
A number of drugs can interfere with vitamin metabolism. The metabolism of pyri-doxine is impaired by several drugs, including isoniazid, cycloserine, and hydralazine.

848 Part IX / Critical Issues for the 21st Century
The potential for a secondary deficiency of niacin also exists. Reduced circulating lev-els of pyridoxine and thiamin occur more frequently (and in a dose-dependent manner)in patients treated with theophylline than in similar patients not treated with this agent(113–115). Plasma pyridoxal-5′-phosphate appears to be more affected than plasmapyridoxal or urinary 4-pyridoxic acid (115). Theophylline is a pyridoxal kinase antago-nist that, with chronic use, may require concurrent vitamin B6 supplementation to limitnervous system side effects such as tremor (116,117). This differs from the effects ofdopamine, isoniazid, cycloserine, hydralazine, and penicillamine, which form covalentcomplexes with pyridoxal or pyridoxal-5′-phosphate and thereby inhibit pyridoxalkinase (116). The poor availability of this vitamin, which reduces γ-aminobutyric acidlevels in the brain, may play a role in the seizure risk of theophylline at high concen-trations. Hydralazine-induced deficiency of vitamin B6 has been reported to causeneuropathy (118). Through its interaction, hydralazine appears to inhibit a number ofenzymes that require pyridoxal as a cofactor, and this might contribute to the drug’shypotensive effect (119).
Several drugs can impair the conversion of riboflavin to active co-enzymes. Theseinclude chlorpromazine, amitriptyline, imipramine, quinacrine, and doxorubicin (120,121).
A large portion of patients treated with sulfasalazine develop folate deficiency (122).The deficiency may be responsible for severe megaloblastic anemia and severe pancy-topenia, which are associated with the drug (123,124). Although malabsorption mayplay a partial role (as mentioned previously), metabolic abnormalities may also con-tribute to the deficit (125). Several nonsteroidal anti-inflammatory drugs can also inter-fere with the impact of folate metabolism on biosynthesis of other nutrients (125).Although not all patients treated with these agents exhibit a significant decrease inserum folate levels, tissue levels of folate may be reduced in the absence of serum folateabnormalities.
Early descriptions of the influence of oral contraceptives on nutritional statusdescribed decreased levels of several B vitamins and ascorbic acid, whereas levels ofvitamin K increased (126). Compared to nonusers, users of oral contraceptives exhib-ited lower levels of erythrocyte folate and riboflavin, erythrocyte transketolase activity,plasma pyridoxal phosphate, and serum vitamin B12 within a few cycles of initiatingtreatment (127–129). Increases in urinary formiminoglutamic acid in women using oralcontraceptives indicate alteration in folate metabolism (128). Reduced folate status inthese women needs to be addressed prior to discontinuing use of oral contraceptives inthose of childbearing age. The value of folic acid supplementation in women using oralcontraceptives may extend beyond prevention of low circulating levels to prevention orreduction of cervical dysplasia (130,131). Oral contraceptives may increase tryptophanmetabolism through induction of tryptophan oxygenase, and it has been theorized thatthis may lead to a pyridoxine deficiency (49,129). The deficits have been associatedwith clinical symptoms, including depression and anxiety. In such cases of deficiency,vitamin B6 repletion may require doses of at least 40 mg daily to correct levels and clin-ical manifestations (132,133). Clinical manifestations are not universally responsive tovitamin supplementation at pharmacological doses (134). Incomplete evaluation ofbaseline and follow-up status may explain the variability in findings with repletion. Thiswas the case for riboflavin status in oral contraceptive users. Despite several reports ofpoor riboflavin status in users (135,136), when diet is controlled, the need for supple-mentation vanishes (137).

Chapter 34 / Medication and Nutrition 849
Oral contraceptive formulations may also have an influence on ascorbic acid status(138–140). Reductions in plasma and leukocyte levels of this vitamin have been described,although the mechanism remains unclear. Oral contraceptive users appear to have a morerapid turnover of ascorbic acid (141,142). Although increased utilization and metabolismis a possible mechannism for this rapid turnover, it may also be explained by alterationsin tissue distribution (139). It is possible that with adequate dietary intake, no significantchange in ascorbic acid status occurs, and individuals using oral contraceptives wouldrarely be expected to require supplementation (143,144).
Biotin catabolism can occur with chronic use of the anticonvulsants carbamazepine,phenytoin, phenobarbital, and primidone but not with valproic acid (145–147). This can beassociated with increased organic aciduria. The loss of biotin may contribute to the adverseeffects of these anticonvulsants, including poor seizure control. Many patients have diffi-culty tolerating the side effects of carbamazepine, which may partly result from alterednutrient status. Biotin deficiency may be the most significant of the nutrient deficits (seefolate and vitamin D discussions below) that are caused by the anticonvulsants (148).Supplementation of biotin to help control seizure activity awaits clinical trials.
Serum folate levels were noted to be significantly lower in children treated forepilepsy with anticonvulsants (phenobarbital, phenytoin, primidone) (149). Erythrocytefolate levels are also noted to be reduced in patients being treated with phenytoin and/orcarbamazepine but not with valproic acid (93). This was not correlated with dietaryfolate intake. Serum folate levels decrease following initiation of phenytoin therapy.Conversely, folic acid supplementation alters the pharmacokinetics of phenytoin.Because of the two-way interaction between this drug–nutrient pair, administration offolic acid supplementation at the initiation of phenytoin therapy prevents the decreaseof folate and allows quicker achievement of steady-state phenytoin concentrations (150).Negative studies may involve patients who have maintained adequate folate status sincebefore initiation of anticonvulsants (151). Enzyme induction may be involved in thereduction in folate status in patients treated with the anticonvulsants phenobarbital,phenytoin, or carbamazepine compared to controls (152,153). The effects of carba-mazepine may be more severe than the others and are likely dose-related, and supple-mentation with a folic acid analog may improve some cognitive measures in patientstreated with the drug (93,152). Disturbances of folate and thiamin status have been sug-gested as an explanation for adverse neuropsychiatric effects of anticonvulsants(154,155). The effects from carbamazepine may take about 2 mo to manifest (156,157).Outright megaloblastic anemia may be most likely in patients who have a poor folatestatus prior to treatment. Although reductions in folate status have been noted for phe-nobarbital, phenytoin, and carbamazepine, valproic acid treatment does not appear todisturb this vitamin (93). In contrast, carnitine deficiency can occur with valproic acidtreatment (158,159). Reductions are noted in both plasma free carnitine and plasmatotal carnitine concentrations (158,159). A reduction in urinary total and free carnitinehas also been described for chronic valproic acid treatment (160). Valproic acid caninhibit the hepatic synthesis of carnitine and contribute to a deficiency state. It appearsto occur at the level of butyrobetaine hydroxylase but is without direct inhibition, likelya result of reduced α-ketoglutarate levels, which are required as a cofactor (161). Thisdeficit may contribute to the drug’s adverse effects, including hyperammonemia.Management of clinical deficiency required a significant dose of carnitine in children, inwhich case symptoms resolved within 1 wk of the intervention (159). An appropriate

850 Part IX / Critical Issues for the 21st Century
prophylactic dose has not been described. Intravenous administration of L-carnitine isrecommended for patients with valproic acid induced hepatotoxicity or other acute meta-bolic crises associated with carnitine deficits (162). It is suggested that oral L-carnitinesupplementation be considered for patients with symptomatic valproic acid-associatedhyperammonemia or for those with multiple risk factors for valproic acid hepatotoxicityas well as infants and children using valproic acid (162). The recommended oral dose ofL-carnitine is 100 mg/kg daily to a maximum of 2 g daily. Supplementation may not beneeded in patients receiving valproic acid who are otherwise healthy and ingest a regulardiet (163).
6.3.2. LIPID-SOLUBLE VITAMINS
Although not often mentioned, most topically applied sunscreen drug products forma barrier to ultraviolet light that can reduce vitamin D formation in the skin (164).Osteomalacia resulting from altered nutrient availability has been attributed to a num-ber of medications beyond sunscreens. These include cholestyramine, phenytoin, phe-nobarbital, isoniazid, aluminum antacids, bisphosphonates, fluoride, and rifampicin.
Isoniazid is noted to impair both hepatic and renal vitamin D metabolism (165).However, the combination of isoniazid and rifampicin did not appear to alter vitamin Dmetabolism over a 9-mo treatment period (166), despite a study in normal subjects inwhich a brief course of oral rifampicin decreased circulating 25-OH-cholecalciferollevels by more than 50% (167).
The anticonvulsants phenobarbital, phenytoin, and carbamazepine can reduce vita-min D by altering its metabolism through enzyme induction, thereby reducing serum25-OH-cholecalciferol (168–172). Determining bone mineral densities may be useful indetecting bone loss, especially in children receiving anti-epileptic agents (173); how-ever, skeletal changes may be identified only by bone biopsy (174). Patients treatedwith anti-epileptics may have reduced bone mass in the absence of obvious vitamin Ddeficiency (175). Elevated alkaline phosphatase in patients who had low serum 25-hydroxyvitamin D [25(OH)D] while receiving carbamazepine normalized followingvitamin D supplementation (176). However, the use of vitamin D supplementation maynot be warranted in all patients receiving carbamazepine (177). Nevertheless, monitor-ing vitamin D status is justified. Interference with vitamin K metabolism may be alesser factor in side effects of phenytoin and phenobarbital on bone (178). Cimetidineinhibits 25-hydroxylase activity in the liver, thereby reducing vitamin D hydroxylation,but serum 25(OH)D rises within 1 mo of discontinuing therapy (179,180). Effects ofmedication on vitamin D vary, which may partly result from the complexities of for-mation, activation, and metabolism, not to mention polymorphism of the vitamin Dreceptor.
It is unknown whether drugs that increase cytochrome P450 activity alter metabolismof vitamin E isomers or if they alter vitamin status, given the relevance of this enzymesystem to initial steps in vitamin E metabolism (181).
6.4. ExcretionThere appears to be a depletion of folic acid and vitamin B12 with long-term use of
metformin (75). This depletion is also noted with long-term use of diuretics (182).Diuretics may increase renal losses of thiamin that contribute to symptomatic heart fail-ure, although these patients often have poor thiamin intake as well (183). Patients with

Chapter 34 / Medication and Nutrition 851
congestive heart failure are likely to exhibit thiamin deficiency, which not only resolveswith thiamin treatment but also improves left ventricular ejection fraction (184,185).
Chlorpromazine and tricyclic antidepressants (e.g., amitriptyline) increase urinaryexcretion of riboflavin (186,187). It is unclear whether this is the end result of decreasedtissue distribution or the result of reduced metabolic incorporation. Flavin adenine din-ucleotide production from riboflavin may be inhibited by these drugs, given the struc-tural similarities (188). Furthermore, tricyclic antidepressants may inhibit a number ofriboflavin-dependent enzymes (e.g., nicotinamide adenine dinucleotide phosphate oxidase)involved in mitochondrial respiration in cardiac tissue. It has not been established whetherthis inhibition relates to the potential cardiotoxicity of these agents, which is otherwiseattributed to their quinidine-like effect. However, the presence of an abundant amountof ubiquinone can overcome the difficulty posed by inhibition of those enzymes (189).Riboflavin supplementation may be problematic because it may increase the auto-induction of amitriptyline.
7. MINERALS
The following discussion addresses the effect of medication on the status of elec-trolytes and trace elements (Tables 5 and 6). Keep in mind that disorders of sodium con-centration must be evaluated in conjunction with volume status. For example, althougha number of drugs can cause sodium retention (e.g., nonsteroidal anti-inflammatorydrugs, corticosteroids, estrogens), there may be no influence on serum sodium concen-trations because of simultaneous increases in water retention; however, edema mightbecome apparent if retention is significant. Alterations of mineral status may be moreclinically significant in the presence of renal dysfunction.
7.1. AbsorptionOsteomalacia may result from poor mineralization of the bone during deficits of cal-
cium and phosphorus as well as vitamin D. Several drugs, including cholestyramine,phenytoin, phenobarbital, isoniazid, aluminum-containing antacids, and rifampicin,may contribute to this adverse outcome by reducing absorption or altering metabolismand distribution (190).
Aluminum-containing antacids can bind phosphate and fluoride within the gut, therebyreducing their absorption (191). Formation of aluminum phosphates within the GI lumenaccounts for the reduced phosphate absorption in the presence of aluminum-containingmedication (e.g. antacids, sucralfate). In the past, this was used as a therapeutic approachto hyperphosphatemia in patients with chronic kidney disease. Long-term use of thesebinders can exacerbate osteomalacia that results in part from aluminum accumulation aswell as the loss of phosphate and calcium.
Through their reduction of vitamin D, the anticonvulsants can decrease activeintestinal calcium absorption, thereby placing these patients at risk for osteomalacia inthe absence of vitamin D and calcium supplementation (192). Reduction in serum cal-cium, along with increased alkaline phosphatase, has been noted to occur following thefirst month of phenytoin therapy (193). Hypocalcemia may be more severe with phe-nobarbital treatment than with phenytoin or carbamazepine (171). Valproic acidmonotherapy is not associated with hypocalcemia.
Corticosteroids are also associated with loss of bone mass. This partly results fromreduced vitamin D-dependent calcium absorption (194).

852 Part IX / Critical Issues for the 21st Century
Table 5Drugs That Alter Macromineral Status
SodiumHyponatremia
Acetazolamide Fluoxetine OxytocinBromocriptine Furosemide PentamidineCarbamazepine Heparin SertralineCyclophosphamide Hydrochlorothiazide SpironolactoneChlorpropamide MetolazoneClofibrate Morphine
HypernatremiaBumetanide Foscarnet MethoxyfluraneCidofavir Furosemide PhenytoinColchicine Hypertonic Na salts TorsemideDemeclocycline Lithium VinblastineEthacrynic acid
PotassiumHypokalemia
Acetazolamide Ephedrine PiperacillinActivated charcoal Epinephrine Polymyxin BAlbuterol Ethacrynic acid PrednisoloneAmiloride Fluconazole PrednisoneAmmonium chloride Fluoxetine PseudoephedrineAmphotericin B Foscarnet RifampinAmpicillin Furosemide RisperidoneAspirin Ganciclovir RitodrineBetamethasone Gentamicin Saline laxativesBisacodyl Hydrochlorothiazide SalmeterolBumetanide Hydrocortisone SargramostimCarbenicillin Indapamide SirolimusCarboplatin Insulin Sodium bicarbonateCarmustine Isoflurane Sodium lactateChlorothiazide Isoproterenol Sodium polystyreneChlorpropamide Isosorbide mononitrate sulfonateChlorthalidone Itraconazole SorbitolCisplatin Levalbuterol SotalolColchicine Levodopa/Carbidopa TacrolimusCorticosteroids Lithium TerbutalineCorticotropin Methylprednisolone TestosteroneCortisone Metolazone TheophyllineCyanocobalamin Mezlocillin ThiazidesCytarabine Nafcillin TicarcillinDesirudin Nifedipine TobramycinDexamethasone Nylidrin TorsemideDextrose Ondansetron TriamcinoloneDidanosine Oxacillin VincristineDigoxin immune fab PamidronateDobutamine Penicillin GDoxorubicin Phosphates
(Continued)

Chapter 34 / Medication and Nutrition 853
Table 5 (Continued)
HyperkalemiaAmiloride Glucagon PropranololAtenolol Heparin QuinaprilBenazepril Ibuprofen RamiprilCaptopril Indomethacin SpironolactoneCotrimoxazole Metoprolol SuccinylcholineCyclosporine Naproxen TacrolimusDigoxin Pentamidine TriamtereneEnalapril Potassium salts
MagnesiumHypomagnesemia
Albuterol Docusate PenicillamineAmphotericin B Estrogen PentamidineBumetanide Ethacrynic acid PhosphatesCarboplatin Ethanol SargramostimChlorothiazide Foscarnet SulfonamidesCholestyramine Furosemide TacrolimusCisplatin Gentamicin TetracylinesCorticosteroids Hydrochlorothiazide TobramycinCyclosporine Insulin TorsemideDextrose Laxatives Zoledronic acidDidanosine Oral contraceptivesDigoxin Pamidronate
HypermagnesemiaLithiumMagnesium salts
PhosphorusHypophosphatemia
Acetazolamide Cisplatin InsulinAlendronate Demeclocycline MagnesiumAl-Mg antacids Dextrose Osmotic diureticsArginine Digoxin PamidronateCalcitonin Erythropoietin SevelamerCalcium salts Ethanol SirolimusCarmustine Felbamate SucralfateCefotetan Foscarnet TacrolimusCholestyramine Glucagon Zoledronic acid
HyperphosphatemiaAntileukemia regimensPhosphate salts
CalciumHypocalcemia
Alendronate Edetate disodium PamidronateAmphotericin B Estrogens PentobarbitalAntacids Ethacrynic acid PentamidineBleomycin Etidronate PhenobarbitalBumetanide Famotidine PhenytoinCalcitonin Fluocortolone Phosphates
(Continued)

854 Part IX / Critical Issues for the 21st Century
The H2 receptor antagonist cimetidine has the potential to lower serum calcium lev-els after several weeks of therapy without affecting parathyroid hormone (PTH) levels(probably by altering hepatic vitamin D metabolism inhibiting 25-hydroxylase activity)(179,180,195–197). As a result of decreasing gastric acid, this class of agents mayreduce the absorption of dietary iron and place patients at risk for iron deficiency (77).However, this finding was not confirmed in patients with Zollinger-Ellison Syndromewho were chronically treated with H2 antagonists or proton pump inhibitors (198).Managing this risk through iron supplementation may actually lead to decreased drugand iron absorption (at least in the case of cimetidine), because a drug–nutrient com-plex is formed; however, any reduction in drug absorption may not be clinically rele-vant (199,200). Absorption of zinc is also reduced in individuals who are treated withcimetidine (201).
Cholestyramine may negatively influence the status of magnesium, calcium, iron,and zinc (202). The absorption of multivalent cations (e.g., calcium, iron, magnesium)may be reduced by chelating with the tetracycline antibiotics (203). Malabsorption ofsodium and potassium can occur as a result of the GI effects of colchicine and laxatives.
7.2. DistributionIntracellular concentrations of potassium and magnesium are reduced in patients who
are treated with diuretics (204). This may occur without a reduction in the serum con-centration and despite potassium supplementation.
Magnesium depletion can occur in tissues of patients who are receiving thiazide diuret-ics without altering serum magnesium concentrations (205). Magnesium losses are espe-cially important in light of the poor dietary intake of magnesium among adults (206).However, thiazide diuretics do cause calcium retention, which may even improve bonemineral content in chronic users, translating to lower risk of hip fractures (207,207a).
Table 5 (Continued)
Carboplatin Fluoride Polymyxin BCholestyramine Fluorouracil PropylthiouracilCisplatin Foscarnet RanitidineCimetidine Furosemide RituximabCitrate Salts Gentamicin Saline laxativesCodeine Hydrochlorothiazide SargramostimCorticosteroids Interferon Sodium polystyreneCorticotropin Isoniazid SulfonamidesCyclosporine Ketoconazole TerbutalineCytarabine Lansoprazole TetracyclinesDaunorubicin Leucovorin TobramycinDidanosine Magnesium TorsemideDigoxin Mineral oil TriamtereneDiethylstilbestrol Mithramycin Zoledronic acidDoxorubicin Nizatadine
HypercalcemiaAl-Mg antacids Hydrochlorothiazide TheophyllineCalcium salts Lithium Vitamin AGanciclovir Tamoxifen Vitamin D

Chapter 34 / Medication and Nutrition 855
Thiazide diuretics, selective serotonin reuptake inhibitors, and others are more likely tocause hyponatremia in the elderly as a result of impaired water excretion.
By inhibiting bone resorption, bisphosphonates (e.g., alendronate) may cause or exacer-bate uncorrected hypocalcemia in the absence of adequate calcium and vitamin D intake.Patients with tumor-related hypercalcemia can be treated with pamidronate to lower serumcalcium levels. However, hypocalcemia may occur in about one-fourth of patients who aretreated with pamidronate, although they are usually asymptomatic (208).
Estrogen use can cause a decrease in serum magnesium (although not as much as isseen in pregnancy), which has been suggested to result from intracellular shifting(209,210). Low dietary magnesium intake in women using oral contraceptives or estro-gen replacement, particularly in the presence of calcium supplementation, may increasethe risk of adverse drug effects, including thrombosis (211). The effect of oral contra-ceptives on copper and zinc are widely described, but the mechanism for this effectremains unclear (126,144). Both whole blood and plasma levels of copper increase inpatients using oral contraceptives, whereas the data regarding decrease of zinc concen-trations is much less consistent (212–214).
Corticosteroids can cause a dose-dependent, transient decrease in serum zinc concen-trations following an initial rise (215). No decrease was identified after 48 h following
Table 6Drugs That Alter Trace Mineral Status
ChromiumCorticosteroids
CopperAntacids PenicillamineAntivirals Valproic acidCorticosteroids ZidovudineEthambutol Zinc SaltsOral contraceptives
IronAspirin EthanolCalcium IndomethacinCholestyramine NeomycinDeferoxamine SulfonamidesErythropoietins Tetracyclines
SeleniumCorticosteroidsValproic Acid
ZincAntivirals EthambutolCaptopril Folic acidCholestyramine HydrochlorothiazideCimetidine Oral contraceptivesCorticosteroids PenicillamineDeferiprone K-sparing diureticsEdetate Ca disodium ThiazidesEnalapril Valproic acidEstrogen Zidovudine

856 Part IX / Critical Issues for the 21st Century
an intravenous dose. A slower decline in serum copper levels that is attributed to corti-costeroids may last as long as 96 h after a dose (215). Serum selenium levels have beennoted to increase during corticosteroid treatment (216). The clinical significance of theredistribution of these minerals with corticosteroid administration is not clear but mayplay a role in immunosuppression.
Patients treated with zidovudine were noted to have reduced serum copper and zinclevels compared to similar patients who were not receiving this antiretroviral medica-tion (217). Although it has only been investigated in an animal model, the drug etham-butol may decrease distribution of copper to the liver and heart and distribution of zincto the liver and kidneys (218).
7.3. Excretion7.3.1. ELECTROLYTES
Electrolyte loss may occur through the GI tract or the kidneys. Sodium, potassium,and water depletion following chronic use of laxatives has been well-recognized foryears as the so-called “laxative abuse syndrome” but still continues to occur in patients(219,220). Elevated levels of renin and aldosterone respond well to potassium, sodium,and fluid repletion (221). Prophylactic potassium supplementation may be beneficial inpatients requiring bowel regimens who may have a history of cardiovascular disease(222). Of course, appropriate use of laxatives is the best management approach in thiscase. Besides increasing the risk for hyperphosphatemia, phosphate enemas can causehypocalcemia and hypomagnesemia as well as hypokalemia (223–225). The phosphateload of the concentrated product is excessive—particularly for infants, the elderly, andothers with impaired renal function.
A number of drugs can increase renal losses of electrolytes (e.g., diuretics, antimi-crobials, chemotherapy). The pharmacological activity of most diuretics involves therenal excretion of sodium. Loop diuretics increase renal wasting of potassium and mag-nesium (226,227); the latter likely occurs through an inhibition of passive magnesiumabsorption (228). Magnesium wasting occurs with a number of other drugs (229).Magnesium deficits may exist in the face of serum magnesium concentrations withinthe normal range. In fact, unrecognized drug-induced hypomagnesemia may be respon-sible for refractory episodes of hypokalemia and hypocalcemia. Loop diuretics alsoincrease loss of calcium in the urine as PTH levels increase (230). Loss of all these elec-trolytes through diuresis increases the risk of arrhythmia and sudden death in patientstreated with these agents (231,232).
The penicillins (e.g., carbenicillin, ampicillin, nafcillin, ticarcillin, oxacillin) arereported to cause hypokalemia, probably because of increased potassium secretionresulting from the solute load (nonreabsorbable anion) presented to the distal renaltubules (233–237). Hypocalcemia, hypokalemia, and hypomagnesemia all have beennoted in patients treated with aminoglycoside antibiotics (238). Treatment with the anti-fungal agent amphotericin is known to result in renal depletion of potassium and mag-nesium. Hypokalemia, in turn, may potentiate the tubular toxicity of amphotericin (239).This may be less likely in patients treated with liposomal formulations of this drug (240).Foscarnet can result in hypokalemia, hypomagnesemia, hypocalcemia, and hypophos-phatemia (229,241,242). The effect of foscarnet on calcium and phosphorus may be min-imized when the drug is administered as a liposome-encapsulated formulation (243).Foscarnet binding to ionized calcium may explain some of the abnormalities (244).

Chapter 34 / Medication and Nutrition 857
Corticosteroids—administered orally or parenterally—increase the risk of hypokalemiain patients receiving diuretics (245). Urinary potassium excretion increases with dose andduration of corticosteroid therapy (246). Mineralocorticoids stimulate renal tubular potas-sium secretion directly, whereas glucocorticoids do so indirectly through the sodium loadpresented to the distal tubule (247). Corticosteroids may also increase renal magnesiumlosses, resulting in hypomagnesemia (248). Corticosteroids can decrease intestinal calciumabsorption, increase renal calcium excretion, and decrease osteoblast activity, all of whichcontributes to osteoporosis. This drug-induced osteoporosis may partly depend on the doseand duration of corticosteroid use as well as bone mineral density prior to initiation of thedrug regimen. Supplementation with vitamin D and calcium can prevent some of theincreases in PTH and loss of bone mineral density that occur with corticosteroid therapy(249,250). The altered calcium absorption may vary among glucocorticoids through amechanism that apparently does not involve 1,25-dihydroxy-cholecalciferol (251). Theproton pump inhibitor lansoprazole has been reported to cause severe, symptomatichypocalcemia through an unknown mechanism (252). Other immunosuppressants besidescorticosteroids also can cause electrolyte disturbances. Cyclosporine and tacrolimus cancause increased renal magnesium losses and possible potassium losses as well (253,254).
A number of medications, including the selective serotonin reuptake inhibitors, cancause hyponatremia (particularly in the elderly) as a result of increased secretion ofantidiuretic hormone (255). Other medications, including lithium therapy, can causehypernatremia as a consequence of decreased renal responsiveness to antidiuretic hor-mone (i.e., nephrogenic diabetes insipidus) (256–258). In either case, the alteration inserum sodium concentration is related to a disorder of water regulation, which eitherdilutes (hyponatremia) or concentrates (hypernatremia) the sodium content of the serum.Therefore, management of these disorders includes water restriction (hyponatremia) orwater replacement (hypernatremia). If the hypernatremia associated with lithium is man-aged with sodium restriction rather than water replacement, the risk of lithium toxicity isactually increased as the drug is reabsorbed renally in place of sodium.
7.3.2. TRACE MINERALS
Loss of blood at the GI tract is higher as a result of aspirin or other nonsteroidal anti-inflammatory drug therapy and may increase the risk of developing iron deficiency(259,260). Aspirin use has been associated with lower serum ferritin concentrations insome patients, although confounding factors could have played a role (261).
Captopril and, to a lesser extent, enalapril increase urinary zinc excretion after sev-eral months of treatment in patients with hypertension (262,263). This is not reflectedby serum values of zinc, which remain unchanged (264). No documentation existsregarding whether this will lead to clinically apparent deficits, but it may play a role inthe altered taste experienced by patients receiving this class of medication. Diuretics(including the thiazides and chlorthalidone) increase urinary zinc losses (265,266).Again, serum levels remain normal in most patients, although this is expected as a resultof redistribution from the intracellular space.
Penicillamine is used to lower serum copper concentrations in patients withWilson’s Disease by increasing renal elimination of a drug–mineral complex. Althoughpenicillamine is useful in Wilson’s Disease, this nutrient loss may explain the drug’steratogenic effect (267). Penicillamine also has the potential to lower levels of othernutrients. Loss of zinc may be increased, but iron, calcium, and magnesium losses are

858 Part IX / Critical Issues for the 21st Century
not readily apparent (268). Circulating zinc levels improve within a few months ofcontinued therapy; it is not clear whether this is a recovery of zinc status or merely aredistribution from other compartments (269). Supplementation of magnesium, zinc,and pyridoxine has been suggested for patients receiving penicillamine (270).Zidovudine and valproic acid may also reduce serum copper concentrations (271).
Additionally, corticosteroids can increase chromium losses and, therefore, may con-tribute to the hyperglycemia associated with these agents (272). Corticosteroids mayalso increase urinary loss of selenium (273). Understanding the clinical relevance ofdrug-induced losses of the trace minerals requires additional study.
8. SUMMARY AND RECOMMENDATIONS
A nutritionally focused patient history, physical examination, and appropriate labo-ratory marker evaluations are important to correctly identify nutrient deficits orexcesses in patients using medication. No single clinician specifically looks for nutri-tional aspects of drug use on a regular basis. Any change in nutritional status identifiedby a clinician should be examined for a drug-induced etiology.
Everyone requiring medication should have a thorough nutritional assessment per-formed at baseline and periodically during chronic treatment. Any abnormalities innutritional status or status of a specific nutrient identified by this diligence should bedocumented and published to educate others. For those drugs known to cause alterednutritional status, specific interventions should occur at the time the medication isstarted to prevent adverse effects. When a drug-induced change poses a significant con-cern for a patient, a therapeutically equivalent or alternative agent may be selected.
Current evidence does not support indiscriminant use of nutrient supplements tomanage losses that may result from drug use. Indeed, the dose of a nutrient that isneeded to offset the adverse effects of many medications is not known. Additionally, insome instances, pharmacological nutrient dosing may increase drug clearance with clin-ical consequences, as in the case of folic acid and phenytoin (274).
The clinical relevance of the drug-induced changes to the status of an individualnutrient needs to be determined on an individual basis. This relevance may be viewedas a finding of little value or may help to explain debilitating adverse effects associatedwith chronic use of a medication. Aside from the few widely recognized interactions,most of these interpretations usually are not made.
Ideally, all new drugs should be evaluated for effects on nutritional status. Cliniciansshould be sensitized to identify and report effects of drugs that are otherwise unrecog-nized and should develop guidelines to address altered nutritional status that take intoaccount the most appropriate test(s) of status. Prospective studies regarding methods tocorrect nutritional status should evaluate not only parameters of nutrient status butinfluence on clinical manifestations. In this way, patients required to use medication canbe optimally managed regarding maintenance of adequate nutritional status.
REFERENCES1. Kaufman DW, Kelly JP, Rosenberg L, et al. Recent patterns of medication use in the ambulatory
adult population of the US: the Slone survey. JAMA 2002; 287:337–344.2. Shojania KG, Duncan BW, McDonald KM, et al. Making healthcare safer: a critical analysis of
patient safety practices. Evidence Report/Technology Assessment No. 43. AHRQ Publication No.01-E058. Rockville, MD:Agency for Healthcare Research and Quality, 2001.

Chapter 34 / Medication and Nutrition 859
3. Boullata JI, Barber JR. A Perspective on Drug–Nutrient Interactions. In: Boullata JI, Armenti VA,eds. Handbook of Drug–Nutrient Interactions. Humana Press, Totowa, NJ, 2004, pp. 3–25.
4. Couris RR, Tataronis GR, Dallal GE, et al. Assessment of healthcare professionals’ knowledge aboutwarfarin–vitamin K drug–nutrient interactions. J Am Coll Nutr 2000; 19:439–445.
5. Teresi ME, Morgan DE. Attitudes of healthcare professionals toward patient counseling ondrug–nutrient interactions. Ann Pharmacother 1994; 28:576–580.
6. Rathman SC, Blanchard RK, Badinga L, et al. Dietary carbamazepine administration decreases liverpyruvate carboxylase activity and biotinylation by decreasing protein and mRNA expression in rats.J Nutr 2003; 133:2119–2124.
7. Markell M. Dietary Supplement Interaction With Nutrients. In: Boullata JI, Armenti VA, eds.Handbook of Drug–Nutrient Interactions. Humana Press, Totowa, NJ, 2004, pp. 235–240.
8. Biehl JP, Vilter RW. Effect of isoniazid on vitamin B6 metabolism: its possible significance in pro-ducing isoniazid neuritis. Proc Soc Exp Biol Med 1954; 85:389–392.
9. Levy L, Higgins LJ, Burbridge TN. Isoniazid-induced vitamin B6 deficiency. Am Rev Resp Dis1967; 96:910–917.
10. McCabe BJ, Frankel EH, Wolfe JJ. Monitoring Nutritional Status in Drug Regimens. In: McCabeBJ, Frankel EH, Wolfe JJ, eds. Handbook of Food–Drug Interactions.CRC Press, Boca Raton, FL,2003, pp. 73–108.
11. Pelton R, LaValle JB, Hawkins EB, et al., eds. Drug-Induced Nutrient Depletion Handbook. Second ed,Lexi-Comp Inc., Hudson, OH, 2001.
12. Roe DA. Drug-Induced Nutritional Deficiencies, 2nd ed. AVI Publishing, Westport, CT, 1985.13. Gervasio JM. Drug-Induced Changes in Nutritional Status. In: Boullata JI, Armenti VA, eds.
Handbook of Drug–Nutrient Interactions. Humana Press, Totowa, NJ, 2004, pp. 243–256.14. Matarese LE. Metabolic Complications of Parenteral Nutrition Therapy. In: Gottschlich MM,
Fuhrman MP, Hammond KA, et al., eds. The Science and Practice of Nutrition Support.Kendall/Hunt Publishing, Dubuque, IA, 2001, pp. 269–286.
15. Seitz HK, Suter PM. Ethanol Toxicity and Nutritional Status. In: Kotsonis FN, Mackey MA, eds.Nutritional Toxicology, 2nd ed. Taylor & Francis, London, UK, 2002, pp. 122–154.
16. Lieber CS. Alcohol: its metabolism and interaction with nutrients. Annu Rev Nutr 2000;20:395–430.
17. Mowry JB, Furbee RB, Chyka PA. Poisoning. In: Chernow B, ed. The Pharmacologic Approach tothe Critically Ill Patient, 3rd ed. Williams & Wilkins, Baltimore, MD, 1994, pp. 975–1008.
18. Said HM, Redha R, Nylander W. Biotin transport in the human intestine: inhibition by anticonvul-sant drugs. Am J Clin Nutr 1989; 49:127–131.
19. Mock DM, Dyken ME. Biotin catabolism is accelerated in adults receiving long-term therapy withanticonvulsants. Neurology 1997; 49:1444–1447.
20. Lambie DG, Johnson RH. Drugs and folate metabolism. Drugs 1985; 30:145–155.21. Race TF, Paes IC, Faloon WW. Intestinal malabsorption induced by oral colchicines: comparison
with neomycin and cathartic agents. Am J Med Sci 1970; 259:32–41.22. Frequin ST, Wevers RA, Braam M, et al. Decreased vitamin B12 and folate levels in cerebrospinal
fluid and serum of multiple sclerosis patients after high-dose intravenous methylprednisolone.J Neurol 1993; 240:305–308.
23. Peretz A, Neve J, Vertongen F, et al. Selenium status in relation to clinical variables and corticos-teroid treatment in rheumatoid arthritis. J Rheumatol 1987; 14:1104–1107.
24. Ruze P. Kava-induced dermopathy: a niacin deficiency? Lancet 1990; 335:1442–1445.25. Wolfe WS, Frongillo EA, Valois P. Understanding the experience of food insecurity by elders sug-
gests ways to improve its measurement. J Nutr 2003; 133:2762–2769.26. Mott AE, Leopold DA. Disorders of taste and smell. Med Clin North Am 1991; 75:13231–13253.27. Ackerman BH, Kasbekar N. Disturbances of taste and smell induced by drugs. Pharmacotherapy
1997; 17:482–496.28. Henkin RI, Schecter PJ, Friedewald WT, et al. A double-blind study of the effects of zinc sulfate on
taste and smell dysfunction. Am J Med Sci 1976; 272:285–299.29. Taylor AT, Nausea and Vomiting. In: DiPiro JT, Talbert RL, Yee GC, et al., eds. Pharmacotherapy:
A Pathophysiologic Approach, 5th ed. McGraw-Hill, New York, 2002, pp. 641–653.30. Spruill WJ, Wade WE. Diarrhea, Constipation, and Irritable Bowel Syndrome. In: DiPiro JT, Talbert
RL, Yee GC, et al., eds. Pharmacotherapy: A Pathophysiologic Approach, 5th ed. McGraw-Hill, NewYork, 2002, pp. 655–669.

860 Part IX / Critical Issues for the 21st Century
31. Umbricht D, Kane J. Medical complications of new antipsychotic drugs. Schizophren Bull 1996;22:475–483.
32. Vanina Y, Podalskaya A, Sedky K, et al. Body weight changes associated with psychopharmacology.Psych Serv 2002;53:842–847.
33. Pischon T, Sharma AM. Use of beta-blockers in obesity hypertension: potential role of weight gain.Obes Rev 2001; 2:275–280.
34. Berardi RR, Montgomery PA. Pancreatitis. In: DiPiro JT, Talbert RL, Yee GC, et al., eds.Pharmacotherapy: A Pathophysiologic Approach, 5th ed. McGraw-Hill, New York, 2002, pp. 701–715.
35. Saltzman JR, Kemp JA, Golner BB, et al. Effect of hypochlorhydria due to omeprazole treatment oratrophic gastritis on protein-bound vitamin B12 absorption. J Am Coll Nutr 1994; 13:584–591.
36. Termanini B, Gibril F, Sutliff VE, et al. Effect of long-term gastric acid suppressive therapy on serumvitamin B12 levels in patients with Zollinger-Ellison syndrome. Am J Med 1998; 104:422–430.
37. Jacobson ED. Depletion of vitamin B12, iron, beta-carotene, and fat malabsorptive effects of neomycinin commonly used doses. JAMA 1961; 175:187–190.
38. Carr A, Samaras K, Burton S, et al. A syndrome of peripheral lipodystrophy, hyperlipidemia andinsulin resistance in patients receiving HIV protease inhibitors. AIDS 1998; 12:F51–F58.
39. Luna B, Feinglos MN. Drug-induced hyperglycemia. JAMA 2001; 286:1945–1948.40. Marks V, Teale JD. Drug-induced hypoglycemia. Endocrinol Metab Clin North Am 1999; 28:555–577.41. Pandit MK, Burke J, Gustafson AB, et al. Drug-induced disorders of glucose tolerance. Ann Intern
Med 1993; 118:529–539.42. Buse JB, Cavazonni P, Hornbuckle K, et al. A retrospective cohort study of diabetes mellitus and
antipsychotic treatment in the United States. J Clin Epidemiol 2003; 56:164–170.43. Gianfrancesco F, White R, Wang RH, et al. Antispychotic-induced type 2 diabetes: evidence from a
large health plan database. J Clin Psychopharmacol 2003; 23:328–335.44. Mantel-Teeuwisse AK, Kloosterman JM, Maitland-van der Zee AH, et al. Drug-induced lipid
changes: a review of the unintended effects of some commonly used drugs on serum lipid levels.Drug Safety 2001; 24:443–456.
45. Brillon DJ, Zheng B, Campbell RG, et al. Effect of cortisol on energy expenditure and amino acidmetabolism in humans. Am J Physiol 1995; 268:E501–E513.
46. Ferrando AA, Stuart CA, Sheffield-Moore M, et al. Inactivity amplifies the catabolic response ofskeletal muscle to cortisol. J Clin Endocrinol Metab 1999; 84:3515–3521.
47. Strobl JS, Thomas MJ. Human growth hormone. Pharmacol Rev 1994; 46:1–34.48. Úbeda N, Alonso-Aperte E, Varela-Moreiras G. Acute valproate administration impairs methionine
metabolism in rats. J Nutr 2002; 132:2737–2742.49. Slap GB. Oral contraceptives and depression: impact, prevalence and cause. J Adolesc Health Care
1981; 2:53-64.50. Noda S, Haratake J, Sasaki A, et al. Acute encephalopathy with hepatic steatosis induced by pan-
tothenic acid antagonist, calcium hopantenate, in dogs. Liver 1991; 11:134-142.51. Shin HC, Landowski CP, Sun D, et al. Transporters in the GI Tract. In: van de Waterbeemd H,
Lennernäs H, Artursson P, eds. Drug Bioavailability: Estimation of Solubility, Permeability,Absorption and Bioavailability. Wiley-VCH,Weinheim, Germany, 2003, pp. 245–287.
52. Kamath AV, Darling IM, Morris ME. Choline uptake in human intestinal Caco-2 cells is carrier-mediated. J Nutr 2003; 133:2607–2611.
53. Zimmerman J. Drug interactions in intestinal transport of folic acid and methotrexate: further evi-dence for the heterogeneity of folate transport in the human small intestine. Biochem Pharmacol 1992;44:1839–1842.
54. Chungi VS, Bourne DW, Dittert LW. Competitive inhibition between folic acid and methotrexate fortransport carrier in the rat small intestine. J Pharm Sci 1979; 68:1552–1553.
55. Leeb BF, Witzmann G, Orgis E, et al. Folic acid and cyanocobalamin levels in serum and erythro-cytes during low-dose methotrexate therapy for rheumatoid arthritis and psoriatic arthritis patients.Clin Exp Rheumatol 1995; 13:459–463.
56. Dijkmans BA. Folate supplementation and methotrexate. Br J Rheumatol 1995; 34:1172–1174.57. Morgan SL, Baggott JE, Lee JY, et al. Folic acid supplementation prevents deficient blood folate
levels and hyperhomocysteinemia during longterm, low dose methotrexate therapy for rheumatoidarthritis: implications for cardiovascular disease prevention. J Rheumatol 1998; 25:441–446.
58. Corcino J, Waxman S, Herbert V. Mechanisms of triamterene-induced megaloblastosis. Ann InternMed 1970; 73:419–424.

Chapter 34 / Medication and Nutrition 861
59. Joosten E, Pelemans W. Megaloblastic anaemia in an elderly patient treated with triamterene. MethJ Med 1991; 38:209–211.
60. Zimmerman J, Selhub J, Rosenberg IH. Competitive inhibition of folic acid absorption in ratjejunum by triamterene. J Lab Clin Med 1986; 108:272–276.
61. Mason JB, Zimmerman J, Otradovec CL, et al. Chronic diuretic therapy with moderate doses of tri-amterene is not associated with folate deficiency. J Lab Clin Med 1991; 117:365–369.
62. Russell DM, Dutta SK, Rosenberg IH, et al. Impairment of folic acid by oral pancreatic extracts. DigDis Sci 1980; 25:369–373.
63. West RJ, Lloyd JK. The effect of cholestyramine on intestinal absorption. Gut 1975; 16:93–98.64. Hoppner K, Lampi B. Bioavailability of folate following ingestion of cholestyramine in the rat. Int
J Vit Nutr Res 1991; 61:130–134.65. Deguchi Y, et al. Comparative studies on synthesis of water-soluble vitamins among human species
of Bifidobacteria. Agr Biol Chem 1985; 19:13–19.66. Stevens CE, Hume ID. Contributions of microbes in vertebrate gastrointestinal tract to production
and conservation of nutrients. Physiol Rev 1998; 78:393–427.67. Hill MJ. Intestinal flora and endogenous vitamin synthesis. Eur J Cancer Prev 1997; 6(Suppl 1):S43–S45.68. Faloon WW, Chodos RB. Vitamin B12 absorption studies using colchicine, neomycin and continu-
ous 57Co B12 administration. Gastroenetrol 1969; 56:1251.69. Webb DI, Chodos RB, Mahar CQ, et al. Mechanism of vitamin B12 malabsorption in patients receiv-
ing colchicines. N Engl J Med 1968; 279:845–850.70. Stopa EG, O’Brien R, Katz M. Effect of colchicine on guinea pig intrinsic factor-vitamin B12 recep-
tor. Gastroenterol 1979; 76:309–314.71. Ehrenfeld M, Levy M, Sharon P, et al. Gastrointestinal effects of long-term colchicine therapy in
patients with recurrent polyserositis. Dig Dis Sci 1982; 27:723–727.72. Paltiel O, Falutz J, Veilleux M, et al. Clinical correlates of subnormal vitamin B12 levels in patients
infected with the human immunodeficiency virus. Am J Hematol 1995; 49:318–322.73. Adams JF, Clark JS, Ireland JT, et al. Malabsorption of vitamin B12 and intrinsic factor secretion dur-
ing biguanide therapy. Diabetologia 1983; 24:16–18.74. Berger W. Incidence of severe side effects during therapy with sulfonylureas and biguanides. Horm
Metab Res Suppl 1985; 15:111–115.75. Carlsen SM, Folling I, Grill V, et al. Metformin increases total serum homocysteine levels in nondi-
abetic male patients with coronary heart disease. Scan J Clin Lab Invest 1997; 57:521–527.76. Salom IL, Silvis SE, Doscherholmen A. Effect of cimetidine on the absorption of vitamin B12. Scan
J Gastroenterol 1982; 17:129–131.77. Aymard JP, Aymard B, Netter P, et al. Haematological adverse effects of histamine H2-receptor
antagonists. Med Toxicol Adverse Drug Exp 1988; 3:430–448.78. Force RW, Nahata MC. Effect of histamine H2-receptor antagonists on vitamin B12 absorption. Ann
Pharmacother 1992; 26:1283–1286.79. Festen HP. Intrinsic factor secretion and cobalamin absorption: physiology and pathophysiology in
the gastrointestinal tract. Scand J Gastroenterol 1991; 188:1–7.80. Schenk BE, Festen HP, Kuipers EJ, et al. Effect of short- and long-term treatment with omeprazole
on the absorption and serum levels of cobalamin. Aliment Pharmacol Ther 1996; 10:541–545.81. Tang G, Serfaty-Lacrosniere C, Camilo ME, et al. Gastric acidity influences the blood response to a
β-carotene dose in humans. Am J Clin Nutr 1996; 64:622–626.82. Becker GL. The case against mineral oil. Am J Dig Dis 1953; 19:344–347.83. Elinder LS, Hadell K, Johansson J, et al. Probucol treatment decreases serum concentrations of diet-
derived antioxidants. Arterioscl Thromb Vasc Biol 1995; 15:1057–1063.84. Hathcock JN. Metabolic mechanisms of drug–nutrient interactions. Fed Proc 1985; 44(1 Pt 1): 124–129.85. Knodel LC, Talbert RL. Adverse effects of hypolipidaemic drugs. Med Toxicol 1987; 2:10–32.86. Hoogwerf BJ, Hibbard DM, Hunninghake DB. Effects of long-term cholestyramine administration
on vitamin D and parathormone levels in middle-aged men with hypercholesterolemia. J Lab ClinMed 1992; 119:407–411.
87. Finer N, James WP, Kopelman PG, et al. One-year treatment of obesity: a randomized, double-blind,placebo-controlled, multicentre study of orlistat, a gastrointestinal lipase inhibitor. Int J Obes 2000;24:306–313.
88. Melia AT, Koss-Twardy SG, Zhi J. The effect of orlistat, an inhibitor of dietary fat absorption, on theabsorption of vitamins A and E in healthy volunteers. J Clin Pharmacol 1996; 36:647–653.

862 Part IX / Critical Issues for the 21st Century
89. McDuffie JR, Calis KA, Booth SL, et al. Effects of orlistat on fat-soluble vitamins in obese adoles-cents. Pharmacotherapy 2002; 22:814–822.
90. Zhi J, Melia AT, Koss-Twardy SG, et al. The effect of orlistat, an inhibitor of dietary fat absorption,on the pharmacokinetics of beta-carotene in healthy volunteers. J Clin Pharmacol 1996; 36:152–159.
91. Conly J, Stein K. Reduction of vitamin K2 concentrations in human liver associated with the use ofbroad spectrum antimicrobials. Clin Invest Med 1994; 17:531–539.
92. Lipsky JJ. Antibiotic-associated hypoprothrombinemia. J Antimicrob Chemother 1988; 21:281–300.93. Goggin T, Gough H, Bissessar A, et al. A comparative study of the relative effects of anticonvul-
sant drugs and dietary folate on the red cell folate status of patients with epilepsy. Q J Med 1987;65:911–919.
94. Latham J, Gill DS, Wickramasinghe SN. Effects of phenytoin sodium on doubling time, deoxyuri-dine supression, 3H-methotrexate uptake and 57 co-cyanocobalamin uptake in HL60 cells. Clin LabHaematol 1990; 12:67–75.
95. Botez MI, Joyal C, Maag U, et al. Cerebrospinal fluid and blood thiamine concentrations in phenytoin-treated epileptics. Can J Neurol Sci 1982; 9:37–39.
96. Patrini C, Perucca E, Reggiani C, et al. Effects of phenytoin on the in vivo kinetics of thiamine andits phosphoesters in rat nervous tissues. Brain Res 1993; 628:179–186.
97. Zangen A, Botzer D, Zangen R, et al. Furosemide and digoxin inhibit thiamine uptake in cardiaccells. Eur J Pharmacol 1998; 361:151–155.
98. Alter HJ, Zvaifler NJ, Rath CE. Interrelationship of rheumatoid arthritis, folic acid, and aspirin.Blood 1971; 38:405–416.
99. Lawrence VA, Loewenstein JE, Eichner ER. Aspirin and folate binding in vivo and in vitro studiesof serum binding and urinary excretion of endogenous folate. J Clin Lab Med 1984; 103:944–948.
100. Sahud MA, Cohen RJ. Effect of aspirin ingestion on ascorbic acid levels in rheumatoid arthritis.Lancet 1971; 1:937–938.
101. Loh HS, Watters K, Wilson CW, et al. The effects of aspirin on the metabolic availability of ascor-bic acid in human beings. J Clin Pharmacol 1973; 13:480–486.
102. Coffey G, Wilson CWM. Ascorbic acid deficiency and aspirin induced hematemesis. BMJ 1975;1:208.
103. Levine MA, Pollard HB. Hydrocortisone inhibition of ascorbic acid transport by chromaffin cells.FEBS Lett 1983; 158:134–138.
104. Dalakas MC, Leon-Monzon ME. Zidovudine-induced mitochondrial myopathy is associated withmuscle carnitine deficiency and lipid storage. Ann Neurol 1994; 35:482–487.
105. Tein I, DimAuro S, Xie ZW, et al. Valproic acid impairs carnitine uptake in cultured human skinfibroblasts: an in vitro model for pathogenesis of valproic acid-associated carnitine deficiency.Pediatr Res 1993; 34:281–287.
106. Aberg F, Appelkvist EL, Broijersen A, et al. Gemfibrozil-induced decrease in serum ubiquinone andalpha- and gamma-tocopherol levels in men with combined hyperlipidaemia. Eur J Clin Invest 1998;28:235–242.
107. Folkers K, Langsjoen P, Willis R, et al. Lovastatin decreases coenzyme Q levels in humans. ProcNatl Acad Sci USA 1990; 87:8931–8934.
108. Mortensen SA, Leth A, Agner E, et al. Dose-related decrease of serum coenzyme Q10 during treat-ment with HMG-CoA reductase inhibitors. Mol Aspects Med 1997; 18(Suppl):S137–144.
109. Ghirlanda G, Oradei A, Manto A, et al. Evidence of plasma CoQ10 lowering effect by HMG-CoAreductase inhibitors: a double-blind, placebo-controlled study. J Clin Pharmacol 1993; 33:226–229.
110. DePinieux G, Chariot P, Ammi-Said M, et al. Lipid lowering drugs and mitochondrial function:effects of HMG-CoA reductase inhibitors on serum ubiquinone and blood lactate/pyruvate ratio.Br J Clin Pharmacol 1996; 42:333–337.
111. Human JA, Ubbink JB, Jerling JJ, et al. The effect of simvastatin on the plasma antioxidant con-centrations in patients with hypercholesterolaemia. Clin Chim Acta 1997; 263:67–77.
112. Bargossi AM, Grossi G, Fiorella PL, et al. Exogenous CoQ10 supplementation prevents plasmaubiquinone reduction by HMG-CoA reductase inhibitors. Mol Aspects Med 1994;15(Suppl):187–193.
113. Shimizu T, Maeda S, Mochizuki H, et al. Theophylline attenuates circulating vitamin B6 levels inchildren with asthma. Pharmacol 1994; 49:392–397.
114. Shimizu T, Maeda S, Arakawa H, et al. Relation between theophylline and circulating vitamin lev-els in children with asthma. Pharmacol 1996; 53:384–389.

Chapter 34 / Medication and Nutrition 863
115. Delport R, Ubbink JB, Serfontein WJ, et al. Vitamin B6 nutritional status in asthma: the effect oftheophylline therapy on plasma pyridoxal-5’-phosphate and pyridoxal levels. Int J Vitam Nutr Res1988; 58:67–72.
116. Laine-Cessac P, Cailleaux A, Allain P. Mechanisms of the inhibition of human erythrocyte pyridoxalkinase by drugs. Biochem Pharmacol 1997; 54:863–870.
117. Bartel PR, Ubbink JB, Delport R, et al. Vitamin B6 supplementation and theophylline-related effectsin humans. Am J Clin Nutr 1994; 60:93–99.
118. Raskin NH, Fishman RA. Pyridoxine deficiency neuropathy due to hydralazine. N Engl J Med 1964;273:1182–1185.
119. Vidrio H. Interaction with pyridoxal as a possible mechanism of hydralazine hypotension.J Cardiovasc Pharmacol 1990; 15:150–156.
120. Pinto JT, Huang YP, Rivlin RS. Inhibition of riboflavin metabolism in rat tissues by chlorpromazine,imipramine and amitriptyline. J Clin Invest 1981; 67:1500–1506.
120. Dutta P, Pinto JT, Rivlin RS. Antimalarial effects of riboflavin deficiency. Lancet 1985;2:1040–1043.
122. Krogh-Jensen M, Ekelund S, Svendsen L. Folate and homocysteine status and haemolysis in patientstreated with sulphasalazine for arthritis. Scand J Clin Lab Invest 1996; 56:421–429.
123. Grieco A, Caputo S, Bertoli A, et al. Megaloblastic anaemia due to sulphasalazine responding todrug withdrawal alone. Postgrad Med J 1986; 62:307–308.
124. Logan EC, Williamson LM, Ryrie DR. Sulphasalazine associated pancytopenia may be caused byacute folate deficiency. Gut 1986; 27:868–872.
125. Baggott JE, Morgan SL, Ha T, et al. Inhibition of folate-dependent enzymes by non-steroidal anti-inflammatory drugs. Biochem J 1992; 282:197–202.
126. Webb DI, Chodos RB, Mahar CQ, et al. Mechanism of vitamin B12 malabsorption in patients receiv-ing colchicine. N Engl J Med 1968; 279:845–850.
127. Prasad AS, Lei KY, Moghissi KS, et al. Effect of oral contraceptives on nutrients, III: vitamins B6, B12,and folic acid. Am J Obstet Gynecol 1976; 125:1063–1069.
128. Shojania AM. Oral contraceptives: effect of folate and vitamin B12 metabolism. Can Med AssocJ 1982; 126:244–247.
129. Ahmed F, Bamji MS, Iyengar L. Effect of oral contraceptive agents on vitamin nutrition status. AmJ Clin Nutr 1975; 28:606–615.
130. Butterworth CE, Hatch KD, Gore H, et al. Improvement in cervical dysplasia associated with folicacid therapy in users of oral contraceptives. Am J Clin Nutr 1982; 35:73–82.
131. Harper JM, Levine AJ, Rosenthal DL, et al. Erythrocyte folate levels, oral contraceptive use andabnormal cervical cytology. Acta Cytol 1994; 38:324–330.
132. Bermond P. Therapy of side effects of oral contraceptive agents with vitamin B6. Acta VitaminEnzymol 1982; 4:45–54.
133. Kishi H, Kishi T, Williams RH, et al. Deficiency of vitamin B6 in women taking contraceptive for-mulations. Res Commun Chem Pathol Pharmacol 1997; 17:283–293.
134. Villegas-Salas E, Ponce de Leon R, Juarez-Perez MA, et al. Effect of vitamin B6 on the side effectsof a low-dose combined oral contraceptive. Contraception 1997; 55:245–248.
135. Sanpitak N, Chayutimonkul L. Oral contraceptives and riboflavine nutrition. Lancet 1974; 1:836–837.136. Newman LJ, Lopez R, Cole HS, et al. Riboflavin deficiency in women taking oral contraceptive
agents. Am J Clin Nutr 1978; 31:247–249.137. Roe DA, Bogusz S, Sheu J, et al. Factors affecting riboflavin requirements of oral contraceptive
users and nonusers. Am J Clin Nutr 1982; 35:495–501.138. Nash AL, Cornish EJ, Hain R. Metabolic effects of oral contraceptives containing 30 micrograms
and 50 micrograms of oestrogen. Med J Aust 1979; 2:277–281.139. Rivers JM. Oral contraceptives and ascorbic acid. Am J Clin Nutr 1975; 28:550–554.140. Weininger J, King JC. Effect of oral contraceptive agents on ascorbic acid metabolism in the Rhesus
monkey. Am J Clin Nutr 1982; 35:1408–1416.141. Harris AB, Hartley J, Moor A. Reduced ascorbic acid excretion and oral contraceptives. Lancet
1973; 2:201–202.142. McElroy VJ, Schendel HE. Influence of oral contraceptives on ascorbic acid concentrations in
healthy, sexually mature women. Am J Clin Nutr 1973; 26:191–196.143. Hudiburgh NK, Milner AN. Influence of oral contraceptives on ascorbic acid and triglyceride status.
J Am Diet Assoc 1979; 75:19–22.

864 Part IX / Critical Issues for the 21st Century
144. Tyrer LB. Nutrition and the pill. J Reprod Med 1984; 29(7 Suppl):547–550.145. Mock DM, Mock NI, Nelson RP, et al. Disturbances in biotin metabolism in children undergoing
long-term anticonvulsant therapy. J Ped Gastroenterol Nutr 1998; 26:245–250.146. Krause KH, Kochen W, Berlit P, et al. Excretion of organic acids associated with biotin deficiency
in chronic anticonvulsant therapy. Int J Vitam Nutr Res 1984; 54:217–222.147. Krause KH, Bonjour JP, Berlit P, et al. Biotin status of epileptics. Ann N Y Acad Sci 1985;
447:297–313.148. Krause KH Bonjour JP, Berlit P, et al. Effect of long-term treatment with antiepileptic drugs on the
vitamin status. Drug–Nutr Interact 1988; 5:317–343.149. Leary PM. Folate studies in underprivileged children with epilepsy. S Afr Med J 1973; 47:2245–2246.150. Lewis DP, Van Dyke DC, Willhite LA, et al. Phenytoin-folic acid interaction. Ann Pharmacother
1995; 29:726–735.151. Tomson T, Lindbom U, Sundqvist A, et al. Red cell folate levels in pregnant epileptic women. Eur
J Clin Pharmacol 1995; 48:305–308.152. Froscher W, Maier V, Laage M, et al. Folate deficiency, anticonvulsant drugs, and psychiatric
morbidity. Clin Neuropharmacol 1995; 18:165–182.153. Kishi T, Fujita N, Eguchi T, et al. Mechanism for reduction of serum folate by antiepileptic drugs
during prolonged therapy. J Neurol Sci 1997; 145:109–112.154. Reynolds EH, Trimble MR. Adverse neuropsychiatric effects of anticonvulsant drugs. Drugs 1985;
29:570–581.155. Botez MI, Botez T, Ross-Chouinard A, et al. Thiamine and folate treatment of chronic epileptic
patients: a controlled study with the Wechsler IQ scale. Epilepsy Res 1993; 16:157–163.156. Hendel J, Dam M, Gram L, et al. The effects of carbamazepine and valproate on folate metabolism
in man. Acta Neurol Scand 1984; 69:226–231.157. Isojarvi JI, Pakarinen AJ, Myllyla VV. Basic hematological parameters, serum gamma-glutamyl-
transferase activity, and erythrocyte folate and serum vitamin B12 levels during carbamazepine andoxcarbamazepine therapy. Seizure 1997; 6:207–211.
158. Opala G, Winter S, Vance C, et al. The effect of valproic acid on plasma carnitine levels. Am J DisChild 1991; 145:999–1001.
159. Van Wouwe JP. Carnitine deficiency during valproic acid treatment. Int J Vit Nutr Res 1995; 65:211–214.160. Melegh B, Kerner J, Kispal G, et al. Effect of chronic valproic acid treatment on plasma and urine
carnitine levels in children. Acta Paediat Hung 1987; 28:137–142.161. Farkas V, Bock I, Cseko J, et al. Inhibition of carnitine bisynthesis by valproic acid in rats: the bio-
chemical mechanism of inhibition. Biochem Phrmacol 1996; 52:1429–1433.162. De Vivo DC, Bohan TP, Coulter DL, et al. L-carnitine supplementation in childhood epilepsy: cur-
rent perspectives. Epilepsia 1998; 39:1216–1225.163. Hirose S, Mitsudome A, Yasumoto S, et al. Valproate therapy does not deplete carnitine levels in oth-
erwise healthy children. Pediatrics 1998; 101:E9.164. Matsuoka LY, Ide L, Wortsman J, et al. Sunscreens suppress cutaneous vitamin D3 synthesis. J Clin
Endocrinol Metab 1987; 64:1165–1168.165. Brodie MJ, Boobis AR, Hillyard CJ, et al. Effects of isoniazid on vitamin D metabolism and hepatic
monooxygenase activity. Clin Pharmacol Ther 1981; 30:363–367.166. Williams SE, Wardman AG, Taylor GA, et al. Long term study of the effect of rifampicin and isoni-
azid on vitamin D metabolism. Tubercle 1985; 66:49–54.167. Brodie MJ, Boobis AR, Dollery CT, et al. Rifampicin and vitamin D metabolism. Clin Pharmacol
Ther 1980; 27:810–814.168. Bell RD, Pak CY, Zerwekh J, et al. Effect of phenytoin on bone and vitamin D metabolism. Ann
Neurol 1979; 5:374–378.169. Zerwekh JE, Homan R, Tindall R, et al. Decreased serum 24,25-dihydroxyvitamin D concentration
during long-term anticonvulsant therapy in adult epileptics. Ann Neurol 1982; 12:184–186.170. Gascon-Barre M, Villeneuve JP, Lebrun LH. Effect of increasing doses of phenytoin on the plasma
25-hydroxyvitamin D and 1,25-dihydroxyvitamin D concentrations. J Am Coll Nutr 1984; 3:45–50.171. Gough H, Goggin T, Bissessar A, et al. A comparative study of the relative influence of different anti-
convulsant drugs, UV exposure and diet on vitamin D and calcium metabolism in outpatients withepilepsy. Q J Med 1986; 59:569–577.
172. Hahn TJ, Hendin BA, Scharp CR, et al. Effect of chronic anticonvulsant therapy on serum 25-hydroxycalciferol levels in adults. N Engl J Med 1972; 287:900–904.

Chapter 34 / Medication and Nutrition 865
173. Chung S, Ahn C. Effects of anti-epileptic drug therapy on bone mineral density in ambulatory epilep-tic children. Brain Dev 1994; 16:382–385.
174. Hoikka V, Alhava EM, Karjalainen P, et al. Carbamazepine and bone mineral metabolism. ActaNeurol Scand 1984; 70:77–80.
175. Farhat G, Yamout B, Mikati MA, et al. Effect of antiepileptic drugs on bone density in ambulatorypatients. Neurology 2002; 58:1348–1353.
176. Rajantie J, Lamberg-Allardt C, Wilska M. Does carbamazepine treatment lead to a need of extra vit-amin D in some mentally retarded children? Acta Paediatr Scand 1984; 73:325–328.
177. Ala-Houhala M, Korpela R, Koivikko M, et al. Long-term anticonvulsant therapy and vitamin Dmetabolism in ambulatory pubertal children. Neuropediatrics 1986; 17:212–216.
178. Keith DA, Gundberg CM, japour A, et al. Vitamin K-dependent proteins and anticonvulsant medication.Clin Pharmacol Ther 1983; 34:529–532.
179. Bengoa JM, Bolt MJ, Rosenberg IH. Hepatic vitamin D 25-hydroxylase inhibition by cimetidine andisoniazid. J Lab Clin Med 1984; 104:546–552.
180. Odes HS, Fraser GM, Krugliak P, et al. Effect of cimetidine on hepatic vitamin D metabolism inhumans. Digestion 1990; 46:61–64.
181. Sontag TJ, Parker RS. Cytochrome P450 ω-hydroxylase pathway of tocopherol catabolism: novelmechanisms of regulation of vitamin E status. J Biol Chem 2002; 277:25290–25296.
182. Morrow LE, Grimsely EW. Long-term diuretic therapy in hypertensive patients: effects on serum homo-cysteine, vitamin B6, vitamin B12, and red blood cell folate concentrations. S Med J 1999; 92:866–870.
183. Morrow LE, Grimsely EW. Long-term diuretic therapy in hypertensive patients: effects on serumhomocysteine, vitamin B6, vitamin B12, and red blood cell folate concentrations. S Med J 1999;92:866–870.
184. Seligmann H, Halkin H, Rauchfleisch S, et al. Thiamine deficiency in patients with congestive heartfailure receiving long-term furosemide therapy: a pilot study. Am J Med 1991; 91:151–155.
185. Shimon I, Almog S, Vered Z, et al. Improved left ventricular function after thiamine supplementa-tion in patients with conjestive heart failure receiving long-term furosemide therapy. Am J Med1995; 98:485–490.
186. Edelbroek PM, Zitman FG, Schreuder JN, et al. Amitriptyline metabolism in relation to antidepres-sive effect. Clin Pharmacol Ther 1984; 35:467–473.
187. Bell IR, Edman JS, Morrow FD, et al. Vitamin B1, B2, and B6 augmentation of tricyclic antidepres-sant treatment in geriatric depression with cognitive dysfunction. J Am Coll Nutr 1992; 11:159–163.
188. Pinto J, Huang YP, Pelliccione N, et al. Cardiac sensitivity to the inhibitory effects of chlorpro-mazine, imipramine and amitriptyline upon formation of flavins. Biochem Pharmacol 1982;31:3495–3499.
189. Kishi T. Inhibition of Myocardial Respiration by Psychotherapeutic Drugs and Prevention byCoenzyme Q. In: Yamamura Y, Folkers K, Ito Y, eds. Biomedical and Clinical Aspects of CoenzymeQ. Elsevier, Amsterdam, 1980, pp. 139–154.
190. D’Erasmo E, Ragno A, Raejntroph N, et al. Drug-induced osteomalacia. Recent Prog Med 1998;89:529–533.
191. Spencer H, Lender M. Adverse effects of aluminum-containing antacids on mineral metabolism.Gastroenterol 1979; 76:603–606.
192. Shafer RB, Nuttall FQ. Calcium and folic acid absorption in patients taking anticonvulsant drugs.J Clin Endocrinol Metab 1975; 41:1125–1129.
193. Reunanen MI, Sotaniemi EA, Hakkarainen HK. Serum calcium balance during early phase ofdiphenylhydantoin therapy. Int J Clin Pharmacol Biopharm 1976; 14:15–19.
194. Lukert BP, Raisz LG. Glucocorticoid-induced osteoporosis: pathogenesis and management. AnnIntern Med 1990; 112:352–364.
195. Ghishan FK, Walker F, Meneely R, et al. Intestinal calcium transport: effect of cimetidine. J Nutr1981; 111:2157–2161.
196. Caron P, Gaillard J, Barousse C, et al. Cimetidine treatment of primary hyperparathyroidism.Biomed Pharmacother 1987; 41:143–146.
197. Hakanson R, Persson P, Axelson J. Elevated serum gastrin after food intake or acid blockade evokeshypocalcemia. Regul Pept 1990; 28:131–136.
198. Stewart CA, Termanini B, Sutliff VE, et al. Iron absorption in patients with Zollinger-Ellison syn-drome treated with long-term gastric acid antisecretory therapy. Aliment Pharmacol Ther 1998;12:83–98.

866 Part IX / Critical Issues for the 21st Century
199. Campbell NR, Hasinoff BB, Meddings JB, et al. Ferrous sulfate reduces cimetidine absorption. DigDis Sci 1993; 38:950–954.
200. Partlow ES, Campbell NR, Chan SC, et al. Ferrous sulfate dos not reduce serum levels of famoti-dine or cimetidine after concurrent ingestion. Clin Pharmacol Ther 1996; 59:389–393.
201. Sturniolo GC, Montino MC, Rossetto L, et al. Inhibition of gastric acid secretion reduces zincabsorption in man. J Am Coll Nutr 1991; 10:372–375.
202. Watkins DW, Khalafi R, Cassidy MM, et al. Alterations in calcium, magnesium, iron and zincmetabolism by dietary cholestyramine. Dig Dis Sci 1985; 30:477–482.
203. Neuvonen PJ. Interactions with the absorption of tetracyclines. Drugs 1976; 11:45–54.204. Dorup I, Skajaa K, Clausen T, et al. Reduced concentrations of potassium, magnesium, and sodium-
potassium pumps in human skeletal muscle during treatment with diuretics. Br Med J 1988;296:455–458.
205. Malini PL, Strocchi E, Valtancoli G, et al. Angiotensin-converting enzyme inhibitors, thiazide diuret-ics and magnesium balance: a preliminary study. Magnes Res 1990; 3:193–196.
206. Ford ES, Mokdad AH. Dietary magnesium intake in a national sample of U.S. adults. J Nutr 2003;133:2879–2882.
207. Reusz GS, Dobos M, Vasarhelyi B, et al. Sodium transport and bone mineral density in hypercalci-uria with thiazide treatment. Pediatr Nephrol 1998; 12:30–34.
207a. Schoofs MWCJ, van der Klift M, Hofman, et al. Thiazide diuretics and the risk for hip fracture. AnnIntern Med 2003; 139:476–482.
208. Thurlimann B, Waldburger R, Senn HJ, et al. Plicamycin and pamidronate in symptomatic tumor-related hypercalcemia: a prospective randomized crossover trial. Ann Oncol 1992; 3:619–623.
209. Stanton MF, Lowenstein FW. Serum magnesium in women during pregnancy, while taking contra-ceptives, and after menopause. J Am Coll Nutr 1987; 6:313–319.
210. Seelig MS. Increased need for magnesium with the use of combined oestrogen and calcium forosteoporosis treatment. Magnes Res 1990;3:197-215.
211. Seelig MS. Interrelationship of magnesium and estrogen in cardiovascular and bone disorders,eclampsia, migraine and premenstrual syndrome. J Am Coll Nutr 1993; 12:442–458.
212. Vir SC, Love AH. Zinc and copper nutriture of women taking oral contraceptive agents. Am J ClinNutr 1981; 34:1479–1483.
213. Hinks LJ, Clayton BE, Lloyd RS. Zinc and copper concentrations in leucocytes and erythrocytes inhealthy adults and the effect of oral contraceptives. J Clin Pathol 1983; 36:1016–1021.
214. Liukko P, Erkkola R, Pakarinen, et al. Trace elements during 2 years’ oral contraception with low-estrogen preparations. Gynecol Obstet Invest 1988; 25:113–117.
215. Yunice AA, Czerwinski AW, Lindeman RD. Influence of synthetic corticosteroids on plasma zincand copper levels in humans. Am J Med Sci 1981; 282:68–74.
216. Koskelo EK. Serum selenium in children during anti-cancer chemotherapy. Eur J Clin Nutr 1990;44:799–802.
217. Baum MK, Javier JJ, Mantero-Atienza E, et al. Zidovudine-associated adverse reactions in a longi-tudinal study of asymptomatic HIV-1-infected homosexual males. J AIDS 1991; 4:1218–1226.
218. Solecki TJ, Aviv A, Bogden JD. Effect of a chelating drug on balance and tissue distribution of fouressential metals. Toxicol 1984; 31:207–216.
219. Oster JR, Materson BJ, Rogers AI. Laxative abuse syndrome. Am J Gastroenterol 1980; 74:451–458.220. Chin RL. Laxative-induced hypokalemia. Ann Emerg Med 1998; 32:517–518.221. Fleming BJ, Genuth SM, Gould AB, et al. Laxative-induced hypokalemia, sodium depletion and
hyperreninemia: effects of potassium and sodium replacement on the rennin-angiotensin-aldosteronesystem. Ann Intern Med 1975; 83:60–62.
222. Ritsema GH, Eilers G. Potassium supplements prevent serious hypokalemia in colon cleansing. ClinRadiol 1994; 49:874–876.
223. Knobel B, Petchenko P. Hyperphosphatemic hypocalcemic coma caused by hypertonic sodium phos-phate (Fleet) enema intoxication. J Clin Gastroenterol 1996; 23:217–219.
224. Ehrenpreis ED, Wieland JM, Cabral J, et al. Symptomatic hypocalcemia, hypomagnesemia, andhyperphosphatemia secondary to Fleet’s Phospho-Soda colonoscopy preparation in a patient withjejunoileal bypass. Dig Dis Sci 1997; 42:858–860.
225. Grosskopf I, Graff E, Charach G, et al. Hyperphosphataemia and hypocalcaemia induced by hypertonicphosphate enema: an experimental study and review of the literature. Hum Exp Toxicol 1991;10:351–355.

Chapter 34 / Medication and Nutrition 867
226. Ryan MP, Devane J, Ryan MF, et al. Effects of diuretics on the renal handling of magnesium. Drugs1984; 28(Suppl 1):167–181.
227. Schwinger RH, Erdmann E. Heart failure and electrolyte disturbances. Meth Find Exp ClinPharmacol 1992; 14:315–325.
228. Quamme GA. Renal magnesium handling: new insights in understanding old problems. Kidney Int1997; 52:1180–1195.
229. Al-Ghamdi SM, Cameron EC, Sutton RA. Magnesium deficiency: pathophysiologic and clinicaloverview. Am J Kidney Dis 1994; 24:737–752.
230. Reichel H, Deibert B, Geberth S, et al. Frusemide therapy and intact parathyroid hormone plasmaconcentrations in chronic renal insufficiency. Nephrol Dial Transplant 1992; 7:8–15.
231. Robertson JI. Diuretics, potassium depletion and the risk of arrhythmias. Eur Heart J 1984; 5(Suppl A):25–28.
232. Gettes LS. Electrolyte abnormalities underlying lethal and ventricular arrhythmias. Circulation1992; 85(Suppl 1):I70–76.
233. Klastersky J, Vanderklen B, Daneau D, et al. Carbenicillin and hypokalemia. Ann Intern Med 1973;78:774–775.
234. Gill MA, DuBe JE, Young WW. Hypokalemiac metabolic alkalosis induced by high-dose ampicillinsodium. Am J Hosp Pharm 1977; 34:528–531.
235. Mohr JA, Clark RM, Waack TM, et al. Nafcillin-associated hypokalemia. JAMA 1979; 242:544.236. Nanji AA, Lindsay J. Ticarcillin associated hypokalemia. Clin Biochem 1982; 15:118–119.237. Schlaeffer F. Oxacillin-associated hypokalemia. Drug Intell Clin Pharm 1988; 22:695–696.238. Nanji AA, Denegri JF. Hypomagnesemia associated with gentamicin therapy. Drug Intell Clin Pharm
1984; 18:596–598.239. Bernardo JF, Murakami S, Branch RA, et al. Potassium depletion potentiates amphotericin-B-
induced toxicity in renal tubules. Nephron 1995; 70:235–241.240. Oravcova E, Mistrik M, Sakalova A, et al. Amphotericin B lipid complex to treat invasive fungal
infections in cancer patients: report of efficacy and safety in 20 patients. Chemotherapy 1995;41:473–476.
241. Gearhart MO, Sorg TB. Foscarnet-induced severe hypomagnesemia and other electrolyte disorders.Ann Pharmacother 1993; 27:285–289.
242. Anonymous. Morbidity and toxic effects associated with ganciclovir or foscarnet therapy in a ran-domized cytomegalovirus retinitis trial: studies of ocular complications of AIDS research group, incollaboration with the AIDS Clinical Trials Group. Arch Intern Med 1995; 155:65–74.
243. Omar RF, Dusserre N, Desormeaux A, et al. Liposomal encapsulation of foscarnet protects againsthypocalcemia induced by free foscarnet. Antimicrob Agents Chemother 1995; 39:1973–1978.
244. Jacobson MA, Gambertoglio JG, Aweeka FT, et al. Foscarnet-induced hypocalcemia and effects offoscarnet on calcium metabolism. J Clin Endocrinol Metab 1991; 72:1130–1135.
245. Widmer P, Maibach R, Kunzi UP, et al. Diuretic-related hypokalemia. Eur J Clin Pharmacol 1995;49:31–36.
246. Shenfield GM, Knowles GK, Thomas N, et al. Potassium supplements in patients treated with cor-ticosteroids. Br J Dis Chest 1975; 69:171–176.
247. Stanton B, Giebisch G, Klein-Robbenhaar G, et al. Effects of adrenalectomy and chronic adrenalcorticosteroid replacement on potassium transport in rat kidney. J Clin Invest 1985; 75:1317–1326.
248. Rolla G, Bucca C, Bugiani M, et al. Hypomagnesemia in chronic obstructive lung disease: effect oftherapy. Magnes Trace Elem 1990; 9:132–136.
249. Buckley LM, Leib ES, Cartularo KS, et al. Calcium and vitamin D3 supplementation prevents boneloss in the spine secondary to low-dose corticosteroids in patients with rheumatoid arthritis: a ran-domized, double-blind, placebo-controlled trial. Ann Intern Med 1996;125: 961–968.
250. Lems WF, Van Veen GJ, Gerrits MI, et al. Effect of low-dose prednisone (with calcium and calcitriolsupplementation) on calcium and bone metabolism in healthy volunteers. Br J Rheumatol 1998;37:27–33.
251. Gennari C. Differential effect on glucocorticoids on calcium absorption and bone mass. Br J Rheumatol1993; 32(Suppl 2):11–14.
252. Subbiah V, Tayek JA. Tetany secondary to the use of a proton-pump inhibitor. Ann Intern Med 2002;137:219–220.
253. Woo M, Przepiorka D, Ippoliti C, et al. Toxicities of tacrolimus and cyclosporine A after allogenicblood stem cell transplantation. Bone Marrow Transplant 1997; 20:1095–1098.

868 Part IX / Critical Issues for the 21st Century
254. Mihatsch MJ, Kyo M, Morozumi K, et al. The side effects of ciclosporine A and tacrolimus. ClinNephrol 1998; 49:356–363.
255. Movig KLL, Leufkens HGM, Lenderink AW, et al. Serotonergic antidepressants associated with anincreased risk for hyponatremia in the elderly. Eur J Clin Pharmacol 2002; 58:143–148.
256. Baylis PH, Heath DA. Water disturbances in patients treated with oral lithium carbonate. Ann InternMed 1978; 88:607–608.
257. Walker RG. Lithium nephrotoxicity. Kidney Int 1993; 42:593–598.258. Shirley DG, Singer DR, Sagnella GA, et al. Effect of a single test dose of lithium carbonate on
sodium and potassium excretion in man. Clin Sci 1991; 81:59–63.259. Boardman PL, Hart FD. Side-effects of indomethacin. Ann Rheum Dis 1967; 26:127–132.260. Leonards JR, Levy G. Gastrointestinal blood loss from aspirin and sodium salicylate tablets in man.
Clin Pharmacol Ther 1973; 14:62–66.261. Fleming DJ, Jacques PF, Massaro JM, et al. Aspirin intake and the use of serum ferritin as a mea-
sure of iron status. Am J Clin Nutr 2001; 74:219–226.262. Golik A, Zaidenstein R, Dishi V, et al. Effects of captopril and enalapril on zinc metabolism in hyper-
tensive patients. J Am Coll Nutr 1998; 17:75–78.263. Golik A, Modai D, Averbukh Z, et al. Zinc metabolism in patients treated with captopril versus
enalapril. Metabolism 1990; 39:665–667.264. O’Connor DT, Strause L, Saltman P, et al Serum zinc is unaffected by effective captopril treatment
of hypertension. J Clin Hypertension 1987; 3:405–408.265. Wester PO. Zinc balance before and during treatment with bendroflumethiazide. Acta Med Scand
1980; 208:265–267.266. Reyes AJ, Leary WP, Lockett CJ, et al. Diuretics and zinc. S Afr Med J 1982; 62:373–375.267. Keen CL, Mark-Savage P, Lönnerdal B, et al. Teratogenic effects of D-penicillamine in rats: relation
to copper deficiency. Drug–Nutr Interact 1983; 2:17–34.268. Dastych M, Jezek P, Richtrova M. Effect of penicillamine therapy on the concentration of zinc, cop-
per, iron, calcium, and magnesium in the serum and their excretion in urine. Z Gastroenterol 1986;24:157–160.
269. Teherani DK, Altmann H, Tausch G, et al. Zinc levels in blood and urine of rheumatoid arthritispatients after four months treatment with D-penicillamine. Z Rheumatol 1980; 39:395–400.
270. Seelig MS. Auto-immune complications of D-penicillamine: a possible result of zinc and magne-sium depletion and of pyridoxine inactivation. J Am Coll Nutr 1982; 1:207–214.
271. Sandstead HH. Requirements and toxicity of essential trace elements, illustrated by zinc and copper.Am J Clin Nutr 1995; 61(suppl):621–624.
272. Ravina A, Slezak L, Mirsky N, et al. Reversal of corticosteroid-induced diabetes mellitus with sup-plemental chromium. Diabet Med 1999; 16:164–167.
273. Peretz AM, Neve JD, Famaey JP. Selenium in rheumatic diseases. Semin Arthrit Rheum 1991;20:305–316.
274. Chien LT, Krumdiek CL, Scott CW, et al. Harmful effects of megadoses of vitamins: electroen-cephalogram abnormalities and seizures induced by intravenous folate in drug-treated epileptics.Am J Clin Nutr 1975; 28:51–58.

From: Preventive Nutrition: The Comprehensive Guide for Health Professionals, Third EditionEdited by: A. Bendich and R. J. Deckelbaum © Humana Press Inc., Totowa, NJ
869
35 Health Claims for Foodsand Dietary SupplementsCurrent and Emerging Policies
Annette Dickinson
KEY POINTS
● There is scientific consensus that improving dietary habits helps to promote health andreduce the risk of chronic diseases.
● Scientifically substantiated health claims in food labeling can help consumers identifyhealthy foods and food habits that may protect health and prevent disease.
● The Nutrition Labeling and Education Act of 1990 authorized the US Food and DrugAdministration (FDA) to approve health claims for foods and dietary supplementswhen the claims were supported by “significant scientific agreement,” and a number ofsuch claims have been approved.
● Courts have ruled that the FDA must also consider permitting “qualified” health claimswhen such claims are truthful and not misleading, and the agency has permitted a num-ber of qualified health claims.
● The Dietary Supplement Health and Education Act of 1994 authorized marketers ofdietary supplements to use label statements describing the effect of a product on the struc-ture and function of the body (under certain conditions), and these “structure/function”statements are widely used.
● The interest in health claims is global, but different countries and international policy-making bodies have adopted markedly different regulatory structures for handlingsuch claims.
1. INTRODUCTION
Although there is widespread scientific acceptance of the importance of diet in reduc-ing the risk of chronic disease, there is continuing controversy about the extent to whichstatements about diet and health may be appropriately included in food product label-ing and advertising. The United States has undertaken major initiatives in exploringmechanisms for harnessing the power of commercial product labeling to convey or rein-force government-sanctioned health messages about specific types of foods or foodcomponents, and other countries and international organizations also are exploring

870 Part IX / Critical Issues for the 21st Century
alternatives for permitting health-related statements in the labeling of conventionalfoods and dietary supplements. Over the past decade, public policy regarding healthclaims for food has evolved based on complex legal and scientific considerations. A listof abbreviations used in this chapter appears in Table 1.
2. PUBLIC HEALTH RECOMMENDATIONS IN THE UNITED STATES
Scientific and public acceptance of the existence of a strong relationship between dietand health has been growing for more than two decades in the United States and world-wide. An early and influential compilation of the data appeared in 1977, when theSenate Select Committee on Nutrition and Human Needs published its report on DietaryGoals for the United States (1). The report included recommendations for dietary pat-terns that might decrease the risk of several “killer diseases,” such as cancer and heartdisease. Although there was opposition to the dietary goals from some quarters, the con-cept of public recommendations for dietary changes that lead disease prevention soonbecame firmly established.
Following publication of the report by Senate Select Committee, Congress directedthe Department of Health and Human Services and the United States Department ofAgriculture to prepare a set of dietary guidelines for reducing the risk of chronic dis-ease. The first edition of Dietary Guidelines for Americans appeared in 1980 and, byCongressional directive, has been re-evaluated and republished every 5 yr thereafter (2).The sixth set of these guidelines is currently being developed by an expert committeeand will be finalized before the end of 2005.
In 1979, the Surgeon General’s Report on Health Promotion and Disease Prevention,Healthy People, set forth a broad agenda for preventive actions that could be taken toreduce health risks, including some general nutritional recommendations similar tothose suggested by the Senate Select Committee (3). This report ultimately led to thedevelopment of a series of wide-ranging US action plans that call on federal, state, andlocal governments as well as other public and private organizations to take cooperative
Table 1Abbreviations Used in This Chapter
Ca CalciumCDC Centers for Disease Control and PreventionCHD Coronary heart diseaseDRI Dietary Reference IntakeDSHEA Dietary Supplement Health and Education Act (1994)FDA Food and Drug AdministrationFDAMA Food and Drug Administration Modernization Act (1997)FOSHU Food for Specified Health Uses (Japan)FTC Federal Trade CommissionNCI National Cancer InstituteNLEA Nutrition Labeling and Education Act (1990)NRC National Research CouncilNTDs Neural tube birth defectsRDA Recommended Daily (Dietary) AllowancesRDI Reference Daily Intakeω-3 Polyunsaturated fatty acids

Chapter 35 / Health Claims for Foods 871
action to measurably reduce recognized risk factors and to increase health-promotingbehaviors. Objectives have been defined for the third decade of the program—HealthyPeople 2010 (4).
In 1982, the National Research Council (NRC) published a report called Diet,Nutrition, and Cancer, which outlined specific dietary recommendations for cancerreduction (5). The report called for increased consumption of fruits and vegetables thatare rich in antioxidant vitamins, cruciferous vegetables, and grains and other foods thatare rich in fiber. It emphasized that these recommendations were aimed at increasingintakes of certain food groups or types of foods—not specific nutrients.
In 1988 and 1989 the Surgeon General’s report on on Nutrition and Health and the NRCreport on Diet and Health, respectively, reviewed the data and made broad recommenda-tions regarding dietary habits that were likely to help reduce the risk of cancer, heart dis-ease, hypertension, diabetes, obesity, osteoporosis, and other chronic diseases (6,7).
In 1994, the Food and Nutrition Board of the National Institute of Medicine pub-lished a thoughtful document regarding the philosophical and scientific basis for theRecommended Daily (Dietary) Allowances (RDAs) and indicated that, for the first time,a document existed to evaluate the potential for chronic disease prevention as well asclassic measures of nutritional status in establishing new recommendations (8). Thateffort is now complete and has already resulted in reports that provide recommendationsfor six categories of nutrients (9–14). These reports establish Dietary Reference Intakesfor specific nutrients, potentially including estimated average requirements, adequateintakes, RDAs, and upper levels of tolerable intake. Reports cover calcium and relatednutrients, B-vitamins, antioxidant nutrients, trace nutrients, and macronutrients, andelectrolytes. The reports include extensive discussions of the potential for diseasereduction that is related to increased intakes of many nutrients; however, in most cases,the recommended intakes are based on traditional measures of nutritional status ratherthan on disease prevention. However, substantially increased intakes of calcium andvitamin D are recommended, especially for older adults, to help enhance bone densityand reduce the risk of osteoporosis (see Chapter 18). The report on B-vitamins urgeswomen of childbearing age to get 0.4 mg (400 μg) of synthetic folic acid per day inaddition to their usual dietary folate intake to reduce the risk of having a baby withneural tube defects (NTDs) (see Chapter 24). The evidence on antioxidants and diseaseprevention is insufficient to form the basis for new and higher intake recommendations,but more research is encouraged (see relevant chapters in the sections on cancer andcardiovascular disease.)
As these various examples indicate, US public health policy regarding diet and healthhas been moving steadily in the direction of putting increased emphasis on the potentialfor reducing the risk of chronic disease through dietary changes.
3. THE US FOOD MARKETPLACE AND THE LAW
Although the scientific community was developing new dietary recommendationsintended to reduce disease risk, food marketing companies both in the United States andglobally were constrained in their ability to make use of this information in labeling andadvertising. As discussed later, disease-related statements in food labeling were officiallyviewed by the US Food and Drug Administration (FDA) as inappropriate or illegal, andthe food industry was accordingly restricted in promoting health benefits.

872 Part IX / Critical Issues for the 21st Century
In 1984, the National Cancer Institute (NCI) was pursuing various educational pro-grams to increase public awareness of dietary patterns that might reduce cancer risk. Aspart of this initiative, NCI entered into a joint national campaign with the KelloggCompany to promote diets that were high in fiber. Informational messages appearedprominently in the labeling of certain of Kellogg’s high-fiber cereals.
The US Food, Drug, and Cosmetic Act defines drugs, in part, as products “intendedfor use in the diagnosis, cure, mitigation, treatment, or prevention of disease in man orother animals.” Under this law, claims relating to disease prevention were viewed his-torically as drug claims and were not permitted in food labeling. However, in 1984,faced with Kellogg’s cereals that bore NCI-supported claims about fiber and cancer, theFDA entered into a public dialogue about the desirability of permitting “health claims”for foods under certain conditions.
Several forces were at work during this period. The food industry was increasingly anx-ious to use the strong science base to promote foods with desirable characteristics.Consumer advocates were concerned that claims were getting out of control and urgedCongress to permit only those claims that were specifically authorized by the FDA understrict guidelines. In 1989, the Federal Trade Commission (FTC) released a report conclud-ing that fiber claims in the marketplace had both increased consumer awareness of the rela-tionship between fiber and cancer and increased the number of high-fiber products thatwere available to the public (14). Both of these outcomes were viewed as positive devel-opments by the authors of the FTC report. The FDA began the process of developing guide-lines (or regulations) for health claims, but some legal questions persisted about whetherthe FDA had the authority to permit health claims for foods without a change in the statute.
In 1990, Congress passed the Nutrition Labeling and Education Act (NLEA),which gave the FDA clear authority to permit health claims in food labeling undercertain conditions. (NLEA also put mandatory nutrition labeling in place and definednutrient content claims, but neither of these aspects of NLEA are discussed in thischapter.) A health claim is defined as a label statement characterizing the relation-ship of a nutrient or food component to a disease or health-related condition. Underthe new law, foods with approved health claims are not considered “drugs” solelybecause their labeling contains a health claim, although by definition, the healthclaim must mention a disease or health-related condition.
To approve an NLEA health claim, the FDA must determine, “based on the totalityof publicly available scientific evidence (including evidence from well-designed stud-ies conducted in a manner which is consistent with generally recognized scientific pro-cedures and principles), that there is significant scientific agreement, among expertsqualified by scientific training and experience to evaluate such claims, that the claim issupported by such evidence.” Also, the FDA must issue a regulation describing requiredcomponents of the claim to ensure that the claim accurately conveys the nutrient–dis-ease relationship. The NLEA specified that the claim should enable consumers “to com-prehend the information provided in the claim and to understand the relativesignificance of such information in the context of a total daily diet.”
The NLEA provided the FDA with a list of 10 health claims that the agency wasrequired to evaluate initially, including 4 designated as claims for dietary supplements.The six core claims listed in the NLEA related to fat and cancer, fat and heart disease,sodium and hypertension, fiber and cancer, fiber and heart disease, and calcium andosteoporosis. The four claims listed as dietary supplement claims were for antioxidant

Chapter 35 / Health Claims for Foods 873
vitamins and cancer, folic acid and NTDs, ω-3 fatty acids and heart disease, and zincand immune function in the elderly.
4. US HEALTH CLAIMS REGULATIONS
In January 1993, the FDA finalized regulations establishing “general requirements”for health claims (15). For a food to be eligible for a health claim, it must not containdisqualifying amounts of any “risk nutrients,” including total fat, saturated fat, choles-terol, or sodium. Also, a serving of the food must naturally contain at least 10% of theRDA of vitamins A and C, iron, calcium, protein, or fiber. This provision, sometimesreferred to as the “jelly bean rule,” is intended to ensure that foods that bear healthclaims are products with some inherent nutritional value. If a health claim suggests thatpeople should consume more of any substance (such as calcium or folic acid or fiber),the FDA must make a determination that the substance is safe and lawful. Additionally,the substance must contribute taste, aroma, nutritive value, or a designated technicaleffect in foods and must retain those qualities when consumed at levels high enough tojustify the health claim. In the regulation authorizing a health claim, the FDA provides“model claims” that may be used in product labeling. Marketers are not limited to thelanguage of the “model claim,” but the language they use must convey certain informationspecified in the regulation.
In 1993, the FDA issued separate regulations approving three health claims for foodsthat were low in certain components that were related to disease risk (16–18). Theseincluded claims that foods low in lipids may help reduce the risk of cancer, that foodslow in saturated fat and cholesterol may help reduce the risk of coronary heart disease(CHD), and that foods low in sodium may help reduce the risk of hypertension.
Meanwhile, the FDA approved three health claims for foods that were naturally goodsources of dietary fiber, soluble fiber, or two of the antioxidant vitamins (19–21). In allthree cases, the FDA argued that the available evidence indicated that diets that werehigh in these nutrients were protective against cancer and/or heart disease but did notpermit a determination that these nutrients were the cause of the protective effect (i.e.,the FDA concluded that fiber and antioxidant vitamins may be only markers for pro-tective foods or disease-reducing food habits). Under these regulations, health claimsabout reduction of cancer risk may be made for fruits, vegetables, and grains that arelow in fat and are naturally good sources of dietary fiber, vitamin C, or vitamin A fromβ-carotene. Health claims also may be made about the reduction of CHD risk by fruits,vegetables, and grains that are low in fat, saturated fat, and cholesterol and that containat least 0.6 g of soluble fiber per serving.
The FDA declined to approve any health claims for specific fiber sources in 1993,but the agency indicated that it would be willing to review health claim petitions basedon sufficient evidence showing that specific fibers lower cholesterol. In 1997 and 1998,the FDA approved petitions for health claims for oat fiber and psyllium fiber (22,23).The oat claim is permitted for foods (including dietary supplements) that contain a suf-ficient amount of oat bran, rolled oats, or whole oat flour to provide at least 0.75 g ofβ-glucan-soluble fiber per serving. The psyllium claim is permitted for foods (includingdietary supplements) that contain at least 1.7 g of psyllium fiber per serving. In 1999,the FDA approved a health claim for soy protein; this claim was also approved on thegrounds that soy protein lowers cholesterol, and therefore, may reduce the risk of heart

874 Part IX / Critical Issues for the 21st Century
disease (24). The claim is permitted for foods that are low in saturated fat and choles-terol and that contain at least 6.25 g of soy protein per serving. A health claim has alsobeen permitted for foods containing stanol or sterol esters, which lower cholesterol andthus may reduce the risk of heart disease (25).
In 1993, in addition to the three claims for foods low in “risk nutrients” and the threeclaims for food groups naturally high in some beneficial nutrients, the FDA alsoapproved one claim that could appear on supplements and fortified foods as well asunfortified conventional foods. This was the calcium health claim, which may be usedin the labeling of a food or dietary supplement that meets the general requirements forhealth claims and contains at least 200 mg of calcium per serving (26). The claim indi-cates that diets that are high in calcium may reduce the risk of osteoporosis.
In all of the 1993 regulations that approved health claims, the FDA relied heavily on theSurgeon General’s Nutrition and Health report, the NRC Diet and Health report, and theDietary Guidelines for Americans as evidence of “significant scientific agreement” regard-ing specific diet and health relationships. Health claims for diet–disease relationships thatwere not favorably considered in these reports were disapproved, including claims for ω-3fatty acids and heart disease and for zinc and immune function in the elderly (27,28).Disapproval of a health claim was interpreted to mean that no statements about thediet–disease relationship could be made in food or dietary supplement labeling—not evena statement that accurately described the state of the emerging evidence. This interpretationwas challenged in subsequent litigation, as will be discussed later.
In 1996, the FDA approved a health claim petition that foods sweetened with sugaralcohols were related to a reduced risk of dental caries (29). The rule permits the use ofxylitol, sorbitol, mannitol, maltitol, isomalt, lactitol, hydrogenated starch hydrolysates,hydrogenated glucose syrups, or a combination thereof. In 1997, erythritol was addedto the list of sugar alcohols that are eligible for this health claim (30).
The health claim that was the subject of the greatest controversy involved the rela-tionship between the Β-vitamin folic acid and a reduced risk of giving birth to a babywith a NTD. In 1997, the delay in approving the folic acid health claim eventually ledto the development of an alternative procedure for permitting health claims. In 1992,the US Public Health Service issued a recommendation that urged women of child-bearing age to obtain 0.4 mg of folic acid daily before conception and early in preg-nancy to reduce the risk of having a baby with a NTD such as spina bifida oranencephaly (31). The development of this recommendation was spearheaded by sci-entists at the Centers for Disease Control and Prevention (CDC). Although the FDA,as part of the Public Health Service, participated in the development of this recom-mendation, in 1993, the agency declined to authorize a health claim for folic acid (32),because it was considering requiring mandatory enrichment of grain products withfolic acid and was concerned about potential safety issues if some individuals obtainedadditional folic acid from other sources, including foods and dietary supplements thatbore health claims.
The FDA did not officially approve a health claim for folic acid until 1996 (33). Theagency indicated that the safety issues had been resolved, because an enrichment planhad been developed that would maintain total folic acid intake within safe ranges. Thehealth claim is permitted in the labeling of any foods or supplements that provide atleast 10% of the Reference Daily Intake (RDI) of folic acid. This relatively low levelwas selected as the basis for the suggestion to permit the claim to appear on the largest

Chapter 35 / Health Claims for Foods 875
possible number of fruits and vegetables. Although this same low trigger level appliesin defining the eligibility of a dietary supplement for this health claim most dietary sup-plements that contain folic acid provide the full RDI of 0.4 mg (400 μg). The regulationalso requires that dietary supplements bearing the folic acid health claim must meet dis-integration and dissolution standards established by the US Pharmacopeia or must beshown to be bioavailable.
Simultaneously with the finalization of the folic acid health claim, the FDA also final-ized a series of rules amending the Standards of Identity for enriched grain products torequire mandatory addition of folic acid, beginning in 1998 (34). Products that wereaffected included enriched flour, corn meal, breads, rice, and pasta. The agency alsoamended the food additive rule on folic acid to define other permitted uses of folic acid infoods (35). The revised rule permitted breakfast cereals to contain up to 0.4 mg of folicacid per serving and also permitted addition of folic acid to infant formula, medical foods,and foods for special dietary use; other addition of folic acid to foods is not allowed.
Table 2 is a summary list of the NLEA health claims that had been approved by theFDA as of September 2004.
5. FOOD AND DRUG ADMINISTRATION MODERNIZATION ACT OF 1997 HEALTH CLAIMS
The FDA Modernization Act of 1997 (FDAMA) was a major legislative initiativethat had broad effects on the regulation of drugs and devices and on FDA approaches topriority-setting and stakeholder involvement in the decision-making process. Among itsmany provisions, FDAMA also created an alternative route for permitting health claims
Table 2NLEA Health Claims Approved by the US Food and Drug Administration
as of September 2004
Food Claim
Health claims for foods low in certain componentsFoods low in total fat and saturated fat Reduced cancer riskFoods low in saturated fat and cholesterol Reduced risk of CHDFoods low in sodium Reduced risk of hypertensionHealth claims for foods naturally containing certain componentsFoods that are good sources of fiber Reduced risk of cancerFoods that are good sources of soluble fiber Reduced risk of CHDFoods that are good sources of vitamin C or β-carotene Reduced risk of cancerHealth claims for specific food components, whether added or naturally occurringFoods high in calcium Reduced risk of osteoporosisFoods with folate or folic acid Reduced risk of having a baby
with NTDsFoods sweetened with sugar alcohols Reduced risk of dental cariesFoods with whole oats or oat bran containing β-glucan Reduced risk of heart diseaseFoods with psyllium fiber Reduced risk of heart diseaseFoods with soy protein Reduced risk of heart diseaseFoods with stanol and sterol esters Reduced risk of heart disease
Abbreviations: CHD, coronary heart disease; NTD, neural tube defect.

876 Part IX / Critical Issues for the 21st Century
for foods. The FDA delay in approving the folic acid health claim was frequently andstrongly criticized. Marketers argued that they should have been able to base a healthclaim on the 1992 Public Health Service recommendation, despite the absence of FDAapproval of a formal health claim for folic acid. This argument found a sympathetic earin Congress; therefore, FDAMA contains a provision that permits manufacturers tomake health claims based on authoritative statements by certain scientific bodies,including the National Institutes of Health, the CDC, and the National Academy ofSciences. Before making a health claim based on an authoritative statement by an appro-priate scientific body, a company must notify the FDA 120 d in advance. This providesthe FDA with an opportunity to evaluate the claim and to deny it or require modificationsif it is found not to be valid.
In 1998, the FDA denied an early petition for nine FDAMA health claims, largelybecause the statements cited were not authoritative statements of scientific bodies(36). In 1999, the FDA allowed the use of the first FDAMA health claim—a healthclaim submitted by General Mills based on the Diet and Health report from 1989 bythe National Academy of Sciences. The claim states that the consumption of wholegrain foods is related to a reduced risk of heart disease and some cancers. In 2000,the FDA allowed a health claim submitted by Tropicana that suggested that foodsthat are good sources of potassium and are low in sodium may reduce the risk forhigh blood pressure and stroke; this claim was also based on the 1989 Diet andHealth report.
6. COURT OF APPEALS DECISION
Some may be surprised to learn that government regulations (including FDA regula-tions) can raise constitutional issues. The first amendment to the United StatesConstitution guarantees freedom of speech, and the courts have held that this protectionextends to not only to individual speech but to commercial speech as well (such as label-ing and advertising). The government can prohibit false or misleading commercialspeech but is constrained in its ability to restrict speech that is truthful and not mislead-ing. In the case of health claims, the FDA does not allow the use of fully authorizedNLEA health claims unless they are supported by “significant scientific agreement.”Qualified health claims (health claims with disclaimers about the strength of the evi-dence) also were not considered permissible, even if they truthfully described the levelof scientific support for a particular diet–disease relationship.
Several parties brought suit against the FDA for violating the first amendment bydenying certain health claims. The first successful case was argued by attorney JonathanEmord on behalf of a coalition of petitioners, including Durk Pearson and Sandy Shaw(authors who are also developers and marketers of some dietary supplement products),the American Preventive Medical Association (a health rights advocacy organizationwhose members are health care practitioners), and Citizens for Health (a health rightsadvocacy organization whose members are consumers). In this case, Pearson v. Shalala,in January 1999, a US Court of Appeals ruled that some aspects of the FDA currenthealth claims approval process may have violated the first amendment as well as theAdministrative Procedure Act (37). The court concluded that the FDA needed to betterdefine the term “significant scientific agreement” and at least consider the appropriate-ness of permitting “qualified” health claims. For example, the FDA rejected specific health

Chapter 35 / Health Claims for Foods 877
claims for antioxidants because the evidence suggested a beneficial effect of certain typesof foods, but the component responsible for the effect was not definitive. The court sug-gested that rather than banning the claim for antioxidant vitamins outright, the FDAshould have considered permitting a claim with a required disclaimer, such as: “The evi-dence is inconclusive because existing studies have been performed with foods containingantioxidant vitamins, and the effect of those foods on reducing the risk of cancer mayresult from other components in those foods.”
In this ruling, the court cited legal precedents that overturned government regulations“that seek to keep people in the dark for what the government perceives to be their owngood.” The court suggested that more, rather than less, information may be the solution.At the same time, the court recognized that when the evidence against a claim out-weighs the evidence in its favor, the FDA may choose to ban it outright (i.e., a dis-claimer cannot salvage a claim that is basically misleading). Regulations denyingsubstance-specific health claims for dietary fiber and cancer, antioxidant vitamins andcancer, and ω-3 fatty acids and CHD were remanded to the FDA with instructions forreconsideration. The agency was also instructed to reconsider some aspects of the folicacid health claim.
In December 1999 and January 2000, the FDA announced its plan for implementingthe court’s decision, issued a guidance document that better defined “significant scien-tific agreement,” and re-opened the comment period on the four claims at issue (38–40).Although the agency was reconsidering the evidence on those claims, attorney JonathanEmord submitted additional health claims for consideration, including claims relatingto vitamin E and heart disease, Β-vitamins (folic acid and vitamins B6 and B12) and car-diovascular disease (CVD), and saw palmetto and benign prostatic hyperplasia.
In its decision to permit some qualified health claims, the FDA adopted the approachof “exercising enforcement discretion” by not challenging the claims, rather thanapproving them outright. Notification of the agency’s decision is provided in the formof a letter to the petitioner who has requested the health claim, and the letter is postedon the FDA website. No regulation is adopted regarding the qualified health claim. Inthis manner, the FDA agreed to permit qualified health claims relating to ω-3 fatty acidsand heart disease, Β-vitamins and CVD, and some aspects of the claim relating to folicacid and NTDs. The FDA provided model language, which it considered to be appro-priate for each claim. For example, in the ω-3 claim, the agency suggested the followingmodel language: “Consumption of ω-3 fatty acids may reduce the risk of CHD. FDAevaluated the data and determined that, although there is scientific evidence supportingthe claim, the evidence is not conclusive.”
The agency declined to permit qualified health claims for antioxidants and cancer orfor vitamin E and heart disease, because the weight of the scientific evidence was notsupportive of a beneficial effect. The FDA also denied any health claim for saw pal-metto and benign prostatic hyperplasia, because the claim related to a treatment effectin cases where hyperplasia already existed, rather than a preventive or risk reductioneffect in healthy men.
Emord appealed the FDA denial of the antioxidant health claim, arguing that the agencyhad overinterpreted the degree of scientific support that was required for a qualified healthclaim. The agency reviewed more than 150 studies and found that the evidence against theclaim outweighed the evidence in favor of it. The FDA concluded that the claim would beinherently misleading to a degree that could not be cured by a disclaimer. In December

878 Part IX / Critical Issues for the 21st Century
2002, a United States District Court ruled against the FDA, noting that approximately one-third of the studies that the FDA examined were supportive of the antioxidant claim andthat the “FDA’s decision to ban the claim completely is not in accordance” with the Courtof Appeals’ findings in Pearson v. Shalala (41). The court instructed the FDA to craft oneor more “short, succinct, and accurate disclaimers” to be used in the context of a qualifiedhealth claim about antioxidants and cancer risk. The FDA subsequently agreed to permit aqualified health claim, such as: “Some scientific evidence suggests that consumption ofantioxidant vitamins may reduce the risk of certain forms of cancer. However, FDA hasdetermined that this evidence is limited and not conclusive” (42).
Emord appealed the FDA denial of the saw palmetto health claim, suggesting that theNLEA defines a health claim as a statement describing the relationship between a nutri-ent and a disease or health-related condition and does not specify that the relationshipmust be preventive in nature. However, the FDA’s denial of the claim was upheld by theCourt of Appeal (42a).
7. THE FOOD AND DRUG ADMINISTRATION’S INITIATIVE ONCONSUMER HEALTH INFORMATION FOR BETTER NUTRITION
The FDA approach to the evaluation and approval of health claims in the decade fol-lowing the passage of the NLEA (1990) was highly conservative. Mark B. McClellantook office in November 2002 as the new Commissioner of the FDA. McClellan is aphysician and an economist who quickly adopted a more proactive view of the FDA rolein regulating the flow of health information to the consumer. In December 2002, heannounced the formation of a Task Force on Consumer Health Information for BetterNutrition; in July 2003, he released a Task Force report establishing new groundrules forthe review of health claims—especially qualified health claims (42). The FDA empha-sized that this new approach would provide consumers with “better, easily understood,up-to-date scientific information about how dietary choices can affect health.” Theagency stated that it would encourage marketers of conventional foods and dietary sup-plements to compete on the basis of health and nutrition benefits in addition to other prod-uct characteristics, such as taste and convenience. The FDA emphasized that it wanted to“reward companies that make healthier products.” Meanwhile, the agency promised thatit would increase enforcement action against companies “that appeal to consumersthrough false and misleading health claims.”
As part of this new initiative, the FDA announced that it would consider both conven-tional foods and dietary supplements to be eligible for qualified health claims. Followingthe Pearson v. Shalala decision in 1999, the FDA had taken the view that qualified healthclaims would only be available for dietary supplements, because the case had beenbrought in relation to dietary supplement claims. However, because the decision wasbased on first amendment grounds, many stakeholders believed it should apply to all foodproducts that were eligible for health claims; therefore, the FDA adopted the current view.
The FDA permitted four new qualified claims in 2003, relating to selenium and can-cer, phosphatidylserine and cognitive dysfunction, nuts and heart disease, and walnutsand heart disease. All of these claims were evaluated on the basis of petitions submit-ted to the agency. The FDA suggested model language for each of the claims. The sug-gested language for the qualified claim for nuts was relatively positive, stating that“Scientific evidence suggests but does not prove that eating 1.5 ounces per day of most

Chapter 35 / Health Claims for Foods 879
nuts as part of a diet low in saturated fat and cholesterol may reduce the risk of heartdisease.” At the other end of the spectrum, the suggested model language for phos-phatidylserine was very highly qualified. Table 3 provides a summary listing of thequalified health claims that are currently permitted by the FDA.
Another legal challenge was filed against FDA as a result of this newly expeditedapproach to evaluating qualified health claims. Two consumer advocacy groups, theCenter for Science in the Public Interest and Public Citizen, charged that the newapproach is illegal because it does not sufficiently protect consumers against potentiallymisleading information and in because the NLEA requires approval of health claims togo through formal rulemaking and not through informal procedures such as those theFDA used in dealing with the 2003 qualified health claims. However, the challenge wasdismissed by the court (42b).
All stakeholders agree that is it important for qualified health claims to be supportedby a meaningful level of scientific evidence; however, defining the amount of evidenceneeded in each case will be an ongoing challenge for the agency.
8. STATEMENTS ABOUT EFFECTS ON STRUCTURE OR FUNCTION
The term “health claim,” as used in this chapter, refers to health claims as defined inthe NLEA of 1990—statements specifically describing the relationship between a foodor food component and a disease or health-related condition, evaluated by the FDA andapproved by regulation based on a finding that the claims are supported by significantscientific agreement. However, there are other types of statements relating to healtheffects of a product that can be made in labeling and advertising for both conventionalfoods and dietary supplements. The Food, Drug, and Cosmetic Act of 1938 distin-guishes between drugs and foods largely on the basis of the uses for which these prod-ucts are intended. Foods are simply products used for food. Drugs are defined partially as“articles intended for use in the diagnosis, cure, mitigation, treatment, or prevention ofdisease in man or other animals.” Drugs also are defined as “articles (other than food)intended to affect the structure or any function of the body of man or other animals.”
Table 3Qualified Health Claims Permitted by the US Food and Drug Administration
as of September 2004
Qualified claims about cancer riskSelenium and cancerAntioxidant vitamins and cancer
Qualified claims about cardiovascular riskNuts and heart diseaseWalnuts and heart diseaseω-3 fatty acids and coronary heart diseaseB-vitamins and vascular disease
Qualified claims about cognitive functionPhosphatidylserine and cognitive dysfunction and dementia
Qualified claims about neural tube defects (NTDs)Folic acid at a level of 0.8 mg, related to NTDs

880 Part IX / Critical Issues for the 21st Century
In the latter part of the drug definition, the law basically recognizes that foods haveeffects on structure and function and that such uses are not drug uses. The FDA has his-torically permitted some statements regarding the effects on structure and function toappear in food labeling and advertising, but it has argued in numerous legal cases thatmany particular statements about structure/function effects are actually implied diseaseclaims and, therefore, not permissible for foods. The line between appropriate struc-ture/function statements and illegal disease claims has been a subject of considerablediscussion in the past decade because of new provisions that were added to the Food,Drug, and Cosmetic Act in 1994.
The Dietary Supplement Health and Education Act of 1994 (DSHEA) defines dietarysupplements and permits them to bear “Statements of Nutritional Support.” (TheDSHEA also has numerous other provisions, which are not addressed in this chapter.)Dietary supplements have always been considered as a subcategory of foods, and theywere classified as foods for special dietary use under the 1938 Food, Drug, andCosmetic Act. The DSHEA reaffirms that dietary supplements are foods and provides abroad definition. A dietary supplement is defined as “a product (other than tobacco)intended to supplement the diet.” Such products may contain vitamins, minerals, herbsor other botanicals, amino acids, or almost any other dietary substance that may be usedto supplement the diet. Products may contain concentrates, metabolites, constituents,extracts, or any combination of the permitted types of ingredients. Dietary supplementsmay be in dosage forms, such as tablets or capsules, or may be in the physical form ofconventional foods, provided they are not “represented for use as a conventional food”and are not intended as the sole item of a meal or of the diet.
Under the DSHEA, dietary supplement labeling is permitted to contain “Statementsof Nutritional Support.” These statements may describe the role of a nutrient or dietaryingredient that is intended to affect the structure or function of the body, may charac-terize the documented mechanism for such an effect, may relate to general well-being,or may claim a benefit related to a classical nutrient deficiency disease (provided thestatement also discloses the prevalence of the deficiency in the United States). Thesestatements may not claim to diagnose, mitigate, treat, cure, or prevent a specific diseaseor class of diseases.
Additionally. under the DSHEA, the manufacturer of any dietary supplement making aStatement of Nutritional Support is required to have substantiation that the statement istruthful and not misleading. Also, the label should contain the following disclaimer to avoidany implication that the statement is an FDA-authorized health claim or an FDA-approveddrug claim: “This statement has not been evaluated by the Food and Drug Administration.This product is not intended to diagnose, treat, cure, or prevent any disease.”
Marketers are required to notify the FDA within 30 d if they are making a Statementof Nutritional Support in labeling. According to a database compiled by AACConsulting, the FDA has received letters of notification from hundreds of companiesregarding more than 10,000 Statements of Nutritional Support (43). The most com-monly mentioned statements relate to emotional or mental health, cholesterol or theheart, energy and strength, immune function, antioxidant effects, joints and bones,digestion or gastrointestinal function, weight loss, urinary function or prostate health,and women’s health. FDA does not evaluate or approve Statements of NutritionalSupport, but it has responded to some letters of notification, indicating that the agencyviews the proposed statement as a disease claim or an unauthorized health claim.

Chapter 35 / Health Claims for Foods 881
Approximately 10% of the letters of notification have triggered FDA responses, whichare called “courtesy letters” (to distinguish them from formal enforcement noticescalled “warning letters”).
A few examples illustrate the current usage of Statements of Nutritional Support. Inthe area of immune function, Statements of Nutritional Support commonly appear ondietary supplements such as zinc or echinacea, indicating that the product supports ahealthy immune system or enhances natural resistance. The FDA has found these state-ments to be permissible but has objected to any specific mention of diseases such ascolds, flu, sore throat, and bronchitis. Statements about supporting normal joint func-tion or joint flexibility are commonly used for products such as glucosamine and chon-droitin sulfate. The FDA has found statements about supporting normal function to beacceptable but has objected to any specific reference to joint pain or to arthritis orrheumatism.
FDA regulatory oversight of Statements of Nutritional Support has thus far primar-ily concentrated on evaluating whether the statements legally qualify under the DSHEAand has not extended to probing the manufacturer’s substantiation for the statements.Although many Statements of Nutritional Support clearly are consistent with the rec-ognized effects of certain nutrients or botanical ingredients, there is substantial concernregarding the scientific basis of some label statements currently seen in the marketplace.Some groups have called for formal evaluation of the evidence supporting such state-ments. In its 1997 report, the Commission on Dietary Supplement Labels emphasizedthe importance of ensuring that Statements of Nutritional Support are adequately sub-stantiated, so that consumers are provided with scientifically valid information (44).The commission also suggested that summaries of the substantiation be made availableto the public so that consumers and health professionals could better evaluate the claimsbeing made.
Although it appears that Statements of Nutritional Support have, to some extent,accomplished the objective of better informing consumers about the uses of certaindietary supplements, there is concern regarding the blurring of traditional boundariesbetween permissible food claims and drug claims. In January 2000, the FDA finalizedregulations that are intended to better define the boundaries between permissible struc-ture/function statements and impermissible direct or implied disease claims (45). In thefinal rule, the FDA provides numerous examples of permitted and prohibited claims toillustrate the agency’s view of what constitutes an implied disease claim. Acceptablestatements include claims relating to normal symptoms of the menstrual cycle ormenopause (mild mood changes, cramps, hot flashes) and claims relating to mild memoryproblems or absentmindedness associated with aging. However, the agency finds thatstatements relating to benign prostatic hypertrophy would be considered disease claims,because the consequences are potentially more serious. Also, statements relating to low-ering cholesterol or decreasing platelet aggregation would be considered to be impliedclaims about heart disease and, therefore, are not permitted. Statements about main-taining healthy function generally would be acceptable. One of the more surprisingaspects of the final rule was the FDA determination that many approved claims for over-the-counter drug products are, in fact, statements about structure or function and notdisease claims and that such statements may be used for dietary supplements as well.These include statements about preventing nausea from motion sickness, relievingoccasional sleeplessness, and soothing stress or nervous tension.

882 Part IX / Critical Issues for the 21st Century
There is an inherent tension between providing consumers with meaningful infor-mation about the health benefits of foods and dietary supplements and attempting toretain some legal or logical boundary to distinguish that information from the types ofclaims reserved for approved pharmaceutical products. With approved NLEA healthclaims that specifically claim to reduce the risk of serious chronic diseases and withDSHEA Statements of Nutritional Support that describe specific effects on the structureand function of the body, that tension is likely to continue into the foreseeable future.The food/drug distinction in the United States is not as sharp as it once was, and it maybecome even more blurred as policymakers seek to provide consumers with more infor-mation to enable them to more fully participate in efforts directed toward health pro-motion and disease prevention.
9. HEALTH CLAIMS POLICY OUTSIDE THE UNITED STATES
The policy debate regarding the dividing line between health claims made for foods anddisease claims that should be restricted to drugs is a global phenomenon, based on scien-tific research into the physiological effects of foods and their resulting health benefits.
In Japan, only pharmaceutical products could traditionally be formulated and labeledfor health uses. As a scientific consensus began to emerge regarding the importance offood choices in modifying the risk of chronic disease, the concept of functional foodsbegan to develop in Japan (46). In 1984, 1988, and 1992, special study groups on func-tional foods were appointed by the Ministry of Education, Science and Culture. Eachgroup consisted of the top specialists in biochemistry, food chemistry, and agriculturalchemistry and met for 2 to 3 yr to produce recommendations relating to the functionaleffects of foods in the modulation of physiological systems. In 1988, the Ministry ofHealth and Welfare established an Office of Health Policy on Newly Developed Foods,which studied how to best systematize the regulation of functional foods.
In 1991, the Nutrition Improvement Law officially established a category of productsknown as Food for Specified Health Uses (FOSHUs), which were eligible for healthclaims. FOSHUs are functional foods whose formulation and claims have beenapproved by the Minister of Health and Welfare based on clinical evidence that theproduct promotes health. Such foods cannot bear statements relating to the preventionor treatment of disease but may only bear claims regarding preserving or promotinghealth. Permitted claims included statements such as: “helps maintain a good gastroin-testinal condition,” “helpful for people concerned about high blood cholesterol level,”and “suitable for people with mild hypertension.” Such statements are considered to be suf-ficiently food-oriented to avoid conflict with the Pharmaceutical Affairs Law governingmedicines in Japan.
FOSHUs that have been approved have included foods with functional ingredients,including oligosaccharides, lactobacillus, bifidobacteria, dietary fiber sources, peptides,sugar alcohols, and minerals. FOSHUs approved by the Ministry of Health and Welfarebear a graphic seal, and their labels must include information describing the functionaleffect, the amount to be used, and other directions for use. Contrary to health claimsapproval in the United States, the Japanese system does not generically confer FOSHU sta-tus for certain food ingredients or components. Rather, each individual product requiresspecific approval. As of September 2003, there were 371 FOSHUs approved in Japan (47).Table 4 summarizes the approved products, categorized according to the type of claim.

Chapter 35 / Health Claims for Foods 883
There is a striking dissimilarity between the types of health claims approved in theUnited States and the types of conditions for which FOSHUs are approved in Japan. Inthe United States, the majority of approved health claims relate to reducing the risk ofcancer or heart disease. In Japan, half of the approved FOSHU claims relate to effectson the gastrointestinal tract, especially those relating to the nature of the microflora. Inthe United States, most foods for which health claims can be made are conventionalfoods that are major components of the diet (grains, fruits, vegetables), but some claimsare permitted for fortified foods and dietary supplements. In Japan, many FOSHUclaims are for specific food components delivered in the form of soft drinks or otherbeverages, but products in the form of tablets or capsules are also eligible.
In April 2001, the Japanese system for regulating foods and supplements with healthclaims was revised to add a category of “foods with nutrient function claims” (46). Inthis category, statements about the recognized functions of vitamins and minerals arepermitted, provided the nutrient is present within a prescribed range. For example, withvitamin A it may be stated that this nutrient “helps maintain vision at night” and “helpsmaintain healthy skin and mucosa.” Also, the product must bear a disclaimer to distin-guish these products from FOSHUs, and the disclaimer must state: “Unlike Foods for
Table 4Foods for Specified Health Uses
Number of products Specified health use Ingredients Types of foods
190 Helps maintain Oligosaccharides, Yogurt, beverages,good gastro- lactobacillus, table sugar, candy,intestinal condition bifidobacterium, vinegar, cookies,
dietary fiber cornflakes, cereals
63 Good for those who Soy protein, Beverages, soyhave high serum peptides, dietary products, meatcholesterol or fiber, plant sterols/ products, biscuits,triglycerides stanol esters cooking oils
41 Good for those who Dietary fiber, Beverageshave high blood albuminglucose polyphenols
L-arabinose
28 Good for those who Peptides, Soft drinks, souphave high blood glucosides powderpressure
26 Helps maintain Polyphenols, sugar Candy, chocolate,strong and healthy alcohols chewing gumteeth
23 Helps improve Calcium citrate Soft drinks, tofuabsorption of malate, caseincalcium or iron phosphopeptide,
oligosaccharides,heme iron
Approved in Japan as of September 2003 (47).

884 Part IX / Critical Issues for the 21st Century
Specified Health Uses, this food product has not been evaluated by the Ministry ofHealth, Labor, and Welfare.”
In Canada, there has also been a long history of regulating all health claims as drugclaims. The Canadian government has given consideration to the health claims approvedin the United States and has concluded that some of the claims may be permissible inCanada, whereas others require additional review. In regulations published in January2003, Canada finalized nutrition labeling regulations that also provide for health claimsrelating to calcium and osteoporosis, sodium and hypertension, dietary fat and heart dis-ease, fruits and vegetables to reduce the risk of cancer, and sugar alcohols to reduce therisk of dental caries (48). In a separate initiative, over the past 5 yr, Health Canada hasbeen in the process of developing an entirely new regulatory system for “natural healthproducts.” In 1998, the Standing Committee on Health produced a report in which 53recommendations were proposed as the basis for future regulation of natural healthproducts. In 1999, the Natural Health Products Directorate was established withinHealth Canada to develop a comprehensive framework, with extensive stakeholderinput, and to administer the system. The final natural health products regulations werepublished in the Canada Gazette, Part II, on June 18, 2003, and became effective inJanuary 2004 (49). A broad range of products are covered, including vitamins, miner-als, herbal remedies, traditional medicines (such as Traditional Chinese Medicine),homeopathic medications, probiotics, amino acids, and essential fatty acids. Most nat-ural health products are considered as a subcategory of “drugs,” and health claims arepermitted, provided that the claims are in accord with the findings of a review processthat covers safety as well as efficacy. Monographs are prepared for a large number ofingredients or products to facilitate the ability to make claims that are recognized ashaving appropriate scientific support. Natural health products must be manufacturedunder Good Manufacturing Practices (as defined in the regulations), the producers musthave site licenses, and products will eventually be required to bear a Natural ProductNumber (comparable to the current Drug Identification Number). Observers worldwideare watching the Canadian regulatory approach with great interest, because it appearsto offer some unique opportunities to meet consumer demands for health-related productsyet maintains a high level of control over product safety and quality as well as validityof claims.
In Europe, health-related claims currently are permitted in most countries only fordrug products, although there are provisions under which some claims may be specifi-cally licensed by a national government for use with foods or food ingredients. In July2003, the European Commission proposed a new directive regarding health claims forfoods, which, if adopted, ultimately would require member governments to bring theirnational policies into line with the directive (50,51). The proposed directive wouldapply to health claims made in advertising as well as labeling and would permit onlyclaims supported by “generally accepted scientific data.” A health claim is defined as aclaim that “states, suggests or implies that a relationship exists between a food category,a food, or one of its constituents and health.” The proposal includes a unique provisionthat provides a period of exclusivity to submitters of proprietary data supporting ahealth claim, so long as the claim could not have been approved without submission ofthe proprietary data. Structure/function claims would also be permitted, and if theDirective is adopted, a positive list of well-recognized functional claims is to be devel-oped within 3 yr of implementation. Under this proposal, health claims would need to

Chapter 35 / Health Claims for Foods 885
be reviewed by the European Food Safety Authority and approved by the EuropeanUnion Commission, and a register of health claims would be established. The proposeddirective requires the approval of the European Parliament and the Council of Ministersbefore it can become final.
The Codex Alimentarius is an international body that develops standards and policiesthat are applicable to foods marketed worldwide. A policy recommendation relating tohealth claims has been debated by the Codex Committee on Food Labeling over a periodof several years (52). The committee’s current recommendation relates to nutrition claimsas well as health claims and asserts that these claims “should be consistent with nationalhealth policy, including nutrition policy, and support such policies where applicable.”The committee recommends that such claims be permitted in food labeling, provided thatthey are “based on current relevant scientific substantiation and the level of proof mustbe sufficient to substantiate the type of claimed effect and the relationship to health asrecognized by generally accepted scientific review of the data and the scientific substan-tiation should be reviewed as new knowledge becomes available.” This recommendationwas forwarded to the full Codex Alimentarius Commission for adoption in 2003, but itwas returned to the committee for further consideration regarding whether the policyshould apply only to food labeling or whether it should also apply to food advertising.Codex recommendations are particularly significant, because many national governmentsdevelop or modify their food labeling policies based on Codex models.
10. OUTLOOK FOR THE NEXT DECADE
There is a worldwide trend to reconsider national and international policies that havetraditionally restricted health claims for foods. Scientific evidence supports the conceptthat dietary patterns, food choices, and the intake of specific food components can affectthe health of individuals and ultimately can have an impact on public health. It seemslikely that statements about the health benefits of foods will become a more prominentcomponent of food labeling and advertising in many parts of the world. This phenomenon isalready well-advanced in the United States and is moving forward under various frameworksin other countries and regions of the world. It remains to be seen whether divergent nationaland international policies will eventually be harmonized in the interest of facilitating theglobal marketing of foods with health benefits.
REFERENCES1. Senate Select Committee on Nutrition and Human Needs. Dietary Goals for the United States.
Government Printing Office, Washington, DC, 1977.2. Dietary Guidelines for Americans. U.S. Department of Health, Education and Welfare and US
Department of Agriculture, Washington, DC, 1980, 1985, 1990, 1995, and 2000.3. US Surgeon General. Healthy People: The Surgeon General’s Report on Health Promotion and
Disease Prevention. U.S. Department of Health, Education and Welfare, Washington, DC, 1979.4. US Department of Health and Human Services. Healthy People 2010 (Conference Edition, in Two
Volumes). Washington, DC, January 2000.5. National Research Council. Diet, Nutrition, and Cancer. National Academy Press, Washington, DC,
1982.6. US Surgeon General. Report on Nutrition and Health. US Department of Health and Human
Services, Washington, DC, 1988.7. National Research Council. Diet and Health: Implications for Reducing Chronic Disease Risk.
National Academy Press, Washington, DC, 1989.
886 Part IX / Critical Issues for the 21st Century
8. Food and Nutrition Board, Institute of Medicine. How Should the Recommended DietaryAllowances be revised? National Academy Press, Washington, DC, 1994.
9. Food and Nutrition Board, Institute of Medicine. Dietary Reference Intakes for Calcium,Phosphorus, Magnesium, Vitamin D, and Fluoride. National Academy Press, Washington, DC, 1997.
10. Food and Nutrition Board, Institute of Medicine. Dietary Reference Intakes for Thiamin, Riboflavin,Niacin, Vitamin B-6, Folate, Vitamin B-12, Pantothenic Acid, Biotin, and Choline. NationalAcademy Press, Washington, DC, 1998.
11. Food and Nutrition Board, Institute of Medicine. Dietary Reference Intakes for Vitamin C, VitaminE, Selenium, and Carotenoids. National Academy Press, Washington, DC, 2000.
12. Food and Nutrition Board, Institute of Medicine. Dietary Reference Intakes for Vitamin A, VitaminK, Arsenic, Boron, Chromium, Copper, Iodine, Iron, Manganese, Molybdenum, Nickel, Silicon,Vanadium, and Zinc. National Academy Press, Washington, DC, 2001.
13. Food and Nutrition Board, Institute of Medicine. Dietary Reference Intakes for Energy,Carbohydrate, Fiber, Fat, Fatty Acids, Cholesterol, Protein, and Amino Acids. National AcademyPress, Washington, DC, 2002.
13a. Food and Nutrition Board, Institute of Medicine. Dietary Reference Intakes for Water, Potassium,Sodium, Chloride, and Sulfate (pre-publication). National Academy Press. Washington, DC, 2004.
14. Ippolito P, Mathios A. Health Claims in Advertising and Labeling: A Study of the Cereal Market.Bureau of Economics, Federal Trade Commission, Washington, DC, 1989.
15. Food and Drug Administration. Labeling: general requirements for health claims for food. Fed Reg1993; 58:2478–2536. (Codified in Section 101.14, Title 21, Code of Federal Regulations.)
16. Food and Drug Administration. Food labeling: health claims and label statements; dietary fat andcancer. Fed Reg 1993; 58:2787–2819. (Codified in Section 101.73, Title 21, Code of Federal Regulations.)
17. Food and Drug Administration. Food labeling: health claims and label statements; dietary saturatedfat and cholesterol and coronary heart disease. Fed Reg 1993; 58:2739–2786. (Codified in Section101.75, Title 21, Code of Federal Regulations.)
18. Food and Drug Administration. Food labeling: health claims and label statements; sodium and hyperten-sion. Fed Reg 1993; 58:2820–2849. (Codified in Section 101.74, Title 21, Code of Federal Regulations.)
19. Food and Drug Administration. Food labeling: health claims and label statements; dietary fiber and can-cer. Fed Reg 1993; 58:2537–2551. (Codified in Section 101.76, Title 21, Code of Federal Regulations.)
20. Food and Drug Administration. Food labeling: health claims and label statements; dietary fiber andcardiovascular disease. Fed Reg 1993; 58:2552–2605. (Codified in Section 101.77, Title 21, Codeof Federal Regulations.)
21. Food and Drug Administration. Food labeling: health claims and label statements; antioxidant vita-mins and cancer. Fed Reg 1993; 58:2622–2660. (Codified in Section 101.78, Title 21, Code ofFederal Regulations.)
22. Food and Drug Administration. Food labeling: health claims; oats and coronary heart disease. FedReg 1997; 62:3584–3601. (Codified in Section 101.81, Title 21, Code of Federal Regulations.)
23. Food and Drug Administration. Food labeling; health claims: soluble fiber from certain foods andcoronary heart disease. Fed Reg 1998; 63:8103–8121. (Codified in Section 101.81, Title 21, Codeof Federal Regulations.)
24. Food and Drug Administration. Food labeling: health claims; soy protein and coronary heart dis-ease. Fed Reg 1999; 64:57,699—57,733. (Codified in Section 101.82, Title 21, Code of FederalRegulations.)
25. Food and Drug Administration. Food labeling: health claims; plant sterol/stanol esters and coronaryheart disease. Fed Reg 2000; 65:54,685—54,739. (Codified in Section 101.83, Title 21, Code ofFederal Regulations.)
26. Food and Drug Administration. Food labeling: health claims; calcium and osteoporosis. Fed Reg1993; 58:2665–2681. (Codified in Section 101.72, Title 21, Code of Federal Regulations.)
27. Food and Drug Administration. Food labeling: health claims; omega-3 fatty acids and coronaryheart disease. Fed Reg 1993; 58:2682–2738. (Codified in Section 101.71, Title 21, Code of FederalRegulations.)
28. Food and Drug Administration. Food labeling: health claims; zinc and immune function in the elderly.Fed Reg 1993; 58:2661–2664. (Codified in Section 101.71, Title 21, Code of Federal Regulations.)
29. Food and Drug Administration. Food labeling: health claims; sugar alcohols and dental caries. FedReg 1996; 61:43,433—43,447. (Codified in Section 101.80, Title 21, Code of Federal Regulations.)

Chapter 35 / Health Claims for Foods 887
30. Food and Drug Administration. Food labeling: health claims; sugar alcohols and dental caries. FedReg 1997; 62:63,653—63,655. (Codified in Section 101.80, Title 21, Code of Federal Regulations.)
31. Centers for Disease Control and Prevention. Recommendations for the use of folic acid to reduce thenumber of cases of spina bifida and other neural tube defects. MMWR 1992; 41:RR-14.
32. Food and Drug Administration. Food labeling: health claims and label statements; folic acid andneural tube defects. Fed Reg 1993; 58:2606–2621.
33. Food and Drug Administration. Food labeling: health claims and label statements; folate and neuraltube defects. Fed Reg 1996; 61:8752–8781. (Codified in Section 101.79, Title 21, Code of FederalRegulations.)
34. Food and Drug Administration. Food standards: amendment of standards of identity for enrichedgrain products to require addition of folic acid. Fed Reg 1996; 61:8781–8797. (Codified in Sections136, 137 and 139 of Title 21, Code of Federal Regulations.)
35. Food and Drug Administration. Food additives permitted for direct addition to food for human con-sumption; folic acid (folacin). Fed Reg 1996; 61:8797–8807. (Codified in Section 172.345, Title 21,Code of Federal Regulations.)
36. Food and Drug Administration. Food labeling: health claims; interim final rules. Fed Reg 1998;63:34,084–34,117.
37. US Court of Appeals for the District of Columbia Circuit, Pearson v. Shalala, 164 F.3d 650 (D.C. Cir.1999). Available from Jonathan Emord’s website: http://www.emord.com/publicat.htm. AccessedSeptember 17, 2004.
38. Food and Drug Administration. Food labeling: Health claims and label statements for dietarysupplements; Strategy for implementation of Pearson court decision. Fed Reg 1999;64:67,289–67,291.
39. Food and Drug Administration. Guidance for industry: Significant scientific agreement in the reviewof health claims for conventional food and dietary supplements; availability. Fed Reg 1999; 64:71,794.
40. Food and Drug Administration. Food labeling: Health claims and label statements;Request for scientific data and information; reopening of comment period. Fed Reg 2000;65:4252–4253.
41. US District Court for the District of Columbia, decision regarding qualified health claims for antioxi-dants and reduced cancer risk, in the case of Julian M. Whitaker, M.D., et al., v. Tommy G. Thompson,Secretary, Department of Health and Human Services, et al., December 23, 2003. Available fromJonathan Emord’s website: http://www.emord.com/publicat.htm. Accessed September 17, 2004.
42. Food and Drug Administration. Website providing current list of permitted label claimsand information about the Task Force on Consumer Information for Better Nutrition:http:// www.cfsan.fda.gov/~dms/lab-hlth.html.
42a. United States Court of Appeals for the District of Columbia Circuit. Internet document of the courtruling regarding a qualified health claim for saw palmetto: http://pacer.cadc.uscourts.gov/docs/com-mon/opinions/200401/03-5020a.pdf. Accessed September 17, 2004.
42b. FDA week. Court Dismisses CSPI, Public Citizen Suit on Qualified Food Claims; Vol. 10, No. 32.Inside Washington Publishers: Washington, DC, 2004.
43. AAC Consulting Group. Dietary Supplement Notification List. Bethesda, Maryland, 2004.44. Commission on Dietary Supplement Labels. Report of the Commission on Dietary Supplement
Labels. Superintendent of Documents, Washington, DC, 1997.45. Food and Drug Administration. Regulations on statements made for dietary supplements concerning the
effect of the product on the structure or function of the body; Final rule. Fed Reg 2000; 65:999–1050.46. Hosoya N. Health claims in Japan: foods for specified health uses and functional foods. Paper pre-
pared for Codex Committee on Nutrition and Foods for Special Dietary Uses, Codex Alimentarius.Japan Health Food & Nutrition Food Association, Tokyo, Japan, September 1998.
47. Nakajima K., Japan Health Food & Nutrition Food Association. “Global responses to claims andlabeling,” presentation at the First Latin American Conference on Food Supplements, sponsored bythe International Alliance of Dietary/Food Supplement Associations (IADSA), in Rio de Janeiro,Brazil, October 2003.
48. Health Canada, Health Products and Food Branch. Website with link to nutrition labeling and healthclaim regulations: http://www.hc-sc.gc.ca/hpfb-dgpsa/onpp-bppn/labelling-etiquetage/index_e.html.
49. Health Canada, Natural Health Products Directorate. Website with link to regulations and other mate-rials: http://www.hc-sc.gc.ca/hpfb-dgpsa/nhpd-dpsn/nhp_regs_e.html. Accessed September 17, 2004.

888 Part IX / Critical Issues for the 21st Century
50. European Commission. Website with information on 2003 proposed directive regarding nutrition andhealth claims in food labeling: http://europa.eu.int/eur-lex/en/com/pdf/2003/com2003_6424en01.pdf.Accessed September 17, 2004.
51. European Commission. Website with clarification of some misunderstandings relating to the 2003proposed directive on nutrition and health claims: http://europa.eu.int/comm/dgs/health_con-sumer/library/press/press315_en.pdf. Accessed September 17, 2004.
52. Codex Committee on Food Labeling, Codex Alimentarius. Website with final report of 2003 meet-ing and recommendations regarding nutrition labeling and health claims: ftp://ftp.fao.org/codex/ali-norm03/al0322Ae.pdf. Accessed September 17, 2004.

From: Preventive Nutrition: The Comprehensive Guide for Health Professionals, Third EditionEdited by: A. Bendich and R. J. Deckelbaum © Humana Press Inc., Totowa, NJ
889
KEY POINTS
● On a daily basis, most physicians need specific knowledge and skills regarding nutritionto provide optimal care for their patients.
● Medical organizations and nutrition educational task forces agree that medical studentsneed to learn about all clinically relevant nutrition topics.
● Comprehensive nutrition education outlines the impact of dietary exposure on diseasedevelopment and teaches practical diagnostic and intervention skills.
● Computer-assisted nutrition instruction is effective and ensures systematic coverage ofthe full range of knowledge and skills.
● Adaptive instruction can tailor content presentation to student needs and save time byavoiding unnecessary repetition.
1. WHY SHOULD HEALTH PROFESSIONALS HAVE NUTRITIONEXPERTISE?
Insufficient, excessive, or imbalanced availability of macro- and micronutrients is amajor contributing cause of morbidity and mortality worldwide. As people age, the pat-terns of nutritional intake play a significant role in the onset and progression of diseases:5 of the 10 leading causes of death have a strong relationship with poor diet (1,2).Obesity is epidemic in the United States, contributes to health risk, and currently con-tributes $92 billion (more than $700 per obese person) to health care costs (3). In manyinstances, particularly in affluent countries such as the United States, well-targeteddietary changes in patients that are encouraged by health professionals can significantlychange disease risk and prevent or delay morbidity and mortality.
The early successes of nutrition interventions virtually eradicated simple deficiencydiseases such as scurvy, pellagra, and rickets in developed countries. The need has shiftedto more complex nutrition patterns that are difficult to change and that influence healthoutcomes over the long-term. The growing obesity epidemic drives a secondary wave of
36 Teaching Preventive Nutritionin Medical Schools
Martin Kohlmeier and Steven H. Zeisel

890 Part IX / Critical Issues for the 21st Century
diabetes, cardiovascular disease (CVD), renal failure, and cancer. The prevalent pattern ofoverconsumption causes additional specific health risks that are independent of the obvi-ous mismatch of energy expenditure and intake. Therefore, the excessive insulin releasetriggered by high intake of rapidly absorbed carbohydrates promotes some common can-cers, and the hyperlipidemias related to high intake of saturated fats and partially hydro-genated fats (trans fats) accelerate atherosclerotic damage. Paradoxically, even with aplentiful food supply, most people do not get enough of all beneficial nutrients and otherfood constituents to ensure optimal health and minimize lifetime risk from disease. Forexample, most obese people could likely lower their risk for CVD, cancer, and other dis-ease if they acquired enough folate from food or other sources. Understanding these com-plex nutritional interactions requires grounding in nutrition sciences.
Physicians and other health professionals need to be intimately familiar withnutrition–disease relationships, just as they are with other disease-causing agents andconditions. They are in a position to work with their patients on preventive measuresbefore nutrition-related diseases cause harm that is difficult to correct or irreparable.Vaccinations, well-visits, visits for minor illnesses or injuries, and sports physicals provideopportunities to discuss the risk of diabetes with the parents of obese children and youngadolescents and to direct them to appropriate resources. Nutrition information providedduring routine gynecological examinations can help women to lower their risk of CVDand reduce the risk of birth defects in the event of a future pregnancy. Neurologists needto know about the consumption of some critical foods and dietary supplements in detailto optimize medications for a patient with epilepsy. Full attention to feeding arrange-ments and nutritional status of elderly patients during hospital rounds are crucial for therapid and sustained recovery after surgical interventions. These are just a few examplesto indicate how commonly nutrition intersects with the daily practice of virtually all clinicalspecialties.
Physicians also have unrivaled authority on health issues. The private and public dis-courses of physicians can have significant impact on individual behaviors and ofteninfluence policy decisions. For all these reasons, it is imperative that physicians andhealth professionals are knowledgeable regarding nutritional issues.
2. WHAT NUTRITION KNOWLEDGE HELPS HEALTHPROFESSIONALS TO PROMOTE DISEASE PREVENTION?
Health professionals need a general framework of nutrition knowledge and practicalskills to be effective. Similarly to other areas of medicine, new insights develop rapidlyand occur constantly; therefore the standards of practice evolve continuously. Nutritionissues pose a particular challenge, because the public is so familiar with eating and isconstantly inundated with a mixture of credible, irrelevant, and outright false informa-tion regarding nutrition. Patients ask questions about everything from weight loss todietary supplements. Physicians should be able to provide specific and reliable guidancewithin the time constraints of typical consultations. They perform best when they candraw on a solid understanding of nutritional theory and possess frequent updates on cur-rent practice from credible sources (not simply from the mass media).
Recent medical graduates usually do well at the diagnosis and pharmacologicaltreatment of metabolic diseases such as diabetes and hyperlipidemias, because theseare topics of instruction in all medical school curricula. Coverage of preventive nutrition

Chapter 36 / Teaching Preventive Nutrition 891
tends to be much more limited and largely depends on the interests of particularinstructors. Several organizations have suggested a set of nutrition topics that medicalschool curricula should cover (4,5). The most recent set of proposed topics was initi-ated by the American Medical Student Association’s Nutrition Committee and wasendorsed by a panel of experienced nutrition educators (5). The 92 listed topics wereof varying complexity and sometimes covered entire subdisciplines (e.g., “pregnancy”).Some did not have a clear correlate in current nutritional practice (e.g., “schizophrenia”),and others may have more properly been the domains of other disciplines (“peptic ulcerdisease”). Several important nutrition issues were not included. The competencies cor-responding to the amended and consolidated list (Table 1) require many additionalhours of study and practice than most medical schools can currently allocate. Similarly,the Curriculum Committee of the Nutrition Academic Award Program defineddetailed nutrition knowledge objectives for both medical students and more advancedlearners (6).
3. WHERE AND WHEN CAN PHYSICIANS LEARNTO USE PREVENTIVE NUTRITION?
Practically every US medical school attempts to offer some type of nutrition educa-tion. In response to one of our surveys (7), only 1 out of the 95 schools that provideddetailed information did not teach nutrition to their medical students. In most (90%) ofthe responding schools, nutrition education was a required part of the curriculum. Acomprehensive survey of the American Medical Association Liaison Committee onMedical Education (LCME) produced similar results (8). Nonetheless, graduation exitsurveys persistently find that students in most medical schools are greatly dissatisfiedwith nutrition education (9). This is not be surprising, because very little time is actu-ally devoted to teaching core concepts of nutrition. In our survey, we found that evenamong the schools that reported a nutrition requirement, the majority (70%) offeredfewer than the minimum 25 h that is considered necessary by the Food and NutritionBoard of the National Academy of Sciences (10).
These shortfalls may be partly related to lack of visibility in most medical schools:only 31 of the 126 LCME-accredited medical schools in the United States list a depart-ment, division, or specialty in which the title makes any reference to nutrition.Currently, only eight medical school departments or divisions are specifically dedicatedto nutrition. The other 23 medical schools list nutrition as part of the organizational title(usually secondary to gastroenterology or endocrinology) of divisions in medicine orpediatrics. A recent survey of medical school faculty also did not list nutrition as a sep-arate discipline (11). Additionally, the LCME requirements for medical school accred-itation do not even mention nutrition education (12). Of course, the challenge exists inthat the constantly increasing curriculum load of medical students leaves little room foradditional content (13) and that the more visible disciplines will compete more suc-cessfully for course time. The political structure of medical schools is such that the cur-riculum for medical students, in part, defines the territory for scientific disciplines inmedicine. For nutrition to succeed in the medical school environment, it must beincluded as a core part of student training (14). Because nutrition is not included as acore part of student training, a message is sent to future physicians that this disciplineis not important.

892 Part IX / Critical Issues for the 21st Century
Table 1Expected Nutrition Competencies for Medical Graduates
Basic nutritionEnergy (sources, deficiency, calculations)Physiology of hunger and satietyPhysiology of thirstProtein (sources, bioavailability, deficiency)Carbohydrates (simple and complex, requirements)Fats (ω-3, ω-6, saturated, trans, effects)Dietary fiber (types, sources, effects)Vitamin A (sources, deficiency, excess)Antioxidants (types, sources, effects)Vitamin C (sources, actions, deficiency)Vitamin D (skin synthesis, dietary sources, deficiency)Vitamin K (sources, deficiency, anticoagulation)Thiamin (sources, deficiency)Riboflavin (sources, deficiency)Niacin (sources, deficiency)Folate (sources, deficiency)Vitamin B12 (sources, deficiency)Water and electrolytes (Na, K, Cl)Calcium and phosphate (sources, deficiency, excess)Iron (sources, bioavailability, deficiency, excess)Zinc (deficiency)Trace minerals (I, Cu, Cr, Mn, Mb, Se)Nutrition and immunity
Nutrition AssessmentDiet history takingNutrition physical examination (body composition, skin)Laboratory evaluationAssessment of energy balanceAssessment of protein intakeAssessment of carbohydrate intakeAssessment of fat intakeAssessment of vitamin intakeAssessment of antioxidant intakeAssessments of electrolyte intake and balanceAssessments of mineral and trace element intakeAssessment of fiber intake
Preventive NutritionConception and pregnancyLactationGrowth and developmentSecond half of life (cognitive decline, osteoporosis)Oral healthCardiovascular diseaseCancerObesityHypertensionCriteria for an adequate diet
(Continued)

Chapter 36 / Teaching Preventive Nutrition 893
4. HOW CAN NUTRITION BE TAUGHT?
These difficulties can be overcome, as demonstrated by several institutions. Amongthe respondents to our survey (7), 25 schools reported that nutrition education was inte-grated into a larger part of the curriculum, sometimes across several years. Since then,anecdotal information from some institutions indicates that this type of instructionalarrangement is on the rise. The establishment of an integrated curriculum with compre-hensive nutritional content improved students’ performance and boosted satisfaction(9). The cost was allocation of an additional 40 h of nutrition instruction according to atopic list similar to the one mentioned earlier. In our survey, only three other institutionsreported a similar allocation of curricular time to nutrition education. An integratedcase-based approach at another medical school also virtually eliminated student dissat-isfaction, although education efficacy was not reported (15). Again, a comprehensivelist of nutrition competencies was added to the teaching objectives of most basic andclinical courses. The disadvantage of such fully integrated curricula is that students are
Table 1 (Continued)
Nutrient intake recommendationsNational nutritional programs and goalsVegetarianism
Dietary Treatment of DiseaseEating disordersFailure to thriveNutritional anemiasDiabetesCancerHyperlipidemiaRenal failureDiarrheaAlcohol abuse and liver diseaseCeliac diseaseKidney stonesHyperuricemia and goutHospital malnutritionSurgery, trauma, and infectionFood-borne illnessDrug–nutrient and supplement–drug interactionsPrimary malnutritionFood intolerances and allergiesInborn errors of metabolismAcquired immunodeficiency syndrome
Nutritional InterventionThe “MD-RD” teamNutritional supplementsEnteral nutrition supportParenteral nutrition supportWriting nutrition prescriptionsWriting nutrition referralsCultural issues

894 Part IX / Critical Issues for the 21st Century
less likely to appreciate the full potential of nutritional assessment and interventionbecause they do not see nutrition as a fully developed discipline. Usually, many of theinstructors, who are tasked with teaching nutrition as part of another discipline, are notfully versed in all areas of nutrition. For example, although some instructors may behighly qualified to present certain aspects of nutrient metabolism from a basic scienceperspective, they may not be able to convey the relevance of clinical interventions.Careful curriculum development and close interaction between nutrition educators andinstructors from other disciplines is essential for the success of integrated curricula(9,15). Instructors at the University of Pennsylvania have developed materials for case-based instruction, which are collected in the textbook Medical Nutrition and Disease(16). Case-based learning integrates basic science and clinical practice principles in anaccessible format that is especially suitable for small-group discussions and as a start-ing point for self-study. Introductory nutrition sessions with the students and the label-ing of nutrition-specific content as a discrete entity fostered an identity for the nutritioncomponent and met students’ high expectations of nutrition education.
We must recognize the trend among medical schools to increase curriculum con-tent that focuses on problem-solving in small group teaching settings (17), whereasstructured lecture time is being reduced. New materials should be introduced withinnovative approaches that require a minimum of added contact hours (18).Computer-based instruction offers an alternative, particularly for institutions thathave difficulty covering the full range of nutrition education. Previous experiencesupports the view that medical students learn well with computer-based instruction(19,20). Students can learn at their own pace and at a time that they choose. The inter-active format can ensure that material is well-retained and identifies knowledge gapsthrough self-assessment features. Slow and difficult navigation through materialscaused problems with earlier applications, because the user could not easily viewadjacent pages or quickly browse through a chapter. However, computers havebecome much faster, program interfaces have become more sophisticated, and usershave grown more adapted to extended work with learning modules. Earlier barriers tocomputer-assisted instruction have lost importance, because medical students nowroutinely use electronic learning resources, and laptop computers have become a con-stant presence even in lecture halls.
We have developed a computer-taught modular nutrition curriculum that covers most ofthe topics listed in Table 1 and takes 20 to 30 h to complete (21,22) (Fig. 1). The aim ofthis curriculum is to (a) foster a thorough understanding of nutrient sources, metabolism,and functions; (b) lead to an appreciation of nutritional lifestyle for disease devel-opment and amelioration; (c) teach specific diagnostic and interventional skills; and(d) demonstrate the collaboration of physicians with dietitians and other health careprofessionals. Video case presentations provide a framework for the application of basicscience concepts and practical clinical skills. Clinical patient information becomesaccessible as the user makes diagnostic and treatment decisions and the case evolves.Knowledge items are taught and reinforced with a variety of methods, including ani-mations, case-based interactions, and short quizzes. The wide range of optional resourcesincludes an extensive glossary, detailed intake recommendations, video-based demon-stration of anthropometric techniques, and extensive information regarding diagnostictests. Review copies of the programs are available to medical schools at no charge(http://www.med.unc.edu/nutr/nim/). In 2003, 87 (69%) of the 126 accredited US medical

Chapter 36 / Teaching Preventive Nutrition 895
schools used one or more of the programs. Sixty-three international medical schoolsused the CD-ROM series.
The content covers sources, metabolism, and pathological consequences for allmacronutrients and most micronutrients in a clinical context. The computer-based pre-sentation provides an opportunity to ensure comprehensive coverage of all topics withoutstrict adherence to a systematic sequence. Therefore, vitamins are integrated throughoutthe modules rather than in a section of their own. This brings the basic nutrient infor-mation closer to the clinical context and makes it more likely to be drawn upon as typicalclinical situations arise later in practice.
An important element of the instruction concerns how to conduct dietary interviewsand avoid typical pitfalls. The assessment of nutrient intakes (as listed among the essentialtopics) is an example of specific diagnostic skills conveyed in the programs. Becausephysicians in clinical practice rarely have the time for a complete dietary history (whichis also a topic of instruction), the program draws the learner’s attention to the most impor-tant food sources. We developed a series of simple questions to identify US patients thatare most likely to be at risk for particular nutrient deficiencies or imbalances (Table 2).When the particular nutrients are discussed, images of the dominant sources are dis-played with the questions and commentary on typical at-risk populations. At a latertime, interactive exercises reinforce the use of these assessment questions. Emphasis isplaced on taking a dietary supplement history as an indispensable part of some officevisits. The students are first taught the main considerations for obtaining a complete
Fig. 1. Sample screens from Nutrition in Medicine CD-ROM series.

896 Part IX / Critical Issues for the 21st Century
Table 2Questions for the Identification of Patients Most Likely at Risk
of Individual Micronutrient Inadequacies
How many servings of grains (bread, cereal, pasta, rice, corn) and pork do you consumeper day?Thiamin alarm threshold: Has fewer than three servings of grains or one serving of porkper day. People who severely restrict their carbohydrate or total energy intake and do noteat pork on a regular basis are most likely to have low thiamin intake.
How many servings of grains, milk, and meats do you have per day?Riboflavin alarm threshold: Has fewer than three servings of grains, milk, and meats perday. People with severely restricted intake, such as the elderly and people on very lowcalorie diets, are most likely to have low intake.
How many servings of potato, sweet potato, corn, meat, poultry, fish, banana, breakfastcereal, and watermelon do you have per day?Vitamin B6 alarm threshold: Has fewer than three servings of potato, sweet potato, corn,meat, poultry, fish, banana, breakfast cereal, and watermelon per day. Look for peoplewho eat little overall.
How many servings of breakfast cereals, dark-green vegetables, legumes, orange andorange juice do you have per day?Folate alarm threshold: Has fewer than three servings of breakfast cereals, dark-green vegetables, legumes, and orange per day. Look for people who do not like greens and legumes.
How many servings of seafood, meat, dairy products, and eggs do you have per day?Vitamin B12 alarm threshold: Has less than one serving of seafood, meat, dairy products,and eggs per day. Look for people who avoid animal-derived foods.
How many servings of fruits and nonstarchy vegetables do you have per day?Vitamin C alarm threshold: Has less than one serving of fruit or nonstarchy vegetable perday. Look for people who eat few fruits and vegetables.
Do you eat mostly fat-free foods?Vitamin E alarm threshold: Avoids oils, fats, nuts, and seeds. Look for people who eatmostly fat-free foods and avoid added fat.
How many servings per day of fruits and nonstarchy vegetables with colored flesh do youhave per day?Carotenoids alarm threshold: Has less than one serving of fruits and vegetables with colored flesh per day. Look for people who eat few colored fruits and nonstarchy vegetables.
How many servings of milk, calcium-fortified juice, yogurt, and cheese do you have per day?Calcium alarm threshold: Has fewer than three servings of milk, calcium-fortified juice,yogurt, and cheese per day. Look for people who avoid milk and calcium-fortified juices,do not get enough vitamin D, and consume too much phosphate.
How many servings of milk per day and fish per week do you consume?Vitamin D alarm threshold: Has less than one serving of milk per day or fish per week.Look for people who avoid the sun, do not eat fish, nor drink fortified milk.
How many servings of meat, processed cheese, and cola do you have per day?Phosphate alarm threshold: Has more than five servings of meat, processed cheese, andcola per day. Look for people who frequently have cola or cheeseburgers.

Chapter 36 / Teaching Preventive Nutrition 897
supplement history. They can then use a video case format to interactively explore theissues by prompting the interviewing physician to question her patient. This interactiondemonstrates how supplement usage often only arises in response to specific questioning.Focus group testing demonstrated that just a few minutes of exposure provided verygood working skills that can be used directly with patients.
5. AN ADAPTIVE LEARNING MODE
Identifying existing nutrition instruction in courses of biochemistry, physiology,pathology, endocrinology, gastroenterology, and other disciplines is helpful but will beinsufficient without considerable expansion. Introducing a comprehensive stand-alonenutrition curriculum would be desirable but likely requires a minimum of 25 h ofinstruction (10). Evidently, without a significant restructuring, few schools would beable to present their existing curricula and add several more hours of nutrition educa-tion. Therefore, the best hope for adding nutrition content is the use of more efficientand targeted instruction.
It is worth noting that nutrition properly deals with the metabolic and health conse-quences that result from different levels of intakes. To establish a legitimate territoryfor nutrition in medical schools, time teaching nutrition in the core curriculum mustbe spent wisely. Content must be presented so that it becomes clear that nutrition usesevidence-based approaches and teaches components that are critical, as well as familiar,to the entrenched medical disciplines.
Although nutrition is a highly important topic of study, there is a valid argument thatthe existing medical curriculum is overburdened and struggling to fit within a 4-yrdegree program. Thus, nutrition instruction should build on prior courses of anatomy,biochemistry, and physiology and presuppose basic understanding of major diseaseprocesses. Although there are considerable overlaps, there is much nutrition-specificcontent that should be favored for inclusion at the expense of basic science or generalclinical material. Thus, we found that by the second half of our students’ second year(prior to any specific nutrition instruction), they had adequate knowledge regardingtreatment of diabetes but knew little about nutritional prevention of cancer or dietarysupport after diagnosis. Even within individual modules, as is true for traditional lectures,some of the material duplicates earlier presentations in other courses. There would be aconsiderable amount of time saved if it were possible to focus only on those knowledgeitems that a particular class or even a particular individual was not familiar with.
We explored the viability of such adaptive instruction in a class of second-year medicalstudents (19). All 117 students in a class took a test with multiple-choice questions cov-ering the main topic areas of our cancer instructional program. Half of the students thenused a shortened program version that omitted the topics that most in the class werealready familiar with. The other students used the full version. Tailoring the instructionbased on students’ prior knowledge cut the time requirement to about half and achievednearly the same instructional efficacy. We provide a mechanism whereby all of our currentprograms can be adapted by instructors to meet student needs by following the instructor’sown preferences, known overlaps with prior courses, or based on tests as outlined ear-lier (Nutrition in Medicine Lite; http://www.med.unc.edu/nutr/nim/). We are currentlyengaged in the development of a Web-based/CD ROM hybrid system that can collateindividual instructional items across the entire curriculum based on instructor preferenceand prior student knowledge.

898 Part IX / Critical Issues for the 21st Century
6. CONCLUSIONS AND RECOMMENDATIONS
Nutrition education is an indispensable curriculum component that prepares futurephysicians for daily health care challenges. Theoretical knowledge and practical skillshelp future physicians to cope with ever-expanding nutrition information and can makenutrition assessment and effective intervention an integral part of daily practice. Thetime period of undergraduate medical education constitutes the formative years thatgreatly determine the attitudes, knowledge framework, and basic skill sets of futurephysicians. During this critical time, medical students should be offered a comprehen-sive curriculum that focuses on practically relevant nutrition topics and visibly demon-strates the importance of in-depth nutrition knowledge for effective health care. Giventhe increasing importance of diet-related diseases, most medical schools need to allocatea significantly greater amount of time to specific nutrition education. Computer-basedinstruction can be an effective resource to augment the efforts of a limited number ofnutrition instructors and can ensure a sufficient scope of teaching and training. Becausethe programs can be adapted to the particular needs of each medical school and even ofindividual students, the gains from more efficient delivery may be a convincing argumentfor course directors and curriculum committees trying to fit ever more content into analready overburdened curriculum.
ACKNOWLEDGMENTS
This work was funded by a grant from the National Institutes of Health (CA65474).Support for this work was also provided by grants from the National Institutes of Healthto the UNC Clinical Nutrition Research Unit (DK56350).
REFERENCES1. McGinnis J, Foege W. Actual causes of death in the United States. JAMA 1993; 270:2207–2212.2. Ventura S, Peters K, Martin J, Maurer J. Births and deaths: United States, 1996. Monthly Vital
Statistics Report. Vol. 46, No. 1. Supp 2. National Center for Health Statistics, Hyattsville, Maryland,1997, pp. 32–22.
3. Finkelstein EA, Fiebelkorn IC, Wang G. National medical spending attributable to overweight andobesity: how much, and who’s paying? Health Aff (Millwood) 2003; (Suppl W3):219–226.
4. American Society for Clinical Nutrition Committee on Medical Dental School and ResidencyNutrition Education. Priorities for nutrition content within a medical school curriculum: a nationalconsensus of medical educators. Acad Med 1990; 65:538–540.
5. American Medical Student Association’s Nutrition Curriculum Project. Report of the AmericanMedical Student Association’s Nutrition Curriculum Project. Essentials of nutrition education inmedical schools: a national consensus. Am J Clin Nutr 1997; 65:1559–1561.
6. Curriculum Committee of the Nutrition Academic Award Program. Nutrition Curriculum guidefor training physicians. Practice, behavior, skills and attitudes across the curriculum.http://www.nhlbi.nih.gov/funding/training/naa/products.htm, 2003. Accessed September 14, 2004.
7. Torti F, Adams K, Edwards L, Lindell K, Zeisel S. Survey of Nutrition Education in US MedicalSchools—An Instructor-Based Analysis. Med Educ Online: http://www.Med-Ed-Online.org/pdf/res00023.pdf. Accessed September 14, 2004.
8. American Medical Association. Nutrition and dietetic education for medical students. Report of theCouncil on Medical Education. American Medical Association Publications, Chicago, 1997.
9. Taren DL, Thomson CA, Koff NA, et al. Effect of an integrated nutrition curriculum on medicaleducation, student clinical performance, and student perception of medical-nutrition training. Am JClin Nutr 2001; 73:1107–1112.
10. Committee on Nutrition in Medical Education. Nutrition Education in US Medical Schools.Academy Press, Washington, DC, 1985.

Chapter 36 / Teaching Preventive Nutrition 899
11. Barzansky B, Etzel SI. Educational programs in US medical schools, 2002–2003. JAMA 2003;290:1190–1196.
12. Liaison Committee on Medical Education. Functions and structure of a medical school. Standardsfor accreditation of medical education programs leading to the M.D. degree. http://www.lcme.org/functions2003september.pdf. Accessed September 14, 2004.
13. Wylie-Rosett J, Segal-Isaacson C, Deen D, Cimino C. Nutritional education: understanding the pastto prepare for future medical practice. Einstein Quart J Biol Med 2002; 19:59–67.
14. Lo C. Integrating nutrition as a theme throughout the medical school curriculum. Am J Clin Nutr2000; 72:882S–889S.
15. Hark LA, Morrison G. Development of a case-based integrated nutrition curriculum for medicalstudents. Am J Clin Nutr 2000; 72:890S–897S.
16. Hark L, Morrison G. Medical Nutrition and Disease. A Case-Based Approach to Teaching Nutrition,3rd ed. Blackwell Publishing, Boston, Massachusetts, 2003.
17. Bakemeier RF, Anderson JJB, Brooks CM, et al. Nutrition and cancer education objectives of theAmerican Association for Cancer Education. J Cancer Ed 1989; 4:241–253.
18. Swanson AG. 1990 ASCN nutrition educator’s symposium and information exchange. Amer J NutrEduc 1991; 53:587,588.
19. Kohlmeier M, McConathy WJ, Cooksey Lindell K, Zeisel SH. Adapting the contents of computer-based instruction based on knowledge tests maintains effectiveness of nutrition education. Am J ClinNutr 2003; 77:1025S–1027S.
20. Kohlmeier M, Althouse L, Stritter F, Zeisel SH. Introducing cancer nutrition to medical students:effectiveness of computer-based instruction. Am J Clin Nutr 2000; 71:873–877.
21. Plaisted CS, Kohlmeier M, Cooksey K, Zeisel SH. The development of “Nutrition in Medicine”interactive CD-ROM programs for medical nutrition education. J Cancer Educ 2000; 15:140–143.
22. Cooksey K, Kohlmeier M, Plaisted C, Adams K, Zeisel SH. Getting nutrition education into medicalschools: a computer-based approach. Am J Clin Nutr 2000; 72:868S–876S.


From: Preventive Nutrition: The Comprehensive Guide for Health Professionals, Third EditionEdited by: A. Bendich and R. J. Deckelbaum © Humana Press Inc., Totowa, NJ
901
37 Preventive Nutrition Throughout the Life CycleA Cost-Effective Approach to Improved Health
Adrianne Bendich and Richard J. Deckelbaum
KEY POINTS
● More than 60% of adults in the United States self-report that they are in excellenthealth, although more than 60% are overweight or obese and almost 60% do not par-ticipate in any vigorous physical activity. Obesity is a growing problem globally.
● A major finding in the 20th century was that a simple B vitamin (folic acid) couldprevent a very serious birth defect of the neural tube; furthermore, folic acid-containing multivitamins taken during the periconceptional period significantlyreduced cardiovascular and renal defects as well as neural tube and cleft lip–cleftpalate defects.
● Low intakes of many of the essential micronutrients are associated with increased riskof low birth weight and/or premature births, maternal morbidity and mortality in bothdeveloped and undeveloped nations. Interventions have the potential to reduce healthcare costs by billions of dollars annually.
● Childhood undernutrition, also seen in both developed and undeveloped nations, sig-nificantly reduces intellectual capacity and increases infection-related morbidity/mor-tality. Micronutrient fortification is predicted to be highly cost-effective.
● Regarding adult chronic diseases/conditions, 5 of the 10 leading causes of death arerelated to diet. Although recent intervention trials with single or multiple micronutrientsdid not show decreases in secondary events, baseline findings continue to confirm thestrong associations between higher than average intakes and significantly reduced risksof, for example, cancer and cardiovascular disease.
● Osteoporosis, cataracts, age-related macular degeneration, diabetes, and hypertensionappear to be likely candidates for preventive nutrition intervention strategies. Predictedannual cost savings above and beyond the costs for the nutritional interventions couldreach $50 billion.

902 Part IX / Critical Issues for the 21st Century
1. INTRODUCTION
The most recent data from the US Centers for Disease Control indicated that “in 2001,64% of adults 18 years of age and over reported excellent or very good health.”However, 58% of adults never participated in any type of vigorous leisure-time physi-cal activity, and 13% of adults did not have a usual place of health care. Twelve percentof adults had been told by a doctor or other health professional that they had heart dis-ease and 21% had been told on two or more visits that they had hypertension. Nearlyone-fourth of adults were current smokers, and 22% were former smokers. Moreover,based on adults ages 20 yr and older with a body mass index greater than 25, 64% wereoverweight or obese and 30% were frankly obese (1).
Within the past 5 yr, there has been a growing appreciation of the value of nutritionalinterventions as cost-effective and safe means of maintaining health and decreasing riskof major chronic diseases. Moreover, an increasing body of evidence suggests that thereare more commonalities than differences among the nutrition recommendations toreduce risk factors for diseases; for instance, both cancer and cardiovascular disease(CVD) prevention recommendations include increased consumption of fruits and veg-etables (2–11). Similarly, increased whole grain intake (as compared to refined grains)has been associated with decreased prevalence of CVD, cancer, and type 2 diabetes(12–17). A simple dietary change (increasing the number of servings of low-fat, cal-cium-rich dairy foods by two each day) has significant potential for an annual $26 bil-lion in health care savings in the costs associated with hypertension, obesity, type 2diabetes, coronary artery disease (CAD), stroke, osteoporosis, kidney stones, colorectalcancer, and pregnancy-associated pre-eclampsia (18). Obesity is becoming the leadingcause for concern because of the multifold attendant morbidities. Chapter 15 by Frierand Greene is especially informative (19). Moreover, the unexpected large increase inchildhood obesity and excessive weight, reviewed extensively by the leadingresearchers in Chapters 12–14 in this volume (20–22), outline the unfortunate conse-quences not only in childhood but also in adulthood, even if the obese or overweightchild develops into a normal-weight adult. Obesity is linked to between 280,000 and325,000 deaths per year in the United States and is more costly than smoking-relateddeaths (the number one killer). It is estimated that obesity-related expenditures reached$75 billion in 2003. Currently, about 27% of US adults and children are classified asobese (23). Other nations are also calculating the health care costs associated with obe-sity. The pharmacoeconomics of managing childhood and adolescent obesity wasrecently reviewed by Kiess et al. (24) in a population of German children. The authorsreported that a cross-sectional study of more than 2500 children in Leipzig found that29% of those ages 7 to 18 yr were overweight and 16% were obese. Obesity is a growingglobal problem—not only a US problem.
Decreased fat intake, particularly saturated fat intake, is clearly linked to decreasedserum cholesterol levels and decreased prevalence of cardiovascular complications suchas CAD (18). Although recent studies place some doubt on the contribution of fat intaketoward increasing risk of breast cancer, high levels of fat intake are still associated withthe risk of some cancers and type II diabetes (1,25–27). Foods that are rich in otherdietary components, including fiber, complex carbohydrates, and micronutrients,appear to decrease the risk of certain forms of cancer as well as coronary heart disease(CHD) and manifestations of diabetes (19,20,28,29). A recent analysis of the directmedical costs of care for diabetes, based on actual cases, showed that the lowest costs

Chapter 37 / Preventive Nutrition Throughout the Life Cycle 903
were associated with those diabetics who were diet-controlled. Obesity added signifi-cantly to health costs, as did use of insulin and more advanced disease resulting inkidney failure and need for dialysis. Dialysis alone increased costs 11-fold (30).
The major chronic diseases also share a number of common cellular and biochemicalmechanisms in their pathogenesis (1,23,31). For example, cell proliferation is commonin both atherosclerosis and cancer and is of importance to some of the complicationsassociated with diabetes. Changes in signal transduction and gene expression relate tocancer, atherosclerosis, obesity, and diabetes. Additionally, DNA modifications likelycontribute mechanistically to each of these disease classes. Importantly, in examining thesets of nutrition recommendations that are aimed at reducing the risk of several chronicdiseases and that are developed by a number of different private and government orga-nizations, the different recommendations show far more common themes and common-alities than differences. The recommendations of most nutrition and public health groupsare very similar to the 2000 United States Dietary Guidelines of the US Department ofHealth and Human Services and the US Department of Agriculture, which include the“ABC” recommendations outlined in Table 1 (16).
One important issue deals with how to implement the current dietary recommenda-tions for all population groups regardless of their economic and educational status.Where will food fortification and micronutrient supplementation be of most benefit?The reality is that the majority of populations, both in the United States and elsewhere,do not follow dietary recommendations (12,32–34). Given the available evidence thathigher fruit and vegetable as well as whole grain intakes can have marked effects onreduction of chronic disease risk, it is quite likely that improved diets alone would be amajor step forward in chronic disease risk reduction and economic cost. However, it isalso clear that fortification and supplementation of certain nutrients has been associatedwith reduced risk of chronic diseases in populations that have not routinely consumedthe highest intakes of recommended foods (35–37). Therefore, an inclusive approachthat combines the best of many nutritional delivery systems and includes physical activ-ity and smoking reduction may provide a greater potential for cost-effective measuresto reduce disease.
For developing countries, a new report in 2004 from the United Nations Children’sFund (UNICEF) and the Micronutrient Initiative (38) found that lack of basic vitaminsand minerals in the diet holds back economic development in virtually every country inthe southern hemisphere. A lack of key vitamins and minerals is responsible for impair-ing intellectual development, compromising immune systems, and increasing the risk ofserious birth defects. The report found that fortification of wheat flour with iron andfolic acid in the 75 most needy countries was expected to reduce iron deficiency by 10%,and birth defects could be lowered by one-third. Such fortification would cost a total ofabout $85 million, which is about $0.04 per person. The estimated result is that thesecountries would gain $275 million in increased productivity and $200 million fromenhanced earning potential.
1.1. ObjectivesThe major objective of this chapter is to examine the wealth of data presented in this
volume, in the more than 50 chapters in the two earlier editions of Preventive Nutrition(39,40), in relevant chapters from Primary and Secondary Preventive Nutrition (41), andin other published studies and to look at the potential cost savings if these strategies

904 Part IX / Critical Issues for the 21st Century
were adopted. We highlight those nutritionally related interventions that can improvehealth, reduce disease risk, and save on health care costs. Therefore, our goal is to doc-ument the totality and the consistency of the data and then attempt to quantify thesavings that could exist once preventive nutrition strategies are instituted.
Each section includes data related to the preventive nutrition interventions at thelevel of individuals and populations and then discusses the health economics potential.The discussion follows the life span and thus begins with the anticipation of conceptionand concludes with an examination of the diseases/conditions that most affect seniors.Emphases are placed on the role of nutrition in the prevention of birth defects and pre-mature birth and the cost-effectiveness of nutritional interventions for CVD, cancer, andosteoporosis prevention. The information regarding health economics is based mainlyon US national databases of hospital costs. Globally, there will be many differences inthe economic value of nutrition interventions, and these obviously also differ betweencountries at various stages of economic development and availability of medical care.
2. NUTRITIONAL INTERVENTIONS TO OPTIMIZE PREGNANCY OUTCOMES
2.1. Birth DefectsWhen Preventive Nutrition was published in 1997, the objectives of the researchers
who wrote the chapters involved with optimizing pregnancy outcomes were to reducethe risk of birth defects (42) and premature birth (43) so that the infant morbidity andmortality would be decreased. Secondarily, there were also strategies that would reducematernal morbidity and mortality and reduce the potential for paternal sperm DNAdamage (44) and, consequently, also improve neonatal health prospects. The data pri-marily came from studies in developed countries where frank nutrient deficiencies arerare. Therefore, the dietary and/or supplementation strategies were implemented in rel-atively well-nourished women. The Barker Hypothesis that chronic diseases of middleage begin in utero further heightens the need to enhance the nutritional status of womenof childbearing potential. Improvement in birth outcomes, especially decreasing preva-lence of low birth weight, may also improve the health of newborns when they reach
Table 1Aim, Build, Choose—for Good Health
Aim for fitnessAim for healthy weight.Be physically active each day.
Build a healthy baseLet the Food Pyramid guide your food choices.Choose a variety of grains daily—especially whole grains.Choose a variety of fruits and vegetables daily.Keep food safe to eat.
Choose sensiblyChoose a diet that is low in saturated fat and cholesterol and moderate in total fat.Choose beverages and foods that limit your intake of sugars.Choose and prepare foods with less salt.If you drink alcoholic beverages, do so in moderation.

Chapter 37 / Preventive Nutrition Throughout the Life Cycle 905
middle age and older (45–48). Unfortunately, current economic predictions cannotaccount for the potential reductions in health care costs that would be realized in thenext half-century or more. Nevertheless, the benefits of optimizing pregnancy outcomesto improve current neonatal and maternal health are more than sufficient to justify thenutritional interventions discussed here.
The recent UNICEF report indicates that developing countries are examining theeconomic burden of adverse pregnancy outcomes (38). Iodine deficiency, prevalent inmany African and Asian nations, has serious and irreparable consequences in preg-nancy. As many as 20 million babies every year are born mentally impaired as a resultof maternal iodine deficiency. Severe iron deficiency anemia contributes to the deathsof an estimated 50,000 women a year during childbirth. Folate deficiency is causingapprox 200,000 severe birth defects annually and is associated with roughly 1 in 10adult deaths from heart disease. Food fortification with essential vitamins and mineralsin foods that are regularly consumed by most people (such as flour, salt, sugar, cookingoil, and margarine) is the preferred method to increase consumption in the developingcountries and is predicted to cost only a few cents per person per year. Supplementationis considered for only the most vulnerable groups (particularly children and women ofchildbearing age), using vitamin and mineral supplements in the form of tablets, cap-sules, and syrups. Although the actual costs of the supplements are low, implementationcosts are higher than for fortification. However, fortification and supplementation pro-grams cannot be successful without a parallel program to control diseases such asmalaria, diarrhea, and parasitic infections, which reduce the ability of the body toabsorb and retain essential vitamins and minerals. Nevertheless, it is estimated that inthe 75 most needy countries, if wheat flour was fortified with iron and folic acid, irondeficiency could be reduced by 10% and birth defects could be lowered by one-third.
Birth defects are the leading cause of infant mortality and morbidity in the UnitedStates. Cardiovascular birth defects are the most common birth defect; neural tube birthdefects (NTDs) are the second leading defect. One major preventive nutrition finding ofthe 20th century was that periconceptional use (use of the supplement prior to concep-tion and during the first trimester) of a folic-acid containing multivitamin/mineral sup-plement significantly reduced the occurrence of NTDs. Another key finding was thatsupplementation with folic acid alone could more than halve the risk of having a secondchild affected by NTD (42).
The only intervention trial that examined the potential to reduce the risk of first occur-rence of NTDs was done in Hungary using a prenatal multivitamin supplement contain-ing 800 μg of folic acid and several other essential micronutrients. The final data set ofthe Hungarian trial are presented in detail in the Chapter 24 by Czeizel in this volume (49)and indicates a significant reduction in two major types of birth defects beyond NTD.Nine cases with defects of the urinary tract were found in the no-multivitamin group andonly two were observed in the multivitamin group. The difference was most obvious inthe obstructive anomalies of the urinary tract. There were 10 infants with cardiovasculardefects in the multivitamin group and 20 in the no-multivitamin group. The difference inthe rate of conotruncal heart defects (3 vs 10) was also significant (relative risk [RR] =0.29, 95% confidence interval [CI] 0.09–0.97). In addition to showing that periconcep-tional use of multivitamins significantly reduced NTDs, Czeizel and Dudas found thatwomen who took the multivitamin containing 12 vitamins (including 800 μg of folic acid,4 μg of vitamin B12, 2.6 mg of vitamin B6, 100 mg of vitamin C, and 15 IU of vitamin E)

906 Part IX / Critical Issues for the 21st Century
also had less morning sickness than the women taking the matched placebo (50). In theUK Medical Research Council (MRC; 1991) Trial for prevention of NTD recurrence, themultivitamin used contained only eight of the vitamins and did not include vitamins E andB12; it only contained 40 mg of vitamin C and 1 mg of vitamin B6. Although the multivi-tamin contained 4 mg of folic acid (five times the level in the Czeizel and Dudas trial),there was no decrease in cardiovascular birth defects in either the group taking folic acidalone or the group taking folic acid plus the multivitamins in the MRC Trial.Cardiovascular birth defects were also not lowered in the group taking the multivitaminswithout folic acid compared to the placebo group (51).
The supplement used in the trial by Czeizel and Dudas is more comparable to the typi-cal one-a-day-type multivitamin/mineral supplement sold in the United States than the sup-plement used in the MRC Trial. Therefore, it is not surprising that survey data from theUnited States suggest that lowered cardiovascular birth defect risk is associated with peri-conceptional use of multivitamin/mineral supplements, which usually contain more of thevitamins and minerals found in the supplement that lowered cardiovascular birth defects.
Because cardiovascular birth defects are about 10-fold more prevalent than NTDs,the total medical costs associated with this defect are high (about $50,000/patient; $3billion/yr). Fortunately, the risk reduction associated with multivitamin use was high(about 50%) (49,52) and, therefore, the potential cost savings approached $1.5 billionper year for hospitalization costs alone (35). The cost savings are particularly greatbecause the balancing costs of the multivitamins are relatively low. Unfortunately, eventoday, there are few women (about 20%) who take a multivitamin during the pericon-ceptional period before they have confirmed their pregnancy (53).
The cost savings would probably be much greater than $1.5 billion per year becausemultivitamin use during the months before conception and throughout pregnancy hasalso been associated with significant reductions in the occurrence of NTDs, renal birthdefects, cleft lip and palate, and limb reduction birth defects (54). Supplementation hasalso been associated with decreased risk of childhood brain tumors (55).
In an editorial in the New England Journal of Medicine, Oakley suggested that the rightadvice to American women is to eat the best diets possible and to take a multivitamin con-taining folic acid to ensure that the birth-defect preventive level of folic acid is consumeddaily (56). This advice was given even after the Food and Drug Administration initiatedits policy for fortification of enriched grain products and flour with folic acid. It appearsthat this level, which raises folic acid intakes by an average of 100 μg per day, may notbe sufficient to prevent folic acid-responsive birth defects. Further verification of the needfor intake of the 400 μg-level of folic acid is shown in the recent study from China (57).When women anticipating pregnancy took 400 μg of supplemental folic acid during thepericonceptional period, there was a fourfold reduction in NTDs in the higher risk areaand a 40% reduction in a lower risk area.
2.2. Low Birth Weight and Premature Birth PreventionLow birth weight and preterm delivery often occur together. Preterm delivery is
defined as birth following less than 37 wk of gestation; very preterm delivery is definedas birth following less than 33 wk of gestation. Low birth weight is defined as <2500 g,and very low birth weight is <1500 g. Of all low-birth-weight infants born, 60 to 70%are also preterm. Preterm delivery associated with low birth weight is the second leadingcause of infant hospitalization and is also the second leading cause of infant mortality,

Chapter 37 / Preventive Nutrition Throughout the Life Cycle 907
following birth defects (58). Low birth weight is second only to cardiovascular birthdefects in annual hospitalization costs, exceeding $2.5 billion per year (35). The vastmajority of these costs are borne by public funds, and the affected mothers and childrenare often the least equipped to deal with this event. Preterm births are more prevalent inteenagers, those with less than a high school education, and those with the lowestincomes. In 1995, 7.3% of all infants born in the United States were low birth weight;for African-Americans, the rate was considerably higher (13%; ref. 59).
In a prospective, case–control study, Scholl et al. (60) found that pregnant women inCamden, New Jersey, who took prenatal multivitamins during the first trimester had afourfold reduction in very preterm births and a twofold reduction in preterm births. Evenif supplementation began in the second trimester, there was a significant twofold reduc-tion in very preterm as well as preterm births. The risk of very low birth outcomes (whichwas highly correlated with preterm delivery) was dramatically reduced by six- to seven-fold when prenatal multivitamins were taken during the first two trimesters. Low birthweight was also reduced significantly with supplementation. These results wereobserved in women who were at high risk for preterm/low-birth-weight outcomes: theywere poor teenagers, and many had low weight gain during pregnancy. Prenatal supple-ments increased iron and folate status significantly but did not alter serum zinc level.Previously, low iron and/or folate staus has been associated with increased risk ofpreterm birth and low birth weight (43). Zinc-containing multivitamins were also shownto reduce preterm births in an intervention study (61). Because there was such a dramaticreduction in preterm births in the women who took zinc and (presumably) folic acid-con-taining prenatal vitamins, the cost savings were predicted to reach over $1.5 billion peryear (35). In Chapter 25 of this volume, Scholl (62) identifies recent studies where cal-cium, antioxidants, and long-chain polyunsaturated fatty acids have also reduced the riskof preterm births. It appears that there is significant overlap between the optimal intakes ofthe nutrients linked to reducing preterm births and those nutrients that reduce the risk ofmajor birth defects. Therefore, such an intervention would be highly cost-effective, savingbillions and, perhaps, trillions of dollars every year in global health care costs.
Recently, there have been links made between maternal diet during pregnancy,preterm birth, and CVD in the offspring 50 yr or more after their birth (45,46). We mustwait to see if women who used supplements before and during pregnancy had childrenwho, at middle age, have less chronic diseases, such as CVD. Thus, it appears certainthat the cost savings associated with a program to provide folic acid-containing multi-vitamins to all women of childbearing potential both before and during the entire preg-nancy would be far greater than those based on either cardiovascular birth defect orpreterm birth reduction alone. Moreover, the reduction in pain and suffering for thenewborn and parents is substantial.
3. STUDIES OF BIRTH DEFECT AND LOW BIRTH WEIGHTPREVENTION FROM DEVELOPING COUNTRIES
In developing countries, premature births are a serious problem, and an additionalproblem is intra-uterine growth retardation, which often coincides with premature birthbut may also occur with term delivery. DeOnis et al. (63) reviewed the 12 nutritionallybased interventions that have been examined for their potential to reduce the incidenceof intra-uterine growth retardation and, often, preterm birth and low birth weight.

908 Part IX / Critical Issues for the 21st Century
Only one of the interventions (balanced protein/energy supplementation duringpregnancy) significantly reduced the risk of low birth weight. The authors also sug-gested that many of the micronutrient supplementations that were reviewed are likely toprove beneficial, and larger cohorts are required to ensure their efficacy. These micronu-trients include vitamin D, folic acid, zinc, calcium, magnesium, and iron. Ramakrishnan(64) also extensively reviewed both observational and intervention studies from devel-oping and developed countries that examined the role of micronutrients in optimizingpregnancy outcomes. The authors remind us that in developing countries, one of everyfive infants (20%) has low birth weight, compared to a rate of 6% in developed coun-tries. Moreover, in developing countries, the majority of low-birth-weight infants arecarried to term. Thus, intra-uterine growth retardation is a significant problem in devel-oping countries and impacts the potential physical and, most likely, the mental growth ofthe child throughout his or her lifetime. Low maternal micronutrient intake of zinc, cal-cium, magnesium, vitamin A, vitamin C, and, possibly, the B-vitamins copper and sele-nium is associated with premature birth and low birth weight. Deficiency of iodine,folate, and/or iron is also linked to adverse pregnancy outcomes.
There have been recent data published from two large, well-controlled interventionstudies in developing countries. In a placebo-controlled trial, West et al. (65) examinedthe effects of weekly supplementation with the recommended dietary allowance of vita-min A (provided as either preformed vitamin A [retinol] or β-carotene) in over 20,000pregnant women in Nepal. They found a significant, 40% reduction in maternal mortal-ity with both vitamin A interventions compared to placebo. It is important to note thatwomen were provided the supplements before conception and that this relatively mod-est dose of vitamin A in the form of β-carotene appeared more effective than the pre-formed supplement of retinol. Low β-carotene status has been reported in cases ofpre-eclampsia in women from developing countries, and as discussed below, the antiox-idant potential of β-carotene (compared to the much lower antioxidant potential ofretinol) may have been involved in reducing maternal mortality in the study in Tanzania.
The second critical study involved over 1000 pregnant women from Tanzania whowere infected with human immunodeficiency virus (HIV) (66). In this placebo-con-trolled trial, the pregnant women received either placebo; β-carotene and retinol; a mul-tivitamin containing vitamins B1, B2, B6, B12, niacin, folic acid, and vitamins C and E;or the multivitamin plus β-carotene and retinol from 12 to 27 wk of gestation until birth.There was a 40% reduction in fetal death, a 44% reduction in low birth weight, a 39%reduction in very preterm birth, and a 43% reduction in small-for-gestational-age out-comes in the groups supplemented with the multivitamin independent of the vitamin A.Additionally, mothers taking the multivitamin had significantly heavier babies than thosenot taking the multivitamin (p = 0.01). Although the supplement did not contain iron, thewomen in the multivitamin group had a significant increase in their hemoglobin levelscompared to those not taking the multivitamin. Because this study involved HIV-positivewomen, the investigators also measured the concentration of total T cells (CD3), T-helpercells (CD4), and T-suppressor cells (CD8). Pregnant women who were HIV-positive andtook the multivitamin supplement had significant increases in total T cells, which mainlyresulted from increases in CD3 cells; CD8 cells also increased. Although vitamin A didnot show an effect in this study, it is important to note that the HIV-infected women hadlow vitamin A status at the onset, and the level provided may not have been sufficientand/or may have not been absorbed sufficiently to show an effect. Vitamin A may also

Chapter 37 / Preventive Nutrition Throughout the Life Cycle 909
have been administered too late in these pregnancies to show its effect. In the study byWest et al. (65), vitamin A supplementation was started before conception. Vitamin A iscritical for early embryonic growth. The critical finding in the study by Fawzi et al. (66)was that a multivitamin supplement containing modest doses of micronutrients signifi-cantly improved birth outcomes at levels similar to those seen when poor women in theUnited States who were HIV-negative used multivitamins during their pregnancies (60).
In both developed and underdeveloped countries, there is a direct relationship betweenthe level of poverty and the risk of low-birth-weight outcomes. Ramakrishnan (67) rightlyargued that improving the nutritional status of poor women prior to and during pregnancyhas the potential to significantly reduce the risk of preterm and low-birth-weight births.It is expected that such programs would still be cost-effective, given the many adverseoutcomes associated with premature birth and/or low-birth-weight outcomes.
4. REDUCTION IN PRE-ECLAMPSIA AND OTHER PREGNANCY-ASSOCIATED ADVERSE EFFECTS
Pre-eclampsia is defined as hypertension and proteinuria beginning during the sec-ond half of gestation. Approximately 5% of pregnant women in the United Statesdevelop this condition during pregnancy. Pre-eclampsia is the leading cause of mater-nal death and accounts for more than 40% of premature births worldwide (68–70).Therefore, the costs associated with pre-eclampsia would include not only 40% of thecosts associated with the infant of a preterm delivery but would also include the costsassociated with maternal care.
Several mechanisms have been proposed for the initiation and progression of pre-eclampsia, including oxidative damage to the placenta and/or imbalance in blood pres-sure regulation. Because of the importance of micronutrients such as vitamins C and E(and β-carotene, as mentioned previously) as antioxidants and the association of lowcalcium status and high blood pressure, these micronutrients have been studied in well-designed protocols to determine their effects on pre-eclampsia.
Bucher et al. (71) reviewed 14 randomized clinical trials that involved the use of calciumsupplements during pregnancy to determine the effects on maternal blood pressure and pre-eclampsia. They concluded that calcium supplementation (usually 1500–2000 mg/d fromweek 20 to birth) led to a significant reduction in maternal systolic and diastolic bloodpressure and a 62% reduction in the risk of pre-eclampsia. The authors recommendedthat calcium supplementation be provided for all women at risk for pre-eclamsia. Itshould be noted that the majority of the populations included in this analysis were notfrom the United States and had intakes of calcium of about 300 to 500 mg per day—well below their nations’ recommended intake levels (72,73).
Several important studies have been published following this review. Levine et al. (70)randomized over 4500 pregnant women from the United States to either 2000 mg of cal-cium or placebo per day and found that there was no difference in the rate of pre-eclampsiabetween the groups (about 7%). However, it must be noted that these women were not atincreased risk for pre-eclampsia and that they had dietary calcium intakes greater than1100 mg per day—very close to the recommended intake level during pregnancy, yet wellabove the national average. In a recent re-evaluation of the data concerning calcium andrisk of pre-eclampsia, DerSimonian and Levine (69) again found that calcium supplemen-tation did not appear to further lower the risk of pre-eclampsia for normal pregnancies but

910 Part IX / Critical Issues for the 21st Century
that for high-risk pregnancies, calcium supplementation appeared to significantly lowerthe risk. High-risk pregnancies include those of teenagers, women with pre-existinghypertension, and women carrying multiple fetuses. However, the most recent trial stud-ied 1800 mg of elemental calcium supplementation per day in over 400 pregnant womenfrom Australia who had apparently adequate dietary calcium intakes (median: 1100–1200mg/d) and other characteristics very similar to those in the study by Levine et al. (70). Thistrial reported a greater than twofold reduction in the risk of pre-eclampsia and a reductionin the risk of preterm delivery from 10% (placebo) to 4.4% (calcium-supplemented).There were also reductions in hospital admissions for threatened preterm labor (p = 0.03)and preterm premature rupture of membranes (p = 0.08), which would reduce health carecosts above and beyond those reduced by the benefits seen with calcium supplementation.In fact, the authors calculated that 73 low-risk women or 42 high-risk women would needto be supplemented to prevent one case of pre-eclampsia. Given that supplementationwas given for only 20 wk (at most) and the approximate cost of the calcium supplementsare about $20 per woman, it would cost about $1500 to provide the supplements to 73women—well below the expected medical costs associated with one case of pre-eclampsiaand the potential preterm and/or low-birth-weight infant (74).
One other study of interest examined the blood pressure of the children of mothers whotook calcium during pregnancy to prevent pre-eclampsia. Belizan et al. (75) showed thatat age 7 yr, there was a significantly lower systolic blood pressure in the group of childrenwhose mothers had taken 2000 mg of calcium per day during pregnancy. The greatestantihypertensive effect was seen in the overweight children. As mentioned previously, itis not possible to account for all of the savings that might accrue from calcium supple-mentation if one limits the cost savings to those associated with pre-eclampsia alone. Thegreatest health care savings may not be seen until decades after the intervention.
As mentioned earlier, oxidative stress is another mechanism that has been examinedin pre-eclampsia. Vitamin E is the major lipid-soluble antioxidant in serum, and vitaminC is the major water-soluble antioxidant in the blood. Wang et al. (76) found, and Jainand Wise (77) confirmed, that serum lipid peroxide levels were significantly higher andserum vitamin E levels were significantly lower in women with pre-eclampsia comparedto women with normal pregnancies.
Chappell et al. (68) enrolled 283 pregnant women who were at risk for pre-eclampsiain a placebo-controlled trial using daily supplements of vitamin C (1000 mg) and vita-min E (400 IU). There was a significant 61% reduction in risk of pre-eclampsia in theantioxidant-supplemented group. These investigators hypothesized that antioxidantsmight stabilize the maternal endothelium and placenta and thus reduce risk of pre-eclampsia. They found that the plasma marker for endothelial activation as well as theindex for placental dysfunction were both significantly decreased in the supplementedgroup. The levels of the antioxidants used in this study were well above national rec-ommended intake levels; therefore, this study also provided important data concerningthe safety of high doses of antioxidants during pregnancy.
Reduction in pre-eclampsia, which often occurs before term, also reduces the risk ofpreterm delivery and low-birth-weight outcomes. Again, there appears to be multiplehuman health benefits as well as billions of dollars of cost-saving benefits that could berealized with the optimization of maternal nutrition based on the recent results fromwell-controlled clinical trials as well as survey data that associate low intakes of keynutrients with adverse pregnancy outcomes (Table 2).

Chapter 37 / Preventive Nutrition Throughout the Life Cycle 911
5. CHILDHOOD
Preventive nutrition strategies in childhood center around two major areas of con-cern: the effects of severe and marginal deficiencies of essential nutrients in developingcountries and the health effects of obesity in the children in developed as well as devel-oping countries. Regarding the former, the UNICEF report in 2004 (38) indicated thatiron deficiency impairs mental development in young children and is lowering nationalIQs. It also undermines adult productivity, with estimated losses of 2% of the grossdomestic product in the worst affected countries. Vitamin A deficiency compromises theimmune systems of approx 40% of children under age 5 yr in the developing world,leading to the deaths of 1 million youngsters each year. Undernutrition of essential vit-amins and minerals has its most devastating and durable effects when it occurs early inlife and continues through early childhood.
Undernutrition and essential micronutrient deficiencies are not seen exclusively inthe underdeveloped countries. For instance, in the United States, the Pediatric Nutrition
Table 2Association of Essential Nutrient Status With Reduced Risk
of Adverse Pregnancy Outcomes
Low status associated SupplementationVitamin/mineral with increased risk reduces risk
Folic acid Neural tube birth defects Neural tube birth defectsDamage to sperm DNA
Iron Low birth weightPremature deliveryMaternal morbidity
and mortalityCognitive deficits
Calcium Pre-eclampsia Pre-eclampsia
Iodine Cognitive deficits
Vitamins C and E Pre-eclampsia
Long chain polyunsaturated Premature deliveryfatty acids
Vitamin A as retinol and Low birth weight andas β-carotene premature delivery
Magnesium, copper, Premature delivery and selenium, niacin low birth weight
Multivitamin/mineral Neural tube birth defects,supplement (60, 62) cleft lip/cleft palate,
cardiovascular birthdefects, renal birthdefects, low birthweight, premature delivery
Multivitamin containing Premature deliveryzinc (61)

912 Part IX / Critical Issues for the 21st Century
Surveillance System, which monitors the nutritional status of low-income children,reported that about 18% of the children under age 2 yr and 17% of children ages 2 to 5 yrhad iron deficiency anemia (59). Unfortunately, the percentage of African-Americanchildren with anemia actually rose from 21% in 1989 to about 25% in 1997.
In addition to the adverse effects of iron deficiency on cognitive function, deficien-cies in iodine, polyunsaturated fatty acids, and vitamin B12 have also been linked todecreased cognitive abilities. Other studies have shown that supplementation ofwell-fed children with zinc, folic acid, vitamins B6 and B12, iron, or vitamin A improvedcognitive function (78).
Childhood obesity is a rapidly growing problem in the United States and worldwide.In Chapter 14 of this volume, Williams (20) reviews the demographics and potentialtreatments currently available. Polhamus et al. (59) indicated that the prevalence ofexcessive weight among children less than age 2 yr is about11%; in children ages 2 to5 yr, the rate increased from 7% in 1989 to 8.6% in 1997.
In the United States, obesity is found most frequently in populations with the highestpoverty rates and lowest levels of education. Drewnowski and Spector (79) suggested thathigh nutrient-dense foods are more expensive and less palatable and that the unexpectedrise in obesity levels in the poor resulted partly from poor food choices based on nutritionalquality that, in large part, begins early in life and remains the eating pattern into adulthood.
6. THE ADULT CHRONIC DISEASES
There is a critical convergence of the micronutrients that are discussed as preventivenutrition strategies related to pregnancy and those associated with reduction in risk ofchronic diseases in adulthood. In fact, the origins of adult chronic disease may be atconception or very soon thereafter, so the similarity in the list of essential nutrients mayresult from the fact that these are required throughout the life span. It is only now, whenthere is a critical mass of data, that we are able to see the connecting nutritional threadsthat run throughout life. Therefore, we now examine the parallel data from studies asso-ciating certain nutritional factors with reduction of the risk of adult chronic diseases.
As detailed in Chapter 1 by McGuiness and Ernst, 5 of the 10 leading causes of deathin the United States are conditions that can be modified by diet (80). The major broad cat-egories of nutrition-related chronic diseases include CVD, stroke, cancer, diabetes, andosteoporosis. Deterioration of visual and mental/neurological function could also be addedto this list (31). In attempting to assign health dollar costs to each of these individual cate-gories, it is evident that these conditions overlap regarding the cost of morbidities and mor-talities. For example, a definable comorbidity of obesity is often type 2 diabetes, and thepresence of insulin resistance or type 2 diabetes markedly increases risk for CVD (81).
Nevertheless, in the previous edition of Preventive Nutrition, Blumberg reviewed coststhat could be attributed to the different chronic diseases (32). Examining the three leadingcauses of death specifically, he estimated that the annual economic costs of CVD, cancer,and stroke are $138 billion, $104 billion, and $30 billion, respectively, a total exceeding$250 billion annually. Nutritional interventions that could reasonably delay the onset ofCVD and stroke for 5 yr could result in annual health cost savings of $84 billion.
6.1. Cardiovascular Disease and CancerBendich et al. (31) examined the cost savings that could be accrued if all adults in the
United States took a daily supplement containing a minimum of 100 IU of vitamin E.

Chapter 37 / Preventive Nutrition Throughout the Life Cycle 913
Based on some of the intervention and epidemiological studies that found significantreductions in risk of heart attack in those who had used vitamin E (5,82), it was pre-dicted that universal intervention could lower annual hospital costs by over $5 billionand lower overall costs associated with CVD (CVD) complications by $20 billion.However, as reviewed in Chapter 10 by Hodis et al. (82), not all recent studies have con-firmed secondary cardiovascular risk reduction with supplemental vitamin E. Ongoingstudies will help to evaluate the potential for this essential vitamin (with antioxidant andother functions) to affect the primary prevention of CVD.
In addition to antioxidants such as vitamin E, there has also been a continued asso-ciation of low B-vitamin status (especially folic acid and vitamins B6 and B12) withincreased risk of CVD, stroke, and vascular dementia (3,34,36,83,84). Multivitamin usehas been associated with improved B-vitamin status and reduction in homocysteine lev-els, an important risk factor in CVD and related morbidities (85). Although the cost-effectiveness of multivitamin supplementation has not been reported in the literature,this intervention could also prove to be a cost-saving health strategy.
The potential for supplements to completely halt or slow the progress of already exist-ing disease that has resulted in major debility appears to be quite daunting. Furthermore,the disease may have been progressing for many years before the medically obviousevent occurs, and short-term interventions may be just that—too short. Toole et al. (86)examined the potential for supplements of vitamins (folic acid and vitamins B6 and B12)to reduce the risk of recurrent strokes in a 2-yr, double-blind randomized study of 3680patients who had suffered an ischemic stroke and had higher than average serum homo-cysteine levels. The comparison was between a multivitamin that included a relativelyhigh level of the three B-vitamins versus one with lower levels. Serum homocysteine lev-els were moderately lowered in a dose–response manner; the lower the baseline homo-cysteine, the lower the risk of recurrent stroke. Unfortunately, there was no difference inthe rate of recurrent stroke, CHD, or deaths between the groups. The authors suggestedthat one potential confounder was the mandatory folic acid fortification that occurredduring their study. Another possibility is that the study was too short in duration.
McCarron and Heaney (18) examined the estimated costs associated with diseases orconditions that can be beneficially affected by a diet that is rich in calcium/dairy products.Direct medical costs associated with obesity and diabetes alone reach $100 billion annually.Osteoporosis costs are about $17 billion, and hypertension adds another $34 billion. Datafrom intervention studies and recent epidemiological data consistently find a significantlyreduced risk of colon cancer associated with higher than average calcium intakes; costsassociated with colon cancer alone are estimated at $5 billion annually. Using the findingsof the Dietary Approaches to Stop Hypertension intervention study, the epidemiologicaldata from the Coronary Artery Risk Development in Young Adults Study, and several inter-vention studies using calcium supplements, the authors estimated that $26 billion in healthcare costs could be saved annually with the inclusion of two additional servings of dairyfoods per day; savings would also be seen with increased calcium intake (18).
Another major factor in increasing health care costs is the morbidity associated withobesity. In Chapter 15, Frier and Green suggest that the annual health care costs that can beattributed to obesity from all causes are over $99 billion in the United States (19). Again,the dissection of obesity costs from other factors that are associated with increased CVDand cancer remains to be determined. The associations of obesity with hyperlipidemia,hypertension, and type 2 diabetes all contribute to increased risk for CVD and stroke (81).

914 Part IX / Critical Issues for the 21st Century
Lack of physical activity is certainly another risk factor for both cancer and CVD (87–89).Despite the difficulty in assigning exact dollar costs to each of these risk factors and dis-eases, it seems obvious that combining nutritional approaches with a healthy lifestyle canhave a marked impact on reducing health care costs. However, it has been estimated thatonly 0.25% of health care cost dollars currently go to prevention strategies that would beextremely cost-effective (32).
6.2. OsteoporosisAlthough it is difficult to determine the exact cost savings involved with a preventive
nutrition strategy that could impact more than one disease condition, it is worthwhile toexamine the “minimal” health economic benefit of implementing such a strategy. We havechosen to examine in detail the data from well-controlled intervention studies that tested thehypothesis that nutritional intervention could reduce the risk of osteoporosis-related hip frac-ture. We chose this example because there appears to be less overlap between osteoporosisand the other chronic degenerative diseases discussed. However, we are cognizant that theintervention that was common among the studies reviewed, calcium, has been associatedwith reducing the risk of colon cancer (90) and hypertension (91); thus, even in this exam-ple, the economic benefits may be underestimated.
More than 6 million adults in the United States have osteoporosis (92), which isdefined as having bones that are two standard deviations below the peak bone mineraldensity (BMD) seen in young adults (93,94). Osteoporosis is a known risk factor for hipfracture (95). Osteoporotic hip fractures pose enormous human and economic costs.The nearly 300,000 annual hip fractures in the United States have been estimated to costthe nation around $5.6 billion based on hospital and other costs. Those with hip fracturesexperience increased risk of institutionalization and death (96).
Supplemental calcium with or without vitamin D has been shown to reduce the risk ofhip fractures (97–99). Three placebo-controlled, double-blind studies showed that calciumsupplementation (with or without vitamin D) significantly reduced the risk of hip fracturein individuals over age 50 yr. Bendich et al. (100) conducted a meta-analysis from the riskreduction data presented in these three reviews and arrived at a Mantel-Haenzel combinedrelative risk estimate of 0.53 (95% CI 0.31–0.90) for hip fractures. The pooled relative riskfor all nonvertebral fractures, including hip, was 0.61 (95% CI 0.46–0.80). Therefore, inthese three studies, there was a 47% reduction in the risk of hip fracture in those individu-als who took supplemental calcium at levels that ranged from 500 to 1200 mg per day forup to 3.4 yr. At the same time, there was an additional benefit of a 39% reduction in alltypes of nonvertebral fractures.
Using the risk reductions seen in these studies and US national data on the hospital andcertain other costs associated with hip fracture, the potential reduction in cost was calculatedfor care of hip fracture patients. Over 134,000 hip fractures and $2.6 billion could have beenavoided if all adults over age 50 yr in the United States took 1200 mg of supplemental cal-cium per day. Universal calcium supplementation was cost-effective for women over age 75 yrbased on the need to take the supplemental calcium for 34 mo before the hip fracture reduc-tion was seen. However, if the assumption is made that the benefit would be seen after 12 to14 mo of supplementation (as was seen in the Chapuy study [97]), then universal calciumsupplementation becomes cost-effective for all US men and women ages 65 yr and older.
The savings actually are greater because the calculations did not include the cost savingsassociated with the reduction in the other classes of nonvertebral fractures. The costs

Chapter 37 / Preventive Nutrition Throughout the Life Cycle 915
associated with these events are not fully ascertainable, because many of those whobreak a wrist or other nonvertebral bone often are not hospitalized. Another key findingfrom this study was that calcium supplementation that commences in women over age85 yr is very cost-effective, as the intervention data suggest that even at this age, BMDcan be lost less quickly if calcium supplementation is instituted.
Although the cost analysis did not include vertebral fractures, it appears that fracturesof the spine would also be reduced in many older women who were supplemented with1200 mg of calcium per day. In a placebo-controlled, double-blind study in women overage 60 yr who consumed less than 1000 mg of calcium per day, Recker et al. (101)found that supplementation significantly reduced the risk of spine fractures, especiallyin women with a history of bone fractures.
The National Institutes of Health and the National Academy of Sciences recommendthat postmenopausal women who are not taking estrogen replacement therapy shouldconsume 1500 and 1200 mg, respectively, of elemental calcium daily (72,73). The ben-efit of estrogen replacement and other antiresorptive therapies for osteoporosis preven-tion are predicated on the daily consumption of 1000 mg of calcium (102). However,data from a telephone survey of a representative sample of US households revealed thatthe average daily intake of dietary calcium falls far short of the minimum recommendeddaily amount of 1000 mg. The telephone survey found that only half of the adults ages60 to 94 yr drank one glass of milk, which provides 300 mg of calcium, every day (103).LeBoff et al. (104) measured the vitamin D and calcium status of postmenopausalwomen with hip fractures and found that 50% had deficient vitamin D levels, and over80% had low calcium levels. Because vitamin D is required for calcium absorption, theauthors suggested that the low calcium status was linked to the low vitamin D status.Therefore, these data suggest that individuals at risk for hip and other fractures shouldincrease their calcium as well as vitamin D intakes.
Cost savings analyses are based on databases that capture the costs associated withcertain events. Thus, when health economists are limited to hospitalization costs, it is notpossible to determine the cost savings associated with reducing the occurrence of osteo-porosis, because there are no hospital expenses associated with osteoporosis itself. It iswell-recognized that increasing bone mass during the years of bone growth and earlyadulthood is the best preventive strategy for osteoporosis. However, because there are sofew hospitalizations of young people who fracture bones, universal calcium (and vitamin D)supplementation may not prove to be cost-effective. Recently, however, Singer et al.(105) documented the incidence of fractures in individuals ages 15 to 94 yr in Edinburgh,Scotland. They reported that between the ages of 15 and 49 yr, men had 2.9 times thefractures as age-matched women; fractures of the wrist began to increase in women atage 40 yr, before menopause; and women over age 60 yr had 2.3 times the risk of frac-tures as men of the same age. Although this study did not examine nutritional factors,other studies have linked increased risk of fractures in young adults with low intakes ofcalcium and other micronutrients and low sun exposure, as found in Scotland. It may bethat the establishment of newer databases that capture the total costs (loss of work aswell as medical costs) associated with fractures will permit the evaluation of the cost-effectiveness of earlier nutritional interventions for improvement of bone health.
In addition to reducing the risk of osteoporosis, individuals over age 50 yr who takecalcium supplements at the level of about 1200 mg per day may also be loweringtheir risk for colon cancer. Recently, the data from the Calcium Polyp Prevention Study

916 Part IX / Critical Issues for the 21st Century
(a double-blind, placebo-controlled study) were published (90). The subjects had previ-ously had one colon polyp removed prior to entering this study. Those that took 1200 mgof calcium per day for up to 4 yr had significantly fewer recurrences of polyps than theplacebo group. The mechanism of action of calcium in reducing the risk of colon can-cer by reducing the number of precancerous lesions is believed to be via the reductionin bile acids that are thought to be carcinogenic.
One other potential benefit of calcium supplementation may be a reduction in bloodpressure in both men and women (91). As described earlier, calcium supplementation low-ered blood pressure during pregnancy and also reduced blood pressure in the male andfemale offspring of women who took calcium supplements during pregnancy (71,75).Because high blood pressure is a strong risk factor in stroke and aggravates other CVDs,calcium supplementation may be very cost-effective in all of its biological functions.
It is also important to note that in addition to calcium, antioxidant status has also beenassociated with risk of hip fracture. Lifestyle factors such as smoking also increase therisk of hip fracture. Melhus et al. (106) found a threefold increased risk of hip fracturein women who were current smokers and who had the lowest intakes of either vitamin Eor vitamin C compared to nonsmoking women with the highest antioxidant intakes. Ifthe smokers had the lowest intakes of both vitamins, the odds ratio increased to 4.9.
Smoking, independent of antioxidant status, has been shown to increase the risk of hipfracture, which may be a result of its association with decreased calcium absorption (107).To complete the circle-of-life events, it is most interesting to note that Jones et al. (108)found that maternal smoking during pregnancy resulted in children with shorter staturesthat were linked to lower bone mass. Children of smoking mothers may be at greater riskfor osteoporosis because their bones never accumulate the bone mass needed to preventthis disease in later life. Importantly, infant bone mass has been shown to be increased ifmothers are supplemented with calcium during pregnancy. Koo et al. (109) showed thattotal bone mineral content was significantly greater in infant children born to mothers whowere supplemented with 2000 mg of calcium per day during pregnancy compared towomen in the placebo group who consumed less than 600 mg of calcium per day.
7. KEY MICRONUTRIENTS FOR DISEASE PREVENTION
Several vitamins and minerals have been consistently associated with primary preven-tion of the age-related chronic diseases already discussed as well as with reduction in therisk of developing cataracts and age-related macular degeneration reviewed in Chapter 19by Siegal et al. (110). Coincidentally, the vast majority of these essential micronutrientsalso appear to the reduce the risk of adverse pregnancy outcomes. The list includes someantioxidant vitamins (vitamins C and E), B-vitamins (folic acid, B12, and B6), and vitaminD; minerals associated with improved health outcomes for the young and old include cal-cium, magnesium, iron, zinc, and selenium. It should be noted that iron, zinc, and seleniumare also required for the function of antioxidant enzymes. Copper and manganese also arerequired for some of the antioxidant enzymes, but there are less data currently availableconcerning the disease-preventing role of these specific minerals.
The majority of data associating micronutrients with primary disease preventioncome from epidemiological studies. There appears to be certain chronic diseases thatare good candidates for preventive nutrition strategies (Table 3). Findings suggest thatindividuals with the highest intakes of foods containing these micronutrients have the
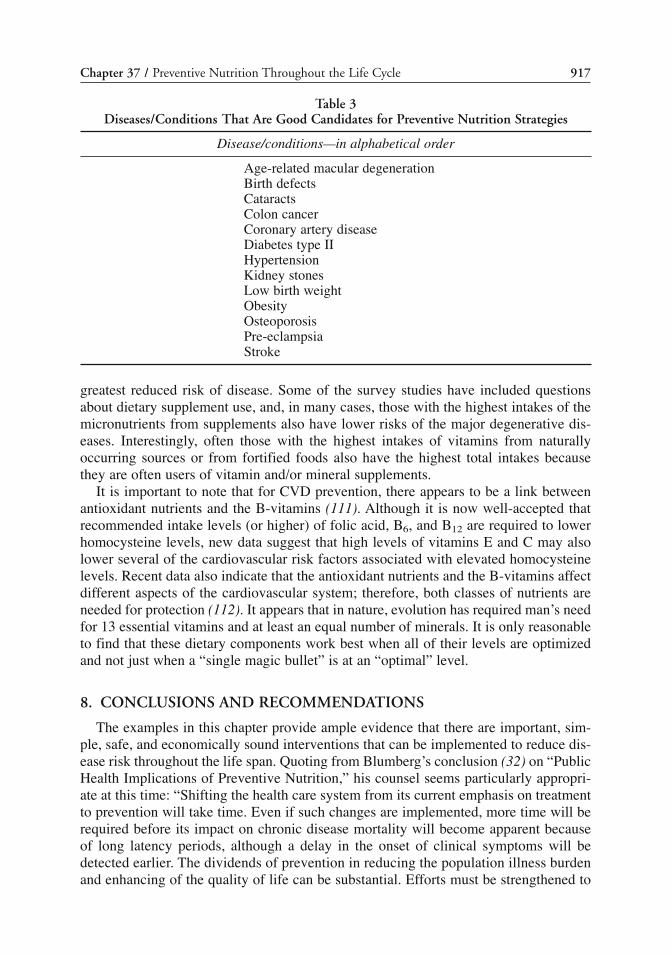
Chapter 37 / Preventive Nutrition Throughout the Life Cycle 917
greatest reduced risk of disease. Some of the survey studies have included questionsabout dietary supplement use, and, in many cases, those with the highest intakes of themicronutrients from supplements also have lower risks of the major degenerative dis-eases. Interestingly, often those with the highest intakes of vitamins from naturallyoccurring sources or from fortified foods also have the highest total intakes becausethey are often users of vitamin and/or mineral supplements.
It is important to note that for CVD prevention, there appears to be a link betweenantioxidant nutrients and the B-vitamins (111). Although it is now well-accepted thatrecommended intake levels (or higher) of folic acid, B6, and B12 are required to lowerhomocysteine levels, new data suggest that high levels of vitamins E and C may alsolower several of the cardiovascular risk factors associated with elevated homocysteinelevels. Recent data also indicate that the antioxidant nutrients and the B-vitamins affectdifferent aspects of the cardiovascular system; therefore, both classes of nutrients areneeded for protection (112). It appears that in nature, evolution has required man’s needfor 13 essential vitamins and at least an equal number of minerals. It is only reasonableto find that these dietary components work best when all of their levels are optimizedand not just when a “single magic bullet” is at an “optimal” level.
8. CONCLUSIONS AND RECOMMENDATIONS
The examples in this chapter provide ample evidence that there are important, sim-ple, safe, and economically sound interventions that can be implemented to reduce dis-ease risk throughout the life span. Quoting from Blumberg’s conclusion (32) on “PublicHealth Implications of Preventive Nutrition,” his counsel seems particularly appropri-ate at this time: “Shifting the health care system from its current emphasis on treatmentto prevention will take time. Even if such changes are implemented, more time will berequired before its impact on chronic disease mortality will become apparent becauseof long latency periods, although a delay in the onset of clinical symptoms will bedetected earlier. The dividends of prevention in reducing the population illness burdenand enhancing of the quality of life can be substantial. Efforts must be strengthened to
Table 3Diseases/Conditions That Are Good Candidates for Preventive Nutrition Strategies
Disease/conditions—in alphabetical order
Age-related macular degenerationBirth defectsCataractsColon cancerCoronary artery diseaseDiabetes type IIHypertensionKidney stonesLow birth weightObesityOsteoporosisPre-eclampsiaStroke

918 Part IX / Critical Issues for the 21st Century
encourage all segments of the population to adopt preventive nutrition strategies, notjust those who are high risk. Food habits develop early in life, and this is a useful timeto develop preventive nutrition behaviors, although an emphasis on older adults appearsmore critical at this juncture, since by 2004 the cost of health care for those over 65 isprojected to constitute 50% of the total national health care bill. Together with anincrease in physical activity and the cessation of tobacco use, dietary modification andimprovements in nutritional status present us with the greatest potential for reducing theincidence of chronic disease, improving public health, and limiting the growth of healthcare expenditures.”
REFERENCES1. “Summary Health Statistics for U.S. Adults: http://www.cdc.gov/nchs/products/pubs/pubd/hes-
tats/obese/obse99.htm2. Deckelbaum RJ, Fisher EA, Winston M, et al. Summary of a Scientific Conference on Preventive
Nutrition: Pediatrics to Geriatrics. Circulation 1999; 100:450–456,.3. Beresford, S.A.A., Motulsky, A.G. Homocyst(e)ine, Folic Acid and Cardiovascular Disease Risk. In:
Bendich A, Deckelbaum, RJ, eds. Preventive Nutrition: The Comprehensive Guide for HealthProfessionals, 3rd ed. Humana Press, Totowa, NJ, 2005.
4. Bostick RM. Diet and Nutrition in the Etiology and Primary Prevention of Colon Cancer. In:Bendich A, Deckelbaum, RJ, eds. Preventive Nutrition: The Comprehensive Guide for HealthProfessionals, 1st ed. Humana Press, Totowa, NJ, 1997, pp. 57–96.
5. Buring JE, Gaziano JM. Antioxidant Vitamins and Cardiovascular Disease. In: Bendich A,Deckelbaum, RJ, eds. Preventive Nutrition: The Comprehensive Guide for Health Professionals,1st ed. Humana Press, Totowa, NJ, 1997, pp. 171–180.
6. Comstock GW, Helzlsouer KJ. Preventive Nutrition and Lung Cancer. In: Bendich A, Deckelbaum,RJ, eds. Preventive Nutrition: The Comprehensive Guide for Health Professionals, 1st ed. HumanaPress, Totowa, NJ, 1997, pp. 109–134.
7. Fontham ETH. Prevention of Upper Gastrointestinal Tract Cancers. In: Bendich A, Deckelbaum, RJ,eds. Preventive Nutrition: The Comprehensive Guide for Health Professionals, 3rd ed. HumanaPress, Totowa, NJ, 2005.
8. Hertog MG, Bueno-de-Mesquita HB, Fehily AM, Sweetnam PM, Elwood PC, Kromhout D. Fruitand vegetable consumption and cancer mortality in the Caerphilly Study. Cancer Epidemiol BiomarkPrev 1996; 5:673–677..
9. Howe GR. Nutrition and Breast Cancer. In: Bendich A, Deckelbaum, RJ, eds. Preventive Nutrition:The Comprehensive Guide for Health Professionals, 1st ed. Humana Press, Totowa, NJ, 1997, pp.97–108.
10. Joshipura KJ, Asherio A, Manson JE, Stampfer MJ, Rimm EB, Speizer FE, Hennelcero CH,Spiegelman D, Willett WC. Fruit and vegetable intake in relation to risk of ischemic stroke. JAMA1999; 282:1233–1239.
11. Kushi LH, Folsom AR, Prinaes RJ, Mink PJ, Ying W, Bostick RM. Dietary antioxidant vitamins anddeath from coronary heart disease in postmenopausal women. N Engl J Med 1996; 334:1156–1162,.
12. Willett WC. Potential Benefits of Preventive Nutrition Strategies: Lessons for the United States. In:Bendich A, Deckelbaum, RJ, eds. Preventive Nutrition: The Comprehensive Guide for HealthProfessionals, 3rd ed. Humana Press, Totowa, NJ, 2005.
13. Jacobs DR, Meyer KA, Kushi LH, Folsom AR. Whole grain intake may reduce the risk of ischemicheart disease death in postmenopausal women: the Iowa Women’s Health Study. Am J Clin Nutr1998; 68:248–257..
14. Jacobs DRR, Marquart L, Slavin J, Kushi, LH. Whole grain intake and cancer: an expanded reviewand meta-analysis. Nutr Cancer 1998; 30:85–96.
15. Jarvi AE, Karlstrom BE, Granfeldt YE, Bjorck IM, Vessby BO, Asp NG. The influence of food struc-ture on postprandial metabolism in patients with non-insulin-dependent diabetes mellitus. Am J ClinNutr 1995; 61(4):837–842.
16. Dietary Guidelines Advisory Committee. Prepared for the Committee by the Agricultural ResearchService, United States Department of Agriculture. Report of the Dietary Guidelines AdvisoryCommittee on the Dietary Guidelines for Americans. 2000, p.1.

Chapter 37 / Preventive Nutrition Throughout the Life Cycle 919
17. Liu S, Stampfer MJ, Hu FB, et al. Whole-grain consumption and risk of coronary heart disease:results from the Nurses’ Health Study. Am J Clin Nutr 1999; 70(3):412–419.
18. McCarron DA, Heaney RP. Estimated healthcare savings associated with adequate dairy food intake.Am J Hypertension 2004; 17:88–97.
19. Frier HI, Greene HL. Obesity and Chronic Disease: Impact of Weight Reduction. In: Bendich A,Deckelbaum, RJ, eds. Preventive Nutrition: The Comprehensive Guide for Health Professionals,3rd ed. Humana Press, Totowa, NJ, 2005.
20. Williams CL. Can Childhood Obesity be Prevented? Preschool nutrition and Obesity. In: Bendich A,Deckelbaum, RJ, eds. Preventive Nutrition: The Comprehensive Guide for Health Professionals,3rd ed. Humana Press, Totowa, NJ, 2005.
21. Bergstrom E, Hernell O. Obesity and Insulin Resistance in Childhood and Adolescence. In: BendichA, Deckelbaum, RJ, eds. Preventive Nutrition: The Comprehensive Guide for Health Professionals,3rd ed. Humana Press, Totowa, NJ, 2005.
22. Faith MS, Calamaro CJ, Pietrobelli A, Dolan MS, Allison DV, Heymsfield SB. Prevention ofPediatric Obesity: Examining the Issues and Forecasting Research Directions. In: Bendich A,Deckelbaum, RJ, eds. Preventive Nutrition: The Comprehensive Guide for Health Professionals,3rd ed. Humana Press, Totowa, NJ. 2005.
23. New York Times, Section F, p. 2, February 10, 2004.24. Kiess W, Bottner A, Bluher S, et al. Phamacoeconomics of obesity management in childhood and
adolescence. Expert Opin Pharmacother 2003; 4(9):1471–1477.25. Holmes MD, Hunter DJ, Colditz GA, et al. Association of dietary intake of fat and fatty acids with
risk of breast cancer. JAMA 1999; 281(10):914–920.26. Rozowski SJ, Moreno M. Effect of Westernization of Nutritional Habits on Obesity in Latin
America. In: Bendich A, Deckelbaum, RJ, eds. Preventive Nutrition: The Comprehensive Guide forHealth Professionals, 1st ed. Humana Press, Totowa, NJ, 1997, pp. 487–504.
27. Zhang S, Hunter DJ, Rosner BA, et al. Dietary fat and protein in relation to risk of non-Hodgkin’slymphoma among women. J Natl Cancer Inst 1999; 91(20):1751–1758,.
28. Calle EE, Thun MJ, Petrelli JM, Rodriguez C, Heath CW Jr. Body-mass index and mortality in aprospective cohort of US adults. N Engl J Med 1999; 341(15):1097–1105,.
29. Zhang S, Hunter DJ, Hankinson SE, et al. A prospective study of folate intake and the risk of breastcancer. JAMA 1999; 281(17):1632–1637.
30. Brandle M, Zhou H, Smith BR, et al. The direct medical cost of type 2 diabetes. Diabetes Care 2003;8:2300–2304.
31. Anderson R. Antioxidant Nutrients and Prevention of Oxidant-Mediated Diseases. In: Bendich A,Deckelbaum, RJ, eds. Preventive Nutrition: The Comprehensive Guide for Health Professionals,3rd ed. Humana Press, Totowa, NJ, 2005
32. Blumberg J. Public Health Implications of Preventive Nutrition. In: Bendich A, Deckelbaum, RJ,eds. Preventive Nutrition: The Comprehensive Guide for Health Professionals, 1st ed. HumanaPress, Totowa, NJ, 1997, pp. 1–17.
33. Krebs-Smith SM, Smicklas-Wright H, Guthrie HA, Krebs-Smith J. The effects of variety in foodchoices on dietary quality. J Am Diet Assoc 1987; 87:897–903,.
34. Selhub J, Jacques PF, Rosenberg IH, et al. Serum total homocysteine concentrations in the thirdNational Health and Nutrition Examination Survey (1991–1994): population reference ranges andcontribution of vitamin status to high serum concentrations. Ann Intern Med 1999; 131(5):331–339.
35. Bendich A, Mallick R, Leader S. Potential health economic benefits of vitamin supplementation.West J Med 1997; 166(5):306–312.
36. Ross GW, Petrovitch H, White LR, et al. Characterization of risk factors for vascular dementia: theHonolulu-Asia Aging Study. Neurology 1999; 53(2):337–343,.
37. Spencer AP, Carson DS, Crouch MA. Vitamin E and coronary artery disease. Arch Intern Med 1999;159(12):1313–1320.
38. Vitamin and Mineral Deficiency. http://www.unicef.org/media/files/davos_micronutrient.pdf.Accessed September 14, 2004.
39. Bendich A, Deckelbaum, RJ, eds. Preventive Nutrition: The Comprehensive Guide for HealthProfessionals, 1st ed. Humana Press, Totowa, NJ, 1997.
40. Bendich A, Deckelbaum, RJ, eds. Preventive Nutrition: The Comprehensive Guide for HealthProfessionals, 2nd ed. Humana Press, Totowa, NJ, 2001.
41. Bendich A, Deckelbaum, RJ, eds. Primary and Secondary Preventive Nutrition, Humana Press,Totowa, NJ, 2001.

920 Part IX / Critical Issues for the 21st Century
42. Czeizel AE. Folic Acid-Containing Multivitamins and Primary Prevention of Birth Defects. In:Bendich A, Deckelbaum, RJ, eds. Preventive Nutrition: The Comprehensive Guide for HealthProfessionals, 1st ed. Humana Press, Totowa, NJ, 1997, pp. 351–371.
43. Scholl TO, Hediger ML. Maternal Nutrition and Preterm Delivery. In: Bendich A, Deckelbaum, RJ, eds.Preventive Nutrition: The Comprehensive Guide for Health Professionals, 1st ed. Humana Press,Totowa, NJ, 1997, pp. 405–421.
44. Woodall AA, Ames BN. Nutritional Prevention of DNA Damage to Sperm and Consequent RiskReduction in Birth Defects and Cancer in Offspring. In: Bendich A, Deckelbaum, RJ, eds. PreventiveNutrition: The Comprehensive Guide for Health Professionals, 1st ed. Humana Press, Totowa, NJ,1997, pp. 373–385.
45. Barker DJ. Fetal origins of cardiovascular disease. Ann Med 1999; 1:3–6.46. Klebanoff MA, Secher NJ. Mednick BR, Schulsinger C. Maternal size at birth and the development
of hypertension during pregnancy: a test of the Barker hypothesis. Arch Intern Med 1999;159(14):1607–1612.
47. Moore SE. Nutrition, immunity and the fetal and infant origins of disease hypothesis in developingcountries. Proc Nutr Soc 1998; 57:241–247,.
48. Yarbrough DE, Barrett-Connor E, Kritz-Silverstein D, Wingard DL. Birth weight, adult weight, andgirth as predictors of the metabolic syndrome in postmenopausal women—the Rancho BernardoStudy. Diabetes Care 1998; 21:1652–1658,.
49. Czeizel AE. Folic Acid-Containing Multivitamins and Primary Prevention of Birth Defects.Foundation for the Community Control of Hereditary Diseases, Budapest, Hungary. In: Bendich A,Deckelbaum, RJ, eds. Preventive Nutrition, 3rd ed., Humana Press, Totowa, NJ, 2005.
50. Czeizel AE, Dudas I. Prevention of the first occurrence of neural-tube defects by periconceptionalvitamin supplementation. N Engl J Med 1992; 327(26):1832–1835.
51. MRC. Prevention of neural tube defects: results of the Medical Research Council Vitamin Study.MRC Vitamin Study Research Group. Lancet 1991; 338(8760):13–17.
52. Botto LD, Khoury MJ, Mulinare J, Erickson JD. Periconceptional multivitamin use and the occur-rence of conotruncal heart defects: results from a population-based, case–control study. Pediatrics:1996; 98(5):911–917.
53. MMWR. Use of folic acid-containing supplements among women of childbearing age-United States,1997. MMWR 1998; 47:131–134,.
54. Butterworth CE, Bendich A. Folic acid and the prevention of birth defects. Ann Rev Nutr 1996;16:73–98,.
55. Bunin GR, Cary JM. Diet and Childhood Cancer: Preliminary Evidence. In: Bendich A,Deckelbaum, RJ, eds. Preventive Nutrition: The Comprehensive Guide for Health Professionals,1st ed. Humana Press, Totowa, NJ, 1997, pp. 17–32.
56. Oakley GP Jr. Eat right and take a vitamin. N Engl J Med 1998; 338(15):1060,1061.57. Berry RJ, Li Z, Erickson JD, et al. Prevention of neural-tube defects with folic acid in China. China-
U.S. Collaborative Project for Neural Tube Defect Prevention. N Engl J Med 1999;341(20):1485–1490.
58. MMWR. Preterm singleton births—United States, 1989–1996. MMWR. 1999; 48:185–189.59. Polhamus B, Dalenius K, Thompson D, et al. Pediatric nutrition surveillance. Nutr Clin Care 2003;
6(3):132–134.60. Scholl TO, Hediger ML, Bendich A, Schall JI, Smith WK, Krueger PM. Use of multivitamin/mineral
prenatal supplements: influence on the outcome of pregnancy. Am J Epidemiol 1997; 146:134–141.61. Goldenberg RL, Tamura T, Neggers Y, et al. The effect of zinc supplementation on pregnancy
outcome. JAMA 1995; 274(6):463–468.62. Scholl TO. Maternal Nutrition and Preterm Delivery. UMDNJ. Camden, NJ. In: Bendich A,
Deckelbaum, RJ, eds. Preventive Nutrition, 3rd ed. Humana Press, Totowa, NJ, 2005.63. deOnis M, Villar J, Gulmezoglu M. Nutritional interventions to prevent intrauterine growth retarda-
tion: evidence from randomized controlled trials. Eur J Clin Nutr 1998; 53(1):S83–S93,.64. Ramakrishnan U, Manjrekar R, Rivera J, Gonzales-Cossio T, Martorell R. Micronutrients and preg-
nancy outcome: a review of the literature. Nutr Res 1999; 19:103–159.65. West KP Jr, Katz J, Khatry SK, et al. Double blind, cluster randomised trial of low dose supple-
mentation with vitamin A or beta carotene on mortality related to pregnancy in Nepal. The NNIPS-2Study Group. BMJ 1999; 318(7183): 570–575.

Chapter 37 / Preventive Nutrition Throughout the Life Cycle 921
66. Fawzi WW, Masamanga GI, Speigelman D, et al. Randomised trial of effects of vitamin supplementson pregnancy outcomes and T cell counts in HIV-1 infected women in Tanzania. Lancet 1998;351(9114):1477–1482.
67. Ramakrishnan U. Nutrition and low birth weight: from research to practice. Am J Clin Nutr 2004;79:17–21.
68. Chappell LC, Seed PT, Bailey Al, et al. Effects of antioxidants on the occurrence of pre-eclampsiain women at increased risk: a randomized trial. Lancet 1999; 254:810–816.
69. DerSimonian R, Levine RL. Resolving discrepancies between a meta-analysis and a subsequentlarge controlled trial. JAMA 1999; 282:664–670.
70. Levine RJ, Hauth JC, Curet LB, et al. Trial of calcium to prevent preeclampsia. N Engl J Med 1997;337(2):69–76.
71. Bucher HC, Guyatt GH, Cook RJ, et al. Effect of calcium supplementation on pregnancy-inducedhypertension and preeclampsia: a meta-analysis of randomized controlled trials. JAMA 1996;275(14):1113–1117,.
72. Anonymous. Optimal calcium intake. NIH consensus development panel. JAMA 1994;272:1942–1948.
73. Institute of Medicine Food and Nutrition Board. Dietary Reference Intakes for Calcium, Phosphorous,Magnesium, Vitamin D, and Fluoride. National Academy Press, Washington DC, 1997, S-9.
74. Crowther CA, Hiller JE, Pridmore B, et al. Calcium supplementation in nulliparous women for theprevention of pregnancy-induced hypertension, preeclampsia and preterm birth: an Australian ran-domized trial. FRACOG and the ACT Study Group. Aust NZ J Obstet Gynaecol 1999; 39:12–18.
75. Belizan JM, Villar J, Bergel E, et al. Long-term effect of calcium supplementation during pregnancyon the blood pressure of offspring: follow up of a randomised controlled trial. BMJ 1997;315(7103):281–285.
76. Wang YP, Walsh SW, Guo JD, Zhang JY. Maternal levels of prostacyclin, thromboxane, vitamin E,and lipid peroxides throughout normal pregnancy. Am J Obstet Gynecol 1991; 165:1690–1694.
77. Jain SK, Wise R. Relationship between elevated lipid peroxides, vitamin E deficiency and hyper-tension in preeclampsia. Mol Cell Biochem 1995; 151:33–38.
78. Hughes D, Bryan J. The assessment of cognitive performance in children: considerations for detect-ing nutritional influences. Nut Rev 2003; 61:413–422.
79. Drewnowski A, Specter SE. Poverty and obesity: the role of energy density and energy costs. AmJ Clin Nutr 2004; 79:6–16.
80. Ernst ND, McGinnis MJ. Preventive Nutrition: A Historic Perspective and Future EconomicOutlook. NHLBI—NIH and RW Johnson Foundation. Preventive Nutrition: The ComprehensiveGuide for Health Professionals, 3rd ed. Human Press, Totowa, NJ, 2005..
81. Goldstein DJ. The Management of Eating Disorders and Obesity, 2nd ed. Humana Press, Totowa,NJ, 2005.
82. Hodis HN, Mack WJ, Sevanian A. Antioxidant Vitamin Supplementation and CardiovascularDisease. In: Bendich A, Deckelbaum, RJ, eds. Preventive Nutrition, The Comprehensive Guide forHealth Professionals, 3rd ed. Humana Press, Totowa, NJ, 2004.
83. Fassbender K, Mielke O, Bertsch T, Nafe B, Froschen S, Hennerici M. Homocysteine in cerebralmacroangiography and microangiopathy. Lancet 1999; 353(9164):1586,1587.
84. Ridker PM, Manson JE, Buring JE, Shih J, Matias M, Hennekens CH. Homocysteine and risk of car-diovascular disease among postmenopausal women. JAMA 1999; 281(19):1817–1821.
85. Jacques PF, Selhub J, Bostom AG, Wilson PW, Rosenberg IH. The effect of folic acid fortifica-tion on plasma folate and total homocysteine concentrations. N Engl J Med 1999;340(19):1449–1454.
86. Toole JF, Malinow MR, Chambless LE, et al. Lowering homocysteine in patients with ischemicstroke to prevent recurrent stroke, myocardial infarction, and death: the Vitamin Intervention forStroke Prevention (VISP) Randomized Controlled Trial. JAMA 2004; 291(5):565,.
87. Blair SN, Brodney S. Effects of physical inactivity and obesity on morbidity and mortality: currentevidence and research issues. Med Sci Sports Exerc 1999; 11(Suppl):S646–S662.
88. McTiernan A, Schwartz RS, Potter J, Bowen D. Exercise clinical trials in cancer prevention research:a call to action. Cancer Epidemiol Biomarkers Prev 1999; 8(3):201–207.
89. Pols MA, Peeters PH, Twisk JW, Kemper HC, Grobbee DE. Physical activity and cardiovasculardisease risk profile in women. Am J Epidemiol 1997; 146(4):322–328.

922 Part IX / Critical Issues for the 21st Century
90. Baron JA, Beach M, Mandel JS, et al. Calcium supplements for the prevention of colorectal adenomas.Calcium Polyp Prevention Study Group. N Engl J Med 1999; 340(2):101–107.
91. McCarron DA, Reusser ME. Finding consensus in the dietary calcium-blood pressure debate. J AmColl Nutr 1999; 18:398S–405S,.
92. Looker AC, Orwoll ES, Johnston CC, et al. Prevalence of low femoral bone density in older USadults from NHANES III. J Bone Miner Res 1997; 12(11):1761–1768.
93. Heaney RP. Osteoporosis: Vitamins, Minerals, and Other Micronutrients. In: Bendich A,Deckelbaum, RJ, eds. Preventive Nutrition: The Comprehensive Guide for Health Professionals,Humana Press, 1st ed. Totowa, NJ, 1997, pp. 285-302.
94. Holick MF, ed. Vitamin D. Humana Press, Totowa, NJ, 1999.95. Marshall D, Johnell O, Wedel H. Meta-analysis of how well measures of bone mineral density pre-
dict occurrence of osteoporotic fractures. BMJ 1996; 312:1254–1259.96. Kleerekoper M, Avioli L. Evaluation and Treatment of Postmenopausal Osteoporosis. In: Favus M,
ed. Primer on the Metabolic Bone Diseases and Disorders of Mineral Metabolism. Lippincott-Raven, Philadelphia, PA, 1996, pp. 264–271.
97. Chapuy M, Arlot M, Duboeuf F, et al. Vitamin D3 and calcium to prevent hip fractures in elderlywomen. New Eng J Med 1992; 327(23):1637–1642.
98. Dawson-Hughes B, Harris S, Krall E, Dallal G. Effect of calcium and vitamin D supplementation onbone density in men and women 65 years of age or older. New Eng J Med 1997; 337(10):670–676.
99. Reid I, Ames R, Evans M, Gamble G, Sharpe S. Long-term effects of calcium supplementation onbone loss and fractures in post-menopausal women: a randomized controlled trial. Am J Med 1995;98:331–335.
100. Bendich A, Leader S, Muhuri P. Supplemental calcium for the prevention of hip fracture: potentialhealth-economic benefits. Clin Ther 1999; 21(6):1058–1072.
101. Recker RR, Hinders S, Davies KM, et al. Correcting calcium nutritional deficiency prevents spinefractures in elderly women. J Bone Miner Res 1996; 11:1961–1966.
102. Nieves JW, Komar L, Cosman F, Lindsay R. Calcium potentiates the effect of estrogen and calci-tonin on bone mass: review and analysis. Am J Clin Nutr 1998; 67(1):18–24.
103. Elbon S, Johnson M, and Fischer J. Milk consumption in older Americans. Am J Pub Health 1998;88:1221–1224.
104. LeBoff MS, Kohlmeier L, Hurwitz S, Franklin J, Wright J, Glowacki J. Occult vitamin D deficiencyin postmenopausal US women with acute hip fracture. JAMA 1999; 281(16):1505–1511.
105. Singer BR, McLauchlan GJ, Robinson CM, Christie J. Epidemiology of fractures in 15,000 adults:the influence of age and gender. J Bone Joint Surg Br 1998; 80(2):243–248.
106. Melhus H, Michaelsson K, Holmberg L, Wolk A, Ljunghall S. Smoking, antioxidant vitamins, andthe risk of hip fracture. J Bone Miner Res 1999; 14(1):129–135.
107. Krall EA, Dawson-Hughes B. Smoking and bone loss among postmenopausal women. J Bone MinerRes 1991; 6:331–338.
108. Jones G, Riley M, Dwyer T. Maternal smoking during pregnancy, growth, and bone mass in prepu-bertal children. J Bone Miner Res 1999; 1:146–151.
109. Koo WWK, Walters JC, Esterlitz J, Levine RJ, Bush AJ, Sibai B. Maternal calcium supplementationand fetal bone mineralization. Obstet Gynecol. 1999; 94:577–582.
110. Siegal M, Chin C-J, Tayler A. Antioxidant Status and Risk for Cataract. In: Bendich A, Deckelbaum,RJ, eds. Preventive Nutrition, 3rd ed. Humana Press, Totowa, NJ, 2005.
111. Nappo F, De Rosa N, Marfella R, et al. Impairment of endothelial functions by acute hyperhomo-cysteinemia and reversal by antioxidant vitamins. JAMA 1999; 281(22):2113–2118.
112. Woodside JV, Young IS, Yarnell JW, et al. Antioxidants, but not B-group vitamins increase the resis-tance of low-density lipoprotein to oxidation: a randomized, factorial design, placebo-controlledtrial. Atherosclerosis 1999; 144(2):419–427.

From: Preventive Nutrition: The Comprehensive Guide for Health Professionals, Third EditionEdited by: A. Bendich and R. J. Deckelbaum © Humana Press Inc., Totowa, NJ
923
Appendix ARelated Readings
1. American Academy of Pediatrics Staff. 1998. Pediatric Nutrition Handbook, 4th ed.Elk Grove Village, IL: American Academy of Pediatrics.
2. Bales, C.W., Ritchie, C.S. 2003. Handbook of Clinical Nutrition and Aging.Totowa, NJ: Humana Press.
3. Bendich, A.B., Deckelbaum, R.J. 2001. Preventive Nutrition: The ComprehensiveGuide for Health Professionals, 2nd ed. Totowa, NJ: Humana Press.
4. Bendich, A.B., Deckelbaum, R.J. 2000. Primary and Secondary PreventiveNutrition. Totowa, NJ: Humana Press.
5. Bendich, A.B., Deckelbaum, R.J. 2005. Preventive Nutrition: The ComprehensiveGuide for Health Professionals, 3rd ed. Totowa, NJ: Humana Press.
6. Bendich, A.B., Deckelbaum, R.J. (eds.) 1997. Preventive Nutrition: TheComprehensive Guide for Health Professionals. Totowa, NJ: Humana Press.
7. Berdanier, C.D. 1998. CRC Desk Reference for Nutrition. Boca Raton, FL: CRCPress.
8. Berdanier, C.D., Failla, M.L. 1998. Advanced Nutrition: Micronutrients. Boca Raton,FL: CRC Press.
9. Bogden, J.D., Klevay, L.M. 2000. Clinical Nutrition of the Essential TraceElements and Minerals: The Guide for Health Professionals (Nutrition andHealth). Totowa, NJ: Humana Press.
10. Boullata, J., Armenti, V.T. 2004. Handbook of Drug–Nutrient Interactions.Totowa, NJ: Humana Press.
11. Bray, G.A., Ryan, D.H. (eds.) 1999. Nutrition, Genetics, and Obesity, PenningtonCenter Nutrition Series, vol. 9. Baton Rouge, LA: Louisiana State University Press.
12. Brody, T. 1998. Nutritional Biochemistry, 2nd ed. San Diego, CA: AcademicPress.
13. Burckhardt, P., Dawson-Hughes, B., Heaney, R.P. July 9, 2004. NutritionalAspects of Osteoporosis, 2nd ed. New York, NY: Academic Press.
14. Chernoff, R. 1999. Geriatric Nutrition: The Health Professional’s Handbook, 2nd ed.Gaithersburgh, MD: Aspen Publishers.
15. Cho, S.S., Prosky, L., Dreher, M. (eds.). 1999. Complex Carbohydrates in Foods.New York: Marcel Dekker.

924 Appendix A / Related Readings
16. Chow, C.K. (ed.) 1999. Fatty Acids in Foods and Their Health Implications, 2nd ed.New York: Marcel Dekker.
17. Clifford, A.J., Muller, H-G. (eds.) 1998. Mathematical Modeling in ExperimentalNutritional. New York: Plenum.
18. Combs, G.F. Jr., 1998. Vitamins: Fundamental Aspects in Nutrition and Health,2nd ed. San Diego, CA: Academic Press.
19. Coulston, A.M., Rock, C.L., Monsen, E.R. (eds.) 2001. Nutrition in the Preventionand Treatment of Disease, 1st ed. New York, NY: Academic Press.
20. Driskell, J. 1999. Sports Nutrition. Boca Raton, FL: CRC Press.21. Duyff, R.L. 2002. American Dietetic Association Complete Food and Nutrition
Guide, 2nd ed. Ontario, Canada: Wiley.22. Eitenmiller, R.R., Landen, W.O., Jr. (eds.) 1999. Vitamin Analysis for the Health
and Food Sciences. Boca Ranton, FL: CRC Press.23. El-Khoury, A.E. (ed.) 1999. Methods for Investigation of Amino Acids and Protein
Metabolism. Boca Raton, FL: CRC Press LLC.24. Escott-Stump, S. 1998. Nutrition and Diagnosis-Related Care, 4th ed.
Hagerstown, MD: Lippincott Williams & Wilkins.25. Frost, G., Dornhorst, A., Moses, R. (eds.) 2003. Nutritional Management of
Diabetes Mellitus (Practical Diabetes). Ontario, Canada: Wiley.26. Gershwin, M., Keen, C.L., German, J.B. (eds.) 1999. Nutrition and Immunology:
Principles and Practice. Totowa, NJ: Humana Press.27. Gibson, G.R., Roberfroid, M.B. 1999. Colonic Microbiota, Nutrition and Health.
Boston, MA: Kluwer Academic.28. Goldstein, D.J. (ed.) 1999. The Management of Eating Disorders and Obesity.
Totowa, NJ: Humana Press. 29. Goldstein, D.J. (ed.), 2005. Management of Eating Disorders and Obesity, 2nd ed.
Totowa, NJ: Humana Press.30. Goldstein, M.C., Goldstein, M.A. 2002. Controversies in Food and Nutrition.
Westpart, CT: Greenwood Press.31. Holick, M.F., Dawson-Hughes, B. (ed.), 2004. Nutrition and Bone Health.
Totowa, NJ: Humana Press.32. Holick, M.F. (ed.), 1998. Vitamin D: Physiology, Molecular Biology, and Clinical
Applications. Totowa, NJ: Humana Press.33. Houston, S.M., Holly, J.M., Feldman, E.L. (ed.), 2004. IGF and Nutrition in
Health and Disease (Nutrition and Health Ser). Totowa, NJ: Humana Press.34. Huang, Y. Sinclair, A. (ed.), 1998. Lipids in Infant Nutrition. Champaign, IL:
AOCS Press.35. Hughes, D.A., Darlington, G.L., Bendich, A. (ed.),. 2003. Diet and Human Immune
Function. Totowa, NJ: Humana Press.36. Kessler, D.B., Dawson, P. (eds.) 1999. Failure to Thrive and Pediatric Undernutrition:
A Transdisciplinary Approach. Baltimore, MD: Paul H. Brookes Publishing.37. Mann, J., Truswell, A.S., Truswell, S. (eds.) 1998. Essentials of Human Nutrition.
New York: Oxford University Press.38. Mann, J., Truswell, S. 2002. Essentials of Human Nutrition, 1st ed. Oxford:
University Press.39. Mcardle, W.D., Katch, F.I., Katch, V.L. 1999. Sports and Exercise Nutrition.
Philadelphia, PA: Williams & Wilkins.

Appendix A / Related Readings 925
40. McCormick, D.B. (ed.). 1998. Annual Review of Nutrition. Palo Alto, CA: AnnualReviews Inc.
41. Miller, G.D., Jarvis, J.K., McBean, L.D. (ed.), 1999. Handbook of Dairy Foodsand Nutrition, 2nd ed. Boca Raton, FL: CRC Press.
42. Miller, T.L., Gorbach, S.L. (eds.) 1999. Nutrition Aspects of HIV Infection. NewYork: Oxford University Press.
43. Morrison, G., Hark, L. 1999. Medical Nutrition and Disease, 2nd ed. Malden,MA: Blackwell Science, Inc.
44. Mostofsky, D.I., Yehuda, S., Salem, N. Jr. (ed.), 2001. Fatty Acids: Physiologicaland Behavioral Functions. Totowa, NJ: Humana Press.
45. Nieman, D.C., Pedersen, B.K. (eds.) 2000. Nutrition and Exercise Immunology.Boca Raton, FL: CRC Press.
46. Oberleas, D., Harland, B.F., Bobilya D.J. 1999. Minerals: Nutrition andMetabolism. New York: Vantage Press.
47. O’Dell, B.L., Sunde, R.A. 1997. Handbook of Nutritionally Essential MineralElements, vol. 2. New York: Marcel Dekker.
48. Papas, A. (ed.). 1998. Antioxidant Status, Diet, Nutrition, and Health. Boca Raton,FL: CRC Press.
49. Peckenpaugh, N.J., Poleman, C.M. 1999. Nutrition Essentials and Diet Therapy,8th ed. Philadelphia, PA: WB Saunders.
50. Pence, B.C., Dunn, D.M. 1998. Nutrition and Women’s Cancers. Boca Raton, FL:CRC Press.
51. Pennington, J.A.T., Bowes, A.D., Church, H. 1998. Bowes and Church’s FoodValues of Portions Commonly Used, 17th ed. Philadelphia, PA: Lippincott.
52. Rugg-Gunn, A.J., Nunn, J.H. 1999. Nutrition, Diet, and Oral Health. Oxford:Oxford University Press.
53. Sadler, M.J., Strain, J.J., Caballero, B. (eds.) 1998. Encyclopedia of HumanNutrition. San Diego, CA: Academic Press.
54. Semba, R.D., Bloem, M.W. (eds.), 2001. Nutrition and Health in DevelopingCountries. Totowa, NJ: Humana Press.
55. Shils, M., Olson, J.A., Shike, M. Ross, A.C. (eds.). 1999. Modern Nutrition inHealth and Disease, 9th ed. Baltimore, MD: Williams & Wilkins.
56. Simopoulos, A.P. (ed.) 1998. The Return of ω3 Fatty Acids into the Food Supply.I. Land-Based Animal Food Products and Their Health Effects. Basel, Switzerland:Karger, S., AG.
57. Spallholz, J.E., Mallory Boylan, L., Driskell, J.A. 1999. Nutrition: Chemistry andBiology, 2nd ed. Boca Raton, FL: CRC Press LLC.
58. Stafstrom, C.E., Rho, J.M. (eds.), 2004. Epilepsy and the Ketogenic Diet. Totowa, NJ:Humana Press.
59. Stipanuk, M. (ed.) 1999. Biochemical and Physiological Aspects of HumanNutrition. Philadelphia, PA: Saunders, W.B.
60. Taylor, A. (ed.) 1999. Nutritional and Environmental Influences on the Eye. BocaRaton, FL: CRC Press LLC.
61. Tarnopolsky, M. (ed.) 1999. Gender Differences in Metabolism: Practical andNutritional Implications. Boca Raton, FL: CRC Press.
62. Touger-Decker, R., Sirois, D.A., Mobley, C.C. (eds.), 2004. Nutrition and OralMedicine. Totowa, NJ: Humana Press.

926 Appendix A / Related Readings
63. Veith, W.J. (ed.) 1999. Diet and Health, 2nd ed. Boca Raton, FL: CRC Press.64. Watson, R.R. (ed.) 1998. Nutrients and Foods in AIDS. Boca Raton, FL: CRC
Press.65. Watson, R.R., Preedy, V.R. 2003. Nutrition and Heart Disease: Causation and
Prevention. Boca Raton, FL: CRC Press.66. Willett, W. 1998. Nutritional Epidemiology, 2nd ed. New York: Oxford University
Press.67. Wilson, T., Temple, N.J. (ed.), 2003. Beverages in Nutrition and Health. Totowa,
NJ: Humana Press.68. Wilson, T., Temple, N.J. (ed.), 2001. Nutritional Health: Strategies for Disease
Prevention. Totowa, NJ: Humana Press. 69. Wolinsky, I. (ed.) 1998. Nutrition in Exercise and Sport, 3rd ed. Boca Raton, FL:
CRC Press.

From: Preventive Nutrition: The Comprehensive Guide for Health Professionals, Third EditionEdited by: A. Bendich and R. J. Deckelbaum © Humana Press Inc., Totowa, NJ
927
Appendix BWeb Sites of Interest
http://www.ifst.org/The Institute of Food Science & Technology (IFST) is based in the United Kingdom,with members throughout the world, with the purpose of serving the public interest inthe application of science and technology for food safety and nutrition as well as fur-thering the profession of food science and technology. Eligibility for membership canbe found at the IFST home page, an index and a search engine are available.
http://www.nysaes.cornell.edu/cifs/start.htmlThe Cornell Institute of Food Science at Cornell University home page provides infor-mation on graduate and undergraduate courses as well as research and extensionprograms. Links to related sites and newsgroups can be found.
http://www.blonz.comCreated by Ed Blonz, PhD, “The Blonz Guide” focuses on the fields of nutrition, foods,food science and health supplying links and search engines to find quality sources,news, publication, and entertainment sites.
http://www.hnrc.tufts.edu/The Jean Mayer US Department of Agriculture (USDA) Human Nutrition Research Centeron Aging (HNRC) at Tufts University is one of six mission-oriented centers aimed at study-ing the relationship between human nutrition and health, operated by Tufts Universityunder the USDA. Research programs; seminar and conference information; publications;nutrition, aging, medical and science resources; and related links are available.
http://www.fao.org/The Food and Agriculture Organization (FAO) is the largest autonomous agency withinthe United Nations, founded “with a mandate to raise levels of nutrition and standardsof living, to improve agricultural productivity, and to better the condition of ruralpopulation,” emphasizing sustainable agriculture and rural development.
http://www.eatright.org/The American Dietetic Association is the largest group of food and nutrition profes-sionals in the United States, members are primarily registered dietitians (RDs) and

928 Appendix B / Web Sites of Interest
dietetic technicians, registered (DTRs). Programs and services include promoting nutri-tion information for the public; sponsoring national events, media and marketing pro-grams, and publications (The American Dietetic Association); and lobbying for federallegislation. Also available through the website are member services, nutrition resources,news, classifieds, and government affairs. Assistance in finding a dietitian, marketplacenews, and links to related sites can also be found.
http://www.faseb.orgThe Federation of American Societies for Experimental Biology (FASEB) is a coalitionof member societies with the purpose of enhancing the profession of biomedical and lifescientists, emphasizing public policy issues. FASEB offers logistical and operational sup-port as well as sponsoring scientific conferences and publications (The FASEB Journal).
http://www.foodsciencecentral.comThe International Food Information Service (IFIS) is a leading information, product andservice provider for professionals in food science, food technology, and nutrition. IFISpublishing offers a wide range of scientific databases, including FSTA–Food Science andTechnology Abstracts. IFIS GmbH offers research, educational training, and seminars.
http://www.ift.org/The Institute of Food Technologists (IFT) is a membership organization advancing thescience and technology of food through the sharing of information; publications includeFood Technology and Journal of Food Science; events include the annual meeting andFood Expo. Members may choose to join a specialized division of expertise (there are 23divisions); IFT student associations and committees are also available for membership.
http://www.veris-online.org/The VERIS Research Information Service is a nonprofit corporation, focusing onantioxidants, providing professionals with reliable sources on the role of nutrition inhealth. Data in VERIS publications, distributed without fee to those who qualify, isbased on technical peer-reviewed journals. Quarterly written reports and newsletters,research summaries, annual abstract books, vitamin E fact book and educational pro-grams are among the available VERIS publications and communications. Links to help-ful web resources are also accessible.
http://www.osteo.org/The National Institutes of Health Osteoporosis and Related Bone Diseases–NationalResource Center (NIH ORBD-NRC) mission is to “provide patients, health professionals,and the public with an important link to resources and information on metabolic bone dis-eases, including osteoporosis, Paget’s disease of the bone, osteogenesis imperfecta, andhyperparathyroidism. The Center is operated by the National Osteoporosis Foundation, incollaboration with The Paget Foundation and the Osteogenesis Imperfecta Foundation.”
http://www.ag.uiuc.edu/~food-lab/nat/The Nutrition Analysis Tool (NAT) is a free web-based program designed to be used by any-one to analyze the nutrient content of food intake. Links to an “Energy Calculator” and “SoyFood Finder” are also available. NAT is funded by C-FAR at the University of Illinois.

Appendix B / Web Sites of Interest 929
http://www.calciuminfo.comThis is an online information source created, copyrighted, and maintained byGlaxoSmithKline Consumer Healthcare Research and Development. The nutritionaland physiological role of calcium is presented in formats designed for health care pro-fessionals, consumers, and kids. References and related links, educational games forkids, calcium tutorials, and a calcium calculator are easily accessible.
http://vm.cfsan.fda.gov/The Center for Food Safety and Applied Nutrition (CFSAN) is one of five product-ori-ented centers implementing the Food and Drug Administration’s mission to regulatedomestic and imported food as well as cosmetics. An overview of CFSAN activities canbe found along with useful sources for researching various topics such as food biotech-nology and seafood safety. Special interest areas, for example, advice for consumers,women’s health, and links to other agencies are also available.
http://www.bcm.tmc.edu/cnrc/The Children’s Nutrition Research Center (CNRC) at Baylor College of Medicine isone of six USDA/ARS human nutrition research centers in the nation, assisting healthcare professionals and policy advisors to make appropriate dietary recommendations.CNRC focuses on the nutrition needs of children, from conception through adolescence,and of pregnant and nursing women. Consumer news, seminars, events, and mediainformation are some of the sections available from this home page.
http://www.dsqi.org/The Dietary Supplement Quality Initiative (DSQI) is designed to educate consumers onthe health benefits, safety, standards and regulations, and labeling of dietary supple-ments. Industry news, interviews, editorials, and DSQI resources and services provideuseful tools for consumers, practitioners, producers and distributors.
http://www.usda.govThe US Department of Agriculture (USDA) provides a broad scope of service to thenation’s farmers and ranchers. In addition, the USDA ensures open markets for agricul-tural products, food safety, environmental protection, conservation of forests and ruralland, and the research of human nutrition. Affiliated agencies, services and programsare accessible through this web site.
http://www.nalusda.gov/The National Agriculture Library (NAL), a primary resource for agriculture informa-tion, is one of four national libraries in the United States and a component of theAgriculture Research Service of the US Department of Agriculture. Access to NAL’sinstitutions and resources are available through this site.
http://www.fns.usda.gov/fns/The Food and Nutrition Service (FNS) administers the US Department of Agriculture’s(USDA) 15 food assistance programs for children and needy families with the missionto reduce hunger and food insecurity. Details of nutrition assistance programs andrelated links can be found.

930 Appendix B / Web Sites of Interest
http://www.agnic.org/The Agriculture Network Information Center (AgNIC), established through the allianceof the National Agriculture Library (NAL) and other organizations, provides publicaccess to agriculture-related resources.
http://www.who.int/nut/welcome.htmThe World Health Organization (WHO) has regarded nutrition to be of fundamentalimportance for overall health and sustainable development. The global priority of nutri-tional issues, activities, mandates, resources, and research are presented in detail.
Nutritional Science JournalsBrown CM. Where to find nutritional science journals on the World Wide Web. J Nutr1997; 127:1527–1532.
http://www.crcpress.com/jour/catalog/foods.htmCritical Reviews in Food Science and Nutrition
http://www.wiley.com/Home.htmlInternational Journal of Eating Disorders
http://www.peakcom.com/clinnutr.org/jabs.htmlJournal of Parenteral and Enteral Nutrition
http://www.lrpub.com/journals/j1013.htmJournal of Pediatric Gastroenterology and Nutrition
http://www.elsevier.nl:80/inca/publications/store/5/2/5/0/1/3/Journal of Nutritional Biochemistry
http://www.karger.com/journals/anm/anm jh.htmAnnals of Nutrition and Metabolism
http://www.hscsyr.edu/n~utrition/Nutrition: The International Journal of Applied and Basic Nutritional Sciences
http://www.elsevier.nl/inca/publications/store/5/2/5/4/8/3/Nutrition Research
http://www.humanapress.comHumana Press web site

931
Index
A
AAP. See American Academy of Pediatrics (AAP)Abbreviations, 870tAbdominal pain, 840ACAT, 286Acid ash residue
calcium, 446Acquired bone mass, 440Acrodermatitis enteropathica, 560AcylCoA cholesterol acyltransferase (ACAT),
286Adaptive learning mode, 897Adenosylmethionine, 418Adipocytokines
obesity, 300–301Adiposity rebound, 352–354, 353f, 364Adolescents
alcohol, 820–821Africa, 348African Americans, 347, 350Aged, 7t
alcohol, 821B cells, 555cataracts, 464immunity, 551–568, 552–556, 553tinfectious disease, 555interleukins, 556Latin America, 773fmicronutrients, 551–568mortality, 554fneutrophils, 555thymus, 552–553T lymphocytes, 553–555
Age-related bone loss, 442fAge Related Eye Disease Study (AREDS), 467,
470t–473t, 475, 497Agita Sao Paulo
Brazil, 784AgNIC
websites, 930Agriculture
Chile, 767–768Agriculture Network Information Center
(AgNIC)websites, 930
AHA. See American Heart Association (AHA)Aim, Build, Choose, 904tAlameda County Study, 252Alcohol, 722, 807–826, 812f
adolescents, 820–821cancer, 822causes vs consequences, 808–811death and disease burdens, 819–821diseases associated with, 821–822diversity vs collectivity, 811–816esophageal adenocarcinoma, 32–33esophageal squamous cell carcinoma, 26–27,
27theart attacks, 822–823hypertension, 822–823ignorance vs knowledge, 824–825infants and children, 820lifestyle choices, 810–811median, mean, moderation, 811nutrients, 816–817older population, 821pregnancy, 820public health collectivity, 811–813risk factors vs causes, 819–823stomach cancer, 36–37stroke, 822–823temporal variance in intake pattern, 813–814toxicities, 818–819
Alcoholic lung diseaseannual burden, 6
Alcoholismdisease concept, 814–816
Allium, 69�-carotene
cataract, 491fcataract extraction, 492cortical cataract, 492nuclear cataract, 490–492posterior subcapsular cataract, 492
�-linolenic acidchemical structure, 280fnuts, 241toils, 241tvegetables, 241t
�-tocopherol, 93, 96, 408

932 Index
Alpha Tocopherol Beta Carotene (ATBC), 260–261, 262–263, 269, 475
Cancer Prevention Study, 96Aluminum
calcium, 447Alzheimer’s disease, 5American Academy of Pediatrics (AAP)
diagnosis, 371dietary guidelines, 360pediatric overweight prevention recommenda-
tions, 337tAmerican Cancer Society
nutritional guidelines, 45websites, 45t
recommendations, 168American College of Gastroenterology
Helicobacter pylori treatment guidelines, 45–46American Diabetes Association
nutritional guidelineswebsites, 45t
American Dietetic Associationwebsites, 927–928
American Heart Association (AHA)dietary guidelines, 360nutritional guidelines, 45
websites, 45tstep I/II diet, 396
American Medical AssociationLCME, 891
Amitriptylineriboflavin excretion, 851
Anabolic hormones, 842Anemia
prevalence, 705fAngiographical studies, 256–258Antacids, 851Antibiotics
anti-inflammatory properties, 524Antibody responses
vitamin A deficiency, 578Anticonvulsants
serum folate, 840vitamin D, 850, 851
Antioxidant(s), 246–248anti-atherogenic effects, 248–259cardiovascular protective effects
B-mode ultrasound trials, 258–259, 267–268
randomized controlled trials, 259–268cataracts, 463–498
epidemiological studies, 468–497, 469tdegenerative disorders, 513–514epidemiological studies, 249–251
health claims, 877–878lens, 464–467pregnancy, 657–658preterm delivery
studies, 650tserum
case-control studies, 254–255cross-sectional studies measuring, 253–254prospective cohort studies, 255–256studies measuring, 253–257
Antioxidant enzymes, 408Antioxidant index
cataractsobservational studies, 494–497
Antioxidant micronutrientsvitamin C, 410–412
animal studies, 410epidemiological studies, 410–412
Antioxidant nutrientscancer, 512–513cardiovascular disease, 512oxidant-mediated disease prevention, 505–516smoking-related disease, 510–513
Antioxidant Supplementation in AtherosclerosisPrevention (ASAP), 267–268, 270
Antioxidant vitamin supplementscardiovascular disease, 245–272
completed randomized controlled trial,259–268
ongoing randomized controlled trial, 270–272, 271t
randomized controlled trial, 268–270Aortic plaques
menhaden oil, 226apoB
fish oil, 235–236AREDS. See Age Related Eye Disease Study
(AREDS)Argentina
fats, 775food habits, 774
ARM, 497Arterial imaging studies, 256–259, 266–268Arthritis, 5Arylamine N-acetyltransferase, 71ASAP, 267–268, 270Ascorbate
clinical trials, 558–559lens, 466
Ascorbic acidesophageal squamous cell carcinoma, 30
Asia, 348atherosclerosis, 799–800

Index 933
cholesterol, 797fchronic disease epidemiology, 792–794nutritional recommendations, 801–802risk factors, 794–797Western diet, 791–802
Asthmasinusitis, 535viral respiratory infections, 535
ATBC. See Alpha Tocopherol Beta Carotene(ATBC)
Atherosclerosis, 246–248, 903Asia, 799–800experimental
fish oil, 226Atwater’s calorimetry, 824Avocado unsaponifiables, 418Ayurdevic remedy, 418
B
Bangladeshunderweight children, 698f
Barker Hypothesis, 904Barrett’s esophagus
medications, 31–32Basel Prospective Study, 255B cells
aging, 555Behavioral weight loss interventions, 331–332Benzyl isothiocyanate (BITC), 68�-carotene, 90, 96, 260–261, 262–263, 269, 408,
467, 475Cancer Prevention Study, 96cardiovascular protection
randomized controlled trial, 262–263cataract, 489fcataract extraction, 490cell culture models, 162–163cigarette smoking, 511–512circulating leukocytes, 514–515clinical trials, 559cortical cataract, 490dietary and supplementary intake
epidemiological studies, 250t, 252–253mixed cataract, 490nuclear cataract, 490posterior subcapsular cataract, 490randomized controlled trial, 96–98, 97t–98tsmoking, 114
Beta Carotene and Retinol Efficacy Trial, 96,263, 269
Bioavailability, 158–159Biochemical studies
esophageal squamous cell carcinoma, 30
Biotincatabolism, 840
Birthvitamin A
clinical trials, 586tBirth defects, 904–905
developing countries, 907–909folate-rich diets, 619–620folic acid multivitamins, 603–623food fortification, 622–623nutritional intervention, 619–623
Birth weight, 346. See also Low birth weightBITC, 68Black tea (Congou tea)
esophageal squamous cell carcinoma, 29Black tea flavonols, 61–63Bladder cancer
soy, 144Blonz Guide
websites, 927Blood donor studies
iron, 183–184Blood glucose
drug-induced changes, 843tBlood pressure, 324
calcium, 909, 910weight loss, 390
Blount’s disease, 350BMD, 914
calcium, 427–429BMI. See Body mass index (BMI)Body fat
dietary fat, 717–718Body mass index (BMI), 296, 298, 345
CDC overweight, 321diabetes risk, 387mortality, 386f
Body weight, 721–722Bogalusa Heart Study, 363
Louisiana, 347Bolivia
food habits, 774Bone
micronutrients, 409Bone factors
vitamin A, 582–583Bone loss
age-related, 442fBone mass
acquired, 440genetically programmed
acquisition, 438–440Bone mineral density (BMD), 914
calcium, 427–429

934 Index
Bone turnovercalcium, 427–429fracture risk reduction, 429reduction, 428–429
Bookspreventive nutrition, 923–926
Braindevelopment, 666
BrazilAgita Sao Paulo, 784food consumption, 775fobesity, 779, 781protein calories, 774socioeconomic changes, 773
Breast cancer, 394–395dietary fat, 716–717fat, 902soy, 65
animal studies, 126–130, 127t–129tepidemiological studies, 124–126, 125t–
126ttrans-fatty acids, 288
BreastfeedingChile, 765
British Department of Health and Social SecurityNutritional Survey, 252
C
CACFP, 357Caffeine
calcium, 445Calcium, 109–111, 115, 366, 720–721
acid ash residue, 446aluminum, 447ascertaining requirements, 435–438blood pressure, 909, 910bone mineral density, 427–429bone turnover, 427–429caffeine, 445cancer, 91, 110fcitrate, 448claim
FDA approval, 874colon cancer, 915–916cost savings, 915esophageal squamous cell carcinoma, 30fracture risk reduction, 429fractures, 915information
websites, 929intake and retention curves, 436f, 439fintestinal absorption, 444–445menopause, 440–441
osteoporosis, 425–430, 435–438phosphorus, 446–447postmenopausal osteoporosis, 426t, 428f, 915pregnancy, 654–655, 909preterm delivery
studies, 645t–647tprotein, 445–446recommendations, 455renal conservation, 445–446requirements, 437tsodium, 445–446sources, 447–448, 448fthreshold intake, 436f
Calcium citrate malate (CCM), 448Calcium Polyp Prevention Study, 915–916Cambridge Heart Antioxidant Study (CHAOS),
264, 269Camellia sinensis
esophageal squamous cell carcinoma, 29flavonols, 61–63
Canadahealth claims, 884
Cancer, 903, 912–913annual burden, 6antioxidant nutrients, 512–513cell apoptosis
soy, 145dietary fat, 716–717incidence, 5risk
dietary supplements, 89–116trans-fatty acids, 288weight loss, 395
Cancer Prevention Study, 386Captopril, 857Carbamazepine, 836
vitamin D, 850Carbohydrate induced hypertriglyceridemia
fish oil, 232–235Carcinogens, 508Cardiovascular birth defects, 905Cardiovascular diagnosis, 912–913Cardiovascular disease, 349, 390–393, 913
antioxidant nutrients, 512antioxidants vitamin supplements, 245–272dietary folate, 207–210fat, 902folate, 205–207, 207–210folic acid, 191–213homocysteine, 191–213
Cardiovascular riskobesity, 391
CARET, 96, 263, 269

Index 935
Caribbean countriesLifestyle Project, 785
CARMEN, 784Carotene. See also �-carotene; �-carotene
tomatoes, 167Carotene and Retinol Efficacy Trial (CARET),
96, 263, 269Carotenoids, 467. See also Total carotenoids
cataractobservational studies, 485–494
Case-based learning, 894Catalase, 408Cataracts
�-carotene, 491fantioxidant index
observational studies, 494–497antioxidants, 463–498
epidemiological studies, 468–497, 469t�-carotene, 489fcarotenoids
observational studies, 485–494etiology, 464–468extraction, 477
�-carotene, 492�-carotene, 490lutein and zeaxanthin, 488multivitamins, 496total carotenoids, 485–486vitamin C, 482vitamin E, 484–485
future research, 497lutein, 487f, 488multivitamins
observational studies, 494–497riboflavin, 493frisk ratio, 475ftotal carotenoids, 485–492, 486fvitamin C, 477–482, 481fvitamin E
observational studies, 482–484zeaxanthin, 487f, 488
CATCH, 331, 364, 365tCCM, 448CDC
overweight, 321Cellular immunity
vitamin A deficiency, 577–578Center for Food Safety and Applied Nutrition
(CFSAN)websites, 929
Centers for Disease Control and Prevention(CDC)
overweight, 321
Cereals, 11Cerebrovascular disease, 792
homocysteine, 205CETP, 285CFSAN
websites, 929CHAOS, 264, 269CHD. See Coronary heart disease (CHD)Chemoprevention studies
esophageal squamous cell carcinoma, 30–31Child. See also Early childhood
alcohol, 820Chile
homeless, 767malnourished, 755t, 763–765
healthy diet, 375timmunization
vitamin A clinical trials, 586tnutritional status
development, 756fobesity
Latin America, 782tpreventive nutrition, 911–912underweight
Bangladesh, 698fChild and Adolescent Trial for Cardiovascular
Health (CATCH), 331, 364, 365tChild and Adult Care Food Program (CACFP),
357Childhood obesity
comorbidities, 324–326dietary fat, 363–364environment, 327–329family-based behavior, 332genetic influences, 326–327health effects, 349–350mechanisms, 326–329prevalence, 323–324prevention, 329–332, 345–375
goals, 355tprioritizing, 323–324
primary prevention studies, 330secondary prevention, 354secondary prevention studies, 330–332tertiary prevention studies, 330–332tracking into later life, 348–349
Children’s Nutrition Research Center (CNRC)websites, 929
Chileagriculture, 767–768breastfeeding, 765CONIN, 763–765CONPAN, 762–768

936 Index
fast foods, 782food and nutrition interventions, 763food distribution, 760t, 761ffood habits, 774homeless children, 767infant mortality, 754f, 754tmalnourished children, 755t
treatment, 763–765malnutrition, 753–759marasmic infants, 764tnutritional policy, 762–768nutrition education, 765obesity, 779, 780f, 781potable water and sewage services, 768tpreschool food program, 766primary education, 766primary health care, 759–761protein, 778rural health care, 765–766sanitation, 767school food program, 766socioeconomic changes, 773
Chilean Nutrition Foundation (CONIN), 763–765Chives, 69Chlorpromazine
riboflavin excretion, 851Cholesterol, 14, 360, 362
Asia, 797fJapan, 795, 796fKorea, 796serum
age-adjusted prevalence, 391fCholesterol Lowering Atherosclerosis Study
(CLAS), 257Cholesteryl ester transfer protein (CETP), 285Cholestyramine, 854Chondrocyte metabolism
vitamin D, 408Chondrocytes, 406Chondroitin sulfate
osteoarthritis, 416–418Chronic disease
obesity, 383–397Chronic disease prevention
factors influencing, 4–16Chronic disease risk factors, 349Chronic diseases
cost, 913Chronic lung disease
annual burden, 6Chylomicronemia syndrome, 228Cigarette smoke
phagocytes, 507
Cigarette smoking, 506–507�-carotene, 511–512oxidants, 506proinflammatory effects, 506–507vitamin C, 511vitamin E, 511–512
Cinnamic acid, 57, 57t, 58Circulating leukocytes
�-carotene, 514–515vitamin C, 514–515vitamin E, 514–515
Cirrhosis, 821–822CLAS, 257Clinical nutrition curriculum, 18CNRC
websites, 929Cobalamin
homocysteine, 202osteoarthritis, 415
Codex Alimentarius, 885Cod liver oil, 539–540
historical perspective, 535–536tuberculosis, 538
Collagen metabolismvitamin E, 408
Colon cancercalcium, 915–916
Colorectal cancer preventionsoy
animal studies, 136–139, 138t–139tepidemiological studies, 135–136, 136t
Complex carbohydrates, 719–720Computer-based instruction, 894Congou tea
esophageal squamous cell carcinoma, 29CONIN, 763–765CONPAN
Chile, 762–768Constipation, 840Consumer health information
FDA, 878–879Copper
osteoporosis, 453–454plasma levels, 527t
Cornell Institute of Food Sciencewebsites, 927
Coronary angiographical trials, 266–268Coronary Artery Risk Development in Young
Adults Study, 913Coronary heart disease (CHD), 364
annual burden, 6body iron stores
epidemiological data, 176–184

Index 937
dietary iron, 182–183homocysteine, 202–205
causal relationship, 210–212meta-analyses, 203t
incidence, 5iron, 174iron overload, 184–185Norway, 749fpooled relative risk, 287fserum ferritin
case-control studies, 181–182cohort studies, 176–179, 177tcross-sectional studies, 181–182
subscapular skinfold thickness, 393tTS
cohort studies, 179–181, 180tCortical cataract, 476
�-carotene, 492�-carotene, 490lutein and zeaxanthin, 488multivitamins, 494–496riboflavin, 492–494total carotenoids, 485vitamin C, 480–481vitamin E, 484
Corticosteroids, 836, 842, 855–856, 857Costa Rica
food habits, 774Cost savings
calcium, 915osteoporosis, 915
Council for Food and Nutrition (CONPAN)Chile, 762–768
Cruciferous vegetables, 68Cuba
carbohydrates, 776
D
Daidzein, 64Dairy products, 720–721Daycare
obesity prevention, 370–372Death
leading causes, 4treal causes, 5t
Degenerative disordersantioxidants, 513–514phagocytes, 513–514
Degenerative osteoarthritis, 406Delayed hypersensitivity skin test responses
micronutrients, 562tDementia
vascular, 913
Demographic profiles, 6Depression, 326Developed world
vitamin A, 542Developing countries
birth defects, 907–909low birth weight, 907–909pregnancy, 905vitamin A, 587–588
Developmentchildren nutritional status, 756fpoverty, 690–692
DHA. See Docosahexaenoic acid (DHA)Diabetes. See also Type 2 diabetes mellitus
annual burden, 6coronary heart disease, 388fish oil, 237–238gestational, 346incidence, 5
Diarrhea, 840, 843vitamin A
clinical trials, 585tDiet. See also Maternal diet
behaviorearly vs later childhood, 363
child healthy, 375tfat-controlled
safety early childhood, 365–367Lyon Diet Heart Study, 225Mediterranean, 225metabolic effects, 305–309obesity, 303osteoarthritis, 406–407preschool children, 373–374quality, 357tsalmon oil, 228Western
Asia, 791–802Diet and Health Report
National Research Council, 357Diet and Reinfarction Trial, 225Dietary Approaches to Stop Hypertension,
913Dietary energy
Norway, 746tDietary fat, 361, 362, 714–716
body fat, 717–718breast cancer, 716–717cancer, 716–717childhood obesity, 363–364
Dietary fiber, 372Dietary folate
cardiovascular disease, 207–210

938 Index
Dietary guidelinespreliminary, 17tpreschool children, 359t, 360–367
Dietary Guidelines for Americans, 17Dietary habits
healthyNorway, 738–740
Dietary intakeearly childhood, 355–360
Dietary interviews, 895Dietary iron
CHD, 182–183Dietary polyunsaturated fatty acids, 665–682Dietary Reference Intakes (DRI), 9Dietary studies
esophageal squamous cell carcinoma, 28–30Dietary Supplement Health and Education Act
(DSHEA), 89, 880Dietary Supplement Quality Initiative (DSQI)
websites, 929Dietary supplements
cancer risk, 89–116, 112–113published studies, 92–95
defined, 90future research, 113–114hypothesized mechanisms of effect, 90–92measurement error in use, 111–112nutrient intake, 94frecommendations, 114–115time-integrated measures, 112use, 92
Diet intake national surveyspreschool children, 358–360
Digestionmedications, 841
Diindoylmethane (DIM), 65Discovery Health Survey, 13Docosahexaenoic acid (DHA), 221, 672
aortic plaques, 226seafood, 240t
Dominican Republicobesity, 780
Down syndrome, 618DRI, 9Drugs. See MedicationsDry mouth, 840DSHEA, 89, 880DSQI
websites, 929Dutch famine, 302Dutch Famine Studies, 349Dyslipidemia, 390–391
E
Early childhooddietary intake, 355–360fat-controlled diet
safety, 365–367obesity prevention, 350–355
primordial prevention, 351obesity trends, 345–355
Early diet behaviorlater childhood diet behavior, 363
Early Head Start, 369Eat Redistribution Syndrome, 842Economic burden, 350Economics, 7–10Ecuador
energy, 775food habits, 774
EFA. See Essential fatty acids (EFA)Eggs, 10Eicosanoids, 667–669Eicosapentaenoic (EPA) acid, 221, 672
aortic plaques, 226seafood, 240t
Elderly. See AgedEl Nino-induced drought, 694Endometrial cancer
soy, 139Energy
Latin America, 776fEnergy expenditure, 299fEnergy intake, 299f
energy expenditure, 354–355obesity, 303–315
EPA. See Eicosapentaenoic (EPA) acidEquol, 64Esophageal adenocarcinoma, 31–34
alcohol, 32–33diet, 33Helicobacter pylori, 33–34obesity, 33tobacco, 32–33
Esophageal cancerprevention, 26–34
recommendations, 44–46Esophageal squamous cell carcinoma, 26–31
alcohol, 26–27, 27tdietary studies, 28–30nutrition, 28–31thermal irritation, 27–28tobacco, 26–27, 27t
Essential fatty acids (EFA), 360, 523–524, 668fstable isotope precursors, 669

Index 939
Essential polyunsaturated fatty acidssources, 671–673
Established Populations for EpidemiologicStudies of the Elderly, 251
Estrogenmagnesium, 855
Ethnic diversity, 6–7, 7tEthnicity
obesity on IR, 296European Community Multicenter Study of
Antioxidants, Myocardial Infarction, andCancer study, 288
Excessive weightprevalence, 347fWIC, 368–369
ExerciseLatin America, 787–788
Expected nutrition competenciesmedical graduates, 892t–893t
Experimental atherosclerosisfish oil, 226
Extractioncataract
vitamin E, 484–485
F
FA. See Fatty acids (FA)Familial studies
homocysteine regulation abnormalities,194
Families with young childrenobesity prevention, 373–374
FAOwebsites, 927
FASEBwebsites, 928
Fast foodsChile, 782
Fasting chylomicronemia, 228, 231Fat, 12. See also Dietary fat; Saturated fat
body vs dietary, 717–718breast cancer, 902cardiovascular disease, 902controlled diet
safety early childhood, 365–367guidelines
USDA Preschool Food Guide Pyramid,362–363
Japan, 799fLatin America, 777fmaldigested, 841type 2 diabetes, 902
Fatty acids (FA), 8, 306–307. See also n-3 fattyacids; Trans-fatty acids; Trans-monounsaturated fatty acids
blood levels, 525dietary polyunsaturated, 665–682essential polyunsaturated
sources, 671–673omega-3, 715red blood cell, 525
FDA. See Food and Drug Administration (FDA)FDAMA. See Food and Drug Administration
Modernization Act of 1997 (FDAMA)Federal preschool nutrition programs, 367–368Federal Trade Commission (FTC), 872Federation of American Societies for Experimen-
tal Biology (FASEB)websites, 928
Ferritin, 174. See also Serum ferritinpreterm delivery, 635
Fetal alcohol syndrome, 820Fetal development
PUFA, 673–675Fetal growth retardation, 666FEV1, 507FFA, 294Fiber, 444–445
dietary, 372recommended intake, 372fsources
FDA approval, 873Finnish Kuopio Ischemic Heart Disease Risk
Factor Study, 176, 177, 183Finnish Mobile Clinic Study, 251, 253First National Health and Nutrition Examination
Survey Epidemiologic Followup Study,252
FishJapan, 801tventricular fibrillation, 223
Fish oilapoB, 235–236carbohydrate-induced hypertriglyceridemia,
232–235diabetes, 237–238diet, 228experimental atherosclerosis, 226hypertension, 238hypertriglyceride, 230–231hypolipidemic effects
mechanism, 231LDL, 235–236lipoproteins, 236–237

940 Index
plasma lipids, 236–237preterm delivery
studies, 648tVLDL, 235–236
Flavanones, 59t. See also specific typegrapefruit, 63
Flavones, 59–60, 59t. See also specific typeFlavonoids, 57, 57t, 58–65, 59t. See also specific
compoundFlavonols, 59t, 60–63. See also specific type
green tea, 61–63Flaxseed, 57–58FMI survey, 13FNS
websites, 929Folate
cancer, 91cardiovascular disease, 205–207, 207–
210deficiency
sulfasalazine, 848dietary
cardiovascular disease, 207–210homocysteine, 197–202, 201–202plasma homocysteine, 197–201pregnancy, 652–653preterm delivery
studies, 642t–645trich diets
birth defects, 619–620serum
anticonvulsants, 840Folic acid, 905, 913
bioavailability, 91cardiovascular disease, 191–213claim
FDA approval, 874homocysteine, 198t–200tmultivitamins, 603–623, 611t–612t
birth defects, 603–623NTD, 212, 871osteoarthritis, 415recommendations, 212–213
Foodadvertising, 10consumption, 11t
Brazil, 775fNorway, 746t
distributionChile, 760t, 761f
fortificationbirth defects, 622–623vitamin A deficiency, 588–589
habitsLatin America, 774–775
intakemedications, 837–841, 838t–839t
labeling regulations, 8tFDA, 7
marketplacelaws, 871–873
nonnutritive components, 55–75portion sizes, 328fproducttrends, 12tproduction
Norway, 740–741specified health uses, 883tsupply servings
vs food guide pyramid, 11tFood, Drug, and Cosmetic Act of 1938, 879–880Food and Agriculture Organization (FAO)
websites, 927Food and Drug Administration (FDA), 871–873
approvalscalcium claim, 874fiber sources, 873folic acid claim, 874health claims, 875t, 879toat claim, 873psyllium claim, 873sugar alcohol claim, 874
consumer health information, 878–879food-labeling regulations, 7health claims, 875t, 879t
approval process, 876–878US Court of Appeals, 876–878
Food and Drug Administration ModernizationAct of 1997 (FDAMA), 875–876
Food and Nutrition Service (FNS)websites, 929
Food Fight, 336Food for Specified Health Uses (FOSHU), 882Food Guide Pyramid, 12, 17
vs food supply servings, 11tUSDA, 356
Food Marketing Institute (FMI) survey, 13Food Policy, 336Food Stamp Program, 9Forced expiratory flow in 1 s (FEV1), 507Formula
LCPUFA, 673tFortovase
garlic interaction, 69Foscarnet, 856FOSHU, 882

Index 941
Fracture Intervention Trial Study, 426Fracture risk reduction
bone turnover, 429calcium, 429clinical trials, 429
Fracturescalcium, 915
Framingham Children’ s Study, 363Framingham Heart Study, 392Free fatty acids (FFA), 294Free radicals, 246–248, 523French paradox, 823Fruit, 11, 718–719
antioxidant properties, 56cancer, 56cardiovascular disease, 248–249esophageal squamous cell carcinoma, 29potential anticarcinogenic compounds, 57tstomach cancer, 38
FTC, 872Functional foods, 56
G
�-carotenetomatoes, 167
�-tocopherol, 93Garlic, 69
ROS, 70saquinavir interaction, 69sulfur compounds, 70t
Gastric cancer. See Stomach cancerGemfibrozil, 227Genetically programmed bone mass
acquisition, 438–440Genetics, 350
childhood obesity, 326–327obesity, 299–300
Genistein, 64–65, 123–124, 144estrogen-dependent breast tumors, 130–131
Gestational diabetes, 346Gestational weight gain
maternal diet, 632–633maternal weight, 630–632
Ginsengesophageal squamous cell carcinoma, 30
GIO, 455GISSI, 265, 269Glucocorticoid-induced osteoporosis (GIO), 455Glucocorticoids
obesity, 301Glucosamine
osteoarthritis, 416–418Glucose intolerance, 324–325
Glutathione (GSH)lens, 466–467
Glycemic controlweight loss, 388
Glycemic index, 305–306GNP
Latin America, 773vs life expectancy, 757f
Grain, 11Grapefruit
flavanones, 63Greenland
cardiovascular disease, 800Green tea (Camellia sinensis)
esophageal squamous cell carcinoma, 29aflavonols, 61–63
Gross national product (GNP)Latin America, 773vs life expectancy, 757f
Growthvitamin A deficiency, 578
Growth chartheight and weight
obesity, 298Gruppo Italiano per lo Studio della
Sopravvivenza nell’Infarto Miocardico(GISSI), 265, 269
GSHlens, 466–467
Gustatory hallucination, 840
H
Haitiobesity, 780
HATS, 266–267, 269HDL. See High-density lipoprotein (HDL)HDL Atherosclerosis Treatment Study (HATS),
266–267, 269Head Start Act, 369Health claims
Canada, 884FDA, 879tFDA approval, 875tJapan, 882regulations, 873–875
Health professionalsnutrition expertise, 889–890
Health Professionals Study, 183, 251, 253Healthy dietary habits
Norway, 738–740Healthy Eating Index (HEI), 356t, 357t
preschool children, 355–357Healthy People, 870

942 Index
Healthy People 2010, 871Healthy Start, 364, 365, 371Heart attacks
alcohol, 822–823Heart disease
iron, 173–186Heart-healthy preschool meals, 364–365
recommendations, 374tHeart Outcomes Prevention Evaluation (HOPE),
265Heart Protection Study, 266HEI, 356t, 357t
preschool children, 355–357Height and weight growth chart
obesity, 298Helen Keller International Nutritional Surveil-
lance, 695Helicobacter pylori
esophageal adenocarcinoma, 33–34stomach cancer, 35–36treatment guidelines, 45–46
Hematopoiesisvitamin A deficiency, 579
Hemostasistrans-fatty acids, 286
Hepatic cancersoy, 144
Heredityobesity on IR, 296
HGP, 15–16High blood pressure
stroke, 916High carbohydrates
triglycerides, 233f, 234fHigh-density lipoprotein (HDL)
atherosclerosis treatment study, 266–267, 269cholesterol, 8, 294
age-adjusted prevalence, 392ftrans-monounsaturated fatty acids, 284–
286Hip fractures, 454–456
smoking, 916Histamine H2 receptor antagonists
inducing Barrett’s esophagus, 32HIV. See Human immunodeficiency virus (HIV)Homeless children
Chile, 767Homestead food production
vitamin A deficiency, 589Homocysteine
cardiovascular disease, 191–213cerebrovascular disease, 205CHD, 202–205
causal relationship, 210–212metaanalyses, 203t
cobalamin, 202folate, 197–202, 201–202folic acid, 198t–200tmetabolism, 192–194, 193fperipheral vascular disease, 205pregnancy, 653–654pyridoxine, 202recommendations, 212–213regulation abnormalities, 194–195stroke, 205
meta-analyses, 206ttotal population concentration, 195
Homocystinuria, 194Honolulu Heart Program, 392HOPE, 265Hot liquids
esophageal squamous cell carcinoma, 27–28HPS, 607, 608tHumana Press
websites, 930Human capital, 692–693Human Development Index, 691–692Human Genome Project (HGP), 15–16Human growth and development
PUFA, 673–675Human immunodeficiency virus (HIV), 842
annual burden, 6pregnancy, 908vitamin A
clinical trials, 585tHungarian Case Control Surveillance of Congeni-
tal Abnormalities, 612, 618Hungarian Periconception Service (HPS), 607,
608tHungarian Randomized Controlled Trial, 608–613Hydrogen peroxide, 407–409Hygienic physiology, 816Hypercholesterolemia
Japan, 794Hyperglycemia, 842Hyperhomocysteinemia, 194, 616Hyperinsulinemia, 324–325Hyperlipidemia
obesity, 913Hyperlipidemic patients
n-3 fatty acids, 227–230Hypertension, 15, 389–390
age-adjusted incidence, 390falcohol, 822–823fish oil, 238Japan, 794

Index 943
obesity, 913stroke, 916
Hypertriglyceridefish oil, 230–231
Hypertriglyceridemiacarbohydrate-induced
fish oil, 232–235Hypocalcemia, 856Hypogeusia, 840Hypoglycemia, 842Hypokalemia, 856Hypomagnesemia, 856
I
I3C, 65–67ICZ, 65IDA. See Iron deficiency anemia (IDA)IFIS
websites, 928IFST
websites, 927IFT
websites, 928IGT, 324, 387Immunity
aging, 552–556, 553tmicronutrients
cross-sectional studies, 557–558research required, 566–568
nutritionfactors influencing, 564–566
older population, 551–568vitamin A deficiency, 576–578
IMPACT, 428Impaired glucose tolerance (IGT), 324, 387Imprinting hypothesis
obesity, 303Improving Measures of Persistence on Actonal
Treatment (IMPACT), 428Indole, 57t, 65–67Indole [3,2-b] carbazole (ICZ), 65Indole-3-carbinol (I3C), 65–67Indonesia, 705–706
economic indicators, 706tIndonesian crisis, 693–695Infants
adiposity, 351–352alcohol, 820feeding and activity patterns, 352marasmic
Chile, 764tmortality
Chile, 754f, 754t
Latin America, 772fobesity, 351–352PUFA, 676–681vitamin A
clinical studies, 573–590weight gain, 351–352
Infectionnutritional supplements, 524vitamin A
clinical trials, 584–587, 585tInfectious disease
aging, 555vitamin A deficiency, 576, 577t
Inflammationotitis media, 524sinusitis, 524
Institute of Food Science & Technology (IFST)websites, 927
Institute of Food Technologists (IFT)websites, 928
Insulinadolescence, 304f
Insulin resistance (IR), 798, 912in childhood and adolescence
obesity, 293–312metabolic alterations, 388syndrome, 294–296
Interhealth Chile, 785Interleukins
aging, 556International Food Information Service (IFIS)
websites, 928Intervention trials
population selection, 148–149Invirase
garlic interaction, 69Iodine, 412–414Iowa Women’s Health Study, 250, 252IR. See Insulin resistance (IR)Iron
blood donor studies, 183–184cancer, 91–92CHD
epidemiological data, 176–184dietary
CHD, 182–183esophageal squamous cell carcinoma, 30heart disease, 173–186oxidized LDL cholesterol, 183–184pregnancy, 634–651preterm delivery
studies, 636t–639tserum measures of body stores, 174–176

944 Index
Iron deficiency anemia (IDA), 692–693, 703–704lower current productivity, 693
Iron deficient childrenlower future productivity, 692–693
Iron overloadCHD, 184–185
IR syndrome, 294–296Isoflavones, 59t. See also specific type
soybeans, 63–65Isoniazid, 850Isothiocyanates, 57t, 68–69
J
Japan, 348, 349cholesterol, 795, 796fchronic disease, 792fat, 799ffish, 801thealth claims, 882hypercholesterolemia, 794hypertension, 794mortality
chronic disease, 793fnutritional recommendations, 801–802, 802tnutritional states, 798PUFA, 798type 2 diabetes, 793f
Journalsnutritional science
websites, 930
K
Kaempferol, 57, 60–61Kashin-Beck disease, 412–414Kava, 837KIHD, 176, 177, 183Korea
cholesterol, 796chronic disease, 792nutritional recommendations, 802, 802tnutritional state, 799, 800t
Kuopio Ischemic Heart Disease Risk FactorStudy (KIHD), 176, 177, 183
L
Latin America, 771–778. See also specific coun-tries
carbohydrates, 776energy, 775, 776fexercise, 787–788fats, 775–776, 777ffood habits, 774–775GNP, 773
infant mortality, 772fmorbidity and mortality, 772nutrition education, 786–787obesity, 778–783, 779t, 781tolder population, 773fproteins, 776–778socioeconomic changes, 773–774urbanization, 772
Lawsfood marketplace, 871–873
Laxative abuse syndrome, 856LCAT, 285LCME
AMA, 891LCPUFA. See Long-chain polyunsaturated fatty
acids (LCPUFA)LDL. See Low density lipoprotein (LDL)Learning
case-based, 894Learning mode
adaptive, 897Lecithin cholesterol acyltransferase (LCAT), 285Leeks, 69Lens, 465f
antioxidants, 464–467oxidants, 466fproteins, 466fproteolytic enzymes, 467–468
Leptinobesity, 300–301
Leukocytessmokers, 507
Liaison Committee on Medical Education(LCME)
AMA, 891Life cycle
preventive nutrition, 901–918Life expectancy, 6
GNP, 757fLifestyle Project
Caribbean countries, 785Light exposure
cataracts, 464Lignans, 57tLimonene, 73–74Linolenic acid, 221, 671
chemical structure, 280fconversions, 280fnuts, 241toils, 241tvegetables, 241t
Linseed (flaxseed), 57–58Linxian Study, 262, 263, 269, 475

Index 945
Lipid(s), 325Lipid hydroperoxide, 247Lipid peroxidation, 246Lipid Research Clinics Coronary Primary Preven-
tion Trial, 256Lipid soluble vitamins
absorptionmedications, 846–847
distributionmedications, 847
metabolismmedications, 850
Lipodystrophy, 842Lipoproteins, 325
fish oil, 236–237n-3 fatty acids, 226–227
Long-chain polyunsaturated fatty acids(LCPUFA), 667–669, 668f, 672
formula with, 673tLost generation, 692–693Louisiana
Bogalusa Heart Study, 347Low birth weight, 905–906
annual burden, 6developing countries, 907–909incidence, 5
Low-density lipoprotein (LDL)cholesterol, 8, 247, 349
fish oil, 235–236iron, 174oxidized iron, 183–184trans-monounsaturated fatty acids, 284–286
Lung cancersoy, 139–140, 139–144
Lung diseasealcoholic
annual burden, 6Lutein
cataract, 487f, 488Lycopene, 467
bioavailability, 158–159cell culture models, 162–163prostate cancer
animal studies, 163–164epidemiological studies, 159–162, 160thuman studies, 164–165
protective health benefitsplausible mechanisms, 165–167
supplementation, 167Lyon Diet Heart Study, 225
M
Macromineral statusaltering drugs, 852t–854
Macronutrientsmedications, 841–843
Magnesiumestrogen, 855osteoporosis, 453thiazides, 854–855
Malariavitamin A
clinical trials, 586tMaldigested fat, 841Malnourished child
Chile, 755ttreatment, 763–765
MalnutritionChile, 753–759crisis-sensitive indicators, 699–705etiology, 695–698, 696f
Manganeseosteoporosis, 453–454
Marasmic infantsChile, 764t
Marine autotrophic bacteria, 671Marketplace foods, 327Massachusetts Health Care Panel Study, 253Matairesinol, 57Maternal diet
gestational weight gain, 632–633preterm delivery, 633–634
studies, 636t–650tMaternal nutrition
preterm delivery, 629–659Maternal serum �-fetoprotein (MS AFP), 616Maternal thinness
micronutrients, 689–708prevalence, 702fMaternal weightgestational weight gain, 630–632
Matsuyamachildren
obesity intervention, 798tMeal patterns
changing, 10–13Meal portion sizes
total energy intake, 328fMeal sources
changing, 13Measles
vitamin Aclinical trials, 585t
Meats, 11Medical graduates
expected nutrition competencies, 892t–893t

946 Index
Medical schoolsteaching preventive nutrition, 889–898
Medications, 833–858adverse effects, 835–836altered nutritional status, 836–837digestion, 841food intake, 837–841, 838t–839tmacronutrients, 841–843
absorption, 842excretion, 843metabolism, 842–843
minerals, 851–858, 852t–854tdistribution, 854–856excretion, 856–858
nutrient interactions, 834–835, 835ttrace minerals, 855t
excretion, 857–858use, 833–834vitamins, 843–851, 844t–845t
absorption, 845–847distribution, 847excretion, 850–851metabolism, 847–850
Mediterranean diet, 225Menhaden oil
aortic plaques, 226Menopause
calcium, 440–441Metabolic syndrome, 294–296, 325, 393–394Metered dose inhalers, 840Methylenetetrahydrofolate reductase (MTHFR),
194–195, 205–206Mexican Americans, 347Mexico
obesity, 781Mexico City
obesity, 779Microalgae, 671Micronutrient Initiative, 903Micronutrients. See also Antioxidant micronutri-
entsanti-inflammatory properties, 409bone, 409cancer, 91clinical trials, 558–560combinations
clinical trials, 560–564deficiencies, 702–703deficiency, 911delayed hypersensitivity skin test responses,
562tdisease prevention, 916–917food vs supplements, 92–93
immunity, 556–564cross-sectional studies, 557–558research required, 566–568
inadequaciesidentification questions, 896t
maternal thinness, 689–708multiple
deficiencies, 542–543multivitamins, 94older population, 551–568osteoarthritis, 407–409pregnancy, 651–654stomach cancer, 38–40
Milkvitamin A, 539vitamin D, 539
Minerals. See also specific typealtering drugs, 852t–854esophageal squamous cell carcinoma, 31medications, 851–858, 852t–854tpreterm delivery
studies, 648t–650tsupplements
pregnancy, 656–657use, 93t
Mírame, 785Mixed cataract, 476
�-carotene, 490multivitamins, 496riboflavin, 494vitamin C, 481–482vitamin E, 484
Moderate drinking, 824Monounsaturated fatty acids
trans, 280HDL, 284–286LDL, 284–286serum total, 284–286
MorbidityLatin America, 772obesity, 913
MortalityBMI, 386fLatin America, 772rate, 326vitamin A deficiency, 576
MS AFP, 616MTHFR, 194–195, 205–206Mucosal immunity
vitamin A deficiency, 576–577Multinational Monitoring Project of trends and
Determinants of Cardiovascular DiseaseStudy, 253

Index 947
Multiple micronutrientsdeficiencies, 542–543
Multivitamins, 99cancer risk, 100f–101fcataracts
observational studies, 494–497cortical cataract, 494–496folic acid, 603–623, 611t–612tmicronutrients, 94mixed cataract, 496nuclear cataract, 494posterior subcapsular cataract, 496pregnancy, 656–657preterm delivery
studies, 648t–650tzinc-containing
preterm births, 907Multivitamins and Probucol (MVP) Trial, 257Myocardial infarction, 247Myrosinase, 68
N
N-acetyltransferase, 71NAL
websites, 929Nambour Skin Cancer Prevention Trial (NSCPT),
264, 269Naringin, 63NAS NRC
dietary recommendations, 396Nasopharyngeal cancer
soy, 144National Academy of Science National Research
Council (NAS NRC)dietary recommendations, 396
National Agriculture Library (NAL)websites, 929
National Cancer Institute (NCI), 872nutritional guidelines, 45
websites, 45tNational Cholesterol Education Program (NCEP),
14, 360, 393–394National Council on Nutrition and Physical Ac-
tivityNorway, 744
National disease profile, 4–5National Food Control Authority
Norway, 744National Health and Nutrition Examination Sur-
vey, 15, 254National High Blood Pressure Education Pro-
gram, 14
National Institute Diabetes and Digestive andKidney Diseases’ (NIDDK), 322
National Institutes of Health (NIH), 360Osteoporosis and Related Bone Diseases-
National Resource Center (ORBD-NRC)
websites, 928National Longitudinal Alcohol Epidemiologic
Survey (NLAES), 812–813National Research Council (NRC), 871
Diet and Health Report, 357websites, 928
National School Lunch Program, 9National Task Force on Prevention and Treatment
of ObesityNIDDK, 322
Nausea, 840NCEP, 14, 360, 393–394NCI, 872
nutritional guidelines, 45websites, 45t
Neomycinmalabsorption, 842
Nepalpregnancy, 908
Neural membranepolyunsaturated fatty acids, 670–671
Neural tube defects (NTD)annual burden, 6folic acid, 212, 871historical perspective, 617–619Hungarian Randomized Controlled Trial, 608–
613, 609tincidence, 5reduction, 604–605, 606tstudies, 614–617two-cohort controlled study, 613–614
Neurosporenetomatoes, 167
Neutrophilsaging, 555
New Zealandtype 2 diabetes, 793
n-3 fatty acids, 221–240antiarrhythmic actions, 222–225
animal studies, 222–223clinical trials, 224–225population studies, 223–224
hyperlipidemic patients, 227–230lipoproteins, 226–227plasma lipids, 226–227pregnancy, 655–656seafood, 240t

948 Index
thrombosis, 225–226VLDL, 228
Nicotine replacement, 44NIDDK, 322NIDDM. See Noninsulin dependent diabetes
mellitus (NIDDM)Nifedipine
n-3 fatty acids, 223NIH, 360NIH ORBD-NRC
websites, 928NLAES, 812–813NLEA, 7, 872Nobiletin, 59, 59tNonalcoholic fatty liver disease, 326Noninsulin dependent diabetes mellitus (NIDDM),
294, 295, 296, 301, 302, 307–308Northwick Park Heart Study, 392Norway, 735–750
coronary heart disease, 749fcurrent nutrition and food policy, 742–743dietary energy, 746tfood consumption, 746tfood production, 740–741governmental implementation bodies, 744–
745governmental white papers, 737–741healthy dietary habits, 738–740National Council on Nutrition and Physical
Activity, 744National Food Control Authority, 744new government recommendations, 737Nutrition and Food Policy, 736–747
characteristics, 747–748resistance against, 741–742results, 745–747
NRC, 871Diet and Health Report, 357websites, 928
NSCPT, 264, 269NTD. See Neural tube defects (NTD)Nuclear cataract, 476
�-carotene, 490–492�-carotene, 490lutein and zeaxanthin, 488multivitamins, 494riboflavin, 492total carotenoids, 485vitamin C, 478–479vitamin E, 482–484, 483f
Nurses’ Health Study, 209, 224, 251, 252, 288Nutrient nutrient interactions
osteoporosis, 444
Nutrients. See also Antioxidant nutrientsintake
preschool children, 359tintake assessment, 895pregnancy, 911t
Nutritioneducation
Chile, 765Latin America, 786–787vitamin A deficiency, 588
expertisehealth professionals, 889–890
factors influencing, 4–16immunity
factors influencing, 564–566intervention
birth defects, 619–623status
purchasing power, 700fsupplements
blood level data, 527clinical research, 525–535contents, 528thistorical perspective, 535–540infection, 524safety, 534–535socioeconomic status, 535upper respiratory pediatric visits, 529–532upper respiratory tract illness, 521–544
teaching, 893–897Nutritional science journals
websites, 930Nutrition Analysis Tool
websites, 928Nutrition and Food Policy
Norway, 736–737Nutrition and Vision Project (NVP), 474Nutrition Improvement Law, 882Nutrition in Medicine
CD-ROM, 895fNutrition in Medicine Lite, 897Nutrition Labeling and Education Act (NLEA), 7,
872Nuts
�-linolenic acid, 241tNVP, 474
O
Oat claimFDA approval, 873
Obesity, 912. See also Childhood obesity;Pediatric obesity
adipocytokines, 300–301

Index 949
assessment, 296–398body weight regulation, 298–299cardiovascular risk, 391Chile, 780fchronic disease, 383–397diet, 303energy intake, 303–315esophageal adenocarcinoma, 33etiology, 298–303genetics, 299–300glucocorticoids, 301health risks
weight loss, 387–395height and weight growth chart, 298hyperlipidemia, 913hypertension, 913imprinting hypothesis, 303insulin, 294intervention therapy, 395–396and IR in childhood and adolescence, 293–312Latin America, 778–783, 779t, 781tmorbidity, 913odds ratio in young adulthood, 295foral glucose tolerance test, 297fosteoarthritis, 409–415preschool, 347prevention, 309–311, 322f
daycare, 370–372preschool, 370–372principles, 374–375
programming hypothesis, 303sociocultural environment, 308–309stroke, 391thrifty genotype, 301–303thrifty phenotype, 301–303treatment, 309–311trends, 384f, 385ftype 2 diabetes, 913
Oceansover fishing, 540–543pollutants, 540
Oils�-linolenic acid, 241t
Older population. See AgedOmega-3 fatty acids, 715. See also n-3 fatty
acidsOnions, 69, 72–73
sulfur compounds, 72tOral contraceptives
vitamins, 848–849ORBD-NRC
NIHwebsites, 928
Organizational nutritional guidelineswebsites, 45t
Organosulfur compounds, 57t, 69–73Orofacial clefts
Hungarian Randomized Controlled Trial,608–613
reduction, 604–605two-cohort controlled study, 613–614
Oropharyngeal candidiasis, 840Osteoarthritis, 405–418
chondroitin sulfate, 416–418cobalamin, 415diet, 406–407factors associated with, 407tfolic acid, 415glucosamine, 416–418micronutrients, 407–409nutritional factors
epidemiological studies of, 410tnutritional products
clinical trials, 413tobesity, 409–415risk factors, 406vitamin D, 414–415vitamin E
clinical trials, 412Osteomalacia, 850, 851Osteophytes, 406Osteoporosis, 433–455, 914–916. See also
Postmenopausal osteoporosiscalcium, 425–430, 435–438cost savings, 915magnesium, 453nutrient nutrient interactions, 444protein, 451–452trace minerals, 453–454vitamin K, 452–453
Osteoporosis and Related Bone Diseases-National Resource Center (ORBD-NRC)
National Institutes of Health (NIH)websites, 928
Otitis media, 522inflammation, 524pilot clinical research, 527–529
Otitis Media Pilot Study, 529fOvarian cancer
soy, 139Overweight. See also Obesity
CDC, 321prevention recommendations
AAP, 337tOxidant-mediated disorders
etiology, 508tpredictors, 513–514

950 Index
Oxidantsas carcinogens, 508cigarette smoking, 506harmful activities, 507–510immunosuppressive properties, 510lens, 466fproadhesive activity, 509–510proatherogenic properties, 509proteolytic activities, 509
Oxidation, 246–248trans-fatty acids, 284
Oxidized lipoproteins, 247
P
Painabdominal, 840
Pancreatitis, 841Paraguay
food habits, 774Parental treatment guidelines
pediatric obesity, 328tPassive over consumption, 363Pathological Determinants of Atherosclerosis in
Youth (PDAY), 362PCOS, 324PDAY, 362Pediatric Nutrition Surveillance System, 911–912Pediatric obesity
parental treatment guidelines, 328tprevention, 321–338
approaches, 332–336future, 335t–336t, 336–337inoculation vs environmental manipula-
tions, 333–334punitiveness, 334shotgun vs rifle approach, 332–333target, 332–333timing, 334–336
Pediatric overweight prevention recommenda-tions
AAP, 337tPediatric visits
upper respiratorynutritional supplements, 529–532, 533t
PEITC, 68PEM, 666
male infants, 667Penicillamine, 857, 858Penicillin, 856Periconceptional supplementation, 620–622Periconception care, 605–607Peripheral neuropathy
polyunsaturated fatty acids, 667
Peripheral vascular diseasehomocysteine, 205
Peroxidase, 408Peru
energy, 775food habits, 774obesity, 781
Phagocytescigarette smoke, 507degenerative disorders, 513–514
Phantoguesia, 840Phenethyl isothiocyanate (PEITC), 68Phenobarbital
vitamin D, 850Phenytoin
vitamin D, 850Phospholipids, 281Phosphorus
calcium, 446–447Physical activity, 307–308Physician’s awareness, 18–19Physicians’ Health Study, 161, 263, 269, 475,
559Phytoene
tomatoes, 167Phytoestrogens, 63–64Phytofluene
tomatoes, 167Pickled foods
stomach cancer, 37–38PIH, 631Plant lignans, 57Plasma cholesterol
type V patients, 230fPlasma homocysteine
folate, 197–201Plasma lipids
fish oil, 236–237n-3 fatty acids, 226–227
Plasma triglycerides, 232ftype V patients, 229f
Policy implications, 16–19clinical implications, 18
Polycystic ovary syndrome (PCOS), 324Polyphenols, 61, 62Polyunsaturated fatty acids (PUFA), 279–280,
667–673, 715dietary, 665–682essential
sources, 671–673fetal development, 673–675human growth and development, 673–675infants, 676–681

Index 951
Japan, 798long chain, 667–669, 668f, 672formula with, 673tneural membrane, 670–671peripheral neuropathy, 667preterm infants, 675–676skin, 667sources, 672ttrans, 280vision, 667
Populationaging, 7t
Portion sizesfood, 328f
Posterior subcapsular cataract, 476�-carotene, 492�-carotene, 490lutein and zeaxanthin, 488multivitamins, 496riboflavin, 494total carotenoids, 485vitamin C, 481vitamin E, 484
Postmenopausal osteoporosiscalcium, 426t, 428f, 915vitamin D, 426t
Postprandial lipemiareduction, 231
Potable water and sewage servicesChile, 768t
Potassiumurine calcium, 445f
Povertydevelopment, 690–692
Preeclampsia, 657–658, 909–910vitamin E, 910
Pregnancyalcohol, 820antioxidants, 657–658calcium, 654–655, 909developing countries, 905folate, 652–653homocysteine, 653–654iron, 634–651micronutrients, 651–654mineral supplements, 656–657multivitamins, 656–657Nepal, 908n-3 fatty acids, 655–656nutrient status, 911tnutritional optimization, 904–906planning, 605–607Tanzania, 908
vitamin A deficiency, 578–579zinc, 651–652
Pregnancy induced hypertension (PIH), 631Preliminary dietary guidelines, 17tPremature birth prevention, 905–906Prenatal multivitamin supplementation, 905Preschool children
diet, 373–374dietary guidelines, 359t, 360–367diet intake national surveys, 358–360HEI, 355–357nutrient intake, 359tobesity prevention, 370–372vitamin A, 573–590weight for length growth, 346f
Preschool Food Guide PyramidUSDA, 360
Preschool food programChile, 766
Preschool mealsheart healthy, 364–365
Preschool obesity, 347Preterm delivery
defined, 629–630ferritin, 635maternal diet, 633–634
studies, 636t–650tmaternal nutrition, 629–659
PUFA, 675–676risk factors, 630zinc-containing multivitamins, 907
Preventable conditionsannual burden, 6
Preventive nutrition, 3–19books, 923–926childhood, 911–912life cycle, 901–918potential benefits, 713–725
evidence, 714Primary education
Chile, 766Primary health care
Chile, 759–761Primary Prevention Project, 266Probucol trial, 257Processed meats, 721Professional awareness, 14–15Programming hypothesis
obesity, 303Proinflammatory effects
cigarette smoking, 506–507Prostate cancer
lycopene

952 Index
animal studies, 163–164epidemiological studies, 159–162, 160thuman studies, 164–165
soy, 65animal studies, 132–135, 133t–134tepidemiological studies, 131–132, 132t
tomatoes, 157–168animal studies, 163–164epidemiological studies, 159–162, 160thuman studies, 164–165
Protein, 720calcium, 445–446lens, 466fosteoporosis, 451–452
Protein caloriesBrazil, 774
Protein energy malnutrition (PEM), 666male infants, 667
Proteolytic enzymeslens, 467–468
Protozoa, 671Pseudogynecomastia, 325Psychological problems, 350Psyllium
claimFDA approval, 873
Public awareness, 13–14Public health interventions, 18t, 870–871
vitamin A, 583–588PUFA. See Polyunsaturated fatty acids (PUFA)Pulmonary dysfunction
smokers, 507fPurchasing power
nutritional status, 700fPyridoxine
clinical trials, 559homocysteine, 202
Q
Quantitative trait locus (QTL), 300Quercetin, 57, 60–61
R
Racial diversity, 6–7, 7tRDA, 9, 357REACT. See Roche European American Cataract
Trial (REACT)Reactive nitrogen species (RNS)
lycopenes, 166Reactive oxygen species (ROS), 407–409
garlic, 70lycopenes, 166
Recommended Dietary Allowances (RDA), 9, 357
Red blood cell fatty acids, 525, 526tRegulations
food marketplace, 871–873health claims, 873–875
Renal conservationcalcium, 445–446
Reproductionpregnancy, 578–579
Respiratory abnormalities, 325Respiratory disease
rickets, 537–538Respiratory infection
viralasthma, 535
vitamin Aclinical trials, 585t
Respiratory syncytial virus infectionvitamin A
clinical trials, 585tRespiratory tract illness
uppernutritional supplements, 521–544
Retinoid receptors, 575Retinol, 115, 573–590
absorption, 574anti-infective properties, 538–539blood levels, 525bone factors, 582–583breast milk, 581–582cancer, 91deficiency, 576–579, 704–705
antibody responses, 578cellular immunity, 577–578clinical features, 581tdiagnosis, 580–582epidemiology, 579–580eye signs and symptoms, 580food fortification, 588–589growth, 578hematopoiesis, 579homestead food production, 589immunity, 576–578infectious disease, 576, 577tmortality, 576mucosal immunity, 576–577nutrition education, 588pregnancy, 578–579prevention, 588–590reproduction, 578–579risk factors, 580serum retinol, 580–581vision, 579
developed world, 542

Index 953
developing countries, 587–588discover, 536infants, 573–590infection and mortality
clinical trials, 584–587, 585tmetabolism, 574–575milk, 539preschool children, 573–590public health intervention, 583–588storage and transport, 574supplements
modern clinical studies, 540–541Riboflavin, 492–494
cataract, 493fcortical cataract, 492–494excretion, 851mixed cataract, 494nuclear cataract, 492posterior subcapsular cataract, 494
Ricketsrespiratory disease, 537–538
RNSlycopenes, 166
Roche European American Cataract Trial(REACT), 467, 475, 497
ROS. See Reactive oxygen species (ROS)Rural health care
Chile, 765–766
S
S-adenosylmethionine, 418Salmon oil diet, 228Salt, 721, 800Salted foods
stomach cancer, 37–38Sanitation
Chile, 767Saquinavir
garlic interaction, 69Saturated fat, 360
USDA Preschool Food Guide Pyramid,362–363
Saturated fatty acids (SFA), 8School-based interventions, 330–331School food program
Chile, 766School Meals for Healthy Children, 9Scientific insights, 15–16SCPS, 263Seafood
n-3 fatty acids, 240tSecoisolariciresinol, 57Secondary hyperparathyroidism, 426–427
Secondary Prevention with Antioxidants ofCardiovascular Disease in Endstage RenalDisease (SPACE), 265, 269
SECURE, 268, 269, 270SELECT, 102–109, 114Selenium, 90, 114, 412–414
cancer, 91esophageal squamous cell carcinoma,
30plasma levels, 527trandomized controlled trial, 98
Selenium and Vitamin E Chemoprevention Trial(SELECT), 102–109, 114
Senescence, 441–444Serum cholesterol
age-adjusted prevalence, 391fSerum ferritin
CHDcase-control studies, 181–182cohort studies, 176–179, 177tcross-sectional studies, 181–182
Serum folateanticonvulsants, 840
Serum retinolvitamin A deficiency, 580–581
Serum transferrin saturation levelgeometric mean serum ferritin, 175t
SES, 327nutritional supplements, 535
Sexually transmitted disease (STD)annual burden, 6
SFA, 8Sinusitis, 522
adjunctive therapy, 532–534asthma, 535inflammation, 524
Skinpolyunsaturated fatty acids, 667
Skin Cancer Prevention Study (SCPS), 263Sleep, 325Sleep apnea, 350Smoked foods
stomach cancer, 37–38Smoking
antioxidant nutrients, 510–513�-carotene, 114cataracts, 464hip fractures, 916leukocytes, 507pulmonary dysfunction, 507f
Social stigma, 326Socioeconomic status (SES), 327
nutritional supplements, 535

954 Index
Sodiumcalcium, 445–446urine calcium, 445f
Soybladder cancer, 144breast cancer
animal studies, 126–130, 127t–129tepidemiological studies, 124–126, 125t–
126tcancer, 65cancer cell apoptosis, 145cancer prevention, 123–150
future research, 149–150colorectal cancer prevention
animal studies, 136–139, 138t–139tepidemiological studies, 135–136, 136t
dietary components, 148doses needed for laboratory and clinical stud-
ies, 148endometrial cancer, 139experimental models, 147–148hepatic cancer, 144hormonal modulation, 146–147identifying bioactive components, 147lung cancer, 139–144mechanism of action, 144–145nasopharyngeal cancer, 144ovarian cancer, 139prostate cancer prevention
animal studies, 132–135, 133t–134tepidemiological studies, 131–132, 132t
stomach cancer, 139thyroid cancer, 144tumor angiogenesis, 145–146
Soybeansisoflavones, 63–65unsaponifiables, 418
SPACE, 265, 269Special Turku Coronary Risk Factor Intervention
Project (STRIP), 366Spices
potential anticarcinogenic compounds, 57tStable isotope precursors
essential fatty acids (EFA), 669Starches, 719–720Statements of Nutritional Support, 881STD
annual burden, 6Stomach cancer
alcohol, 36–37diet
epidemiological studies, 39t–43tfruits, 38
Helicobacter pylori, 35–36histological types, 34micronutrients, 38–40pickled foods, 37–38prevention, 34–45
recommendations, 44–46risk factors, 35–36salted foods, 37–38smoked foods, 37–38soy, 139tobacco, 36–37vegetables, 38
Stool antigen test, 46Stress, 309STRIP, 366Stroke, 913
alcohol, 822–823annual burden, 6high blood pressure, 916homocysteine, 205
meta-analyses, 206tincidence, 5obesity, 391
Studies of Childhood Activity and Nutrition, 366Study to Evaluate Carotid Ultrasound Changes in
Patients Treated with Ramipril and Vita-min E (SECURE), 268, 269, 270
Sugar alcohol claimFDA approval, 874
Sugars, 12Sulfasalazine
folate deficiency, 848Sulforaphane, 68Sullivan, Jerome, 173–174Superoxide dismutase, 408Supplements. See Nutrition, supplements;
Vitamin(s), supplementsSurgeon General’s Report on Health Promotion
and Disease Prevention, 870Surgeon General’s report on Nutrition and
Health, 871Survey of Food Intake in Individuals
US Department of Agriculture (USDA), 356–357
T
Tangeretin, 59, 59tTanzania
pregnancy, 908Tardive dyskinesia, 842Taste, 840Teaching preventive nutrition
medical schools, 889–898
Index 955
TEE, 352Television viewing, 327Terpenes, 57t, 58, 73–74Thailand
chronic disease, 792macroeconomy, 694nutritional recommendations, 802, 802ttype 2 diabetes, 793
Thearubigens, 61Theogallin, 61Theophylline
inducing Barrett’s esophagus, 32Thermal irritation
esophageal squamous cell carcinoma, 27–28Thiazides
magnesium, 854–855Thrifty genotype
obesity, 301–303Thrifty phenotype
obesity, 301–303Thrombogenesis, 392–393Thrombosis
n-3 fatty acids, 225–226Thymus
aging, 552–553Thyroid cancer
soy, 144TIBC, 174, 178T lymphocytes
aging, 553–555Tobacco
esophageal adenocarcinoma, 32–33esophageal squamous cell carcinoma, 26–27,
27tstomach cancer, 36–37
Tocopherol, 93, 96, 260–261, 262–263, 269, 408,475
Cancer Prevention Study, 96Toddlers feeding and activity patterns, 352Tomatoes
composition, 158consumption, 158nutrient and carotenoid contents, 158tprostate cancer, 157–168
animal studies, 163–164epidemiological studies, 159–162, 160thuman studies, 164–165
protective health benefitsplausible mechanisms, 165–167
Total carotenoidscataract, 485–492, 486fcataract extraction, 485–486cortical cataract, 485
nuclear cataract, 485posterior subcapsular cataract, 485
Total energy expenditure (TEE), 352Total energy intake
meal portion sizes, 328fTotal iron binding capacity (TIBC), 174, 178Trace metals, 523
blood levels, 525Trace minerals
medications, 855tosteoporosis, 453–454
Trans-fatty acids, 279–288, 715absorption, 281cancer, 288on CHD risk factors, 286conversion, 282–284desaturation, 283fdigestion, 281epidemiological studies, 286–287food, 281hemostasis, 286LDL oxidation, 286mechanism, 285–286metabolism, 281–284, 282foxidation, 284production, 280tissue levels, 282
Transferrin saturation (TS), 174coronary heart disease (CHD)
cohort studies, 179–181, 180tTrans-monounsaturated fatty acids, 280
HDL, 284–286LDL, 284–286serum total, 284–286
Trans-polyunsaturated fatty acids, 280Triacylglycerols, 281Tricyclic antidepressants
riboflavin excretion, 851Triglycerides
high carbohydrates, 233f, 234fTS. See Transferrin saturation (TS)Tuberculosis
cod liver oil, 538Tumor angiogenesis
soy, 145–146Twin studies
homocysteine regulation abnormalities, 194Two-cohort controlled study
NTD and orofacial clefts, 613–614Type 2 diabetes mellitus, 324–325, 349, 792, 903,
912fat, 902Japan, 793f

956 Index
metabolic improvements, 389tNew Zealand, 793obesity, 913risk factors, 387–388Thailand, 793
U
Underweight childrenBangladesh, 698f
United Nations Children’s Fund (UNICEF), 903Upper respiratory pediatric visits
nutritional supplements, 529–532, 533tUpper respiratory tract illness
nutritional supplements, 521–544Urbanization
Latin America, 772Urea breath test, 46Urine calcium
potassium, 445fsodium, 445f
Uruguayfats, 775food habits, 774socioeconomic changes, 773
US Court of AppealsFDA health claims approval process, 876–878
US Department of Agriculture (USDA), 9Food Guide Pyramid, 356, 373–374, 724fPreschool Food Guide Pyramid, 360, 361f
fat guidelines, 362–363Survey of Food Intake in Individuals, 356–357websites, 927, 929
US Food and Drug Administration. See Food andDrug Administration (FDA)
US Food Drug and Cosmetic Act, 872US National Longitudinal Alcohol Epidemiologic
Survey, 812–813
V
Vaccine preventable deathsannual burden, 6
Vaccines, 522–523Vascular dementia, 913VECAT, 475Vegetable oils, 671Vegetables, 11, 718–719
�-linolenic acid, 241tantioxidant properties, 56cancer, 56cardiovascular disease, 248–249esophageal squamous cell carcinoma, 29potential anticarcinogenic compounds, 57tstomach cancer, 38
Ventricular fibrillationfish, 223
VERISwebsites, 928
Vertebral Efficacy with Risedronate Therapy(VERT), 426
Very low-density lipoprotein (VLDL), 281fish oil, 235–236
Vida Chile, 785Viral respiratory infections
asthma, 535Viruses, 522–523Visceral adiposity
diabetes risk, 387Vision
polyunsaturated fatty acids, 667vitamin A deficiency, 579
VITAL, 114Vitamin(s). See also Multivitamins; Water-
soluble vitaminscancer risk
studies, 95–111case-control studies, 95cohort studies, 95esophageal squamous cell carcinoma, 31medications, 843–851, 844t–845t
excretion, 850–851metabolism, 847–850
oral contraceptives, 848–849randomized controlled trial, 94–95study design, 94–95supplementary intake
RCT, 260tsupplements, 722–723. See also Antioxidant
vitamin supplementsuse, 93t
Vitamin A, 115, 573–590absorption, 574anti-infective properties, 538–539blood levels, 525bone factors, 582–583breast milk, 581–582cancer, 91deficiency, 576–579, 704–705
antibody responses, 578cellular immunity, 577–578clinical features, 581tdiagnosis, 580–582epidemiology, 579–580eye signs and symptoms, 580food fortification, 588–589growth, 578hematopoiesis, 579

Index 957
homestead food production, 589immunity, 576–578infectious disease, 576, 577tmortality, 576mucosal immunity, 576–577nutrition education, 588pregnancy, 578–579prevention, 588–590reproduction, 578–579risk factors, 580serum retinol, 580–581vision, 579
developed world, 542developing countries, 587–588discover, 536infants, 573–590infection and mortality
clinical trials, 584–587, 585tmetabolism, 574–575milk, 539preschool children, 573–590public health intervention, 583–588storage and transport, 574supplements
modern clinical studies, 540–541Vitamin B6, 913
clinical trials, 559Vitamin B12, 621, 913Vitamin C, 99–102, 115
antioxidant micronutrients, 410–412animal studies, 410epidemiological studies, 410–412
B-mode ultrasound studies, 258–259cancer risk, 103f–104fcardiovascular protection
randomized controlled trial, 262cataracts, 477–482, 481fcataracts extraction, 482cigarette smoking, 511circulating leukocytes, 514–515coronary heart disease, 248–249dietary and supplementary intake
epidemiological studies, 250t, 251–252mixed cataract, 481–482nuclear cataract, 478–479posterior subcapsular cataract, 481studies, 105f
Vitamin D, 115, 425, 448–451, 449fanticonvulsants, 850, 851cancer, 91chondrocyte metabolism, 408deficiency, 427discover, 536–537
milk, 539nonclassical functions, 541–542osteoarthritis, 414–415postmenopausal osteoporosis, 426t
Vitamin E, 102–109, 912–913cancer risk, 106f–107fcardiovascular protection
randomized controlled trial, 260–262, 261tcataract extraction, 484–485cataracts
observational studies, 482–484cigarette smoking, 511–512circulating leukocytes, 514–515clinical trials, 559collagen metabolism, 408cortical cataract, 484dietary and supplementary intake
epidemiological studies, 249–251, 250tmixed cataract, 484nuclear cataract, 482–484, 483fosteoarthritis
clinical trials, 412posterior subcapsular cataract, 484preeclampsia, 910
Vitamin E, Cataract and Age-related MacularDegeneration (VECAT), 475
Vitamin Kosteoporosis, 452–453
Vitamins and Lifestyle Study (VITAL), 114VLDL, 281
fish oil, 235–236
W
Water-soluble vitaminsabsorption
medications, 845–846distribution
medications, 847WAVE Trial, 267, 269Websites, 927–930
AgNIC, 930American Dietetic Association, 927–928Blonz Guide, 927calcium information, 929Cornell Institute of Food Science, 927FAO, 927FASEB, 928Humana Press, 930IFIS, 928IFST, 927IFT, 928NAL, 929NAT, 928

958 Index
NIH ORBD-NRC, 928nutritional science journals, 930organizational nutritional guidelines, 45tUSDA, 927, 929VERIS, 928
WHO, 930Weight
body, 721–722excessive
prevalence, 347fWIC, 368–369Weight for length growth
preschool boys, 346fWeight gain, 841
gestationalmaternal diet, 632–633maternal weight, 630–632
Weight loss, 841behavioral interventions, 331–332blood pressure, 390cancer, 395glycemic control, 388obesity-related health risks, 387–395risk factors improvement, 388–391
Western dietAsia, 791–802
WHI, 92–93, 93tWhite Conference on Nutrition, 9WHO, 253
websites, 930Whole milk, 10WIC. See Women, Infants, and Children (WIC)Wilson’s disease, 857
Women, Infants, and Children (WIC), 9, 367–368excessive weight, 368–369nutritional aspects, 368
Women’s Angiographic Vitamin and Estrogen(WAVE) Trial, 267, 269
Women’s Health Initiative (WHI), 92–93, 93tWomen’s Health Study, 264, 269World Food Conference, 740World Health Organization (WHO)
and Multinational Monitoring Project oftrends and Determinants of Cardiovas-cular Disease Study, 253
websites, 930
X
Xenobiotic metabolismlycopenes, 166–167
Xerophthalmia, 583Xerostomia, 840
Z
Zeaxanthin, 258–259cataract, 487f, 488
Zinc, 366, 858clinical trials, 560esophageal squamous cell carcinoma, 30multivitamins
preterm births, 907osteoporosis, 453–454plasma levels, 527tpregnancy, 651–652preterm delivery
studies, 640t–642t