Cancer-preventive effects - IARC Publications
248
Chapter 4 Cancer-preventive effects Human studies The groupings used to evaluate epi- demiological studies were: • Total fruit consumption • Total vegetable consumption • Total fruit and vegetable consump- tion Where possible, potatoes, pulses and mushrooms were excluded from the evaluations (see also Chapter 1). The Working Group was con- cerned that reporting of associations between specific cancers and specific individual foods or subgroups of fruit and vegetables might be subject to publication bias. Few of the studies identified had examined the effects of total intake of fruit and vegetables combined. Therefore the Working Group decided to evaluate the evi- dence in relation to total fruit and to total vegetables. This approach is con- servative in that an effect of any spe- cific fruit or vegetable, or subgroup of them, would be diluted, but would not be conservative if relationships between cancer and fruits and vegeta- bles were due to composite effects of multiple bioactive components. General issues In assessing the evidence on the rela- tion between cancer and intake of fruit and vegetables, sources of hetero- geneity between studies include: • differences in study design, with different potential opportunities for bias and confounding to influence results; • differences in reference period; • differences in definition of expo- sure (see Chapter 1); • differences in dietary assessment instrument and its method of administration (see Chapter 2); • differences in the extent and con- trol of measurement error; • differences in the extent to which potentially confounding factors were investigated, and in the ade- quacy of adjustment for these; • effect modification; • differences in methods of statistical analysis; • chance (and multiple testing); • differences in study context. In appraising individual studies, it is important to consider their design, as this affects the biases that may occur and their generalizability. Problems associated with specific designs are addressed in the next section. Problems that affect more than one type of design are discussed in subse- quent sections. Study design Randomized controlled trials The definitive method of investigating the efficacy of a potentially preventive intervention is the randomized con- trolled trial. The particular strength of this design is that, provided the trial is sufficiently large, the distribution of potential confounders, known (mea- sured) and unknown (unmeasured), will differ between the group assigned to receive the intervention and the con- trol group no more than would be expected by chance. In addition, the exposure potentially can be precisely defined, although in the context of fruit and vegetables this would probably apply to the advice (and any measures taken to support this) rather than intake. Blinding (masking) can exclude the possibility that knowledge of the exposure status of the subjects could bias the assessment of outcome. However, subjects cannot be blinded to their intake of foods. For various reasons, such as non-compliance, it is possible that subjects may not receive the exposure to which they have been assigned. The reasons for this may be associated with the outcome of inter- est. For example, in a randomized trial of the cancer-preventive effect of advice to increase fruit and vegetable intake, there could be a high propor- tion of non- or poor compliers in the intervention group. In one randomized controlled trial of individualized advice to increase vegetable and fruit intake, drop-outs were more likely to be smok- ers and of lower socioeconomic status than those who did not drop out (Smith-Warner et al., 2000). As smok- ing and socioeconomic status are related to cancer outcome, so also is drop-out. It is therefore crucially impor- tant that the data are analysed accord- ing to the principle of 'intention-to- treat', otherwise the effect of random- ization in minimizing potential con- founding is lost (Peto et al., 1976; Fergusson et al., 2002). In trials of interventions designed to assess the effects of increasing 53
-
Upload
khangminh22 -
Category
Documents
-
view
0 -
download
0
Transcript of Cancer-preventive effects - IARC Publications
Chapter 4
Cancer-preventive effects
Human studies
The groupings used to evaluate epi-demiological studies were: • Total fruit consumption • Total vegetable consumption • Total fruit and vegetable consump-
tion
Where possible, potatoes, pulses and mushrooms were excluded from the evaluations (see also Chapter 1).
The Working Group was con-cerned that reporting of associations between specific cancers and specific individual foods or subgroups of fruit and vegetables might be subject to publication bias. Few of the studies identified had examined the effects of total intake of fruit and vegetables combined. Therefore the Working Group decided to evaluate the evi-dence in relation to total fruit and to total vegetables. This approach is con-servative in that an effect of any spe-cific fruit or vegetable, or subgroup of them, would be diluted, but would not be conservative if relationships between cancer and fruits and vegeta-bles were due to composite effects of multiple bioactive components.
General issues In assessing the evidence on the rela-tion between cancer and intake of fruit and vegetables, sources of hetero-geneity between studies include:
• differences in study design, with different potential opportunities for
bias and confounding to influence results;
• differences in reference period; • differences in definition of expo-
sure (see Chapter 1); • differences in dietary assessment
instrument and its method of administration (see Chapter 2);
• differences in the extent and con-trol of measurement error;
• differences in the extent to which potentially confounding factors were investigated, and in the ade-quacy of adjustment for these;
• effect modification; • differences in methods of statistical
analysis; • chance (and multiple testing); • differences in study context. In appraising individual studies, it is important to consider their design, as this affects the biases that may occur and their generalizability. Problems associated with specific designs are addressed in the next section. Problems that affect more than one type of design are discussed in subse-quent sections.
Study design Randomized controlled trials The definitive method of investigating the efficacy of a potentially preventive intervention is the randomized con-trolled trial. The particular strength of this design is that, provided the trial is sufficiently large, the distribution of potential confounders, known (mea-sured) and unknown (unmeasured), will differ between the group assigned to receive the intervention and the con-
trol group no more than would be expected by chance. In addition, the exposure potentially can be precisely defined, although in the context of fruit and vegetables this would probably apply to the advice (and any measures taken to support this) rather than intake. Blinding (masking) can exclude the possibility that knowledge of the exposure status of the subjects could bias the assessment of outcome. However, subjects cannot be blinded to their intake of foods. For various reasons, such as non-compliance, it is possible that subjects may not receive the exposure to which they have been assigned. The reasons for this may be associated with the outcome of inter-est. For example, in a randomized trial of the cancer-preventive effect of advice to increase fruit and vegetable intake, there could be a high propor-tion of non- or poor compliers in the intervention group. In one randomized controlled trial of individualized advice to increase vegetable and fruit intake, drop-outs were more likely to be smok-ers and of lower socioeconomic status than those who did not drop out (Smith-Warner et al., 2000). As smok-ing and socioeconomic status are related to cancer outcome, so also is drop-out. It is therefore crucially impor-tant that the data are analysed accord-ing to the principle of 'intention-to-treat', otherwise the effect of random-ization in minimizing potential con-founding is lost (Peto et al., 1976; Fergusson et al., 2002).
In trials of interventions designed to assess the effects of increasing
53

IARC Handbooks of Cancer Prevention Volume 8: Fruit and Vegetables
intakes of fruit and vegetables, randomization should result in similar baseline intakes of fruit and vegetables between the arms of the trial. In theory, the intervention group will augment its intake of fruit and vegetables above the baseline level by a certain amount. However, especially if the intervention is intended to result in increased intake over a prolonged period, measurement of adherence to the intervention is a crucial issue. In addition, changes in intake of fruit and vegetables may bring about other changes such as reduction in meat intake or weight gain, which may have their own effects on cancer incidence, and so compli-cate interpretation of the effect of the intervention.
In specifying criteria for assessing evidence on which health policies and guidelines are based, several national organizations accord the highest level of evidence to randomized controlled trials (NHMRC, 1999; Briss et al., 2000; SIGN, 2001). Comparisons between such trials and observational evidence have been made for certain topics, but not for consumption of fruit and vegetables (loannidis et ai., 2001), because few randomized controlled trials of the effects of fruit and vegeta-bles have been conducted. Differences in the estimated magni-tude of effect between trials and obser-vational studies are very common and the directions of the differences are dif-ficult to predict (Britton et al., 1998; MacLehose et aL, 2000). There are many potential reasons for such differ-ences, including a short period of observation in the trials, trials conducted during an inappropriate period of the natural history of the dis-ease or using end-points with unknown predictive value (especially intermedi-ate end-points, see below), use of a different quantity of fruits and/or vegetables in the trial, or bias or mea-surement error in the observational studies.
The only randomized controlled trials of the effects of fruit and vegeta-bles in the area of cancer and precan-cerous lesions have examined the effects of a recommendation to con-sume a specified amount and/or dietary counselling. Such counselling tends not to be limited to fruit and vegetable intake (there may be, for example, advice to reduce fat intake) and may influence other health-related behaviour. Although trial results can be especially compelling and have wide-spread implications, caution is needed in generalizing from the results of trials on specially selected groups to the population as a whole.
Cohort studies In a cohort study, individuals who are disease-free are recruited to partici-pate in the study and are then followed over time to identify those who develop the disease. Information on, for example, socio-demographic factors, medical history and lifestyle factors such as diet is collected at the beginning of the study, before the onset of disease. The cohort design could be regarded as similar to the randomized controlled trial, except that the assignment of exposure is subject-selected rather than random-ized. Consequently, (a) it is necessary to measure potential confounders and adjust for them; (b) the distribution of unknown and unmeasured con-founders may differ between the groups being compared; (c) it may not be meaningful to analyse the study according to intention to treat, as any change in exposure (diet) may be highly context-dependent and unlikely to be reproducible in other populations and periods, (d) changes in exposure as a consequence of early symptoms of disease and biases in loss to follow-up that are directly or indirectly related to exposure are potential issues affecting interpretation; and (e) the subjects are not blinded to their expo-
sure status - this may compromise the extent to which assessment of out-come is independent of exposure sta-tus.
Large numbers of subjects have to be enrolled in a cohort study in order to have adequate statistical power to determine associations with specific types of cancer. Gains in efficiency, over numbers of subjects analysed or numbers of tests performed on collected specimens, are possible in cohort studies with nested case—control and case—cohort designs, but the requirement for a large cohort size overall is unchanged. Therefore, the methods used for assessment of dietary intake and potentially confounding factors need to be suitable for application to large num-bers of subjects. This has implications for the extent of potential measure-ment error (see Chapter 2). A potential advantage of the cohort design com-pared with the case—control design is that concurrent measurement of cur-rent diet is likely to be better corre-lated with the true current diet than is retrospective measurement of past diet with the true past diet. Another advantage is that repeated measure-ments can be obtained, if resources are available. Repeated measurement allows changes in diet and other rele-vant exposures to be monitored, and also permits development of a sum-mary measure of exposure less sub-ject to random misclassification than a single measure. This gives the investi-gator a choice of measure of 'diet', including diet at the beginning of the study, more recent intake or a summary measure of repeated expo-sures.
A strategy for dealing with the possibility that pre-diagnostic changes in diet may bias the observed associa-tion between diet and disease is to exclude cases diagnosed in the initial period of follow-up. Investigators often assess whether results are altered by
54

Cancer-preventive effects
the exclusion of cases identified in the initial period of follow-up, such as the first two years.
Participation bias in a cohort study affects the genoralizability of the results, but does not compromise their internal validity. However, it has been suggested that the tendency for the most health-conscious to participate may reduce the variability of dietary intake, making it difficult to detect asso-ciations with disease risk (Steinmetz et aI., 1994). Over-representation of health-conscious active persons inter-ested in their diet has been noted in dietary surveys (Harris et al., 1989; vant Hof & Burema, 1996; Sidenvall et al., 2002). There is also a possibility that subjects in a cohort study who are knowledgeable concerning effects of diet on health may report their diet in a manner that represents what they believe they should eat, not what they actually eat. This could be a problem of some studies of health professionals.
Bias resulting from differential loss to follow-up by exposure could occur if, for example, both loss to follow-up and fruit or vegetable consumption vary by socioeconomic status. Limited data on loss to follow-up tend to be presented for cohort studies. In a case—control study of lung cancer nested within a cohort study in New York State, USA, although there were some differences in diet between those lost to follow-up (19 of 525 controls, 3.6%) and those whose outcome was known, the results of analyses relating to diet and alcohol were similar including and excluding losses to follow-up (Bandera et al., 2002). In a longitudinal study of cognitive ageing, those who did not return for follow-up had lower educa-tional levels than those who did return (Van Beijsterveldt et al,, 2002). In stud-ies in the USA, members of minority groups have tended to have higher drop-out rates than whites (Vernon et al., 1984; Bowen et al., 2000). In a study of black women in the USA,
those who were lost to follow-up tended to be less well educated than those who remained in the study (Russell et al., 2001). A related issue concerns the return of incomplete information during follow-up, i.e., item non-response. This has been shown to be associated with subsequent loss to follow-up (IJeeg et ai., 2002).
In cohort studies, disease rates during follow-up are typically analysed with respect to the values of factors measured at enrolment. Enrolment diet may accurately reflect typical life-time intake. However, because of the combined effects of measurement errors and changes in the exposure of participating subjects over time, this approach may underestimate the strength of association between habit-ual level of exposure during the period of follow-up and disease risk. Repeated measurements of baseline exposure in a representative sample of participants in a cohort study can be used to estimate the magnitude of measurement error and correct for it. Repeated measurements taken later in the exposure period can be used to correct for changes in exposure. Using a food frequency questionnaire (FF0), Goldbohm et al. (1995) observed a high degree of consistency of within-subject dietary patterns relating to fruit and vegetable consumption between five successive annual assessments.
Limited participation at enrolment affects the generalizability of the findings from the study cohort. It does not affect the validity of the study findings.
Case—control studies In a case—control study, individuals who have recently developed a dis-ease and a sample of individuals with-out the disease being investigated are recruited and information is then col-lected on potential risk factors during a specified reference period before the onset of disease. One of the main
advantages of the case—control design compared with the cohort design is that the total number of subjects whose diet has to be assessed is much smaller. In theory, this gives more flexibility in the choice of meth-ods for determining diet and potentially confounding exposures than with cohort studies. Thus, for example, data can be collected by in-person interview using a detailed quantitative dietary instrument rather than by self-com-pleted questionnaire.
As in cohort studies, the assign-ment of exposure is subject-selected rather than randomized, and this raises similar issues with regard to potential bias and confounding. The main potential biases of the case—con-trol design are (a) inappropriate choice of cases or controls, leading to selec-tion bias and (b) misreporting of past diet.
Selection bias In a number of studies of cancer in relation to fruit and vegetable intake, controls comprised subjects hospital-ized with other types of cancer or with a range of other disorders. Hospital-based studies may be attractive for investigations of diseases when it is difficult to characterize the underlying study base (Wacholder et al., 2002). Another possible attraction is that, pro-vided that the diseases of control sub-jects are of similar severity to that of the cases, recall bias may be mini-mized (see discussion of recall bias). However, if the conditions for which a subject is hospitalized are themselves related to fruit and vegetable con-sumption, the measure of association would be distorted (Wacholder et al., 1992).
Selection bias also may occur as a result of differential non-participation between cases and controls. There has been concern about a decline in participation rates (Olson, 2001), especially in population-based studies.
55
IARC Handbooks of Cancer Prevention Volume 8: Fruit and Vegetables
This could result in people selected as population controls being largely those most likely to be at homo when contacted. Therefore in studies using population controls, it is critical to ensure as high a response as possible from those eligible in the base popula-tion. Information on the potential effects of low participation rates is limited (Madigan et al., 2000).
Differential misclassification of diet - recall bias Retrospective measurement of diet is likely to be less well correlated with the true diet during the reference period than is the case for concurrent mea-surement of diet and the true current diet (see Chapter 2). If cases and con-trols differ in their accuracy of dietary recall, the comparison of the reported diet will be biased.
It has been suggested that the like-lihood of recall bias may be greater when recall is poor in general (Coughlin, 1990). However, this was not apparent in a systematic review of empirical studies of recall bias pub-lished between 1966 and 1990 (Chouinard & WaIter, 1995).
Dietary information obtained from cases and controls by questionnaire or interview was compared with informa-tion on the index subject obtained from the next of kin or spouse in two studies in the USA. In one, the responses of 67 men with cancer to a dietary inter-view were compared with those of their spouses to the same instrument regarding intake of the index subject; a similar comparison was made for 91 male neighbourhood controls and their spouses (Marshall et al., 1980). The study instrument included 27 items to assess vegetable consumption and 11 to assess fruit consumption. The pro-portion of case—spouse pairs reporting exact agreement regarding vegetable consumption was 59%, compared with 65% for control—spouse pairs, while for fruit consumption the proportions were
49% and 56% respectively. The pro-portion of case—spouse pairs reporting agreement of vegetable consumption within one category (out of 11 possible categories) was 88% compared with 94% for control—spouse pairs. The corresponding proportions for fruit were 76% and 88%. In the other US study (Herrmann, 1985), the response to a diet interview of 94 cases with colon cancer and their next of kin, and 93 controls selected using an area probability sampling scheme and their next of kin, were compared. The instru-ment had 31 items relating to con-sumption of vegetables and 12 relating to fruit. The agreement, over five cate-gories of frequency of consumption, was higher for case—next of kin than control—next of kin pairs both for vege-tables (agreement 70% for case—next of kin pairs and 66% for control—next of kin pairs; kappa 0.45 and 0.40 respec-tively) and fruit (agreement 66% for case—next of kin pairs and 63% for control-next of kin pairs; kappa 0.42 and 0.41 respectively). Although these studies indicate reasonable agreement between the reports of index subjects and proxy subjects, concern has per-sisted about the quality of data from proxy respondents (Nelson et al., 1990; Lyon et al., 1992).
In other studies, data from self-completed questionnaires or from interviews carried out as part of a sur-vey or enrolment into a cohort study were compared with data obtained from subjects after diagnosis of cancer and from control subjects identified at that time (Table 9). All but one of the studies relating to food groups used FFQs in both assessments. In most of these studies, the data were inter-preted as showing little evidence of recall bias (Friedenreich et al., 1991; Holmberg et aI., 1996; Lindsted & Kuzma, 1990). Hammar and Norell (1991) noted that there was good agreement between retrospective and original information among subjects
who reported that they had not changed their diet between 1967 and 1987. However, this was not the case for those who had changed their diet, and this was a particular issue for those who had changed their diet because of disease. [The ability of some of these studies to detect recall bias may have been limited because of misclassification likely to have resulted from the instruments used, the small size of some of the studies, and corre-lated errors between the dietary assessments.]
Two studies presented data only on nutrients. Wilkens et al. (1992), in a study in which both assessments of diet were made by interview, found that although there were no marked differences overall between cases and non-cases in the ability to recall past diet, this did not apply in certain sub-groups, such as subjects with the longest recall interval (8-10 years), and cases with colorectal cancer or any cases diagnosed with distant stage disease, compared with non-cases. Giovannucci et al. (1993) reported finding no association between breast cancer and intake of total or saturated fat when prospec-tively collected data were analysed, but a positive association when retro-spectively collected data were analysed. However, the prospective analysis related to 392 cases and 786 controls, while the retrospective analy-sis related to 300 cases and 602 con-trols. Thus, the difference in results may not be entirely attributable to recall bias; response bias might have contributed. In a study in Finland, Männistô et al. (1999) compared data obtained by FQ from cases of breast cancer with data from (a) population-based controls and (b) subjects who were referred for the same examina-tions as cases but who were later diag-nosed to be healthy. There was evidence that group (b) differed from group (a) in reporting of milk products,
56

C-) s) r) CD
-. CD
CD
CD
CD
CD ç)
W
Study Cases Controls Prospective Retrospective Number Results method method of items
Type N Type N Type Timing Type Timing Veg. Fruit
Lindsted & Incident, 117 Survivors 99 FF0 1960 FF0, subset of 1960 1984 Kuzma, ns aged <82 instrument 1969 years, ns
Lindsted Mainly 181 Controls 225 FF0 1976 FF0, subset of 1976 1984 7 (indu- 7 & Kuzma, breast, selected ran- instrument ded 2 1990 female domly from categories
genifo- cohort of sur- relating to urinary or vivors aged rice) coloreclal <82 years
Frieden- Breast 325 Selected from 628 FF0 1982- reich at participants in 85 al., 1991 mammography
screening trial (same study base as cases)
Hammar Colo- 45 Random sam- 135 FF0 1967
& Noreli, rectal pie of original
1991 cohort
Holmberg Breast 265 Selected from 431 FF0 1967-90, Interview at aL, participants in sent out
1996 mammûgra- with invita- phy screening tion to (same study participate base as in cases) screening
Self-administered 1988 17
10 FF0 identical to first except reference period specified as diet at time of first FF0
FF0 identical to first except reference period Specified as diet at time of first FF0
Spearman rank-order correlation for veg. 0.21 for cases, 0.25 for controls; for fruit 0.26 for cases, 0.23 for controls. Exact and close agreement greater for controls than cases for both veg. and fruit
Spearman rank-order correlation for veg. In range 0.35-0.61 for cases, 0.27-0.65 for controls; for fruit 0.29-0.51 for cases and 0.31-0.46 for controls. % agreement greater for cases than controls for 417 veg. categories and 4/7 fruit categories. Over all 35 food groups, case—control dif-ference in recall error was not significant in multivariate analysis that conditioned on dietary changes.
Pearson correlation for veg. 0.50 (95% Cl 0.41-0.58) for cases and 0.48 (95% Cl 0.42-0.54) for controls; for fruit 0.55 (0.47-0.62) for cases and 0.58 (95% Cl 0.53— 0.63) for controls
1987 1 Among subjects with high consumption according to the original report, controls tended to under-estimate their previous consumption of fruit/veg. more than cases. Among those with low consump-tion according to the original report, cases tended to over-estimate their previ-ous consumption more than controls.
6 mo 9 4 Veg.: 31.3% agreement for cases, 37.3% after for controls; kappa 0.16 and 0.08 respec- screen- tively (0.12 and 0.18 when analysis ing restricted to subjects who returned com-
plete questionnaires).
Fruit: 38.51/. agreement for cases, 41.9% for controls; kappa 0.23 and 0.18 respectively
IARC Handbooks of Cancer Prevention Volume 8: Fruit and Vegetables
and for premenopausal women a difference was apparent also for reporting of tea, sugar, fats and vita-mins. Thus the OR of breast cancer in premenopausal women for the highest quintile of vegetable consumption ver-sus the lowest in comparison with group (a) was 1.3 (95% Cl 0.5-3.1) and with group (b) 0.6 (95% Cl 0.3-1.4).
Investigations of the theoretical impact of recall bias for dichotomous exposures shows that even severe recall bias causes only weak to moder-ate spurious associations (Drews & Greenland, 1990; Swan at al., 1992; Khoury at aI., 1994). However, in a simulation analysis, differential under-reporting of fat and energy intake by cases but not controls substantially altered the association between fat intake and disease risk (Bellach & Kohlmeier, 1998). The direction and magnitude of the effect depended on the type of error structure.
Differences in reference period between types of study An implicit difference between trials and cohort studies on the one hand and case—control studies on the other lies in the reference period about which data on intake of vegetables and fruit are sought. In trials and cohort studies, the reference period is typically at enrolment, although in some studies data on diet at later time-points in follow-up have been obtained. In case—control studies, data are typically sought for a reference period before diagnosis for cases and for a corresponding period before recruitment for controls. Although investigators recognize that there may be a long latent period in cancer development, they have also noted that reporting of past diet is influenced by current diet. It has been assumed that while total intake declines with age, the relative intake of different nutrients varies little in adult life
(Willett, 1998d). However, increasing diversity in the foods available for con-sumption and the increasing consump-tion of convenience foods may mean that this assumption is no longer ten-able in a number of countries (see Chapter 3).
Differences in the length of the reference period are a potential source of variability between studies in popu-lations where availability of fruit and vegetables varies by season.
It is possible that early life exposure to fruit and vegetables is important in the etiology of cancer. The food frequency approach taken in cohort studies (of older individuals) to date provides little to no information on early-life exposure. To the extent
that self-reported adult intake is a poor measure of early-life diet, addi-tional exposure error is introduced into studios.
Differences in definition of exposure between types of study Standard methods for classifying exposure to vegetables and fruit in epi-demiological studies have not been established (Smith at al., 1995) (see Chapter 2). The instruments used in most studies have been designed to assess variation in nutrient intake, rather than variation in intake of fruit and vegetables per Se. As an example of the lack of standardization, studies differ in whether fruit juice consump-tion is included in fruit consumption, vegetable juice intake with vegetable consumption, and whether potatoes or mature beans are included in vegetable intake (Slattery, 2001; Smith-Warner at al., 2001 a).
The number of fruit and vegetable questions has varied considerably across studies, which may influence the specific fruit and vegetable groups examined and the intake estimates obtained. The contrast in intake esti-mates for the high versus low categories for relative risk estimation
also has been highly variable across studies.
Differences in study instrument and its method of administration between types of study The methods of dietary assessment used in epidemiological studies to esti-mate individual dietary exposure include FFQs, diet history interviews, 24-hour dietary recalls and food record methods (see Chapter 2). Most studies have used FFQs. Key factors that differ include the number and formula-tion of questions, inclusion of data on portion size and the method of admin-istration. For example, in studies of col-orectal cancer in which the number of items used to assess dietary intake was reported, this varied between 35 and 276 items for cohort studies, and 10 to 300 items for case—control studies (see below). Direct interview-ing has been used in many case—con-trol studies, whereas this is seldom used in cohort studies.
Measurement error Issues in assessing evidence from different studies include (a) whether a validation study has been done; (b) if one has been done, its adequacy (see Chapter 2); and (c) whether informa-tion for the validation study was used in the analyses based on the primary study instrument. Little is known about the measurement error structure for reported fruit and vegetable intake in FFQs. Errors in the instrument being validated and in the reference method tend to be correlated (Plummer & Clayton, 1993; Goldbohm at al., 1995; Day at ai., 2001; Kipnis at al., 2001), while the extent of error varies with characteristics of the subject (Prentice, 1996; Homer et al., 2002). In conse-quence, both the attenuation of the dietary effect and the loss of statistical power may be greater than previously estimated, making modest (but important) reductions in relative risk
58

Cancer-preventive effects
difficult to detect (Kipnis et al., 2003). Potential solutions to this problem include the development and use of FFQs with far more detailed questions about fruit and vegetable intake; use of more intensive instruments (recalls, diaries) as the primary dietary assess-ment tool, and development of unbiased biomarkers of fruit and veg-etable intake, analogous to urinary nitrogen as a biomarker of protein intake. At present, such fruit and veg-etable biomarkers do not exist.
Adjustment for misclassification (cal-ibration) may not deal with possible het-erogeneity between studies because of differences in the design and adminis-tration of the primary study instrument.
End-points In most studies, the primary end-point has been newly incident cancers. However, in some studies, mortality due to specific types of cancer has been the primary end-point and these would be biased if fruit or vegetable intake were associated with survival.
In randomized trials, and some observational studies, intermediate effect markers have been used as end-points. An intermediate effect bio-marker is a detectable lesion or biolog-ical parameter with some of the histo-logical or biological features of preneo-plasia or neoplasia but without evi-dence of invasion, which is known either to be on the direct pathway from the initiation of the neoplastic process to the occurrence of invasive cancer, has a high probability of resulting in the development of cancer, or is a detec-table biochemical abnormality which is highly correlated with the presence of such a lesion. Thus intermediate effect markers include (a) detectable precan-cerous changes in an organ (con-firmed by histology), (b) alteration of a gene that is considered to play a causative role, (c) DNA damage, (cl) other indicators of carcinogenesis, such as the expression of a marker of
an exposure known to be a cause of a cancer (e.g., positivity for human papil-lomavirus (HPV) DNA), and (e) effects on metabolic factors thought to be involved in etiology, e.g., effects on phase I and phase II enzymes, antiox-idant pathways and steroid hormone metabolism. Causation is not a require-ment for inclusion in this group, but the expectation is that the relevant bio-markers can eventually be connected in a biologically mechanistic manner to the cancer (Miller et al., 2001).
There is likely to be a hierarchy of intermediate biomarkers. Those that are known to be on the causal pathway to cancer are at the top and can be truly called intermediate effect mark-ers. Then there are markers where present knowledge indicates only a probability of cancer association, but it is uncertain as to whether they are on the causal pathway - they can only be called intermediate markers. A subset of intermediate effect markers, which can be modulated, have been called surrogate end-point biomarkers (Kelloff et ai., 2000).
It has not been convincingly shown that the use of fruits and vegetables, or derivatives from them, in men and women with any type of preneoplastic lesion can substantially reduce the subsequent development of truly invasive cancer (see subsequent sec-tions of this chapter). In general, not enough is known on the natural history of precancerous lesions to identify those that will progress to invasive cancer if allowed to do so, nor to define the time point in the natural history of progression of intermediate end-points to cancer where an intervention will prevent the development of the cancer. If an intervention, such as fruit and vegetables, acts at the later stages of carcinogenesis, a randomized trial with an intermediate end-point will fail to demonstrate any effect. It would only be if the intervention was administered after the occurrence of the intermedi-
ate end-point, and was shown not to prevent the development of subse-quent cancer, that a benefit from the intervention could be excluded. Such studies are, however, likely to be precluded for ethical reasons, and therefore it may be impossible to use randomized trials to evaluate the effect of inhibition of the later stages of carcinogenesis.
Confounding An association between intake of fruit and vegetables and cancer could be due to confounding. This may be because a high intake of fruit and veg-etables is associated with other behav-iours related to health (Serdula et al., 1996; Williams et a/., 2000). In particu-lar, smokers consume lower quantities of vegetables and fruit than non-smok-ers; some studies (Serdula et al., 1996, Agudo et al., 1999; Voorrips et al., 2000a; Sauvaget et al., 2003) but not all (Nuttons et al., 1992; McPhillips et al., 1994; Wallstrom et al., 2000) have shown that differences in con-sumption are greater for fruit than for vegetables. Mean intake of fruit and vegetables of past smokers may be higher than those of current smokers (Miller etal., 2003).
In most studies, data on smoking behaviour have been self-reported and the accuracy of these data may vary between studies (e.g., Lindqvist et ai., 2002). In some studies, higher levels of alcohol consumption have been associated with lower intake of fruit and vegetables (Serdula et ai., 1996; Wallstrom et ai., 2000). In addition, high intakes of fruit and vegetables are associated with reduced intake of potentially harmful foods such as red meat. Thus intervention studies aimed at increasing intake of vegetables and fruit may also result in reduced fat intake (Smith-Warner et ai., 2000). Physical inactivity is a consistent risk factor for colon and breast cancer and may be associated with other types of
59
IARC Handbooks of Cancer Prevention Volume 8: Fruit and Vegetables
cancer (e.g., endometrium, prostate) (IARC, 2002) and fruit and vegetable consumption is likely to be correlated with physical activity. Even though many studies adjust for physical activity, this characteristic is not mea-sured with great accuracy and residual confounding remains a possibility. In addition, consumption of fruit and vegetables varies by age, gender, socioeconomic status and ethnicity. In most countries where the relationship between fruit and vegetable intake and measures of socioeconomic status has been investigated, the general pattern has been that intake was higher among people of higher socioeco-nomic status (Subar et aI., 1990; Murphy et aI., 1992; Potter, 1997) (see Chapter 3).
When confounders are measured inaccurately, it follows that the analysis cannot properly control for confound-ing. If both the primary exposure of interest and the confounder are mea-sured inaccurately, it is possible that the two sets of errors may be inter-related, so the apparent relationship between exposure and confounder may be quite different from that between the underlying variables (Clayton & Hills, 1993).
Due to the association between intake of fruit and vegetables and important risk factors for cancer like smoking and cancer on one side, and the possible errors in measuring these factors on the other side (e.g., Marshall et aI., 1996; Lindqvist et al., 2002; Stram et al., 2002), it is difficult to exclude residual confounding com-pletely. For example, Stram et al. (2002) illustrated with a simulation that even a modest correlation between smoking and serum l3-carotene, combined with errors in smoking assessment, might plausibly explain the observed inverse association of serum n-carotene levels with lung cancer risk in terms of residual con-founding.
Effect modification Components of fruit and vegetables can interact with biological targets by modifying the risk associated with car-cinogenic exposures. For example, DNA damage related to tobacco smok-ing could be inhibited by fruit and vegetable components. Such effect modification needs to be clearly distin-guished from confounding, because it represents a genuine protective effect that occurs only in those exposed to the carcinogens. For this reason, it is important to analyse epidemiological data not only with an approach based on adjustment for potential con-founders (e.g., smoking), but also stratifying by carcinogenic exposures (e.g., never-smokers, ex-smokers, cur-rent smokers).
If fruit and vegetable intake is pro-tective only for persons with a specific genetically determined metabolic pro-file, the incorporation of appropriate genetic information into epidemiologi-cal studies could sharpen' the relative risks observed in the 'susceptible' group. Work on such nutrition—gene interactions presents considerable difficulties, however, given that there are many bioactive constituents of fruits and vegetables and many enzymes involved in their absorption and metabolism, with functionally important allelic variants for at least some of these enzymes.
Statistical analysis Categorization of exposure An issue in statistical analysis is whether to consider reported dietary intake as a continuous or a categorical variable. When the objective of dietary assessments is to rank subjects according to their intake rather than to provide a precise quantitative measure of absolute intake, analysis by ordered categories such as tertiles, quartiles or quintiles is less sensitive to the effects of outliers than analysis of continuous variables (Willett, 1998e). The mea-
sure of the effect of the nutrient on disease can be interpreted as the effect of changing intake between quantiles of intake, e.g. from the lowest to the highest. Categorization by quan-tiles can be based on the distribution of (a) cases, (b) non-cases and (c) all subjects. These three methods have been found to give the same statistical power to detect a trend across quan-tiles over a wide range of study situa-tions (Hsieh et al., 1991). The choice of method may be influenced by consid-eration of how the quantiles relate to the source population and by ease of implementation.
Adjustment for energy intake Total energy intake requires attention in the analysis and interpretation of nutritional epidemiology studies for several reasons. (1) It may be a pri-mary cause of disease. Low energy intakes have reduced the incidence of tumeurs in experimental animals. Thus, adjustment for energy intake may be performed in human observa-tional studies to mimic the isocaloric conditions in animal experiments. (2) It may be associated with disease in a non-causal manner and, since repor-ted intakes of many specific food groups or nutrients tend to be corre-lated with total reported intake, total energy intake may confound associa-tiens with many food groups or nutrients. (3) Factors such as physical activity, body size and metabolic varia-tion influence energy intake and may influence the risk of disease; variation in nutrient intake secondary to the influence of these factors on total energy intake is extraneous when investigating the effect of variation in nutrient intake on disease (Willett, 1990).
Methods of adjustment have been discussed by Willett (1990) and Kushi et al. (1992). More recently, it has been noted that the impact of measurement error on energy-adjustment models is
Cancer-preventive effects
uncertain (Kipnis et al, 1997), and there is renewed debate about energy adjustment (Block, 2001; Day et aI. 2001; Day, 2002; Willett, 2001a, b, c). There is some doubt as to whether energy adjustment is required for assessment of fruit and vegetable intake. Fruits and vegetables are sources of non-fat energy. It has been suggested that adjustment for body weight may be a better approach to adjust for the overall effects of energy (Day & Ferrari, 2002).
Low intake or missing values Treatment of data from subjects reporting very low total intake or with a high proportion of missing values can lead to (a) selection bias from exclud-ing such subjects or (b) misclassifica-tion introduced by imputation of values to avoid this (Vach & Blettner, 1991; Greenland & Finkle, 1995; Demissie et al., 2003; Lyles & Allen, 2003). It is important to consider what method has been used, and whether the investiga-tors reported any impact on the study results from different methods of deal-ing with this problem.
Study context Heterogeneity between studies could arise from differences in many aspects of study context, including the types of fruit and vegetables available for con-sumption, their growing conditions, typical methods of preparation (stor-age, cooking), variability of exposure in the study population and of genetic background.
In cohort studies, few participants consume more than 4-5 servings of vegetables (or fruits) per day. This sim-ply reflects the ranges of fruit and veg-etable intake common in the USA and Europe, where these studies were conducted. The cohort studies to date could not evaluate whether substantial cancer protection is associated with higher levels of intake.
Integration of evidence In reviewing the evidence in the rest of this chapter, the Working Group used inclusion criteria. Case reports were not considered, and ecological studies were not used in the evaluation. Cohort and case-control studies were always considered unless in the judge-ment of the Working Group they were inadequate in conception, design, conduct or analysis.
There have been several instances of sequential or multiple publications of analyses of the same or overlapping data-sets. When the reports clearly related to the same or overlapping data-sets, only data from the largest or most recent publication were included.
Meta-analyses and pooled analy-ses that were available are described at the end of the relevant section.
The data considered are presented in detail in the tables. In general, the tables include only data for total fruit, total vegetables, and total fruit and vegetables combined, unless for a specific study, the subgroups for which data were presented appeared to com-prise a substantial proportion of fruit or vegetable intake, e.g. fresh fruits for fruits, or raw and cooked vegetables for vegetables. However, the data on sub-groups do not contribute to the evaluations, and no data are pre-sented on cruciferous vegetables, as they will be the subject of a future eval-uation. The odds ratios (ORs) or relative risks (RAs) presented are always those reported relating the highest quantile of consumption (of total fruit or total vegetables) to the lowest. Confidence intervals for these ORs are included when reported by the authors. When the authors reported ORs for the lowest to the highest consumption, the Working Group computed the inverse, and the result of these computations (and of the inverse of the confidence intervals if available) appears in square brackets in the tables.
The data used in the evaluations also appear as plots (Figures 16-51). Only those studies on total fruit or veg-etables which reported confidence intervals and adjusted for the main confounders for the relevant sites are included in the plots. Meta-analyses and pooled analyses reported in the tables or discussed in the text have not been included in the plots. An estimate of the overall effect across all the evaluable studies, calculated as explained below, is presented, taking the size of the study (as reflected in the confidence interval) into account when weighting the individual study findings. The result of applying a test for hetero-geneity is given with each plot. The reader is cautioned that these sum-mary estimates do not constitute the result of a formal meta-analysis, and they should not be interpreted as such.
The summary estimates in the plots were calculated as follows. Using the log of the relative risks for the high-est versus lowest exposure categories in the individual studies, designated as 01, the pooled estimate (summary value, ) was obtained, separately for cohort and case-control studies, as
PP = 1fvar()]/[I 1/var(3)]
with estimated standard error
SE(J3) = [1, 1/var([3)]-112
The x2 for heterogeneity was calculated as
x2 = E I (3 13)2/var(1)
with (N-1) degrees of freedom, where N is the total number of studies.
The analyses and generation of the plots were performed using the R soft-ware (Ihaka & Gentleman, 1996). Individual studies are presented in the plot in chronological order, with the box size' proportional to the inverse of their variance.
61
IARC Handbooks of Cancer Prevention Volume 8: Fruit and Vegetables
For some studies, results are reported for subcategories of the pop-ulation under study, for example, males and females, pre- and post-menopausal women, colon and rectal cancer. In the calculation of the overall effect and in the final plot, the sub-groups counted as individual studies; however, when counting the number of evaluable studies for different cancer sites, subgroups were considered as coming from a single study.
In reviewing the evidence on each cancer site, the Working Group consid-ered the following criteria: • Overall quality of design • Comparability of source population
of cases and controls • Adequacy of control for potential
confounding • Evidence of dose—response effect • Evidence of effect modification • Evidence for difference in effect by
age, gender and subsite of cancer • Evidence of publication bias • Evidence of heterogeneity of effect
between studies
Effects by site The tables summarizing epidemiologi-cal studies and their results by site (Tables 10-112 are grouped on pages 103-245).
Grouped sites of the upper gastro-intestinal tract The most important factors responsible for the occurrence of cancers of the upper gastrointestinal tract (oral, pha-ryngeal and oesophageal cancers), as well as cancer of the larynx, are tobacco smoking and alcohol drinking, which interact in a multiplicative way (WCF/ AICA, 1997). There are therefore seri-ous risks of residual confounding in observational studies of cancers at all these sites.
Combined fruit and vegetables Cohort studies Three cohort studies have reported
upon fruit and vegetable consumption in relation to grouped sites of the upper gastrointestinal tract, two conducted in Europe and one in the USA. One included all incident cancers from mouth to oesophagus (Boeing, 2002); another also included larynx (Kjaerheim et al., 1998) and a third additionally included nasopharynx and stomach (Kasum et al., 2002). Boeing (2002) reported a significantly de-creased risk associated with consump-tion of fruit and vegetables combined; the other studies reported data only on subcategories (Table 10).
Oral cavity and pharynx Fruit Cohort studies No cohort study on fruit consumption and risk of oral or oropharyngeal can-cer was identified by the Working Group.
Case—control studies Five studies in the USA and Australia have been reported (Table 11).Wynder et at (1957) used a hospital-based case—control design and included 543 males and 116 females with cancer in their analysis. Neither vegetable nor fruit consumption was significantly dif-ferent in males, but women with tongue cancer (n 57) had lower citrus fruit consumption than controls (the findings are not tabulated). One study, which included deceased subjects, found an inverse association (Winn et aI., 1984). Three analyses of data from a large study in the USA (McLaughlin et al., 1988; Gridley et al., 1990; Day et aI., 1993) found inverse associations for fruit consumption except among blacks in total and black females.
In four South American hospital-based studies, inverse associations for fruit or citrus fruit consumption were significant in three.
In Europe, most of the case—control studies were conducted in northern Italy and nearby areas. Case
recruitment was hospital-based and controls were hospital patients. In addition to reports from single study centres (Franceschi et al., 1991a; La Vecchia et al., 1991), combined analyses have been conducted using the various data sources in different combinations (Bosetti et al., 2000b). The publications of Negri et aI. (1 991) and La Vecchia et al. (1991) seem to have used overlapping data-sets. The results of Negri et al. (1991) were used for the Working Group's evaluation because of the larger number of sub-jects reported. Except for the first, the studies revealed inverse associations, one of which was non-significant. A sub-analysis for never-smokers showed a non-significant risk reduction in those having more than a low intake of fresh fruit (Fioretti et al., 1999). Franceschi et al. (1999) reported on a multicentre study conducted between 1992 and 1997, using an expanded validated questionnaire. More recent studies elsewhere in Europe have shown a consistent inverse relationship with fruit consumption.
Fruit consumption was inversely related to oropharyngeal cancer in one of the two older studies in southern Asia. However, this study reported only raw data without adjustment. A recent hospital-based case—control study in India showed a protective effect of fruit consumption in the whole study popula-tion, as well as among male smokers and non-smokers and alcohol drinkers and non-drinkers (Rajkumar et al., 2003b).
In most studies that addressed the issue (Winn et al., 1984; Oreggia et al., 1991; Tavani et al., 2001; Sanchez et al., 2003), an inverse association with fruit consumption was found across all strata of smoking and alcohol-drinking status.
Vegetables Cohort studies In the large cohort study of Hirayama (1990) in Japan, the frequency of intake of green-yellow vegetables was
62
kajob
Highlight
kajob
Highlight

Cancer-preventive effects
inversely associated with risk of oropharyngeal cancer non-significantly in men and significantly in women.
Case—control studies Three analyses of data from a large study in the USA (McLaughlin et aL. 1988; Gridley et al., 1990, Day et al., 1993) found a significantly reduced risk associated with vegetable con-sumption only in black men (Table 12).
In four studies in South or Central America, there was no significant effect of vegetable consumption except for a study in Uruguay involving 57 cases of squamous-cell carcinoma of the tongue.
The European case—control stud-ies on diet and risk of oral and oropha-ryngeal cancer used hospital-based case recruitment and hospital patients as controls. The studies in northern Italy, except that of Franceschi et ai. (1991a), show a consistent significant inverse relationship between veg-etable intake and risk of oral and pha-ryngeal cancer. A sub-analysis on never-smokers revealed no protection by vegetables (Fioretti et al. 1999).
In a recent study in southern India, vegetable intake was inversely related to risk (Rajkumar et al., 2003b). This was true for current smokers and non-smokers as well as for alcohol drinkers and non-drinkers. Neither of two stud-ies from northern Asia presented data on total vegetable consumption.
Most other studies that addressed the issue suggest that the inverse association with vegetable consump-tion persists across all strata of smok-ing and alcohol-drinking status.
Combined fruit and vegetables Results on total fruit and vegetable consumption from three case—control studies in North America have been reported. Graham etal. (1977) reported no difference between 584 cases of oral cavity cancer and 1222 hospital controls in intake of various fruit and
vegetables, but no numerical data were presented. Gridley et al. (1992) reported that fruit and vegetable intake was associated with reduced risk (pre-sented as a point estimate) for oral and pharyngeal cancer, independent of supplement use (Table 13). Winn et al. (1984) also reported a significant inverse relationship for combined fruit and vegetable consumption.
Precancerous lesions Three case—control studies investi-gated precancerous lesions with respect to fruit and vegetables (Table 14). In two studies of submucous fibrosis and leukoplakia in male tobacco users in different states of India, cases and controls were selected by medical examination of household members. Only in the study of Gupta et aL (1999) was total fruit and vegetable consumption evaluated, and no inverse association was reported. Similarly, the study of Morse et al. (2000) did not show a significant inverse association with fruit and vegetable consumption.
Salivary gland Zheng et al. (1996) (Table 15) did not find an association of either fruit or vegetable consumption with salivary gland cancer.
Nasopharynx In the two case—control studies (Table 16), significant inverse associations were reported only for orange and tan-gerine consumption.
Discussion The data available for evaluation are almost entirely from case—control stud-ies, of varying design. Fruit consump-tion was evaluable in 10 studies: the mean odds ratio (OR) was 0.45 (95% confidence interval (Cl), 0.38-0.53), range 0.10-0.70 (Figure 16). Vegetable consumption was evalu-able in seven studies: mean OR = 0.49
(95% Cl 0.39-062), range 0.19-0.80 (Figure 17).
Most of these studies adjusted for the potential confounding effects of tobacco and alcohol consumption, though many, especially the earlier studies, did so rather crudely. There-fore it is not possible to exclude an effect of residual confounding. Further, many of the case—control studies were hospital-based, and even in those that were population-based, full compara-bility of the data from cases and con-trols may not have been achieved, nor can the inherent biases associated with this design be eliminated.
Only three case—control studies considered the effect of fruit and vegetable consumption on presumed precursor lesions of the mouth. No significant inverse association was found. Similarly, no effect of these exposures on salivary gland cancer (one study) was found, while for naso-pharyngeal cancer (two studies), only subcategories of exposure were con-sidered.
Oesophagus Fruit Cohort study Only one cohort study considered total fruit consumption (Table 17). This was conducted in the Life Span Study in Japan that included 120 321 atomic bombing survivors and non-exposed controls. A borderline significant inverse association was found (Sauvaget et ai., 2003).
Case—control studies Three of the five studies in the USA found significant inverse associations for fruit consumption (Table 18). Four out of six studies in South America also found significant inverse associa-tions, while two that did not report an effect were on citrus and non-citrus fruit, and not all fruits combined. The findings from four studies in South America were also included in a
63
kajob
Highlight

[ARC Handbooks of Cancer Prevention Volume 8: Fruit and Vegetables
No. of Case—control studies categ. OR 95% CI
Kune eta?., 1993 3 0.1 0.0-0.3 _________________________
Oreggia eta?., 1991 4 0.42 0.14-1.25 • :
De Stefani eta?., 1999 3 0.7
Garrote eta?., 2001 3 0.43 0.21-0.89
Negri eta?., 1991 3 0.2 0.1-0.3
Tavani eta?., 2001 3 0.34 0.13-0.87 _______________
Lissowska et al., 2003 3 0.40 0.17-0.95 S.
Sanchez eta?., 2003 3 0.52 0.34-0.79
Rajkumar eta?., 2003b 3 0.55 0.38-0.81
Takezaki eta?., 1996 3 0.5 0.4-0.7
SUMMARY VALUE 0.45 0.38-0.53
Heterogeneity test: x2 (9df)=22; p=0.010
0.1 0.25 0.5 Odds ratio
Figure 16 Case-control studies of oral and pharyngeal cancer and fruit consumption (see Table 1)
pooled analysis (Castellsague et al., Tavani et al. (1 993) for women, Tavani a?. (1979) conducted a population-2000) which found a significant inverse et al. (1994) for non-smokers and based study between 1974 and 1976 association. Tavani et al. (1996) for non-drinkers with 344 incident cancers of the
The studies in Europe also gener- were based on the same data-set oesophagus and twice the number of ally found fruit consumption to be extended to 316 cases until December controls. When they considered recent inversely related to risk, except for a 1992. Most of the cases were already diet, they found relative risk estimates small study in Greece. The large study covered by the report of Negri et al. below 1.0, most of them significant for of Tuyns et al. (1987) evaluated citrus (1991). Bosetti et al. (2000a) used an nearly all fruit items considered, but fruit and other fresh fruit but not total expanded validated questionnaire in a they did not present relative risk fruit. Many hospital-based case- multi-centre study on citrus and other estimates for total fruit. The hospital-control studies were conducted in fruits conducted between 1992 and based case-control study of Prasad et northern Italy. Following an early 1997. In nearly all these studies, al. (1992) in Hyderabad, India, report (Decarli et al., 1987), Negri et significant inverse associations were included only 35 cases and did not pro- al. (1991) (294 cases in June 1990) found. sent relative risk estimates for food summarized the results of the studies Several studies in southern Asia items. The hospital-based study of so far conducted. The reports of have been reported. Cook-Mozaffari et de Jong et al. (1974) among Singapore
64

Cancer-preventive effects
No. of Case-control studies categ. OR 95% Cl
Kune et al., 1993 3 0.3 0.1-0.6
Oreggia etal., 1991 4 0.19 0.05-0.67
De Stefani at ai., 1999 3 0.8 0.4-1.4
Garrote at al., 2001 3 0.76 0.40-1.51
Lissowska etal., 2003 3 0.17 0.07-0.45
Sanchez etal., 2003 3 0.54 0.34-0.79
Rajkumar etal., 2003b 3 0.44 0.28-0.69
SUMMARY VALUE 0.49 0.39-0.62
Heterogeneity test: x2 (6df)=13; p=0.051
0.1 0.25 0.5
Odds ratio
Figure 17 Case—control studies of oral and pharyngeal cancer and vegetable consumption (see Table 12)
Chinese with 131 squamous-cell oeso-phageal cancer cases and 345 hospital controls also did not analyse total fruit, but only banana consumption. Of the four studies from India and Turkey included in Table 18, risk estimates were below 1.0 in one of the Indian studies and both in Turkey.
Of the nine studies in northern Asia included in Table 18, five considered total fruit, one finding a significant inverse association only for men. Of the remainder, one was based on oesophagitis diagnosed by oesopha-goscopy in relatives in households.
Tavani et al. (1994, 1996) found that fruit intake was significantly inversely related to risk in the low-
exposure groups of alcohol drinkers and smokers. Cheng et al. (1995) also reported that among never-smokers and non-drinkers, selected from a previously analysed study population, consumption of citrus fruit was inversely related to risk.
Vegetables Cohort studies All four cohort studies were conducted in China or Japan, but none considered the effect of total vegetable consumption (Table 19).
Case—control studies All five studies in the USA showed an inverse association between vegetable
consumption and risk of oesophageal cancer (Table 20). Wynder & Brass (1961) also reported lower intake of vegetables among 150 squamous-cell oesophageal cancer patients com-pared with 150 other tumour patients used as controls. Similarly, of the five studies in South America, all but one showed an inverse association between vegetable consumption and risk of oesophageal cancer. This was confirmed in the overview analysis of data from four of the studies (Castellsague et al., 2000). Further, except for squamous-cell carcinoma in one small study in Greece, all the stud-ies in Europe showed inverse associa-tiens, though only four assessed total
65

IARC Handbooks of Cancer Prevention Volume 8: Fruit and Vegetables
vegetable intake. The studies con-ducted in northern Italy are best repre-sented by the reports of Negri et al. (199 1 ) and Bosetti et al. (2000a).
In the study in Iran by Cook-Mozaffari et al. (1979), relative risk estimates below 1.0, most of them not significant, were found for nearly all vegetable items, though total vege-table intake was not considered. The two studies in India and the two in Turkey all found inverse associations with vegetable consumption, although one of those in India did not assess total vegetable consumption.
Similarly, all but one of the nine cancer studies conducted in northern Asia found inverse associations between various groupings of vegeta-bles and oesophageal cancer, though only one considered total vegetable consumption. This was supported for women but not men by the study of Chang-Claude et al. (1990) of oeso-phagitis among relatives.
The study of Tavani et al. (1994) in never-smokers revealed that vege-table consumption measured as total green vegetable consumption or carotene index is inversely related to risk of cancer of the oesophagus and in both low and high alcohol drinkers. Cheng et al. (1995) reported that among never-smokers and non-drinkers, selected from a previously analysed study population, consum-ption of green leafy vegetables was inversely related to risk.
Combined fruit and vegetables Cohort studies No studies were identified by the Working Group.
Case—control studies The hospital-based case—control study by Mettlin et al. (1981) of male patients with 147 cases and 264 controls was one of the first to investigate fruit and vegetable consumption with respect to risk of oesophageal cancer. However,
the only comparison was between case consumption and the consumption by the total study population. The findings indicated that fruit and vegetable con-sumption was significantly inversely related to case status.
All six studies with published esti-mates on combined fruit and vegetable intake found an inverse relationship with oesophageal cancer risk (Table 21).
Discussion For oesophageal cancer, fruit con-sumption was evaluable in 16 case—control studies: the mean OR was 0.54 (95% Cl 0.48-0.61), range 0.14-1.50 (Figure 18). Vegetable consumption was evaluable in 10 case—control stud-ies, giving a mean OR = 0.64 (95% Cl 0.57-072), range 0.10-0.97 (Figure 19).
The observation of an inverse asso-ciation with fruit and vegetable intake in most of the studies was confirmed by a recent meta-analysis by Riboli & Norat (2003). For both dietary factors, the combined relative risk estimate was significantly below 1.0.
The data indicate that cancer cases have usually eaten less fruit and vegetables over their lifetime and that those eating more fruit and vegetables than the rest of the study population usually experience Less oesophageal cancer. However, it remains uncertain whether this results from a true protec-tive effect or is due to residual confounding by tobacco smoking, alcohol drinking and social factors. Studies that looked at effects of fruit and vegetables in particular subgroups of never-smokers and non-drinkers and those that looked at effects of these food items across strata of smoking habits and alcohol drinking indicate similar associations of fruit and vegetable consumption across all the subgroups considered, but the power of these studies was low.
Stomach Despite reductions in incidence and
mortality rates in most countries, stomach cancer is still one of the most common malignant neoplasms world-wide. The reasons for the decline and for geographical differences are not fully understood, but domestic refrigeration, increased year-round availability of fruits and vegetables, and reduced use of salt are believed to be relevant factors.
Fruit Cohort studies The association between intake of fruit and the risk of stomach cancer has been examined in 11 cohort studies (Table 22), most of which reported an inverse, although often non-significant, association.
Guo etal. (1994) found no associa-tion for either cardia or non-cardia cancer.
Case—control studies Most of the 37 case—control studies of the association between intake of fruit and risk of stomach cancer included in Table 23 showed an OR below 1.0.
Two studies reported associations according to anatomical subsite; these showed significant inverse associa-tions for both cardia and non-cardia cancer (Palli et al., 1992; Ekström et aI., 2000). Six case—control studies reported upon the association according to histological subtype. In three, there was a significant inverse association for each histological type (Correa et al., 1985; Harrison et al., 1997; Ekström et al., 2000), in one a significant inverse association for the intestinal type in females only (Kato et al., 1990), in one a significant inverse association for the differentiated histo-logical type (Ito etal., 2003) and in one no association for any subtype (Ward & Lopez-Carrillo, 1999).
Vegetables Cohort studies The association between intake of veg-etables and risk of stomach cancer
kajob
Highlight

Cancer-preventive effects
No. of Case—control studies categ. OR 95% Cl
Brown etal., 1988 3 0.5 0.3-0.9
Castelisagué et at, 2000 (S) 3 0.37 0.27-0.51 - De Stefani etal., 1999 3 0.4 0.3-0.6 -I---4- De Stelani etal., 2000b (S) 4 0.18 0.09-0.39
Negri et al., 1991 3 0.3 0.2-0.4 I Tzonou etal., 1996a (S) 5 0.9 0.67-1.21 -I - Tzonou etal., 1996a (A) 5 0.84 0.65-1.08 : Cheng etal., 2000 (A) 4 0.18 0.05-0.57 • Sharp etal., 2001 (A) 4 0.64 0.25-1.67
Terry etal., 2001b (A) 4 0.7 0.4-1.1 - Terry etal., 2001b (S) 4 0.6 0.4-1.1
Woltgarten et al., 2001 (A) 2 0.16 0.04-0.53
Wolfgarten etal., 2001 (S) 2 0.33 0.12-0.91 • Phukan etal., 2001 2 0.3 0.08-4.2
Onuk etal., 2002 2 0.14 0.06-0.3
Hu etal., 1994 4 1.5 0.8-2.9
Hanaoka etal., 1994 4 0.50 0.18-1.39 - Gao et al., 1999 3 0.75 0,36-1-55
Yokoyama etal., 2002 5 0.78 0.28-2.17
SUMMARY VALUE 0.54 0.48-0.61
Heterogeneity test: x2 (18df)=82; p<0.001
I 1'
0.1 0.25 015 1 2
Odds ratio
Figure 18 Case-control studies of oesophageal cancer and fruit consumption (see Table 18)
S = squamous cell carcinoma, A = adenocarcinoma
was examined in 11 cohort studies (Table 24). Although all studies except two showed relative risks below 1.0, the association was generally not sig-nificant.
One study showed a significant inverse association for cases with dif-ferentiated histological type, but none for those with undifferentiated type (Kobayashi et al., 2002). In two studies, the association between total intake of vegetables and the risk of stomach cancer was examined accord-
ing to anatomical subsite; in each there was no significant association for either cardia or non-cardia cancer (Inoue et al., 1994; Kobayashi et al., 2002).
Case—control studies Most of 39 case—control studies reported in Table 25 showed an OR below 1.0.
In two studies, the association between intake of total vegetables and the risk of stomach cancer was examined according to anatomical
subsite; in one there were significant inverse associations for both cardia and non-cardia cancer for raw vegeta-bles (PaRi et al., 1992), while in the other the association was not signifi-cant (EkstrOm et al., 2000). Five studies reported upon the association between intake of vegetables and the risk of stomach cancer according to histological subtype; in three there was a significant inverse association for both histological types (Ward & Lopez-Carrillo, 1999; Ekstrôm et al., 2000;
67

IARC Handbooks of Cancer Prevention Volume 8: Fruit and Vegetables
No. of Case-control studies categ. OF 95% Cl
Brown etal., 1988 3 0.7 0.4-1.3 iffl
-
Chen et al., 2002a (A) 4 0.45 0.2-1.0
De Stefani etal., 1999 3 0.7 0.5-0.9 --
Castelisagué et al., 2000 3 0.62 0.44-0.86 -----
De Stefani et al., 2000b 4 0.64 0.34-1.20 -I----- -
Tzonou et al., 1996a (A) 5 0.62 0.48-0.80
Tzonou etal., 1996a (S) 5 0.97 0.74-1.28 -1 Launoy etal., 1998 4 0.24 0.11-0.55
Cheng etal., 2000 4 0.58 0.22-1.55
Terry et al., 2001b (A) 4 0.5 0.3-0.8
Terry et al., 2001 b (S) 4 0.6 0.4-1.0
Onuk etal., 2002 2 0.10 0.04-0.23
SUMMARY VALUE 0.64 0.57-0.72 -Ç>
Heterogeneity test: x2 (11 df)=34 p=0.00033
0.1 0.25 0.5 Odds ratio
Figure 19 Case-control studies of oesophageal cancer and vegetable consumption (see Table 20) A = adenocarcinoma; S = squamous-cell carcinoma
Ito et al., 2003), in one for the intestinal study considered only fresh fruit and Cl 0.77-0.95), range 0.55-1.92 type only in males (Kato et al., 1990) raw vegetables. (Figure 20). In the 28 ovaluable and in one a non-significant inverse case-control studies, the mean OR association (Harrison et al., 1997). Case-control studies was 0.63 (95% Cl 0.58-0.69), range
In all three of the case-control studies 0.31-1.39 (Figure 21). Combined fruit and vegetables that evaluated the combination of fruit Vegetable consumption was evalu- Cohort studies and vegetables, there was a significant able in five cohort studies. The mean Three cohort studios examined the inverse association (Table 27). RR was 0.94 (95% Cl 0.84-1.06), association between combined intake range 0.70-1.25 (Figure 22). Twenty of total fruit and vegetables and the Discussion case-control studies were evaluable and risk of stomach cancer (Table 26). In Fruit consumption was evaluable in 10 the mean OR was 0.66 (95% Cl two of these, there was a significant cohort studies of stomach cancer. The 0.61-0.71), range 0.30-1.70 (Figure 23). inverse association, although one mean relative risk (RR) was 0.85 (95%
68

Cancer-preventive effects
No. of Cohort Studies categ. OR 95% Cl
Chyou etal., 1990 4 0.8 0.4-1.3 ___
Nomura et at., 1990 3 0.8 0.6-1.3
Kneller Pt al., 1991 4 1.5 0.75-2.93
Kato etal., 1992 3 1.92 1.03-3.59 _________
Guo etal., 1994 2 0.9 0.8-1.1 J - Inoue etal., 1996 3 0.55 0.22-1.35
Rotterweck etal., 1998 5 0.97 0.64-1.48
Galanis et al., 1998 2 0.6 0.4-0.9
Kobayashi etal., 2002 4 0.70 0.48-1.01
Sauvaget et al., 2003 3 0.80 0.65-0.98
SUMMARY VALUE 0.85 0.77-0.95 4.
Heterogeneity test: x2 (9df)=1 5; p=0.083
I
0.25
I
0.5 1
I j
2 4 Odds ratio
Figure 20 Cohort studies of stomach cancer and fruit consumption (see Table 22)
The results of the cohort studies second in Japanese. However, the Only three cohort studies adjusted for are not consistent. Besides differences numbers of cases in both studies were history of stomach disease and family in population and the types of fruit and low. In all except two of the cohort stud- history of stomach cancer. Two studies vegetables consumed, other factors ies, the dietary questionnaire was not did not adjust for tobacco or alcohol that could explain the heterogeneity validated and the numbers of total intake and one of these reported a sig- are the quality of design, food intake items in the questionnaire were low. nificant risk increase associated with assessment, uncontrolled confounding Stomach cancer is a disease of high intake of fruit. and effect modification. In most cohort complex etiology involving multiple risk The relationship between stomach studies, there were inverse associa- factors including dietary, infectious, cancer risk and diet has been exten-tions, but these were statistically signif- occupational, genetic and preneoplas- sively investigated in case—control icant in only two studies for fruit and tic factors. It is possible that unmea- studies, mainly in European and Asian one for vegetables. In two cohort sured or unidentified risk factors may populations. The case—control studies studies, a positive association was have affected some study results, showed more consistent and stronger reported between fruit intake and While all the studies adjusted for sex effects of fruit and vegetables on stomach cancer risk, one in a high-risk and age, adjustment for He/icobacter stomach cancer risk than the cohort male American population and the pylori infection was rarely possible. studies. Most of the case—control

IARC Handbooks of Cancer Prevention Volume 8: Fruit and Vegetables
No. of I
Case-control studies categ. OR 95% Cl
Correa etal., 1985 (B) 4 0.33 0.16-0.66 Correa etal., 1985 (W) 4 0.47 0.24-0.92 a Jedrychowski etal., 1986 3 0.31 0.15-0.64 I
Kono et ai., 1988 (H) 2 0.7 0.4-1.0 - Kono etal., 1988 (P) 2 0.5 0.3-0.6 De Stefani etal., 1990a Kato etal., 1990 (M)
3 3
0.36 0.63
0.23-0.56 0.51-1.33
t L
Kato etal., 1990 (F) 3 0.77 0.33-1.78 Wu-Willams et al., 1990 3 0.67 0.29-1.67 Boeing etal., 1991a 3 0.56 0.35-0.91 Yi & Hsieh, 1991 2 0.5 0.3-0.8 I
Hoshiyama & Sasaba, 19923 0.8 0.5-1.3 - Jedryehoeiski etal., 1992 3 0.72 0.56-0.94 : Sanchez-Diez etal., 1992 2 0.31 0.11-0.87 I
Ramon etal., 1993 4 0.85 0.21-1.11 I moue et al., 1994 2 0.86 0.70-1.10 '-- - Cornée et al., 1995 3 0.50 0.25-1.03 u Muñoz et al., 1997 3 0.47 0.21-1.05 Xu et al., 1996 4 0.5 0.4-0.8 Harrison etal., 1997 (I) * 0.5 0.3-0.9 y I - Harrison etal., 1997 (D) * 0.5 0.2-1.0 I La Vecchia et al., 1997 3 0.6 0.5-0.8 Gao etal., 1999 3 0.88 0.47-1.67 I Ward & Lopez-Carrillo, 19994 1.0 0.5-2.2 Ekstrém etal., 2000 (C) 4 0.5 0.2-1.0 - Ekstrôm etal., 2000 (N) 4 0.6 0.4-0.8 Huang etal., 2000 (FH +) * 1.39 0.69-2.82 Huang etal., 2000 (FH -) 1.11 0.74-1.67 Mathew etal., 2000 4 0.7 0.2-3.6 De Stefani etal., 2001 3 0.35 0.21-0.59 u Hamada etal., 2002 2 0.4 0.2-0.9 I Kim et al., 2002 3 0.67 0.33-1.39 'e Nishinioto etal., 2002 4 0.6 0.3-1.2 Ito etal., 2003 4 0.68 0.40-1.16 'u - SUMMARY VALUE 0.63 0.58-0.69
Heterogeneity test: x2 (33df)=54.4; p=0.0108 L I
0.1 0.2 0.5 1 2 Odds ratio
Figure 21 Case-control studies of stomach cancer and fruit consumption (see Table 23)
B = blacks; W = whites, H = hospital controls; P = population controls; M = males, F = females; I = intestinal type; D = diffuse type; C = cardia; N = non-cardia; FH+ = gastric cancer family history positive; FH- = gastric cancer family history nega-tive; * = not applicable
70

Cancer-preventive effects
No. of Cohort studies categ. OR 95% Cl Chyou et al., 1990 4 0.7 0.4-1.1 Kneller et ai., 1991 4 0.9 0.48-1.78 Botterweck etaL, 1998 5 0.86 0.58-1.26 McCullough etal., 2001 (M) 3 0.89 0.76-1.05 McCullough etal., 2001 (F) 3 125 0.99-1.58
Kobayashi et al. 2002 5 0.75 0.54-1.04 SUMMARY VALUE 0.94 0.84-1.06
Heterogeneity test: x2 (5df)=9.5; p=0.09
05 Odds ratio
Figure 22 Cohort studies of stomach cancer and vegetable consumption (see Tabie 24) M = males; F = females
No. of Case-control studies categ. OR 95% CI
Correa etal., 1985 4 0.50 0.25-1.00 Risch et al., 1985 * 0.84 0.72-0.96 Jedrychowski etal., 1986 3 0.61 0.25-1.49 De Stefani etal., 1990a 3 0.37 0.23-0.59 Boeing etal., 1991a 3 0.86 0.54-1.36 Jedrychowski et al., 1992 3 0.60 0.46-0.78 Memik etal., 1992 3 0.6 0.31-1.23 -: - Sanchez-Diez etal., 1992 2 0.70 0.41-1.08 - Hanssor etal., 1993 4 0.50 0.32-0.78 • Cornée et al., 1995 3 0.77 0.37-1.60 Xu etal., 1996 3 0.5 0.4-0.8 • Harrison et al., 1997 (I) * 0.8 0.5-1.3 Harrison etal., 1997 (D) * 0.7 0.4-1.2 - Muñoz etal., 1997 3 0.47 0.22-1.03 Ji et at., 1998 (M) 4 0.4 0.3-0.5 Ji etal., 1998 (F) 4 0.7 0.5-1.1 Ward & Lopez-Carrillo, 1999 4 0.3 0.1-0.6 EkstrOm etal., 2000 (C) 4 0.5 0.3-1.1 Ekstrém et al., 2000 (N) 4 0.7 0.5-1.0 Mathew etal., 2000 3 1.1 0.2-5.0 De Stefani et al., 2001 3 0.83 0.49-1.43 Chen etal., 2002 4 1.7 0.77-3.7 Kim et al., 2002 3 0.64 0.31-1.32 SUMMARY VALUE VALUE 0.66 0.61-0.71
Heterogeneity test: x2 (22&)=50; p=0.00059
2 4 0.25 0.5 1 Odds ratio
Figure 23 Case-control studies of stomach carcer and vegetable consumption (see Table 25) intestinal type; D = diffuse type; M = males; F = females; C = cardia; N = non-cardia; * = not applicable
71
IARC Handbooks of Cancer Prevention Volume 8: Fruit and Vegetables
studies adjusted for more potential confounders than the cohort studies, particularly for other dietary factors, family antecedents of stomach cancer and socioeconomic status. The use of hospital-based or population-based controls was not a clear indicator of any difference in results. Only a few studies analysed the results by gender and there is very limited information about associations according to histol-ogy or tumour subsite.
The reason why case-control studies were more likely to show inverse associations is not clear. One explanation could be recall bias. Further, people with preclinical symp-toms of stomach carcinoma or stom-ach disorders may change their dietary habits months or years before the diagnosis. In the Netherlands Cohort Study, analyses limited to cases occur-ring in the first year of follow-up revealed a strong inverse association with high combined fruit and vegetable consumption. With these cases excluded, the associations were much closer to the null value. Also stratified analyses (on stomach cancer and veg-etable and fruit consumption com-bined) for subjects with and without stomach disorders revealed a stronger inverse association in subjects with stomach disorders (Botterweck et al., 1998).
Three cohort studies and three case-control studies evaluated combined intake of fruit and vegeta-bles, and in all except one cohort study there were significant inverse associa-tions. The absence of such estimates in other reports could be because the hypotheses were related to particular sub-groups of fruits and vegetables, or perhaps clue to publication bias.
Colon and rectum Because of potential end-point mis-classification between specific colorec-tal subsites, this section focuses on colorectal cancer in toto. Where
reports include separate risk estimates for colon and rectal cancer, these site-specific findings are noted in the accompanying tables.
Fruit Cohort studies Table 28 summarizes data from 12 cohort studies of fruit consumption and colorectal cancer. Results from these studies, conducted in Europe, in the USA and one in Japan, were pub-lished within the last ten years. In only one of these studies (Terry et al., 2001a) is there evidence of a signifi-cant inverse association with fruit consumption.
A pooled analysis of data from 10 cohort studies (many included in Table 28) has so far been reported only in an abstract (Smith-Warner et al., 2002a). The analysis included 4966 cases of colorectal cancer from a total of 533 753 men and women followed for 6-16 years. The pooled multivariate relative risks for the high-est versus lowest quartile of intake of total fruit were 0.94 (95% Cl 0.84-1.04) for colon and 0.96 (0.78-1.17) for rectal cancer.
Case-control studies Table 29 presents data from 21 case-control studies of fruit consump-tion and colorectal cancer, some published nearly two decades ago. These investigations were nearly evenly split between population-based and hospital-based case-control stud-ies. The geographical diversity is somewhat greater than for the cohort studies, some studies having been conducted in Asia, South America and Australia.
The findings are also diverse; only five studies reported significant inverse associations and then often for only one gender, five showed non-signifi-cant inverse associations and for the remainder, the ORs tended to centre around 1.0.
Vegetables Cohort studies Table 30 presents data from 13 cohort studies of vegetable consumption in relation to colorectal cancer. Again, these studies were conducted only within Europe and the USA. For none was a significant inverse association reported between vegetable consump-tion and colorectal cancer (or colon and rectum cancer separately).
A pooled analysis of data from 10 cohort studies (many included data in Table 30) has so far been reported only in an abstract (Smith-Warner et al., 2002a). The analysis included 4968 cases of colorectal cancer from a total of 533 753 men and women followed for 6-16 years. The pooled multivariate relative risks for the high-est versus lowest quartile of intake of total vegetables were 0.95 (95% Cl 0.85-1.05) for colon and 0.93 (0.79-1.10) for rectal cancer.
Case-control studies Data from 27 hospital-based and pop-ulation-based case-control studies of colorectal cancer, published over the last 25 years, are summarized in Table 31. These studies were con-ducted in Asia, Australia and South America, as well as Europe and North America. Significant inverse associa-tions for vegetable consumption were reported in 15 studies, though for some of these the associations were in only one gender, or for colon or rectal cancer. In addition non-significant inverse associations were noted in eight studies.
Combined fruit and vegetables Cohort studies Table 32 presents data from six cohort studies that considered combined fruit and vegetable consumption in relation to colorectal cancer, all conducted within Europe and the USA. In one there were significant inverse associa-tions with colorectal cancer as a whole
72
kajob
Highlight

Cancer-preventive effects
and with rectal cancer (Terry et al., 2001 a), in another with colon cancer in females (Shibata et al., 1992).
Case—control studies Five case—control studies of colorectal cancer have evaluated total fruit and vegetable consumption (Table 33). One found a significant inverse associ-ation for females (Shannon et al., 1996) and another for both sexes com-bined (Deneo-Pellegrini etaL, 2002).
Adenomatous polyps Fruit Cohort study. One cohort study has reported upon fruit consumption and the detection of polyps on endoscopy (Table 34). A significant inverse associ-ation was reported.
Case—control studies. Six case—control studies have considered adenomatous polyps (Table 35); three reported inverse associations with fruit intake. In one small study, there was a significant positive association with hospital con-trols, but not with population controls (Almendingen et al., 2001). [The Working Group was uncertain that the controls in this study were comparable to the cases, in view of the disparity between numbers of cases and con-trols and the much smaller number of controls.]
Vegetables Cohort study. One cohort study reported no association between veg-etable consumption and the detection of polyps on endoscopy (Table 36).
Case—control studies. Six case—control studies of adenomas have evaluated vegetable consumption (Table 37). There were inverse associations in males in one (Smith-Warner et al., 2002b) and in females in another (Sandier et al., 1993), but no clear association was noted in other studies that evaluated risk in both
genders together. In a small study, there was a suggestion of an inverse association in comparison with hospi-tal controls, but not with healthy controls (Almendingen et ai., 2001).
Combined fruit and vegetables Randomized triai. The Polyp Prevention Trial (PPT) was a randomized interven-tion study of the effect of a low-fat, high-fibre, high-fruit and vegetable diet on the recurrence of colorectal adeno-matous polyps in individuals older than 35 years (Schatzkin et al., 2000). Intervention participants increased their intake of fruit and vegetables from 2.05 to 3.41 servings per 1000 kcal energy intake; control participants increased only from 2.00 to 2.23 servings per 1000 kcal. Intervention participants, compared with controls, lowered their fat intake by approximately one third and increased total fibre intake by about 75%. The primary trial result, however, was null: adenoma recurrence rates were virtually identical in the intervention and control groups over a four-year follow-up period (AR = 1.00; 0.90-1.12).
Cohort study. No cohort study has reported upon combined fruit and veg-etable consumption and adenomas.
Case—control studies. One case—control study of adenomas reported non-sig-nificant inverse associations (Table 38).
Discussion Colorectal cancer The evidence for an inverse associa-tion between fruit intake and colorectal cancer is weaker in the cohort studies than in the case—control studies. The small reduction in risk observed in cohort studies is restricted to women. Over the 11 evaluable cohort studies, the mean RA was 1.00 (95% Cl 0.96-1.05), range 0.50-1.60 (Figure
24) and for the nine evaluable case—control studies, the mean OR was 0.87 (95% Cl 0.78-0.97), range 0.30-1.74 (Figure 25). A meta-analysis (Riboli & Norat, 2003) has shown a small statistically significant reduction in risk (per 100 gram increase in daily consumption) for the case—control studies (0.93; 95% Cl 0.87-0.99) and a small non-significant reduction for cohort studies (0.96; 95% Cl 0.90-1.01).
Similarly, the evidence for an inverse association between veg-etable consumption and colorectal cancer is considerably weaker in the cohort studies than in the case—con-trol studies. The mean RA for the 10 evaluable cohort studies was 0.9 (95% Cl 0.85-1.05), range 0.72-1.78 (Figure 26) and for the 13 evaluable case— control studies the mean OR was 0.63 (95% CI 0.56-0.70), range 0.18-1.29 (Figure 27). The meta-analysis showed a substantial reduc-tion in risk (per 100 grams) for the case—control studies (0.87; 95% CI 0.80-0.95) but only a small non-signif-icant reduction in risk (0.96; 95% Cl 0,90-1.05) for the cohort studies (Riboli & Norat, 2003). [If the relation-ship between vegetable consumption and colorectal cancer were linear, the OR of 0.87 per 100 grams of vege-table intake would translate into a risk reduction of approximately 40% for five servings versus one serving of vegetables daily.]
Adenomatous polyps Adenomatous polyps are considered necessary precursor lesions for most large-bowel malignancies (Schatzkin et al., 1994). Both observational and experimental studies of adenomas can thus be informative with respect to eti-ological factors operating in the earlier stages of colorectal carcinogenesis.
The one randomized intervention trial showed no apparent protective effect from an intervention for adeno-
73

No. of Cohort studies categ.
Shibata et al., 1992 (M) 3
Shibata et al., 1992 (F) 3
Steinmetz etaL, 1994 4
Kato et al., 1997 4
Hsing etal., 1998a (CR) 4
Pietirien eta]., 1999 4
Michels etal., 2000 (FC) 5
Michels etal., 2000 (FR) 5
Michels etal., 2000 (M,C) 5
Michels et aI., 2000 (M, R) 5
Voorrips et al., 2000a (MC) 5
Voorrips et al., 2000a (M, R) 5
Voorrips et al., 2000a (FC) 5
Voorrips et al., 2000a (FR) 5
Terry et al., 2001a(CR) 4
Flood et ai., 2002 5
Sauvaget et al., 2003 3
McCullough et ai., 2003 (M, C) 5
McCullough et al., 2003 (F, C) 5
SUMMARY VALUE
Heterogeneity test: x2 (18df) =37; p=0.0046
OR 95% Cl
1.12 0.69-181
0.50 0.31-0.80
0.66 0.58-1.29
1.49 0.82-2.70
1.6 0.9-2.8
1.1 0.8-1.7
0.96 0.89-1.03
0.96 0.83-1.11
1.08 1.00-1.16
1.09 0.94-1.26
1.33 0.90-1.97
0.85 0.55-1.32
0.73 0.48-1.11
0.67 0.34-1.33
0.68 0.52-0.89
1.15 0.86-1.53
0.97 0.73-1.29
1.11 0.76-1.62
0.74 0.47-1.16
100 0.96-1.06
IARC Handbooks of Cancer Prevention Volume 8: Fruit and Vegetables
0.5 1 2 Odds ratio
Figure 24 Cohort studies of colorectal cancer and fruit consumption (see Table 28) M = males; F = females; CR = colorectal; C = colon; R = rectal
matous polyps (see above), However, this trial, in which most of the end-points were small recurrent adenomas, could not rule out the possibility that fruit and vegetable intake operates to prevent the growth of small into large adenomas, or large adenomas into carcinomas. Thus, the null results of this trial do not definitively exclude a protective role for fruit and vegetables against malignant disease of the large bowel.
However, no clear pattern of pro-tection by fruit or vegetables is evident from the case—control studies of col-orectal adenomas. Nevertheless, in the one cohort study that has so far reported data, there was a statistically significant inverse association with fruit consumption.
Limitations of the data
The case—control studies of fruit and vegetables in relation to colorectal can-cer have been carried out over more
than two decades in several countries among both men and women. Although the aggregate risks from these studies suggest that total fruit and total vegetables confer protection against colorectal cancer, the case—control studies taken as a whole reflect considerable heterogeneity in association (Riboli & Norat, 2003).
The most serious problem with the case—control studies, however, is the possibility that recall and selection biases account for the observed asso-
74
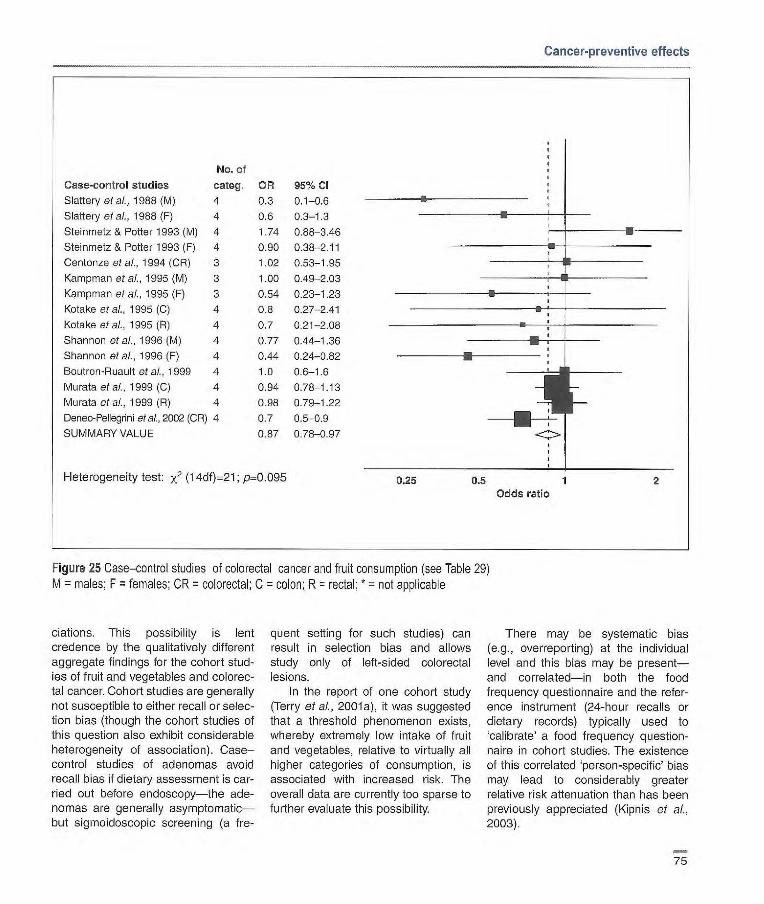
0.25 0.5 1 2
Cancer-preventive effects
No. of
Case-control studies categ.
Slattery et aL, 1988 (M) 4
Slattery et aL, 1988(F) 4
Steinmetz & Potter 1993 (M) 4
Steinmetz & Potter 1993 (F) 4
Centonze etal., 1994 (CR) 3
Kampman etal., 1995 (M) 3
Kampman etal., 1995 (F) 3
Kotake etal., 1995 (C) 4
Kotake etal., 1995 (R) 4
Shannon etal., 1996(M) 4
Shannon of a)., 1996 (F) 4
Boutron-Rusult etal., 1999 4
Murata etal., 1999 (C) 4
Murata etaL,1999(R) 4
Deneo-Pellegrini et al., 2002 (CR) 4
SUMMARY VALUE
Heterogeneity test: x2 (14df)=21; p=0.095
OR 95% Cl
0.3 0.1-0.6
0.6 0.3-1.3
1.74 0.88-3.46
0.90 0.38-2.11
1.02 0.53-1.95
1.00 0.49-2.03
0.54 023-1.23
0.8 027-2.41
0.7 0.21-2.08
0.77 0.44-1.36
0.44 0.24-0.82
1.0 0.6-1.6
0.94 0.78-1.t3
0.98 0.79-122
0.7 0.5-0.9
0.87 0.78-0.97
Odds ratio
Figure 25 Case-control studies of colorectal cancer and fruit consumption (see Table 29) M = males; F = females; OR = colorectal; C = colon; R = rectal; * = not applicable
ciations. This possibility is lent credence by the qualitatively different aggregate findings for the cohort stud-ies of fruit and vegetables and colorec-tal cancer. Cohort studies are generally not susceptible to either recall or selec-tion bias (though the cohort studies of this question also exhibit considerable heterogeneity of association). Case-control studies of adenomas avoid recall bias if dietary assessment is car-ried out before endoscopy—the ade-nomas are generally asymptomatic—but sigmoidoscopic screening (a fre-
quent setting for such studies) can result in selection bias and allows study only of left-sided colorectal lesions.
In the report of one cohort study (Terry of al., 2001a), it was suggested that a threshold phenomenon exists, whereby extremely low intake of fruit and vegetables, relative to virtually all higher categories of consumption, is associated with increased risk. The overall data are currently too sparse to further evaluate this possibility.
There may be systematic bias (e.g., overreporting) at the individual level and this bias may be present—and correlated—in both the food frequency questionnaire and the refer-ence instrument (24-hour recalls or dietary records) typically used to 'calibrate' a food frequency question-naire in cohort studies. The existence of this correlated 'person-specific' bias may lead to considerably greater relative risk attenuation than has been previously appreciated (Kipnis of al.,
2003).
75
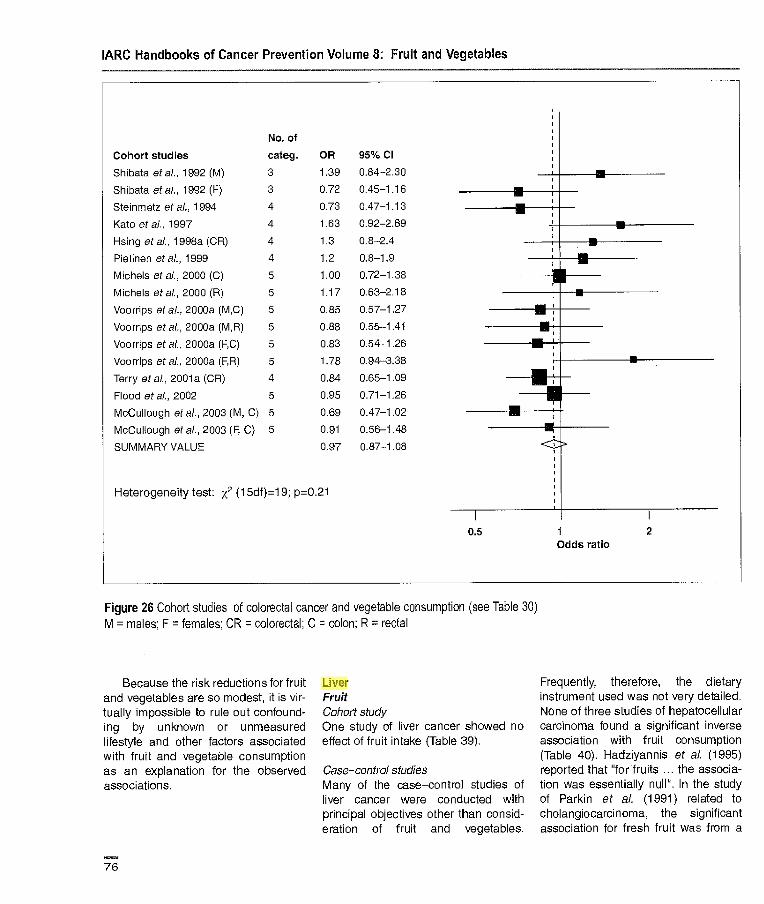
No. of
Cohort studies categ.
Shibata at al., 1992 (M) 3
Shibata at at., 1992 (F) 3
Steinmetz at al., 1994 4
Kato at al., 1997 4
Hsing etaL, 1998a (CR) 4
Piefinen etaL, 1999 4
Michels at ai., 2000 (C) 5
Michels eta]., 2000 (R) 5
Voorrips at al., 2000a (M,C) 5
Voorrips at al., 2000a (M,R) 5
Voorrips at al., 2000a (FC) 5
Voorrips at al. 2000a (F, R) 5
Terry etal., 2001a (CR) 4
Flood at al., 2002 5
McCullough at al., 2003 (M, C) 5
McCullough et al., 2003 (F, C) 5
SUMMARY VALUE
Heterogeneity test: x2 (1 5df)=1 9; p=0.21
OR 95% Cl
1.39 0.84-2.30
0.72 0.45-1.16
0.73 0.47-1.13
1.63 0.92-2.69
1.3 0.8-2.4
1.2 0.8-1.9
1.00 0.72-1.38
1.17 0.63-2.18
0.85 0.57-1.27
0.88 0.55-1.41
0.83 0.54--1.26
1.78 0.94-3.38
0.84 0.65-1.09
0.95 0.71-1.26
0.69 0.47-1.02
0.91 0.56-1.48
0.97 0.87-1.08
IARC Handbooks of Cancer Prevention Volume 8: Fruit and Vegetables
0.5 1 2 Odds ratio
Figure 26 Cohort studies of colorectal cancer and vegetable consumption (see Table 30) M = males; F = females; CR = colorectal; C = colon; R = rectal
Because the risk reductions for fruit and vegetables are so modest, it is vir-tually impossible to rule out confound-ing by unknown or unmeasured lifestyle and other factors associated with fruit and vegetable consumption as an explanation for the observed associations.
Liver Fruit Cohort study One study of liver cancer showed no effect of fruit intake (Table 39).
Case-control studies Many of the case-control studies of liver cancer were conducted with principal objectives other than consid-eration of fruit and vegetables.
Frequently, therefore, the dietary instrument used was not very detailed. None of three studies of hepatocellular carcinoma found a significant inverse association with fruit consumption (Table 40). Hadziyannis et al. (1995) reported that for fruits .. the associa-tion was essentially null". In the study of Parkin et al. (1991) related to cholangiocarcinoma, the significant association for fresh fruit was from a
76
kajob
Highlight

No. of
Case-control studies categ. OR 95% CI
Slattery et al., 1988 (M) 4 0.6 0.3-1.3
Slattery etal., 1988 (F) 4 0.3 0.1-0.9
Young & Wolf, 1988 5 0.72 0.48-1.07
Lee at at, 1989 (CR ) 3 0.69 0.45-1.05
Hu etal., 1991 3 0.18 0.05-0.61
Iscovichi at al., 1992 4 0.075 0.02-0.30
Steinmetz & Potter, 1993 (M) 4 1.29 0.67-2.51
Steinmetz & Potter, 1993 (F) 4 1.11 0.50-2.45
Centonze at al., 1994 (CR) 3 0.51 0.25-1.04
Kampman at al., 1995 (C) 4 0.40 0.23-0.69
Kotake of al., 1995 (C) 4 1.01 0.24-4.22
Kotake at al., 1995 (R) 4 0-5 0.12-1.96
Shannon at al., 1996 (M) 4 018 0.45-1.35
Shannon at at, 1996 (F) 4 0.51 128-0.93
Boutron-Ruault at al., 1999 4 01 0.4-1.3
La Vecchia at al., 1999 (M) 3 0.74 0.59-0.91
La Vecchia at al., 1999 (F) 3 0.43 0.32-0.56
Deneo-Pellegrini etal., 2002 (CR) 4 0.7 0.5-0.9
SUMMARY VALUE 0.63 0.56-0.70
Heterogeneity test: x2 (1 7df)=37; p=0.0038
Cancer-preventive effects
0.1 0.25 0.5 1 2 4 Odds ratio
Figure 27 Case—control studies of colorectal cancer and vegetable consumption (see Table 31) M = males; F = females; CR = colorectal cancer; C = colon; R = rectal
univariate analysis; when included in a multivariate model with all other food items, the association was no longer significant.
Vegetables Cohort studies The largest of the three cohort studies (Table 41), that of Hirayama (1990), included only limited information on
diet, and for the class of vegetables, only frequency of consumption of green-yellow vegetables. Death from liver cancer was the end-point. [The Working Group noted that it is not clear whether all of these were from hepato-cellular carcinoma].
The study of Yu et al. (1995) was a full cohort analysis of vegetable con-sumption, previously reported as a
nested case—control study by Yu et al. (1993). Yu et al. (1995) noted that the inverse association for vegetable consumption appeared to be restricted to carriers of hepatitis B surface antigen (HBsA9) [RR 0.21, 0.09-0.50] and ciga-rette smokers [0.26, 0.12-0.591.
In the study of Sauvaget et al. (2003), green-yellow vegetable con-sumption was associated with a
77
IARC Handbooks of Cancer Prevention Volume 8: Fruit and Vegetables
significant reduction in liver cancer mortality.
Case controlstudies Six case—control studies have reported data, two with significant inverse associations for vegetable consump-tion (Table 42). No numerical data were reported in the study of Fukuda et al. (1993), which was primarily designed to evaluate viral risk factors for hepatocefular carcinoma. How-ever, the authors appear to have con-sidered only mean consumption levels of fresh and green-yellow vegetables, and these were said to be similar for cases and controls. Similarly, Hadziyannis et al. (1995) reported that for ... vegetables, the association was
essentially null.
Combined fruit and vegetables Cohort studies No studies were identified by the Working Group.
Case—control studies Only one study assessed the combina-tion of fruit and vegetables, with an inverse association reported in both males and females (Table 43).
Discussion Consumption of total fruit was not significantly associated with liver can-cer, in either cohort or case—control studies. Consumption of total vegeta-bles was significantly inversely associ-ated with liver cancer only in one cohort study.
Biliary tract Fruit Cohort study One cohort study has reported that there was no significant association between fruit consumption and gall-bladder cancer (Table 44).
Case—control studies No studies were identified by the Working Group.
Vegetables Cohort studies Hirayama (1990) tabulated gallbladder cancer as one of the end-points, but in the table in the section devoted to dietary factors, it is linked to bile-duct cancer. It is unclear whether the numbers of cases cited in Table 45 include bile-duct cancer. Comparison of daily with less frequent consumption of vegetables revealed no association. The study of Sauvaget et al. (2003) did not show any significant associa-tion.
Case—control studies No studies were identified by the Working Group.
Combined fruit and vegetables Case—control study One case—control study has been reported of fruit and vegetable con-sumption and biliary tract cancer. The results were presented separately for gallbladder and bile duct cancer, and data for gallbladder cancer are summarized in Table 48. For bile-duct cancer, there were inverse associa-tions for fruits, lettuce/cabbage, green-yellow vegetables and other vegeta-bles in the univariate analysis, but these did not persist in the multivariate analysis.
Discussion The available studies of biliary tract cancer in relation to fruit and vegetable consumption are too few to allow any conclusion to be drawn.
Pancreas Fruit Cohort studies Of six cohort studies on diet and pan-creas cancer, four used death from pancreas cancer as end-point and
none found a significant inverse association with fruit consumption (Table 47). That of Mills et al. (1988) did not evaluate fruit consumption per se, but did report a protective effect of high consumption of vegetarian protein products, including raisins, dates and dry fruit. Zheng et aI. (1993) provided no numerical data on risks for fruit consumption but reported that fruit consumption showed no clear associa-tion with pancreatic cancer risk.
Case—control studies Many of the studies reported used proxy interviews for dead cases. For the few that used only direct interviews (with consequent exclusion of many cases who died within a short period), this is indicated in the comments section of Table 48. Eight of the 13 studies reported inverse associations for estimated fruit intake, one also for citrus fruit.
Farrow & Davis (1990), however, while reporting no numerical data, indi-cated that cases and controls did not differ with respect to total intake of all fruit or citrus fruit. Howe et al. (1990) also reported negative findings for associations with fruit consumption, on the basis of a model that included fibre, but they reported a significant protective effect of estimated intake of fibre (HR 0.38 for 28 g/d of fibre from fruit). This study had been designed to obtain estimates of effects of nutrients, rather than of food groups.
The studies of Howe et al. (1990), Baghurst et al. (1991) and Bueno de Mesquita et al. (1991) were part of the IARC multi-country SEARCH pro-gramme, designed to evaluate associ-ations using similar protocols in several different countries, also includ-ing studies in Montreal, Canada and Poland, that did not report specifically on fruit and vegetable intake. Howe et al. (1992) reported a combined analysis of these studies, with a total of 802 cases and 1669 controls. Like the
78
kajob
Highlight
kajob
Highlight
Cancer-preventive effects
study of Howe of al. (1990), the analysis was primarily related to nutrients. However, the authors com-ment that the results provide strong evidence of an inverse association of pancreas cancer with markers of fruit intake, particularly dietary fibre and vitamin C. The AR for the highest ver-sus lowest quintile of vitamin C intake was 0.55 (95% Cl 0.39-078) in a model that included all nutrient vari-ables and lifetime cigarette consump-tion.
Vegetables Cohort studies Of the six cohort studies with data on vegetable consumption and pancreas cancer, none found a significant inverse association (Table 49). Mills et al. (1988) did not evaluate vegetable consumption per se, but did report a protective effect of high consumption of vegetarian protein products (beans, lentils or peas). Zheng et al. (1993) provided no numerical data on risks for vegetable consumption but reported that consumption of vegetables showed no clear association with pancreatic cancer risk.
Case—control studies Many of the studies have used proxy interviews for dead cases. For the few that used only direct interviews (with consequent exclusion of many cases who died within a short period), this is indicated in the comments section of Table 50.
Seven of the 13 studies found pro-tective effects for estimated intake of vegetables. Some found significant associations only for cruciferous veg-etables or carrots. Farrow & Davis (1990), however, while reporting no numerical data, indicated that apart from a non-significant higher con-sumption of green and yellow vegeta-bles by cases, cases and controls did not differ with respect to their total
intake of all vegetables and raw veg-etables. Howe et ai. (1990) also reported negative findings for associa-tions with vegetable consumption, on the basis of a model that included fibre, and they reported a significant protective effect of estimated intake of fibre (RA = 0.56 for 28 gld of fibre from vegetables). This study had been designed to obtain estimates of effects of nutrients, rather than of food groups.
Baghurst et aI. (1991) reported no numerical estimates of associations for vegetables, but indicated that cases consumed significantly less of a number of vegetables than controls.
The studies of Howe et al. (1990), Aaghurst et al. (1991) and Bueno de Mesquita et al. (1991) were part of the ARC multi-country SEARCH pro-gramme, designed to evaluate associ-ations using similar protocols in several different countries, also includ-ing studies in Montreal, Canada and Poland, that did not report specifically on f ru[t and vegetable intake. Howe et al. (1992) reported a combined analy-sis of these studies, with a total of 802 cases and 1669 controls. Like the study of Howe et al. (1990), the analy-sis was primarily related to nutrients. However, the authors comment that the results provide strong evidence' of an inverse association of pancreas cancer with several markers of vege-table intake, particularly dietary fibre. The AR for the highest versus lowest quintile of dietary fibre intake was 0.50 (0.34-0.72) in a model that included all nutrient variables and lifetime cigarette consumption.
Combined fruit and vegetables Case—control studies Two case—control studies have been reported with estimates of risk for com-bined fruit and vegetable consumption (Table 51). Both showed inverse asso-ciations.
Discussion Six case—control studies on fruit con-sumption and pancreas cancer were evaluable. The mean OR was 0.72 (95% CI 0.63-0.83), range 0.07-0.92 (Figure 28). The mean OR for the five evaluable case—control studies of vegetable con-sumption was 0.80 (95% Cl 0.69-0.93), range 0.32-1 .03 (Figure 29).
Although inverse associations for fruit or vegetable consumption were seen in many case—control studies, these have largely not been replicated in the cohort studies. There has to be some concern over the mainly inverse associations with fruit and or vegeta-bles found in many of the case—control studies when the response rates for controls were low. It is possible that responders are more likely to be health-conscious than non-responders and thus tend to eat more fruit and vegetables. Selection bias is also pos-sible if the case series was restricted to those subjects still alive at the time of interview. In the two largest individ-ual case—control studies, only living cases were interviewed. This involved many more exclusions in the study of Silverman et al. (1998) conducted in the USA than in that of Ji et al. (1995) conducted in China. Whether this accounts for the difference between the largely negative findings of Silverman etal. (1998) and the signifi-cant association in men for fruit in the study of Ji et al. (1995) is uncertain.
Larynx Fruit Cohort studies No studies were identified by the Working Group.
Case—control studies The ten case—control studies on total fruit intake in relation to larynx cancer risk (Table 52) all included men and some also included women. The majority of the studies were hospital-based.
79
kajob
Highlight
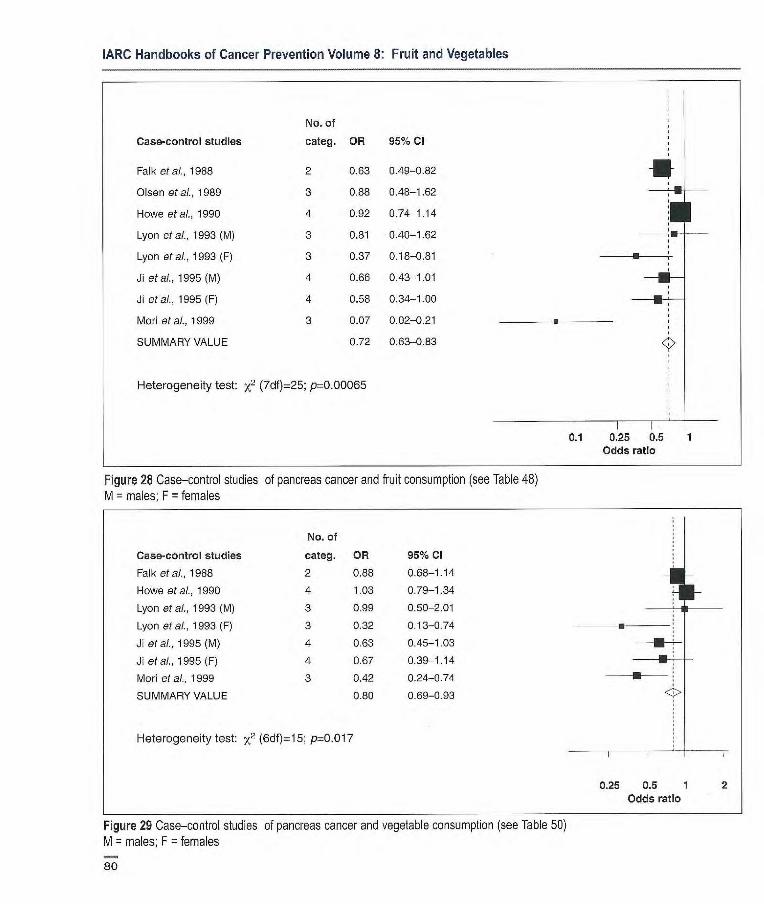
IARC Handbooks of Cancer Prevention Volume 8: Fruit and Vegetables
No. of
Case-control studies categ. OR 95% CI
Falk etal., 1988 2 0.63 0.49-0.82
Olsen etal., 1989 3 0.88 048-1.62
Howe etal., 1990 4 0.92 0.74-1.14 I I Lyon etal., 1993 (M) 3 0.81 0.40-1.62
Lyon at al., 1993 (F) 3 0.37 0.18-0.81
Ji etal., 1995 (M) 4 0.66 0.43-1.01
Ji etal., 1995 (F) 4 0.58 0.34-1.00
Mod etal., 1999 3 0.07 0.02-0.21
SUMMARY VALUE 0.72 0.63-0.83
Heterogeneity test: x2 (7df)=25; p=0.00065
0.1 0.25 0.5 Odds ratio
Figure 28 Case-control studies of pancreas cancer and fruit consumption (see Table 48) M = males; F = females
No. of
Case-control studies categ. OR 95% CI
Falk etal., 1988 2 0.88 0.68-1.14
Howe etal., 1990 4 1.03 0.79-1.34 LI Lyon eta]., etal., 1993 (M) 3 0.99 0.50-2.01
Lyon etal., 1993 (F) 3 0.32 0.13-0.74
Ji etal., 1995 (M) 4 0.63 0.45-1.03 •--
W etal., 1995 (F) 4 0.67 0.39-1.14 -
Mori at al., 1999 3 0.42 0.24-0.74
SUMMARY VALUE 0.80 0.69-0.93
Heterogeneity test: x2 (6df)=15; p=0.017
0.25 0.5 1 2 Odds ratio
Figure 29 Case-control studies of pancreas cancer and vegetable consumption (see Table 50)
M = males; F = females
80

Cancer-preventive effects
Most studies used a food fre-quency questionnaire to measure dietary intake, while one study used a diet history interview. The total number of measured food items varied widely between studies, as did the number of fruit items. This implies that very differ-ent numbers of fruits may be included in the category labelled total fruit'. Several reports do not state what is included under '(total) fruit'.
Almost all studies controlled for confounding by smoking (in different ways and detail) and alcohol, except three (De Stefani etal., 1987; Zheng et al., 1992b; Guo etal., 1995).
The (extreme) contrasts in intake of fruits considered were most often high versus low intake, based on tertiles or quartiles of intake.
All case—control studies showed inverse associations between intake of total fruit and risk of larynx cancer, with ORs for high versus low intake varying between 0.3 and 0.8. Although some studies did not show significant associ-ations, the overall pattern of the case—control studies is of a consistent inverse association between total intake of fruit and risk of larynx cancer.
Only one study investigated these associations within subgroups of smoking, age and alcohol, or of supra-glottis versus epiglottis and other sub-sites (bosetti et al., 2002a). The observed ORs were weaker in the sub-groups.
Vegetables Cohort studies No studies were identified by the Working Group.
Case—control studies Nine case—control studies have reported on intake of (total) vegetables in relation to larynx cancer risk (Table 53). These studies all included men, and some also included women. The majority of the studies were hospital-based.
Most studies used a food fre-quency questionnaire to measure dietary intake, while one study used a diet history interview. The total number of measured food items varied widely between studies, as did the number of vegetable items. Not all studies reported the number of items but for the ones that did, the number of veg-etable items varied up to 26. This implies that very different numbers of vegetables may be included in the category labelled total vegetables'.
Almost all studies controlled for confounding by smoking (in different ways and detail) and alcohol, except three (De Stetani et al., 1987; Zheng et al., 1992b; Guo etal., 1995).
All except one of the studies found inverse associations between intake of total vegetables and risk of larynx cancer, with ORs for high versus low intake varying between 0.17 and 0.9. Although most of the studies did not show significant associations, the overall pattern of the case—control studies is of a consistent inverse asso-ciation between total intake of vegeta-bles and risk of larynx cancer.
Only one study investigated these associations within subgroups of smoking, age and alcohol, or supra-glottis versus epiglottis and other sub-sites (Bosetti et al., 2002a). No differ-ent ORs were found, however.
Combined fruit and vegetables Cohort study In one cohort study in the USA on upper aerocligestive tract cancer (Kasum et al., 2002), a non-significant inverse association of larynx cancer with intake of vegetables and fruits was mentioned, but no data were shown.
Case—control studies In two case—control studies, there were significant inverse associations between combined fruit and vegetable intake and larynx cancer risk (Table 54).
Discussion Only case—control studies on larynx cancer were available for evaluation. These studies were conducted in Europe, Asia and South America. For four evaluable case—control studies with total fruit, the mean OR was 0.63 (95% Cl 0.52-0.77), range 0.38-0.80 (Figure 30). For four evaluable studies with vegetable consumption, the mean OR was 0.49 (95% Cl 0.40-061), range 0.17-1.1 (Figure 31).
Control for smoking was rather crude and incomplete in the early stud-ies; more recent studies have used more elaborate models and still observed inverse associations with fruit and vegetable intake. Only one study addressed associations between fruit and vegetables and larynx cancer in subgroups of smoking and alcohol intake. ORs for fruit became weaker in these subgroups, which might indicate residual confounding by smoking and alcohol. The possibility of recall and selection bias in the case—control stud-ies cannot be excluded.
Lung Fruit Cohort studies A total of 16 cohort studies have been reported on fruit intake and risk of lung cancer and in addition, results are available from a pooled analysis of primary data from eight cohort studies (Table 55).
Six studies used mortality from lung cancer as the end-point. Follow-up times ranged from 4 to 25 years. All but two studies used a self-adminis-tered food frequency questionnaire to measure dietary intake. The number of fruit items varied up to 23. The considered contrasts in fruit intake also varied considerably between stud-ies. All but one study (Wang & Hammond, 1985) corrected for possible confounding by smoking (often in more detail than in the case—control studies), as well as
81
kajob
Highlight
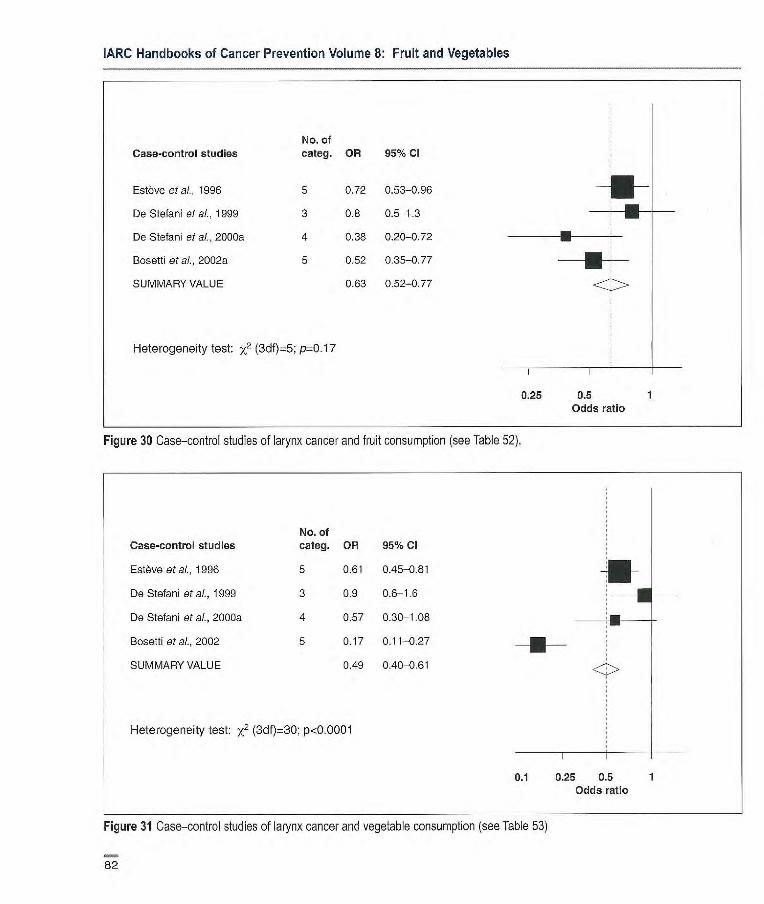
No. of Case-control studies categ. OR 95% Cl
Estève eta)., 1996 5 0.61 0.45-0.81
De Stefani etal., 1999 3 0.9 0.6-1.6
De Stetani et al., 2000a 4 0.57 0.30-1.08
Bosetti etal., 2002 5 0.17 0.11-0.27
SUMMARY VALUE 0.49 0.40-0.61
Heterogeneity test: x2 (3df)=30; p<0.0001
IARC Handbooks of Cancer Prevention Volume 8: Fruit and Vegetables
No. of Case-control studies categ. OR 95% CI
Estève et al., 1996 5 0.72 0.53-0.96
De Stefani of al., 1999 3 0.8 0.5-1.3
De Stefani et al., 2000a 4 0.38 0.20-0.72 E -
Bosetti eta)., 2002a 5 0.52 0.35-0.77
SUMMARY VALUE 0.63 0.52-0.77
Heterogeneity test: x2 (3df)=5; p-0. 17
0.25 0.5 Odds ratio
Figure 30 Case-control studies of larynx cancer and fruit consumption (see Tabla 52).
0.1 0.25 0.5 Odds ratio
Figure 31 Case-control studies of larynx cancer and vegetable consumption (see Table 53)
82
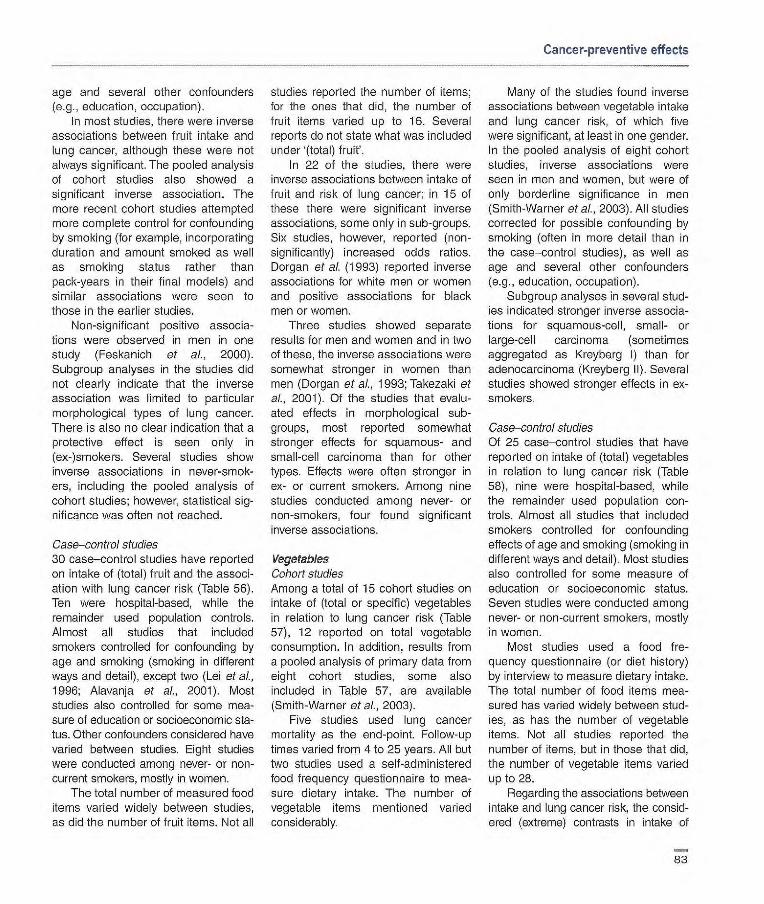
Cancer-preventive effects
age and several other confounders (e.g., education, occupation).
In most studies, there were inverse associations between fruit intake and lung cancer, although these were not always significant. The pooled analysis of cohort studies also showed a significant inverse association. The more recent cohort studies attempted more complete control for confounding by smoking (for example, incorporating duration and amount smoked as well as smoking status rather than pack-years in their final models) and similar associations were seen to those in the earlier studies.
Non-significant positive associa-tions were observed in men in one study (Feskanich et al., 2000). Subgroup analyses in the studies did not clearly indicate that the inverse association was limited to particular morphological types of lung cancer. There is also no clear indication that a protective effect is seen only in (ex-)smokers. Several studies show inverse associations in never-smok-ers, including the pooled analysis of cohort studies; however, statistical sig-nificance was often not reached.
Case—control studies 30 case—control studies have reported on intake of (total) fruit and the associ-ation with lung cancer risk (Table 56). Ten were hospital-based, while the remainder used population controls. Almost all studies that included smokers controlled for confounding by age and smoking (smoking in different ways and detail), except two (Lei et al., 1996; Alavanja et at, 2001). Most studies also controlled for some mea-sure of education or socioeconomic sta-tus. Other confounders considered have varied between studies. Eight studies were conducted among never- or non-current smokers, mostly in women.
The total number of measured food items varied widely between studies, as did the number of fruit items. Not all
studies reported the number of items; for the ones that did, the number of fruit items varied up to 16. Several reports do not state what was included under '(total) fruit'.
In 22 of the studies, there were inverse associations between intake of fruit and risk of lung cancer; in 15 of these there were significant inverse associations, some only in sub-groups. Six studies, however, reported (non-significantly) increased odds ratios. Dorgan et at. (1993) reported inverse associations for white men or women and positive associations for black men or women.
Three studies showed separate results for men and women and in two of these, the inverse associations were somewhat stronger in women than men (Dorgan et at., 1993; Takezaki et aI., 2001). Of the studies that evalu-ated effects in morphological sub-groups, most reported somewhat stronger effects for squamous- and small-cell carcinoma than for other types. Effects were often stronger in ex- or current smokers. Among nine studies conducted among never- or non-smokers, four found significant inverse associations.
Vegetables Cohort studies Among a total of 15 cohort studies on intake of (total or specific) vegetables in relation to lung cancer risk (Table 57), 12 reported on total vegetable consumption. In addition, results from a pooled analysis of primary data from eight cohort studies, some also included in Table 57, are available (Smith-Warner et al., 2003).
Five studies used lung cancer mortality as the end-point. Follow-up times varied from 4 to 25 years. All but two studies used a self-administered food frequency questionnaire to mea-sure dietary intake. The number of vegetable items mentioned varied considerably.
Many of the studies found inverse associations between vegetable intake and lung cancer risk, of which five were significant, at least in one gender. In the pooled analysis of eight cohort studies, inverse associations were seen in men and women, but were of only borderline significance in men (Smith-Warner et aI., 2003). All studies corrected for possible confounding by smoking (often in more detail than in the case—control studies), as well as age and several other confounders (e.g., education, occupation).
Subgroup analyses in several stud-ies indicated stronger inverse associa-tions for squamous-cell, small- or large-cell carcinoma (sometimes aggregated as Kreyberg I) than for adenocarcinoma (Kreyberg II). Several studies showed stronger effects in ex-smokers.
Case—control studies Of 25 case—control studies that have reported on intake of (total) vegetables in relation to lung cancer risk (Table 58), nine were hospital-based, while the remainder used population con-trols. Almost all studies that included smokers controlled for confounding effects of age and smoking (smoking in different ways and detail). Most studies also controlled for some measure of education or socioeconomic status. Seven studies were conducted among never- or non-current smokers, mostly in women.
Most studies used a food fre-quency questionnaire (or diet history) by interview to measure dietary intake. The total number of food items mea-sured has varied widely between stud-ies, as has the number of vegetable items. Not all studies reported the number of items, but in those that did, the number of vegetable items varied up to 28.
Regarding the associations between intake and lung cancer risk, the consid-ered (extreme) contrasts in intake of
83
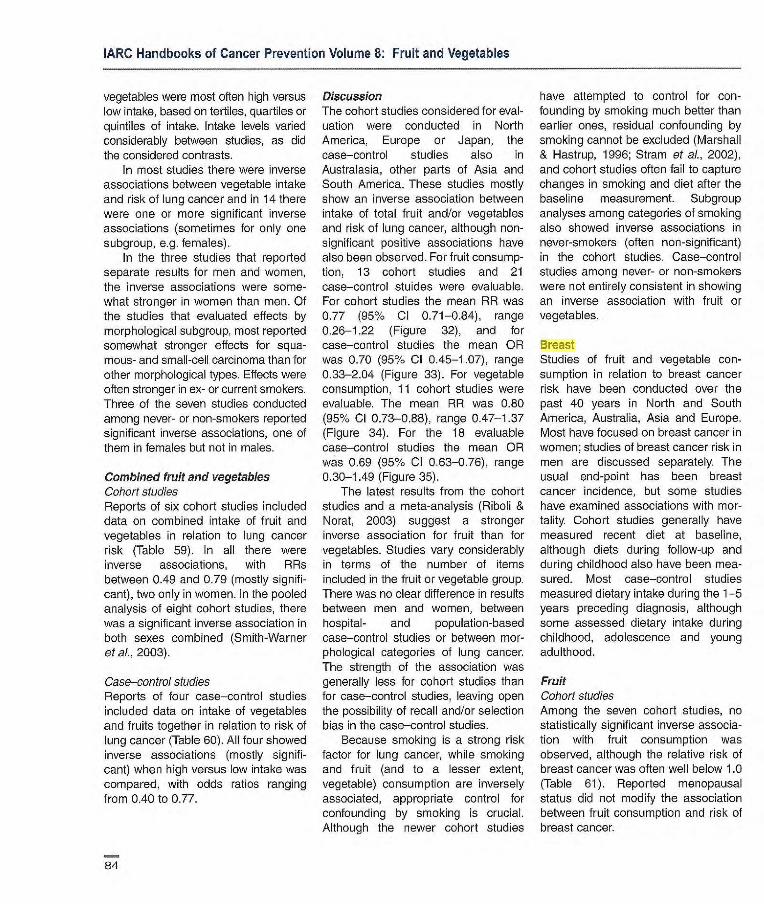
IARC Handbooks of Cancer Prevention Volume 8: Fruit and Vegetables
vegetables were most often high versus low intake, based on tertiles, quartiles or quintiles of intake. Intake levels varied considerably between studies, as did the considered contrasts.
In most studies there were inverse associations between vegetable intake and risk of lung cancer and in 14 there were one or more significant inverse associations (sometimes for only one subgroup, e.g. females).
In the three studies that reported separate results for men and women, the inverse associations were some-what stronger in women than men. Of the studies that evaluated effects by morphological subgroup, most reported somewhat stronger effects for squa-mous- and small-cell carcinoma than for other morphological types. Effects were often stronger in ax- or current smokers. Three of the seven studies conducted among never- or non-smokers reported significant inverse associations, one of them in females but not in males.
Combined fruit and vegetables Cohort studies Reports of six cohort studies included data on combined intake of fruit and vegetables in relation to lung cancer risk (Table 59). In all there were inverse associations, with ARs between 0.49 and 0.79 (mostly signifi-cant), two only in women. In the pooled analysis of eight cohort studies, there was a significant inverse association in both sexes combined (Smith-Warner et al., 2003).
Case—control studies Reports of four case—control studies included data on intake of vegetables and fruits together in relation to risk of lung cancer (Table 60). All four showed inverse associations (mostly signifi-cant) when high versus low intake was compared, with odds ratios ranging from 0.40 to 0.77.
Discussion The cohort studies considered for eval-uation were conducted in North America, Europe or Japan, the case—control studies also in Australasia, other parts of Asia and South America. These studies mostly show an inverse association between intake of total fruit and/or vegetables and risk of lung cancer, although non-significant positive associations have also been observed. For fruit consump-tion, 13 cohort studies and 21 case—control stuides were evaluable. For cohort studies the mean AR was 0.77 (95% Cl 0.71-084), range 0.26-122 (Figure 32), and for case—control studies the mean OR was 0.70 (95% Cl 0.45-1.07), range 0.33-2.04 (Figure 33). For vegetable consumption, 11 cohort studies were evaluable. The mean AR was 0.80 (95% Cl 0.73-0.88), range 0.47-1.37 (Figure 34), For the 18 evaluable case—control studies the mean OR was 0.69 (95% Cl 0.63-0.76), range 0.30-1.49 (Figure 35).
The latest results from the cohort studies and a meta-analysis (Riboli & Norat, 2003) suggest a stronger inverse association for fruit than for vegetables. Studies vary considerably in terms of the number of items included in the fruit or vegetable group. There was no clear difference in results between men and women, between hospital- and population-based case—control studies or between mor-phological categories of lung cancer. The strength of the association was generally less for cohort studies than for case—control studies, leaving open the possibility of recall and/or selection bias in the case—control studies.
Because smoking is a strong risk factor for lung cancer, while smoking and fruit (and to a lesser extent, vegetable) consumption are inversely associated, appropriate control for confounding by smoking is crucial. Although the newer cohort studies
have attempted to control for con-founding by smoking much better than earlier ones, residual confounding by smoking cannot be excluded (Marshall & Hastrup, 1996; Stram et al., 2002), and cohort studies often fail to capture changes in smoking and diet after the baseline measurement. Subgroup analyses among categories of smoking also showed inverse associations in never-smokers (often non-significant) in the cohort studies. Case—control studies among never- or non-smokers were not entirely consistent in showing an inverse association with fruit or vegetables.
Breast Studies of fruit and vegetable con-sumption in relation to breast cancer risk have been conducted over the past 40 years in North and South America, Australia, Asia and Europe. Most have focused on breast cancer in women; studies of breast cancer risk in men are discussed separately. The usual end-point has been breast cancer incidence, but some studies have examined associations with mor-tality. Cohort studies generally have measured recent diet at baseline, although diets during follow-up and during childhood also have been mea-sured. Most case—control studies measured dietary intake during the 1-5 years preceding diagnosis, although some assessed dietary intake during childhood, adolescence and young adulthood.
Fruit Cohort stud/es Among the seven cohort studies, no statistically significant inverse associa-tion with fruit consumption was observed, although the relative risk of breast cancer was often well below 1.0 (Table 61). Reported menopausal status did not modify the association between fruit consumption and risk of breast cancer.
84
kajob
Highlight
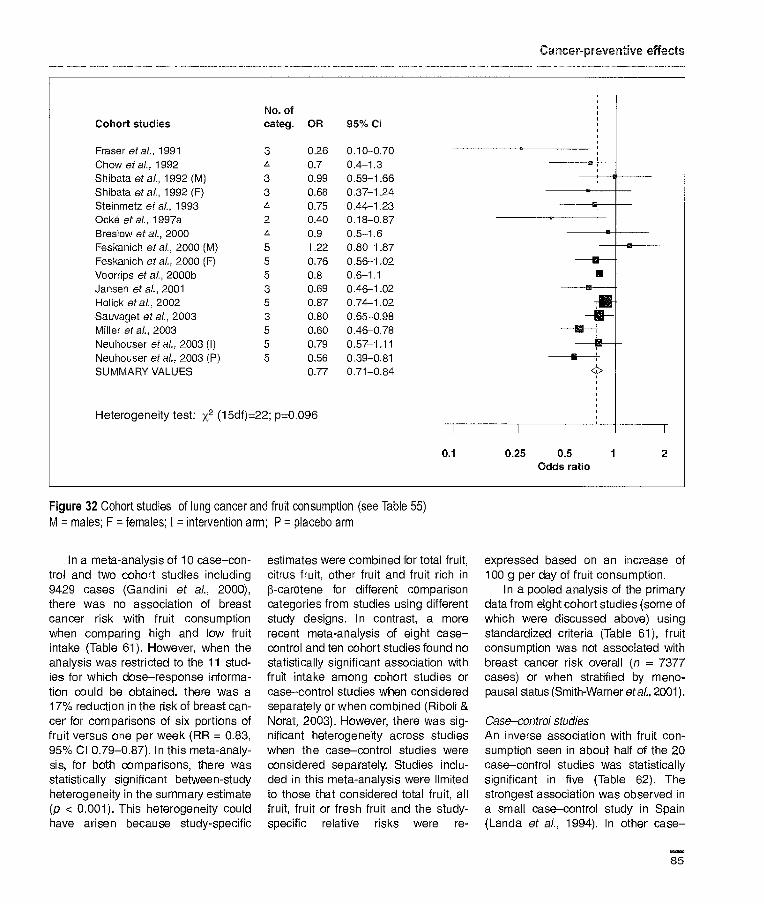
No. of Cohort studies categ. OR 95% CI
Fraser at at., 1991 3 0.26 0.10-0.70 Chow etal., 1992 4 0.7 0.4-1.3 Shibata etal., 1992 (M) 3 0.99 0.59-1.66 1
11
Shibata etal., 1992 (F) 3 0.66 0.37-124 -+-.- — Steinmetz at al., 1993 4 0.75 0.44-1.23 — Ocké eta?., 1997a 2 OAO 0.18-0.87 Breslow at al., 2000 4 0.9 0.5-1.6 Feskanich eta?., 2000 (M) 5 1.22 0.80-1.87 Feskanich eta?., 2000 (F) 5 0.76 0.56-1.02 19
Voorrips at al., 2000b 5 0.8 0.6-1.1 Jansen et a?., 2001 3 0.69 0.46-1.02 Holick etal., 2002 5 0.87 0.74-1.02 $ Sauvaget eta?., 2003 3 0.80 0.65-0.98 Miller at al., 2003 5 0.60 0.46-0.78 Neuhouser et al., 2003 (I) 5 0.79 0.57-1.11 —p--- - Neuhouser eta?., 2003 (P) 5 0.56 0.39-0.81 -.-+ SUMMARY VALUES 0.77 0.71-0.84 4>
Heterogeneity test: x2 (15df)22; p=0.096 I I I
_
0.1 025 0.5 1 2 Odds ratio
Figure 32 Cohort studies of lung cancer and fruit consumption (see Table 55) M = males; F = females; I = intervention arm; P = placebo arm
In a meta-analysis of 10 case-con-trol and two cohort studies including 9429 cases (Gandini et al., 2000), there was no association of breast cancer risk with fruit consumption when comparing high and low fruit intake (Table 61). However, when the analysis was restricted to the 11 stud-ies for which dose-response informa-tion could be obtained, there was a 17% reduction in the risk of breast can-cer for comparisons of six portions of fruit versus one per week (RR = 0.83, 95% Cl 0.79-0.87). In this meta-analy-sis, for both comparisons, there was statistically significant between-study heterogeneity in the summary estimate (p < 0.001). This heterogeneity could have arisen because study-specific
estimates were combined for total fruit, citrus fruit, other fruit and fruit rich in 13-carotene for different comparison categories from studies using different study designs. In contrast, a more recent meta-analysis of eight case-control and ten cohort studies found no statistically significant association with fruit intake among cohort studies or case-control studies when considered separately or when combined (Riboli &
Norat, 2003). However, there was sig-nificant heterogeneity across studies when the case-control studies were considered separately. Studies inclu-ded in this meta-analysis were limited to those that considered total fruit, all fruit, fruit or fresh fruit and the study-specific relative risks were re-
expressed based on an increase of 100 g per day of fruit consumption.
In a pooled analysis of the primary data from eight cohort studies (some of which were discussed above) using standardized criteria (Table 61), fruit consumption was not associated with breast cancer risk overall (n = 7377 cases) or when stratified by meno-pausal status (Smith-Warner eta?., 2001).
Case-control studies
An inverse association with fruit con-sumption seen in about half of the 20 case-control studies was statistically significant in five (Table 62). The strongest association was observed in a small case-control study in Spain (Landa et al., 1994). In other case-
85

IARC Handbooks of Cancer Prevention Volume 8; Fruit and Vegetables
No. of Case-control studies categ. OR 95°J Cl
Fontharn et at, 1988 3 0.66 0.54-0.82 -- Kalandidi etal., 1990 4 0.33 0.13-0.68 Candelora etal., 1992 4 0.8 0.3-1.1 • : - Forman etal., 1992 4 1.10 0.57-2.08 : Dorgan et al., 1993 (WM) 3 0.95 0.70-1.30 ___E_ Dorgan et al., 1993 (WF) 3 0.56 0.40-0.79 Dorgan etal., 1993 (BM) 3 2.04 1.11-3.70 I
Dorgan et aI., 1993 (BF) 3 1.30 0.44-3.85 Gao etal., 1993 3 0.45 0.30-0.67 Suzuki etal., 1994 3 1.2 0.4-3.1 Axeisson etal., 1996 3 0.73 0.43-1.23 'u - Xu et al., 1996 4 0.6 0.5-0.9 Hu etal., 1997 4 0.7 0.4-1.2 f - Ko etal., 1997 2 1.0 0.5-1.7 4
Pawlega et al., 1997 3 0.42 023-0.77 Pillow etal., 1997 * 0.56 0.31-0.99 Nyberg etal., 1998 3 0.67 0.33-1.36 - Brennan et al., 2000 3 1.09 0.6-1.5 Takezaki etal., 2001 (MA) 4 0.98 0.61-1.58 I
Takezaki etal., 2001 (M,S) 4 0.61 0.40-0.95 Takezaki et al., 2001 (FA) 4 0.68 0.27-1,70 Takezaki etal., 2001 (FS) 4 0.49 0.11-2.13 De Stefani etal., 2002 4 0.84 0.62-1.13 - Kreuzer etal., 2002 3 0.66 0.37-1.19 • - Marchand etal., 2002 (M) 3 0.7 0.4-1.5 Rachtan, 2002a 2 0.49 0.32-0.74 Seow etal., 2002 (Sm) 3 0.63 0.28-1.44 Seow et al., 2002 (NonSm) 3 0.60 0.39-0.93 U SUMMARY VALUE 0.70 0.45-1.07
Heterogeneity test: x2 (27df)=45; p=0.015 I I 0.1 0.25 0.5 1 2 4
Odds ratio
Figure 33 Case-control studies of lung cancer and fruit consumption (see Table 56) W = white; B = black; M = males, F = females; A = adenocarcinoma; S = squamous and smai cell carcinoma; Sm = smokers; NonSm = non smokers; t = not applicable
control studies, the relative risks have shown no more than a 10% increase or decrease in the risk of breast cancer for comparisons of high versus low consumption. A few studies have reported in the text that fruit consump-tion was not associated with the risk of breast cancer. In a Swedish case-control study, the OR was elevated in women over 50 years of age but not
associated with breast cancer risk in women 50 years and younger (Holmberg et aI., 1994). The test for effect modification by age group was not statistically significant. A similar pattern was observed in a Russian case-control study (Zaridze et
aI., 1991).
Vegetables Cohort studies Among the seven cohort studies (Table 63), a statistically significant inverse association with vegetable consump-tion was observed only in the Nurses' Health Study when the analysis was limited to premenopausal breast can-cer (Zhang et al., 1999). When only postmenopausal women who were
86

Cancer-preventive effects
No. of Cohort studies categ. OR 95% Cl
Chow et al., 1992 4 1.2 0.6-2.3
Shibata et al., 1992 (M) 3 1.37 0.74-2.25
Shibata et al., 1992 (F) 3 0.58 0.32-1.05 • Steinmetz eta)., 1993 4 0.50 0.29-0.67 Ocké eta)., 1997 2 0.47 0.21-1.03 • Breslow etal., 2000 4 0.9 0.5-1.5 Feskarich et ai., 2000 (M) 5 1.04 0.69-1.57 ---- Feskanich eta)., 2000 (F) 5 0.68 0.51-0.90 Voo4ps etal., 2000b 5 0.7 0.5-1.0
Jansen eta)., 2001 3 0.90 0.61-1.33 Holick et al., 2002 5 0.75 0.63-0.88 Miller et al.. 2003 5 1.00 0.76-1.30
Neibouser et at, 2003 (I) 5 0.81 0.65-1.21
Neubouser et al., 2003 (P) 5 0.82 0.59-1.14 - SUMMARY VALUE 0.80 0.73-0.88
Heterogeneity test: x2 (13df)=18; p=0.16
0.25 0.5 1 2 Odds ratio
Figure 34 Cohort studies of lung cancer and vegetable consumption (see Table 57) M = males; F = females; I = intervention arm; P = placebo arm
current users of hormone replace-ment therapy were examined, there was a suggestion of an inverse asso-ciation. In three other cohort studies, a reduction of less than 15% in the risk of breast cancer was observed for higher versus lower vegetable con-sumption.
In a meta-analysis of 10 case—con-trol and 10 cohort studies, breast cancer risk was decreased by 4% for an increment of 100 grams of vegeta-bles per day (Riboli & Norat, 2003). When the two study designs were examined separately, an inverse asso-ciation was suggested only in the case—control studies, but there was statistically significant heterogeneity in the results across the studies. Studies included in this meta-analysis were limited to those that considered total fruit, all fruit, fruits or fresh fruits and
the study-specific relative risks were re-expressed based on an increase of 100 g per day of fruit consumption.
In a pooled analysis of eight cohort studies including 7377 breast cancer cases, total vegetable consumption was not associated with the risk of breast cancer (Table 63) (Smith-Warner et al., 2001). There was also no evidence of effect modification by family history, history of benign breast disease, hormone replacement ther-apy use, body mass index, fat con-sumption, alcohol consumption and several reproductive factors.
Case—control studies In most of the 24 case—control studies, inverse associations with vegetable consumption have been found (Table 66). The strongest association observed was in a small case—control
study in Greece (Katsouyanni et al.,
1986). In the 13 case—control studies that found a statistically significant inverse association, the risk of breast cancer was generally 40-60% lower for comparison of the highest versus lowest intakes of total vegetables. In one study in Russia, the risk of breast cancer was reported to be lower among women who had increased their vegetable consump-tion during the past 10 years com-pared with those who had decreased consumption (Zaridze et al., 1991).
In none of the case—control studies showing an odds ratio of at least 1.2 with higher vegetable consumption was the association statistically sig-nificant.
Some case—control studies of pre-menopausal women have suggested that higher vegetable consumption is
87

IARC Handbooks of Cancer Prevention Volume 8: Fruit and Vegetables
No. of Case-control studies categ. OR 95% Cl
MacLennan etal., 1977 2 0.45 0.30-0.67 Fontham etal., 1988 3 0.90 0.74-1.11 -1 - Le Marchand etal., 1969 (M) 4 0.31 0.17-0.56 u
Le Marchand et al., 1989 (F) 4 0.18 0.06-0.53 Jain etal., 1990 4 0.60 0.40-0.88 Kalandidi etal., 1990 4 1.09 0.44-2.68 Candelora et al., 1992 4 0.3 0.1-0.5 Forman etal., 1992 4 0.60 0.30-1.18 • : - Dorgan etal., 1993 (WM) 3 0.80 0.58-1.10 -i--- - Dorgan etal., 1993 (WF) 3 0.59 0.42-0.82 Dorgan etal., 1993 (BM) 3 1.10 0.59-2.04 -4---- u Dorgan etal., 1993 (6F) 3 0.67 0.23-1.96 Sankaranarayanan etal., 1994 4 0.32 0.13-0.78 Axelsson etal., 1996 3 0.37 0.23-0.61 Agudo etal., 1997 3 0.65 0.32-1.31 - Ko etal., 1997 2 0.4 0.2-0.8 Pillow etal., 1997 * 1.49 0.84-2.63 Nyberg etal., 1998 3 0.57 0.29-1.13 • : - Kubik etal., 2001 4 0.84 0.6-1.3 -HI
-
De Stefani etal., 2002 4 0.72 0.54-0.97 Marchand et al., 2002 (M) 3 1.4 0.7-2.9 Seow etal., 2002 (Sm) 3 0.48 0.23-1.00 • Seow etal., 2002 (NonSm) 3 0.78 0.51-1.20 .• - SUMMARY VALUE 0.69 0.63-0.76
Heterogeneity test: x2 (22df)=58; p<0.0001 1 I I
0.1 0.25 0.5 1 2 Odds ratio
Figure 35. Case-control studies of lung cancer and vegetable consumption (see Table 58) M = males; F = females; W = white; B = black; Sm = smokers; NonSm = non-smokers.
associated with reduced risk of breast cancer. However, relatively few studies have examined whether the associa-tion between vegetable consumption and breast cancer risk is modified by menopausal status. In those studies that have examined both pro-menopausal and postmenopausal breast cancer, no effect modification by menopausal status or by age group was generally observed. However, in a large Italian case-control study, raw vegetable consumption was inversely associated with the risk of pre-menopausal, but not postmenopausal, breast cancer (p-value for interaction =
0.01) (Franceschi etal., 1995; Braga et
al., 1997b). Educational level also has not been found to modify the associa-tion between vegetable consumption and the risk of breast cancer.
In a meta-analysis of 14 case-con-trol studies and three cohort studies of 16 052 cases (Gandini et al., 2000), a summary estimate for vegetables was generated by combining study-specific risk estimates for vegetables, cooked vegetables, raw vegetables, green vegetables and other vegetables (Table 63). Overall, there was a 25% reduction in the relative risk of breast cancer for comparison of the highest versus lowest categories of vegetable intake; however, there was statistically
significant between-study heterogene-ity (p < 0.001). When the analysis was restricted to the 16 studies with dose-response information, reductions in the risk of breast cancer were observed for intakes as low as three portions compared to one per week (HR = 0.91, 95% Cl 0.89-0.93). A 20% reduction in risk was observed for eat-ing six portions versus one per week (FIR = 0.79, 95% Cl 0.77-0.80). Again, there was statistically significant between-study heterogeneity for these summary estimates (p < 0.001). The results for vegetable consumption were suggestive of weaker associa-tions among studies using a validated
88
Cancer-preventive effects
questionnaire (RR = 0.85, 95% Cl 0.71-1.01 for high versus low con-sumption) than with a non-validated one (RA = 0.66, 95% Cl 0.55-0.81; p for interaction = 0.13), among stud-ies reporting univariate (AR = 0.86, 95% Cl 0.77-0.97) versus multivariate relative risks (AR = 0.68, 95% Cl 0.56-0.83; p for interaction = 0.22), and among non-Mediterranean (RA = 0.77, 95% Cl 0.66-0.92) compared with Mediterranean countries (RA = 0.67, 95% Cl 0.54-0.87; p for interac-tion = 0.48). Other sources of hetero-geneity are that relative risks for differ-ent categories of intake for different vegetable groups were combined into a summary estimate.
Combined fruit and vegetables Cohort studies Total fruit and vegetable consumption was not significantly associated with breast cancer risk in two out of three cohort studies (Table 65). In the Nurses Health Study, there was an inverse association with total fruit and vegetable consumption among pre-menopausal women (Zhang et al., 1999). The association was stronger among premenopausal women with a family history of breast cancer or who drank at least 15 grams of alcohol per day. In this study, fruit and vegetable consumption was not associated with breast cancer risk among post-menopausal women, but an inverse association was suggested among postmenopausal women who were current users of hormone replacement therapy.
In a pooled analysis of eight prospective studies (including the Nurses' Health Study mentioned above), total fruit and vegetable con-sumption was not assocated with breast cancer risk overall or for pre-menopausal or postmenopausal breast cancer (p for interaction by menopausal status = 0.57) (Smith-Warner etal., 2001).
Case—control studies Among the four case—control studies that considered combined fruit and vegetable consumption, a significant inverse association was found in only one (Aonco etal., 1999) (Table 66).
Breast cancer in men In three case—control studies of the association between fruit and veg-etable consumption and risk of breast cancer in men (Table 67), the results are inconsistent and the evidence is too limited to allow any conclusion to be drawn.
Discussion About 30 studies have evaluated the categories of total fruit or total vegeta-bles in relation to risk of breast cancer. Total fruit consumption generally has not been significantly associated with risk in either a protective or harmful direction, the relative risks being mostly between 0.8 and 1.2 for comparisons of high versus low fruit intake. For the six evaluable cohort studies, the mean RA was 0.82 (95% Cl 0.71-0.95), range 0.74-1.08 (Figure 36) and for the 12 case—control studies the mean OR was 0.99 (95% Cl 0.92-1.07), range 0.57-1.82 (Figure 37). For total vegetable con-sumption, case—control studies have been more suggestive of an inverse association than the cohort studies, but they are more susceptible to recall and selection bias than cohort studies. For the five evaluable cohort studies, the mean RA was 0.94 (95% Cl 0.83-1.07), range 0.64-1.43 (Figure 38) and for the 12 case—control studies the mean OR was 0.66 (95% Cl 0.57-0.75), range 0.09-1.40 (Figure 39). There was little suggestion that associations between fruit and veg-etable consumption and breast cancer risk differ by menopausal status. The Working Group could not exclude the possibility that fruit and vegetable consumption is associated with a slight
decrease in the risk of breast cancer. Errors in the measurement of fruit and vegetable consumption may have attenuated the results, so it is possible that stronger inverse associations could be observed if more accurate dietary assessment methods were used to estimate fruit and vegetable intake. There are inadequate data on effects of diet during early life on sub-sequent risk of developing breast can-cer. Few studies have examined effect modification.
Cervix Fruit Cohort studies No studies were identified by the Working Group.
Case—control studies In five studies that addressed the association of intake of fruit with inva-sive cervix cancer, most point esti-mates were below 1.0, although confi-dence intervals generally included the null (Table 68). The exception with a significant inverse association reported was a hospital-based study in Japan (Hirose etal., 1996).
Vegetables Cohort studies No studies were identified by the Working Group.
Case—control studies There is evidence of an inverse asso-ciation, but confidence intervals often included the null (Table 69).
Combined fruit and vegetables Two studies have examined total fruit and vegetable intake with regard to risk of cancer of the cervix (Table 70), one showing evidence of an inverse association and the other no significant effect.
89
kajob
Highlight
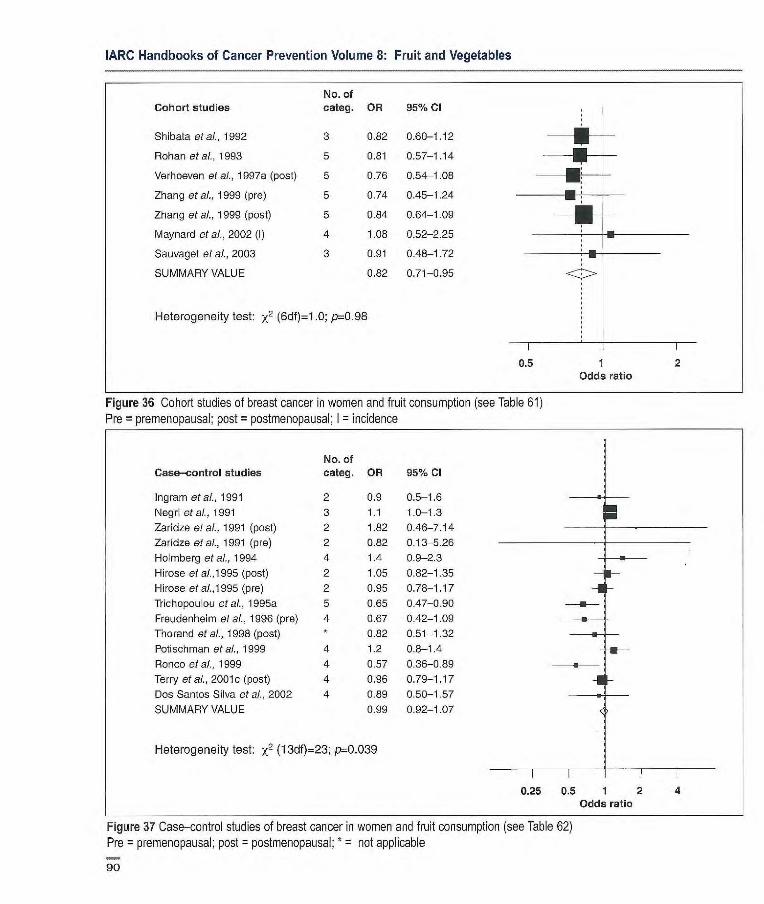
IARC Handbooks of Cancer Prevention Volume 8: Fruit and Vegetables
No. of Cohort studies categ. OR 95% Cl
Shibata etal., 1992 3 0.82 0.60-1.12 -- -
Rohan etal., 1993 5 0.81 0.57-1.14
Verhoeven etal., 1997a (post) 5 0.76 0.54-1.08 ---- -
Zhang etal., 1999 (pre) 5 0.74 0.45-1.24
Zhang etal., 1999 (post) 5 0.84 0.64-1.09 -
Maynard et al., 2002 (I) 4 1.08 0.52-2.25
Sauvaget etal., 2003 3 0.91 0.48-1.72
SUMMARY VALUE 0.82 0.71-0.95
Heterogeneity test: x2 (6df)=1 .0; p=0.98
0.5 1 2 Odds ratio
Figure 36 Cohort studies of breast cancer in women and fruit consumption (see Table 61) Pre = premenopausal; post = postmenopausal; I = incidence
No. of Case—control studies categ. OR 95% Cl
Ingram etal., 1991 2 0.9 0.5-1.6
Negri etal., 1991 3 1.1 1.0-1.3
Zaridze etal., 1991 (post) 2 1.82 0.46-7.14
Zaridze etal., 1991 (pre) 2 0.82 0.13-5.26
Homberg et al., 1994 4 1.4 0.9-2.3
Hirose et al.,1995 (post) 2 1.05 0.82-1.35 F- Hirose etal.1995 (pre) 2 0.95 0.78-1.17 -I - Triobopouou etal., 1995a 5 0.65 0.47-0.90
Freudenheini etal., 1996 (pre) 4 0.67 0.42-1.09
Thorand et al., 1998 (post) * 0.82 0.51-1.32 ---u- - Potischman etal., 1999 4 1.2 0.8-1.4
Ronco e! al., 1999 4 0.57 0.36-0.89
Terry etal., 2001c (post) 4 0.96 0.79-1.17 -or Dos Santos Silva et al., 2002 4 0.89 0.50-1.57 -a SUMMARY VALUE 0.99 0.92-1.07
Heterogeneity test: x2 (13df)=23; p=0.039
0.25 0.5 1 2 4 Odds ratio
Figure 37 Case-control studies of breast cancer in women and fruit consumption (see Table 62) Pre = premenopausal; post = postmenopausal; * = not applicable
90
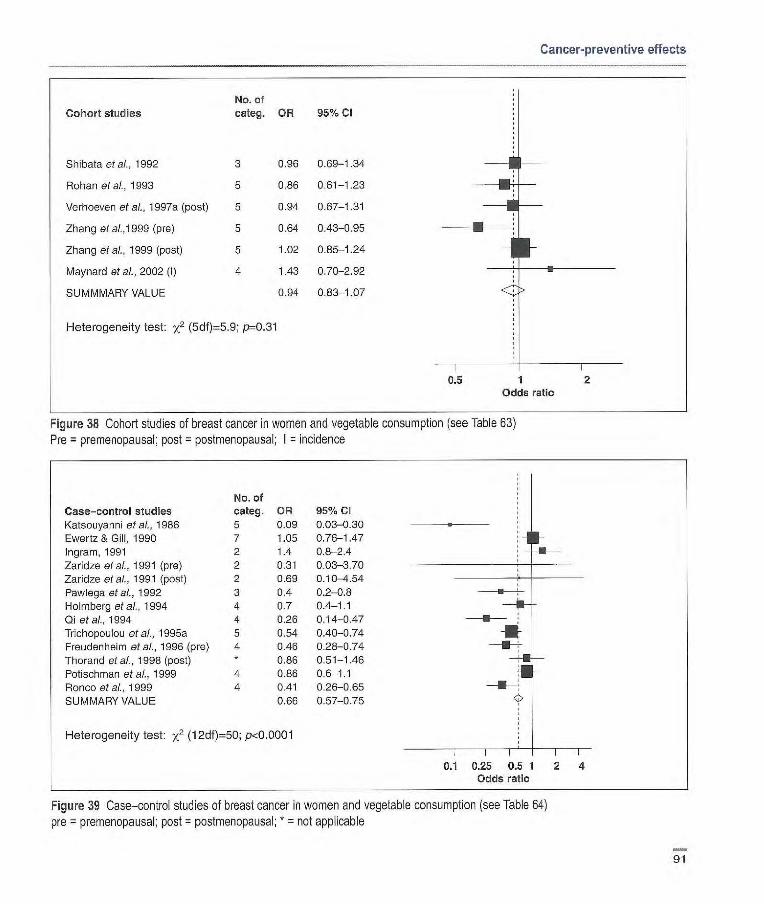
Cancer-preventive effects
Cohort studies
Shibatactai., 1992
Rohan et at, 1993
Verhoever et ai., 1 997a (post)
Zhang etai.,1999 (pre)
Zhang et aI., 1999 (post)
Maynard et al., 2002 (I)
SUMMMARY VALUE
No. of categ. OR 95% Cl
3 0.96 0.69-1.34
5 0.86 0.61-1.23
5 0.94 0.67-1.31
5 0.64 0.43-0.95
5 1.02 0.85-1.24
4 1.43 0.70-2.92
0.94 0.83-1.07
Heterogeneity test: x2 (5df)5.9; p0.31
0.5 1 2 Odds ratio
Figure 38 Cohort studies of breast cancer in women and vegetable consumption (see Table 63) Pro = premenopausal; post = postmeropausal; I = incidence
Case—control studies Katsouyanni et al., 1986
Ewertz & Gill, 1990 Ingram, 1991
Zaridze et al., 1991 (pre)
Zaridze et at, 1991 (post)
Pawlegaet al, 1992 Holmberg etal., 1994
Qi et ai., 1994
Trichopoulou et at, 1995a Freudenheim et al., 1996 (pre)
Thorand et at, 1998 (post)
Potischman et al., 1999 Ronco et at, 1999 SUMMARY VALUE
No. of categ. OR 95% CI 5 0.09 0.03-0.30
7 1.05 0.76-1-47 2 1.4 0.8-2.4
2 0.31 0.03-3.70
2 0.69 0.10-4.54
3 0.4 0.2-0.8
4 0.7 0.4-1.1
4 0.26 0.14-0.47
5 0.54 0.40-0.74
4 0.46 0.28-0.74 * 0.86 0.51-1.46
4 0.86 0.6-1.1 4 0.41 0.26-0.65
0.66 0.57-0.75
Heterogeneity test: x2 (12df)=50; pd0.0001
0.1 0.25 0.5 1 2 4 Odds ratio
Figure 39 Case—control studies of breast cancer in women and vegetable consumption (see Table 64) pre = premenopausal; post = postmenopausal; * = not applicable
91

IARC Handbooks of Cancer Prevention Volume & Fruit and Vegetables
In situ cervical cancer The association of fruit and vegetable intake with risk of in situ cervical can-cer has been examined in only one case—control study (Table 71); there was an inverse association with fruit intake but not with vegetables.
Cervical dysplasia One case—control study examining risk for cervical dysplasia in relation to intake of fruit and vegetables has been reported (Table 72). Cervical dysplasia is difficult to study because of prob-lems with case ascertainment. In this study, there is some concern about the comparability of the study base for the cases and controls. Fruit intake appeared to be associated with reduced risk. There was no analysis of total vegetable intake.
Discussion In all, nine case—control studies have addressed associations between fruit and vegetable intake and either inva-sive cancer or precancerous lesions of the cervix. The findings are not completely consistent and there is little evidence for a strong effect of intake of these foods on risk.
In considering these findings, several limitations need to be kept in mind. The lack of evidence from cohort studies makes it hard to evaluate the effect of recall and selection bias on the results. Further, there are concerns with measurement error. As in all observational studies, confounding is possible. Of particular concern for cervical cancer is the role of diet in a pathway that includes human papillo-mavirus (HPV). If fruit and vegetable intake is important in a causal pathway that includes HPV, it would be impor-tant to determine the HPV status of controls. Alternatively, HPV may operate as a confounder if both diet and HPV status are related to social status. However, in a study conducted in India where HPV was measured in
both cases and controls, there was little difference between the OR measured for the full control group and that for the group of controls who were HPV-positive (Rajkumar et al., 2003a).
Endometrium Fruit Cohort studies No studies were identified by the Working Group.
Case—control studies Eleven studies have examined the association between intake of fruit and risk of endometrial cancer (Table 73). In many of these, ORs were close to one and confidence intervals included the null. For the four studies where there was a significant inverse association, ORs were in the range 0.45-0.7.
Vegetables Cohort studies No studies were identified by the Working Group.
Case—control studies Of 11 case—control studies that evaluated intake of vegetables, inverse associations were reported in eight, six being statistically significant (Table 74). In one study in Japan, a significant increase in risk was associated with consumption of raw but not green vegetables (Hirose et al., 1996).
Combined fruit and vegetables Cohort studies In one cohort study, an inverse associ-ation between risk of endometrium cancer and combined fruit and veg-etable intake was reported, but the confidence interval was wide and included the null (Table 75).
Case—control studies In all three studies, total intake of fruit and vegetables was inversely associ -
ated with risk of endometrium cancer; in one the trend was significant (Table 76).
Discussion Fruit consumption was evaluable in seven case—control studies, resulting in a mean OR of 1.03 (95% Cl 0.90-1.17), range 0.67-1.97 (Figure 40). For the five evaluable studies on vegetable consumption, the mean OR was 0.75 (95% Cl 0.64-0.89), range 0.65-1.00 (Figure 41). It is difficult to make comparisons among these stud-ies because of differences in the com-position of the diet in different regions and because of considerable differences in dietary assessment. There appears to be inconsistent evi-dence of an inverse association with these foods.
An important confounder to con-sider in the study of endometrial can-cer is body mass index; most but not all of the studies included control for this.
Overall these results provide weak evidence at best for an effect of fruit and vegetable intake on risk of endometrial cancer.
Ovary Fruit Cohort studies Neither of two cohort studies of fruit intake and ovary cancer risk found an association (Table 77).
Case-control studies Among four case—control studies of total fruit intake in relation to risk of ovary cancer (Table 78), one found a significant inverse association, but in another fruit intake was positively associated with risk.
Vegetables Cohort studies In the two available studies, the asso-ciation of vegetable intake with risk was inverse, but for both, the confi-
92
kajob
Highlight
kajob
Highlight
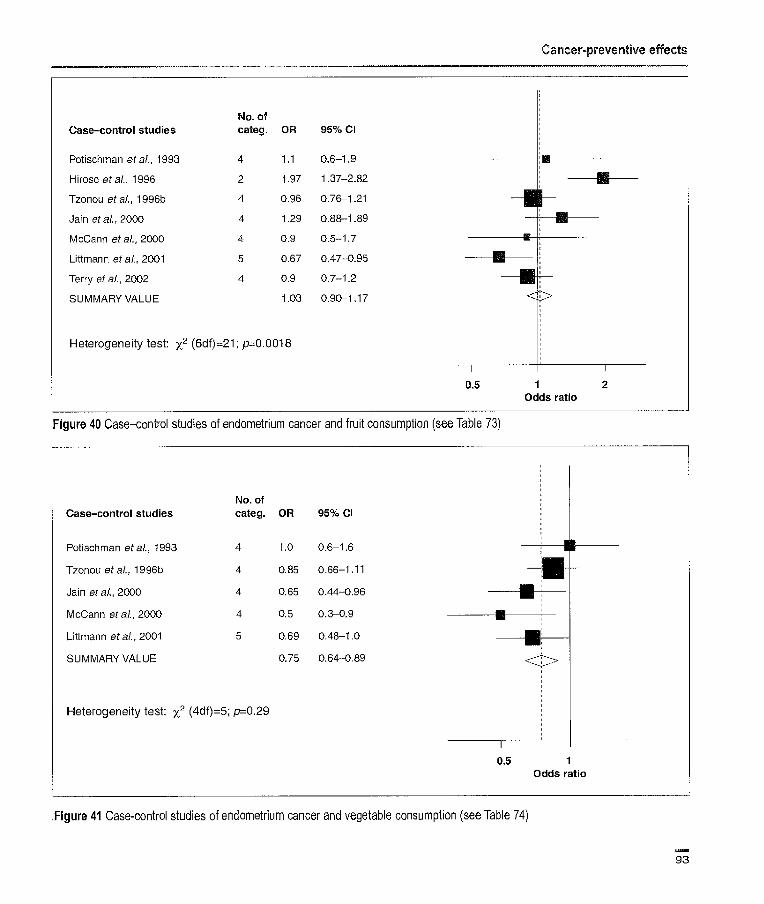
No. of Case-control studies categ. OR 95% Cl
Potischman etal., 1993 4 1.1 0.6-1.9
Hirose etal., 1996 2 1.97 1.37-2.82
Tzonou etal., 1996b 4 0.96 0.76-1.21
Jain etal., 2000 4 1.29 0.88-1.89
McCann et aL, 2000 4 0.9 0.5-1.7
Littmann etal., 2001 5 0.67 0.47-0.95
Terry of al., 2002 4 0.9 0.7-1.2
SUMMARY VALUE 1.03 0.90-1.17
Heterogeneity test: x2 (6df)=21; p0.0018
Cancer-preventive effects
0.5 1 2 Odds ratio
Figure 40 Case—control studies of endometrium cancer and fruit consumption (see Table 73)
No. of Case-control studies categ. OR 95% Cl
Potischman etal., 1993 4 1.0 0.6-1.6 1 1
Tzonou etal., 1996b 4 0.85 0.66-1.11 -- - Jain etal., 2000 4 0.65 0.44-0.96
McCann etal., 2000 4 0.5 0.3-0.9
Littmann etal., 2001 5 0.69 0.48-1.0
SUMMARY VALUE 0.75 0.64-0.89
Heterogeneity test: x2 (4df)=5; p=0.29
0.5 Odds ratio
Figure 41 Case-control studies of endometrium cancer and vegetable consumption (see Table 74)
93
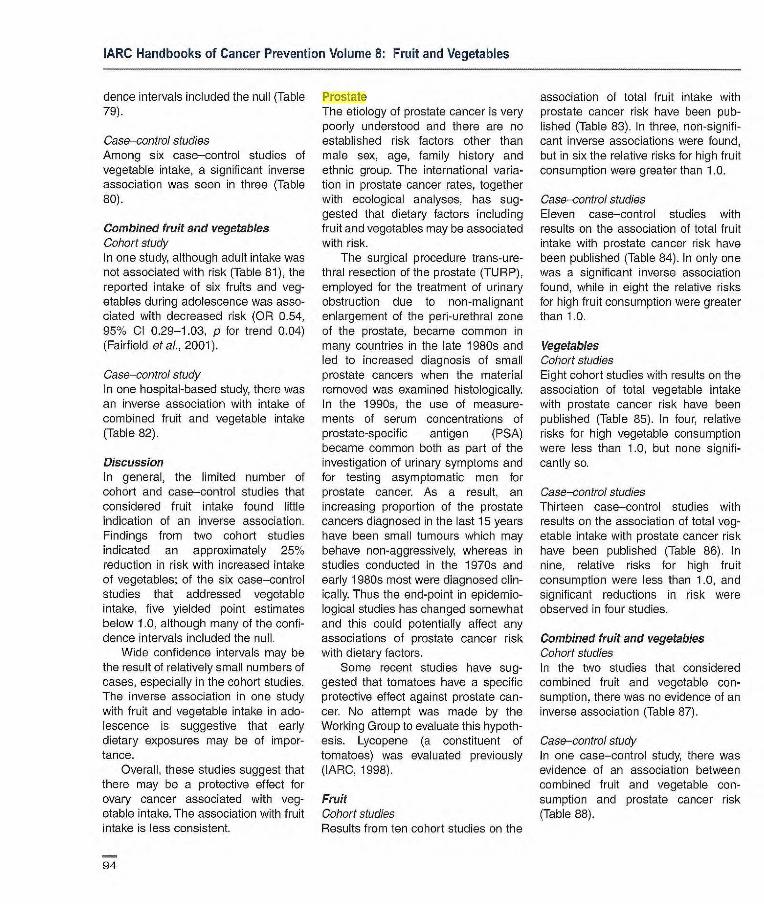
IARC Handbooks of Cancer Prevention Volume 8: Fruit and Vegetables
dence intervals included the null (Table 79).
Case—control studies Among six case—control studies of vegetable intake, a significant inverse association was seen in three (Table 80).
Combined fruit and vegetables Cohort study In one study, although adult intake was not associated with risk (Table 81), the reported intake of six fruits and veg-etables during adolescence was asso-ciated with decreased risk (OR 0.54, 95% Cl 0.29-1.03, p for trend 0.04) (Fairfield of al., 2001).
Case—control study In one hospital-based study, there was an inverse association with intake of combined fruit and vegetable intake (Table 82).
Discussion In general, the limited number of cohort and case—control studies that considered fruit intake found little indication of an inverse association. Findings from two cohort studies indicated an approximately 25% reduction in risk with increased intake of vegetables; of the six case—control studies that addressed vegetable intake, five yielded point estimates below 1.0, although many of the confi-dence intervals included the null.
Wide confidence intervals may be the result of relatively small numbers of cases, especially in the cohort studies. The inverse association in one study with fruit and vegetable intake in ado-lescence is suggestive that early dietary exposures may be of impor-tance.
Overall, these studies suggest that there may be a protective effect for ovary cancer associated with veg-etable intake. The association with fruit intake is less consistent.
Prostate The etiology of prostate cancer is very poorly understood and there are no established risk factors other than male sex, age, family history and ethnic group. The international varia-tion in prostate cancer rates, together with ecological analyses, has sug-gested that dietary factors including fruit and vegetables may be associated with risk.
The surgical procedure trans-ure-thral resection of the prostate (TtJRP), employed for the treatment of urinary obstruction due to non-malignant enlargement of the pen-urethral zone of the prostate, became common in many countries in the late 1980s and led to increased diagnosis of small prostate cancers when the material removed was examined histologically. In the 1990s, the use of measure-ments of serum concentrations of prostate-specific antigen (PSA) became common both as part of the investigation of urinary symptoms and for testing asymptomatic men for prostate cancer. As a result, an increasing proportion of the prostate cancers diagnosed in the last 15 years have been small tumours which may behave non-aggressively, whereas in studies conducted in the 1970s and early 1980s most were diagnosed clin-ically. Thus the end-point in epidemio-logical studies has changed somewhat and this could potentially affect any associations of prostate cancer risk with dietary factors.
Some recent studies have sug-gested that tomatoes have a specific protective effect against prostate can-cer. No attempt was made by the Working Group to evaluate this hypoth-esis. Lycopene (a constituent of tomatoes) was evaluated previously (]ARC, 1998).
Fruit Cohort studies Results from ten cohort studies on the
association of total fruit intake with prostate cancer risk have been pub-lished (Table 83). In three, non-signifi-cant inverse associations were found, but in six the relative risks for high fruit consumption were greater than 1.0.
Case—control studies Eleven case—control studies with results on the association of total fruit intake with prostate cancer risk have been published (Table 84). In only one was a significant inverse association found, while in eight the relative risks for high fruit consumption were greater than 1.0.
Vegetables Cohort studies Eight cohort studies with results on the association of total vegetable intake with prostate cancer risk have been published (Table 85). In four, relative risks for high vegetable consumption were less than 1.0, but none signifi-cantly so.
Case—control studies Thirteen case—control studies with results on the association of total veg-etable intake with prostate cancer risk have been published (Table 86). In nine, relative risks for high fruit consumption were less than 1.0, and significant reductions in risk were observed in four studies.
Combined fruit and vegetables Cohort studies In the two studies that considered combined fruit and vegetable con-sumption, there was no evidence of an inverse association (Table 87).
Case—control study In one case—control study, there was evidence of an association between combined fruit and vegetable con-sumption and prostate cancer risk (Table 88).
94
kajob
Highlight

Cancer-preventive effects
Discussion There is little evidence to support a protective effect of fruit intake on prostate cancer risk. For fruit con-sumption, eight ovaluable cohort stud-ies gave a mean AR of 111 (95% Cl 0.98-1.26), range 0.84-1.57 (Figure 42) and nine evaluble case—control studies gave a mean OR of 1.08 (95% Cl 0.98-1.18), range 0.40-170 (Figure 43). Vegetable consumption was evaluable in six cohort studies; mean AR 0.95 (95% Cl 0.84-1.08), range 0.7-1.04 (Figure 44) and nine case—control studies, mean OR 0.90 (95% Cl 0.82-1.00), range 0.6-1.39 (Figure 45).
Testis Testicular cancer accounts for less than 2% of malignant neoplasms in men, but is the most common malig-nancy in young adult men aged 15-44 years in most developed countries, and its incidence has been increasing in developed countries throughout the world. An ecological association with consumption of fat, energy intake and dairy products was identified (Armstrong & Doll, 1975), but only two case—control studies (Table 89) have investigated the influence of total fruit and vegetable consumption on testicu-lar cancer risk. In neither were there significant inverse associations with fruit or vegetable consumption.
An additional case—control study conducted in East Anglia, UK, aiming to test the hypothesis that milk and dairy products are risk factors for tes-ticular cancer collected data on fresh fruit and vegetable consumption in adolescence (Davies et aI., 1996). Although cases tended to have eaten fewer oranges, apples and fruit salads than the population controls, the difference was not statistically signifi-cant, while the reverse was the case for vegetable salads.
Discussion The information available is too sparse to allow any conclusion on the association of fruit and vegetables with testis cancer to be drawn.
Bladder The Working Group adopted the usual convention of including studies of all urothelial cancers among the general group of bladder cancers.
Fruit Cohort studios Of five cohort studies (Table 90), two show a statistically significant inverse association with fruit consumption. However, in the study by Zeegers et al. (2001), the trend is inconsistent and varies between different categories cf smokers. In this study, stratified ORs by smoking habits indicated a non-sig-nificant inverse association among current smokers and in ex-smokers who smoked more than 15 cigarettes per day.
Case—control studies Among the four case—control studies identified (Table 91), inverse associa-tions were seen in three for total fruit intake, two of which were statistically significant.
Meta-analyses Results of two formal meta-analyses considering fruit consumption and bladder cancer risk have been repor-ted. Steinmaus et al. (2000) included nine studies with data on fruit (four cohort and five case—control). The OR for high versus low consumption was [0.71 (95% Cl adjusted for hetero-geneity statistic 0.55-092)]. There was little variation by study type. Riboli & Norat (2003) included eight studies in their meta-analysis (three cohort and five case—control); the OR for an in-crease in consumption of 100 g of fruit per day was 0.81 (0.73-0.91). Again there was little variation by study type.
Vegetables Cohort studies None of the four cohort studies reporting information on vegetables (Table 92) reported a statistically sig-nificant inverse association with the consumption of vegetables. Two reported non-significant inverse asso-ciations, but one was with green-yel-low vegetables.
Case—control studies Out of four case—control studies identi-fied, only three reported information on total vegetables and one on green-yel-low and other vegetables separately (Table 93). Two studies found inverse associations with vegetable consump-tion, but neither was statistically signif-icant. In the study by Zeegers et ai.
(2001), stratified ORs by smoking habits indicated a non-significant inverse association only among cur-rent heavy smokers.
Meta-analyses Results of two formal meta-analyses considering vegetable consumption and bladder cancer risk have been reported. Steinmaus et al. (2000) included 10 studies with data on veg-etables (three cohort and seven case—control). The OR for high versus low consumption was [0.86 (95% Cl adjusted for heterogeneity statistic 0.75-0.99)]. There was little variation by study type. Riboli & Norat (2003) included six studies in their mete-analysis (two cohort and four case—control); the OR for an increase in consumption of 100 g of vegetables per day was 0.91 (95% Cl 0.82-1.00). Again there was little variation by study type.
Combined fruit and vegetables Cohort studies In two cohort studies, no association of combined fruit and vegetable intake with bladder cancer risk was seen (Table 94).
95
kajob
Highlight
kajob
Highlight
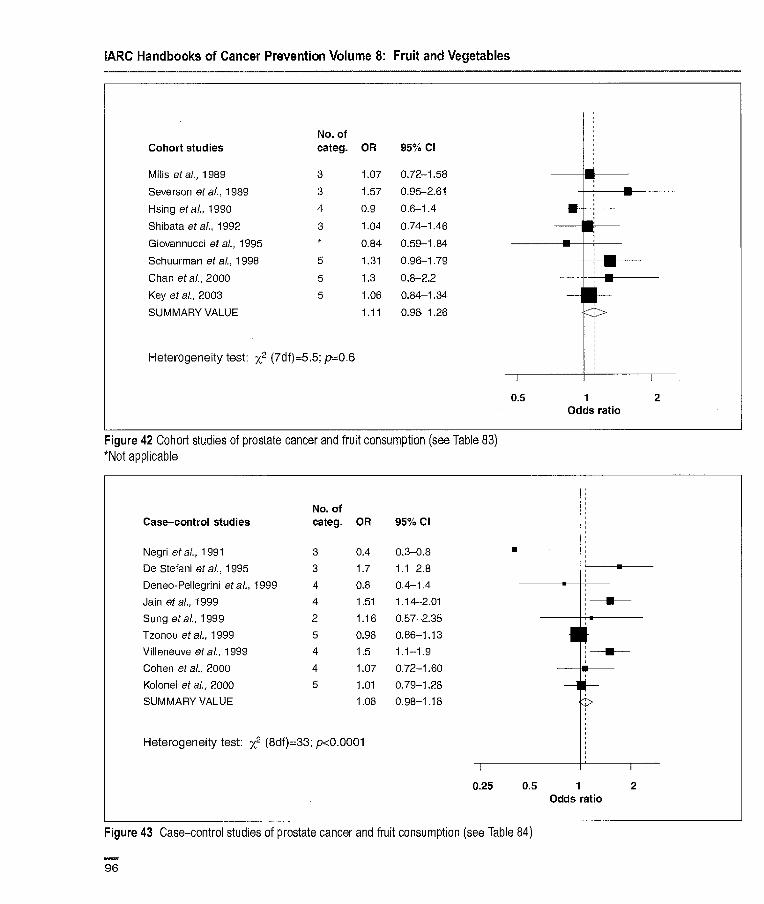
IARC Handbooks of Cancer Prevention Volume 8: Fruit and Vegetables
No. of Cohort studies categ. OR 95% Cl
Mills etal., 1989 3 1.07 0.72-1.58 111111 Severson et al., 1989 3 1.57 0.95-2.61
Hsing etal., 1990 4 0.9 0.6-1.4
Shibata et al, 1992 3 1.04 0.74-1.46 - _____
Giovarinucci etal., 1995 * 0.84 0.59-1.84 - Schuurmari etaL, 1998 5 1.31 0.96-1.79
Chan etal., 2000 5 1.3 0.8-2.2
Key etal., 2003 5 1.06 0.84-1.34 - SUMMARY VALUE 1.11 0.98-1.26
Heterogeneity test: x2 (7df)=5,5; pz0.6
0.5 1 2 Odds ratio
Figure 42 Cohort studies of prostate cancer and fruit consumption (see Table 83) *Not applicable
No. of Case—control studies categ. OR 95% Cl
Negri etal., 1991 3 0.4 0.3-0.8
De Stefani et al., 1995 3 1.7 1.1-2.8
Deneo-Pellegrini etal., 1999 4 0.8 0.4-1.4
Jain etal., 1999 4 1.51 1.14-2.01
Sung etal., 1999 2 1.16 0.67-2.35
Tzonou etal., 1999 5 0.98 0.86-1.13 • F Villeneuve etal., 1999 4 1.5 1.1-1.9
Cohen etal., 2000 4 1.07 0.72-160 - Kolonel etal., 2000 5 1.01 0.79-1.28 - H SUMMARY VALUE 1.08 0.98-1.18
Heterogeneity test: x2 (8df)=33; p<0.0001
0.25 0.5 1 2 Odds ratio
Figure 43 Case-control studies of prostate cancer and fruit consumption (see Table 84)
96
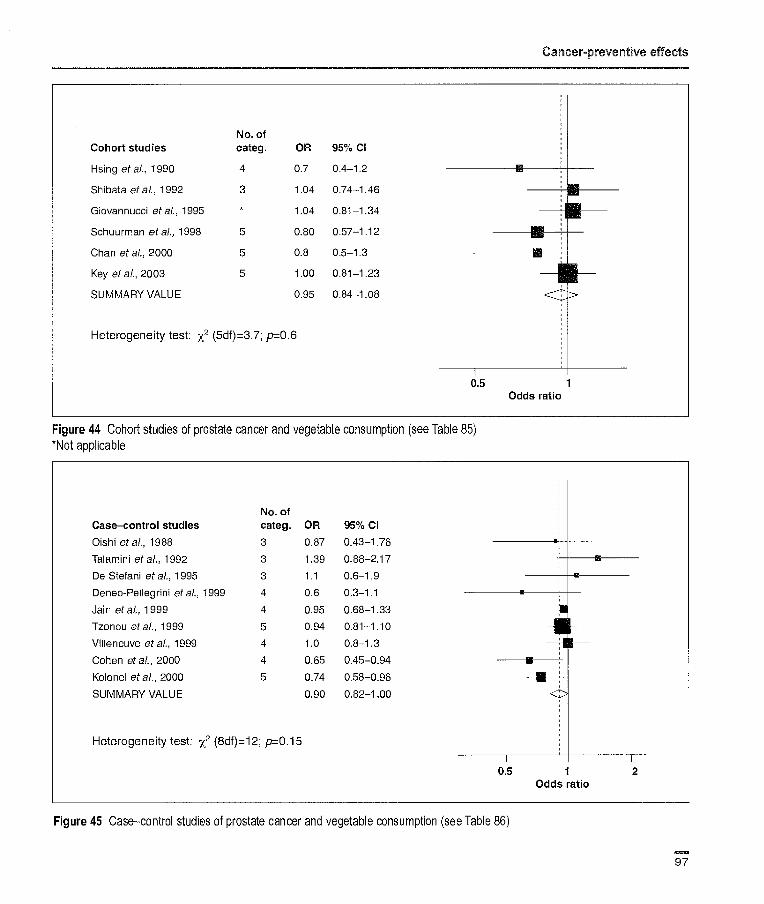
Cancer-preventive effects
No. of Cohort studies categ. OR 95% Cl
Hsing et al., 1990 4 0.7 0.4-1.2
Shibata et al., 1992 3 1.04 0.74-1.46
Giovannucci etal., 1995 * 1.04 0.8-1.34
Schuurman etal., 1998 5 0.80 0.57-1.12 ----- - Chan etal., 2000 5 0.8 0.5-1.3
Key etal., 2003 5 1.00 0.81-1.23 - SUMMARY VALUE VALUE 0.95 0.84-1.08
Heterogeneity test: x2 (5df)=3.7; p=0.6
0.5 1 Odds ratio
Figure 44 Cohort studies of prostate cancer and vegetable consumption (see Table 85) *Not applicable
No. of Case—control studies categ. OR 95% Cl
Oishi etal., 1988 3 0.87 0.43-1.76 • Talamini etal., 1992 3 1.39 0.88-2,17
De Stefani et al., 1995 3 1.1 0.6-1.9 - Deneo-Pellegrini et al., 1999 4 0.6 0.3-1.1 - Jain et a[, 1999 4 0.95 0.68-1.33
Tzonou etal., 1999 5 0.94 0.81-1.10 -U - Villeneuve et ai., 1999 4 1.0 0.8-1.3
Cohen et etal., 2000 4 0.65 0.45-0.94
Kolonel etal., 2000 5 0.74 0.58-0.96
SUMMARY VALUE 0.90 0.82-1.00
Heterogeneity test: x2 (8df)=12; p=0.15
0.5 1 2
Odds ratio
Figure 45 Case—control studies of prostate cancer and vegetable consumption (see Table 86)
97
IARC Handbooks of Cancer Prevention Volume 8: Fruit and Vegetables
Case—control studies Inverse associations were noted in two out of three case—control studies in which combined fruit and vegetable intake was considered, but the associ-ation was significant only for males in one (Table 95).
Discussion Cohort studies of the relationship between fruit and vegetable consump-tion and bladder cancer risk were generally set up to investigate diet, with the exception of that of Nagano et al. (2000), whose main goal was to study survivors of the atomic bomb-ings. Most case—control studies had a hospital-based design; this design has limitations related to the recruitment of subjects with diet-associated diseases in the control group. Virtually all stud-ies used food frequency question-naires and adjusted for relevant con-founders (gender, age, smoking and energy intake). The case—control stud-ies more often found inverse associa-tions than the cohort studies, but the findings were not consistent. For the five evaluable cohort studies on fruit consumption, the mean HR was 0.87 (95% Cl 0.72-1.04), range 0.63-1.12 (Figure 46); for the four evaluable case—control studies, the mean OR was 0.74 (95% Cl 0.59-1192), range 0.53-095 (Figure 47). For vegetable consumption, the mean OR for the three evaluable cohort studies was 0.94 (95% Cl 0.76-1.16), range 0.72-1.16 (Figure 48), and the mean OR for the three evaluable case—control studies was 0.89 (95%Cl 0.69-1.14), range 0.66-1.04 (Figure 49).
Although both formal meta-analy-ses suggest protective effects of fruit and vegetables, the criteria for inclu-sion of studies varied, and in particular, that of Steinmaus et al. (2000) included studies that used surrogate estimates of fruit or vegetable con-sumption that were not considered by the Working Group.
Therefore, although the evidence of protective effects for fruit and veg-etables and bladder cancer is sugges-tive, especially from the ease—control studios, the Working Group felt it was not possible to exclude bias as accounting for the findings.
Kidney In adults, cancer of the kidney encom-passes two major histopathological entities, namely renal-cell (parenchy-mal) cancer and renal pelvis cancer. The epidemiology of renal pelvis can-cer resembles that of bladder cancer more than that of renal-cell cancer and in some studies is included in the grouping urothelial cancer; it would thus have been covered in the previ-ous section. The present review is therefore restricted to renal-cell can-cer, which accounts for 80-90% of kid-ney cancers.
Fruit Cohort studies Of two cohort studies of renal-cell cancer reporting data on total fruit consumption (Table 96), only the one with the smaller numbers of cases found an inverse, but non-significant, association.
Case—control studies The association between total fruit consumption and renal-cell cancer has been considered in seven case—con-trol studies covering populations in North America, northern, central and southern Europe, Asia and Australia (Table 97). Significant inverse associa-tions with fruit consumption were noted in four, but in one study only in males and in another only in non-smokers.
Data from three of these case—con-trol studies (Chow et al., 1994; Mellemgaard et al., 1996; Lindblad et al., 1997) as well as from an Australian study (McCredie & Stewart, 1992) were included in a multicentre analysis of 1185 renal-cell cancer cases and
1526 control subjects (Wolk et al., 1996). In this analysis, there was a suggestion of an inverse association with total fruit consumption, but the association was not significant. In an analysis stratified by smoking sta-tus, the inverse association was con-fined to non-smokers. In the multicen-tre analysis, only a subset of 260 cases from the US study (Chow et al., 1994) with direct interviews was included.
In a recent large case—control study among non-Asians of Los Angeles, California, which did not present results for total fruit, a strong significant inverse association was observed for citrus fruit (p for trend 0.003) (Yuan etal., 1998).
Vegetables Cohort studies In the one cohort study, there was no significant association with vegetable consumption (Table 98).
Case—control studies Among five case—control studies with information on vegetable consumption, four found inverse associations, but they were significant only in men in one, and in another that considered dark green and yellow-orange vegeta-bles separately (Table 99). In the multi-centre study (Wolk et al., 1996), there was a weak non-significant inverse association.
Combined fruit and vegetables Cohort study No significant association was observed in the one cohort study that considered combined intake of fruit and vegetables (Table 100).
Case—control studies In one case—control study, a non-sig-nificant inverse association with com-bined intake of fruit and vegetables was noted in women, but not in men (Table 101).
98
kajob
Highlight

Cancer-preventive effects
No. of Cohort studies categ. OR 95% Cl
Chyou etal., 1993 3 0.63 0.37-1.08
Michaud etal., 1999 5 1.12 010-1.78
Nagano etaL, 2000 3 0.75 0.46-1.22
Zeegers etal., 2001 5 0.74 0.53-1.04
Mrchaud etal., 2002 5 1.10 0.77-1.57
SUMMARY VALUE 0.87 0.72-1.04
Heterogeneity test: x2 (4df)=5.4; p=0.25
0.5 Odds ratio
Figure 46 Cohort studies of bladder cancer and fruit consumption (see Table 90)
No. of Case-control studies categ. OR 95% Cl
Riboli etal., 1991 4 0.95 0.67-1.35 ----I F- Bruemmer etal., 1996 4 0.53 0.30-0.93
Wakai etal., 2000 4 0.65 0.40-1.06 ----- -
Bab et al., 2001 3 0.65 0.40-1.04 -
SUMMARY VALUE 0.74 0.59-0.92
Heterogeneity test: x2 (3df)=3.8; p=0.28
0.5 1 Odds ratio
Figure 47 Case—control studies of bladder cancer and fruit consumption (see Table 91)
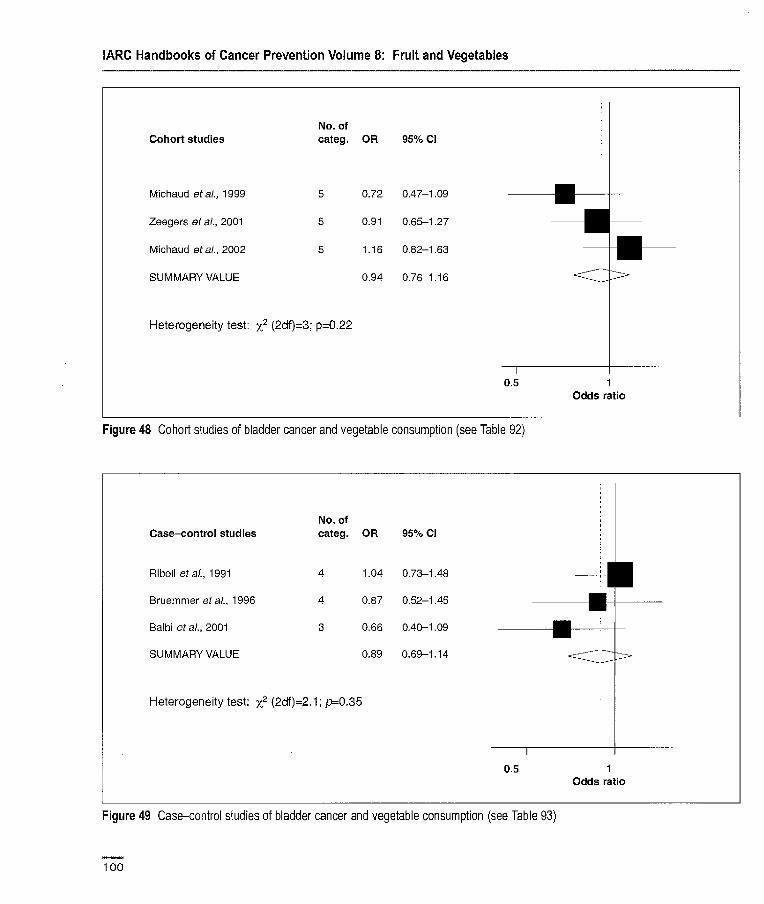
IARC Handbooks of Cancer Prevention Volume 8: Fruit and Vegetables
No. of Cohort studies categ. OR 95% Cl
Michaud etal., 1999 5 0.72 0.47-1.09
Zeegers etal., 2001 5 0.91 0.65-1.27
Michaud eta,'., 2002 5 1.16 0.62-163 —j
SUMMARY VALUE 0.94 0.76-1.16
Heterogeneity test: x2 (2df)=3; p=0.22
0.5 Odds ratio
Figure 48 Cohort studies of bladder cancer and vegetable consumption (see Table 92)
No. of Case-control studies categ. OR 95% Cl
Riboli et al., 1991 4 1.04 0.73-1.48 11 Bruemmer etal., 1996 4 0.87 0.52-1.45 oil
Balbi etal., 2001 3 0.66 1111111111111 0.40-1.09 _..____ - -
SUMMARY VALUE 0.89 0.69-1.14 i
Heterogeneity test: x2 (2df)=2.1; p=0.35
0.5 1 Odds ratio
Figure 49 Case—control studies of bladder cancer and vegetable consumption (see Table 93)
100

Cancer-preventive effects
Discussion A number of studies have examined fruit and vegetable consumption in relation to kidney cancer risk. There were only two cohort studies with small numbers of cases and nine case—con-trol studies of which three were also analysed together with another as a multicentre study (Wolk et al., 1996). The studies were performed in Australia, China, Europe and the USA and all renal-cell cancer cases were histologically confirmed. Most studies used population-based controls. Response rates were relatively high in most studies and adjustment was made for potential confounding by body mass index and smoking. However, recall bias cannot be excluded in the case—control studies.
The results are not consistent. For the seven evaluable case—control studies on fruit consumption, the mean OR was 0.76 (95% Cl 0.63-0.91), range 0.20-1.20 (Figure 50) and for the four evaluable case—control stud-ies on vegetable consumption, the mean OR was 0.86 (95% Cl 0.67-1.09), range 0.30-1.60 (Figure 51).
Because smoking increases oxida-tive stress, it is of interest to examine the association with fruit and vegeta-bles in subgroups of smokers and non-smokers. However, only two case—control studies took smoking status into account when analysing associa-tions of fruit and vegetables with risk of renal-cell cancer. The results from these two studies and from the multi-centre analysis are not consistent; one showing a significant inverse associa-tion for cruciferous/dark green vegetables both in ever-smokers and non-smokers (Yuan et al., 1998), whereas the other study (Lindblad et al., 1997) and the multicentre analysis found this relationship only among non-smokers.
Brain Adult brain cancer Fruit Cohort studies. No cohort studies on adult brain cancer were identified by the Working Group.
Case—control studies: In two reports on a case—control study in north-east China, a significant inverse association with fruit consumption and risk of adult brain cancer was found (Table 102). No association with citrus fruit consump-tion was found in a study in the USA (Chen et al., 2002b).
Vegetables Cohort studies. No cohort studies on adult brain cancer were identified by the Working Group.
Case—control studies. In one case—con-trol study in the USA and in two reports (possibly not independent) on a case—control study in north-east China, inverse associations between veg-etable consumption and risk of adult brain cancer were found (Table 103).
Childhood brain cancer Fruit Cohort studies. No cohort studies on childhood brain cancer were identified by the Working Group.
Case—control studies. Although there have been several studies of dietary variables and childhood cancer (espe-cially brain tumeurs), few have consid-ered fruit and vegetables per se.
Four case—control studies have considered fruit consumption, with contrasting results (Table 104). Two of the three studies that considered maternal diet during pregnancy found inverse associations. In the study in Australia that did not find an overall association, however, there was an inverse association for fruit consumption in the first year of life of the child.
Vegetables Cohort studies. No cohort studies on childhood brain cancer were identified by the Working Group.
Case—control studies. Three case—con-trol studies have considered vegetable consumption, with contrasting results (Table 105).The two that found inverse associations both considered the diet of the mother during pregnancy, while the third found no association either during gestation or in the first year of life.
Discussion Information on adult and childhood brain cancer in relation to consumption of fruit and vegetables is sparse and comes entirely from case—control studies. Although inverse associations have been found, the number of stud-ies was considered by the Working Group to be too few to permit evaluation.
Thyroid Thyroid cancer is a rare disease, which occurs more frequently among females than males. The majority of thyroid malignancies are well differen-tiated, and survival is high. Papillary carcinoma comprises between 50 and 80% of thyroid cancers and follicular carcinoma between 10 and 40%. Anaplastie carcinoma is less common (5-10%), occurs in the sixth to seventh decade of life and is highly malignant. Medullary carcinoma arises from para-follicular or C-cells, and is even rarer. The majority of the information that fol-lows refers to differentiated thyroid car-cinoma.
Fruit Cohort studies No cohort studies were identified by the Working Group.
101
kajob
Highlight
kajob
Highlight
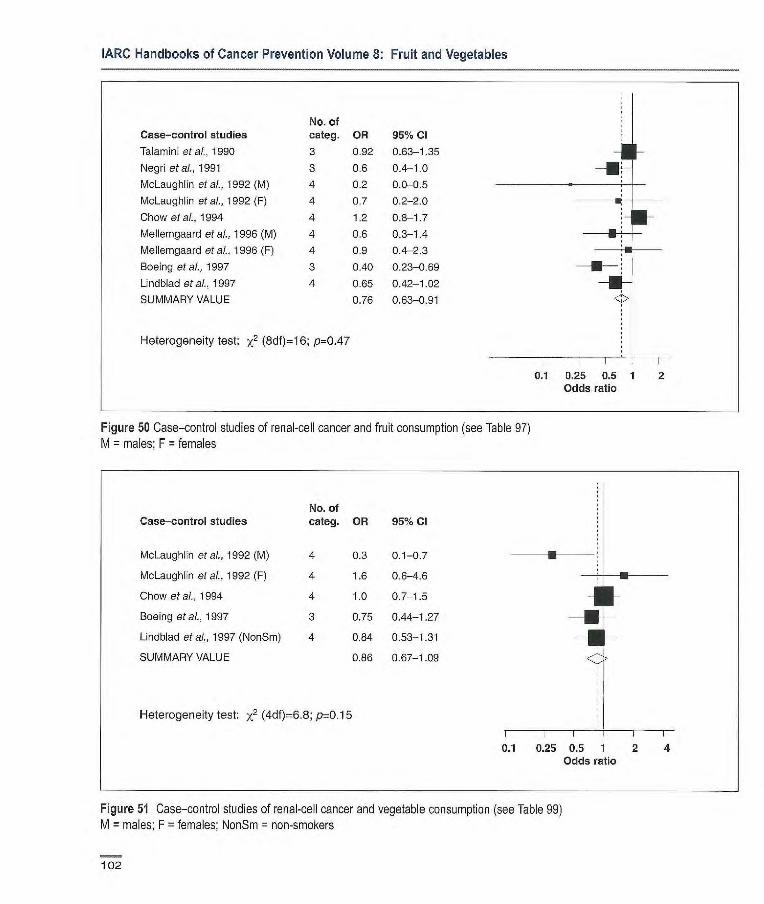
IARC Handbooks of Cancer Prevention Volume 8: Fruit and Vegetables
No. of Case-control studies categ. OR 95% Cl
Talamin etal., 1990 3 0.92 0.63-1.35 -1 - Negri etal., 1991 3 0.6 0.4-1.0 -
McLaughlin etal., 1992 (M) 4 0.2 0.0-0.5 -
McLaughlin eta]., 1992 (F) 4 0.7 0.2-2.0
Chow etal., 1994 4 1.2 0.8-1.7
Mellemgaard etal., 1996 (M) 4 0.6 0.3-1.4 -
Mellemgaard etal., 1996 (F) 4 0.9 0.4-2.3 1
Boeing etal., 1997 3 0.40 0.23-0.69
L]ndblad etal., 1997 4 0.65 0.42-1.02
SUMMARY VALUE 0.76 0.63-0.91
Heterogeneity test: x2 (8df)=1 6; p=0.47
0.1 025 0.5 1 2 Odds ratio
Figure 50 Case—cortrol studies of renal-cell cancer and fruit consumption (see Table 97) M = males; F = females
No. of Case-control studies categ. OR 95% Cl
McLaughlin et al., 1992 (M) 4 0.3 0.1-0.7
McLaughlin etal., 1992 (F) 4 1.6 0.6-4.6 -
Chow etal., 1994 4 1.0 0.7-1.5 1 F Boeing et al., 1997 3 0.75 0.44-1.27
Lindblad etal., 1997 (NonSm) 4 0.84 0.53-1.31
SUMMARY VALUE 0.86 0.67-1.09
Heterogeneity test: x2 (4df)=6.8; p0.15
r I I I
0.1 0.25 0.5 1 2 4 Odds ratio
Figure 51 Case—control studies of renal-cell cancer and vegetable consumption (see Table 99) M = males; F = females; NonSm = non-smokers
102
Cancer-preventive effects
Case—control studies Only two case—control studies have reported on the relationship between fruit consumption and thyroid cancer risk (Table 106). Neither reported a sig-nificant inverse association with total fruit consumption.
Vegetables Cohort studies No cohort studies were identified by the Working Group.
Case—control studies Three case—control studies have reported on intake of either total or green/root vegetables and their associa-tien with thyroid cancer risk (Table 107). None reported a significant inverse association for vegetable consumption.
The association between crucifer-ous vegetables and other vegetable intake and thyroid cancer risk has been systematically re-analysed in a collaborative pooled analysis of 11 case—control studies (Bosetti et al. 2002b). A significant inverse associa-tion for intake of vegetables other than cruciferous was found (OR 0.82, 95% Cl, 0.69-0.98).
Discussion Information on thyroid cancer in rela-tion to consumption of fruit and veg-etables is sparse and comes entirely from case—control studies. Although an
inverse association with consumption of vegetables other than cruciferous has been found in a collaborative re-analysis, the overall number of studies of total fruits or total vegetables was considered by the Working Group to be toc low to permit evaluation.
Non-Hodgkin lymphoma Fruit Cohort studies In two cohort studies, non-significant inverse associations between total fruit consumption and risk for non-Hodgkin lymphoma were found (Table 108).
Case—control studies In the only case—control study of total fruit consumption and non-Hodgkin lymphoma identified (Table 109), there was no evidence of an inverse associ-ation.
Vegetables Cohort studies Three cohort studies of non-Hodgkin lymphoma include data on vegetable consumption. Hirayama (1990) men-tioned malignant lymphoma as one of the end-points in relation to green-yellow vegetable consumption (Table 110), but gave no further details. In one study there was a significant inverse association for vegetable consumption, but there was no association in the other.
Case—control study In the one case—control study of total vegetable consumption and non-Hodgkin lymphoma (Table 111), there was no evidence of an inverse associa-tion.
Discussion Information on non-Hodgkin lym-phoma in relation to consumption of fruit and vegetables is sparse and comes from two cohort and two case—control studies. Although inverse associations were found, the overall number of studies of total fruits or total vegetables was considered by the Working Group to be too low to permit evaluation.
Leukaemia Fruit No studies were identified by the Working Group.
Vegetables Cohort study Hirayama (1990) included leukaemia as one of the end-points in relation to green-yellow vegetable consumption (Table 112), but gave no further details.
Case—control studies No studies were identified by the Working Group.
Relative Stat. sign risk (95% Cl)
FF0 > 466 gld vs 0.55 (0.32-
287 gld (3) 0.95)
Author, year, Cases/ country cohort
size, gender
Boeing, 2002, 124/ Europe 387144,
M,F
Exposure Range assessment contrasts (no. of items) (no. of
categories)
Adjustment for Comments confounding
Follow-up time, Incidence sex, education, Preliminary BMI, smoking, results of alcohol, energy EPIC
103
kajob
Highlight
kajob
Highlight
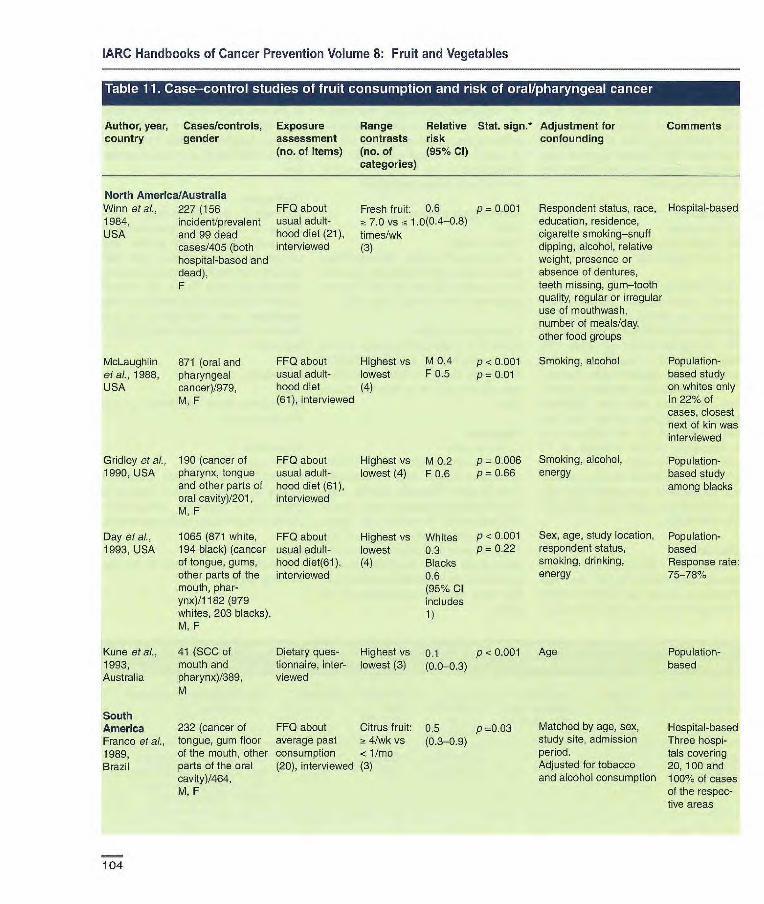
Highest vs M 0.2 p 0.006 Smoking, alcohol, Population- lowest (4) F 0.6 p = 0.66 energy based study
among blacks
Highest vs Whites lowest 0.3 (4) Blacks
0.6 (95% Cl includes 1)
P < 0.001 Sex, age, study location, Population- p = 0.22 respondent status, based
smoking, drinking, Response rate: energy 75-78%
IARC Handbooks of Cancer Prevention Volume 8: Fruit and Vegetables
Author, year, Cases/controls, Exposure Range Relative Stat. sign.* Adjustment for
Comments country gender assessment contrasts risk confounding
(no. of items) (no. of (95% Cl) categories)
North America/Australia Winn et al., 227 (156 FF0 about 1984, incident/prevalent usual adult- USA and 99 dead hood diet (21),
cases/405 (both interviewed hospital-based and dead), F
Fresh fruit: 0.6 p = 0.001 ~t 7.0 vs ac 1.0(0.4-0.8) times/wk (3)
Respondent status, race, Hospital-based education, residence, cigarette smoking—snuff dipping, alcohol, relative weight, presence or absence of dentures, teeth missing, gum—tooth quality, regular or irregular use of mouthwash, number of meals/day, other food groups
McLaughlin 871 (oral and et &., 1988, pharyngeal USA cancer)/979,
M. F
FF0 about Highest vs M 0.4 usual adult- lowest F 0.5 hood diet (4) (61), interviewed
P < 0.001 P = 0.01
Smoking, alcohol Population- based study on whites only In 22% of cases, closest next of kin was interviewed
Gridley et al., 190 (cancer of FF0 about 1990, USA pharynx, tongue usual adult-
and other parts of hood diet (61), oral cavity)/201, interviewed M, F
Day et al., 1065 (871 white, FF0 about 1003, USA 194 black) (cancer usual adult-
of tongue, gums, hood diet(61), other parts of the interviewed mouth, phar- ynx)/1 182 (979 whites, 203 blacks), M, F
Kune et al., 41 (SCC of Dietary ques Highest vs 0.1 p < 0.001 Age Population- 1993, mouth and tionnaire, inter- lowest (3) (0.0-0.3) based Australia pharynx)/389, viewed
M
South America 232 (cancer of FF0 about Citrus fruit: 0.5 p =0.03 Matched by age, sex, Hospital-based Franco et al., tongue, gum floor average past 4/wk vs (0.3-0.9) study site, admission Three hospi- 1989, of the mouth, other consumption < 1/mo period, tais covering Brazil parts of the oral (20), interviewed (3) Adjusted for tobacco 20, 100 and
cavity)/464, and alcohol consumption 100% of cases M, F of the respec-
tive areas
104

Cancer-preventive effects
Author, year, Cases/controls, Exposure Range Relative Stat. sign.* Adjustment for
Comments country gender assessment contrasts risk confounding
(no. of items) (no. of (95% Cl) categories)
Oreggia et al., 57 (3CC of the Short FF0 ~! 5 vs < 1 [0.42
p 0.03 1991, tongue)/353, times/wk (0.14—
Uruguay M (4) 125)]
De Stefani et 33 (oral and pha- FF0 Highest vs 0.7
al., 1999, ryngeal cancer)!- (64), inter- Lowest (0.4-1.3)
Uruguay 393, viewed (3)
M, F
Garrote et al., 200 (cancer of oral FF0 about life- > 13 vs < 7 0.43 (0.21— p < 0.05
2001, Cuba cavity, pharynx)/ time dietary servings/wk 0.89)
200, habits (3)
M, F
Europe Franceschi et 302 (cancer of oral FF0 about Fresh fruit: 1.1 p = 0.75 at., 1991 a, cavity, and recent diet Highest vs Italy pharynx/699, (40) lowest
M,F (3)
Negri et al., 119 (cancer of oral FF0 Highest vs 0.2 p < 0.01 1991, Italy cavity and phar- (14-37, depend- lowest (0.1-0.3)
ynx)/6147, ing on cancer (3)
M, F site)
Levi et al., 156 (oral and FF0 about diet Citrus fruit: 0.38 (0.20— p < 0.01 1998, pharyngeal cancer)/ of recent 2 >3.5 vs 0.73) Switzerland 284, years 1.5 servings!
M, F (79), inter- wk (3)
viewed Other fruit: 0.22 p < 0.01 >11 vs !~ 5.2 (0.11-0.44)
servings/wk (3)
Age, county, type of Hospital-based tobacco, smoking
intensify, total alcohol and other foods
Age, sex, residence, Hospital-based;
urban/rural status, Controls for
education, BMI, analysis of
tobacco smoking oral/pharyngeal, (pack-years), alcohol, laryngeal and
energy oesophageal cancer
Gender, age, area of Hospital-based
residence, education, smoking and drinking habits and all four major foods (starchy foods, animal foods, vegetables)
Age, sex, occupation, Hospital-based
smoking, drinking No cancer reg- istry - unknown num-
ber of cases in the area; no individual
matching per- formed, but catchment
areas of cases and controls were strictly
comparable
Age, area of residence, Hospital-based
education, smoking, Data from a
sex, vegetables network of
case—control studies
Age, sex, education, Hospital-based
smoking, alcohol and non-alcohol energy intake
105

Tavani et al., 132 (cancer of oral FF0 about 2001, cavity, pharynx, recent year Italy tongue, mouth, (25), inter-
oro-pharynx)/148, viewed M, F
Lissowska et 122 (cancers of FF0 (25), al., 2003, oral cavity and interviewed Poland pharynx)/1 24,
M, F
Sanchez et al., 375 (cancer of oral FF0 (25) 1984, USA and oropharynx)!
375, M, F
Southern Asia Jafarey et cl., 1192 (carcinoma FF0 1977, of oral cavity and Pakistan oropharynx)!
10749 from an earlier study, M, F
IARC Handbooks of Cancer Prevention Volume 8: Fruit and Vegetables
Author, year, Cases/controls, Exposure Range Relative Stat. sign.* Adjustment for Comments country gender assessment contrasts risk
confounding
(no. of items) (no. of (95% Cl) categories)
Francescbi et 598 (oral and FF0 about diet Diversity of 0.7(0.4-1.2) p <0.05 al., 1999, pharyngeal of recent two consumption: Italy cancer)! years > 6 vs < 4
1491, (78), inter- servings/wk M, F viewed (3)
Age, centre, sex, edu- Hospital-based in cation, smoking habit, specific areas energy, alcohol, num-ber of servings of all fruits and veg. con-sumed weekly
Total fruit: 0.34 p <0.05 Age, sex, education, Hospital-based > 13 vs <7 (0.13-087)
total number of portions/wk
portions, smoking, (3)
alcohol
~! 71wk vs 0.40 p < 0.01 Gender, age. residence, Hospital-based < 3 wk (3) (0.17-0.95) smoking, alcohol
11 vs < 6 0.52 p < 0.001 Gender, age, centre, Hospital-based, servings/wk (0.34-0.79) years of schooling, three areas of (3) smoking, alcohol Spain
5-7 times! Males: Population-based wk [0.08 (0.06- Only frequencies vs < 1/wk 0.12)] of fruit and veg. (4) Females: consumption of
[0.10 (0.07- males and females 0.15)] in five categories
reported
Notani & 278 (cancer of Jayant, 1987, oral cavity) plus India 225 (pharyngeal
cancer)121 5 (hospital-based, H) and 177 (from population, P)
FF0 about At least Oral cavity: usual diet once aweek H:[1.15 before onset of vs less than (0.77- the disease once a 1.67)]
week (2) P:[1.12 (0.71-2.0)] Pharynx: H:[1.16 (0.77- 1.67)] P:[1.01 (0.63-1.67)]
Age, tobacco habits Partly hospital- based, partly population-based
Rajkumar et 591 (cancers of FF0 (21), a 4 vs 2 0.55 p < 0.001 Age, sex, centre, Hospital-based al., 2003b, oral cavity)/582, interviewed
servings/wk (0.38-0.81) education, chewing, India M, F
(3) smoking, alcohol
106
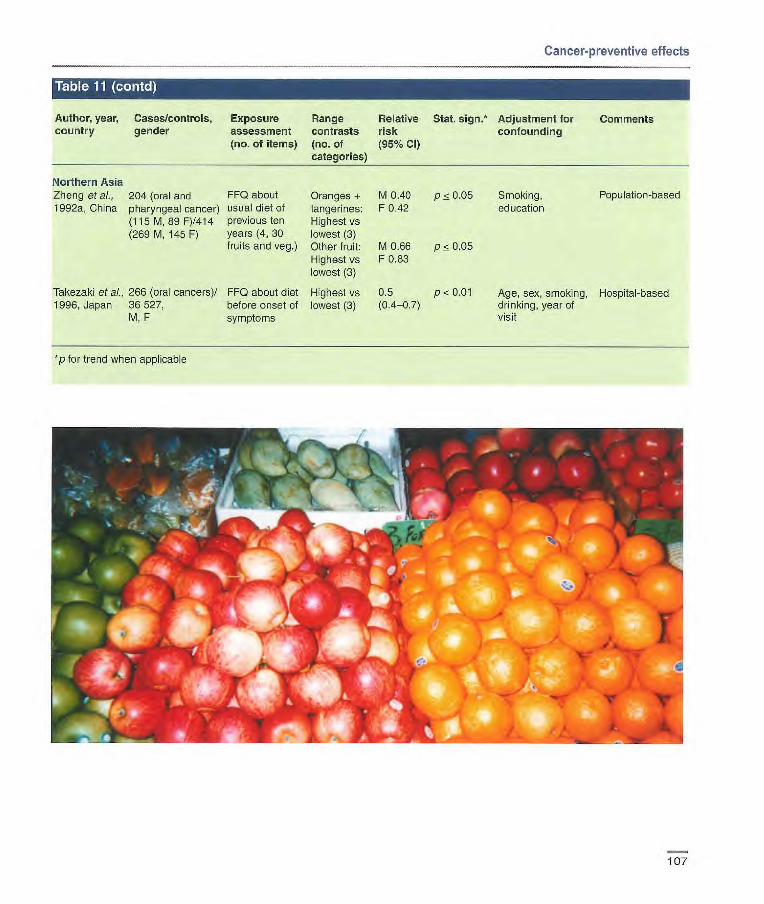
Cancer-preventive effects
Author, year, Cases/controls, Exposure Range Relative Stat. sign.* Adjustment for Comments country gender assessment contrasts risk confounding
(no. of items) (no. of (95% Cl) categories)
Northern Asia Zheng et al., 204 (oral and FF0 about Oranges + M 0.40 p ~ 0.05 1992a, China pharyngeal cancer) usual diet of tangerines: F 0.42
(115 M, 89 F)!414 previous ten Highest vs (269 M, 145 F) years (4, 30 lowest (3)
fruits and veg.) Other fruit: M 0.66 p <0.05 Highest vs F 0.83 lowest (3)
Takezaki et al., 266 (oral cancers)/ FF0 about diet Highest vs 0.5 p < 0.01 1 996, Japan 36 527, before onset of lowest (3) (0.4-0.7)
M, F symptoms
Smoking, Population-based education
Age, sex, smoking, Hospital-based drinking, year of visit
*p for trend when applicable
107

IARC Handbooks of Cancer Prevention Volume 8: Fruit and Vegetables
Author, year, Cases/controls, Exposure Range Relative Stat. Adjustment for Comments country gender assessment contrasts risk sign.* confounding
(no. of items) (no. of (95% Cl) categories)
North America/Australia
Winn et ai., 227 (156 FFQ about Green leafy 0.7 p = 0.06 Respondent status, Hospital-based 1984, incident/prevalent usual adulthood veg: ~t 7.0 vs (0.5-1.1) race, education,
USA cases and 99 diet fc 2.0 residence, cigarette dead cases)/405 (21), inter- limes/wk smoking—snuff dipping, (both hospital- viewed (3) alcohol, relative weight, based and dead), presence or absence F Other veg.: 01 p 0.08 of dentures, teeth
7.1 vs < (0.4-1.3) missing, gum-tooth
6.9 times/wk qualïty, regular or not
(3) regular use of mouth- wash, number meals/day, other food groups
McLaughlin et 871 (oral and FF0 about Highest vs M tO p = 0.69 Smoking, alcohol Population based
al., 1988, USA pharyngeal usual adulthood lowest F 0.8 p = 0.20 study of Whites cancer)/979, diet (4) only M, F (61), inter- In 22% of oases
viewed closest next of kin was interviewed
Gridley et al., 190 (cancer of FF0 about Highest vs M 0.3 p= 0.004 Smoking, alcohol, Population-based
1990, USA pharynx, tongue, usual adulthood lowest F 0.8 p = 0.92 energy study among
and other parts of diet (61), inter- (4) Blacks
oral cavity)/201, viewed M, F
Day etal., 1065 (871 whites, FF0 about Highest vs Whites 0.8 p=0.15 Sex, age, study Population-based
1993, USA 194 blacks) usual adulthood lowest Blacks 0.5 P = 0.07 location, respondent (cancer of tongue, diet(61), inter- (4) (95%01 status, smoking, gums, other parts viewed includes 1) drinking, energy of the mouth, pharynx)J1 182 (979 whites, 203 blacks), M, F
Kune et al., 44 (SCC of mouth Dietary ques- Highest vs 0.3 p 0.001 Age Population-based
1993, and pharynx)/398, tionnaire, inter- lowest (3) (0.1-0.8) Australia M viewed
South/Central America
Franco et al., 232 (cancer of FF0 about Green veg.: 0.7 Matched by age, sex, Hospital-based
1989, tongue, gum, floor average past 4/wk vs < (0.4-1.4) study site, admission Three hospitals
Brazil of mouth, other consumption 1/mo (3) period covering 20, 100
parts of oral (20), interviewed Adjusted for tobacco and 100% of
cavity)/464, M, F and alcohol cases of the
consumption respective areas
108
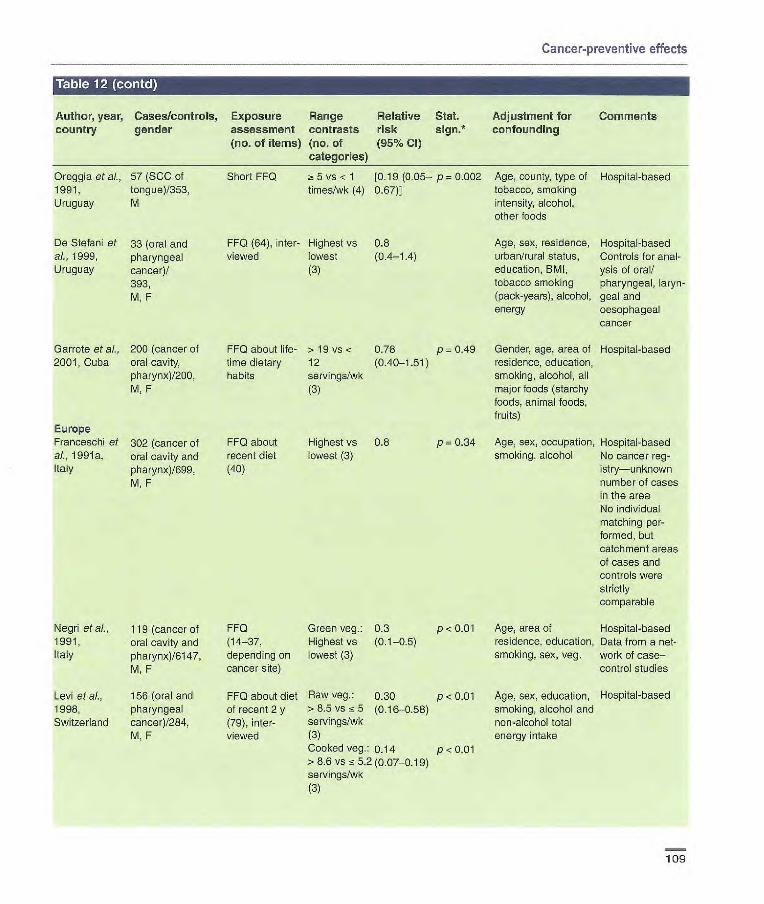
Cancer-preventive effects
Author, year, country
Cases/controls, gender
Exposure Range assessment contrasts (no. of items) (no. of
categories)
Relative Stat. risk sign.*
(95% Cl)
Adjustment for confounding
Comments
Oreggia etal., 57 (SCC cf Short FF0 ~! 5 vs < 1 [0.19 (0.05– p= 0.002 Age, county, type of Hospital-based 1991, tongue)/353, times/wk (4) 0.67) tobacco, smoking Uruguay M intensity, alcohol,
other foods
De Stefani et 33 (oral and FF0 (64), inter- Highest vs 0.8 Age, sex, residence, Hospital-based aL, 1999, pharyngeal viewed lowest (0.4-1.4) urban/rural status, Controls for anal- Uruguay cancer)! (3) education, BMI, ysis of oral!
393, tobacco smoking pharyngeal, laryn- M, F (pack-years), alcohol, goal and
energy oesophageal cancer
Garrote et ai., 200 (cancer of 2001, Cuba oral cavity,
pharynx)/200, M, F
Europe Franceschi et 302 (cancer of al., 1991 a, oral cavity and Italy pharynx)/699,
M, F
FF0 about life- > 19 vs < 0.76 p = 0_49 time dietary 12 (0.40-1.51) habits servings/wk
(3)
FF0 about Highest vs 0.8 p = 0.34 recent diet lowest (3) (40)
Gender, age, area of Hospital-based residence, educalion, smoking, alcohol, all major foods (starchy foods, animal foods, fruits)
Age, sex, occupation, Hospital-based smoking, alcohol No cancer reg-
istry—unknown number of cases in the area No individual matching per-formed, but catchment areas of cases and controls were strictly comparable
Negri et al., 119 (cancer of FF0 Green veg.: 0.3 p < 0_01 Age, area et Hospital-based 1991, oral cavity and (14-37, Highest vs (0.1-0.5) residence, education, Data from a net- Italy pharynx)/6147, depending on lowest (3) smoking, sex, veg. work of case–
M, F cancer site) control studies
Levi et al., 156 (oral and FF0 about diet Raw veg.: 0.30 p < 0_01 Age, sex, education, Hospital-based 1998, pharyngeal of recent 2 y >8.5 vs 15 5 (0.16-0.58) smoking, alcohol and Switzerland cancer)/284, (79), inter- servings/wk non-alcohol total
M, F viewed (3) energy intake Cooked veg.: 0.14 p<0.01 >8.6 vs 5.2(0.07-0.19) servings/wk (3)
109

IARC Handbooks of Cancer Prevention Volume 8: Fruit and Vegetables
Author, year, Cases/controls, Exposure Range Relative Stat. Adjustment for Comments country gender assessment contrasts risk $jgfl•* confounding
(no. of items) (no. of (95% Cl) categories)
Franceschi et 598 (oral and FF0 about diet Diversity of 0.6 NS Age, centre, sex, Hospital-based in at, 1999, pharyngeal of recent two consump- (0.3-1.0) education, smoking, specific areas Italy cancer)/1 491, years tien: energy, alcohol,
M, F (78), inter- ~ 7 vs <4 number of servings of viewed servings/wk all fruits and veg. con-
(3) sumed weekly
Tavani et al., 132 (cancer of FF0 about Total green 0.37 p < 001 Age, sex, educatlon, Hospital-based 2001, Italy oral cavity, recent year (25), veg:> 13 vs (0.16-088) total number of
pharynx, tongue, interviewed <7 portions/ portions, smoking, mouth/ wk alcohol 148, (3)
M, F
Lissowska et 122 (oral cavity, FF0 (25), inter- - 9/wk vs 0.17 (0.07— p < 0.01 Gender, age, resi- Hospital-based al., 2003, and pharynx)/124, viewed 6/wk (3) 0.45) dence, smoking, Poland M, F alcohol
Sanchez et al., 375 (cancer of FF0 (25) = 8 vs <3 0.54 (0.34— p 0.001 Gender, age, centre, Hospital-based, 2003, Spain oral cavity and servings/wk 0.79) years of schooling, three areas in
oropharynx)/375, (3) smoking, alcohol Spain M, F
Southern Asia Jafarey et al., 1192 (carcinoma 1977, of oral cavity and Pakistan oropharynx)!
10 749 from an earlier study, M, F
Notani & 278 (cancer of Jayant, 1987, oral cavity) plus India 225 (pharyngeal
cancer)/21 5 (hospital, H) and 177 (population, P), M
FF0 5-7 times a M: [0.40 week vs (0.29-0.56)] once a week F: [0.47 or less (3) (0.31-0.76)1
FF0 about Daily vs not Oral cavity usual diet before daily H: [1.05 onset of the (2) (0.71-1.67)] disease P: [0.42
(0.25-0.71)] Pharynx H: [1.03 (0.67-1.67)] P: [0.38 (0.22-0.63)]
Population based Only frequencies of fruit and veg. consumption in 5 categories reported
Age, tobacco habits Partly hospital- based, partly population-based
Rajkumar et 591 (cancers of FF0 (21), ~! 14 vs 7 0.44 p = 0.002 Age, sex, centre, Hospital-based a/., 2003b, oral cavity)/582, interviewed
servings/wk (0.28-0.69) education, chewing,
India M, F
(2) smoking, alcohol
110

Cancer-preventive effects
Author. year, country
Cases/controls, gender
Exposure assessment (no. of items)
Range contrasts (no. of categories)
Relative risk (95% CI)
Stat. sign.'
Adjustment for Comments confounding
Northern Asia Zheng et ai., 204 (oral and FF0 about Dark green M 1.37 NS Smoking and Population-based 1992a, pharyngeal usual diet of veg.: F 1.22 NS education China cancer), 115 M, 89 the previous Highest vs
F)/414 (269 M, ten years lowest (3) 145 F) (41, 30 fruits Dark yellow M 0.32 p< 0.05
and veg.) veg.: F078 NS Highest vs lowest (3) Raw veg.: M 0.45 p < 0.05 Highest vs F 1.18 NS lowest (3)
Takezaki et ai., 266 (oral can- FF0 about Green-yellow 1.0 (0.7 p> 0.05 Age, sex, Hospital-based 1 996, cers)/36 527, diet before veg.: —1.3) smoking, Japan M, F onset of the Highest vs drinking, year of
symptoms lowest (3) visit Raw veg: 0.5 (0.4 p < 0.01 Highest vs —0.7) lowest (3)
*p for trend when applicable
Author, year, Cases/controls, Exposure Range country gender assessment contrasts
(no. of (no. of items) categories)
Winn et ai., 227 (156 incident/- FF0 about > 21 vs 11 1984, USA prevalent cases usual adult- times/wk (3)
and 99 dead hood diet cases/405 (both (21), inter- hospital-based viewed and dead)
Gridley etal., 1103 (oral and FIFO, inter- 1992, USA pharyngeal can- viewed
cers)/1 262, M, F
*p for trend when applicable
Relative Stat. Adjustment for Comments risk sign.* confounding (95% CI)
0.5(0.3-0.8) p=0.0002 Respondent statua, race, Hospital- education, residence, based cigarette smoking snuff dipping, alcohol, relative weight, presence or absence of dentures, teeth missing, gum-tooth quality, regular or irregu-lar use of mouthwash, number of meals/day, other food groups
Race, sex, tobacco and Population- alcohol use based
Highest vs No vitamin E lowest (4) supplement:
0.6 Vitamin E sup-plement: 0.2
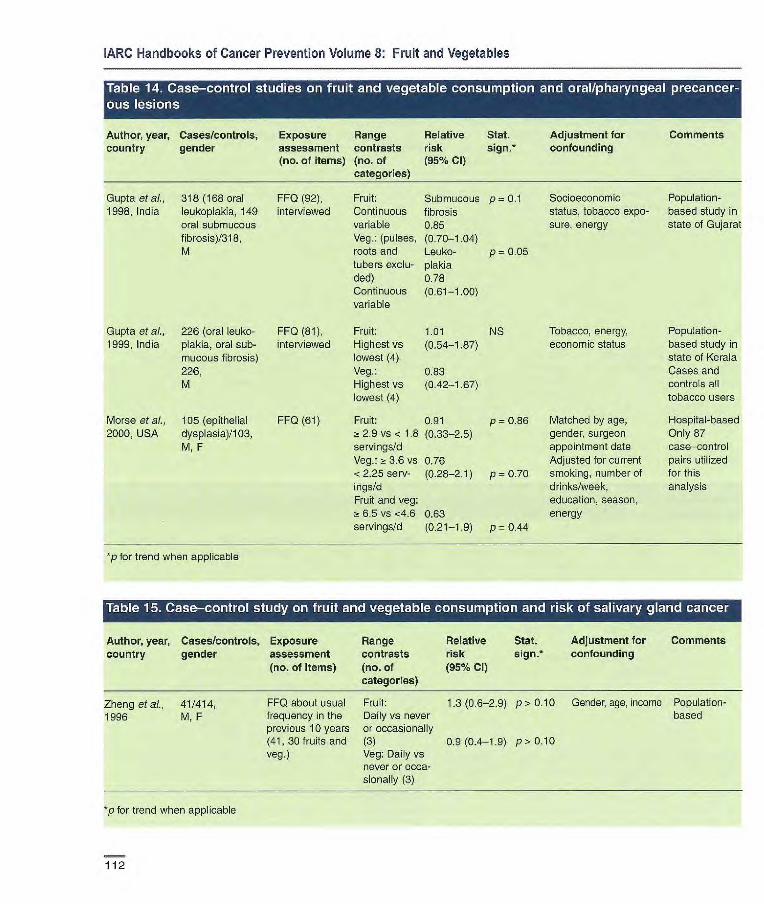
IARC Handbooks of Cancer Prevention Volume 8: Fruit and Vegetables
ous rr.i Author, year, Cases/controls, Exposure Range Relative Stat. Adjustment for Comments country gender assessment contrasts risk sign.* confounding
(no. of items) (no. of (95% Cl) categories)
Gupta etal., 318 (168 oral FF0 (92), Fruit: Submucous p = 0.1 Socioeconomic Population- 1998, India leukoplakia, 149 interviewed Continuous fibrosis status, tobacco expo- based study in
oral submucous variable 0.85 sure, energy state of Gujarat fibrosis)/318, Veg.: (pulses, (0.70-1.04) M roots and Leuko- p = 0.05
tubers exclu- plakia ded) 0.78 Continuous (0.61-1.00) variable
Gupta etal., 226 (oral leuko- FF0 (81), Fruit: 1.01 NS Tobacco, energy, Population- 1999, India plakia oral sub- interviewed Highest vs (0.54-1.87) economic status based study in
mucous fibrosis) lowest (4) state of Kerala 226, Veg.: 0.83 Cases and M Highest vs (0.42-1.67) controls all
lowest (4) tobacco users
Morse et al., 105 (epithelial FF0 (61) Fruit: 0.91 p = 0.86 Matched by age, Hospital-based 2000, USA dysplasia)/103, ~! 2.9 vs < 1.8 (0.33-2.5) gender, surgeon Only 87
M, F servings/cl appointment date case—control Veg.: a 3.6 vs 0.76 Adjusted for current pairs utilized <2.25 serv- (0.28-2.1) p = 0.70 smoking, number of for this ings/d drinks/week, analysis Fruit and veg: education, season,
6.5 vs <4.6 0.63 energy servings/d (0.21-1.9) p = 0.44
*p for trend when applicable
Table 15. Case-control study on fruit and vegetable consumption and risk of salivary gland cancer
Author, year, Cases/controls, Exposure Range Relative Stat. Adjustment for Comments country gender assessment contrasts risk sign.* confounding
(no. of items) (no. of (95% Cl) categories)
Zheng etal., 41/414, FF0 about usual Fruit: 1.3(0.6-2.9) p> 0.10 Gender, age, income Population- 1996 M, F frequency in the Daily vs never based
previous 10 years or occasionally (41,30 fruits and (3) 0.9 (0.4-19) p> 0.10 veg.) Veg: Daily vs
never or occa- sionally (3)
p for trend when applicable
112

Cancer-preventive effects
Author, year, Country
Cases/controls, Exposure gender assessment
(no. of items)
pharynx isrJ
Range contrasts (no. of categories)
.1 LA'i'I I}1' liii
Relative risk (95% Cl)
LJ I t II L I
Stat. sign.
I L-i 1.1 cancer L' .J I naso-
Adjustment for Comments confounding
Armstrong 282/282, FF0 about diet Oranges/tan- 0.52 p < 0.01 Population- et al., 1998, M, F five years germes: (0.31085)1 based Malaysia before diag-nosisweekly vs < 0.98
and at monthly (3) (0.51-1.86)2
age 10 y (55), Chinese 0.64 p < 0.1 interviewed flowering (0.401.04)1
cabbage: 0.47 weekly vs < (0.29_077)2 weekly (2) 0.50 Other veg.: (0.231.07)1 weekly vs < 0.59 monthly (0,33-1.06)2 (3) 1 diet of
recent 5 y 2 diet at age 10
Yu et al., 1989, 306/306, FF0 Oranges/tan- 0.3 (0-1-0-9)1 p < 0.05 Neighbour- China M, F as reported by germes: 0.0 (0.0_0.)2 NS hood controls
mother: 110 Diet at age Analysis of mothers of 10 y: daily vs subjects' diet cases/1 39 rarely (4) as reported by mothers of Diet at age mothers controls 1-2 y: weekly Only 82
vs rarely (3) matched Diet of children Other fresh 0.6 (0.3_1.2)1 NS case—mother aged 10 y (41) fruit: 0.3 (0.1_1.1)2 NS control—mother and aged 1-2 Diet at age pairs y(19) lOy: daily vs
rarely (4) Diet at age 1-2 y; weekly vs rarely (3) Fresh green [0.59 NS veg.: children (0.20-1.67)]' diet at age 10 LO.77 NS y: daily vs less (0.20_3.33)]2 than daily (2) children diet at 1 during ages age 1-2 y: 1-2 y weekly vs 2 at age 10 y rarely (3)
*p for trend when applicable
113

IARC Handbooks of Cancer Prevention Volume 8: Fruit and Vegetables
Author, year, Cases/cohort Exposure Range Relative Stat. sign.* Adjustment for Comments country size, gender assessment contrasts risk confounding
(years follow-up) (no. of items) (no. of (95% Cl) categories)
Yu etal., 1993, 1162/12 693, Interview Fresh fruit: 0.99 p> 0.1 Age, sex Incidence
China M, F regular or (0.85-1.15) Interviews per- 15 y occasional vs formed in 1989
never in subjects (2) recruited in
1974 for screening
Guo et al., 1994, 639/3200, FF0 for diet Fresh fruit: 0.9 NS Years of Incidence China M, F, during the past ~! once vs (0.8—ti) smoking, Nested
5 y 12 months, none/mo (2) cancer history case—control interviewed in first-degree study in ran-
relatives domized control trial
Sauvaget et al., 80/38540, FF0 (22), self- Daily vs 0.57 p 0.07 Sex, age, radia- Mortality
2003, Japan M, F administered once/wk or (0.31-1.04) lion dose, city, Atomic 17 y less (3) BMI, smoking bombing
status, alcohol, survivors education level
*p for trend when applicable
Author, year, Cases/controls, Exposure Range Relative Stat. sign.' Adjustment for Comments country gender assessment contrasts risk confounding
(no. of items) (no. of (95% Cl) categories)
North America Ziegler et aL. 120/250, M, black FF0 about Highest [0-50] p < 0.05 Alcohol
1981, subjects' usual vs lowest
USA adult diet before (3) 1974(31,3 fruits), inter-viewed
Population-based Deaths from oesophageal cancer (cases) or other caus-es (controls) Interviews with next of kin completed for 67% of cases and 71% of controls
Hospital- and population-based Incidence series
Brown et ai., Incidence:
FF0 about usual Highest vs 0.5 (0.3-0.9) p < 0.01 Use of ciga- 1986, 74/157, M
adult diet, inter- lowest rettes and
USA Mortality: viewed (3) alcohol
143/285, M
114

Cancer-preventive effects
Author, year, Cases/controls, Exposure Range Relative Stat. sign.* Adjustment for Comments country gender assessment contrasts risk confounding
(no. of items) (no. of (95% Cl) categories)
Brown et ai., 174 ADC/750, M FF0 about Highest vs 1995, (white) usual adult diet lowest
USA (60), inter- (4) viewed
Brown et al., 333 9CC (114 FF0 about Highest vs 1998, USA white, 219 black)/ usual adult diet lowest
1238 (681 whites, (60) (4) 557 black), M
Chen et at., 124 (ADC)/449, Short FF0 Citrus fruit
2002a, USA M, F about diet and juices: before 1985 Highest vs (54), inter- lowest (4) viewed by telephone
South America Victora et al., 164 SCC/327
FF0 (9), inter- log days/mo 0.66 p = 0.002
1987, Brazil M, F
viewed +1 (90% Cl 0.52-083)
De Stefani et al., 261 8CC! 522, FF0 cf recent Daily vs z 0.33 1990b, Uruguay M, F
diet, inter- onc&wk (0.2-0.5) viewed (4)
Castelletto et al., 131(9CC)! 262, FF0 about Citrus fruit: 1.6 (0.8-3.1) 1994, Argentina M, F recent diet and > 3/wk vs <
diet 10 y before 1/wk (3) admission Non-citrus fruit; 0.7 (0.3-1.5) (10), inter- > 3/wk vs < viewed 1/wk (3)
Rolôn et al., 131/381, FF0 about Citrus fruit: 0.8 (0.4-1.7) p = 0.43 1995, M, F current diet Highest vs
Paraguay (50), inter- lowest (4) viewed Non-citrus fruit: 0.9 (0.4-2.1) p 0.98
Highest vs low- est (4)
Age, area, Population- smoking, liquor based use, income, energy, DM1
Age, area, Population- smoking, alcohol, based energy
Age, sex, Population- energy, based respondent type, For 76% of BMI, alcohol, cases and for tobacco, 61% of con- education, trois, inter- family history, views con- vitamin supple- ducted with ment use, age next of kin squared
Cachaça drinking, Hospital- residence, smok- based ing status, fruit and meat con- sumption
Age, residence, Hospital- smoking duration, based type of tobacco, alcohol
Age, sex, hospital, Hospital- education, aver based age number of cigarettes/day, alcohol, barbe- cued neat, pota- toes, raw and cooked veg.
Lifetime consum- Hospital- ption of alcohol, based cigarette smoking, age group, sex, hospital group, meats, fats, fish, milk
0.7 p = 0.24
White: 0.5 p=0.04 Black: 0.4 p = 0.001
0.48 p = 0.03 (0.21-1.1)
115
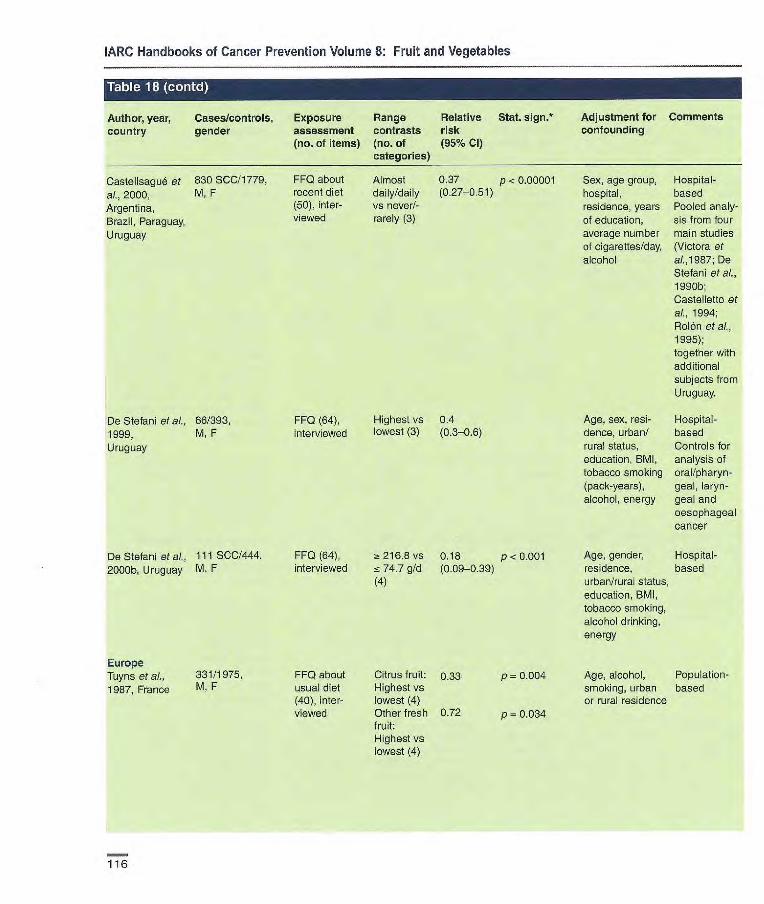
IARC Handbooks of Cancer Prevention Volume 8: Fruit and Vegetables
Table 18
Author, year, Cases/controls, Exposure Range Relative Stat. sign.* Adjustment for Comments country gender assessment contrasts risk confounding
(no. of items) (no. of (95% Cl) categories)
Castelisagué et 830 SCC11779, al., 2000, M, F Argentina, Brazil, Paraguay, Uruguay
Dc Stefani ci aL. 86/393, 1999, M, F Uruguay
De Stetani et al., 111 SCC/444, 2000b, Uruguay M, F
FF0 about Almost 0.37 p < 0.00001 recent diet daily/daily (0.27-0.51) (50), inter- vs never!- viewed rarely (3)
FF0 (64), Highest vs 0.4 interviewed lowest (3) (0.3-0.6)
FFQ(64), 216.8 vs 0.18 p<0.00l interviewed 74.7 g/d (0.09-0.39)
(4)
FF0 about Citrus fruit: 0.33 p 0.004 usual diet Highest vs (40), inter- lowest (4) viewed Other fresh 0.72 p = 0.034
fruit: Highest vs lowest (4)
Sex, age group, Hospital- hospital, based residence, years Pooled analy- of education, sis from four average number main studies of cigareftes/day, (Victora et alcohol al.,1987; De
Stefani etaL, 199Gb; Castelletto et al., 1994; Rolón etal., 1995); together with additional subjects from Uruguay.
Age, sex, resi- Hospital- dence, urban/ based rural status, Controls for education, BMI, analysis of tobacco smoking oral/pharyn- (pack-years), geai, laryn- alcohol, energy geai and
oesophageal cancer
Age, gender, Hospital- residence, based urban/rural status, education, BMI, tobacco smoking, alcohol drinking, energy
Age, alcohol, Population- smoking, urban based or rural residence
Europe Tuyns et al., 331/1975, 1987, France M. F
116

Cancer-preventive effects
I_1 61 1; fA(1i'JI
Author, year, country
R' I
Cases/controls, gender
Exposure assessment (no. of items)
Range contrasts (no. of categories)
Relative Stat. sign. risk (95% Cl)
Adjustment for confounding
Comments
Francesehi et al., 68/505, FF0 about diet Fresh fruit: [0.49] Hospital- 1990, M of last year 13 vs 4 based Italy (40), inter- servings/wk No cancer
viewed (3) registry, unknown number of cases in the area OR computed from distribu- tion of intake
Negri etal., 1991, 294/6147, FF0 Highest vs 0.3 (0.2-0.4) p< 0.01 Age, area of Hospital- Italy M, F (14-37, lowest residence, educa- based
depending on (3) tion, smoking, Data from a cancer site) sex, veg. network of
case—control studies
Tzonou eta]., 43 SCC plus 56 FF0 about Highest vs SCC: 0.90 p 0.49 Gender, age, birth- Hospital- 1996a, Greece ADC/200, diet 1 y before lowest (0.67-1.21) place, schooling, based
M, F onset of the (5) ADC: 0.84 p = 0.17 height, analgesics, disease (115) (0.65-1.08) coffee drinking, interviewed alcohol, smoking,
energy
Launoy et at., 208 SCC/399, FF0 about Fresh fruit: 0.59 p < 005 Age, interviewer, Hospital- 1998, France M diet of previous > 180 vs < (0.35-1.00) smoking, beer, based
year (39), inter- 60 g/d (4) aniseed aperitifs, viewed Citrus fruit: 0.54 p < 005 hot Calvados,
> 60 vs < 20 (0.33-0.89) whisky, total alco- g/d (4) hot, energy
Bosetti et al., 304 (SCC)/743, FF0 about diet Citrus fruit 0.42 p < 0_01 Age, sex, area of Hospital- 2000a, Italy M, F 2 y before diag- (5) (0.25-0.71) residence, educa- based in spe-
nosis (78), Other fruit 0.52 p < 0.05 tien, smoking, olfic areas interviewed (5) (0.31-0.87) alcohol, non-
alcohol energy
Levi et at., 2000, 101 (SCC and FF0 about diet Citrus fruit: 0.22 p <0.01 Age, sex, educa- Hospital- Switzerland ADC)/ 327, of recent 2 y > 3.5 vs (0.1-0.6) tion, smoking, based
M, F (79), 1.5 serv- alcohol and Interviewed ings/wk (3) non-alcohol
Other fruit: 0.20 p < 0.01 energy >3.5vs 25 (0.1-0.4) 1.5 serv- ings/wk (3)
117
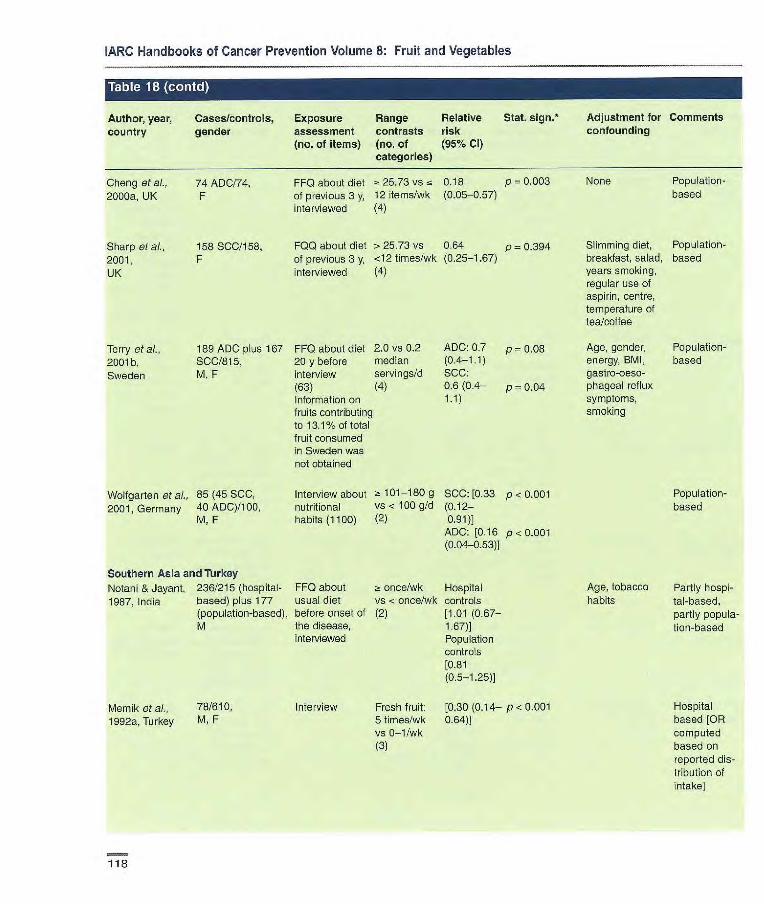
IARC Handbooks of Cancer Prevention Volume 8: Fruit and Vegetables
Table 1 (contd) r I
Author, year, Cases/controls, Exposure Range Relative Stat. sign.* Adjustment for Comments country gender assessment contrasts risk confounding
(no. of items) (no. of (95% Cl) categories)
Cheng et al., 74 ADC/74, 2000a, UK F
Sharp et al., 158 SCC/158, 2001, F UK
FFQ about diet - 25.73 vs ~i 0.18 p 0.003 of previous 3 y, 12 items/wk (0.05-0.57) interviewed (4)
F00 about diet > 25.73 vs 0.64 p 0.394 of previous 3 y, <12 times/wk (0.25-1.67) interviewed (4)
None Population- based
Slimming diet, Population- breakfast, salad, based years smoking, regular use of aspirin, centre, temperature of lea/coffee
Terry et aL, 189 ADC plus 167 FF0 about diet 2.0 vs 0.2 ADO: 0.7 p = 0.08 Age, gender, Population- 2001b, SCC/815, 20 y before median (0.4-1.1) energy, BMI, based Sweden M, F interview servings/d SOC: gastro-oeso-
(63) (4) 0.6(0.4— p 0.04 phageal reflux Information on 1.1) symptoms, fruits contributing smoking to 13.1% of total fruit consumed in Sweden was not obtained
Wolfgarten et al., 85 (45 SOC, Interview about 1: 101-180 g SOC: [0.33 p < 0.001 2001, Germany 40 ADC)/100, nutritional VS < 100 g/d (0.12-
M, F habits (1100) (2) 0.91) ADO: [0.16 p<0.001 (0.04-0.53)]
Southern Asia and Turkey Notarli & Jayant, 236/215 (hospital- FF0 about a once/wk Hospital 1987, India based) plus 177 usual diet vs < once/wk controls
(population-based), before onset of (2) [1.01 (0.67- M the disease, 1.67)]
interviewed Population controls [0.81 (0.5-1.25)]
Memik et at., 78/610, Interview Fresh fruit: [0.30 (0.14— p< 0.001 1992e, Turkey M, F 5 times/wk 0.64)]
vs 0-1/wk (3)
Population-based
Age, tobacco
Partly hospi- habits tal-based,
partly popula-tion-based
Hospital based [OR computed based on reported dis-tribution of intake
118

Cancer-preventive effects
Author, year, country
Cases/controls, gender
-
Exposure assessment (no. of items)
Range contrasts (no. of categories)
Relative Stat. 5jgfl*
risk (95% CI)
Phukan etal., 502/1004 Interview Ocoasonally 0.3 p <0.01 2001, India vs never (0.08-4.2)
(2)
Onuk etal., 2002, 44/100, M, F Information on Highest vs [0.14 p <0.001 Turkey dietary habits lowest (2) (0.06-
0.31)
Northern Asia Chang-Claude et 52 Subjects diag- FF0 about diet Fresh fruit 0.31
al., 1990, China nosed with in the past 5 y in summer: (0.15-0.60) oesophagitis (42 1/wk vs -r M, 10 F)1486 (312 1/wk(2) M, 174 F)
Li etal., 1989, 1242 (SCC, ADC FF0 of diet in Fresh fruit: 1.0 China and unknown types the late 1970s > 35 vs 0 (0.8-1.2)
of oesophageal (recent) (72), times/y (4) cancer)/1 311, interviewed M, F
400 (5CC, ADC FF0 about Citrus fruit 0.096 p < 0.001 and other)/1 598, recent diet Daily or more (0.036- M, P (22). inter- vs -r once/v 0.26)
viewed (6) Other fruit: 0.15 p -r 0.001 Dally or more (0.05-0.45) vs <once/y (6)
FF0 of diet 5 y Highest vs M 0.6 p -r 0.001 before interview lowest F 0.6 p 0.11 (81), inter- (4)
viewed
Adjustment for Comments confounding
Hospital-based
Hospital-based
Household Population- status, age, based gender, oesopha- All subjects g tie among underwent siblings cesophago-
scopy with biopsy. One third of sub- jects selected from a house- hold with a case of oeso- phageal cancer
Age, sex, Population- smoking based
Age, educational Hospital- attainment, based birthplace Chinese pop-
ulation
Age, education, Population- birthplace, tea based drinking, smoking and alcohol (only for men)
Cheng etal., 1992a, Hong Kong
Gao et al., 1994, 902 (624 M, 278 China F)/1552(85
M, 701 F)
Hu etal., 1994, 196/392, FF0 about Highest vs 1.5 p = 0.29 Alcohol, smoking, Hospital- China M, F recent diet and lowest (4) (0.8-2.9) income, occupa- based
diet in 1966 tion (32), (inter- viewed, no men- tion which data were used)
119

IARC Handbooks of Cancer Prevention Volume 8: Fruit and Vegetables
'Table I:I(iWi
Author, year, Cases/controls, Exposure Range Relative Stat. 5jgfl* Adjustment for Comments country gender assessment contrasts risk confounding
(no. of items) (no. of (95% CI) categories)
Hanaoka et al., 139/136, FF0 of diet 5-7 vs < OE50 p = 0.19 Alcohol Hospital- 1994, Japan M before onset of 1/s/k (4) (0.18-1.39) based
the disease
Cheng et aI., 67 never-smokers FFQ about Citrus fruit: Never p = 0.007 Gender, age, Hospital-
1995, and 53 never- recent diet Daily vs 3 smokers: educational attain- based
Hong Kong drinkers! (22), inter- times/wk 0.39 ment, place of Chinese 539 never- viewed (3) (0.16-0.98) birth, preference population smokers, 407 never- Never p 0.183 for hot drinks or drinkers, drinkers: soups, green leafy M, F 0.59 veg., pickled veg.,
(0.23-1.52) alcohol, tobacco
Gao et al., 1999, 81/234, FF0, inter- z. once/wk 0.75 Age, sex Population- China M, F viewed VS < once! (0.36-1.55) based
me (3)
Yokoyama et aL 234/634, FF0 (na) Almost [0.78 Age Hospital-
2002, Japan M every day (0.28-2.17)] based. Con- vs seldom trois were (5) attending for
health check- ups
p for trend when applicable. ADC, adenocarcinoma; SCC, squamous-cell carcinoma
120

Cancer-preventive effects
Author, year, Cases/cohort Exposure Range Relative Stat. Adjustment for Comments country size, gender assessment contrasts risk sign.* confounding
(years follow-up) (no. of items) (no. of (95% Cl) categories)
Hirayama, 1990, 585/265 118, FF0 (7) Green- 1.06 Age-adjusted Mortality Japan M, F yellow veg.: (90% Cl, rates Census-based
17 y Daily vs non- 0.91-1.24) Cohort in daily (2) seven Prefec-
tures
Yu et al., 1993, 1162/12 693. Interview Fresh veg.: 0.66 p 0.044 Age, sex Incidence China M, F about diet Regular, (0.44-0.99) Interviews per-
15 y occasionaily formed in 1989 vs never (2) in subjects
recruited in 1974 for screening
Guo et al.,1 994, 639/3200, FF0 for diet dur- Fresh veg.: 0.8 p 0.08 Years of Incidence China M. F ing the past 12 a 60 vs zs 30 (0.6—t0) smoking, cancer Nested
months times/mo history in first- case—control (3) degree study in
relatives randomized control trial
Sauvaget eta! 80/38540, FF0 (22) self- Green- 0.89 p 0.63 Sex, age, radia- Mortality 2003, M, F administered yellow veg.: (0.4B-1.C)3) tion dose, city, Atomic bomb- Japan Daily vs BMI, smoking ing survivors
once/wk or status, alcohol less (3) habits, education
level
p for trend when applicable
121
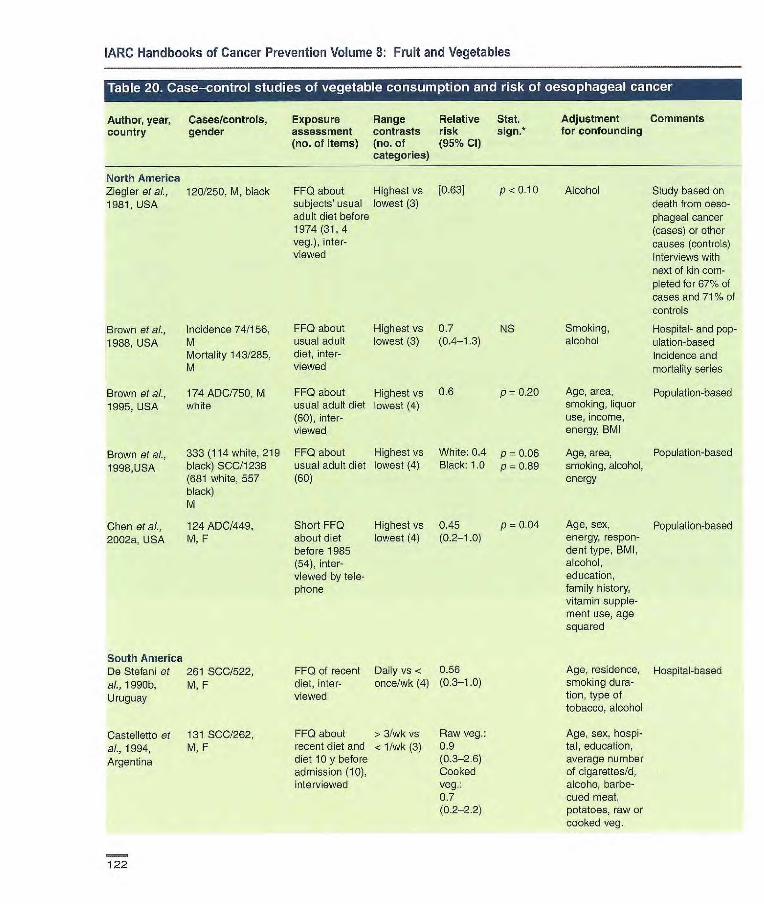
IARC Handbooks of Cancer Prevention Volume 8: Fruit and Vegetables
Author, year, Casesfcontrols, Exposure Range Relative Stat. Adjustment Comments country gender assessment contrasts risk sign.* for confounding
(no. of items) (no. of (95% Cl) categories)
North America Ziegler et al., 120/250, M, black 1981, USA
Brown etaL, Incidence 74/156, FF0 about Highest vs 0.7 NS 1988, USA M usual adult lowest (3) (0.4-1.3)
Mortality 143/285, diet, inter- M viewed
Brown et al., 174 ADC/750, M FF0 about Highest vs 0.6 p 0.20
1995, USA white usual adult diet lowest (4) (60), inter- viewed
Brown et al., 333 (114 white, 219 FF0 about Highest vs White; 0.4 p 0.06
1998,USA black) SCC/1238 usual adult diet lowest (4) Black: 1.0 p 0.89 (681 white, 557 (60) black) M
Chen et ai., 124 ADC/449, Short FF0 Highest vs 0.45 p = 0.04
2002a, USA M, F about diet lowest (4) (0.2-1.0) before 1985 (64), inter- viewed by tele- phone
FF0 of recent Daily vs < 0.56 diet, inter- once/wk (4) (0.3-1.0) viewed
FF0 about > 3/wk vs Raw veg. recent diet and < 1/wk (3) 0.9 diet 10y before (0.3-2.6) admission (10), Cooked interviewed veg.:
0.7 (0.22.2)
Study based on death from oeso-phageal cancer (cases) or other causes (controls) Interviews with next of kin com-pleted for 67% of cases and 71% of controls
Smoking
Hospital- and pop- alcohol
ulation-based Incidence and mortality series
Age, area, Population-based smoking, liquor use, income, energy, BMI
Age, area, Population-based smoking, alcohol, energy
Age, sex, Population-based energy, respon-dent type, BMI, alcohol, education, family history, vitamin supple-ment use, age squared
Age, residence, Hospital-based smoking dura- tion, type of tobacco, alcohol
Age, sex, hospi-tal, education, average number of cigarettes/d, alcoho, barbe-cued meat, potatoes, raw or cooked veg.
FF0 about Highest vs [0.63] subjects' usual lowest (3) adult diet before 1974(31,4 veg.), inter-viewed
P <0.10 Alcohol
South America De Stefani et 261 SCC/522, al., 1990b, M, F Uruguay
Castelletto et 131 SCC/262, al., 1994, M, F Argentina
122

Cancer-preventive effects
Author, year, country
Cases/controls, gender
Exposure assessment (no. of items)
Range contrasts (no. of categories)
Relative Stat. sign.* risk (95% Cl)
Adjustment for confounding
Comments
RoIOn et al., 131/381, FF0 about Highest vs 0.8 (0.3-1.8)p = 0.71 Lifetime consum- Hospital-based 1995, M. F current diet lowest (4) ption of alcohol, Paraguay (50), inter- smoking, age
viewed group, sex, hospital group, meats, fats, fish, milk
De Stefani et 66/393, FF0 (64), Highest vs 0.7 (0.5-0.9) Age, sex, resi- Hospital-based al., 1999, M, F interviewed lowest (3) dence, urban/rural Controls for Uruguay status, education, analysis of oral!
BMI, smoking pharyngeal, (pack-years), laryngeal and alcohol, energy oesophageal
cancer
Castellsagud 830 SCC/1 779, FF0 about Almost 0.62 p 0.08 Sex, age group, Hospital-based et ai., 2000, M, F recent diet daily/daily (0.44-0.88) hospital residence, Pooled analysis Argentina, (50) inter- vs years of educa- from four main Brazil, viewed never/rarely tion, smoking, studies (Victora Paraguay, (3) alcohol etaL,1987; De Uruguay Stefani et al.,
1990b; Castel- lette et al., 1994; RolOn et al., 1995); together with additional subjects from Uruguay
De Stefani et 111 SCC/444, FF0 (64), inter- > 127.7 vs 0.64 p = 0.04 Age, gender, resi- Hospital based al., 2000b, M, F viewed 'z 53.8 g/d (0.34-1.20) dence, urban/rural
Uruguay (4) status, education, BMI, smoking, alcohol, energy
Europe Francheschi of 68/505, FF0 about > 14 vs z 7 [0.37] Hospital-based al., 1990, Italy M diet of last year servings/wk No cancer reg-
(40), inter- (3) istry, unknown viewed number of cases
in the area OR computed based upon dis-tribution of cases/controls
123

]ARC Handbooks of Cancer Prevention Volume 8; Fruit and Vegetables
• ri i rzaiji
Author, year, Cases/controls Exposure Range Relative Stat. sign.* Adjustment Comments country gender assessment contrasts risk for confounding
(no. of items) (no. of (95% Cl) categories)
Negri et aL. 294/6147, FF0 (14-37, Green veg.: 02 (0.1-0.3) p < 0.01 Age, area of resi- Hospital-based 1991, Italy M, F depending on Highest vs dence, education, Data from a
cancer site) lowest (3) smoking, sex, fruit network of consumption case—control
studies
Tuyns et al., 331/1975, FF0 about Fresh veg: 0L58 p 0.029 Age, alcohol, Population- 1987, France M, F usual diet (40), Highest smoking, urban or based
interviewed versus rural residence lowest (4)
Tzcnou et al., 43 SCC plus 56 FF0 about diet (5) 3CC: 0.97 p 0.83 Gender, age, Hospital-based 1996a, Greece ADC/200, one year before (0.74-1.28) birthplace,
M, F onset of disease ADC: 0.62 p 0.0003 schooling, height, (115), inter- (0.48_080) analgesics, viewed coffee drinking,
alcohol, smoking, energy
Launoy et 208 SOC/399, FF0 about > 400 vs e 0.24 p e 0.001 Age, interviewer, Hospital-based at, 1998, M diet of previous 200 g/d (0.11-0.55) smoking, beer, Franco year (39), inter- (4) aniseed aperitifs,
viewed hot Calvados, whisky, total alcohol, energy, other significant food groups (butter, fresh fish, oil, veg.)
Bosetti et al., 304 SCC/743, FF0 about Raw veg.: 0.32 p e 0.001 Age, sex, area of Hospital-based 200a, Italy M, F diet of 2 y 12.6 vs e (0.19-0.55) residence, educa- in specific areas
before diag- 3.9 serv- tion, smoking, nosts (78), ings/wk alcohol, non- interviewed (5) alcohol energy
Cooked 019 NS veg: >4.3 (0.47-1.31) vs e 1.4 servings/wk (5)
Cheng et at, 74 ADC/74, F FF0 about > 25.90 vs 0.58 p = 0.371 Population- 2000a, UK diet of previous < 15.37 (0.22-1.55) based
3 y, inter- items/wk viewed (4)
124

Cancer-preventive effects
ii] [IIC1i1(i
Author, year, country
Cases/controls, gender
Exposure assessment (no. of items)
Range contrasts (no. of categories)
Relative risk (95% CI)
Stat. sign.* Adjustment for confounding
Comments
Levi et aL, 101 (SCC and FF0 about diet Raw veg.: 0.14 p < 0.01 Age, sex, educa- Hospital-based 2000, ADC)/327, of recent 2 y > 9.5 vs ~g (0.1-04) tion, smoking, Switzerland M, F (79), inter- 5.5 serv- alcohol and non-
viewed ings/wk (3) alcohol total Cooked 0.19 p <0.01 energy intake veg.: > 8.0 (0.1-0.3) vs cc 5.3 servings/wk (3)
Terry et al., 189 ADC plus 167 1 about 3.3 vs 1.1 ADC: 0.5 p 0.001 Age, gender, Population-based 20011 SCC/ 815, diet 20 y before median (0.3-0.8) energy, BMI, Information on Sweden M, F interview (63) servingsld SCC: p = 0.02 gastro-oeso- vegetables which
(4) 0.6 (0.4-1-0) phageal reflux contribute to 3.5% symptoms, of total veg. con- smoking sumed in Sweden
were not obtained
Southern Asia and Turkey
Notani & 236/215 (hospital- FF0 about Daily vs not Population Age, tobacco Partly hospital- Jayant, 1987, 177 usual diet daily (2) controls habits based, partly pop- India (from population), before onset of [0.38 (0.23— ulation-based
M the disease, 0.67)]
interviewed Hospital controls [1.08 (0.71-1.67)]
Memik eta]., 78/610, Interview a 5 vs 0-1 [0.34] Hospital-based 1992a, Turkey M, F times/wk (3)
Phukan et aL. 50211004 interview Green leafy 0.26 p < 0.01 NA Hospital-based 2001, India veg.: (0.01-2.9)
Daily vs never (4)
Onuk eta)., 441100, Information on Highest vs [0.10 (0.04— p < 0.001 Hospital-based 2002, Turkey M, F dietary habits lowest (2) 0.23)]
Northern Asia Chang-Claude 52 subjects with FF0 about diet Green veg.: M 0.9 Household status All subjects under-
et ai., 1990, oesophagitis (42 M, in the past five in winter: a 1 (0.4-2.1) went oeso-
China 10 1 (312 M, years, inter- vs < 1/wk (2) F 0.3 phagoscopy with 174 F) viewed Raw veg.: - (0.1-1.4) biopsy
1 vs < 1/mo M 1.3 One third of sub- (2) (0.6-2.6) jects selected from
F 0.2 a household with a (0.1-0.7) case of
oesophageal cancer
125
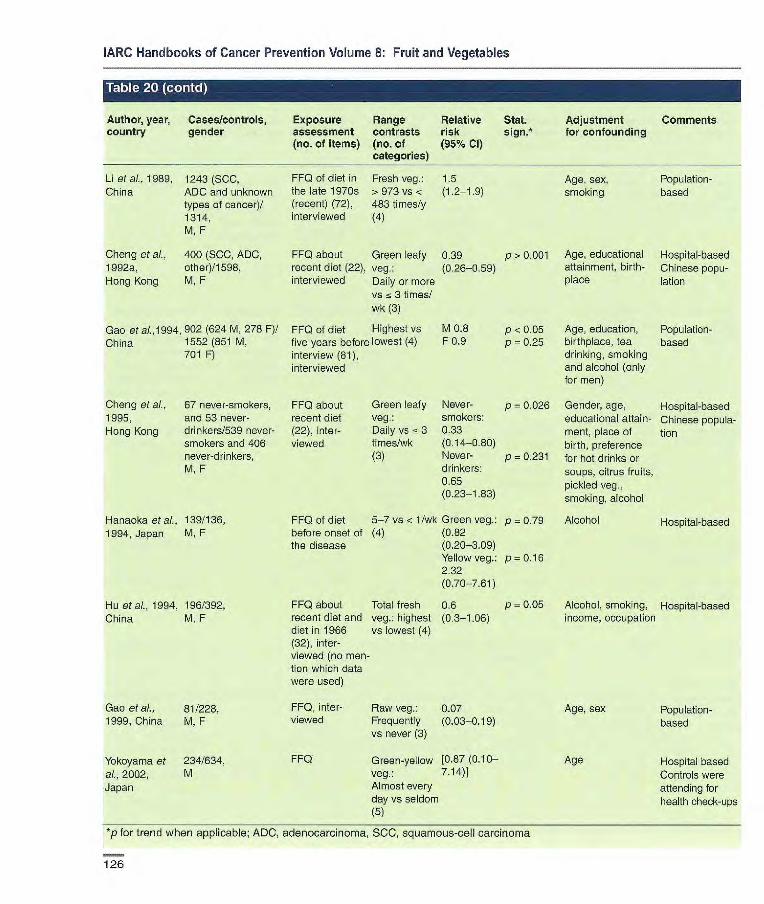
IARC Handbooks of Cancer Prevention Volume 8: Fruit and Vegetables
Author, year, country
Cases/controls, gender
Exposure assessment (no. of items)
Range contrasts (no. of categories)
Relative risk (95% Cl)
Stat. sign.*
Adjustment for confounding
Comments
Li et ai., 1989, 1243 (SCC, FF0 of diet in Fresh veg.: 1.5 Age, sex, Population- China ADC and unknown the late 1970s >973 vs < (1.2-19) smoking based
types of cancer)! (recent) (72), 483 times/y 1314, interviewed (4) M, F
Cheng et al., 400 (SCC, ADC, FF0 about Green leafy 0.39 p> 0.001 Age, educational Hospital-based 1992a, other)/1 598, recent diet (22), veg.: (0.26-0.59) attainment, birth- Chinese popu- Hong Kong M, F interviewed Daily or more place lation
vs 5 3 times! wk (3)
Gao et a/.,1994, 902 (624 M, 278 F)! FF0 of diet Highest vs M 0.8 p < 0.05 Age, education, Population- China 1552 (851 M, five years before lowest (4) F 0.9 p 0.25 birthplace, tea based
701 F) interview (81), drinking, smoking interviewed and alcohol (only
for men)
Cheng et al., 67 never-smokers, FFQ about Green leafy Never- p 0.026 Gender, age, Hospital-based 1995, and 53 never- recent diet veg.: smokers: educational attain- Chinese popula- Hong Kong drinkers/539 never- (22), inter- Daily vs 3 0.33 ment, place of tion
smokers and 406 viewed times/wk (0i4-0.80) birth, preference never-drinkers, (3) Never- p = 0.231 for hot drinks or M, F drinkers: soups, citrus fruits,
0.65 pickled veg., (0.23-1.83) smoking, alcohol
Hanaoka et al., 139/136, FF0 of diet 5-7 vs < 1/wk Green veg.: p 0.79 Alcohol Hospital-based 1994, Japan M, F before onset of (4) (0M2
the disease (0.20-3.09) Yellow veg.: p 0.16 2.32 (0.70-7.61)
Hu et al., 1994, 196/392, FF0 about Total fresh 0.6 p = 0.05 Alcohol, smoking, Hospital-based China M, F recent diet and veg.: highest (0.3-1.06) income, occupation
diet in 1966 vs lowest (4) (32), inter- viewed (no men- tion which data were used)
Gao et al., 81/228, FF0, inter- Raw veg.: 0.07 Age, sex Population- 1999, China M, F viewed Frequently (0.03-0.19) based
vs never (3)
Yokoyama et 234/634, FF0 Green-yellow [0.87 (0.10— Age Hospital based al., 2002, M veg.: 7.14)] Controls were Japan Almost every attending for
day vs seldom health check-ups (5)
*p for trend when applicable; ADC, adenocarcinoma, SCC, squamous-cell carcinoma
126

Cancer-preventive effects
Author, year, Cases/controls, Exposure Range Relative
Stat. Adjustment Comments country gender assessment contrasts risk
sign.* for confounding (no. of items) (no. of (95% Cl)
categories)
FF0 about Highest vs [0.5] sub]ects' usual Lowest adult diet (3) before 1974 (31), interviews with next of kin
FF0 about Highest vs [0.50] subjects' usual lowest (3) adult diet before 1974 (31,3 fruits, 4 veg.), inter- viewed
FF0 about Fresh fruit Directly usual con- or raw veg.: interviewed sumption, ~t 5 vs ~-. 1 [0.40 (0.15- p < 0.01
interviewed items/wk (3) 1.11)] All pairs: [0.43 p < 0.001 (0.23-0.83)]
FF0 about Raw fruits White: Age, study
usual adult diet and veg.: [0.50 (0.26- area, years of
(60) > 18.3 vs < 0.91)] cigarette 7.1 ser- Black: smoking, vings/wk (4) [0.59 alcohol, race
(0.32-1.00)]
Pottern et al., 120/250, M, 1981, USA black
Ziegler etal., 120/250, M,
1981 ,USA black
Vu et al., 1988, 275/275, USA M,F
Brown et al., 347 (SCC)/1 354,
2001, M
USA
P < 0.05 Alcohol
P < 0.05 Alcohol
Study based on death from ceso-phageal cancer (cases) or other causes (controls) Interviews with next of kin completed for 67% of cases and 71% of controls
Population-based; deaths from oeso-phageal cancer (cases) or other caus-es (controls) Interviews with next of kin completed for 67% of cases and 71% of controls
Neighbourhood con-trols. Only 129 cases directly interviewed, otherwise with next of kin
Population-based
Terry etal., 189 ADC plus 167 FF0 about diet 4.8 vs 1.5 ADC: 0.5 p= 0.005 Age, gender, Population-based
20011 SCC/815, M, F 20 y before median (0.3-0.8) energy, BMI, gas- Information on fruits
Sweden interview (63) servings/d SCC: 0.6 p 0.01 tro-oesophageal and veg. which con- (4) (0.4-1,0) reflux symptoms, tribute 3.5 % of total
smoking veg. and 13.1% of fruit consumed in Sweden was not obtained
De Stefani et 111/444, FF0 (64), 343 vs 0.22 p 0.001 Age, gender, Hospital-based
al., 2000b, M, F interviewed 155.7 g/d (0.11-0.45) residence, urban!
Uruguay rural status, education, BMI, smoking, alcohol, energy
*p for trend when applicable; ADC, adenocarcinoma, SOC, squamous-cell carcinoma
127

Chyou etal., 111/361 (subcohort), 24-h recall, 1990, Hawaii M interviewed (Japanese) 18y (54)
Nomura et ai., 149/7839, FF0 (20) 1990, Hawaii M
(Japanese) 19
~ 301 vs 0.8 p = 0.20 Age, smoking O g/d (4) (0.4-1.3)
a5vs r 0.8
Age 1/wk (3) (0.5-1.3)
Case—cohort Incidence All cohort: 8006
Incidence
IARC Handbooks of Cancer Prevention Volume 8: Fruit and Vegetables
Author, year, Cases/cohort Exposure Range Relative Stat. sign.* Adjustment Comments country size, gender (years assessment contrasts risk for confounding
follow-up) (no. of items) (no. of (95% Cl) categories)
lnoue et aI., 69/972,
1996, Japan M, F 6y
Botterweck et 281/3123 (subcohort), FF0 (150, 8
ai., 1998, M, F fruits)
Netherlands 6.3 y
FF0, self-administered
Daily vs Without rare (3) atrophic
gastritis: 0.55 (0.22-1.35)
a325vs, 0.97 p=05l 46 g/d (5) (0.64-1.48)
Matched by age Incidence and sex. Adjusted Nested case—con- for years of smok- trol in randomized ng and cancer controlled trial history in first- Similar finding for degree relatives cardia'non-cardia
cancer
Sex, age Incidence Similar finding in subtypes with atrophic gastritis
Age, sex, smok- Incidence ing, education, Case—cohort stomach disor- analysis ders, family All cohort: 120 852 history of gastric cancer, veg.
Age, education, Incidence Japanese place of birth, gender (analyses among men: smoking, alcohol)
Age, education, Mortality smoking, BMI, multivitamin and vitamin C use, aspirin use, race, family history
Kneller etal., 75/17633,
1991, USA M 20 y
Kato etal., 57/9753,
1992, Japan M, F 6y
Guo et ai, 538/2695,
1994, China M, F 5y
FF0, inter- once/mo 0.9 viewed
vs none/mo (0.8-1.1) (2)
FF0 (35), self- Highest vs 1.5 NS
Age, cigarette Mortality administered lowest (4) (0.75-2.93)
smoking
FF0 (25), self- Daily vs 1.92 p = 0.035 Age, sex
Mortality administered 1-2/wk (3) (1.03-3.59)
Galanis etal., 108/11 907, FF0 (13), a 7 vs < 0.6 (0.4-0.9)
1998, Hawaii M, F
interviewed 7/wk (2)
(Japanese) 14.8 y
McCullough et 910/436 654 M, FF0 (32), Citrus fruit: M: 0.88 p = 0.11
ai., 2001, USA 439/533 391 F
self-adminis- Highest vs (0.75-1.03) 14 y
tered lowest (3) F: 0.97 p = 0.79 (0.78-121)
128

Cancer-preventive effects
Author, year, Cases/cohort
Exposure Range Relative Stat. sign.* Adjustment Comments country size, gender assessment contrasts risk for confounding
(years follow-up)
(no. of items) (no. of (95% Cl) categories)
Kobayashi at 404/39 993, FF0 (44), self- Almost daily 0.70 p 0.25 al., 2002, M, F administered vs < 1 d/wk (0.45-1.01) Japan by (4)
Sauvaget 617/38540, FF0 (22), self- Daily vs 0-1 0.80 p = 0.03 etal., 2003, M, F administered d/wk (0.65-0.98) Japan 17y (3)
*p for trend when applicable
Age, sex, area, Incidence, similar education, finding when cases smoking, BMI, in first 2 y excluded alcohol, vitamin A, C, E supple- ment use, energy, salted food, history of peptic ulcer, family history of gastric cancer
Age, sex, radia- Mortality, atomic tien dose, city, bombing survivors BMI, smoking, alcohol, education
Author, year, Cases/controls, Exposure Range Relative Stat. sign!' Adjustment Comments country gender assessment contrasts risk for confounding
(no. 01 items) (no. of (95% Cl) categories)
Jedrychowski 110/110, FF0, inter- etal., 1986, M, F viewed Poland
La Vecchia 206/474, FF0 (29) at al., 1987b, M, F interviewed Italy
Kano at al., 26/793 hospital, FF0, inter-
1988, Japan 91 population, viewed M, F
Highest vs Whites: p < 0.005 lowest (4) 0,47(0.24—
0.92) Blacks: p<0.001 0.33(0.16— O.66)
Daily or [0.31 almost daily (0.15-0.64)] vs less fre- quently (3)
Fresh fruit: 0.73 NS Highest vs lowest (3). Citrus fruit: 0.63 p =0.11 Highest vs lowest (3)
Fruit, other Hospital p 0.08 than man- controls: dare 0.7 (0.4-1.0) oranges: Population p 0.008 Daily vs controls: less (2) 0.5 (0.3-0.8)
Matched by race, Hospital-based sex and age (within Similar finding 5 y). Adjusted for by histological sex, respondent type status, income, duration of smoking
Matched by sex Hospital-based and age, adjusted for residence and smoking
Age, sex, educa- Hospital-based tien, areas of residence, other dietary factors
Matched by age, Hospital-based sex and residence. and population- Adjusted for based smoking, mandarin orange, green tea
Correa et al., Whites: 189/190, FF0 (59),
1985, USA M, F
interviewed Blacks 189/190, M, F
129

IARC Handbooks of Cancer Prevention Volume 8: Fruit and Vegetables
Table Irm r I
Author, year, Cases/controls, Exposure Range Relative Stat. sign. Adjustment Comments country gender assessment contrasts risk for confounding
(no. of items) (no. of (95% Cl)
You etal., 1988, 564/1131, China M, F
Cog gon et al., 94/185, 1989, M,F UK
De Stefani et 210/630, al,, 1990e, M, F Uruguay
Kate et al., 289/1247, 1990, Japan M
198/1767, F
Lee et al., 210/810, 1990, M,F
Taiwan, China
Wu-Williams et 130/135,
al., 1990, USA M
Boeing et al., 143/579, 1991a, M,F Germany
FF0 (85, 9 Fresh fruit: 0-6 (0.4-0.6) fruits), inter- > 130 vs <5 viewed kg/y (4)
FF0 (6), inter- Fresh or 0.6 (0.2-15) viewed or self- frozen fruit: administered > 5 vs <1
time/wk (3)
FF0, inter- 5-7 vs 2 or [0.36 p < 0.001 viewed less times/ (0.23-0.56)
wk (3)
FF0 (10), self- Almost daily M: 0.83 administered vs once or (0.51-1.33)
twice per F: 0.77
month (3) (0,33-1.78)
FF0, inter- 6 vs 1/w viewed Estimated at 0.91
age ~ 20 y Estimated at 1,0 age 20-39 y
FF0, inter- 5 or more [0,67 viewed or self- times/wk vs (0.29-1,67)] administered once or
less/wk (3)
FF0 (74), Highest vs 0.56 (0,35- p> 0.05 interviewed lowest (3) 0.91)
Matched by age Population- and sex. Adjusted based for sex, age and family income
Matched by age Population- (2 y), sex, Adjusted based for length of refrig- erator use, salad veg. in winter, salt, smoked neat or fish (including bacon), socioeco- nomic status
Matched by age Hospital-based and sex. Adjusted forage, sex, resi- dence, smoking duration, wine ingestion, meat, salted meat, veg. and 'mate'
Age, residence Hospital-based Significant reduction for intestinal type in females
Matched by age, Hospital-based sex, hospital
Matched by sex, Population- age, race based
Age, sex, hospital Hospital-based
Gonzalez et al., 354/354,
1991, Spain M, F Dietary history Other [than 0.7 (0.4- questionnaire citrus] fruit: 1.2) (77), inter- Highest vs viewed lowest (4)
P = 0.08 Matched by age, Hospital-based sex, and area cf residence. Adjusted for energy intake
130
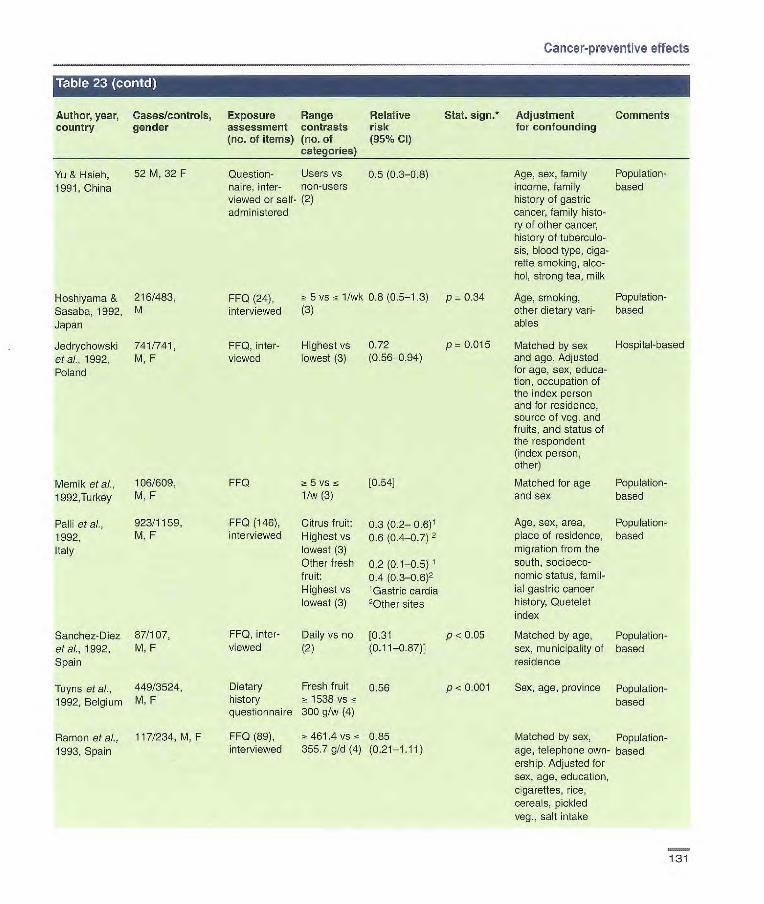
Cancer-preventive effects
Author, year, Cases/controls, Exposure Range Relative Stat. sign.* Adjustment Comments country gender assessment contrasts risk for confounding
(no. of items) (no. of (95% CI)
Hoshlyama & 216/483
Sasaba, 1992, M
Japan
Jedryctiowski 741/741 et al., 1992, M, F Poland
Memik et aI., 106/609, FF0 5 vs [0.54]
1992,Turkey M, F 1/w (3)
Paul etal., 923/1159, FF0 (146), Citrus fruit: 0.3 (0.2— 0.6)1
1992, M, F interviewed Highest vs U.s (0.4-0.7) 2
Italy lowest (3) Other fresh 0.2 (0.1-0.5) 1
fruit: 0.4 (0.3_0.6)2 Highest vs 'Gastric cardia lowest (3) 20ther sites
Sanchez-Diez 87/107, FF0, inter- Daily vs no [0.31 p <0.05 olaf., 1992, M, F viewed (2) (0.11-0.87)1 Spain
Tuyns et a/., 449/3524, Dietary Fresh fruit 0.56 p < 0.001
1992, Belgium M, F history 1538 vs questionnaire 300 g/w (4)
Ramon et al., 117/234, M, F FF0 (89), 461.4 vs 0.85
1993, Spain interviewed 355.7g/d(4) (0.21-1.11)
Age, sex, family Population- income, family based history of gastric cancer, family histo- ry of other cancer, history of tuberculo- sis, blood type, ciga- rette smoking, alcc- bol, strong tea, milk
Age, smoking, Population- other dietary van- based ables
Matched by sex Hospital-based and age. Adjusted for age, sex, educa- tion, occupation of the index person and for residence, source of veg. and fruits, and status of the respondent (index person, other)
Matched for age Population- and sex based
Age, sex, area, Population- place of residence, based migration from the south, socioeco- nomic status, famil- ial gastric cancer history, Quetelet index
Matched by age, Population- sex, municipality of based residence
Sex, age, province Population- based
Matched by sex, Population- age, telephone own- based ership. Adjusted for sex, age, education, cigarettes, rice, cereals, pickled veg., salt intake
Yu & Hseh, 52 M, 32 F
1991, China Question- Users vs 0.5 (0.3-0.8) flaire, inter- non-users viewed or self- (2) administered
FF0 (24), 5 vs < 1/wk 0.8 (0.5-1.3) p 0.34 interviewed (3)
FF0, inter- Highest vs 0.72
p = 0.015 viewed lowest (3) (0.56-0.94)
131
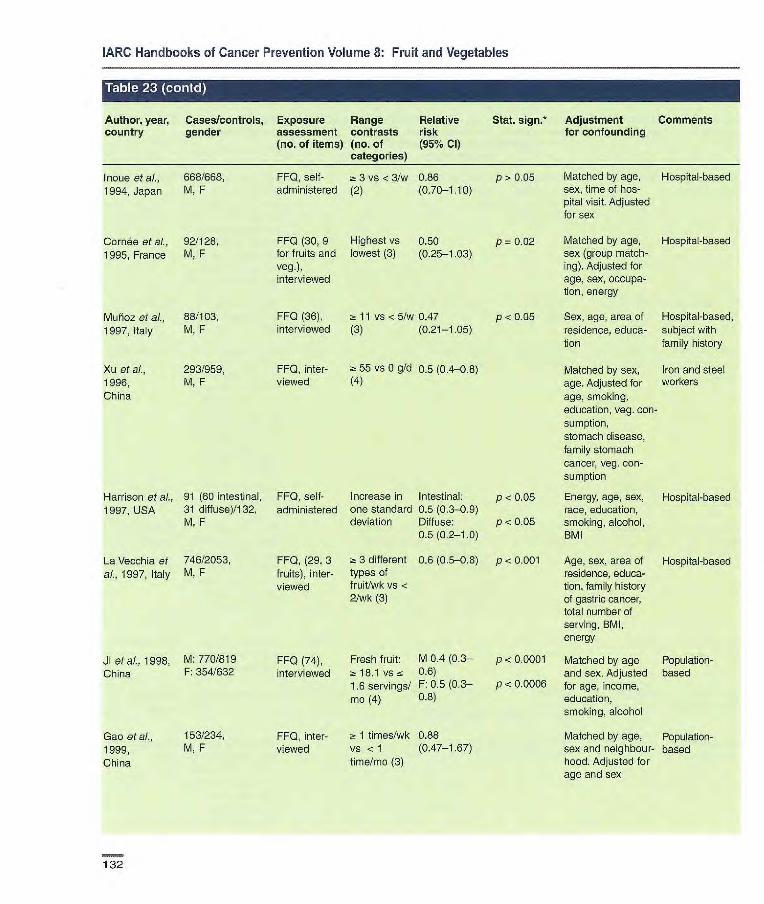
Author, year, country
Cases/controls, gender
Exposure assessment (no. of items)
Range contrasts (no. of categories)
Relative risk (95% Cl)
Inoue et al., 668/668, FF0, self- a 3 vs < 31w 0.86 1994, Japan M, F administered (2) (0.70-1.10)
Cornée etal., 92/128, FF0 (30, 9 Highest vs 0.50 1995, France M, F for fruits and lowest (3) (0.25-1.03)
veg.), interviewed
Muñoz et aL, 88/103, FF0 (36), 2: 11 vs <5/w 0.47 1997, Italy M, F
interviewed (3) (0.21-1.05)
Xu et al., 293/959, FF0, inter- ~ 55 vs O g/d 0.5 (0.4-0.8) 1996, M, F
viewed (4) China
IARC Handbooks of Cancer Prevention Volume 8: Fruit and Vegetables
Stat. sign.* Adjustment Comments for confounding
p> 0.05 Matched by age, Hospital-based sex, time of hos- pital visit. Adjusted for sex
p = 0.02 Matched by age, Hospital-based sex (group match- ing). Adjusted for age, sex, occupa- tion, energy
p < 0.05 Sex, age, area of Hospital-based, residence, educa- subject with tion family history
Matched by sex, Iron and steel age. Adjusted for workers age, smoking, education, veg. con- sumption, stomach disease, family stomach cancer, veg. con- sumption
Harrison et al., 91 (60 intestinal, FF0, self- Increase in Intestinal: p < 0.05 Energy, age, sex, Hospital-based 1997, USA 31 diffuse)/132, administered one standard 0.5 (0.3.-09) race, education,
M, F deviation Diffuse; p < 0.05 smoking, alcohol, 0.5 (0.2-1.0) BMI
La Vecchia et 746/2053, FF0, (29, 3 2: 3 different 0.6 (0.5-0.8) p < 0.001 Age, sex, area of Hospital-based al., 1997, Italy M, F fruits), inter- types of residence, educa-
viewed fruit/wk vs < tion, family history 2/wk (3) of gastric cancer,
total number of serving, BMI, energy
Ji et al., 1998, M: 770/819 FF0 (74), Fresh fruit: M 0.4 (0.3— p < 0.0001 Matched by age Population- China F: 354/632 interviewed z- 18.1 vs 0.6) and sex. Adjusted based
1.6 servings! F: 0.5 (0.3— p < 0.0006 for age, income, mû (4) 0.8) education,
smoking, alcohol
Gao etal., 153/234, FF0, inter- 1 times/wk 0.88 Matched by age, Population- 1999, M, F viewed vs < 1 (0.47-1.67) sex and neighbour- based China time/mo (3) hood. Adjusted for
age and sex
132
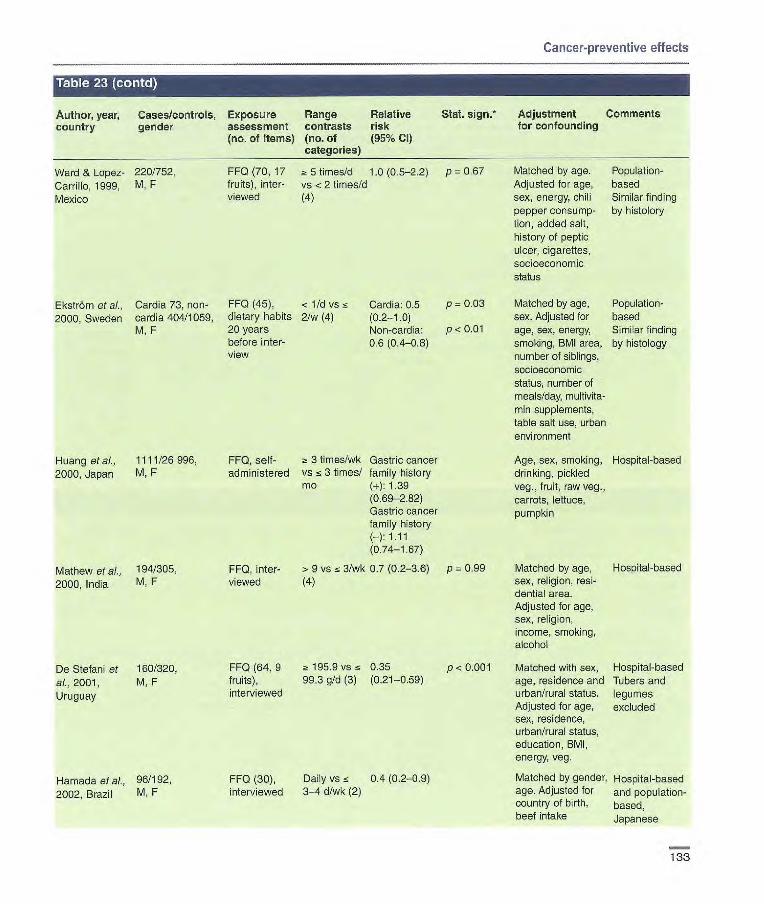
Cancer-preventive effects
•rl.jLM.i't.1HI'i
Author, year. country
Cases/controls, gender
Exposure assessment (no. of items)
Range contrasts (no. of categories)
Relative risk (95% CI)
Stat. 5jgfl* Adjustment for confounding
Comments
Ward & Lopez- 220/752, FF0 (70, 17 ~- 5 timesld 1.0 (0.5-2.2) p = 0.67 Matched by age. Population-
Carrillo, 1999, M, F fruits), inter- vs < 2 times/d Adjusted for age, based
Mexico viewed (4) sex, energy, chili Similar finding pepper consump- by histolory tion, added salt, history of peptic ulcer, cigarettes, socioeconomic status
Ekstrôm et at, Cardia 73, non- FF0 (45), < l/d vs z Cardia: 0.5 p = 0.03 Matched by age, Population-
2000, Sweden cardia 404/1059, dietary habits 21w (4) (0.2-1.0) sex. Adjusted for based M, F 20 years Non-cardia: p < 0.01 age, sex, energy, Similar finding
before inter- 0.6 (0.4-0.8) smoking, BMI area, by histology view number of siblings,
socioeconomic status, number of meals/day, multivita- min supplements, table salt use, urban environment
Huang et ai., 1111/26 996, FF0, self- z 3 times/wk Gastric cancer Age, sex, smoking, Hospital-based 2000, Japan M, F administered vs z 3 times/ family history drinking, pickled
mc (+): 1.39 veg., fruit, raw veg., (0.69-2,82) carrots, lettuce, Gastric cancer pumpkin family history (-): 1.11 (0.74-1.67)
Mathew et al., 194/305, FFQ, inter- > 9 v z 3/wk 0.7 (0.2-88) p 0.99 Matched by age, Hospital-based
2000, India M, F viewed (4) sex, religion, resi- dential area. Adjusted for age, sex, religion, income, smoking, alcohol
De Stefan! et 160/320, FF0 (64, 9 z 195.9 vs z 0.35 p <0.001 Matched with sex, Hospital-based
al., 2001, M. F fruits), 99.3 g/d (3) (0.21-0.59) age, residence and Tubers and
Uruguay interviewed urban/rural status. legumes Adjusted for age, excluded sex, residence, urban/rural status, education, BMI, energy, veg.
Hamada at aL. 96/192, FF0 (30), Daily vs z 0.4 (0.2-0.9) Matched by gender, Hospital-based
2002, Brazil M. F interviewed 3-4 d!wk (2) age. Adjusted for and population- country of birth, based, beef intake Japanese
133
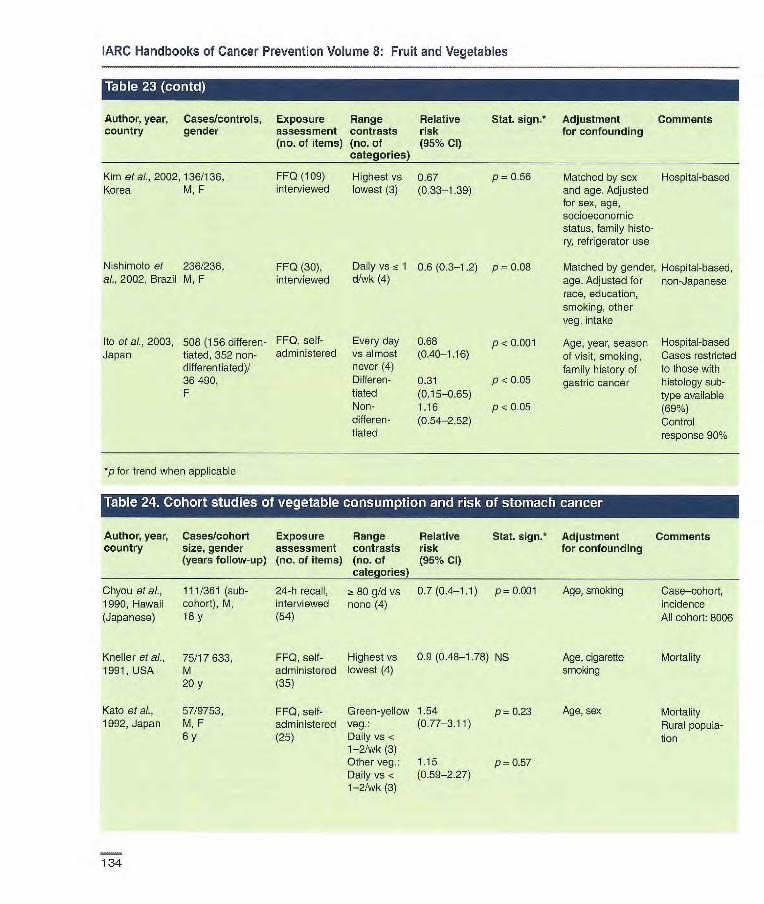
IARC Handbooks of Cancer Prevention Volume 8: Fruit and Vegetables
Author, year, Cases/controls, Exposure Range
Relative Stat. sign, Adjustment Comments country gender assessment contrasts risk
for confounding
(no. of items) (no. of
(95% Cl)
Matched by sex Hospital-based and age. Adjusted for sex, age, socioeconomic status, family histo- ry, refngerator use
Matched by gender, Hospital-based, age. Adjusted for non-Japanese race, education, smoking, other veg. intake
Age, year, season Hospital-based of visit, smoking, Cases restricted family history of to those with gastric cancer histology sub-
type available (69%) Control response 90%
Kim etal., 2002,136/136, FFQ (109) Highest vs 0.67 p — 0.56 Korea M, F interviewed lowest (3) (0.33-1.39)
N shirnoto et 236/236, FFQ (30), Daily vs ~-. 1 0.6 (0.3-1.2) p = 0.08 aL, 2002, Brazil M, F interviewed d/wk (4)
Ito etal., 2003, 508 (156 differen- FFQ, self- Every day 0.68 p <0.001 Japan tiated, 352 administered vs almost (0.40-1.16)
differentiated)! never (4) 36490, Differen- 0.31 p < 0.05 F tiated (0.15-0.65)
Non- 1.16 p <0.05 differen- (0.54-2.52) tiated
*p for trend when applicable
Author, year, Cases/cohort Exposure Range Relative Stat. sign.* Adjustment Comments country size, gender assessment contrasts risk for confounding
(years follow-up) (no. of items) (no. of (95% Cl) categories)
Chyou et al., 111/361 (sub- 24-h recall , 80 g/d vs 0.7 (0.4-1.1) p= 0.001 Age, smoking Case—cohort, 1990, Hawaii cohort), M, interviewed none (4) incidence (Japanese) 18 y (54) All cohort: 8006
Kneller et aL. 75/17633, FFQ, self- Highest vs 0.9 (0.48-1.78) NS Age, cigarette Mortality 1991, USA M administered lowest (4) smoking
20 y (35)
Kate et aL, 57/9753, FFQ, self- Green-yellow 1.54 p = 0.23 Age, sex Mortality 1992, Japan M, F administered veg.: (0.77-3.11) Rural popula-
6 y (25) Daily vs < tion 1-2/wk (3) Other veg.: 1.15 p-0.57 Daily vs < (0.59-2.27) 1-2/wk (3)
134

Cancer-preventive effects
Stat. sign.* Adjustment Comments for confounding
Author, year, Cases/cohort Exposure Range Relative country size, gender assessment contrasts risk
(years follow-up) (no. of items) (no. of (95% CI) categories)
Guo et al., 538/2695, FF0, inter- Fresh yap.: 1.1 (0.8-1.4) 1994, China M, F viewed <60 vs <30
5y times/mo (3)
Inoue et ai., 69/972, FF0, self- Raw veg.: 0.67 1996, Japan M, F administered Daily (0.29-1.57)
6 y vs rare (3) Green-yellow 0.74 veg.: (0.17-3.20) Daily vs rare (3)
Botterweck et 264/2953 (subco- FF0 (150, a 286 vs c 0.86 p 0.25
ai., 1998, hort), 17 veg.) 103 g/d (5) (0.58-1.26)
Netherlands M, F 6.3 y
Galanis etal., 108/11 907, FF0 (13), Raw veg.: 0.8 (0.5-1.2) 1998, Hawaii M, F interviewed 7 vs <7/wk
(Japanese) 14.8 y (2)
McCullough et 910/436 654, FF0 (32), M: ~ 13 vs M: 0.89 p 0.17 al., 2001, M self-adminis- <8 d/wk (3) (0.76-1.05)
USA 439/533 391, tered F:> 14 vs F: 1.25 p = 0.06 F < 9 d/wk (3) (0.99-1.58) 14 y
Kasum et al., 56/34361, FF0 (127), Yellow/orange 0.63
2002, USA F self-adminis- veg.: 3.5-106 14y tered vs 0-1 ser-
vings/wk (3)
Kobayashi et 404/39903, FF0 (44), Highest vs 0.75 p 0.17
al., 2002, M, F self-adminis- lowest (5) (0.54-1.04)
Japan by tered
Sauvaget et al., 617/38 540, FF0 (22), Green-yellow 0.91
2003, Japan M, F self-adminis- veg.: (0.74-1.13) p0.35 17 y tered Daily vs 0-1
d/wk (3)
*p for trend when applicable
Matched by age and Incidence sex. Adjusted for years Nested of smoking and cancer case—control in history in first-degree randomized relatives controlled trial
Sex, age Incidence Similar findings in subjects with atrophic gastritis
Age, sex, smoking, Incidence education, stomach Case—cohort disorders, family analysis. history of gastric All cohort: 120 cancer, total fruit 852 consumption
Age, education, Incidence Japanese place of birth, gender (analy- ses among men; also smoking and alcohol)
Age, education, Mortality smoking, BMI, multi- vitamin and vitamin C use, aspirin use, race, family history
Age, energy, alcohol, Incidence smoking
Age, sex, area, Incidence education, smoking, Similar finding BMI, alcohol, vitamin when first two A, C, E supplement years' cases use, energy, salted excluded. Signi- food, history of peptic ficant inverse ulcer, family history of association only gastric cancer for differentiated
histology type
Age, sex, radiation Mortality, atomic dose, city, BMI, smoking bombing sur- alcohol, education vivors
135
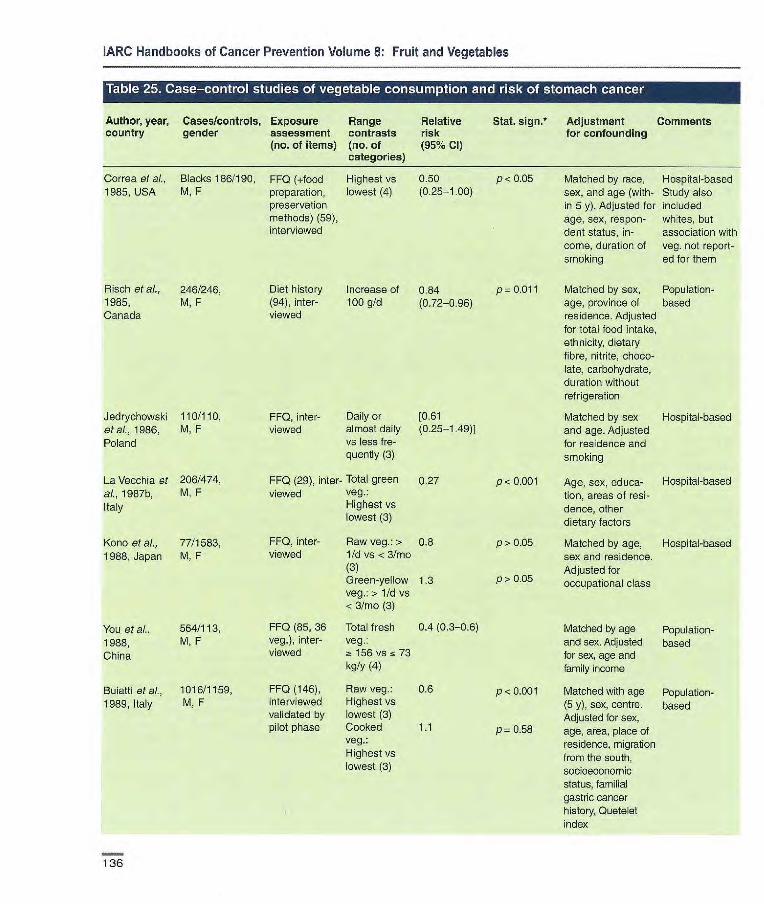
Correa et al., Blacks 186/190, FF0 (+food Highest vs 0.50 p< 0.05 1985, USA M, F preparation, lowest (4) (0.25-1.00)
pmservatior methods) (59), interviewed
Risch et al., 246/246, Diet history Increase of 0.84 p= 0.011 1965, M, F (94), inter- 100 g/d (0.72-0.96) Canada viewed
Jedryohowski 110/110, FF0, inter- Daily or [0.61 eta]., 1986, M, F viewed almost daily (0.25-1.49)] Poland vs less fre-
quently (3)
La Vecchia et 206/474, FF0 (29), inter- Total green 0.27 al., 1987b, M, F viewed veg.:
Italy Highest vs lowest (3)
Kano et al., 77/1583, FF0, inter- Raw veg.:> 0.8
1988,Japan M, F viewed 1/dvs<3Jmo (3) Green-yellow 1.3 veg.:>1/dvs <3/mo (3)
You et al., 564/113, FF0 (85, 36 Total fresh 0.4 (0.3-0.6)
1988, M, F veg.), inter- veg.:
China viewed ~t 156 vs _.~ 73 kg/y (4)
Buiatti et al., 1016/1159, FF0 (146), Raw veg.: 0.6
1989, Italy M, F interviewed Highest vs validated by lowest (3) pilot phase Cooked 1.1
veg.:
Highest vs
lowest (3)
Matched by race, Hospital-based sex, and age (with- Study also
in 5 y). Adjusted for included
age, sex, respon- whites, but dent status, in- association with
come, duration of veg. not report- smoking ed for them
Matched by sex, Population- age, province of based residence. Adjusted
for total food intake,
ethnicity, dietary
fibre, nitrite, choco- late, carbohydrate, duration without refrigeration
Matched by sex Hospital-based and age. Adjusted for residence and smoking
Age, sex, educa- Hospital-based tion, areas of resi- dence, other dietary factors
Matched by age, Hospital-based sex and residence. Adjusted for occupational class
Matched by age Population- and sex. Adjusted based for sex, age and family income
Matched with age Population- (5 y), sex, centre. based Adjusted for sex,
age, area, place of
residence, migration
from the south, Socioeconomic status, familial
gastric cancer
history, Quetelet index
p<0.00l
p>0.05
p>0.05
P 'z 0.001
P 0.58
IARC Handbooks of Cancer Prevention Volume 8: Fruit and Vegetables
Table 25. Case-c.o.ntrol studies of vegetable consumption and risk of stomach cancer
Author, year, Cases/controls, Exposure Range Relative Stat. sign. Adjustment Comments country gender assessment contrasts risk for confounding
(no. of items) (no. of (95% Cl) categories)
136
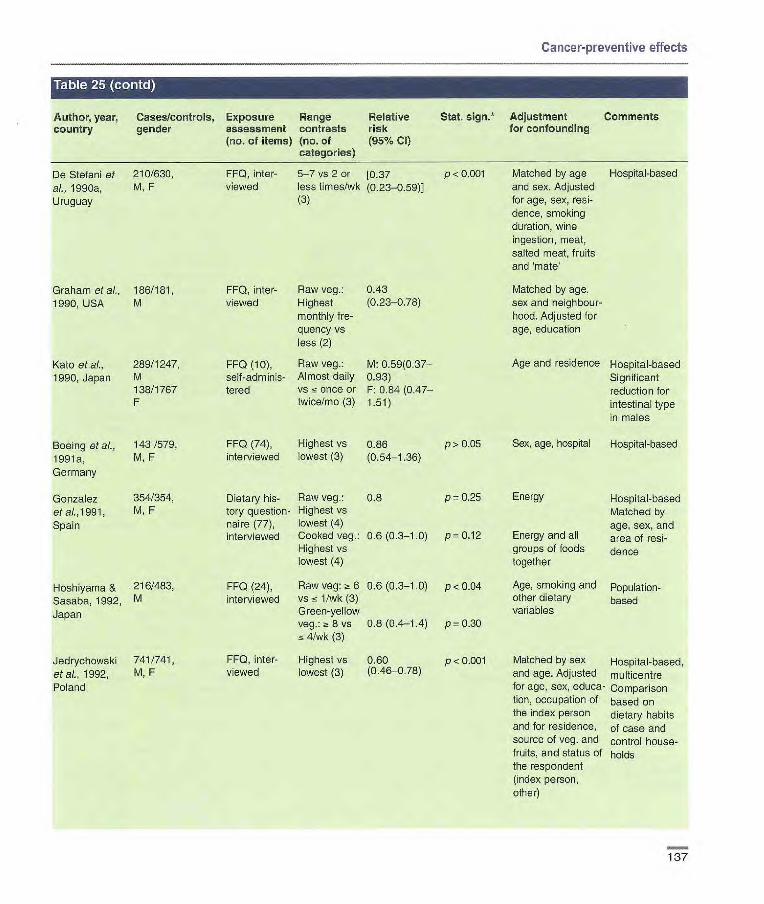
Cancer-preventive effects
Author, year, Cases/controls, Exposure Range Relative
Stat. $jgfl•* Adjustment Comments country gender assessment contrasts risk
for confounding
(no. of items) (no. of (95% Cl) categories)
De Stefani et 210/630, al., 1990a, M, F
Uruguay
Graham et al., 186/181, 1990, USA M
Kato et al., 289/1247, 1990, Japan M
138/1767 F
Boeing etaL, 143/579, 1991a, M, F
Germany
Gonzalez 354/354, etal.,1991, M,F
Spain
Hoshiyama & 216/483,
Sasaba, 1992, M
Japan
Jedrychowski 741/741 etal.. 1992, M, F
Poland
FF0, inter- 5-7 vs 2 or [1137 viewed less times/wk (0.23-0.59)
(3)
FF0, inter- Raw veg.: 0.43 viewed Highest (0.23-078)
monthly fre- quency vs less (2)
FF0 (10), Raw veg: M: 0.59(0.37- seif-adminis- Almost daily 0.93) tered vs ns once or F: 0.84 (0.47-
twice/mo(3) 1.51)
FF0 (74), Highest vs 0.86 p>0.O5 interviewed lowest (3) (0.54-1.36)
Dietary his- Raw veg.: 0.8 p 0.25 tory question- Highest vs naire (77), lowest (4) interviewed Cooked veg.: 0.6 (0.3-1.0) p 0.12
Highest vs lowest (4)
FF0 (24), Raw veg: Z~ 6 0.6 (0.3-1.0) p < 004 interviewed vs < 1/wk (3)
Green-yellow veg.: ~! S vs 0.8 (0.4-1.4) p = 0.30
4/wk (3)
FF0, inter- Highest vs 0.60 p <0.001 viewed lowest (3) (0.46-038)
P < 0.001 Matched by age Hospital-based and sex. Adjusted for age, sex, resi-dence, smoking duration, wine ingestion, moat, salted meat, fruits and 'mate'
Matched by age, sex and neighbour-hood. Adjusted for age, education
Age and residence Hospital-based
Significant reduction for intestinal type in males
Sex, age, hospital Hospital-based
Energy Hospital-based Matched by age, sex, and
Energy and all area of rosi- groups of foods dence together
Age, smoking and Population- other dietary based variables
Matched by sex Hospital-based, and age. Adjusted multicentre for age, sex, educa- Comparison tien, occupation of based on the index person dietary habits and for residence, of case and source of veg. and control house- fruits, and status of holds the respondent (index person, other)
137

IARC Handbooks of Cancer Prevention Volume 8: Fruit and Vegetables
Author, year, country
Cases/controls, gender
Exposure assessment (no. of items)
flange contrasts (no. of categories)
Relative risk (95% Cl)
Stat. sign.* Adjustment Comments for confounding
Memik at al., 117/609, FF0 - 5 vs < 1/wk 0.6(0,31— p < 0.05 Matched for age Population- 1992, Turkey M, F (3) 1.23) and sex based
Paul at al., 923/1159, FF0 (146), Raw veg.: 0.4 (0.2_0.8)1 Age, sex, area, Population- 1992, Italy M, F interviewed Highest vs 0.6 (0.3_0.8)2 place of residence, based
lowest (3) migration from the Cooked veg.: 1.5 (0.8_2.8)1 south, socio- Highest vs I .1(0.9_1.4)2 economic status, lowest (3) 'Gastric cardia familial gastric
2All others cancer history, Ouetelet index (tertile categories of weight/ height squared)
Sanchez-Diez 87/107, FF0, inter- Daily vs [0.70 Matched by age, sex, Population- etal., 1992, M, F viewed none (2) (0.41-1.08)] municipality based Spain of residence
Tuyns at at., 449/3524, Diet history Cooked 0.33 p < 0.001 Sex, age, province Population- 1992, Belgium M, F question- veg.: _~t 1160 based
naire vs 600 g/wk (4) Raw veg.: 0.4 p<0.001
268 vs 80 g/wk (4)
Hansson etal., 338/669, FF0 (45), > 15 vs < 10.58 p= 0.011 Age, gender, and Population- 1993, Sweden M, F interviewed 2.1 tines/mo (0.37-0.69) socioeconomic based
'Diet ln ado- (4) 2050 p = 0.005 status
escence (0.32-0.78) 2Diet con- Semi-conti- 10.89 Age, gender, sonic- sumed 20 nuous (0.77-1.03) economic status, years before variables 20.81 consumption of a interview (effect per (0.70-0.94) food item during
category) adolescence and 20 years before inter- view
Ramon etal., 117/234, FF0 (89), Highest vs 0.66 p >0.05 Matched by sex, Population- 1993, Spain M, F interviewed lowest (4) age, telephone pos- based
session. Adjusted for sex, age
I noue et al., 668/668, FF0, self- Fresh veg.: 0.70(0,55— p <0.05 Matched by age, Hospital-based 1994, Japan M, F administered ~ 3 vs < 3/w 0.88) sex, time of hospital
(2) visit. Adjusted for sex
Cornée etal., 92/128, FF0 (30, 9 Highest vs 0.77 p = 0.68 Matched by age, Hospital-based 1995, France M, F fruits and lowest (3) (0.37-1.60) sex (group matching) Veg. comprise
veg.), inter- Adjusted for age, all types except viewed sex, occupation, dried veg. and
energy potatoes
138

Cancer-preventive effects
Author, year, Cases/controls, Exposure Range Relative Stat. sign.* Adjustment Comments country gender assessment contrasts risk for confounding
(no. of items) (no. of (95% Cl) categories)
Lee et at, 213/213, FF0 (64), Fresh veg.: 1.2 (0.8-1.9) p> 0.01 Matched by age, sex. Hospital-based 1995, Korea M, F interviewed Highest vs Adjusted for age, sex,
lowest (3) education, economic status, residence
Xu at al., 1996, 293/959, FF0, a 7.4 vs 0.5 (0.4-0.8) Matched by sex, age. Iron and steel China M, F interviewed 15 5.4 g/d (3) Adjusted for age, workers
smoking, education, fruit consumption, stomach disease, family stomach cancer
Harrison, et at, 91 (60 intestinal, FF0, self- Increase in Intestinal: Energy, age, sex, Hospital-based 1997, USA 31 diffuse)/132, administered one standard 0.8 (0.5-1.3) race, education,
M, F deviation Diffuse: smoking, alcohol, 0.7 (0.4-12) BMI
La Vecchia et 746/2053, FF0 (29, 7 z~ 7 vs cc 5 0.5(0.4-0.7) p<0.001 Age, sex, area of resi- Hospital-based at, 1997, Italy M, F veg) inter- different types dence, education, Data relate to
viewed of veg./wk family history of diversity of (4) gastric cancer, total types of veg.
number of serving, consumed, BMI, energy rather than
number of all veg. items
MuOoz et al., 88/103, FF0 (36), 8 vs 6/wk 0.47 p>0.05 Sex, age, area of Hospital-based, 1997, Italy M, F interviewed (3) (0.22-1.03) residence, education subjects with
family history. OR for subjects without family history 0.46
Ji et al., 1998, 770/819, M FF0 (74), ~t 263.5 vs M: 0.4 (0.3— p <0.001 Matched by age Population- China 354/632, F interviewed 158.9 0.5) and sex. Adjusted based
servings/mo F: 0.7 p>0.05 for age, income, edu- (4) (0.5-1.1) cation, smoking,
alcohol
Gao et at, 149/228, FF0, inter- Raw veg.: 0.07(0.04— Matched by age, Population- 1999, China M, F viewed Frequently 0.13) sex and neighbour- based
vs almost hood. Adjusted for age never (3) and sex
Ward & Lopez- 220/752, FF0 (70,13 - 6 vs <4 0.3 (0.10.6) P 0.001 Matched by age. Population- Carrillo, 1999, M, F veg.), inter- times/d (4) Adjusted for age, sex, based Mexico viewed energy, chili pepper Similar findings
consumption, added by subtype
salt, history of peptic ulcer, cigarettes, socioeconomic status
139

IARC Handbooks of Cancer Prevention Volume 8: Fruit and Vegetables
Table 25 (con r.
Author, year, Caseslcontrols, Exposure Range Relative Stat. sign.* Adjustment Comments country gender assessment contrasts risk for confounding
(no. of items) (no. of (95% Cl) categories)
Ekström et al., (Cardia; 69, non- FFQ (45), 2/d vs Cardia: p = 0.05 Matched by age, Population- 2000, carda 395)11061, dietary habits 5/w (4) 0.5 (0.3-1.1) sex. Adjusted for based Sweden M, F 20 years Non-cardia: p = 0.02 energy, smoking, Similar findings
before inter- 0.7 (0.5-1.0) BMI, area, number by histology view of - -j-=-
Huang et al., 111/26996, 2000, Japan M, F
Mathew et al., 194/305, 2000, India M, F
conomic status, number of meals/ day, multi-vitamin supplements, table sait use, urban environment
FF0, self- Raw veg.; Gastric cancer p <0.05 Age, sex, smoking, Hospital-based administered a 3 times/wk family history drinking, pickled
VS <3 (+): 0.52 veg., fruit, raw veg., tines/mo (0.27-099) carrots, lettuce,
Gastric cancer p > 0.05 pumpkin family history (-): 0.95 (0.64-1.41)
FF0, inter- > 9 vs 3/w 1.1(0.2-5.0) p = 0.06 Matched by age, Hospital-based viewed sex, religion, resi-
dential area. Adjusted for age, sex, religion, income, smoking, alcohol
De Stefan! et 160/320, al., 2001, M,F
Uruguay
FF0 (64,13 ~: 128.8 g/d 083 veg.), inter- vs ~ 71.6 g/d (0.49-1.43) viewed (3)
P = 0.54 Matched with sex, Hospital-based age, residence Tubers and and urban/rural legumes status. Adjusted fer excluded age, sex, resi- dence, urban/rural status, education, BMI, energy, fruit
Chen et at, 124/449, 2002a, USA M, F
Short FF0 Highest vs 11 (0.77-3.7) p >0.05 (54), inter- lowest (4) viewed, validated against full questionnaire
Matched with age, Population- sex and vital status. based Adjusted for sex, age, energy, respondent type, BMI, alcohol, tobacco, education, family history, vitamin supplement use
140
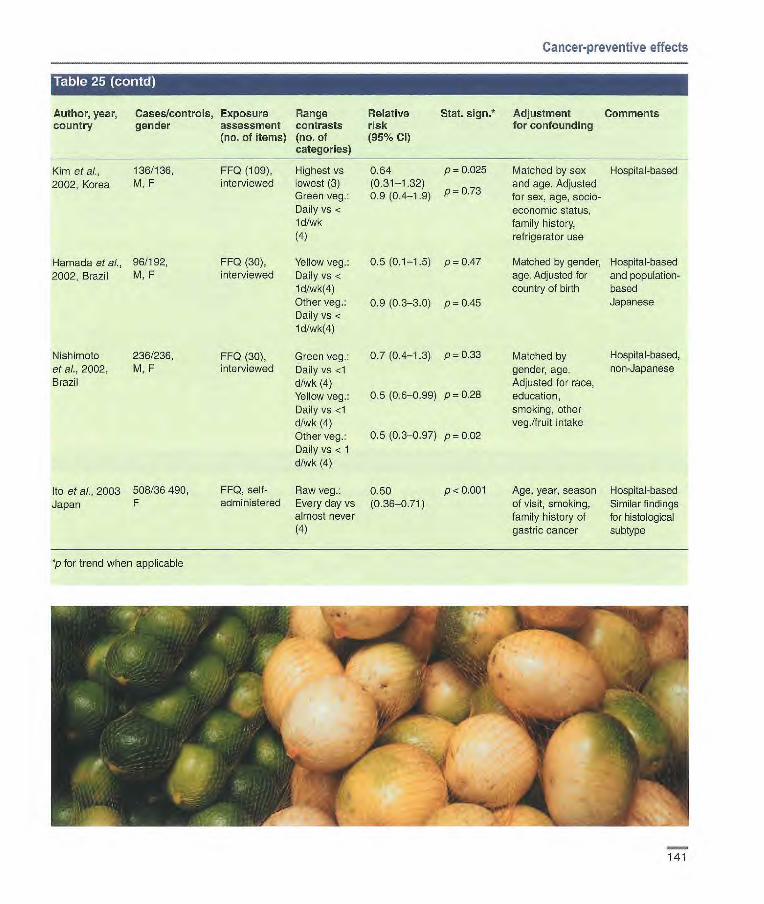
Cancer-preventive effects
Author, year, country
Cases/controls, Exposure gender assessment
(no. of items)
flange contrasts (no. of categories)
Relative risk (95°Jo CI)
Stat. sign.* Adjustment for confounding
Comments
Kim et cl., 136/136, FF0 (109), Highest vs 0.64 p= 0.025 Matched by sex Hospital-based 2002, Korea M, F interviewed lowest (3) (0.31-1.32) and age. Adjusted
Green veg.: 0.9 (0.4-1.9) - 073 p - . for sex, age, socio- Daily vs < economic status, ld/wk family history, (4) refrigerator use
Hamada et al., 96/192, FF0 (30), Yellow veg.: 0.5 (0.1-1.5) p 0.47 Matched by gender, Hospital-based 2002, Brazil M, F interviewed Daily vs < age. Adjusted for and population-
1 d/wk(4) country of birth based Other veg.: 0.9 (0.3-3.0) p 0.45 Japanese Daily vs ld/wk(4)
Nishimolo 236/236, FF0 (30), Green veg.: 0.7 (0.4-1.3) p 0.33 Matched by Hospital-based, et al., 2002, M, F interviewed Daily vs <1 gender, age. non-Japanese Brazil d/wk (4) Adjusted for race,
Yellow veg.: 0.5 (0.6-0.99) p 0.28 education, Daily vs <1 smoking, other d/wk (4) veg.Ifruit intake Other veg.: 0.5 (0.3-0.97) p 0.02 Daily vs < 1 d/wk (4)
Ito et al., 2003 508/36 490, FF0, self- Raw veg.: 0.50 p < 0.001 Age, year, season Hospital-based Japan F administered Every day vs (0.36-0.71) of visit, smoking, Similar findings
almost never family history of for histological (4) gastric cancer subtype
p for trend when applicable
141

IARC Handbooks of Cancer Prevention Volume 8: Fruit and Vegetables
Table 26. Cohort studies of total fruit and vegetable consumption and risk of stomach cancer
Author, year, Cases/cohort Exposure Range Relative Stat. sign.* Adjustment Comments country size, gender assessment contrasts risk for confounding
(years follow-up) (no. of items) (no. of (95% Cl) categories)
Terry et ai., 116/11 546, 1998, M,F Sweden 25 y
FF0 (150, 544 vs 0.72 p 0.14 17veg.,8 190g/d(5) (0.48-1.10) fruits)
FF0 (13), Fresh fruit 0.5 (0.3-0.8) p=0.02 interviewed and raw
veg.: z!14 vs < 8/wk (3)
FF0 (23), High vs [0.18 p< 0.05 self-adminis- none/very (0.05-060)] tered little (4)
Age, sex, smoking, Incidence education, stomach Case-cohort disorders, family analysis history cf gastric All cohort: cancer 120 852
Age, education, Incidence Japanese place of birth, gender (analy- ses among men; also smoking, alcohol)
Sex, age, smoking, Incidence BMI at 25 y, Twin study childhood socio-economic status, alcohol
Botterweck et 264/3123, al., 1998, M, F
Netherlands subcohorts 6.3 y
Galanis et al., 108/11 907, 1998, Hawaii M, F (Japanese) 14.8 y
*p for trend when applicable
Author, year, Cases/controls, Exposure Range Relative Stat. sign? Adjustment Comments country gender assessment contrasts risk for confounding
(no. of items) (no. of (95% Cl) categories)
Boeing et al., 741/741, FF0 (43, 8 Highest vs 0.53 p 0.01 1991b, Poland M, F fruits and 12 lowest (5) (0.37-0.75)
veg.), Fruit and veg. score
Hanseon et ai., 338/669, FFQ (45), Highest vs 038 1993, Sweden M, F interviewed lowest (4) (021-0.67)
Age, sex, occupation, Hospital-based education, residence Similar results
for intestinal and diffuse type
Age, gender, socio- Population- economic status, con- based sumption of a food item during adoles- cence and 20 years before interview
De Stefani et 160/320, FF0 (64, 22 ~t 321.1 vs 0.33 p <0.001 ai., 2001, M, F fruits and 192.1 g/d (3) (0.19-0.56)
Uruguay veg.), interviewed
*p for trend when applicable
142
Matched by sex, age, Hospital-based residence and Tubers and
urban/rural status, legumes
Adjusted for age, sex, excluded residence, urban/rural status, education, BMI, energy, tubers, legumes
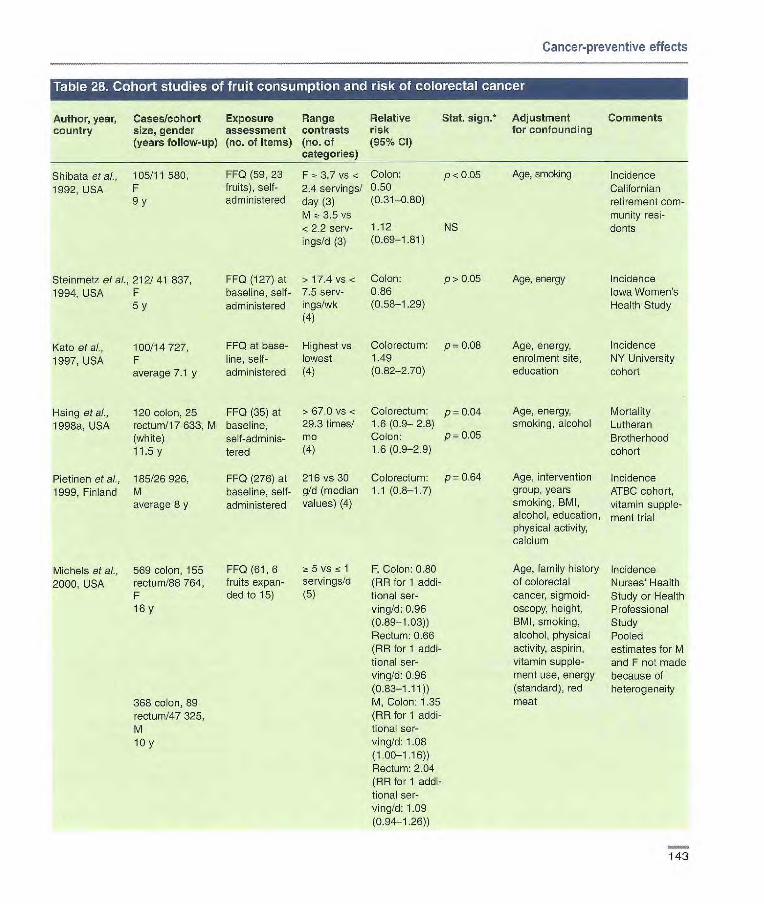
Cancer-preventive effects
Author, year, Cases/cohort Exposure Range Relative Stat. sign.* Adjustment Comments country size, gender assessment contrasts risk for confounding
(years follow-up) (no. of items) (no. of (95% Cl) categories)
Shibata et ai., 105/11 580, FF0 (59, 23 F , 3.7 vs < Colon: p <0.05 Age, smoking Incidence 1992, USA F fruits), self- 2.4 servings! 0.50 Californian
9 y administered day (3) (0.31-0.80) retirement corn- M ~t 3.5 vs niunity resi- <2.2 serv- 1.12 NS dents igs/d (3) (0.69-1.81)
Steinmetz et at., 212/41 837, FF0 (127) at > 17.4 vs < Colon: p> 0.05 Age, energy Incidence 1994, USA F baseline, self- 7.5 sers- 0.86 Iowa Women's
5 y administered ings/wk (0.58-1.29) Health Study (4)
Kato et al., 100/14727, FF0 at base- Highest vs Colorectum: p= 0.08 Age, energy, Incidence
1997, USA F line, self- lowest 1.49 enrolment site, NY University average 7.1 y administered (4) (0.82-2.70) education cohort
Hsing et ai., 120 colon, 25 FF0 (35) at >67.0 vs < Colorectum: p = 0.04 Age, energy, Mortality 1998a, USA rectum/17 633, M baseline, 29.3 times! 1.6 (0.9- 2.8) smoking, alcohol Lutheran
(white) seif-adminis- mo Colon: P 0.05 Brotherhood 11.5 y tered (4) 1.6 (0.9-2.9) cohort
Pietinen eta)., 185/26926, FF0 (276) at 216 vs 30 Colorectum: p= 0.64 Age, intervention Incidence 1999, Finland M baseline, self- g!d (median 1.1 (0.8-1.7) group, years ATBC cohort,
average 8 y administered values) (4) smoking, BMI, vitamin supple- alcohol, education, ment trial physical activity, calcium
FFQ(61,6 5vs fc1 fruits expan- servings/b ded to 15) (5)
Michels et al., 569 colon, 155 2000, USA rectum/88 764,
F 16y
368 colon, 89 rectum/47 325, M toy
F, Colon: 0.80 (RB for 1 addi-tional ser-ving/d: 0.96 (0.89-1.03)) Rectum: 0.66 (BR for 1 addi-tional ser-ving/b: 0.96 (0.83-1.11)) M, Colon: 1.35 (RR for 1 addi-tional ser-virig/d: 1.08 (1.00-1.16)) Rectum: 2.04 (RR for 1 addi-tional ser-ving/d: 1.09 (0.94-1.26))
Age, family history Incidence of colorectal Nurses' Health cancer, sigmoid- Study or Health oscopy, height, Professional BMI, smoking, Study alcohol, physical Pooled activity, aspirin, estimates for M vitamin supple- and F not made ment use, energy because of (standard), red heterogeneity meat
143
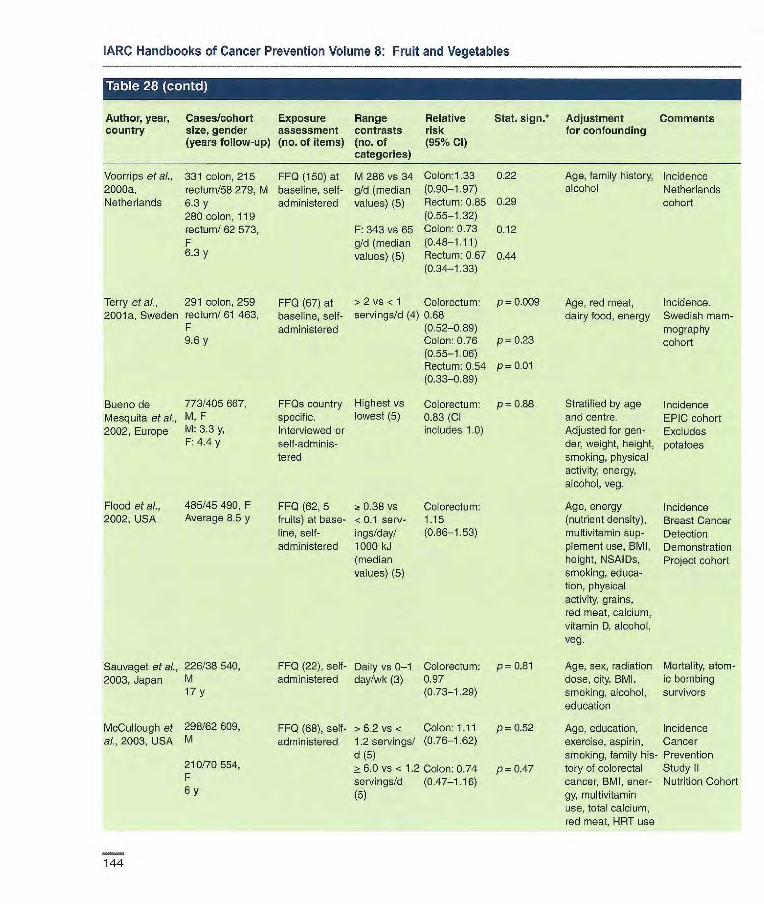
IARC Handbooks of Cancer Prevention Volume 8: Fruit and Vegetables
• r I@] I .W-4 Z(Ii'J I R'J
Author, year, Cases/cohort Exposure Range Relative Stat. 5jgfl* Adjustment Comments country size, gender assessment contrasts risk for confounding
(years follow-up) (no. of items) (no. of (95% Cl) categories)
Voorrips et al., 331 colon, 215 FF0 (150) at M 286 vs 34 Colon:1.33 0.22 Age, family history, Incidence 2000a, rectum/SB 279, M baseline, self- g!d (median (0.90-1.97) alcohol Netherlands Netherlands (3.3 y administered values) (5) Rectum: 0.85 0.29 cohort
280 colon, 119 (0.55-1.32) rectum! 62 573, F: 343 vs 65 Colon: 0.73 0.12 F gld (median (0.48-1.11) 6.3 y values) (5) Rectum: 0.67 0.44
(0.34-1.33)
Terry etal., 291 colon, 259 FF0 (67) at >2 vs < 1 Colorectum: p= 0.009 Age, red meat, Incidence. 2001a, Sweden rectum! 61 463, baseline, self- servings/d (4) 0.68 dairy food, energy Swedish mam-
F administered (0.52-0.89) mography 9.6 y Colon: 0.76 p= 0.23 cohort
(0.55-1.06) Rectum: 0.54 p= 0.01 (0.33-089)
Buono de 773/405 667, FFQs country Highest VS Colorectum: p= 0.88 Stratified by age Incidence Mesquita et ai., M, F specific. lowest (5) 0.83 (Cl and centre. EPIC cohort 2002, Europe M: 3.3 y, Interviewed or includes 1.0) Adjusted for gen- Excludes
F: 4.4 y self-adniinis- der, weight, height, potatoes to red smoking, physical
activity, energy, alcohol, veg.
Flood et al., 485/45 490, F FF0 (62, 5 0.38 vs Colorectum: Age, energy Incidence 2002, USA Average 8.5 y fruits) at base- < 0.1 serv- 1.15 (nutrient density), Breast Cancer
line, self- ings/day! (0.86-1.53) multivitamin sup- Detection administered 1000 kJ plenent use, BMI, Demonstration
(median height, NSA1Ds, Project cohort values) (5) smoking, educa-
tion, physical activity, grains, red meat, calcium, vitamin D, alcohol, veg.
Sauvaget et al., 226/38 540, FF0 (22), self- Daily vs 0-1 Colorectum: p 0.81 Age, sex, radiation Mortality, atom- 2003, Japan M administered day/wk (3) 0.97 dose, city, BMI, ic bombing
17 y (0.73-1.29) smoking, alcohol, survivors education
McCullough et 298/62609, FF0 (68), self- > 6.2 vs . Colon: 1.11 p = 0.52 Age, education, Incidence al., 2003, USA M administered 1.2 servings/ (0.76-1.62) exercise, aspirin, Cancer
d (5) smoking, family his- Prevention 210/70554, > 6.0 vs < 12 Colon: 0.74 p = 0.47 tory of colorectal Study II F servings/d (0.47-1.16) cancer, BMI, ener- Nutrition Cohort 6 y (5) gy, multivitaniin
use, total calcium, red meat, HRT use
144
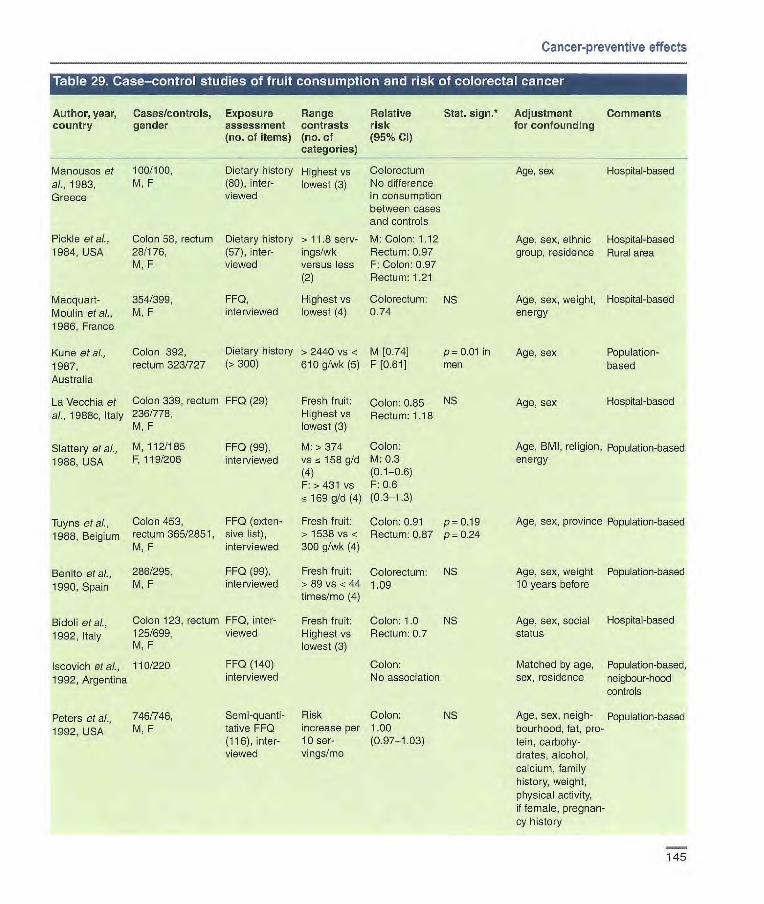
Author, year, Cases/controls, Exposure Range Relative country gender assessment contrasts risk
(no. of items) (no. of (95% Cl categories)
Manousos at 100/100, Dietary history H 1 ghest vs Colorectum al., 1983, M, F (80), inter- lowest (3) No difference
Greece viewed in consumption between cases and controls
Pickle at at, Colon 58, rectum Dietary history > 11.8 serv- M: Colon: 1.12 1984, USA 28/176, (57), inter- ings/wk Rectum: 0.97
M, F viewed versus less F: Colon: 0.97 (2) Rectum: 1.21
Macquart- 354/399, FF0, Highest vs Colorectum: Moulin et al., M, F interviewed lowest (4) 0.74
1986, France
Kune at al., Colon 392, Dietary history > 2440 vs < M [0.74]
1987, rectum 323/727 (>300) 610 g/wk (5) F [0.61]
Stat. sign. Adjustment Comments for confounding
NS
p-0.0I in men
Age, sex Hosptal-based
Age, sex, ethnic Hospital-based group, residence Rural area
Age, sex, weight, Hospital-based energy
Age, sex Population- based
Cancer-preventive effects
Australia
La Vecchia et Colon 339, rectum FF0 (29)
at, 1968e, Italy 236/778, M, F
Slattery etal., M, 112/185 FF0 (99),
1988, USA F, 119/206 interviewed
Tuyns et a]., Colon 453, FF0 (exten
1988, Belgium rectum 365/2851, sive list), M, F interviewed
Benito at al., 286/295, FF0 (99),
1990, Spain M, F interviewed
Bidoli at al., Colon 123, rectum FF0, inter-
1992, Italy 125/699, viewed M, F
Iscovich etal., 110/220 FF0 (140)
1992, Argentina interviewed
Fresh fruit: Colon: 0.85 NS Highest vs Rectum: 1.18 lowest (3)
M:>374 Colon: vs158gld M:0.3 (4) 1 F: > 431 vs F: 0.6
169 g/d (4) (0.3-1.3)
Fresh fruit: Colon: 0.91 p= 0.19 > 1538 vs < Rectum: 0.87 p- 0.24 300 g/wk (4)
Fresh fruit: Colorectum: NS >89vs<44 1.09 times/mo (4)
Fresh fruit: Colon: 1.0 NS Highest vs Rectum: 0.7 lowest (3)
Colon: No association
Age, sex Hospital-based
Age, BMI, religion, Population-based energy
Age, sex, province Population-based
Age, sex, weight Population-based 10 years before
Age, sex, social Hosp ta -based status
Matched by age, Population-based, sex, residence neigbour-hood
controls
Age, sex, neigh- Population-based bourhood, fat, pro- tein, carbohy- drates, alcohol, calcium, family history, weight, physical activity, if female, pregnan- cy history
Peters at al., 746/746, Semi-quant - Risk Colon: NS
1992, USA M, F tative FF0 increase per 1.00 (116),inter- 10 see- (097-.103) viewed vin gs/rno
145

Steinmetz & M 121/241 Potter, 1993, F 99/197 Australia
Centonze et al. Colorectal 1994, Italy 119/119,
M, F
Kampman et M 130/136 aL, 1995, F 102/123
Netherlands
Kotake et ah, Colon 187, 1995, Japan rectum
176/383 screening and hospital controls, M. F
Shannon etal., M 238/224
1996, USA F186/190
Franceschi et Colon 1225
ai., 1997, Italy Rectum 728/ 4154, M, F
Boutron-Ruault 171/309,
etal., 1999, M,F
France
Levi et al., Colon 119, 1999, rectum 104/491,
Switzerland
M, F
Age, sex, occupa- Population- tion, Quetelet based index, alcohol, pro- tein intake, age at first live birth for women
Age, sex, smoking, Population-education, changes based in diet
Age, urbanization, Population- energy, alcohol, based cholecystectomy, family history
Age, sex
Age, energy
Age, sex, centre, education, energy, physical activity, veg., number of servings
Hospital-based
Population-based
Hospital-based
Age, sex, energy Population- based
IARC Handbooks of Cancer Prevention Volume 8: Fruit and Vegetables
Table 29 (coil
Author, year, Cases/controls, Exposure Range Relative Stat. sign. Adjustment Comments country gender assessment contrasts risk for confounding
(no. of items) (no. of (95% Cl) categories)
FFQ (141, 14 M: 28 vs ~-. 8Colon fruits), self- servings/wk M: 1.74 administered, (4) (088-.346) previously F: ~ 34 vs , F: 0.90
validated 12 servings! (0.38-2.11)
wk (4)
FF0 (70), ~: 480 vs Colorectum: p= 0.96 interviewed 305 g/d (3) 1.02
(053-1.95)
FF0 (289), M: > 269 vs Colon: p= 0.88 interviewed <100 g/d (3) M: 1.00
F: > 327 vs (049-2.03) <143g/d(3) F:0.54 P= 0.13
(0.23-1.23)
FF0 (10) Daily vs 1-2 Colon: 0.8 times/wk (4) (0.27-2.41)
Rectum: 0.7 (0.21-2.08)
Semiquanti- M:> 17 vs Colon tative FF0 (71), 0.46 serv- M: 0.77 p= 0.21 interviewed by ings/d (4) (0.44-1.36) telephone F: >2.1 vs F: 0.44 p = 0.007
0.69 (0.24-0.82) servings/d (4)
FF0 (79), Diversity of Colon: 0.80 NS interviewed consumption: (0.63-1.01)
>6 vs 3 Rectum: 0.94 p= 0.36 servings/wk (0.70-1.25) (3)
Dietary history, M: >273.2 Colorectum: p 0.34 interviewed vs < 130 g/d 1.0 (0.6-1.6)
(4) F: > 256.4 vs <137.4 g/d (4)
FF0 (79), Citrus fruit: Colorectum: interviewed OR for an 0.86
increase of (0.78-0.96) one serving/d Other fruit: Colorectum: OR for an 0.85(0.75— increase of 0.96) one serving/d
Age, sex, educa- Hospital-based lion, tobacco, alcohol, BMI, energy, physical activity
146

Cancer-preventive effects
Author, year, Cases/controls, Exposure Range Relative
Stat. sign.* Adjustment Comments country gender assessment contrasts risk
for confounding
(no. of items) (no. of (95% Cl) categories)
Murata et aL. Colon 265 FF0, self- Daily vs rare Colon:
1999, Japan Rectum 164/794, administered (4) 0.94 M, F (0.76-1.13)
Rectum: 0.98 (0.79-1.22)
Denec- Coion: 260, FF0 (64, Highest vs Coloroctum: p 0.04 Pellegrin et at., Rectum: 224/ 10 fruits), lowest (4) 0.7 (0.5-0.9) 2002, Uruguay 1452 interviewed
*p for trend when applicable
Age, alcohol, Hospital-based tobacco, sex, eating attitude, other foods
Age, sex, residence, urban/rural status, education, family history of colon cancer, BMI, energy, red meat intake
Hospital-based
Table [ 11ZuhIiuiii] iL'1iithiIrisk u colorectal rcancer
Author, year, Cases/cohort Exposure Range Relative Stat. sign.* Adjustment Comments country size, gender assessment contrasts risk for confounding
(years follow-up) (no. of items) (no. of (95% Cl) categories)
Si et al., 105 F, 97 M/ FF0 (59) F 2! 4.8 vs < Colon:
1992, USA Ii 580 at baseline, 3.2 servings! 0.72 (0.45- 9 y self-adminis- d (3) 1.16)
tered M a 4.5 vs z 1.39 (0.84- 3 servings! 2.30)
d (3)
Thun et aI., 539 F, 611, M! FF0 (32) at Highest vs Colon: 1992, USA 5746 baseline lowest (5) F 0.66
6y M0.80
Steinmetz, et 212/41 637, F FF0 (127) >30.4 vs Colon: p>O.O5
at., 1994, USA 5 y at baseline, < 15.1 0.73 self-adminis- servings/wk (0.47-1.13) tered (4)
Age, smoking Incidence California retire- ment community residents Includes potatoes
Matched by age, Mortality race, sex ACS Cancer
Prevention II cohort: 426 838 F, 337 505 M Nested case— cohort design Inclusion of potatoes not specified
Age, energy Incidence Iowa Woman's Health Study Includes potatoes
NS
NS
147

IARC Handbooks of Cancer Prevention Volume 8: Fruit and Vegetables
Table 30 ( ni
Author, year, Cases/cohort Exposure Range Relative Stat. sign.* Adjustment Comments country size, gender assessment contrasts risk for confounding
(years follow-up) (no. of items) (no. of (95% Cl) categories)
Kato, at al, 100/14727, FFQ at base- Highest vs Colorectum: p = 0.40 Age, energy, Incidence 1997, USA F line, self- lowest (4) 1.63(0.92— enrolment site, NY University
Average 7.1 y administered 2.89) education cohort Excludes pota- toes
Hsing, at at, 125 colon, 25 FF0 (35) at > 4.5 vs < Colorectum: p = 0.3 Age, energy (stan- Mortality 1998a, USA rectum/i 7 633, baseline, 1.2 1.3 (0.8-24) dard), smoking, Lutheran
M self-adminis- Umes/rno Colon: p = 0.3 alcohol Brotherhood (white) tered 1.5 (0.8-2.6) cohort 11.5 y Includes
potatoes
Pietinen, et at, 185/26 926, FF0 (276) at 191 vs 44 Colorectun: p= 0.46 Age, intervention Incidence 1999, Finland M baseline, g/d (median 1.2 (0.8-1.9) group, years ATBC cohort,
Average 6 y self-adrninis- values) (4) smoking BMI, vitamin supple- tered alcohol, education, ment trial. All
physical activity, smokers calcium Inclusion of
potatoes not specified
Michels, at aI., 368 colon, 89 FF0 (61, 11 zt 5 vs 1 Colon: Age, family Incidence 2000, USA rectum/47 325, veg., expan- servings/d 1.00(0.72— history of colo- Nurses' Health
M ded to 28) (5) 1.38) rectal cancer, sig- Study or Health 569 colon; 155 (PR for 1 moidoscopy, Professional rectum/88 764, additional serv- height, BMI, Study F log/day: smoking, alcohol, Excludes M 10 y, F 16 y 1.03 (0.97— physical activity, potatoes
1.09)) menopausal Pooled esti- Rectum: 1.17 status, hormone mates for M (0.63-2.18) replacement and F (PR for I therapy, aspirin, additional serv- vitamin supple- ing/day: 1.02 ment use, energy, (0.92— 1.14)) red meat
Voorrips at at, 312 colon, 199 FF0 (150) M 285 vs Colon: p = 0.45 Age, family history, Incidence 2000a, rectum/58 279, M at baseline, 100 g/d 0.85(0.57— alcohol Netherlands Netherlands 266 colon, 115 self-adminis- (median 1.27) cohort
rectum/62 573, F tered values) (5) Rectum: p = 0.58 Excludes 6.3 y 0.88(0.55— potatoes
1.41) F 293 vs Colon: p = 0.31 107 g/d 0.83(0.54— (median 1.26) values) (5) Rectum: p = 0.09
1.78(0.94— 3.38)
148
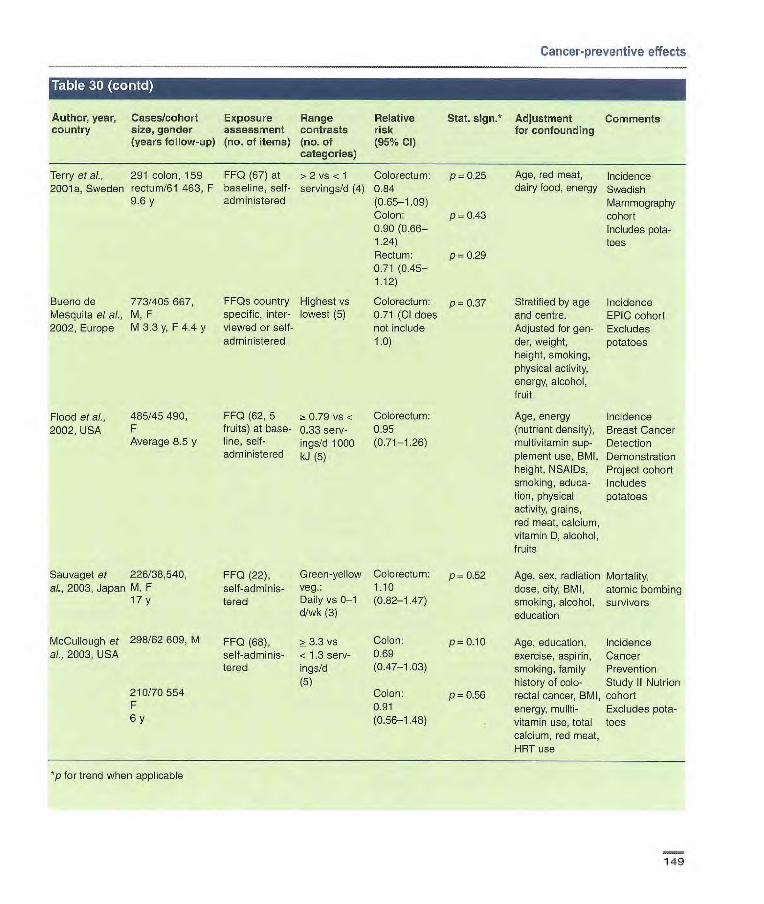
Cancer-preventive effects
Author, year, country
Cases/cohort size, gender (years follow-up)
Exposure assessment (no. of items)
Range contrasts (no. of categories)
Relative risk (95% Cl)
Stat. sign.* Adjustment for confounding
Comments
Terry et al., 291 colon, 159 FF0 (67) at > 2 vs < 1 Colorectum: p 0.25 Age, red meat, Incidence 2001 a, Sweden rectum/61 463, F baseline, self- servings/d (4) 0.84 dairy food, energy Swedish
9.6 y administered (0-65-1.09) Mammography Colon: p = 0.43 cohort 0.90 (0.66— Includes pota- 1.24) toes Rectum: p=0.29 0.71 (0.45- 1.12)
Bueno de 773/405 667, FFQs country Highest vs Colorectum: p = 0.37 Stratified by age Incidence Mesquita et al., M, F specific, inter- lowest (5) 0.71 (Cl does and centre. EPIC cohort 2002, Europe M 3.3 y, F 4.4 y viewed or self- not include Adjusted for gen- Excludes
administered 1.0) der, weight, potatoes height, smoking, physical activity, energy, alcohol, fruit
Flood et al., 485/45490, FF0 (62, 5 a: 0.79 vs < Colorectum: Age, energy Incidence 2002, USA F fruits) at base- 0.33 serv- 0.95 (nutrient density), Breast Cancer
Average 8.5 y line, self- ings/d 1000 (0.71-1.26) multivitamin sup- Detection administered kJ (5) plement use, BMI, Demonstration
height, NSAIDs, Project cohort smoking, educa- Includes tion, physical potatoes activity, grains, red meat, calcium, vitamin D, alcohol, fruits
Sauvaget et 226/38,540, FF0 (22), Green-yellow Colorectum: p = 0.52 Age, sex, radiation Mortality, aI., 2003, Japan M, F self-adrninis- Veg. 1_10 dose, city, BMI, atomic bombing
17 y tered Daily vs 0-1 (0.82-1.47) smoking, alcohol, survivors d/wk (3) education
McCullough et 298/62 609, M FF0 (68), >3.3 vs Colon: p 0.10 Age, education, Incidence al., 2003, USA self-adninis- < 1.3 serv- 0.69 exercise, aspirin, Cancer
tered ings/d (0.47-1.03) smoking, family Prevention (5) history of colo- Study Il Nutrion
210170554 Colon: p = 0.56 rectal cancer, BMI, cohort F 0.91 energy, mullti- Excludes pota- 6 y (0.56-1.48) vitamin use, total toes
calcium, red meat, HRT use
p for trend when applicable
149
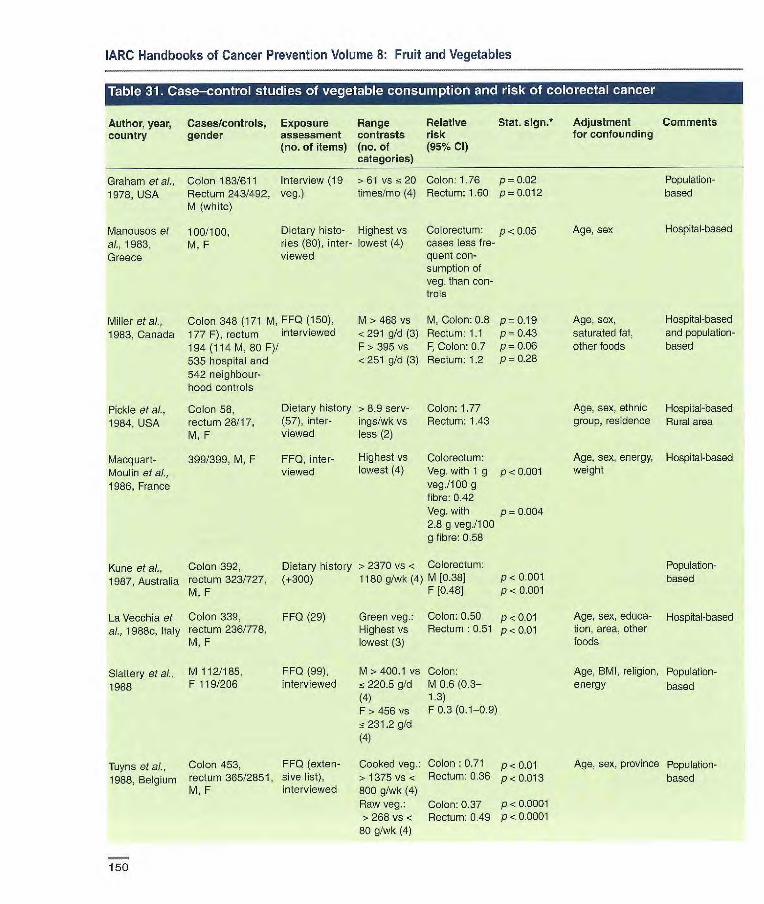
IARC Handbooks of Cancer Prevention Volume 8: Fruit and Vegetables
Author, year, Cases/controls, Exposure Range Relative
Stat. sign.* Adjustment Comments country gender assessment contrasts risk
for confounding
(no. of items) (no. of (95% Cl) categories)
Graham at al., Colon 183/611 Interview (19 > 61 vs < 20 Colon: 1.76 p = 0.02
1978, USA Rectum 243/492, veg.) times/mo (4) Rectum: 1.60 p=0.0l2 M (white)
Manousos at 100/100, Dietary histo- Highest vs Colorectum: p< 0.05 Age, sex
al., 1983, M, F ries (80), inter- Lowest (4) cases Less f re-
Greece viewed quent con-
Population-based
Hospital-based
Miller at al., Colon 348 (171 M, FF0 (150), 1983, Canada 177 F), rectum interviewed
194 (114 M, 80 F)/ 535 hospital and 542 neighbour-hood controls
surnption of veg. than con- trols
M >468 vs M, Colon: 0.8 P= 0.19 Age, sex, <291 g/d (3) Rectum: 1.1 p= 0.43 saturated fat, F > 395 vs F, Colon: 0.7 p = 0-06 other foods <251 g/d (3) Rectum: 1.2 p = 0.28
Hospital-based and population-based
Pickle at ai., Colon 58, Dietary history > 8.9 serv- Colon: 1.77
1984, USA rectum 28/17, (57), inter- ings/wkvs Rectum: 1.43 M, F viewed less (2)
Macquart- 399/399, M, F FF0, inter- Highest vs Colorectum:
Moulin at al., viewed lowest (4) Veg. with 1 g p < 0.001
1986, France veg./100 g fibre: 0.42 Veg. with p = 0.004 2.8 g veg./1 00 g fibre: 0.58
Kune et al.. Colon 392, Dietary history > 2370 vs < Colorectum:
1987, Australia rectum 323/727, (+300) 1180 g/wk (4) M [0.38] p <0.001
M, F F [0.48] p -r 0.001
La Vecchia at Colon 339, FF0 (29) Green veg.: Colon: 0.50 p -r 0.01 ai., 1988c, Italy rectum 236/778, Highest vs Rectum :0.51 p < 0.01
M, F lowest (3)
Slattery at al., M 112/185, FF0 (99), M > 400.1 vs Colon:
1988 F 119/206 interviewed 15 220.5 g/d M 0.6 (0.3- (4) 1.3) F >456 vs F 0.3 (0.1-0.9)
231.2 g/d (4)
Tuyns eta]., Colon 453, FF0 (exten- Cooked veg.: Colon :0.71 p < 0.01 1988, Belgium rectum 365/2851, sive list), > 1375 vs < Rectum: 0.36 p<O.013
M, F interviewed 800 g/wk (4) Raw veg.: Colon: 0.37 p <0.0001 r- 268 vs -r Rectum: 0.49 p <0.0001 80 g/wk (4)
Age, sex, ethnic Hospital-based group, residence Rural area
Age, sex, energy, Hospital-based weight
Population-based
Age, sex, educa- Hospital-based tien, area, other foods
Age, BMI, religion, Population- energy based
Age, sex, province Population- based
150

Highest vs Colon: 0.79 NS lowest (3) (0.48-1.28)
Rectum: 0.51 p<0.05 (0.27-0.98) Colorectum: NS 0.69(0.45— 1 .05)
117 vs < Colorectum: NS 64 times/no 0.71 (4)
>193vs< [0.18 p0.003 75.5 kg/y (3) (0.05-0.61)
Highest vs Colon: 0.7 NS lowest (3) Rectum : 0.6
> 1281 vs < Colon: 0.075 p< 0.001 483 times/y (0.02-0.3) (4)
Semiquanti- Other non- 1.01 tative FF0 cruciferous (0.97-1.04) (116), inter- veg.: viewed Risk increase
per 10 servings/mo
Peters et ai., 746/746, 1992, USA M, F
Steinmetz & M 121/241, FF0 (141 48 M ~t 32 vs < Colon:
Potter, 1993 F 99/197 veg.), self- 15 servings/ M 1.29 administered, wk (4) (0.67-2.51)
previously F a 38 vs < F 1.11
validated 19 servings/ (0.50-2.45)
wk (4)
Cancer-preventive effects
Author, year, Cases/controls, Exposure Range Relative country gender assessment Contrasts risk
(no. of items) (no. of (95% Cl) Categories)
Young & Wolf, 353/618, M, F FF0 (25) Macella- Colon: 1988, USA (white) Diet over age neous veg.: 0.72
35 y 20 times/mo (0.48-1.07) vs 1/mo (5)
Stat. sign.* Adjustment Comments for confounding
Age, sex Population- based
Lee etal., 1989, Colon 131, FF0 (116), Singapore Rectum 71/426, interviewed
M, F
Bonito et aI., 265/267, FF0 (99), 1990, Spain M, F interviewed
Hu et ai., 1991, Colon 111, FF0 (25) China rectum 225/336,
M, F
Bidoli et al., Colon 123, FF0, 1992, Italy rectum 125/699, interviewed
M, F
Iscovich etaL, 110/220, FF0 (143) 1992, Argentina
Age, sex, dialect, Hospital-based education, occupation
Age, sex, weight Population- 10 years prior based
Age, sex, resi- Hospital-based dence
Age, sex, social Hospital-based status
Age, sex, rosi- Population- dence, other based, neigh- foods bourhood
controls
Age, sex, neigh- Population- bourhood, fat, based protein, carbohy- drates, alcohol, calcium, family history, weight, physical activity, if female, pregnancy history
Age, sex, occu- Population- pation, Ouetelet based index, alcohol, protein intake,
age at first live
birth for women
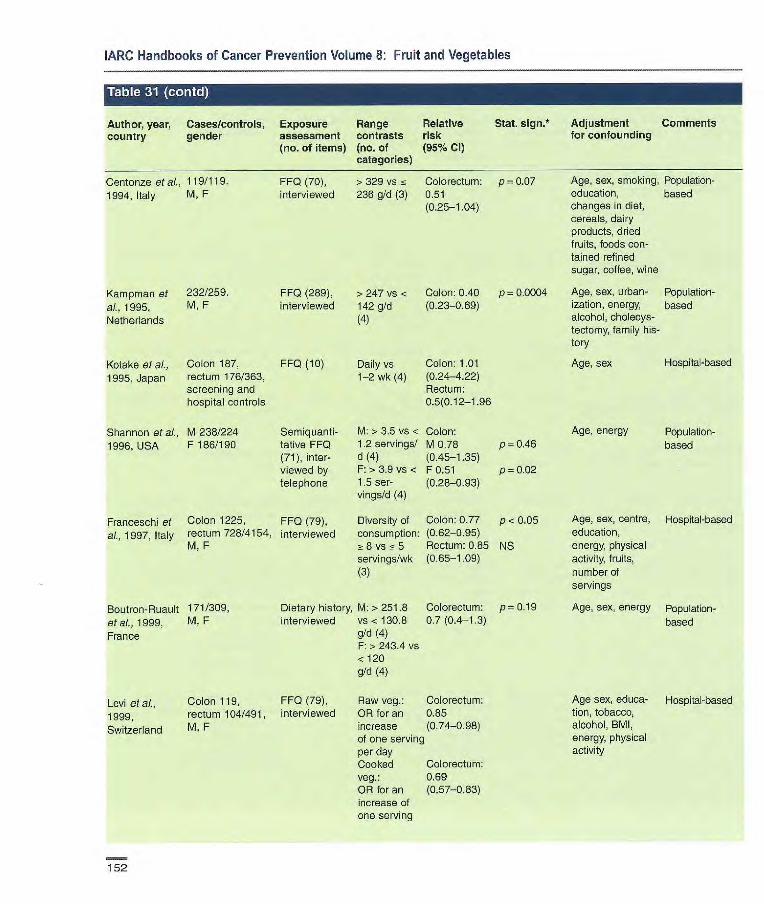
IARC Handbooks of Cancer Prevention Volume 8: Fruit and Vegetables
Author, year, Cases/controls, Exposure Range Relative
Stat. sign.* Adjustment Comments country gender assessment contrasts risk
for confounding
(no. of items) (no. of (95% CI) categories)
Centonze et al., 119/11 9. FF0 (70), > 329 vs i~ Colorectum: p = 0.07 1994, Italy M, F interviewed 236 g/d (3) 0.51
(0.25-1.04)
Kampnan et 232/259. FF0 (289), > 247 vs < Colon: 0.40 p= 0.0004 ai., 1995, M, F interviewed 142 g/d (0.23-0.69) Netherlands (4)
Kotake etaL, Colon 187, FF0 (10) Daily vs Colon: 1.01 1995, Japan rectum 176/363, 1-2 wk (4) (0.24-4.22)
screening and Rectum: hospital controls 0.5(0.12-1.96
Shannon et al., M238/224 Semiquanti- M: > 3.5 vs < Colon: 1996, USA F 186/190 tative FF0 1.2 servings! M 0.78 p0.46
(71), inter- d (4) (0.45-1.35) viewed by F:> 3.9 vs < F 0.51 p 0.02 telephone 1.5 ser- (0.26-0.93)
vings/d (4)
Franceschi et Colon 1225, FF0 (79), Diversity of Colon: 0.77 p <0.05 al., 1997, Italy rectum 728/4154, interviewed consumption: (0.62-0.95)
M, F 8 vs 5 Rectum: 0.85 NS servir gs/wk (0.65-1.09) (3)
Boutron-Ruau!t 171/309, Dietary history, M: >251.8 Colorectum: p= 0.19
etaL, 1999, M, F interviewed vs< 130.6 0.7 (0.4-1.3)
France g/d (4) F: > 243.4 vs <120 g/d (4)
Levi et al., Colon 119, FF0 (79), Raw veg.: Colorectum:
1999, rectum 104/491, interviewed OR for an 0.85
Switzerland M, F increase (0.74-0.98) of one serving per day Cooked Colorectum: veg.: 0.69 OR for an (0.57-0.83) increase of one serving
Age, sex, smoking, Population- education, based changes in diet, cereals, dairy products, dried fruits, foods con- tained refined sugar, coffee, wine
Age, sex, urban- Population- ization, energy, based alcohol, cholecys-tectomy, family his-tory
Age, sex Hospital-based
Age, energy Population- based
Age, sex, centre, Hospital-based education, energy, physical activity, fruits, number of servings
Age, sex, energy Population- based
Age sex, educa- Hospital-based tien, tobacco, alcohol, BMI, energy, physical activity
152
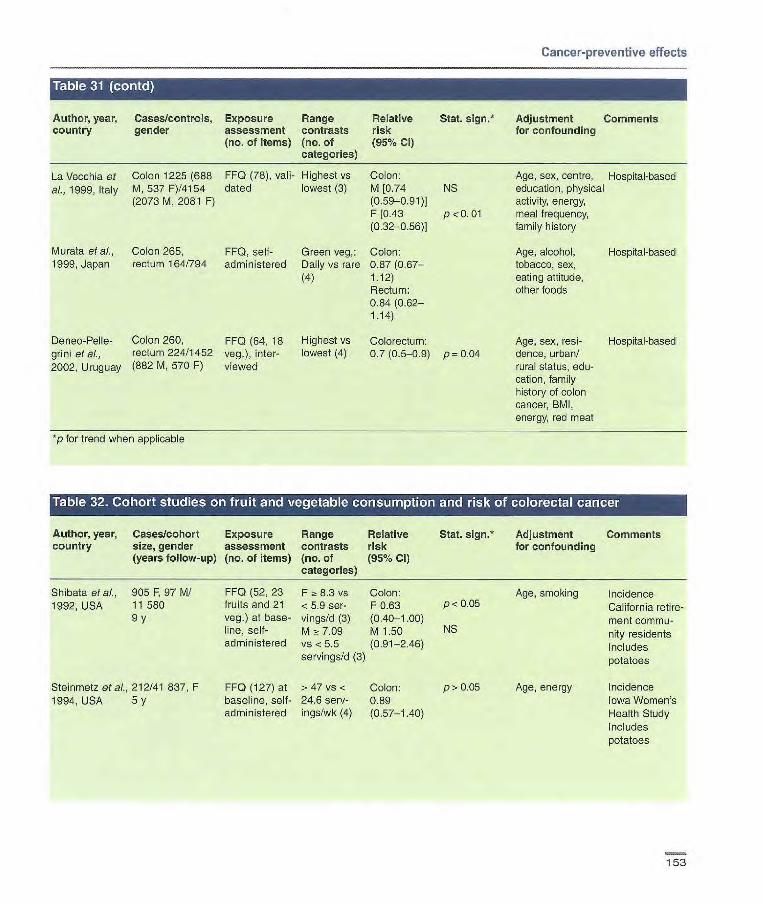
Cancer-preventive effects
Author, year, Cases/controls, Exposure Range Relative Stat. sign. Adjustment Comments country gender assessment contrasts risk for confounding
(no. of items) (no. of (95% Cl) categories)
La Vecchia et Colon 1225 (688 FF0 (78), vail- Highest vs Colon: al., 1999, Italy M, 537 F)/4154 dated lowest (3) M [0.74 NS
(2073 M, 2081 F) (0.59-0.91)] F[0.43 p<0.01 (0.32-0.56)]
Murata etal., Colon 265, FF0, self- Green veg,: Colon: 1999, Japan rectum 164/794 administered Daily vs rare 0.87(0,67—
(4) 1.12) Rectum: 0.84(0.62— 1.14)
Deneo-Pelle- Colon 260, FF0 (64, 18 Highest vs Colorectum: grini et al., rectum 224/1452 veg.), inter- lowest (4) 0.7(0.5-0.9) p=0.04 2002, Uruguay (882 M, 570 F) viewed
*p for trend when applicable
Age, sex, centre, Hospital-based education, physical activity, energy, meal frequency, family history
Age, alcohol, Hospital-based tobacco, sex, eating attitude, other foods
Age, sex, resi- Hospital-based dence, urban/ rural status, edu- cation, family history of colon cancer, BMI, energy, red meat
Stat. sign.* Adjustment Comments for confounding
Author, year, Cases/cohort Exposure Range Relative country size, gender assessment contrasts risk
(years follow-up) (no. of items) (no. of (95% Cl) categories)
Shibata et ci., 905 F. 97 M/ FF0 (52, 23 F 8.3 vs Colon: 1992, USA 11 580 fruits and 21 <5.9 ser- F 0.63
9 y veg.) at base- vings/d (3) (0.40-1.00) line, self- M 7.09 M 1.50 administered vs < 5.5 (0.91-2.46)
servings/d (3)
Steinmetz etal., 212/41 837, F FF0 (127) at >47 vs o Colon: p> 0.05 Age, energy 1994, USA 5 y baseline, self- 24.6 serv- 0.89
administered ings/wk (4) (0.57-1.40)
Age, smoking p< 0.05
NS
Incidence California retire-ment commu-nity residents Includes potatoes
Incidence Iowa Women's Health Study Includes potatoes
153
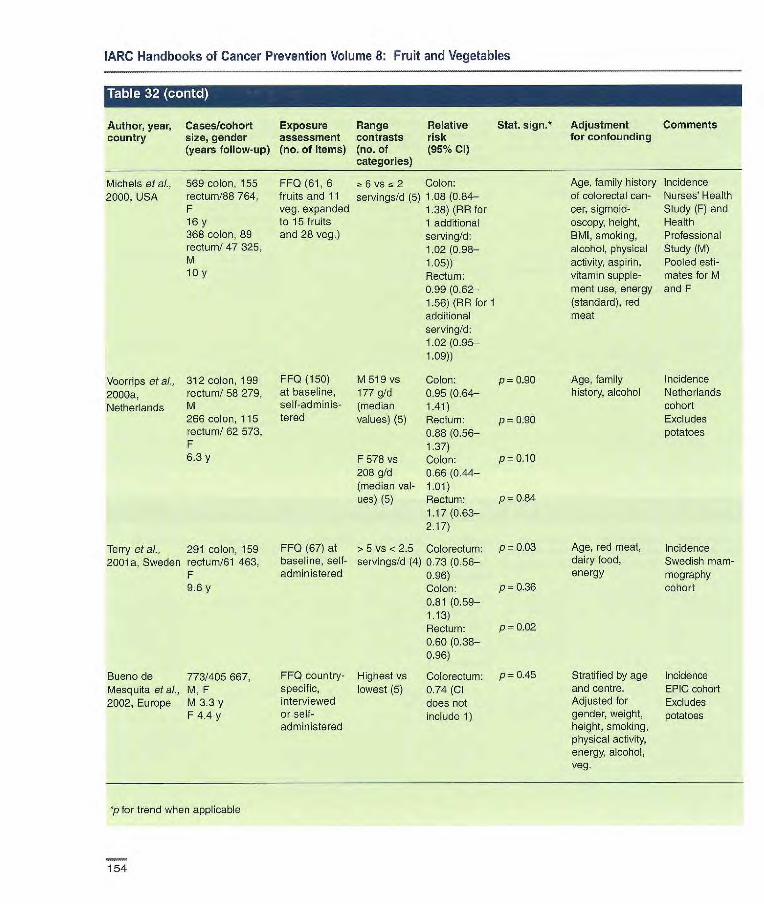
IARC Handbooks of Cancer Prevention Volume 8: Fruit and Vegetables
Author, year, Cases/cohort Exposure Range Relative Stat. sign.* Adjustment Comments country size, gender assessment contrasts risk for confounding
(years follow-up) (no. of items) (no. of (95% Cl) categories)
Bueno de 773/405 667, Mesquita et al., M, F 2002, Europe M 3.3 y
F 4.4 y
p=0.84
p= 0.03
p= 0.36
p=0.02
p= 0.45
FFQ(61,6 6vs~2 Colon: fruits and 11 servings!d (5) 1.08 (0.84- veg. expanded 1.38) (AR for to 15 fruits 1 additional and 28 veg.) serving/d:
1.02 1.05)) Rectum: 0.99(0.62— 1.56) (AR for 1 additional serving!d: 1.02(0.95— 1.09))
FF0 (150) M 519 vs Colon: at baseline, 177 g/d 0.95 1 self-adminis- (median 1.41) tered values) (5) Rectum:
0.88(0.56— 1.37)
F 578 vs Colon: 208 çj!d 0.66 (0.44— (median val- 1.01) ues) (5) Rectum:
1.17 (0.63- 2.17)
FF0 (67) at > S vs < 2.5 Colorectum: baseline, self- servings!d (4) 0.73(0.56— administered 0.96)
Colon: 0.81 (0.59- 1.13) Rectum: 0.60 (0.38- 0.96)
FFQ country- Highest vs Colorectum: specific, lowest (5) 0.74 (Cl interviewed does not or self- include 1) administered
Age, family history Incidence of colorectal can- Nurses' Health cer, sigmoid- Study (F) and oscopy, height, Health BMI, smoking, Professional alcohol, physical Study (M) activity, aspirin, Pooled esti- vitamin supple- mates for M ment use, energy and F (standard), red meat
Age, red meat, Incidence dairy food, Swedish mam- energy mography
cohort
Stratified by age
Incidence and centre. EPIC cohort Adjusted for
Excludes gender, weight, potatoes height, smoking, physical activity, energy, alcohol, veg.
Michels etal., 569 colon, 155 2000, USA rectum/88 764,
F 16 y 368 color, 89 rectum! 47 325, M 10 y
Voorrips etal., 312 colon, 199 2000a, rectum! 58 279,
Netherlands M 266 colon, 115 rectum! 62 573, F 6.3 y
Terry et aI., 291 colon, 159 2001a, Sweden rectum /61 463,
F 9.6 y
P 0.90 Age, family Incidence history, alcohol Netherlands
cohort
P 0.90 Excludes potatoes
P 0.10
p for trend when applicable
154

Cancer-preventive effects
Author. year, country
Cases/controls, gender
Exposure assessment (no. of items)
Range contrasts (no. of categories)
Relative risk (96% Cl)
Stat. 5jgfl* Adjustment for confounding
Comments
Pickle at aI., 58 colon, Dietary history > 21.3 serv- Colon 0.97 Age, sex, ethnic Hospital-based,
1984, USA 28 rectum/ i 76, (57), inter- ings!wk vs Rectum 1.21 group, residence rural area M, p viewed less (2)
Peters et aI., 147/147 Questionnaire, Fresh fruit: Colorectum: Education, age Population-
1989, USA M white interviewed or raw veg.: 0.6 (0.2-1.4) based, neigh- 5 vs fc 1 bcurhood con-
times/wk (3) trois
Steinmetz & M 121/141 FF0 (141, 14 M: 59 vs Colon: Age, sex, 0000upa- Population-based Potter, 1993, F 99/197 fruits, 48 28 servings/ M 1.39 ton, Quetelet index,
Australia veg.), pre- wk (4) (0.72-2.71) alcohol, protein viously F: 70 vs F 0.76 intake, age at ffrst validated, self- 36 servings/ (0.33-1.76) Live birth for women administered wk (4)
Shannon et al., M 238/224 Semiquanti- M:> 5 vs 1.8 0.93 p 0.61 Age, energy Population-based
1996, USA P 186/190 tative FF0 servings/d (0.52-1.64) (71), inter- (4) viewed by F: > 5.7 vs < 0.48 p 0.02 telephone 2.4 (0.26-0.86)
servings/d (4)
Deneo- 260 colon, 224 FF0 (64, 10 Highest vs Colorectum: p 0.01 Age, sex, residence, Hospital-based
Pellegrini et al., rectum/1452 fruits, 15 veg), lowest (4) 0.7 (0.5.-09) urban/rural status, 2002, Uruguay interviewed education, family
history of colon can- cer, BMI, energy, red meat
*p for trend when applicable
Author, year, Cases/cohort Exposure Range Relative Stat. sign.* Adjustment Comments country size gender assessment contrasts risk for confounding
(years follow-up) (no. of items) (no. of (95% Cl) categories)
Platz at al., 690/16448, FF0 (131) >8.4 vs 0.81 p=0.03 Age, endoscopy Subjects who 1997, USA M < 1.3 g/d (5) (0.59-1.11) before 1986, family had endo-
9 y history of colorectal scopy (left- cancer, BMI, pack- sided aderio- years smoking, mas) physical activity, reg-ular aspirin use, energy, alcohol, red meat, folate and methionine intake
p for trend when applicable
155
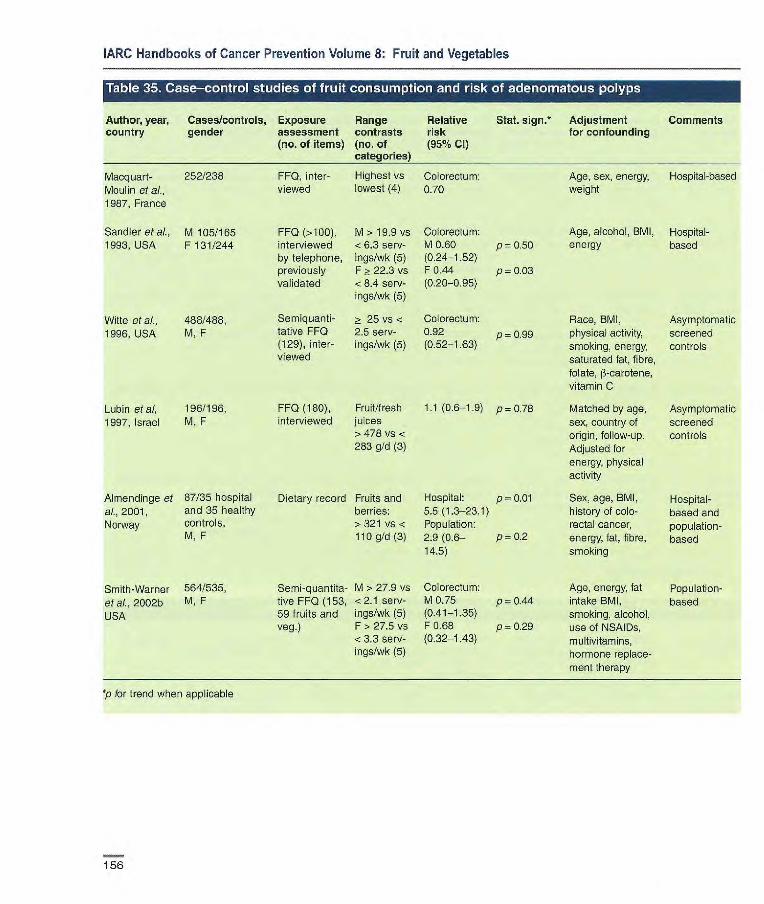
FF0 (>100), M > 19.9 vs Colorectum interviewed <6.3 serv M 0.60 p = 0.50 by telephone, ngs/wk (5) (0.24-1.52) previously F > 22.3 vs F 0.44 p 0.03 validated <8.4 serv- (0.20-0.95)
ings/wk (5)
Semiquanti- > 25 vs < Colorectum: tative FF0 2.5 serv- 0.92 p099 (129), inter- ings/wk (5) (0.52-1.63) viewed
1987, France
Sandier etal., M 105/165 1993, USA F131/244
Witte etal., 4881488, 1996, USA M, F
Age, alcohol, BMI, Hospital- energy based
Race, BMI, physical activity, smoking, energy, saturated fat, fibre, folate, 13-carotene, vitamin C
Matched by age, sex, country of origin, follow-up. Adjusted for energy, physical activity
Sex, age, BMI, history of colo-rectal cancer, energy, fat, fibre, smoking
Age, energy, fat intake BMI, smoking, alcohol, use of NSAIDs, multivitamins, hormone replace-ment therapy
Asymptomatic screened controls
Asymptomatic screened controls
Hospital-based and population-based
Population-based
IARC Handbooks of Cancer Prevention Volume 8: Fruit and Vegetables
Author, year, Cases/controls, Exposure Range Relative country gender assessment contrasts risk
(no. of items) (no. of (95% Cl) categories)
Macquarl- 2521238 FF0, inter- Highest vs Colorectum: Moulin et aL. viewed lowest (4) 070
Stat. sign.* Adjustment Comments for confounding
Age, sex, energy, Hospital-based weight
Lubin eta!, 196/196, FF0 (180), Fruit/fresh 1.1 (0.6-1.9) p=0.78
1997, Israel M, F interviewed juices > 478 vs < 283 g/d (3)
Almendinge et 87/35 hospital Dietary record Fruits and Hospital: p = 0.01 al., 2001, and 35 healthy berries: 5.5 (1.3-23.1) Norway controls, > 321 vs < Population:
M,F 110g/d(3) 2.9(0.6— p=0.2 14.5)
Smith-Warner 564/535, Semi-quantita- M > 27.9 vs Colorectum:
etal., 2002b M, F tive FF0 (153, <2.1 serv- M 0.75 p_OÂ.4
USA 59 fruits and ings/wk (5) (0.41-1.35) veg.) F> 27.5 vs F 0.68 p = 0.29
<3.3 serv- (0.32-1.43) ings/wk (5)
p for trend when applicable
156

Cancer-preventive effects
Author, year, country
Cases/cohort Exposure size, gender assessment (years follow-up) (no. of items)
Range contrasts (no. of categories)
Relative Stat. sign.* risk (95% Cl)
Adjustment for confounding
Comments
P[atz et al., 690/16 448, FF0 (131) > 11.5 vs < 0.93 p 0.33 Age, endoscopy Subjects who 1997, USA M 3.2 g!d (5) (0.67-1.30) before 1986, family had endo-
9 y history of colorectal scopy (left- cancer, BMI, pack- sided adeno- years smoking, mas) physical activity, reg- ular aspirin use, energy, alcohol, red meat, folate and methionine intake
*p for trend when applicable
Author, year, country
Cases/controls, gender
Exposure assessment (no. of items)
Range contrasts (no. of categories)
Relative risk (95% Cl)
Stat sign.* Adjustment for confounding
Comments
Macquart- 252/238, 1 inter- Veg. (low Colorectum: Age, sex, energy, Hospital-based Moulin et al., M, F viewed fibre): Highest 0.78 weight 1987, France vs lowest (4)
Veg.: Highest 1.24 vs lowest (4)
Witte et ai., 488/488, Semiquanti- 45.5 vs Colorectum: p 0.27 Race, BMI, physical Asymptomatic 1996, USA M, F tative FF0 9 servings! 0.90 activity, smoking, screened con-
(129), inter- will (5) (0.49-1.68) energy, sarurated trois viewed fat, fibre, folate,
il-carotene, vitamin C
Lubin et al., 196/196, FF0 (180), > 460 vs < 0.9 (0.6-1.6) p = 0.838 Matched by age, Asymptomatic 1997, Israel M, F interviewed 290 g/d (3) sex, country of screened
origin, follow-up, controls Adjusted for energy, physical activity
Sandier et al., M 105/165 FF0 (> 100), M: 23.9 vs Colorectal Age, alcohol, BMI, Hospital-based 1993, USA F 131/244 interviewed by < 11.1 serv- adenomas: energy
telephone, ings/wk (5) M 1.20 previously F: 24.8 vs (0.49-2.93) P = 0.72
validated .z 11.2 serv- F 0.74 ingstwk (5) (0.35-1.57) p = 0.69
157
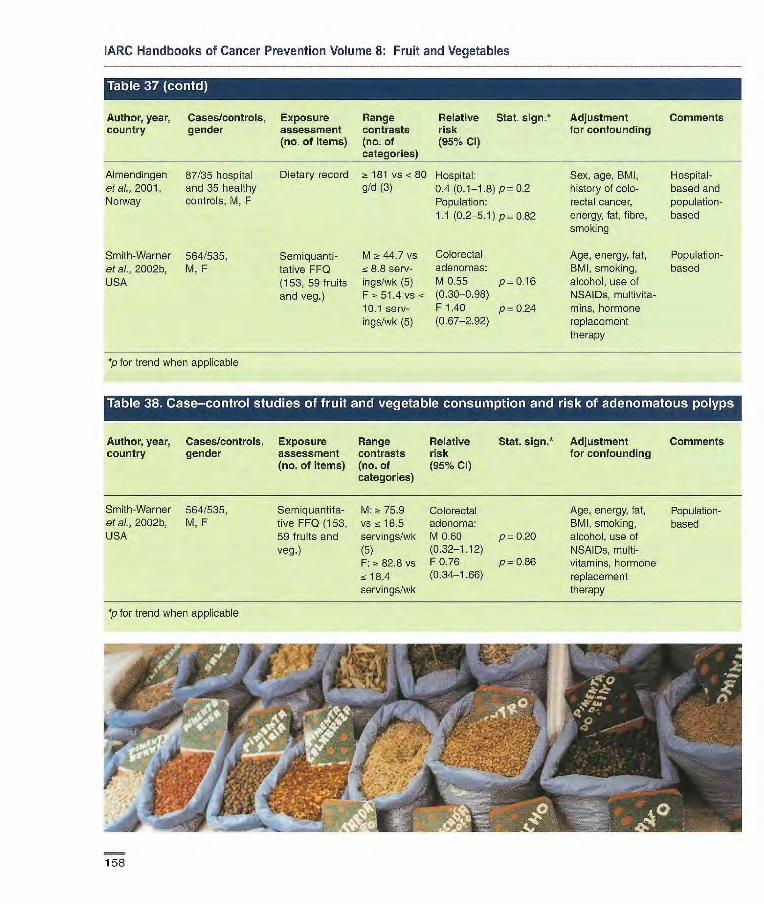
IARC Handbooks of Cancer Prevention Volume 8: Fruit and Vegetables
Author, year, Cases/controls, Exposure Range Relative Stat. sign.* Adjustment Comments country gender assessment contrasts risk for confounding
(no. of items) (no. of (95% CI)
Almendingen 87/35 hospital Dietary record 181 vs < 60 Hospital: Sex, age, BMI, Hospital- et al., 2001, and 35 healthy g!d (3) 0.4 (0.1-1.8) p 0.2 history of colo- based and Norway controls, M, F Population: rectal cancer, population-
1. 1 (0.2-.5.1) p 0.82 energy, fat, fibre, based smok ing
Smith-Warner 564/535, Semiquanti- M ~- 44.7 vs Colorectal Age, energy, fat, Population- et al., 2002b, M, F tative FF0 8.8 serv- adenomas: BMI, smoking, based USA (153, 59 fruits ings/wk (5) M 0.55 p 0.16 alcohol, use of
and veg.) F 51.4 vs (0.30-0.98) NSAIDs, nultivita- 10.1 serv- F 1.40 pû.24 mina, hormone ings!wk (5) (0.67-2.92) replacement
therapy
*p for trend when applicable
Author, year, Cases/controls, Exposure Range Relative Stat. sign.* Adjustment Comments country gender assessment contrasts risk for confounding
(no. of items) (no. of (95% Cl) categories)
Smith-Warner 564/535, Semiquantita- M: z~ 75.9 Colorectal Age, energy, fat, Population- et al., 2002b, M, F tive FF0 (153, vs 16.5 adenoma: BMI, smoking, based USA 59 fruits and servings/wk M 0.60 p = 0.20 alcohol, use of
veg.) (5) (0.32-1.12) NSAIDs, multi- F: , 82.6 vs F 0.76 p 0.86 vitamins, hormone ~ 18.4 (0.34-1.66) replacement servings/wk therapy
p for trend when applicable
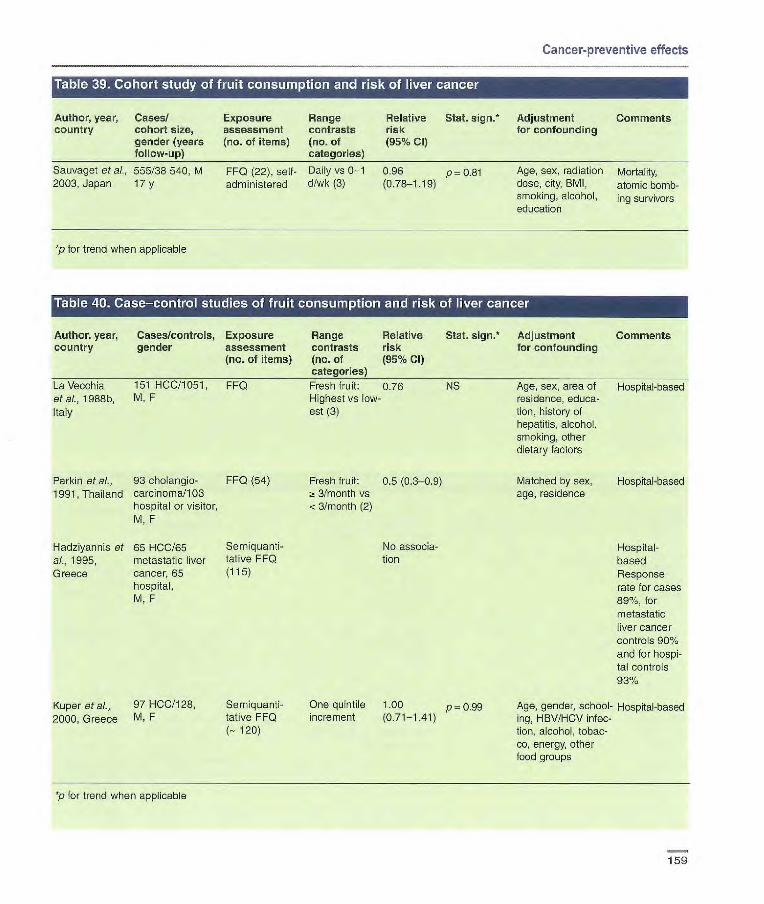
Cancer-preventive effects
Author, year, Cases/ country cohort size,
gender (years follow-up)
Sauvaget at al., 555/38 540, M 2003, Japan 17 y
Exposure Range Relative Stat. sign. Adjustment Comments assessment contrasts risk for confounding (no. 01 items) (no. of (95% Cl)
categories)
FF0 (22), self- Daily vs 0-1 0.96 p = 0.81 Age, sex, radiation Mortality, administered d/wk (3) (0.78-1.19) dose, city, 8M1, atomic bomb-
smoking, alcohol, ling survivors education
*p for trend when applicable
Author, year, Cases/controls, Exposure Range Relative Stat. 5jgfl•* Adjustment Comments country gender assessment contrasts risk for confounding
(no. of items) (no. of (95% Cl) categories)
La Vecchia 151 HOC/1051, FF0 Fresh fruit: 0.76 NS Age, sex, area of Hospital-based et ai., 1988b, M, F Highest vs low- residence, educa- Italy est (3) tien, history of
hepatitis, alcohol, smoking, other dietary factors
Parkin et al., 93 oholangio- FF0 (54) Fresh fruit: 0.5 (0.3-0.9) 1991, Thailand carcinoma/103 ~I 3/month vs
hospital or visitor, < 3/month (2) M, F
l-Iadziyannis et 65 HCC/65 Semiquanti- No associa- ai., 1995, metastatic liver tative FF0 tien Greece cancer, 65 (115)
hospital, M. F
Kuper et al., 97 HCCI128, Semiquanti- One quintile 1.00 p0.99 2000, Greece M, F tative FF0 increment (0.71-1.41)
(-. 120)
Matched by sex, Hospital-based age, residence
Hospital-based Response rate for cases 89%, for metastatic liver cancer controls 90% and for hospi-tal controls 93%
Age, gender, school- Hospital-based ing, HBV/HCV infec- tion, alcohol, tobac- co, energy, other food groups
p for trend when applicable

IARC Handbooks of Cancer Prevention Volume 8: Fruit and Vegetables
Author, year, Cases/cohort Exposure Range Relative country size, gender, assessment contrasts risk
(years follow-up) (no. of items) (no. of (95% Cl) categories)
Hirayama, 1990, 1251/265 118, FF0 (7) Green-yellow 0.91 (90% Japan M,F veg.: daily vs Cl
17y non-daily 0.82-1.01) (2)
Stat. sign.* Adjustment Comments for confounding
Not reported Mortality Census-based cohort in seven prefec-tures
Vu et ai., 1995, 50/8436, M FF0 6 veg-con- [0.4 p = 0.006 Age, HBsAg carrier Incidence
Taiwan 54 y taming (0.2-08)] status, cigarette Cohort recruit- meals/wk vs smoking, habitual ed primarily <6 alcohol consump- for a study of
tion, history of biologLcal liver disease markers of
HCC
Sauvaget et aL. 555/38 540, M FF0 (22), self- Green-yellow 0.75 p 0.009 Age, sex, radiation Mortality, 2003, Japan 17 y administered veg.: (0.60-0.95) dose, city, BMI, atomic bomb-
Daily vs 0-1 smoking, alcohol, ing survivors d/wk (3) education
*p for trend when applicable
Table 42. Case—control studies of vegetable consumption and risk of liver cancer
Author, year, Cases/controls, Exposure Range Relative Stat. sign.* Adjustment Comments country gender assessment contrasts risk for confounding
(no. of items) (no. of (95% Cl) categories)
Lam et aI., 106/107, FF0 Yellow veg.: 0.6 Hospital-based 1982, Hong M, F weekly vs less Response rate Kong Green veg.: 1.0 for cases 72%
daily vs less
La Vecchia et 151/1051, FF0 al., 1988b, Italy M, F
Srivatanakul 65/65 matched FF0 (54)
et al., 1991, hospital or visitor, Thailand M, F
Green veg.: 0.58 p <0.05 Age, sex, area of Hospital-based Highest vs low- residence, educa- est (3) tion, history of
hepatitis, alcohol, smoking, other dietary factors
'Other' fresh 0.2 p< 0.05 HB5Ag status, Hospital-based. veg.: twice a (0.04-1.0) alcohol, betel-nut 'Other' fresh day vs less (2) chewing, shrimp veg. consump-
paste and powdered tion excludes peanut consumption cucumber and
cabbage (Parkin etal., 1991)
160

Author, year, Cases/controls, Exposure Range country gender assessment contrasts
(no. of items) (no. of categorie
Fukuda et al., 368/485, FF0 (12) 1993, Japan M, F
Hadziyannis 65/65 controls Semiquanli- et at., 1995, with metastatic tative FF0 (115) Greece liver cancer, 65
hospital controls, M, F
Kuper et al., 97/128, Semiquanhi-
2000, Greece M, F tative FF0
(- 120)
Hospital-based Response rates high, only 7 cases not interviewed, and 3 controls excluded with incomplete information
Hospital-based Response rate for cases 89%, for metastatic liver cancer controls 90% and for hospital controls 93%
Age, gender, Hospital-based schooling, HBV/HCV infec- tion, alcohol, tobacco, energy, other food groups
Relative risk (95% Cl)
Stat. sign.* Adjustment Comments for confounding
No difference in consump-tion between cases and controls
No associa-tion
One quintile 1.21 p 0.36 increment (0.80-1.82)
Cancer-preventive effects
p for trend when applicable
Author, year, Cases/controls, Exposure Range country gender assessment contrasts
(no. of items) (no. of categories]
Braga et ai., 320/1408, FF0 Fresh fruit, 1997e, Italy M, F green veg.
and carrots combined: Highest vs lowest (3)
*p for trend when applicable
Relative Stat. sign. Adjustment Comments risk for confounding (95%)
[0.46 (0.32- Age, sex, Hospital-based. 0.67)] area This is an exten-
of residence, sion of La smoking Vecchia et al. history, dia- (1988b). betas, liver Attributable risk cirrhosis estimated to be
40% (26-54%), 44°k for males (28-60%) and 32% for females (4-60%)
161

IARC Handbooks of Cancer Prevention Volume 8: Fruit and Vegetables
Table
Author, year, Cases/cohort Exposure Range Relative Stat. sign.* Adjustment Comments country size, gender assessment contrasts risk for confounding
(years follow-up) (no. of items) (no. of (95% Cl) categories)
Sauvaget et a/., 157/38540, FF0 (22), Daily vs 0.85 p = 0.53 Age, sex, radiation Mortality,
2003, Japan M self-adminis- 0-1 d/wk (0.57-1.25) dose, city, BMI, atomc bomb- 17 y te red (3) smoking, alcohol, ing survivors
education
*p for trend when applicable
Table 45. Cohort study of vegetable consumption and risk of gallbladder cancer
Author, year, Cases/cohort Exposure Range Relative Stat. sign. Adjustment Comments country size, gender assessment contrasts risk for confounding
(years follow-up) (no. of items) (no. of (95% Cl) categories)
Hlrayama, 1990, 530/265 118, FF0 (7) Green-yellow 1.06 (90% Cl Not reported Mortality Japan M, F veg.: Daily vs 0.90-1.24) Census-based
17 y non-daily cohort in (2) seven prefec-
tures
Sauvaget et al., 157/38 540, FF0 (22), self- Green-yellow 1.09 (0.73— p = 0.73 Age, sex, radiation Mortality, 2003, Japan M administered veg.: 1.74) dose, city, BMI, atomic
17y Daily vs 0-1 smoking, alcohol, bombing sur- d/wk (3) education vivors
*p for trend when applicable
Itable 46. Case—control study z;i fruit vegetable Iconsumption W11T. Irisk of gallbladderu
Author, year, Cases/controls, Exposure Range Relative Stat. sign.* Adjustment Comments country gender assessment contrasts risk for confounding
(no. of items) (no-of (95% Cl) categories)
Kato et al., 109/218, FF0 (- 46) Daily vs less 0.26 Marital status, Population- 1989, Japan M, F than daily (2) (0.13-0.50) other food items based
Response rates 64% for cases, virtually 100% for controls
*p for trend when applicable
162
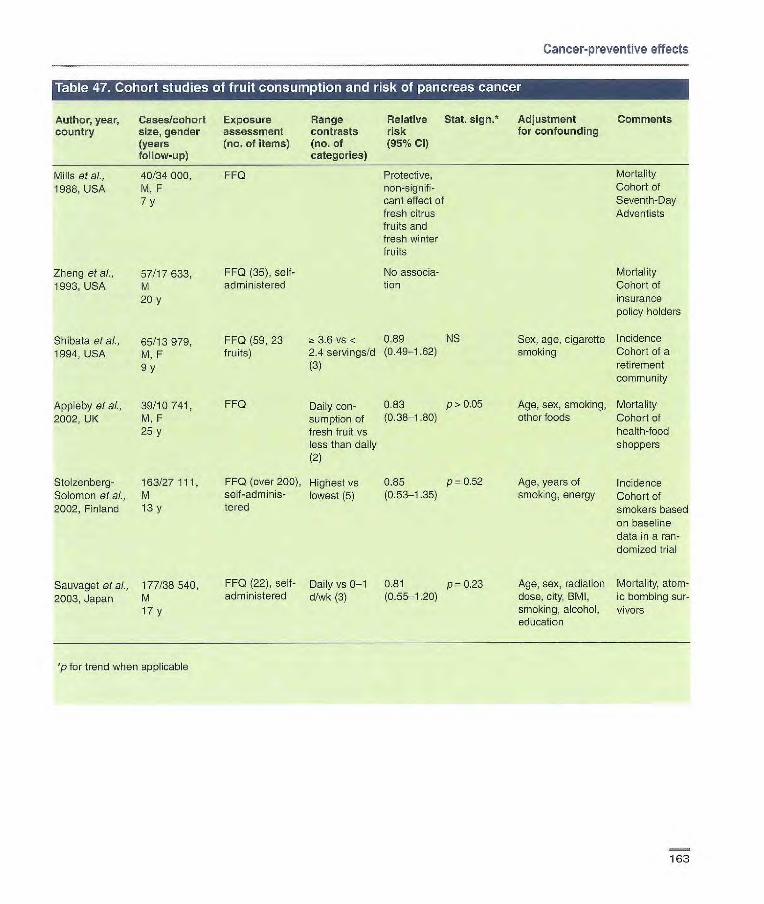
Mills at al., 40/34000, FF0
Protective, 1988, USA M, F
non-signifi- 7y cant effect of
fresh citrus fruits and fresh winter fruits
Zbeng et ai., 57/17633, FF0 (35), self- No associa-
1993, USA M
administered
tion 20 y
Shibata et ai., 65/13979, 1994, USA M, F
9y
Appleby at al., 39/10 741, 2002, UK M, F
25 y
Stolzenberg- 163/27111 Solomon at aL, M 2002, Finland 13 y
FF0 (59, 23 3.6 vs < 0.89 NS
fruits) 2.4 servings/d (0.49-1.62) (3)
FF0 Daily con- 0.83 p> 0.05
sumption of (0.38-1-80) fresh fruit vs less than daily (2)
FF0 (over 200), Highest vs 0.85 p = 0.52 self-adminis- lowest (5) (0.53-1.35) lered
Cancer-preventive effects
Author, year, Cases/cohort Exposure Range Relative Stat. 5jgfl* Adjustment Comments country size, gender assessment contrasts risk for confounding
(years (no, of items) (no. of (95% Cl) follow-up) categories)
Mortality Cohort of Seventh-Day Adventists
Mortality Cohort of insurance policy holders
Sex, age, cigarette Incidence smoking Cohort of a
retirement community
Age, sex, smoking, Mortality other foods Cohort of
health-food shoppers
Age, years of Incidence smoking, energy Cohort of
smokers based on baseline data in a ran- domized trial
Age, sex, radiation Mortality, atom- dose, city, BMI, ic bombing sur- smoking, alcohol, vivors education
Sauvaget et al., 177/38 540, FF0 (22), self- Daily vs 0-1 0.81 p= 0.23
2003, Japan M administered d/wk (3) (0.55-1.20)
17 y
*p for trend when applicable
163
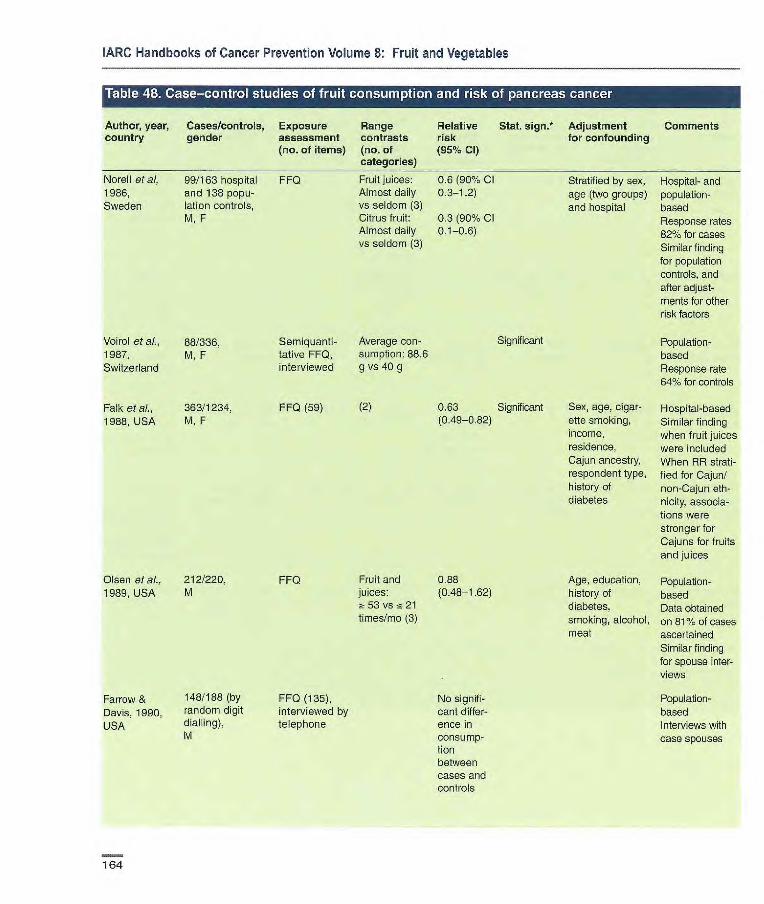
Significant
0.63 Significant (0.49-0.82)
Voirol et ai., 88/336, 1987, M, F Switzerland
Falk et ai., 363/1234, 1988, USA M,F
Semiquanti- Average con- tative FF0, sumption: 88.6 interviewed g vs 40 9
FF0 (59) (2)
Olsen etaL, 212/220, 1989, USA M
FF0 Fruit and 0.88 juices: (0.48-1.62) ;-_ 53 vs !~ 21 times/mo (3)
Fruit juices: 0.6 (90% Cl Almost daily 0.3-12) vs seldom (3) Citrus fruit: 0.3 (90% Cl Almost daily vs seldom (3)
Norell et ai, 99/163 hospital FFQ 1986, and 138 popu-
Sweden lation controls, M, F
FF0 (135), No signifi- interviewed by Cant differ- telephone ence in
consump- tion between cases and controls
Farrow & 148/188 (by Davis, 1990, random digit
USA dialling), M
IARC Handbooks of Cancer Prevention Volume 8: Fruit and Vegetables
Author, year, Cases/controls, Exposure Range Relative Stat. sign.* Adjustment Comments country gender assessment contrasts risk for confounding
(no. of items) (no. of (95% Cl) categories)
Stratified by sex, Hospital- and age (two groups) population- and hospital based
Response rates 820% for cases Similar finding for population controls, and after adjust- ments for other risk factors
Population- based Response rate 841% for controls
Sex, age, cigar- Hospital-based atte smoking, Similar finding income, when fruit juices residence, were included Cajun ancestry, When RR strati- respondent type, lied for Cajun/ history of non-Cajun eth- diabetes nicity, associa-
tiens were stronger for Cajuns for fruits and juices
Age, education, Population- history of based diabetes, Data obtained smoking, alcohol, on 81% of oases meat ascertained
SimiJar finding for spouse inter- views
Population- based Interviews with case spouses
164

Cancer-preventive effects
Author, year, country
Cases/controls, gender
Exposure assessment (no. of items)
Range contrasts (no. of
Relative risk (95% Cl)
Stat. sign.* Adjustment for confounding
Comments
Howe et aI, 249/505, Quantitative Highest vs 0.92 Fibre, energy, Population-
1990, Canada M, F FF0 (Over 200) lowest (4) (0.74-1.14) lifetime cigarette based consumption 547 cases
ascertained 1636 potential controls approached 78% cases and 38% controls interviewed by proxy
La Vecchia 247/1089, FF0 (14) Fresh fruit: 0.68 p <0.05 Age, sex Hospital-based
etaL, 1990a, M, F Highest vs (0.41-0.98)
Italy lowest (3)
Baghurat et 104/253, FF0 (179) No differ- Population-
ai., 1991, community con- ence in con- based
Australia trois, sumption Response rate M, F between 62% for male
cases and and 63% for controls female cases,
and 57% arid 51% for controls, respectively
Bueno de 164/480, Semi-quantita- Highest vs 1.09 Age, gender, Population- Mesquita et al., M, F tive FF0 (116) lowest (5) response status based 1991, (direct/proxy), Overall response Netherlands smoking, energy rate 72%. More
than half of the cases directly interviewed
Lyon et al., M 85/192 FF0 directed Highest vs M 0.81 p = 0.26 Age, cigarette Population- 1993, USA F 60/171 to period 20 y lowest (3) (0.40-1.62) smoking, coffee, based
before inter- F 0.37 p < 0.05 alcohol Response rate view (32) (0.18-0.81) for cases 88%;
for controls 77% All data derived from interviews of next of kin
Ji et al., 1995, 451/1552, FF0 (86), Highest vs M 0.66 p = 0.02 Age, income, Population- China M, F interviewed lowest (4) (0.43-1.01) smoking, green based
F 0.58 p = 0.08 tea drinks Deceased cases (0.34-1.00) (females only) excluded (19%)
and response Relatives assist- status ed with inter-
views
165
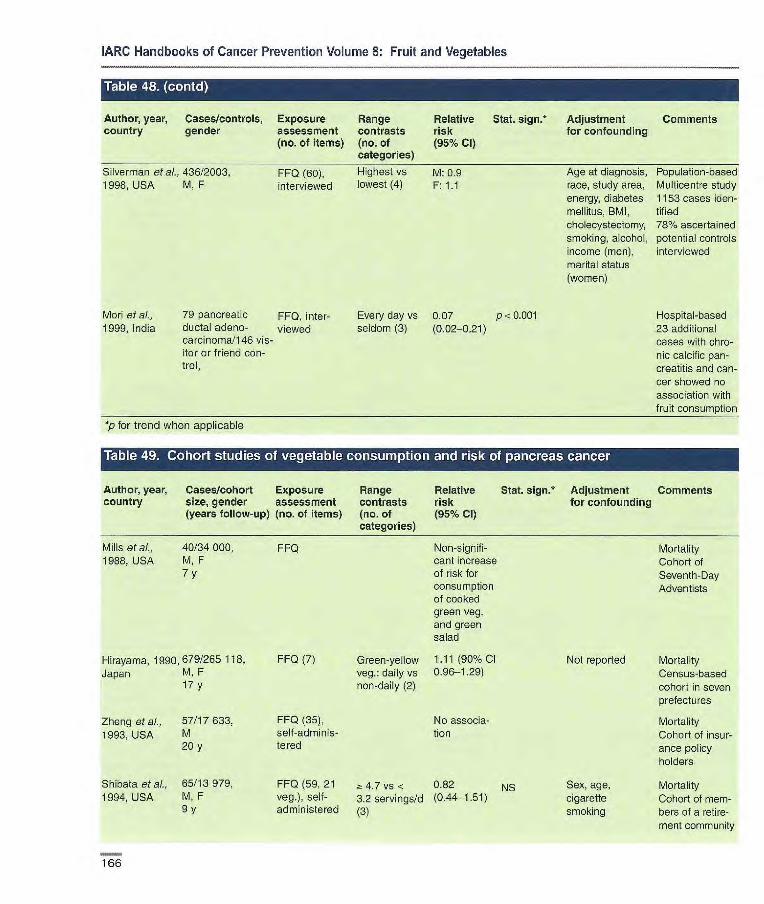
IARC Handbooks of Cancer Prevention Volume 8: Fruit and Vegetables
Author, year, Cases/controls, Exposure Range Relative Stat. 5jgfl* Adjustment Comments country gender assessment contrasts risk for confounding
(no. of items) (no. of (95% Cl) categories)
Silverman at aL. 436/2003, FF0 (60), Highest vs M: 0.9 1998, USA M, F interviewed lowest (4) F: 1.1
Mori at al., 79 pancreatic FF0, inter- Every day vs 0.07 p < 0.001 1999, India ductal adeno- viewed seldom (3) (0.02-021)
carcinoma/146 vis-itor or friend con-trol,
*p for trend when applicable
Age at diagnosis, Population-based race, study area, Multicentre study energy, diabetes 1153 cases den- mellitus, BMI, tif ied cholecystectomy, 18% ascertained smoking, aicohol, potential controls income (men), interviewed marital status (women)
Hospital-based 23 additional cases with chro-nic calcific pan-creatitis and can-cer showed no association with fruit consumption
Author, year, Cases/cohort Exposure Range Relative Stat. sign.* Adjustment Comments country size, gender assessment contrasts risk for confounding
(years follow-up) (no. of items) (no. of (95% Cl) categories)
Mills et al., 40/34000, 1988, USA M,F
7y
FF0 Non-signifi- Mortality cant increase Cohort of of risk for Seventh-Day consumption Adventists of cooked green veg. and green salad
FF0 (7) Green-yellow 1 .11(90% Cl Not reported Mortality veg.: daily vs 0.96-1.29) Census-based non-daily (2) cohort in seven
prefectures
FF0 (35), No associa- Mortality self-adminis- tien Cohort of insur- tered ance policy
holders
FFQ (59, 21 4.7 vs < 0.82 NS Sex, age, Mortality veg.), self- 3.2 servirrgs/d (0.44-1.51) cigarette Cohort of mem- administered (3) smoking bers of a retire-
ment community
Hirayama, 1990, 679/265 118, Japan M, F
17 y
Zheng etal., 57/17633, 1993, USA M
20 y
Shibata etal., 65/13 979, 1994, USA M, F
9y
Imm

Vcirol et al», 88/336,
1987, M,F
Switzerland
Falk et ai., 36311234,
1988. USA M, F
Semiquanti- Average 0.47 Significant tative FF0, consumption: interviewed 230 g v$ 156.6
g
FF0 (59) (2) 0.85 NS (0.68-1.14)
Cancer-preventive effects
Author, year, Cases/cohort Exposure Range Relative Stat. sign.* Adjustment Comments country size, gender assessment contrasts risk for confounding
(years follow-up) (no. of items) (no. of (95% Cl) categories)
Stolzenberg- 163/27111, FFQ (over Highest vs 9.77 p = 0.32
Solomon et ai., M 200), self- lowest (5) (0.47-1.27) 2002, Finland 13 y administered
Sauvaget et 177/38540 FF0 (22), self- Green-yellow 0.82 p = 0.36
at., 2003, M administered veg.:daily vs (0.54-1.24)
Japan 17 y 01 bASk (3)
p for trend when applicable
Author, year, Cases/controls, Exposure Range Relative Stat. sign.* Adjustment Comments country gender assessment contrasts risk for confounding
(no. of items) (rio. of (95% Cl) categories)
Age, years of Incidence smoking, energy Cohort based
on baseline data in a ran- domized trial. Potatoes and legumes excluded
Age, sex, radia- Mortality, atom- tion dose, city, ic bombing BMI, smoking, survivors alcohol, education
Stratified by Hospital- and sex, age (two population- groups) and based hospital Response rates
82% for cases. Similar finding for population controls, for raw veg. and after adjustment for other risk fac- tors.
Population- based Response rate for controls 64%
Sex, age, smok- Hospital-based ing, income, residence, Cajun ancestry, respon-dent type, history of diabetes
Norell et ai., 99/163 hospital FF0
Almost daily 0.5 (90%
1986, Sweden and 138 popu- vs seldom (3) 0.3.-11) lation controls, M, F
167
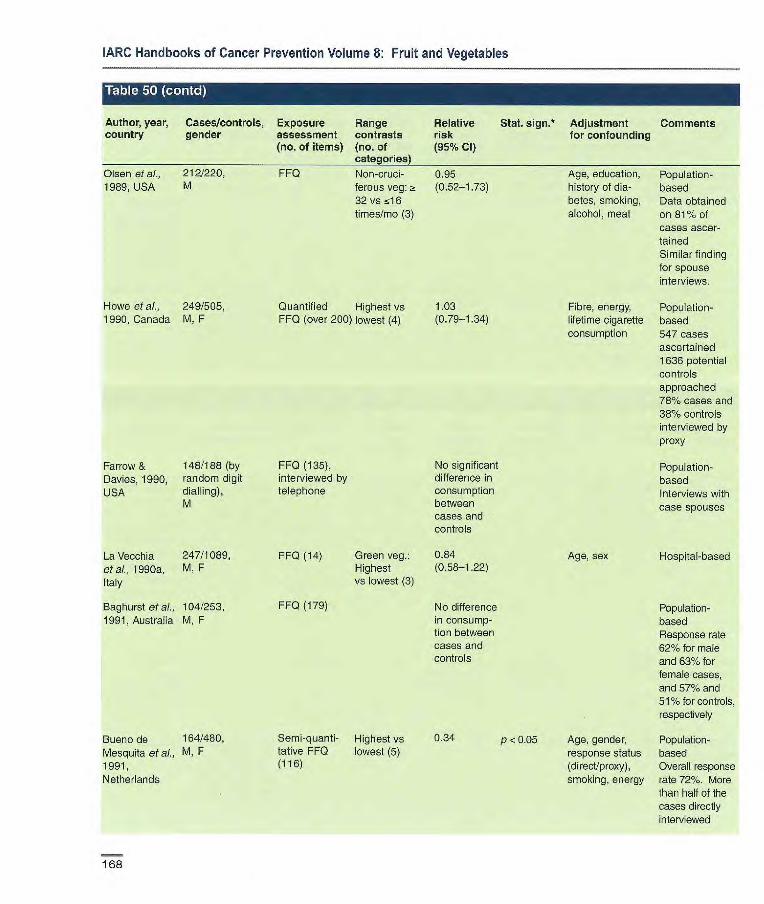
IARC Handbooks of Cancer Prevention Volume 8: Fruit and Vegetables
Author, year, Cases/controls, Exposure Range Relative Stat. sign.* Adjustment Comments country gender assessment contrasts risk for confounding
(no. of items) (no. of (95% CI) categories)
Olsen et ai., 212/220, FF0 Non-crud- 095 Age, education, Population- 1969, USA M ferous veg: a (0.52-1.73) history of dia- based
32 vs 516 betes, smoking, Data obtained times/mo (3) alcohol, meat on 811% of
cases ascer- tained Similar finding for spouse interviews.
Howe et al., 249/505, Quantified Highest vs 1.03 Fibre, energy, Population- 1990, Canada M, F FF0 (over 200) lowest (4) (0.79-1.34) lifetime cigarette based
consumption 547 cases ascertained 1636 potential controls approached 78% cases and 38% controls interviewed by proxy
Farrow & 148/188 (by FF0 (135), No significant Population- Davies, 1990, random digit interviewed by difference in based USA dialling), telephone consumption Interviews with
M between case spouses cases and controls
La Vecchia 247/1089, FF0 (14) Green veg.: 0.84 Age, sex Hospital-based eta)., 1990a, M, F Highest (0.58-1.22) Italy VS lowest (3)
Baghursi eta)., 104/253, FF0 (179) No difference Population- 1991, Australia M, F in consurnp- based
tion between Response rate cases and 62% for male controls and 63% for
female cases, and 57% and 51% for controls, respectively
Bueno de 164/480, Semi-quanti- Highest vs 0.34 p . 0.05 Age, gender, Population- Mesquita et ai., M, F tative FFQ lowest (5) response status based 1991, (116) (direct/proxy), Overall response Netherlands smoking, energy rate 72%. More
than half of the cases directly interviewed
168

Cancer-preventive effects
Author, year, Cases/controls, Exposure flange Relative Stat. sign. Adjustment Comments country gender assessment contrasts risk for confounding
(no. of items) (no. of (95% Cl) categories)
Lyon etal., M 87/191, FF0 directed Highest vs M 0.99 p= 0.80 Age, cigarette Population- 1993, USA F 60/169 to period 20 y lowest (3) (0.50-2.01) smoking, alcohol, based
before interview F 0.32 p 0.01 coffee consurnp- Response rate (32) (0.13-0.74) tien 88% for cases
and 77% for controis. All data derived from interviews of next of kin
Ji etal., 1995, 451/1552, FF0 (86), Highest vs M 0.63 p = 0.03 Age, income, Population-
China M, F interviewed lowest (4) (0.45-1.03) smoking, green based F 0.67 p = 0.15 tea drinks Deceased (0.39-1.14) (females only), cases excluded
response status (19%) Relatives assisted with interviews.
Silverman 436/2003, FF0 (60), Highest vs M 0.6 p = 0.035 Age at diagnosis, Population- etal., 1998, M, F interviewed lowest (4) F 0.9 race, study area, based. Multi- USA energy, choIe- centre study.
cysteotomy, 1153 oases diabetes mellitus, identified BM I, cigarette 78% ascer- smoking, alcohol, tamed potential income (men), controls marital status interviewed (women)
Mod et at, 79 pancreatic FF0, inter- 1999, India ductal adeno- viewed
carcinoma/1 46 visitor or friend control, M, F
Every day vs 0.42 p < 0.01 seldom or (0.24-0.74) sometimes (3)
Hospital-based 23 additional cases with chronic calcific pancreatitis and cancer showed similar, non-significant asso-ciation with veg. consump-tion
p for trend when applicable
169

IARC Handbooks of Cancer Prevention Volume 8: Fruit and Vegetables
Author, year, Cases/controls, Exposure Range Relative Stat. sign.' Adjustment Comments country gender assessment contrasts risk for confounding
(no. of items) (no. of (95% Cl) categories)
Gold et ai., 201/201 hospital FFQ, inter- Raw fruits H: 0.55 p!5 0.02 Matched by age, Hospital- and popula- 1985, USA (H) and 201 popu- viewed and veg.: (0.37-0.90) race, tion-based
alien (P) controls, 5 vs <5 P: 0.55 sex Response rates for M, F times/wk (2) (0.34-0.91) cases 70%, for hospi-
tal controls 54% and for population con- trols 50% (random digit dialling)
Mack et aI., 326/363 neigh- FFQ in broad Fresh fruit 0.7 Matched by age, Population-based 1986, USA bourhood con- groups, inter- and veg.: (0.5-0.9) sex, race, Response rate 661/.
trois, viewed -5 vs <5 neighbourhood for cases M, F times/wk (2) Direct interviews of
124 pairs, proxy interviews of the remainder
*p for trend when applicable
170

bol
Age, tobacco Hospital-based habits and population-
based
P < 0.01 Age, residence, Hospital-based education, No interaction smoking, intake with tobacco or of fish, green veg., with alcohol alcohol
M: p 0.21 Age, education, Population-based smoking pack- No control for years alcohol
Age, number of Hospital-based cigarettes, mental No control for factors, using alcohol firewood in winter, Unclear presenta- smoke in environ- lion ment
Age, study centre, Population-based smoking, alcohol, Similar finding for energy epilarynx and
hypopharynx
Age, smoking, Hospital-based alcohol Includes incident
and prevalent cases
Age, sex, Hospital-based
residence, Part of larger
urban/rural, edu- case—control cation, BMI, study on aero- smoking pack- digestive years, alcohol, cancers energy
Cancer-preventive effects
Table U_. d7asne--control studies of fruit consumption and risk of larynx cancer
Author, year, Cases/controls, Exposure Range Relative Stat. 5jgfl•* Adjustment Comments country gender assessment contrasts risk for confounding
(no. of items) (no. of (95% Cl categories)
De Stefani et 107/290, FF0, inter- Daily vs never [0.37 p z 0.05 Age Hospital-based
al., 1987, M viewed, fre- (4) (0.19-0.77)] No control for Uruguay quency smoking and alco-
Notani & 80/215 hospital FF0, inter- ~ once/wk vs Hospital con Jayant, 1987, controls, 177 viewed, fre- < once/wk troIs: [0.65 India population quency (2) (0.33-1.25)]
control, Population M controls:
[0.50 (0.24- 1.0)]
La Vecchia et 110/833, FF0 (17), Fresh fruits: 0.3 al., 1990b, Italy M interviewed, Highest vs
frequency lowest (3)
Zheng et al., 201/414, FF0 (41, 5 Highest vs M: 0.7 1992b, China M, F fruits), inter- lowest F: 0.5
viewed. fre- (3) (0.2-1.5) quency, portion size
Guo et al., 100/100, FF0, inter- Insufficient 0.44
1995, China M, F viewed vs sufficient
Estève et ci., 727 endolarynx/ Diet history, > 250 vs fc [0.72 p < 0.05 1998, France, 2736, interviewed, 70 g/d (5) (0.53-0.96)]
Switzerland, M frequency,
Spain, Italy portion size
Maier & Tisch, 164/656, FF0, inter- Fresh fruit: 0,7(0.4-1.1) p=0.08
1997, Germany M viewed, fre- > once/wk vs quency less (2)
De Stefani et 34/393, FF0 (64, 8 Highest vs 0.8
al., 1999, M, F fruits), inter- lowest (3)
Uruguay viewed, fre- quency, portion size
P 0.03
171
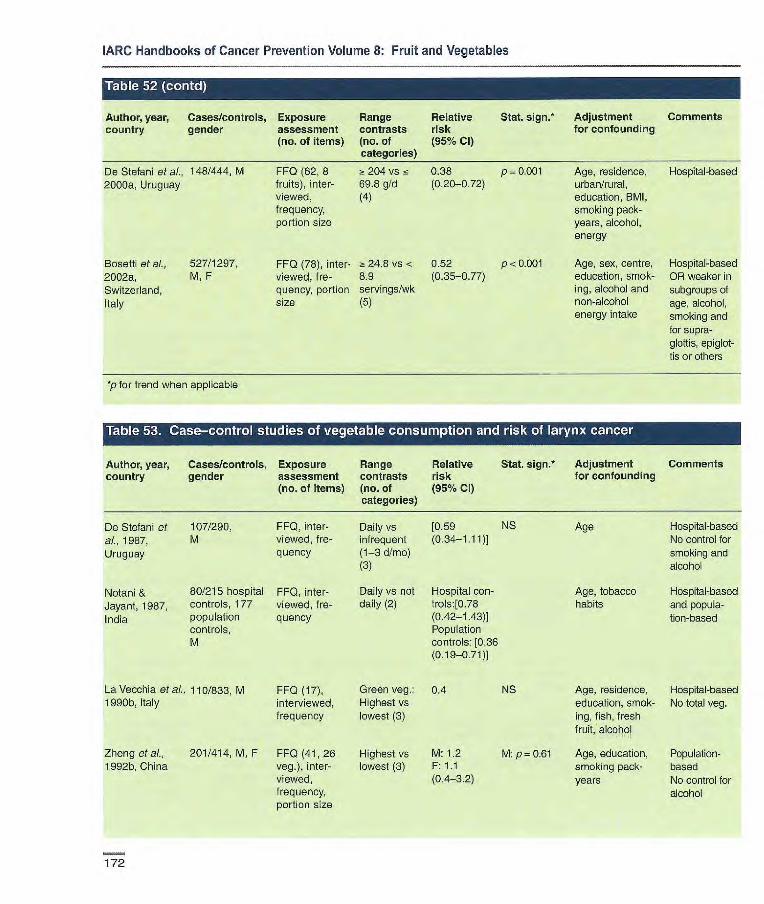
IARC Handbooks of Cancer Prevention Volume 8: Fruit and Vegetables
Author, year, Cases/controls, Exposure Range Relative Stat. sign. Adjustment Comments country gender assessment contrasts risk for confounding
(no. of items) (no. of (95% CI) categories)
De Stefani et al., 148/444, M FF0 (62, 8 ~! 204 vs is 0.38 p 0.001 Age, residence, Hospital-based 2000a, Uruguay fruits), inter- 69.6 g/d (0.20-0.72) urban/rural,
viewed, (4) education, BMI, frequency, smoking pack- portion size years, alcohol,
energy
BoseltE et al., 527/1297, FF0 (78), inter- 24.8 vs < 0.52 p <0.001 Age, sex, centre, Hospital-based 2002a, M, F viewed, f re- 8.9 (0.35-0.77) education, smok- OR weaker in Switzerland, quency, portion servings/wk ing, alcohol and subgroups of Italy size (5) non-alcohol age, alcohol,
energy intake smoking and for supra- glottis, epiglot- tis or others
*p for trend when applicable
Author, year, Cases/controls, Exposure Range Relative Stat. sign.* Adjustment Comments country gender assessment contrasts risk for confounding
(no. of items) (no. of (95% Cl) categories)
De Stefani et 107/290, FF0, inter- al., 1987, M viewed, fre-
Uruguay quency
Notani & 80/215 hospital FF0, inter- Jayant, 1987, controls, 177 viewed, f re-
India population quency controls, M
Daily vs [0.59 NS Age Hospital-based infrequent (0.34-1.11)] No control for (1-3 d/mo) smoking and (3) alcohol
Daily vs not Hospital con- Age, tobacco Hospital-based daily (2) trols:[0.78 habits and popula-
(0.42-1.43)] tion-based Population controls: [0.36 (0.19-0.71)]
La Vecchia etal., 110/833, M FF0 (17), Green veg.: 0.4 1990b, Italy interviewed, Highest vs
frequency lowest (3)
Zheng et al., 201/414, M, F FF0 (41, 26 Highest vs M: 1.2 1992b, China veg.), inter- lowest (3) F: 1.1
viewed, (0.4-3.2) frequency, portion size
NS Age, residence, Hospital-based education, smok- No total veg. ing, fish, fresh fruit, alcohol
M: p = 0.61 Age, education, Population- smoking pack- based years No control for
alcohol
172

Cancer-preventive effects
Author, year, country
Cases/controls, gender
Exposure assessment (no. of items)
Range contrasts (no. of categories)
Relative risk (95% Cl)
Stat. sign. Adjustment for confounding
Comments
Guo et aI., 100/100, FF0, inter- Sufficient vs 0.37 p 0.03 Age Hospital-based 1995, China M, F viewed insufficient No control for
alcohol
Estève et AI., 727 endolarynxl Diet history, > 350 vs T5 [0.61 p < 0.05 Age, study centre, Population- 1996, France, 2736, interviewed, 170 gld (5) (0.45-0.81)] smoking, alcohol, based Italy, Spain, M frequency, energy Similar finding Switzerland portion size for epilarynx
and hypophar- ynx
De Stefani et 34/393,. FF0 (64, 14 Highest vs 0.9 (0.6-1.6) Age, sex, rosi- Hospital-based cl., 1999, M, F veg.), inter- lowest (3) derice, urban! Part of larger Uruguay viewed, rural, education, case-control
frequency, BMI, smoking study on aerodi- portion Size pack-years, gestive cancers
alcohol, energy
De Stefani et al., 148/444, FF0 (62, 11 120.4 vs 0.57(0.30- p= 0.18 Age, residence, Hospital-based 2000a, Uruguay M veg.), inter- 54.1 g!d (4) 1.08) urban/rural, educe-
viewed, tion, BMI, smoking frequency, pack-years, alco- portion size hol, energy
Bosetti et ai., 527/1297, FF0 (78), 18.1 VS 0.17 p < 0.001 Age, sex, centre, Hospital-based 2002a, M, F interviewed, <8.6 (0.11-0.27) education, smok- OR similar for Switzerland, frequency, servings/wk ing, alcohol and subgroups of Italy portion size (5) non-alcohol energy age, alcohol,
intake smoking and for supraglottis, epiglottis or others
Author, year, country
Cases/controls, gender
Exposure assessment (no. of items)
Range contrasts (no. of categories)
Relative risk (95% Cl
Stat. sign.* Adjustment for confounding
Comments
Zatonski et ai., 249/965, FF0 (30), inter- Highest vs 0.34 Age, residence, Population- 1991, Poland M viewed, f re- lowest (3) (0.18-0.64) education, based
quency smoking, alcohol
De Stefani et 148/444, 1 (62, 8 320.7 vs 0.30 p < 0.001 Age, residence, Hospital-based al., 2000a, M fruits and 11 143.0 g/d (0.15-0.59) urban/rural,
Uruguay veg.), inter- (4) education, BMI,
viewed, fro- smoking pack-
quency, portion years, alcohol,
size energy
*p for trend when applicable
173

IARC Handbooks of Cancer Prevention Volume 8: Fruit and Vegetables
Author, year, Cases/cohort Exposure Range Relative Stat. sign.* Adjustment Comments country size, gender assessment contrasts risk for confounding
(years follow-up) (no. of items) (no. of (95 % Cl) categories)
Kvale et a/., 168/13785, FF0 (31, 9 50 vs <20 1.10 p= 0.90 Age, cigarette Incidence 1983, Norway M fruits), self- times/mo (4) smoking, region, RA 0.71 (NS)
11.5 y administered, urban/rural rosi- for squamous and frequency dence small-cell carci-
nomas
Wang & 671/13628, FF0 (16), self- Fruit/fruit [0.57] Age Mortality Hammond M administered, juice: 5-7 vs No control for smok- 1985, USA 10 y frequency 0-2 d/wk ing.
(3) RR = 0.52 in those taking vitamin pills; PR 0.65 in heavy smokers
Fraser et a)., 61/34198, FF0 (51, 5 2 times/d 0.26 p 0.006 Age, sex, Incidence 1991, USA M, F fruits), self- vs <3 (0.10-0.70) smoking history Seventh-Day
6 y administered, times/wk (3) Adventists PR =
frequency 0.28 in never-smok- ers, RR= 0.22 in ever-smokers. Similar finding for adenocarcinoma and tumeurs of other cell types
Chow et al., 219/17633, FF0 (35), self- > 90 vs < 31 0.7 (0.4-1.3) Age, smoking Mortality 1992, USA M administered, times/mo (4) status, occu- Lutheran Brother-
20 y frequency pation hood Significant associa- tion only for oranges
Shibata etal., 164 (94M, FF0 (59,23 M: 2: 3.5 vs 0.99 NS Age, smoking Incidence 1992, USA 70 F)/1 1 580 fruits), self- < 2.2 serv- (0.59-1.66) Retirement
9 y administered, ings/d (3) community frequency F: > 3.7 vs 0.65 NS
<2.4 serv- (0.37-1.24) ings/d (3)
Steinmetz at 138/2814, FF0 (127, 15 ~: 18 vs :5 7 0.75 p=0.08 Age, pack-years Incidence
aI., 1993, USA F fruits), self- servings/wk (0.44-1.23) of smoking, Nested case—con-
4 y administered, (4) energy trc[; total cohort =
frequency, 34977
portion size; Strongest effect in validated large-cell carcino-
ma and in ex- smokers, but small numbers
Key et aL. 59/10771, FF0 (5), self- Fresh fruit: SMR: Age, sex, Mortality 1996, UK M, F administered, Daily vs less 0.59 smoking Vegetarians and
17 y frequency than daily (2) (0.34-1.02) health-conscious people
174

and portion size
Breslow etal., 154/20 004, M, F FF0 (59, 5 2000, USA 8.5 y fruits), self-
administered, frequency, portion size; validated
Feskanichet F519/77823 FF0 (116, at, 2000, USA M 274/47 778 15 fruits), self-
F: 12 y administered, M: 10 y frequency,
portion size; validated
> 11.5 vs <3 0.9(0.5-1.6) p< 0.489 servings/wk (4)
F>3.lvs< 0.76 1.7 servings/d (0.56-1.02) (5) M>3.3vs 1.22
15 1.7 serv- (0.80-1.87) ings/d (5)
FF0 (150, 8 Highest 0.8 (0.6-1 .1) P,0.001 fruits), self- (median 325 administered, g/d) vs frequency , lowest portion size; (median 46 validated g/d) (5)
Voorrips et al., 1010/2953 2000b, (suboohort), Netherlands M, F
6.3 y
Cancer-preventive effects
Author, year, Cases/cohort Exposure Range Relative country size, gender assessment contrasts risk
(years follow-up) (no. of items) (no. of (95 % CI) categories)
Ocké etal., 54/561. Dietary history, > 33rd vs ~g 0.40 1997a, M spouse inter- 33rd percen- (0.18-0.87)
Netherlands 20 y view, frequency tile (2)
Jansen etal., 149/1578,
2001, Finland, M, smokers Italy, Nether- 25 y
lands
Stat. 5jgfl,* Adjustment Comments for confounding
Age, pack- Incidence years of cigarette AR for stable smoking, energy dietary habits.
Weaker RR for average habits
Age, sex, Mortality smoking duration, packs/day smoked
Age, follow- Incidence up cycle, In females, smoking status, effect strongest years since in never-amok- quitting, ers; effect similar cigarettes/day, in Kreyberg I age at start and Il smoking, In males, energy protective effect
only in never- smokers, and in Kreyberg I
Age, sex, Incidence family history Total cohort =
of lung cancer, 120 852 education, Protective effect current smoker only in smokers (yIn), years of (current and ex), smoking, cig./day and in all cell
types
Age, cig./day, Mortality. country, Protective effect energy, only in heavy veg. smokers (20+
cig/day) Effects less strong in Italy
Dietary history, Highest vs 0.69 p = 0.05 interviewed, lowest (3) (0.46-1.02) frequency and portion size
175

0.80 p = 0.035 (0.65-0.98)
FF0 (22), self- Highest vs administered, lowest (3) frequency; vali-dated
Mortality Atomic bombing survivors Strongest effect in never and cur-rent smokers No effect in women
Incidence Strongest effects in never- and current smokers
Highest vs 0.60 p 0.01 lowest (5) (0.46-0.78)
Intervention 0.79 p 0.13 arm: Highest (0.57-1.11) vs lowest (5) Placebo arm: 0.56 p 0.003 Highest vs (039-081) lowest (5)
Follow-up of participants in CARET trial in smokers and asbestos workers
Sauvaget et 563/38540, cl. 2003, M, F Japan 18
Miller et al. 860/478 021, FF0 (.-300), 2003, M, F self-adminis- 10 European 0-14 (mean 6 y) tered or inter- countries viewed, fre-
quency, portion size; calibration study
Neuhouser et Intervention arm: FF0, self- al., 2003, USA 414/7072, administered
M, F (45 items Placebo arm: relating to 326/7048, fruit and veg.) M, F 12 y
Age, sex, radia-tion dose, city, BMI, smoking status, alcohol, education
Age, sex, weight, héight, centre, smoking intensity and duration
Sex, age, smoking status, total pack-years of smoking, asbestos expo-sure, race/ ethnicity, enrol-ment centre
IARC Handbooks of Cancer Prevention Volume 8: Fruit and Vegetables
• t1 'J L'i.i i'i.'i ii ' u
Author, year, Cases/cohort Exposure Range Relative Stat. sign. Adjustment Comments country size, gender assessment contrasts risk for confounding
(years tallow-up) (no. of items) (no. of (95 % Cl) categories)
Holick et aL, 1844/27 084, FF0 (276), self- > 188 vs <45 0.87 p= 0.01 Age, years Incidence 2002, Finland M, smokers administered, g/d (5) (0,74-1.02) smoked, cig./ day, ATBC trial
14 y frequency, nterven-tion (a- portion size; tocopherol/p- validated carotene), previ-
ous supplement use ((3-carotene and vitamin A), energy, choles- terol, fat
Smith-Warner 3206/430 281 et al., 2003, (8 cohorts), pooled analy- M, F sis of 8 cohorts 6-16 y
FF0 self- Highest vs 0.77 p < 0.001 administered, lowest (5) (0.67-087) frequency, portion size; validated
Age, education, BMI, alcohol, energy, smoking status, duration, amount smoked
Incidence Effect strongest in never-smokers; significant effect only in current smokers; stronger effects in squa-mous-cell and adenocarcinoma than small-cell carcinoma Citrus fruit in-versely associated
*p for trend when applicable
176
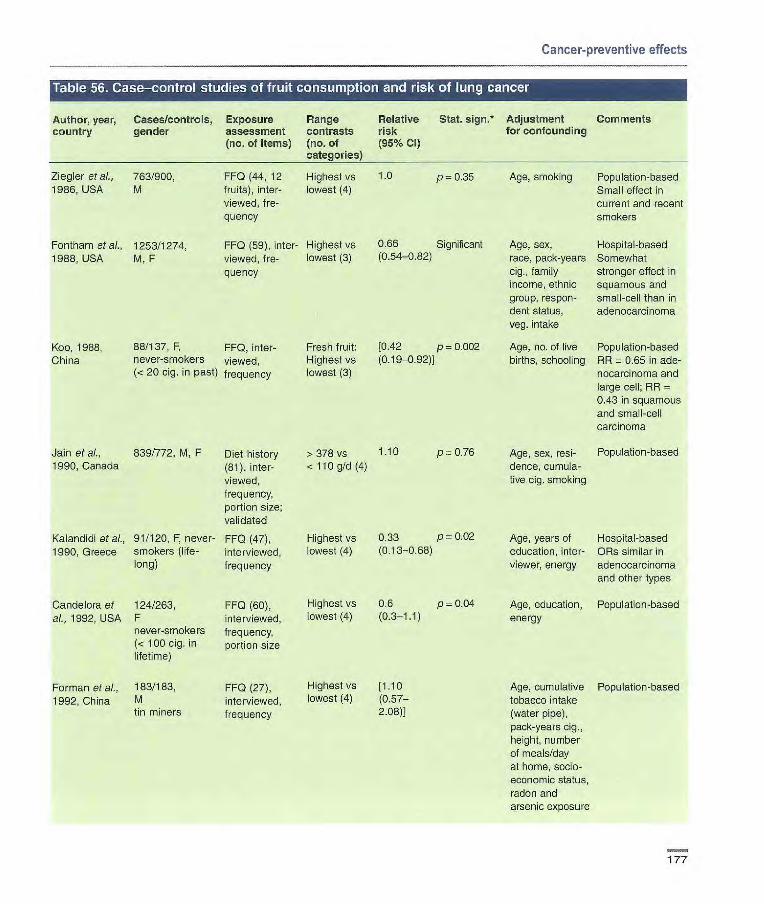
Cancer-preventive effects
Author, year, Cases/controls, Exposure Range
Relative Stat. 5jgfl* Adjustment Comments country gender assessment contrasts risk for confounding
(no. of items) (no. of
(95% Cl)
Ziegler et al., 763/900, 1986, USA M
Fontham etal., 1253/1274, 1988, USA M, F
Koo, 1988, 88/137, F, FF0, inter- China never-smokers viewed,
(< 20 cig. in past) frequency
Jain et al., 839/772, M, F Diet history 1990, Canada (81), inter-
viewed, frequency, portion size; validated
Kalandidi etal., 91/120, F, never- FF0 (47), 1990, Greece smokers (life- interviewed,
long) frequency
Candelora et 124/263, FF0 (60), al., 1992, USA F interviewed,
never-smokers frequency, (< 100 Gig, in portion size lifetime)
Forman eta)., 183/183, FF0 (27), 1992, China M interviewed,
tin miners frequency
Age, smoking Population-based Small effect in current and recent smokers
Age, sex, Hospital-based race, pack-years Somewhat cig., family stronger effect in income, ethnic squamous and group, respon- small-cell than in dent status, adenocarcinoma veg. intake
Age, no. of live Population-based births, schooling PR 0.65 in ade-
nocarcinoma and large cell; RR 0.43 in squamous and small-cell carcinoma
Age, sex, resi- Population-based dence, cumula- tive cig. smoking
Highest vs [1.10 Age, cumulative Population-based lowest (4) (0.57— tobacco intake
2.08) (water pipe), pack-years cig., height, number of meals/day at home, socio-economic status, radon and arsenic exposure
FF0 (44, 12 Highest vs fruits), inter- lowest (4) viewed, fre-quency
FF0 (59), inter- Highest vs viewed, fre- lowest (3) quency
1.0 p=0.35
0.66 Significant (0.54-0.82)
Fresh fruit: [0.42 p 0.002 Highest vs (0.19-0.92) lowest (3)
>378 vs 1.10 p0.76 < llOg/d (4)
Highest vs 0.33 p = 0.02
lowest (4) (0.13-0.68)
Highest vs 0.6 p 0.04 lowest (4) (0.3-1.1)
Age, years of Hospital-based education, inter- ORs similar in viewer, energy adenocarcinoma
and other types
Age, education, Population-based energy
177
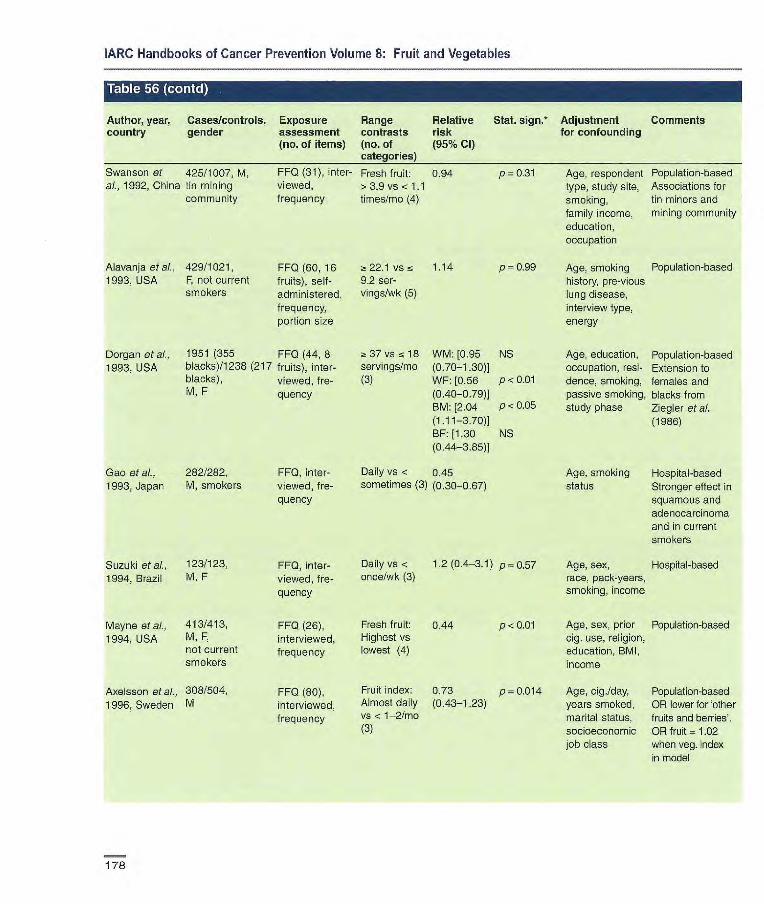
Suzuki etal., 123/123,
1994, Brazil M, F
Mayne etal., 413/413,
1994, USA M, F, not current smokers
Axe Isson et at., 308/504,
1996, Sweden M
FF0, inter-viewed, fre-quency
FF0 (26), interviewed, frequency
FF0 (80), interviewed, frequency
IARC Handbooks of Cancer Prevention Volume 8: Fruit and Vegetables
Author, year, Cases/controls, Exposure Range Relative country gender assessment contrasts risk
(no. of items) (no. of (95% Cl) categories)
Swanson et 425/1007, M, FF0 (31), inter- Fresh fruit: 0.94 al., 1992, China tin mining viewed, >39 vs < 1.1
community frequency times/mo (4)
Stat. sign.* Adjustment Comments for confounding
Alavanja eta]., 429/1021, 1993, USA F, not current
smokers
FF0 (60,16 22.1 vs 5 1.14 p=0.99 fruits), self- 9.2 ser- administered, vings/wk (5)
frequency, portion size
Dorgan eta]., 1951 (355 FF0 (44, 8 1993, USA blacks)/1238 (217 fruits), inter-
blacks), viewed, f re- M, F quency
37vs18 WM:[0.95 NS servings/mo (0.70-1.30)] (3) WF: [0.56 p < 0.01
(0.40-0.79)] BM: [2.04 P < 0.05
(1.11-3.70)] BF: [1.30 NS (0.44-3.85)]
Daily vs .r 0.45 sometimes (3) (0.30-0.67)
Daily vs < 1.2 (0.4-3.1) p0.57 once/wk (3)
Fresh fruit: 0.44 p <0.01 Highest vs lowest (4)
Fruit index: 0.73 p0.014 Almost daily (0.43-1.23) vs < 1-2/mo (3)
Age, respondent Population-based type, study site, Associations for smoking, tin miners and family income, mining community education, occupation
Age, smoking Population-based history, pre-vious lung disease, interview type, energy
Age, education, Population-based occupation, resi- Extension to dence, smoking, females and passive smoking, blacks from study phase Ziegler m'ai.
(1986)
Age, smoking Hospital-based status Stronger effect in
squamous and adenocarcinoma and in current smokers
Age, sex, Hospital-based race, pack-years, smoking, income
Age, sex, prior Population-based cig. use, religion, education, BMI, income
Age, cig./day, Population-based years smoked, OR lower for 'other marital status, fruits and berries'. socioeconomic OR fruit = 1.02 job class when veg. index
in model
Gao etal., 282/282, FF0, inter- 1993, Japan M, smokers viewed, fre-
quency
p=0.3l
178
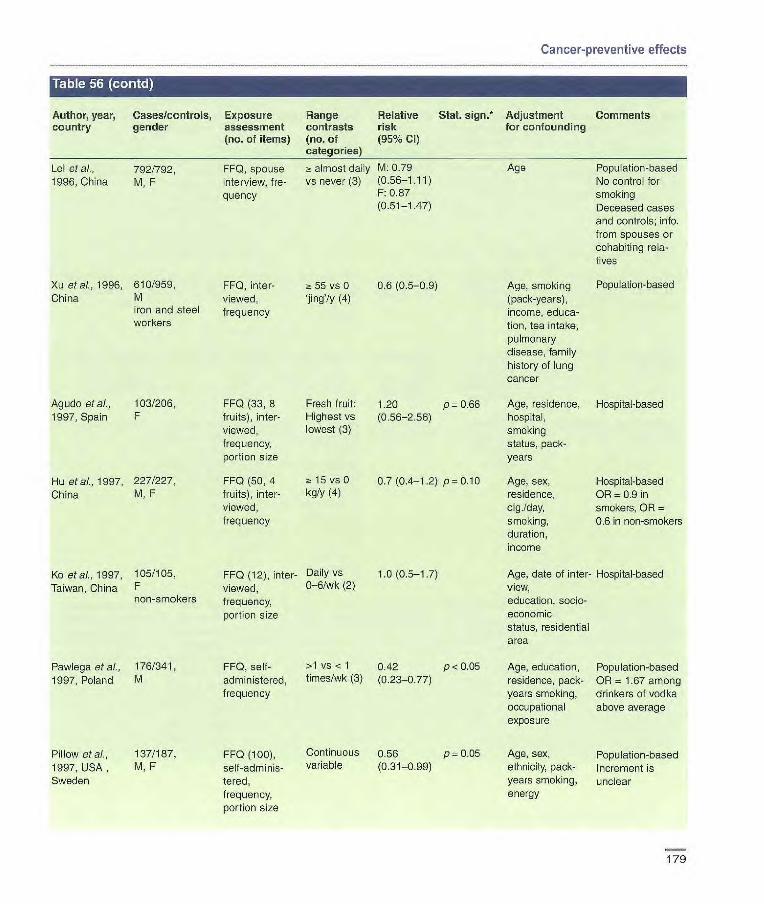
Cancer-preventive effects
Author, year, Cases/controls, Exposure Range Relative Stat. sign.* Adjustment Comments country gender assessment contrasts risk for confounding
(no. of items) (no. of (95% Cl) categories)
Lei at al., 792/792, FF0, spouse almost daily M: 0.79 Age Population-based 1996, China M, F interview, fre- vs never (3) (0.56-1.11) No control for
quency F: 0.87 smoking (0.51-1.47) Deceased cases
and controls; info. from spouses or cohabiting rela- tives
Xu at al., 1996, 610/959, FF0, inter- a 55 vs 0 0.6 (0.5-0.9) Age, smoking Population-based China M viewed, jing'/y (4) (pack-years),
iron and steel frequency income, educa- workers tien, tea intake,
pulmonary disease, family history of lung cancer
Agudo et al., 103/206, FF0 (33, 8 Fresh fruit: 1.20 p 0.66 Age, residence, Hospital-based 1997, Spain F fruits), inter- Highest vs (0.56-2.56) hospital,
viewed, lowest (3) smoking frequency, status, pack portion size years
Hu eta]., 1997, 227/227, FF0 (50, 4 15 vs 0 01 (0.4-1.2) p = 0.10 Age, sex, Hospital-based China M, F fruits), inter- kg/y (4) residence, OR = 0.9 in
viewed, cig./day, smokers, OR frequency smoking, 0.6 in non-smokers
duration, income
Ko etal., 1997, 105/105, FF0 (12), inter- Daily vs 1.0 (0.5-17) Age, data of inter- Hospital-based Taiwan, China F viewed, 0-6/wk (2) view,
non-smokers frequency, education, socio-
portion size economic status, residential area
Pawlega etal., 176/341, FF0, self- >1 vs < 1 0.42 p < 0.05 Age, education, Population-based 1997, Poland M administered, times/wk (3) (023-0.77) residence, pack- OR = 1.67 among
frequency years smoking, drinkers of vodka occupational above average exposure
Pillow etal., 137/187, FF0 (100), Continuous 0.56 p=0.05 Age, sex, Population-based 1997, USA , M, F self -adminis- variable (0.31-0.99) ethnicity, pack- Increment is Sweden tered, years smoking, unclear
frequency, energy portion size
179
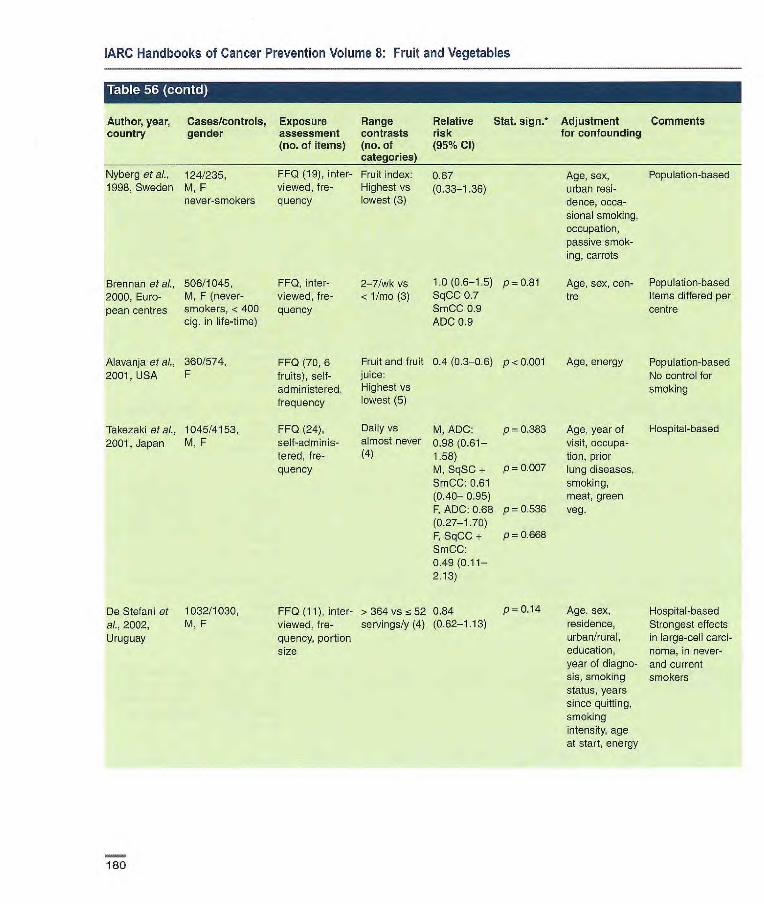
IARC Handbooks of Cancer Prevention Volume 8: Fruit and Vegetables
• 11, IPI [ItSI
Author, year, country
I Ito I
Cases/controls, gender
Exposure assessment (no. of items)
Range contrasts (no. of categories)
Relative Stat. sign.* risk (95% Cl)
Adjustment for confounding
Comments
Nyberg etal., 124/235, FF0 (19), inter- Fruit index: 067 Age, sex, Population-based 1998, Sweden M, F viewed, fre- Highest vs (0.33-1.36) urban resi-
never-smokers quency lowest (3) dence, occa- sional smoking, occupation, passive smok- ing, carrots
Brennan at al., 506/1045, FF0, inter- 2-7/wk vs 1.0(0.6-1.5) p=0.81 Age, sex, con- Population-based 2000, Euro- M, F (never- viewed, fre- < 1/mo (3) SqCC 0.7 tre Items differed per pean centres smokers, < 400 quency smcc 0.9 centre
cig. in life-time) ADC 0.9
Alavanja etal., 360/574, FF0 (70, 6 Fruit and fruit 0.4 (0.3-06) p < 0.001 Age, energy Population-based 2001, USA F fruits), self- juice: No control for
administered, Highest vs smoking frequency lowest (5)
Takezaki eta]., 1045/4153, FF0 (24), Daily vs M, ADC: p 0.383 Age, year of Hospital-based 2001, Japan M, F self-adminis- almost never 0.98 (0.61— visit, occupa-
tered, fre- (4) 1.58) tion, prior quency M, SqSC + p 0.007 lung diseases,
SmCC: 0.61 smoking, (0.40— 0.95) meat, green F, ADC: 0.68 pO.536 veg. (0.27-1.70) F, SqCC + p 0.668 SmCC: 0,49(0,11— 2.13)
De Stefani at 1032/1030, FF0 (11), inter- > 364 vs 52 0.84 P 0.14 Age, sex, Hospital-based al., 2002, M, F viewed, fre- servings/y (4) (0.62-1.13) residence, Strongest effects Uruguay quency, portion urban/rural, in large-cell carci-
size education, noma, in never- year of diagno- and current sis, smoking smokers status, years since quitting, smoking intensity, age at start, energy
180

Cancer-preventive effects
irn r.i
Author, year, Cases/controls, Exposure Range Relative Stat. Adjustment Comments country gender assessment contrasts risk sign.* for confounding
(no. of items) (no. of (95% Cl)
Kreuzer et 234/535, FF0 (15) inter- Defy vs ic 0.66 p 0.94 Age, region al., 2002, F viewed, once/wk (3) (0.37-1.19) Germany (never-smokers, frequency
< 400 cig. in life- time)
Marchand et 134/295, FF0 (89), inter- Highest vs M: 0.7 p0.09 Age, ethnicity, ai., 2002, New M, F viewed, lowest (3) (0.4-1.5) pack-years Caledonia frequency, smoking
portion size
Population-based
Population-based No significant association in women ('data not shown')
Rachtan, 242/352, FF0 (17), self- Daily vs rarely 0.49 2002a, F administered, (2) (0.32-0.74) Poland frequency
Seow et al., 303/765, FF0 (39, 12 z: 9.7 vs < Smokers: 2002, F fruits), inter- 3.8 sorv- 0.63 Singapore viewed, ings/wk (3) (0.28-1 .44)
frequency, Non-sno- portion size kers: 0.60
(0.39-0.93)
p = 0.00i Age, pack-years Population-based
p = 0.4 Age, date of admis- Hospital-based sien, place of birth, family history of
P 0.03 cancer, (for smokers: duration, cig.fday)
p for trend when applicable
ADC, adenooarcirioma; SqCC, squamous-cell carcinoma; SrnCC, small-cell carcinoma
Author, year. Cases/cohort Exposure Range Relative Stat. sign. Adjustment Comments country size, gender assessment contrasts risk for confounding
(years follow-up) (no. of items) (no. of (95 % Cl) categories)
Kvale et al., 168/13 785, M FF0 (31, 8 Veg. index: 0.74 p 0.37 Age. sex, cig. Incidence 1983, Norway 11.5 y veg.), self- z! 50 vs <20 smoking, region, RR 0.54 (NS)
administered, times/mo (4) urban/rural resi- for squamous and frequency dance small cell oaroino-
nias
Fraser et al., 61/34 198, M, F FF0 (51), Cooked green 1.09 p=0.50 Age, sex, cig. Potatoes excluded 1991, USA 6 y self-adminis- veg.: (0.41-2.87) smoking status incidence
tered, ~! 7 vs < 3 (never, ex, cur- Seventh-Day frequency times/wk (3) rent) Adventists
No information on total veg.
Chow et al., 219/17 633, M FF0 (35), self- > 160 vs <46 1.2 (0.6-2.3) Age, smoking Mortality 1992, USA 20 y administered, times/mo (4) status, Lutheran
frequency occupation Brotherhood
181

Breslow et aI., 158/20004, 2000, USA M, F
8.5 y
Feskanich et 519/77823, ai., 2000, USA F
274/47778 M F 12 y M 10 y
FF0 (59,12 > 13.6 vs < 0.9(0.5-1.5) p<0.786
veg.), self- 5.2
administered, servings/wk
frequency, por- (4)
tien size; validated
FF0 (116,23 F: >4.3vss 0.68 veg.), self- 2.5 servings/d (0.51-0.90) administered, (5)
frequency, M: > 4.1 vs 1.04
portion size; 2.3 servings/d (0.69-1.57)
validated (5)
Voorrips et al., 1010/2953
2000b, (sub-cohort),
Netherlands M, F 6.3 y
FF0 (150, 21 Highest
veg), self- (median
administered, 286 g/d) vs
frequency, lowest (103
portion size; g/d) (5)
validated
0.7 (0.5-1.0) p = 0.001
IARC Handbooks of Cancer Prevention Volume 8: Fruit and Vegetables
Table 57 (contl
Author, year, Cases/cohort Exposure Range Relative Stat. 5jgfl•* Adjustment Comments country size, gender assessment contrasts risk for confounding
(years follow-up) (no. of items) (no. of (95 % Cl)
Shibata eta)., 164 (94 M FF0 (59,21 M: 4.5 vs 1.37 NS Age, smoking Incidence
1992, USA 70 F)/1 1 580 veg.), self- < 3 servings/d (0.74-2.25) Retirement corn-
9 y administered, (3) munity
frequency F: = 4.8 vs 0.58 NS <3-2 serv- (0.32-1.05) ings/d (3)
Steinmetz et 138/2814, FF0 (127, 29 a 31 vs 14 0.50 p=0.0l Age, pack-years Incidence
a)., 1993, USA F veg.), self- servings/wk (0.29-087) of smoking, Nested case- 4 y administered, (4) energy control; total cohort
frequency, por- 34 977
don size; Strongest effect in
validated large-cell carcino- ma, and in ax- smokers, but small numbers
Ocké et ai., 54/561, Dietary history, > 33rd vs wc 0.47 Age, pack- Incidence
1997a, M spouse inter- 33rd percen- (0.21-1.03) years of cig. FIR for stable
Netherlands 20 y view; frequency tile (2) smoking, dietary habits
and portion energy Weaker RR for
size average habits
Age, sex, Mortality smoking duration, packs/day smoked
Age, follow- Incidence up cycle, smok- Excludes beans ing status, years and lentils, pots- since quitting, toes cig./day, age For females, effect at start strongest in cur- smoking, rent smokers, and energy in Kreyberg I
For males protec- tive effect only in never-smokers, and in Kreyberg I
Age, sex, Incidence family history of Total cohort = 120 lung cancer, 852 education, cur- Protective effect rent smoker, only in current and years of amok- ex smokers, and in ing, cig./day Kreyberg I (men)
182

860/ FF0 (300), 478,021, self-adminis- M, F tered or inter- (0-14 mean viewed, fre- 6 y) quency, portion
size; cali- bration study
Miller etal, 2003, 10 European countries
Cancer-preventive effects
Author, year, Cases/cohort Exposure Range
Relative Stat. sign.* Adjustment Comments country size, gender assessment contrasts risk for confounding
(years follow-up) (no. of items) (no. of
(95 % CI)
Jensen et ai., 149/1578, 2001, Italy, M, smokers Netherlands 25 y
Dietary history, Highest vs interviewed, lowest (3) frequency and portion size
0.90 p0.59 (0.61-1.33)
Age, cig./day, Mortality country, Protective effect energy, fruit only in heavy
smokers (20+ cig./day), effects less strong in Italy
Green leafy M: 0.76 p= 0.035 veg.: Almost (0.59-0.98) daily vs F:1.19 p-0.45 1-2/wk (3) (0.75-190)
Holick etal., 1644/27 084, FF0 (276), >156 vs <52 0.75 p<0.000l 2002, Finland M, smokers self--adminis- Old (5) (0.63-0.88)
14y tered, frequency, portion size; validated
Highest vs 1.00 p=0.85 lowest (5) (0.76-1.30)
Age, family Mortality history of lung No information on cancer, total veg. Effects smoking status, stronger in male cigts/day X ex-smokers and duration, time female non- since quitting smokers
Age, years incidence smoked, cigi ATBC trial day, intervention (a-tocopherol/ p-carotene), pre- vious supple- ment use ((3-carotene and vitamin A), energy, cholesterol, fat
Age, sex, Incidence weight, height, No association in centre, smoking never-, current
and ex-smokers
Ozasa et al., 572/98248, FF0 (32), 2001, Japan M, F self-adminis
9 y tered, frequency
Neubouser at ai., 2003, USA
Intervention arm: FF0, self- 414/7072, M, F administered Placebo arm: (45 items 326/7048, relating M. F to fruit and 12 veg.)
Intervention 0.81 p 0.46 arm: Highest (0.65-1.21) vs lowest (5) Placebo arm: 0.82 p 0.39 Highest vs (0.59-114) lowest (5)
Sex, age, Follow up of parti- smoking status, cipants in CARET pack-years of trial in smokers smoking, and asbestos asbestos workers exposure, race/ethnicity, enrolment centre
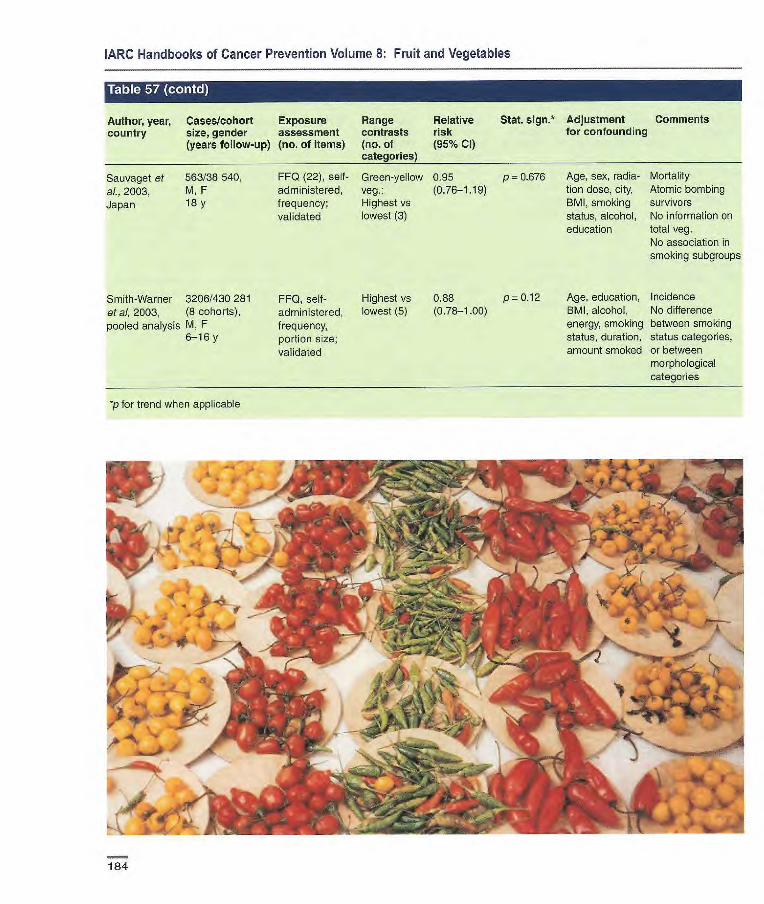
FF0, self- Highest vs 0.88 p = 0.12 administered, lowest (5) (0.78-1.00) frequency, portion size; validated
Smith-Warner 3206/430 281 et al, 2003, (8 cohorts), pooled analysis M, F
6-16 y
'p for trend when applicable
Age, education, Incidence BMI, alcohol, No difference energy, smoking between smoking status, duration, status categories, amount smoked or between
morphological categories
IARC Handbooks of Cancer Prevention Volume 8: Fruit and Vegetables
Table 57 (contd)
Author, year, Cases/cohort Exposure Range Relative Stat. sign.* Adjustment Comments country size, gender assessment contrasts risk for confounding
(years follow-up) (no. of items) (no. of (95% Cl)
Sauvaget et 563/38540, FF0 (22), self- Green-yellow 0.95 p 0L676 al., 2003, M, F administered, veg.: (0.76-1.19) Japan lay frequency; Highest vs
validated lowest (3)
Age, sex, radia- Mortality tion dose, city, Atomic bombing BMI, smoking survivors status, alcohol, No information on education total veg.
No association in smoking subgroups
'.,.. J...• ' --.. .
• 1 •
'h . ... • .. -. r . 21 0
;;:- . - .
' 'U
- .-.---......,.- 4 . .. -..,. . ..,
.I .
._( p: •* ?
4-,
/ S Kk
184
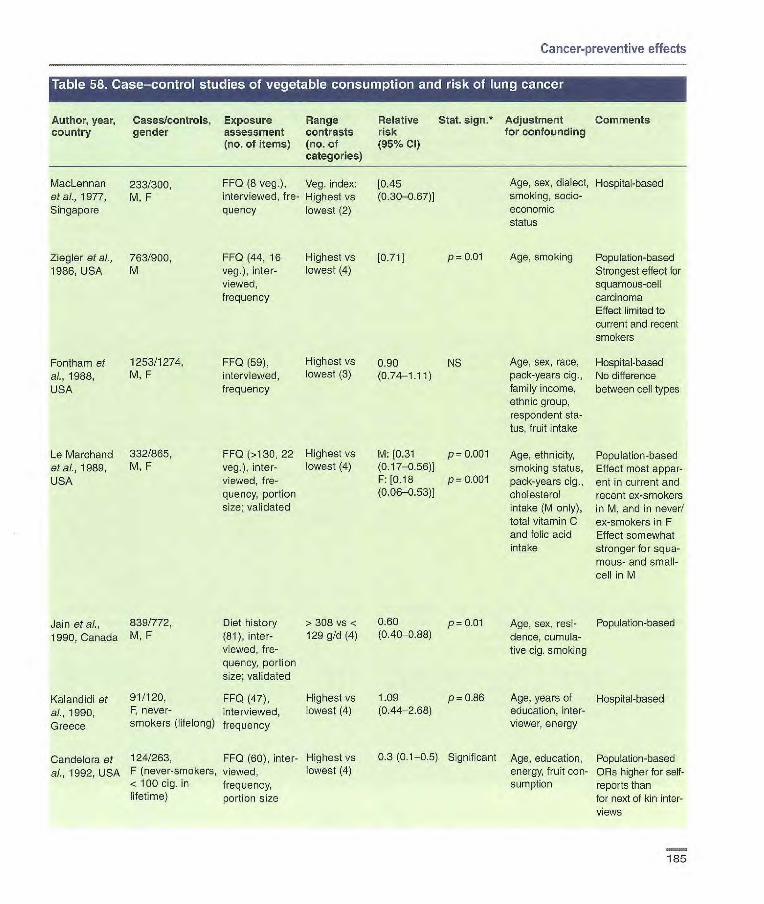
Cancer-preventive effects
Author, year, Cases/controls, Exposure Range Relative Stat. sign.* Adjustment Comments country gender assessment contrasts risk for confounding
(no. of items) (no. of (95% Cl) categories)
MacLennan 233/300, FF0 (6 veg.), Veg. index; (0.45 Age, sex, dialect, Hospital-based et a ]., 1977, M, F interviewed, fre- Highest vs (0.30-0.67)] smoking, socle- Singapore quency lowest (2) economic
status
Ziegler et aL. 763/900, FF0 (44, 16 Highest vs [0.71] p 0.01 Age, smoking Population-based 1986, USA M veg.), inter- lowest (4) Strongest effect for
viewed, squamous-cell frequency carcinoma
Effect limited to current and recent smokers
Fontham et 1253/1274, FF0 (59), Highest vs 0.90 NS Age, sex, race, Hospital-based al., 1988, M, F interviewed, lowest (3) (0.74-1.11) pack-years cig., No difference USA frequency family income, between cell types
ethnic group, respondent sta- tus, fruit intake
Le Marchand 332/865, FF0 (>130, 22 Highest vs M: [0.31 p 0.001 Age, ethnicity, Population-based et al., 1989, M, F veg.), inter- lowest (4) (017-0.56)] smoking status, Effect most appar- USA viewed, fre- F: [0.18 P = 0.001 pack-years cig., ent in current and
quency, portion (0.06-0.53)] cholesterol recent ox-smokers size; validated intake (M only), in M, and in never/
total vitamin C ex-smokers in F and folic acid Effect somewhat intake stronger for squa-
mous- and small- cell in M
Jain et al., 839/772, Diet history > 308 vs r 0.60 p = 0.01 Age, sex, resi- Population-based 1990, Canada M, F (81), inter- 129 g/d (4) (0.40-088) dence, cumula-
viewed, fre- tive cig. smoking quency, portion size; validated
Kalandidi et 91/120, FF0 (47), Highest vs 1.09 p = 0.86 Age, years of Hospital-based al., 1990, F, never- interviewed, lowest (4) (0.44-2.68) education, inter-
Greece smokers (lifelong) frequency viewer, energy
Candelora et 124/263, FF0 (60), inter- Highest vs
ai., 1992, USA F (never-smokers, viewed, lowest (4) < 100 cig. in frequency, lifetLrne) portion Size
Significant Age, education, Population-based energy, fruit con- ORs higher for self- sumption reports than
for next of kin inter-views
185

IARC Handbooks of Cancer Prevention Volume 8: Fruit and Vegetables
Author, year, Cases/controls, Exposure Range Relative Stat. sign.* Adjustment Comments country gender assessment contrasts risk for confounding
(no. of items) (no. of (95% CI) categories)
Forman at al., 183/183, FF0 (27), Highest vs [0.60 1992, China M, tin miners interviewed, lowest (4) (0.30-1.18)]
frequency
Alavanja et 429/1021, FF0 (60; 28 -a 25 vs 13 0.99 p0.89 al., 1993, USA F not current veg.), self- servings/wk
smokers administered, (5) frequency, portion size
Dorgan etal., 1951 (355 FF0 (44, 16 66 vs 41 WM: [0.80 NS 1993, USA blacks)/1238 veg.), inter- servings/mo (0.58-1.10)1
(217 blacks), viewed, (3) WF: [0.59 p<O.Ol M, F frequency (0.42-082)]
BM: [1.10 NS (0.59-204)] BF: [0.67 NS (0.23-1.96)]
Age, cumulative Population-based tobacco intake Stronger protective (water pipe), effect for yellow- pack-years cig. light green veg. smoking, height, number of meals/day at home, socio- economic status, radon and arsenic exposure
Age, smoking Population-based history, previous Includes potatoes lung disease, interview type, energy
Age, education, Population-based occupation, resi- Extension to dence, smoking, females and passive blacks from smoking, Ziegler etal. study phase (1986)
Effects stronger in squamous- and small-cell than adenocarcinoma Effect limited to current and ex cig. smokers
Sankaranara- 261/1190, yanan et al., M 1994, India
Mayne etal., 413/413, 1994, USA M, F, not
current smokers
FF0 (45, 12 Highest vs veg.), inter- lowest (4) viewed, frequency
FF0 (26), inter- Highest vs viewed, lowest (4)
frequency
032 p 0.02
Age, smoking, Population-based (0.13-0.78)
education, Onions most pro- religion tective (RR 0.03)
M: 0.55 NS Age, prior cig. Population-based F: 0.47 p <0.025 use, religion,
education, BMI, income
186
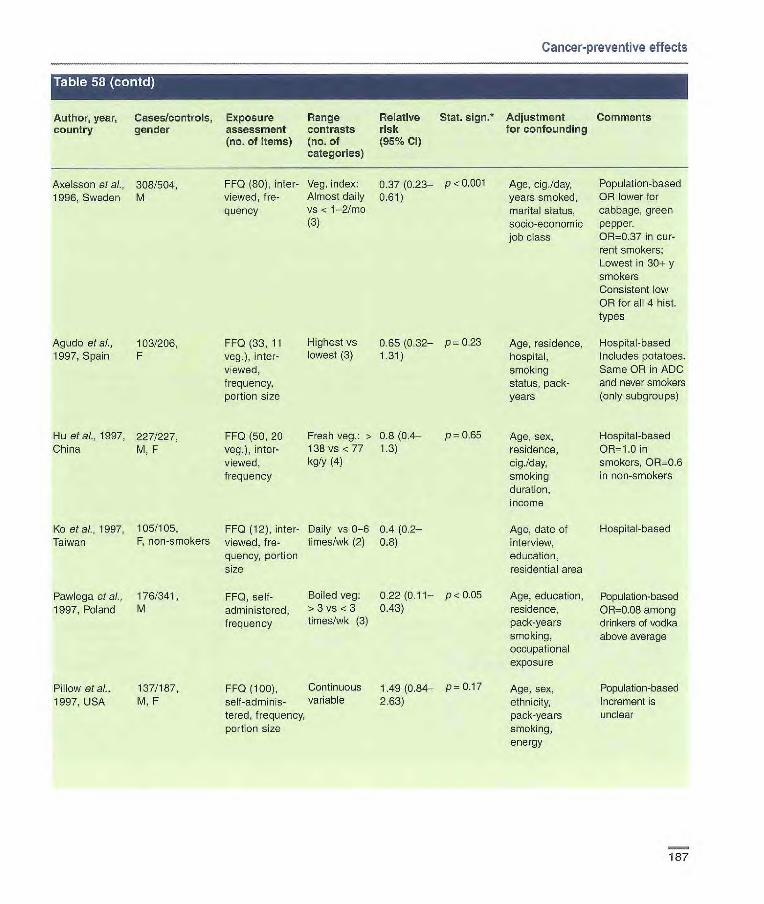
Cancer-preventive effects
Author, year, Cases/controls, Exposure Range Relative Stat. 5jgfl•* Adjustment Comments country gender assessment contrasts risk for confounding
(no. of items) (no. of (95% Cl) categories)
AxeLsson of ai., 308/504, FF0 (80), inter- Veg. index; 0.37(0.23- P<0-001 Age, cig./day, Population-based 1996, Sweden M viewed, 0e- Almost daily 0.61) years smoked, OR lower for
quency vs < 1-2/mo marital status, cabbage, green (3) socio-economic pepper.
job class OR-0.37 in cur- rent smokers; Lowest in 30± y smokers Consistent low OR for all 4 hist. types
Agudo et a/., 103/206, FF0 (33, 11 Highest vs 0.65(0.32- p 0.23 Age, residence, Hospital-based 1997, Spain F veg.), inter- lowest (3) 1.31) hospital, Includes potatoes.
viewed, smoking Same OR in ADC frequency, status, pack- and never smokers portion size years (only subgroups)
Ru etal., 1997, 227/227, FF0 (50, 20 Fresh veg.: > 0.8 (0.4- p0.65 Age, sex, Hospital-based China M, F veg.), inter- 138 vs <77 1.3) residence, OR-1.0 in
viewed, kg/y (4) cig./day, smokers, OR=0.6 frequency smoking in non-smokers
duration, income
Ko et al., 1997, 105/105, FF0 (12), inter- Daily vs 0-6 0.4 (02- Age, date of Hospital-based Taiwan F, non-smokers viewed, fre- times/wk (2) 0.8) interview,
quency, portion education, size residential area
Pawlega et al., 176/341, FF0, self Boiled veg: 0.22(0.11- P<0.05 Age, education, Population-based 1997, Poland M administered, > 3 vs <3 0.43) residence, OR=0.08 among
frequency times/wk (3) pack-years drinkers of vodka smoking, above average occupational exposure
Pillow et al., 137/187, FF0 (100), Continuous 1.49 (0.84- P 0.17 Age, sex, Population-based 1997, USA M, F self-adminis- variable 2.63) ethnicity, Increment is
tered, frequency, pack-years unclear portion size smoking,
energy
187
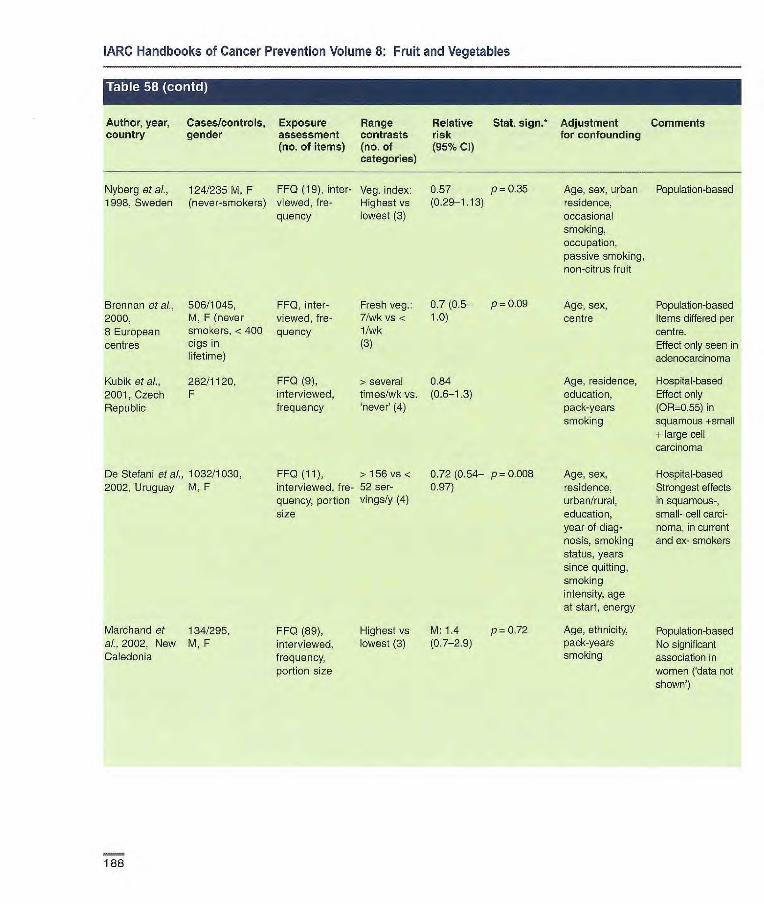
IARC Handbooks of Cancer Prevention Volume 8: Fruit and Vegetables
Author, year, Cases/controls, Exposure Range Relative Stat. sign.* Adjustment Comments country gender assessment contrasts risk for confounding
(no. of items) (no. of (95% Cl) categories)
Nyberg et aL, 124/235 M, F FF0 (19), inter- Veg. index: 0.57 p = 0.35 Age, sex, urban Population-based 1998, Sweden (never-smokers) viewed, f re- Highest vs (029-1.13) residence,
quency lowest (3) occasional smoking, occupation, passive smoking, non-citrus fruit
Brennan et al., 506/1045, FF0, inter- 2000, M, F (never viewed, f re- 8 European smokers, <400 quency centres cigs in
lifetime)
Kubik et al., 282/1120, FFQ (9), 2001, Czech F interviewed, Republic frequency
De Stefani et ai., 1032/1030, 2002, Uruguay M, F
Fresh veg.: 0.7(0.5— p = 0.09 Age, sex, 7/wkvs< 1.0) centre 1 /wk (3)
> several 0.84 Age, residence, times/wk vs. (0.6-1.3) education, never' (4) pack-years
smoking
Popuiation-based Items differed per centre. Effect only seen in adenocarcinona
Hospital-based Effect only (0R0.55) in squamous +small + large cell carcinoma
Hospital-based Strongest effects in squamous-, small- cell carci-noma, in current and ex- smokers
FFQ(11), >156vs< interviewed, fre- 52 ser-quency, portion vings/y (4) size
0.72 (0.54— p = 0.008 0.97)
Age, sex, residence, urban/rural, education, year of diag-nosis, smoking status, years since quitting, smoking intensity, age at start, energy
Marchand et 134/295, ai., 2002, New M, F Caledonia
FF0 (89), interviewed, frequency, portion size
Highest vs M:1.4 p=0.72 lowest (3) (0.7-2.9)
Age, ethnicity, pack-years smoking
Population-based No significant association in women ('data not shown')
188
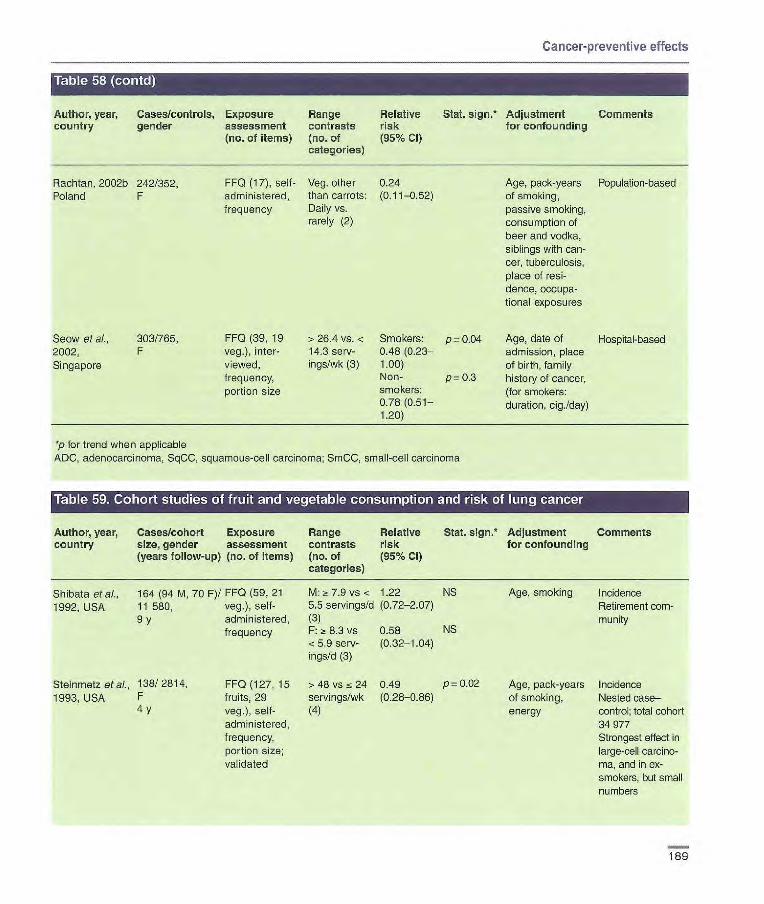
Cancer-preventive effects
Author, year, Cases/controls, Exposure Range Relative Stat. sign.* Adjustment Comments country gender assessment contrasts risk for confounding
(no. of items) (no. of (95% Cl) categories)
FF0 (17), self- Veg. other 0.24 administered, than carrots: (0.11-0.52) frequency Daily vs.
rarely (2)
FF0 (39, 19 >26.4 vs. < Smokers: p=0.04 veg.), inter- 14.3 serv- 0.48(0.23— viewed, ings/wk (3) 1.00) frequency, Non- p= 0.3 portion size smokers:
0.78(0.51— 1.20)
Rachtan, 2002b 242/352 Poland F
Seow et al., 303/755, 2002, F Singapore
Age, pack-years Population-based of smoking, passive smoking, consumption of beer and vodka, siblings with can-cer, tuberculosis, place of resi-derice, occupa-tional exposures
Age, date of Hospital-based admission, place of birth, family history of cancer, (for smokers: duration, cig./day)
p for trend when applicable ADC, adenocarcinonia, SqCC, squamous-cell carcinoma; SrnCC, small-cell carcinoma
Author, year, Cases/cohort Exposure Range Relative Slat. sign.* Adjustment Comments country size, gender assessment contrasts risk for confounding
(years follow-up) (no. of items) (no. of (95% Cl) categories)
Shibata et al., 164 (94 M, 70 F)/ FF0 (59,21 1992, USA 11 580, veg.), self-
9 y administered, frequency
Steinmetz etal., 138/ 2814, FF0 (127, 15 1993, USA F fruits, 29
4 y veg.), self- administered, frequency, portion size; validated
M: ;~ 7.9 vs < 1.22 NS 5.5 servings/b (0.72-2.07) (3) F: 8.3 vs 0.58 NS <5.9 serv- (0.32-1-04) ings/d (3)
>48vs24 0.49 p=0.02 servings/wk (0.28-0.86) (4)
Age, smoking Incidence Retirement com-munity
Age, pack-years Incidence of smoking, Nested case— energy control; total cohort
34 977 Strongest effect in large-cell carcino-ma, and in ox-smokers, but small numbers
189

IARC Handbooks of Cancer Prevention Volume 8: Fruit and Vegetables
Author, year, country
Cases! cohort size, gender (years follow-up)
Exposure assessment (no. of items)
Range contrasts (no. of categories)
Relative Stat. 5jgfl*
risk (95% CI)
Adjustment for confounding
Comments
Feskanich at F 519/77 823, FF0 (116, 15 F>7.2 vs 0.79 Age, follow-up Incidence. Ex- a]., 2000, USA 12 y fruits, 23 veg.), 4.5 servingsld (0.59-1.06) cycle, smoking cludes beans and
M 274/47 778, self-admiqjs- (5) status, years lentils, potatoes 10 y tered, frequency, M >7.2 vs 1.12 since quitting, For females, effect
portion size; 4.3 servings/d (0.74_1.59) cig./day (current strongest in never- validated (5) smokers), age smokers, and in
at start smoking, Kreyberg I. For energy males, protective
effect only in never-smokers, and in Kreyberg I
Voorrips at al., 1010/2953, FF0 (150, 8 Highest 0.7 (0.5-1.0) p < 0.001 Age, sex, Incidence 2000b, (subcohort). fruits, 21 veg.), (median 554 family history of Total cohort 120 Netherlands M, F sel-adminis- g/d) vs lung cancer, 852
6.3 y tered, frequency, lowest (191 education, portion size; g/d) (5) current smoker validated (yes/no), years
of smoking, cig./day
Holick at at., 1644/27 084, FF0 (276), > 332 vs < 0.73 p <0.001 Age, years Incidence 2002, Finland M, smokers self-adminis- 116 g/d (5) (0.62-0.86) smoked, cigi ATBC trial
14 y tered, frequency, day, intervention portion size; (c-tocopherol/J3- validated carotene), previ-
ous supplement use ((t-carotene and vitamin A), energy, choles- terol, fat
Neuhouser Intervention FF0, self- Intervention 0.76 p= 0.13 Sex, age, amok- Follow up of at al., 2003, arm: 414/ 7072, administered arm: Highest (0.55-1.06) ing status, total participants in USA M, F (45 items vs lowest (5) pack-years of CARET trial in
Placebo arm: relating to Placebo arm: 0.73 p = 0.21 smoking, asbes- smokers and 326/7048, fruits and veg.) Highest vs (0.51-1.04) tos exposure, asbestos workers M, F lowest (5) race/ethnicity, 12 y enrolment centre
Smith-Warner 3206/430 281 FF0, self- Highest vs 0.79 p = 0.001 Age, education, Incidence. Effect et aI., 2003, (8 cohorts), administered, lowest (5) (0.69-0.90) BMI, alcohol, strongest in pooled analysis M, F frequency, energy, smoking never-smokers;
6-16 y portion size; status, duration, significant effect validated amount smoked only in current
smokers; stronger effects in SqCC and ADC than SmCC
*p for trend when applicable ADC, adenocarcinoma, SqCC, squamous-cell carcinoma; SmCC, small-cell carcinoma
190
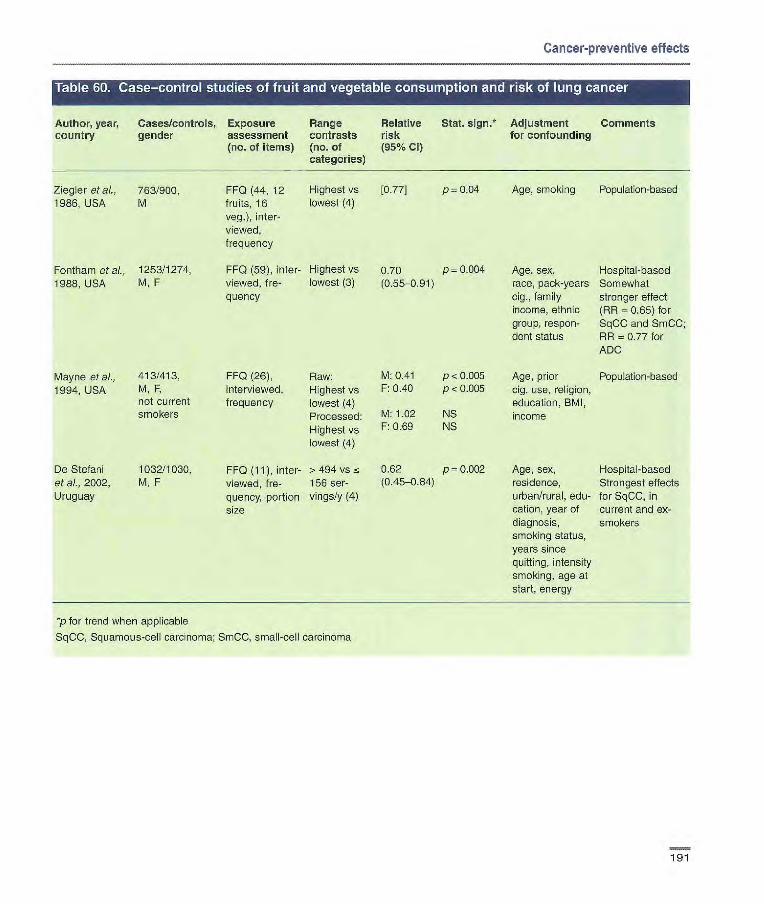
FF0 (44, 12 Highest vs 1077] p= 0.04 fruits, 16 lowest (4) veg.), inter- viewed, frequency
FF0 (59),inter- Highest vs 0.70 p 0.004 viewed, fre- lowest (3) (0.55-0.91) quency
FF0 (26), Raw: M: 0.41 p < 0.005 interviewed, Highest vs F: 0.40 p < 0.005 frequency lowest (4)
Processed: M: 1.02 NS
Highest vs F: 0.69 NS
lowest (4)
FF0 (11), inter- >494 vs s 0.62 p0.002 viewed, f re- 156 ser- (0.45-0.84)
quency, portion vings/y (4) size
Ziegler et ai- 763/900. 1986, USA M
Fontharn et ai., 1253/1274, 1988, USA M, F
Mayne et al., 413/413, 1994. USA
M, F, not current smokers
De Stefani
1032/1030, et aL. 2002, M, F Uruguay
Age, smoking Population-based
Age, sex, Hospital-based race, pack-years Somewhat cig., family stronger effect income, ethnic (RA = 0.65) for group, respon- SqCC and SmCC; dent status AR = 0.77 for
ADC
Age, prior Population-based cig. use, religion, education, BMI, income
Age, sex, Hospital-based residence, Strongest effects urban/rural, edu- for SqCC, in cation, year of current and ex- diagnosis, smokers smoking status, years since quitting, intensity smoking, age at start, energy
Cancer-preventive effects
Author, year, Cases/controls, Exposure Range Relative Stat. sign.* Adjustment Comments country gender assessment contrasts risk for confounding
(no. of items) (no. of (95% Cl) categories)
p for trend when applicable
SqCC, Squamous-cell carcinoma; SmCC, small-cell carcinoma
191
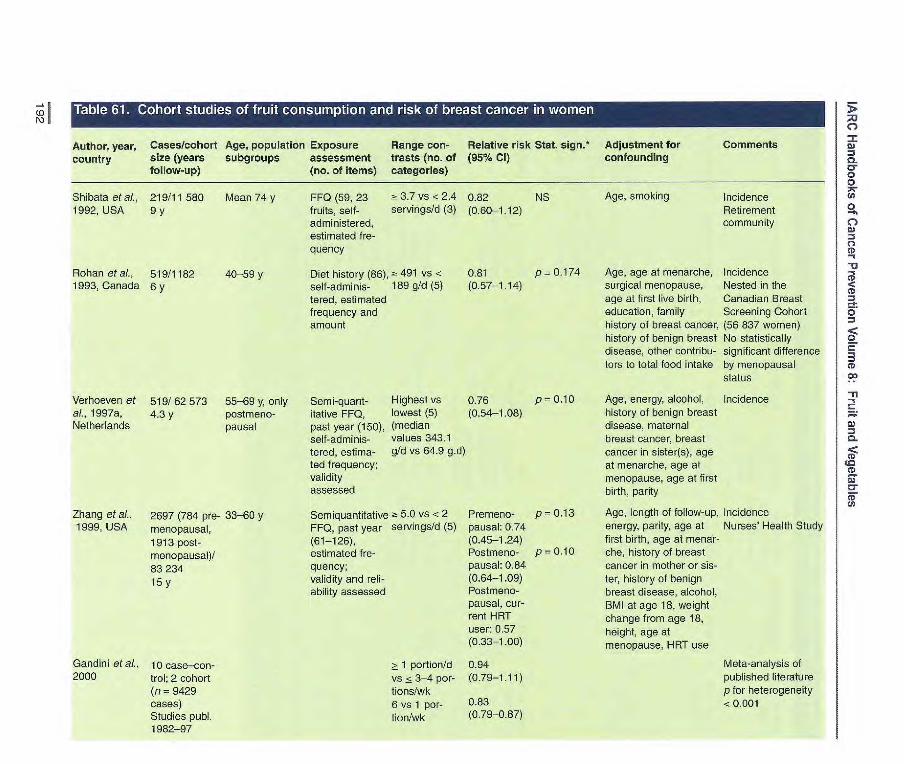
FFQ (59, 23 3.7 vs <2.4 0.82 NS fruits, self- servings/d (3) (0.60-1.12) administered, estimated fre- quency
Diet history (86),;- 491 vs < 0.81 p 0.174 self-adninis- 169 g/d (5) (0.57-1.14) tered, estimated frequency and amount
Shibata etaL, 219/11 580 Mean 74 y 1992, USA 9y
Rohan etal., 519/1182 40-59y 1993, Canada Sy
55
Author, year, Cases/cohort Age, population Exposure Range con- Relative risk Stat. sign.* Adjustment for Comments country size (years subgroups assessment trasts (no. of (95% CI) confounding
follow-up) (no. of items) categories)
Verhoeven et 519/62573 55-69 y, only Semi-quant- Highest vs 0.76 p 0.10 al., 1997a, 4.3 y postnleno- itative FFQ, lowest (5) (0.54-1.08) Netherlands pausal past year (150), (median
self-adminis- values 343.1 tered, estima- gfd vs 64.9 g.d) ted frequency; validity assessed
Zhang et aI., 2697 (764 pre- 33-60 y Semiquantitative 5.0 vs <2 Prenieno- p = 0.13 1999, USA menopausal, FFQ, past year servings/d (5) pausal: 0.74
1913 post- (61-126), (0.45-1.24) menopausal)/ estimated f re- Postmeno- p 0.10
83 234 quency; pausal: 0.84
15Y validity and reli- (0.64-1.09) ability assessed Postmeno-
pausal, cur- rent HRT user: 0.57 (0.33-1.00)
Gandini et aI., 10 case—con- _> 1 portion/d 0.94 2000 trol; 2 cohort vs <3-4 por- (0.79-1.11)
(ri = 9429 tions/wk cases) 6 vs 1 per- 0.63 Studies pub!. tion/wk (0.79-087) 1982-97
Age, smoking Incidence Retirement community
Age, age at menarche, Incidence surgical menopause, Nested in the age at first live birth, Canadian Breast education, family Screening Cohort history of breast cancer, (56 837 women) history of benign breast No statistically disease, other contribu- significant difference tors to total food intake by menopausal
status
Age, energy, alcohol, Incidence history of benign breast disease, maternal breast cancer, breast cancer in sister(s), age at menarche, age at menopause, age at first birth, parity
Age, length of follow-up, Incidence energy, parity, age at Nurses' Health Study first birth, age at menar- che, history of breast cancer in mother or sis- ter, history of benign breast disease, alcohol, BMI at age 18, weight change from age 18, height, age at menopause, HRT use
Meta-analysis of published literature p for heterogeneity <0.001

U)
Author, year, Cases/cohort Age, population Exposure Range con- Relative risk Stat. sign.* Adjustment for Comments country size (years subgroups assessment trasts (no of (95% CI) confounding
follow-up) (no. of items) categories)
Smith-Warner 7377 cases from et al. 2001 eight cohort
studies with total baseline popula-tion of 351 825 women Follow-up 1976-96
Appleby etal., 90/6416 a16 y 2002, UK 25 y 25 y
Highest vs All: 0.93 p = 0.8 lowest (4) (0.86-1.00) Increment All:0.99 (0.95- 100 g/d too).
Premenopausal: 0.98 (0.94-1.02) Postmenopausal: 0.99 (0.98-1.01)
FF0 (5); esti- Fresh fruit 0.66 (0.38— NS mated f re- Daily vs < dailyl.14) quency (2)
Pooled analysis Study-specific RRs were calculated using the primary data and then combined using the random effects model Similar finding when fruit juices were excluded from total fruits p for heterogeneity: 0.89-0.94
Age, smoking, Mortality other foods Cohort of health food
shoppers
Maynard at 82 incident, 36 Mean 8 y 7-day house- Highest (mean Incidence: 1.08 p = 0.61 Age, energy, Incidence and mortality al., 2002, UK fatal/1959 hold Tnven- = 88.4 g/d) vs (0.52-2.25). food expendi- Survey conducted at the 64 y 64 y tory lowest (mean Mortality: 1.25 p = 0.73 ture, Townsend household level
0.6 g/d) (4) (0.40-3.92) score, season 78% of the 4999 boys and girls originally identified were included in the cohort
Riboli & Norat, 8 case—control, Increment Cohort: p for hetero- Meta-analysis of pubiished 2003 10 cohort 100 g/d 0.99 (0.98-1.00) geneity = literature
studies, publ. 0.99 1973-2001 Case—control: p for hotero-
0.92 (0.84-1.01) geneity < 0.01
All: 0.99 p for hetero- (0.98-1.00) geneity =
0.88
Sauvaget et 76/23 667 34-103 y FF0, past Defy vs 1/wk 0.91 (0.48— 0.71 Age, radiation Mortality al., 2003, 18 y year (22), (3) 132) dose, city, BMI, Atomic bombing survivors Japan self-adminis- smoking, alco-
tered, estimat- hol, education ed frequency
*p for trend when applicable; HRT, hormone replacement therapy CO J,

Author, Cases! Age, population Exposure Range con- Relative risk Stat. sign.* Adjustment for Comments
year, controls subgroups assessment trasts (no. of (95% Cl) confounding country (no. of items) categories)
Katsouyanni 120/120 Mean 55 y for FIFO, before Highest vs [0.59] p = 0.10 Age, interviewer, Hospital-based et al., 1986, cases onset of dis- lowest (5) years of schooling Response rate Greece ease (120), 92% for cases
interviewed, estimated fre- quency
Iscovich et 150/150 Mean 56 y for FF0, 5 y up to Highest vs Citrus fruit Age, education, Hospital-based and al., 1989, hospital con- cases 6 mo before lowest (4) Hospital controls: NS husband's occupa- population-based Argentina trois, ISO inter-view (147, 0.75 tion, age at first Response rate 98%
neighbour- 13 fruits), inter- Neighbourhood p < 0.05 pregnancy, parity, for cases hood controls viewed, esti- controls: 0.58 obesity index
mated f re- Other than citrus: quericy Hospital controls: p < 0.05
0.55 Neighbourhood pc 0.05 controls: 0.41
Torliolo et 250 (70 pre- <75 y Interviewer- Highest vs 1.1 Age, energy Population-based ai., 1989, menopausal, administered lowest (4) Response rate 91% Italy 180 post- dietary history for cases, 79% for
menopausal)/ (70); estimated controls 499 frequency and
amount
Van't Veer 133/238 25-44, 55-64 y Diet history, Highest vs 0.55 p = 0.35 Age, history of Population-based et al., 1990, 12 no before lowest (4) benign breast Response rate 80% Netherlands diagnosis disease, first and for cases, 53% for
(236), inter- second degree of controls viewed, esti- family history, num- mated frequen- ber of cigarettes cy and amount; smoked daily, validity and education, ever-use reliability of oral contraceptives, assessed age at menarche,
age at first full-term pregnancy, BMI, energy, alcohol
Ingram et 99/209 22-86 y FF0, current Highest vs 0.9 (0.5-1.6) NS Age, residence Population-based al., 1991, intake (179), lowest (2) Response rate 100% Australia self-adminis- for cases
tered
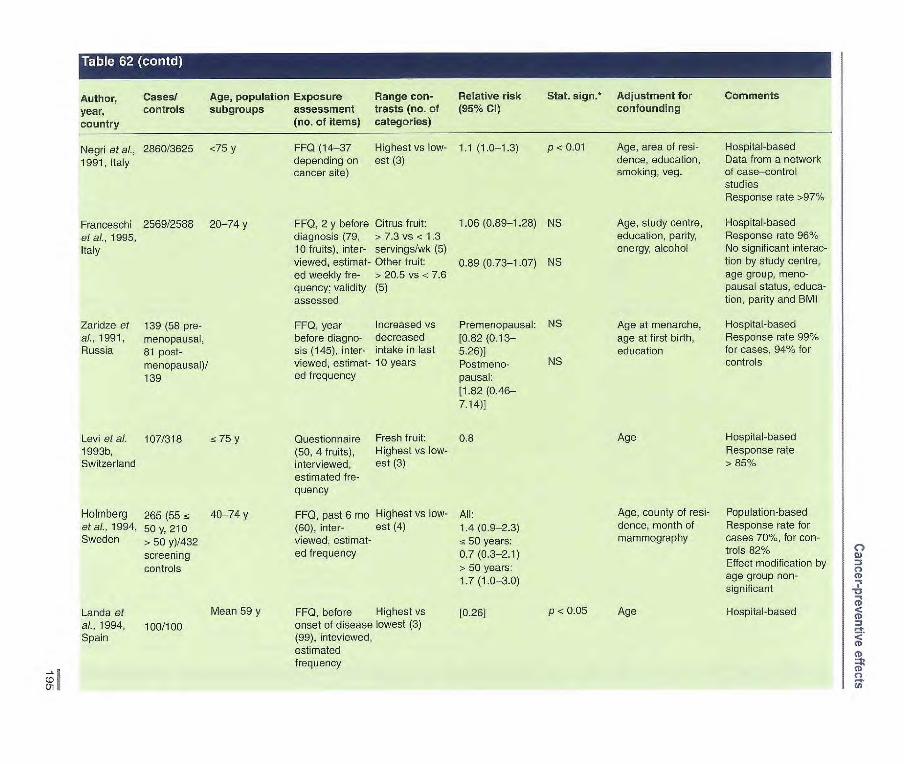
Author, year, country
Cases/ controls
Age, population Exposure subgroups assessment
(no. of items)
Range con- trasts (no. of categories)
Relative risk (95% Cl)
Stat. sign.* Adjustment for confounding
Comments
Negri et al., 2860/3625 <75 y FF0 (14-37 Highest vs low- 1.1 (1.0-1.3) p e 0.01 Age, area of resi- Hospital-based
1991, Italy depending on est (3) dence, education, Data from a network cancer site) smoking, veg. of case—control
studies Response rate >97%
Francesobi 2569/2588 20-74 y FF0, 2 y before Citrus fruit: 1.06 (0.89-1.28) NS Age, study centre, Hospital-based
et al., 1995, diagnosis (79, > 7.3 vs e 1.3 education, parity, Response rate 960/. Italy 10 fruits), inter- servings/wk (5) energy, alcohol No significant interac-
viewed, estimat- Other fruit: 0.89 (0.73-1.07) NS fion by study centre, ed weekly fre- > 20.5 vs e 7.6 age group, meno- quency; validity (5) pausal status, educa- assessed tion, parity and BMI
Zaridze at 139 (58 pre- FF0, year Increased vs Premenopausal: NS Age at menarche, Hospital-based al., 1991, menopausal, before diagno- decreased [0.82 (0.13— age at first birth, Response rate 990%
Russia 81 post- sis (145), inter- intake in last 5.26)] education for cases, 94% for
menopausal)/ viewed, estimat- 10 years Postmeno- NS controls
139 ed frequency pausai: [1.82 (0.46- 7.14)]
Levi et al. 107/318 a 75 y Questionnaire Fresh fruit: 0.8 Age Hospital-based
1993b, (50, 4 fruits), Highest vs low- Response rate Switzerland interviewed, est (3) > 85/
estimated fre- quency
Holmberg 265 (55 fc 40-74 y FF0, past 6 mo Highest vs low- All: Age, county of resi- Population-based et al., 1994, 50 y, 210 (60), inter- est (4) 1.4 (0.9-2.3) dance, month of Response rate for Sweden > 50 y)/432 viewed, estimat- a 50 years: mammography cases 70%, for con-
screening ed frequency 0.7 (0.3-2.1) trois 82%
controls > 50 years: Effect modification by
1.7 (1.0-3.0) age group non- significant
Land a et Mean 59 y FF0, before Highest vs [0.26] P < 0.05 Age Hospital-based al., 1994, 100/100 onset of disease lowest (3) Spain (99), inteviewed,
estimated frequency
C,,
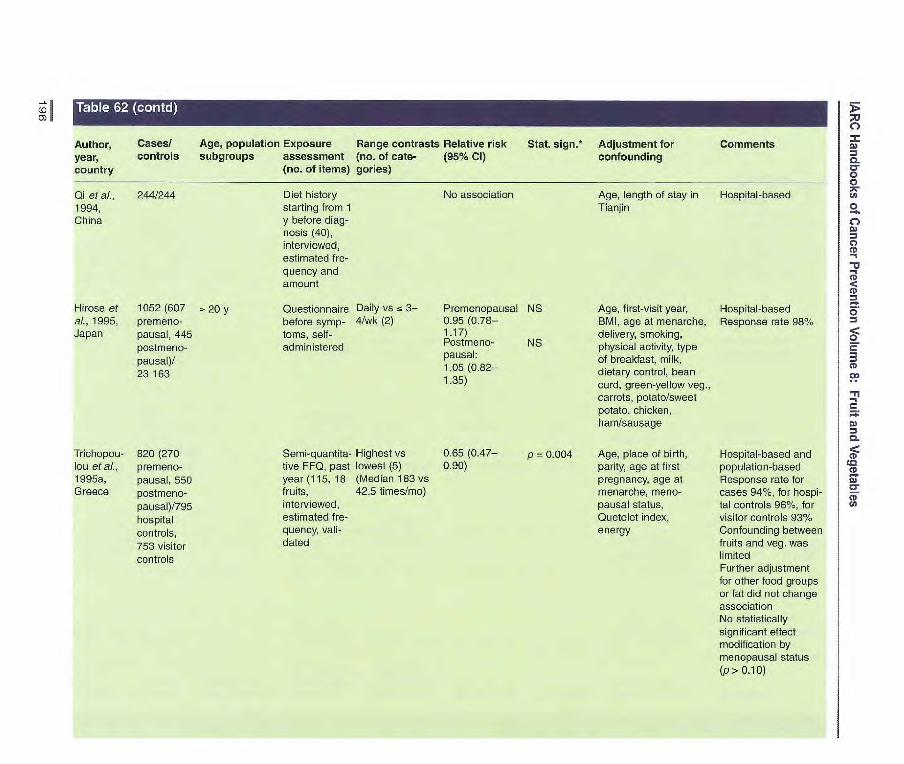
Author, Cases! Age, population Exposure Range contrasts Relative risk Stat. 5jgfl•* Adjustment for Comments year, controls subgroups assessment (no. of cate- (95% Cl) confounding country (no. of items) gories)
Qi et ai., 244/244 Diet history No association Age, length of stay in Hospital-based 1994, starting from 1 Tianjin China y before diag-
nosis (40), interviewed, estimated fre- quency and amount
Hirose et 1052 (607 = 20 y Questionnaire Daily vs 3— Premenopausal NS Age, first-visit year, Hospital-based al., 1995, premeno- before syrnp- 4/wk (2) 095 (0.76— BMI, age at menarche, Response rate 98% Japan pausal, 445 toms, self- 1.17) delivery, smoking,
postmeno- administered Postmeno- NS physical activity, type pausal)/
pausa. of breakfast, milk, 23 163
1.05 dietary control, bean 1.35) curd, green-yellow veg.,
carrots, potato/sweet potato, chicken, ham/sausage
p = 0.004 Trichopou- 820 (270 lou et ai., premeno- 1995a, pausal, 550 Greece postmeno-
pausal)/795 hospital controls, 753 visitor controls
Semi-quantita- Highest vs 0.65(0.47— tive FF0, past lowest (5) 0.90) year (115,18 (Median 183 vs fruits, 42.5 times/mo) interviewed, estimated fre- quency, vali- dated
Age, place of birth parity, age at first pregnancy, age at menarche, meno-pausal status, Quetelet index, energy
Hospital-based and population-based Response rate for cases 94%, for hospi-tal controls 96%, for visitor controls 931%
Confounding between fruits and veg. was limited Further adjustment for other food groups or fat did not change association No statistically significant effect modification by menopausal status (p> 0.10)
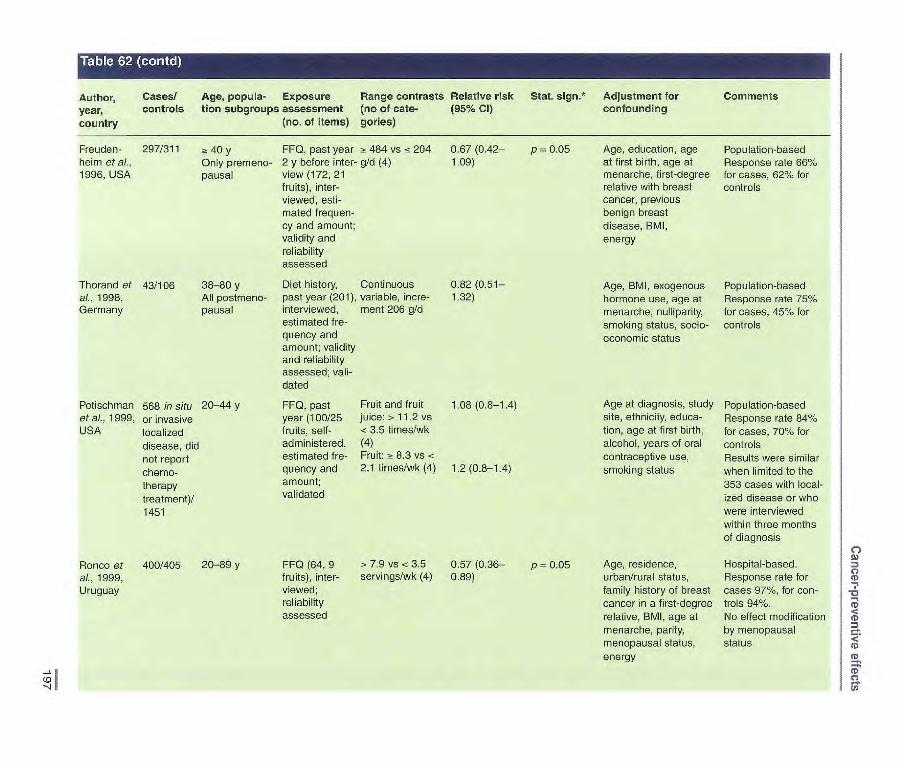
Author, Cases! Age, popula- Exposure Range contrasts Relative risk Stat. sign.* Adjustment for Comments year, controls Lion subgroups assessment (no of caLe- (95% Cl) confounding
country (no. of items) gories)
Freuden- 297/311 a 40 y FF0, past year - 484 vs 204 heim et al., Only premeno- 2 y before inter- gld (4) 1996, USA pausai view (172, 21
fruits), inter- viewed, esti- mated frequen- cy and amount; validity and reliability assessed
Thorand of 43/106 38-80 y Diet history, Continuous al., 1998, All postmeno- past year (201), variable, incre- Germany pausal interviewed, ment 206 g/d
estimated fre- quency and amount; validity and reliability assessed; vali- dated
Potischman 568 in situ 20-44 y FF0, past Fruit and fruit et aI., 1999, or invasive year (100/25 juice:> 11.2 vs USA localized fruits, self- < 3.5 times/wk
disease, did administered, (4)
not report estimated f re- Fruit: a 8.3 vs <
chemo- quency and 2.1 times/wk (4)
therapy amount;
treatment)/ validated
1451
0.67(0.42— p = 0.05 Age, education, age Population-based 1.09) at first birth, age at Response rate 66%
menarche, first-degree for cases, 62% for relative with breast controls cancer, previous benign breast disease, RMI, energy
0,82(0.51— Age, BMI, exogenous Population-based 1.32) hormone use, age at Response rate 75%
menarche, nuiliparity, for cases, 45% for smoking status, socio- controls economic status
1.08 (0.8-1.4) Age at diagnosis, study Population-based site, ethnicity, educa- Response rate 84% tien, age at first birth, for cases, 70% for alcohol, years of oral controls contraceptive use, Results were similar
1.2 (0.8-1.4) smoking status when limited to the 353 cases with local- ized disease or who were interviewed within three months of diagnosis
p 0.05 Age, residence, Hospital-based. urban/rural status, Response rate for family history of breast cases 97%, for con- cancer in a first-degree troIs 94%. relative, BMI, age at No effect modification menarche, parity, by menopausal menopausal status, status energy
Ronco et 400/405 20-89 y al., 1999, Uruguay
FF0 (64, 9 > 7.9 vs <3.5 0.57(0.36— fruits), inter- servings/wk (4) 0.89) viewed; reliability assessed
(0E: -4 t

(0 co
Author, year, country
Cases! Age, population Exposure controls subgroups assessment
(no. of items)
Range contrasts Relative risk (no. of categories) (95% Cl)
Stat. sign.* Adjustment for confounding
Comments
Terry et al. 2832/2650 50-74 y FFQ, past Highest vs 0.96 p = 0.81 Age, height, BMI, Population-based 20010, All postmeno- year (65, 19 lowest (4) (0.79-1.17) current smoking, socle- Response rate for Sweden pausai fruits and economic status, alco- cases 84%, for con-
veg.), self- hol, high-fibre grains troIs 82% administered, and cereals, fatty ftsh, estimated multivitamin use, parity, frequency hormone replacement
therapy, history of benign breast disease, family history of breast cancer, type of menopause, age at menopause, age at menarche, age at first birth
Dos Santos 240/477 <75 y FFQ, 2-3 y 4 vs < 1 0.89 p = 0.45 Age, general practi- Population-based Silva et al., before (108, servings/d (4) (0.50-1.57) tioner, energy, age at Population: women 2002, UK 23 fruits), menarche, age at first of South Asian
interviewed, birth, parous, parity, ethnicity who had estimated f re- breasifeeding, family migrated to England quency and history of breast cancer, Response rate 79% amount menopausal status, for cases, 760% for validrty time since menopause, controls assessed education
*p for trend when applicable

Author, Cases/cohort Age, popula- Exposure Range con- Relative risk Stat. sign.* Adjustment for Comments
year, size (years tion sub- assessment (no. trasts (no. of (95% CI) confounding
country follow-up) groups of items) categories)
Mean 74 y FF0 (59, 21 veg.), > 4.8 vs < 3.2 0.96 self-administered, servings/d (3) (0.69-1.34) estimated fre- quency
40-59 y Diet history (86), > 433 vs 0.86 self-administered, <203 g/d (5) (0.61-123) estimated fre- quency and amount
NS Age, smoking Incidence Retirement community Includes potatoes
p 0.752 Age, age at menarche, Incidence surgical menopause, Nested in the Canadian age at first live birth, Breast Cancer Screening education, family Cohort (56 837 women) history of breast can- No statistically significant cer, history of benign difference by breast disease, and menopausal status other contributors to total food intake
Shibata et 219/11 580 aL, 1992, 9y USA
Rohan et 519/1182 aL, 1993, 6y Canada
Järvinen et 88/4697
~ 15 y Diet history, in Highest vs No association
Age, BMI, parity, Incidence a)., 1997, 25 y
terviewed, lowest (3)
region, occupation, Finland
past year smoking
Verhoeven 519/62 573 55-69 y Semiquanti1ative Highest vs 0.94 p= 0.30 et al., 4.3 y Only post- FF0, past year lowest (5) (0.67-1.31) 1997a, menopausal (150), self-admin- (Median values: Netherlands women istered, estimated 303 vs 108 gfd)
frequency; validity assessed
Zhang et 2697 (784 33-60 y Semi-quantitative > 5.0 vs <2 Premeno- p = 0_10 ai., 1999, premeno- FF0, past year servings/d (5) pausal: 0.64 USA pausal, 1913 (61-126), self- (049-095)
post- administered, esti Postmeno- menopausal)/ mated frequency, pausal: 1.02 p = 0.61 83 234 validity and relia- (0.85-1.24) 15 y bility asssessed Postmeno-
pausal, current HRT user: 0.87(0.63 1.20)
Age, energy, alcohol, Incidence history of benign breast disease, maternal breast cancer, breast cancer in sister(s), age at menarche, age at menopause, age at first birth, parity
Age, length of follow- Incidence up, energy, parity, age Nurses' Health Study at first birth, age at menarche, history of breast cancer in mother or sister, history of benign breast dis- ease, alcohol, BMI at age 18, weight change from age 18, height, age at menopause, HRT use
ZZ
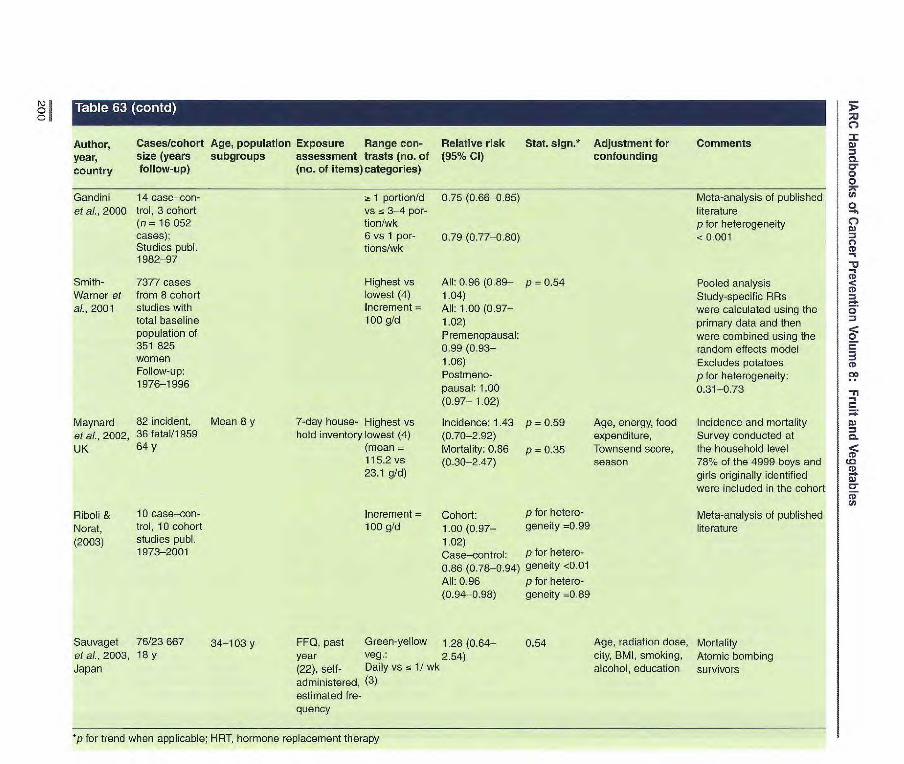
Author, year, country
Cases/cohort Age, population Exposure Range con- size (years subgroups assessment trasts (no. of follow-up) (no. of items) categories)
Relative risk (95% CI)
Stat. sign.* Adjustment for confounding
Comments
Gandini 14 case—con- ~t 1 portion/d 0.75 (0.66-085) Mete-analysis of published et al. 2000 trol, 3 cohort vs 3-4 por- literature
(n = 16 052 tion/wk pfor heterogeneity cases); 6 vs 1 por- 0.79 (0.77-0.80) <0.001 Studies pub]. tions/wk 1982-97
Smith- 7377 cases Highest vs All: 0.96 (0.89— p 0.54 Pooled analysis Warner et from 8 cohort lowest (4) 1.04) Study-specific RRs aL, 2001 studies with Increment = All: 1.00 (0.97— were calculated using the
total baseline 100 g/d 1.02) primary data and then population of Premenopausal: were combined using the 351 825 0.99 (0.93— random effects model women 1.06) Excludes potatoes Follow-up: Postmeno- p for heterogeneity: 1976-1996 pausal: 1.00 0.31-0.73
(0.97— 1.02)
Maynard 82 incident, Mean 8 y 7-day house- Highest vs Incidence: 1.43 p = 0.59 Age, energy, food Incidence and mortality et aL. 2002, 36 fatal/i 959 hold inventory lowest (4) (0.70-2.92) expenditure, Survey conducted at UK 64 y (mean Mortality: 0.86 p = 0.35 Townsend score, the household level
115.2 vs (0.30-2.47) season 78% of the 4999 boys and 23.1 g/d) girls originally identified
were included in the cohort
Fliboui & 10 case—con- Increment = Cohort: pfor hetero- Meta-analysis of published Norat, trol, 10 cohort 100 g/d 1.00(0.97— geneity 0.99 literature (2003) studies publ. 1.02)
1973-2001 Case—control: pfor hetero-
0.86 (0.78-0.94) geneity <0.01
All: 0.96 p for hetero- (0.94-0.98) geneity =0.89
Sauvaget 76/23667 34-103 y FF0, past Green-yellow 1.28 (0.64— 0.54 Age, radiation dose, Mortality etal., 2003, 18 y year Veg. 2.54) city, BMI, smoking, Atomic bombing Japan (22), self- Daily vs 1/ wk alcohol, education survivors
administered, (3) estimated fre- quency
*p for trend when applicable; HRT, hormone replacement therapy

Iscovich et 150/150 Mean 56 y for FF0, 5 y up to Green leafy Hospital con- p < 0.05 Age, education, Hospital-based and popula- al., 1989, hospital con- cases 6 mo before veg.: trois: 0.32 husband's occupa- lion-based Argentina troIs, 150 neigh- interview (147, Highest vs Neighbour- p <0.05 tion, age at first Response rate 98% for
bourhood con- 12 veg., lowest (4) hood controls: pregnancy, parity, cases trois excluding pota- 0.15 obesity index In multivariate analyses con-
toes, 4 puises), All green veg.: Hospital con- p < 0.05 trolling for other food groups, interviewed, Highest vs trois: 0.52 the association estimated f re- lowest (4) Neighbour- P < 0.05 with green vegetables quency hood controls: remained
0.40
Tonolo et 250 (70 pre- < 75 y Diet history Highest vs 1.2 Age, energy Population-based al., 1989, menopausal, (70), inter- lowest (4) Response rate for cases Italy 180 postmeno- viewed, 91%, for controls 790%
pausai)/499 estimated fre- quency and amount
Ewertz & 1474/1322 < 70 y Semi-quantita- 7 vs < 2 (7) [1.05 Age, residence Population-based Gill, 1990, live FF0, year times/wk (0.76-1.47)] Response rate for cases Denmark before diagno- 88%, for controls 79%
sis (21), esti- Questionnaire completed mated f ra- one year after diagnosis quency and amount; inclu- ded summary question on veg.
N) o
Author, Cases/controls Age, population Exposure Range con- Relative risk Stat. sign.* Adjustment for Comments year, subgroups assessment trasts (no of (95% Cl) confounding country (no. of items) categories)
Zemla, 328 (214 native l7-79y 1984, upper Silesians, Poland 114 migrants)!
585
Katsouyanni 120/120 Mean 55 y for et al., 1986, cases Greece
Questionnaire Raw veg. Upper (5), interviewed Rather Silesians 0_73
regular vs Migrants 1.57 none (3)
FF0, before Highest vs 0.09 p < 0.001 onset of dis- lowest (5) (0.03-0.30) ease (120), interviewed, estimated fre- quency
Population-based, hospital visitor controls Response rate for cases 98%
Age, interviewer, Hospital-based years of schooling, Response rate for cases parity, age at first 92% birth, marital status, No interaction with age, menopausal status, years of schooling, age at menopause, menopausal status age at menarche, place of residence
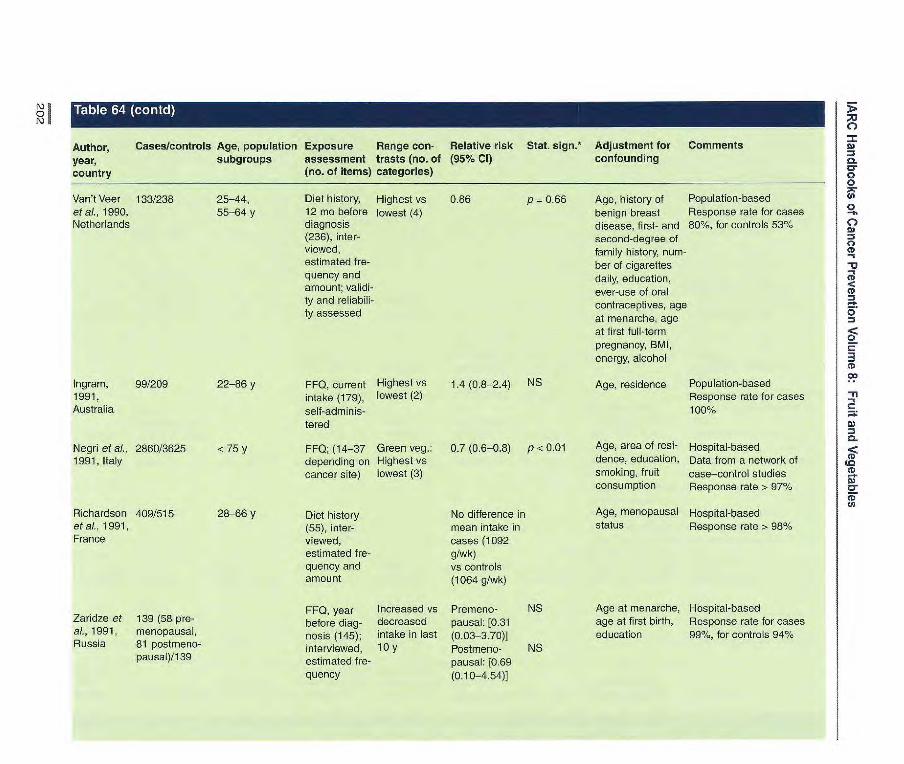
Age, history of Population-based
benign breast Response rate for cases disease, first- and 80%, for controls 53% second-degree of family history, num- ber of cigarettes daily, education, ever-use of oral contraceptives, age at menarche, age at first full-term pregnancy, BMI, energy, alcohol
Age, residence Population-based Response rate for cases 100%
Age, area of resi- Hospital-based dence, education, Data from a network of smoking, fruit case—control studies consumption Response rate > 97%
Age, menopausal Hospital-based status Response rate > 980/.
Author, Cases/controls Age, population Exposure Range con- Relative risk Stat. sign.* Adjustment for Comments
year, subgroups assessment trasts (no. of (95% Cl) confounding
country (no. of items) categories)
Van't Veer 133/238 25-44, Diet history, Highest vs 0.86 p 0.66 et al., 1990, 55-64 y 12 no before lowest (4) Netherlands diagnosis
(236), inter- viewed, estimated fre- quency and amount; validi- ty and reliabili- ty assessed
Ingram, 99/209 22-86 y FF0, current Highest vs 1.4 (0.8-2.4) NS 1991, intake (179), lowest (2) Australia self-adminis-
tered
Negri et a[., 2860/3625 <75 y FFQ; (14-37 Green veg.: 0.7 (0.6-0.8) p < 0.01 1991, Italy depending on Highest vs
cancer site) lowest (3)
Richardson 409/515 28-66 y Diet history No difference in etal., 1991, (55), inter- mean intake in France viewed, cases (1092
estimated f re- g/wk) quency and vs controls amount (1064 g/wk)
FF0, year Increased vs Premeno- NS Zaridze et 139 (58 pro- before diag- decreased pausai: f031 al., 1991, menopausal, nods (145); intake in last (0.03-3.70)] Russia 81 postmeno- interviewed, 10 y Postmeno- NS
pausal)/139 estimated f re- pausai: (0.69 quency (0.10-4.54)]
Age at menarche, Hospital-based age at first birth, Response rate for cases education 99%, for controls 94%
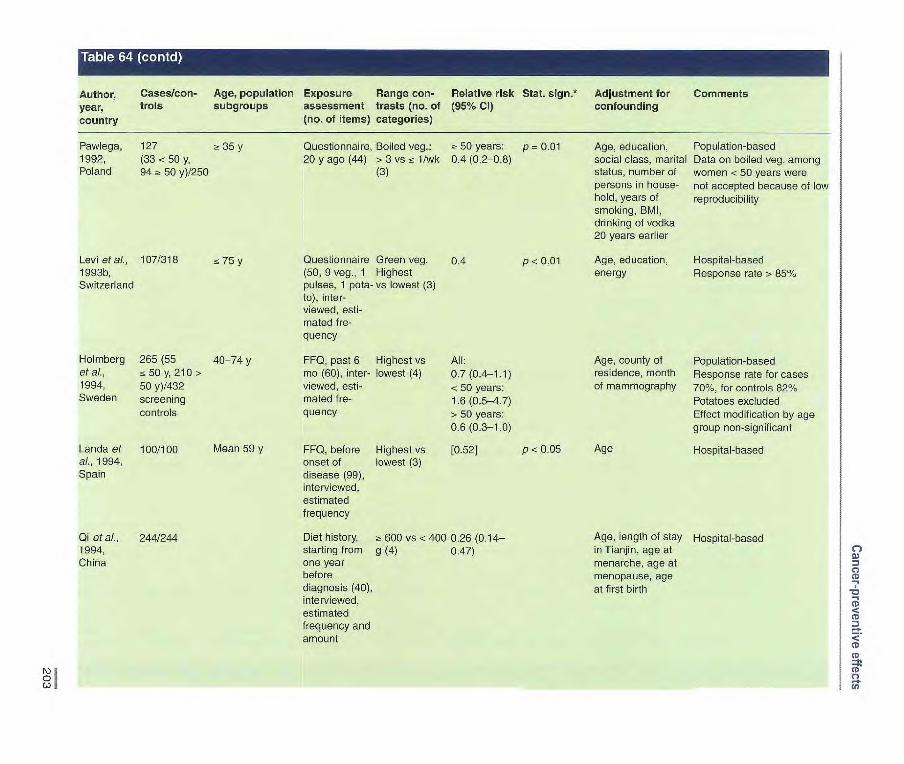
Pawlega, 127 35y 1992, (33<50y, Poland 94 a 50 y)/250
Levi et al., 107/318 75 y 1993b, Switzerland
Holmberg 265 (55 40-74 y etal., z5Oy,210> 1994, 50 y)/432 Sweden screening
controls
Landaet 100/100
Mean 59 y al., 1994, Spain
Author, Cases/con- Age, population Exposure Range con- Relative risk Stat. sign.* Adjustment for Comments year, trois subgroups assessment trasts (no. of (95% Cl) confounding country (no. of items) categories)
Qi etal., 244/244 1994, China
Questionnaire, Boiled veg.: a 50 years: p 0.01 20 y ago (44) > 3 vs 1/wk 0.4 (0.2-08)
(3)
Questionnaire Green veg. 0.4
P < 0.01 (50, 9 veg., 1 Highest pulses, 1 pota- vs lowest (3) to), inter- viewed, esti-mated fre-quency
FF0, past 6 Highest vs All: mo (60), inter- lowest (4) 0.7 (0.4-1.1) viewed, esti- <50 years: mated fre- 1.6 (0.5-4.7) quency > 50 years:
0.6 (0.3-1.0)
FF0, before Highest vs 0.52]
P < 0.05 onset of lowest (3) disease (99), interviewed, estimated frequency
Diet history, a 600 vs < 400 0.26 (0.14— starting from g (4) 0.47) one year before diagnosis (40), interviewed, estimated frequency and amount
Age, education, Population-based social class, marital Data on boiled veg. among status, number of women <50 years were persons in house- not accepted because of low hold, years of reproducibility smoking, BMI, drinking of vodka 20 years earlier
Age, education, Hospital-based energy Response rate > 85%
Age, county of Population-based residence, month Response rate for cases of mammography 70%, for controls 82%
Potatoes excluded Effect modification by age group non-significant
Age Hospital-based
Age, length of stay Hospital-based in Tianjin, age at menarche, age at menopause, age at first birth

Author, Cases/con- Age, population Exposure Range con- Relative risk Stat. sign.* Adjustment for Comments
year, trois subgroups assessment trasts (no. of (95% Cl) confounding
country (no. of items) categories)
Franceschi 2569/2588 20-74 y FF0, 2 y before Raw veg.: 0.73 p < 0.01 Age, study Hospital-based et al., 1995, diagnosis (79, > 12.5 vs < (0.60-0.88) centre, educa- Response rate 96% Italy 11 veg., 2 pota- 4.9 servings/ tion, parity, Cooked vegetable group
toes), inter- wk energy, alcohol includes pulses viewed, estimat- (5) ed weekly fre- Cooked veg:> 0.96 quency; validity 7.5 vs <3.1 (0.79-1.16) assessed servings/wk
(5)
Hirose of 1052 (607 > 20 y Questionnaire Raw veg. Premeno- NS Age, first-visit Hospital-based
ai., 1995, premerio- before symp- Daily vs a pausai: 1.00 year Response rate 98%
Japan pausai, 445 torils, self- 3-4/wk (2) (0.85-19)
postmeno- administered Postmeno- NS
pausai)! pausai: 0.99
23 163 (0.81-1.20)
Tricho- 820, (270 pro- Semi-quantita- Highest vs low- 0.54 p = 0.0001 Age, place of Hospital and population-based pouiou et menopausal, tive FF0, past est (5) (0.40-0.74) birth, parity, age Response rate for cases 94%, al., 1995a, 550 post year (115, 26 (median 142 at first pregnancy, for hospital controls 96%, for Greece menopausal)! veg., 1 potato, vs 47 age at menarche, visitor controls 93%.
795 hospital 5 puises), inter- times/mo) menopausal Confounding between fruit and
controls, 753 viewed, estimat- status, Queteiet veg. was limited. Potatoes
visitor ed frequency; index, energy excluded.
controls validated Further adjustment for other food groups or fat did not change association. No statistically significant effect modification by menopausal status (p>0.10).
Freuden- 297/311 40 y, only pre- FF0, past year a 523 vs :5 0.46 p < 0.001 Age, education, Population-based. Response heim et ai., menopausal 2 y before inter- 276 g/d (4) (0.28-0.74) age at first birth, rate 66% for cases, 62% for 1996, USA view (172, 31 age at menarche, controls. Potatoes excluded.
veg.), inter- first-degree reia Association attenuated after viewed, tive with breast further adjustment for jI-caro- estimated f re- cancer, previous tene (RR = 0.84, 0.43-1.63) quency and benign breast and lute in/zeaxanthin (FIR = amount; validity disease, BMi, 0.76, 0.41-1.44). No change and reliability energy in vegetable estimate after assessed adjusting for vitamin C,
ri -tocopherol, folic acid, dietary fibre or c-carotene

Author, Cases/con- Age, population Exposure Range con- Relative risk Stat. sign.* Adjustment for Comments year, trois subgroups assessment trasts (no. of (95% Cl) confounding country (no. of items) categories)
Thorand et 43/106 38-80 y, all post- Diet history, Continuous at., 1998, menopausal past year (201), variable, Germany interviewed, increment
estimated f re- 260 g/d quency and amount; validity and reliability assessed
Potischman 568 in situ or 20-44 y FF0, past year s 18.2 vs < et al., 1999, invasive local- (100, 34 veg.), 8.4 times/wk USA ized disease, self-adminis- (4)
did not report tered, estimated
chemotherapy frequency and
treatment/1 451 amount, validated
0.86 Age, BMI, exo- Population-based (0.51-1.46) genous hormone Response rate 75% for cases,
use, age at 45% for controls. Potatoes menarche, nulli- excluded. Similar finding when parity, smoking, potatoes are included status, socioeco- nomic status
0.86 (0.6-1.1) Age at diagnosis, Population-based study site, Response rate 84% for ethnicity, educa- cases, 70% for controls tion, age at first Vegetable group included birth, alcohol, potatoes, olives, avocado, years of oral garlic. Results not changed contraceptive after further adjustment for use, smoking cereals and grains. Results status similar when limited to the
353 cases with localized disease or who were inter- viewed within three months of diagnosis
Age, residence, Hospital-based urban/rural Response rate for cases 97%, status, family for controls 941%
history of breast Vegetable group includes canner in a first- garlic and legumes, excludes degree relative, potatoes. No effect modification BMI, age at by menopausal status. menarche, RR remained significant parity, meno- after further adjustment for pausai status, other nutrient but became energy non-significant after further
adjustment for lycopene
Ronco et 400/405 al., 1999, Uruguay
20-89 y FF0 (64, 15 s 16.3 vs< 9 0.41 p = 0.004 veg.), inter- servings/wk (0.26-0.65) viewed, (4) reliability assessed
ç)
CD -I
-9 CD
CD
CD
(D
CD C,
ZZ

C-)
Author, Cases/con- year, trois country
Ago, population Exposure subgroups assessment
(no. of items)
Range con- trasts (no of categories)
Relative risk Stat. sign.*
(95% Cl) Adjustment for confounding
Comments
Tavani et 579/668 22-39 y FF0 (78); esti- Raw veg.: 0.57 Study centre, Hospital-based
al., 1999, mated weekly > 8 servings! (0.33o.98) year of recruit- Subset of studies by
Italy frequency; vali- wk vs less (2) ment, age, Franceschi et al., 1995, Negri
dated education, BMI. etal., 1991 family history of Response rate generally breast cancer, > 96% parity, age at first btrth
Dos Santos 240/477 <75 y FF0, 2-3 y Veg. dishes: 0.48 p 0.005 Age, general Population-based
Silva et al., before (108, 40 ~r 4 vs z5 I g/d (0.27-0.85) practitioner, Population: women of South
2002, UK veg., 21 pulses, (4) energy, age at Asian ethnicity who had
lentils, dhals), menarche, age migrated to England
interviewed, at first birth, Response rate for cases 79%,
estimated t re- parous, parity, for controls 76%
quency and breast feeding, Risk was attenuated after
amount; validity family history of further adjustment for type of
assessed breast cancer, diet or neat consumption menopausal status, time since menopause, education
*p for trend when applicable

Author, Cases/cohort Age, population Exposure Range con- Relative risk Stat. sign.* Adjustment for Comments year, size (years subgroups assessment trasts (no. of (95% Cl) confounding country follow-up) (no. of items) categories)
Shibata et 219/11 580 Mean 74 y FF0 (59, 23 a 8.3 vs 0.87 (0.63-1.21) NS Age, smoking Incidence ai., 1992, 9 y fruits, 21 <59 serv- Retirement community USA veg.), self- ings/d (3) Veg. group includes
administered, potatoes estimated fre- quency
Byrne etal. 53/6156 32-86 y FF0 (93), > 3 vs e 3 0.7 (0.4-1.5) Age Incidence 1998, USA 4 y interviewed; Servings/d
estimated f re- (2)
quency
Zhang e! 2697 (784 33-60 y Semi-quanti- 5.0 vs <2 Premenopausal: Age, length of Incidence al. 1999, premeno- tative. FFQ, servings/d 0.77 (0.58-1.02) p 0.05 follow-up, energy Nurses' Health Study USA pausal, 1913 past year (5) Prernenopsu- intake, parity, age
postmeno- (61-126), sal and positive at first birth, age pausal)/ 83 234 self-adminis- family history: at menarche, 15 y tered, estimat- 0.29 (0.13-0.62) p 0.003 history of breast
ed frequency; Premenopausal cancer in mother or validity and and drink a 15 sister, history reliability g/d of alcohol: of benign breast assessed
053 (0.27-1.04) p = 0.007 disease, alcohol,
Postmenopausal: BMI at age 18,
1.03 (0.81-1.31) p 0.73 weight change
Postmeno- from age 18,
pausal and cur- height, age at rent HRT user:
0.86 (0.54-1.39) menopause, HRT use
Smith- 71377 cases Highest vs All: Pooled analysis Warner et from S cohort lowest (4) 0.93 (086-1.00) p = 0.12 Study-specific RRs were al., 2001 studies with Increment = All: calculated using the primary
total baseline 100 g/d 0.89 (0.98-1.00) data and then were corn- population of Premenopausal: bined using the random 351 825 0.99 (0.96-1.02) effects model women Postmenopausal: Veg. group excludes potatoes Follow-up: 1.00 (0.98-1.01) p for heterogeneity 0.78-0.99 1976-96
p for trend when applicable. HRT, hormone replacement therapy (n
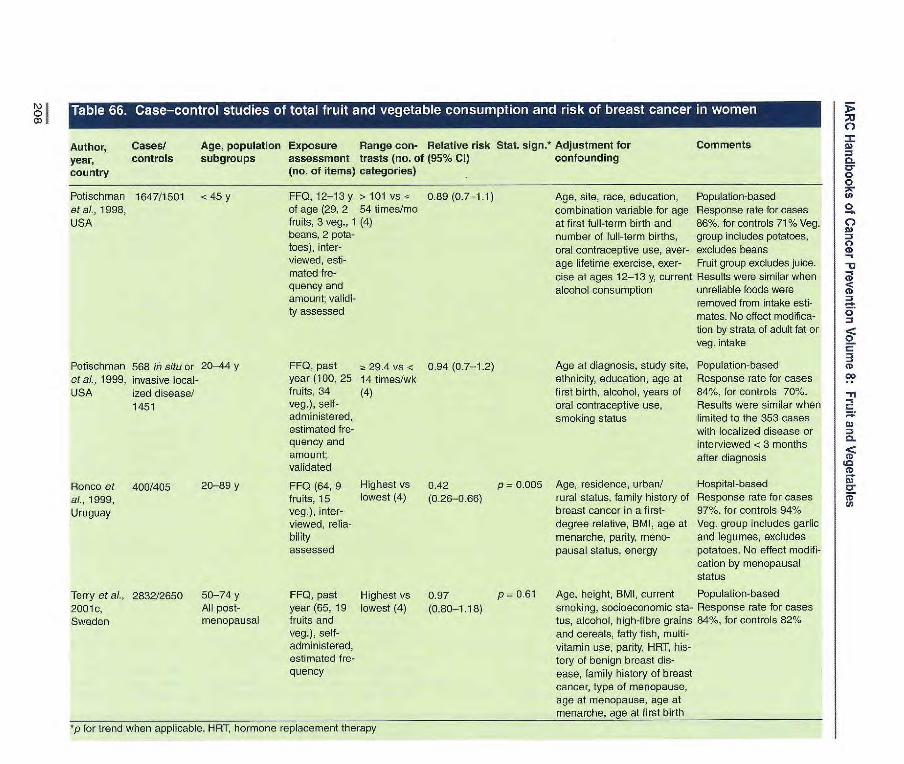
Author, Cases! Age, population Exposure Range con- Relative risk Stat. sign.* Adjustment for Comments
year, controls subgroups assessment trasts (no. of (95% Cl) confounding country (no. of items) categories)
0.89 (0.7-1.1) Age, site, race, education, Population-based combination variable for age Response rate for cases at first full-term birth and 86%, for controls 71% Veg. number of full-term births, group includes potatoes, oral contraceptive use, aver- excludes beans age lifetime exercise, exer- Fruit group excludes juice. cise at ages 12-13 y, current Results were similar when alcohol consumption unreliable foods were
removed from intake esti- mates. No effect modifica- tion by strata of adult fat or veg. intake
Potischman 1647/1501 <45 y et al,, 1998, USA
FF0, 12-13 y > 101 vs < of age (29, 2 54 times/mo fruits, 3 veg., 1 (4) beans, 2 pota- toes), inter- viewed, esti- mated fre- quency and amount; validi- ty assessed
Potisch man 568 in situ or 20-44 y et ai., 1999, invasive local- USA ized disease!
1451
Ronco et 400/405 20-89 y at, 1999, Uruguay
FF0, past year (100, 25 fruits, 34 veg.), self-administered, estimated fre-quency and amount; validated
FF0 (64, 9 fruits, 15 veg.), inter-viewed, relia-bility assessed
Age at diagnosis, study site, ethnicity, education, age at first birth, alcohol, years of oral contraceptive use, smoking status
Age, residence, urban/ rural status, family history of breast cancer in a f irat-degree relative, BMI, age at menarche, parity, meno-pausal status, energy
Populatiombased Response rate for cases 84%, for controls 70%. Results were similar when limited to the 353 cases with localized disease or interviewed <3 months after diagnosis
Hospital-based Response rate for cases 97%, for controls 94% Veg. group includes garlic and legumes, excludes potatoes. No affect modifi-cation by menopausal status
a 29.4 vs < 0.94 (0.7-1.2) 14 times/wk (4)
Highest vs 0.42 p = 0.005 lowest (4) (0.26-0.66)
Terry et ai., 2832/2650 50-74 y FF0, past Highest vs 0.97 p = 0.61 2001e, All post- year (65, 19 lowest (4) (0.80-1.18) Sweden menopausal fruits and
veg.), self-administered, estimated fre-quency
*p for trend when applicable. HRT, hormone replacement therapy
Age, height, BMI, current Population-based smoking, socioeconomic sta- Response rate for cases tus, alcohol, high-fibre grains 84%, for controls 82% and cereals, fatty fish, multi- vitamin use, parity, HRT, his- tory of benign breast dis- ease, family history of breast cancer, type of menopause, age at menopause, age at menarche, aqe at first birth

Cancer-preventive effects
Author, year, Cases/ Exposure Range Relative Stat. sign.* Adjustment Comments country controls assessment contrasts risk for confounding
(no. of items) (no. of (95% Cl) categories)
Hsing et al., 178/512 Questionnaire, Fruit: All respon- Age at death, Mortality for 1998b, USA adult life (5), 7 vs < 1/wk dents: socioeconomic cases and con-
estimated (4) 0.8 (0.4-1.3) status trois frequency Veg.: 2! 7 VS < Spouse Questionnaire
1/wk (4) respondents: completed by 0.5 (0.2-1.2) next of kin All respon- de ris: 0.5 (0.2-1.7) Spouse respondents: 0.3 (0.03-42)
Rosenblatt etal., 220/291 FFQ (125), Citrus fruit: 1.7(1.0-2.8) p=0.032 Age, study site, Population- 1999, USA self-adminis- Highest vs energy based
tered lowest (4) Response rate Other fruit: 1.1 (0.7-1.9) P= 0.85 for cases 75%, Highest vs for controls 45% lowest (4) Green veg.: 1.0(0.5-1.7) p=0.44 Highest vs low- est (4) Yellow veg.: 0.8(0.4-1.3) p- 0.35 Highest vs lowest (4)
Johnson et al., 81/1905 FF0 (60), self- Fruit and juice: 2.26 p= 0.02 Age, marriage Population- 2002, Canada administered ~!: 26 vs < 99 (1.18-4.52) status, coffee based
servings/wk (4) consumption, Response rate Fruit: 1.15 p = 0.4 physical for cases 68%,
14.5 VS <4.4 (0.622.13) activity, BM for controls 65% servings/wk (4) Veg.: a 24 vs -z 0.70 p = 0.33 13 servings/wk (0.38-1.30) (4) Veg. and veg. 0.75 p 0.41 juice: (0.40-1.40)
25 vs <13.4 servings/wk (4)
p for trend when applicable
209

IARC Handbooks of Cancer Prevention Volume 8: Fruit and Vegetables
Author, year, Cases/controls Exposure Range Relative Stat. sign.* Adjustment Comments country assessment contrasts risk for confounding
(no. of items) (no. of (95% CI) categories)
Verreault et ai., 189/227 FF0, (66) ? 10.7 vs s 1.3 p = 0.68 Age, education, Population-based 1989, USA average f ra- 3.4 servings!- (0.6-2.5) smoking, frequen- Response for
quency of use, wk (4) cy of Pap smears, cases 72%, for eli- assumed stan- oral and barrier gible controls 69%
dard portion contraceptive use, Interviews 2.8
size, interviewed age at first inter- years after diagno- by telephone course, number of sis for cases
sexual partners, history of cervico- vaginal infection
Ziegler etal., 271/502 FF0 (75, 15 s 19 vs s 7.3 p = 0.26 Matched on age, Population-based 1990, USA fruits and fruit servings/wk [0.74] race and tale- Response for
juices), inter- (4) phone exchange. cases 73%, for
viewed, open- Adjusted for num- eligible controls ended frequen- ber of sexual part- 74% cy categories ners, age at first
intercourse, ciga- rettes per day, oral contraceptive use duration, history of non-specific geni- tal infection, years since last Pap smear, age, study centre
Herrero et at, 748/1411 FF0 (58, 15 ~ ii 9 vs <43 0.86 p = 0.44 Age, study site, Hospital-based in 1991, four Latin fruits), inter- servings/mo (0.6-1.2) age at first inter- two countries, American viewed, f re- (4) course, number of hospital and corn- countries quency only, sexual partners, munity-based in
assumed number of preg- other two coun- average portion nancies, presence tries size of HPV 16/18, Response for
time since last cases 99.1%, for Pap smear, num- controls 95.8% ber of household Controls with no facilities as mea- sexual history sure of household excluded from sociO-economic analysis status
Cuzick et aI., 121/241 Diet assess- s 8 vs 0 0.67 p = 0.33 Number of part- Hospital-based 1996, UK ment tool not pieces/wk (4) (0.19_2.35) ners and age at
clear, interviewed first intercourse
Hirose et aI., 556/26751 Questionnaire Daily vs 0.70 p < 0.01 Age and first visit Hospital-based 1996, Japan on frequency s 3-4 serv- (0.59-0.83) year 98% of first-visit
of intake ings/wk (2) patients completed questionnaire
p for trend when applicable
210
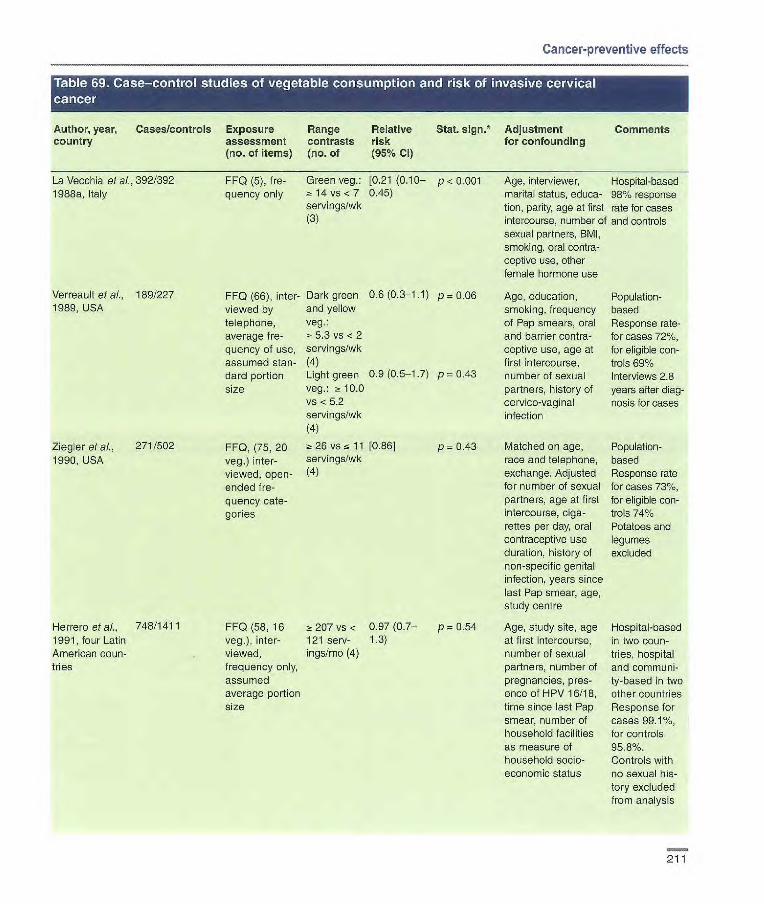
Cancer-preventive effects
Author, year, Cases/controls country
Ltil!iA1[F1ji1JJ
Exposure Range assessment contrasts (no. of items) (no. of
'i ano mjii •1l
Relative Stat. sign.* risk (95% CI)
Adjustment for confounding
Comments
La Vecchia et ai., 392/392 FF0 (5), fro- Green veg.: [0.21 (0.10— p -n 0.001 Age. interviewer, Hospital-based 1988a, Italy quency only 14 vs < 7 0.45) marital status, educe- 98% response
,servings/wk tion, parity, age at first rate for cases (3) intercourse, number cf and controls
sexual partners, BMI, smoking, oral contra- ceptive use, other female hormone use
Verreault et a/, 189/227 FF0 (66), inter- Dark green 0.6(0.3-1.1) p=0.06 Age, education, Population- 1989, USA viewed by and yellow smoking, frequency based
telephone, veg.: of Pap smears, oral Response rate- average f re- - 5.3 vs < 2 and barrier contra- for cases 72%, quency of use, servings/wk ceptive use, age at for eligible con- assumed stan- (4) first intercourse, troIs 69% dard portion Light green 0.9 (0.5-1.7) p = 0.43 number of sexual Interviews 2.8 size veg.: 2! 10.0 partners, history of years after diag-
vs n 5.2 cervico-vaginal nosis for cases servings/wk infection (4)
Ziegler et al., 271/502 FF0, (75, 20 26 vs 11 [0.86] p 0.43 Matched on age, Population- 1990, USA veg.) inter- servings/wk race and telephone, based
viewed, open- (4) exchange. Adjusted Response rate ended f re- for number of sexual for cases 73%, quency cate- partners, age at first for eligible con- genes intercourse, Giga- trois 74%
rettes per day, oral Potatoes and contraceptive use legumes duration, history of excluded non-specific genital infection, years since last Pap smear, age, study centre
Herrero et al., 748/1411 FF0 (58, 16 a 207 vs < 0.97(0.7— p = 0.54 Age, study site, age Hospital-based 1991, four Latin veg.) inter- 121 serv- 1.3) at first intercourse, in two coon- American noun- viewed, ings/rno (4) number cf sexual tries, hospital tries frequency only, partners, number of and communi-
assumed pregnancies, pres- ty-based in two average portion ence of HPV 16/18, other countries size time since last Pap Response for
smear, number of cases 99.1%, household facilities for controls as measure of 95.8%. household socto- Controls with economic Status no sexual his-
tory excluded from analysis
211

IARC Handbooks of Cancer Prevention Volume 8: Fruit and Vegetables
Author, year, Cases/controls Exposure Range Relative Stat. sign. Adjustment Comments country assessment contrasts risk for confounding
(no. of items) (no. of (95% Cl) categories)
Cuzick etal., 121/241 Diet assess- 7 vs _~ 2 Leafy veg.: p = 011 Number of partners, Hospital-based 1996, UK ment tool not servings/wk 0.59 age at first inter-
clear, inter- (3) (0.24-1.48) course
viewed Other veg.: p = 0.39 0.67 (0.23-1.96)
Hirose et ai., 556/26751 Questionnaire Raw veg.: 0.88 NS Age and first-visit Hospital-based 1996, Japan on frequency of Daily vs (0.74-1.04) year 98% of first visit
intake 3-4 SV patients com- ings/wk (2) pleted question- Green veg.: 0.56 p < 0.01 naire ~t 5 vs 2 (0.45-0.71) servings/wk (3)
p for trend when applicable
Author, year, Cases/controls Exposure Range Relative country assessment contrasts risk
(no. of items) (no. of (95% Cl) categories)
Ziegler etal., 271/502 FFQ (75, 15 ? 44 vs 21 [0.90] 1990, USA fruits and fruit servings/wk
juices, 20 (4)
veg.), inter- viewed, open- ended frequency categories
Rajkumar et 205/213 FFQ (21), ;~ 7 vs <6 0.48 p = 0.04 al., 2003a, India interviewed servings/wk (0.24-0.98)
(3)
*p for trend when applicable
p = 0.34 Matched on age, Population- race and telephone based exchange. Adjusted Response rate for number of sexual for cases 73%, partners, age at first for eligible con- intercourse, cigarettes trois 74% per day, oral contra- ceptive use duration, history of non-specific genital infection, years since last Pap smear, age, study centre
Age, residence, Hospital-based occupation, marital Little difference status, age at first when only HPV- marriage, number of positive controls pregnancies, hus- were band's extramarital considered affairs, BMI, chewing habits
Stat. sign." Adjustment Comments for confounding
212

Cancer-preventive effects
Author, year, Cases/controls Exposure Range Relative Stat. sign.* Adjustment Comments country assessment contrasts risk for confounding
(no. of items) (rio. of (95% Cl)
Ziegler et al., 229/502 FF0, (75, 15 Fruit: [0.61] p = 0.09 Matched on age, Population- 1991, USA fruit and fruit ~t 19 vs :5 7.3 race and telephone based
juice, 20 veg.), servings/wk exchange. Adjusted Limited to non- interviewed, (4) for number of sexual Hispanic whites open-ended Veg.: 25 [0.921 p = 0.48 partners, duration of Response for frequency VS 1 1 cigarette use, oral cases 78%, for categories servings/wk contraceptive use eligible controls
(4) Fruit and [0.74] p 0.43
duration, history of 74% non-specific genital
veg.: 2: 44 infection, years since
servings/wk last Pap smear,
vs 21 (4) years of education, age, study centre
p for trend when applicable
Table i .i71 study ofI (Tllconsumption a il. 1risk of cervical dysplasi
Author, year, Cases/controls Exposure Range Relative Stat. sign.* Adjustment Comments country assessment contrasts risk for confounding
(no. of items) (no. of (95% Cl) categories)
De Vet et al., 257/705 FF0 self- 3 vs 0 0.29 p 0.06 Demographic Population- 1991, administered, servings/d (0.13-0.63) characteristics, based Netherlands frequency of (4) season when ques- Cases were
consumption tionnaire completed, participants in and small, marital status, a multi-centre medium or large education, smoking, trial; controls portion size parity, oral contra- were drawn
ceptive use, ago at from population first sexual inter- registries course, frequency Response rate of intercourse, num- for cases 85%, ber of sexual part- for controls ners, frequency of 67% Pap smears, con- sumption of other food groups
p for trend when applicable
213
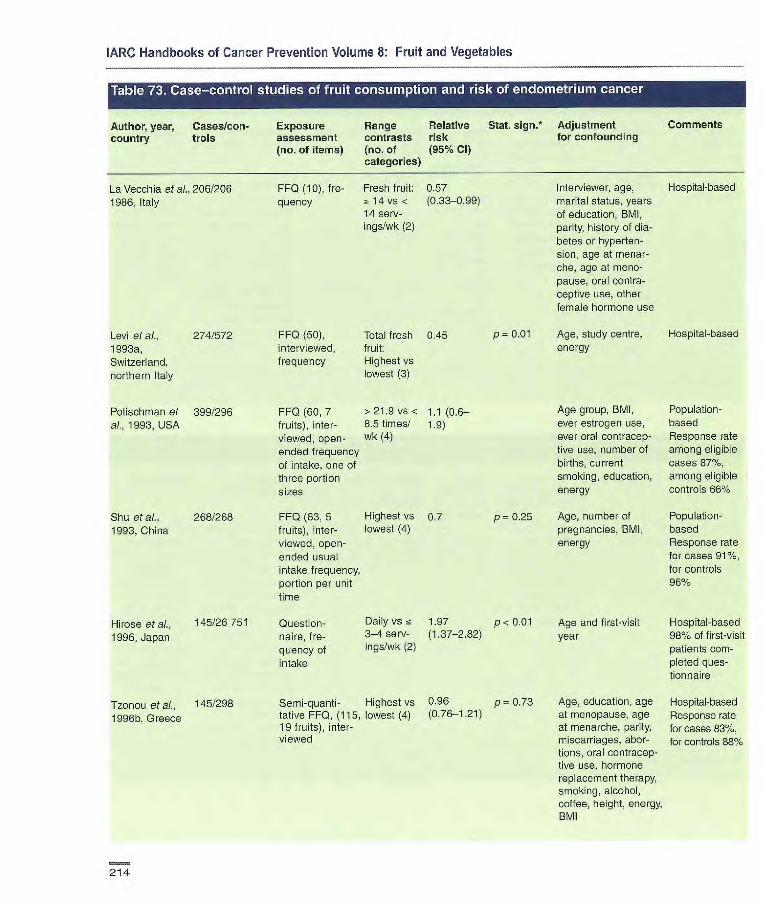
Age group, BMI, Population- ever estrogen use, based ever oral oontracep- Response rate five use, number of among eligible births, current oases 87%, smoking, education, among eligible energy controls 66%
Age, number of Population- pregnancies, SMI, based energy Response rate
for cases 91%, for controls 96%
p = 0.25
Hirose et ai., 145/26751
1996, Japan Question- Daily vs nz 1.97 p < 0_01
flaire, fre- 3-4 serv- (1.37-2.82)
quency of ings/wk (2)
intake
Tzonou et ai., 145/298
1996b, Greece
Semi-quanti- Highest vs 0.96 p = 0.73 tative FF0, (115, lowest (4) (0.76-1.21) 19 fruits), inter- viewed
IARC Handbooks of Cancer Prevention Volume 8: Fruit and Vegetables
Author, year, Cases/con- Exposure Range Relative
Stat. sign. Adjustment Comments country trois assessment contrasts risk
for confounding
(no. of items) (no. of (95% CI) categories)
Levi et al., 274/572 FF0 (50), Total fresh 0.45 1993a, interviewed, fruit: Switzerland, frequency Highest vs
northern Italy lowest (3)
Potisohrnan et 399/296 FF0 (60, 7 > 21.9 vs < 1 .1(0.6— ai., 1 993, USA fruits), inter- 8.5 times! .9)
viewed, open- wk (4)
ended frequency of intake, one of three portion sizes
Shu et al., 268/268 FF0 (63, 5 Highest vs 0.7 1993, China fruits),inter- lowest (4)
viewed, open- ended usual intake frequency, portion per unit time
La Vecchia et ai., 206/206
FF0 (10), f re- Fresh fruit: 0.57 1986, Italy quency 2! 14 vs < (0.33-0.99)
14 serv-ings/wk (2)
P 0.01
Interviewer, age, Hospital-based marital status, years of education, BMI, parity, history of dia-betes or hyperten-sion, age at menar-che, age at meno-pause, oral contra-ceptive use, other female hormone use
Age, study centre, Hospital-based energy
Age and first-visit Hospital-based year 980% of first-visit
patients com- pleted ques- tionnaire
Age, education, age Hospital-based at menopause, age Response rate at menarche, parity, for cases 83%, miscarriages, aber- for controls 88% tiens, oral contracep- tive use, hormone replacement therapy, smoking, alcohol, coffee, height, energy, BM1
214

Cancer-preventive effects
•ti'iiM ['i'll I.' I
Author, year, Cases/con- Exposure Range Relative Stat. sign. Adjustment Comments country trol assessment contrasts risk for confounding
(no. of items) (no. of (95% Cl) categories)
Goodman at ai., 332/511 FF0 (250), inter- > 282 vs o 0.5 p = 0.004 Pregnancy history, Population-based 1997, USA viewed, open- 95 gld oral contraceptive Response rate for
ended usual (4) usage, history of cases 66%, for intake frequency, diabetes, BMI, controls 73% portion size from energy pictures of three different portions
Jain at ai., 552/563 Diet history, > 555 vs 1.29 p = 0.41 Energy, age, body Population-based 2000, Canada interviewed, usual <229 gld (0.88-1.89) weight, ever Response rate for
frequency, usual (4) smoked, history of oases 50% of amount in relation diabetes, oral con- potentially to food models traceptive use, nor- eligible. 70% of eli-
mone replacement gible with MD therapy use, univer- approval, for con- city education, live troIs 41% births, age at menarche
McCann at al., 232/639 Diet history > 184 vs 0.9 p = 0.97 Age, education, Population-based 2000, USA (172, 18 fruits) <81 (0.5-1.7) BMI, diabetes, Response rate for
self-administered, times/mo hypertension, pack- cases 51%, for usual intake, por- (4) years cigarette controls 51% tion size in rela- smoking, age at tion to pictures menarche, parity,
oral contraceptive use, menopause status, hormone replacement therapy use, other food groups
Littmar at at., 679/944 FF0 (98, 16 > 2.3 vs < 067 (0.47— p = 0.02 Age, county of rosi- Population-based 2001, USA fruits), inter- 0.8 serv- 095) pence, energy, Response rate for
viewed, frequency ings/d (5) unopposed estrogen cases 72%, for five years pre- use, smoking, BMI controls 73% viously, portion among those size relative to found eligible three categories
Terry at at., 2002, 709/2887 FF0, self- > 21 vs -r 0.9 p = 0.35 Age, BMI, smoking, Population-based Sweden administered, 2.5 serv- (0.7-1.2) physical activity, Postmenopausal
nine frequency ings/wk prevalence of dia- women with intact categories (median val- betes, fatty fish con- uterus, no history
ues (4) sumption, quintiles of endometrial or of total food con- breast cancer sumption, other Response rate for dietary factors cases 75%
p for trend when applicable
215
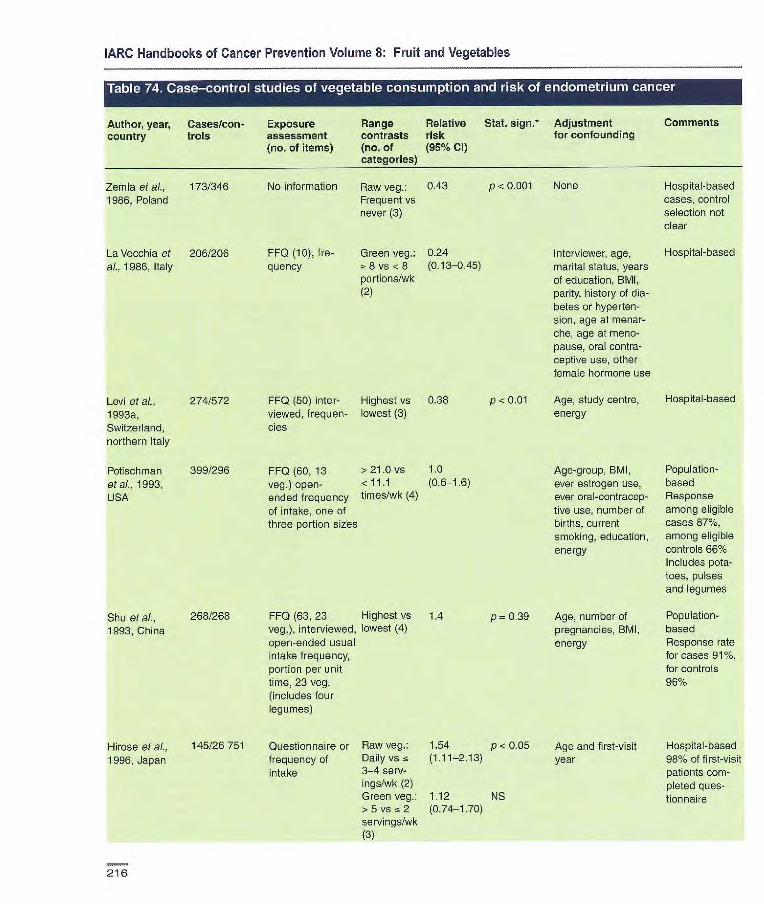
IARC Handbooks of Cancer Prevention Volume 8: Fruit and Vegetables
Author, year, Cases/con- Exposure Range Relative Stat. sign.* Adjustment
Comments country trois assessment contrasts risk for confounding
(no. of items) (no. of (95% Cl categories)
Zemla et al., 173/346 No information Raw veg.: 0.43
1986, Poland Frequent vs never (3)
La Vecchia et 2061206 FIFO (10), fre- Green veg.: 0.24
al., 1986, Italy quency -~ 8 vs <8 (0.13-0.45) portions/wk (2)
P < 0.001 None
Interviewer, age, marital status, years of education, BMI, parity, history of dia-betes or hyperten-sion, age at menar-che, age at meno-pause, oral contra-ceptive use, other female hormone use
Hospital-based cases, control selection not clear
Hospital-based
P < 0.01
p = 0.39
Levi et al,, 274/572 1 (50) inter- Highest vs 0.38
1993a, viewed, frequen- lowest (3)
Switzerland, des northern Italy
Potischman 399/296 FF0 (60, 13 > 21.0 vs 1.0
etal., 1993, veg.) open- < 11.1 (0.6-1.6)
USA ended frequency times/wk (4)
of intake, one of three portion sizes
Age, study centre, Hospital-based energy
Age-group, BMI, Population- ever estrogen use, based ever oral-contracep- Response tive use, number of among eligible births, current cases 87%, smoking, education, among eligible energy controls 66%
Includes pota- toes, pulses and legumes
Age, number of Population- pregnancies, BMI, based energy Response rate
for cases 91%,
for controls
96%
Shu et al., 268/268
1993, China
1 (63, 23 Highest vs 1.4 veg.), interviewed, lowest (4) open-ended usual intake frequency, portion per unit time, 23 veg. (includes four legumes)
Hirose etal., 145/26751 1996, Japan
Questionnaire or Raw veg.: 1.54 p < 0.05 frequency of Daily vs (1.11-2.13)
intake 3-4 serv- ings/wk (2) Green veg.: 1.12 NS > 5 vs cc 2 (0.74-1.70) servi ngs/wk (:3)
Age and first-visit Hospital-based year 98% of first-visit
patients com-pleted ques-tionnaire
216
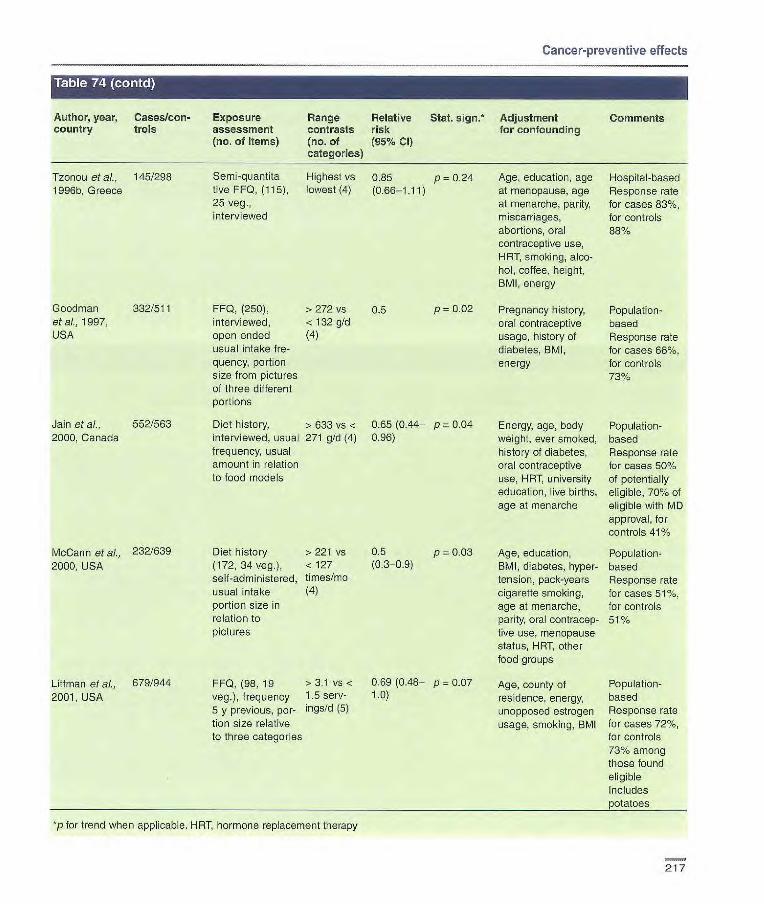
FF0, (250), > 272 vs 0.5 p = 0.02 interviewed, < 132 g/d open ended (4) usual intake fre- quency, portion size from pictures of three different portions
Diet history, > 633 vs < 0.65 (0.44— p = 0.04 interviewed, usual 271 g/d (4) 0.96) frequency, usual amount in relation to food models
Goodman 332/511 etal., 1997, USA
Jain at al., 552/563 2000, Canada
Cancer-preventive effects
Author, year, Cases/con- Exposure Range Relative Stat. sign.* Adjustment
Comments country trois assessment contrasts risk for confounding
(no. of items) (no. of (95% CI) categories)
Tzonou etaL, 145/298 Semi-quantita Highest vs 0.85 p = 0.24 1996b, Greece tive FF0, (115), lowest (4) (0.66-1.11)
25 veg., interviewed
McCann et al., 232/639 Diet history > 221 vs 0.5 p = 0.03 2000, USA (172, 34 veg.), < 127 (0.3-0.9)
self-administered, times/mo usual intake (4)
portion size in relation to pictures
Littman et ai., 679/944 FF0, (98, 19 >3.1 '/5 < 0.69 (0.48— p = 0.07
2001, USA veg.), frequency 1.5 serv- 1.0)
s y previous, per- ingsld (5) tion size relative to three categories
*p for trend when applicable. HRT, hormone replacement therapy
Age, education, age Hospital-based at menopause, age Response rate at menarche, parity, for cases 83%, miscarriages, for controls abortions, oral contraceptive use, HRT, smoking, alco- hol, coffee, height, BMI, energy
Pregnancy history, Population- oral contraceptive based usage, history of Response rate diabetes, BMI, for cases 66%, energy for controls
73%
Energy, age, body Population- weight, ever smoked, based history of diabetes, Response rate oral contraceptive for cases 50% use, HAT, university of potentially education, live births, eligible, 70% of age at menarche eligible with MD
approval, for controls 41%
Age, education, Population- BMI, diabetes, hyper- based tension, pack-years Response rate cigarette smoking, for cases 51%, age at menarche, for controls parity, oral contracep- 51% tive use, menopause status, HRT, other food groups
Age, county of Population- residence, energy, based unopposed estrogen Response rate usage, smoking, BMI for cases 72%,
for controls 73% among those found eligible Includes
217
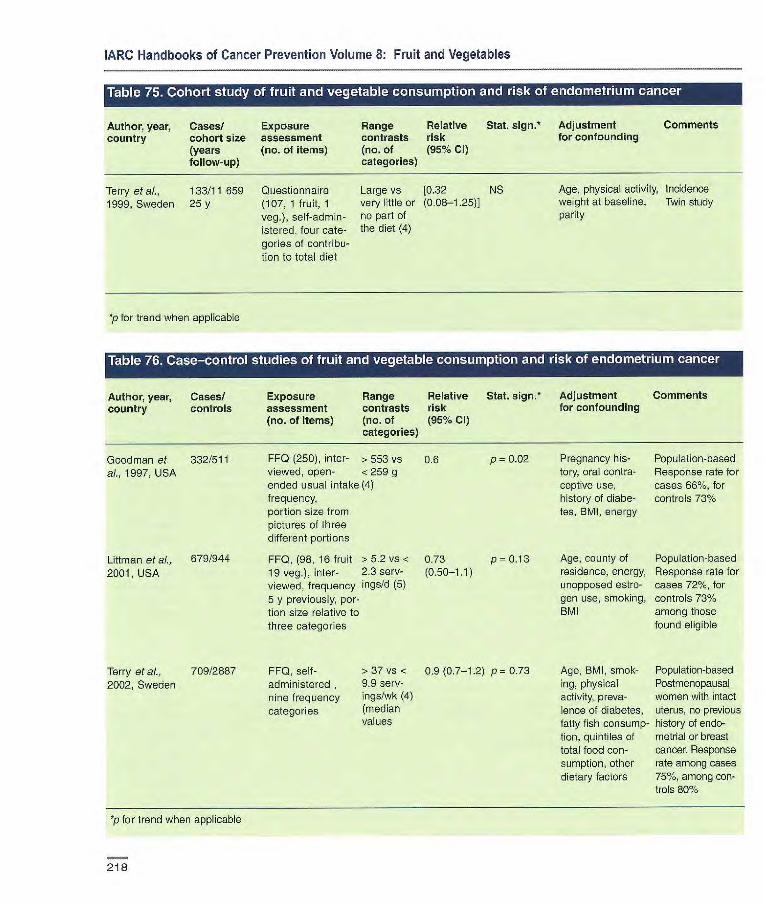
IARC Handbooks of Cancer Prevention Volume 8: Fruit and Vegetables
Author, year, Cases! Exposure Range Relative
Stat. sign.' Adjustment Comments country cohort size assessment contrasts risk
for confounding
(years (no. of items) (no. of (95% Cl) follow-up) categories)
Terry et at., 133/11 659 Questionnaire Large vs [0.32 NS 1999, Sweden 25 y (107, 1 fruit, 1 very little or (0.08-1.25)1
veg.), self-admin- no part of
istored, four cate- the diet (4) genes of contribu- tion to total diet
Age, physical activity, Incidence weight at baseline, Twin study parity
p for trend when applicable
Author, year, Cases! Exposure Range Relative Stat. sign. Adjustment Comments country controls assessment contrasts risk for confounding
(no. of items) (no. of (95% Cl) categories)
Goodman et 332/511 FF0 (250), inter- > 553 vs 0.6 p = 0.02 Pregnancy his- Population-based
at., 1997, USA viewed, open- <259 g tory, oral contra- Response rate for ended usual intake (4) ceptive use, cases 66%, for frequency, history of diabe- controls 73% portion size from tes, BMI, energy pictures of three different portions
Litiman et al., 679/944 FF0, (98, 16 fruit >5.2 vs < 0.73 p= 0.13 Age, county of Population-based
2001, USA 19 veg.), inter- 2.3 serv- (0.50-1.1) residence, energy, Response rate for viewed, frequency ings/d (5) unopposed estro- cases 721/., for 5 y previously, por- gen use, smoking, controls 73% tion size relative to BMI among those three categories found eligible
Terry et aI., 709/2887 FF0, self- > 37 vs < 0.9 (0.7-1.2) p = 0.73 Age, BMI, smok- Population-based
2002, Sweden administered , 9.9 serv- ing, physical Postmenopausal nine frequency ings!wk (4) activity, preva- women with intact categories (median lence of diabetes, uterus, no previous
values fatty fish consump- history of endo- tion, quintiles of metrial or breast total food con- cancer. Response sumption, other rate among cases dietary factors 75%, among con-
trols 80%
*p for trend when applicable
218

to
Cancer-preventive effects
Author, year, Cases/
Exposure Range Relative
Stat, sign.* Adjustment Comments country cohort size
assessment contrasts risk
for confounding (years follow- (no. of items) (no. of (95% Cl) up)
categories)
Age, energy, Incidence number of live Iowa Health births, age at Study menopause, family history of ovarian cancer, hysterecto- my/unilateral oophorectomy status, waist-to-hip ratio, physical activity, pack-years of smoking, educa- tion
Age, energy, dura- Incidence tien of oral contra- Nurses' Health ceptive use, parity, Study tubal ligation, BMI. Limited te smoking, dietary fibre epithelial
cancers
Kushi et al.. 139/29083 Sem-quanti-
1999, USA 10 y tative FF0 (126), self-administered. nine frequency categories, validated
>23vs< 1.13 p=0.5l 11 times/wk (0.66-1.93) (4)
Fairfield & al., 301/80326 2001, USA 16y
Semi-quaritita- 3.2 vs < five FF0 (126), 1.1 serv- seif-adminis- ings/d (5)
tered, nine fre- quency cate- gories, valida- ted
1.27 p= 0.20 (0.80-2.02)
*p for trend when applicable
219
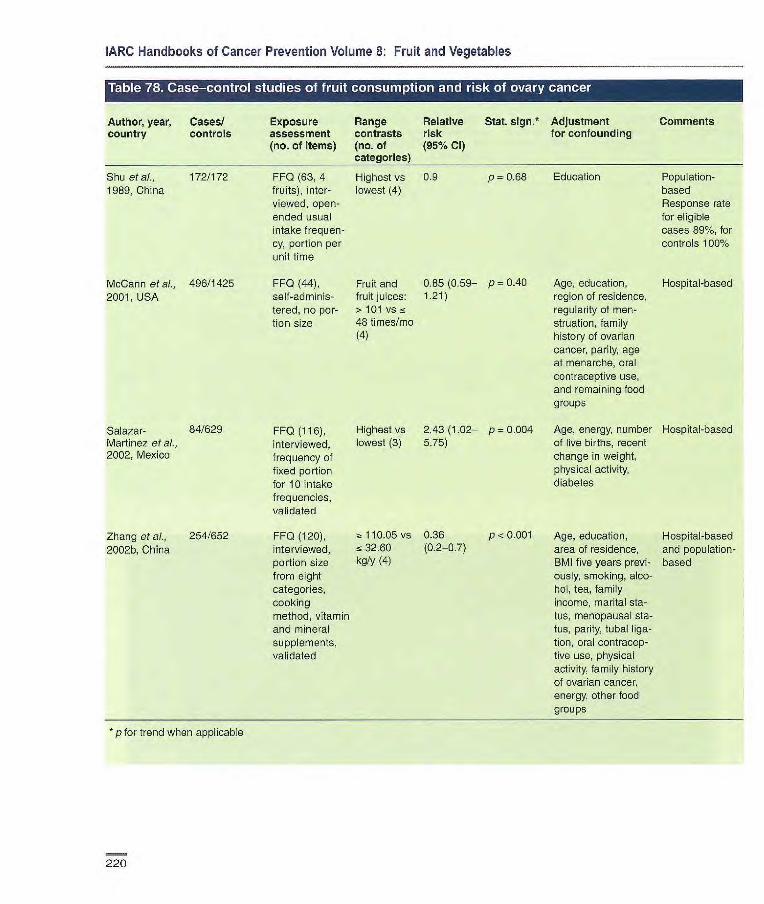
IARC Handbooks of Cancer Prevention Volume 8: Fruit and Vegetables
Author, year, country
Cases/ controls
Exposure assessment (no. of items)
Range contrasts (no. of categories)
Relative risk (95% Cl)
Stat. sign.* Adjustment for confounding
Comments
Shu at ai., 172/172 FF0 (63, 4 Highest vs 09 p 0.68 Education Population- 1989. China fruits), inter- lowest (4) based
viewed, open- Response rate ended usual for eligible intake frequen- cases 89%, for cy, portion per controls 1001/6
unit time
McCann at al., 496/1425 FF0 (44), Fruit and 0.85 (0.59— p = 0.40 Age, education, Hospital-based 2001, USA self-adminis- fruit juices: 1.21) region of residence,
tered, no per- > 101 vs ~ regularity of men- tion size 48 times/mo struation, family
(4) history of ovarian cancer, parity, age at menarche, oral contraceptive use, and remaining food groups
Salazar- 84/629 FF0 (116), Highest vs 2.43 (1.02— p = 0.004 Age, energy, number Hospital-based Martinez et al., interviewed, lowest (3) 5.75) of live births, recent 2002, Mexico frequency of change in weight,
fixed portion physical activity,
for 10 intake diabetes
frequencies, validated
Zhang at al., 254/652 FF0 (120), 110.05 vs 0.36 p < 0.001 Age, education, Hospital-based 2002b, China interviewed, 32.60 (0.2-0.7) area of residence, and population-
portion size kg/y (4) BMI five years previ- based from eight ously, smoking, alco- categories, hol, tea, family cooking income, marital sta- method, vitamin tus, menopausal sta- and mineral tus, parity, tubal liga- supplements, tion, oral contracep- validated tive use, physical
activity, family history of ovarian cancer, energy, other food groups
* p for trend when applicable
220

Cancer-preventive effects
Author, year, Cases/cohort Exposure Range Relative Stat. sign.* Adjustment Comments country size (years assessment contrasts risk for confounding
follow-up) (no. of items) (no. of (95% Cl) categories)
Kushi et al., 139/29083 Semi-quant- >31 vs < 0.76 p = 0.21 1999, USA 10 y tative FF0 (126), 16 iimes/wk (0.42-1.37)
self-administered, (4) nine frequency categories, validated
Fairfield et al., 301/80326 2001, USA 16y
Semi-quantitative > 4.4 vs < FF0 (126), self- 1.8 serv- administered, ings/d (5) nine frequency categories
0.77 p = 0.30 (0.48-1.24)
p for trend when applicable
Age, energy, Incidence number of live births, Iowa Health age at menopause, Study family history of ovarian cancer, hysterectomy/ unilateral oophorec- tomy status, waist- to-hip ratio, physical activity, pack-years of smoking, educa- tion
Age, energy, dura- Incidence tion of oral contra- Nurses' Health ceptive use, parity, Study tubal ligation, BMI, Limited to smoking, dietary epithelial fibre cancers
Author, year, Cases/ country controls
Si et al., 172/172 1989, China
Exposure Range Relative Stat. sign.* Adjustment Comments assessment contrasts risk for confounding (no. of items) (110. of (95% Cl)
categories)
FF0 (63, 18 Highest vs 0.8 p 0.45 Education Population- veg.), inter- lowest (4) based viewed, open- Response ended usual rate for eligible intake frequency, cases 89%, portion per unit for controls time 100%
La Vecchia et al., 455/1385 FF0 (10), inter- Green veg.: 0.61 p< 0.001 1987b, Italy viewed, three > 8 vs <7 (0.46-0.82)
categories of Ire- times/wk (3) quency
Age, interviewer, Hospital- marital status, social based class, education, parity, age at first birth, age at menarche, menopausal status, age ai menopause, BMI, oral contraceptive use, other female hor-mone use, retinol, carotene, added fat, alcohol, other foods
221

IARC Handbooks of Cancer Prevention Volume 8: Fruit and Vegetables
•iiiriuzrruiiwoi
Author, year, Cases/ Exposure Range Relative Stat. 5jgfl•* Adjustment Comments country controls assessment contrasts risk for confounding
(no. of items) (no. of (95% Cl) categories)
Bosetti et al., 1031/2411 FFQ, (78), Raw veg.:> 0.47 p < 0.0001 Age, study centre, Hospital-based 2001, Italy interviewed, 11.5 vs < (0.34-0.64) education, year of in four regions
frequency only 4.0 serv- interview, parity, of Italy ings/wk (5) oral contraceptive Cooked 0.65 p = 0.002 use, energy veg.: (0.48-0.87) > 5.0 vs < 1.8 serv- ings/wk (5)
McCann et ai., 496/1425 FFQ (44), > 66 vs ~. 0.76 p = 0.07 Age, education, Hospital-based 2001, USA self-adnilnis- 24 times/mo (0.52-1.10) region of residence,
tered, no (4) regularity of men- portion size struation, family
history of ovarian cancer, parity, age at menarche, oral contraceptive use, and remaining food groups
Salazar- 84/629 FFQ, (116), Green leafy 1.56 p 0.14 Age, energy, number Hospital-based Martinez et al., frequency of veg.: (0.67-3.64) of live births, recent 2002, Mexico fixed portion Highest vs change in weight,
for 10 intake lowest (3) physical activity, frequencies, diabetes validated
Zhang et ai., 254/652 FFQ (120), = 180.55 0.24 p < 0.001 Age, education, Hospital-based 2002b, China interviewed, vs 89.25 (0.1-0.5) area of residence, and population-
portion size kg/y (4) BMI five years previ- based from eight ously, smoking, categories, alcohol, tea, family cooking income, marital method, vitamin status, menopausal and mineral status, parity, tubal supplements, ligation, oral contra- validated captive use, physical
activity, family history of ovarian cancer, energy, other food groups
p for trend when applicable
222
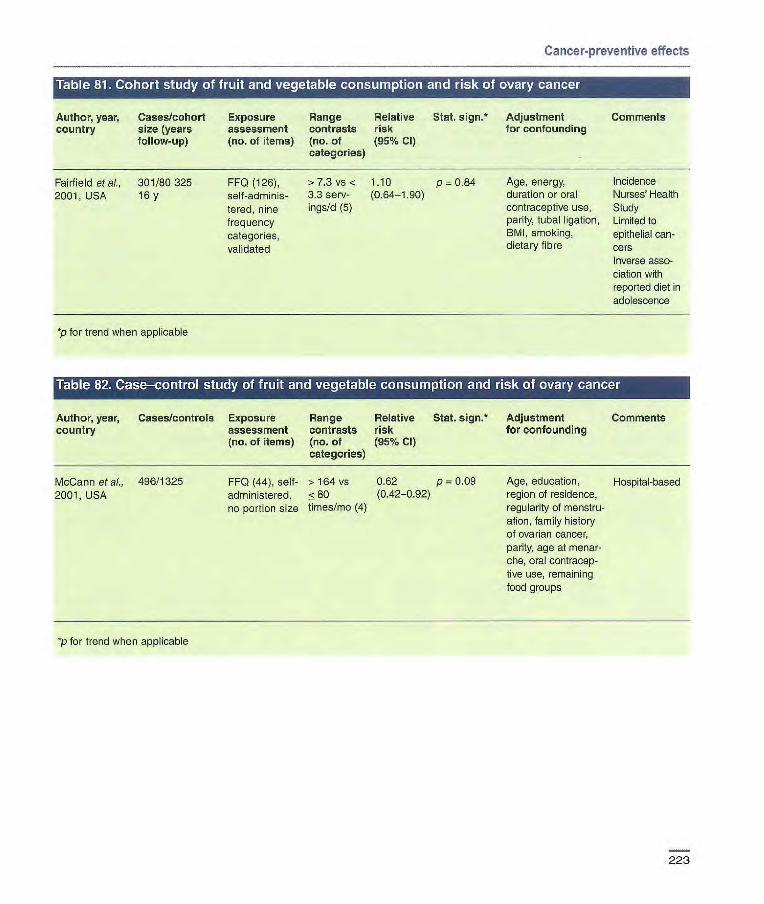
Cancer-preventive effects
• r iii LI IWIFIC Ito] I 111141 to LTA'I •ii'ii I IL' 'Ai [4 K I'l L -11661 It.1'I IIIs] It@] I II L •i KIM6i ''L I KIM L.I
Author, year, Cases/cohort Exposure Range Relative Stat. sign.* Adjustment Comments country size (years assessment contrasts risk for confounding
follow-up) (no. of items) (no. of (95% CI) categories)
Fairfield etal., 301/80325 FF0 (126), >7.3 vs < 110 p 0.84 Age, energy, Incidence
2001, USA 16 y self-adninis- 3.3 serv- (0.64-1.90) duration or oral Nurses' Health
tared, nine ings/d (5) contraceptive use, Study
frequency parity, tubal ligation, Limited to
categories, BMI, smoking, epithelial can-
validated dietary fibre cors
Inverse asso- ciation with reported diet in adolescence
*p for trend when applicable
Author, year, Cases/controls Exposure Range Relative Stat. sign.* Adjustment Comments country assessment contrasts risk for confounding
(no. of items) (no. of (95% Cl) categories)
McCann et al., 496/1325 2001, USA
FF0 (44), self- > 164 vs 0.62 p = 0.09 administered, 580 (0.42-0.92)
no portion size times/mo (4)
Age, education, Hospital-based region of residence, regularity of menstru-ation, family history of ovarian cancer, parity, age at menar-che, oral contracep-live use, remaining food groups
p for trend when applicable
223
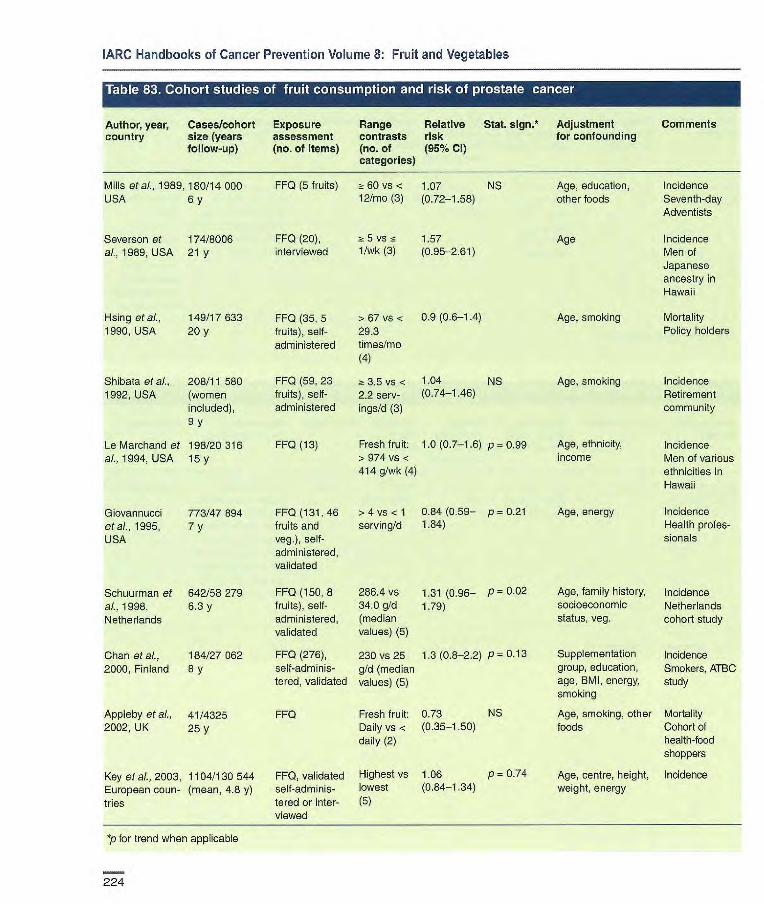
Age, education, other foods
Age
Age, smoking
Age, smoking
Incidence Seventh-day Adventists
Incidence Men of Japanese ancestry in Hawaii
Mortality Policy holders
Incidence Retirement community
Age, ethnicity, Incidence income Men of various
ethnicities in Hawaii
Age, energy Incidence Health profes- sionals
Age, family history, Incidence socioeconomic Netherlands status, veg. cohort study
Supplementation Incidence group, education, Smokers, ATBC age, BMI, energy, study smoking
Age, smoking, other Mortality foods Cohort of
health-food shoppers
Age, centre, height, Incidence weight, energy
IARC Handbooks of Cancer Prevention Volume 8: Fruit and Vegetables
Author, year, Cases/cohort Exposure Range Relative Stat. sign.* Adjustment Comments country size (years assessment contrasts risk for confounding
follow-up) (no, of items) (no. of (95% Cl) categories)
Mills etal., 1989,180/14 000 FF0 (5 fruits) 2:60 vs < 1.07 NS USA 6 y 12/mo (3) (0.72-t58)
Severson at 174/8006
FF0 (20), z- 5 vs 1.57 ai., 1989, USA 21 y
interviewed 1/wk (3) (0.95-2.61)
Hsi ng etal., 149/17 633 1990, USA 20y
FF0 (35, 5 > 67 vs < 0.9 (0.6-1.4) fruits), self- 29.3 administered times/mo
(4)
FF0 (59, 23 2t 3.5 vs < 1.04 NS fruits), self- 2.2 serv- (0.74-1.46) administered ings/d (3)
FF0 (13) Fresh fruit: 1.0 (0.7-1.6) p 0.99 > 974 vs < 414 g/Wk (4)
Shibata at ai., 208/11 580 1992, USA (women
included), 9y
Le Marchand et 198/20 316 a/.,1994, USA 15y
Giovannucci 773/47894 FF0 (131, 46 >4 vs < 1 0.84 (0.59— p = 0.21 etal., 1995, 7 y fruits and serving/d 1.84) USA veg.), self-
administered, validated
Schuurman at 642/58279 FF0 (150,8 286.4 vs 1.31 (0.96— p= 0.02
al., 1998, 6.3 y fruits), self- 34.0 g/d 1.79) Netherlands administered, (median
validated values) (5)
Chan etal., 184/27062 FF0 (276), 230 vs 25 1.3 (0.8-2.2) p 0.13
2000, Finland 8 y self-adminis- g/d (median tered, validated values) (5)
Appleby etal., 41/4325 FF0 Fresh fruit: 0.73 NS 2002, UK 25 y Daily vs < (0.35-1.50)
daily (2)
Key at a1, 2003, 1104/130 544 FF0, validated Highest vs 1.06 p = 0.74
European coun- (mean, 4.8 y) self-adminis- lowest (0,84-1,34)
tries tered or inter- (5) viewed
*p for trend when applicable
224
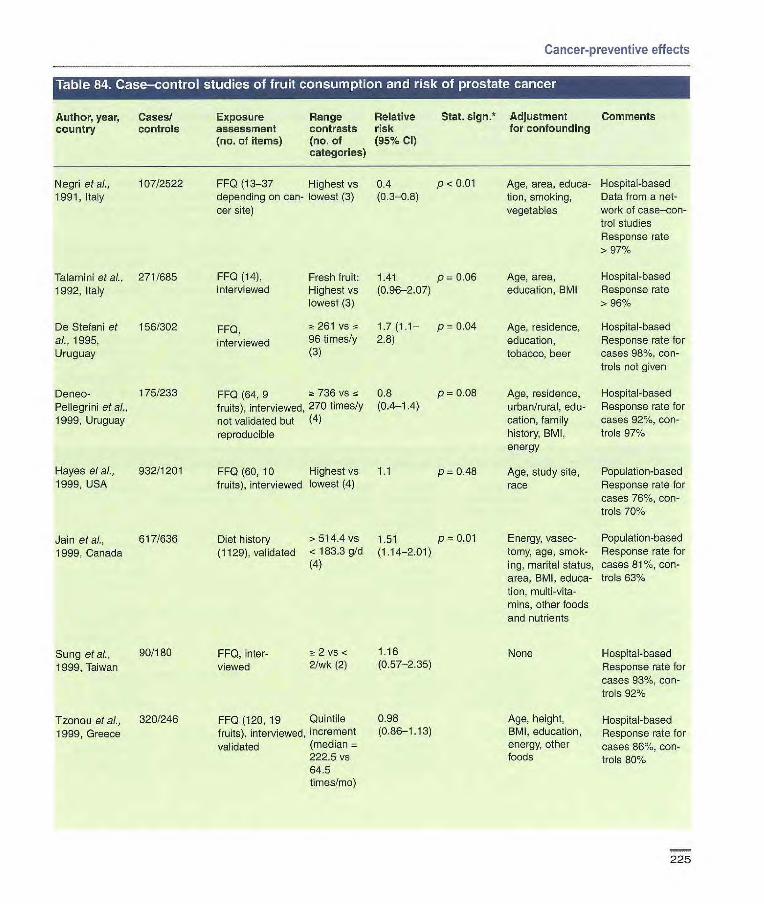
FF0 (13-37 Highest vs 0.4 p - 0.01 depending on can- lowest (3) (0.3--08) cer site)
FF0 (14), Fresh fruit: 1.41 p 0.06 interviewed Highest vs (0.96-207)
lowest (3)
FF0, 2t 261 vs 1.7 (1.1— P = 0.04
interviewed 96 times/y 2.8) (3)
Negri etal., 107/2522 1991, Italy
Talamini etal., 271/685 1992, Italy
De Stefani et 156/302 ai., 1995, Uruguay
Defoe- 175/233 FF0 (64, 9 a 736 VS 0.8 p = 0.08 Pellegrini etal., fruits), interviewed, 270 times/y (0,4-1.4)
1999, Uruguay not validated but (4) reproducible
Hayes et al., 932/1201 FF0 (60, 10 Highest vs 1.1 p 0.48 1999, USA fruits), interviewed lowest (4)
Jain etal., 617/636 Diet history >514.4 vs 1.51 p = 0.01
1999, Canada (1129), validated < 183.3 g/d (1.14-2.01) (4)
Cancer-preventive effects
Table 84. Case-control studies of fruit consumption and risk of prostate cancer
Author, year, Cases/ Exposure Range Relative Stat. sign.* Adjustment Comments country controls assessment contrasts risk for confounding
(no. of items) (no. of (95% CI) categories)
Sung et al., 90/180 FF0, nter- 2 vs < 1.16
1999, Taiwan viewed 2/wk (2) (0.57-2.35)
Tzonou etal., 320/246 FF0 (120, 19 Quintile 0.98
1999, Greece fruits), interviewed, increment (0.86-1.13)
validated (median 2225 vs 64.5 times/mo)
Age, area, educa- Hospital-based tion, smoking, Data from a riot- vegetables work of case—con-
trol studies Response rate > 97%
Age, area, Hospital-based education, BMI Response rate
> 96%
Age, residence, Hospital-based education, Response rate for tobacco, beer cases 98%, con-
trols not given
Age, residence, Hospital-based urban/rural, edu- Response rate for cation, family cases 921/., con- history, BMI, trois 971%
energy
Age, study site, Population-based race Response rate for
cases 76%, con- trols 70%
Energy, vasec- Population-based tomy, age, smok- Response rate for ing, marital status, cases 81%, con- area, BMI, eduoa- trois 63% tion, multi-vita- mins, other foods and nutrients
None Hospital-based Response rate for cases 93%, con- trols 92%
Age, height, Hospital-based BMI, education, Response rate for energy, other cases 86%, con- foods trois 80%
225
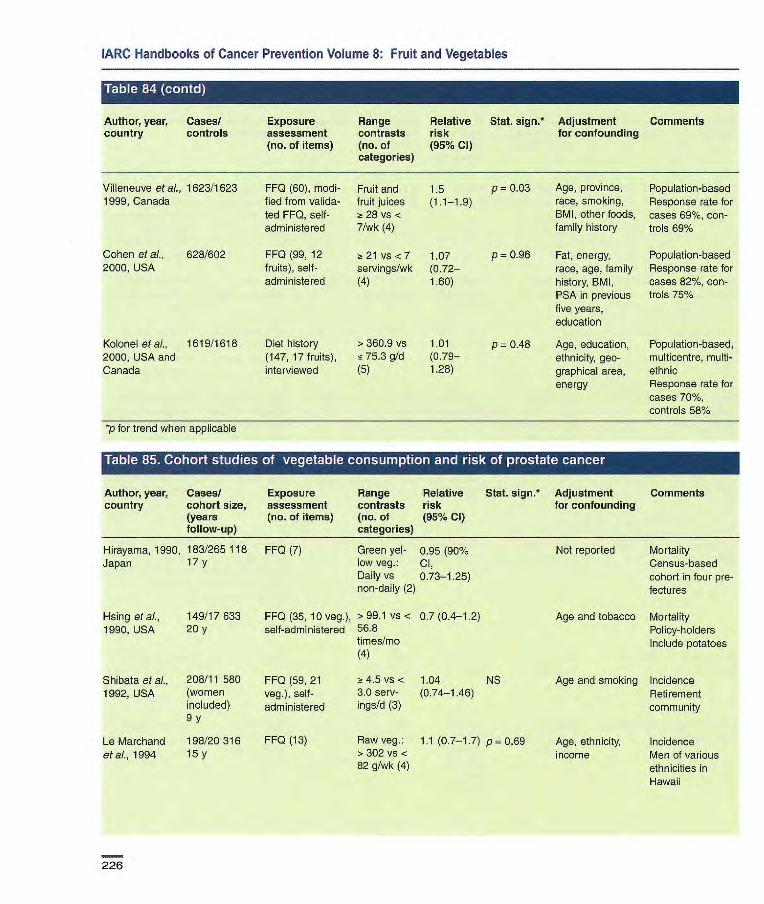
IARC Handbooks of Cancer Prevention Volume 8: Fruit and Vegetables
Author, year, Cases! Exposure Range Relative Stat. sign.* Adjustment Comments country controls assessment contrasts risk for confounding
(no. of items) (no. of (95% Cl) categories)
Villeneuve et aI., 1623/1623 FF0 (60), modi- Fruit and 1.5 p = 0.03 Age, province, Population-based 1999, Canada fied from valida- fruit juices (1.1-1.9) race, smoking, Response rate for
ted FF0, self- -z 28 vs < BMI, other foods, cases 69%, con- administered 7/wk (4) family history troIs 69%
Cohen et al., 628/602 FF0 (99, 12 ;n 21 vs <7 1.07 p = 0.96 Fat, energy, Population-based 2000, USA fruits), self- servings/wk (0.72— race, age, family Response rate for
administered (4) 1.60) history, BMI, cases 82%, con- PSA in previous trois 75% five years, education
Kolonel et at, 1619/1618 Diet history > 360.9 vs 1.01 p 0.48 Age, education, Population-based, 2000, USA and (147, 17 fruits), 5 75.3 g/d (0.79— ethnicity, geo- rnulticentre, multi- Canada interviewed (5) 1.28) graphical area, ethnic
energy Response rate for cases 70%, controls 58%
*p for trend when applicable
Author, year, Cases! Exposure Range Relative Stat. sign.* Adjustment Comments country cohort size, assessment contrasts risk for confounding
(years (no. of items) (no. of (95% Cl) follow-up) categories)
Hirayama, 1990, 183/265 118 FF0 (7) Green yel- 0.95 (90% Japan 17y low veg: Cl,
Daily vs 0.73-1.25) non-daily (2)
Hsing etal., 149/17633 FF0 (35, 10 veg.), >99.1 vs < 0.7 (0A-1.2) 1990, USA 20 y self-administered 568
times/mo (4)
Shibata et al., 208/11 580 FF0 (59, 21 2: 4.5 vs < 1.04 NS 1992, USA (women veg.), self- 30 serv- (014-1.46)
included) administered ings/d (3)
Not reported Mortality Census-based cohort in four pre-fectures
Age and tobacco Mortality Policy-holders Include potatoes
Age and smoking Incidence Retirement community
9y
Le Marchand 198/20316 FF0 (13) etal., 1994 15
Raw veg.: 1.1(0.7-1.7) p = 0.69 > 302 vs < 82 g/wk (4)
Age, ethnicity, Incidence income Men of various
ethnicities in Hawaii
226
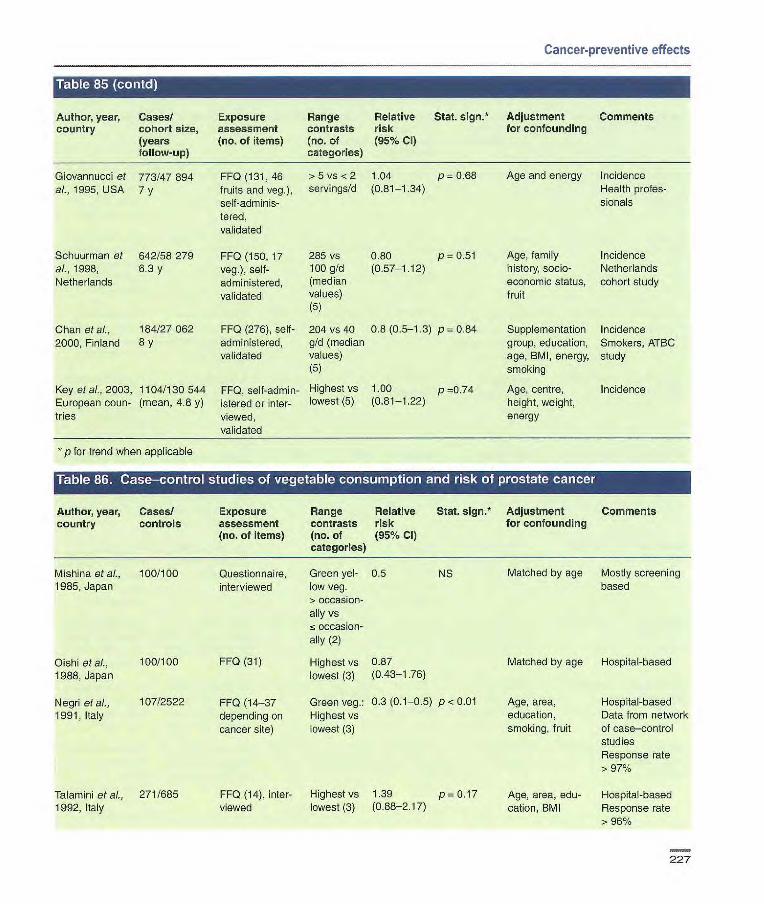
Cancer-preventive effects
• t1 'J[K.IAL'i'IJ[L'.J
Author, year, Cases! Exposure Range Relative Stat. sign!' Adjustment Comments country cohort size, assessment contrasts risk for confounding
(years (no. of items) (no. of (95% Cl) follow-up) categories)
Giovannucci et 773/47894 FF0 (131, 46 >5 vs <2 1.04 p 0.68 Age and energy Incidence al., 1995, USA 7 y fruits and veg.), servingsfd (0.81-1.34) Health protes-
seif-adminis- sionals tered, validated
Schuurman et 642/58279 FF0 (150, 17 285 vs 0.80 p = 0.51 Age, family Incidence al., 1998, 6.3 y veg.), self- 100 g/d (0.57-1.12) history, socio- Netherlands Netherlands administered, (median economic status, cohort study
validated values) fruit (5)
Chan etal., 184/27062 FF0 (276), self- 204 vs 40 0.8 (0.5-1.3) p= 0.84 Supplementation Incidence 2000, Finland 8 y administered, g/d (median group, education, Smokers, ATBC
validated values) age, BMI, energy, study (5) smoking
Key etal., 2003, 1104/130 544 FF0, self-admin- Highest vs 1.00 p 0.74 Age, centre, Incidence European noun- (mean, 4.8 y) istered or inter- lowest (5) (0.81-1.22) height, weight, tries viewed, energy
validated
p for trend when applicable
Table 86. Case-control studies of vegetable consumption and risk of prostate cancer
Author, year, Cases! Exposure Range Relative Stat. sign.* Adjustment Comments country controls assessment contrasts risk for confounding
(no. of items) (no. of (95% Cl) categories)
Mishina etal., 100/100 Questionnaire, Green yet- 0.5 NS Matched by age Mostly screening 1985, Japan interviewed low veg. based
> occasion- ally vs <occasion- ally (2)
Oishi etal., 100/100 FF0 (31) Highest vs 0.87 Matched by age Hospital-based 1988, Japan lowest (3) (0.43-1.76)
Negri etal., 107/2522 FF0 (14-37 Green veg.: 0.3 (0.1-05) p< 0.01 Age, area, Hospital-based 1991, Italy depending on Highest vs education, Data from network
cancer site) lowest (3) smoking, fruit of case—control studies Response rate > 97%
Talamini etal., 271/685 FF0 (14), inter- Highest vs 1.39 p= 0.17 Age, area, edu- Hospital-based 1992, Italy viewed lowest (3) (0.88-2.17) cation, BMI Response rate
> 96%
227

IARC Handbooks of Cancer Prevention Volume 8: Fruit and Vegetables
If 1]ItI;i1cii11J
Author, year, country
Cases/ controls
Exposure assessment (no. of items)
Range contrasts (no. of categories)
Relative Stat. sign.* risk (95% Cl)
Adjustment for confounding
Comments
De Stefani et 156/302 FF0, interviewed > 131 vs ~ 1.1 (0.6-1 .9) p = 0.71 Age, residence, Hospital-based al., 1995, 51 times/y education, Response rat for Uruguay (3) tobacco, beer cases 98%, con-
trols not given
Key et aI., 328/328 FF0 (83) inter- Cooked 0.71 p = 0.415 Matched by age. Population-based 1997, UK viewed, validated veg.: (0.34-1.48) Adjusted for social Potatoes excluded
> l/d vs s class Response rate for 4/wk (4) cases 77%, for
controls 81%
Deneo-Pelle- 175/233 FF0 (64, 12 697 vs 15 0.6 (0.3-1.1) p= 0.02 Age, residence, Hospital-based grini et al., veg.), inteviewed, 336 times/ urban/rural, educa- Response rate for 1999, Uruguay not validated but y (4) tion, family history, cases 92%, for
reproducible BMI, energy controls 97%
Hayes etal., 932/1201 FF0 (60,21 Highest vs 1.0 p = 0.89 Age, study site, Population-based 1999, USA veg.), inter- lowest (4) race Includes potatoes
viewed Response rate for cases 76%, for controls 70%
Jain eta)., 617/636 Diet history > 594.6 vs 0.95 NS Energy, vasectomy, Population-based 1999, Canada (1129), validated <286.5 g/d (0.68-1.33) age, smoking, Response rate for
(4) marital status, area, cases 81%, for BMI, education, controls 63% multivitamins, other foods and nutrients
Tzonou et al., 320/246 FF0 (120, 26 Quintile 0.94 Age, height, BMI, Hospital-based 1999, Greece veg.), interviewed, increment (0.81-1.10) education, energy, Potatoes excluded
validated (median = other foods Response rate for 121.3 vs 48 cases 86%, for times/mo) controls 80%
Villeneuve 1623/1623 FF0 (60), nodi- >28 vs < 1.0 (0.8-1.3) p= 0.79 Age, province, Population-based et ai., 1999, fied from validated 14/wk (4) race, smoking, BMI, Response rate for Canada FF0, sell-adminis- other foods, family cases 69%, for
tered history controls 69%
Cohen et al., 628/602 FF0 (99, 21 > 28 vs < 0.65 p 0.01 Fat, energy, race, Population-based 2000, USA veg.), self- 14 serv- (0.45-0.94) age, family history, Response rate for
administered ings/wk (4) BMI, PSA in previ- cases 82%, for eus 5 y, education controls 75%
Kolonel et aL. 1619/1618 Diet history, 37 >324.8 vs 0.74 p = 0.04 Age, education, Population-bases, 2000, USA, veg. <101.3 g/d (0.580.96) ethnicity, geogra- multicentre, multi- Canada (5) phic area, energy ethnic
Response rate for cases 70%, for controls 58%
*p for trend when applicable
228
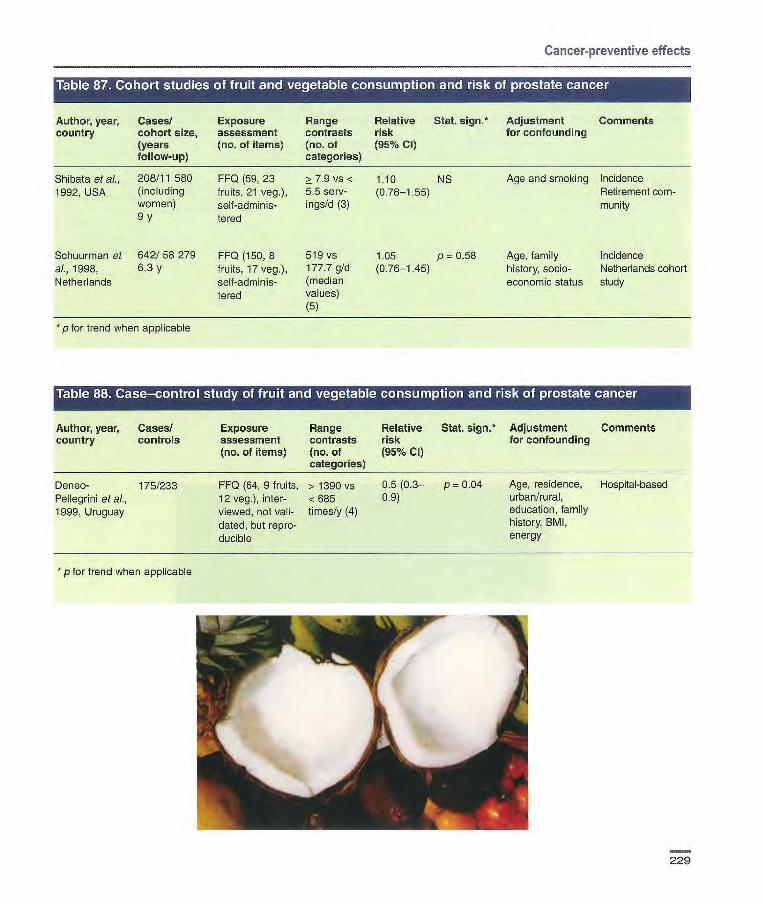
Cancer-preventive effects
• r iii LI'.1I IV] 1 Ell I III II '1 III IIJ1I!1111,11:461:4r. Is] i:- L'J I }1'I I I lI I L'J I or. II tUI 1 SJ IN #I IS1 I 1 -A II Li
Author, year, Cases/ Exposure Range Relative Stat. sign.* Adjustment Comments country cohort size, assessment contrasts risk for confounding
(years (no. of items) (no. of (95% Cl) follow-up) categories)
Shibata etal., 208/11 580 FF0 (59, 23 2: 7.9 vs < 1.10 NS Age and smoking Incidence 1992, USA (including fruits, 21 veg.), 5.5 serv- (0.78-1.55) Retirement corn-
women) self-adminis- ings/d (3) munity 9 y tered
Schuurman et 642/58279 FF0 (150,8 519 vs 1.05 p = 0.58 Age, family Incidence al., 1998, 6.3 y fruits, 17 veg.), 177.7 g/d (0.76-1.45) history, socio- Netherlands cohort Netherlands self-adminis- (median economic status study
lered values) (5)
*p for trend when applicable
Table 88. Case—control study offruit and vegetable Zconsumption and risk of prostate
Author, year, Cases! Exposure Range Relative Stat. sign.* Adjustment Comments country controls assessment contrasts risk for confounding
(no. of items) (no. of (95% CI) categories)
Deneo- 175/233 FF0 (64, 9 fruits, > 1390 vs 0.5 (0.3— p 0.04 Age, residence, Hospital-based Pellegrini eta]., 12 veg.), inter- < 685 0.9) urban/rural,
1999, Uruguay viewed, not vail- times/y (4) education, family
dated, but repro- history, BMI,
ducible energy
* p for trend when applicable
229

IARC Handbooks of Cancer Prevention Volume 8: Fruit and Vegetables
Author, year, Cases/ Exposure Range Relative
Stat. sign.* Adjustment Comments country controls assessment contrasts risk
for confounding
(no. of items) (no. of (95% Cl) categories)
Sigurdson et 160 (82 non- FF0 (152), Fruit: Age, education, HospitaL'based, at., 1999, USA seminomas, self-adrninis- > 147.2 vs < income, ethnicity, friend-matched
46 semino- tered, vail- 29.7 g/l 000 kcal cryptorchidism, controls mas, 32 dated (4) energy Response rates mixed germ- Nor-seminorna [0.9(0.3-2.5)] p = 0.99 for cases 38%, cell)/1 36 Seniinoma [0.4(0.1-1.4)] p = 0.29 for controls 73%
Mixed germ-cell [0.3(0.1-1.3)] p = 0.09
Veg.:> 58.9 vs <18.6 g/l 000 kcal (4) Non-seminoma [0.6(0.3-2.5)] p 0.81 Seminoma [1.7(0.5-5.0)] p 0.25 Mixed germ-cell [1.4(0.4-5.0)] p = 0.48
Swerdlow et aI., 60 twin pairs FF0, self- OR for having Fruit: Study in twins 1999, UK administered consumed 1.0 (0.3-3.1)
more during Veg.: childhood 0.3 (0.1-1.0)
p for trend when applicable
.t, p - -te
r M_
230
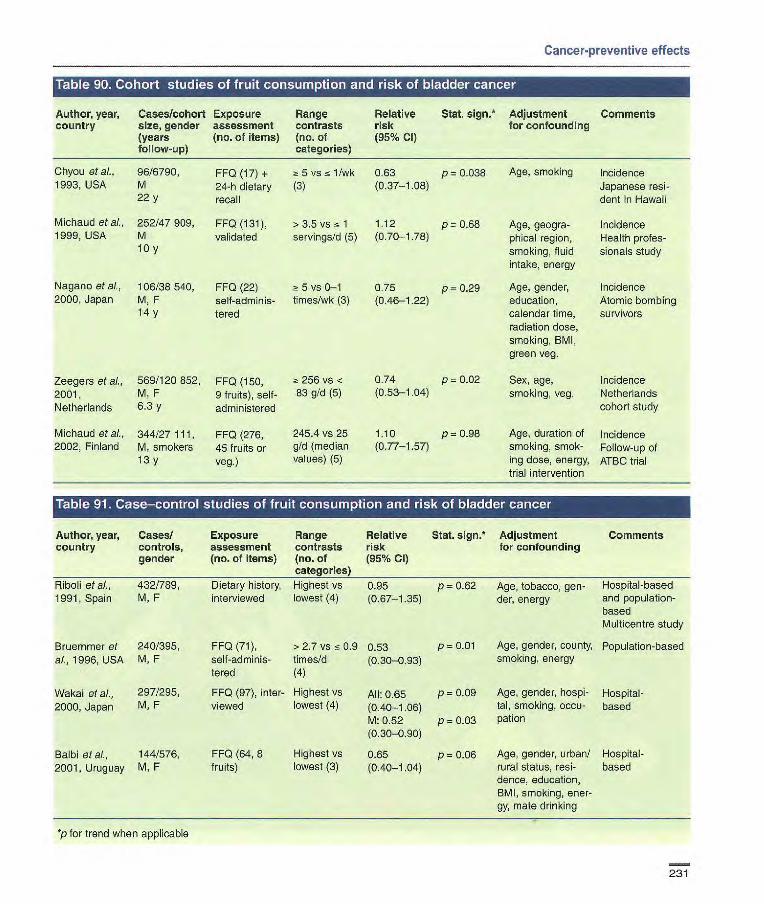
Zeegers et al., 569/120 852, FF0 (150, 2001, M, F 9 fruits), self- Netherlands 6.3 y administered
Michaud et al., 344/27111, FF0 (276, 2002, Finland M, smokers 45 fruits or
13y veg.)
256v5 < 0.74 p 0.02 83 g/d (5) (0-53-1.04)
245.4vs25 1.10 p=0.98 gld (median (0.77-1.57) values) (5)
Age, smoking
Age, geogra-phical region, smoking, fluid intake, energy
Age, gender, education, calendar time, radiation dose, smoking, BMI, green veg.
Sex, age, smoking, veg.
Incidence Japanese resi-dent ïn Hawaii
Incidence Health profes-sionals study
Incidence Atomic bombing survivors
Incidence Netherlands cohort study
Age, duration of Incidence smoking, smok- Follow-up of ing dose, energy, ATBC trial trial intervention
Cancer-preventive effects
Author, year, Cases/cohort Exposure Range Relative Stat. sign.* Adjustment Comments country size, gender assessment contrasts risk for confounding
(years (no. of items) (no. of (95% Cl) follow-up) categories)
Chyou et al., 96/8790, 1993, USA M
22 y
Michaud et al., 252/47909, 1999, USA M
10Y
Nagano eta)., 106/38540, 2000, Japan M, F
14 y
FF0 (17) + 2. 5 vsn~ 1/wk 0.63 p= 0.038 24-h dietary (3) (0.37-1.08) recall
FFO(131), >3.5vs1 1.12 p=0.68 validated servings/d (5) (0-70-1.78)
FF0 (22) 5 vs 0-1 0.75 p = 0.29 self-adminis- times/wk (3) (0.46-1.22) tered
Author, year, Casesl Exposure Range Relative Stat. sign.* Adjustment Comments country controls, assessment contrasts risk for confounding
gender (no. of items) (no. of (95% Cl) categories)
Riboli et al., 432/789, Dietary history, Highest vs 0.95 p = 0.62 Age, tobacco, gen- Hospital-based 1991, Spain M, F interviewed lowest (4) (0.67-1.35) der, energy and population-
based Multicentre study
Bruemmer et 240/395, FF0 (71), > 2.7 vs s 0.9 0.53 p = 0.01 Age, gender, county, Population-based al., 1996, USA M, F self-adminis- times!d (0.30-0.93) smoking, energy
tered (4)
Wakai et al., 297/295, FF0 (97), inter- Highest VS All: 0.65 2000, Japan M, F viewed lowest (4) (0.40-1.06)
M: 0.52 (0.30-0.90)
Balbi eta]., 144/576, FF0 (64, 8 Highest vs 0.65 2001, Uruguay M, F fruits) lowest (3) (0.40-1.04)
*p for trend when applicable
P = 0.09 Age, gender, hospi- Hospital- tal, smoking, cocu- based
P = 0.03 pation
p 0.06 Age, gender, urban/ Hospital- rural status, resi- based dence, education, BMI, smoking, ener-gy, mate drinking
231
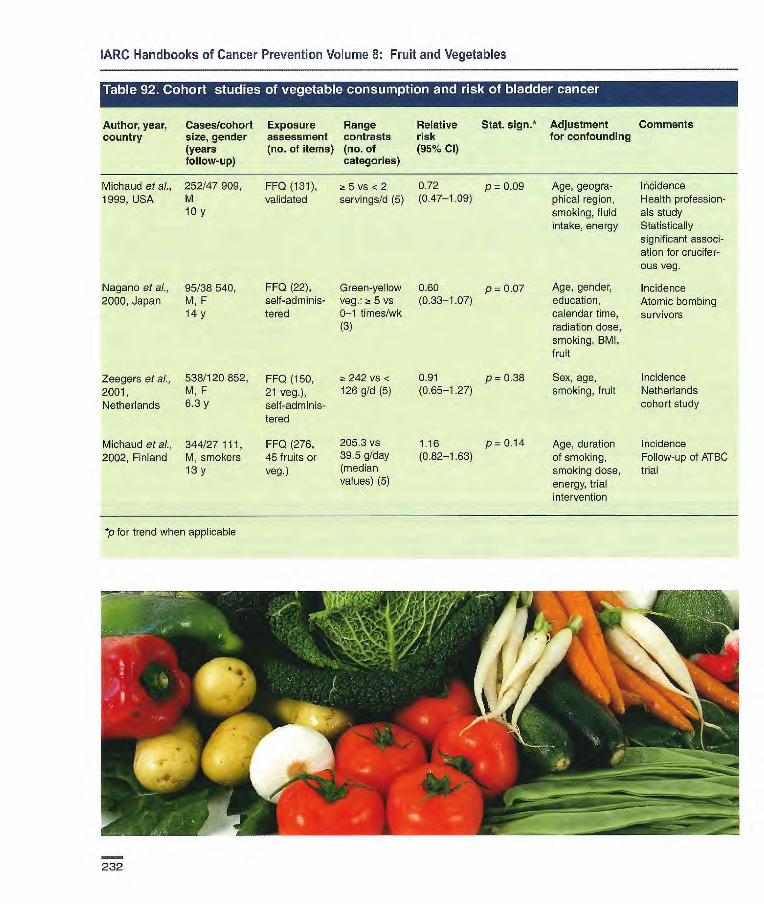
Age, geogra- incidence phical region, Health profession- smoking, fluid ais study intake, energy Statistically
significant associ- ation for crucifer- ous veg.
Age, gender, Incidence education, Atomic bombing calendar time, survivors radiation dose, smoking, BMI, fruit
Sex, age, Incidence smoking, fruit Netherlands
cohort study
Age, duration Incidence of smoking, Follow-up of ATBC smoking dose, trial energy, trial intervention
IARC Handbooks of Cancer Prevention Volume 8: Fruit and Vegetables
Author, year, Cases/cohort Exposure Range Relative Stat. sign.* Adjustment Comments country size, gender assessment contrasts risk for confounding
(years (no. of items) (no. of (95% Cl) follow-up) categories)
Michaud et al., 252/47 909, FFQ (131), ~t S vs <2 0.72 p = 0.09 1999, USA M validated servings/d (5) (0.47-1.09)
10 y
Nagano et al., 95/38540, FF0 (22), Green-yellow 0.60 p = 0.07 2000, Japan M, F self-adminis- veg.: -~ 5 vs (0.33-1.07)
14 y tered 0-1 times/wk (3)
Zeegers et al., 538/120 852, FF0 (150, z- 242 vs < 0.91 p = 0.38 2001, M, F 21 veg.), 126 g/d (5) (0.65-1.27) Netherlands 6.3 y self-adminis-
tered
Michaud etal., 344/27111, FF0 (276, 205.3v8 1.16 p=0.l4 2002, Finland M, smokers 45 fruits or 39.5 g/day (0.82-1.63)
13 y veg.) (median vaues) (5)
*p for trend when applicable
TI :
232

Cancer-preventive effects
Author, year, Cases/ Exposure Range Relative Stat. sign.* Adjustment Comments country controls, assessment contrasts risk for confounding
gender (no. of items) (no. of (95% Cl) categories)
Riboli et al., 432/789, Dietary Highest vs 1.04 p = 0.45 Age, gender, Hospital-based 1991, Spain M, F history, inter- lowest (4) (0.73-1.48) tobacco, energy and population-
viewed based Multicentre study
Bruemmer 240/395, FF0 (71), >3.6 tirnes/d 0.87 p = 0.65 Age, gender, Population-based etal., 1996, M, F self-adminis- vs ~-. 1.3 (0.52-1.45) county, smoking, USA tered timesfd (4) energy
Wakai et al., 297/295, FF0 (97), inter- Green-yellow 0.73 p = 0.20 Age, gender, Hospital-based 2000, Japan M, F viewed veg.: (0.45-1.20) hospital, smok-
Highest vs ing, occupation lowest (4) Other veg.: 1.04 p = 0.73 Highest vs (0.62-1.73) lowest (4)
Balbi etal., 144/576, FF0 (64, 11 Highest vs 0.66 p = 0.12 Age, gender, Hospital-based 2001, Uruguay M, F veg.) lowest (3) (0.40-1.09) residence, urban/
rural status, edu- cation, SMI, smoking, energy, mate drinking
*p for trend when applicable
Table consumption and Ilbladder *li
Author, year, Cases/cohort Exposure Range Relative Stat. sign.* Adjustment Comments country size, gender assessment contrasts risk for confounding
(years (no. of items) (no. of (95% Cl) follow-up) categories)
Steineck et al., 70/16477 FF0 (8), self- "Exposed 1.0 (0.6-1.6) Age, sex, smoking Incidence 1988, Sweden 14 y administered to fruit and Twin study
veg."
Zeegers etal., 538/120 852, FF0 (150, 9 fruits, 471 vs 0.98 p= 039 Age, sex, smoking Incidence 2001, M, F 21 veg.), self- <241 g/d (0.60-1.61) Netherlands cohort Netherlands 6.3 y administered (5) study
-p for trend when applicable
233

Claude etal., 531/531, FF0, inter- Eaten M: 0.59 1986, Germany M, F viewed regularly (0.37-095)
F; 0.90 (0.37-2.21)
De Ste'ani et 111/222, FF0, inter- Moderately al., 1991, M, F viewed elevated OR Uruguay for infrequent
consumers of green and yellow veg, and raw fruits"
Balbi etal., 144/576 FF0 (64,8 Highest vs 0.67 p=0.11 2001, Uruguay M, F fruits, 11 veg.) lowest (3) (0.41-1.09)
Age, smoking Hospital-based
Age, gender, Hospital-based residence, social class
Age, gender, urban/rural status, residence, education, BMI, smoking, energy, mate drinking
Hospital-based
IARC Handbooks of Cancer Prevention Volume 8: Fruit and Vegetables
Author, year, Cases! Exposure Range Relative Stat. sign.* Adjustment Comments country controls, assessment contrasts risk for confounding
gender (no. of items) (no. of (95% CI) categories)
*p for trend when applicable
Author, year, Cases/cohort Exposure Range Relative Stat. sign. Adjustment Comments country size, gender assessment contrasts risk for confounding
(years (no. of items) (no. of (95% Cl) follow-up) categories)
Fraser etal., 14/34 198, FF0 (51) >3 vs <3/wk 0.21 (0.05— p= 0.097 Age, sex Incidence 1990, USA M, F (2) 1.45) Seventh-Day
6 y Adventists (58% actoovo vege- tarians), 3.7% current smokers
Frineas etal., 62/35 192, FFQ (127) > 15 vs < 9 1.00 Age Incidence 1997, USA F servings/wk (0.55-1.80) Postmenopausal
8 y (3) women
p for trend when applicable
234
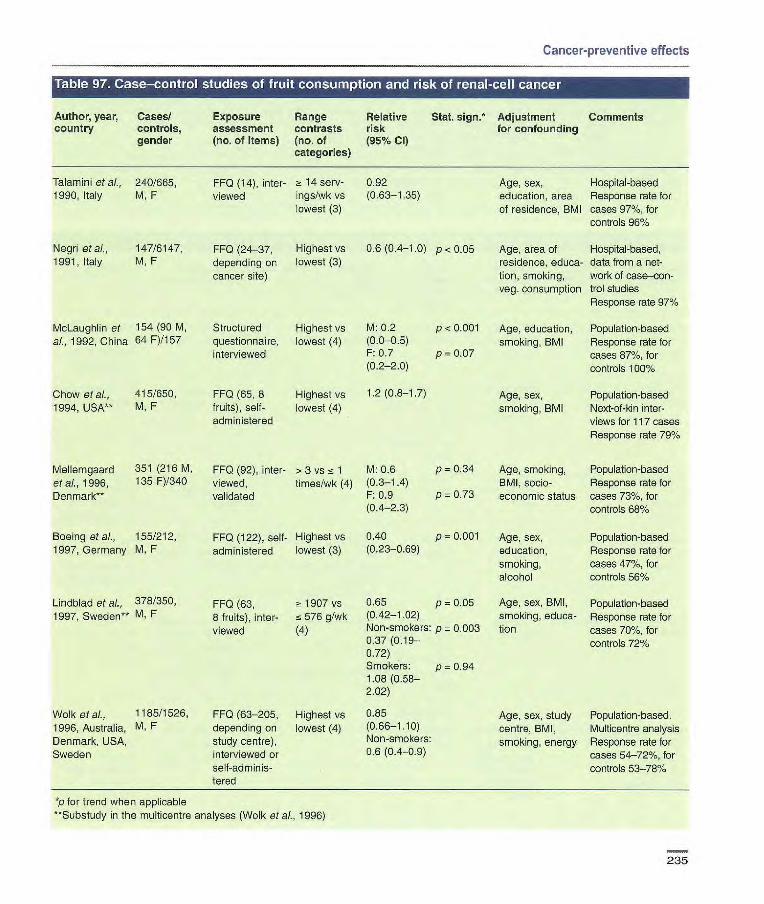
Cancer-preventive effects
Table 97. Case-control studies of fruit consumption and risk of renal-cell cancer
Author, year, Cases/ Exposure Range Relative Stat. sign.* Adjustment Comments country controls, assessment contrasts risk for confounding
gender (no. of items) (no. of (95% CI) categories)
Age, sex, Hospital-based education, area Response rate for of residence, BMI cases 97%, for
controls 96%
Age, area of Hospital-based, residence, educa- data from a net- tion, smoking, work of case—con- veg. consumption trol studies
Response rate 97%
Age, education, Population-based smoking, BMI Response rate for
cases 87%, for controls 100%
Age, sex, Population-based smoking, BMI Next-of-kin inter-
views for 117 cases Response rate 791%
1 (14), inter- 2! 14 serv- 0.92 viewed ings/wk vs (0.63-1.35)
lowest (3)
FF0 (24-37, Highest vs 0.6 (0.4-1.0) p < 0.05 depending on lowest (3) cancer site)
Structured Highest vs
M: 0.2 p < 0.001 questionnaire, lowest (4)
(0.0-05)
interviewed
10.7 p0.07 (0.2-2.0)
FF0 (65, 6 Highest vs
1.2 (0.8-1.7) fruits), self- lowest (4) administered
FF0 (92), inter- > 3 vs nz 1 M: 0.6 viewed, timeslwk (4) (0.3-1.4) validated F: 0.9
(0.4-2.3)
FF0 (122), self- Highest vs 0.40
administered lowest (3) (023-0.69)
FF0 (63, - 1907 vs 0.65 p = 0.05
8 fruits),inter- 576 9/wk (0.42-1.02)
viewed (4) Non-smokers: p 0.003 0.37 0.72) Smokers: p = 0.94 1.08 (0.58- 2.02)
FF0 (63-205, Highest vs 0.85 depending on lowest (4) (0.661.10)
study centre), Non-smokers:
interviewed or 0.6 (0.4-0.9)
self-adminis- tered
Talamini etal., 240/665, 1990, Italy M, F
Negri etal., 147/6147, 1991, Italy M, F
McLaughlin et 154 (90 M, al., 1992, China 64 F)/157
Chow etal., 415/650, 1994, USA** M, F
Mellemgaard 351 (216 M,
et al., 1996, 135 1 Denmark**
Boeing etal., 155/212, 1997, Germany M, F
Lindblad et al., 378/350
1997, Sweden** M, F
Wolk etal., 1165/1526,
1996, Australia, M, F Denmark, USA, Sweden
P = 0.001 Age, sex, Population-based education, Response rate for smoking, cases 47%, for alcohol controls 561%
Age, sex, BMI, Population-based smoking, educa- Response rate for tian cases 70%, for
controls 72%
Age, sex, study Population-based. centre, BMI, Multicentre analysis smoking, energy Response rate for
cases 54-72%, for controls 53-78%
P = 0.34 Age, smoking, Population-based BMI, socio- Response rate for
p 0.73 economic status cases 73%, for controls 68%
*p for trend when applicable **Substudy in the multicentre analyses (Wolk et al., 1996)
235

IARC Handbooks of Cancer Prevention Volume 8: Fruit and Vegetables
Author, year, Cases/cohort Exposure Range Relative Stat. sign. Adjustment Comments country size, gender assessment contrasts risk for confounding
(years (no. of items) (no. of (95°Io Cl) follow-up) categories)
Prineas et ai., 62/35 192, F FF0 (127) >27 vs < 1.44 Age Incidence 1997, USA 8 y 17 servings/wk (0.80-259) Postmenopausal
(3) women
Table 99. Case-control studies of vegetable consumption and risk of renal-cell cancer
Author, year, Cases/ Exposure Range Relative Stat. sign.* Adjustment Comments country controls, assessment contrasts risk for confounding
gender (no. of items) (no. of (95% Cl) categories)
McLaughlin et 154/157, al., 1992, M, F China
Chow et ai., 415/650,
1994, USA** M, F
Structured Highest vs. M 0.3 (0.1-0.7) p = 0.01 Age, education,
questionnaire, lowest (4) F 1.6 (0.6-46) p 0.33 smoking, BMI interviewed
FFQ (65, 9 M: 12.4 vs 1.0 (0.7-1.5) Age, sex, veg.), self- 5.1 servings! smoking, BMI administered wk (4)
F: ~t 14.1 vs. i~73 servings! wk (4)
Population-based Response rate for cases 87%, for controls 1000/6
Population-based Response rate 79%
Boeing et al., 155/212
FF0 (122), 1997, self-adminis- Germany
tered
Lindblad et 378/350 FF0 (63,13 aL,1997, veg.), mnter Sweden* viewed
Yuan et ai., 1204/1204 FF0 (40), 1998, USA M, F interviewed
Wolk et al., 1185/1526, FF0 (63-205, 1996, M, F depending on Australia, study centre), Denmark, interviewed or USA, Sweden self-adminis-
tered
Highest vs. 0.75 (0.44-1.27) p = 0.285 Age, sex, educa- Population-based lowest (3) tien, smoking, Response rate
alcohol for cases 47%, for controls 56%
816 vs < 084 (0.53-1.31) p = 0.74 Age, sex, BMI, Population-based
290 g/wk (4) Non-smokers: smoking, educa- Response rate 0.60 (0.30-1.16) p = 0.35 tion for cases 70%, Smokers: for controls 72% 1.04 (0.56-1.94) P = 072
Age, sex, educa- Population- tion, BMI, hyper- based, neigh- tension, smoking, bourhood analgesics, controls amphetamines
Age, sex, study Population-based centre, BMI, Multicentre smoking, energy analysis
Response rate for cases 54-72%, for con-trols 53-78%
Dark-green 0.51 (0.38-0.69) p < 0.001 veg.: ? 13.1 vs
2.0 times/mo (5) Yellow-orange 0.64 (0.48-0.86) p < 0.001 veg.: a 17.1 vs !c 43 times/mo (5)
Highest vs 0.81 (0.61-1 .08) lowest (4)
*p for trend when applicable. **Substudy in the multicentre analyses (Wolk et al., 1996)
236

Cancer-preventive effects
Author, year, Cased Exposure Range Relative Stat. sign. Adjustment Comments country cohort size, assessment contrasts risk for confounding
gender (years (no. of items) (no. of (96% Cl) follow-up) categories)
Prineas et al., 62/35 102. F FF0 (127) > 42 vs < 1.56 Age Incidence 1997, USA 8 y 28 serv- (0.83-2.92) Postmenopausal
ings/wk (3) women
Author, year. Cases/ Exposure Range Relative Stat. sign.* Adjustment Comments country controls, assessment contrasts risk for confounding
gender (no. of items) (no. of (95% Cl) categories)
NS Age, cigarette Population-based NS smoking, relative Response rate
weight 98%
Matched by age Population-based, neighbourhood controls Response rate for cases 73%
McLaughlin et M 313/428 FF0 (28), inter- Highest vs M: 1.5 al., 1984, USA F 182/269 viewed lowest (4) F: 0.7
Yu et al.. 1986, 160/160 FF0, interviewed No difer- USA M, F ence in con-
sumption of fresh fruit and veg. between oases and controls
* p for trend when applicable
237

IARC Handbooks of Cancer Prevention Volume 8: Fruit and Vegetables
Author, year, country
Cases! controls, gender
Exposure assessment (no. of items)
Range contrasts (no. of categories)
Relative Stat. sign.* risk (95% CI)
Adjustment for confounding
Comments
Hu etaL, 1998, 218(glioma)/ FF0 (15 fruit 46 vs 19 0.28 p 0.0005 Income, educa- Hospital-based China 436, and veg.),inter- kg!y (4) (0.16 tion, alcohol,
M, F viewed 0.51) selected occupa- tional exposures, veg.
Hu et al., 1999, 129 (73 glioma, FF0 (57, 5 Highest vs 0.15 p < 0.01 income, educa- Hospital-based China 56 menin- fruits), inter- lowest (4) (0.1-0.4) lion, cigarette Continuation of
gioma)/258, viewed smoking, alcohol, study of Hu etal., M, F selected occupa- 1998 with more
tional exposures, comprehensive energy questionnaire
* p for trend when applicable
Author, year, Cases/ Exposure Range Relative Stat. sign.* Adjustment Comments country controls, assessment contrasts risk for confounding
gender (no. of items) (no. of (95% Cl) categories)
Hu et cL, 1998, 218 (glioma)! FF0 (15 fruit z~ 125 vs i~ 0.51 p = 0.009 Income, edu(-,a- Hospital-based China 436, and veg.), inter- 84 kg/y (4) (0.29-0.89) tion, alcohol,
M, F viewed selected occupa- tional exposures, fruit
Hu etal., 129 (73 FF0 (57, 17 Fresh veg.: 0.29 p <0.01 Income, educa- Hospital-based 1999, China glioma, 56 veg.), inter- Highest vs (0.1-0.7) tion, cigarette Continuation of
menirgioma)/ viewed lowest (4) smoking, alcohol, study of Hu et al. 258, selected occupa- (1998) with more M, F tional exposures, comprehensive
energy questionnaire
Chen et al., 236 (glioma)/ FF0 (48), Highest vs 0.5 p = 0.06 Age, gender, Population-based 2002b, USA 449, interviewed lowest (4) (0.3-1.0) energy, respon- Response rate for
M, F by telephone dent type, educe- cases 90%, for tien level, family controls 71%, history, farming reinterviewed fol- experience lowing a previous
study
*p for trend when applicable
238

Adjustment Comments for confounding
Sex, birth order, Population-based birth weight. Study of primitive duration of breast neuroectodermal feeding for child, tumours (mostly age, history of medulloblas- miscarriage, tomas) month of first 74/ first eligible prenatal visit, control contacted educational level, income level for mother, use dur- ing pregnancy of cigarettes, bottled water, electric blanket, duration of nausea, child's diet in first year of life
Child's age and Population-based sex, maternal Response rate for age, number of identified cases years of schooling 69%, for eligible of the mother controls contacted
71.5%
Age, sex, Population-based mother's educa- Response rate for tior, mother's eligible cases BMI before preg- 85%, for controls nancy, vegetables, 60% cured meats
Age, sex, Population-based mother's educa- Response raie for tion, ever/never eligible cases use of a dummy, 85%, for controls other food groups 60%
Energy Population-based
Cancer-preventive effects
Author, year, Cases/ Exposure Range Relative Stat. sign.*
country controls, assessment contrasts risk gender (no. of items) (no. of (95% Cl)
categories)
Bunin et ai., 1661166 FF0, interviews Fruit and fruit 0.28 p 0.003 1993, USA of mothers juices: (0.14-0.59)
regarding their Highest vs
diet during preg- lowest (4) nancy
Cordier et al., 75/113, Interview on Fresh fruit: 0.6 1994, France M, F maternal diet Highest vs (0.1-3.0)
during pregnancy lowest (4)
McCredie et 82/164, FF0 based or > 952.3 vs 1.5 p = 0.39 al., 1994a, M, F maternal diet 'z 299.7 (0.6-3.7) Australia during preg- items/V (4)
nancy, inter- viewed
McCredie et al., 82/164, FF0 based Blended or 0.4 1994b, M, F or child's diet in solid fruit: (0.1-11)
Australia the perinatal and > 240 vs 'z
early postnatal 154.8
period, inter- times/first
viewed year (4)
Lubin et al., 300/574, FF0 (100), inter- Highest vs During
2000, Israel underage 10 viewed lowest (3) gestation: y,M,F 1.24 p0.50
(0.7-1.8) As a child: 1.24 p=0.39 (0.8-2.1)
*p for trend when applicable
239

Sex, birth order, Population-based birth weight, Study of primitive duration of breast neuroectodermal feeding for child, tumours (mostly age, history of medulloblas- miscarriage, tomas) month of first 74% first eligible prenatal visit, control contacted educational level, income level for mother, use during pregnancy of cigarettes, bottled water, electric blanket, duration of nau- sea, child's diet in first year of life
Age, sex, Population-based mother's educa- Response rate for tion, mother's eligible cases BMI before preg- 85%, for controls nancy, fruit, cured 60% meats
Energy Population-based
IARC Handbooks of Cancer Prevention Volume 8: Fruit and Vegetables
Author, year, Cases! Exposure Range Relative Stat. sign.* Adjustment Comments country Controls assessment contrasts risk for confounding
gender (no. of items) (no. of (95% Cl) categories)
Burin etal., 166/166 FF0, inter- Highest vs 0.37 (0.19-. p = 0.005 1993, USA views of moth- lowest (4) 0.72)
ers regarding their diet during pregnancy
McCredie et 82/164, FF0 based > 1109.9 vs 0.4 p = 0.06 al., 1994a, M, F or maternal <597.6 (0.1-1.0) Australia diet during itenls/y (4)
pregnancy, interviewed
Lubin et al., 300/574, FF0 (100), Highest vs During 2000, Israel underage interviewed lowest (3) gestation:
10, 1.25 p 0.35 M, F (0.8-1.9)
As a child: 1.30 p=0.24 (0.8-23)
*p for trend when applicable
240
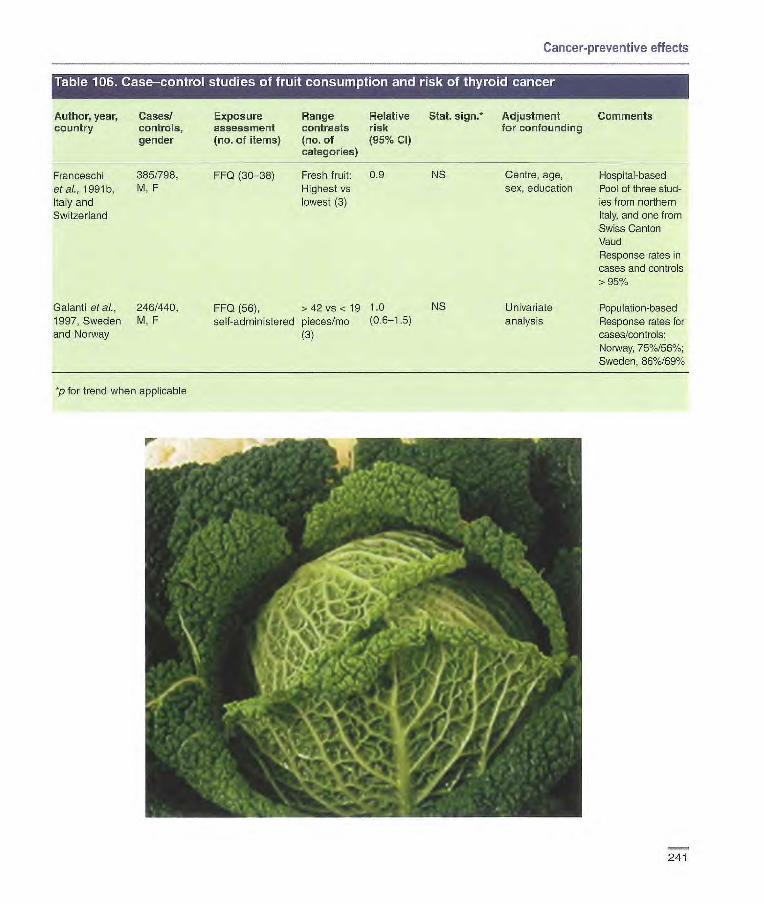
Cancer-preventive effects
Author, year, country
Cases/ controls, gender
Exposure assessment (no. of items)
Range contrasts (no. of categories)
Relative risk (95% Cl
Stat. 5jgfl* Adjustment for confounding
Comments
Franceschi 385/798, FF0 (30-38) Fresh fruit: 0.9 NS Centre, age, Hospital-based eta[, 1991b, M, F Highest vs sex, education Fool of three stud- Italy and lowest (3) ies from northern Switzerland Italy, and one from
Swiss Canton Vaud Response rates in cases and controls > 95%
Galanti et al., 246/440, FF0 (56), >42 vs < 19 10 NS Univariate Population-based 1997, Sweden M, F self-administered pieces/mo (0.6-1.5) analysis Response rates for and Norway (3) cases/controls:
Norway, 75%/56%; Sweden, 86%/69%
*p for trend when applicable
1.,
r
241
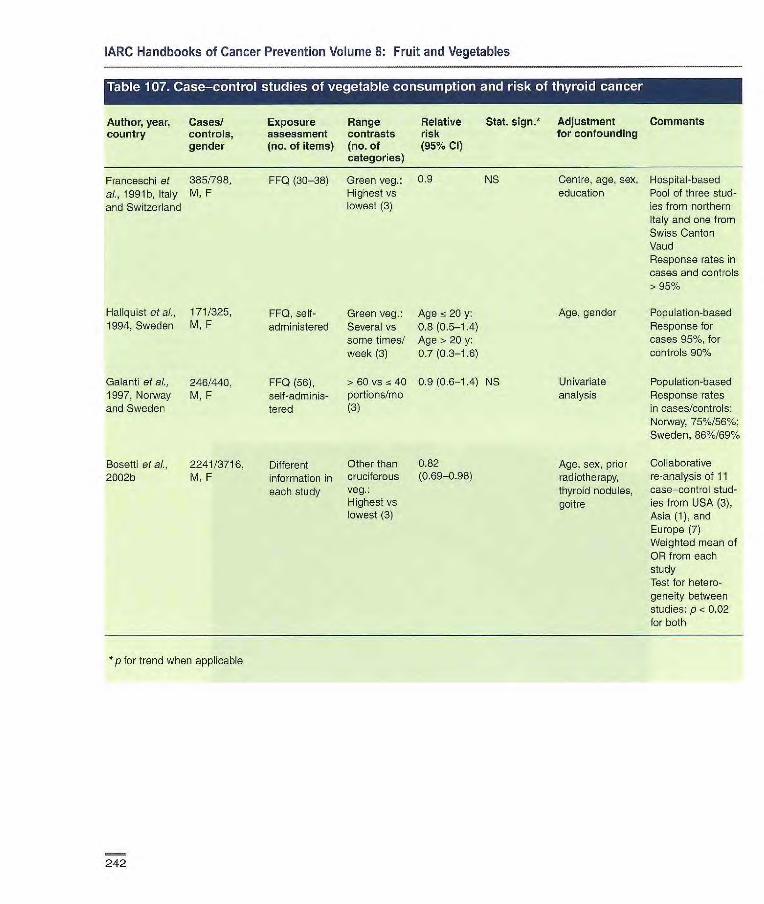
IARC Handbooks of Cancer Prevention Volume 8: Fruit and Vegetables
Author, year, Cases/
Exposure Range Relative Stat. sign.* Adjustment Comments country controls, assessment contrasts risk for confounding
gender
(no. of items) (no. of (95% Cl) categories)
Franceschi at 385/798, FFQ (30-38) Green veg.: 0.9 NS Centre, age, sex, Hospital-based ai., 1991b, Italy M, F Highest vs education Pool of three stud- and Switzerland lowest (3) ]es from northern
Italy and one from Swiss Canton Vaud Response rates in cases and controls > 95°J
HaLiquist at ai., 171/325, FF0, self- Green veg.: Age 20 y: Age, gender Population-based 1994, Sweden M, F administered Several vs 0.8 (0.5-1.4) Response for
some times! Age > 20 y: cases 95%, for week (3) 0.7 (0.3-1.8) controls 90%
Galanti at al., 246/440, FF0 (56), > 60 vs fc 40 0.9 (0.6-1.4) NS Univariate Population-based 1997, Norway M, F self -adminis- portions/mo analysis Response rates and Sweden tered (3) in cases/controls:
Norway, 75%/56%; Sweden, 86%/69%
Bosetti at al., 2241/3716, Different Other than 0.82 Age, sex, prior Collaborative
2002b M, F information in cruciterous (0.69-0.96) radiotherapy, re-analysis of 11
each study Veg.: thyroid nodules, case—control stud- Highest vs goitre ies from USA (3), lowest (3) Asia (1), and
Europe (7) Weighted mean of OR from each study Test for hetero- geneity between studies: p < 0.02 for both
*p for trend when applicable
242

Cancer-preventive effects
Author, year, Cases/ Exposure
Range Relative
Stat. sign? Adjustment Comments country cohort size, assessment
contrasts risk
for confounding gender (years (no. of items)
(no. of (95% Cl)
follow-up)
categories)
Chiti etal., 104/35 156, Semi-quantitative > 84 vs < 0.67 p= 0.09 Age, energy Incidence 1996, USA F FFQ (126) 54 serv- (0.41-1.08) Iowa Women's
7 y ings/mo (3) Health Study
Zhang et a/., 199/88 410, Semi-quantitative a 3 vs - 1 0.79 p 0.39 Age, energy, Incidence 2000, USA F FFQ ((31) servingsfd (0.49-1.27) length of follow-up, Nurses' Health
14 y (4) geographical Study region, cigarette smoking, height, beet, pork or lamb as a main dish
p for trend when applicable
243

IARC Handbooks of Cancer Prevention Volume 8: Fruit and Vegetables
Table r[,IX Case—control studies Ifruit iconsumption ia and Itfl . non—Hodgkin Jj1 ir'iiii.
Author, year, Cases/controls, Exposure Range Relative Stat. sign. Adjustment Comments country gender assessment contrasts risk for confounding
(no. of items) (no. of (95% CI) categories)
Tavani etal., 429/1157 FF0 (14) Highest 0.9 NS Centre, age, sex Hospital-based 1997, Italy M, F vs lowest (3) Response rates
Table 110. CohortrTr l!T of vegetable consumption 11i1J1 'Inon-Hodgkin
Author, year, Cases/ Exposure Range Relative Stat. 5jgfl•* Adjustment Comments country cohort size, assessment contrasts risk for confounding
gender (years (no. of items) (no. of (95% Cl) (follow-up) categories)
Hirayama, 219 lymphe- FF0 (7) Green-yel- 1.15 Not reported Mortality 1990, Japan sarcoma, 29 low veg.: (90% Cl, Census-based
other lympho- Daily vs 0.95-1.40) cohort in seven ma/265 116, non-daily prefectures M,F (2) 17 y
Chiu etal., 104/35156, Semi-quantitative >98 vs < 0.96 p 0.86 Age, energy Incidence
1996, USA F FF0 (126) 62 serv- (0.58-1.60) Iowa Women's
7 y ings/mo (3) Health Study
Zhang et at., 199/88410, Semi-quantitative 3 vs < 1 0.65 p = 0.04 Age, energy, Incidence
2000, USA F FF0 (61) servings!d (0.37-1.13) length of follow-up. Nurses' Health 14 y (4) geographical Study
region, cigarette smoking, height, beef, pork or lamb as a main dish
p for trend when applicable
244
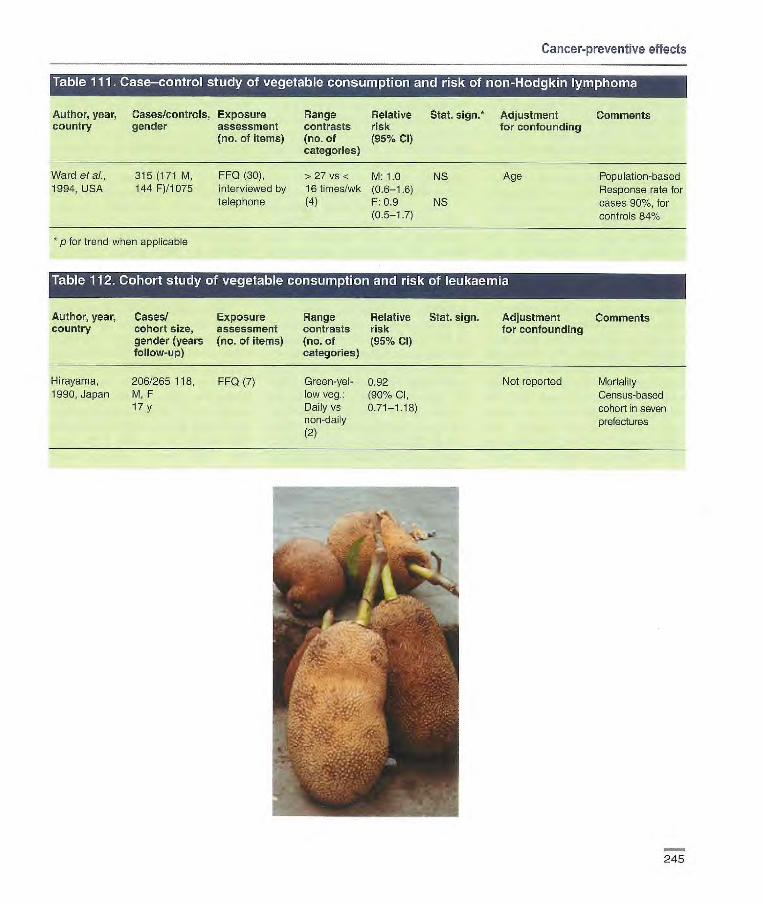
Cancer-preventive effects
• tI'JL•
Author, year, Cases/controls, Exposure flange Relative Stat. sign.* Adjustment Comments country gender assessment contrasts risk for confounding
(no. of items) (no. of (95% Cl) categories)
Ward et a)., 315 (171 M, FF0 (30), >27 vs < M: 1.0 NS Age Population-based 1994, USA 144 F)11075 interviewed by 16 times/wk (0.6-1.6) Response rate for
telephone (4) F: 0.9 NS cases 90%, for (0.5-1.7) controls 84%
*p for trend when applicable
Table 112. Cohort study of vegetable consumption and risk of leukaemia
Author, year, Cases! Exposure Range Relative Stat. sign. Adjustment Comments country cohort size, assessment contrasts risk for confounding
gender (years (no. of items) (no. of (95% Cl) follow-up) categories)
Hirayama, 206/265 118, FF0 (7) GreenyeI- 0.92 Not reported Mortality 1990, Japan M, F low veg.: (90% CI, Census-based
17 y Daily vs 0.71-1.18) cohort in seven non-daily prefectures (2)
u 245
IARC Handbooks of Cancer Prevention Volume 8: Fruit and Vegetables
Preventable fraction The proportion of any disease poten-tially preventable by modification of a risk factor in a population is deter-mined by both the strength of the risk factor, as represented by the relative risk, and the prevalence of the risk fac-tor. This proportion is commonly known as the preventable fraction (also sometimes called the population attributable risk) (WHO, 2002). The certainty in any estimate of pre-ventable fraction, including that for the fraction of cancers that is due to low intake of fruit and vegetables, is dependent on the precision of both the relative risk associated with low intake and the proportion of the population consuming low levels. The review pre-sented earlier in this chapter makes it clear that many of the relative risk esti-mates are uncertain and that the prevalence of exposure to low intake varies widely across studies and cancer sites. Therefore, confidence in an estimate of any particular cancer's preventable fraction for low fruit and vegetable intake must be low.
Nevertheless, the Working Group calculated the preventable fractions for cancer sites for which it judged there was at least limited support for a causal association, in order to estimate the approximate extent of the potential prevention that could be linked to increasing fruit and vegetable intake. Although the relative risks and prevalences of low intake vary widely between studies, in many of the studies reviewed, the levels of fruit and vegetable intake being compared were the highest versus lowest quartiles or tertiles (i.e., range of prevalence of low intake 25% to 33%), and the relative risk estimates were generally in the range of 20% to 30% lower risk for subjects in the highest category of intake. Applying this range of risk difference to the range of prevalence of low intake, the preventable fraction for low fruit and vegetable intake would
fall into the range of 5-12%. It is important to recognize that this is only a crude range of estimates and that the proportion of cancers that might be preventable by increasing fruit and vegetable intake may vary beyond this range for specific cancer sites and across different regions of the world.
There have been many estimates of the fraction of cancer preventable by increasing fruit and vegetable intake based on individual case—control studies, but only two based on meta-analyses. Van't Veer et al. (2000) reviewed published studies and esti-mated the population attributable risks for all cancer sites due to consumption of 250 grams of fruit and vegetables per day as compared to the recom-mended 400 grams per day. They made three estimates based on differ-ent assumptions of the size of the relative risks: a best guess estimate (19%), an optimistic estimate (28%), and a conservative estimate (6%). Norat and Riboli (2002) estimated the preventable fractions for oesophageal, stomach and colorectal cancers in various populations around the world using relative risks derived from a meta-analysis of published studies (largely from developed countries), coupled with regional prevalence estimates derived from sources includ-ing FAC data. This approach led to estimates of the proportion of cancers preventable by increasing fruit and vegetable intake from current levels to 350 grams per day in the range of 8-10% for colorectal cancer and 20-30% for oesophageal and gastric cancers; these estimates varied sub-stantially in different regions of the world.
The preventable fraction estimates of 5-12% for the groups of cancers evaluated here as having limited evi-dence for an inverse association with fruit and vegetable consumption are similar to the estimates for all cancer sites made by van't Veer et al., and to
the estimates for colorectal cancer by Norat and Riboli, but they are lower than the Norat and Riboli estimates for oesophageal and stomach cancers. The range of estimates of the fraction of selected cancers preventable by increasing intake of fruit and vegeta-bles is only an approximation. The true relative risk for low intake is quite uncertain given limitations in dietary assessment and in study designs. In addition, the mix of various cancers as well as the prevalence of low intake can vary substantially across different populations.
The present estimates for the frac-tion of selected cancers preventable by increasing fruit and vegetable intake could be either high or low. They would be too high if the relative risk estimates on which the measure is based are inflated by biases in study design and/or uncontrolled confound-ing by other factors. On the other hand, they would be too low if the rela-tive risks were underestimated because of misclassification arising from random errors in estimating dietary intake. In addition, benefits of increasing fruit and vegetable intake may well extend beyond those at the lowest levels of intake. Shifting the diets of entire populations over long periods to lower levels of risk can have a greater impact on population health than reducing risk only for a subgroup at highest risk (Rose, 1985). Increasing fruit and vegetable intake in populations is likely also to be accom-panied by other beneficial changes in diet composition and in other chronic diseases.
Ecological studies Ecological studies are analyses of associations between characteristics of populations and disease rates in populations. The essential feature of an ecological study is that populations, rather than individuals, are the unit of analysis. Populations compared with
246

Cancer-preventive effects
the ecological design can be popula-tions in different countries, populations in different regions within a single country, or the same population across different times. Ecological studies can also compare populations defined by characteristics such as religion, racial/ethnic characteristics or special historical circumstances, such as the experience of famine. Thus, ecological studies, also referred to sometimes as correlational studies, can be cross-sectional or longitudinal.
The study of changing disease risk among people who migrate from one country to another combines the elements of geography and time in ecological analysis. Migrant studies build on geographical studies, as they are uncontrolled experiments in which presumed changes in lifestyle related to migration (notably diet) can be assessed as affecting cancer risk. The appeal of migrant studies is the inter-nal control for the many characteristics of people that are unchanged after migration, notably the inherited geno-type of individuals. Changes in cancer risk with migration have therefore been critical observations for estimating the proportion of differences in cancer risk between countries that may be due to genetic rather than non-genetic etiol-ogy (Doll & Peto, 1981).
The main weakness of ecological studies is suggested by their inherent design - that the characteristics being examined are population-level charac-teristics and cannot be directly linked to individual disease risk. Confounding at the population level between a sus-pected risk factor and disease cannot be accounted for properly in ecological studies (Morgenstern, 1995; Green-land, 2001). Thus, ecological studies may result in biased estimates of the true individual-level relationship between exposure and disease risk - a problem that is known as the eco-logical fallacy" - and group-level asso-ciations may be reflective only of the
spurious association between the fac-tor of interest and other truly causal factors.
Ecological studies of differences diet and disease between regions within a single country and ecological studies comparing changes in diet with changes in disease across time within a single population are somewhat less susceptible to the ecological fallacy than are international ecological stud-ies. This is because cultural differences apart from diet may be fewer across regions within a single country or across time in a single population. However, the very presence of varia-tion between regions or over time in diet and disease suggests that there may also be other differences that could confound the association. Because of this important limitation, ecological studies have usuaHy been regarded solely as hypothesis-gener-ating.
Despite these weaknesses, eco-logical studies do offer substantial strengths for elucidating relationships between diet and cancer. If factors in the diet affect cancer risk only over long periods of time, perhaps even across generations, it becomes very difficult or impossible to estimate the relevant exposures to diet at the indi-vidual level. The ecological study design, in which long-term diet differ-ences between populations can be examined, may offer a better means to observe hypothesized associations between long-term dietary exposures and cancer risk. When a hypothesized dietary exposure is very specific and discrete (e.g., soy), ecological studies can be more useful. When the expo-sure is less specific, such as total fruit and vegetable intake, ecological stud-les are less useful. The presence of a biologically plausible link between aspects of diet and particular cancers can help to strengthen the internal consistency of ecological studies. With fruit and vegetables and cancer, how-
ever, there is little specificity for cancer types that can be useful in this regard.
Ecological studies can be refined by correlating disease rates and dietary exposures within specific sub-groups of the population for which both disease rates and diet can be strati-fied, such as age and gender. This type of detail is usually available for disease rates, but is often lacking in the dietary data used in ecological analyses. If ecological associations are to be interpreted as causal, the argument for the proper temporality of the relationship between diet and dis-ease can be strengthened by lagging the analysis so that the dietary mea-sures precede the disease rates. Information on diet lagged by 10 years or more may be more relevant than contemporaneous information to can-cer rates in a population. This type of lagging of analyses is often not possi-ble, however, due to insufficient histor-ical information.
Cancer rates used in ecological analyses can be either mortality rates or incidence rates. In either case, attention to the quality of the cancer data is important, especially for com-parisons between countries or across long time periods. Equally important is attention to the quality of the dietary data. Indicators as crude as the popu-lation-level estimates of food intake derived from crude agricultural data sources, or as refined as population-representative diet surveys, have been used. Even with the best possible measures of cancer risk and food intake, however, the fundamental problem of the ecological fallacy will render any association observed in an ecological study no more than sugges-tive of a causal relationship.
Table 113 summarizes findings from two types of study - cross-sec-tional ecological studies comparing countries and those comparing regions within countries. Table 114 summa-rizes studies that analysed the rela-
247

IARC Handbooks of Cancer Prevention Volume 8: Fruit and Vegetables
tionship between fruit and vegetable intake and changes in cancer risk within single populations over time.
Cross-sectional studies between countries International cross-sectional studies look for relationships between levels of fruit and vegetable intake and cancer rates among populations defined by national boundaries. In such studies, the cancer rates are either mortality or incidence rates as collected by each country, and the dietary data are typi-cally crude food disappearance estimates from agricultural sources such as the food balance sheets, which are country-level estimates of food consumption at the population level as estimated by the Food and Agricultural Organization (FAO) (see Chapter 3).
A classic analysis of the associa-tion between food consumption pat-terns and cancer rates between coun-tries (Armstrong & Doll, 1975) showed rather strong associations of several factors, such as fat, in the diet with several common cancers. Associa-tions with fruit and/or vegetable intake were reported for cancers of the liver, breast, ovary and kidney. Positive associations were seen between fruit intake and cancers of the breast and ovary, while inverse associations were seen between fruit intake and liver cancer, and between vegetable intake and kidney cancer. In a similar analysis by Rose et aI. (1986), inverse associa-tions were observed between fruit intake and ovarian cancer, and between vegetable intake and cancers of the colon (for women only), breast, ovary and prostate. Thouez et al. (1990) reported an inverse association between energy intake from vegeta-bles and oesophageal and pancreatic cancer across 29 countries, and a study by Hebert et aI. (1993) including 59 countries showed inverse associa-tiens of both fruit and vegetables with
oesophageal and oral cancers. A posi-tive association between calorie intake from vegetables and cancer of the stomach was reported by Thouez et al. (1990), but that association was dimin-ished after adjustment for age differ-ences between countries. The rates of lung cancer across 10 nations in the South Pacific were found to be inversely associated with the intake of yellow-orange vegetables in models that adjusted for demographic differ-ences as well as tobacco use and other dietary factors (Le Marchand et al., 1995). Hebert and collaborators reported little relationship between fruit and vegetable intake and cancer of the bladder across 50 countries (Hebert & Miller, 1994) and little relationship between breast cancer and fruit intake across 66 countries (Hebert & Rosen, 1996), but there was a modest inverse association between cabbage intake and breast cancer (Hebert & Rosen, 1996). Another ecological study across 28 countries showed an inverse asso-ciation between tomato consumption and prostate cancer risk (Grant, 1999), though this was found only with multi-variate models also containing non-tat milk intake (data not shown). This analysis was inspired by observations from case—control and cohort studies of a protective association between tomato intake and prostate cancer risk, and provides a good example of the use of ecological studies to support or refute hypotheses emerging from stud-ies with other designs.
In sum, the international studies tend to report more inverse associa-tions than positive associations between cancer rates and intake of fruit and vegetables. These associa-tions are generally stronger for vegeta-bles than for fruit. There are many reported associations that are null, however, and the various reports cannot be easily compared due to dif-ferent methods of analysis, different time periods of collection of cancer
and diet data, the high likelihood of selective reporting of findings by can-cer site, by food typo, and according to the strength and statistical significance of the observations. It is quite possible, therefore, that the number of null associations is greater than the selec-tive literature suggests.
Cross-sectional studies between regions within countries Regional cross-sectional studies look for relationships between levels of fruit and vegetable intake and cancer rates across populations defined by regional boundaries within countries. In such studies, the cancer mortality or inci-dence data are usually collected in a uniform way across regions, and the dietary data are usually much more detailed and reliable than the FAO data, often being derived from national surveys of food intake as reported by individuals.
Bingham et al. (1979) reported strong inverse associations between intake of vegetables (other than potatoes) and colon cancer, using data from diet surveys in nine different regions of the United Kingdom. Shimada (1986) used similar methods to show an inverse association between vegetable intake and stomach cancer in five regions of Japan. The most extensive within-country ecological study ever con-ducted is the analysis of cancer rates in relation to diet across 65 counties in China (Zhuo & Watanabe, 1999). In this ambitious project, two communes in each of 65 Chinese counties were selected for dietary assessments, which included not only dietary measurements from households but also collection of samples from individ-uals for nutritional biomarker measure-ments. The study was substantially weakened by the use of cancer rates for a time period preceding the dietary assessments. Modest correlations, either positive or inverse, with fruit and
248
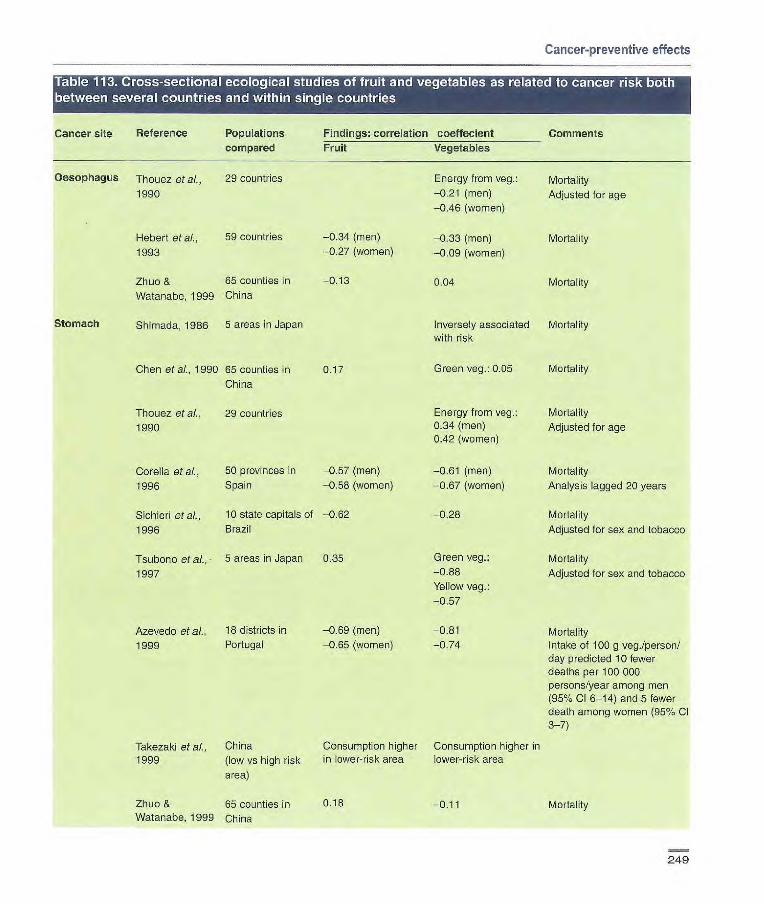
Cancer-preventive effects
Cancer site Reference Populations compared
Oesophagus Ti et at,, 29 countries
1990
Hebert et ai., 59 countries
1993
Zhuo & 65 counties in
Watanabe, 1999 China
Stomach Si 1956 5 areas in Japan
Chen at aL, 1990 65 counties in China
Ttiouez et al., 29 countries 1990
Findings: correlation coeffecient Comments Fruit Vegetables
Energy from veg.: Mortality -0.21 (men) Adjusted for age -0.46 (women)
-0.34 (men) -0.33 (men) Mortality -0.27 (women) -o.o (women)
-0.13 0.04 Mortality
Inversely associated Mortality with risk
0.17 Green veg.: 0.05 Mortality
Energy from veg.: Mortality 0.34 (men) Adjusted for age 0.42 (women)
-0.61 (men) Mortality
-0.67 (women) Analysis lagged 20 years
-0.28 Mortality
Adjusted for sex and tobacco
Green veg. Mortality -0.88 Adjusted for sex and tobacco Yellow veg.:
-0.57
Corella eta]., 50 provinces in -0.57 (men)
1996 Spain -0.55 (women)
Sichieri et al., 10 state capitals of -0.62
1996 Brazil
Tsubono et al., 5 areas in Japan 0.35
1997
Azevedo et al., 18 districts in -0.69 (men) -0.81 Mortality 1999 Portugal -0.65 (women) -0.74 Intake of 100 g veg./person/
day predicted 10 fewer deaths per 100 000 persons/year among men (95% Cl 6-14) and 5 fewer death among women (95% Cl 3-7)
Takezaki et al., China Consumption higher Consumption higher in 1999 (low vs high risk in lower-risk area lower-risk area
area)
Zhuo & 65 counties in 0.15 -0.11 Mortality Watanabe, 1999 China
249

-0.94
0.06 (men) -0.17 (women)
Green veg.:
-0.03
0.09
-0.13
Mortality
Mortality
Adjusted for age
Mortality
Mortality
Adjusted for sex and
tobacco
Mortality
Incidence
Green veg.: Mortality
0.11
Calories from veg.: Adjusted for age
-0.58 (men) -0.56 (women)
Yellow-orange veg.: Incidence associated with Multivariate models adjust- decreased risk ing for age, sex, tobacco, (p0.06) and selected other dietary
factors
Green veg.: Mortality 0.15 (men) 0.22 (women)
Mortality
-0.11 Mortality
Ad)usted for age
Green veg.: Mortality -0.16-0.02
IARC Handbooks of Cancer Prevention Volume 8: Fruit and Vegetables
Cancer site Reference Populations Findings correlation coeffecient Comments
compared Fruit Vegetables
Colon
Liver
Pancreas
Lung
Breast
Bingham at al., 9 regions in Great
1979 Britain
Rose at al., 30 countries 0.03 (men)
1986 -0.03 (women)
Chen etal., 65 counties in China -0.08
1990
Sichieri et al., 10 state capitals of -0.05
1996 Brazil
Zhuo & 65 counties in China -0.08 Watanabe, 1999
Armstrong & 23 countries -0.38 (men) Doll, 1975 -0.46 (women)
Chen at al., 65 counties in China -0.06 1990
Thouez et al., 29 countries 1990
Vioque etal. Regions of Spain Fruits, other than
1990 citrus; -2.01 (men)
Le Marchand at 10 island nations of aL, 1995 the South Pacific
Chen at al., 65 counties in China -0.22 (men) 1990 -0.20 (women)
Armstrong & 32 countries 0.44 Doll, 1975
Rose at ai., 30 countries 0.09 1986
Chen at al., 65 counties in China -0.09 1990
250
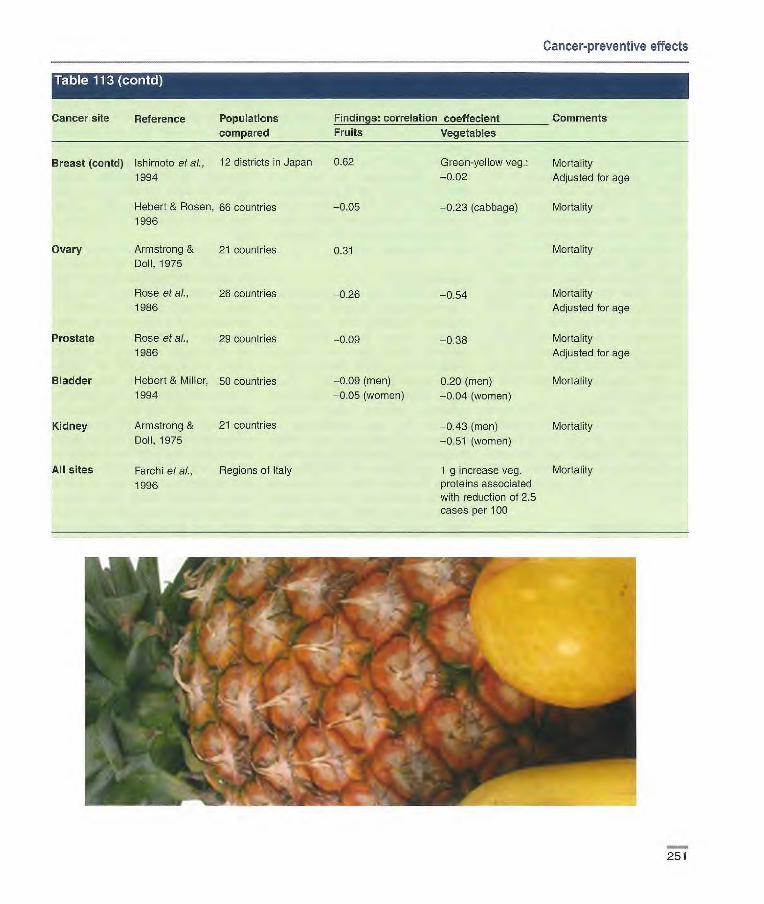
Cancer-preventive effects
Cancer site Reference Populations Findings: correlation coeffecient Comments
compared Fruits Vegetables
Breast (contd) Ishimoto et at., 12 districts in Japan 0.62 Green-yellow veg.: Mortality 1994 —0.02 Adjusted for age
Hebert & Rosen, 66 countries —0.05 —0.23 (cabbage) Morta ity 1996
Ovary Armstrong & 21 countries 0.31 Mortality Doll, 1975
Rose et ai., 26 countries 0.26 —0.54 Morts ity 1986 Adjusted for age
Prostate Rose et al., 29 countries 1986
Bladder Hebert & Miller, 50 countries 1994
Kidney Armstrong & 21 countries
Doll, 1975
All sites Farchi et al., Regions of Italy
1996
—0.09 (men)
—0.05 (women)
—0.38
020 (men)
—0.04 (women)
0.43 (men) —0.51 (women)
1 g increase veg. proteins associated with reduction of 2.5 cases per 100
Morts ity
Adjusted for age
Mortality
Mortality
Mortality
251

IARC Handbooks of Cancer Prevention Volume 8: Fruit and Vegetables
vegetable intake were found for several cancer sites. Fruit intake was inversely associated with risk of stom-ach cancer across 50 provinces in Spain (Corella et al., 1996), 10 states in Brazil (Sichieri etaL, 1996) and 18 districts in Portugal (Azevedo et al., 1999), and between high- versus low-risk areas in China (Takezaki et al., 1999); but the corresponding associa-tion was positive with stomach cancer across the 65 counties in China (Chen et al., 1990) and across five areas in Japan (Tsubono et al., 1997). Vege-table intake has been consistently observed to be inversely associated with risk for stomach and colon can-cers in many countries (Bingham etaL, 1979; Shimada, 1986; Corella et al., 1996; Sichieri etaL, 1996; Tsubono et aL, 1997;Azevedoetal., 1999;Zhuo& Watanabe, 1999).
In sum, studies of correlations between cancer rates and diet within countries also tend to show inverse associations between fruit and veg-etable intake and many cancers, espe-cially cancers of the stomach and colon.
Time trend studies Analyses of time trends are ecological studies correlating fruit and vegetable intake with cancer rates over time either within a single population or across several populations. These studies suffer from the same ecologi-cal fallacy as the cross-sectional studies among and within countries, but they have the advantage of follow-ing the same population over time. Since many characteristics of the pop-ulation do not change over time, the number of potential confounding factors is reduced. Table 114 surnma-rizes findings from the few such studies that have examined fruit and vegetables specifically. The analyses of temporal relationships between fruit and vegetables and cancer have had a
variety of methods and mixed findings. The most consistently reported inverse associations have been for stomach cancer (Jedrychowski & Popiela, 1986; Swistak et al., 1996; Tominaga & Kuroishi, 1997). The interpretation of these observations is particularly difficult, however, due to potential con-founding by improving socioeconomic conditions that have led to both a more varied diet and a lower risk of infection with He/icobacter pylon.
Migrant studies Migrant studies are ecological studies examining cancer rates in relation to migration of people from countries of differing cancer rates. Studies of migrants from Asia to America (Ubukata et al., 1986; Story & Harris, 1989) showed that migrants them-selves tended to retain Asian dietary patterns, whereas their children acquired the food preferences of America. Such changes, either within the generation of migrants or in subse-quent generations of their offspring, feature increased intake of meats and fats and decreased intake of vegeta-bles (Lee et al., 1999). This shift to a more western diet is associated with substantial increases in the risk of can-cers of the breast (Wu & Bernstein, 1998) and colon (Bernstein & Wu, 1998). Ziegler et al. (1993) conducted a large, population-based case—con-trol study that in many ways serves as an example of how migration can be better studied. They assessed migra-tion effects on breast cancer for child-hood, adolescent and adult exposures among Asian-American women in California by interviewing both study participants and their mothers. They found a gradient in breast cancer risk related to migration history that was quite comparable with the international differences in breast cancer incidence rates.
Summary Ecological analyses have been generally consistent with the hypothe-sis that increased fruit and vegetable intake is associated with lower risk of cancer at many sites. International cor-relational studies, studies across regions in single countries and studies of time trends and migrating popula-tions are all congruent in this conclu-sion.
Ecological studies offer both limita-tions and advantages for assessing the relationship between fruit and veg-etable intake and cancer risk. The large contrasts between countries in diet that reflect long-term dietary differ-ences over decades or entire lifetimes are difficult to measure in studies based on assessments of dietary exposures in individuals. The strength of ecological studies is their ability to examine such long-term differences. Their weakness is that there are many confounding factors that limit the ability to conclude causality attributable to any particular dietary factor. As fruit and vegetable intake varies substan-tially along with many other factors, including both dietary and non-dietary factors, any association between fruit and vegetable intake and cancer risk emerging from ecological analyses cannot be interpreted as causal. Another limitation is the apparently selective reporting of findings by can-cer site, food type, or non-null results.
Intermediate markers of cancer Experimental dietary studies in humans serve as an important link between the nutritional epidemiologi-cal studies and experiments con-ducted in animal models. They rely on intermediate end-points related to dis-ease risk, using biological markers that may also provide insight into the modes of action of fruit and vegetable constituents in humans. At the same time, they are limited by the sensitivity
252

Cancer-preventive effects
Cancer site Reference Country or areas Years of Findings: correlation coeffecient
Comments studied trend Fruit Vegetables
Stomach Jedrychowski Poland 1951-83 Fruit increased Veg. increased & Popiela, 1986 87%, while mortality 14%, while
decreased about mortality
50% decreased about
50%
Swistak et at, 4 European 1970-92 Mortality decreased Mortality
1996 countries as fruit increased decreased as veg.
increased
Tominaga & Japan 1955-93 —0.83 (men) Green yellow veg.: 10-year time lag Kuroishi, 1997 —0.82 (women) —0.38 (men) between diet and cancer
—0.40 (women) Adjusted for age Other veg:
—0.61 (men)
—0.62 (women)
Colon/rectum McMichael et 4 countries 1921-74 Fruit tended to be Veg. tended
aL. 1979 relatively stable, to be relatively while mortality stable, while mor-
varied depending tality varied
on country, age, depending cri
sex country, age, sex
Holmqvist, 15 European 1961-90 No consistent No consistent
1997 countries pattern of asso pattern of associa- dation tion
Tominaga & Japan 1955-93 0.81 (men) Green-yellow veg.: 10-year time lag Kuroishi, 1997 0.83 (women) 0.44 (men) between diet and cancer
0.40 (women) Adjusted for age Other veg.:
0.59 (men) 0.62 (women)
Breast Prieto-Ramos 50 provinces in 30 years Correlation Provinces with etaL, 1996 Spain between breast highest increase in
cancer mortality veg. consumption
rates in 1981-85 from 1964 to 1981 and fruit intake in had lowest breast
1964-65 cancer mortality Citrus fruit: —0.10 level in 1981-85
Other fresh fruit: —0.16
253
IARC Handbooks of Cancer Prevention Volume 8: Fruit and Vegetables
and specificity of the biological mark-ers, access to relevant biological spec-imens and the logistics of conducting experimental studies in humans. Most of the markers reflect very early processes in the pathways of carcino-genesis (e.g., carcinogen metabolism, adduct formation), since downstream signal-transduction markers relevant to cancer progression are lacking. These early markers may not associ-ate directly with cancer risk.
Dietary intervention studies in humans using disease end-points would provide the strongest evidence for an effect of fruit and vegetables on disease risk. However, such dietary intervention studies need to have thou-sands of participants in order to have sufficient statistical power and are very expensive. Issues such as timing and dose of the intervention, choice of study populations and compliance also influence interpretation of the results. As a result, no fruit and vegetable interventions have yet been conducted with cancer as the outcome.
Intervention studies This section reviews the human exper-imental studies that have examined the capacity of fruit and vegetables to modulate biological processes rele-vant to cancer (Table 115-119). Several of these studies were designed to test the effect of fruit and vegetables on biomarkers of cardio-vascular or other diseases. Results of these studies are applicable to cancer in so far as the markers are shared. The interventions differ greatly in dura-tion, sample size and study design. Study duration ranges from single doses to months or years of interven-tion and is typically determined by the biology of the marker and its respon-siveness to change. Ideally, sample size is dictated by the variance associ-ated with the biomarker and the statis-tical power needed to detect an effect of intervention, but in practice, logistic
and cost considerations often limit the sample size, so that the studies may be statistically underpowered to test effectively the fruit and vegetable treat-ments. The majority of intervention studies in humans have been of short duration and sample sizes have been small. No long-term, randomized clini-cal trials have tested solely the effects of increasing fruit and vegetable intake on intermediate cancer markers. Those that have included other diet alterations as part of the treatment, e.g., reduced energy intake from fat and/or increased whole grain intake (Schatzkin et al., 2000), have limited capacity to examine the effects of fruits and vegetables alone.
A variety of study designs have been used. Study designs described in the table as crossover or 'x-arm trial refer to randomized intervention stud-ies in which participants are recruited, screened for eligibility and interest in participating, randomly assigned to one or more interventions and/or con-trol groups and followed over time until the end of the study. Crossover studies may or may not include washout peri-ods between different treatments. Crossover designs lacking washout periods of sufficient duration are prone to carryover effects that can jeopardize interpretation of the results. Numerous studies examining effects of fruit and vegetables have employed less strin-gent designs that do not use random-ization or a control group. These designs include taking measurements before and after the intervention (e.g., pre—post) or the sequential addition
of treatments (tx) after an initial, dietary-restricted control period (e.g., "control—txl--tx2"). Interventions such as these have the potential to produce biased results.
The degree of dietary control also varies. In the following tables, con-trolled intervention refers to a study in which the diet is provided to study par-ticipants. In this type of study, volun-
teers may be free-living, eating the food at a feeding centre or taking it home, or they may be housed in a metabolic ward. There are also differ-ent degrees of control within these types of study; the loosening of control (e.g., including free days on which par-ticipants can deviate from the study diet, drink alcohol, etc.) is more char-acteristic of studies of longer duration, where long-term participant retention is often most challenging. The term supplementation of habitual diet"
refers to addition of fruit or vegetables to a participant's usual diet. This com-mon approach allows participants more control over their diets and mini-mizes metabolic effects of drastic changes in diet that are a potential problem with controlled interventions. In some cases, habitual diets may be modified to restrict particular foods (e.g., certain fruits and vegetables) that may influence the outcome of the study.
The following review is limited to plant foods, excluding grains, nuts, seeds, dried legumes, starchy tubers, spices and products used for infusions (e.g., teas).
Antioxidant effects (Table 115) Oxidative damage, resulting from an imbalance between free-radical gener-ation and antioxidant defence, has been hypothesized to play a role in cancer (Rock etal., 1996). The antiox-idant defence system has both enzy-matic and non-enzymatic components that prevent radical formation and remove radicals before damage can occur.
Antioxidant enzymes Several studies have reported altered activities of antioxidant enzymes in red blood cells (RBC) after fruit and veg-etable interventions; however, the responses have varied widely accord-ing to the type and dose of fruit or vegetable and only a few very different
254
Cancer-preventive effects
foods have been tested. In three stud-ies, RBC glutathione reductase activi-ties increased with spinach, parsley and grape-skin extract supplementa-tion (Castenmiller et al., 1999; Nielsen at al., 1999; Young et al., 2000). ABC glutathione peroxidase activity increased in interventions using grape-skin extract (Young at al., 2000) and blackcurrant and apple juice (Young at al., 1999) and was unchanged with onion and parsley (Lean et at, 1999; Nielsen et al,, 1999). ABC superoxide dismutase activity increased with pars-ley (Nielsen et ai., 1999) and was unchanged with onion (Lean et al., 1999) and with blackcurrant and apple juice (Young at al., 1999). Catalase activity decreased with spinach (Castenmiller at al., 1999) and was unchanged with parsley (Nielsen etaL, 1999), blackeurrant and apple juice (Young at aI., 1999) and grape-skin extract (Young et al., 2000).
Total antioxidant capacity The antioxidant capacity of fruits and vegetables has been measured in human intervention studies. Most inter-ventions relied on effects detectable in blood samples. Several assays mea-sure serum total antioxidant capacity ex vivo. These include oxygen radical absorbance capacity (ORAC), ferric-reducing ability (FRAP) and Trolox equivalent antioxidant capacity (TEAC). Typically, these markers are indicative of recent exposure to antioxidants (Mayne, 2003). Interventions with fruits and fruit juices led to an increase in total antioxidant capacity (Day at al., 1997; Cao at al., 1998a,b; Serafini at al.,1998; Aviram at al., 2000; Marniemi at al., 2000; Pedersen at al., 2000; van den Berg at al., 2001; Kay & Holub, 2002), whereas those with cruciferous and allium vegetables, spinach and tomatoes had no effect (Zhang et al., 1997; Cao at al., 1998b; Castenmiller et al., 1999; Lean et al., 1999; Bub et al., 2000; Pellegrini at al., 2000).
Oxidative damage If not quenched by antioxidants, free radicals react with, and may alter, the structure and function of a number of cellular components, such as lipid-containing cell membranes, lipopro-teins, proteins, carbohydrates, ANA and DNA.
Lipids Effects of fruits and vegetables on the susceptibility to oxidation of serum lipoprotein ex vivo have been explored extensively in relation to cardiovascu-lar disease; however, since lipid perox-idation products form adducts with DNA, they may also increase cancer risk (see section on mechanisms in this chapter). The majority of interven-tion studies found that low-density lipoprotein (LDL) oxidation was decreased and lag time to oxidation increased following supplementation of a wide range of fruits and vegeta-bles, including tomato products and juice at various doses (Agarwal & Rao, 1998; Bub at al., 2000), orange (Harats at al., 1998), grape (Day et al,, 1997) and pomegranate juices (Aviram at al., 2000), a mixture of vegetables (Hininger of al., 1997) and garlic pow-der (Phelps & Harris, 1993). Tomato or orange juice was not consistently effective; two studies reported no change in LDL oxidation with these juices (Abbey et al., 1995; Maruyama et al., 2001). Other treatments that did not significantly alter these markers included sea buckthorn juice (Eccieston at al., 2002) and aged gar-lic extract (Steiner & Lin, 1998). O'Reilly at al. (2001), testing the effects of onion and black tea supple-mentation, found no change in plasma F2-isoprostane or malondialdehyde-LDL autoantibody titre, suggesting no alteration in LDL oxidation in vivo. In addition, two studies have reported no change in urinary malondialdehyde with onion supplementation (Boyle at al., 2000) and with increasing fruit and
vegetable intake to twelve servings per day (Thompson et al., 1999a).
Proteins Five studies have tested the effects of fruit and vegetable interventions on plasma protein oxidation, specifically protein carbonyl formation. Three found no effect of intervention (Castenmiller at al., 1999; Nielsen at al., 1999; van den Berg et al., 2001). One reported an increase in formation of plasma 2-aminoadipic semialde-hyde (a specific carbonyl at lysine residues) with a blackcurrant–apple juice mixture (Young at al., 1999)—a prooxidant effect significantly positively correlated with plasma vitamin C con-centrations (Castenmiller at al., 1999; Dragsted at al., 2001). Another study reported a non-significant increase in oxidation with grape-skin extract (Young et al., 2000).
DNA oxidation and adduct formation Interaction of reactive oxygen or nitro-gen species with DNA bases can result in the formation of adducts, which, dur-ing the course of attempted repair or replication, can lead to mutations that may contribute to the development of neoplastic cells (see section on mech-anisms in this chapter). To test whether antioxidant scavenging of free radicals diminishes the production of DNA adducts, studies have measured oxidative DNA damage in humans in relation to various fruit and vegetable treatments. Urinary and/or peripheral blood leukocyte concentrations of 8- hydroxydeoxyguanosine (8-OHdG) were decreased after interventions with Brussels sprouts (Verhagen et al., 1995, 1997), various tomato products (Rehman at al., 1999; Chen et al., 2001b), vegetable juice (Fan at al., 2000) and a diet high in fruit and veg-etables (Thompson at al., 1999a). Results have been inconsistent for allium interventions (Hageman at al., 1997; Beatty at al., 2000; Boyle at al.,
255

ARC Handbooks of Cancer Prevention Volume 8: Fruit and Vegetables
11 I.] 11:4 04 .i pill ui IL' TL•i' Ll K 101 MA Ill (I &'&l lii MI ILM01 I Mr. liii L1)1 It t iii uc L11! l'A I ILTM ii•i 11111 r I No
Author, year, Subjects, age Study design Daily dose of food/agent Duration of Treatment outcomes
country (mean or range) intervention
Antioxidant enzymes
Castenmiller Healthy NS nor- Parallel arm; Txl: carotenod supplement; 3 wk Increased RBC glutathione et ai., 1999, molipidaemic, controlled inter- tx2: whole-leaf spinach 20 g/MJ, reductase and decreased cata- Netherlands 30 M, 42 F; vention tx3: minced spinach 20 g/MJ, lase activities with spinach. No
18-58 y tx4: liquefied spinach 20 g/MJ, effect on SOD, tx5: liquefied spinach 20 g/MJ + beetroot fibre 10 g/kg
Lean et al., Type li diabetics, Crossover, two- Onion 400 o + tea 250 mL or 14 d No effect on plasma SOD or glu- 1999, UK 5 M, 5 F; 50-74 y arm trial; supple- onion 400 g + ketchup 20 g + tathione peroxidase activity
mentation of Italian seasoning herbs I g +
restricted habitual tea 250 mL diet
Nielsen et al., NS, 7 M, 7 F; Crossover; Parsley 20 g/10 MJ 1 wk each Increased RBC glutathione 1999, 20-31 y controlled inter- tx reductase and SOD activities; Denmark venticn no effect on RBC catalase and
glutathione peroxidase
Young et aL. Healthy NS Crossover; Fruit juice (blackcurrant and 1 wk each Increased RBC glutathione per-
1999, 4 F, 1 M; supplementation apple juice, 1:1): 750, 1000 tx oxidase activity with Juice. No
Denmark 22-28 y of restricted and 1500 mL effect on glutathione reductase, habitual diet catalase and SOD
Young et al., Healthy NS Crossover; Grape-skin extract 600 mg 1 wk each Increased RBC glutathione
2000, 9 F, 6 M; supplementation tx reductase and glutathione
Denmark 21-33 y of restricted peroxidase activities. No effect habitual diet on catalase and SOD
Aviram et al., NS; Study 1: pre—post; Study 1: 50 mL pomegranate Study 1 2 Increased serum paraoxonase
2000, Israel Study 1: 13 supplementation juice wk Study 2: 3 of habitual diet Study 2: increasing doses of Study 2: 10 20-35 y Study 2: pre—post; pomegranate juice 20-80 mL wk
supplementation of habitual diet
Total antioxidant capacity
Day et al., Healthy adults, Pre—post; supple- Red grape juice concentrate I wk Increased serum TAC 1997, UK 6 M, 1 F mentation of 125 mL
habitual diet
Zhang et at., Healthy, 52 M, F 3-arm trial; supple- 8 m garlic oil or 1.0 g garlic 11 wk Increased plasma TAC at 4 and 1997, UK mentation powder 6 wk, but no difference at 11 wk
of habitual diet
Cao et al., Healthy NS, 8 F; 5 treatments Coconut drink or coconut drink Single dose, Increased serum TAC (ORAC, 1998a, USA mean age 66.9 y assigned to each + strawberries 240 9; ascorbic each 2 wk TEAC and FRAP) with all tx
subject in a acid 1250 mg; raw spinach apart and increased urinary TAC random sequence 294 g; red wine 300 mL (ORAC) with strawberries,
spinach and ascorbic acid
256

Cancer-preventive effects
Author, year, Subjects, age Study design Daily dose of food/agent Duration of Treatment outcomes
country (mean or range) intervention
Cao at al., Healthy, 17 M, Crossover; con- Txl: fruit and vegetables 10 15 d per tx Increased plasma TAC (CRAC) 1998b, USA 17 F; 20-40 y trolled intervention servings on both tx; no further effect of
and 60-80 y tx2: fruit and vegetables 10 broccoli servings + broccoli 2 servings (205 g) days 6-10
Serafini at al., Healthy non- Tx-tx2-tx3 1998, Italy smokers, 6 F, 4 M;
25-50 y
Castenrniller Healthy non- Parallel arm; et at, 1999, smokers, normo- controlled inter- Netherlands lipidaemic, 42 F, vention
30M; 18-58 y
Txl: dealcoholized red wine Single doses Increased plasma TRAP with 113 mL; tx2: dealcoholized per tx dealcoholized red wine white wine; tx3: tap water
Txl: carotenoid supplement: 3 wk No effect on plasma FRAP 1x2: whole-leaf spinach 20 g/MJ, tx3: minced spinach 20 g/MJ, tx4: liquefied spinach 20 g/MJ, tx5: liquefied spinach 20 g/MJ + beetroot fibre 10 gfkg
Lean et al., Type II diabetics, Crossover, two- Onion 400 g + tea 250 mL or 14 d No effect on plasma TEAC 1999, UK 5 M, 5 F; arm trial; supple- onion 400 g ± ketchup 20 g +
50-74 y mentation of Italian seasoning herbs 1 g + restricted habitual 250 mL diet
Leighton at Healthy omnivo- 2-arm trial; Mediterranean diet or high fat 3 months; increased plasma TAC with al., 1999, rous 42 M; controlled inter- diet; red wine 240 mUd added during the Mediterranean diet and with Chile 20-27y vention second wine in both diets
month wine added
Young at al., Healthy non- Crossover; Fruit juice (blackcurrant and 1 wk each tx No effect on plasma TEAC and 1999, smokers, 4F, 1 M; supplementation apple juice 1:1): 750, 1000 FRAP Denmark 22-28 y of restricted and 1500 mL
habitual diet
Aviram at at, Non-smokers Study 1: pre-post; Study 1: 50 mL pomegranate Study 1: 2 wk Increased serum TAC 2000, Israel M; supplementation of juice Study 2: 10
Study 1: 13 habitual diet Study 2: increasing doses of wk Study 2: 3 Study 2: pre-post; pomegranate juice 20-80 mL 20-35 y supplementation
of habitual diet
Hub et al., Healthy non- 1x1: tomato juice 330 mL; tx2: 2 wk each tx No effect on plasma FRAP 2000, smoking 23 M; carrot juice 330 mL; tx3: dried Germany 27-40 y spinach powder 10 g
Lee at at, Healthy, 5 F, 1 M; Txl: tomato soup 200 g + 7 d each tx Increased plasma FRAP with 2000, 20-24 y canned tomatoes 230 g + tomatoes + olive oil UK olive oil 20 mL
1x2: tomato soup 200 g + canned tomatoes 230 g + sunflower oil 20 mL
257
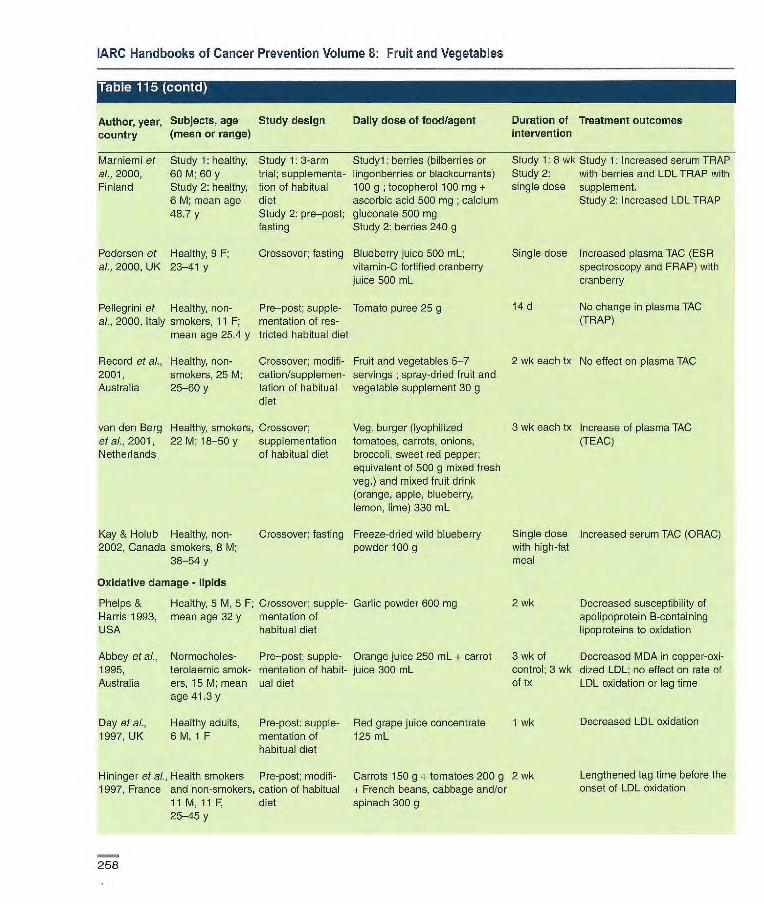
IARC Handbooks of Cancer Prevention Volume 8; Fruit and Vegetables
Author, year, Subjects, age Study design Daily dose of food/agent Duration of Treatment outcomes country (mean or range) intervention
Marniemi et Study 1: healthy, Study 1: 3-arm Studyl: berries (bilberries or Study 1: 8 wk Study 1: Increased serum TRAP al., 2000, 60 M; 60 y trial; supplementa- lingonberries or blackcurrants) Study 2: with berries and LDL TRAP with Finland Study 2: healthy, tian of habitual 100 g ; tocop hero l 100 mg + single dose supplement.
6 M; mean age diet ascorbic acid 500 mg ; calcium Study 2: Increased LDL TRAP 48.7 y Study 2: pro—post; gluconate 500 mg
fasting Study 2: berries 240 g
Pedersen et Healthy, 9 F; Crossover; fasting Blueberry juice 500 mL; Single dose Increased plasma TAC (ESR al., 2000, UK 23-41 y vitamin-C fortified cranberry spectroscopy and FRAP) with
juice 500 mL cranberry
Pellegrini et Healthy, non- Pro--post; supple- Tomato puree 25 g 14 d No change in plasma TAC al., 2000, Italy smokers, 11 F; mentation of res- (TRAP)
mean age 25.4 y tricted habitual diet
Record et al., Healthy, non- Crossover; modifi- Fruit and vegetables 5-7 2 wk each tx No effect on plasma TAC 2001, smokers, 25 M; cation/supplemen- servings ; spray-dried fruit and Australia 25-60 y tation of habitual vegetable supplement 30 g
diet
van den Berg Healthy, smokers, Crossover; Veg. burger (lyophilized 3 wk each Ix Increase of plasma TAC et al., 2001, 22 M; 18-50 y supplementation tomatoes, carrots, onions, (TEAC) Netherlands cf habitual diet broccoli, sweet red pepper;
equivalent of 500 g mixed fresh veg.) and mixed fruit drink (orange, apple, blueberry, lemon, lime) 330 mL
Kay & Holub Healthy, non- Crossover; fasting Freeze-dried wild blueberry Single dose Increased serum TAC (ORAC) 2002, Canada smokers, 8 M; powder 100 g with high-fat
38-54 y meal
Oxidative damage - lipids
Phelps & Healthy, 5 M, 5 F; Crossover; supple- Garlic powder 600 mg 2 wk Decreased susceptibility of Harris 1993, mean age 32 y mentation of apolipoprotein B-containing USA habitual diet lipoproteins to oxidation
Abbey eta]., Normocholes- Pro—post; supple- Orange juice 250 mL + carrot 3 wk of Decreased MDA in copper-oxi- 1995, terolaemic smok- mentation of habit- juice 300 mL control; 3 wk dized LDL; no effect on rate of Australia ers, 15 M; mean ual diet of lx LDL oxidation or lag time
age 41.3 y
Day et aL, Healthy adults, Pre-post: supple- Red grape juice concentrate 1 wk Decreased LDL oxidation
1997, UK 6 M, 1 F mentation of 125 mL habitual diet
Hininger et aL. Health smokers Pro-post; modifi- Carrots 150 g + tomatoes 200 g 2 wk Lengthened lag time before the 1997, France and non-smokers, cation of habitual + French beans, cabbage and/or onset of LDL oxidation
11 M, il F, diet spinach 300 g 25-45 y
258
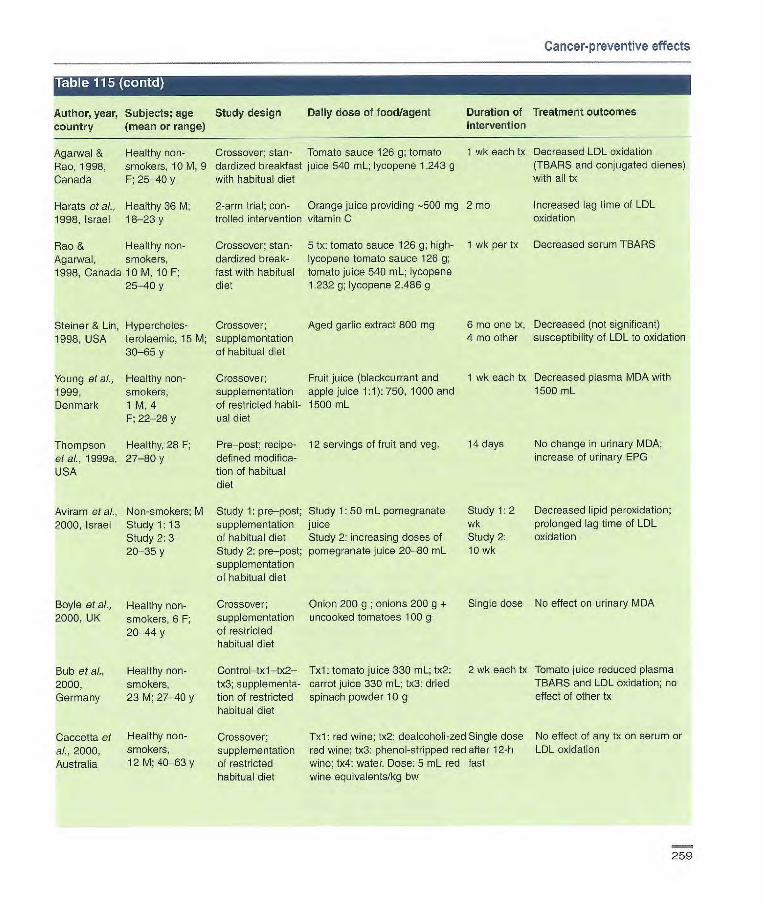
Cancer-preventive effects
Table 115tiiir i
Author, year, Subjects; age Study design Daily dose of food/agent Duration of Treatment outcomes country (mean or range) intervention
Agarwal & Healthy non- Crossover; stan- Tomato sauce 126 g; tomato 1 wk each tx Decreased LDL oxidation
Rao, 1998, smokers, 10M, 9 dardized breakfast juice 540 mL; lycopene 1.243 g (TBARS and conjugated dienes)
Canada F; 25-40 y with habitual diet with all tx
Harats et al., Healthy 36 M; 2-arm trial; con- Orange juice providing -500 mg 2 mo Increased lag time of LDL
1998, Israel 18-23 y trolled intervention vitamin C oxidation
Rao & Healthy non- Crossover; stan- 5 tx: tomato sauce 126 g; high- 1 wk per tx Decreased serum TBARS
Agarwal, smokers, dardizod break- lycopene tomato sauce 126 g; 1998, Canada 10M, 10F; fast with habitual tomato juice 540 mL; lycopene
25-40 y diet 1.2320; lycopene 2.486 g
Steiner & Lin, Hyperodoles- Crossover; Aged garlic extract 800 mg 6 mo erre tx, Decreased (not significant)
1998, USA terolaemic, 15 M; supplementation 4 m other susceptibility of LDL to oxidation
30-65 y of habitual diet
Young et ai., Healthy non- Crossover; Fruit juice (blackcurrant and 1 wk each tx Decreased plasma MDA with
1999, smokers, supplementation apple juice 1:1): 750, 1000 and 1500 mL
Denmark 1 M, 4 of restricted habit- 1500 mL F; 22-28 y ucl diet
Thompson Healthy, 28 F; Pre-post; recipe- 12 servings of fruit and veg. 14 days No change in urinary MDA;
et al., 1 999a, 27-80 y defined modifica- increase of urinary EPG
USA tion of habitual diet
Aviram et ai., Non-smokers; M Study 1: pre-post; Study 1: 50 mL pomegranate Study 1: 2 Decreased lipid peroxidation;
2000, Israel Study 1: 13 supplementation juice wk prolonged lag time of LDL
Study 2: 3 of habitual diet Study 2: increasing doses of Study 2: oxidation
20-35 y Study 2: pre-post; pomegranate juice 20-80 mL 10 wk supplementation of habitual diet
Boyle et al., Healthy non- Crossover; Onion 200 g ; onions 200 g + Single dose No effect on urinary Mi
2000, UK smokers, 6 F; supplementation uncooked tomatoes 100 g
20-44 y of restricted habitual diet
Bub et al., Healthy non- Control-txl-tx2- Txl: tomato juice 330 mL; tx2: 2 wk each tx Tomato juice reduced plasma
2000, smokers, tx3; supplementa- carrot juice 330 mL; 1x3: dried TBARS and LDL oxidation; no
Germany 23 M; 27-40 y lion of restricted spinach powder 10 g effect of other tx habitual diet
Cacoetta et Healthy non- Crossover; 1x1: red wine; tx2: dealcoholi-zed Single dose No effect cf any tx on serum or
ai., 2000, smokers, supplementation red wine; tx3: phenol-stripped red after 12-h LDL oxidation
Australia 12 140-63 y of restricted wine; tx4: water. Dose: 5 mL red fast habitual diet wine equivalents/kg bw
259

IARC Handbooks of Cancer Prevention Volume 8: Fruit and Vegetables
Table (cc)ntd) i
Author, year, Subjects; age Study design Daily dose of food/agent Duration of Treatment outcomes country (mean or range) intervention
Chopra et al., 18 non-smokers Crossover; supple- Creamed spinach 200 g and 1 wk each tx Increased lag-phase of LDL cxi- 2000, UK and 14 smokers, mentation of habit- mango puree 100 g; tomato dation only in non-smokers on
F; 24-52 y ual diet puree 200 g and watermelon tomato and watermelon tx 100 g/d
Fuhrman et Healthy non- Pre—post Tomato oleoresin (lycopene 30 Single dose Reduced susceptibility of LDL to al., 2000, smokers, 4; mg) with high-fat oxidation Israel 30-45 y meal
Young eta]., Healthy non- Crossover; supple- Grape-skin extract 800 mg 2000, smokers, mentation of res- Denmark 6 M, 9 F; tricted habitual diet
21-33 y
Bôhm et aL. Not reported Pre—post Tomato juice 500 mL 2001, Germany
Lac, 2001, 4 M, 4 F; mean Placebo-controlled Aged garlic extract 36 g USA age 68 y crossover; supple-
mentation of habit-ual diet
1 wk each tx No effect on plasma- or LDL-M DA
2 wk Decreased ex vivo lymphocyte membrane damage by reactive oxygen species
2 wk Increased resistance to LDL oxidation
Maruyarna et Healthy, 31 F; 3-arm trial; supple- Tomato juice 160 g; tomato juice 1 menstrual No change in lag time of LDL al., 2001, mean age 21.3 y mentation of 480 g cycle oxidation Japan habitual diet
O'Reilly et Healthy non- Crossover; supple- Onion 150 g + black tea 300 mL 2 wk No effect on plasma F2-iso- al., 2001, UK smokers, mentation of res- prostane or MDA-LDL autoanti-
20 M, 22 F; tricted habitual diet body titre 20-60 y
Veg. burger (lyophilized toma- 3 wk each tx No effect on MDA or F2-iso- toes, carrots, onions, broccoli, prostane sweet red pepper; equivalent of 500 g mixed fresh veg.) and mixed fruit drink (orange, apple, blueberry, lemon, lime) 330 mL
Sea buckthorn juice 300 mL 8 wk Increased (not significant) lag time of LDL oxidation
van den Healthy smokers, Crossover; Berg et al., 22 M; 18-50 y supplementation 2001, of habitual diet Netherlands
Eccleston et Healthy non- 2-arm trial; al., 2002, UK smokers, supplementation
20 M; 18-55 y of habituai diet
Oxidative damage - proteins
Castenmiller Healthy non- Parallel arm; et al., 1999, smokers, normo- controlled inter- Netherlands Iipidaemic, 30 M, vention
42 F; 18-58 y
Txl: carotenoid supplement; 3 wk tx2: whole leaf spinach 20 g/MJ, tx3: minced spinach 20 g/MJ, tx4: liquefied spinach 20 g/MJ, 1x5: liquefied spinach 20 g/MJ + beetroot fibre 10 g/kg
No effect on plasma 2-amino- adipic semialdehyde formation
260

Cancer-preventive effects
Author, year, Subjects; age Study design Daily dose of food/agent Duration of Treatment outcomes country (mean or range) intervention
Nielsen et al., Non-smokers, 7 Crossover; Parsley 20 gIlO Mi 1 wk each tx No effect plasma 2-aminoadipic 1999, M, 7 F; 20-31 y controlled interven- semialdehyde formation Denmark tion
Young et al., Healthy non- Crossover; Fruit juice (blackcurrant and apple I wk each tx Increased plasma 2-aminoadipic 1999 smokers, 1 M, 4 supplementation juice 1:1): 750, 1000 and 1500 semialdehyde formation with Denmark F; 22-28 y of restricted mL juice dose; no effect on RBC
habitual diet 2-aminoadipic semialdehyde and '-gLutamyl semialdehyde forma- ton.
Young et at, Healthy non- Crossover; supple- Grape-skin extract 600 mg I wk each tx Non-significant increase in 2000, smokers, rnentation of plasma 2-aminoadipic semialde- Denmark 6 M, 9 F; restricted habitual hyde formation
21-33 y diet
van den Berg Healthy smokers, Crossover; Veg. burger (lyophilized tomatoes, 3 wk each tx No effect on protein carbonyl et ai., 2001, 22 M; 18-50 y supplementation carrots, onions, broccoli, sweet formation Netherlands of habitual diet red pepper; equivalent of 500 g
mixed fresh veg.) and mixed fruit drink (orange, apple, blueberry, lemon,lime) 330 mL
Oxidative damage and adduct formation - DNA
Verhagen et Healthy non- 2-arm trial; con- Brussels sprouts 300 g 3 wk Decreased urinary 8-01 al,, 1995, smokers, trolled intervention Netherlands 10 M; 20-28 y
Hageman et Healthy non- Crossover; supple- Cucumber salad 100 g; 8 d each tx Decreased ex vivo PBL ai., 1997, smokers, mentation of habit- cucumber salad 100 g + raw benzo[a]pyrene—DNA adduct Netherlands 9 M ual diet garlic 3 g formation and PBL 8-0HdG with
both tx. Additional decrease of benzo[apyrene—DNA adduct with garlic
Pool-Zobel et Healthy non- Control—txl--tx2— 1x1: tomato juice 330 mL; tx2: 2 wk each tx Decreased lymphocyte DNA al., 1997, smokers, tx3; supplementa- carrot juice 330 mL; tx3: dried strand breaks (comet assay) with Germany 23 M; 27-40 y tion of restricted spinach powder 10 g all tx and decreased oxidative
habitual diet DNA base damage (endonucle- ase Ill assay) with carrot juice only
Verhagen et Healthy non- Crossover; supple- Brussels sprouts 300 g 1 wk per tx Decreased urinary 8-0HdG in al., 1997, smokers, 5 M, 5 F mentation of res- 415 men; no effect in women Netherlands tricted habitual diet
Rao & Healthy non- Crossover; stan Tomato sauce 126 g; high- 1 wk per tx No significant change in Agarwal 1998, smokers, dardized breakfast lycopene tomato sauce 126 g; lymphocyte 8-0HdG Canada 10 M, 10 F; with habitual diet tomato juice 540 mL; lycopene
25-40 y 1.232 g; lycopene 2.486 g
261
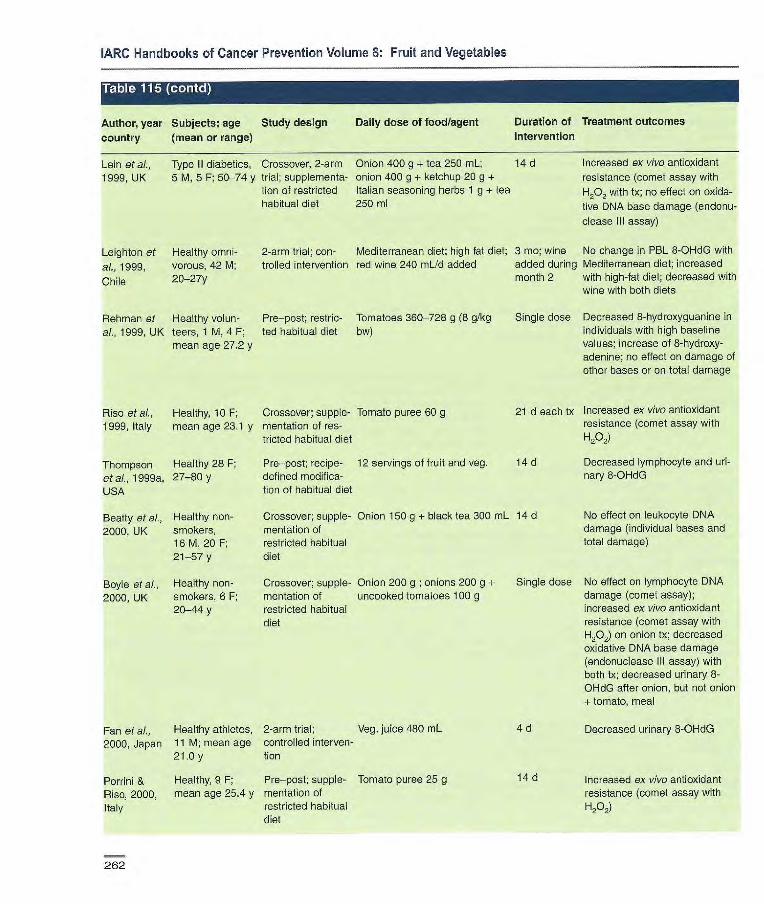
IARC Handbooks of Cancer Prevention Volume 8: Fruit and Vegetables
Table tHZRTh1 r4
Author, year Subjects; age Study design Daily dose of food/agent Duration of Treatment outcomes
country (mean or range) intervention
Lein at al., Type II diabetics, Crossover, 2-arm Onion 400 g + tea 250 mL; 14 d Increased ex vivo antioxidant
1999, UK 5 M, 5 F; 50-74 y trial; supplementa- onion 400 g + ketchup 20 g + resistance (comet assay with lion of restricted Italian seasoning herbs 1 g -4- tea H202 with tx; no effect on oxida- habitual diet 250 ml tive DNA base damage (endonu-
clease Ill assay)
Leighton at Healthy omni- 2-arm trial; con- Mediterranean diet; high fat diet; 3 me; wine No change in PBL 8-OHdG with
al., 1999, vorous, 42 M; trolled intervention red wine 240 mUd added added during Mediterranean diet; increased
Chile 20-27y month 2 with high-fat diet; decreased with wine with both diets
Rehman et Healthy volun- Pre—post; restric- Tomatoes 360-728 g (B glkg al., 1999, UK teers, 1 M, 4 F; ted habitual diet bw)
mean age 27.2 y
Rise at al., Healthy, 10 F; Crossover; supple- Tomato puree 60 g 1999, Italy mean age 23.1 y mentation of res-
tricted habitual diet
Single dose Decreased 8-hydroxyguanine in individuals with high baseline values; increase of 8-hydroxy-adenine; no effect on damage of other bases or on total damage
21 d each tx Increased ex vivo antioxidant resistance (comet assay with H202)
Thompson Healthy 28 F; Pre—post; recipe- 12 servings of fruit and veg. 14 d
at ai., 1999a, 27-80 y defined modifica-
USA tion of habitual diet
Beatty at al., Healthy non- Crossover; supple- Onion 150 g + black tea 300 mL 14 d
2000, UK smokers, mentation of 16 M, 20 F; restricted habitual 21-57 y diet
Boyle et al., Healthy non- Crossover; supple- Onion 200 g ; onions 200 g + Single dose
2000, UK smokers, 6 F; mentation of uncooked tomatoes 100 g 20-44 y restricted habitual
diet
Decreased lymphocyte and uri-nary 8-OHdG
No effect on leukocyte DNA damage (individual bases and total damage)
No effect on lymphocyte DNA damage (comet assay); increased ex vivo antioxidant resistance (comet assay with H202) on onion Ix; decreased oxidative DNA base damage (endonuclease Ill assay) with both tx; decreased urinary 8-OHdG after onion, but not onion + tomato, meal
Fan at al., Healthy athletes, 2-arm trial; Veg. juice 480 mL 4 d Decreased urinary 8-OHdG
2000, Japan 11 M; mean age controlled interven- 21.0y tion
Porrini & Healthy, 9 F; Pre—post; supple- Tomato puree 25 g 14 d Increased ex vivo antioxidant
Riso, 2000, mean age 25.4 y mertation of resistance (comet assay with
Italy restricted habitual H202) diet
262

Cancer-preventive effects
Author, year, Subject; age Study design Daily dose of food/agent Duration of Treatment outcomes country (mean or range) intervention
Chen et al., 32 M, localized Pro-post; substitu- Tomato sauce 200 g incorporated 3 wk 2001 b, USA prostate adeno- tion in habituai diet into pasta dishes
carcinoma; mean age, 65.7
Collins et Healthy, non- Crossover; Homogenized kiwi fruit 500 mL Single dose ai., 2001, UK smokers, supplementation
6 M, F; 24-55 y of habituai diet
Decreased leukocyte and prostate tissue 8-01
No effect on endogenous lymphocyte DNA damage (comet assay) or oxidative DNA base damage (endcriu-clease Ill assay), but increased ex vivo antioxidant resistance (to H2O)
Dragsted of Healthy non- Crossover; Fruit juice (blackcurrant and 1 wk each No effect on urinary 8-OHdG ai., 2001, smokers, supplementation apple juice 1:1): 750, 1000 and tx Denmark 4 F, 1 M; of restricted 1500 mL
22-28 y habitual diet
van den Healthy smokers, Crossover; Veg. burger (lyophilized 3 wk each No effect on PBMC DNA dam Berg 22 M; 18-50 y supplementation tomatoes, carrots, onions, tx age (comet with and without et at., 2001, of habituai diet broccoli, sweet red pepper; equiv- Hp2; endonuclease Ill) Netherlands aient of 500 g mixed fresh veg.)
and mixed fruit drink (orange, apple, blueberry, lemon, lime) 330 mL
Porrini et ai.. Healthy non- Control—txl —wash- txl: spinach 150 g per day 3 wk each Increased ex vivo antioxidant 2002, Italy smokers, 9 F; out—tx2; supple- tx2: spinach 150 g + tomato tx resistance (comet assay with
mean age 25.2 y mentation of puree 25 g Hp.) with both tx; no addition- restricted habitual al effect of tomato diet
Vogel et ai., Healthy non- Controlled inter- Havonoid-food free basai diet + 25 d No effect cf fruit and vegeta- 2002, smokers, 22 M, vention; parallel txl: fruits and vegetables 600 g; bles on PBL DNA-repair Denmark 21 F; 21-56 y arm tx2: vitamin-mineral tablets; tx3: enzyme expression (OGG1
placebo tablets and ERCC1)
bw, body weight; EPG, 8-isoprostane; ESR, electron spin resonance spectroscopy; FRAP, ferric-reducing ability of plasma; LDL, low-density lipoprotein; MDA, maiondialdehyde; ORAC, oxygen radical absorbance capacity; 8-OHdG. 8-hydroxydeoxyguanosine; PBL, peripheral blood lymphocyte; RBC, red blood cell; SOD, superoxide dismutase; TAC, total antioxidant capacity; TBARS, thiobarbi-turic acid reactive substances; TEAC, trolox equivalent antioxidant capacity; TRAP, antioxidant potential; lx or Tx, treatment
263

]ARC Handbooks of Cancer Prevention Volume 8: Fruit and Vegetables
2000), which ranged in length from a single dose to 14 days. In addition, Chen et al. (2001 b) reported concomi-tantly decreased levels of 8-OHdG in both peripheral leukocytes and in prostate tissue of prostate adenocarci-noma patients whose diets were sup-plemented with tomato sauce (200 g/d) for three weeks.
The other main approach to study DNA damage in response to interven-tions has been to measure lymphocyte damage ex vivo, using a single-cell gel electrophoresis or comet assay. Two modifications of this assay, hydrogen-peroxide-induced DNA damage and endonuclease Ill cleavage to deter-mine the presence of oxidized pyrim-idines, indicate the susceptibility of lymphocyte DNA to oxidative damage. Using the comet assay, several studies (Pool-Zobel et al., 1997; Lean et al., 1999; Rise et al., 1999; Boyle et al., 2000; Collins etal., 2001; Porrini etal., 2002), but not all (van den Berg et al., 2001), have shown that various fruits and vegetables (e.g., tomato products, onions, carrot juice and kiwi fruit) reduce endogenous and/or hydrogen-peroxide-induced DNA strand breaks; however, these treatments do not always concurrently inhibit base oxida-tion. Another study showed that addi-tion of raw garlic to a cucumber salad intervention for eight days further inhibited ex vivo lymphocyte benzo[a]-pyrene-DNA adduct formation (Hageman et al., 1997).
Nitrosation (Table 116) Some of the same factors that con-tribute to oxidative damage and the production of reactive oxygen species can also lead to production of reactive nitrogen species. A wide range of nitro-gen-containing compounds and nitrosating agents to which humans are exposed react in vivo to form potentially carcinogenic N-nitroso, C-nitroso and reactive diazo compounds (Bartsch & Frank, 1996). Nitrosating
agents can also be synthesized endogenously by bacteria in the gut and activated macrophages.
Nitrosation in humans can be estimated quantitatively by monitoring urinary excretion of N-nitrosoproline (NPRO) after an oral dose of L-proline (Ohshima & Bartsch, 1981). Various studies have shown reduced urinary excretion of nitrosation products after single doses or one-week interven-tions of vitamin-C-rich fruits, vegeta-bles and juices (Knight & Forman, 1987; Helser et al., 1992; Xu et al., 1993; Chung et al., 2002). In contrast, a longer-term (15-day) intervention of broccoli, green peas (Pisum sativum) and Brussels sprouts had no effect on N-nitrosation, particularly in the large intestine (Hughes et al., 2002). Some vegetables that are significant sources of nitrate and certain veg-etable-canning methods increase body nitrite load (Lowenfels etal., 1978; Xu et al., 1993).
Modulation of biotransformation enzymes (Table 117) Drug-metabolizing enzymes metabo-lize many endogenous compounds and detoxify numerous xenobiotics (Yang et al., 1994). Phase I enzymes such as cytochrome P450-dependent monooxygenases (CYP) catalyse oxi-dation, hydroxylation and reduction reactions, converting hydrophobic compounds to reactive electrophiles in preparation for reaction with water-sol-uble moieties (conjugation) to enhance their excretion. Phase II enzymes, such as UDP-glucuronosyltrans-ferases (UGT), sulfotransferases and glutathiono S-transferases (GST), catalyse these conjugation reactions.
Research efforts on effects of con-stituents of fruit and vegetables on bio-transformation enzymes have focused particularly on the phase Il conjugating enzymes. These enzyme systems are rapidly induced; enzymatic activities rose and reached a plateau within five
days of continued daily ingestion of a food with inducing capacity (coffee or broccoli) and dropped rapidly when the food was removed from the diet (Sreerama et al., 1995). This suggests that most of the interventions to date, which have been short (one to two weeks), are of sufficient duration to evaluate the initial effect of diet on these enzyme systems. Several con-trolled dietary interventions have shown that cruciferous vegetables at doses of at least 300 g per day increase plasma (Bogaards et al., 1994; Nijhoff et al., 1995a; Lampe et al., 2000a) and rectal (Nijhoff et al., 1995b) GST-u concentrations. A lower dose of broccoli (-85 g) as part of a lyophilized mixed-vegetable treatment had no effect on plasma GST-a (van den Berg et al., 2001). GST-:r in plasma and peripheral white blood cells did not respond to a cruciferous vegetable intervention, although rectal GST-t increased after feeding with Brussels sprouts (Nijhoff et al., 1995a, b). In two other studies, GST-jt mRNA and/or protein in white blood cells decreased when participants were fed mixtures of vegetables of which Cruciferae were a minor component (Persson et al., 2000; van den Berg et al., 2001). However, another study reported a trend towards higher lympho-cyte GSTP1 with high-carotenoid veg-etable juices (Pool-Zobel et al., 1998), suggesting that responses vary exten-sively depending on the treatment.
Biotransformation of xenobiotics and that of therapeutic drugs share many of the same enzyme systems; therefore, drug metabolites can be monitored in intervention studies designed to test the effects of expo-sures on these systems. This is useful because in human studies it is often difficult to obtain particular tissue sam-ples to measure enzyme activities directly. Five studies have used caf-feine metabolite ratios to test broccoli, Brussels sprouts or mixed cruciferous
264
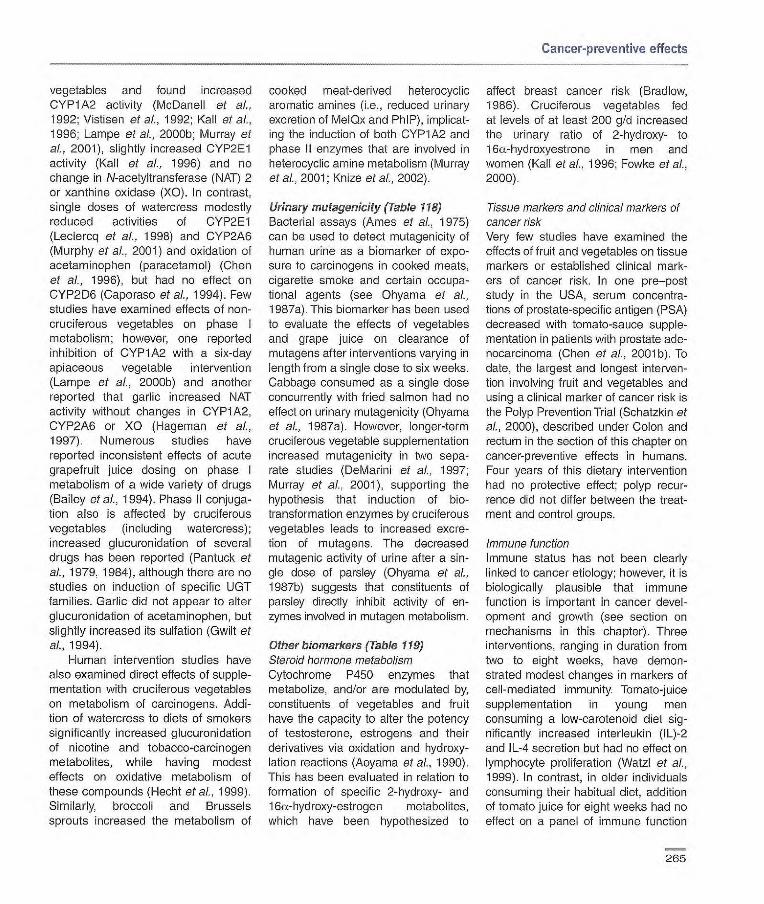
Cancer-preventive effects
vegetables and found Increased CYP1A2 activity (McDanell et al., 1992; Vistisen et al., 1992; Kall et al., 1996; Lampe et at, 2000b; Murray et ci., 2001), slightly increased CYP2E1 activity (Kall of al., 1996) and no change in N-acetyltransfe rase (NAT) 2 or xanthine oxidase (XO). In contrast, single doses of watercress modestly reduced activities of CYP2E1 (Leclercq et al., 1998) and CYP2A6 (Murphy of al., 2001) and oxidation of acetaminophen (paracetamol) (Chen et al., 1996), but had no effect on CYP21D6 (Caporaso et ai., 1994). Few studies have examined effects of non-cruciferous vegetables on phase I metabolism; however, one reported inhibition of CYP1A2 with a six-day apiaceous vegetable intervention (Lampe of al., 2000b) and another reported that garlic increased NAT activity without changes in CYP1A2, CYP2A6 or XO (Hageman of al., 1997). Numerous studies have reported inconsistent effects of acute grapefruit juice dosing on phase I metabolism of a wide variety of drugs (Bailey of al., 1994). Phase Il conjuga-tion also is affected by cruciferous vegetables (including watercress); increased glucuronidation of several drugs has been reported (Pantuck et al., 1979, 1984), although there are no studies on induction of specific UGT families. Garlic did not appear to alter glucuronidation of acetaminophen, but slightly increased its sulfation (Gwilt et al., 1994).
Human intervention studies have also examined direct effects of supple-mentation with cruciferous vegetables on metabolism of carcinogens. Addi-tion of watercress to diets of smokers significantly increased glucuronidation of nicotine and tobacco-carcinogen metabolites, while having modest effects on oxidative metabolism of these compounds (Hecht et al., 1999). Similarly, broccoli and Brussels sprouts increased the metabolism of
cooked meat-derived heterocyclic aromatic amines (i.e., reduced urinary excretion of MelQx and PhIP), implicat-ing the induction of both CYP1A2 and phase Il enzymes that are involved in heterocyclic amine metabolism (Murray et ai., 2001; Knize et al., 2002).
Urinary mutagenicity (Table 118) Bacterial assays (Ames of at, 1975) can be used to detect mutagenicity of human urine as a biomarker of expo-sure to carcinogens in cooked meats, cigarette smoke and certain occupa-tional agents (see Ohyama of al., 1987a). This biomarker has been used to evaluate the effects of vegetables and grape juice on clearance of mutagens after interventions varying in length from a single dose to six weeks. Cabbage consumed as a single dose concurrently with fried salmon had no effect on urinary mutagenicity (Ohyama et ai., 1987a). However, longer-term cruciferous vegetable supplementation increased mutagenicity in two sepa-rate studies (DeMarini of al., 1997; Murray of al., 2001), supporting the hypothesis that induction of bio-transformation enzymes by cruciferous vegetables leads to increased excre-tion of mutagens. The decreased mutagenic activity of urine after a sin-gle dose of parsley (Ohyama et ai., 1987b) suggests that constituents of parsley directly inhibit activity of en-zymes involved in mutaçjen metabolism.
Other biomarkers (Table 119) Steroid hormone metabolism Cytochrome P450 enzymes that metabolize, and/or are modulated by, constituents of vegetables and fruit have the capacity to alter the potency of testosterone, estrogens and their derivatives via oxidation and hydroxy-lation reactions (Aoyama et ai., 1990). This has been evaluated in relation to formation of specific 2-hydroxy- and 1 6-hydroxy-estrogen metabolites, which have been hypothesized to
affect breast cancer risk (Bradlow, 1986). Cruciferous vegetables fed at levels of at least 200 g/d increased the urinary ratio of 2-hydroxy- to 1 6a-hydroxyestrone in men and women (Kall of ai., 1996; Fowke of al., 2000).
Tissue markers and clinical markers of cancer risk Very few studies have examined the effects of fruit and vegetables on tissue markers or established clinical mark-ers of cancer risk. ln one pro—post study in the USA, serum concentra-tions of prostate-specific antigen (PSA) decreased with tomato-sauce supple-mentation in patients with prostate ado-nocarcinoma (Chen of al., 2001b). To date, the largest and longest interven-tion involving fruit and vegetables and using a clinical marker of cancer risk is the Polyp Prevention Trial (Schatzkin of al., 2000), described under Colon and rectum in the section of this chapter on cancer-preventive effects in humans. Four years of this dietary intervention had no protective effect; polyp recur-rence did not differ between the treat-ment and control groups.
Immune function Immune status has not been clearly linked to cancer etiology; however, it is biologically plausible that immune function is important in cancer devel-opment and growth (see section on mechanisms in this chapter). Three interventions, ranging in duration from two to eight weeks, have demon-strated modest changes in markers of cell-mediated immunity. Tomato-juice supplementation in young men consuming a low-carotenoid diet sig-nificantly increased interleukin (IL)-2 and IL-4 secretion but had no effect on lymphocyte proliferation (Watzl et ai., 1999). In contrast, in older individuals consuming their habitual diet, addition of tomato juice for eight weeks had no effect on a panel of immune function
265
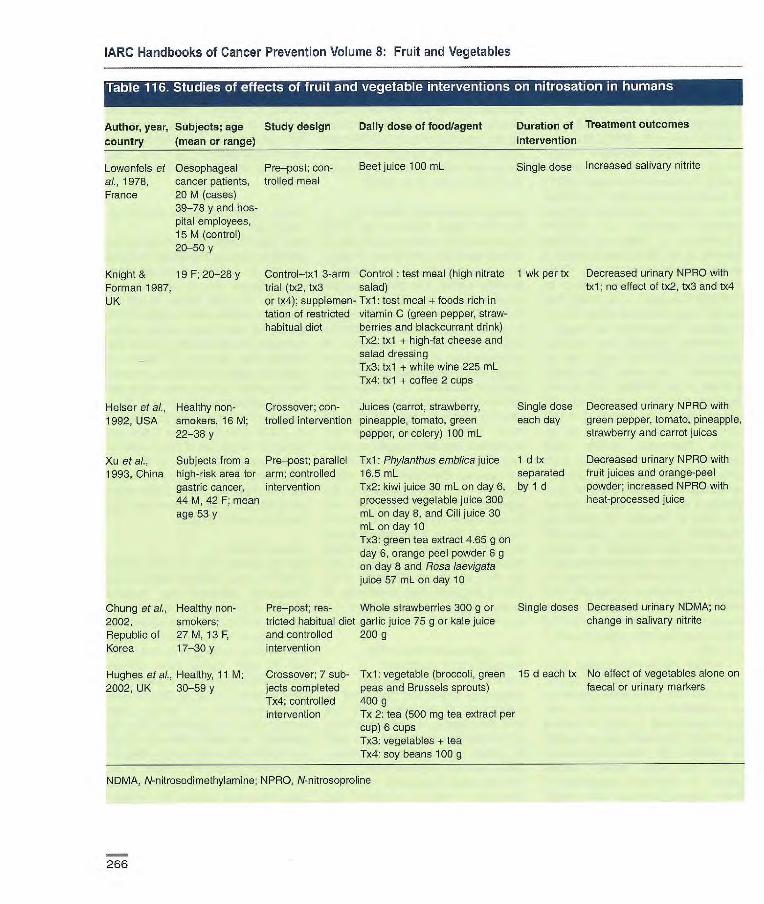
IARC Handbooks of Cancer Prevention Volume 8: Fruit and Vegetables
Author, year, Subjects; age Study design Daily dose of food/agent Duration of Treatment outcomes
country (mean or range) intervention
Single dose Increased salivary nitrite Lowenfels et Oesophageal Pre—post; con- Beet Juice 100 mL
al., 1978, cancer patients, trolled meal France 20 M (cases)
39-78 y and hos- pital employees, 15 M (control) 20-50 y
Knight & 19 F; 20-28 y Control—txl 3-arm Control test meal (high nitrate Forman 1987, trial (tx2, tx3 salad) UK or tx4); supplemen- 1x1: test meal + foods rich in
tation of restricted vitamin C (green pepper, straw- habitual diet berries and blackcurrant drink)
1x2: txl + high-tat cheese and - salad dressing
1x3: txl + white wine 225 mL 1x4: txl -4- coffee 2 cups
Helser et aL. Healthy non- Crossover; con- Juices (carrot, strawberry, 1992, USA smokers, 16 M; trolled intervention pineapple, tomato, green
22-38 y pepper, or celery) 100 mL
Xu et al., Subjects from a Pre—posi; parallel Txl: Phylanthus emblica Juice 1993, China high-risk area for arm; controlled
16.5 mL
gastric cancer, intervention
1x2: kiwi juice 30 mL on day 6, 44 M, 42 F; mean processed vegetable Juice 300
age 53 y mL on day 8, and Cili juice 30
mL on day 10 Tx3: green tea extract 4.65 g on day 6, orange peel powder 6 g on day 8 and Rosa iaevigata juice 57 mL on day 10
1 wk per tx Decreased urinary NPRO with txl; no effect of tx2, tx3 and tx4
Single dose Decreased urinary NPRO with each day green pepper, tomato, pineapple,
strawberry and carrot juices
1 d tx Decreased urinary NPRO with separated fruit juices and orange-peel by 1 d powder; increased NPRO with
heat-processed juice
Chung etal., Healthy non- Pre—post; res- Whole strawberries 300 g or Single doses Decreased urinary NDMA; no
2002, smokers; tricted habitual dïet garlic Juice 75 g or kale juice change in salivary nitrite
Republic of 27 M, 13 F. and controlled 200 g Korea 17-30 y intervention
Hughes et al., Healthy, 11 M; Crossover; 7 sub- 1x1: vegetable (broccoli, green 15 d each tx No effect of vegetables alone on
2002, UK 30-59 y jects completed peas and Brussels sprouts) faecal or urinary markers Tx4; controlled 400 g intervention Ix 2: tea (500 mg tea extract per
cup) 6 cups 1x3: vegetables + tea 1x4: soy beans 100 g
NDMA, N-nitrosodimethylamine; NPRO, N-nitrosoproline
266
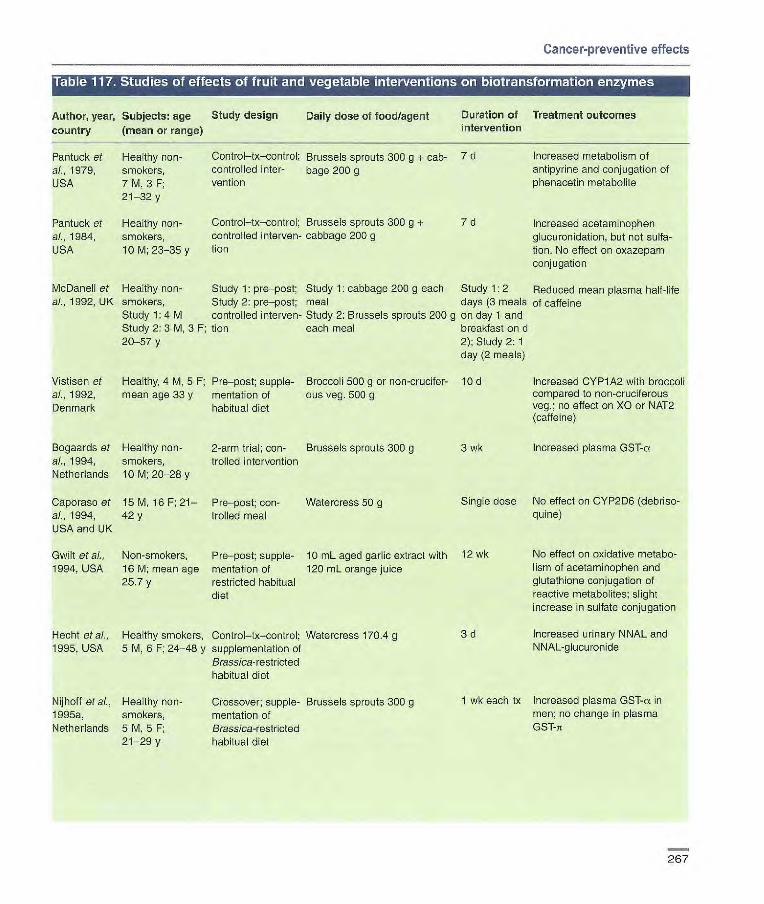
Cancer-preventive effects
• ri 91 1:40 • W1I SIG I Lk_ IJ I I I
Author, year, Subjects: age country (mean or range)
9 -J •i t! 11 Ir. II LU RUC40 L i'I 17,M 111!. AW4 111111 I.1
Study design Daily dose of food/agent
IN 011011 Ir. I @M
Duration of intervention
IS] III I'.I IM II IP'Ai I IL.
Treatment outcomes
Pantuck et Healthy non- Control—tx—control; Brussels sprouts 300 g + cab- 7 d Increased metabolism of al., 1979, smokers, controlled inter- bage 200 g antipyrine and conjugation of USA 7 M, 3 F; vention phenacetin metabolite
21-32 y
Pantuck et Healthy non- Control—tx—control; Brussels sprouts 300 g + 7 d Increased acetaminophen al., 1984, smokers, controlled irterven- cabbage 200 g glucuronidation, but not sulfa- USA 10 M; 23-35 y lion don. No effect on oxazepam
conjugation
McDanell et Healthy non- Study 1: pre—post; Study 1: cabbage 200 g each Study 1: 2 Reduced mean plasma half-life al., 1992, UK smokers, Study 2: pro—post; meal days (3 meals of caffene
Study 1: 4 M controlled interven- Study 2: Brussels sprouts 200 g on day 1 and Study 2: 3 M, 3 F; tien each meal breakfast on d 20-57 y 2); Study 2: 1
day (2 meals)
Vistisen et Healthy, 4 M, 5 F; Pre—post; supple- Broccoli 500 g or non-crucifer lCd Increased CYP1A2 with broccoli al., 1992, mean age 33 y mentation of ous veg. 500 g compared to non-cruciferous Denmark habitual diet veg.; no effect on XO or NAT2
(caffeine)
Bogaards et Healthy non- 2-arm trial; con- Brussels sprouts 300 g 3 wk Increased plasma GST-cr al., 1994, smokers, trolled intervention Netherlands 10 M; 20-28 y
Caporaso et 15 M, 16 F; 21— Pre—post; con- Watercress 50 g Single dose No effect on CYP2D6 (debriso- al., 1994, 42 y trolled meal quine) USA and UK
No effect on oxidative metabo-lism of acetaminophen and glutathione conjugation of reactive metabolites; slight increase in sulfate conjugation
Gwilt etal., Non-smokers, Pre—post; supple- 10 mL aged garlic extract with 12 wk 1994, USA 16M; mean age mentation of 120 mL orange juice
25.7 y restricted habitual diet
Hecht et al., Healthy smokers, Control—tx—control; Watercress 170.4 g
3d 1995, USA 5 M, 6 F; 24-48 y supplementation of
Brassica-resl rioted habitual diet
Increased urinary NNAL and NNAL-glucu ronde
Nijhotf et al., Healthy non- Crossover; supple- Brussels sprouts 300 g
1 wk each tx Increased plasma GST-a in 1995a, smokers, mentation of
men; no change in plasma
Netherlands 5 M, 5 F; Brass/ca-restricted
G ST-n 21-29 y habitual diet
267

IARC Handbooks of Cancer Prevention Volume 8: Fruit and Vegetables
1 ru sj '
Author, year country
sj •si
Subjects: age (mean or range)
Study design Daily dose of food/agent Duration of
intervention
Treatment outcomes
Nijhoff et al., Healthy non- Crossover; sup- Brussels sprouts 300 g 1 week each Increased rectal GST-cL and 1995b, smokers, plementat ion of tx GST-jr; no effect on duodenal or Netherlands 5 M, 5 F; mean Brass/ca-restrict- lymphocyte GST
age 24 y ed habitual diet
Sreerama et Healthy, 1 F; Control—tx— Broccoli 300 g 12 d Increased activities of GST,
L, 1995, 28 y control; class 3 aldehyde dehydrogenase USA supplementation and DT-cbaphorase
of restricted (NAD(P)H:quinone oxido- habitual diet reductase) in saliva
Chen et al., Healthy non- Crossover; Watercress 50 g Single dose Decreased oxidative meta- 1996, USA smokers, fasting bolites of acetaminophen
7 M, 3 F, 23-48 y
Kall et al., Healthy non- Control—txl--tx2; Txl: standard diet avoiding Tx 1:6 d; Increased CYP1A2 (caffeine); 1996, smokers, 2M, supplementation GST inducers 1x2: 12 d non-significant increase in Denmark 14 F; 21-35 y of modified 1x2: standard diet+ broccoli 500 g CYP2E1 (ohlorzoxazone)
habitual diet
Hageman et Healthy non- Pre—post; supple- Raw garlic 3 g 8 d Increased NAT activity; no al., 1997, smokers, 9 M mentation of change in CYP1A2, XO, or Netherlands habitual diet CYP2A6 (caffeine)
Pool-Zobel Healthy non- Control—txl —tx2— Txl: tomato juice 330 mL; tx2: 2 wk each tx Increased lymphocyte cytosolic et al., 1998, smokers, tx3; supplementa- carrot juice 330 mL; tx3: dried protein and GSTF'l with tomato Germany 23 M; 27-40 y tion of restricted spinach powder 10 g and carrot juice, but not spinach
habitual diet
Leclercq et Healthy, 6 M, Pre—post; fasting Watercress 50 g Single dose Decreased CYP2E1 (chlorzoxa- al., 1998, 4 F; 26-55 y zone) Belgium
Hecht et al., Healthy smokers, Control—tx—con- Watercress 170.4 g 3d Increased urinary glucuronides 1999, USA 5 M, 6 F; 24— trol; supplemen- of cotinine and trans-3'-hydroxy-
48 y tation of Brassica- cotinine; no effect on oxidative restricted habitual metabolism of nicotine and coti- diet nine
Lampe et al., Healthy non- Randomized Brass/ca vegetables 436 g; 6 d each tx Brass/ca increased and apia- 2000b, USA smokers, crossover; allium veg. 190 g; apiaceous ceous decreased CYP1A2 corn-
19 M, 17 F; controlled veg. 265 g pared with basal and allium 20-40 y intervention diets; no effect on NAT2 and XO
activities (caffeine)
Lampe et ai., Healthy non- Crossover; Brass/ca vegetables 436 g; 6 d each tx Increased GST-a and GST 2000a, USA smokers, controlled allium veg. 190 g; apiaceous activity with Brass/ca in GSTM1-
21 M, 22 F; intervention veg. 265 g null individuals; decreased GST- 20-40 y a with apiaceous in GSTM1+
men; increased GST-5 activity with Brass/ca and All/urn in GSTM1+ women
268
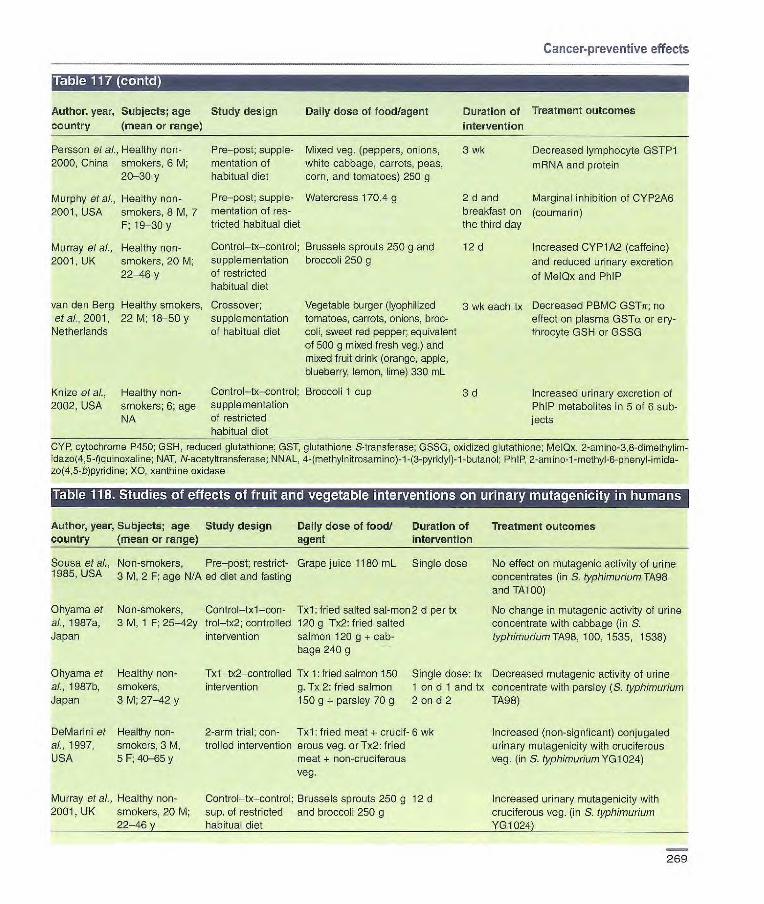
Cancer-preventive effects
Author, year, Subjects; age country (mean or range)
Study design Daily dose of food/agent Duration of intervention
Treatment outcomes
Persson et al., Healthy non- Pie—post; supple- Mixed veg. (peppers, onions, 3 wk Decreased lymphocyte GSTP1 2000, China smokers, 6 M; mentation of white cabbage, carrots, peas, mRNA and protein
20-30 y habitual diet corn, and tomatoes) 250 g
Murphy etal., Healthy non- Pro—post; supple- Watercress 170.4 g 2 d and Marginal inhibition of CYP2A6 2001, USA smokers, B M, 7 mentation of res- breakfast on (coumarin)
F; 19-30 y tricted habitual diet the third day
Murray at al., Healthy non- Control—tx—control; Brussels sprouts 250 g and 12 d Increased CYP1 A2 (caffeine) 2001, UK smokers, 20 M; supplementation broccoli 250 g and reduced urinary excretion
22-46 y of restricted of MelQx and PhIP habitual diet
van den Berg Healthy smokers, Crossover; Vegetable burger (lyophilized 3 wk each tx Decreased PBMC GSTji; no et a]., 2001, 22 M; 18-50 y supplementation tomatoes, carrots, onions, broc- effect on plasma GSTa or ery-
Netherlands of habitual diet coli, sweet red pepper; equivalent throcyte GSH or GSSG of 500 g mixed fresh veg.) and mixed fruit drink (orange, apple, blueberry, lemon, lime) 330 mL
Knize et al., Healthy non- Control—tx—control; Broccoli 1 cup 3 d Increased urinary excretion of 2002, USA smokers; 6; age supplementation PhIP metabolites in 5 of 6 sub-
NA of restricted jects habitual diet
CYP, cytochrome P450; GSH, reduced glutathione; GST, glutathione S-transferase; GSSG, oxidized glutathiorie; MeIQx, 2-amino-3,8-dimethylim- idazo(4,5-quinoxaline; NAT, N-acetyltransferase: NNAL. 4-(methylnitrosamino)-1 -(3-pyridyl)-1 -butanol; PhIP, -methyl-6-ptienyl-imida- zo(4,5-b)pyridine; XO, xanthine oxidase
Table 118. Studies of effects
Author, year. Subjects; age country (mean or range)
of fruit and
Study design
vegetable interventions
Daily dose of food/ agent
Duration of intervention
on urinary mutagenidity in humans
Treatment outcomes
Sousa et ai., Non-smokers, Pre—post; restrict- Grape juice 1180 mL Single dose No effect on mLitagenic activity of urine 1985, USA 3 12 F; age NIA ed diet and fasting concentrates (in S. typhimurium TA98
and TA 100)
Ohyama et Non-smokers, Control—txl—con- Txl: fried salted sal-mon 2 b per tx No change in mutagenic activity cf urine al., 1987a, 3 M, 1 F; 25-42y trol—tx2; controlled 120 g 1x2: fried salted concentrate with cabbage (in S. Japan intervention salmon 120 g + cab- typhimuriumlA98, 100, 1535, 1536)
bage 240 g
Ohyama et Healthy non- Tx1—tx2—controlled Tx 1: tried salmon 150 Single dose: tx Decreased mutagenic activity of urine al., 1987b, smokers, intervention g. Tx 2: fried salmon f on d f and tx concentrate with parsley (S. typhimurium Japan 3 M; 27-42 y 150 g + parsley 70 g 2 on d 2 TA98)
DeMarini et Healthy non- 2-arm trial; con- Txl: fried meat + crucif- 6 wk Increased (non-signficant) conjugated al., 1997, smokers, 3 M, trolled intervention erous veg. orTx2: fried urinary mutagenicity with cruciferous USA 5 F; 40-65 y meat + non-cruciferous veg. (in S. typhimurium YG1 024)
veg.
Murray et al., Healthy non- Control—tx—control; Brussels sprouts 250 g 12 d Increased urinary mutagenicity with 2001, UK smokers, 20 M; sup. of restricted and broccoli 250 g cruciferous veg. (in S. typhimurium
22-46 y habitual diet Y010241
269
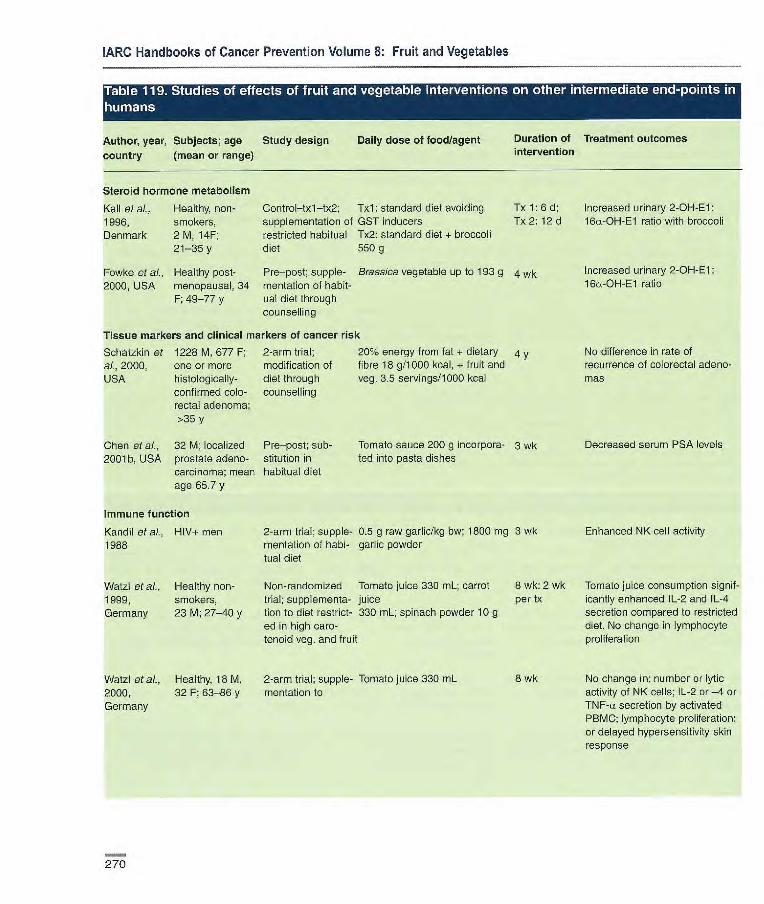
IARC Handbooks of Cancer Prevention Volume 8: Fruit and Vegetables
humans (.1 L']t mii! I IS1 II' II ( IL-1 II LI I'J IlSi! I L1 ii I(1 III L1' I F; t'I.II L' •.L.'I II t I •
Author, year, Subjects; age Study design Daily dose of food/agent Duration of Treatment outcomes
country (mean or range) intervention
Steroid hormone metabolism
Kall et at, Healthy, non- Control—txl—tx2; Txl: standard diet avoiding Tx 1: 6 d; Increased urinary 2-OH-El: 1996, smokers, supplementation of GST inducers Tx 2:12 d l&L-OH-E1 ratio with broccoli Denmark 2 M, 141 restricted habitual Tx2: standard diet + broccoli
21-35y diet 550g
Fowke et al., Healthy post- Pre—post; supple- Brass/ca vegetable up to 193 g 4 wk Increased urinary 2-OH-El:
2000, USA menopausal, 34 mentation of habit- 16a-OH-El ratio
149-77 y uaI diet through counselling
Tissue markers and clinical markers of cancer risk
Schatzkin of 1228 M, 677 F; 2-arm trial; 20% energy from fat + dietary 4 y No difference in rate of al., 2000, one or more modification of fibre 18 g/l 000 kcal, + fruit and recurrence of colorectal adeno- USA histologically- diet through veg. 3.5 servings/1000 kcal mas
confirmed colo- counselling rectal adenoma; >35 y
Chen et al., 32 M; localized Pre—post; sub- Tomato sauce 200 g incorpora- 3 wk Decreased serum PSA levels 2001b, USA prostate adeno- stitution in ted into pasta dishes
carcinoma; mean habitual diet age 65.7 y
Immune function
Kandil et at, HIV+ men 2-arm trial; supple- 0.5 g raw garlic/kg bw; 1800 mg 3 wk Enhanced NK cell activity 1988 mentation of habi- garlic powder
tuai diet
Watzl et al., Healthy non- Non-randomized Tomato juice 330 mL; carrot 8 wk: 2 wk Tomato juice consumption signif- 1999, smokers, trial; supplementa- juice per tx icantly enhanced IL-2 and IL-4 Germany 23 M; 27-40 y tion to diet restrict- 330 mL; spinach powder 10 g secretion compared to restricted
ed in high caro- diet. No change in lymphocyte tenoid veg. and fruit proliferation
Watzl et al., Healthy, 18 M, 2-arm trial; supple- Tomato juice 330 mL 2000, 32 F; 63-86 y mentation to Germany
8 wk No change in: number or lytic activity of NK cells; IL-2 or-4 or Ti secretion by activated PBMC; lymphocyte proliferation; or delayed hypersensitivity skin response
270

Cancer-preventive effects
Author, year Subjects; age Study design Daily dose of food/agent Duration of Treatment outcomes
country (mean or range) intervention
Antibacterial activity
Aydin et al., H. pylon-positive 2-arm trial; supple- Garlic oil 275 mg capsules (800 2 wk No change in grade of gastritis 1997, Turkey dyspeptic patients, mentation of habi- .g allicin) 3 times or garlic-oil or H. pylori-positivity (gastric
5 M, 15 F; 21-61 tuai diet capsules 3 times + omeprazole mucosal urease test)
y 20 mg 2 times
Graham et al., Healthy, 7 M, 5 F, Crossover; Txl: fresh garlic (10 sliced 1 meal per No effect of garlic or capsaicin 1999, USA proven H. pylori controlled test cloves) ;Tx2: capsaicin (6 sliced tx on H. pylon (urea breath test)
infection; 18-75 y meals fresh jalapenos peppers); Tx3 (+ control): bismuth subsalicy- late 2 tablets
McNulty et ai., Dyspeptic patients Pre—post; supple- Garlic oil (4 mg) capsule 4 times 14 d No eradication or suppression 2001, UK with positive mentation of habit- of H. pyf or! (urea breath test) or
serology for H. ual diet symptom improvement pylori, 5; 18-75 y
Other biomarkers
Ross etal., Healthy, 19M, F Crossover; Carrot coins 165 g + carrot puree Pd each No effect of vegetable tx on 1995, USA ages N/A controlled interven- 125 g + chopped spinach 250 g; tx PDGF and mitogenic activity
bon broccoli 390 g + cauliflower 300 g; tofu and textured vegetable protein product 45 g
Jenkins et al., Healthy, 8 M, 2 F; Crossover; con- Txl: high-fruit and veg. diet 2 wk each High-fruit and veg. diet resulted 2001, 24-60 y trolled intervention (63 servingsl2500 kcal diet); tx in: greatest faecal bile acid out- Canada Tx2: starch-based diet (11 serv- put, faecal bulk, and faecal
ings of fruit and veg.) short-chain fatty acid outputs; Tx3: ow-saturated fat diet (5 lowest concentrations of faecal servings of fruit and veg.) bile acids; and increased uri-
nary mevalonic acid excretion
bw, body weight; El, estrone; IL, interleukin; NK, natural killer; PBMC, peripheral blood mononuclear cells; PDGF, platelet-derived growth factor; PSA, prostate-specific antigen; TNF, tumour necrosis factor
271
IARC Handbooks of Cancer Prevention Volume 8: Fruit and Vegetables
markers: number or lytic activity of natural killer (NK) cells, IL-2, IL-4 and tumour necrosis factor (TNF)-a
secretion by activated mononuclear cells, lymphocyte proliferation or delayed hypersensitivity skin response (Watzl et al., 2000). One small study using garlic suggested that natural killer (NK) cell activity can be increased in immunocompromised
individuals (e.g., human immunodefi-ciency virus (HIV)-positive patients) (Kandil et al., 1988).
Antibacterial activity Garlic has received attention as a potential antibacterial agent, particu-larly in the treatment of Hellcobacter pylori infection. This Allium vegetable has long been used as an antibiotic, antiviral and antifungal agent and in
countries where modern medicines are scarce, it remains a treatment for vari-ous infections (Reuter et al., 1990); however, few clinical interventions have been conducted to test its effi-cacy. Three studies using garlic or gar-lic oil have been unsuccessful in erad-
icating existing H. pylori infection or associated gastrointestinal symptoms (Aydin et aL, 1997; Graham et al., 1999; McNulty et al., 2001). These studies were small and of short dura-tion - from a single meal up to two weeks - possibly not long enough to
assess therapeutic efficacy (Mahady & Pendland, 2000).
Observational studies Some biomarkers have been deter-mined as part of case—control studies in order to evaluate possible carcino-
genic mechanisms in relation to the observed cases.
Hemminki et al. (2002) investi-gated whether high consumption of fruit and vegetables can reduce muta-tions in the von Hippel-Lindau (VHL) gene, a gatekeeper gene for renal-cell
cancer. Somatic VHL mutations appear to be associated with some
50% of sporadic renal-cell cancer (Gnarra et al., 1994; Prowse et al., 1997; Yang et al., 1999; Brauch et al., 2000). In a molecular epidemiological sub-study of 102 Swedish patients with renal-cell cancer, within a previously reported case—control study (Lindblad
et al., 1997), consumption of total fruits was not associated with mutation, but consumption of citrus fruit (~: 421 ver-
sus < 421 g/mo) was protective
against mutation in both smokers and all subjects. Among smokers, veg-etable intake (> 1039 versus < 1039 g/mo) also was significantly protective (Hemminki et al., 2002).
In a study on total aromatic DNA adducts in human white blood cells
(Peluso et al., 2000), among 162 blad-der cancer cases and 104 hospital controls, high consumption of fruit and vegetables during the previous 24 h decreased the strength of the associa-tion between adducts and the risk for bladder cancer: for vegetables, OR for
0-1 servings: 7.80, 95% Cl 3.00-20.30; OR for two servings: 4.98; 95% Cl 1.56-15.92; OR for 3 servings: 1.97
95% Cl 0.48-8.02). In a study on 4-aminobiphenyl—DNA adducts in bladder biopsies, high consumption of fruit and vegetables was non-significantly asso-
ciated with lower levels of adducts (Airoldi et al., 2002).
In approximately 100 volunteers in
Italy, a strong inverse association between lymphocyte bulky DNA adducts and frequency of consumption of fresh fruit (p for trend = 0.04) and
vegetables (p for trend = 0.01) was reported (Paul et al., 2000). Also in Italy, oxidative DNA damage, mea-
sured by comet assay with formami-dopyrimidine DNA glycosylase in lym-phocytes from 71 healthy adults, was inversely associated with tomato con-
sumption (p for trend = 0.05) (Giovannelli et al., 2002). Regarding DNA adducts derived from lipid perox-idation products, levels of 1 ,N6-etheno-deoxyadenosine in white blood cells
were inversely correlated with veg-
etable consumption (p = 0.02) among 42 healthy female volunteers (Hagenlocher et al., 2001) and levels
of malondialdehyde-deoxyguanosine were inversely, although non-signifi-cantly, associated with fruit and salad consumption in colorectal biopsies
from normal mucosa in men (Leuratti etal., 2002).
Experimental studies
Animal studies The review in this section covers stud-ies on the effects of fruit and vegetables administered individually or in combination during the initiation
stage of carcinogenesis (just before and during the carcinogen treatment), during the post-initiation and progres-sion stages (after carcinogen treat-ment until the end of the study) and during the initiation, post-initiation and progression stages (Table 120). Also, the effects of mixtures of fruit and veg-etables on intestinal tumours in trans-genie mouse models are reviewed. As elsewhere in this volume, fruit and veg-etables are taken to include edible plant foods, excluding cereal grains, nuts, seeds, dried beans, starchy
roots, spices and products used mainly as infusions.
Both cereal-based and semi-
purified diets have been used in studies of the effects of diet on carcinogenesis. Cereal-based diets include the dietary ingredients from whole-grain cereals and
protein-rich foods. Semi-purified diets include defined ingredients such as casein, soybean protein, starch, sucrose and vitamins. Semi-purified diets have the advantage that each component can be modulated independently of the others in a controlled manner.
Effects on spontaneous tumours The influence of dietary factors such as total composition, thermal pro-
272
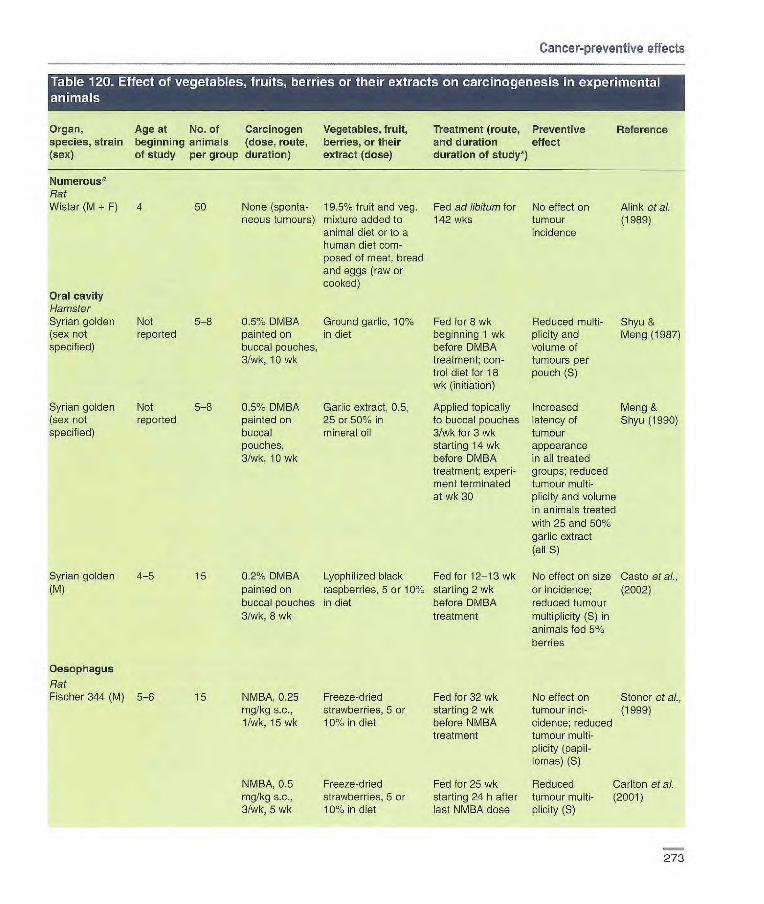
0.5% DMBA Ground garlic, 10% Fed for wk Reduced multi- Shyu & painted on in diet beginning 1 wk plicity and Meng (1987) buccal pouches, before DMBA volume of 3/wk, 10 wk treatment; con- tumours per
fr01 diet for 18 pouch (S) wk (initiation)
0.5% DMBA Garlic extract, 0.5, Applied topically Increased Meng & painted on 25 or 50% in to buccal pouches latency of Shyu (1990) buccal mineral oil 3/wk for 3 wk tumour pouches, starting 14 wk appearance 3/wk, 10 wk before DMBA in all treated
treatment; experi- groups; reduced ment terminated tumour multi- at wk 30 plicity and volume
in animals treated with 25 and 501%
garlic extract (all S)
0.2% DMBA Lyophilized black Fed for 12-13 wk No effect on size Caste et ai., painted on raspberries, 5 or 10% starting 2 wk or incidence; (2002) buccal pouches in diet before DMBA reduced tumour 3/wk, 8 wk treatment multiplicity (S) in
animals fed 5% berries
NMBA, 0.25 Freeze-dried Fed for 32 wk No effect on Stoner et ai., mg/kg s.c., strawberries, 5 or starting 2 wk tumour md- (1999) 1/wk, 15 wk 10% in diet before NMBA c/deuce; reduced
treatment tumour multi- plicity (papil- lomas) (S)
NMBA, 0.5 Freeze-dried Fed for 25 wk Reduced Carlton et ai. mg/kg s.c., strawberries, 5 or starting 24 h after tumour multi- (2001) 3/wk, 5 wk 101/. in diet last NMBA dose plicity (S)
Oral cavity Hamster Syrian golden (sex not specified)
Not 5-8 reported
Syrian golden
Not 5-8 (sex not
reported specified)
Syrian golden 4-5 15 (M)
Oesophagus
Rat Fischer 344 (M) 5-6 15
Cancer-preventive effects
Organ, Age at No. of Carcinogen Vegetables, fruit, species, strain beginning animals (dose, route, berries, or their (sex) of study per group duration) extract (dose)
Numerous Rat Wistar (M + F) 4 50 None (sponta- 195% fruit and veg.
neous tumours) mixture added to animal diet or to a human diet com- posed of meat, bread and eggs (raw or cooked)
Treatment (route, Preventive Reference and duration effect duration of study*)
Fed ad libitum for No effect on Alink et al. 142 wks tumour (1 989)
i ncidence
273

IARC Handbooks of Cancer Prevention Volume 8: Fruit and Vegetables
Organ, Age at species, strain beginning (sex) of study
No. of Carcinogen animals (dose, route, per group duration)
Vegetables, fruit, berries, or their extract (dose)
Treatment (route, and duration; duration of study*)
Preventive effect
Reference
Fischer 344 (M) 7-8 15 Ni 0.25 Lyophilized black Fed for 30 wk Reduced Kresty et ai.,
mg/kg s.c., raspberries, 5 or starting 2 wk tumour (2001) 1/wk, 15 wk 10% in diet before NMBA multi-
treatment plicity (S)
5-8 8-15 NMBA, 0.25 Lyophilized black Fed for 15, 25, Decreased mg/kg s.c., raspberries, 5 or 35 wk starting tumour 3/wk, 5 wk 10% in diet 3d after last incidence and
NMBA dose multiplicity and high-grade dysplasia after 25 wk with both treatments (all S)
Fischer 344 (M) 6-7 10-25 Ni 0.25 Freeze-dried blue- Fed for 25 wk No effect on Aziz al al., mg/kg s.c., berries, 5 or 10% starting 2 wk incidence, size (2002) 1/wk, 15 wk in diet before NMBA or multiplicity
treatment
Colon Mouse Swiss ICR 5-7 14-17 DMH, 23-56 Fresh cabbage, 13% Fed for 21.5 wk Slight increase Temple &
(M+F) mg/kg s.c., in diet starting 31 d before in tumour md- El-Khatib 1/wk, 7 wk, DMH treatment dence in (1987) (total dose females (NS) 320 mg/kg)
Swiss ICR (F) 5-7 20-40 DMH 17-65 Fresh cabbage, 13% (a) Fed beginning (a) Slight Temple &
mg/kg s.c., 1/wk in diet 5 wk before DMH increase in Basu (1987) 8 wk (total dose, treatment until 3 d tumour 291 mg/kg) after last DMH dose incidence (NS)
(initiation); control diet for 19.5 wk (b) Fed for 19.5 wk (b) Reduction beginning 3 d after in tumour last DMH dose multiplicity (S) (promotion)
ApcMifl mice Weanlings 14-17 None (spon- Low- or high-fat Exposure in utero Inhibited multi- Van Kranen
(M + F) taneous diet with 19.5 or until around day 90 plicity of intesti- et al., (1998)
tumours) 22.3% freeze-dried of life tinal polys in M fruit-veg. mixture, fed low-fat (S). respectively Increased multi-
plicity of intes- tinal polyps in M and F fed high- fat diet (S)
274

Cancer-preventive effects
Organ, Age at No. of Carcinogen Vegetables, fruit, Treatment (route, Preventive Reference species, strain beginning animals (dose, route, berries, or their and duration; effect (sex) of study per group duration) extract (dose) duration of study*)
Rat Wistar (M) 4 36-43 DMH, 50 19.5% fruit and veg. Fed for months Reduction in Aiink et al.
mg/kg s.c., mixture added to starting 4 wk polypoid (1993) 1 wk, 13 wk animal diet or to a before DMH adenomas in
human diet corn- treatment animals ted posed of meat, animal diet (S); bread and eggs increase in (raw or cooked) adenocarcinomas
in animals fed human diet(s)
Wistar (M) 5 30 DMH, 50 mg/ Low- or high-fat Fed for up to 35 wk Slight decrease Rjinkels et kg, s.c., 1/wk, diet containing beginning 4 wk in incidence of at., (1997a,b) 10 wk 19.50/. fruit-veg. before DMH colorectal
mixture treatment adenomas with low- or high-fat diet (NS)
Wistar (M) 5 30 MNNG, 6 mg/ Low- or high-fat Fed for 35 wk Reduced ici- Rijnkels et al. kg, intra- diet containing starting 4 wk cidence of (1 997e) rectally, lwk, 19.5% fruit- before MNNG colon adeno- 5 wks veg. mixture treatment carcinomas In
animals fed high-fat diet
Fischer 344 (M) 5 30 AOM, 15 Low- or high-fat (a) Fed for 8 wk No effect on Rjinkels et mg/kg bw, s.c., diet containing beginnning 4 wk colon carcino- Al., (1998) t /wk, 3 wk 19.5% fruit-veg. before AOM treat- genesis
mixture ment, control diet for 28 wk (initiation) (b) Fed for 2 wk starting 2 wk after last AOM dose (promotion)
Fischer 344/ 7 24-25 MNU, 0.5 mL Tomato juice diluted Given for 35 wk Reduced colon Narisawa NSlc (F) of 0.4% or 0.8%, 1:2 or 1:14 (17 or starting together incidence and (1998)
intrarectally, 3.4 ppm lyoopene) with MNU treat- multiplicity in 3/wk, 3 wk in drinking water ment animals given
tomato juice diluted 1:2 (S)
Fischer 344 (M) 3 30 AOM, 15mg! Orange juice in piece Given for 28 wk Reduced colon Miyagi et al. kg, s.c., 1/wk, of drinking water beginning 1 wk tumour (2000) 2 wk after last AOM incidence (S)
(post-initiation)
276

IARC Handbooks of Cancer Prevention Volume 8: Fruit and Vegetables
Organ, Age at No. of Carcinogen Vegetables, fruit, Treatment (route, Preventive Reference species, strain beginning animals (dose, route, berries, or their and duration; effect (sex) of study per group duration) extract (dose) duration of study)
Fischer 344 (M) 7 20-29 AOM, 20 mgI Mandarin juice in Given for 36 wk Reduced md- Tanaka et al., kg, s.c., 1/wk, drinking-water at beginning 1 wk dence and (2000) 2 wk night after last AOM multiplicity
dose (post- of colon adeno- initiation) carcinoma (S)
Sprague-Dawley 5 30-42 DMH, 20 mg/ Orange pulp, 15% Fed for months Colon adeno- Kossoy etal., (sex not speci- kg 1/wk, 6 wk in diet starting together carcinoma ici- (2001) tied) (route not with DMH treat- cidence not
specified) ment affected; de- creased incidence of endoplytic adenocarcino- mas (S); increased incidence of exo- phytic adeno- carcinomas (S)
Fischer 344 (M) 8-9 18 AOM 15 mg/kg Lyophilized black Starting 24h after Decreased Harris etal., irnp. 1/wk, 2 wk raspberries, 2.5, 5 last AOM dose; total tumour (2001)
or 10% in diet 9 wk for aberrant multiplicity crypt foci and for (all S); 33 wk for tumeurs decreased
multiplicity of adenocarci noma (S for 10% raspberry group) and of aberrant crypttoci (all S)
Liver Rat Fischer 344 (M) Weanling 8-11 1 ppm AFB1 in Freeze-dried ground Fed together with Decreased Boyd et at,
the diet for 26 beets or cabbage, carcinogen for 26 tumour ici- (1982) wk 25% in diet wk; control diet cidence with
for 16 wk cabbage (S); increased inci- dence and size with beet (S)
Sprague-Dawley 8 25 NDEA in 120 or 160 g carrots Fed together Delayed tumour Rieder etal. (M) drinking water 4 or 5 d/wk, respec- with carcinogen occurrence and (1983)
for 10 wk (total tively, without any forai least 14 wk prolonged sur- dose, 500 mg/ other diet vival (S) kg bw)
16 30 NDEA, i.p., 11 160 g carrots/wk, 5 Fed for 14 wk Delayed wk, 8 wk (total d/wk without any other Starting 2 wk appearance of dose, 400 mg/ diet before NDEA tumours and kg bw) treatment prolonged
survival (S)
276
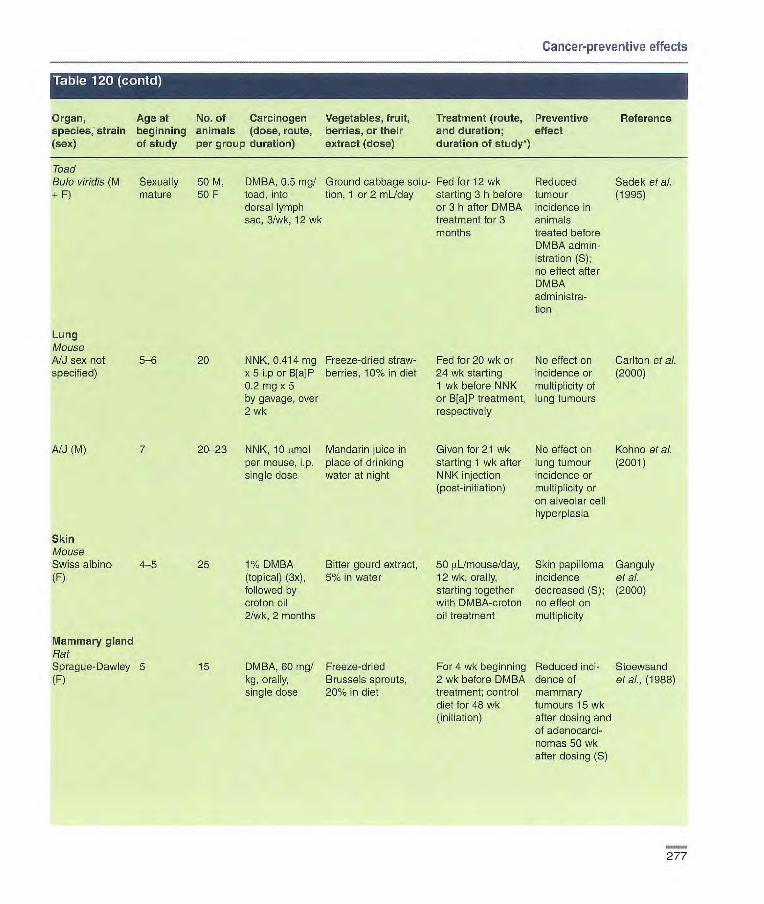
Cancer-preventive effects
Organ, Age at No. of Carcinogen Vegetables, fruit, Treatment (route, Preventive Reference species, strain beginning animals (dose, route, berries, or their and duration; effect (sex) of study per group duration) extract (dose) duration of study*)
Toad Bofo v/rid/s (M Sexually 50 M, DMBA, 0.5 mg/ Ground cabbage solu- Fed for 12 wk Reduced Sadek etal. + F) mature 50F toad, into tion, 1 or mL/day starting 3h before tumour (1995)
dorsal lymph or 3 h after DMBA incidence in sac, 3/wk, 12 wk treatment for 3 animals
months treated before DMBA admin-istration (S); no effect after DMBA administra-tion
Lung Moose A/J sex not 5-6 20 NNK, 0.414 mg Freeze-dried straw- Fed for 20 wk or No effect on Carlton et al. specified) x 5 Lp or B[aP berries, 10% in diet 24 wk starting incidence or (2000)
0.2 mg x 5 1 wk before NNK multiplicity of by gavage, over or B[a]P treatment, lung tumeurs 2 wk respectively
NJ (M) 7 20-23 NNK, 10 amol Mandarin juice in Given for 21 wk No effect on Kohno et at. per mouse, p. place of drinking starting 1 wk after lung tumour (2001) single dose water at night NNK injection incidence or
(post-initiation) multiplicity or on alveolar cell hyperplasia
Skin Mouse Swiss albino 4-5 25 1% DMBA Bitter gourd extract, 50 UL/mouse/day, Skin papilloma Ganguly (F) (topical) (3x), 5% in water 12 wk, orally, incidence et al.
followed by starting together decreased (S); (2000) croton oil with DMBA-croton no effect on 2/wk, 2 months oil treatment multiplicity
Mammary gland Rat Sprague-Dawley 5 15 DMBA, 60 mg/ Freeze-dried For 4 wk beginning Reduced md- Stoewsand (F) kg, orally, Brussels sprouts, 2 wk before DMBA dence of etal., (1988)
single dose 20% in diet treatment; control mammary diet for 48 wk tumeurs 15 wk (initiation) after dosing and
of adenocarci- nomas 50 wk after dosing (S)
277
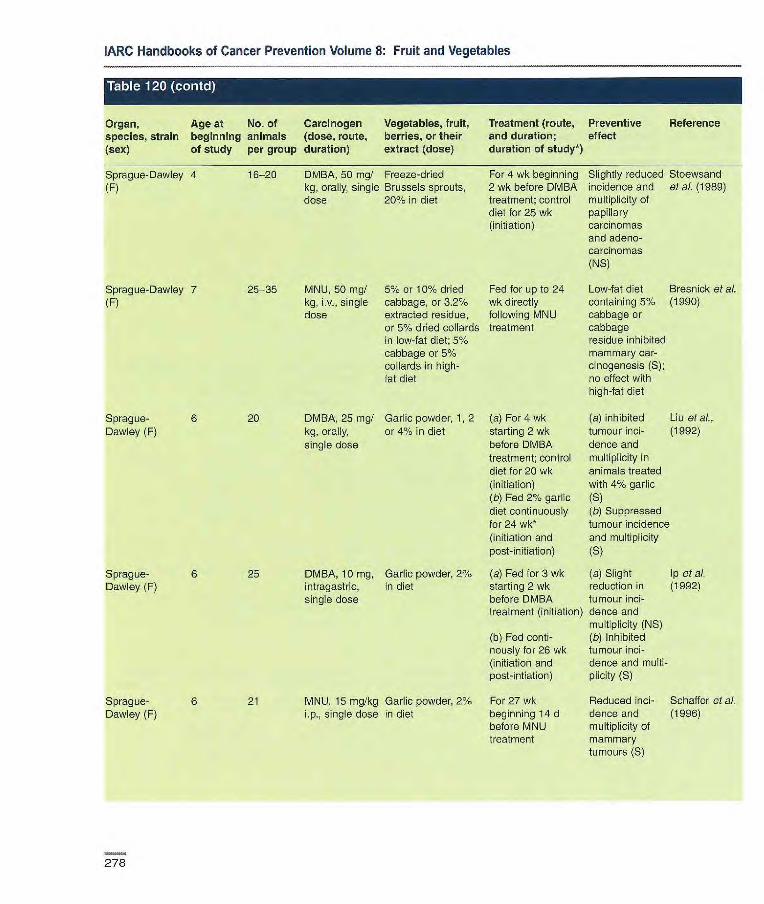
IARC Handbooks of Cancer Prevention Volume 8: Fruit and Vegetables
Organ, species, strain (sex)
Age at No. of Carcinogen beginning animals (dose, route, of study per group duration)
Vegetables, fruit, berries, or their extract (dose)
Treatment (route, and duration; duration of study*)
Preventive effect
Reference
Sprague-Dawley 4 16-20 DMBA, 50 mg/ Freeze-dried For 4 wk beginning Slightly reduced Stoewsand (F) kg, orally, single Brussels sprouts, 2 wk before DMBA incidence and etal. (19 89)
dose 200% in diet treatment: control multiplicity of diet for 25 wk papillary (initiation) carcinomas
and adeno- carcinomas (NS)
Sprague-Dawley 7 25-35 MNU, 50 mgI 5% or 10% dried Fed for up to 24 Low-fat diet Bresnick etal. (F) kg, iv., single cabbage, or 3.2% wk directly containing 5% (1990)
dose extracted residue, following MNU cabbage or or 5% dried collards treatment cabbage in low-fat diet; 5% residue inhibited cabbage or 5% mammary car- collards in high- cinogenesis (S); fat diet no effect with
high-fat diet
Sprague- 6 20 DMBA, 25 mg/ Garlic powder, 1 2 (a) For 4 wk (a) inhibited Liu of al., Dawley (F) kg, orally, or 4% in diet starting 2 wk tumour mci- (1992)
single dose before DMBA dence and treatment; control multiplicity in diet for 20 wk animals treated (initiation) with 4% garlic (b) Fed 2% garlic (S) diet continuously (b) Suppressed for 24 wk* tumour incidence (initiation and and multiplicity post-initiation) (S)
Sprague- 6 25 DMBA, 10 mg, Garlic powder, 2% (a) Fed for 3 wk (a) Slight Ip eta]. Dawley (F) intragastric, in diet starting 2 wk reduction in (1992)
single dose before DMBA tumour ici- treatment (initiation) dence and
multiplicity (NS) (b) Fed conti- (b) Inhibited nously for 26 wk tumour ici- (initiation and dence and multi- post-intiation) plicity (S)
Sprague- 6 21 MNU, 15 mg/kg Garlic powder, 2% For 27 wk Reduced ici- Schaffer etal. Dawley (F) i.p., single dose in diet beginning 14 d dence and (1 99c))
before MNU multiplicity of treatment mammary
tumours (S)
278

Cancer-preventive effects
Organ, Age at No. of Carcinogen Vegetables, fruit, Treatment (route, Preventive Reference species, strain beginning animals (dose, route, berries, or their and duration; effect (sex) of study per group duration) extract (dose) duration of study*)
Sprague- 6 26 DMBA, 50 mgI Freeze-dried biffer Fed for 3 wk Both diets Kusanran at Dawley (F) kg, orally, gourds, 6.25 or beginning 2 wk reduced multi- a?. (1999a)
single dose 12.5% in diet before DMBA plicity of mam- treatment; control mary tumours diet for 24 wk (S); no effect on initiation incidence
Uterine cervix Mouse Swiss albino (F) 8-10 25-30 3-MC, 600 tg Ground garlic in For 6 wk beginning Reduced ici- Hussein eta?.
into uterine water, 400 mglkg!d, 2 wk before 341 dence of squa- (1990) cervix canal orally thread insertion; mous cell car- by laparotomy experiment ended cinoma (S); no
after 14 wk effect on hyper- plasia or dys- plasia
Bladder Mouse C3HIHeN (F) Age not 20 103 MBT2 Garlic extract, 5, Given for 53 or Dose-depen- Riggs eta?.
reported bladder cancer 50 and 500 mg 65 d beginning dent decrease (1997) cells in 0.1 garlic/i OOmL in 1 month before in tumour mL culture drinking water MDT2 tumeur volume with medium s.c., transplantation 50 and 500 mg into right mg garlic thigh extract (S)
Rat Fischer 344 (M) 6 24 BBN, 0.051/. Tomato juice diluted For 12 wk starting Decreased Okajima at al.
in drinking 1:4 in drinking wafer directly after multiplicity of (1998) water for 8 wk (25 ppm lycopene) BBN treatment transitional-
cell carcinomas (S); no effect on incidence
AFB1. aflatoxin B1; ACM, azoxymethane; B[a]P, benzo[a]pyrane; BBN, N-butyl-N-(4-hydroxybutyl)nitrosamine; DMBA, 7,1 2-dimetbyl-benz[alanthracene; DMH, 1,2-diniethy1hydrazine; irn p., iritraperitoneal; 3-MC, 3-methylchclanthrene; MINING, N-methyl-W-nitro-N-nitrosoguanidine; MNU, N-methyl-N-nïtrosourea; NDEA: N-nitrosodiethylamine; NMBA: N-nitrosom ethyl benzylamine; NNK, 4-(methylni-trosamino)-1-(3pyridyl)-1-butanone: NS, not significant; p.c., percutaneous; S, significant, s.c., subcutaneous
Abdominal cavity, adrenal glands, bone, brain, haemotopoietic system, liver, mammary glands, ovaries, parrcmas, pituitary gland, skin, soft tissues, thymus, thyroid, uterus, other sites *When study continued beyond last carcinogen or fruit/vegetable treatment. The number of weeks is counted from the beginning of the Study (and not from beginning of carcinogen treatment).
279
IARC Handbooks of Cancer Prevention Volume 8: Fruit and Vegetables
cessing and the presence of fruit and vegetables on tumour incidence was studied in a long-term experiment in rats (Alink et al., 1989). Groups of 50 male and 50 female Wistar rats were fed one of the following diets: a semi-purified animal diet (A, control); diet A in which fruit and vegetables replaced macro- and micronutrients (B); an uncooked human diet (meat, bread and eggs) supplemented with semi-purified micronutrients (C); diet C with fried or baked products (D); or a complete human diet consisting of cooked products, fruit and vegetables (E). Diets B, C, D and E were prepared according to mean dietary composition figures for the Netherlands. The animal diets contained 21.6% energy fat and the human diets contained 40.6% energy fat. Rats were fed ad Jib/turn for 142 weeks. Male but not female rats fed the human diets (C, D or E) had a significantly higher incidence of epithe-lia] tumours (p < 0.02) than those fed the animal diets (A or B), mainly accounted for by tumeurs of the pituitary and thyroid glands. Compared with the uncooked human diet (diet C), frying and baking of food products (diet D) and the addition of fruit and vegeta-bles (diet E) induced minor, non-signif-icant differences in the tumour inci-dence in over 20 tissues examined.
Effects on carcinogen-induced tumours Oral cavity Hamster Shyu & Meng (1987) studied the inhibitory effect of garlic (Aiium sativum) administered during the initia-tion stage of carcinogenesis induced by 7,1 2-dimethylbenz[a]anthracene (referred to as 9,10-dimethyl-1 ,2-ben-zanthracene; DMBA) in the buccal pouch of hamsters- Groups of 5-8 Syrian golden hamsters [age and sex not reported] received a diet containing 10% (w/w) peeled and ground garlic for eight weeks. Painting of 0.5%
DMBA on the buccal pouches began in the second week, three times per week for 10 weeks. Animals were killed after 26 weeks. Garlic adminis-tration significantly reduced the num-ber and total volume of DMBA-induced tumeurs per buccal pouch three- and four-fold, respectively [values read from diagrams].
In another study (Meng & Shyu, 1990), groups of 5-8 golden Syrian hamsters [age and sex not specified] were painted with 0.5, 25 or 500% gar-lic extract in mineral oil three times per week for three weeks and, after a lag period of 11 weeks, with 0.5% DMBA on the right pouch three times per week for 10 weeks. The animals were killed at week 30. Garlic extract treat-ment increased the latency period of tumour appearance in DMBA-treated animals (8-10 weeks after DMBA painting versus six weeks in controls). The numbers of tumours per pouch in animals treated with DMBA alone and with 25% and 50% garlic extract were 4.6, 1.1 and 1 .4, respectively (p = 0.01 and 0.003, respectively). The average tumour volume per pouch was also significantly reduced in animals treated with 25% and 50% garlic extract (26.5 and 7.8 mm3, respectively, versus 72.6 mm3 p < 0.01). [The Working Group noted that the effect could be either local or systemic.]
The ability of black raspberries (Rubus occidentalls) of the Jewel variety to inhibit DMBA-induced tumorigenesis in the hamster cheek pouch was evaluated (Caste et al., 2002). Male Syrian golden hamsters, 4-5 weeks of age, were fed 0, 5 or 10% freeze-dried black raspberries in AIN-76A diet for 12 weeks. The con-centration of corn starch was adjusted to maintain an isocaloric diet among all groups. Beginning after two weeks, hamster cheek pouches were painted with 0.2% DMBA in dimethylsulfoxide (DMSO) three times per week for eight weeks. The animals were killed after
12-13 weeks and the number and vol-ume of tumeurs determined. There was no difference in tumour size or incidence between groups. Treatment with 5% but not 10% raspberries resulted in a significant reduction in the multiplicity of tumeurs relative to DMBA controls (1.9 versus 3.2 tumeurs per animal; p = 0.02). [The Working Group noted inconsistencies between the text and table for the duration of treatment].
Oesophagus Rat The effect of strawberries (Fragaria ananassa) of the Commander variety on N-nitrosomethylbenzylarnine (NMBA)-induced tumorigenesis in the oesopha-gus of male Fischer 344 rats was examined. In a first experiment (Stoner et al., 1999), 5-6-week-old rats (15 animals per group) were placed on AIN-76A diet or a diet containing 5 or 10% freeze-dried strawberries and were maintained on these diets for the duration of the study. The energy con-tent of the berry diets was maintained by appropriately reducing the corn starch content. From two weeks after diet initiation, rats were given a subcu-taneous injection of NMBA (0.25 mg/kg bw) once per week for 15 weeks. Controls received either the vehicle (20% DMSO in water) or a diet con-taining 10% freeze-dried strawberries. Thirty weeks after initiation of NMBA treatment, the rats were killed and oesophageal tumours (papillomas) counted. The 5 and 100% strawberry diets had no effect on tumour incidence but reduced oesophageal tumour mul-tiplicity by 24% (p < 0.05) and 56% (p <0.01), respectively, relative to NMBA controls. In addition, both strawberry diets significantly reduced the inci-dence of lesions classified as dysplas-tic leukoplakia (p < 0.05), while signifi-cantly increasing that of lesions classi-fied as simple leukoplakia (p < 0.05). In a post-initiation experiment (Carlton et
280

Cancer-preventive effects
al., 2001), rats were fed AIN-76A diet and given subcutaneous injections of NMBA (0.5 mg/kg bw) three times per week for five weeks. Immediately after NMBA treatment, animais were placed on control diet or a diet containing 5 or 10% strawberries. The 5 and 10% strawberry diets reduced oesophageal tumour multiplicity at 25 weeks by 38 and 31%, respectively. Both reductions were statistically significant (p < 0.05), although there was not a significant dose—response relationship. [The Working Group noted discrepancies between the text and figure for the treatment regimen.
Their ability of black raspberries of the Driscol and Bristol varieties to inhibit NMBA-induced tumorigenesis in the rat oesophagus was evaluated in both initiation and post-initiation bioas-says (Kresty et al., 2001). Groups of 15 male Fischer 344 rats, 7-8 weeks old, were given AIN-76A diet or AIN-76A diet containing 5 or 10% freeze-dried black raspberries. The energy content of the berry diets was main-tained by appropriately reducing the corn starch content. Animals were maintained on their respective diets throughout the 30-week study. Starting two weeks after initiation of the experi-mental diets, rats were given subcuta-neous injections of NMBA (0.25 mg/kg bw) once per week for 15 weeks. Controls received either the vehicle (20% DMSO in water) or a diet con-taining 10% black raspberries. At 30 weeks, the animals were killed and oesophageal papillomas counted. Control animals had no tumeurs. Feeding 5 and 10% black raspberries significantly reduced the multiplicity of NMBA-induced oesophageal tumours by 39 and 49%, respectively (p < 0.05). In a post-initiation bioassay, black raspberries were administered in the diet at 5 and 10% after completion of NMBA treatment. Animals were given subcutaneous injections of NMBA (0.25 mg/kg bw) three times per week
for five weeks and maintained on their respective diets until killed at 15, 25 or 35 weeks of the study. Both 5 and 10% black raspberry diets reduced tumour incidence at 25 weeks by 54 and 46%, respectively, tumour multiplicity by 62 and 43%, respectively, and high-grade dysplastic lesions by 43 and 32%, respectively. After 35 weeks, similar significant reductions were seen only with the diet containing 5% black rasp-berries.
The effect of blueberries (Vacci-nium corymbosum) of the Rubel vari-ety on NMBA-induced tumorigenesis in the rat oesophagus was investigated (Aziz et al., 2002). Male Fischer 344 rats, 6-7 weeks old, were placed on AIN-76A diet or AIN-76A diets containing 5 or 10% freeze-dried blue-berries. The energy content of the berry diets was maintained by appro-priately reducing the corn starch con-tent. Animals were maintained on the respective diets throughout the study. Two weeks after initiation of the exper-imental diets, three groups of rats (25 animals per group) were given sub-cutaneous injections of NMBA (0.25 mg/kg bw) once per week for 15 weeks. Control groups received either the vehicle (20% DMSO in water) or a diet containing 10% blueberries only. At 25 weeks, the rats were killed and oesophageal tumours were counted and sized. There were no significant differences in tumour incidence, multi-plicity or size in berry-fed animals versus animals treated with NMBA only. The authors concluded that the lack of tumour-inhibitory effect of blue-berries, in contrast to that of strawber-ries and black raspberries under similar conditions, might be explained, at least in part, by their relatively low content of ellagic acid.
Colon Mouse Mice were treated with 1,2-climethyl-hydrazine (DMH) to induce colon
tumeurs and fed cabbage during the initiation and/or post-initiation periods (Temple & El-Khatib, 1987; Temple & Basu, 1987). In the first study, groups of 14-17 male and female Swiss ICR mice, aged 5-7 weeks, were fed con-trol diet or a diet containing 131% cab-bage throughout the study. After 31 days, the mice received weekly subcu-taneous injections of DMH at gradually increased doses of 23-56 mg/kg bw for seven weeks. All animals were killed 17 weeks after the first dose of DMH. Feeding of the cabbage diet had no significant effect on colon tumour incidence or multiplicity (Temple & El-Khatib, 1987). In the second experi-ment, cabbage was fed (a) starting five weeks before the first injection of DMH until three days after the last (initiation period) or (b) starting three days after the first DMH injection for 19.5 weeks (promotion period). DMH was injected once weekly for eight weeks at doses increasing from 17 to 65 mg/kg bw. Feeding of cabbage during the initia-tien period led to a modest increase in incidence of adenocarcinomas. In con-trast, the incidence of adenomas was reduced by 30% and multiplicity by 59% (p < 0.05) when cabbage was given during the promotion period (Temple & Basu, 1987).
Van Kranen et al. (1998) evaluated the effect on intestinal neoplasia of the amount of dietary fat and a fruit—veg-etable mixture. Groups of 14-17 male and female weanling Apc'Oill mice, a model for multiple intestinal neoplasia, were fed a low-fat (20% fat energy) or a high-fat (40% fat energy) diet with or without a freeze-dried fruit—vegetable mixture (19.5 and 22.3% w/w, respec-tively). The choice of fruits and vegeta-bles was based on the mean fruit and vegetable consumption in The Netherlands. The composition of the high-fat diets was adjusted to allow for decreased food consumption in these groups. Because of the early onset of tumours in these mice, exposure to the
281

IARC Handbooks of Cancer Prevention Volume 8: Fruit and Vegetables
diets was started in utero and contin-ued until around day 90 after birth. The fruit-vegetable mixture added to the low-fat diet significantly lowered the multiplicity of polyps in the small intes-tine (from 16.2 to 10.2 per mouse) but not in the colon, in male mice only. Surprisingly, the multiplicity of intesti-nal polyps was significantly increased in both male and female mice on the high-fat diet containing fruit-vegetable mixture (from 16.5 to 26.8 polyps per mouse on average).
Rat Alink et al. (1993) studied the modulat-ing effect of heat processing and of addition of fruit and vegetables to human diets on DMH-induced colon tumeurs in male Wistar rats. The same diets as in the chronic study were used, which included 19.5% of fruit and vegetable mixture (Alink et al., 1989; see Effects on spontaneous tumours above). These diets were fed throughout the study. After four weeks, each rat was given one weekly subcu-taneous injection of DMH (50 mg/kg bw) for 10 weeks. Animals were killed after eight months. A lower multiplicity of polypoid adenomas was found in rats consuming the animal diet with fruit and vegetables compared with the control animal diet (1.4 versus 2.6; p < 0.01). In contrast, adding fruit and veg-etables to the fried or baked human diet increased the multiplicity of adeno-carcinomas (2.9 versus 2.1; p < 0.05). The authors hypothesized that this might be due to an interaction between fat and non-nutrient components of the fruit and vegetables.
In a further experiment, the effect of low- and high-fat diets in combina-tion with a fruit-vegetable mixture on DMH-induced colon carcinogenesis was studied (Rijnkels et al., 1997a, b). Groups of 30 five-week-old male Wistar rats were maintained on low-fat (20% fat energy) or high-fat (40% fat energy) diets with or without 19.5% of
fruit-vegetable mixture. After four weeks, each rat was given one weekly subcutaneous injection of DMH (50 mg/kg bw) for 10 weeks. The experi-ment was terminated 35 weeks after initiation of the diet regimen. The fruit-vegetable mixture added to either the low-fat or the high-fat diet induced a non-significant decrease in the num-ber of adenomas.
The effect of a fruit-vegetable mix-ture on N-methyl-W-nitro-N-nitroso-guanidine (MNNG)-induced colon car-cinogenesis was studied in male Wistar rats (Rijnkels et al., 1997c). Groups of 30 five-week-old rats were fed low-fat or high-fat semi-purified diets with or without 19.5% of a fruit.-vegetable mixture. After four weeks, all animals were given weekly intrarectal instillations of MNNG (6 mg/kg bw) for five weeks. After 35 weeks, all animals were killed and colon tumeurs were evaluated histopathologically. The fruit-vegetable mixture significantly reduced the development of colon adenocarcino-mas (p < 0.01) when added to the high-fat diet, but not when added to the low-fat diet.
The effects of a fruit-vegetable mixture administered during the initia-tion and promotion stages of azoxymethane (AOM)-induced colon carcinogenesis were studied in rats (Rijnkels et al., 1998). Groups of 30 five-week-old male Fischer 344 rats were fed semi-purified low-fat (20% fat energy) or high-fat (40% fat energy) diets with or without 19.5% of fruit-vegetable mixture. Four weeks after initiation of the experiment, all animals were given three weekly sub-cutaneous injections of AOM (15 mg/kg bw). Eight weeks after the start of the study, animals on control diets were switched to the corresponding diet supplemented with a fruit-veg-etable mixture and those on the fruit-vegetable diets were switched to the corresponding control diet, in both
cases until 36 weeks from the begin-ning of the experiment. The fruit-veg-etable mixture administered during either the initiation or the post-initiation stage had no effect on AOM-induced colon carcinogenesis, irrespective of the fat content of the diet.
The effect of tomato juice on N-methylnitrosourea (MNU)-induced colon carcinogenesis was studied in female Fischer 344 rats (Narisawa et al., 1998). Groups of 24 or 25 seven-week-old rats received intrarectal instillations of MNIJ at 2 mg or 4 mg three times per week for three weeks. Animals had free access to water (con-trol group), a 17 ppm aqueous lycopene solution, or tomato juice diluted 1:2 or 1:14 and containing 17 ppm or 3.4 ppm [sic[ lycopene, respec-tively. The colon tumour incidence was evaluated at week 35. After adminis-tration of 2 or 4 mg MNU, consumption of tomato juice containing 17 ppm lycopene significantly reduced colon tumour incidence compared with the other groups, and tumour multiplicity compared with controls only The more dilute tomato juice had no effect on colon carcinogenesis.
Miyagi et al. (2000) studied the effect of orange juice administered during the post-initiation period of AOM-induced colon carcinogenesis in rats. Groups of 30 male Fischer 344 rats, 21 days old, were fed control diet until 36 days of age. At 22 and 29 days of age, all animals were given a sub-cutaneous injection of AOM (15 mg/kg bw). One week after the second dose of AOM, one group was switched from drinking water to orange juice and a modified diet, while the other group remained on the control diet. [The Working Group noted that the source of carbohydrate in the control diet was primarily corn flour, whereas the diet of the orange juice group was more sucrose-based[. The study was termi-nated at 33 weeks of age. There was a 22% lower colon tumour incidence
282

Cancer-preventive effects
(p < 0.05) in the animals given orange juice. [The Working Group noted that the total energy intake was not calcu-lated, but final body weights were sim-ilar between the groups].
The effect of mandarin juice on AOM-induced colon carcinogenesis was studied in seven-week-old male Fischer 344 rats (20-29 per group) (Tanaka et al., 2000). All animals were fed control diet and were given a sub-cutaneous dose of AOM (20 mg/kg bw) once per week for two weeks. Beginning one week after the second dose of ACM, one group was switched from drinking water to commercial mandarin juice at night-time, while maintained on a control diet. The experiment was terminated at week 38. The incidence and multiplicity of colon adenocarcinomas were signifi-cantly decreased in animals given mandarin juice (35% versus 69% in controls, p < 0.02; 0.40 ± 0.58 versus 0.76 ± 0.57 tumours per rat; p < 0.05, respectively).
The effect of orange pulp on DMH-induced colon tumorigenesis was stud-ied in Sprague-Dawley rats (Kossoy et al., 2001). Five week-old rats [sex unspecified] were fed control diet (n = 30) or experimental diet containing 15% orange pulp (n 42). DMH was injected at 20 mg/kg bw once weekly for six weeks starting together with administration of experimental diet. The experiment was continued for eight months. Administration of orange pulp in the diet had no effect on the incidence of total colon adenocarcino-mas, but significantly reduced the inci-dence of the more advanced endo-phytic adenocarcinomas in the colon (p < 0.05), while significantly increas-ing that of the less advanced exophytic adenocarcinomas (p < 0.05).
Inhibition of AOM-induced colon carcinogenesis by black raspberries (Rubus occidentalis) of the Jewel vari-ety was studied in rats (Harris et al., 2001). Groups of 18 male Fischer 344
rats, 8-9 weeks old, were given intraperitoneal injections of AOM (15 mg/kg bw) once per week for two weeks. Control animals received an equal volume of saline only or a diet containing 5% freeze-dried black rasp-berries. Animals were switched to a diet containing 0, 2.5, 5 or 10% black raspberries 24 hours after the last AOM injection and were maintained on these diets throughout the experiment. The sucrose content of the berry diets was reduced to maintain the energy content of the diets. The number of aberrant crypt foci nine weeks after the last dose of AOM decreased by 34%, 25% and 21% in the groups fed 2.5, 5 and 10% black raspberry, respectively, relative to the AOM-only group. The reductions were significant compared with controls in all groups (p < 0.01), although there was not a significant dose—response relationship. At 33 weeks after the last dose of ACM, the remaining animals were killed and the tumours analysed. Control animals had no tumours. Total tumour multiplic-ity (adenomas + adenocarcinomas) was reduced by 42, 45 and 71% in the groups fed 2.5, 5 and 10% black rasp-berry, respectively, relative to ACM controls (p < 0.05 for all groups). Adeno-carcinoma multiplicity decreased by 28, 35 and 80% in the same groups; only the reduction in rats fed 10% black raspberry was significant (p< 0.01).
Liver Rat Groups of male weanling Fischer 344 rats were fed a semi-purified diet con-taining 25% (w/w) freeze-dried ground cabbage (Brass/ca oleracea L.) or table beet (Beta vulgar/s L.), with or without 1 ppm aflatoxin B1 (Boyd et al., 1982). After 26 weeks of treatment, all animals were maintained on basal diet without aflatoxin for a further 16 weeks. Control animals had no tumours. The mean, median and max-
imum size, and the number of tumours exceeding 10 mm in diameter were all significantly lower (p < 0.05) in animals fed the cabbage diet. [The Working Group noted that the cabbage diet resulted in decreased food intake and thus decreased intake of aflatoxin 131.]
Groups of 25 male Sprague-Dawley rats, two months old, were given N-nitrosodiethlamine (NDEA) in drinking water for 10 weeks (total dose 500 mg/kg bw) (Rieder et al., 1983). Animals were fed a control diet or 120 or 160 g of carrots per week without any other supplementary food. [The Working Group considered that the amount of carrots given was very high (unbalanced diet), as was the dose of carcinogen administered.] In the first study (120 or 160 g carrots per week), feeding of carrots started together with carcinogen administration; in the sec-ond study (160 g of biological' or mar-ket' carrots per week), feeding started two weeks before carcinogen adminis-tration. Carrots were given for 14 weeks. Feeding 120 g or 160 g carrots per week together with or before car- cinogen treatment significantly delayed tumour occurrence and pro-longed survival compared with animals on the control diet. The effects with 160 g carrots per week were signifi-cantly greater than those with 120 g carrots per week. No difference was observed between the biological' and 'market' carrots.
Toad Sadek et al. (1995) assessed the effect of cabbage on DMBA-induced hepato-carcinogenesis in toads (Bufo viridis). DMBA (0.5 mg in 0.1 mL olive oil) was administered into dorsal lymph sacos of sexually mature male and female toads weighting 40 g, three times per week for 12 weeks. Controls received olive oil only. A solution of ground cab-bage leaves was fed at 1 or 2 mL per animal per day for 12 weeks starting 3 h before carcinogen treatment or 3 h
283

IARC Handbooks of Cancer Prevention Volume 8: Fruit and Vegetables
after carcinogen treatment. Toads treated with 1 or 2 mL cabbage 3 h before DMBA treatment (initiation period) showed a significantly lower incidence of hepatocellular carcino-mas compared with those treated with DMBA alone. However, feeding of cab-bage after carcinogen treatment (post-initiation period) had no effect on liver tumour incidence compared with ani-mals treated with IDMBA alone.
Lung Mouse The ability of strawberries (Fragaria ananassa) of the Allstar variety to inhibit lung tumorigenesis after induc-tion with 4-(methylnitrosamino)-1 -(3-pyridy-1 -butanone (NNK) or ben-zo[a]pyrene (B[a]P) was examined in A/J mice (Carlton at aL, 2000). Groups of 20 mice were fed AIN-76A diet or a diet containing 10% freeze-dried strawberries for the entire duration of the study. The diet was modified to maintain total energy intake. One week after diet initiation, mice were treated with NNK or Bfa]P over a two-week period. NNK was administered in saline by intraperitoneal injection in five doses of 0.414 mg each. B[a]P was administered in cottonseed oil by gavage in five doses of 0.2 mg each. Animals were killed 20 or 24 weeks after the first dose of NNK or B[a]P, respectively. There was no significant difference in lung tumour incidence or tumour multiplicity between the 10% strawberry groups and their respective control groups.
The effect of mandarin juice on N N K-induced pulmonary carcinogene-sis was studied in male NJ mice (Kohno at aI., 2001). Seven-week-old mice (20-23 per group) were given a single intraperitoneal injection of NNK (10 prnol per mouse). One week later, one group received mandarin juice in drinking water at night for 21 weeks. Administration of mandarin juice had no effect on lung tumour incidence or
multiplicity or on incidence of alveolar cell hyperplasia.
Skin Mouse The effect of bitter gourd extract in water (Momordica cha ra nt/a) was studied in 4-5-week-old female Swiss albino mice (Ganguly at al., 2000). One group of 25 mice received three topical applications of 1% DMBA On alternate days followed by 1% croton oil applied twice weekly for two months. The other group of 25 mice received the same treatment simulta-neously with oral administration of 5% bitter gourd extract (50!.LL per mouse) daily for three months. Treatment with bitter gourd extract delayed the appearance of skin papillomas and significantly reduced the incidence of papillomas at 12 weeks (control diet, 78%; bitter gourd diet, 19.5% [values read from diagram]; p < 0.05), but did not affect the multiplicity
Mammary gland Rat The effect of Brussels sprouts (Brass/ca oleracea L.) administered during the initiation and progression stages of DMBA-induced mammary carcinogenesis was studied in Sprague-Dawley rats (Stoewsand at al., 1988). Female rats, five weeks old, were divided into groups of 15 ani-mals. One group (I) was fed 20% freeze-dried Brussels sprouts for the first four weeks, followed by 48 weeks on basal diet. The other group (Il) was fed basal diet for 17 weeks and then switched to the Brussels sprouts diet for 35 weeks, until termination of the study. All animals received a single oral dose of DMBA (60 mg/kg bw) two weeks after the beginning of the study. Administration of Brussels sprouts during the initiation period (group I) significantly reduced the incidence of OMBA-induced palpable mammary tumours 15 weeks after dosing (13%
versus 77%; p < 0.01) and of adeno-carcinomas 50 weeks after dosing (p < 0.05). [The Working Group noted that the study did not include appropriate controls for the progression period and that animals in group Il had signifi-cantly lower body weight.] In another study with the same initiation protocol (Stoewsand et al., 1989), administra-tion of Brussels sprouts 27 weeks after DMBA injection reduced the incidence and multiplicity of DMBA-induced pap-illary carcinomas and adenocarcino-mas, and significantly reduced prolifer-ation, anaplasia and invasiveness in these tumeurs.
Groups of 50-day old female Sprague-Dawley rats were given a sin-gle injection of MNU (50 mg/kg bw) into the tail vein. Rats were then assigned to groups (25-35 in each group) and fed a control-fat (5%) diet containing 5 or 10% dried cabbage, 3.2% cabbage residue or 5% collards, or a high-fat (24.6%) diet containing 5% cabbage or 5% collards. The study was terminated when palpable mam-mary tumours reached a diameter of 0.5 cm or at 24 weeks. The rats on the control-fat diet containing 5% cabbage or 3.2% cabbage residue had signifi-cantly lower incidence [25 to 38% decrease] of mammary adenocarcino-mas than rats fed the control diet with-out cabbage. This effect was not observed in rats on the high-fat diet containing cabbage (Bresnick at al., 1990).
Liu at al. (1992) determined the efficacy of garlic powder administered during the initiation and post-initiation periods of DMBA-induced mammary carcinogenesis in rats. In an initiation study, groups of 41-day old female Sprague-Dawley rats were fed a diet containing 0, 1, 2 or 4% garlic powder for two weeks before and two weeks after a single DMBA treatment by intu-bation (25 mg/kg bw). In an initiation and post-initiation study, groups of female Sprague-Dawley rats were fed
284
Cancer-preventive effects
2% garlic powder from two weeks before DMBA treatment until termina-tion of the study at 24 weeks. Garlic administered during initiation (at the 4% level) and during initiation and post-initiation significantly (p < 0.05) reduced DMBA-induced mammary tumour incidence (350% and 40%, respectively, versus 85% in controls) and multiplicity (1.57 and 1.50 tumours per tumour-bearing rat, respectively, versus 2.41 in controls).
Three groups of 25 female Sprague-Dawley rats, 41 days of age, were fed control diet or a 2% freeze-dried milled garlic powder diet two weeks before and one week after intra-gastric administration of 10 mg DMBA (initiation period), or the same diet from two weeks before until 24 weeks after DMBA administration (initiation and post-initiation period), when the experiment was terminated (Ip et al., 1992). Administration of garlic powder during the initiation stage had a slight but not significant effect on mammary tumour incidence and multiplicity, whereas continuous administration of garlic powder significantly (p < 005) reduced both mammary tumour inci-dence (84 versus 56%) and multiplicity [2.84 versus 1.52 tumours per rat].
The effect of garlic powder on MNU-induced mammary carcinogene-sis was studied in female Sprague-Dawley rats (Schaffer et al., 1996). Groups of rats, 41 days of age, were fed the control diet or experimental diet containing 2% garlic powder for 14 days (21 rats per group). All rats then received MNU intraperitoneally (15 mg/kg bw) and continued on their dietary regimen for 25 weeks. Administration of garlic powder in the diet significantly (p < 0.05) reduced mammary tumour incidence (by 76%) and tumour multiplicity (by 81%).
The effect of dietary Thai bitter gourd administered during the initiation stage of DMBA-induced mammary carcinogenesis was studied in female
Sprague-Dawley rats (Kusamran et al., 1998a). Groups of 41-day-old animals were pair-fed on control diet or experi-mental diet containing 6.25 or 12.5% freeze-dried Thai bitter gourd for two weeks before and one week after a single oral dose of DMBA (50 mg/kg bw) and killed 25 weeks after dosing. Administration of Thai bitter gourd at 6.25 and 12.5% during the initiation stage significantly suppressed the mul-tiplicity of mammary tumours [by 50%, read from diagram], but had no effect on the incidence.
Uterine cervix Mouse The effect of garlic on 3-methyicholan-threne (3-MC)-induced cervical car-cinogenesis was evaluated in groups of random-bred 8-10-week-old virgin Swiss albino mice (Hussain et al., 1990). A sterile cotton thread impreg-nated with beeswax containing about 600 tg 3-MC was inserted into the canal of the uterine cervix by means of a laparotomy. Ground garlic prepared in distilled water at a level of 1% was administered orally at a dose of 400 mg/kg bw per day for two weeks before and four weeks after 3-MC thread insertion. Twelve weeks after the insertion of threads, all animals were killed and tissues were processed for histopatliological exami-nation. Administration of garlic significantly decreased the incidence of 3-MC-induced squamous-cell carci-noma of the uterine cervix (23% ver-sus 73% in controls). However, garlic had no effect on the incidences of hyperplasia and dysplasia in the uter-ine cervix.
Bladder Mouse The effect of aged garlic extract on bladder carcinogenesis was evaluated in female C3H/HeN mice given implants of MBT2 bladder tumour cells (Riggs et al., 1997). MBT2 bladder
tumours were originally induced in C3H/HeN mice by oral administration of N-[4-(5-nitro-2-furyl)-2-thiazolyl]for-mamide (FANFT). Tumour cells for transplantation were prepared by mincing tumours and mechanically dis-persing the tissue into a single-cell suspension. Garlic extract was admin-istered orally at doses of 5, 50 and 500 mg/i 00 mL drinking water. One month after initiation of garlic treatment, 1000 MBT2 cells in 0.1 mL cell culture medium were subcutaneously injected into the right thigh. The experiment was terminated 23 days after tumour cell implantation for determination of tumour incidence and after 35 days for tumour volume. Treatment with garlic led to a dose-dependent reduction in tumour incidence, which was statisti-cally significant at the highest dose (500 mg/i 00 mL). In addition, animals that received 50 and 500 mg garlic extract in drinking water had significant reductions in tumour volume (2563 and 1644 mm3, respectively, versus 4047 mm3 in controls).
Rat The inhibitory properties of tomato juice against urinary bladder carcino-genesis were evaluated in rats (Okajima et al., 1998). Bladder cancer was induced in six-week-old male Fischer 344 rats by 0.05% N-butyt-N- (4-hydroxybutyl)nitrosamine (BBN) given in the drinking water for eight weeks. This was followed by tap water (control) or tomato juice diluted 1:4 for 12 weeks. BBN induced simple hyper-plasia, nodulopapillary hyperplasia and transitional-cell carcinomas in the urinary bladder. Tomato juice reduced the multiplicity (1.17 ± 0.9 versus 2.20 ± 1.4; p <0.05) but not the incidence of transitional-cell carcinomas, and had no effect on simple or nodulopapillary hyperplasia in the bladder.
285

IARC Handbooks of Cancer Prevention Volume 8: Fruit and Vegetables
Biomarkers Intermediary biomarkers that are potentially related to cancer risk include markers for uptake, chemical activation deactivation and DNA-bind-ing of carcinogens, DNA repair, cyto-genetic markers and markers for oxidative damage to DNA. Other inter-mediary cancer biomarkers relate to cell turnover and apoptosis, to intercel-lular communication and to altered expression of genes involved in the cell cycle and its regulation. The fol-lowing review covers studies of the effect of diets enriched with fruits and vegetables on such biomarkers in experimental animals, which have mostly used extracts prepared from single fruits and vegetables. Much research has concentrated on the effects of compounds contained in Brass/ca vegetables, All/urn vegeta-bles and polyphenol-rich plants or their extracts.
Effects on phase I and Il enzymes Total fruit and vegetables Several studies have considered the effects of fruit and vegetable mixtures on enzyme induction. In a three-month feeding study on the effects of human-type diets on hepatic drug-metaboliz-ing enzymes (Alink et al., 1988), groups of five male and five female Wistar SPF rats were fed a semi-syn-thetic control diet or a complete north-ern European (Dutch) diet without vegetables and fruit, or a complete northern European diet including 19.9% local summer vegetables and fruit (40.1% potato, 3.4% banana, 10.3% orange, 21.8% apple, 4.3% each of lettuce, tomato, cucumber and cauliflower, 2.9% each of look and spinach, and 1.4% pepper) or lyo-philized semi-synthetic diets contain-ing 20.1% local summer vegetables plus fruit or 20.0% local winter vegeta-bles (44.6% potato, 3.8% banana, 11.5% orange, 24.2% apple, 3.2% each of red cabbage, white cabbage,
sauerkraut and beet, and 1.6% each of carrot and Brussels sprout) plus fruit. Vitamins and minerals were added to all diets to the same final content and diets were isocaloric and with similar distribution of energy from fat (40%), protein (13%) and carbohydrate (47%) by addition of semi-purified compo-nents identical to those used in the control feed. The diets were irradiated at 500 krad and analysed to ensure equal contents of vitamins and miner-ais in each diet and stored at —40 00
until use. All three diets containing fruits or vegetables significantly increased hepatic ethoxycoumarin-O-deethylase activity (ECOD) in the male rats by 33-42%, whereas only hepatic ethoxyresorufin-O-deethylase (EROD) activity was increased (by 96-122%) in the female group fed summer vegeta-bles and fruit compared to the control group. The increase in the females dosed with summer vegetables based on the northern European diet also was not significant compared with the group given the corresponding diet without vegetables and fruit (12%). Aminopyrine-N-demethylase was not affected by any of the treatments in either sex. Total CYP enzyme activity was increased only in male rats given the northern European diet without vegetables and in the winter vegeta-bles group (by 20%). Hepatic glu-tath ione- S-transfe rase (GST) was only increased in the males by summer vegetables and fruits (by 81%), while U DP-glucu ronosyltransfe rase (UGT) activity was unaffected. Mierosomes from the rat livers were subsequently screened in Salmonella typh/murium TA98 for their ability to activate benzo[a]pyrene (B[a]P) to mutagenic products. All fruit- and vegetable-con-taining diets decreased the ability of subsequently prepared hepatic micro-somes to activate B[a]P by 20-40% (estimated from diagram). A similar assay in S. typhimurium TA100 showed that all human diets, except
the complete northern European that including summer vegetables and fruit, caused a 25-50% decrease (esti-mated from diagram) in the activation of IV-nitrosodimethylamine (NDMA) by subsequently prepared hepatic micro-somes.
Hepatic and colonic enzyme activi-ties induced by six weeks' feeding of a vegetable—fruit mixture (19.5% w/w) (35.1% potato, 3.0% banana, 9.0% orange, 19.1% apple, 3.75% lettuce, 1.25% green pepper, 3.75% tomato, cucumber and cauliflower, 2.5% each of spinach, leek, red cabbage, white cabbage, sauerkraut and beetroot, and 1.25% each of carrot and Brussels sprout) was investigated in groups of five male Wistar rats fed low- or high-fat diets (20 or 40% of energy) (Rijnkels & Alik, 1998). Half of the ani-mals in each group were treated with DMH (four subcutaneous injections of 50 mg/kg bw from week 2 to 5). In the liver of control rats on the low-fat diet, the vegetable mixture increased GST, decreased NDMA-demethylase and left EROD and pentoxyresorufin-O-deethylase (PROD) unaffected. In low-fat DMH-treated rats, the effect was reversed and PROD was increased by the vegetable and fruit treatment. The reported changes in enzyme activities were from 1.2- to 2.1-fold. In rats fed the high-fat diet, fruit and vegetable treatments had no effect.
Studies with several individual vegetables A few studies have been performed to compare the effects of individual vegetables on enzyme induction. Bradfield et al. (1985) fed a range of powdered vegetables (cauliflower, car-rot, kale, beet, Brussels sprout, egg plant or onion), mixed individually at a 20% level into isocaloric feeds, for 10 days to groups of four or five male C57BL/6 mice. Kale, cauliflower and carrots significantly increased hepatic ECOD activity 1.3, 2.2 and 1.2-fold,
286
Cancer-preventive effects
respectively, whereas Brussels sprouts, cauliflower and onions simi-larly increased hepatic epoxide hydro-lase (1.6-, 1.6-, and 2.3-fold) and GST activities (2.0-, 1.2-, and 1.8-fold), respectively.
Dried powdered preparations of cabbage (20% w/w) or Brussels sprouts (20% w/w) fed individually to groups of 5-10 female ICR/Ha mice for two weeks also significantly increased GST activity in the small intestine (2.1- and 3.1-fold, respec-tively) (Sparnins et al., 1982). In the liver, only Brussels sprouts increased the activity (1.8-fold). [The Working Group noted that no compensation for the vegetables was made to the con-trol diets.]
Lyophilized vegetables were indi-vidually added (12 g per rat per day) to human-type diets (23 g per rat per day) offered for three weeks to groups of three male Fischer 344 rats and induc-tion of phase I and Il enzymes in the liver and colon was measured (O'Neill et al., 1997). [The Working Group noted that actual intakes were not recorded.] Broccoli and Brussels sprouts significantly increased hepatic GST by 24-64%, whereas broccoli decreased colonic GST by 35%. Spinach, tomato paste, peas and pep-pers significantly decreased GST, mainly in the liver, and changes were all below 20%. flhe Working Group noted that the changes seemed too small to be truly statistically significant taking into account the small numbers in each group]. GST activity deter-mined with either chloro-dinitroben-zene (CDNB) or dichloro-nitrobenzene (DCNB) as substrate gave highly cor-related results. No effect on quinone reductase (OR) in liver or colon was reported. CYP lAi was increased in liver only after treatment with Brussels sprouts, whereas no effects on this enzyme or on CYP 1A2, 2B1, 2132, 3A or 2E1 1 were observed in liver or colon with any other treatment.
Kusamran et al. (1998b) fed two freeze-dried preparations of vegeta-bles commonly consumed in Thailand (Thai and Chinese bitter gourd, both at 12.5% in the diet, substituting propor-tional amounts of carbohydrate, fibre and protein) to groups of 10 pair-fed male Wistar rats for two weeks. Thai bitter gourd decreased hepatic aniline hydroxylase and aminopyrine-N-demethylase by 37% and 28%, respectively, increased GST by 59% and counteracted ex vivo activation by hepatic 59 preparations of aflatoxin B1 and B[a]P by 30-64%.
Single fruits and vegetables Various studies have examined the ability of a single fruit or vegetable to modify activities of phase I or II enzymes in experimental animals. Experiments with Brass/ca (broccoli, cabbage, Brussels sprout), All/urn (garlic and onion), Momordica (bitter gourd) and citrus (grapefruit) species have been reported.
Groups of female ICR/Ha mice [number of animals per group not given] were given suspensions of broc-coli tablets in 1% carboxymethylcellu-lose, 25% glycerol (1 glkg bw) by gav-age (Clapper et al., 1997). [The Working Group noted that the dose was unclear; the concentration of broc-coli in the suspension was not stated.] The broccoli tablets contained 5 g of lyophilized pesticide-free broccoli. GST activity in colon tissues was higher one day after broccoli adminis-tration, but decreased by day two. GSTi. and a were significantly induced one day after the treatment and decreased almost to baseline by day 2 fthe Working Group noted that the exact increase was not stated].
Groups of five female Wistar rats were fed a 10% broccoli diet for seven days or a control diet containing the same amount of carbohydrates, fibres, proteins and vitamins (yang et al., 1991). In the liver, levels of CYP1A1,
1A2, 2B and 2E1 proteins and of total CYP1A mRNA increased, whereas mRNAs corresponding to the other proteins were unaffected. In the colon, CYP1A1, 2B and 2E1 proteins as well as CYP1A1 mRNA increased, whereas CYP213 mRNA decreased. CYP1A2 protein and mRNA were either unaffected or undetectable.
A subsequent study with a similar design examined the effects of feeding broccoli samples, varying in their con-tents of glucosinolates, on testicular phase I and II enzymes and antioxi-dant enzymes (yang et al., 1999). The broccoli, grown with varying amounts of N and S fertilizer or organically, was fed at a level of 10% in the diet to groups of 8-10 male Wistar rats for one week. Broccoli, most prominently that grown with high levels of N fertil-izer, affected GST (1.6-told induction) and UGT (1.8-fold induction), but did not statistically significantly change the activities of epoxide hydrolase, OR, p-sulfotransferase or the anti-oxidative enzymes catalase (CAT) and glu-tathione peroxidase (GPX) in rat testes. CYP enzyme activities were also measured in this study (yang et al, 2001). Dietary broccoli induced the CYP1 A activities, EROD and 7 methoxy-resorufin-O-demethylase (MROD), in rat liver and weakly in colon, but not in kid-ney. Consistent with this finding, the hepatic metabolism of 2-amino-1- methyl-6-phenylimida70[4,5-b]pyridine (PhIP) to the proximate carcinogen N-hydroxy-PhIP, a CYP1 A-related activ-ity, was enhanced by broccoli. PROD activity, an assay for CYP2131/2, was weakly induced in colon and kidney but not in liver. The 21-hydroxy- and 613-hydroxy-testosterone hydroxylase activities were induced in liver micro-somes, showing that broccoli increased CYP3A activity. The observed modula-tions of CYP activities depended clearly on the broccoli sample used, the Shogun cultivar giving a higher response than Emperor. Significantly
287

[ARC Handbooks of Cancer Prevention Volume 8: Fruit and Vegetables
different levels of enzyme induction were observed with broccoli samples grown under different conditions.
Groups of four male Wistar rats (McDanell et al., 1989) were fed ad libitum during six days a semi-syn-thetic diet with or without 25% freeze-dried Brussels sprouts, or an equiva-lent amount of aqueous methanolic Brussels sprouts extract, or the residue remaining after this extraction. Feeding Brussels sprouts increased EROD 2.5-, 4.9- and 4.1-fold in the liver, small and large intestine, respec-tively; feeding the extract also increased, although slightly, the enzy-matic activity, whereas the residue was without effect. In a time-course study, groups of four male Wistar rats were fed 20 g of a single semi-synthetic meal containing 25% (dry weight) cab-bage [the Working Group noted that no modification was made to the control feed] (MeDanell et al., 1989). EROD activity was significantly decreased in the liver 1-2 hours after dosing and in the small intestine was significantly increased 4-6 h after dosing. No effect was observed in the large intestine.
In two dose—response studies (Bogaards et al., 1990), groups of 5-8 newly weaned male Fischer 344 rats were fed a semi-synthetic diet with 0, 2.5, 5, 10, 15, 20 or 30% Brussels sprouts added (substituting for protein and fibre) during a 28-day period, after which the liver and small intestines were analysed for GST activity (using CDNB as substrate) and content of GST subunits 1, 2, 3, 4 and 7. Casein and cellulose were given to controls, for protein and fibre compensation. A significant dose—response relationship was observed, with increases of 17% in GST activity and 15% in GST protein content in the liver after the lowest dose. The corresponding figures were 182% and 121% after the highest dose. Subunits 1, 2 and 3 appeared to be the most responsive. In the small intestine, GST activity was induced
only after feeding 15% or more of Brussels sprouts. GST protein sub-units 1, 2 and 4 were significantly induced after feeding 15% or 30% Brussels sprouts. Total GST protein, determined only in the second experi-ment, was not significantly induced after feeding 20% Brussels sprouts.
Groups of six male Wistar rats were fed 0-20% cooked Brussels sprouts in the diet for periods of 2-28 days and liver and small intestines were assayed for various phase I and phase Il activities (Wortelboer et al., 1992). Hepatic microsomal EROD and PROD were increased from day 2 onwards in rats given 20% Brussels sprouts in the diet and from day 14 onwards in rats given 5%. No effect was observed at the 2.5% dietary level, in the small intestine, EROD and PROD activities were increased only at the highest dose, after 2 and 7 days, respectively. Hepatic microsomal tes-tosterone 213- and 6[3-hydroxylase activities were increased from 7 and 14 days onwards in the highest dose group only and no effects were observed in microsomes from the small intestine. Western blots indicated dose-related increased levels of CYP1A2 in the liver and of CYP2131/2 in the small intestine. Hepatic GST, UGT type 1 and DT-diaphorase tended to increase from day 2 at the two higher dose levels and glucuronyl transferase 1 also increased after 28 days of feeding with 2.5% Brussels sprouts. In contrast, glucuronyl trans-ferase 2 decreased initially at the 2.5 and 5% levels, but after 28 days there was no effect at these lower dose lev-els, while an increase was observed in the rats fed 20% Brussels sprouts. In the small intestine, GST increased from day 2 at the 200% dose level whereas DT-diaphorase increased, on day 2 only, at both the 5% and 20% dose levels.
Groups of eight male Wistar rats were treated by gavage with Brussels
sprouts extract equivalent to 7 g per day of fresh vegetable for four days and livers and kidneys were removed 6 h after the last dose to assay expres-sion or activities of phase I and Il enzymes (Sorensen et al., 2001). No change was observed in the expres-sion of hepatic CYP1A2, CYP2B or CYP2E1 . The OR activity increased by 155% in liver but not in kidney, and hepatic expression of GSTh increased by 30%.
Liu et al. (1992) examined the influ-ence on liver and mammary GST activity of dietary supplements of garlic powder (2 or 4%) fed to groups of five female Sprague-Dawley rats. After two weeks of treatment, garlic at 2 or 4% increased GST activity by 91 and 100%, respectively, in liver and by 42% and 47% in the mammary tissue.
In groups of 6-8 male Sprague-Dawley rats, oral treatment with 200-1000 mg/kg bw garlic oil daily for 1-3 days led to increases in GST expression (50-150%) and activity (.,.40%) in rat liver and decreases in CYP activities, notably inducible CYP2E1 (Kwak et al., 1995).
Groups of male Wistar rats [num-ber of rats per group not given] were fed 0.1, 0.5 or 1% powdered garlic for four weeks before a single dose of B[aP or 3-MC and urine was collected for 24 h (Polasa & Krishnaswamy, 1997). The animals were then killed and the liver and lungs assayed for OR and the liver for GST (CDNB sub-strate). Garlic dose-dependently decreased urinary mutagenicity in S. typhimurium TA98 after B[a]P dosing, whereas mutagenicity in TA100 or mutagenicity in both strains after 3-MC dosing was decreased to an equal extent by all three garlic dose levels. All three doses increased hepatic GST (30-43%) and OR (80-100%, read from diagram) and lung OR (40-50%, read from diagram) to similar extents.
The interaction with respect to hepatic phase I and II enzymes
288
Cancer-preventive effects
between dietary fat and garlic oil (200 mg/kg bw) given as three weekly intu-bations during seven weeks was investigated in groups of 4-5 male Sprague-Dawley rats (Sheen et al.,
1999). Garlic oil increased GST activity by 38-40%, but did not significantly affect NDMA-demethylase, PROD, total CYP or total NADPH-cytochrome c reductase. I mmunoblot analyses revealed increased hepatic levels of CYP2131 and GST (placental form) and decreased CYP2EI after intubation with garlic oil. The content of fat (5 or 20%) in the feed did not interact with garlic oil. In a subsequent study, groups of five male Sprague-Dawley rats, fed either a low- or high-fat diet, were treated with 0, 30, 80 or 200 mg/kg bw garlic oil by gavage three times per week for six weeks (Chen et aL, 2001 a). Garlic oil dose-dependently increased liver GST and PROD activities and CYP2131 mRNA and pro-tein levels. Again, the effects of garlic oil were independent of dietary fat con-tent.
Oral administration of bitter gourd extract (5% in water) daily for three months to groups of eight Swiss albino female mice significantly increased hepatic GST in normal mice and in mice skin-painted with DMBA (Ganguly et al., 2000).
Grapefruit juice is known to have some capacity to modify the biotrans-formation of certain drugs (Bailey at al., 1994). The effect was investigated in groups of 6-9 male Sprague-Dawley rats given a daily oral dose of 4 or 8 mL'kg of grapefruit juice for two days, followed on the second day by a dose of pentobarbitone sodium (50 mg/kg). The juice significantly increased sleeping time in a dose-dependent manner (46% and 79%, respectively) (Sharif & Ah, 1994). Administration of 4 mL grapefruit juice per day for two days (four rats per time point) inhibited theophylline metabo-lism up to 90 min after administration
of theophylline (10 mg/kg bw). Pure commercial grapefruit juice offered instead of drinking water to groups of three male Fischer 344 rats did not affect the plasma clearance of a sub-sequent dose of PhIP (60 mg/kg bw) (Miyata at aI., 2002).
In summary, fruit and vegetable mixtures at levels relevant to human dietary intakes can increase both phase I and Il xenobiotic-metabolizing enzyme activities. Evidence from stud-ies with high doses of single vegeta-bles indicates a stronger ability to induce phase Il enzymes. Induction has been observed both in the liver and extrahopatically in lung, intestines and mammary tissue. In studies look-ing at dose—response effects, phase Il enzymes were induced in a dose-related manner.
Inhibition of damage to macromole-cules Mixtures of fruit and vegetables Groups of 4-5 female Sprague-Dawley rats were fed a standard diet, or a specially composed diet with cereals and cereal by-products, or vegetable by-products, milk and sugar, or vegetable by-products together with meat and fish by-products and vegetable oil. Blood samples were collected after four weeks to determine background levels of 4-aminobiphenyl adducts in haemoglobin (Richter at al., 2000). [The Working Group noted that no information was given on the nature of the vegetables included in the diets and that only the vegetable and milk diet was similar to the control diet in macronutrient composition]. Adduct levels were significantly decreased by 50% in animals on both diets contain-ing vegetable by-products, whereas the cereal-based (high-fibre) diet had no effect.
Individual fruit and vegetables The protective effect of garden cress (Lepidium satIvum) towards genotoxic
effects induced by 2-amino-3-methyl-imidazo[4,5-f]quinoline (10) was inves-tigated by single-cell gel electrophore-sis (SCGE) assays (Kassie et al., 2002). Pretreatment of groups of three male Fischer 344 rats with fresh gar-den cress juice (0.8 mL) for three con-secutive days led to significant reduc-tions (p < 0.05) in DNA damage induced by 10 (90 mg/kg, 0.2 mL corn oil/animal) in colon and liver cells in the range of 75-92%.
The influence of dietary supple-ments of garlic powder (2 or 4%), offered two weeks before and two weeks after DMBA treatment (25 mg/kg bw), significantly and dose-dependently reduced mammary DNA adduct levels (approximately 30-70%, respectively), as determined by 32P-postlabelling in groups of five female Sprague-Dawley rats (Liu etaL, 1992). In a subsequent study on the interac-tion between garlic and selenite on DMBA-induced liver and mammary DNA adducts, marked enhancement of the selenium-induced protection was observed with concomitant garlic treat-ment (Schaffer etal., 1997). Groups of five female Sprague-Dawley rats were fed sodium selenite (0.1, 0.5 or 1 mg/kg diet) in combination with garlic powder (0, 20 or 40 mg/ kg diet) in a 3 x 3 factorial design. After two weeks of feeding, all rats were given 25 mg/kg bw DMBA in corn oil by intubation. After 24 h, total DNA adducts in mam-mary tissue were determined. Garlic dose-dependently decreased the adduct level in the low-selenium group (40-80%) and the effect was potenti-ated by dietary selenium, increasing to 50% and almost 100% in the high-selenium group (values read from dia-gram). A decrease in the specific anti- 34-dihydrodiol-1 ,2-epoxide deoxy- guanosine adduct accounted for almost the entire effect.
Various garlic preparations were fed to groups of six female Sprague-Dawley rats for two weeks before a
289
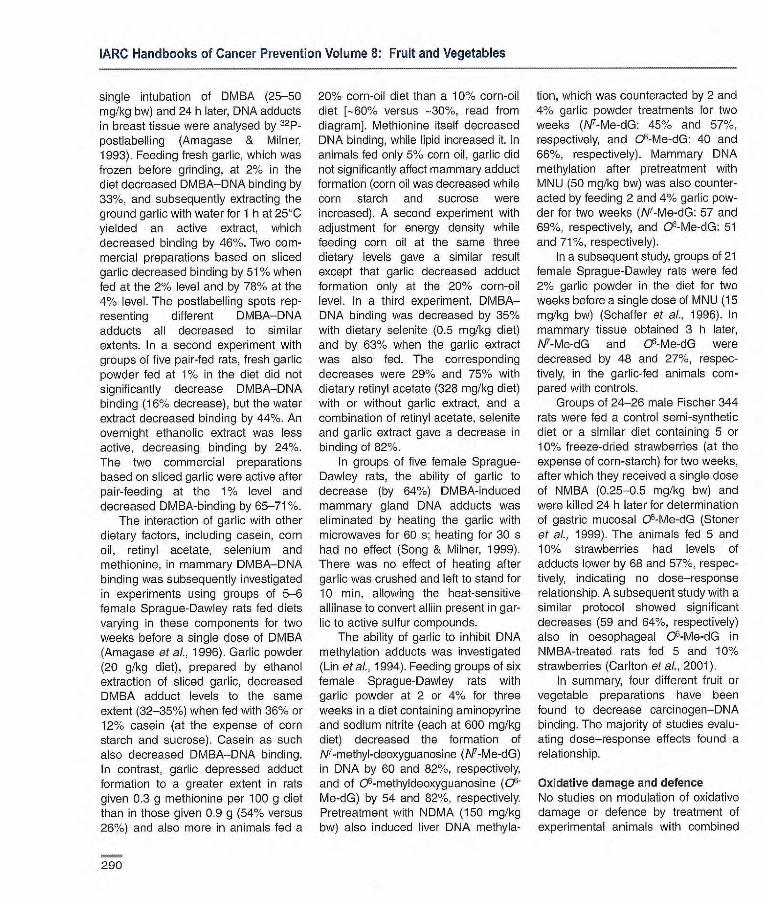
IARC Handbooks of Cancer Prevention Volume 8: Fruit and Vegetables
single intubation of DMBA (25-50 mg/kg bw) and 24 h later, DNA adducts in breast tissue were analysed by 32P-postlabelling (Amagase & Milner, 1993). Feeding fresh garlic, which was frozen before grinding, at 2% in the diet decreased DMBA-DNA binding by 33%, and subsequently extracting the ground garlic with water for 1 h at 25CC yielded an active extract, which decreased binding by 46%. Two com-mercial preparations based on sliced garlic decreased binding by 51% when fed at the 2% level and by 78% at the 4% level. The postlabelling spots rep- resenting different DMBA--DNA adducts all decreased to similar extents. In a second experiment with groups of five pair-fed rats, fresh garlic powder fed at 1% in the diet did not significantly decrease DMBA-DNA binding (16% decrease), but the water extract decreased binding by 44%. An overnight ethanolic extract was less active, decreasing binding by 24%. The two commercial preparations based on sliced garlic were active after pair-feeding at the 1% level and decreased DMBA-binding by 65-71%.
The interaction of garlic with other dietary factors, including casein, corn oil, retinyl acetate, selenium and methionine, in mammary DMBA-DNA binding was subsequently investigated in experiments using groups of 5-6 female Sprague-Dawley rats fed diets varying in these components for two weeks before a single dose of DMBA (Amagase et aI., 1996). Garlic powder (20 g/kg diet), prepared by ethanol extraction of sliced garlic, decreased DMBA adduct levels to the same extent (32-35%) when fed with 36% or 12% casein (at the expense of corn starch and sucrose). Casein as such also decreased DMBA-DNA binding. In contrast, garlic depressed adduct formation to a greater extent in rats given 0.3 g methionine per 100 g diet than in those given 0.9 g (54% versus 260%) and also more in animals fed a
20% corn-oil diet than a 10% corn-oil diet [-60% versus -30%, read from diagram]. Methionine itself decreased DNA binding, while lipid increased it. In animals fed only 5% corn oil, garlic did not significantly affect mammary adduct formation (corn oil was decreased while corn starch and sucrose were increased). A second experiment with adjustment for energy density while feeding corn oil at the same three dietary levels gave a similar result except that garlic decreased adduct formation only at the 20% corn-oil level. In a third experiment, DMBA-DNA binding was decreased by 35% with dietary selenite (0.5 mg/kg diet) and by 63% when the garlic extract was also fed. The corresponding decreases were 29% and 75% with dietary retinyl acetate (328 mg/kg diet) with or without garlic extract, and a combination of retinyl acetate, selenite and garlic extract gave a decrease in binding of 82%.
In groups of five female Sprague-Dawley rats, the ability of garlic to decrease (by 64%) DMBA-induced mammary gland DNA adducts was eliminated by heating the garlic with microwaves for 60 s; heating for 30 s had no effect (Song & Milner, 1999). There was no effect of heating after garlic was crushed and left to stand for 10 mm, allowing the heat-sensitive allilnase to convert alliin present in gar-lic to active sulfur compounds.
The ability of garlic to inhibit DNA methylation adducts was investigated (Lin et al., 1994). Feeding groups of six female Sprague-Dawley rats with garlic powder at 2 or 4% for three weeks in a diet containing aminopyrine and sodium nitrite (each at 600 mg/kg diet) decreased the formation of N7-methyl-deoxyguanosine (1\F-Me-dG) in DNA by 60 and 82%, respectively, and of 06-methyldeoxyguanosine (06- Mo-dG) by 54 and 82%, respectively. Pretreatment with NÛMA (150 mg/kg bw) also induced liver DNA methyla-
tion, which was counteracted by 2 and 4% garlic powder treatments for two weeks (N7-Me-dG: 45% and 571/., respectively, and 06-Me-dG: 40 and 66%, respectively). Mammary DNA methylation after pretreatment with MNU (50 mg/kg bw) was also counter-acted by feeding 2 and 4% garlic pow-der for two weeks (M-Me-dO: 57 and 69%, respectively, and 06-Me-dG: 51 and 71%, respectively).
In a subsequent study, groups of 21 female Sprague-Dawley rats were fed 20/. garlic powder in the diet for two weeks before a single dose of MNU (15 mg/kg bw) (Schaffer et aI., 1996). In mammary tissue obtained 3 h later, M-Me-dG and 06-Me-dG were decreased by 48 and 27%, respec-tively, in the garlic-fed animals com-pared with controls.
Groups of 24-26 male Fischer 344 rats were fed a control semi-synthetic diet or a similar diet containing 5 or 10% freeze-dried strawberries (at the expense of corn-starch) for two weeks, after which they received a single dose of NMBA (0.25-0.5 mg/kg bw) and were killed 24 h later for determination of gastric mucosal 03-Me-dG (Stoner et aI., 1999). The animals fed 5 and 10% strawberries had levels of adducts lower by 68 and 57%, respec-tively, indicating no dose-response relationship. A subsequent study with a similar protocol showed significant decreases (59 and 64%, respectively) also in oesophageal 03-Me-dG in NM BA-treated rats fed 5 and 10% strawberries (Carlton et aI., 2001).
In summary, four different fruit or vegetable preparations have been found to decrease carcinogen-DNA binding. The majority of studies evalu-ating dose-response effects found a relationship.
Oxidative damage and defence No studies on modulation of oxidative damage or defence by treatment of experimental animals with combined
290
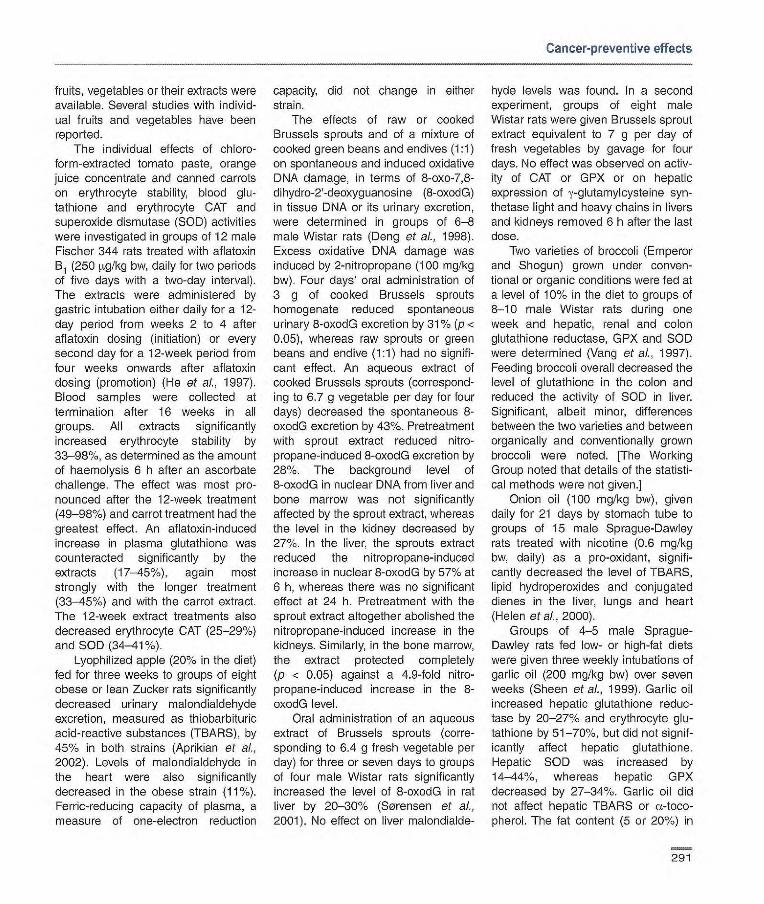
Cancer-preventive effects
fruits, vegetables or their extracts were available. Several studies with individ-ual fruits and vegetables have been reported.
The individual effects of chloro-form-extracted tomato paste, orange juice concentrate and canned carrots on erythrocyte stability, blood glu-tathione and erythrocyte CAT and superoxide dismutase (SOD) activities were investigated in groups of 12 male Fischer 344 rats treated with aflatoxin B1 (250 [ig/kg bw, daily for two periods of five days with a two-day interval). The extracts were administered by gastric intubation either daily for a 12-day period from weeks 2 to 4 after aflatoxin dosing (initiation) or every second day for a 12-week period from four weeks onwards after aflatoxin dosing (promotion) (He et al., 1997). Blood samples were collected at termination after 16 weeks in all groups. All extracts significantly increased erythrocyte stability by 33-98%, as determined as the amount of haemolysis 6 h after an ascorbate challenge. The effect was most pro-nounced after the 12-week treatment (49-98%) and carrot treatment had the greatest effect. An aflatoxin-induced increase in plasma glutathione was counteracted significantly by the extracts (17-45%), again most strongly with the longer treatment (33-45%) and with the carrot extract. The 12-week extract treatments also decreased erythrocyte CAT (25-29%) and SOD (34-41%).
Lyophilized apple (20% in the diet) fed for three weeks to groups of eight obese or lean Zucker rats significantly decreased urinary malondialdehyde excretion, measured as thiobarbituric acid-reactive substances (TBARS), by 45% in both strains (Aprikian et al., 2002). Levels of malondialdehyde in the heart were also significantly decreased in the obese strain (11%). Ferric-reducing capacity of plasma, a measure of one-electron reduction
capacity, did not change in either strain.
The effects of raw or cooked Brussels sprouts and of a mixture of cooked green beans and endives (1:1) on spontaneous and induced oxidative DNA damage, in terms of 8-oxo-7,8-dihydro-2-deoxyguanosine (8-oxodG) in tissue DNA or its urinary excretion, were determined in groups of 6-8 male Wistar rats (Deng et al., 1998). Excess oxidative DNA damage was induced by 2-nitropropane (100 mg/kg bw). Four days' oral administration of 3 g of cooked Brussels sprouts homogenate reduced spontaneous urinary 8-oxodG excretion by 310/ (p < 0.05), whereas raw sprouts or green beans and endive (1:1) had no signifi-cant effect. An aqueous extract of cooked Brussels sprouts (correspond-ing to 6.7 g vegetable per day for four days) decreased the spontaneous 8-oxodG excretion by 43%. Pretreatment with sprout extract reduced nitro-propane-induced 8-oxodG excretion by 28%. The background level of 8-oxodG in nuclear DNA from liver and bone marrow was not significantly affected by the sprout extract, whereas the level in the kidney decreased by 27%. In the liver, the sprouts extract reduced the nitropropane-induced increase in nuclear 8-oxodG by 57% at 6 h, whereas there was no significant effect at 24 h. Pretreatment with the sprout extract altogether abolished the n itropropane- induced increase in the kidneys. Similarly, in the bone marrow, the extract protected completely (p < 0.05) against a 4.9-fold nitro-propane-induced increase in the 8-oxodG level.
Oral administration of an aqueous extract of Brussels sprouts (corre-sponding to 6.4 g fresh vegetable per day) for three or seven days to groups of four male Wistar rats significantly increased the level of 8-oxodG in rat liver by 20-30% (Sorensen et al., 2001). No effect on liver malondialde-
hyde levels was found. In a second experiment, groups of eight male Wistar rats were given Brussels sprout extract equivalent to 7 g per day of fresh vegetables by gavage for four days. No effect was observed on activ-ity of CAT or GPX or on hepatic expression of '-glutamylcysteine syn-thetaso light and heavy chains in livers and kidneys removed 6 h after the last dose.
Two varieties of broccoli (Emperor and Shogun) grown under conven-tional or organic conditions were fed at a level of 10% in the diet to groups of 8-10 male Wistar rats during one week and hepatic, renal and colon glutathione reductase, GPX and SOD were determined (yang et al., 1997). Feeding broccoli overall decreased the level of glutathione in the colon and reduced the activity of SOD in liver. Significant, albeit minor, differences between the two varieties and between organically and conventionally grown broccoli were noted. [The Working Group noted that details of the statisti-cal methods were not given.]
Onion oil (100 mg/kg bw), given daily for 21 days by stomach tube to groups of 15 male Sprague-Dawley rats treated with nicotine (0.6 mg/kg bw, daily) as a pro-oxidant, signifi-cantly decreased the level of TBARS, lipid hydroperoxides and conjugated dienes in the liver, lungs and heart (Helen et ai., 2000).
Groups of 4-5 male Sprague-Dawley rats fed low- or high-fat diets were given three weekly intubations of garlic oil (200 mg/kg bw) over seven weeks (Sheen et al., 1999). Garlic oil increased hepatic glutathione reduc-tase by 20-270% and erythrocyte glu-tathione by 51-70%, but did not signif-icantly affect hepatic glutathione. Hepatic SOD was increased by 14-44%, whereas hepatic GPX decreased by 27-34%. Garlic oil did not affect hepatic TBARS or o.-toco-pherol. The fat content (5 or 20%) in
291

IARC Handbooks of Cancer Prevention Volume 8: Fruit and Vegetables
the feed did not significantly interact with the garlic oil treatment.
Lyophilized garlic fed at 2% in the diet to groups of eight male Wistar rats for three weeks decreased CAT activ-ity and CAT protein levels in renal cor-tex, but did not influence CAT expres-sion (Pedraza-Chaverri et aI., 2000). Treatment of rats with the nephrotoxic drug gentamicin (75 mg/kg by subcu-taneous injection every 12 hours dur-ing the last six days) led to increased urinary excretion of lipid peroxidation products, decreased activity of Mn-SOD and GPX in the renal cortex and of plasma GPX and decreased activity and expression of CAT in the renal cortex in rats given ordinary chow. Geritamicin-treated and garlic-supple-mented rats only experienced a decrease in renal cortex CAT activity similar to the action of garlic alone. A subsequent study by the same group indicated that the decrease in CAT activity in the renal cortex followed a garlic-induced decrease in tissue levels of H202 (Pedraza-Chaverri et al., 2001).
Three months' daily feeding of a 5% bitter gourd extract to groups of eight female Swiss albino mice increased hepatic GPX, CAT and SOD by 110%, 100% and 57%, respectively [values read from diagram] and decreased the ex vivo susceptibility of hepatic microsomes to lipid peroxida-tien (>60%; read from diagram) and to lymphocyte DNA strand breakage (61%; read from diagram) (Ganguly et al., 2000). Similar effects were found in mice treated with DMBA in croton oil.
In summary, the evidence from ani-mal studies with respect to effects of fruit and vegetables on antioxidant enzymes and direct oxidative damage to DNA is inconsistent, whereas lipid oxidation seems in many cases to be reduced by such treatments.
Effects on mutation and DNA strand breaks Groups of six Long-Evans male rats were allowed to drink ad libitum only fresh or boiled (100°C, 15 mm) veg-etable juices (500 g vegetable to 1 L juice, 7-17 mL juice per day) during one week and bone marrow micronu-cleus formation induced by DMBA was measured (Ito et al., 1986). Fresh or boiled extracts of onion, burdock, egg plant, cabbage and Welsh onion and boiled pumpkin extract all reduced DMBA-induced clastogenicity by 40-68%. Fresh pumpkin juice in-creased clastogenicity, while fresh or boiled juices from lettuce, carrot, peaman (bell pepper) and celery were inactive.
Seven fruit and ten vegetable extracts, prepared with organic sol-vents, were tested for their ability to inhibit the clastogenic effects of cyclophosphamide and B[a]P in the mouse bone marrow micronucleus assay (Edenharder et al., 1998). Groups of four 7-12-week-old male NMRI mice were treated intraperi-toneally with B[a]P (150 mg/kg bw in 200 iL corn oil) or orally with cyclophosphamide (200 mg/kg bw in saline by gastric intubation) to induce micronuclei and simultaneously by gastric intubation with 05m mL sus-pension of freeze-dried fruit or veg-etable extracts. Sweet cherries, straw-berries, bananas, kiwi fruit, oranges and peaches all decreased the clasto-genic effects significantly (10-40% decrease); a 39% decrease caused by apples was not significant. Among the vegetables, cucumber, radish, tomato, Brussels sprouts, asparagus, red beet, yellow-red peppers and spinach (22-79% decrease) had significant activ-ity, but cauliflower and onions did not sig- nificantly decrease clastogenicity. Further fractionation of the orange extract revealed that several fractions contained active principles, and that dif-ferent fractions contained activity against each of the two clastogens tested.
The influence of five days of grape-fruit juice intake on PhIF-induced DNA damage in the colon was examined by the comet assay in groups of three male Fischer 344 rats given 60 mg/kg of PhIP by gavage three hours before sacrifice. DNA damage in the colon of rats allowed free access to grapefruit juice for five days was significantly reduced to 400% of the level in control rats (Miyata et al., 2002). The effect was found to be unrelated to absorp-tion and biotransformation of PhIP.
In summary, evidence from three studies with more than ten different fruits and vegetables points to a pre-ventive effect of many on carcinogen-induced DNA damage and mutation.
Effects on DNA repair No studies on modulation of DNA repair caused by treatment of experimental animals with combined fruits, vegeta-bles or their extracts were available.
Groups of eight male Wistar rats were given an aqueous Brussels sprout extract equivalent to 7 g per day of fresh vegetable for four days by gav-age and the livers and kidneys were removed 6 In after the last dose (Sorensen et al., 2001). No effect on the activity of 8-oxoguanosine DNA glycosylase (OGG1) was observed in either organ.
Intermediary markers related to the cell cycle A range of lyophilized vegetables were individually added to human-type diets [no details were given] at a level of 12 g per day and fed to groups of three male Fischer 344 rats and the mitotic index and proliferating cell nuclear antigen (PCNA) in colon cells were measured (O'Neill et al., 1997). PCNA responded only marginally, whereas spinach, petit pois (green peas) and peppers decreased the mitotic index substantially. Only the effect of petit pois (41% decrease) was statistically significant. There was an inverse
292
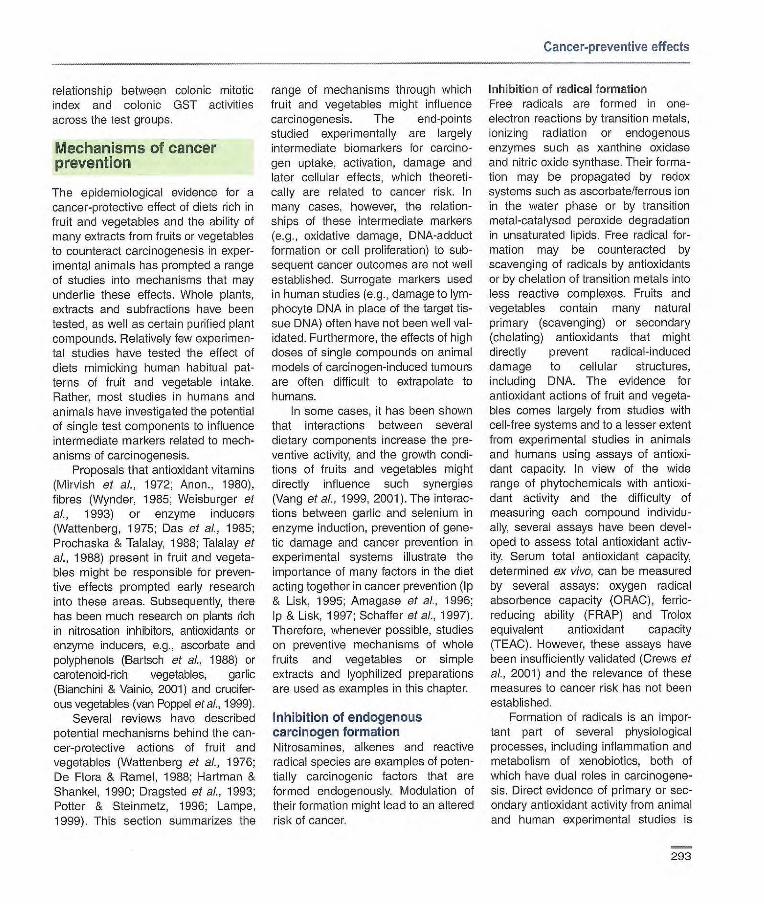
Cancer-preventive effects
relationship between colonic mitotic index and colonic GST activities across the test groups.
Mechanisms of cancer prevention
The epidemiological evidence for a cancer-protective effect of diets rich in fruit and vegetables and the ability of many extracts from fruits or vegetables to counteract carcinogenesis in exper-imental animals has prompted a range of studies into mechanisms that may underlie these effects. Whole plants, extracts and subfractions have been tested, as well as certain purified plant compounds. Relatively few experimen-tal studies have tested the effect of diets mimicking human habitual pat-terns of fruit and vegetable intake. Rather, most studies in humans and animals have investigated the potential of single test components to influence intermediate markers related to mech-anisms of carcinogenesis.
Proposals that antioxidant vitamins (Mirvish et aI., 1972; Anon., 1980), fibres (Wynder, 1985; Weisburger at aI., 1993) or enzyme inducers (Wattenberg, 1975; Das et al., 1985; Prochaska & Talalay, 1988; Talalay et aI., 1988) present in fruit and vegeta-bles might be responsible for preven-tive effects prompted early research into these areas. Subsequently, there has been much research on plants rich in nitrosation inhibitors, antioxidants or enzyme inducers, e.g., ascorbate and polyphenols (Bartsch et al., 1988) or carotenoid-rich vegetables, garlic (Bianchini & Vainio, 2001) and crucifer-ous vegetables (van Poppel et al., 1999).
Several reviews have described potential mechanisms behind the can-cer-protective actions of fruit and vegetables (Wattenberg at aI., 1976; De Flora & Ramel, 1988; Hartman & Shankel, 1990; Dragsted at al., 1993; Potter & Steinmetz, 1996; Lampe, 1999). This section summarizes the
range of mechanisms through which fruit and vegetables might influence carcinogenesis. The end-points studied experimentally are largely intermediate biomarkers for carcino-gen uptake, activation, damage and later cellular effects, which theoreti-cally are related to cancer risk. In many cases, however, the relation-ships of these intermediate markers (e.g., oxidative damage, DNA-adduct formation or cell proliferation) to sub-sequent cancer outcomes are not well established. Surrogate markers used in human studies (e.g., damage to lym-phocyte DNA in place of the target tis-sue DNA) often have not been well val-idated. Furthermore, the effects of high doses of single compounds on animal models of carcinogen-induced tumours are often difficult to extrapolate to humans.
In some cases, it has been shown that interactions between several dietary components increase the pre-ventive activity, and the growth condi-tions of fruits and vegetables might directly influence such synergies (yang et al., 1999, 2001). The interac-tions between garlic and selenium in enzyme induction, prevention of gene-tic damage and cancer prevention in experimental systems illustrate the importance of many factors in the diet acting together in cancer prevention (Ip & Lisk, 1995; Amagase at al., 1996; Ip & Lisk, 1997; Schaffer at aI., 1997). Therefore, whenever possible, studies on preventive mechanisms of whole fruits and vegetables or simple extracts and lyophilized preparations are used as examples in this chapter.
Inhibition of endogenous carcinogen formation Nitrosamines, alkenes and reactive radical species are examples of poten-tially carcinogenic factors that are formed endogenously. Modulation of their formation might lead to an altered risk of cancer.
Inhibition of radical formation Free radicals are formed in one-electron reactions by transition metals, ionizing radiation or endogenous enzymes such as xanthine oxidase and nitric oxide synthase. Their forma-tion may be propagated by redox systems such as ascorbate/ferrous ion in the water phase or by transition metal-catalysed peroxide degradation in unsaturated lipids. Free radical for-mation may be counteracted by scavenging of radicals by antioxidants or by chelation of transition metals into less reactive complexes. Fruits and vegetables contain many natural primary (scavenging) or secondary (chelating) antioxidants that might directly prevent radical-induced damage to cellular structures, including DNA. The evidence for antioxidant actions of fruit and vegeta-bles comes largely from studies with cell-free systems and to a lesser extent from experimental studies in animals and humans using assays of antioxi-dant capacity. In view of the wide range of phytochemicals with antioxi-dant activity and the difficulty of measuring each compound individu-ally, several assays have been devel-oped to assess total antioxidant activ-ity. Serum total antioxidant capacity, determined ex vivo, can be measured by several assays: oxygen radical absorbence capacity (ORAC), ferric-reducing ability (FRAP) and Trolox equivalent antioxidant capacity (TEAC). However, these assays have been insufficiently validated (Crews et ai., 2001) and the relevance of these measures to cancer risk has not been established.
Formation of radicals is an impor-tant part of several physiological processes, including inflammation and metabolism of xenobiotics, both of which have dual roles in carcinogene-sis. Direct evidence of primary or sec-ondary antioxidant activity from animal and human experimental studies is
293

IARC Handbooks of Cancer Prevention Volume 8: Fruit and Vegetables
scarce; the indirect evidence of decreased oxidative damage is dis-cussed later in this chapter. No long-term studies have investigated the relationship between markers of antioxidant capacity and cancer risk. In one small case-control study, increased serum total antioxidant status, measured by TEAC, was found to be associated with reduced breast cancer risk (Ching et al., 2002); however, the case—control design lim-ited the conclusions that could be drawn regarding temporality. To date, there is no evidence for a relationship between increased ex vivo antioxidant capacity of plasma and feeding with whole fruits or vegetables in experi-mental animals; the only study identi-fied had a negative outcome (Aprikian at al., 2002).
Inhibition of nitrosation Some of the factors that contribute to oxidative damage and the production of reactive oxygen species can also lead to production of reactive nitrogen species. A wide range of nitrogen-con-taining compounds and nitrosating agents to which humans are exposed react in vivo to form potentially carcinogenic N-nitroso, C-nitroso and reactive diazo compounds. Nitrosating agents are also synthesized endoge-nously by bacteria and activated macrophages. High exposure to nitrate leading to increased endogenous nitrosation has been proposed as a possible risk factor for several cancers (Bartsch et al., 1992). Therefore, inter-ventions that reduce formation of nitroso compounds may lower risk, although evidence to support this directly is lacking (Bartsch & Frank, 1996; Hughes et al., 2002).
Modulation of carcinogen bloavailability Dietary carcinogens need to be absorbed from the gut or at least to enter the opithelial cell lining of the
gastrointestinal tract in order to have an effect on cancer risk. In theory, fruit and vegetables may influence the bioavailabil ity of carcinogens by inhibiting their uptake or by increasing their excretion. Carcinogens may adsorb to structures in fruit and vegetables such as fibres or chloro-phyll or may be diluted by the increased bulk of material in the gas-trointestinal tract after meals contain-ing large amounts of fruit and vege-tables.
Aflatoxins adsorb strongly to chlorophyllin (a water-soluble copper complex of chlorophyll used as a food colorant), making them less bioavail-able and decreasing DNA binding and subsequent tumour development in trout (Breinholt et al., 1999; Hayashi et al., 1999). Chlorophyllin also reduces aflatoxin adduct formation in humans (Egner et al., 2001). Although chloro-phy!l was less potent than chlorophyllin in adsorbing aflatoxins (Dashwood et aI., 1998), the ubiquitous presence of chlorophylls and other porphyrins in green fruits and green leafy vegetables suggests that such a mechanism may be relevant to cancer prevention by fruit and vegetables.
The bulking or carcinogen-adsorb-ing effect of plant-based fibre-rich foods, including fruit and vegetables, has been hypothesized to be important for protection against exogenous and endogenous cancer-enhancing fac-tors, including secondary bile acids (Jacobs, 1986) and hydrophobic car-cinogens (Harris et aI., 1996). Certain fibres may be able to inhibit carcino-genesis by heterocyclic amines (Ferguson & Harris, 1996). In humans, supplementation with dietary fibre from vegetable and grain sources lowers faecal bile acid concentrations in a dose-dependent manner as a result of faecal bulking (Lampe et al., 1992), but there are no experimental studies to support such an effect of fruit and veg-etables in general.
Modulation of enzyme systems Many carcinogens need metabolic activation in order to elicit their effects. The oxidation (phase I) and conjuga-tion (phase Il) reactions involved in this process may be influenced by dietary fruit and vegetables. The enzyme sys-tems responsible for these transforma-tions also participate in steroid hor-mone metabolism and their modulation may therefore also affect risk of hor-mone-dependent cancers. The en-zymes involved in antioxidative defence against reactive oxygen and nitrogen species are another group that may be modulated by dietary fac-tors.
Phase I and II enzymes Phase I enzymes such as the cytochrome P450-dependent mono-oxygenases (CYP) catalyse oxidation, hydroxylation and reduction reactions, but may also convert hydrophobic compounds to reactive electrophiles. Phase Il enzymes such as UGT, sulfo-transferases and OSTs catalyse conju-gation reactions with water-soluble moieties to improve excretion. The bal-ance between carcinogen activation and detoxification is potentially impor-tant for cancer risk. Both oxidation reactions and conjugation can lead to formation of either activated, DNA-reactive metabolites or less toxic metabolites. Modulation of phase I and Il metabolism may therefore lead to increased or decreased risk of cancer, depending on the carcinogen in ques-tion. However, there are few examples of activation solely by conjugation and lack of ability to induce conjugating enzymes is associated with increased cancer risk in transgenic knock-out mice (Talalay & Fahey, 2001). Excessive induction of phase I enzymes has been associated with increased risk of cancer at several sites in humans (Lee et al., 1994; Landi at al., 1999; Mollerup et al., 1999; Stucker et al., 2000; Guen-
294
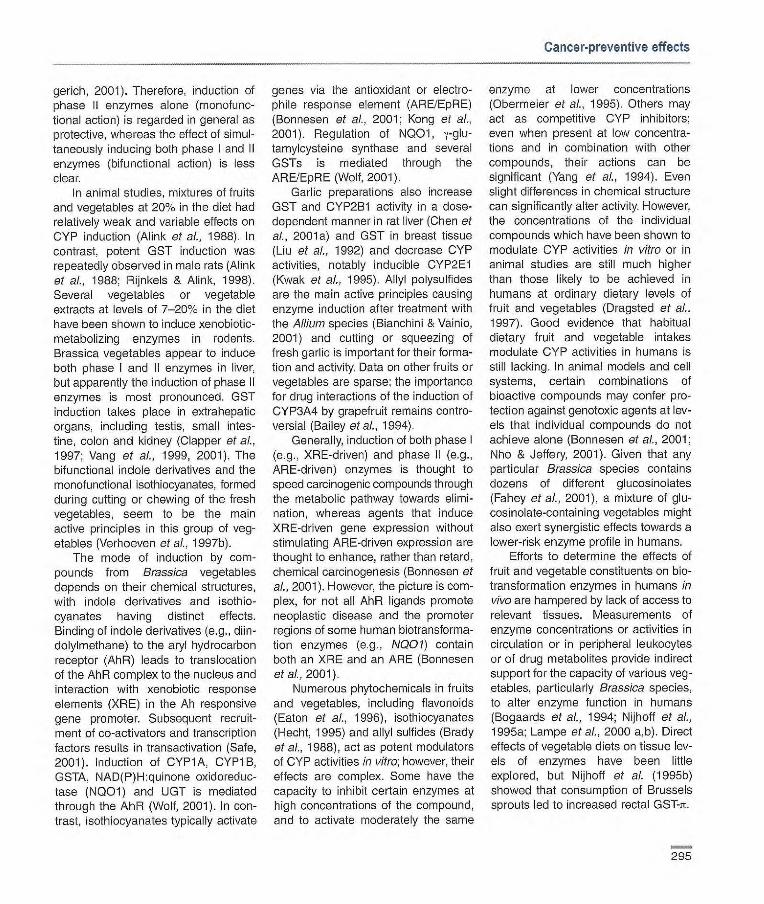
Cancer-preventive effects
gerich, 2001). Therefore, induction of phase II enzymes alone (monofunc-tional action) is regarded in general as protective, whereas the effect of simul-taneously inducing both phase I and Il enzymes (bifunctional action) is less clear.
In animal studies, mixtures of fruits and vegetables at 20% in the diet had relatively weak and variable effects on CYP induction (Alink et al., 1988). In contrast, potent GST induction was repeatedly observed in male rats (Alink et al., 1988; Rijnkels & Alink, 1998). Several vegetables or vegetable extracts at levels of 7-20% in the diet have been shown to induce xenobiotic-metabolizing enzymes in rodents. Brassica vegetables appear to induce both phase I and Il enzymes in liver, but apparently the induction of phase Il enzymes is most pronounced. GST induction takes place in extrahepatic organs, including testis, small intes-tine, colon and kidney (Clapper et al., 1997; yang et ai., 1999, 2001). The bifunctional indole derivatives and the monofunctional isothiocyanates, formed during cutting or chewing of the fresh vegetables, seem to be the main active principles in this group of veg-etables (Verhoeven et aI., 1997b).
The mode of induction by com-pounds from Brassica vegetables depends on their chemical structures, with indole derivatives and isothio-cyanates having distinct effects. Binding of indole derivatives (e.g., dim-dolylmethane) to the aryl hydrocarbon receptor (AhR) leads to translocation of the AhR complex to the nucleus and interaction with xenobiotic response elements (XRE) in the Ah responsive gene promoter. Subsequent recruit-ment of co-activators and transcription factors results in transactivation (Safe, 2001). Induction of CYP1A, CYP1B, GSTA, NAD(P)H:quinone oxidoreduc-tase (NQ01) and UGT is mediated through the AhR (Wolf, 2001). In con-trast, isothiocyanates typically activate
genes via the antioxidant or electro-phile response element (ARE/EpRE) (Bonnesen et al., 2001; Kong et al., 2001). Regulation of N001, y-glu-tamylcysteine synthase and several GSTs is mediated through the ARE/EpRE (Wolf, 2001).
Garlic preparations also increase GST and CYP2B1 activity in a dose-dependent manner in rat liver (Chen et al., 2001a) and GST in breast tissue (Liu et al., 1992) and decrease CYP activities, notably inducible CYP2 El (Kwak et al., 1995). Allyl polysulfides are the main active principles causing enzyme induction after treatment with the All/urn species (Bianchini & Vainio, 2001) and cutting or squeezing of fresh garlic is important for their forma-tion and activity. Data on other fruits or vegetables are sparse; the importance for drug interactions of the induction of CYP3A4 by grapefruit remains contro-versial (Bailey et al., 1994).
Generally, induction of both phase I (e.g., XRE-driven) and phase II (e.g., ARE-driven) enzymes is thought to speed carcinogenic compounds through the metabolic pathway towards elimi-nation, whereas agents that induce XRE-driven gone expression without stimulating ARE-driven expression are thought to enhance, rather than retard, chemical carcinogenesis (Bonnesen et al., 2001). However, the picture is com-plex, for not all AhR ligands promote neoplastic disease and the promoter regions of some human biotransforma-tion enzymes (e.g., NQ01) contain both an XRE and an ARE (Bonnesen et al., 2001).
Numerous phytochemicals in fruits and vegetables, including flavonoids (Eaton et al., 1996), isothiocyanates (Hecht, 1995) and allyl sulfides (Brady et al., 1988), act as potent modulators of CYP activities in vitro; however, their effects are complex. Some have the capacity to inhibit certain enzymes at high concentrations of the compound, and to activate moderately the same
enzyme at lower concentrations (Obermeier et al., 1995). Others may act as competitive CYP inhibitors; even when present at low concentra-tions and in combination with other compounds, their actions can be significant (Yang et al., 1994). Even slight differences in chemical structure can significantly alter activity. However, the concentrations of the individual compounds which have been shown to modulate CYP activities in vitro or in animal studies are still much higher than those likely to be achieved in humans at ordinary dietary levels of fruit and vegetables (Drageted et ai., 1997). Good evidence that habitual dietary fruit and vegetable intakes modulate CYP activities in humans is still lacking. In animal models and cell systems, certain combinations of bioactive compounds may confer pro-tection against genotoxic agents at lev-els that individual compounds do not achieve alone (Bonnesen et al., 2001; Nho & Jeffery, 2001). Given that any particular Brass/ca species contains dozens of different glucosinolates (Fahey et al., 2001), a mixture of glu-cosinolate-contai ning vegetables might also exert synergistic effects towards a lower-risk enzyme profile in humans.
Efforts to determine the effects of fruit and vegetable constituents on bio-transformation enzymes in humans in vivo are hampered by lack of access to relevant tissues. Measurements of enzyme concentrations or activities in circulation or in peripheral leukocytes or of drug metabolites provide indirect support for the capacity of various veg-etables, particularly Brass/ca species, to alter enzyme function in humans (Bogaards et al., 1994; Nijhoff et at., 1995a; Lampe et al., 2000 a,b). Direct effects of vegetable diets on tissue lev-els of enzymes have been little explored, but Nijhoff et al. (1995b) showed that consumption of Brussels sprouts led to increased rectal GST-t.
295

IARC Handbooks of Cancer Prevention Volume 8: Fruit and Vegetables
Human studies of the effects of cruciferous vegetable supplementation on metabolism of carcinogens and pro-moting agents, such as estrogens, have also provided support for a pro-tective effect through modulation of phase I and phase Il enzymes. Watercress added to the diet of smok-ers significantly increased glucuronida-tion of nicotine and tobacco-carcino-gen metabolites, but had modest effects on oxidative metabolism of these compounds (Hecht etaL, 1999; Murphy et al., 2001). Similarly, broccoli and Brussels sprouts increased the metabolism (reducing the excretion) of heterocyclic aromatic amines derived from cooked meat; this implied induc-tion of both CYP1A2 and relevant phase Il enzymes (Murray et al., 2001; Knize et aL, 2002).
Phase I and Il enzymes that metabolize and/or are modulated by phytochemicals also contribute to inac-tivation of endogenous steroid hor-mones. They alter the potency of testosterone, estrogen and their deriv-atives via oxidation and hydroxylation reactions and conjugation with sulfate and glucuronide moieties (Aoyama et aI., 1990). Thus, induction or inhibition of these enzyme systems in vivo can modify the biological effects of hor-mones. Several studies have demon-strated that high dietary levels of cru-ciferous vegetables can increase 2-hydroxylation of estrogens in humans, probably by inducing CYP1A2 (Bradlow et al., 1994; Kall et al., 1996).
In conclusion, some mechanisms by which constituents of certain fruits and vegetables, notably Brass/ca and All/urn species, induce phase I and II enzymes have been identified. However, the magnitude of effects in relevant human tissues remains unclear, because of the difficulties associated with accessing these tis-sues. Although induction may take place after consumption of several
hundred grams of certain vegetables, effects of habitual dietary intakes of fruit and vegetables have received little attention.
Antioxidant enzymes Modulation of antioxidant enzymes is hypothesized to affect protection against reactive oxygen species, but the cancer-preventive effects are not clear. An increase might be interpreted as a response to an oxidative chal-lenge or as an increased capacity for antioxidative defence, depending upon the experimental design.
In aflatoxin B1-dosed rats, CAT and SOD activity in blood decreased in relation to treatment time when the rats were treated with carrot, orange or tomato juice by gavage (He et al., 1997). Since plasma glutathione levels and erythrocyte haemolysis also decreased, the simplest explanation for these results would be that the decrease in the enzymes was a response to a decreased need for degradation of hydrogen peroxide and superoxide. These reactive oxygen species were not measured in the study, however, and no feedback sys-tem is known for the regulation of antioxidant enzymes in erythrocytes, which have no capacity for de nove protein synthesis. In rats that were not pretreated with a carcinogen, treatment for two weeks with garlic led to a decrease in hydrogen peroxide in the renal cortex (Pedraza-Chaverri et al., 2001), which coincided with a decrease in CAT, in support of a feedback regulation. Since CAT activ-ity and protein levels were affected but not CAT mRNA levels (Pedraza-Chaverri et al., 2000), post-transla-tional regulation may take place. Short-term treatment with Brass/ca juices did not seem to influence GPX or CAT activity in liver (Sørensen et al., 2001) or testes (yang et al., 1999). There is some evidence that the long-term effects of constitutive
increases in GPX or SOD may be either protective against cancer (Zhao et al., 2001; Shoichet et al., 2002) or, conversely, increase cancer in trans-genic animals (Lu et al., 1997; Marikovsky et al., 2002). Thus, in rela-tion to cancer, changes in cellular antioxidant defence can have complex consequences.
In humans, expression and activi-ties of SOD, CAT and GPX have been reported to be lower in tumours than in tumour-free adjacent tissue (Bostwick et al., 2000; Ho et al., 2001; Durak et al., 1996), as well as in conditions associated with elevated cancer risk, such as chronic pancreatitis (Cullen et al., 2003) and prostatic intraepithelial neoplasia (Bostwick et al., 2000). These data support the hypothesis that inflammation and the associated decreases in antioxidant enzyme activ-ity create an intracellular environment that favours DNA damage and the pro-motion of cancer (Ho et al., 2001). This is likely to be a local tissue effect and causality remains to be established; however, antioxidant enzyme activities in blood may serve as surrogate mark-ers of exposure and response to gen-eral oxidative stress. In healthy individ-uals, activities of CAT and GPX in whole blood haemolysates were signif-icantly higher in those exposed to envi-ronmental tobacco smoke than Th the unexposed, and levels of oxidative DNA damage were also higher in the exposed individuals (Howard et al., 1998). The few studies that examined effects of fruit or vegetable interven-tions on antioxidant enzyme activities in humans restricted their measure-ments to erythrocytes or plasma. The responses varied widely with the fruit or vegetable type and dose, and only a few disparate foods were tested (Castenmiller et al., 1999; Lean et al.. 1999; Nielsen et al., 1999; Young et al., 1999, 2000).
296
Cancer-preventive effects
Inhibition of damage to macro-molecules Many carcinogens are activated to electrophilic metabolites, which react with cellular macromolecules, includ-ing DNA, proteins and lipids (Miller & Miller, 1981). Reactive radical species have a similar pattern of activity. Fruit and vegetables contain factors that decrease the damage to macromolec-ular structures, determined as decreases in oxidative damage, in adducts, or in the downstream conse-quences of adduct formation, such as mutations or repair.
Decreased oxidative damage to lipids, proteins and DNA Experimental evidence is consistent with the view that increased oxidative DNA damage leads to elevated cancer risk (Halliwell, 2002). The 8-hydroxyla-tion of guanine bases in DNA is a frequent type of oxidative DNA dam-age that can lead to CC to TA trans-versions unless repairs are made before DNA replication (Cheng at al., 1992b). In vivo, when DNA is repaired by exonucleases, 8-hydroxy-2'- deoxyguanosine (8-OHdG) is subse-quently excreted in the urine without further metabolism. Increased levels of urinary 8-OHdG are associated with conditions characterized by increased oxidative stress, such as smoking, whole-body irradiation and cytotoxic chemotherapy (Kasai at al., 1986; Loft et al., 1992; Tagesson at al., 1995). Urinary levels of 8-OHdG also declined in response to intervention with Brussels sprouts (Verhagen at al., 1997) or to a high-vegetable and fruit dietary intervention (Thompson ot al., 1999a), but tomato sauce or fruit juice supplements had no effect (Rao & Agarwal, 1998; Dragsted et al., 2001). Raw Brussels sprouts did not affect urinary 8-OHdG excretion in rats, but cooked sprouts were effective and also significantly decreased nuclear 8-OHdG levels in bone marrow and kid-
neys (Dong at al., 1998). Levels in the liver were unaffected. In another study, Brussels sprouts increased 8-OHdG levels in rat liver (Sorensen et al., 2001).
As with many biomarkers associ-ated with early events in carcinogene-sis, direct and compelling evidence that 8-OHdG is a biomarker of subse-quent cancer development in humans is not available. There are several explanations why elevated oxidative DNA damage may not be consistently associated with increased cancer risk (Halliwell, 2002). Measurement of 8-OHdG in urine and/or easily accessi-ble tissues does not necessarily reflect damage in the target tissues of inter-est. For example, steady-state levels of 8-OHdG in rats can differ in different tissues (Devanaboyina & Gupta, 1996). The biomarker also does not adequately account for oxidative damage to RNA or to free deoxyguanosine and may be influ-enced by variations in DNA repair rates and by site of DNA oxidative damage. For example, unrepaired damage in genes encoding functional proteins crucial to tumour suppression such as p53 is likely to be more dele-terious than damage in non-coding regions of DNA (Halliwell, 2002). Finally, another explanation for the lack of evidence from human studies
may be insufficient statistical power due to the large inter-individual varia-tion in 8-OHdG excretion levels and the relatively small sample sizes in many of the studies.
Tissue levels of oxidative damage remain difficult to measure, although recent improvements in DNA extrac-tion have led to more reliable tech-niques (Ravanat et aL. 2002). Oxida-tive damage to DNA may also be determined by single-cell gel elec-trophoresis (SCGE) using restriction enzymes sensitive to oxidative dam-age to purines or pyrimidines. Protective effects towards DNA oxida-
tion have been observed by this tech-nique in several human studies after dietary modulation with fruits or veg-etables (Duthie at al., 1996; Pool-Zabel at al., 1997; Collins at aI., 1998, 2001; Porrini at aI., 2002). However, the effects are generally not strong, and, as with other markers of oxidative DNA damage, the technique shows large inter-individual variation.
Animal and human evidence points towards decreased lipid oxidation with increasing fruit and vegetable intake (Miller at al., 1998; Maskarinec at al., 1999; Aprikian at aL, 2002). Lipid oxi-dation products have been observed to form adducts with DNA in several human organs, including oral mucosa, colon, liver and breast, leading to increased genetic damage, and have been implicated as a risk factor for human colorectal adenomas (Chaud-hary at al., 1994; Wang at al., 1996; Zhang at al., 2002a; Leuratti et al., 2002). Adduct levels were similar to levels of 8-OHdG in human pancreas (Thompson at al., 1999b), underlining their potential importance. Protection against lipid oxidation may therefore contribute to cancer prevention.
In conclusion, it appears that fruit and vegetables may decrease direct or indirect (through lipid oxidation prod-ucts) oxidative damage to DNA, but the evidence linking such damage to decreased cancer risk is still very limited.
Decreased carcinogen—DNA binding or increased DNA repair Many carcinogens bind to DNA and it is generally believed that changes in the DNA code resulting from such binding are the main cause of cancer initiation, constituting the core of sub-sequent heritable genetic damage from early precancerous lesions up to the development of malignancy. Any decrease in carcinogen—DNA binding is therefore important for the preven-tion of cancer. Decreased binding may
297

IARC Handbooks of Cancer Prevention Volume 8: Fruit and Vegetables
be a result of decreased absorption, decreased formation of activated car-cinogen metabolites or increased detoxification and excretion. Many fruit and vegetables can influence these pathways, as discussed above. For instance, the potent inhibition of mam-mary DNA binding of DMBA in rats pre-treated with garlic extracts (Liu et al., 1992), the dependence of the effect on garlic crushing or ageing (Amagase & Milner, 1993; Song & Milner, 1999) and the synergy with selenite in eliciting this effect (Amagase et al., 1996; Ip & Lisk, 1997; Schaffer et al., 1997) are paralleled by similar actions of garlic and garlic constituents with respect to enzyme induction (Liu etal., 1992; Ip & Lisk, 1997). This strongly implicates changes in the enzymatic activation and deactivation of DMBA in the pre-vention of DNA damage. Deactivation seems to be important, since urinary excretion products of polycyclic aro-matic hydrocarbons have been observed to be less mutagenic after garlic supplementation in rats (Polasa & Krishnaswamy, 1997). Garlic prepa-rations also decrease the activity of hepatic CYP2E1 (Kwak et al., 1995), which is likely to account for the observed decrease in alkylation of DNA by nitrosamines and nitrosoureas (Lin et al., 1994). Examples exist of bioactive components in fruits and vegetables which are able directly to scavenge electrophilic metabolites (Wang et al., 1989; Athar et al., 1989) or to shield sensitive sites in DNA (Teel, 1986; Barch & Fox, 1988). Such actions or other as yet unknown mech-anisms may contribute to prevention of adduct formation by fruits and vegeta-bles.
The evidence for a link between decreased carcinogen—DNA adduct formation and dietary fruit and veg-etable intake in humans is very limited. In a cross-sectional study among 104 healthy Japanese men, no relationship was observed between total bulky
adducts in human lymphocytes and plasma 3-carotene, a marker of vegetable intake (Wang et al., 1997). Evidence from human studies of poly-morphisms in drug-metabolizing enzymes supports a link between car-cinogen activation, adduct formation and cancer risk at several sites (Li et al., 1996; Poirier, 1997; Peluso et al., 1998; Li et al., 2002; Chen et al., 2002c), but clear evidence that dietary fruit and vegetables may reduce the risk of cancers specifically through this mechanism is still lacking.
Measurements of DNA binding reflect the balance between adduct formation and removal. Alterations in DNA repair will also influence this bal-ance, and defects or polymorphisms in DNA-repair genes are known to affect cancer risk (Cheng et al., 2000b; Matullo etal., 2001; Bohr, 2002; Ito et al., 2002; Tang et al., 2002). However, there are no data indicating that fruit and vegetables enhance DNA repair. Thus, hepatic or renal expression of the DNA-repair enzyme OGG1 was not affected in rats after dosing with extracts of Brussels sprouts (Sorensen et al., 2001). In a human study with complete dietary control, a 25-day intervention with 600 g of fruit and veg-etables had no effect on expression of the repair enzymes OGG1 and ERCC1 in lymphocytes (Vogel et al., 2002).
Decreased mutation or cytogenetic damage Interaction of electrophilic compounds, including reactive oxygen or nitrogen species, with DNA bases can result in formation of DNA adducts or cross-links, which, during the course of attempted repair or replication, can lead to gene mutations, DNA strand breaks and other structural changes in DNA. Accumulation of genetic damage in crucial genes may contribute to the development of neoplastic cells. In ani-mal studies, the majority of the twenty-odd different fruit and vegetable juices
that have been tested counteracted cytogenetic damage to mouse bone marrow (Ito et aL, 1986; Edenharder et al., 1998). The observation that inhi-bitory activity was found with the majority of preparations suggests that this effect may be important for the preventive effects of fruit and vege-tables. Mutagenicity in vivo is generally regarded as a strong predictor of carcinogenicity in animal tests and decreased chromosomal damage may similarly be a predictor of protection against tumorigenicity. As already discussed, adduct levels seem to correlate closely with treatments which cause a decrease in carcinogen acti-vation, and it is possible that the ability of many fruits and vegetables to influ-ence drug-metabolizing enzymes underlies the surprisingly common ability of these foods to decrease cytogenetic damage in animals. In contrast, the effect of grapefruit juice on phase I enzymes does not seem to lead to any alteration of the metabo-lism of the heterocyclic aromatic amine PhIP. Neither does the juice cause changes in the bioavailability of PhIP, so the inhibition of PhIP-induced strand breakage in colon DNA by grapefruit juice must involve other mechanisms (Miyata et al., 2002). Thus, links between the influence of dietary fruit and vegetables on carcino-gen metabolism, adduct formation and decreased mutagenic or clastogenic effects in humans or in animals are still not clearly established.
Human studies give an equivocal picture of the ability of fruits or vegeta-bles to decrease DNA strand breaks or micronuclei. Four studies used the comet assay without restriction enzymes or ex vivo oxidative chal-lenge and one of them observed a decreased level of strand breaks after intervention with tomato and carrot juice or spinach powder (Pool-Zobel et al., 1997). The others failed to show such an effect after intervention with
298

Cancer-preventive effects
onion, kiwi fruit or a mixed-vegetable burger (Boyle et ai., 2000; van den Berg et al., 2001; Collins et ai., 2001). Vegetable intake was negatively corre-lated with micronucleus formation in peripheral blood lymphocytes in a cross-sectional study in Hungary, whereas no effect of fresh fruit intake on micronucleated cells in the oeso-phageal mucosa was observed in young Chinese men and women (Chang-Claude et al., 1992; Pastor et al., 2002).
In humans, there seems to be a strong link between chromosomal aberrations and subsequent cancer risk (Hagmar et ai, 1998; Bonassi et al., 2000), but no studies have provided a strong link between the other cytoge-netic end-points and cancer risk.
In conclusion, there is good evidence from animal studies that fruit and vegetables decrease cytogenetic damage, but the human evidence is weak.
Post-initiation effects The biokinetics of cell turnover are of central importance to cancer preven-tion, since a hallmark of cancer is dys-regulation of the cell cycle. Effects on cell turnover are important early as well as late in the development of can-cer. Toxic effects leading to enhanced proliferation increase the efficiency of cancer initiation. Many experimental co-carcinogens are irritants or agents causing inflammation. The same is true for many substances that act as promoters in two-stage carcinogenesis experiments and for factors that en-hance human cancer but lack a potential to cause direct DNA damage. Inhibition of excess cell proliferation or increased apoptosis would consequently be expected to prevent cancer; however the picture is complex and it is neces-sary to gain better understanding of the underlying processes before generaliz-ing from specific effects affecting the cell cycle to subsequent cancer pre-
vention. Many specific compounds derived from plant foods affect cell turnover in cell culture or in animal studies, but relatively few studies have examined the effects of increased intake of preparations made from whole fruits or vegetables on cell turn-over and they are all concerned with markers of cell proliferation, mitosis or apoptosis.
Fruit and vegetable preparations given after treatment with an initiator have been observed to inhibit tumour development and growth and to delay cancer onset in some experimental studies, but the evidence is equivocal. Garlic preparations had preventive activity against breast cancer when dosed after an initiator (Ip & Lislc, 1995). Lyophilized strawberries or black raspberries in the diet inhibited rat oesophageal tumorigenicity when given after initiation with NMBA (Carlton et ai., 2001; Kresty et al., 2001). Feeding cabbage after initiation inhibited tumour development in the mouse colon in one of two similar stud-ies (Temple & Basu, 1987; Temple & el-Khatib, 1987), but in a third study, feeding a fruit and vegetable mixture after azoxymethane treatment had only marginal effects on rat colon car-cinogenesis (Rijnkels et ai, 1998). Likewise, pure mandarin juice did not significantly affect lung tumorigenesis when given to mice after initiation with NNK (Kohno et al., 2001) and the post-initiation effects of Brussels sprouts or garlic powder on DMBA-induced rat breast cancer were also much weaker than dosing before and during initiation (Stoewsand et al., 1988; Ip et ai., 1992). In adenomatous polyp patients, intervention with a diet low in fat and high in fibre, fruits and vegetables did not reduce the risk for recurrence of colorectal adenomas (Schatzkin otal., 2000).
Modulation of cell proliferation or apoptosis A range of different Iyophilized vegeta-bles decreased the mitotic index in the rat colon without affecting proliferating cell nuclear antigen (PCNA) (O'Neill et ai, 1997). However, in rats initiated with NMBA, feeding lyophilized rasp-berries decreased oesophageal levels of PCNA (Kresty et al., 2001). Citrus products have been observed to enhance cyclin Dl, apoptosis and activity of T killer cells in the colon and to decrease mucosal PCNA and the proliferation zone, but the effect was not consistently associated with decreased tumour incidence (Miyagi et ai., 2000; Tanaka et al., 2000; Kossoy et al., 2001).
There is no direct evidence for an effect of fruit and vegetable consump-tion on cell proliferation in humans. Although constituents of fruit and vegetables can affect indices of cell proliferation and turnover in vitro, there is little evidence from experiments with dietary change or from feeding studies with whole fruits or vegetable prepara-tions.
In summary, the evidence for a post-initiation effect of fruit and vegeta-bles is relatively weak.
Immune function In vitro and in vivo studies suggest a possible role of immunological defence against cancer and its metastasis (out-lined in 1mai et al., 2000). The mecha-nism of immunosurveillance (Burnet, 1970) is hypothesized to be non-spe-cific, with natural killer cells, activated macrophages, K cells and NKT cells playing key roles (Kubena & McMurray, 1998). Although immune-compromised individuals are at higher risk for certain cancers such as Kaposi sarcoma, data on cancer risk in rela-tion to immune function in the general population are sparse. One cohort study in Japan found that medium and high cytotoxic activity of peripheral
299
IARC Handbooks of Cancer Prevention Volume 8: Fruit and Vegetables
lymphocytes at study entry was asso- ents to immune function (Chandra & taming immune function, but the ciated with reduced risk of cancer (all Sarchielli, 1993), as well as the effect effects of whole fruits and vegetables sites combined) and that low activity of nutrient—nutrient interactions and their constituents on cancer- was associated with increased risk of (Kubena & McMurray, 1 996) in related immune function parameters cancer at 11-year follow-up (1mai etal., humans and in animal models support have been little studied. 2000). The relationship of single nutri- a role for fruits and vegetables in main-
300