PRE-FESIBILITY STUDY ON FATTENING OF BUFFALO/CATTLE CALVES Animal Nutrition Program (ASI) NARC
Upload
khangminh22Category
view
0download
0
AnimAl nutritionSeventh Edition
P. McDonaldR. A. EdwardsJ. F. D. GreenhalghC. A. MorganL. A. SinclairR. G. Wilkinson
AnimAl nutrition
www.pearson-books.comFront cover image: © Getty Images
Seventh Edition
McDonald Edw
ards GreenhalghM
organ Sinclair Wilkinson
Animal Nutrition is a core text for undergraduates in Animal Science, Veterinary Science, Agriculture, Biology and Biochemistry studying this subject. It also provides a standard reference text for agricultural advisers, animal nutritionists and manufacturers of animal feeds.
The latest edition of this classic text continues to provide a clear and comprehensive introduction to the science and practice of animal nutrition. The text is supported by key experimental evidence throughout. Quantitative aspects of the subject are clearly explained and illustrated by worked examples. Chapters that deal with the calculation of requirements include problems and solutions to aid student learning. Other chapters include essay-type questions that students can use as a guide to revision.
P McDonald was formerly Head of the Department of Agricultural Biochemistry at the Edinburgh School of Agriculture. R A Edwards was formerly Head of the Department of Animal Nutrition at the Edinburgh School of Agriculture. J F D Greenhalgh is Emeritus Professor of Animal Production and Health at the University of Aberdeen. C A Morgan is an animal nutritionist at the Scottish Agricultural College, Edinburgh. L A Sinclair is Professor of Animal Science at Harper Adams University College. R G Wilkinson is Principal Lecturer in Ruminant Nutrition at Harper Adams University College
The new edition of Animal Nutrition has been completely updated and has been reorganised to present the subject in six sections:
• the components of foods – carbohydrates, lipids, proteins, vitamins and minerals
• the digestion and metabolism of nutrients – how animals obtain and utilise nutrients from foods
• quantifying the nutrients supplied by foods – digestibility, energy and protein values
• the nutrient requirements of animals – maintenance and production
• a description of the foods commonly given to animals – their nutrient content and factors affecting their use
• the contribution of animal products to human nutrition – including effects on health and the environment
The Appendix provides comprehensive tables on the composition of foods and the latest feeding standards for dairy and beef cattle, sheep, pigs and poultry, and horses.
AnimAl nutritionP. McDonald R. A. Edwards J. F. D. GreenhalghC. A. Morgan L. A. Sinclair R. G. Wilkinson
Seventh Edition
CVR_MCDO4238_07_SE_CVR.indd 1 20/12/2010 15:00


ANIMAL NUTRITION

We work with leading authors to develop the strongesteducational materials in biology, bringing cutting-edgethinking and best learning practice to a global market.
Under a range of well-known imprints, includingPrentice Hall, we craft high-quality print and electronicpublications which help readers to understand and applytheir content, whether studying or at work.
To find out more about the complete range of ourpublishing, please visit us on the World Wide Web at:www.pearsoned.co.uk

ANIMAL NUTRITIONSEVENTH EDITION
P McDonaldFormerly Reader in Agricultural Biochemistry, University of Edinburgh, and Head of the Department of Agricultural Biochemistry, Edinburgh School of Agriculture
R A EdwardsFormerly Head of the Department of Animal Nutrition, Edinburgh School of Agriculture
J F D GreenhalghEmeritus Professor of Animal Production and Health, University of Aberdeen
C A MorganScottish Agricultural College
L A SinclairHarper Adams University College
R G WilkinsonHarper Adams University College


v
Preface to the seventh edition xiAcknowledgements xii
Part 1THE COMPONENTS OF FOODS 1
1 The animal and its food 3
1.1 Water 41.2 Dry matter and its components 51.3 Analysis and characterisation of foods 5
Summary 14Further reading 15
2 Carbohydrates 16
2.1 Classification of carbohydrates 162.2 Monosaccharides 182.3 Monosaccharide derivatives 202.4 Oligosaccharides 232.5 Polysaccharides 262.6 Lignin 30
Summary 30Further reading 31
3 Lipids 32
3.1 Classification of lipids 323.2 Fats 333.3 Glycolipids 433.4 Phospholipids 443.5 Waxes 463.6 Steroids 473.7 Terpenes 50
Summary 51Questions 51Further reading 52
4 Proteins, nucleic acids and other nitrogenous compounds 53
4.1 Proteins 534.2 Amino acids 534.3 Peptides 594.4 Structure of proteins 604.5 Properties of proteins 614.6 Classification of proteins 614.7 Nucleic acids 63
Contents

4.8 Other nitrogenous compounds 664.9 Nitrates 674.10 Alkaloids 68
Summary 68Further reading 69
5 Vitamins 70
5.1 Introduction 705.2 Fat-soluble vitamins 745.3 The vitamin B complex 875.4 Vitamin C 995.5 Hypervitaminosis 100
Summary 101Further reading 102
6 Minerals 103
6.1 Functions of minerals 1036.2 Natural and supplementary sources of minerals 1076.3 Acid–base balance 1106.4 Major elements 1126.5 Trace elements 1216.6 Other elements 135
Summary 136Further reading 136
Part 2THE DIGESTION AND METABOLISM OF NUTRIENTS 139
7 Enzymes 141
7.1 Classification of enzymes 1427.2 Nature of enzymes 1447.3 Mechanism of enzyme action 1467.4 Specific nature of enzymes 1487.5 Factors affecting enzyme activity 1507.6 Nomenclature of enzymes 154
Summary 155Further reading 155
8 Digestion 156
8.1 Digestion in monogastric mammals 1568.2 Microbial digestion in ruminants and other herbivores 1718.3 Alternative sites of microbial digestion 1868.4 Nutrient digestion and the environment 188
Summary 189Further reading 191Historical reference 191
9 Metabolism 192
9.1 Energy metabolism 1949.2 Protein synthesis 213
Contents
vi

9.3 Fat synthesis 2199.4 Carbohydrate synthesis 2269.5 Control of metabolism 232
Summary 233Further reading 234
Part 3QUANTIFYING THE NUTRIENT CONTENT OF FOODS: DIGESTIBILITY, ENERGY AND PROTEIN VALUES 235
10 Evaluation of foods: digestibility 237
10.1 Measurement of digestibility 23810.2 Validity of digestibility coefficients 24310.3 Digestibility in different sections of the digestive tract 24410.4 Factors affecting digestibility 24710.5 Measurement of mineral availability 251
Summary 252Questions 252Further reading 253
11 Evaluation of foods: energy content of foods and energy partition within the animal 254
11.1 Demand for energy 25411.2 Supply of energy 25511.3 Animal calorimetry: methods for measuring heat production
and energy retention 26211.4 Utilisation of metabolisable energy 270
Summary 278Questions 279Further reading 280
12 Evaluation of foods: systems for expressing the energy value of foods 281
12.1 Energy systems and energy models 28212.2 Energy systems for ruminants 28312.3 Energy systems for pigs and poultry 29512.4 Energy systems for horses 29712.5 Predicting the energy value of foods 298
Summary 300Questions 301Further reading 301Historical references 302
13 Evaluation of foods: protein 303
13.1 Crude protein 30313.2 Digestible crude protein 30513.3 Determination of endogenous nitrogen 30613.4 Measures of protein quality for monogastric animals 30813.5 Measures of food protein used in practice in the feeding
of pigs and poultry 315
Contents
vii

13.6 Measures of food protein used in practice in the feeding of horses 31713.7 Measures of protein quality for ruminant animals 31813.8 The UK metabolisable protein system 33113.9 Feed into Milk 333
Summary 337Questions 338Further reading 339
Part 4THE NUTRIENT REQUIREMENTS OF ANIMALS 341
14 Feeding standards for maintenance and growth 343
14.1 Nutrient requirements for maintenance 34514.2 Nutrient requirements for growth 36114.3 Nutrient requirements for wool production 37314.4 Mineral and vitamin requirements for maintenance
and growth 37514.5 Nutritional control of growth 378
Summary 381Questions 383Further reading 383Historical reference 383
15 Feeding standards for reproduction 384
15.1 Nutrition and the initiation of reproductive ability 38515.2 Plane of nutrition, fertility and fecundity 38715.3 Egg production in poultry 39115.4 Nutrition and the growth of the foetus 395
Summary 402Questions 403Further reading 403
16 Lactation 405
16.1 Sources of milk constituents 40616.2 Nutrient requirements of the lactating dairy cow 41016.3 Nutrient requirements of the lactating goat 44016.4 Nutrient requirements of the lactating ewe 44416.5 Nutrient requirements of the lactating sow 44916.6 Nutrient requirements of the lactating mare 453
Summary 457Questions 458Further reading 459
17 Voluntary intake of food 461
17.1 Food intake in monogastric animals 46217.2 Food intake in ruminants 46817.3 Food intake in horses 474
Contents
viii

17.4 Prediction of food intake 474Summary 476Questions 477Further reading 477
Part 5THE NUTRITIONAL CHARACTERISTICS OF FOODS 479
18 Grass and forage crops 481
18.1 Pastures and grazing animals 48118.2 Grasses 48218.3 Legumes 49118.4 Other forages 494
Summary 497Questions 498Further reading 498
19 Silage 499
19.1 Silage, ensilage and silos 49919.2 Role of plant enzymes in ensilage 50019.3 Role of microorganisms in ensilage 50119.4 Nutrient losses in ensilage 50519.5 Classification of silages 50619.6 Nutritive value of silages 51119.7 Whole crop cereal and legume silages 517
Summary 519Questions 520Further reading 520
20 Hay, artificially dried forages, straws and chaff 521
20.1 Hay 52120.2 Artificially dried forages 52620.3 Straws and related by-products 527
Summary 532Questions 532Further reading 532
21 Roots, tubers and related by-products 533
21.1 Roots 53321.2 Tubers 537
Summary 539Questions 539Further reading 540
22 Cereal grains and cereal by-products 541
22.1 The nutrient composition of grains 54122.2 Barley 54322.3 Maize 551
Contents
ix

22.4 Oats 55322.5 Wheat 55422.6 Other cereals 55522.7 Cereal processing 558
Summary 561Questions 562Further reading 562
23 Protein concentrates 563
23.1 Oilseed cakes and meals 56323.2 Oilseed residues of minor importance 57523.3 Leguminous seeds 57623.4 Animal protein concentrates 57923.5 Milk products 58423.6 Single-cell protein 58523.7 Synthetic amino acids 58623.8 Non-protein nitrogen compounds as protein sources 587
Summary 591Questions 592Further reading 592
24 Food additives 594
24.1 Antibiotics 59424.2 Probiotics 59624.3 Oligosaccharides 59924.4 Enzymes 60024.5 Organic acids 60224.6 Spray-dried plasma 60424.7 Modifiers of rumen fermentation 605
Summary 606Questions 607Further reading 607
Part 6ANIMAL PRODUCTS AND HUMAN NUTRITION 609
25 Animal nutrition and the consumers of animal products 611
25.1 Comparative nutrition 61125.2 The contribution of animal products to human requirements 61325.3 Objections to the use of animal products 61725.4 Future trends in the consumption of animal products 622
Summary 623Questions 623Further reading 623
Appendix 1: Solutions to numerical questions 625Appendix 2: Notes on tables 631Index 665
Contents
x

xi
The science of animal nutrition continues to advance and this has necessitated, tovarying degrees, the updating of most chapters. In particular the new developmentsin dairy cow nutrition in the Feed into Milk System and the new nutrient require-ments of pigs proposed by the British Society of Animal Science have been incor-porated in the middle chapters and the Appendix tables. In addition newinformation, published in recent reviews of nutrient requirements by the NationalResearch Council of the United States, and the Commonwealth Scientific and In-dustrial Research Organisation of Australia has been included.
The emphasis of research has shifted during the lifetime of the seven editions ofthis book from mainly outcomes and the effects of nutrition on the whole animal inthe earlier editions to mechanisms, both at a tissue and organ level and increasinglyat a molecular level.The authors are mindful of the need to extend the text in this di-rection and have included reference to developments in this area.
For this edition Alun Edwards decided he would step down and we wish him well.The two remaining authors felt that, in view of the extent of revision required to incor-porate the new information, new authors would be required to replace Peter McDonaldand Alun Edwards. Therefore, Liam Sinclair and Robert Wilkinson, Professor ofAnimal Science and Principal Lecturer in Ruminant Nutrition, respectively, of HarperAdams University College were invited to join the team. These new authors con-tribute a broad knowledge of animal nutrition and will ensure that the book can goto further editions.
In this edition we have attempted to address comments and suggestions made byreviewers in order to improve the book. The subject matter is constantly changingand the authors welcome comments and feedback from readers so that the book canremain relevant and useful.
Reviewing the book involved many discussions with colleagues and the authorsare grateful for their constructive comments, suggestions and support.
C A Morgan, J F D Greenhalgh, L A Sinclair and R G WilkinsonAugust 2010
Preface to the seventh edition

We are grateful to the following for permission to reproduce copyright material:
FiguresFigure 1.1 after Response in the Yield of Milk Constituents to the Intake of Nutrientsby Dairy Cows. AFRC Technical Committee on Responses to Nutrients, ReportNo. 11, CABI Publishing International,Wallingford (1998); Figure 5.1 adapted fromRoche Vitec Animal Nutrition and Vitamin News,Vol. 1, A1-10/2 (1984); Figure 5.4after Effects of vitamin E and selenium on the performance and immune status ofewes and lambs, Journal of Agricultural Science, 142:3, pp. 253–262 (Rooke J A,Robinson J J and Arthur J R 2004), © The Nutrition Society, published byCambridge University Press, reproduced by permission of the publisher and the author;Figure 6.1 from Quantitative Aspects of Ruminant Digestion and Metabolism, 2nded., CAB International,Wallingford (eds Forbes J M and France J 1993) p. 481; Figure7.7 after mechanisms related to enzyme catalysis, Advances in Enzymology andRelated Areas of Molecular Biology, 24, p. 464 (Westheimer, F H 1962); Figures 8.1,8.2 after The Comparative Nutrition of Fowl and Swine: The Gastrointestinal Sys-tems, Office for Educational Practice, University of Guelph (Moran E T Jr 1982); Fig-ure 8.3 after Comparative physiology of the digestive system, Dukes’ Physiology ofDomestic Animals, 9th ed., pp. 216–232. ((ed.) Swenson, Melvin J. 1977), Copyright1933 by H H Dukes; Copyright © 1977 by Cornell University. Used by permissionof the publisher, Cornell University Press; Figure 8.4 after Feeding and Care of theHorse, Lea & Febiger (Lewis, Lon 1982), reproduced with permission of John Wiley& Sons Inc.; Figure 8.5 after Metabolism in the Rumen, Methuen & Co. (Annison E Fand Lewis D 1959) p. 14; Figure 10.1 adapted from Comparison of two in vitroprocedures using rumen liquor-pepsin or pepsin-cellulase for prediction of foragedigestibility, Grass and Forage Science: Journal of the British Grassland Society,33 (1), pp. 13–18 (Terry R A, Mundell D C and Osbourn D F 1978); Figure 10.2adapted from A study of artificial fibre bag technique for determining the digestibil-ity of feeds in the rumen, Journal of Agricultural Science, 88, pp. 645–650 (MehrezA Z and Ørskov E R 1977), © Cambridge University Press, reproduced with permis-sion of the publisher and the author; Figure 12.1 from Feed into Milk: A New AppliedFeeding System for Dairy Cows, Nottingham University Press (Ed.Thomas C 2004);Figure 12.2 adapted from Comparison of energy evaluation systems for dairy cowfeeds, Livestock Production Science, 51, pp. 255–266 (Kaustell K, Tuori M andHuhtanen P 1997), with permission from Elsevier; Figure 12.3 from Comparison ofenergy evaluation systems and a mechanistic model for milk production by dairy cattleoffered fresh grass-based diets, Animal Feed Science and Technology, 143, pp. 203–219(Dijksra J et al. 2008), with permission from Elsevier; Figure 13.4 from Chalupa Wand Sniffen C J, Carbohydrate, protein and amino acid nutrition of lactating dairy
Acknowledgements
xii

cattle, Recent Advances in Animal Nutrition, pp. 265–74 (eds. Garnsworthy P C,Cole D J A 1994); Figure 16.4 after The Energy Metabolism of Ruminants, Hutchinson(Blaxter K L 1967) p. 259 reproduced by permission of the publisher and the author;Figure 16.7 adapted from A review of the potential of nutrition to modify milk fatand protein, Livestock Production Science 23 (3–4), pp. 219–237 (Sutton J D andMorant S V 1989), with permission from Elsevier; Figure 16.8 adapted from Updateon theories of diet-induced milk fat depression and potential applications, RecentAdvances in Animal Nutrition, pp. 115–55 (Griinari J M and Bauman D E 2003);Figure 16.10 from The growth of lambs before and after birth in relation to the levelof nutrition, Journal of Agricultural Science, 38 (2), pp. 93–153 (Wallace R L 1948),© Cambridge University Press, reproduced with permission of the publisher andthe author; Figure 16.11 adapted from The yield and composition of the milk ofFinnish Landrace � Blackface ewes: I. Ewes and lambs maintained indoors, Journal ofAgricultural Science, 79 (2), pp. 303–313 (Peart J N, Edwards R A and Donaldson E1972), © Cambridge University Press, reproduced with permission of the publisherand the author; Figure 16.13 after Variations in the chemical composition of milkwith particular reference to the solids-not-fat: I.The effect of stage of lactation, season ofyear and age of cow, Journal of Dairy Research, 23 (1), pp. 65–81 (Waite R,White J C Dand Robertson A 1956), © Proprietors of Journal of Dairy Research, published byCambridge University Press, reproduced with permission of the publisher and theJournal of Dairy Research; Figure 17.2 after The effect of lactation on intake in thedairy cow, Proceedings, New Zealand Society for Animal Production, 23, pp. 39–52(Hutton J B 1963); Figure 24.1 adapted from The Living Gut, Context (Ewing W N andCole D J A 1994) p. 105, Context, 52 Mill Street, Packington, LE65 1WN.Tel. 01530415 338, Fax: 01530 412673, Email: [email protected]; Figure 24.2 adaptedfrom Yeast culture: its role in maximising fibre digestion in the rumen, Feed Com-pounder, January, pp. 16–19 (Offer N W 1991); Figure 24.3 from The Living Gut,Context (Ewing W N and Cole D J A 1994) p. 142, Context, 52 Mill Street, Packing-ton, LE65 1WN. Tel. 01530 415 338, Fax: 01530 412673, Email: [email protected]
TablesTables 2.11 and 2.12 adapted from Nutrient Requirements of Horses, 5th rev. ed.,National Academies Press (1989) Table 5.1 and 5.3, Reprinted with permission fromthe National Academies Press, Copyright 1989, National Academy of Sciences; Table 1.3 adapted from Principles of Pig Science, Nottingham University Press ((eds)Cole D J A, Wiseman J and Varley M A 1994) pp. 169–95, App. 1; Table 3.6 fromTextbook of Biochemistry with Clinical Correlations, 4th ed., John Wiley & SonsInc. (Devlin,Thomas M 1997) p. 56,This material is used by permission of John Wiley& Sons Inc.; Table 6.2 adapted from Supplemental organically-bound mineralcompounds in livestock nutrition, Recent Advances in Animal Nutrition, pp. 67–91(Ammerman C B, Henry P R and Miles R D 1988); Table 10.1 after The effect in sheepof physical form and stage of growth on the sites of digestion of a dried grass, BritishJournal of Nutrition, 28 (3), pp. 347–356 (Beever D E, Coelho de Silva J P, PrescottJ H D and Armstrong D G 1972), © The Nutrition Society, published by CambridgeUniversity Press, reproduced with permission of the publisher and the author;Table 10.2 adapted from Quantitative digestion of fresh herbage by sheep: II.The sites
Acknowledgements
xiii

of digestion of some nitrogenous constituents, Journal of Agricultural Science, 82 (2),pp. 309–319 (MacRae J C and Ulyatt M J 1974), © Cambridge University Press,reproduced with permission of the publisher and the author; Table 11.2 after Apparatusfor the determination of the energy exchange of calves and of sheep, Journal ofAgricultural Science, 45 (1), pp. 10–18 (Blaxter K L, Graham N McC, and Rook J A F1954), © Cambridge University Press, reproduced with permission of the publisherand the author; Table 11.3 after Plane of nutrition and starch equivalents, Journal ofAgricultural Science, 46 (3), pp. 292–306 (Blaxter K L and Graham N McC 1955), ©Cambridge University Press, reproduced with permission of the publisher and theauthor; Table 11.4 after Comparison of heat production of chickens measured byenergy balance and by gaseous exchange, Journal of Nutrition, 113 (7), pp. 1403–1408(Fuller H L, Dale M N and Smith C F 1983), American Society for Nutrition; Table13.2 adapted from Modern Methods in Protein Nutrition and Metabolism,AcademicPress (Sauer W C and de Lange K 1992) pp. 87–120; Table 13.4 adapted from Amethod of determining the biological value of protein (Table XII), Journal of Biolog-ical Chemistry, 58 (3), p. 891 (Mitchell, H H 1924), Copyright 1924 The AmericanSociety for Biochemistry and Molecular Biology; Table 13.5 adapted from Proteinnutrition and the utilization of dietary protein at different levels of intake by grow-ing swine, Journal of Animal Science, 14, p. 53 (Armstrong D G and Mitchell H H 1955);Table 13.6 adapted from Towards an improved utilization of dietary amino acids bythe growing pig, Recent Advances in Animal Nutrition, pp. 45–64 (Moughan P J 1991);Tables 13.7 and 14.9 adapted from Nutrient Requirement Standards for Pigs, BritishSociety of Animal Science (Whittemore C T, Hazzledine M J and Close W H 2003);Table 13.8 adapted from Carbohydrate, protein and amino acid nutrition of lactatingdairy cattle, Recent Advances in Animal Nutrition, pp. 265–75 (Chalupa W and SniffenC J 1994), Copyright 1994 W. Chalupa; Table 13.11 adapted from Microbial proteinsynthesis and flows of nitrogen fractions to the duodenum of dairy cows (Table 2),Journal of Dairy Science, 75 (8), p. 2306 (Clark J H, Klusmeyer T H and Cameron M R 1992), with permission from Elsevier; Table 13.12 after Amino acid content ofnoncell and cell wall fractions in feedstuffs, Journal of Dairy Science, 66 (10),pp. 2198–2207 (Muscato T V, Sniffen C J, Krishnamoorthy U and Van Soest P J 1983),with permission from Elsevier; Tables 14.6 and 15.4 adapted from The NutrientRequirements of Ruminant Livestock, Common Agricultural Bureaux (AgriculturalResearch Council 1980); Table 14.7 adapted from Comparative Nutrition of Manand Domestic Animals Vol. 1,Academic Press (Mitchell H H 1962); Table 14.11 afterGrowth and development in the pig, with special reference to carcass quality charac-ters: III. Effect of the plane of nutrition on the form and composition of the baconpig, Journal of Agricultural Science, 30 (4), pp. 511–569 (McMeekan C P 1940),© Cambridge University Press, reproduced with permission; Table 15.1 from Effectof dietary energy and protein density on body composition, attainment of puberty,and ovarian follicular dynamics in dairy heifers, Theriogenology, 60 (4), pp. 707–725(Chelikani P K,Ambrose J D and Kennelly J J 2003), with permission from Elsevier;Table 15.2 after Fertility in Scottish Blackface ewes as influenced by nutrition andbody condition at mating, Journal of Agricultural Science, 73 (2), pp. 289–94 (Gunn R G, Doney J M and Russel A J F 1969), © Cambridge University Press,reproduced with permission of the publisher and the author; Table 15.5 adapted fromThe Nutrient Requirements of Pigs, Commonwealth Agricultural Bureaux (Agricul-tural Research Council 1981); Table 15.6 adapted from Effects of maternal nutrition
Acknowledgements
xiv

on udder development during late pregnancy and on colostrum production in ScottishBlackface ewes with twin lambs, Research in Veterinary Science, 39, pp. 230–234(Mellor D J and Murray L 1985); Table 16.2 from Uptake and metabolism of fatin the lactating mammary gland, Lactation (Proceedings of the 17th University ofNottingham Easter School in Agricultural Science) (Bickerstaffe R 1970); Table 16.3adapted from Effect of replacing calcium salts of palm oil distillate with rapeseed oil,milled or whole rapeseeds on milk fatty-acid composition in cows fed maize silage-based diets, Animal, 3 (7), pp. 1067–1074 (Givens D I, Kliem K E, Humphries D J,Shingfield K J and Morgan R 2009), © The Animal Consortium, published by Cam-bridge University Press, reproduced with permission of the publisher and the author;Tables 16.4 and 16.5 adapted from National Milk Records Production Annual Re-port, NMR (2008); Table 16.6 adapted from Variation in the chemical composition ofcow milk, Dairy Science Abstracts, 23, pp. 251–58 (Rook J A F 1961); Table 16.7adapted from Variation in the chemical composition of cow milk, Dairy ScienceAbstracts, 23, pp. 251–258 (Rook J A F 1961); Table 16.8 after Variations in thechemical composition of milk with particular reference to the solids-not-fat: I. Theeffect of stage of lactation, season of year and age of cow, Journal of Dairy Research,23 (1), pp. 65–81 (Waite R,White J C D and Robertson Alan 1956), © Proprietors ofJournal of Dairy Research, published by Cambridge University Press, reproducedwith permission of the publisher and the Journal of Dairy Research; Table 16.11 afterMilk fat depression in dairy cows: role of silage particle size, Journal of Dairy Science,73 (7), pp. 1834–42 (Grant R J, Colenbrander V F and Mertens D R 1990), with per-mission from the American Dairy Science Association.; Tables 16.12, 16.13 adaptedfrom The Nutrition of Goats, Technical Committee on Responses to NutrientsReport No. 10, CAB International (AFRC 1994); Table 16.15 after The quality of sheepmilk: a review, Australian Journal of Experimental Agriculture 37(4) pp. 485–504(Bencini R and Pulina G 1997), Copyright © CSIRO 1997. Published by CSIROPublishing,Victoria, Australia – http://www.publish.csiro.au/72/paper/EA96014.htm;Table 16.20 adapted from Equine Nutrition and Feeding, 2nd ed., Blackwell Science(Frape D 1988), copyright 1998. Reproduced with permission of Blackwell Publish-ing Ltd; Table 16.21 after Nutrient Requirements of Horses, 5 rev. ed., NationalAcademy Press (National Research Council 1989), Reprinted with permission fromthe National Academies Press, Copyright 1989, National Academy of Sciences; Table17.1 after Studies of the energy requirements of chickens, Poultry Science, 33, pp.112–119 (Hill F W and Dansky L M 1954); Tables 17.2 and 17.3 adapted from Theeffects of pelleting diets on intake and digestibility in sheep and cattle, Animal Pro-duction, 16, pp. 223–233 (Greenhalgh J F D and Reid G W 1973); Table 18.3 afterThe voluntary intake and in vivo digestibility of herbage harvested from indigenoushill plant communities, Grass and Forage Science, 41 (1), pp. 53–60 (Armstrong R H,Common T G and Smith H K 1986); Table 18.4 after Proceedings of the Eighth In-ternational Grassland Congress, p. 485 (Armstrong D G 1960); Table 18.6 adaptedfrom Tropical Feeds: Feed Information Summaries and Nutritive Values (FAO Ani-mal Production and Health Series; No. 12), FAO (Gohl B 1981) p. 70, reproducedwith the permission of the Food and Agriculture Organization of the United Nations;Table 18.7 adapted from Energy allowances and feeding systems for ruminants, Tech-nical Bulletin, 33 (MAFF 1975), Crown Copyright material is reproduced with per-mission under the terms of the Click-Use Licence; Table 18.8 adapted from Ensilageof whole-crop barley, Journal of the Science of Food and Agriculture 19, pp. 656–60,
Acknowledgements
xv

pp. 661–6 (Edwards R A, Donaldson E and MacGregor A W ; MacGregor A W andEdwards R A 1968), Copyright by the Society of Chemistry. Reproduced by permissionof John Wiley and Sons Ltd on behalf of the SCI; Table 19.3 after Efficient silagesystems, Forage Conservation in the 80s. British Grassland Society OccasionalSymposium No, 11, pp. 186–197 (Zimmer E 1979); Table 19.5 adapted from Feedingvalue of silage: silages made from freshly cut grass, wilted grass and formic acid treatedwilted grass, Journal of the Science of Food and Agriculture 27 (6), pp. 536–544(Donaldson E and Edwards R A 1976); Table 19.5 adapted from The development ofplant components and their effects on the composition of fresh and ensiled foragemaize: 2. The effect of genotype, plant density and date of harvest on the composi-tion of maize silage, Journal of Agricultural Science, 92 (2), pp. 485–491 (Wilkinson J Mand Phipps R H 1979), © Cambridge University Press, reproduced with permissionof the publisher and the author; Table 19.7 adapted from The effect of formic acidand bacterial inoculants on the fermentation and nutritive value of perennialryegrass silages, Proceedings of the Eurobac Conference, Uppsala, August 1986,pp. 93–98 (Henderson A R, Seale D R,Anderson D H and Heron S J E 1990) reproducedby permission of the author; Table 19.8 adapted from The effect of silage additivescontaining formaldehyde on the fermentation of ryegrass ensiled at different drymatter levels and on the nutritive value of direct-cut silage, Animal Feed Scienceand Technology 7 (3), pp. 303–14 (Henderson R A, McDonald P and Anderson D H1982), with permission from Elsevier; Table 19.10 after Prediction of the organicmatter digestibility of grass silage, Animal Feed Science and Technology 28 (1–2),pp. 115–28 (Barber G D et al. 1990), Reprinted with permission from Excerpta MedicaInc.; Table 19.12 after Prediction of the voluntary intake potential of grass silage bysheep and dairy cows from laboratory silage measurements, Animal Science, 66 (3),pp. 357–367 (Offer N W, et al. 1998); Table 20.1 from The effect of some pre-treatmentson proteolysis during the ensiling of herbage, Grass and Forage Science, 34 (4),pp. 311–315 (Carpintero M C, Henderson A R and McDonald P 1979); Table 20.3after The Conservation of Grass and Forage Crops, Oliver and Boyd (Watson S Jand Nash M 1960) p. 156; Table 20.4 adapted from ADAS Science Arm Report,HMSO (MAFF 1972), Crown Copyright material is reproduced with permissionunder the terms of the Click-Use Licence; Table 20.5 adapted from ExperimentalWork,The Edinburgh School of Agriculture (Mackenzie E J and Purves D 1967) p. 23,reproduced by permission of the Scottish Agricultural College; Table 20.7 adaptedfrom Urea supplementation compared with pre-treatment. 1. Effects on intake, digestionand live-weight change by sheep fed a rice straw, Animal Feed Science and Technology,27, pp. 17–30 (Djajanegara A and Doyle P 1989), with permission from Elsevier;Table 22.1 after Characterisation of induced high protein and high lysine mutants inbarley, Journal of the Science of Food and Agriculture, 27 (6), pp. 545–52 (BalaraviS P et al. 1976); Table 22.3 adapted from Occasional Publication No. 3, British Soci-ety of Animal Production (Barber W P and Lonsdale C R 1980) pp. 61–9; Table 22.4adapted from Distillery By-products as Feeds for Livestock, Scottish AgriculturalCollege (Black H et al. 1991); Table 22.5 adapted from Effect of processing of cerealson rumen fermentation, digestibility, rumination time, and firmness of subcutaneousfat in lambs, British Journal of Nutrition, 32 (1), pp. 59–69 (Ørskov E R, Fraser C andGordon J G 1974), © The Nutrition Society, published by Cambridge UniversityPress, reproduced with permission of the publisher and the author; Table 22.5adapted from Cereal processing and food utilization by sheep, Animal Production, 18,p. 85 (Ørskov E R, Fraser C and McHattie I 1974); Table 23.1 adapted from Table 21
Acknowledgements
xvi

and Table 23, Feed Facts Quarterly, No. 1 (1999) and No. 1 (2000), reproduced bypermission of Simon Mounsey Ltd (www.feedstatistics.co.uk); Table 23.7 after Com-position and nutritive value of single-cell protein (SCP), Animal Feed Science andTechnology, 1 (1), pp. 9–24 (Schulz E and Oslage H J 1976), with permission fromElsevier; Table 24.1 adapted from Enzymes in feed: they really can be made to work,Alltech European Lecture Tour, February–March (Rotter B A, Marquardt RR andGuenter W 1989); Table 24.3 adapted from Acidification of diets for pigs, RecentAdvances in Animal Nutrition, p. 61 (Easter R A 1988); Table 25.1 adapted fromHuman Nutrition and Dietetics, 10th ed., Churchill Livingstone (Garrow J S, JamesW P T and Ralph A (eds) 2000); Table 25.2 adapted from Human Nutrition andDietetics, 10th ed., Churchill Livingstone (Garrow J S, James W P T and Ralph A(eds) 2000); Tables 25.3, 25.4 adapted from FAO, reproduced with the permission ofthe Food and Agriculture Organization of the United Nations; Table 25.5 adaptedfrom FAO, 2008, reproduced with the permission of the Food and AgricultureOrganization of the United Nations; Table 25.6 from Family Food – Report on theExpenditure and Food Survey, Her Majesty’s Stationery Office (Department forEnvironment, Food and Rural Affairs 2006), Crown Copyright material is reproducedwith permission under the terms of the Click-Use Licence; Table 25.7 adapted fromAlternative futures for world cereal and meat consumption, Proceedings of theNutrition Society, 58 (2), pp. 219–234 (Rosegrant MW, Leach N and Gerpacio R V 1999)
TextBox 6.1 adapted from The Mineral Nutrition of Livestock, 3rd ed., CABI Publishing(Underwood E J and Suttle N F 1999); Box 25.2 adapted from Merck VeterinaryManual (Table 01: Global Zoonoses), 9th ed., Merck and Co., Inc. (2008), Copyright2005 by Merck & Co., Inc, Whitehouse Station, NJ, USA. All rights reserved. Usedwith permission.
In some instances we have been unable to trace the owners of copyright material,and we would appreciate any information that would enable us to do so.
Acknowledgements
xvii


PART 1
The components of foods
This part describes the chemistry of foods and the components that supply nutrients to the animal.
Chapter 1 is concerned with the analysis of foods, from the early chemical analysis developedin the 1800s to categorise chemical and nutrient groups, through to the sophisticated physicaland chemical methods used today to identify individual molecular components.
Chapters 2, 3 and 4 describe the major components of foods that supply energy and aminoacids, i.e. the carbohydrates and lipids, and the proteins.
Chapters 5 and 6 give details of the nutrients required in smaller amounts, the vitamins andminerals which, nevertheless, are essential for the normal functions of the body and efficientanimal production.


3
1.1 Water
1.2 Dry matter and its components
1.3 Analysis and characterisation of foods
Food is material that, after ingestion by animals, is capable of being digested, absorbedand utilised. In a more general sense we use the term ‘food’ to describe edible material.Grass and hay, for example, are described as foods, but not all their components aredigestible. Where the term ‘food’ is used in the general sense, as in this book, thosecomponents capable of being utilised by animals are described as nutrients.
The animals associated with humans cover the spectrum from herbivores, the planteaters (ruminants, horses and small animals such as rabbits and guinea pigs); through om-nivores, which eat all types of food (pigs and poultry); to carnivores, which eat chiefly meat(dogs and cats). Under the control of humans these major classes of animal still pertain, butthe range of foods that animals are now offered is far greater than they might normallyconsume in the wild (for example, ruminants are given plant by-products of various humanfood industries and some dog foods contain appreciable amounts of cereals). Nevertheless,plants and plant products form the major source of nutrients in animal nutrition.
The diet of farm animals in particular consists of plants and plant products, althoughsome foods of animal origin such as fishmeal and milk are used in limited amounts.Animals depend upon plants for their existence and consequently a study of animalnutrition must necessarily begin with the plant itself.
Plants are able to synthesise complex materials from simple substances such as carbondioxide from the air, and water and inorganic elements from the soil. By means of photo-synthesis, energy from sunlight is trapped and used in these synthetic processes. Thegreater part of the energy, however, is stored as chemical energy within the plant itself andit is this energy that is used by the animal for the maintenance of life and synthesis of itsown body tissues. Plants and animals contain similar types of chemical substances, and wecan group these into classes according to constitution, properties and function. The maincomponents of foods, plants and animals are:
1 The animal and its food
Food
Water
Dry matter
Organic
Inorganic
CarbohydratesLipidsProteinsNucleic acidsOrganic acidsVitamins
Minerals

Chapter 1 The animal and its food
4
Table 1.1 Composition of some plant and animal products expressed on a freshbasis and a dry matter basis
Water Carbohydrate Lipid Protein Ash
Fresh basis (g/kg)Turnips 910 70 2 11 7Grass (young) 800 137 8 35 20Barley grain 140 730 15 93 22Groundnuts 60 201 449 268 22Dairy cow 570 2 206 172 50Milk 876 47 36 33 8Muscle 720 6 44 215 15Egg 667 8 100 118 107
Dry matter basis (g/kg)Turnips 0 778 22 122 78Grass (young) 0 685 40 175 100Barley grain 0 849 17 108 26Groundnuts 0 214 478 285 23Dairy cow 0 5 479 400 116Milk 0 379 290 266 65Muscle 0 21 157 768 54Egg 0 24 300 355 321
1.1 WATER
The water content of the animal body varies with age.The newborn animal contains750–800 g/kg water but this falls to about 500 g/kg in the mature fat animal. It isvital to the life of the organism that the water content of the body be maintained: ananimal will die more rapidly if deprived of water than if deprived of food. Waterfunctions in the body as a solvent in which nutrients are transported about the bodyand in which waste products are excreted. Many of the chemical reactions broughtabout by enzymes take place in solution and involve hydrolysis. Because of the highspecific heat of water, large changes in heat production can take place within theanimal with very little alteration in body temperature. Water also has a high latentheat of evaporation, and its evaporation from the lungs and skin gives it a furtherrole in the regulation of body temperature.
The animal obtains its water from three sources: drinking water, water present in itsfood, and metabolic water, this last being formed during metabolism by the oxidation ofhydrogen-containing organic nutrients. The water content of foods is variable and canrange from as little as 60 g/kg in concentrates to over 900 g/kg in some root crops. Be-cause of this great variation in water content, the composition of foods is often ex-pressed on a dry matter basis, which allows a more valid comparison of nutrient content.This is illustrated inTable 1.1, which lists a few examples of plant and animal products.
The water content of growing plants is related to the stage of growth, being greaterin younger plants than in older plants. In temperate climates the acquisition of drink-ing water is not usually a problem and animals are provided with a continuous supply.There is no evidence that under normal conditions an excess of drinking water isharmful, and animals normally drink what they require.

Analysis and characterisation of foods
5
1.2 DRY MATTER AND ITS COMPONENTS
The dry matter (DM) of foods is conveniently divided into organic and inorganic ma-terial, although in living organisms there is no such sharp distinction. Many organiccompounds contain mineral elements as structural components. Proteins, for ex-ample, contain sulphur, and many lipids and carbohydrates contain phosphorus.
It can be seen from Table 1.1 that the main component of the DM of pasture grassis carbohydrate, and this is true of all plants and many seeds. The oilseeds, such asgroundnuts, are exceptional in containing large amounts of protein and lipid mater-ial. In contrast, the carbohydrate content of the animal body is very low. One of themain reasons for the difference between plants and animals is that, whereas the cellwalls of plants consist of carbohydrate material, mainly cellulose, the walls of animalcells are composed almost entirely of lipid and protein. Furthermore, plants storeenergy largely in the form of carbohydrates such as starch and fructans, whereas ananimal’s main energy store is in the form of lipid.
The lipid content of the animal body is variable and is related to age, the older ani-mal containing a much greater proportion than the young animal.The lipid content ofliving plants is relatively low, that of pasture grass, for example, being 40–50 g/kg DM.
In both plants and animals, proteins are the major nitrogen-containing com-pounds. In plants, in which most of the protein is present as enzymes, the concentra-tion is high in the young growing plant and falls as the plant matures. In animals,muscle, skin, hair, feathers, wool and nails consist mainly of protein.
Like proteins, nucleic acids are also nitrogen-containing compounds and theyplay a basic role in the synthesis of proteins in all living organisms. They also carrythe genetic information of the living cell.
The organic acids that occur in plants and animals include citric, malic, fumaric,succinic and pyruvic acids.Although these are normally present in small quantities,they nevertheless play an important role as intermediates in the general metabolismof the cell. Other organic acids occur as fermentation products in the rumen, or insilage, and these include acetic, propionic, butyric and lactic acids.
Vitamins are present in plants and animals in minute amounts, and many of themare important as components of enzyme systems. An important difference betweenplants and animals is that, whereas the former can synthesise all the vitamins theyrequire for metabolism, animals cannot, or have very limited powers of synthesis,and are dependent upon an external supply.
The inorganic matter contains all those elements present in plants and animalsother than carbon, hydrogen, oxygen and nitrogen. Calcium and phosphorus are themajor inorganic components of animals, whereas potassium and silicon are the maininorganic elements in plants.
1.3 ANALYSIS AND CHARACTERISATION OF FOODS
Originally the most extensive information about the composition of foods was basedon a system of analysis described as the proximate analysis of foods, which wasdevised over 100 years ago by two German scientists, Henneberg and Stohmann.More recently, new analytical techniques have been introduced, and the informationabout food composition is rapidly expanding (see below). However, the system of

Chapter 1 The animal and its food
6
proximate analysis still forms the basis for the statutory declaration of the composi-tion of foods in Europe.
Proximate analysis of foods
This system of analysis divides the food into six fractions: moisture, ash, crude pro-tein, ether extract, crude fibre and nitrogen-free extractives.
The moisture content is determined as the loss in weight that results from drying aknown weight of food to constant weight at 100 °C.This method is satisfactory for mostfoods, but with a few, such as silage, significant losses of volatile material (short-chainfatty acids and alcohols) may take place.Therefore, for silages, the moisture content canbe determined directly by distilling the water from the sample under toluene.The distil-late is measured and corrected for the presence of fermentation acids and alcohols.
The ash content is determined by ignition of a known weight of the food at 550 °Cuntil all carbon has been removed. The residue is the ash and is taken to representthe inorganic constituents of the food. The major component of ash is silica but ashmay, however, contain material of organic origin such as sulphur and phosphorusfrom proteins, and some loss of volatile material in the form of sodium, chloride,potassium, phosphorus and sulphur will take place during ignition.The ash contentis thus not truly representative of the inorganic material in the food either qualita-tively or quantitatively. Animals do not have a requirement for ash per se but re-quire the individual mineral elements that it contains and are determined bymethods such as atomic absorption spectrometry (see p. 12).
The crude protein (CP) content is calculated from the nitrogen content of the food,determined by a modification of a technique originally devised by Kjeldahl over100 years ago. In this method the food is digested with sulphuric acid, which convertsto ammonia all nitrogen present except that in the form of nitrate and nitrite. Thisammonia is liberated by adding sodium hydroxide to the digest, distilled off andcollected in standard acid, the quantity so collected being determined by titration orby an automated colorimetric method. It is assumed that the nitrogen is derived fromprotein containing 16 per cent nitrogen, and by multiplying the nitrogen figure by 6.25(i.e. 100/16) an approximate protein value is obtained.This is not ‘true protein’ sincethe method determines nitrogen from sources other than protein, such as free aminoacids, amines and nucleic acids, and the fraction is therefore designated crude protein.
The ether extract (EE) fraction is determined by subjecting the food to a continu-ous extraction with petroleum ether for a defined period.The residue, after evapora-tion of the solvent, is the ether extract. As well as lipids it contains organic acids,alcohol and pigments.This procedure is referred to as method A. In the current officialmethod, the extraction with ether is preceded by hydrolysis of the sample with sul-phuric acid and the resultant residue is the acid ether extract (method B).
The carbohydrate of the food is contained in two fractions, the crude fibre (CF)and the nitrogen-free extractives (NFE).The former is determined by subjecting theresidual food from ether extraction to successive treatments with boiling acid andalkali of defined concentration; the organic residue is the crude fibre.
When the sum of the amounts of moisture, ash, crude protein, ether extract andcrude fibre (expressed in g/kg) is subtracted from 1000, the difference is designated thenitrogen-free extractives.The nitrogen-free extractives fraction is a heterogeneous mix-ture of all those components not determined in the other fractions. The crude fibrefraction contains cellulose, lignin and hemicelluloses, but not necessarily the whole

Analysis and characterisation of foods
7
Fig. 1.1 Proposed model for characterisation of foods for ruminants.
AA = amino acids, ADIN = acid detergent insoluble nitrogen, DUP = digestible undegradableprotein, ERDN = effective rumen degradable nitrogen, LCFA = long-chain fatty acids, ME = metabolisable energy, MP = metabolisable protein, N = nitrogen, NF = nitrogen fraction,NFF = non-fermentable fraction, PFF = potentially fermentable fraction, UDN = undegradablenitrogen, VFA = volatile fatty acids, WSC = water-soluble carbohydrates.
From Agricultural and Food Research Council 1998 Technical Committee on Responses to Nutrients, reportno. 11, Wallingford, CABI.
NF
PFF
NFF
Food measurements Rumen parameters Absorbed nutrients
MP
ME
Total NN solubilityN degradabilityADIN
WSC and pectinsStarch – Rate
ExtentCell walls – Rate
Extent
VFALactateLipid
UDN
ERDN
Fermentableenergy
Non-fermentableenergy
DUP AA
Microbialaminoacids
VFAMicrobialfatty acids
LCFAVFAGlucose
amounts of these that are present in the food: a variable proportion of the cell wallmaterial, depending upon the species and stage of growth of the plant material, isdissolved during the crude fibre extraction and thus is contained in the nitrogen-freeextractives. This leads to an underestimation of the fibre and an overestimation ofthe starch and sugars. Thus the nitrogen-free extractive fraction includes starch,sugars, fructans, pectins, organic acids and pigments, in addition to those componentsmentioned above.
Modern analytical methods
In recent years the proximate analysis procedure has been severely criticised bymany nutritionists as being archaic and imprecise, and in the majority of laboratoriesit has been partially replaced by other analytical procedures. Most criticism has beenfocused on the crude fibre, ash and nitrogen-free extractives fractions for the reasonsdescribed above. The newer methods have been developed to characterise foods interms of the methods used to express nutrient requirements. In this way, an attemptis made to use the analytical techniques to quantify the potential supply of nutrientsfrom the food. For example, for ruminants, analytical methods are being developedthat describe the supply of nutrients for the rumen microbes and the host digestiveenzyme system (Fig. 1.1).

Chapter 1 The animal and its food
8
Table 1.2 Classification of forage fractions using the detergent methods ofVan Soest
Fraction Components
Cell contents (soluble in neutral detergent) LipidsSugars, organic acids and
water-soluble matterPectin, starchNon-protein nitrogenSoluble protein
Cell wall constituents (fibre insoluble in neutral detergent)
Soluble in acid detergent HemicellulosesFibre-bound protein
Acid-detergent fibre CelluloseLigninLignified nitrogenSilica
After Van Soest P J 1967 Journal of Animal Science 26: 119.
Starch and sugars
Inadequacies in the nitrogen-free extractives fraction have been addressed by thedevelopment of methods to quantify the non-structural carbohydrates, which aremainly starches and sugars. Sugars can be determined colorimetrically after combi-nation with a reagent such as anthrone. Starch is determined by dilute acid hydrol-ysis of the sample followed by polarimetric determination of the released sugars.This gives a figure for total sugars (i.e. those originating from the hydrolysed starchplus the simple sugars in the food). Sugars per se are determined by extracting thesample with ethanol, acidifying the filtrate and taking a second polarimeter read-ing. The starch content is calculated from the difference between the two readingsmultiplied by a known factor for the starch source. Starch can also be determinedenzymically. For example, in cereals starch is converted to glucose using �-amylasefollowed by amyloglucosidase and then the glucose is measured using the glucoseoxidase-peroxidase reagent.
Fibre
Alternative procedures for fibre have been developed by Van Soest (Table 1.2). Theneutral-detergent fibre (NDF), which is the residue after extraction with boiling neu-tral solutions of sodium lauryl sulphate and ethylenediamine tetraacetic acid (EDTA),consists mainly of lignin, cellulose and hemicellulose and can be regarded as a meas-ure of the plant cell wall material. The analytical method for determining NDF wasoriginally devised for forages, but it can also be used for starch-containing foods pro-vided that an amylase treatment is included in the procedure. By analogy with thenitrogen-free extractives fraction discussed above, the term non-structural carbohy-drate (NSC) is sometimes used for the fraction obtained by subtracting the sum ofthe amounts (g/kg) of CP, EE, ash and NDF from 1000.
The acid-detergent fibre (ADF) is the residue after refluxing with 0.5 M sulphuricacid and cetyltrimethyl-ammonium bromide, and represents the crude lignin andcellulose fractions of plant material but also includes silica.

Analysis and characterisation of foods
9
BOX 1.1 The Cornell net carbohydrate and protein system
The fractionation of the carbohydrates by analysis is currently most fully developed in the Cornellnet carbohydrate and protein system for ruminant diets.This is based on the Van Soest analytical sys-tem, with the addition of other standard techniques, to derive the following fractions in foods:
1. Total carbohydrate � 100 � (crude protein � fat � ash)2. Non-structural carbohydrate (NSC) � 100 � (crude protein � fat � (NDF � NDF protein) � ash)3. Sugar as a proportion of NSC4. Starch, pectin, glucans, volatile fatty acids � NSC � sugar5. Lignin
The carbohydrates are then classified according to their degradation rate by rumen microbes: frac-tion A – fast (comprising the sugars), fraction B1 – intermediate (starch, pectin, �-glucans), fractionB2 – slow (available cell wall material represented by lignin-free NDF) and fraction C – indigestible(unavailable cell wall in the form of lignin).
The determination of ADF is particularly useful for forages as there is a good sta-tistical correlation between it and the extent to which the food is digested (digestibil-ity). In the UK the ADF method has been modified slightly, the duration of boilingand acid strength being increased.The term modified acid-detergent fibre (MADF) isused to describe this determination.
The acid-detergent lignin determination involves the preparation of acid-detergent fibre as the preparatory step. The ADF is treated with 72 per cent sul-phuric acid, which dissolves cellulose.Ashing the residue determines crude lignin,including cutin.
The Van Soest methods of fibre analysis are used in the system of food analysisfor ruminants developed at Cornell University (see Box 1.1).
In monogastric, and particularly human, nutrition the term dietary fibre is oftenused and attention has been focused on its importance in relation to health. Dietaryfibre (DF) was defined as lignin plus those polysaccharides that cannot be digestedby monogastric endogenous enzymes. Initially epidemiological studies linked a lackof DF to constipation, gut and bowel disorders, cardiovascular disease and type 2diabetes; however, the causes of such diseases are multifactorial and in some casesit is not just DF per se that has the beneficial effects but other aspects of the dietalso (e.g. antioxidants). Nevertheless, DF is a major component related to health inhumans and it has equally important effects in animals (see below).
The definition of DF has proved difficult, with definitions ranging throughphysiological/botanical (derived from cell walls of plants, which are poorly digested);chemical/botanical (non-starch polysaccharides (NSP) of plant cell walls); chemi-cal (NSP and lignin); and nutritional/physiological (NSP not digested in the smallintestine). The common features of DF definitions are carbohydrates (polysaccha-rides, oligosaccharides and lignin) resistant to digestion in the small intestine butthat may be fermented in the large intestine and promote beneficial physiologi-cal effects. By virtue of its definition, DF is difficult to determine in the labora-tory. The NSP in most foods, along with lignin, are considered to represent themajor components of cell walls. Methods for measurement of NSP fall into two

Chapter 1 The animal and its food
10
categories (with slight variations in the second category, depending on the re-search laboratory):
■ Enzymic–gravimetric methods, which measure a variety of components and giveno details of polysaccharide type. In the method of the Association of Official An-alytical Chemists for total dietary fibre, samples are gelatinised by heating andtreated with enzymes to remove starch and proteins.The total dietary fibre is pre-cipitated with ethanol and the residue is dried and weighed.
■ Enzymic–chromatographic methods, which identify the individual carbohy-drates in the dietary NSP. The Englyst method can be used to determine total,soluble and insoluble dietary fibre. Measurement of NSP by this method in-volves removal of starch with the enzymes pullulanase and �-amylase. Afterprecipitation with ethanol, the NSP residue is then hydrolysed with 12 M sul-phuric acid. The individual monomeric neutral sugar constituents are deter-mined by gas–liquid chromatography (see below) with separate determinationof uronic acids. Alternatively, the total sugars are determined colorimetricallyafter reaction with dinitrosalicylate solution. Total NSP and insoluble NSP aredetermined directly by analysis of separate subsamples and the soluble NSP arecalculated by difference. The major constituents of NSP are rhamnose, arabi-nose, xylose, glucose, galactose, mannose and glucuronic and galacturonic acids.Cellulose is the major source of glucose, and hemicellulose provides xylose,mannans and galactose.The degradation of pectins releases arabinose, galactoseand uronic acids. Following the adoption of methods to determine NSP, it be-came apparent that non-digestible oligosaccharides and resistant starch alsocontributed to DF based on their physiological behaviour. In recognition of this,enzymic procedures have been developed to determine these components. Acomparison of the dietary fibre contents for a range of food types is given inTable 1.3.
In recent years attention has focused on the importance of both the soluble andinsoluble forms of fibrous material in the human diet.Water-soluble NSP is known tolower serum cholesterol, and insoluble NSP increases faecal bulk and speeds up therate of colonic transit.This last effect is thought to be beneficial in preventing a num-ber of diseases, including cancer of the bowel.
The NSP of foods may be degraded in the gut of pigs by microbial fermentation,yielding volatile fatty acids, which are absorbed and contribute to the energy sup-ply. A further benefit relates to the volatile fatty acid butyric acid, which is reportedto be an important source of energy for the growth of cells in the epithelium of thecolon; thus, the presence of this acid will promote development of the cells and en-hance absorption. The extent of degradation depends on the conformation of thepolymers and their structural association with non-carbohydrate components, suchas lignin. In addition, the physical properties of the NSP, such as water-holding ca-pacity and ion exchange properties, can influence the extent of fermentation. Thegel-forming NSPs, such as �-glucan, reduce the absorption of other nutrients fromthe small intestine and depress digestibility and adversely affect faecal consistencyin pigs and poultry. On a positive note, the water-holding properties lead to benefi-cial effects on the behaviour of pregnant sows by increasing time spent eating andresting owing to increased gut fill and by reducing inappropriate behaviour, such asbar chewing.

Analysis and characterisation of foods
11
Tab
le 1
.3Th
e fi
bre
co
mp
on
ents
(g
/kg
dry
mat
ter)
of
som
e co
mm
on
fo
od
s
Foo
dN
SPR
ham
no
seFu
cose
Ara
bin
ose
Xyl
ose
Man
no
seG
alac
tose
Glu
cose
Uro
nic
aci
ds
Lig
nin
ND
FA
DF
CF
Whe
at10
22
123
375
427
711
105
3526
Bar
ley
158
11
2550
43
7512
3321
089
53M
aize
glu
ten
feed
348
20
6696
417
102
2931
400
114
39Pe
as15
43
032
102
880
238
194
110
63So
ya b
ean
mea
l19
64
225
1710
4959
3630
115
8358
Rap
esee
d m
eal
221
32
4318
416
6448
100
256
206
152
Suga
r be
et p
ulp
602
151
163
2010
4019
316
163
490
276
203
Gra
ss m
eal
485
16
2812
84
1225
329
5072
338
921
0W
heat
str
aw51
21
021
169
57
315
1817
175
246
541
7
AD
F =
acid
-det
erg
ent
fib
re, C
F =
cr
ud
e fi
bre
, ND
F =
neu
tral
-det
erg
ent
fib
re, N
SP =
no
n-s
tarc
h p
oly
sacc
har
ide.
Ad
apte
d f
rom
Die
rick
N A
an
d D
ecu
yper
e J
A 1
994
Enzy
mes
an
d g
row
th in
pig
s. In
: Co
le D
J A
, Wis
eman
J a
nd
Var
ley
M A
(ed
s) P
rin
cip
les
of
Pig
Sci
ence
, Lo
ug
hb
oro
ug
h,
No
ttin
gh
am U
niv
ersi
ty P
ress
, 169
–95
and
Tab
le A
2.1.
1 fo
r C
F.

Chapter 1 The animal and its food
12
Minerals
A simple ash determination provides very little information about the exact mineralmake-up of the food and, when this is required, analytical techniques involving spec-troscopy are generally used. In atomic absorption spectroscopy, an acid solution ofthe sample is heated in a flame and the vaporised atoms absorb energy, which bringsabout transitions from the ground state to higher energy levels.The source of energyfor this transition is a cathode lamp, containing the element to be determined, whichemits radiation at a characteristic wavelength.The radiation absorbed by the atoms inthe flame is proportional to the concentration of the element in the food sample.
Flame emission spectroscopy measures the radiation from solutions of the sam-ple heated in air/acetylene or oxygen/acetylene flames. Each element emits radia-tion at specific wavelengths and there are published tables of flame emission spectra.Atomic absorption and flame emission spectrometry are being replaced by induc-tively coupled plasma emission spectroscopy, as this has a greater sensitivity for therelatively inert elements and can be used to determine several elements simultane-ously or sequentially. Energy from the inductively coupled plasma source is ab-sorbed by argon ions and elements to form a conducting gaseous mixture attemperatures up to 10 000 °C. The electromagnetic radiation emitted from atomsand ions within the plasma is then measured.Alternatively the ions can be separatedand detected using a mass spectrometer.
Just as with other nutrients, a measure of the concentration of the element aloneis not sufficient to describe its usefulness to the animal.Attempts have been made toassess the availability of minerals using chemical methods, such as solubility in wateror dilute acids, but these have had little success. At present animal experiments arethe only reliable way to measure mineral availability (see Chapter 10).
Amino acids, fatty acids and sugars
As an alternative to the standard Kjeldahl method for the determination of nitrogen(crude protein) described above, the Dumas method is also now used. In this methodthe sample is combusted in pure oxygen; the products are carbon dioxide, water, ox-ides of nitrogen and nitrogen. The carbon dioxide and water are absorbed oncolumns and the oxides of nitrogen are converted to nitrogen with a column packedwith copper; the resulting total nitrogen is determined in a thermal conductivity de-tector.This method, although expensive in equipment, is rapid and does not rely onhazardous chemicals.
Knowledge of the crude protein content of a food is not a sufficient measure of itsusefulness for non-ruminants.The amino acid composition of the protein is requiredin order to assess how a food can meet the essential amino acid requirements (seeChapter 4). Similarly, the total ether extract content does not give sufficient informa-tion on this fraction since it is important to know its fatty acid composition. In non-ruminants, this has large effects on the composition of body fat and, if soft fat is to beavoided, the level of unsaturated fatty acids in the diet must be controlled. In rumi-nants, a high proportion of unsaturates will depress fibre digestion in the rumen.When detailed information on the amino acid composition of protein, the fatty acidcomposition of fat or the individual sugars in NSP is required, then techniques in-volving chromatographic separation can be used. In gas–liquid chromatography, thestationary phase is a liquid held in a porous solid, usually a resin, and the mobilephase is a gas. Volatile substances partition between the liquid and the vapour and

Analysis and characterisation of foods
13
can be effectively isolated. This form of chromatography is, however, usually a slowprocess; in order to speed up the separation procedure, high-performance liquidchromatography has been developed. In this technique, pressure is used to force asolution, containing the compounds to be separated, rapidly through the resin heldin a strong metal column. In addition to speeding up the process, high resolution isalso obtained. Gas–liquid chromatography and high-performance liquid chromatog-raphy can also be used for the determination of certain vitamins (e.g. A, E, B6, K),but the measurement of available vitamins requires biological methods.
An example of the application of high-performance liquid chromatography isseen with food proteins, which are hydrolysed with acid and the released aminoacids are then determined using one of the following methods:
■ Ion-exchange chromatography – by which the amino acids are separated on thecolumn, and then mixed with a derivatisation agent, which reacts to give a com-plex that is detected by a spectrophotometer or fluorimeter.
■ Reverse-phase chromatography – in which the amino acids react with the reagentto form fluorescent or ultraviolet-absorbing derivatives, which are then separatedusing a more polar mobile phase (e.g. acetate buffer with a gradient of acetonitrile)and a less polar stationary phase (e.g. octadecyl-bonded silica).The availability ofamino acids to the animal can be estimated by chemical methods. For example, forlysine there are colorimetric methods that depend on the formation of compoundsbetween lysine and dyes (see Chapter 13).
Measurement of protein in foods for ruminants
The new methods of expressing the protein requirements of ruminants (seeChapter 13) require more information than just the crude protein (nitrogen) contentof the food. The unavailable nitrogen is measured as acid detergent insoluble nitro-gen. Information on the rate of degradation in the rumen of the available nitrogen isalso required and this can be estimated by biological methods. In the Cornell net car-bohydrate and protein system, the neutral and acid detergent extractions of Van Soest,described above, are used in combination with extraction with a borate–phosphatebuffer and trichloracetic acid solution to derive several protein fractions.These frac-tions describe the components that are degraded in the rumen or digested in thesmall intestine (see Chapter 13).
Spectroscopy
It is now common for laboratories to use near-infrared reflectance spectroscopy(NIRS) to estimate the composition of foods. The basis of this methodology lies inthe absorption of energy by hydrogen-containing functional groups in organic com-pounds present in the food (C–H, O–H, N–H and S–H). The reflected energy fromthe sample provides information on its composition but, unlike normal spectroscopy,is not related directly to concentration since the sample is heterogenous. Therefore,empirical relationships are derived by calibrating the reflected spectrum with sam-ples of known composition, as determined by standard methods. In practice, energyin the wavelength range 1100–2500 nm is directed on to a cell containing the driedmilled sample, and the diffuse reflected energy is measured across the spectrum.Thespectral data are then related to the known chemical composition of the standardsamples by multiple linear regression. The relationships are then validated with asecond set of samples of known composition. Once satisfactory relationships have

Chapter 1 The animal and its food
14
been derived, they can be applied to the spectra of samples of unknown composi-tion.The technique has been extended to the analysis of fresh silage samples, elimi-nating the need to dry and mill the sample. NIRS has the advantages that it is rapidwith minimal sample preparation, it gives instantaneous results and is non-destructiveof the sample, it allows simultaneous measurement of several parameters with highprecision, and it allows a high throughput of samples at low cost per sample. It isparticularly useful in the context of compound food manufacture where rapid analy-sis of raw materials and finished product is required for efficient mixing and qualitycontrol standards. With forages, particularly grass and cereal silages, NIRS is nowroutinely used to determine not only chemical composition but also a range of foodcharacteristics, including those that are the resultant of a number of nutrient concen-trations such as digestibility, metabolisable energy and nitrogen degradability in therumen and potential silage intake (see Chapters 12, 13 and 17).
Nuclear magnetic resonance spectroscopy is a complex technique that is used todetermine the constituents of foods. This method makes use of the fact that somecompounds contain certain atomic nuclei which can be identified from a nuclearmagnetic resonance spectrum, which measures variations in frequency of electro-magnetic radiation absorbed. It provides more specific and detailed information ofthe conformational structure of compounds than, for example, NIRS but is morecostly and requires more time and skill on the part of the operator. For thesereasons, it is more suited to research work and for cases in which the results fromsimpler spectroscopy techniques require further investigation. Nuclear magnetic res-onance spectroscopy has been useful in the investigation of the soluble and struc-tural components of forages.
SUMMARY
1. Water is an important component of animalfoods. It contributes to the water requirementsof animals and dilutes the nutrient content offoods. Water content varies widely betweenfoods.
2. The constituents of dry matter comprisecarbohydrates (sugars, starches, fibres),nitrogen-containing compounds (proteins,amino acids, non-protein nitrogen compounds),lipids (fatty acids, glycerides), minerals andvitamins.
3. Analytical techniques have been developed fromsimple chemical/gravimetric determinations.
4. Modern analytical techniques attempt tomeasure nutrients in foods in terms of thenutrient requirements of the animal.
5. Starch is determined by polarimetry.
6. Fibrous constituents can be determined byapplication of detergent solutions and weigh-ing the residue or by the use of enzymesfollowed by weighing or gas–liquid chro-matography.
7. Individual mineral elements are measuredby atomic absorption spectroscopy, flamephotometry or inductively coupled plasmaemission spectroscopy.
8. Gas–liquid chromatography is used to deter-mine individual amino acids, fatty acids andcertain vitamins.
9. Near-infrared reflectance spectroscopy is usedroutinely to determine food characteristics andto predict nutritive value. Nuclear magneticresonance spectroscopy is a research techniquefor determining the chemical structure of foodcomponents.

Further reading
15
FURTHER READING
Agricultural and Food Research Council 1987 Technical Committee on Responses to Nutri-ents, report no. 2. Characterisation of feedstuffs: nitrogen. Nutrition Abstracts andReviews, Series B: Livestock Feeds and Feeding 57: 713–36.
Agricultural and Food Research Council 1988 Technical Committee on Responses to Nutri-ents, report no. 3. Characterisation of feedstuffs: other nutrients. Nutrition Abstracts andReviews, Series B: Livestock Feeds and Feeding 58: 549–71.
Asp N-G and Johansson C-G 1984 Dietary fibre analysis. Nutrition Abstracts and Reviews 54:735–51.
Association of Official Analytical Chemists 1990 Official Methods of Analysis, 15th edn,Washington, DC.
Chalupa W and Sniffen C J 1994 Carbohydrate, protein and amino acid nutrition of lactatingdairy cattle. In: Garnsworthy P C and Cole D J A (eds) Recent Advances in Animal Nutri-tion, Loughborough, Nottingham University Press, 265–75.
Champ M, Langkilde A-M, Brouns F, Kettlitz B and Le Bail Collet Y 2003 Advances in dietaryfibre characterization. 1. Definition of dietary fibre, physiological relevance, health benefitsand analytical aspects. Nutrition Research Reviews 16: 71–82.
Coultate T P 1989 Food: The Chemistry of its Components, 2nd edn, London, Royal Societyof Chemistry.
Givens D I, De Boever J L and Deaville E R 1997 The principles, practices and some futureapplications of near infrared spectroscopy for predicting the nutritive value of foods foranimals and humans. Nutrition Research Reviews 10: 83–114.
Kritchevsky D, Bonfield C and Anderson J W 1988 Dietary Fiber, New York, Plenum Press.
Ministry of Agriculture, Fisheries and Food 1985 The Analysis of Agricultural Materials,ref. book 427, London, HMSO.
The Feeding Stuffs (Sampling and Analysis) Regulations 1999, London, HMSO.
Van Soest P J 1994 Nutritional Ecology of the Ruminant, 2nd edn, Ithaca, NY, Comstock.

16
2.1 Classification of carbohydrates
2.2 Monosaccharides
2.3 Monosaccharide derivatives
2.4 Oligosaccharides
2.5 Polysaccharides
2.6 Lignin
In general, carbohydrates are neutral chemical compounds containing the elementscarbon, hydrogen and oxygen and have the empirical formula (CH2O)n, where n is 3 ormore. However, some compounds with general properties of the carbohydrates alsocontain phosphorus, nitrogen or sulphur; and others, e.g. deoxyribose (C5H10O4), do nothave hydrogen and oxygen in the same ratio as that in water. The carbohydrate groupcontains polyhydroxy aldehydes, ketones, alcohols and acids, their simple derivatives,and any compound that may be hydrolysed to these.
2 Carbohydrates
2.1 CLASSIFICATION OF CARBOHYDRATES
The carbohydrates may be classified as shown in Fig. 2.1.The simplest sugars are themonosaccharides, which are divided into subgroups – trioses (C3H6O3), tetroses(C4H8O4), pentoses (C5H10O5), hexoses (C6H12O6) and heptoses (C7H14O7) depend-ing upon the number of carbon atoms present in the molecule.The trioses and tetrosesoccur as intermediates in the metabolism of other carbohydrates and their importancewill be considered in Chapter 9. Monosaccharides may be linked together, with theelimination of one molecule of water at each linkage, to produce di-, tri-, tetra- or poly-saccharides, containing, respectively, two, three, four or larger numbers of monosac-charide units.
The term sugar is generally restricted to those carbohydrates containing fewer thanten monosaccharide residues, while the name oligosaccharides (from the Greek oligos,a few) is frequently used to include all sugars other than the monosaccharides.
Polysaccharides, also called glycans, are polymers of monosaccharide units.Theyare classified into two groups, the homoglycans, which contain only a single type ofmonosaccharide unit, and the heteroglycans, which on hydrolysis yield mixtures of

Classification of carbohydrates
17
Fig. 2.1 Classification of carbohydrates.
Trioses (C3H6O3) GlyceraldehydeDihydroxyacetone
Tetroses (C4H8O4) Erythrose
ArabinoseXylose
Monosaccharides Pentoses (C5H10O5) XyluloseRiboseRibulose
GlucoseHexoses (C6H12O6) Galactose
Mannose
SugarsFructose
Heptoses (C7H14O7) Sedoheptulose
SucroseDisaccharides Lactose
MaltoseCellobiose
Oligosaccharides Trisaccharides RaffinoseKestose
Tetrasaccharides Stachyose
ArabinansXylans
StarchDextrins
Glucans GlycogenCellulose
Homoglycans Callose
Fructans InulinGalactans Levan
Polysaccharides MannansGlucosamines
Pectic substancesHemicelluloses
Heteroglycans Exudate gumsAcidic mucilagesHyaluronic acidChondroitin
GlycolipidsComplex carbohydrates Glycoproteins
Non-sugars

Chapter 2 Carbohydrates
18
monosaccharides and derived products. The molecular weight of polysaccharidesvaries from as little as about 8000 in some plant fructans to as high as 100 million inthe amylopectin component of starch. Hydrolysis of these polymers to their con-stituent sugars can be effected by the action of either specific enzymes or acids.
The complex carbohydrates are an ill-defined group of compounds that containcarbohydrates in combination with non-carbohydrate molecules. They include theglycolipids and glycoproteins. The structure and biological importance of these twogroups of compounds are discussed in Chapters 3 and 4, respectively.
Under physiological conditions, sugars exist mainly in another isomeric form, asring or cyclic structures, rather than straight chains. Glucose forms a pyranose ringand fructose most commonly forms a furanose ring. Each ring structure can occur intwo isomeric forms, designated � and �. Starch and glycogen are polymers of the �-form, while cellulose is a polymer of the �-form.
Properties of the monosaccharides
Because of the presence of an active aldehyde or ketone grouping, the monosaccha-rides act as reducing substances.The reducing properties of these sugars are usuallydemonstrated by their ability to reduce certain metal ions, notably copper or silver,in alkaline solution. The aldehyde and ketone groups may also be reduced chemi-cally, or enzymatically, to yield the corresponding sugar alcohols. Examples of oxi-dation and reduction products are given in the section dealing with monosaccharidederivatives (see p. 20).
1CHO
H2COH
HO3CH
H4COH
H5COH
6CH2OH
CHO
HOCH
HCOH
HOCH
HOCH
CH2OH
1CH2OH
2C O
HO3CH
H4COH
H5COH
6CH2OH
CH2OH
C O
HCOH
HOCH
HOCH
CH2OH
D-Glucose L-Glucose D-Fructose L-Fructose
2.2 MONOSACCHARIDES
Structure
The monosaccharide sugars occur in a number of isomeric forms.Thus, glucose andfructose (both hexoses) are structural isomers, glucose having an aldehyde groupand fructose having a ketone group. Both of these sugars occur in two mirrorimage, stereoisomeric forms, dextro and laevo (D- and L-), according to the orienta-tion of the OH group at carbon atom 5. Biologically the D-forms are the moreimportant.

Monosaccharides
19
Pentoses
The most important members of this group of simple sugars are the aldoses L-arabinose,D-xylose and D-ribose, and the ketoses D-xylulose and D-ribulose.
L-Arabinose occurs as pentosans in arabinans. It is a component of hemicellulosesand it is found in silage as a result of their hydrolysis. It is also a component of gumarabic and other gums. D-Xylose also occurs as pentosans in xylans. These com-pounds form the main chain in grass hemicelluloses. Xylose, along with arabinose,is produced in considerable quantities when herbage is hydrolysed with normalsulphuric acid. D-Ribose is present in all living cells as a constituent of ribonucleicacid (RNA), and it is also a component of several vitamins and coenzymes.
O5C
C4
C3 2C
1C
6CH2OH
H
OH
H
HOH
H
OH
H
HO
O5C
C4
C3 2C
1C
6CH2OH
H
OH
H
HH
OH
OH
H
HO
OC
C
C C
C
H
H
H
OH
OHOH
CH2OH
H
H
HO
α-D-Glucose β-D-Glucose α-D-Fructose
OH
HOH2COH
H
H
OH
OH
H
O
OH
H
HOH
H
OH
H
OH
H
H
OHOH2C
HH
OH
H
OH
H
OH
α-D-Xyloseα-L-Arabinose α-D-Ribose
CH2OH
C O
HCOH
HCOH
CH2OH
CH2OH
C O
HOCH
HCOH
CH2OH
D-RibuloseD-Xylulose
The phosphate derivatives of D-xylulose and D-ribulose occur as intermediates inthe pentose phosphate metabolic pathway (see p. 202).

Chapter 2 Carbohydrates
20
Hexoses
Glucose and fructose are the most important naturally occurring hexose sugars,while mannose and galactose occur in plants in a polymerised form as mannansand galactans.
D-Glucose, grape sugar or dextrose, exists in the free state as well as in combinedform. The sugar occurs free in plants, fruits, honey, blood, lymph and cerebrospinalfluid, and it is the sole or major component of many oligosaccharides, polysaccha-rides and glucosides. In the pure state, glucose is a white crystalline solid and, like allsugars, is soluble in water.
D-Fructose, fruit sugar or laevulose, occurs free in green leaves, fruits and honey.It also occurs in the disaccharide sucrose and in fructans. Green leafy crops usuallycontain appreciable amounts of this sugar, both free and in polymerised form. Thefree sugar is a white crystalline solid and has a sweeter taste than sucrose.The excep-tionally sweet taste of honey is due to this sugar.
D-Mannose does not occur free in nature but exists in polymerised form as man-nan and also as a component of glycoproteins. Mannans are found widely distrib-uted in yeasts, moulds and bacteria.
D-Galactose does not occur free in nature except as a breakdown product duringfermentation. It is present as a constituent of the disaccharide lactose, which occursin milk. Galactose also occurs as a component of the anthocyanin pigments, galac-tolipids, gums and mucilages.
Heptoses
D-Sedoheptulose is an important example of a monosaccharide containing sevencarbon atoms and occurs, as the phosphate, as an intermediate in the pentose phos-phate metabolic pathway (see p. 202).
2.3 MONOSACCHARIDE DERIVATIVES
Phosphoric acid esters
The phosphoric acid esters of sugars play an important role in a wide variety ofmetabolic reactions in living organisms (see Chapter 9). The most commonly occur-ring derivatives are those formed from glucose, the esterification occurring at eithercarbon atoms 1 or 6 or both.
CH2OH
C O
HOCH
HCOH
HCOH
HCOH
CH2OH
D-Sedoheptulose
Monosaccharide derivatives
21
Amino sugars
If the hydroxyl group on carbon atom 2 of an aldohexose is replaced by an aminogroup (–NH2), the resulting compound is an amino sugar. Two such naturally occur-ring important compounds are D-glucosamine, a major component of chitin (seep. 28), and D-galactosamine, a component of the polysaccharide of cartilage.
Deoxy sugars
Replacement of a hydroxyl group by hydrogen yields a deoxy sugar. The derivativeof ribose, deoxyribose, is a component of deoxyribonucleic acid (DNA). Similarly,deoxy derivatives of the two hexoses, galactose and mannose, occur as fucose andrhamnose, respectively, these being components of certain heteropolysaccharides.
O
OH
H
HO
H
OH
H
OH
CH2OH
H
P O
OH
OH
O
OH
H
HO
H
OH
H
OH
CH2O
H
P O
OH
OH
α-D-Glucose 1-phosphate α-D-Glucose 6-phosphate
O
OH
H
HH
OH
NH2
H
HO
CH2OH
H
O
OH
H
HH
OH
NH2
HO
H
CH2OH
H
β-D-Glucosamine β-D-Galactosamine
OHOH2C
HH
OH
H
H
H
OH
O
H
OH
H
OH
H
OH
HO
H
H
CH3
α-L-Rhamnoseα-D-Deoxyribose

Chapter 2 Carbohydrates
22
Sugar acids
The aldoses can be oxidised to produce a number of acids, of which the mostimportant are:
Glycosides
If the hydrogen of the hydroxyl group attached to the carbon 1 atom of glucose isreplaced by esterification, or by condensation, with an alcohol (including a sugarmolecule) or a phenol, the derivative so produced is termed a glucoside. Similarlygalactose forms galactosides and fructose forms fructosides.The general term glyco-side is used collectively to describe these derivatives and the linkage is described asa glycosidic bond.
Oligosaccharides and polysaccharides are classed as glycosides, and these com-pounds yield sugars or sugar derivatives on hydrolysis. Certain naturally occurringglycosides contain non-sugar residues. For example, the nucleosides contain a sugarcombined with a heterocyclic nitrogenous base (see Chapter 4).
COOH
(CHOH)n
CH2OH
COOH
(CHOH)n
COOH
CHO
(CHOH)n
COOH
Aldonic acids Aldaric acids Uronic acids
CH2OH
C O
HOCH
HCOH
HCOH
CH2OH
CH2OH
HOCH
HOCH
HCOH
HCOH
CH2OH
CHO
HOCH
HOCH
HCOH
HCOH
CH2OH
+2H +2H
D-Fructose D-Mannitol D-Mannose
In the case of glucose, the derivatives corresponding to these formulae are glu-conic, glucaric and glucuronic acids, respectively. Of these compounds, the uronicacids, particularly those derived from glucose and galactose, are important compo-nents of a number of heteropolysaccharides.
Sugar alcohols
Simple sugars can be reduced to polyhydric alcohols; for example, glucose yieldssorbitol, galactose yields dulcitol, and both mannose and fructose yield mannitol.Mannitol occurs in grass silage and is formed by the action of certain anaerobicbacteria on the fructose present in the grass.

Oligosaccharides
23
The cyanogenetic glycosides liberate hydrogen cyanide (HCN) on hydrolysis; be-cause of the toxic nature of this compound, plants containing this type of glycosideare potentially dangerous to animals. The glycoside itself is not toxic and must behydrolysed before poisoning occurs. However, the glycoside is easily broken downto its components by means of an enzyme that is usually present in the plant. Anexample of a cyanogenetic glycoside is linamarin (also called phaseolunatin), whichoccurs in linseed, Java beans and cassava. If wet mashes or gruels containing thesefoods are given to animals, it is advisable to boil them when mixing in order to in-activate any enzyme present. On hydrolysis, linamarin yields glucose, acetone andhydrogen cyanide.
Examples of other cyanogenetic glycosides and their sources are shown inTable 2.1.
Table 2.1 Some important naturally occurring cyanogenetic glycosides
Name Source Hydrolytic products in
addition to glucose and
hydrogen cyanide
Linamarin(phaseolunatin)
Linseed (Linum usitatissimum),Java beans (Phaseolus lunatus),Cassava (Manihot esculenta)
Acetone
Vicianin Seeds of wild vetch (Vicia angustifolia)
Arabinose, benzaldehyde
Amygdalin Bitter almonds, kernels ofpeach, cherries, plums, applesand fruits of Rosaceae
Benzaldehyde
Dhurrin Leaves of the great millet(Sorghum vulgare)
p-Hydroxy-benzaldehyde
Lotaustralin Trefoil (Lotus australis),White clover (Trifolium repens)
Methylethyl ketone
2.4 OLIGOSACCHARIDES
Disaccharides
A large number of disaccharide compounds are theoretically possible, dependingupon the monosaccharides present and the manner in which they are linked.The mostnutritionally important disaccharides are sucrose, maltose, lactose and cellobiose,which on hydrolysis yield two molecules of hexoses:
Sucrose is formed from one molecule of �-D-glucose and one molecule of �-D-fructose joined together through an oxygen bridge between their respective carbonatoms 1 and 2.As a consequence, sucrose has no active reducing group.
C12H22O11 + H2O : 2C6H12O6

Chapter 2 Carbohydrates
24
Sucrose is the most ubiquitous and abundantly occurring disaccharide in plants,where it is the main transport form of carbon.This disaccharide is found in high con-centration in sugar cane (200 g/kg) and in sugar beet (150–200 g/kg); it is also pres-ent in other roots such as mangels and carrots, and it occurs in many fruits. Sucroseis easily hydrolysed by the enzyme sucrase or by dilute acids.When heated to a tem-perature of 160 °C it forms barley sugar and at a temperature of 200 °C it formscaramel.
Lactose, or milk sugar, is a product of the mammary gland. Cow’s milk contains43–48 g/kg lactose. It is not as soluble as sucrose and is less sweet, imparting onlya faint sweet taste to milk. Lactose is formed from one molecule of �-D-glucosejoined to one of �-D-galactose in a �-(1:4)-linkage and has one active reducinggroup.
O
OH
H
HH
OH
HO
H
CH2OH
HO
O
OH
H
H
OH
CH2OH
HH OH
H
Lactose
O
OH
H
H
H
OH
H
HO
CH2OH
HO
H
OH
HO
H
H
CH2OHO
CH2OH
Sucrose
Lactose readily undergoes fermentation by a number of organisms, includingStreptococcus lactis.This organism is responsible for souring milk by converting thelactose into lactic acid (CH3.CHOH.COOH). If lactose is heated to 150 °C it turnsyellow; at a temperature of 175 °C the sugar is changed into a brown compound,lactocaramel. On hydrolysis lactose produces one molecule of glucose and onemolecule of galactose.
Maltose, or malt sugar, is produced during the hydrolysis of starch and glycogenby dilute acids or enzymes. It is produced from starch during the germination of bar-ley by the action of the enzyme amylase. The barley, after controlled germinationand drying, is known as malt and is used in the manufacture of beer and Scotch maltwhisky. Maltose is water-soluble, but it is not as sweet as sucrose. Structurally it

Oligosaccharides
25
consists of two �-D-glucose residues linked in the �-1,4 positions; it has one activereducing group.
Cellobiose does not exist naturally as a free sugar, but it is the basic repeating unitof cellulose. It is composed of two �-D-glucose residues linked through a �-(1:4)-bond.This linkage cannot be split by mammalian digestive enzymes. It can, however, besplit by microbial enzymes. Like maltose, cellobiose has one active reducing group.
O
OH
H
H
H
OH
H
HO
CH2OH
H
O
OH
H
H
OH
CH2OH
HH H
OH
Maltose
O
O
OH
H
HH
OH
H
HO
CH2OH
H
HO
H
CH2OH
H
OHH
OH
Cellobiose
O
OH
H
Trisaccharides
Raffinose and kestose are two important naturally occurring trisaccharides.They areboth non-reducing and on hydrolysis produce three molecules of hexose sugars:
Raffinose is the commonest member of the group, occurring almost as widely assucrose in plants. It exists in small amounts in sugar beet and accumulates in molassesduring the commercial preparation of sucrose. Cotton seed contains about 80 g/kg ofraffinose. On hydrolysis, this sugar produces glucose, fructose and galactose.
Kestose and its isomer isokestose occur in the vegetative parts and seeds ofgrasses. These two trisaccharides consist of a fructose residue attached to a sucrosemolecule.
Tetrasaccharides
Tetrasaccharides are made up of four monosaccharide residues. Stachyose, a mem-ber of this group, is almost as ubiquitous as raffinose in higher plants and has been
C18H32O16 + 2H2O : 3C6H12O6

Chapter 2 Carbohydrates
26
isolated from about 165 species. It is a non-reducing sugar and on hydrolysisproduces two molecules of galactose, one molecule of glucose and one of fructose:
C24H42O21 + 3H2O : 4C6H12O6
2.5 POLYSACCHARIDES
Homoglycans
These carbohydrates are very different from the sugars. The majority are of highmolecular weight, being composed of large numbers of pentose or hexose residues.Homoglycans do not give the various sugar reactions characteristic of the aldosesand ketoses. Many of them occur in plants either as reserve food materials such asstarch or as structural materials such as cellulose.
Arabinans and xylans
These are polymers of arabinose and xylose, respectively. Although homoglycansbased on these two pentoses are known, they are more commonly found in combi-nation with other sugars as constituents of heteroglycans.
Glucans
Starch is a glucan and is present in many plants as a reserve carbohydrate. It is mostabundant in seeds, fruits, tubers and roots. Starch occurs naturally in the form ofgranules, whose size and shape vary in different plants. The granules are built up inconcentric layers, and although glucan is the main component of the granules theyalso contain minor constituents such as protein, fatty acids and phosphorus com-pounds, which may influence their properties.
Starches differ in their chemical composition and, except in rare instances, aremixtures of two structurally different polysaccharides, amylose and amylopectin.The proportions of these present in natural starches depend upon the source,although in most starches amylopectin is the main component, amounting to about70–80 per cent of the total. An important qualitative test for starch is its reactionwith iodine: amylose produces a deep blue colour and amylopectin solutionsproduce a blue–violet or purple colour.
Amylose is mainly linear in structure, the �-D-glucose residues being linked be-tween carbon atom 1 of one molecule and carbon atom 4 of the adjacent molecule.A small proportion of �-(1:6) linkages may also be present.Amylopectin has a bush-like structure containing primarily �-(1:4) linkages, but it also has an appreciablenumber of �-(1:6) linkages.
O
OH
H
H
H
OH
H
6CH2OH
H
O
OH
H
H
OH
6CH2OH
HH H
O
O
OH
H
H
OH
6CH2OH
HH H
O
Part of amylose molecule showing 1,4 linkages
4
3 2
1
5
O
4
3 2
1
5
4
3 2
1
5
O

Polysaccharides
27
Starch granules are insoluble in cold water, but when a suspension in water isheated the granules swell and eventually gelatinise. On gelatinisation, potatostarch granules swell greatly and then burst open; cereal starches swell but tendnot to burst.
Animals consume large quantities of starch in cereal grains, cereal by-productsand tubers.
Glycogen is a term used to describe a group of highly branched polysaccharidesisolated from animals or microorganisms. The molecules can be hydrolysed rapidlyin conditions requiring the mobilisation of glucose, such as exercise and stress.Glycogens occur in liver, muscle and other animal tissues. They are glucans, analo-gous to amylopectin in structure, and have been referred to as ‘animal starches’.Glycogen is the main carbohydrate storage product in the animal body and plays anessential role in energy metabolism.
The molecular weights of glycogen molecules vary considerably according tothe animal species, the type of tissue and the physiological state of the animal.The glycogen of rat liver, for example, has molecular weights in the range
whereas that from rat muscle has a rather lower molecular weight ofabout
Dextrins are intermediate products of the hydrolysis of starch and glycogen:5 * 106.
1-5 * 108,
Dextrins are soluble in water and produce gum-like solutions. The higher mem-bers of these transitional products produce a red colour with iodine, while the lowermembers do not give a colour.The presence of dextrins gives a characteristic flavourto bread crust, toast and partly charred cereal foods.
Cellulose is the most abundant single polymer in the plant kingdom, forming thefundamental structure of plant cell walls. It is also found in a nearly pure form in cot-ton. Pure cellulose is a homoglycan of high molecular weight in which the repeatingunit is cellobiose. Here the �-glucose residues are 1,4-linked.
Starch
Glycogen
Dextrins → maltose → glucose
O
OH
H
HH
OH
H
HO
CH2OH
H
HO
H
CH2OH
H
OHH
O
OH
H
H
OH
CH2OH
HH
HO
Cellulose
O
O
H
CH2OH
H
OHH
OHH
O
OH
H
OH
H
n

Chapter 2 Carbohydrates
28
In the plant, cellulose chains are formed in an ordered manner to produce com-pact aggregates (microfibrils), which are held together by both inter- and intramolecularhydrogen bonding. In the plant cell wall, cellulose is closely associated, physicallyand chemically, with other components, especially hemicelluloses and lignin.
Callose is a collective term for a group of polysaccharides consisting of �-(1,3)-and frequently �-(1,4)-linked glucose residues.These �-glucans occur in higher plantsas components of special walls appearing at particular stages of development.A largepart of the endosperm cell wall of cereal grains is composed of �-glucans of this type.They are also deposited by higher plants in response to wounding and infection.
Fructans
These occur as reserve material in roots, stems, leaves and seeds of a variety ofplants, but particularly in the Compositae and Gramineae. In the Gramineae, fruc-tans are found only in temperate species. These polysaccharides are soluble in coldwater and are of a relatively low molecular weight.All known fructans contain �-D-fructose residues joined by 2,6 or 2,1 linkages. They can be divided into threegroups: (1) the levan group, characterised by 2,6 linkages; (2) the inulin group, con-taining 2,1 linkages; and (3) a group of highly branched fructans found, for example,in couch grass (Agropyron repens) and in wheat endosperm. This group containsboth types of linkage.
Most fructans on hydrolysis yield, in addition to D-fructose, a small amount of D-glucose, which is derived from the terminal sucrose unit in the fructan molecule.Thestructure of a typical grass fructan is depicted here:
Galactans and mannans
These are polymers of galactose and mannose, respectively, and occur in the cell wallsof plants.A mannan is the main component of the cell walls of palm seeds, where itoccurs as a food reserve and disappears during germination.A rich source of mannanis the endosperm of nuts from the South American tagua palm tree (Phytelephasmacrocarpa); the hard endosperm of this nut is known as ‘vegetable ivory’.The seedsof many legumes, including clovers, trefoil and lucerne, contain galactans.
Glucosaminans
Chitin is the only known example of a homoglycan containing glucosamine, being alinear polymer of acetyl-D-glucosamine. Chitin is of widespread occurrence in lower
O
H
OH
HO
H
O
CH2OHH
CH2OH
Grass fructan
O
H
OH
HO
H
O
CH2OHH
CH2 O
H
OH
HO
H
CH2OHH
CH2 OO
OH
H
H
OH
CH2OH
HOH
HH
(Sucrose residue)
1-30

Polysaccharides
29
animals and is particularly abundant in Crustacea, in fungi and in some green algae.After cellulose, it is probably the most abundant polysaccharide of nature.
HeteroglycansPectic substances
Pectic substances are a group of closely associated polysaccharides that are solublein hot water and occur as constituents of primary cell walls and intercellular regionsof higher plants.They are particularly abundant in soft tissues such as the peel of cit-rus fruits and sugar beet pulp. Pectin, the main member of this group, consists of alinear chain of D-galacturonic acid units in which varying proportions of the acidgroups are present as methyl esters.The chains are interrupted at intervals by the in-sertion of L-rhamnose residues. Other constituent sugars, e.g. D-galactose, L-arabi-nose and D-xylose, are attached as side chains. Pectic acid is another member of thisclass of compounds; it is similar in structure to pectin but is devoid of ester groups.Pectic substances possess considerable gelling properties and are used commerciallyin jam making.
Hemicelluloses
Hemicelluloses are defined as alkali-soluble cell wall polysaccharides that areclosely associated with cellulose. The name hemicellulose is misleading and implieserroneously that the material is destined for conversion to cellulose. Structurally,hemicelluloses are composed mainly of D-glucose, D-galactose, D-mannose, D-xyloseand L-arabinose units joined together in different combinations and by various gly-cosidic linkages.They may also contain uronic acids.
Hemicelluloses from grasses contain a main chain of xylan made up of �-(1:4)-linked D-xylose units with side chains containing methylglucuronic acid and fre-quently glucose, galactose and arabinose.
Exudate gums and acid mucilages
Exudate gums are often produced from wounds in plants, although they may arise asnatural exudations from bark and leaves. The gums occur naturally as salts, espe-cially of calcium and magnesium, and in some cases a proportion of the hydroxylgroups are esterified, usually as acetates. Gum arabic (acacia gum) has long been afamiliar substance; on hydrolysis it yields arabinose, galactose, rhamnose and glu-curonic acid.Acidic mucilages are obtained from the bark, roots, leaves and seeds ofa variety of plants. Linseed mucilage is a well-known example that produces arabi-nose, galactose, rhamnose and galacturonic acid on hydrolysis.
Hyaluronic acid and chondroitin
These two polysaccharides have a repeating unit consisting of an amino sugar and D-glucuronic acid. Hyaluronic acid, which contains acetyl-D-glucosamine, is present inthe skin, the synovial fluid and the umbilical cord. Solutions of this acid are viscousand play an important part in the lubrication of joints. Chondroitin is chemicallysimilar to hyaluronic acid but contains galactosamine in place of glucosamine.Sulphate esters of chondroitin are major structural components of cartilage, tendonsand bones.
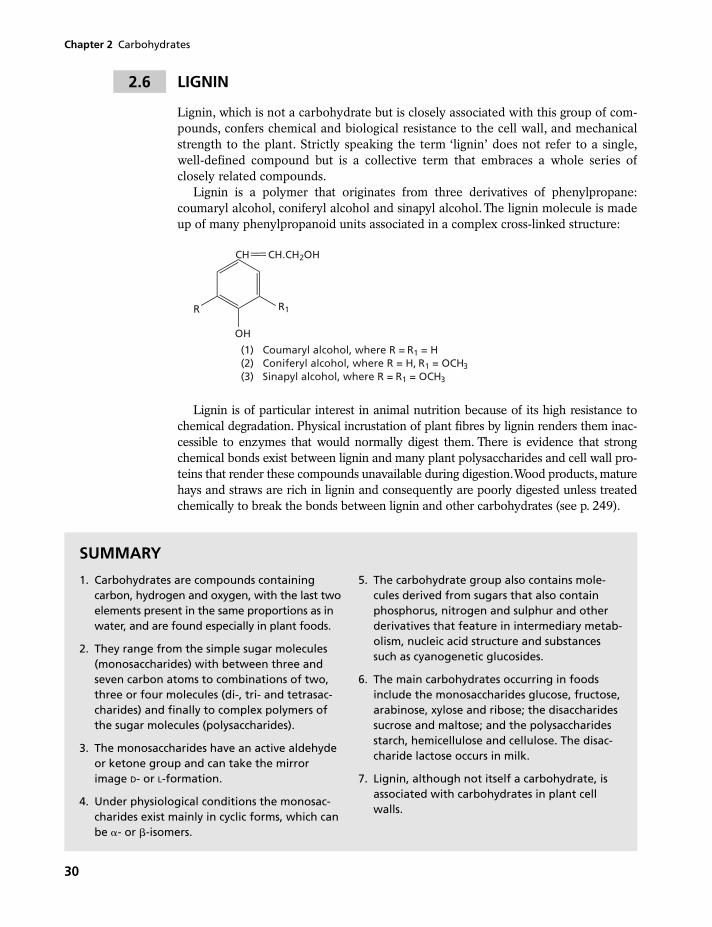
Chapter 2 Carbohydrates
30
Lignin is of particular interest in animal nutrition because of its high resistance tochemical degradation. Physical incrustation of plant fibres by lignin renders them inac-cessible to enzymes that would normally digest them. There is evidence that strongchemical bonds exist between lignin and many plant polysaccharides and cell wall pro-teins that render these compounds unavailable during digestion.Wood products, maturehays and straws are rich in lignin and consequently are poorly digested unless treatedchemically to break the bonds between lignin and other carbohydrates (see p. 249).
2.6 LIGNIN
Lignin, which is not a carbohydrate but is closely associated with this group of com-pounds, confers chemical and biological resistance to the cell wall, and mechanicalstrength to the plant. Strictly speaking the term ‘lignin’ does not refer to a single,well-defined compound but is a collective term that embraces a whole series ofclosely related compounds.
Lignin is a polymer that originates from three derivatives of phenylpropane:coumaryl alcohol, coniferyl alcohol and sinapyl alcohol.The lignin molecule is madeup of many phenylpropanoid units associated in a complex cross-linked structure:
R
OH
CH CH.CH2OH
(1) Coumaryl alcohol, where R = R1 = H(2) Coniferyl alcohol, where R = H, R1 = OCH(3) Sinapyl alcohol, where R = R1 = OCH
3
3
R1
SUMMARY
1. Carbohydrates are compounds containingcarbon, hydrogen and oxygen, with the last twoelements present in the same proportions as inwater, and are found especially in plant foods.
2. They range from the simple sugar molecules(monosaccharides) with between three andseven carbon atoms to combinations of two,three or four molecules (di-, tri- and tetrasac-charides) and finally to complex polymers ofthe sugar molecules (polysaccharides).
3. The monosaccharides have an active aldehydeor ketone group and can take the mirrorimage D- or L-formation.
4. Under physiological conditions the monosac-charides exist mainly in cyclic forms, which canbe �- or �-isomers.
5. The carbohydrate group also contains mole-cules derived from sugars that also containphosphorus, nitrogen and sulphur and otherderivatives that feature in intermediary metab-olism, nucleic acid structure and substancessuch as cyanogenetic glucosides.
6. The main carbohydrates occurring in foodsinclude the monosaccharides glucose, fructose,arabinose, xylose and ribose; the disaccharidessucrose and maltose; and the polysaccharidesstarch, hemicellulose and cellulose. The disac-charide lactose occurs in milk.
7. Lignin, although not itself a carbohydrate, isassociated with carbohydrates in plant cellwalls.

Further reading
31
FURTHER READING
Aspinall G O (ed.) 1982–85 The Polysaccharides,Vols 1–3, New York,Academic Press.
Binkley R W 1988 Modern Carbohydrate Chemistry, New York, Marcel Dekker.
Dey P M and Dixon R A (eds) 1985 Biochemistry of Storage Carbohydrates in Green Plants,London,Academic Press.
Duffus C M and Duffus J H 1984 Carbohydrate Metabolism in Plants, London, Longman.
Stumpf P K, Conn E E and Preiss J (eds) 1988 The Biochemistry of Plants, Vol. 14, Carbohy-drates, New York,Academic Press.
Tipson R S and Horton D (eds) Advances in Carbohydrate Chemistry and Biochemistry,(annual volumes since 1945), New York, Academic Press.
32
3.1 Classification of lipids
3.2 Fats
3.3 Glycolipids
3.4 Phospholipids
3.5 Waxes
3.6 Steroids
3.7 Terpenes
3 Lipids
3.1 CLASSIFICATION OF LIPIDS
The lipids are a group of substances found in plant and animal tissues.They are insol-uble in water but soluble in common organic solvents such as benzene, ether andchloroform. They act as electron carriers, as substrate carriers in enzymic reactions,as components of biological membranes, and as sources and stores of energy. In theproximate analysis of foods they are included in the ether extract fraction.They maybe classified as shown in Fig. 3.1.
Plant lipids are of two main types: structural and storage. The structural lipids arepresent as constituents of various membranes and protective surface layers and makeup about 7 per cent of the leaves of higher plants.The surface lipids are mainly waxes,with relatively minor contributions from long-chain hydrocarbons, fatty acids andcutin. The membrane lipids, present in mitochondria, the endoplasmic reticulum andthe plasma membranes, are mainly glycolipids (40–50 per cent) and phosphoglyc-erides. Plant storage lipids occur in fruits and seeds and are, predominantly, triacyl-glycerols. Over 300 different fatty acids have been isolated from plant tissues, but onlyabout seven are of common occurrence. The most abundant is �-linolenic acid; themost common saturated acid is palmitic acid and the most common monounsaturatedacid is oleic acid.
In animals, lipids are the major form of energy storage, mainly as fat, which mayconstitute up to 97 per cent of the adipose tissue of obese animals.The yield of en-ergy from the complete oxidation of fat is about 39 MJ/kg DM compared with about17 MJ/kg DM from glycogen, the major carbohydrate form of stored energy. In

Fats
33
Fig. 3.1 Classification of the lipids.
addition, stored fat is almost anhydrous, whereas stored glycogen is highly hydrated.Weight for weight, fat is, therefore, about six times as effective as glycogen as astored energy source.
The structural lipids of animal tissues, mainly phosphoglycerides, constitute0.5–1 per cent of muscle and adipose tissue; the concentration in the liver is usually2–3 per cent.The most important non-glyceride neutral lipid fraction of animal tissueis made up of cholesterol and its esters, which together make up 0.06–0.09 per centof muscle and adipose tissue.
Lipids
Glycerol-based Non-glycerol-based
Simple Compound
Glycolipids Phosphoglycerides
SphingomyelinsCerebrosidesWaxesSteroidsTerpenes
Fats Glucolipids Galactolipids Lecithins Cephalins Eicosanoids
3.2 FATS
Fats and oils are constituents of both plants and animals and are important sourcesof stored energy. Both have the same general structure but have different physicaland chemical properties. The melting points of the oils are such that at ordinaryroom temperatures they are liquid and they tend to be more chemically reactivethan the more solid fats.The term ‘fat’ is frequently used in a general sense to includeboth groups.As well as its major function of supplying energy, stored fat is importantas a thermal insulator and, in some warm-blooded animals, as a source of heat formaintaining body temperature.This is especially important in animals that are bornhairless, those that hibernate and those that are cold-adapted. Such animals havespecial deposits of ‘brown fat’ in which oxidation is uncoupled from adenosinetriphosphate (ATP) production (see Chapter 14) and all the energy is liberated asheat. Palmitate oxidised to produce ATP would yield about 13 MJ/kg as heat, com-pared with the uncoupled yield of 39 MJ/kg. In these tissues, the mitochondria areliberally supplied with respiratory electron carriers, particularly cytochromes, whichaccounts for their brown colour.

Structure of fats
Fats are esters of fatty acids with the trihydric alcohol glycerol; they are also referredto as glycerides or acylglycerols.When all three alcohol groups are esterified by fattyacids, the compound is a triacylglycerol (triglyceride):
Chapter 3 Lipids
34
R1, R2 and R3 represent the chains of different fatty acids. Naturally occurring fatsand oils are mixtures of such mixed triacylglycerols. Soya bean oil has been esti-mated to contain about 79 per cent of mixed triacylglycerols compared with about21 per cent of the simple type. Comparable figures for linseed oil are 75 and 25 percent, respectively.Triacylglycerols with residues of one fatty acid only do occur nat-urally; laurel oil, for example, contains about 31 per cent of the triacylglycerol oflauric acid.
Most of the naturally occurring fatty acids have an even number of carbon atoms,which is to be expected in view of their mode of formation (see Chapter 9).The major-ity contain a single carboxyl group and an unbranched carbon chain, which may besaturated or unsaturated. The unsaturated acids contain one (monoenoic), two(dienoic), three (trienoic) or many (polyenoic) double bonds. Fatty acids with morethan one double bond are frequently referred to as polyunsaturated fatty acids (PUFA).The unsaturated acids possess different physical and chemical properties from the satu-rated acids: they have lower melting points and are more chemically reactive.
The presence of a double bond in a fatty acid molecule means that the acid canexist in two forms, depending upon the spatial arrangement of the hydrogen atomsattached to the carbon atoms of the double bond.When the hydrogen atoms lie on
CH2.O.CO.R1
CH.O.CO.R2
CH2.O.CO.R3
Mixed triacylglycerol
sn-1CH2OH
sn-2CH OH + 3R.COOH
sn-3CH2OH
Gycerol Fatty acid
sn-1CH2.O.CO.R
sn-2CH.O.CO.R + 3H2O
sn-3CH2.O.CO.R
Triacylglycerol
It is important to appreciate that, in stereochemical terms, the positions occupiedby the acid chains are not identical. Under the stereospecific numbering system thepositions are designated sn-1, sn-2 and sn-3, as shown.They are readily distinguishedby enzymes and this may lead to preferential reactivity at one or more of the posi-tions. Phosphorylation, for example, always takes place at carbon atom sn-3 ratherthan at carbon atom sn-1.Although triacylglycerols are predominant, mono- and di-acylglycerols do occur naturally, but in much smaller amounts.
Triacylglycerols differ in type according to the nature and position of the fattyacid residues.Those with three residues of the same fatty acid are termed simple tri-acylglycerols, as illustrated above.When more than one fatty acid is concerned in theesterification, a mixed triacylglycerol results:

Fats
35
the same side of the double bond, the acid is said to be in the cis form, whereas it issaid to be in the trans form when the atoms lie on opposite sides, as shown here:
C
C
H
H
(CH2)7.COOH
R
C
C
H
R
(CH2)7.COOH
H
Cis Trans
Most naturally occurring fatty acids have the cis configuration.The fatty acids are named by replacing the final -e of the name of the parent hydro-
carbon by the suffix -oic. Thus, a saturated 18-carbon acid would be named octade-canoic after the parent octadecane.An 18-carbon acid with one double bond would beoctadecenoic after octadecene. The position of the double bond is indicated by refer-ence to the carboxyl carbon atom (carbon atom 1). Thus, 9-octadecenoic acid wouldhave 18 carbon atoms and a double bond between carbon atoms 9 and 10. Similarily,9,12,15-octadecatrienoic acid would have 18 carbon atoms and double bonds betweencarbon atoms 9 and 10, 12 and 13, and 15 and 16.The names may be abbreviated bystating the number of carbon atoms followed by a colon, followed by the number ofdouble bonds (�), the positions of which are stated as a superscript. Thus, octadeca-trienoic acid would be designated 18:3�9,12,15. Alternatively it may be written 9,12,15-18:3. Carbon atoms 2 and 3 are designated alpha (�) and beta (�), respectively, andthe methyl carbon at the distal end of the chain as the omega (�) carbon atom. In nutri-tional work, the unsaturated acids are frequently named in relation to the terminalmethyl as carbon atom 1. Under this system 9,12,15-octadecatrienoic acid would be-come �-3,6,9-octadecatrienoic acid, since carbon atoms 3, 6 and 9 correspond to car-bon atoms 16, 13 and 10 under the former system.The abbreviated designation wouldbe �-3,6,9-18:3. It has become common practice to use n instead of � and we then haven-3,6,9-18:3 and frequently 18:3(n-3). In addition the configuration of the doublebonds is indicated by the use of the prefixes cis and trans.Thus, �-linolenic acid wouldbe all cis-9,12,15-octadecatrienoic, or more simply all cis 9,12,15-18:3.
For certain purposes the PUFA are grouped into families, based on oleic (n-9-18:1),linoleic (n-6,9-18:2) and �-linolenic (n-3,6,9-18:3) as precursors.The families are calledomega-9 (�-9), omega-6 (�-6) and omega-3 (�-3), referring to the positions of the dou-ble bonds nearest to the omega carbon atom in these acids.Again, n is frequently sub-stituted for �. Some of the nutritionally important fatty acids are shown in Table 3.1.
Two low-molecular-weight saturated fatty acids, namely butyric (C3H7.COOH)and caproic (C4H10.COOH), are found in significant amounts in the milk fats of ru-minants, and caproic along with caprylic acid is present in a few oils such as palmkernel and coconut. Other fatty acids containing two carboxyl groups, odd numbersof carbon atoms and branched chains have been isolated from natural fats, but theyare not considered to be of great importance.
Triacylglycerols are named according to the fatty acids they contain, e.g:
CH2.O.CO.C17H33
CH.O.CO.C17H33
CH2.O.CO.C17H33
CH2.O.CO.C15H31
CH.O.CO.C17H33
CH2.O.CO.C17H35
Trioleoylgycerol (triolein) 1-Palmitoyl 2-oleoyl 3-stearoylglycerol (palmito-oleostearin)

Chapter 3 Lipids
36
The fatty acid residues are not distributed randomly between the alcohol groupsof the parent glycerol.Thus, in cow’s milk fat, for example, the short-chain acids areconcentrated at position 3. In human milk fat, the unsaturated acids are predomi-nantly at position 1 and the saturated acids at position 2. Animal depot fats tend tohave saturated acids at position 1 and unsaturated and short-chain acids at position 2;PUFA tend to accumulate at position 3.
There is evidence that the configuration of the constituent triacylglycerols of fatscan influence the extent to which they are digested.Thus, palmitate (hexadecanoate)distributed randomly throughout the 1, 2 and 3 positions was found to be lessdigestible than that which occupied position 2, the favoured position for attack bypancreatic lipase.
The fatty acid composition of the triacylglycerols determines their physical na-ture.Those with a high proportion of low-molecular-weight (short-chain) and unsat-urated acids have low melting points. Thus, tristearin is solid at body temperaturewhereas triolein is liquid.
Composition of fats
It is frequently important in nutritional investigations to assess the quality of the fatbeing produced under a certain treatment.When the effect of the diet is considerable,the results may be obvious in a softening or hardening of the fat. Less obviouschanges may occur, and for these a more objective assessment is necessary. Differ-ences between fats are a function of their fatty acid composition since glycerol is com-mon to all fats. The logical method of following changes in fats is, therefore, tomeasure their fatty acid constitution. Analysis of fats for individual fatty acids has
Table 3.1 Common fatty acids of natural fats and oils
Acid Formula Melting point (°C)
SaturatedCaprylic (octanoic) C7H15.COOH 16.3Capric (decanoic) C9H19.COOH 31.2Lauric (dodecanoic) C11H23.COOH 43.9Myristic (tetradecanoic) C13H27.COOH 54.1Palmitic (hexadecanoic) C15H31.COOH 62.7Stearic (octadecanoic) C17H35.COOH 69.6
UnsaturatedPalmitoleic (9-hexadecenoic) (9-16:1 or 16:1n-7) C15H29.COOH 0Oleic (octadecenoic) (9-18:1 or 18:1n-9) C17H33.COOH 13Linoleic (octadecadienoic) (9,12-18:2 or 18:2n-6) C17H31.COOH -5�-Linolenic (9,12,15-octadecatrienoic) (9,12,15-18:3 or 18:3n-3) C17H29.COOH -14.5Arachidonic (eicosatetraenoic) (5,8,11,14-20:4 or 20:4n-6) C19H31.COOH -49.5Timnodonic (eicosapentaenoic) (5,8,11,14,17-20:5 or 20:5n-3) C19H29.COOHDocosahexaenoic (5,8,11,14,17,20-22:6 or 22:6n-3) C21H36.COOH

Fats
37
presented great problems in the past, but the introduction of techniques such as gaschromatography has allowed determinations to be made more easily and accurately.As well as its major role as an energy source, fat has a vital role in providing individ-ual fatty acids with specific nutritional roles within the animal body. Information onfatty acid composition is, therefore, a prerequisite in the evaluation of fats in thiscontext.
Some typical values for a number of important fats and oils are given in Table 3.2.In general, plant and marine oils, especially those of fish, are more highly unsatu-
rated than those of mammalian origin. This is because of the presence of varyingamounts of linoleic and linolenic acids in addition to the monounsaturated oleic (cis-9-octadecenoic) acid, which is quantitatively the major fatty acid in most naturalfats. In addition, the fish oils have significant concentrations of highly unsaturatedC20 and C22 acids. In mammalian depot fat, the proportion of the more unsaturatedacids is lower and there is a higher proportion of high-molecular-weight saturatedacids such as palmitic and stearic acids, with smaller but significant contributionsfrom lauric (dodecanoic) and myristic (tetradecanoic) acids. For this reason, fats suchas pig lard, and beef and mutton tallow are firm and hard, whereas fish and plant oilsare softer and frequently are oils in the true sense.
Within individual animals, subcutaneous fats contain a higher proportion of unsat-urated acids and are thus softer than deep-body fat. The physical nature of fat variesbetween animals, marine mammals having softer body fat than land mammals. Thereason in both cases is that animal fat has to maintain a degree of malleability at thetemperature of the tissue, which is influenced by ambient temperatures.Thus, the fats
Table 3.2 Fatty acid composition (g/100 g) of some common fats and oils
Rapeseed Soya bean Ryegrass Cocksfoot Linseed Butterfat Lard Beef tallow Menhaden Codliver
4:0 – – – – – 3 – – – –
6:0 – – – – – 2 – – – –
8:0 – – – – – 1 – – – –
10:0 – – – – – 3 – – – –
12:0 – – – – – 4 – – – –
14:0 Tr Tr Tr Tr Tr 12 Tr 3 8 1
16:0 4 10 12 11 6 31 32 26 22 19
18:0 1 4 2 3 3 10 8 19 3 5
20:0 1 Tr – – – – – – – –
22:0 Tr Tr – – – – – – – 4
16:1 2 Tr 2 2 – 2 6 11 4
18:1n-9 54 25 15 – 17 23 48 40 21 15
20:1n-9 – – – – – – – – 2 10
22:1n-9 – – – – – – – – 2 2
18:2n-6 23 52 68 79 13 2 11 5 2 2
18:3n-3 10 7 – – 55 Tr Tr – – –
20:4n-6 – – – – – – – – 2 1
20:5n-3 – – – – – – – – 14 6
22:6n-3 – – – – – – – – 10 27
Others 5 2 7 0 6 1 1 4 1 2
Chapter 3 Lipids
38
of the feet and ears, which are inclined to be colder than the interior of the body, tendto be unsaturated.
Ruminant milk fats are characterised by their high content of low-molecular-weight fatty acids, these sometimes forming as much as 20 per cent of the total acidspresent. As a result they are softer than the depot fats of the respective animals butnot as soft as fats of vegetable and marine origin, being semi-solid at ordinary temper-atures. Milk fats of non-ruminants resemble the depot fat of the particular animal.
In most commercially important edible plant oils, the dominant fatty acids areoleic, linoleic and linolenic acids. Coconut oil is an exception in having the saturated12:0 lauric acid as its major acid. Families of plants tend to produce characteristicoils that frequently contain unusual fatty acids. Examples are the erucic acid of rape-seed; ricinoleic acid, the 18-carbon, monoenoic, hydroxy acid of the castor bean;and vernolic acid, the 18-carbon, trienoic, epoxy acid of the Compositae.
Essential fatty acids
In 1930, linoleic (cis, cis-9,12-octadecadienoic) acid was shown to be effective in pre-venting the development of certain conditions in rats given diets almost devoid of fat.These animals showed a scaly appearance of the skin and suboptimal performance ingrowth, reproduction and lactation; eventually they died as a result of the deficientdiet. More recent work has demonstrated a wide range of symptoms in a variety ofanimals, including some in human beings under certain circumstances (Table 3.3).
Arachidonic (all cis 5,8,11,14-eicosatetraenoic) acid has been shown to haveequivalent or even greater activity than linoleic acid, and linolenic (all cis 9,12,15-octadecadienoic) acid is about 1.5 times as effective as linoleic acid. Mammals cannotsynthesise fatty acids with double bonds closer than carbon atom 9 from the terminalmethyl group. Such acids have to be supplied in the diet. Linoleic acid (18:2n-6) and�-linolenic acid (18:3 n-3) are thus dietary essentials.Arachidonic acid is synthesisedin the body from linoleic acid. However, one of the steps in the synthesis, a �-6 desat-uration, is rate-limiting and production may be slow and an exogenous supply advan-tageous (see Box 3.1). Linoleic and �-linolenic acids are referred to as the essentialfatty acids (EFA). Like other polyunsaturated acids, they form part of various mem-branes and play a part in lipid transport and certain lipoprotein enzymes. In addition,they are the source materials for the synthesis of the eicosanoids. These include theprostaglandins, thromboxanes and leukotrienes, hormone-like substances that regulate
Table 3.3 Symptoms associated with essential fatty acid deficiencies
Growth retardationIncreased permeability to water and increased water consumptionIncreased susceptibility to bacterial infectionsSterilityLess stable biomembranesCapillary fragilityKidney damage, haematuria and hypertensionDecreased visual acuityDecreased myocardial contractilityDecreased ATP synthesis in liver and heartDecreased nitrogen retention

Fats
39
many functions, including blood clotting, blood pressure, smooth muscle contractionand the immune response. They are also the source of other important C20 acids inthe form of eicosapentaenoic (EPA), hydroxy-eicosatrienoic (HETrR) and docosa-hexaenoic (DHA) acids. All are involved in maintaining the fluidity of mammaliancell membranes. EPA is the precursor of the 3-series of prostaglandins and thrombox-anes and the 5-series of leukotrienes. DHA is thought to play an important role inbrain and retinal function, and EPA and HETrR have a modulating effect on the pro-duction of eicosanoids from arachidonic acid. The relationship between the essentialfatty acids and the eicosanoids is illustrated in Fig. 3.2.
The 1- and 3-series prostaglandins are anti-inflammatory and inhibit platelet ag-gregation, whereas the 2-series are pro-inflammatory and pro-aggregatory.The 1- and3-series thromboxanes mildly stimulate platelet aggregation and stimulate the con-traction of respiratory, intestinal and vascular smooth muscle, as do the leukotrienes.The 2-series thromboxanes have a much more powerful action in this respect.
As a general rule, mammals are considered to have an EFA requirement of 3 percent of the energy requirement (3en%) as linoleic acid, although estimates haveranged from 1 per cent to 15 per cent. Estimates for individual species have beenmore specific. Thus, The Nutrient Requirements of Pigs (see Further reading, Chap-ter 12) gives the requirements of pigs under 30 kg liveweight as 3en% as linoleicacid or 2en% as arachidonic acid. For pigs of 30–90 kg, the figures are 1.5en% aslinoleic acid and 1en% as arachidonic acid.
Diet
Linoleic acid
γ-Linolenic acid
Dihomo-γ-Linolenic acid
1-Seriesprostaglandins andthromboxanes3-Series leukotrienes
Arachidonic acid
2-Series prostaglandins,prostacyclins andthromboxanes
α-Linolenic acid
Eicosapentenoic acid
3-Seriesprostaglandins,prostacyclins andthromboxanes3-Series leukotrienes
Fig. 3.2 Relationship between the essential fatty acids and the eicosanoids.
BOX 3.1 Long-chain fatty acid metabolism in cats
Unlike other mammals, cats have a limited �6 desaturase activity. This enzyme is necessary in theconversion of linoleic acid and �-linolenic acid to other physiologically important PUFA such asarachidonic acid, EPA and DHA.The provision of diets deficient in preformed long-chain PUFA butcontaining linoleic acid and �-linolenic acid results in symptoms such as a dry coat, changes inplatelet aggregation and an enlarged fatty liver.The limited �6 desaturase activity can be sufficientfor maintenance and conception in adult cats, but for gestation, lactation and growth a dietary sup-ply of preformed n-6 and n-3 long-chain PUFAs, particularly arachidonic acid, is required.

Chapter 3 Lipids
40
The oilseeds are generally rich sources of linoleic acid, and linseed is a particularlygood source of �-linolenic acid. Pigs and poultry, which normally have considerablequantities of oilseed residues in their diets, will, therefore, receive an adequate supplyof the essential fatty acids.
Ruminant animals are largely dependent on grasses and forages for their nutritionalneeds and are thereby supplied with liberal quantities of linoleic and �-linolenic acids.Although considerable hydrogenation of unsaturated acids to saturated takes place in therumen, with consequent overall reduction of EFA supply (on average 85–95 per cent is lostbetween the mouth and the small intestine), the possibility of ruminants having a defi-ciency is remote.A certain proportion of dietary EFA escapes hydrogenation (approxi-mately 5–15 per cent of dietary intake) and this, allied to very efficient utilisation andconservation of EFA by ruminants, is enough to ensure adequacy under normal condi-tions. EFA deficiency is rare in human beings although, under certain conditions, it doesoccur in infants, elderly people and people taking drugs that inhibit lipid absorption.
Properties of fatsHydrolysis
Fats may be hydrolysed by boiling with alkalis to give glycerol and soaps:
CH2.O.CO.R
CH.O.CO.R + 3KOH
CH2.O.CO.R
CH2OH
CHOH + 3R.COOK
CH2OH
Fat Glycerol Soap
Such a hydrolysis is termed saponification since it produces soaps, which are sodiumand potassium salts of the fatty acids.The process of fat breakdown may take place nat-urally under the influence of enzymes, collectively known as lipases, when it is termedlipolysis.The enzymes may have a certain specificity and preferentially catalyse hydrol-ysis at particular positions in the molecule. Removal of the fatty acid residue attachedto carbon atom 2 of an acylglycerol is more difficult than those at positions 1 and 3.Under natural conditions, the products of lipolysis are usually mixtures of mono- anddiacylglycerols with free fatty acids. Most of these acids are odourless and tasteless, butsome of the lower ones, particularly butyric and caproic, have extremely powerfultastes and smells; when such a breakdown takes place in an edible fat, it may frequentlybe rendered completely unacceptable to the consumer.The lipases are mostly derivedfrom bacteria and moulds, which are chiefly responsible for this type of spoilage, com-monly referred to as rancidity. Extensive lipolysis of dietary fats takes place in the duo-denum and during their absorption from the small intestine. Lipolysis also precedes thehydrogenation of fats in the rumen, and the oxidation of fats in the body.
Oxidation
The unsaturated fatty acids readily undergo oxidation at the carbon atom adjacent tothe double bond to form hydroperoxides:
CH2.CH:CH.CH2.CH2.O2
CH2.CH:CH.CH2.CH2.
OOH

Fats
41
These break down to give shorter-chain products, including free radicals, which thenattack other fatty acids much more readily than does the original oxygen. More freeradicals are produced, with the result that the speed of the oxidation increases expo-nentially. Eventually the concentration of free radicals becomes such that they reactwith each other and the reaction is terminated. Such a reaction, in which the prod-ucts catalyse the reaction, is described as autocatalytic.This particular reaction is anautoxidation. The formation of the free radicals is catalysed by ultraviolet light andcertain metal ions, particularly copper, and the presence of either increases the rateof oxidation dramatically.
The products of oxidation include shorter-chain fatty acids, fatty acid polymers,aldehydes (alkanals), ketones (alkanones), epoxides and hydrocarbons.The acids andalkanals are major contributors to the smells and flavours associated with oxidisedfat, and they significantly reduce its palatability. The potency of these compounds istypified by deca-2,4 dienal, which is detectable in water at concentrations of as littleas 1 in 10 000 million.
Oxidation of saturated fatty acids results in the development of a sweet, heavytaste and smell commonly known as ketonic rancidity. This is due to the presenceof the methyl ketones resulting from the oxidation, which may be represented asfollows:
CH3
CH2
CH2 + O
CH2
CH2
COOH
CH3
CH2 2
CH2
C:O
CH2
COOH
CH3
CH
CH2 + CO2
C:O
CH3
PentanoneCaproic acid
Similar reactions following mould-induced lipolysis are responsible for the char-acteristic flavours of various soft and blue cheeses.
Antioxidants
Natural fats possess a certain degree of resistance to oxidation, owing to the pres-ence of compounds termed antioxidants. These prevent the oxidation of unsatu-rated fats until they themselves have been transformed into inert products. Anumber of compounds have this antioxidant property, including phenols,quinones, tocopherols, gallic acid and gallates. In the European Union, propyl,octyl or dodecyl-gallate, butylated hydroxyanisole, butylated hydroxytoluene andethoxyquin may be added to edible oils as antioxidants in amounts specified in theEC Community Register of Feed Additives 2009. Other substances such as syn-thetic �-, �- and �-tocopherols and various derivatives of ascorbic acid may beused without limit.
The most important naturally occurring antioxidant is vitamin E, which protectsfat by preferential acceptance of free radicals.The possible effects of fat oxidation indiets in which vitamin E levels are marginal are of considerable importance.

Chapter 3 Lipids
42
Hydrogenation
This is the process whereby hydrogen is added to the double bonds of the unsatu-rated acids of a fat, thereby converting them to their saturated analogues. Oleic acid,for example, yields stearic acid:
CH2
(CH2)7
CH + H
CH
(CH2)7
COOH
CH3
(CH2)16
COOH
Oleic acid Stearic acid
H
The process (hardening) is important commercially for producing firm hard fatsfrom vegetable and fish oils in the manufacture of margarine. The hardening resultsfrom the higher melting point of the saturated acids. For the rate of reaction to be prac-ticable, a catalyst has to be used, usually finely divided nickel. Hardening has theadded advantage of improving the keeping quality of the fat, since removal of the dou-ble bonds eliminates the chief centres of reactivity in the material.
Dietary fats consumed by ruminants first undergo hydrolysis in the rumen andthis is followed by progressive hydrogenation of the unsaturated free fatty acids(mainly 18:2 and 18:3 acids) to stearic acid.This helps to explain the apparent anom-aly that, whereas their dietary fats are highly unsaturated, the body fats of ruminantsare highly saturated.
Hydrogenation results in the production not only of saturated acids but also oftrans acids. In addition a redistribution of double bonds within the fatty acid chaintakes place, accounting for the presence in ruminant fats of vaccenic (trans-11,18:1)and elaidic (trans-9,18:1) acids.A similar transformation occurs in the industrial hy-drogenation of plant and fish oils. Partially hydrogenated vegetable oils, for example,commonly contain 3–5 g trans acids/100 g of the total fatty acids, and partially hy-drogenated fish oils about 20 g.
Digestion, absorption and metabolism of the trans acids is comparable with thatof their counterparts. They have higher melting points than their cis analogues andtheir incorporation into ruminant body fats contributes to the hardness of the latter.Trans acids do not possess essential fatty acid activity, but there is evidence thatsome may enter pathways leading to eicosanoid formation and give rise to sub-stances of unknown physiological effects. There is evidence, too, that they decreasethe activity of the desaturases involved in EFA metabolism. However, it would ap-pear that, as long as EFA intake is adequate and trans acids intake is not excessive,they do not have any significant effect on EFA status. Trans fatty acids, particularlythose produced from the partial hydrogenation of vegetable oils (PHVO), have alsobeen associated with an increased risk of cardiovascular disease, cancer, inflamma-tion and type II diabetes. This has led in the USA to the requirement for the transfatty acid content of food to be included on the labelling, with a view to eliminatingtrans fatty acids from the human diet. The profile of trans fatty acids in ruminantproducts is, however, quite different from that of PHVO, and there is evidence that

Glycolipids
43
some of these, such as trans-11, 18:1 (vaccenic acid) and cis-9,trans-11 conjugatedlinoleic acid (rumenic acid), which are found in ruminant milk and meat, have bene-ficial effects on reducing diseases such as cancer and atherosclerosis.
3.3 GLYCOLIPIDS
In these compounds two of the alcohol groups of the glycerol are esterified by fattyacids and the other is linked to a sugar residue. The lipids of grasses and clovers,which form the major part of the dietary fat of ruminants, are predominantly (about60 per cent) galactolipids. Here the sugar is galactose and we have:
O
OH
O
OH
OH
CH2OH
CH2
CHOCOR
CH2OCOR
Galactolipid
Galactolipids
The galactolipids of grasses are mainly of the monogalactosyl type illustrated above,but smaller quantities of the digalactosyl compounds are also present.These have twogalactose residues at the first carbon atom.The fatty acids of the galactosides of grassesand clovers consist largely of linoleic and �-linolenic acids, as shown in Table 3.4.
Rumen microorganisms are able to break down the galactolipids to give galactose,fatty acids and glycerol. Preliminary lipolysis appears to be a prerequisite for thegalactosyl glycerides to be hydrolysed by the microbial galactosidases.
In animal tissues, glycolipids are present mainly in the brain and nerve fibres.Theglycerol of the plant glycolipids is here replaced as the basic unit by the nitrogenousbase sphingosine:
Table 3.4 Fatty acid composition of some forage lipids (g/100 g)
Perennial ryegrass Cocksfoot Red clover White clover Pasture
14:0 2.0 2.0 1.0 1.1 1.716:0 20.9 20.8 15.4 16.8 19.716:1 1.0 1.0 0.1 0.2 0.818:0 4.4 3.1 2.3 1.9 3.518:1 5.1 2.6 2.3 2.1 4.018:2 13.2 15.0 20.8 19.6 15.318:3 51.6 52.8 59.5 59.7 54.1
CH3.(CH2)12.CH:CH.CH.CH.CH2OH
Sphingosine
OHNH2

Chapter 3 Lipids
44
In their simplest form, the cerebrosides, the glycolipids have the amino group ofthe sphingosine linked to the carboxyl group of a long-chain fatty acid and the ter-minal alcohol group to a sugar residue, usually galactose.The typical structure is:
CH3.(CH2)12.CH:CH.CH.CH.CH2
OHNH
O
OCO.R
Sphingosine Galactose
Acid
More complex substances, the gangliosides, are found in the brain.They have theterminal alcohol group linked to a branched chain of sugars with sialic acid as theterminal residue of at least one of the chains.
3.4 PHOSPHOLIPIDS
The role of the phospholipids is primarily as constituents of the lipoprotein com-plexes of biological membranes. They are widely distributed, being particularlyabundant in the heart, kidneys and nervous tissues. Myelin of the nerve axons, forexample, contains up to 55 per cent of phospholipid. Eggs are one of the best animalsources and, among the plants, soya beans contain relatively large amounts. Thephospholipids contain phosphorus in addition to carbon, hydrogen and oxygen.
Phosphoglycerides
These are esters of glycerol in which only two of the alcohol groups are esterified byfatty acids, with the third esterified by phosphoric acid.The parent compound of thephosphoglycerides is, thus, phosphatidic acid, which may be regarded as the simplestphosphoglyceride.
.O.P.O
CH2.O.CO.R1
CH.O.CO.R2
CH2
OH
O
Phosphatidic acid
H
Phosphoglycerides are commonly referred to as phosphatides. In the major biolog-ically important compounds, the phosphate group is esterified by one of several alco-hols, the commonest of which are serine, choline, glycerol, inositol and ethanolamine.The chief fatty acids present are the 16-carbon saturated and the 18-carbon saturatedand monoenoic, although others with 14–24 carbon atoms do occur. The most com-monly occurring phosphoglycerides in higher plants and animals are the lecithins andthe cephalins.

Phospholipids
45
Lecithins
Lecithins have the phosphoric acid esterified by the nitrogenous base choline andare more correctly termed phosphatidylcholines. A typical example would have theformula:
CH2.O.CO.C15H31
CH.O.CO.C17H33
CH2.O. PO3.CH2.CH2.N+(CH3)3
Lecithin
The fatty acid residues at sn-1 are mostly palmitic (16:0) or stearic (18:0) acid.Atsn-2 they are primarily oleic (18:1), linoleic (18:2) or �-linolenic (18:3) acid.
Cephalins
Cephalins differ from the lecithins in having ethanolamine instead of choline andare correctly termed phosphatidylethanolamines. Ethanolamine has the followingformula:
NH2
CH2.CH2OH
The fatty acids at sn-1 are the same as in lecithin, but those at sn-2 are unsatu-rated, mainly linoleic, eicosatetraenoic and docosahexaenoic acid.
Phosphoglycerides are white waxy solids that turn brown when exposed to theair, owing to oxidation followed by polymerisation.When placed in water, the phos-phoglycerides appear to dissolve. However, the true solubility is very low, the appar-ent solubility being due to the formation of micelles.
Phosphoglycerides are hydrolysed by naturally occurring enzymes, the phospho-lipases, which specifically cleave certain bonds within the molecule to release fattyacids, the phosphate ester, the alcohol and glycerol.The release of choline, when fol-lowed by further oxidative breakdown, has been considered to be responsible for thedevelopment of fishy taints by the release of the trimethyl amine group or its oxide;currently these taints are considered to be the result of fat oxidation and not oflecithin breakdown.
The phosphoglycerides combine within the same molecule both the hydrophilic(water-loving) phosphate ester groups and the hydrophobic fatty acid chains. Theyare therefore surface-active and play a role as emulsifying agents in biological sys-tems, for example in the duodenum. Their surface-active nature also explains theirfunction as constituents of various biological membranes.
Sphingomyelins
Sphingomyelins belong to a large group, the sphingolipids, which have sphingosineinstead of glycerol as the parent material.They differ from the cerebrosides in havingthe terminal hydroxyl group linked to phosphoric acid instead of a sugar residue.Thephosphoric acid is esterified by either choline or ethanolamine.The sphingomyelins

Chapter 3 Lipids
46
also have the amino group linked to the carboxyl group of a long-chain fatty acid bymeans of a peptide linkage:
CH3.(CH2)12.CH:CH.CHOH.CH.CH2.O.PO3–.CH2.CH2.N+(CH3)3
NH.CO.R
Sphingosine Phosphoryl choline
Sphingomyelin
Like the lecithins and cephalins, the sphingomyelins are surface-active and areimportant as components of membranes, particularly in nervous tissue. They mayconstitute up to 25 per cent of the total lipid in the myelin sheath that protects thenerve cells, but they are absent from, or present only in very low concentrations in,energy-generating tissue.
Ether phospholipids
Ether phospholipids are glycerol-based but have an alkyl rather than an acyl groupat carbon atom 1, as is the case in the glycerides.Typical are the plasmologens, whichhave a vinyl ether grouping as shown here:
CH2.O.CH:CH.R
CH.O.CO.R
CH2.O.PO3–.CH2.CH2.NH3
+
3.5 WAXES
Waxes are simple, relatively non-polar lipids consisting of a long-chain fatty acidcombined with a monohydric alcohol of high molecular weight. They are usuallysolid at ordinary temperatures. The fatty acids present in waxes are those found infats, although acids lower than lauric acid are very rare; higher acids such as car-naubic (C23H47.COOH) and mellissic (C30H61.COOH) acid may also be present.Themost common alcohols found in waxes are carnaubyl (C24H49.OH) and cetyl(C16H33OH) alcohol.
Natural waxes are usually mixtures of a number of esters. Beeswax is known toconsist of at least five esters, the main one being myricyl palmitate:
Waxes are widely distributed in plants and animals, where they often have a protec-tive function.The hydrophobic nature of the wax coating reduces water losses causedby transpiration in plants, and provides wool and feathers with waterproofing in
C15H31.COOH + C31H63OH : C15H31.COOC31H63 + H2O
Such compounds may form up to 50 per cent of the phospholipids of heart tissue,but their function is unclear.An ether phospholipid called platelet activating factor isa highly potent aggregator of blood platelets.

Steroids
47
animals. Among better-known animal waxes are lanolin, obtained from wool, andspermaceti, a product of marine animals. In plants, waxes are usually included in thecuticular fraction, where they form a matrix in which cutin and suberin are embedded.The term wax is used here in the collective sense and, although true waxes are alwayspresent, the major part is made up of a complex mixture of substances.Alkanes (fromC21 to C37) make up a large proportion of the whole, with odd-chain compounds pre-dominating. Branched-chain hydrocarbons, aldehydes, free fatty acids (from C12 toC36) and various ketols are commonly occurring though minor constituents. Free alco-hols are usually of minor importance but may form up to half of some waxes.
Cutin is a mixture of polymers of C16 and C18 monomers, commonly 16-hydrox-ypalmitic and 10,16-dihydroxypalmitic acids. Phenolic constituents such as para-coumaric and ferulic acids are usually present, but in small amounts only. Suberin isfound in the surfaces of the underground parts of plants and on healed wound sur-faces.The major aliphatic constituents are �-hydroxy acids, the corresponding dicar-boxylic acids and very-long-chain acids and alcohols. There are also substantialamounts of phenolic substances, mainly p-coumaric acid, which form a phenolic coreto which the acids are attached. Both cutin and suberin are highly resistant to break-down and are not of any significant nutritional value.The waxes, too, are resistant tobreakdown and are poorly utilised by animals. Their presence in foods in largeamounts leads to high ether extract figures and may result in the nutritive valuebeing overestimated.
3.6 STEROIDS
The steroids include such biologically important compounds as the sterols, the bileacids, the adrenal hormones and the sex hormones.They have a common structuralunit of a phenanthrene nucleus linked to a cyclopentane ring (Fig. 3.3).
The individual compounds differ in the number and positions of their doublebonds and in the nature of the side chain at carbon atom 17.
Sterols
These have eight to ten carbon atoms in the side chain, an alcohol group at carbonatom 3, but no carbonyl or carboxyl groups.They may be classified into:
■ the phytosterols of plant origin;■ the mycosterols of fungal origin;■ the zoosterols of animal origin.
12
3 54
109
8
6
1112
1314
171615
7
Phenanthrene nucleus
Cyclopentane ring
Fig. 3.3 Basic steroid structural unit.

Chapter 3 Lipids
48
The phytosterols and the mycosterols are not absorbed from the gut and are notfound in animal tissues.
Cholesterol
Cholesterol is a zoosterol that is present in all animal cells. It has a low solubility inwater, about 0.2 mg/100 ml. It is the major sterol in human beings and is important asa constituent of various biological membranes. It is particularly important in themyelinated structures of the brain and central nervous system and may constitute upto 170 g/kg. It is the precursor of the steroid hormones. It is also the precursor of thebile acids.
Normal concentrations in the blood plasma are in the range 1200–2200 mg/l.Some 30 per cent of this is in the free state, the remainder being bound tolipoproteins. These are complexes of proteins and lipids held together by non-co-valent bonds. Each has a characteristic size, molecular weight, chemical composi-tion and density. They are classified on the basis of their density. The five classes,of which one, the chylomicrons, occurs only in the post-absorptive state, areshown in Table 3.5.
In the plasma, the lipoproteins exist as spherical structures with a core of triacyl-glycerols and cholesterol esters.This is surrounded by a shell, about 20 Å thick, con-taining proteins, unesterified cholesterol and phosphatidylcholines. Since they havea greater surface to volume ratio, the smaller particles have a higher protein to lipidratio and are more dense.Thus, the HDLP fraction has about 45 per cent protein and55 per cent lipid, whereas the VLDLP fraction has about 10 per cent protein and90 per cent lipid. Cholesterol is very insoluble and prolonged high levels in blood re-sult in its deposition on the walls of the blood vessels. These deposits eventuallyharden to atherosclerotic plaque. This narrows the blood vessel and serves as a sitefor clot formation and may precipitate myocardial infarction or heart attack.
There is strong evidence that the risk of coronary heart disease is directly relatedto the plasma concentration of LDL-cholesterol and inversely related to that ofHDL-cholesterol, and that the risk is reduced significantly by lowering elevatedserum cholesterol levels. It has been known for many years that one of the most im-portant dietary factors regulating serum cholesterol levels is the ratio of polyunsatu-rated fatty acids (PUFA) to saturated fatty acids (SFA). The SFA increase and thePUFA decrease cholesterol levels, except for the trans PUFA, which have a similareffect to the SFA.A ratio of 0.5–0.9 SFA : PUFA is considered to be satisfactory. It is
Table 3.5 Density-based classes of lipoproteins
Class Density (g/ml) Molecular weight Diameter (Å)
(daltons)
High-density lipoproteins 1.063–1.210 4–2 * 105 50–130 (HDLP)Low-density lipoproteins 1.019–1.063 2 * 106 200–280 (LDLP)Intermediate-density
lipoproteins (IDLP) 1.006–1.019 4.5 * 106 250Very low-density
lipoproteins (VLDLP) 0.95–1.006 5 * 106–107 250–750Chylomicrons <0.95 109–1010 103–104

Steroids
49
important to appreciate that the different families of PUFA affect lipid metabolism indifferent ways.Thus, the �-6 acids significantly decrease serum cholesterol levels andhave a minor effect only on triacylglycerol levels, whereas the �-3 acids have aminor effect on serum cholesterol but significantly lower triacylglycerol levels.This isimportant in the light of recent evidence that high serum triacylglycerol level per seis an important risk factor in coronary heart disease.The �-3 acids are the precursorsof the 3-series of prostaglandins and thromboxanes. The former strongly inhibitplatelet aggregation and the latter are weakly pro-aggregating.The �-6 acids are pre-cursors of the 2-series of prostaglandins and thromboxanes, the former beingstrongly pro-aggregating and the latter weakly anti-aggregating. On balance, fromthis point of view, the �-3 acids may be regarded as having a more beneficial effectthan the �-6 acids.They have a further beneficial effect in that they inhibit the trans-formation of the �-6 acids to their eicosanoid products.
7-Dehydrocholesterol
This substance, which is derived from cholesterol, is important as the precursorof vitamin D3, which is produced when the sterol is exposed to ultraviolet light(Fig. 3.4).
C8H17CH3
CH3
OH
CH2
OH
CH3
C8H17
7-Dehydrocholesterol Cholecalciferol (vitamin D3)
Fig. 3.4 Formation of vitamin D3.
This is a good illustration of how relatively small changes in chemical structuremay bring about radical changes in physiological activity.
Ergosterol
This phytosterol is widely distributed in brown algae, bacteria and higher plants. It isimportant as the precursor of ergocalciferol or vitamin D2, into which it is convertedby ultraviolet irradiation.The change is the same as that which takes place in the for-mation of vitamin D3 from 7-dehydrocholesterol and involves opening of the secondphenanthrene ring.
Bile acids
The bile acids have a five-carbon side chain at carbon atom 17 which terminates in acarboxyl group bound by an amide linkage to glycine or taurine (Fig. 3.5).

Chapter 3 Lipids
50
The bile acids are synthesised from cholesterol and this constitutes the major endpoint of cholesterol metabolism. Under physiological conditions the acids exist assalts.They are produced in the liver, stored in the gall bladder and secreted into theupper small intestine.They are important in several ways:
■ They provide the major excretory pathway for cholesterol, which cannot becatabolised to carbon dioxide and water by mammals. Bile contains high concen-trations of free cholesterol, about 390 mg/100 ml.
■ The bile salts assist, along with the detergent action of phospholipids, in prevent-ing the cholesterol in the bile fluid from crystallising out of solution.
■ They act as emulsifying agents in preparing dietary triacylglycerols for hydrolysis,by pancreatic lipase, in the process of digestion.
■ They may have a role in activating pancreatic lipase.■ They facilitate the absorption, from the digestive tract, of the fat-soluble vitamins.
Steroid hormones
These include the female sex hormones (oestrogens), the male sex hormones (andro-gens) and progesterone, as well as cortisol, aldosterone and corticosterone, which areproduced in the adrenal cortex.The adrenal hormones have an important role in thecontrol of glucose and fat metabolism.
OH
CH3
OH
OH CH.(CH2)2.C.N.CH2.COOH
CH3 O H
Fig. 3.5 Glycocholic acid.
3.7 TERPENES
Terpenes are made up of a number of isoprene units linked together to form chainsor cyclic structures. Isoprene is a five-carbon compound with the following structure:
CH2:C.CH:CH2
CH3
Isoprene
Many terpenes found in plants have strong characteristic odours and flavours andare components of essential oils such as lemon or camphor oil. The word ‘essential’is used to indicate the occurrence of the oils in essences and not to imply that theyare required by animals. Among the more important plant terpenes are the phytol

Questions
51
SUMMARY
1. Lipids are a group of substances that areinsoluble in water but soluble in commonorganic solvents. They include the fats andoils, the glycolipids, the phospholipids, thelipoproteins, the steroids and the terpenes.
2. Fats and oils are major sources of stored en-ergy in both plants and animals. They are es-ters of fatty acids with glycerol. Their physicaland chemical nature is determined by theirfatty acid composition; high-molecular-weight saturated acids confer chemical stabil-ity and physical hardness, whereasunsaturated acids confer chemical reactivityand physical softness.
3. Linoleic and linolenic acids are termed the es-sential fatty acids, although only linoleic acidis considered truly a dietary essential. Theyare the source materials of the eicosanoids,which include the prostaglandins, the throm-boxanes and the leukotrienes.
4. Phospholipids are phosphorus-containingcompounds based on fatty acids esterifiedwith glycerol or a nitrogenous base. They areimportant as constituents of the lipoproteincomplexes of biological membranes.
5. Waxes are mixtures of esters of high-molecular-weight fatty acids with high-molecular-weight alcohols. They are chemically inert,have little or no nutritive value, and aremainly protective in function.
6. The steroids have a basic structural unit of aphenanthrene nucleus linked to a cyclopen-tane ring. They include the sterols, the bileacids and the adrenal and sex hormones.
7. Cholesterol is the precursor of many sterols. Itis present in all animal cells and is particularlyimportant in the myelinated structures of thebrain and nervous tissue. There is strong evi-dence that the risk of coronary heart diseaseis directly related to the concentration of low-density lipoprotein cholesterol in the blood.
8. 7-Dehydrocholesterol and ergosterol are im-portant as the precursors of vitamins D3 andD2, respectively.
9. The lipids in the form of triacylglycerols,cholesterol esters, low-density lipoproteinsand the lipid-derived eicosanoids are inti-mately involved in the aetiology of heartdisease.
QUESTIONS
3.1 Discuss how the structure of an individual fatty acid affects its function withinthe body of domesticated animals.
3.2 Discuss the difference in structure and function between triglycerides, phos-phoglycerides and sphingomyelins in animal tissues.
3.3 Discuss why the diet of ruminants is generally high in polyunsaturated fattyacids, and yet ruminant meat and milk are generally low in polyunsaturatedfatty acids and high in saturated fatty acids.
3.4 Discuss the role and function of steroids in the body of domesticatedanimals.
moiety of chlorophyll, the carotenoid pigments, plant hormones such as giberellicacid and vitamins A, E and K. In animals, some of the coenzymes, including those ofthe coenzyme Q group, are terpenes.

Chapter 3 Lipids
52
FURTHER READING
Garton G A 1969 Lipid metabolism of farm animals. In: Cuthbertson D P (ed.) Nutrition ofAnimals of Agricultural Importance, Oxford, Pergamon Press.
Harwood J L 1997 Plant lipid metabolism. In: Dey P M and Harborne J (eds) Plant Biochem-istry, London,Academic Press.
Palmquist D L 1988 The feeding value of fats. In: Ørskov E R (ed.) World Animal Science,Amsterdam, Elsevier.
Devlin T M (ed.) 2002 Textbook of Biochemistry with Clinical Correlations, 5th edn, NewYork,Wiley-Liss.

53
4.1 Proteins
4.2 Amino acids
4.3 Peptides
4.4 Structure of proteins
4.5 Properties of proteins
4.6 Classification of proteins
4.7 Nucleic acids
4.8 Other nitrogenous compounds
4.9 Nitrates
4.10 Alkaloids
4 Proteins, nucleic acids and othernitrogenous compounds
4.1 PROTEINS
Proteins are complex organic compounds of high molecular weight. In common withcarbohydrates and fats they contain carbon, hydrogen and oxygen, but in additionthey all contain nitrogen and generally sulphur.
Proteins are found in all living cells, where they are intimately connected with allphases of activity that constitute the life of the cell. Each species has its own specificproteins, and a single organism has many different proteins in its cells and tissues. Itfollows therefore that a large number of proteins occur in nature.
4.2 AMINO ACIDS
Amino acids are produced when proteins are hydrolysed by enzymes, acids or alka-lis. Although over 200 amino acids have been isolated from biological materials,only 20 of these are commonly found as components of proteins.
Amino acids are characterised by having a basic nitrogenous group, generally anamino group (–NH2), and an acidic carboxyl unit (–COOH). Most amino acids oc-curring naturally in proteins are of the � type, having the amino group attached to

Chapter 4 Proteins, nucleic acids and other nitrogenous compounds
54
The exception is proline, which has an imino (–NH) instead of an amino group.The nature of the R group, which is referred to as the side chain, varies in differentamino acids. It may simply be a hydrogen atom, as in glycine, or it may be a morecomplex radical containing, for example, a phenyl group.
The chemical structures of the 20 amino acids commonly found in natural proteinsare shown in Table 4.1.
Special amino acids
Some proteins contain special amino acids that are derivatives of common aminoacids. For example, collagen, the fibrous protein of connective tissue, contains hy-droxyproline and hydroxylysine, which are the hydroxylated derivatives of prolineand lysine, respectively.
C
COOH
HR
NH2
Two iodine derivatives of tyrosine, triiodothyronine and tetraiodothyronine(thyroxine), act as important hormones in the body and are also amino acid compo-nents of the protein thyroglobulin (see p. 127).
NH2CHCOOH
CH2
CH2
CHOH
CH2NH2
CH
CH2NH
CH
CH2
COOH
HO
Hydroxyproline Hydroxylysine
C
H
CH2
NH2
COOHO
I
II
HO
Triiodothyronine
the carbon atom adjacent to the carboxyl group, and can be represented by thegeneral formula:

Amino acids
55
Aspartic acid
Asparagine
Glutamic acidNH2CHCOOH
CH2
COOH
NH2CHCOOH
CH2
CH2
COOH
Glutamine NH2CHCOOH
CH2
CH2
CO NH2
NH2CHCOOH
CH2
CO NH2
Table 4.1 Amino acids commonly found in proteins
Monoamino-monocarboxylic acids
Sulpur-containing amino acids
Monoamino-dicarboxylic acids and their amine derivatives
NH2CHCOOH
CH2OH
NH2CHCOOH
CH3
HCOH
CH3
NH2CHCOOH
NH2CHCOOH
CH
CH3 CH3
NH2CHCOOH
CH2
CH
CH3 CH3
NH2CHCOOH
CH
CH2 CH3
CH3
Glycine
Alanine
Valine
Threonine
Isoleucine
SerineNH2CH2COOH
Leucine
Cysteine Methionine NH2CHCOOH
CH2
CH2
S
CH3
NH2CHCOOH
CH2SH

Chapter 4 Proteins, nucleic acids and other nitrogenous compounds
56
Basic amino acids
Aromatic and heterocyclic amino acids
Lysine
Arginine
HistidineNH2CHCOOH
CH2
CH2
CH2
CH2NH2
NH2CHCOOH
CH2
C
HC
NH
N
CH
(CH2)3
NH
NH2CHCOOH
N
NH2
NH
Phenylalanine
Tryptophan
Tyrosine
Proline
NH2CHCOOH
CH2
NH2CHCOOH
CH2
OH
COOHCHCH2HC
HCCH
C
CCH
NH
CH
C
NH2
CH2
CH2NH
CH
CH2
COOH
Table 4.1 Continued

C
NH3+
COO–
HR
Amino acids
57
A derivative of glutamic acid, γ-carboxyglutamic acid, is an amino acid present inthe protein thrombin.This amino acid is capable of binding calcium ions and plays animportant role in blood clotting (see p. 86).
NH2CHCOOH NH2CHCOOH
CH2SSCH2
Cystine
C
H
CH2
NH2
COOHO
I
II
HO
I
Tetraiodothyronine (thyroxine)
NH2CH2CH2CH2COOH
γ-Aminobutyric acid
NH2CHCOOH
CH2
CH
HOOC COOH
γ-Carboxyglutamic acid
The amino acid γ-aminobutyric acid functions in the body as a neurotransmitter.It is also found in silage as a fermentation product of glutamic acid (see p. 502).
The sulphur-containing amino acid cysteine also requires special mention. It mayoccur in protein in two forms, either as itself or as cystine, in which two cysteinemolecules are joined together by a disulphide bridge:
Properties of amino acids
Because of the presence of an amino group and a carboxyl group, amino acids areamphoteric, i.e. they have both basic and acidic properties. Molecules such as these,with basic and acidic groups, may exist as uncharged molecules, or as dipolar ionswith opposite ionic charges, or as a mixture of these.Amino acids in aqueous solutionexist as dipolar ions or zwitter ions (from the German Zwitter, a hermaphrodite):
Chapter 4 Proteins, nucleic acids and other nitrogenous compounds
58
C
COOH
R
NH2H C
COOH
R
HNH2
D-Amino acid L-Amino acid
In a strongly acid solution an amino acid exists largely as a cation, while in alka-line solution it occurs mainly as an anion. There is a pH value for a given aminoacid at which it is electrically neutral; this value is known as the isoelectric point.Because of their amphoteric nature, amino acids act as buffers, resisting changesin pH.
All the α-amino acids except glycine are optically active. As with the carbohy-drates (see Chapter 2), amino acids can take two mirror image forms, D- and L-.
All the amino acids involved in protein structure have an L-configuration ofthe carbon atom. If supplied in the D-form, some amino acids can be converted tothe L-form by deamination of the amino acid to the keto acid and reamination to theL-form (see Chapter 9).
Essential amino acids
Plants and many microorganisms are able to synthesise proteins from simple nitroge-nous compounds such as nitrates.Animals cannot synthesise the amino group, and inorder to build up body proteins they must have a dietary source of amino acids. Cer-tain amino acids can be produced from others by a process known as transamination(see Chapter 9), but the carbon skeletons of a number of amino acids cannot be syn-thesised in the animal body; these are referred to as essential or indispensible aminoacids.
Most of the early work in determining which amino acids could be classed as es-sential was carried out with rats fed on purified diets. The following ten essentialamino acids are required for growth in the rat:
Arginine MethionineHistidine PhenylalanineIsoleucine ThreonineLeucine TryptophanLysine Valine
The chick requires a dietary supply of the ten amino acids listed above but in ad-dition needs a dietary source of glycine. Birds require arginine because their metab-olism does not include the urea cycle (see Chapter 9), which would normally supplythis amino acid. The list of essential amino acids required by the pig is similar tothat for the rat, with the exception of arginine, which can be synthesised by the pig.It has been reported that rapidly growing animals may respond to arginine becausethe very active metabolism of the liver results in little of the amino acid being avail-able to the general circulation. Cats require a dietary supply of arginine, owing totheir limited ability to synthesise ornithine from glutamate, and a deficiency of argi-nine results in the accumulation of ammonia from denatured amino acids in theblood. Cats also require the β-sulphonic amino acid taurine in their diet as they are

Peptides
59
unable to synthesise this from cysteine.Taurine is required for bile acid conjugation(see p. 49). Poultry have a limited capacity to synthesise proline.The actual dietaryrequirement of certain essential amino acids is dependent upon the presence ofother amino acids. For example, the requirement for methionine is partially de-pendent on the cysteine content of the diet (see p. 312).
In the case of the ruminant, all the essential amino acids can be synthesised bythe rumen microorganisms, which theoretically makes this class of animal inde-pendent of a dietary source once the rumen microorganisms have become estab-lished. However, the supply of amino acids from microbial protein is limiting inquantity and quality for maximum rates of growth in young animals and for maxi-mum milk production.The biological value (see Chapter 13) of microbial protein islimited by its content of certain essential amino acids, particularly lysine and me-thionine. For maximum productivity the microbial protein must be supplementedwith a supply of dietary amino acids, from foods or synthetic amino acids, in asuitable form that is not degraded by the microorganisms in the rumen (seeChapter 8).
This type of linkage is known as the peptide linkage; in the example shown, adipeptide has been produced from two amino acids. Large numbers of amino acidscan be joined together by this means, with the elimination of one molecule of waterat each linkage, to produce polypeptides.
Besides being important building blocks in the construction of proteins, somepeptides possess their own biological activity. Milk, in particular, is a source of manybiologically active peptides.The enzymatic hydrolysis of the milk protein casein re-leases opioid peptides, which have pharmacological activities such as analgesia andsleep-inducing effects. Other peptides derived from casein are involved in calciumflow in tissues and modification of the immune system response. Other milk peptides
H N C
R
H
C
H O
OH + H N C C OH
H R1 O
H
H N C
R
H
C
H O
N C
H R1
C
H
OH + H2O
O
4.3 PEPTIDES
Peptides are built up from amino acids by means of a linkage between the α-carboxylof one amino acid and the α-amino group of another acid, as shown here:

Chapter 4 Proteins, nucleic acids and other nitrogenous compounds
60
stimulate growth of desirable bacteria and suppress harmful bacteria, and some actas growth factors for intestinal cells.
Other peptides, including bombesin, enterostatin, glucagon and leptin, are impor-tant in the control of food intake.
Peptides play an important role in the flavour and sensory properties of foodssuch as yeast extract, cheese and fruit juices.
C
NC
HR
HO
N
C
RH
C
N
H
C
HR
C
O
O H
H O
N C
C C N
C
HHR
H R
C
OO
C
RH
N
H
Fig. 4.1 Configuration of polypeptide chain. Dotted lines represent possiblehydrogen bonds.
4.4 STRUCTURE OF PROTEINS
For convenience the structure of proteins can be considered under four basicheadings.
Primary structure
The sequence of amino acids along the polypeptide chain of a protein, as describedabove, is called the primary structure of the protein.
Secondary structure
The secondary structure of proteins refers to the conformation of the chain of aminoacids resulting from the formation of hydrogen bonds between the imino and car-bonyl groups of adjacent amino acids, as shown in Fig. 4.1.
The secondary structure may be regular, in which case the polypeptide chainsexist in the form of an α-helix or a β-pleated sheet, or it may be irregular and existas, for example, a random coil.
Tertiary structure
The tertiary structure describes how the chains of the secondary structure further in-teract through the R groups of the amino acid residues.This interaction causes fold-ing and bending of the polypeptide chain, the specific manner of the folding givingeach protein its characteristic biological activity.

Classification of proteins
61
Quaternary structure
Proteins possess quaternary structure if they contain more than one polypeptidechain.The forces that stabilise these aggregates are hydrogen bonds and electrostaticor salt bonds formed between residues on the surfaces of the polypeptide chains.
4.5 PROPERTIES OF PROTEINS
All proteins have colloidal properties; they differ in their solubility in water, rangingfrom insoluble keratin to albumins, which are highly soluble. Soluble proteins can beprecipitated from solution by the addition of certain salts such as sodium chloride orammonium sulphate. This is a physical effect and the properties of the proteins arenot altered. On dilution the proteins can easily be redissolved.
Although the amino and carboxyl groups in the peptide linkage are non-functional in acid–base reactions, all proteins contain a number of free amino andcarboxyl groups, either as terminal units or in the side chain of amino acid residues.Like amino acids, proteins are therefore amphoteric.They exhibit characteristic iso-electric points and have buffering properties.
All proteins can be denatured or changed from their natural state. Denaturationhas been defined by Neurath and coworkers as ‘any non-proteolytic modification ofthe unique structure of a native protein, giving rise to definite changes in chemical,physical or biological properties’. Products of protein hydrolysis are not includedunder this term. Several agents can bring about denaturation of proteins; theseinclude heat, acids, alkalis, alcohols, urea and salts of heavy metals. The effect ofheat on proteins is of special interest in nutrition as this results in new linkageswithin and between peptide chains. Some of these new linkages resist hydrolysis byproteases produced in the digestive tract and impede their access to adjacent pep-tide bonds.
Susceptibility of proteins to heat damage is increased in the presence of variouscarbohydrates, owing to the occurrence of Maillard-type reactions, which initially in-volve a condensation between the carbonyl group of a reducing sugar with the freeamino group of an amino acid or protein. Lysine is particularly susceptible.With in-creasing severity of heat treatment, further reactions involving protein side chainscan occur and result in the browning of foods. The dark coloration of overheatedhays and silages is symptomatic of these types of reaction.
4.6 CLASSIFICATION OF PROTEINS
Proteins may be classified into two main groups: simple proteins and conjugatedproteins.
Simple proteins
These proteins produce only amino acids on hydrolysis. They are subdivided intotwo groups, fibrous and globular proteins, according to shape, solubility and chemi-cal composition.

Chapter 4 Proteins, nucleic acids and other nitrogenous compounds
62
Fibrous proteins
These proteins, which in most cases have structural roles in animal cells and tissues,are insoluble and are very resistant to animal digestive enzymes.They are composedof elongated filamentous chains joined together by cross-linkages. The group in-cludes collagens, elastin and keratins.
Collagens are the main proteins of connective tissues and constitute about 30 percent of the total proteins in the mammalian body. As mentioned earlier (p. 54), theamino acid hydroxyproline is an important component of collagen. Hydroxylationof proline to hydroxyproline involves vitamin C; if this vitamin is deficient, collagenfibres are weakened and may give rise to gum and skin lesions (see p. 100). The in-dispensable amino acid tryptophan is not found in these proteins.
Elastin is the protein found in elastic tissues such as tendons and arteries. Thepolypeptide chain of elastin is rich in alanine and glycine and is very flexible. It con-tains cross-links involving lysine side chains, which prevent the protein from extend-ing excessively under tension and allow it to return to its normal length whentension is removed.
Keratins are classified into two types. The α-keratins are the main proteins ofwool and hair. The β-keratins occur in feathers, skin, beaks and scales of most birdsand reptiles. These proteins are very rich in the sulphur-containing amino acid cys-teine; wool protein, for example, contains about 4 per cent of sulphur (see p. 373).
Globular proteins
Globular proteins are so called because their polypeptide chains are folded into com-pact structures.The group includes all the enzymes, antigens and those hormones thatare proteins. Its first subgroup, albumins, are water-soluble and heat-coagulable andoccur in milk, the blood, eggs and many plants. Histones are basic proteins that occur incell nuclei, where they are associated with DNA (see p. 64).They are soluble in salt so-lutions, are not heat-coagulable, and on hydrolysis yield large quantities of arginine andlysine. Protamines are basic proteins of relatively low molecular weight, which are as-sociated with nucleic acids and are found in large quantities in the mature male germcells of vertebrates. Protamines are rich in arginine but contain no tyrosine, tryptophanor sulphur-containing amino acids. Globulins occur in milk, eggs and blood, and are themain reserve protein in many seeds.
Conjugated proteins
Conjugated proteins contain, in addition to amino acids, a non-protein moietytermed a prosthetic group. Some important examples of conjugated proteins are gly-coproteins, lipoproteins, phosphoproteins and chromoproteins.
Glycoproteins are proteins with one or more heteroglycans as prostheticgroups. In most glycoproteins the heteroglycans contain a hexosamine, either glu-cosamine or galactosamine or both; in addition, galactose and mannose may alsobe present. Glycoproteins are components of mucous secretions, which act as lu-bricants in many parts of the body.The storage protein in egg white, ovalbumin, isa glycoprotein.
Lipoproteins, which are proteins conjugated with lipids such as triacylglycerolsand cholesterol, are the main components of cell membranes and are also the formin which lipids are transported in the bloodstream to tissues, either for oxidation or

Nucleic acids
63
for energy storage. They can be classified into five main categories in increasingorder of density: chylomicrons, very-low-density lipoproteins (VLDL), low-densitylipoproteins (LDL), intermediate-density lipoproteins (IDL) and high-density lipopro-teins (HDL) (see Chapter 3).
Phosphoproteins, which contain phosphoric acid as the prosthetic group, includethe caseins of milk (see p. 406) and phosvitin in egg yolk.
Chromoproteins contain a pigment as the prosthetic group. Examples are haemo-globin and cytochromes, in which the prosthetic group is the iron-containing com-pound haem, and flavoproteins, which contain flavins (see p. 90).
Adenine and guanine are the principal purine bases present in nucleic acids.
N
N
NH
N
O
NH2
HN
NH
O
CH3
O
HN
NH
O
O
Pyrimidine
Cytosine Thymine Uracil
N
N
N
NH
N
N
N
NH
NH2
HN
N
N
NHH2N
O
Purine Adenine Guanine
4.7 NUCLEIC ACIDS
Nucleic acids are high-molecular-weight compounds that play a fundamental role inliving organisms as a store of genetic information; they are the means by which thisinformation is utilised in the synthesis of proteins. On hydrolysis, nucleic acids yielda mixture of basic nitrogenous compounds (purines and pyrimidines), a pentose (ri-bose or deoxyribose) and phosphoric acid.
The main pyrimidines found in nucleic acids are cytosine, thymine and uracil.Therelationships between these compounds and the parent material, pyrimidine, areshown below:

Chapter 4 Proteins, nucleic acids and other nitrogenous compounds
64
The compound formed by linking one of the above nitrogenous compounds to apentose is termed a nucleoside. For example:
If nucleosides such as adenosine are esterified with phosphoric acid they formnucleotides, e.g. adenosine monophosphate (AMP):
Nucleic acids are polynucleotides of very high molecular weight, generallymeasured in several millions. A nucleotide containing ribose is termed ribonucleicacid (RNA), while one containing deoxyribose is referred to as deoxyribonucleicacid (DNA).
The nucleotides are arranged in a certain pattern; DNA normally consists of adouble-strand spiral or helix (Fig. 4.2). Each strand consists of alternate units of thedeoxyribose and phosphate groups.Attached to each sugar group is one of the fourbases, cytosine, thymine, adenine or guanine.The bases on the two strands of the spi-ral are joined in pairs by hydrogen bonds, the thymine on one strand always beingpaired with the adenine on the other and the cytosine with the guanine. The se-quence of bases along these strands carries the genetic information of the living cell(see p. 217). DNA is found in the nuclei of cells as part of the chromosome structure.
There are several distinct types of ribonucleic acid, which are defined in terms ofmolecular size, base composition and functional properties.They differ from DNA in
N
N
N
NH
NH2
CH
OH
H
CH2OH
OH OH
H CC
C
H
O
CHH
CH2OH
OH OH
H CC
C
H
O
N
N
N
N
NH2
H2O+ +
Adenine D-Ribose Adenosine
CHH
OH OH
H CC
C
H
OH2O3POCH2
N
N
N
N
NH2

Fig. 4.2 Diagrammatic representation of part of the ladder-like DNA molecule,showing the two strands of alternate phosphate (P) and deoxyribose (D) molecules.The horizontal rods represent the pairs of bases held by hydrogen bonds (representedby dotted lines).
A = adenine, T = thymine, C = cytosine, G = guanine.
Nucleic acids
65
P
D
CP
DA
P
DG
P
D
TP
DA
P
P
D
PG
D
T P
D
C P
D
A
P
D
TP
the nature of their sugar moiety and also in the types of nitrogenous base present.RNA contains the pyrimidine uracil in place of thymine.There is evidence to indicatethat unlike DNA, most RNA molecules exist in the form of single, folded chainsarranged spirally.There are three main forms of RNA, termed messenger RNA, ribo-somal RNA and transfer RNA. The functions of these three forms of RNA are dealtwith in the protein synthesis section of Chapter 9.
Apart from their importance in the structure of nucleic acids, nucleotides existfree as monomers and many play an important role in cellular metabolism.
Although nucleotides are synthesised de novo it appears that this synthesis is notalways adequate. In such cases (abrupt early weaning of piglets and times of diseasechallenge) a dietary supply augments the natural synthesis and enhances immunefunction and the proliferation of cells.
Reference has been made previously to the phosphorylation of adenosine to formadenosine monophosphate (AMP). Successive additions of phosphate residues giveadenosine diphosphate (ADP) and then the triphosphate (ATP). The importance ofATP in energy transformations is described in Chapter 9.
Chapter 4 Proteins, nucleic acids and other nitrogenous compounds
66
Table 4.2 Some important amines and their parent amino acids
Amino acid Amine
Arginine PutrescineHistidine HistamineLysine CadaverinePhenylalanine PhenylethylamineTyrosine TyramineTryptophan Tryptamine
4.8 OTHER NITROGENOUS COMPOUNDS
A considerable variety of nitrogen-containing compounds, other than proteins andnucleic acids, occur in plants and animals. In plants, free amino acids are usuallypresent; those in greatest amount include glutamic acid, aspartic acid, alanine, ser-ine, glycine and proline. Other compounds are nitrogenous lipids, amines, amides,purines, pyrimidines, nitrates and alkaloids. In addition, most members of the vita-min B complex contain nitrogen in their structure.
It is impossible to deal with these compounds in any detail here, and only some ofthe important ones not previously mentioned will be discussed.
Amines
Amines are basic compounds present in small amounts in most plant and animal tis-sues. Many occur as decomposition products in decaying organic matter and havetoxic properties.
A number of microorganisms are capable of producing amines by decarboxyla-tion of amino acids (Table 4.2). These may be produced in the rumen under certainconditions and can occur in fermented foods such as cheese, wine, sauerkraut andsausage. They are termed biogenic amines and may give rise to physiological symp-toms; histamine, for example, is an amine formed from the amino acid histidine and incases of anaphylactic shock is found in the blood in relatively large amounts. Hista-mine has also been implicated in dietary-induced migraine. Silages in which clostridiahave dominated the fermentation usually contain appreciable amounts of amines (seeChapter 19).
In contrast to the harmful biogenic amines, the polyamines putrescene, spermi-dine and spermine are necessary for optimal growth and function of cells. They areinvolved in DNA, RNA and protein synthesis, regulation of gene expression, enzymeactivity, cell proliferation and cell signalling.
Several metabolic pathways (e.g. lipid metabolism, creatine and carnitine synthe-sis) require methyl groups and these can be supplied by choline or methionine. Dur-ing the process of transmethylation, betaine, a tertiary amine, is formed by theoxidation of choline. Betaine can be added to the diet to act as a more direct supplyof methyl groups, thus sparing choline for its other functions of lecithin and acetyl-choline formation, and methionine for protein synthesis. Betaine occurs in sugar beet,

Nitrates
67
and the young leaves may contain about 25 g/kg; it is this amine that is responsiblefor the fishy aroma frequently associated with the commercial extraction of sugarfrom beet. In the animal body, betaine may be transformed into trimethylamine, andit is this that gives the fishy taint to milk produced by cows that have been given ex-cessive amounts of sugar beet by-products.
Amides
Asparagine and glutamine are important amide derivatives of the amino acids asparticacid and glutamic acid. These two amides are also classed as amino acids (Table 4.1)and occur as components of proteins.They also occur as free amides and play an im-portant role in transamination reactions.
Urea is an amide that is the main end product of nitrogen metabolism in mam-mals, but it also occurs in many plants and has been detected in wheat, soya bean,potato and cabbage.
In humans and other primates, uric acid is the end product of purine metabolismand is found in the urine. In subprimate mammals the uric acid is oxidised toallantoin before being excreted.
In birds, uric acid is the principal end product of nitrogen metabolism and thuscorresponds, in its function, to urea in mammals.
C
NH2
ONH2
Urea
N
NH
NH
HN
O
O
OH2N
NH
CO
NH
HN
O
O
H
Uric acid Allantoin
4.9 NITRATES
Nitrates may be present in plant materials and, whereas nitrate itself may not betoxic to animals, it is reduced readily under favourable conditions, as in the rumen,to nitrite, which is toxic. Oat hay poisoning is attributed to the relatively largeamounts of nitrate present in green oats.
Quite high levels of nitrate have been reported in herbage given heavy dressingsof nitrogenous fertilisers (see Chapter 18).

Chapter 4 Proteins, nucleic acids and other nitrogenous compounds
68
Table 4.3 Some important alkaloids occurring in plants
Name Source
Coniine HemlockNicotine TobaccoRicinine Castor plant seedsAtropine Deadly nightshadeCocaine Leaves of coca plantJacobine RagwortQuinine Cinchona barkStrychnine Seeds of NuxvomicaMorphine Dried latex of opium poppySolanine Unripe potatoes and potato sprouts
SUMMARY
1. Proteins are complex organic compounds ofhigh molecular weight containing carbon,hydrogen, oxygen, nitrogen and generallysulphur.
2. Proteins are made up from a pool of 20amino acids, about ten of which are essential(indispensable) for non-ruminants.
3. Amino acids join together by a peptide link-age between the �-carboxyl group of oneacid and the �-amino group of another.
4. The primary structure of a protein refers tothe sequence of amino acids in the polypep-tide chain; the conformation of the chain asa result of hydrogen bonding is the second-ary structure; folding of the chain gives thetertiary structure; the quaternary structurerefers to the configuration of those pro-teins with more than one polypeptidechain.
5. Proteins have colloidal properties and can bedenatured by heat, creating new linkages be-tween the chains, some of which are resistantto hydrolysis.
6. Proteins may be simple, either fibrous orglobular, or conjugated to a non-proteinmolecule.
7. Nucleic acids act as a store of genetic informa-tion when arranged to form DNA and RNA.
8. Amines are derivatives of amino acids andsome possess physiological activity.
9. Urea is an important member of the amidegroup of compounds.
10. Nitrate is converted to the toxic nitrite in therumen.
11. Alkaloids are poisonous nitrogen-containingcompounds formed by some plants and fungi.
4.10 ALKALOIDS
These compounds are of particular interest since many of them have poisonousproperties. In plants, their presence is restricted to a few orders of the dicotyle-dons. A number of the more important alkaloids, with their sources, are listed inTable 4.3. The alkaloid in ragwort, for example, attacks the liver and much ofthis organ can be destroyed before symptoms appear. Another nutritionally signif-icant source of alkaloids is the fungus ergot, which grows on cereal grains (seeChapter 22).

Further reading
69
FURTHER READING
Creighton T E 1992 Proteins: Structures and Molecular Properties, 2nd edn, Oxford, W HFreeman.
D’Mello J P F 1995 Amino Acids in Animal Nutrition,Wallingford, CABI.
Horton H R, Moran L A, Ochs R S, Rawn J D and Scrimgeour K G 1993 Principles ofBiochemistry, Englewood Cliffs, NJ, Prentice Hall.
Lehninger A L, Nelson D L and Cox M M 1993 Principles of Biochemistry, 2nd edn, New York,Worth.
Mathews C K and van Holde K E 1990 Biochemistry, Redwood City, CA, Benjamin CummingsPublishing Co.
Neurath H and Hill R L (eds) 1982 The Proteins, New York,Academic Press.

70
5.1 Introduction
5.2 Fat-soluble vitamins
5.3 The vitamin B complex
5.4 Vitamin C
5.5 Hypervitaminosis
Vitamins5
5.1 INTRODUCTION
Discovery of vitamins
The discovery and isolation of many of the vitamins were originally achievedthrough work on rats given diets of purified proteins, fats, carbohydrates andinorganic salts. Using this technique, Hopkins in 1912 showed that a syntheticdiet of this type was inadequate for the normal growth of rats, but that when a smallquantity of milk was added to the diet the animals developed normally. This provedthat there was some essential factor, or factors, lacking in the pure diet.
About this time the term ‘vitamines’, derived from ‘vital amines’, was coined byFunk to describe these accessory food factors, which he thought contained amino-nitrogen. It is now known that only a few of these substances contain amino-nitrogenand the word has been shortened to vitamins, a term that has been generally acceptedas a group name.
Although the discovery of the vitamins dates from the beginning of the twentiethcentury, the association of certain diseases with dietary deficiencies had been recog-nised much earlier. In 1753 Lind, a British naval physician, published a treatise onscurvy, proving that this disease could be prevented in human beings by includingsalads and summer fruits in their diet. The action of lemon juice in curing and pre-venting scurvy had been known, however, since the beginning of the seventeenthcentury.The use of cod-liver oil in preventing rickets has long been appreciated, andEijkmann knew at the end of the nineteenth century that beri-beri, a disease commonin the Far East, could be cured by giving the patients brown rice grain rather thanpolished rice.

Introduction
71
Vitamins and biochemistry
Vitamins are usually defined as organic compounds that are required in smallamounts for normal growth and maintenance of animal life. But this definitionignores the important part that these substances play in plants and their importancegenerally in the metabolism of all living organisms. Unlike the nutrients covered inChapters 2–4, vitamins are not merely building blocks or energy-yielding com-pounds but are involved in, or are mediators of, the biochemical pathways (Fig. 5.1).For example, many of the B vitamins act as cofactors in enzyme systems but it is notalways clear how the symptoms of deficiency are related to the failure of the meta-bolic pathway.
In addition to avoiding explicit vitamin deficiency symptoms (see below) or ageneral depression in production due to a subclinical deficiency, some vitamins areadded to the diet at higher levels in order to (1) enhance the quality of the animalproduct, e.g. vitamin D for eggshell strength and vitamin E for prolonging the shelf
BOX 5.1 Vitamin supplementation of diets
Most food mixes prepared as supplements for ruminants and horses or as the sole food for pigs,poultry, dogs and cats are supplemented with vitamins. With other nutrients, such as energy andprotein, it is possible to demonstrate a response to increments in intake, which can be evaluatedagainst the cost of the increment. This is not possible with vitamins, for which the cost is relativelysmall in relation to the consequences of deficiency.Therefore, vitamins are usually supplied at levelsgreater than those shown to be required under experimental conditions.This oversupply allows foruncertainties met under practical conditions (e.g. variable vitamin content and availability in foods,loss of vitamin potency in storage, range of management practices, quality of the environment,health status, extra requirements due to stress).This is not to say that such safety margins should beexcessive, since this would be wasteful: in addition, an excess of one vitamin may increase the re-quirement for another. For example, the fat-soluble vitamins share absorption mechanisms andcompete with each other; thus, an excess of vitamin A will increase the dietary requirements of vitamins E, D and K.
Originally, vitamins for supplements were isolated from plant products. However, yields fromsuch sources are low and the vitamins can be expensive.Yields can be increased when vitamins areproduced from microorganisms by fermentation. Nowadays many vitamins are produced in multi-stage chemical processes that are controllable and the yield is predictable.
For ease of handling in the feed mill the vitamin supplement needs to (1) be free-flowing, (2) notbe dusty and (3) mix homogeneously with other diet ingredients (vitamins are added in minuteamounts but must be thoroughly dispersed throughout the mix); the vitamin must remain stable andyet be biologically available when consumed by the animal. Some of these criteria are incompatibleand a compromise has to be reached. Oily vitamins are absorbed on to silica; others are coated ormicro-encapsulated and antioxidants are added to prevent breakdown of those vitamins that aresusceptible to oxidation.The manufacturers also make use of stable derivatives of vitamins (e.g. theacetate form of �-tocopherol as opposed to the alcohol form).
Maintenance of vitamin activity in the supplement is affected by temperature, humidity, acidity/alkalinity, oxygen, ultraviolet light, the presence of some trace minerals (dietary supplements areusually combinations of vitamins, minerals and trace elements), physical factors such as hammermilling and the length of time the supplement is stored. For example, choline chloride can destroyother vitamins during storage.

Chapter 5 Vitamins
72
Car
bo
hyd
rate
met
abo
lismIn
osi
tol
C
H
PP
Nu
clei
cac
ids
PP
Pro
tein
met
abo
lism
Ener
gy
ou
tpu
t
B12
B1
PP
H
H
B6
Folic
B12
PP
H
B6
B2
Cal
-p
an B6
Ace
tyl-
Co
A
Asp
arta
te
Pyru
vate
Co
A
Cit
rate
Oxa
lace
tate
PP
PPPP
Iso
citr
ate
Mal
ate
Fum
arat
e
CO
2
α-K
eto
glu
tara
teSu
ccin
yl-C
oA
Succ
inat
e
B1
B2
Cal
-p
an
B6
Cal
-p
an
PP
B6
Glu
tam
ate
B6
2H
H
B6
Folic
Folic
Ch
ol-
ine
PPH
KB
6B
12
Cal
-p
an
Kre
bs
Cyc
le
Mal
on
yl-C
oA
Ch
ole
ster
ol
Acy
l-C
oA
Ace
tateB2
Cal
pan
Cal
pan
B1
B2
B1
PP
Cal
-p
an
Cal
pan
Ch
ol-
ine
Ch
olin
e
HB
2PP
B12
B6
Ace
tylc
ho
line
Pro
pio
nat
e
B1
B1
E
Fat
met
abo
lism
HPP
Cal
-p
anB
1B
12
Ch
ol-
ine
E
KEY Cal
pan
B1
B2
B6
PP H
Folic
Ch
olin
e
C E K B12
B1
Pyri
do
xin
e
Rib
ofl
avin
Thia
min
Nia
cin
Pan
toth
enic
aci
d
Bio
tin
Fola
cin
Ch
olin
e
Asc
orb
ic a
cid
Vit
amin
E
Vit
amin
K
Vit
amin
B12
Fig
. 5.1
Dia
gra
m s
ho
win
g t
he
invo
lvem
ent
of
vita
min
s in
bio
chem
ical
pat
hw
ays.
Ad
apte
d f
rom
Ro
che
Vit
ec A
nim
al N
utr
itio
n a
nd
Vit
amin
New
s1:
A1–
10/2
No
vem
ber
198
4.

Introduction
73
life of carcasses, or (2) improve health, e.g. vitamin A to improve the health status ofthe mammary gland in dairy cows.
Vitamins are required by animals in very small amounts compared with other nu-trients; for example, the vitamin B1 (thiamin) requirement of a 50 kg pig is onlyabout 3 mg/day. Nevertheless, a continuous deficiency in the diet results in dis-ordered metabolism and eventually disease.
Some compounds function as vitamins only after undergoing a chemical change;such compounds, which include �-carotene and certain sterols, are described asprovitamins or vitamin precursors.
Many vitamins are destroyed by oxidation, a process speeded up by the action ofheat, light and certain metals such as iron. This fact is important since the conditionsunder which a food is stored will affect the final vitamin potency. Some commercial vitamin preparations are dispersed in wax or gelatin, which act as a protective layeragainst oxidation (for further details of vitamin supplementation of diets, see Box 5.1).
The system of naming the vitamins by letters of the alphabet was most conven-ient and was generally accepted before the discovery of their chemical nature. Al-though this system of nomenclature is still widely used with some vitamins, themodern tendency is to use the chemical name, particularly in describing members ofthe B complex.
At least 14 vitamins have been accepted as essential food factors, and a few others have been proposed. Only those that are of nutritional importance are dealtwith in this chapter.
It is convenient to divide the vitamins into two main groups: fat-soluble andwater-soluble.Table 5.1 lists the important members of these two groups.
Table 5.1 Vitamins important in animal nutrition
Vitamin Chemical name
Fat-soluble vitaminsA RetinolD2 ErgocalciferolD3 CholecalciferolE Tocopherola
K Phylloquinoneb
Water-soluble vitaminsB complex
B1 ThiaminB2 Riboflavin
NicotinamideB6 Pyridoxine
Pantothenic acidBiotinFolic acidCholine
B12 CyanocobalaminC Ascorbic acid
aA number of tocopherols have vitamin E activity.bSeveral naphthoquinone derivatives possessing vitamin K activity are known.

Chapter 5 Vitamins
74
CH2OHH3C
CH3 CH3
CH3
CH3
Vitamin A (all-trans form)
Table 5.2 Some typical values for liver reserves of vitaminA in different speciesa
Species Vitamin A (µg/g liver)
Pig 30Cow 45Rat 75Man 90Sheep 180Horse 180Hen 270Codfish 600Halibut 3000Polar bear 6000Soup-fin shark 15000
aIn every species, wide individual variations are to be expected.
Adapted from Moore T 1969 In: Morton R A (ed.) Fat Soluble Vitamins,Oxford, Pergamon Press, p. 233.
5.2 FAT-SOLUBLE VITAMINS
Vitamin AChemical nature
Vitamin A (C20H29OH), known chemically as retinol, is an unsaturated monohydricalcohol with the following structural formula:
The vitamin is a pale yellow crystalline solid, insoluble in water but soluble in fatand various fat solvents. It is readily destroyed by oxidation on exposure to air andlight.A related compound with the formula C20H27OH, originally found in fish, hasbeen designated dehydroretinol or vitamin A2.
Sources
Vitamin A accumulates in the liver and this organ is likely to be a good source; theamount present varies with species of animal and diet. Table 5.2 shows some typicalliver reserves of vitamin A in different species, although these values vary widely withineach species.
The oils from livers of certain fish, especially cod and halibut, have long beenused as an important dietary source of the vitamin. Egg yolk and milk fat also areusually rich sources, although the vitamin content of these depends, to a large ex-tent, upon the diet of the animal from which it has been produced.
Vitamin A is manufactured synthetically and can be obtained in a pure form.
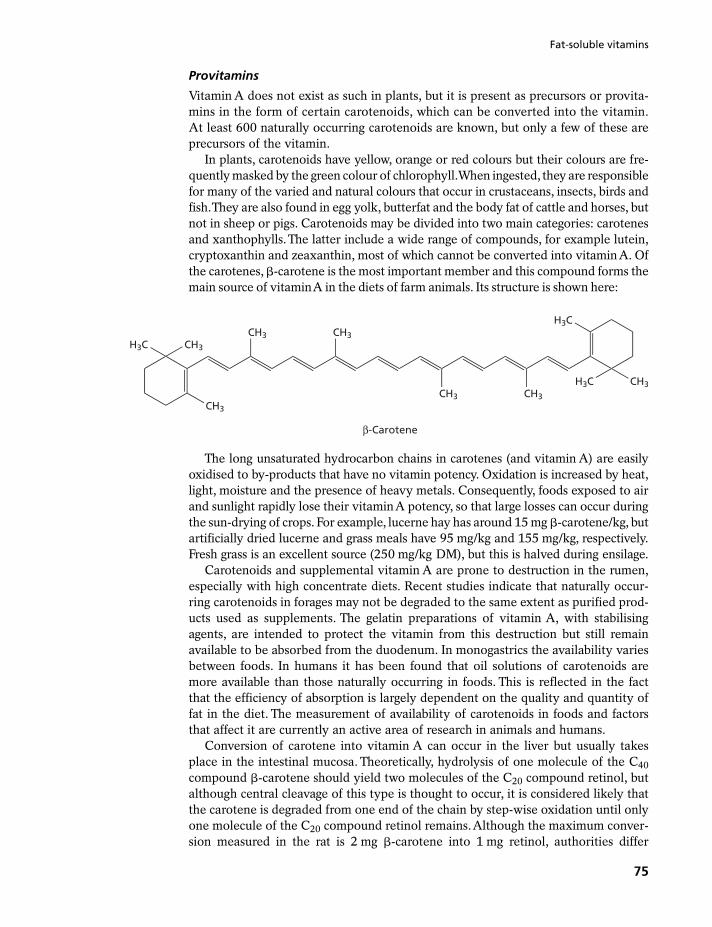
Fat-soluble vitamins
75
Provitamins
Vitamin A does not exist as such in plants, but it is present as precursors or provita-mins in the form of certain carotenoids, which can be converted into the vitamin.At least 600 naturally occurring carotenoids are known, but only a few of these areprecursors of the vitamin.
In plants, carotenoids have yellow, orange or red colours but their colours are fre-quently masked by the green colour of chlorophyll.When ingested, they are responsiblefor many of the varied and natural colours that occur in crustaceans, insects, birds andfish.They are also found in egg yolk, butterfat and the body fat of cattle and horses, butnot in sheep or pigs. Carotenoids may be divided into two main categories: carotenesand xanthophylls.The latter include a wide range of compounds, for example lutein,cryptoxanthin and zeaxanthin, most of which cannot be converted into vitaminA. Ofthe carotenes, �-carotene is the most important member and this compound forms themain source of vitaminA in the diets of farm animals. Its structure is shown here:
The long unsaturated hydrocarbon chains in carotenes (and vitamin A) are easilyoxidised to by-products that have no vitamin potency. Oxidation is increased by heat,light, moisture and the presence of heavy metals. Consequently, foods exposed to airand sunlight rapidly lose their vitaminA potency, so that large losses can occur duringthe sun-drying of crops. For example, lucerne hay has around 15 mg �-carotene/kg, butartificially dried lucerne and grass meals have 95 mg/kg and 155 mg/kg, respectively.Fresh grass is an excellent source (250 mg/kg DM), but this is halved during ensilage.
Carotenoids and supplemental vitamin A are prone to destruction in the rumen,especially with high concentrate diets. Recent studies indicate that naturally occur-ring carotenoids in forages may not be degraded to the same extent as purified prod-ucts used as supplements. The gelatin preparations of vitamin A, with stabilisingagents, are intended to protect the vitamin from this destruction but still remainavailable to be absorbed from the duodenum. In monogastrics the availability variesbetween foods. In humans it has been found that oil solutions of carotenoids aremore available than those naturally occurring in foods. This is reflected in the factthat the efficiency of absorption is largely dependent on the quality and quantity offat in the diet. The measurement of availability of carotenoids in foods and factorsthat affect it are currently an active area of research in animals and humans.
Conversion of carotene into vitamin A can occur in the liver but usually takesplace in the intestinal mucosa. Theoretically, hydrolysis of one molecule of the C40compound �-carotene should yield two molecules of the C20 compound retinol, butalthough central cleavage of this type is thought to occur, it is considered likely thatthe carotene is degraded from one end of the chain by step-wise oxidation until onlyone molecule of the C20 compound retinol remains.Although the maximum conver-sion measured in the rat is 2 mg �-carotene into 1 mg retinol, authorities differ
CH3
H3C
CH3H3C
CH3H3CCH3 CH3
CH3 CH3
β-Carotene

Chapter 5 Vitamins
76
regarding the conversion efficiency in other animals with ranges from 3 : 1 to 12 : 1.Ruminants convert about 6 mg of �-carotene into 1 mg of retinol.The correspondingconversion efficiency for pigs and poultry is usually taken as 11 : 1 and 3 : 1, respec-tively. Cats do not have the enzyme to convert carotene to vitamin A. Since theirdiet comprises meat, which usually contains sufficient vitamin A and low levels ofcarotenoids, the conversion pathway is redundant.The vitamin A values of foods areoften stated in terms of international units (iu), one iu of vitamin A being defined asthe activity of 0.3 µg of crystalline retinol.
Metabolism
Vitamin A appears to play two different roles in the body according to whether it isacting in the eye or in the general system.
In the retinal cells of the eye, vitamin A (all-trans-retinol) is converted into the11-cis-isomer, which is then oxidised to 11-cis-retinaldehde. In the dark the latterthen combines with the protein opsin to form rhodopsin (visual purple), which is thephotoreceptor for vision at low light intensities. When light falls on the retina, thecis-retinaldehyde molecule is converted back into the all-trans form and is releasedfrom the opsin.This conversion results in the transmission of an impulse up the opticnerve. The all-trans-retinaldehyde is converted to all-trans-retinol, which re-entersthe cycle, thus continually renewing the light sensitivity of the retina (Fig. 5.2).
In its second role, in the regulation of cellular differentiation, vitamin A is involvedin the formation and protection of epithelial tissues and mucous membranes. In thisway it has particular importance in growth, reproduction and immune response.Vita-min A is important in the resistance to disease and promotion of healing through itseffect on the immune system and epithelial integrity. In addition, it acts, along withvitamins E and C and �-carotene, as a scavenger of free radicals (see Box 5.2, p. 83).
The placental transfer of vitamin A to the foetus is limited and the neonate haslow stores of the vitamin and relies on consumption of colostrum to establish ade-quate tissue stores.
All-trans-retinol
All-trans-retinal
11-Cis-retinol
11-Cis-retinal
Rhodopsin Opsin
Nerve impulse
Dark
Light
Fig. 5.2 The role of vitamin A (retinol) in the visual cycle.

Fat-soluble vitamins
77
Deficiency symptoms
Ability to see in dim light depends upon the rate of resynthesis of rhodopsin; whenvitamin A is deficient, rhodopsin formation is impaired. One of the earliest symp-toms of a deficiency of vitamin A in all animals is a lessened ability to see in dimlight, commonly known as ‘night blindness’.
It has long been realised that vitamin A plays an important role in combating infec-tion, and it has been termed the ‘anti-infective vitamin’. In several species, vitamin Adeficiency has been shown to be accompanied by low levels of immunoglobulins,although the exact function of the vitamin in the formation of these important proteinsis uncertain.
In adult cattle, a mild deficiency of vitamin A is associated with roughened hairand scaly skin. If it is prolonged the eyes are affected, leading to excessive watering,softening and cloudiness of the cornea and development of xerophthalmia, which ischaracterised by a drying of the conjunctiva. Constriction of the optic nerve canalmay cause blindness in calves. In breeding animals a deficiency may lead to infertility,and in pregnant animals deficiency may lead to failure of embryo growth, disruptedorgan development, abortion, short gestation, retained placenta or the production ofdead, weak or blind calves. Less severe deficiencies may result in metritis and der-matitis and calves born with low reserves of the vitamin; it is then imperative thatcolostrum, rich in antibodies and vitamin A, should be given at birth, otherwise thesusceptibility of such animals to infection leads to scours and, if the deficiency is notrectified, they frequently die of pneumonia. The National Research Council of theUnited States has increased the recommended allowance for dairy cows in order toimprove the health of the mammary gland and reduce mastitis.
In practice, severe deficiency symptoms are unlikely to occur in adult animals ex-cept after prolonged deprivation. Grazing animals generally obtain more than ade-quate amounts of provitamin from pasture grass and normally build up liver reserves.If cattle are fed on silage or well-preserved hay during the winter months, deficien-cies are unlikely to occur. Cases of vitamin A deficiency have been reported amongcattle fed indoors on high cereal rations, and under these conditions a high vitaminsupplement is recommended.
In ewes, in addition to night blindness, severe cases of deficiency may result inlambs being born weak or dead.A deficiency is not common in sheep, however, be-cause of adequate dietary intakes on pasture.
In pigs, eye disorders such as xerophthalmia and blindness may occur. A defi-ciency in pregnant animals may result in the production of weak, blind, dead or de-formed litters. In view of the apparent importance of vitamin A in preventingreproductive disorders in pigs, it has been suggested that the retinoids may have arole in embryo development (cell differentation, gene transcription). Alternatively,they may regulate ovarian steroid production and influence the establishment andmaintenance of pregnancy. In less severe cases of deficiency, appetite is impaired andgrowth retarded.Where pigs are reared out of doors and have access to green food,deficiencies are unlikely to occur, except possibly during the winter. Pigs kept in-doors on concentrates may not receive adequate amounts of vitamin A in the dietand supplements may be required.
In poultry consuming a diet deficient in vitamin A, the mortality rate is usuallyhigh. Early symptoms include retarded growth, weakness, ruffled plumage and a stag-gering gait. In mature birds, egg production and hatchability are reduced. Since mostconcentrated foods present in the diets of poultry are low or lacking in vitamin A or

Chapter 5 Vitamins
78
its precursors, vitamin A deficiency may be a problem unless precautions are taken.Yellow maize, dried grass or other green food, or alternatively cod- or other fish-liveroils or vitamin A concentrate, can be added to the diet.
In horses, the signs of deficiency include the catalogue of symptoms seen in otherfarm animals: night blindness, keratinisation of the skin and cornea, susceptibility toinfection and infertility.
Dogs and cats show similar symptoms. In addition dogs have ataxia and anorexiaand cats have reproductive and developmental disorders.
It has been suggested that, in addition to vitamin A, some species may have adietary requirement for �-carotene per se.The ovaries of bovine species are knownto contain high concentrations of �-carotene during the luteal phase – indeed, it isan integral component of the mucosal membrane of luteal cells – and it has beenpostulated that certain fertility disorders in dairy cattle, such as retarded ovulationand early embryonic mortality, may be caused by a deficiency of the provitamin inthe diet. In sows, injections of �-carotene have reduced embryonic mortality and in-creased litter sizes. It is suggested that it influences steroidogenesis and, through itsantioxidant properties, it may protect the highly active ovarian cells from damage byfree radicals. Supplementation of the diet of dogs with �-carotene resulted in increasedplasma progesterone concentration.
Vitamin DChemical nature
Anumberof formsofvitaminDareknown,althoughnotall of thesearenaturallyoccur-ring compounds.The two most important forms are ergocalciferol (D2) and cholecalcif-erol (D3).The term D1 was originally suggested by earlier workers for an activated sterol,which was found later to be impure and to consist mainly of ergocalciferol,which had al-ready been designated D2.The result of this confusion is that in the group of D vitamins,the term vitamin D1 has been abolished.The structures of vitamins D2 and D3 are:
H2C
CH3CHCH
HO
CHCH
CH3 CH3
CHCH3
CH3
H2C
CH3
HO
CHCH2CH2CH2CHCH3
CH3 CH3
Vitamin D2 (ergocalciferol)
Vitamin D3 (cholecalciferol)

Fat-soluble vitamins
79
The D vitamins are insoluble in water but soluble in fats and fat solvents. Thesulphate derivative of vitamin D present in milk is a water-soluble form of the vita-min. Both D2 and D3 are more resistant to oxidation than vitamin A, D3 being morestable than D2.
Sources
The D vitamins are limited in distribution.They rarely occur in plants except in sun-dried roughages and the dead leaves of growing plants. In the animal kingdom vita-min D3 occurs in small amounts in certain tissues and is abundant only in somefishes. Halibut-liver and cod-liver oils are rich sources of vitamin D3. Egg yolk is alsoa good source, but cow’s milk is normally a poor source, although summer milktends to be richer than winter milk. Colostrum usually contains six to ten times theamount present in ordinary milk.
Clinical manifestations of avitaminosis D, and other vitamin deficiencies, are fre-quently treated by injection of the vitamin into the animal.
Provitamins
Reference has been made (p. 49) to two sterols, ergosterol and 7-dehydrocholesterol,as being precursors of vitamins D2 and D3, respectively.The provitamins, as such, haveno vitamin value and must be converted into calciferols before they are of any use tothe animal. For this conversion it is necessary to impart a definite quantity of energy tothe sterol molecule, and this can be brought about by the ultraviolet light present insunlight, by artificially produced radiant energy or by certain kinds of physical treat-ment. Under natural conditions activation is brought about by irradiation from thesun. The activation occurs most efficiently with light of wavelength 290–315 nm, sothat the range capable of vitamin formation is small.The amount of ultraviolet radia-tion that reaches the earth’s surface depends upon latitude and atmospheric conditions:the presence of clouds, smoke and dust reduces the radiation. Ultraviolet radiation isgreater in the tropics than in the temperate regions, and the amount reaching the morenorthern areas in winter may be slight. Since ultraviolet light cannot pass throughordinary window glass, animals housed indoors receive little, if any, suitable radiationfor the production of the vitamin. Irradiation is apparently more effective in animalswith light-coloured skins. If irradiation is continued for a prolonged period, then thevitamin may be altered to compounds that can be toxic.
The chemical transformation occurs in the skin and also in the skin secretions,which are known to contain the precursor.Absorption of the vitamin can take placefrom the skin, since deficiency can be treated successfully by rubbing cod-liver oilinto the skin.
Vitamin D requirements are often expressed in terms of international units (iu).One iu of vitamin D is defined as the vitamin D activity of 0.025 µg of crystallinevitamin D3.
Metabolism
Dietary vitamins D2 and D3 are absorbed from the small intestine and are trans-ported in the blood to the liver, where they are converted into 25-hydroxycholecalcif-erol. The latter is then transported to the kidney, where it is converted into1,25-dihydroxycholecalciferol, the most biologically active form of the vitamin. Thiscompound is then transported in the blood to the various target tissues, the intestine,

Chapter 5 Vitamins
80
bones and the eggshell gland in birds. The compound 1,25-dihydroxycholecalciferolacts in a similar way to a steroid hormone, regulating DNA transcription in the intes-tinal microvilli, inducing the synthesis of specific messenger RNA (see Chapter 9),which is responsible for the production of calcium-binding protein.This protein is in-volved in the absorption of calcium from the intestinal lumen.The various pathwaysinvolved in these transformations are summarised in Fig. 5.3. Cats do not obtain vita-min D by exposure to sunlight.The natural diet of the cat contains adequate amountsof vitamin D to meet their requirements.Their metabolism has become adapted suchthat 7-dehydroxycholesterol is converted to cholesterol and is not available forvitamin D synthesis.
The amount of 1,25-dihydroxycholecalciferol produced by the kidney is con-trolled by parathyroid hormone. When the level of calcium in the blood is low(hypocalcaemia), the parathyroid gland is stimulated to secrete more parathyroidhormone, which induces the kidney to produce more 1,25-dihydroxycholecalciferol,which in turn enhances the intestinal absorption of calcium.
In addition to increasing intestinal absorption of calcium, 1,25-dihydroxychole-calciferol increases the absorption of phosphorus from the intestine and also en-hances calcium and phosphorus reabsorption from the kidney and bone.
Recently it has been discovered that 1,25-dihydroxycholecalciferol regulates theexpression of genes and the activity of cells associated with the immune system.
Deficiency symptoms
A deficiency of vitamin D in the young animal results in rickets, a disease of growingbone in which the deposition of calcium and phosphorus is disturbed; as a result thebones are weak and easily broken and the legs may be bowed. In young cattle thesymptoms include swollen knees and hocks and arching of the back. In pigs the symp-toms are usually enlarged joints, broken bones, stiffness of the joints and occasionally
Cholecalciferol 7-Dehydrocholesterol
Cholecalciferol
25-Hydroxycholecalciferol
1,25-Dihydroxycholecalciferol
Target tissues
Food Skin
(Ultraviolet radiation)
Liver
Kidney
Fig. 5.3 Metabolic pathway showing production of the hormonally active formof vitamin D.

Fat-soluble vitamins
81
paralysis.The growth rate is generally adversely affected.The term ‘rickets’ is confinedto young growing animals; in older animals vitamin D deficiency causes osteomalacia,in which there is reabsorption of bone already laid down. Osteomalacia due to vitaminD deficiency is not common in farm animals, although a similar condition can occur inpregnant and lactating animals, which require increased amounts of calcium and phos-phorus. Rickets and osteomalacia are not specific diseases necessarily caused by vita-min D deficiency; they can also be caused by lack of calcium or phosphorus or animbalance between these two elements.
In poultry, a deficiency of vitamin D causes the bones and beak to become softand rubbery; growth is usually retarded and the legs become weak. Egg productionis reduced and eggshell quality deteriorates. Most foods of pigs and poultry, with thepossible exception of fishmeal, contain little or no vitamin D, and the vitamin is gen-erally supplied to these animals, if reared indoors, in the form of fish-liver oils orsynthetic preparations.
The need for supplementing the diets of cattle and sheep with vitamin D is gener-ally not so great as that for pigs and poultry. Adult ruminants can receive adequateamounts of the vitamin from hay in the winter months, and from irradiation whilegrazing. However, since the vitamin D content of hays is extremely variable, it is possi-ble that vitamin D supplementation may be desirable, especially with young growinganimals or pregnant animals, on winter diets.There is a considerable lack of informa-tion about the vitamin D needs of farm animals under practical conditions.
For cattle, sheep and pigs vitamins D2 and D3 have the same potency, but forpoultry vitamin D2 has only about 10 per cent of the potency of D3.
Certain foods, such as fresh green cereals and yeast, have been shown to haverachitogenic (rickets-causing) properties for mammals, and raw liver and isolatedsoya bean protein have a similar effect on poultry. In one study it was shown that inorder to overcome the rachitogenic activity of whole raw soya bean meal, a tenfoldincrease in vitamin D supplement was necessary. Heating destroys the rachitogenicactivity.
Vitamin EChemical nature
Vitamin E is a group that includes a number of closely related active compounds.Eight naturally occurring forms of the vitamin are known, and these can be dividedinto two groups according to whether the side chain of the molecule, as shownbelow, is saturated or unsaturated.
The four saturated vitamins are designated �-, �-, �- and �-tocopherol. Of thesethe �-form is the most biologically active and most widely distributed.
OCH3
CH2(CH2 CH2 CH CH2)3H
CH3H3C
HO
CH3
CH3
α-Tocopherol

Chapter 5 Vitamins
82
The �-, �- and �-forms have only about 45, 13 and 0.4 per cent of the activity ofthe �-form, respectively. The unsaturated forms of the vitamin have been desig-nated �-, �-, �- and �-tocotrienols. Of these only the �-form appears to have anysignificant vitamin E activity, and then only about 13 per cent of its saturatedcounterpart.
The �-tocopherol molecule has three centres where stereoisomers can occur.Thenaturally occurring molecule is the D-�-tocopherol (or RRR-�-tocopherol) configura-tion and has the highest vitamin activity. Synthetic DL-�-tocopherol acetate (alsocalled all racemic �-tocopherol acetate) is used as a vitamin E supplement and com-prises all eight possible stereoisomers; only one molecule in eight is in the RRRform. The vitamin activity of the four stereoisomers in the L forms is considerablylower than the four that make up the D forms; in the latter the RRR form is the mostactive.
Sources
Vitamin E, unlike vitamin A, is not stored in the animal body in large amounts forany length of time and consequently a regular dietary source is important. Fortu-nately, the vitamin is widely distributed in foods. Green fodders are good sourcesof �-tocopherol, young grass being a better source than mature herbage. Theleaves contain 20–30 times as much vitamin E as the stems. Losses during hay-making can be as high as 90 per cent, but losses during ensilage or artificial dry-ing are low.
Cereal grains are also good sources of the vitamin, but the tocopherol composi-tion varies with species.Wheat and barley grain resemble grass in containing mainly�-tocopherol, but maize contains, in addition to �-tocopherol, appreciable quantitiesof �-tocopherol. During the storage of moist grain in silos, the vitamin E activity candecline markedly. Reduction in the concentration of the vitamin from 9 to 1 mg/kgDM has been reported in moist barley stored for 12 weeks.
Animal products are relatively poor sources of the vitamin, although the amountpresent is related to the level of vitamin E in the diet.
The vitamin E values of foods are often stated in terms of international units, oneiu of vitamin E being defined as the specific activity of 1 mg of synthetic all-racemic�-tocopherol acetate. It is generally accepted that 1 mg of RRR-�-tocopherol isequivalent to 1.49 iu vitamin E and 1 mg RRR-�-tocopherol acetate is equivalent to1.36 iu vitamin E. However, recent evidence suggests that the equivalence of all-racemic to RRR forms is related to species, age and the criteria used to assess themand that it may be as high as 2 : 1.
Metabolism
Vitamin E functions in the animal mainly as a biological antioxidant; in associa-tion with the selenium-containing enzyme glutathione peroxidase and other vita-mins and trace-element-containing enzymes, it protects cells against oxidativedamage caused by free radicals. Free radicals are formed during cellular metabo-lism and, as they are capable of damaging cell membranes, enzymes and cellnuclear material, they must be converted into less reactive substances if the ani-mal is to survive. This protection is particularly important in preventing oxidationof polyunsaturated fatty acids, which function as primary constituents of subcellu-lar membranes and precursors of prostaglandins. Oxidation of unsaturated fatty

Fat-soluble vitamins
83
BOX 5.2 Free radicals and antioxidants
Antioxidants are required to protect the animal’s cells from damage due to the presence of free rad-icals. These are highly reactive molecules containing one or more unpaired electrons and can existindependently (e.g. superoxide, O*2
-, and hydroxyl, OH*). Their high reactivity is a result of theirtrying to lose or gain an electron to achieve stability.Within cells hydrogen peroxide (H2O2) can eas-ily break down, especially in the presence of transition ions (e.g. Fe2+), to produce the hydroxyl rad-ical, which is the most reactive and damaging of the free radicals:
H2O2 + Fe2+ → OH* + OH-+ Fe3+
Free radicals are generated during normal cellular metabolism owing to leakage from the elec-tron transport chain in mitochondria and leakage from peroxidation of polyunsaturated fatty acidsin the pathway of conversion of arachidonic acid to prostaglandins and related compounds. AlsoO2*- plays an essential role in the extracellular killing of microorganisms by activated phagocytes,and activation of this system can lead to further leakage.
All classes of biological molecules are vulnerable to free radical damage, but especially lipids,proteins and DNA. Cell membranes are an important target because of the enzyme systems con-tained within them. Lipids are the most susceptible; oxidative destruction of polyunsaturated fattyacids can be extremely damaging, since it proceeds as a self-perpetuating chain reaction. The moreactive cells, such as muscle cells, are at greatest risk of damage because they depend on the utilisa-tion of lipids as energy sources.
To maintain cell integrity the animal’s cells require protection mechanisms and these are pro-vided by the antioxidant system, which involves a group of vitamins and enzymes containing traceelements working in series.The initial line of defence is by the enzymes superoxide dismutase (con-taining copper), glutathione peroxidases (containing selenium) and catalase. Superoxide dismutaseeliminates superoxide radicals formed in the cell and prevents the reaction of the radical with bio-logical membranes or their participation in the production of more powerful radicals. Glutathioneperoxidase detoxifies lipid hydroperoxides that are formed in the membrane during lipid peroxida-tion. Catalase can also break down hydrogen peroxide.
If large amounts of radicals are produced the enzyme systems will be insufficient to preventdamage and the second antioxidant system is brought into action.Antioxidants break the chain re-action by scavenging peroxyl radicals and thus interfere with the propagation steps in the lipid per-oxidation process.Vitamin E is the main antioxidant but the carotenoids, vitamin A and vitamin Care also involved. In mammalian cells vitamin E is located in the mitochondria and endothelialreticulum. It donates a hydrogen atom to the free radical to form a stable molecule, thereby break-ing the chain.The amount of vitamin E in the cell membranes is low and it must be regenerated so
acids produces hydroperoxides, which also damage cell tissues, and more lipidfree radicals, so that prevention of such oxidation is of vital importance in main-taining the health of the living animal. The animal has complementary methodsof protecting itself against oxidative damage: scavenging of radicals by vitamin Eand destruction of any peroxides formed by glutathione peroxidase (seeBox 5.2).
(Continued)

Chapter 5 Vitamins
84
Vitamin E also plays an important role in the development and function of theimmune system. In recognition of this the National Research Council requirementsfor dairy cows have been increased to reduce the incidence of mastitis. In studieswith several species, supplementation of diets with the vitamin provided some pro-tection against infection with pathogenic organisms.
Recent research has indicated that vitamin E is also involved in the regulation ofcell signalling and gene expression.
Like vitamin A, it was thought that the transfer of vitamin E across the placentawas limited, with the neonate relying on colostrum to meet its requirements. Morerecent evidence in sheep indicates that placental transfer does occur, with increasedmuscle and brain concentrations in lambs born from ewes fed higher levels.Nonetheless, colostrum is a very important source of vitamin E for the new born.
ROOH,ROH
ROO•, RO•
PUFA
Peroxide and otherradicals
Reductases
NAD(P)H
NAD(P)
Dehydroascorbate
α-Tocopheroxylradical
α-Tocopherol
Vitamin Ecycle
Ascorbate
Vitamin Ccycle
Semi-ascorbylradical
Thiol cycle
TRXox
GSSG
TRXred
GSH
Fig. 5.4 The regeneration of vitamin E.
After Rooke J A, Robinson J J and Arthur J R 2004 Journal of Agricultural Science 142: 253–62.
that there is sufficient to act against other radicals.The regeneration is carried out by reaction withvitamin C and the ascorbate radical in turn is reduced by NADH-dependent enzymes (Fig. 5.4). Ithas been reported that vitamin C also acts as an antioxidant in extracellular fluid, where it operatesas a scavenger preventing the initiation of lipid peroxidation. It contributes up to one-quarter of thetotal antioxidant activity in plasma.

Fat-soluble vitamins
85
Deficiency symptoms
The most frequent and, from a diagnostic point of view, the most important manifes-tation of vitamin E deficiency in farm animals is muscle degeneration (myopathy).Nutritional myopathy, also known as muscular dystrophy, frequently occurs in cattle,particularly calves, when they are turned out on to spring pasture. It is associatedwith low vitamin E and selenium intakes during the in-wintering period and possi-bly the relatively high concentration of polyunsaturated fatty acids in the younggrass lipids. The requirement for the vitamin increases with increasing concentra-tions of polyunsaturated fatty acids in the diet. The myopathy primarily affects theskeletal muscles and the affected animals have weak leg muscles, a condition man-ifested by difficulty in standing and, after standing, a trembling and staggering gait.Eventually, the animals are unable to rise, and weakness of the neck muscles pre-vents them from raising the head. A popular descriptive name for this condition is‘white muscle disease’, owing to the presence of pale patches or white streaks in themuscles.The heart muscle may also be affected and death may result. Serum creatinephosphokinase and glutamic oxaloacetic transaminase levels are elevated in animalsdeficient in vitamin E.
Nutritional myopathy also occurs in lambs, with similar symptoms to those ofcalves.The condition is frequently referred to as ‘stiff lamb disease’. Dietary supple-ments of vitamin E given to pregnant ewes have resulted in increased birth weightand improved vigour and viability of neonatal lambs through quicker times to standand suck. The National Research Council has recently increased the dietary recom-mendation for vitamin E several fold owing to its beneficial effects on prolonging theshelf life of lamb at retail.
In pigs, the two main diseases associated with vitamin E and selenium deficiencyare myopathy and cardiac disease. Nutritional myopathy affects in particular youngfast-growing pigs, but it may occur at any age.The pigs demonstrate an uncoordinatedstaggering gait or are unable to rise. In contrast to other animals, it is the pig’s heartmuscle that is more often affected. Sudden cardiac failure occurs; on post-mortemexamination, large amounts of fluid are found around the heart and lungs and thelesions of the cardiac muscles are seen as haemorrhagic and pale areas.This conditionis commonly known as ‘mulberry heart disease’. Sometimes the liver is also affectedand it becomes enlarged and mottled. Supplemental vitamin E has improved littersize in pigs, probably through its antioxidant properties protecting arachidonic acidand maintaining the functional integrity of the reproductive organs.
Vitamin E deficiency in chicks may lead to a number of distinct diseases: myopa-thy, encephalomalacia and exudative diathesis. In nutritional myopathy the mainmuscles affected are the pectorals, although the leg muscles also may be involved.Nutritional encephalomalacia, or ‘crazy chick disease’, is a condition in which thechick is unable to walk or stand and is accompanied by haemorrhages and necrosisof brain cells. Exudative diathesis is a vascular disease of chicks characterised by ageneralised oedema of the subcutaneous fatty tissues, associated with an abnormalpermeability of the capillary walls. Both selenium and vitamin E appear to be in-volved in nutritional myopathy and in exudative diathesis, but the element does notseem to be important in nutritional encephalomacia. It should be stressed that sele-nium itself is a very toxic element and care is required in its use as a dietary additive.The toxic nature of selenium is discussed in Chapter 7.
In horses, vitamin E deficiency results in the previously mentioned problems, i.e.lameness and muscle rigidity (‘tying up’) associated with skeletal and heart muscles.

Chapter 5 Vitamins
86
The red blood cells become fragile and the release of myoglobin from damaged mus-cle cells gives rise to coffee-coloured urine.
Vitamin K
Vitamin K was discovered in 1935 to be an essential factor in the prevention ofhaemorrhagic symptoms in chicks.The discovery was made by a group of Danish sci-entists, who gave the name ‘koagulation factor’ to the vitamin, which became short-ened to the K factor and eventually to vitamin K.
Chemical nature
A number of forms of vitamin K are known to exist.All compounds exhibiting vita-min K activity possess a 2-methyl-1,4-naphthoquinone ring (menadione), whichanimals are unable to synthesise but plants and bacteria can.
The form of the vitamin present in plants is 2-methyl-3-phytyl-1,4-naphtho-quinone, generally referred to as phylloquinone or vitamin K1.
The compound originally isolated from putrified fishmeal and designated vitaminK2 is now known to be only one of a series of K vitamins with unsaturated sidechains synthesised by bacteria and referred to as menaquinones. The predominantvitamins of the menaquinone series contain six to ten isoprenoid (CH2:CCH3:CH:CH2) side-chain units. Menadione is the synthetic form of the vitamin and isdesignated as vitamin K3.
Vitamins K are relatively stable at ordinary temperatures but are rapidly des-troyed on exposure to sunlight.
Sources
Phylloquinone is present in most green leafy materials, with lucerne, cabbage andkale being good sources. The amounts present in foods of animal origin are usuallyrelated to the diet, but egg yolk, liver and fishmeal are generally good sources.Menaquinones are synthesised by bacteria in the digestive tract of animals.
Metabolism
Vitamin K is necessary for the synthesis of prothrombin in the liver. In the blood-clottingprocess, prothrombin is the inactive precursor of thrombin, an enzyme that convertsthe protein fibrinogen in blood plasma into fibrin, the insoluble fibrous protein thatholds blood clots together. Prothrombin normally must bind to calcium ions before itcan be activated. If the supply of vitamin K is inadequate, then the prothrombin mole-cule is deficient in �-carboxyglutamic acid, a specific amino acid responsible for
O
O
CH3
Menadione (2-methyl-1,4-naphthoquinone)

The vitamin B complex
87
Table 5.3 Some coenzymes and enzyme prosthetic groups involving the B vitamins
Vitamin Coenzyme or prosthetic group Enzyme or other function
Thiamin Thiamin pyrophosphate (TPP) Oxidative decarboxylationRiboflavin Flavin mononucleotide (FMN) Hydrogen carrierRiboflavin Flavin adenine dinucleotide
(FAD)Nicotinamide Nicotinamide adenine
dinucleotide (NAD)
calcium binding. Proteins containing �-carboxyglutamic acid, dependent on vitamin Kfor their formation, are also present in bone, kidney and other tissues.
Deficiency symptoms
Symptoms of vitamin K deficiency have not been reported in ruminants, horses andpigs under normal conditions, and it is generally considered that bacterial synthesisin the digestive tract supplies sufficient vitamin for the animal’s needs.A number ofmicroorganisms are known to synthesise vitamin K, including Escherichia coli. Med-icines that affect the bacteria in the gut may depress the production of vitamin K.Adisease of cattle called ‘sweet clover disease’ is associated with vitamin K. Sweetclover (Melilotus albus) naturally contains compounds called coumarins which,when the crop is preserved as hay or silage, may be converted by a variety of fungi,such as the Aspergillus species, to dicoumarol.This compound lowers the prothrom-bin content of the blood and thereby impairs the blood-clotting process.The diseasecan be overcome by administering vitamin K to the animals. For this reason di-coumarol is sometimes referred to as an ‘anti-vitamin’.
The symptoms of vitamin K deficiency in chicks are anaemia and a delayed clottingtime of the blood; birds are easily injured and may bleed to death. It is doubtfulwhether, in birds, microbially synthesised vitamin K is available by direct absorptionfrom the digestive tract, because the site of its formation is too distal to permit absorp-tion of adequate amounts except by ingestion of faecal material (coprophagy).
5.3 THE VITAMIN B COMPLEX
The vitamins included under this heading are all soluble in water and most of themare components of coenzymes (see Table 5.3).Although the mechanism of action inthis role is known, the connection between the observed deficiency symptoms andthe failure of the metabolic pathways is not always clear.
Unlike the fat-soluble vitamins, members of the vitamin B complex, with the ex-ception of cyanocobalamin, are not stored in the tissues in appreciable amounts and a
Hydrogen carrier
Hydrogen carrier
Nicotinamide Nicotinamide adenine dinucleotide phosphate (NADP)
Hydrogen carrier
Pyridoxine Pyridoxal phosphate
Pantothenic acid Coenzyme A (CoA) Acyl transferFolic acid Tetrahydrofolic acid One carbon transferBiotin Biotin Carbon dioxide transferCyanocobalamin Methylcobalamin Isomerases, dehydrases
Transaminases,decarboxylases

Chapter 5 Vitamins
88
regular exogenous supply is essential. In ruminants, all the vitamins in this group canbe synthesised by microbial action in the rumen and generally this will provide satis-factory amounts for normal metabolism in the host and secretion of adequate quanti-ties into milk. For example, it has been estimated that the amount of thiaminsynthesised in the rumen is equal to the thiamin requirement. However, under certainconditions, deficiencies of thiamin and cyanocobalamin can occur in ruminants. Inhorses, the B vitamins synthesised by the microbial population of the gut plus thosevitamins occurring in the food can meet the requirements of most adult animals.
ThiaminChemical nature
Thiamin (vitamin B1) is a complex nitrogenous base containing a pyrimidine ringjoined to a thiazole ring. Because of the presence of a hydroxyl group at the end ofthe side chain, thiamin can form esters.The main form of thiamin in animal tissues isthe diphosphate ester, commonly known as thiamin pyrophosphate (TPP).The vita-min is very soluble in water and is fairly stable in mildly acidic solution but readilydecomposes in neutral solutions.
Sources
Thiamin is widely distributed in foods. It is concentrated in the outer layers of seeds,the germ, and in the growing areas of roots, leaves and shoots. Fermentation prod-ucts, such as brewer’s yeast, are rich sources.Animal products rich in thiamin includeegg yolk, liver, kidney and pork muscle. The synthetic vitamin is available, usuallymarketed as the hydrochloride.
Metabolism
Thiamin pyrophosphate (or thiamin diphosphate) is a coenzyme involved in (1) theoxidative decarboxylation of pyruvate to acetyl coenzyme A (enzyme: pyruvatedehydrogenase), (2) the oxidative decarboxylation of �-ketoglutarate to succinylcoenzyme A (�-ketoglutarate dehydrogenase) in the tricarboxylic acid cycle, (3) thepentose phosphate pathway (transketolase) and (4) the synthesis of branched-chainamino acids such as valine (branched-chain ketoacid dehydrogenase) in bacteria,yeasts and plants.
Thiamin triphosphate is involved in the activation of the chloride ion channel inthe membranes of nerves, possibly by phosphorylation of the channel protein.
Deficiency symptoms
Early signs of thiamin deficiency in most species include loss of appetite, emaciation,muscular weakness and a progressive dysfunction of the nervous system. In pigs, ap-petite and growth are adversely affected and the animals may vomit and have respi-ratory troubles.
N
N NH2H3C
CH2 N
S
CH3
CH2.CH2.OH
Cl
Thiamin chloride

The vitamin B complex
89
Chicks reared on thiamin-deficient diets have poor appetites and consequentlyare emaciated.After about 10 days they develop polyneuritis, which is characterisedby head retraction, nerve degeneration and paralysis.
Many of these deficiency conditions in animals can be explained in terms of therole of TPP in the oxidative decarboxylation of pyruvic acid. On a thiamin-deficientdiet animals accumulate pyruvic acid and its reduction product lactic acid in their tis-sues, which leads to muscular weakness. Nerve cells are particularly dependent onthe utilisation of carbohydrate and for this reason a deficiency of the vitamin has aparticularly serious effect on nervous tissue. Since acetyl coenzyme A is an impor-tant metabolite in the synthesis of fatty acids (see p. 220), lipogenesis is reduced.Thepentose phosphate pathway is also impaired by a deficiency of thiamin but there islittle effect on the activity of the citric acid cycle.
Because thiamin is fairly widely distributed in foods and, in particular, becausecereal grains are rich sources of the vitamin, pigs and poultry are in practice unlikelyto suffer from thiamin deficiency.
In ruminants, microbial synthesis of the vitamin in the digestive tract, togetherwith that present in the diet, will normally provide adequate amounts of thiamin tosatisfy the animal’s requirements. However, under certain conditions, bacterial thi-aminases can be produced in the rumen, which destroy the vitamin, thereby causingthe deficiency condition known as cerebrocortical necrosis (CCN). This condition ischaracterised by circling movements, head pressing, blindness and muscular tremors.There are two types of thiaminase: one splits the molecule in two and the other sub-stitutes an N-containing ring for the thiazole ring.The resulting compound is absorbedand blocks the reactions involving thiamin. It has been suggested that lactic acidosiscaused by feeding with rapidly fermentable foods may be an important factor in theproduction of thiaminases.Young animals appear to be the most susceptible.
Thiaminase is present in bracken (Pteridium aquilinum), and thiamin deficiencysymptoms have been reported in horses consuming this material. Raw fish also con-tains the enzyme, which destroys the thiamin in foods with which the fish is mixed.The activity of the thiaminase is, however, destroyed by cooking.
RiboflavinChemical nature
Riboflavin (vitamin B2) consists of a dimethyl-isoalloxazine nucleus combined withribitol. Its structure is shown here:
N
N
NH
NCH3
CH3
O
CH2 C C C
HO OH OH
H H H
O
CH2OH
Riboflavin

Chapter 5 Vitamins
90
It is a yellow crystalline compound, which has a yellowish-green fluorescence inaqueous solution. Riboflavin is only sparingly soluble in water; it is heat-stable inacid or neutral solutions, but it is destroyed by alkali. It is unstable to light, particu-larly ultraviolet light.
Sources
Riboflavin occurs in all biological materials. The vitamin can be synthesised by allgreen plants, yeasts, fungi and most bacteria, although the lactobacilli are a notableexception and require an exogenous source. Rich sources are yeast, liver, milk (espe-cially whey) and green leafy crops. Cereal grains are poor sources.
Metabolism
Riboflavin is an important constituent of the flavoproteins.The prosthetic group ofthese compound proteins contains riboflavin in the form of the phosphate (flavinmononucleotide, FMN) or in a more complex form as flavin adenine dinucleotide(FAD). There are several flavoproteins that function in the animal body; theyare all concerned with chemical reactions involving the transport of hydrogen.Further details of the importance of flavoproteins in carbohydrate and aminoacid metabolism are discussed in Chapter 9. Flavin adenine dinucleotide plays arole in the oxidative phosphorylation system (see Fig. 9.2 on p. 196) and forms theprosthetic group of the enzyme succinic dehydrogenase, which converts succinicacid to fumaric acid in the citric acid cycle. It is also the coenzyme for acyl-CoAdehydrogenase.
Deficiency symptoms
In pigs, deficiency symptoms include poor appetite, with consequent retardation ingrowth, vomiting, skin eruptions and eye abnormalities. Riboflavin is essential in thediet of sows to maintain normal oestrus activity and prevent premature parturition.Chicks reared on a riboflavin-deficient diet grow slowly and develop ‘curled toeparalysis’, a specific symptom caused by peripheral nerve degeneration, in which thechicks walk on their hocks with the toes curled inwards. In breeding hens, a defi-ciency reduces hatchability. Embryonic abnormalities occur, including the character-istic ‘clubbed down’ condition in which the down feather continues to grow insidethe follicle, resulting in a coiled feather.
The vitamin is synthesised in the rumen and deficiencies in animals with func-tional rumens are unlikely to occur. However, riboflavin deficiencies have beendemonstrated in young calves and lambs. Symptoms include loss of appetite, diar-rhoea and lesions in the corners of the mouth.
NicotinamideChemical nature
Another member of the B vitamin complex, nicotinamide is the amide derivative ofnicotinic acid (pyridine 3-carboxylic acid) and is the form in which it functions in the

The vitamin B complex
91
N
COOH
N
CONH2
N
CH2 CH COOH
NH2
H
Nicotinic acid Nicotinamide Tryptophan
body.The relationship between nicotinic acid, nicotinamide and the amino acid tryp-tophan, which can act as a precursor, is shown here:
Nicotinamide is a stable vitamin and is not easily destroyed by heat, acids, alkalisor oxidation.
Sources
Nicotinic acid can be synthesised from tryptophan in the body tissues; since ani-mals can convert the acid to the amide-containing coenzyme (see below), it fol-lows that if the diet is adequately supplied with proteins rich in tryptophan, thenthe dietary requirement for the vitamin itself should be low. However, the effi-ciency of conversion of tryptophan into nicotinamide is poor. Studies with chickshave shown that the amino acid was converted into the vitamin at a ratio of only45 : 1 on a weight basis and with some foods, such as soya bean meal, the conver-sion ratio may be even greater. Because of this it is generally considered that anexogenous source of the vitamin is also necessary. Although cats possess theenzymes for the conversion of tryptophan to nicotinic acid, the activity of anenzyme in a competing pathway is very high and no nicotinic acid is synthesised.Cats do not need to produce nicotinic acid because their natural diet is wellsupplied with NAD and NADH. Rich sources of the vitamin are liver, yeast,groundnut and sunflower meals. Although cereal grains contain the vitamin, muchof it is present in a bound form that is not readily available to pigs and poultry.Milk and eggs are almost devoid of the vitamin, although they contain the precur-sor tryptophan.
Metabolism
Nicotinamide functions in the animal body as the active group of two importantcoenzymes: nicotinamide adenine dinucleotide (NAD) and nicotinamide adeninedinucleotide phosphate (NADP).These coenzymes are involved in the mechanism ofhydrogen transfer in living cells (see Chapter 9): NAD is involved in the oxidativephosphorylation system, the tricyclic acid (TCA) cycle and the metabolism of manymolecules, including pyruvate, acetate, �-hydroxy-butyrate, glycerol, fatty acids andglutamate; NADPH is the hydrogen acceptor in the pentose phosphate pathway.
Deficiency symptoms
In pigs, deficiency symptoms include poor growth, anorexia, enteritis, vomitingand dermatitis. In fowls, a deficiency of the vitamin causes bone disorders,

Chapter 5 Vitamins
92
N
HO
CH2OH
H3C N
HO
CHO
H3C N
HO
CH2NH2
H3C
Pyridoxine Pyridoxal Pyridoxamine
CH2OH CH2OH CH2OH
feathering abnormalities, and inflammation of the mouth and upper part of theoesophagus.
Deficiency symptoms are particularly likely in pigs and poultry if diets with ahigh maize content are used, since maize contains very little of the vitamin or oftryptophan.
It has been suggested that through its effects on (1) rumen fermentation (someexperiments have shown increased microbial growth and increased propionic acidproduction) and (2) cell metabolism (increased utilisation of carbohydrate and re-duced lipid mobilisation), nicotinic acid may be a useful supplement to dairy cows,particularly in situations of subclinical ketosis. However, the experimental evidenceis not consistent. Nicotinic acid does not always give positive responses in the rumenand increases in blood concentrations were not observed in all experiments. Currentrecommendations do not advocate the supplementation of dairy cow diets in orderto increase milk yield and composition.
Vitamin B6
Chemical nature
The vitamin exists in three forms, which are interconvertible in the body tissues.Theparent substance is known as pyridoxine, the corresponding aldehyde derivative aspyridoxal and the amine as pyridoxamine. The term vitamin B6 is generally used todescribe all three forms.
The amine and aldehyde derivatives are less stable than pyridoxine and aredestroyed by heat.
Sources
The vitamin is present in plants as pyridoxine, whereas animal products may alsocontain pyridoxal and pyridoxamine. Pyridoxine and its derivatives are widely dis-tributed: yeast, pulses, cereal grains, liver and milk are rich sources.
Metabolism
Of the three related compounds, the most actively functioning is pyridoxal in theform of the phosphate. Pyridoxal phosphate plays a central role as a coenzyme inthe reactions by which a cell transforms nutrient amino acids into mixtures ofamino acids and other nitrogenous compounds required for its own metabolism.

The vitamin B complex
93
HOCH2 C
CH3
CH3
CH
OH
CONHCH2CH2COOH
Pantothenic acid
These reactions involve the activities of transaminases and decarboxylases (seep. 210), and over 50 pyridoxal phosphate-dependent enzymes have been identified.In transamination, pyridoxal phosphate accepts the �-amino group of the aminoacid to form pyridoxamine phosphate and a keto acid. The amino group of pyri-doxamine phosphate can be transferred to another keto acid, regenerating pyri-doxal phosphate.The vitamin is believed to play a role in the absorption of aminoacids from the intestine.
Deficiency symptoms
Because of the numerous enzymes requiring pyridoxal phosphate, a large variety ofbiochemical lesions are associated with vitamin B6 deficiency.These lesions are con-cerned primarily with amino acid metabolism, and a deficiency affects the animal’sgrowth rate. Convulsions may also occur, possibly because a reduction in the activityof glutamic acid decarboxylase results in an accumulation of glutamic acid. In addi-tion, pigs reduce their food intake and may develop anaemia. Chicks on a deficientdiet show jerky movements; in adult birds, hatchability and egg production are ad-versely affected. In practice, vitamin B6 deficiency is unlikely to occur in farm ani-mals because of the vitamin’s wide distribution.
Pantothenic acidChemical nature
Pantothenic acid, another member of the vitamin B complex, is an amide of pantoicacid and �-alanine and has the following formula:
Sources
The vitamin is widely distributed; indeed, the name is derived from the Greekpantothen, ‘from everywhere’, indicating its ubiquitous distribution. Rich sources areliver, egg yolk, groundnuts, peas, yeast and molasses. Cereal grains and potatoes arealso good sources of the vitamin.The free acid is unstable.The synthetically preparedcalcium pantothenate is the commonest product used commercially.
Metabolism
Pantothenic acid is a constituent of coenzyme A, which is the important coenzymein fatty acid oxidation, acetate metabolism, and cholesterol and steroid synthesis. Itforms the prosthetic group of acyl carrier protein in fatty acid synthesis. Chemically,

Chapter 5 Vitamins
94
coenzyme A is 3-phospho-adenosine-5-diphospho-pantotheine. The importance ofthis coenzyme in metabolism is discussed in Chapter 9.
Deficiency symptoms
Deficiency of pantothenic acid in pigs causes slow growth, diarrhoea, loss of hair,scaliness of the skin and a characteristic ‘goose-stepping’ gait; in severe cases,animals are unable to stand. In the chick, growth is retarded and dermatitis occurs.In mature birds, hatchability is reduced. Pantothenic acid, like all the B complexvitamins, can be synthesised by rumen microorganisms; Escherichia coli, for ex-ample, is known to produce this vitamin. Pantothenic acid deficiencies are consid-ered to be rare in practice because of the wide distribution of the vitamin,although deficiency symptoms have been reported in commercial herds ofLandrace pigs.
Folic acidChemical nature
This B complex vitamin was first discovered in the 1930s when it was found that acertain type of anaemia in human beings could be cured by treatment with yeast
O
H
OH
H
O
H
CH2
PHO
OH
N
N N
CH
N
NH2
O
P
OH
O
CH H
CH3C CH3
CHO H
C O
NH
C HH
CH H
C O
NH
C HH
CH H
S H
O
O P O
OH
O
Coenzyme A
Pan
toth
ein
e

The vitamin B complex
95
N
N
N
NNH2
OH
CH2 NH CONHCHCH2CH2COOH
COOH
Pteroylmonoglutamic acid
or liver extracts. The active component in the extracts, which was also shown to beessential for the growth of chicks, was found to be present in large quantities ingreen leaves and was named folic acid (Latin folium, a leaf).
The chemical name for folic acid is pteroylmonoglutamic acid. It is made up ofthree moieties: p-aminobenzoic acid, glutamic acid and a pteridine nucleus.
Several active derivatives of the vitamin are known to occur, these containing upto 11 glutamate residues in the molecule. The monoglutamate form is readily ab-sorbed from the digestive tract but the polyglutamates must be degraded by en-zymes to the monoglutamate form before they can be absorbed.
Sources
Folic acid is widely distributed in nature; green leafy materials, cereals and ex-tracted oilseed meals are good sources of the vitamin. Folic acid is reasonably stablein foods stored under dry conditions, but it is readily degraded by moisture, partic-ularly at high temperatures. It is also destroyed by ultraviolet light.
Metabolism
After absorption into the cell, folic acid is converted into tetrahydrofolic acid, whichfunctions as a coenzyme in the mobilisation and utilisation of single-carbon groups(e.g. formyl, methyl) that are added to, or removed from, such metabolites as histi-dine, serine, glycine, methionine and purines. It is involved in the synthesis of RNA,DNA and neurotransmitters.
Deficiency symptoms
A variety of deficiency symptoms in chicks and young turkeys have been re-ported, including poor growth, anaemia, poor bone development and poor egghatchability. Folic acid deficiency symptoms rarely occur in other farm animals be-cause of synthesis by intestinal bacteria. Injections of folic acid in sows has in-creased litter size. In one experiment, dietary supplements resulted in higher foetalsurvival, thought to be related to prostaglandin activity, but the response has notbeen substantiated in other experiments, possibly because of the variable contentof folic acid in foods. Its role in nucleic acid metabolism concurs with the viewthat supplements might be beneficial at times of growth and differentiation of em-bryonic tissue.

Chapter 5 Vitamins
96
H2CS
CH
HN
HC
CNH
CH
O
(CH2)4 COOH
Biotin
BiotinChemical nature
A part of the vitamin B complex, biotin is chemically 2-keto-3,4-imidazolido-2-tetrahydrothiophene-n-valeric acid. Its structure is:
Sources
Biotin is widely distributed in foods: liver, milk, yeast, oilseeds and vegetables are richsources. However, in some foods, much of the bound vitamin may not be released dur-ing digestion and hence may be unavailable. Studies with chicks and pigs have shownthat the availability of biotin in barley and wheat is very low, whereas the biotin inmaize and certain oilseed meals, such as soya bean meal, is completely available.
Metabolism
Biotin serves as the prosthetic group of several enzymes that catalyse the transfer ofcarbon dioxide from one substrate to another. In animals there are three biotin-dependent enzymes of particular importance: pyruvate carboxylase (carbohydratesynthesis from lactate), acetyl coenzyme A carboxylase (fatty acid synthesis) andpropionyl coenzyme A carboxylase (the pathway of conversion of propionate tosuccinyl-CoA). The specific role of these enzymes in metabolism is discussed inChapter 9.
Deficiency symptoms
In pigs, biotin deficiency causes foot lesions, alopecia (hair loss) and dry scaly skin.In growing pigs, both growth rate and food utilisation are adversely affected. Inbreeding sows, a deficiency of the vitamin can adversely influence reproductive per-formance.
In poultry, biotin deficiency causes reduced growth, dermatitis, leg bone abnormali-ties, cracked feet, poor feathering, and fatty liver and kidney syndrome (FLKS).This lastcondition, which mainly affects 2- to 5-week-old chicks, is characterised by a lethargicstate with death frequently following within a few hours. On autopsy, the liver andkidneys, which are pale and swollen, contain abnormal depositions of lipid.
Although ruminants and horses do not have a requirement for dietary biotin,microbial production in the gut normally being adequate, feeding biotin hasimproved hoof structure and strength.
Biotin deficiency can be induced by giving animals avidin, a protein present in theraw white of eggs, which combines with the vitamin and prevents its absorptionfrom the intestine. Certain bacteria of the Streptomyces spp. that are present in soil

The vitamin B complex
97
N CH2CH2OH
CH3
CH3
+
Choline
CH3
and manure produce streptavidin and stravidin, which have a similar action to theegg white protein. Heating inactivates these antagonist proteins.
CholineChemical nature
The chemical structure of choline is:
Sources
Green leafy materials, yeast, egg yolk and cereals are rich sources of choline.
Metabolism
Unlike the other B vitamins, choline is not a metabolic catalyst but forms an essen-tial structural component of body tissues. It is a component of lecithins, which playa vital role in cellular structure and activity. It also plays an important part in lipidmetabolism in the liver, where it converts excess fat into lecithin or increases the util-isation of fatty acids, thereby preventing the accumulation of fat in the liver. Cholineis a component of acetylcholine, which is responsible for the transmission of nerveimpulses. Finally, choline serves as a donor of methyl groups in transmethylationreactions that involve folic acid or vitamin B12.Although other compounds, such asmethionine and betaine, can also act as methyl donors, they cannot replace cholinein its other functions.
Choline can be synthesised in the liver from methionine; the exogenous require-ment for this vitamin is therefore influenced by the level of methionine in the diet.
Deficiency symptoms
Deficiency symptoms, including slow growth and fatty infiltration of the liver, havebeen produced in chicks and pigs. Choline is also concerned with the prevention ofperosis or slipped tendon in chicks.The choline requirement of animals is unusuallylarge for a vitamin, but in spite of this, deficiency symptoms are not common infarm animals because of its wide distribution and its high concentrations in foods,and because it can be readily derived from methionine.
Vitamin B12
Chemical nature
Vitamin B12 has the most complex structure of all the vitamins.The basic unit is a cor-rin nucleus, which consists of a ring structure comprising four five-membered ringscontaining nitrogen. In the active centre of the nucleus is a cobalt atom.A cyano groupis usually attached to the cobalt as an artefact of isolation and, as this is the most sta-ble form of the vitamin, it is the form in which the vitamin is commercially produced.

Chapter 5 Vitamins
98
CONH2
CH2
CH2
CH.CH3
CH2
NH
N N
NN
CoH3C
NH2.CO.CH2
H3C
NH2.CO.CH2
CH3CO.CH2.CH2
H CH3CH3
CH2.CONH2
CH2.CH2.CONH2
CH3CH2.CH2.CONH2
CH3
CH3
N
NP
OO
O O
CC
C
O
CH
HH
H2COH
H
HO
CH3
CH3
CNA B
CD
Vitamin B12 (cyanocobalamin)
In the animal, the cyanide ion is replaced by a variety of ions, e.g. hydroxyl(hydroxocobalamin), methyl (methylcobalamin) and 5-deoxyadenosyl (5-deoxyadeno-sylcobalamin), the last two forms acting as coenzymes in animal metabolism.
Sources
Vitamin B12 is considered to be synthesised exclusively by microorganisms and its pres-ence in foods is thought to be ultimately of microbial origin.The main natural sourcesof the vitamin are foods of animal origin, liver being a particularly rich source. Its lim-ited occurrence in higher plants is still controversial, since many think that its presencein trace amounts may result from contamination with bacteria or insect remains.
Metabolism
Before vitamin B12 can be absorbed from the intestine it must be bound to a highlyspecific glycoprotein, termed the intrinsic factor, which is secreted by the gastric mu-cosa. In humans, the intrinsic factor may be lacking, which leads to poor absorptionof the vitamin and results in a condition known as pernicious anaemia.
The coenzymic forms of vitamin B12 function in several important enzyme sys-tems.These include isomerases, dehydrases and enzymes involved in the biosynthesis

Vitamin C
99
of methionine from homocysteine. Of special interest in ruminant nutrition is the roleof vitamin B12 in the metabolism of propionic acid into succinic acid. In this pathway,the vitamin is necessary for the conversion of methylmalonyl coenzyme A into suc-cinyl coenzyme A (see p. 203).
Deficiency symptoms
Adult animals are generally less affected by a vitamin B12 deficiency than are younggrowing animals, in which growth is severely retarded and mortality high.
In poultry, in addition to the effect on growth, feathering is poor and kidney dam-age may occur. Hens deprived of the vitamin remain healthy, but hatchability isadversely affected.
On vitamin B12-deficient diets, baby pigs grow poorly and show lack of coordina-tion of the hind legs. In older pigs, dermatitis, a rough coat and suboptimal growthresult. Intestinal synthesis of the vitamin occurs in pigs and poultry. Organisms thatsynthesise vitamin B12 have been isolated from poultry excreta; this fact has an im-portant practical bearing on poultry housed with access to litter, where a majority, ifnot all, of the vitamin requirements can be obtained from the litter.
Vitamin B12 and a number of biologically inactive vitamin B12 analogues are synthe-sised by microorganisms in the rumen and, in spite of poor absorption of the vitaminfrom the intestine, the ruminant normally obtains an adequate amount of the vitaminfrom this source. However, if levels of cobalt in the diet are low, a deficiency of the vita-min can arise and cause reduced appetite, emaciation and anaemia (see p. 125). If cobaltlevels are adequate, then except with very young ruminant animals, a dietary source ofthe vitamin is not essential. Horses also are supplied with sufficient B12 from microbialfermentation when sufficient cobalt is supplied. Parasitised horses have responded tovitamin B12 supplementation, presumably as a result of impaired digestive activity.
Other growth factors included in the vitamin B complex
A number of other chemical substances of an organic nature have been included inthe vitamin B complex.These include inositol, orotic acid, lipoic acid, rutin, carnitineand pangamic acid, but it is doubtful whether these compounds have much practicalsignificance in the nutrition of farm animals.
O C
CHO
C
C
C
CH2OH
HO
H
HO
O
H
L-Ascorbic acid
5.4 VITAMIN C
Chemical nature
Vitamin C is chemically known as L-ascorbic acid and has the following formula:

Chapter 5 Vitamins
100
The vitamin is a colourless, crystalline, water-soluble compound with acidic andstrong reducing properties. It is heat-stable in acid solution but is readily decom-posed in the presence of alkali. The destruction of the vitamin is accelerated byexposure to light.
Sources
Well-known sources of this vitamin are citrus fruits and green leafy vegetables.Synthetic ascorbic acid is available commercially.
Metabolism
Ascorbic acid plays an important part in various oxidation–reduction mechanisms inliving cells.The vitamin is necessary for the maintenance of normal collagen metabo-lism. It also plays an important role in the transport of iron ions from transferrin,found in the plasma, to ferritin, which acts as a store of iron in the bone marrow, liverand spleen. As an antioxidant, ascorbic acid works in conjunction with vitamin E inprotecting cells against oxidative damage caused by free radicals (see Box 5.2). Thevitamin is required in the diet of only a few vertebrates – humans, other primates,guinea pigs, the red-vented bulbul bird and the fruit-eating bat (both native to India)and certain fishes. Some insects and other invertebrates also require a dietary sourceof vitamin C. Other species synthesise the vitamin from glucose, via glucuronic acidand gulonic acid lactone; the enzyme L-gulonolactone oxidase is required for the syn-thesis, and species requiring ascorbic acid are genetically deficient in this enzyme.
Deficiency symptoms
The classic condition in humans arising from a deficiency of vitamin C is scurvy,characterised by oedema, emaciation and diarrhoea. Failure in collagen formationresults in structural defects in bone, teeth, cartilage, connective tissues and muscles.Resistance to infection is reduced.
Since farm animals can synthesise vitamin C, deficiency symptoms normally donot arise. However, it has been suggested that under certain conditions, e.g. climaticstress in poultry, the demand for ascorbic acid becomes greater than can be providedfor by normal tissue synthesis, and a dietary supplement may then be beneficial.
5.5 HYPERVITAMINOSIS
Hypervitaminosis is the name given to pathological conditions resulting from anoverdose of vitamins. Under ‘natural’ conditions it is unlikely that farm animals willreceive excessive doses of vitamins, although when synthetic vitamins are added todiets there is always the risk that abnormally large amounts may be ingested if errorsare made during mixing. There is experimental evidence that toxic symptoms canoccur if animals are given excessive quantities of vitamin A or D.
Clinical signs of hypervitaminosis A in young chicks kept under experimentalconditions and given very high doses of vitamin A include loss of appetite, poorgrowth, diarrhoea, encrustation around the mouth and reddening of the eyelids. Inpigs, toxic symptoms include rough coat, scaly skin, hyperirritability, haemorrhagesover the limbs and abdomen, periodic tremors and death.

Summary
101
SUMMARY
Vitamins are involved in metabolic pathways as coenzymes, and some act as protectors in antioxidantand immune systems. The sources and functions of individual vitamins, and the disorders caused bytheir deficiencies, are summarised below.
Vitamin Source Actions Deficiency symptoms
A, retinol Fish-liver oil Sight, epithelial tissues
D3, cholecalciferol Fish-liver oil, sun-dried roughage
E, a-tocopherol Green foods, cereals Antioxidant Muscle degeneration, liver damage
K, menadione Green foods, egg yolk Prothrombin synthesis
B1, thiamin Seeds Carbohydrate and fat metabolism
B2, riboflavin Green foods, milk Carbohydrate and amino acid metabolism
Nicotinamide Yeast, liver, tryptophan Hydrogen transfer (NAD and NADP)
B6, pyridoxine Cereals, yeast Amino acid metabolism Poor growth, convulsions
Pantothenic acid Liver, yeast, cereals Acetate and fatty acid metabolism (coenzyme A)
Folic acid Green foods, cereals,oilseed meals
Biotin Liver, vegetables Carbon dioxide transfer Foot lesions, hair loss, FLKS
Choline Green foods, cereals, methionine
B12, cyanocobalamin Microorganisms, liver Propionate metabolism Poor growth, anaemia, poor coat/feathering
C, ascorbic acid Citrus fruits, leafy vegetables
FLKS = fatty liver and kidney syndrome.
Excessive intake of vitamin D causes abnormally high levels of calcium and phos-phorus in the blood, which results in the deposition of calcium salts in the arteriesand organs. Symptoms of hypervitaminosis D have been noted in cattle and calves.In the UK, the maximum amount of vitamin D supplement added to diets for farmanimals is controlled by legislation.
Depression in growth and anaemia caused by excessive doses of menadione (vita-min K) have been reported.
Blindness, epithelial infection
Calcium absorption Rickets
Anaemia, delayed clotting
Poor growth, polyneuritis
Poor growth, curled toe paralysis
Poor growth, dermatitis
Poor growth, scaly skin, ‘goose-stepping’ in pigs
Metabolism of single carbon compounds
Component of lecithin Poor growth, fatty liver, perosis
Oxidation–reduction reactions
Reduced resistance toinfection
Poor growth, anaemia, poor hatchability

Chapter 5 Vitamins
102
FURTHER READING
Bender, D A 1992 Nutritional Biochemistry of the Vitamins, Cambridge, CambridgeUniversity Press.
Bieber-Wlaschny M 1988 Vitamin requirements of the dairy cow. In: Garnsworthy P C (ed.)Nutrition and Lactation in the Dairy Cow, London, Butterworth, pp. 135–56.
Chew B P 1995 The influence of vitamins on reproduction in pigs. In: Garnsworthy P C andCole D J A (eds) Recent Advances in Animal Nutrition 1995, Nottingham, NottinghamUniversity Press, pp. 223–39.
Debier, C and Larondelle, Y 2005 Vitamins A and E: metabolism, roles and transfer tooffspring. British Journal of Nutrition 93: 153–74.
Latscha T 1990 Carotenoids: Their Nature and Significance in Animal Feeds, Basel,Hoffmann–La Roche.
Morris J G 2002 Idiosyncratic nutrient requirements of cats appear to be diet-induced evolu-tionary adaptations. Nutrition Research Reviews 15: 153–68.
National Research Council 1994 Nutrient Requirements of Poultry, 9th edn,Washington, DC,National Academy Press.
National Research Council 1998 Nutrient Requirements of Swine, 10th edn,Washington, DC,National Academy Press.
National Research Council 2000 Nutrient Requirements of Beef Cattle, 7th edn,Washington,DC, National Academy Press.
National Research Council 2001 Nutrient Requirements of Dairy Cattle, 7th edn,Washington,DC, National Academy Press.
National Research Council 2006 Nutrient Requirements of Dogs and Cats, Washington, DC,National Academy Press.
National Research Council 2007 Nutrient Requirements of Horses, 6th edn,Washington, DC,National Academy Press.
National Research Council 2007 Nutrient Requirements of Small Ruminants, Washington,DC, National Academy Press.
Whitehead C C 1986 Requirements for vitamins. In: Fisher C and Boorman K N (eds)Nutrient Requirements of Poultry and Nutrition Research, London, Butterworth,pp. 173–89.

103
6.1 Functions of minerals
6.2 Natural and supplementary sources of minerals
6.3 Acid–base balance
6.4 Major elements
6.5 Trace elements
6.6 Other elements
6 Minerals
6.1 FUNCTIONS OF MINERALS
Although most of the naturally occurring mineral elements are found in animal tis-sues, many are thought to be present merely because they are constituents of theanimal’s food and may not have an essential function in the animal’s metabolism.The term ‘essential mineral element’ is restricted to a mineral element that has beenproven to have a metabolic role in the body. Before an element can be classed asessential it is generally considered necessary to prove that purified diets lacking the element cause deficiency symptoms in animals and that those symptoms can beeradicated or prevented by adding the element to the experimental diet. Mostresearch on mineral nutrition has been carried out in this way. However, some of themineral elements required by animals for normal health and growth are needed insuch minute amounts that the construction of deficient diets is often difficult toachieve and deficiency has been demonstrated only in laboratory animals under spe-cial conditions. In such studies it is necessary not only to monitor food and watersupplies but also to ensure that animals do not obtain the element under investiga-tion from cages, troughs, attendants or dust in the atmosphere.
Requirements or allowances for minerals may be derived factorially from theamounts required to meet endogenous losses and the mineral retained or excreted inproducts, or, more usually for the trace elements, empirically from dose responses tolevels in the diet.The main problem for the minerals with more than one function isdeciding on the criterion for adequacy. Dietary levels of mineral that are sufficientfor one function may be inadequate for another. Adequacy for the short period ofgrowth of animals slaughtered for meat may not cover the long-term needs of breed-ing and longevity of adult stock. Also, for the minerals involved in bone formation,there are many criteria, such as bone dimensions, strength, histology and composi-tion. Depletion of body reserves in times of undernutrition will supply the mineral
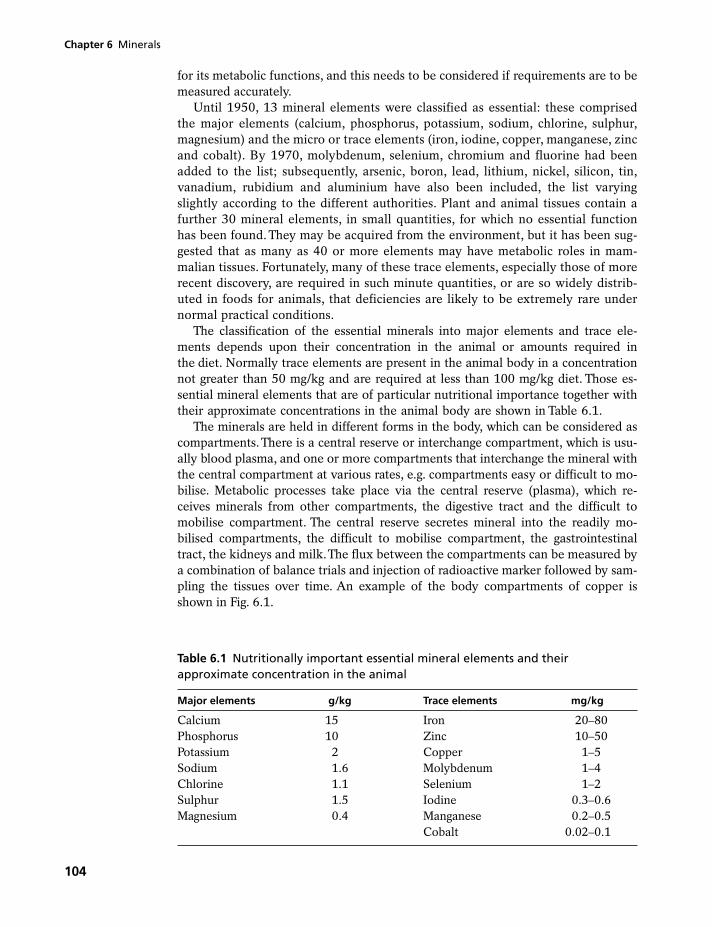
Chapter 6 Minerals
104
for its metabolic functions, and this needs to be considered if requirements are to bemeasured accurately.
Until 1950, 13 mineral elements were classified as essential: these comprisedthe major elements (calcium, phosphorus, potassium, sodium, chlorine, sulphur,magnesium) and the micro or trace elements (iron, iodine, copper, manganese, zincand cobalt). By 1970, molybdenum, selenium, chromium and fluorine had beenadded to the list; subsequently, arsenic, boron, lead, lithium, nickel, silicon, tin,vanadium, rubidium and aluminium have also been included, the list varyingslightly according to the different authorities. Plant and animal tissues contain afurther 30 mineral elements, in small quantities, for which no essential functionhas been found. They may be acquired from the environment, but it has been sug-gested that as many as 40 or more elements may have metabolic roles in mam-malian tissues. Fortunately, many of these trace elements, especially those of morerecent discovery, are required in such minute quantities, or are so widely distrib-uted in foods for animals, that deficiencies are likely to be extremely rare undernormal practical conditions.
The classification of the essential minerals into major elements and trace ele-ments depends upon their concentration in the animal or amounts required inthe diet. Normally trace elements are present in the animal body in a concentrationnot greater than 50 mg/kg and are required at less than 100 mg/kg diet. Those es-sential mineral elements that are of particular nutritional importance together withtheir approximate concentrations in the animal body are shown in Table 6.1.
The minerals are held in different forms in the body, which can be considered ascompartments.There is a central reserve or interchange compartment, which is usu-ally blood plasma, and one or more compartments that interchange the mineral withthe central compartment at various rates, e.g. compartments easy or difficult to mo-bilise. Metabolic processes take place via the central reserve (plasma), which re-ceives minerals from other compartments, the digestive tract and the difficult tomobilise compartment. The central reserve secretes mineral into the readily mo-bilised compartments, the difficult to mobilise compartment, the gastrointestinaltract, the kidneys and milk.The flux between the compartments can be measured bya combination of balance trials and injection of radioactive marker followed by sam-pling the tissues over time. An example of the body compartments of copper isshown in Fig. 6.1.
Table 6.1 Nutritionally important essential mineral elements and theirapproximate concentration in the animal
Major elements g/kg Trace elements mg/kg
Calcium 15 Iron 20–80Phosphorus 10 Zinc 10–50Potassium 2 Copper 1–5Sodium 1.6 Molybdenum 1–4Chlorine 1.1 Selenium 1–2Sulphur 1.5 Iodine 0.3–0.6Magnesium 0.4 Manganese 0.2–0.5
Cobalt 0.02–0.1

Functions of minerals
105
Fig. 6.1 Diagram of the possible routes of movement of copper in the ruminantbody. A is a temporary storage compartment for copper in the liver destined forexchange with blood and excretion into bile, B represents a temporary storagefor incorporation into caeruloplasmin and C represents a long-term storagecompartment.
Adapted from Symonds H W and Forbes J M 1993 Mineral metabolism. In: Forbes J M and France J (eds)Quantitative Aspects of Ruminant Digestion and Metabolism, Wallingford, CABI.
Dietarycopper
Faecalcopper
(unabsorbeddietary and
endogenous)
Absorbed
Endogenousloss
Bile
(i)
(ii)
(iii)
Tissue
Blood
LiverA
LiverB
LiverC
Kidney
FoetusMilk
Urine
Nearly all the essential mineral elements, both major and trace, are believed tohave one or more catalytic functions in the cell. Some mineral elements are firmlybound to the proteins of enzymes (see Box 6.1), while others are present in pros-thetic groups in chelated form. A chelate is a cyclic compound that is formed be-tween an organic molecule and a metallic ion, the latter being held within theorganic molecule as if by a claw (‘chelate’ is derived from the Greek work meaning‘claw’). Examples of naturally occurring chelates are the chlorophylls, cytochromes,haemoglobin and vitamin B12.
Elements such as sodium, potassium and chlorine have primarily an electrochem-ical or physiological function and are concerned with the maintenance of acid–basebalance, membrane permeability and the osmotic control of water distributionwithin the body. Some elements have a structural role, for example calcium andphosphorus are essential components of the skeleton and sulphur is necessary forthe synthesis of structural proteins. Finally, certain elements have a regulatory func-tion in controlling cell replication and differentiation; zinc acts in this way by influ-encing the transcription process, in which genetic information in the nucleotidesequence of DNA is transferred to that of an RNA molecule. It is not uncommon foran element to have a number of different roles; for example, magnesium functionscatalytically, electrochemically and structurally.
A number of elements have unique functions. Iron is important as a constituentof haem, which is an essential part of a number of cytochromes important in respira-tion. Cobalt is a component of vitamin B12 and iodine forms part of the hormonethyroxine.

Chapter 6 Minerals
106
Some elements, for example calcium and molybdenum, may interfere with theabsorption, transport, function, storage or excretion of other elements. There aremany ways in which minerals may interact, but the three major ways involve theformation of unabsorbable compounds, competition for metabolic pathways andthe induction of metal-binding proteins.The interaction of minerals with each otheris an important factor in animal nutrition, and an imbalance of mineral elements –as distinct from a simple deficiency – is important in the aetiology of certain nutri-tional disorders of farm animals.The use of radioactive isotopes in recent years hasadvanced our knowledge of mineral nutrition, although there are many nutritionaldiseases associated with minerals whose exact causes are still unknown.
Although we have been considering the essential role of minerals in animalnutrition, it is important to realise that many are toxic – causing illness or death – ifgiven to the animal in excessive quantities. This is particularly true of copper, sele-nium, molybdenum, fluorine, vanadium and arsenic. Copper is a cumulative poison,the animal body being unable to excrete it efficiently; small amounts of coppergiven in excess of the animal’s daily needs will, in time, produce toxic symptoms.This also applies to the element fluorine. Supplementation of any diet with miner-als should always be carried out with great care, and the indiscriminate use of traceelements in particular must be avoided. Ideally, the supplement should be tailoredto the target animal and a blanket oversupply should be avoided as it is wastefuland potentially dangerous. Minerals should be added to concentrate foods via apremix and thoroughly mixed to avoid ‘hot spots’ of high concentration and poten-tial toxicity.
BOX 6.1 Mineral elements and enzymes
Below are some examples of the involvement of minerals in enzymes (summarised from Underwoodand Suttle – see Further reading).
Mineral Enzyme Function
Iron Succinate dehydrogenase Aerobic oxidation of carbohydratesCytochromes a, b and c Electron transfer
Copper Cytochrome oxidase Terminal oxidaseCeruloplasmin (ferroxidase) Iron utilisation: copper transportSuperoxide dismutase Dismutation of superoxide radical O2*
-
Zinc Carbonic anhydrase CO2 formationAlcohol dehydrogenase Alcohol metabolismCarboxypeptidase A Protein digestionAlkaline phosphatase Hydrolysis of phosphate esters
Manganese Pyruvate carboxylase Pyruvate metabolismSuperoxide dismutase Antioxidant by removing O2*
-
Molybdenum Xanthine dehydrogenase Purine metabolismSulphite oxidase Sulphite oxidation
Selenium Glutathione peroxidases Removal of H2O2 and hydroperoxidesType I and III deiodinases Conversion of thyroxine to active form

Natural and supplementary sources of minerals
107
6.2 NATURAL AND SUPPLEMENTARY SOURCES OF MINERALS
Plants and plant products form the main supply of nutrients to animals, and the compo-sition of plants will influence the animal’s mineral intake.Thus, the species and stage ofmaturity of the plant, the type of soil and climate, and the seasonal conditions are im-portant factors. Legumes tend to be richer in the major minerals and certain trace ele-ments than are grasses, and this is also the case with the seeds of legumes comparedwith the seeds of grasses and cereals. Soil conditions and mineral content affect the up-take of minerals by plants, and this can be further influenced by fertiliser application.One of the major influences is soil pH, the effect of which differs among the elements.For example, molybdenum uptake by plants increases with an increase in soil pH, butcobalt and manganese contents decrease.Therefore, adjusting soil pH with lime will in-fluence the mineral content of plants. Herbage magnesium content and availability canbe reduced by potassium and nitrogen fertilisers.The main animal products used in ani-mal feeding, fishmeal, whey and skimmed milk, are good sources of the major minerals.
Usually, diets for farm animals contain a mineral/trace element/vitamin supple-ment and, on occasions, it is necessary to include extra supplies of some minerals,e.g. calcium for laying hens. Common sources of minerals used in mineral supple-ments are limestone for calcium, dicalcium phosphate for phosphorus, common saltfor sodium, and calcined magnesite for magnesium. Trace elements are usually sup-plied in a salt form, e.g. selenium as sodium selenite. When considering sources ofmineral, the cost, chemical and physical form, and freedom from impurities aretaken into account. It is also necessary to take account of the availability of the ele-ment in question (see Chapter 10). Calcium tends to have a high availability frommost sources and the phosphorus in ortho- and meta-phosphates has an availabilityof 80–100 per cent.The availability of phosphorus from rock phosphates can be verylow. Magnesium from calcined magnesite has an availability of 50–60 per cent,whereas that from magnesium sulphate is up to 70 per cent. Sulphur from sulphatesis 50–90 per cent available.The availability of trace elements in the form of sulphate,chloride or nitrate salts is high because they are water-soluble. Table 6.2 shows theavailability of minerals in a number of sources relative to a standard source. In theseexamples the criteria used to assess the relative availability of the different mineralsvary, e.g. absorption, accumulation in tissues, production of metabolically activecompounds; hence, some sources in Table 6.2 have values greater than 100 per centwhen compared with the standard source of the mineral.
Free ions from inorganic sources can form complexes with other dietary con-stituents, resulting in low absorbability and availability to the animal. Minerals in‘chelated’ or ‘organic’ form (where the element is in combination with an organicmolecule such as an amino acid) are protected from reaction with other constituentsand theoretically have a greater absorbability than inorganic sources. Chelates werementioned above and the addition of chelated minerals as supplements to diets iscurrently an active area of research. One of the most potent chelating agents is thesynthetic compound ethylenediamine tetraacetic acid (EDTA), which has the prop-erty of forming stable chelates with heavy metals. In vitro, however, chelates ofcobalt were not more effective than cobalt chloride in stimulating microbial synthe-sis of vitamin B12, and oral supplements of cobalt EDTA and cobalt sulphate gavesimilar liver and serum vitamin B12 contents. The addition of chelating agents suchas EDTA to poultry diets may in some cases improve the availability of the mineralelement. However, the bonding between the metal and EDTA is strong, and work

Chapter 6 Minerals
108
with copper chelates in sheep has shown that the copper is no more available than ininorganic salts. Recently the manufacture of different forms of trace element–organiccomplex has increased. In 1998 the Association of American Feed Control Officialsdefined four categories of such complexes:
■ Metal amino acid complex: The product resulting from complexing of a solublemetal salt with an amino acid.
■ Metal amino acid chelate: The product of the reaction of a metal ion from a solu-ble metal salt with amino acids with a mole ratio of one mole of metal to threemoles (preferably two) of amino acids to form coordinate covalent bonds. Theaverage weight of the hydrolysed amino acids must be approximately 150 and the resulting molecular weight of the chelate must not exceed 800.
■ Metal polysaccharide complex: The product resulting from complexing of a solu-ble salt with a polysaccharide solution.
Table 6.2 Examples of the relative availability (%) of mineral elements frommineral compounds
Mineral compound Poultry Pigs Cattle Sheep
Cobaltous sulphate – – – 100Cobalt glucoheptate – – – 85Cobalt carbonate – – – 100Cupric sulphate 100 100 100 100Copper-lysine 105 – 100 –Copper-methionine 90 110 – –Cupric carbonate 65 85 – –Cupric chloride 110 – 115 115Ferrous sulphate (7H2O) 100 100 100 100Ferric citrate 75 150 110 –Ferric oxide 10 10 – 5Ferrous chloride 100 – – –Iron-methionine – 185 –Iron-proteinate – 125 –Manganese sulphate 100 – – 100Manganese carbonate 55 – – 30Manganese-methionine 120 – – 125Manganous chloride 100 – – –Sodium selenite 100 100 100 100Seleno-cystine 110 – – –Seleno-methionine 80a/115b 120a/150b – –Seleno-yeast – – 290 100Zinc chloride 100 100 – –Zinc sulphate 100 – 100 100Zinc-lysine – 100 – –Zinc-methionine 125 100 – 100
aAssessed from glutathione peroxidase production or incidence of exudative diathesis.bAssessed from whole body or tissue selenium retention or incidence of pancreatic fibrosis.
Summarised from Ammerman C B, Henry P R and Miles R D 1998 Supplemental organically-bound mineralcompounds in livestock nutrition. In: Garnsworthy P C and Wiseman J (eds) Recent Advances in AnimalNutrition, Nottingham, Nottingham University Press, pp. 67–91.
Natural and supplementary sources of minerals
109
■ Metal proteinate: The product resulting from the chelation of a soluble salt withamino acids and/or partially hydrolysed protein.
Amino acid and peptide chelates are absorbed efficiently, possibly because they aretaken up by the peptide absorption mechanism rather than the active transportmechanism for minerals (see Chapter 8), although this has not been proven. Levelsof iron in the tissues of piglets and piglet growth have been improved by giving aniron proteinate to the sow. However, the piglets also had access to the sow’s faecesand may have obtained iron from these. Again, although zinc methionine has im-proved tissue levels of zinc in pigs, results have not been consistent.The replacementof sodium selenite by selenium-enriched yeast has improved the selenium content ofserum, milk and tissues of gilts and the selenium status of their offspring. Selenium-enriched yeast in diets for lactating cows has increased the transfer of selenium tomilk when compared with selenite. In the case of selenium the element is not in theform of one of the complexes mentioned above but replaces sulphur in the aminoacids that normally contain sulphur. However, inorganic selenium supplements arealso effective and at a lower cost. Owing to the different properties of the chelatingagents and the variable reponses observed, their use as mineral supplements is con-troversial.There are many reports in the popular press claiming increased responses.A critical review by Underwood and Suttle (1999; see Further reading) suggests cau-tion at this stage until evidence of consistent responses is published in scientific jour-nals. In view of their cost, it is unlikely that they will replace inorganic sources ofmineral entirely, but they may be appropriate for special applications. It is suggestedthat ‘organic’ minerals provide an extra supply of the element when there is reducedefficiency of inorganic sources owing to interference from other minerals. Thesepreparations have also been advocated for use to reduce the excretion of unabsorbedmineral and thus reduce the effect on the environment. The EU legislation on feed-ing stuffs permits only named supplements.
Mineral supplementation of animals at pasture can be a problem. Minerals can beincorporated into free-access feed blocks, which also provide a source of energy andnitrogen. However, individual animal intake can be variable. Intake depends on sea-son, weather conditions, the siting and number of blocks (to minimise competition),frequency of renewal and availability of water. The inclusion of oil or molasses im-proves palatability.
Spraying the pasture with soluble salts of trace elements can increase the elementcontent of the pasture. Alternatively, trace elements can be included in fertilisers inorder to increase the herbage content via the soil. However, if the deficiency is due topoor availability of the element, then this type of application will not be successful.
For some of the trace elements, e.g. cobalt and copper, a solid bolus can be de-posited into the rumen using a dosing gun.This bolus dissolves slowly over a periodof months, giving a steady release of the element.There can be problems of regurgi-tation of the bolus and they may become coated, thereby reducing the effective re-lease of the mineral. Recently, boluses formed from soluble glass have beenproduced that are not susceptible to this coating action. The glass boluses may con-tain more than one element (e.g. cobalt and selenium), anthelmintics, and vitaminsA, D or E. Needles of copper oxide, which have a high specific gravity and areretained in the abomasum, have also been used in this way. For certain minerals(e.g. copper, iodine and selenium), oral doses, drenches or injections with solutionsor pastes can be given at appropriate intervals, but the labour requirement is high.

Chapter 6 Minerals
110
6.3 ACID–BASE BALANCE
Normally in nutrition, minerals, including those with electrolytic properties, are con-sidered functionally as separate entities. In physiological terms, however, the elec-trolytes need to be taken together since cells require a specific balance of anions andcations to function efficiently. Physiological processes operate within a narrow rangeof conditions, especially with respect to pH. In addition, enzyme systems, and hencecell metabolism, are sensitive to pH. Thus, changes in acid–base status have a wideinfluence on cell function and the animal must regulate the input and output of ionsto maintain acid–base homeostasis. Failure to maintain the correct electrolyte bal-ance within the cell means that metabolic pathways are unable to function efficientlyand resources are diverted to achieving homeostasis at the expense of growth. Thediet is important in the maintenance of the correct intracellular electrolyte balanceowing to the metabolisable anions and cations that it contains and that consume orgenerate acid during metabolism.Thus, an excess of anions will result in the produc-tion of hydrogen ions to counterbalance the anions, giving metabolic acidosis,whereas an excess of cations requires ions such as acetate and bicarbonate andcauses alkalosis. These effects are independent of the specific metabolic or physio-logical roles of the particular element. The balance of acids and bases influencesmany functions such as growth rate, appetite, amino acid and energy metabolism,calcium utilisation, vitamin metabolism, intestinal absorption and kidney function.Changes in cellular pH are often accompanied by changes in blood and urine pH.Dietary influence in this respect may be assessed by measuring the dietary electrolytebalance, defined as:
Na++ K+
- Cl-
where Na+, K+ and Cl- are the concentrations of the elements in mequiv per unitweight. The dietary electrolyte balance is commonly used to assess the diets of pigsand poultry. Pigs are more susceptible to excess anions than to cations, and the opti-mal dietary electrolyte balance is around 250 mequiv/kg. In poultry, eggshell forma-tion has an effect on the acid–base balance as hydrogen ions are generated whencalcium carbonate is being synthesised. A dietary electrolyte balance of 200–300 mequiv/kg is recommended for laying hens. In conditions of heat stress, elevatedrespiration rate (panting) leads to respiratory alkalosis and in poultry and dairy cowsthe acid–base balance of the diet has been adjusted to alleviate this. Ideally, otherelements making a contribution to electrolyte balance should be considered and amore sophisticated assessment may be achieved by calculating (Na+
+ K++ Ca++
+
Mg++) - (Cl- + H2PO4
-+ HPO4
- -+ SO4
- -).This is termed the dietary undeterminedanion.The latter requires a substantial analytical facility and in practice the less com-prehensive dietary electrolyte balance is generally considered to be sufficient. Re-cently, in ruminant nutrition the cation–anion balance or dietary cation–aniondifference (DCAD) has been used to assess the electrolyte status of diets. This iscalculated as (Na+
+ K+) - (Cl- + SO4
- -) or alternatively as (Na+ + K+) - (Cl-
+ S- -).Manipulation of the cation–anion difference is now recommended as part of thedietary management of dairy cows in order to avoid hypocalcaemia or milk fever(see Box 6.2).
In the above it is seen that there may be confusion with terminology and themethod of calculation (i.e. which ions are included) of the acid–base status of the

Acid–base balance
111
BOX 6.2 Dietary cation–anion difference and milk fever
The metabolic acid–base balance affects the sensitivity of bone to parathyroid hormone (PTH) andthe synthesis of 1,25-dihydroxycholecalciferol. Therefore, acknowledging this when balancing themineral content of the diet can have an effect on the incidence of milk fever. Conditions that promotean alkalotic state (high dietary cations, Na+ and K+) reduce the sensitivity of bone to PTH and canlimit the release of calcium. Conversely, an acidotic state (high dietary anions, Cl- and S- - ) increasesthe sensitivity to PTH, increases 1,25-dihydroxycholecalciferol production and hence increases thecalcium supply.Through these metabolic responses, manipulation of the acid–base balance in the dietof the pre-calving cow has been successful in reducing the incidence of milk fever.
Early work used the dietary electrolyte balance calculation (Na++ K+
- Cl-), but subsequently itwas found that the inclusion of SO4
- - or S- - was beneficial. Thus, dietary cation–anion difference(DCAD) as (Na+
+ K+) - (Cl- + SO4-) or (Na+
+ K+) - (Cl- + S-) is used when calculating and ma-nipulating the acid–base balance of the diet. The recommended target for the latter calculation isaround -100 mequiv/kg.The optimal DCAD probably varies with several factors such as breed andfeeding management. Recent studies have shown that Cl- ions are more acidogenic than S- ions,probably owing to differences in dissociation in and absorption from the digestive tract.
In practice, manipulation of the diet involves minimising foods high in potassium and sodium.Grass silage is the major problem, often containing 30–40 g potassium/kg DM, and alkali-treated grainand molasses should also be avoided. The cereal by-product, brewer’s grains, is a food that is low insodium and potassium. Unlike the low-calcium diet strategy, the DCAD strategy requires a moderateto high calcium intake to be maintained. Supplementary anionic salts (e.g. ammonium chloride, am-monium sulphate, magnesium chloride, calcium chloride) can be used to adjust the DCAD, but theytend to be unpalatable. Practical application of this stategy requires knowledge of the mineral contentsof the foods.To ensure there is adequate magnesium for effective calcium absorption and mobilisation,the magnesium content of the diet is adjusted to 3.5 g/kg DM using magnesium sulphate or magne-sium chloride, and the sulphur content is set at 4 g/kg DM using calcium or ammonium sulphate.Higher magnesium (up to 4 g/kg DM) may be required if the potassium content of the diet is high inview of the latter’s effect on magnesium absorption.The DCAD can then be manipulated with ammo-nium or calcium chloride. Calcium intake is maintained at 120–150 g/day and phosphorus at 50 g/day.This approach to the problem of milk fever requires careful management, since the high quantities ofanionic salts involved may reduce food intake and precipitate other metabolic problems.The effective-ness of the strategy can be checked by measuring urine pH, which should be slightly acidic at around6.5. It is recommended that the diets are given for at least 2 weeks but no more than 4 weeks beforecalving.Although pregnant heifers show the same responses as cows in terms of increased blood cal-cium with decreasing DCAD, food intake was depressed and they did not have increased milk yields.It is currently recommended that heifers should not be given supplementary anions. Current researchis investigating alterations to DCAD to improve food intake and milk production. Early lactation dietscontain large amounts of rumen-fermentable carbohydrate and a positive DCAD would, in theory,help to reduce rumen and blood acidosis.
diet. Some authorities suggest the inclusion of NH4+, HCO3
- and CO3- -, while others
recommend that the absorption coefficient should also be accounted for. However,such refinement will require much more research and information before this type ofmodel can be applied.
Certain pathological conditions may cause disturbances in electrolyte balance,e.g. vomiting (loss of chloride), diarrhoea (loss of bicarbonate) and excessive amino

Chapter 6 Minerals
112
6.4 MAJOR ELEMENTS
Calcium
Calcium is the most abundant mineral element in the animal body. It is an importantconstituent of the skeleton and teeth, in which about 99 per cent of the total bodycalcium is found; in addition, it is an essential constituent of living cells and tissuefluids. Calcium is essential for the activity of a number of enzyme systems, includingthose necessary for the transmission of nerve impulses and for the contractile prop-erties of muscle. It is also concerned in the coagulation of blood. In blood, the ele-ment occurs in the plasma; the plasma of mammals usually contains 80–120 mgcalcium/l, but that of laying hens contains more (300–400 mg/l).
Composition of bone
Bone is highly complex in structure, the dry matter consisting of approximately 460 gmineral matter/kg, 360 g protein/kg and 180 g fat/kg.The composition varies, how-ever, according to the age and nutritional status of the animal. Calcium and phospho-rus are the two most abundant mineral elements in bone; they are combined in aform similar to that found in the mineral hydroxyapatite, 3Ca3(PO4)2.Ca(OH)2.Bone ash contains approximately 360 g calcium/kg, 170 g phosphorus/kg and 10 gmagnesium/kg.
The skeleton is not a stable unit in the chemical sense, since large amounts of thecalcium and phosphorus in bone can be liberated by reabsorption. This takes placeparticularly during lactation and egg production, although the exchange of calciumand phosphorus between bones and soft tissue is always a continuous process. Re-sorption of calcium is controlled by the action of the parathyroid gland. If animalsare fed on a low-calcium diet, the ionic calcium concentration in the extracellularfluid falls, the parathyroid gland is stimulated and the hormone produced causes re-sorption of bone, liberating calcium to meet the requirements of the animal. Sincecalcium is combined with phosphorus in bone, the phosphorus is also liberated andexcreted by the animal.
The parathyroid hormone also plays an important role in regulating the amountof the calcium absorbed from the intestine by influencing the production of 1,25-dihydroxycholecalciferol, a derivative of vitamin D, which is concerned with theformation of calcium-binding protein (see p. 80). Finally, the hormone stimulates thekidney to resorb urinary calcium.
Deficiency symptoms
If calcium is deficient in the diet of young growing animals, then satisfactory bone for-mation cannot occur and the condition known as rickets is produced.The symptomsof rickets are misshapen bones, enlargement of the joints, lameness and stiffness. Inadult animals, calcium deficiency produces osteomalacia, in which the calcium in the
acid oxidation (excess acid production).These, however, are largely outside the con-trol of the nutritionist.

Major elements
113
bone is withdrawn and not replaced. In osteomalacia, the bones become weak andare easily broken. In hens, deficiency symptoms are soft beak and bones, retardedgrowth and bowed legs; the eggs have thin shells and egg production may be reduced.The symptoms described above for rickets and osteomalacia are not specific for cal-cium and can also be produced by a deficiency of phosphorus, an abnormal calcium :phosphorus ratio or a deficiency of vitamin D (see p. 80). A number of factors can beresponsible for subnormal calcification.
Milk fever (parturient paresis) is a condition that most commonly occurs in dairycows shortly after calving. It is characterised by a lowering of the serum calciumlevel, muscular spasms and, in extreme cases, paralysis and unconsciousness. Theexact cause of hypocalcaemia associated with milk fever is obscure, but it is gener-ally considered that, with the onset of lactation, the parathyroid gland is unable torespond rapidly enough to increase calcium absorption from the intestine to meetthe extra demand. Normal levels of blood calcium can be restored by intravenous in-jections of calcium gluconate, but this may not always have a permanent effect. Ithas been shown that avoiding excessive intakes of calcium while maintaining ade-quate dietary levels of phosphorus during the dry period reduces the incidence ofmilk fever. Deliberate use of low-calcium diets to increase calcium absorption in thepractical prevention of milk fever requires a good estimate of calving date, otherwisecalcium deficiency may occur. Also low-calcium diets are hard to achieve with for-ages unless straw is used. Recently, success in controlling milk fever has beenachieved by manipulating the acid–base balance of the diet (see Box 6.2).Adminis-tration of large doses of vitamin D3 for a short period before parturition has alsoproved beneficial, but the timing is critical. Hypocalcaemia in ewes bearing twinsoften occurs before lambing.
Sources of calcium
Milk, green leafy crops, especially legumes, and sugar beet pulp are good sources ofcalcium; cereals and roots are poor sources. In some lucerne crops, calcium associ-ated with oxalates is unavailable. Animal by-products containing bone, such as fish-meal, are excellent sources. Calcium-containing mineral supplements that arefrequently given to farm animals, especially lactating animals and laying hens, in-clude ground limestone, steamed bone flour and dicalcium phosphate. If rock cal-cium phosphate is given to animals it is important to ensure that fluorine is absent,otherwise this supplement may be toxic. High levels of fat in the diet of monogastricanimals result in the formation of calcium soaps of fatty acids, which reduce the ab-sorbability of calcium.
Calcium : phosphorus ratio
When giving calcium supplements to animals it is important to consider the calcium :phosphorus ratio of the diet, since an abnormal ratio may be as harmful as a defi-ciency of either element in the diet.The calcium : phosphorus ratio considered mostsuitable for farm animals other than poultry is generally within the range 1 : 1 to 2 : 1,although there is evidence that suggests that ruminants can tolerate rather higherratios providing that the phosphorus requirements are met. In the case of the calciumand phosphorus requirements for ruminants published by the Agriculture and FoodResearch Council’s Technical Committee on Responses to Nutrients, the requirement

Chapter 6 Minerals
114
for phosphorus can exceed that of calcium in some circumstances.The proportion ofcalcium for laying hens is much larger, since they require great amounts of the elementfor eggshell production. The calcium is usually given to laying hens as ground lime-stone mixed with the diet or, alternatively, calcareous grit may be given ad libitum.Granular limestone is more effective since the large particles are retained in thegizzard for a longer time.
Phosphorus
Phosphorus has more known functions than any other mineral element in the animalbody. The close association of phosphorus with calcium in bone has already beenmentioned. In addition, phosphorus occurs in phosphoproteins, nucleic acids andphospholipids.The element plays a vital role in energy metabolism in the formationof sugar-phosphates and adenosine di- and triphosphates (see Chapter 9).The impor-tance of vitamin D in calcium and phosphorus metabolism has already been dis-cussed in Chapter 5.The phosphorus content of the animal body is considerably lessthan that of calcium content.Whereas 99 per cent of the calcium found in the bodyoccurs in the bones and teeth, the proportion of the phosphorus in these structures isabout 80–85 per cent of the total; the remainder is in the soft tissues and fluids,where it serves the essential functions mentioned above. The control of phosphorusmetabolism is different from that of calcium. If it is in an available form, phosphorusis absorbed well even when there is an excess over requirement. The excess is ex-creted via the kidney or the gut (via saliva). In monogastric animals, the kidney isthe primary route of excretion. Plasma phosphorus diffuses into saliva and in rumi-nants the large amount of chewing during rumination results in saliva being themajor input of phosphorus into the rumen rather than the food.
Deficiency symptoms
Extensive areas of phosphorus-deficient soils occur throughout the world, especiallyin tropical and subtropical areas, and a deficiency of phosphorus can be regarded asthe most widespread and economically important of all the mineral disabilities af-fecting grazing livestock.
Like calcium, phosphorus is required for bone formation and a deficiency can alsocause rickets or osteomalacia. Pica, or depraved appetite, has been noted in cattlewhen there is a deficiency of phosphorus in the diet; the affected animals have ab-normal appetites and chew wood, bones, rags and other foreign materials. Pica is notspecifically a sign of phosphorus deficiency, since it may be caused by other factors.Evidence of phosphorus deficiency may be obtained from an analysis of bloodserum, which shows a phosphorus content lower than normal. In chronic phosphorusdeficiency, animals may have stiff joints and muscular weakness.
Low dietary intake of phosphorus has also been associated with poor fertility,with apparent dysfunction of the ovaries causing inhibition, depression or irregular-ity of oestrus.There are many examples throughout the world of phosphorus supple-mentation increasing fertility in grazing cattle. In cows, a deficiency of this elementmay also reduce milk yield. In hens, there is reduced egg yield, hatchability and shellthickness.
Subnormal growth in young animals and low liveweight gains in mature animalsare characteristic symptoms of phosphorus deficiency in all species. Phosphorusdeficiency is usually more common in cattle than in sheep, as the latter tend to have

Major elements
115
CC
C
C C
CP
H
HP
H
P
P
H
H
P
Phytic acid
P
P = O P
OH
OH
OH
more selective grazing habits and choose the growing parts of plants, which happento be richer in phosphorus.
Sources of phosphorus
Milk, cereal grains and fishmeal products containing bone are good sources of phos-phorus; the content in hays and straws is generally very low. Considerable attentionhas been paid to the availability of phosphorus. Much of the element present incereal grains is in the form of phytates, which are salts of phytic acid, a phosphoricacid derivative:
Insoluble calcium and magnesium phytates occur in cereals and other plant prod-ucts. Experiments with chicks have shown that the phosphorus of calcium phytate isutilised only 10 per cent as effectively as disodium phosphate. In studies with layinghens, phytate phosphorus was utilised about half as well as dicalcium phosphate.Certain plant foods, such as wheat, contain phytase and in the pig stomach some ofthe phytate phosphorus is made available by the action of this enzyme. However, itis likely that the phytase is destroyed in the acid conditions once the acid secretedpenetrates the food mass in the stomach. Intestinal phytase activity from the micro-flora has been observed, but it appears to be of little importance in the pig. It hasbeen shown with sheep that hydrolysis of phytates by bacterial phytases occurs inthe rumen. Bacteria in the hind gut also have phytase activity, but the significance ofthis in phosphorus supply for the monogastric is not clear. Phytate phosphorus ap-pears therefore to be utilised by ruminants as readily as other forms of phosphorus,although studies using radioactive isotopes indicate that the availability of phospho-rus may range from 0.33 to 0.90. Recent studies with a fungal source of phytaseadded to the diet of pigs have shown significant increases in ileal and total tract di-gestibility of phytate phosphorus (see Chapter 24).
Feeding with high levels of phosphorus should be avoided as the excess is ex-creted and contributes to pollution by encouraging the growth of algae in watercourses. High phosphorus intake in association with magnesium can lead to the for-mation of mineral deposits in the bladder and urethra (urolithiasis or urinary calculi)and blockage of the flow of urine in male sheep and cattle.
Potassium
Potassium plays a very important part, along with sodium, chlorine and bicarbonateions, in osmotic regulation of the body fluids and in the acid–base balance in theanimal. Whereas sodium is the main inorganic cation of extracellular tissue fluids,

Chapter 6 Minerals
116
potassium functions principally as the cation of cells. Potassium plays an impor-tant part in nerve and muscle excitability and is also involved in carbohydratemetabolism.
Deficiency symptoms
The potassium content of plants is generally very high, that of grass, for example,being frequently above 25 g/kg DM, so that it is normally ingested by animals inlarger amounts than any other element. Consequently, potassium deficiency is rare infarm animals kept under natural conditions. One exception to this is provided by dis-tiller’s grains (draff; see p. 547), which, as a result of the removal of the liquid afterfermentation, is deficient in several soluble elements, including potassium. Appropri-ate supplementation is necessary where draff forms a large proportion of the diet.
There are certain areas in the world where soil potassium levels are naturally low.Such areas occur in Brazil, Panama and Uganda, and it is suggested that in these trop-ical regions, potassium deficiencies may arise in grazing animals, especially at the endof the long dry season, when potassium levels in the mature herbage are low.
Deficiency symptoms have been produced in chicks given experimental diets lowin potassium.They include retarded growth, weakness and tetany, followed by death.Deficiency symptoms, including severe paralysis, have also been recorded for calvesgiven synthetic milk diets low in potassium.
A dietary excess of potassium is normally excreted rapidly from the body, chieflyin the urine. Some research workers believe that high intake of the element may in-terfere with the absorption and metabolism of magnesium in the animal, which maybe an important factor in the aetiology of hypomagnesaemic tetany (see p. 119).
Sodium
Most of the sodium of the animal body is present in the soft tissues and body fluids.Like potassium, sodium is concerned with the acid–base balance and osmotic regu-lation of the body fluids. Sodium is the chief cation of blood plasma and other extra-cellular fluids of the body.The sodium concentration within the cells is relatively low,the element being replaced largely by potassium and magnesium. Sodium also playsa role in the transmission of nerve impulses and in the absorption of sugars andamino acids from the digestive tract (see p. 168).
Much of the sodium is ingested in the form of sodium chloride (common salt),and it is mainly in this form that the element is excreted from the body.There is evi-dence that sodium rather than chlorine is the chief limiting factor in salt-deficientdiets of sheep and cows.
Deficiency symptoms
Sodium deficiency in animals occurs in many parts of the world, but especially in thetropical areas of Africa and the arid inland areas of Australia, where pastures containvery low concentrations of the element.A deficiency of sodium in the diet leads to alowering of the osmotic pressure, which results in dehydration of the body. Symp-toms of sodium deficiency include poor growth and reduced utilisation of digestedproteins and energy. In hens, egg production and growth are adversely affected. Ratsgiven experimental diets low in sodium had eye lesions and reproductive distur-bances, and eventually died.

Major elements
117
Sources of sodium
Most foods of vegetable origin have comparatively low sodium contents; animalproducts, especially foods of marine origin, are richer sources.The commonest min-eral supplement given to farm animals is common salt.
Chlorine
Chlorine is associated with sodium and potassium in acid–base relationships and os-motic regulation. Chlorine also plays an important part in the gastric secretion,where it occurs as hydrochloric acid as well as chloride salts. Chlorine is excretedfrom the body in the urine and is also lost from the body, along with sodium andpotassium, in perspiration.
A dietary deficiency of chlorine may lead to an abnormal increase of the alkali re-serve of the blood (alkalosis) caused by an excess of bicarbonate, since inadequatelevels of chlorine in the body are partly compensated for by increases in bicarbon-ate. Experiments with rats on chlorine-deficient diets have shown that growth wasretarded, but no other symptoms developed.
Sources of chlorine
With the exception of fishmeals, the chlorine content of most foods is comparativelylow. The chlorine content of pasture grass varies widely and figures ranging from3 g/kg to 25 g/kg DM have been reported.The main source of this element for mostanimals is common salt.
Salt
Since plants tend to be low in both sodium and chlorine, it is the usual practice togive common salt to herbivores. Unless salt is available, deficiencies are likely tooccur in both cattle and sheep. Experiments carried out in the USA with dairy cowson salt-deficient diets showed that animals did not exhibit immediate ill effects, buteventually appetite declined, with subsequent loss in weight and lowered milk pro-duction.The addition of salt to the diet produced an immediate cure.
Salt is also important in the diet of hens, and it is known to counteract feather pick-ing and cannibalism. Salt is generally given to pigs on vegetable diets, but if fishmeal isgiven the need for added salt is reduced. Swill can also be a rich source of salt, al-though the product is very variable and can contain excessive amounts of salt. Toomuch salt in the diet is definitely harmful and causes excessive thirst, muscular weak-ness and oedema. Salt poisoning is quite common in pigs and poultry, especially wherefresh drinking water is limited.When the concentration of salt in the diet of hens ex-ceeds 40 g/kg DM and the supply of drinking water is limited, then death may occur.Hens can tolerate larger amounts of salt if plenty of water is available. Chicks cannottolerate salt as well as adults can, and 20 g/kg DM in the diet should be regarded as theabsolute maximum.This value should also not be exceeded in the diets of pigs.Turkeypoults are even less tolerant, and 10 g/kg of salt in the diet should not be exceeded.
Sulphur
Most of the sulphur in the animal body occurs in proteins containing the amino acidscystine, cysteine and methionine.The two vitamins biotin and thiamin, the hormoneinsulin and the important metabolite coenzyme A also contain sulphur.The structural
Chapter 6 Minerals
118
compound chondroitin sulphate is a component of cartilage, bone, tendons and thewalls of blood vessels. Sulphur-containing compounds are also important in elementsof the respiratory process from haemoglobin through to cytochromes. Only a smallamount of sulphur is present in the body in inorganic form, though sulphates areknown to occur in the blood in small quantities.Wool is rich in cystine and containsabout 4 per cent of sulphur.
Traditionally, little attention has been paid to the importance of sulphur in ani-mal nutrition, since the intake of this element is mainly in the form of protein, anda deficiency of sulphur would indicate a protein deficiency. In recent years, how-ever, with the increasing use of urea as a partial nitrogen replacement for proteinnitrogen and as a method for treating cereal grains (see Chapter 22), it has beenrealised that the amount of sulphur present in the diet may be the limiting factor forthe synthesis in the rumen of cystine, cysteine and methionine. Under these condi-tions, the addition of sulphur to urea-containing rations is beneficial. There is evi-dence that sulphate (as sodium sulphate) can be used by ruminal microorganismsmore efficiently than elemental sulphur. The mean of the estimates of the ratio ofsulphur to nitrogen in microbial protein is around 0.07, which, incidentally, is ap-proximately the ratio found in animal tissue and milk protein. The UK AgriculturalResearch Council has recommended that the requirement for rumen-degradablesulphur should be calculated by multiplying the rumen-degradable nitrogen re-quirement by 0.07 (i.e. equivalent to a N : S ratio of 14 : 1).The ratio of nitrogen tosulphur in wool protein is narrower, at 5 : 1, and the supply of sulphur-containingamino acids may be limiting for sheep with a high rate of wool production. Thislimitation cannot be overcome by increasing the ratio of rumen-degradable sulphurto degradable nitrogen, since this will not alter the rate of microbial protein produc-tion. However, the limitation can be alleviated by supplying sulphur containingamino acids in forms that bypass the rumen or in proteins that have low rumendegradability.
Consideration of sulphur in animal nutrition is important in areas of intensivelivestock production where sulphur in soils is not replaced regularly by fertiliserapplication.
Inorganic sulphur seems to be of less practical importance for monogastricanimals, although studies with pigs, chicks and poults have indicated that inorganicsulphate can have a sparing effect on the requirement for sulphur-containing aminoacids in the diet.
Toxicity can result from excess dietary sulphur, which is converted to hydrogensulphide, a toxic agent, by the gastrointestinal flora.This reduces rumen motility andcauses nervous and respiratory distress.
Magnesium
Magnesium is closely associated with calcium and phosphorus. About 70 per centof the total magnesium is found in the skeleton but the remainder, which is distrib-uted in the soft tissues and fluids, is of crucial importance to the well-being of theanimal. Magnesium is the commonest enzyme activator, for example in systemswith thiamin pyrophosphate as a cofactor, and oxidative phosphorylation is re-duced in magnesium deficiency. Magnesium is an essential activator of phosphatetransferases (e.g. creatine kinase) and it activates pyruvate carboxylase, pyruvateoxidase and reactions of the tricarboxylic acid cycle; therefore, it is essential for the

Major elements
119
efficient metabolism of carbohydrates and lipids. In addition, magnesium is in-volved in cellular respiration and many other cellular reactions, forming complexeswith adenosine tri-, di- and monophosphates. The formation of cyclic AMP andother secondary messengers requires magnesium. Magnesium ions moderate neuro-muscular activity and, through binding to phospholipid, are involved in cell mem-brane integrity. The interaction of parathyroid hormone, which is responsible forcalcium mobilisation (see p. 112), with its receptors on bone and kidney cells in-volves magnesium, and low blood levels of the element are associated withhypocalcaemia. Thus, it can be seen that magnesium is a key element in cellularbiochemistry and function. Magnesium is absorbed from the small and large intes-tine of monogastric animals, and requirements are usually met with cereal and soyabean meal diets. In ruminants, absorbability can be low and potassium reduces theefficiency of absorption by inhibiting the two active transport systems in the rumenwall that carry magnesium against the electrochemical gradient. Potassium does notaffect absorption beyond the rumen.
Deficiency symptoms
Symptoms due to a simple deficiency of magnesium in the diet have been reportedfor a number of animals. In rats fed on purified diets, the symptoms include in-creased nervous irritability and convulsions. Experimental low-magnesium milkdiets for calves caused low serum magnesium levels, depleted bone magnesium,tetany and death.The condition is not uncommon in milk-fed calves about 50–70 daysold. Colostrum is high in magnesium content but milk is low in magnesium, and thisis compounded by a reduction in the efficiency of absorption of magnesium as thecalf ages.
In adult ruminants, a condition known as hypomagnesaemic tetany, associatedwith low blood levels of magnesium (hypomagnesaemia), has been recognised sincethe early 1930s. A great deal of attention has been given to this condition in recentyears, since it is widespread and the death rate is high. Hypomagnesaemic tetany hasbeen known under a variety of names, including magnesium tetany, lactation tetanyand grass staggers, but most of these terms have been discarded because the diseaseis not always associated with lactation or with grazing animals.The condition can af-fect stall-fed dairy cattle, hill cattle, cattle at grass, and sheep.There is some evidenceof a breed susceptibility in the UK, where the condition appears to be more commonin Ayrshire and least common in Jersey animals. Most cases occur in grazing animalsand, in Europe and North America, the trouble is particularly common in the springwhen the animals are turned out on to young, succulent pasture. Because the tetanycan develop within a day or two of animals being turned out to graze, the conditionhas been referred to as the acute form. In this acute type, blood magnesium levelsfall so rapidly that the reserve of magnesium within the body cannot be mobilisedrapidly enough. In the chronic form of the disease, plasma magnesium levels fall overa period of time to low concentrations.This type is not uncommon in suckler herds.Clinical signs of the disease are often brought on by stress factors such as cold, wetand windy weather. In adult animals, bone magnesium is not as readily available asit is in the young calf.
In New Zealand, where cows are pastured throughout the year, hypomagne-saemic tetany occurs most frequently in late winter and early spring. In Australia, ahigh incidence of the disease has been associated with periods of rapid wintergrowth of pastures.

Chapter 6 Minerals
120
The normal magnesium content of blood serum in cattle is within the range of17–40 mg magnesium/litre, but levels below 17 mg/l frequently occur withoutclinical symptoms of disease. Tetany is usually preceded by a fall in blood serummagnesium to about 5 mg/l. Urine magnesium is a better indicator of deficiencythan serum magnesium because levels of the latter do not fall until there is asevere deficiency. However, a lack of magnesium is immediately reflected in urinelevels, for which 10 mg/100 ml is satisfactory, 2–10 mg/100 ml is inadequate andless than 2 mg/100 ml indicates a severe deficiency. Subcutaneous injection ofmagnesium sulphate, or preferably magnesium lactate, can generally be expectedto cure the animal if given early, but in practice this is sometimes difficult. Treat-ment of this kind is not a permanent cure and oral treatment with magnesiumoxide, as described below, should be started immediately. Typical symptoms oftetany are nervousness, tremors, twitching of the facial muscles, staggering gaitand convulsions.
The exact cause of hypomagnesaemic tetany in ruminant animals is unknown,although a dietary deficiency of magnesium may be a contributory factor. Someresearch workers consider the condition to be caused by a cation–anion imbalancein the diet, and there is evidence of a positive relationship between tetany andheavy dressings of pasture with nitrogenous and potassic fertilisers. It has beensuggested that the concentration of potassium in spring pasture should not exceed25 g/kg DM and the application of potassium fertilisers should be managedcarefully.
The use of radioactive magnesium in tracer studies indicates that the magne-sium present in food is poorly absorbed from the alimentary canal; in some casesonly 50 g/kg of the herbage magnesium can be utilised by the ruminant.Why thisis so in ruminants is not known. Since adult animals have only very small readilyavailable reserves of body magnesium, they are dependent upon a regular dietarysupply.
Although the exact cause of hypomagnesaemia is still uncertain, the primary fac-tor would appear to be inadequate absorption of magnesium from the digestivetract.A high degree of success in preventing hypomagnesaemia may be obtained byincreasing the magnesium intake. This can be effected by feeding with magnesium-rich mineral mixtures or, alternatively, by increasing the magnesium content of pas-ture by the application of magnesium fertilisers.
Sources of magnesium
Wheat bran, dried yeast and most vegetable protein concentrates, especially cottonseed cake and linseed cake, are good sources of magnesium. Clovers are usuallyricher in magnesium than grasses, although the magnesium content of forage cropsvaries widely.As mentioned previously, draff is deficient in soluble minerals and highlevels of this food in the diet require appropriate supplementation.The mineral sup-plement used most frequently is magnesium oxide, which is sold commercially ascalcined magnesite.When hypomagnesaemic tetany is likely to occur, it is generallyconsidered that about 50 g of magnesium oxide per head per day should be given tocows as a prophylactic measure. The daily prophylactic dose for calves is 7–15 g ofthe oxide, while that for lactating ewes is about 7 g.The mineral supplement can begiven mixed with the concentrate ration. Alternatively, a mixture of magnesiumacetate solution and molasses can be used, which is frequently made available on afree-choice basis from ball feeders placed in the field.

Trace elements
121
6.5 TRACE ELEMENTS
Iron
More than 90 per cent of the iron in the body is combined with proteins, the mostimportant being haemoglobin, which contains about 3.4 g/kg of the element. Ironalso occurs in blood serum in a protein called transferrin, which is concerned withthe transport of iron from one part of the body to another. Ferritin, a protein con-taining up to 200 g/kg of iron, is present in the spleen, liver, kidney and bone mar-row and provides a form of storage for iron. Haemosiderin is a similar storagecompound and may contain up to 350 g/kg of iron. Iron has a major role in a host ofbiochemical reactions, particularly in connection with enzymes of the electron trans-port chain (cytochromes). Electrons are transported by the oxidation and reductionactivity of bound iron.Among the enzymes containing or activated by iron are cata-lase, peroxidases, phenylalanine hydroxylase and many others, including all the tri-carboxylic acid cycle enzymes.
Deficiency symptoms
Since more than half the iron present in the body occurs as haemoglobin, a dietary de-ficiency of iron would clearly be expected to affect the formation of this compound.The red blood corpuscles contain haemoglobin, and these cells are continually beingproduced in the bone marrow to replace those red cells destroyed in the animal bodyas a result of catabolism. Although the haemoglobin molecule is destroyed in the ca-tabolism of these red blood corpuscles, the iron liberated is made use of in the resyn-thesis of haemoglobin, and because of this the daily requirement of iron by a healthyanimal is usually small. If the need for iron increases, as it does after prolonged haem-orrhage or during pregnancy, then haemoglobin synthesis may be inadequate andanaemia will result.Anaemia due to iron deficiency occurs most commonly in rapidlygrowing sucklings, since the iron content of milk is usually very low.This can occur inpiglets housed in pens without access to soil.The piglet is born with very limited ironreserves and sow’s milk provides only about 1 mg per day.The rapidly growing piglet’srequirement is 15 mg per day, which, in extensive systems, could be obtained by inges-tion of soil. Providing the sow with supplementary iron in gestation does not increasethe foetal piglet’s liver iron or the amount in the milk. Therefore, it is routinely sup-plied by intramuscular injection as a dextran complex or gleptoferron, by 3 days ofage. Usually 200 mg of iron is injected.Alternatively, oral iron supplements are avail-able in the form of a paste of the citrate or fumarate or granules of iron dextran, butthese may not be eaten or the iron may be lost if diarrhoea occurs.Attempts have beenmade to increase the supply of iron to the piglet by supplementing the sow’s diet andrelying on the piglet’s consumption of the sow’s faeces during exploration activity.However, this has produced uneven uptake, and injection of iron compounds is moreeffective. Anaemia in piglets is characterised by poor appetite and growth. Breathingbecomes laboured and spasmodic – hence the descriptive term ‘thumps’ for this condi-tion.Although iron deficiency is not common in older animals, increased supplemen-tation is required when high levels of copper are used for growth promotion.
Iron-deficiency anaemia is not common in lambs and calves because in practice itis unusual to restrict them to a milk diet without supplementary feeding. It does,however, sometimes occur in laying hens, since egg production represents a consid-erable drain on the body reserves.

Chapter 6 Minerals
122
Sources of iron
Iron is widely distributed in foods. Good sources of the element are green leafy ma-terials, most leguminous plants and seed coats. Feeds of animal origin, such as bloodand fishmeals, are excellent sources of iron.As mentioned previously, milk is a poorsource of the element.
Iron is absorbed throughout the gastrointestinal tract, but mainly in the duo-denum and jejunum.Absorption is poor and is, to a large extent, independent of thedietary source.The efficiency of absorption is increased during periods of iron needand decreased during periods of iron overload. The mechanisms whereby the bodycarries this out are not fully understood.A number of theories have been advancedand one of these, the ‘mucosal block’ theory, propounded in 1943, is still widely heldby many to explain the mechanism. According to this theory, the mucosal cells of thegastrointestinal tract absorb iron and convert it into ferritin; when the cells becomephysiologically saturated with ferritin, further absorption is impeded until the iron isreleased and transferred to plasma. Another, more recent theory proposes that themain regulator of iron uptake is the iron concentration in the epithelial cells of theduodenal mucosa.
The adult’s need for iron is normally low, as the iron produced from the destruc-tion of haemoglobin is made available for haemoglobin regeneration, only about 10 per cent of the element escaping from this cycle.
Iron toxicity
Iron toxicity is not a common problem in farm animals, but it can result from pro-longed oral administration of the element. Ferrous ions are reported to generateoxygen-based free radicals, contributing to oxidative stress in the cell (see Chapter 5).Normally iron is protein-bound or in chemical form, which prevents it from causingoxidation. Chronic iron toxicity results in alimentary disturbances, reduced growthand phosphorus deficiency.
Copper
Evidence that copper is a dietary essential was obtained in 1924, when experi-ments with rats showed that copper was necessary for haemoglobin formation.Al-though copper is not actually a constituent of haemoglobin, it is present in certainother plasma proteins, such as ceruloplasmin, concerned with the release of ironfrom the cells into the plasma. A deficiency of copper impairs the animal’s abilityto absorb iron, mobilise it from the tissues and utilise it in haemoglobin synthesis.Copper is also a component of other proteins in blood. One of these, erythro-cuprein, occurs in erythrocytes, where it plays a role in oxygen metabolism. Theelement is also known to play a vital role in many enzyme systems; for example,copper is a component of cytochrome oxidase, which is important in oxidativephosphorylation. It is also a component of superoxide dismutase, which forms partof the cell’s antioxidant system. The element also occurs in certain pigments,notably turacin, a pigment of feathers. Copper is necessary for the normal pigmen-tation of hair, fur and wool. It is thought to be present in all body cells, beingparticularly concentrated in the liver, which acts as the main copper storage organof the body. Copper has been shown to reduce the susceptibility to infection inlambs directly.

Trace elements
123
Deficiency symptoms
Since copper performs many functions in the animal body, there are a variety of de-ficiency symptoms. These include anaemia, poor growth, bone disorders, scouring,infertility, depigmentation of hair and wool, gastrointestinal disturbances, and le-sions in the brain stem and spinal cord.The lesions are associated with muscular in-coordination and occur, especially, in young lambs. A copper deficiency conditionknown as ‘enzootic ataxia’ has been known for some time in Australia; the disorderthere is associated with pastures low in copper content (2–4 mg/kg DM) and can beprevented by feeding with a copper salt.A similar condition that affects lambs occursin the UK and is known as ‘swayback’. The signs of swayback range from completeparalysis of the newborn lamb to a swaying staggering gait that affects, in particular,the hind limbs. The condition can occur in two forms, one congenital, in which thesigns are apparent at birth and are due to the failure of the myelin sheath of nervesto develop, and the other in which the onset of the clinical disease is delayed for sev-eral weeks.The congenital form of the condition is irreversible and can be preventedonly by ensuring that the ewe receives an adequate level of copper in her diet. De-layed swayback can be prevented or retarded in copper-deficient lambs by par-enteral injection of small doses of copper complexes.
Although the dietary level of copper is an important factor in the aetiology ofswayback, the condition does not appear to be invariably caused by a simple dietarydeficiency of the element. Swayback has been reported to occur on pastures appar-ently normal or even high (7–15 mg/kg DM) in copper content. One important factoris that the efficiency of absorption of dietary copper is very variable. For example,there is about a tenfold variation in the efficiency with which Scottish Blackface ewesabsorb copper from autumn pasture (1.2 per cent) and from leafy brassicas (13.2 percent). It is also known that genetic factors influence the concentration of copper in theblood, liver and brain of the sheep, and hence the incidence of swayback can beaffected by genotype. Blackface lambs given a copper-supplemented barley andfishmeal diet retained 6 per cent of the dietary copper in the liver, whereas Texellambs retained 13 per cent. Finnish Landrace and Suffolk lambs were intermediate,at 8–9 per cent retention.
Copper plays an important role in the production of ‘crimp’ in wool.The elementis present in an enzyme that is responsible for the disulphide bridge in two adjacentcysteine molecules. In the absence of the enzyme, the protein molecules of the wooldo not form their bridge and the wool, which lacks crimp, is referred to as ‘stringy’ or‘steely’ (see p. 375).
Nutritional anaemia resulting from copper deficiency has been produced experi-mentally in young pigs by diets very low in the element, and this type of anaemiacould easily arise in such animals fed solely on milk. In older animals, copper defi-ciency is unlikely to occur and copper supplementation of practical rations is gener-ally considered unnecessary. There are, however, certain areas in the world wherecopper deficiency in cattle occurs. A condition in Australia known locally as ‘fallingdisease’ was found to be related to a progressive degeneration of the myocardium ofanimals grazing on copper-deficient pastures.
Copper–molybdenum–sulphur interrelations
Certain pastures on calcareous soils in parts of England and Wales have been knownfor over 100 years to be associated with a condition in cattle known as ‘teart’, which

Chapter 6 Minerals
124
is characterised by unthriftiness and scouring.A similar disorder occurs on reclaimedpeat lands in New Zealand, where it is known as ‘peat scours’. Molybdenum levels inteart pasture are of the order of 20–100 mg/kg DM compared with 0.5–3.0 mg/kg DMin normal pastures, and teart was originally regarded as being a straightforwardmolybdenosis. In the late 1930s, however, it was demonstrated that feeding withcopper sulphate controlled the scouring and hence a molybdenum–copper relation-ship was established.
It is now known that the effect of molybdenum is complex, and it is consideredthat the element exerts its limiting effect on copper retention in the animal only inthe presence of sulphur. Sulphide is formed by ruminal microorganisms from dietarysulphate or organic sulphur compounds; the sulphide then reacts with molybdate toform thiomolybdate, which in turn combines with copper to form an insoluble cop-per thiomolybdate (CuMoS4), thereby limiting the absorption of dietary copper. Inaddition, it is considered likely that if thiomolybdate is formed in excess, it may beabsorbed from the digestive tract and exert a systemic effect on copper metabolismin the animal.
Sources of copper
Copper is widely distributed in foods, and under normal conditions the diet of farmanimals is likely to contain adequate amounts.The copper content of crops is relatedto some extent to the soil copper level, but it is also affected by other factors such asdrainage conditions and the herbage species. Seeds and seed by-products are usuallyrich in copper, but straws contain little.The normal copper content of pasture rangesfrom about 4 mg/kg to 8 mg/kg DM.The copper content of milk is low, and hence itis customary when dosing young animals, especially piglets, with an iron salt to in-clude a trace of copper sulphate.
Copper toxicity
It has long been known that copper salts given in excess to animals are toxic. Con-tinuous ingestion of copper in excess of nutritional requirements leads to an accu-mulation of the element in the body tissues, especially in the liver. Copper can beregarded as a cumulative poison, so that considerable care is required in administer-ing copper salts to animals. The tolerance to copper varies considerably betweenspecies. Pigs are highly tolerant (see Box 6.3) and cattle relatively so. On the other
BOX 6.3 Copper as growth promoter
In the late 1950s and early 1960s Barber, Braude, Mitchell and their colleagues at the National In-stitute for Research in Dairying at Reading demonstrated that pigs given high levels of copper (up to250 mg/kg) in the diet had faster growth rates and better food conversion efficiency than unsupple-mented pigs. Most of this copper is not absorbed but passes through the digestive tract, achieving itseffect by altering the microbial population in much the same way as antibiotic growth promoters, al-though its effect is independent of and in addition to that caused by antibiotics.
Concern about pollution of the environment has resulted in restrictions on the use of copperas a growth promoter in Europe.The maximum permitted dietary level is 170 mg/kg for pigs up to12 weeks of age, and then it must be reduced to 35 mg/kg as for other classes of pig. Furthermore, itis essential that sheep do not have access to pasture that has recently been fertilised with pig slurry.

Trace elements
125
hand, sheep are particularly susceptible and chronic copper poisoning has been en-countered in housed sheep on concentrate diets. There is a gradual accumulation ofcopper in the liver of sheep until the danger level of about 1000 mg/kg fat-free DMis reached. Poisoning has been known to occur in areas where the herbage containscopper of the order of 10–20 mg/kg DM and low levels of molybdenum. Chroniccopper poisoning results in necrosis of the liver cells, jaundice, loss of appetite anddeath from hepatic coma.The slow accumulation of copper in the liver causes dam-age to the organ without overt symptoms. There is leakage of enzymes from thedamaged cells into the blood. Eventually there is a sudden release of copper andhaemolysis, which can occur spontaneously or as a result of stressors such as partu-rition or infection. There is a genetic variation in animals’ susceptibility to copperpoisoning related to the efficiency of retention, with the Scottish Blackface being theleast susceptible and continental breeds, such as the Texel, being highly susceptible.The EU maximum permitted level for copper in sheep diets is 15 mg/kg – this shouldnot be exceeded if toxicity is to be avoided. For susceptible breeds, a dietary level of10 mg/kg can be excessive. It is unwise to administer copper supplements to sheepunless deficiency conditions are liable to occur – many cases of death due to copperpoisoning caused by the indiscriminate use of copper-fortified diets have been re-ported. Chronic copper poisoning in sheep has occurred under natural conditions inparts of Australia where the copper content of the pasture is high. Care should betaken when sheep are given antiprotozoal compounds such as monensin, which mayeliminate the protozoa that produce the sulphide that normally reduces copperavailability.
Cobalt
A number of disorders of cattle and sheep, characterised by emaciation, anaemiaand listlessness, have been recognised for many years and have been described as‘pining’, ‘salt sick’, ‘bush sickness’ and ‘wasting disease’. These disorders occur inEurope, Australia, New Zealand and the USA. In the UK, ‘pining pastures’ occur inmany counties and are particularly common in the border counties of England andScotland.
As early as 1807, Hogg, an Ettrick shepherd, recognised pining or ‘vinquish’ asbeing a dietary upset. Pining is associated with a dietary deficiency of cobalt causedby low concentrations of the element in the soil and herbage. Pining can be pre-vented in these areas by feeding with small amounts of cobalt.
The physiological function of cobalt was discovered only when vitamin B12 wasisolated and was shown to contain the element. Cobalt is required by microorgan-isms in the rumen for the synthesis of vitamin B12; if the element is deficient in thediet, then the vitamin cannot be produced in the rumen in amounts sufficient to sat-isfy the animal’s requirements and symptoms of pining occur. Pining is therefore re-garded as being due to a deficiency of vitamin B12. There is evidence for this, sinceinjections of vitamin B12 into the blood alleviate the condition, whereas cobalt injec-tions have little beneficial effect. Although vitamin B12 therapy will prevent piningoccurring in ruminant animals, it is more convenient and cheaper in cobalt-deficientareas to supplement the diet with the element, allowing the microorganisms in therumen to synthesise the vitamin for subsequent absorption by the host.
When ruminants are confined to cobalt-deficient pastures it may be severalmonths before any manifestations of pine occur because of body reserves of vitamin

Chapter 6 Minerals
126
B12 in the liver and kidneys.When these are depleted there is a gradual decrease inappetite, with consequent loss of weight followed by muscular wasting, pica, severeanaemia and eventually death. If the deficiency is less severe, then a vague unthrifti-ness, difficult to diagnose, may be the only sign. Deficiency symptoms are likely tooccur where levels of cobalt in the herbage are below 0.1 mg/kg DM. Under grazingconditions, lambs are the most sensitive to cobalt deficiency, followed by maturesheep, calves and mature cattle in that order.
Ruminants have a higher requirement for the element than non-ruminants be-cause some of the element is wasted in microbial synthesis of organic compoundswith no physiological activity in the host’s tissues. Furthermore, vitamin B12 ispoorly absorbed from the digestive tract of ruminants, the availability in some casesbeing as low as 0.03.The ruminant has an additional requirement for the vitamin be-cause of its involvement in the metabolism of propionic acid (see p. 202), an impor-tant acid absorbed from the rumen.
There is evidence that the intestinal microorganisms in non-ruminants also cansynthesise vitamin B12, although in pigs and poultry this synthesis may be insuffi-cient to meet their requirements. It is common practice to include in pig and poultrydiets some animal protein food rich in vitamin B12 and/or a vitamin supplement, inpreference to including a cobalt salt.
Apart from the importance of cobalt as a component of vitamin B12, the elementis believed to have other functions in the animal body as an activating ion in certainenzyme reactions.
Sources of cobalt
Most foods contain traces of cobalt. Normal pasture herbages have a cobalt contentwithin the range 100–250 µg/kg DM.
Cobalt deficiency in ruminants can be prevented by dosing the animals with a so-lution of cobalt salts, although this form of treatment has to be repeated at short in-tervals and precautions must be taken when handling the solution (see below).Alternatively the animals can be given access to cobalt-containing salt licks. A con-tinuous supply from a single dose can be obtained by giving a cobalt bullet contain-ing 900 g cobaltic oxide/kg; the bullet remains in the reticulum and slowly releasesthe element over a long period. Some of this cobalt is not utilised by the animal andis excreted, and this of course has the effect of improving the cobalt status of the pas-ture.Alternatively, deficient pastures can be treated with cobalt-containing fertilisersor with small amounts of cobalt salt solutions.
Cobalt toxicity
Although an excess of cobalt can be toxic to animals, there is a wide margin ofsafety between the nutritional requirement and the toxic level. Cobalt toxicosis isextremely unlikely to occur under practical farming conditions. Unlike copper,cobalt is poorly retained by the body tissues and an excess of the element is soon ex-creted.The toxic level of cobalt for cattle is 1 mg cobalt/kg body weight daily. Sheepare less susceptible to cobalt toxicosis than cattle and have been shown to toleratelevels up to 3.5 mg/kg. Excessive cobalt supplementation of ruminant diets can leadto the production of analogues of vitamin B12 and a reduction in the quantity of thetrue vitamin. Cobalt compounds pose a risk to human health as they cause cancer ifinhaled and they irritate the skin; for this reason, their use has been restricted in the

Trace elements
127
EU, where materials with more than 100 mg Co/kg must be labelled as hazardousand should be handled only with appropriate personal protection equipment. TheEuropean Food Safety Authority has recommended that the supplementation ofdiets for farm animals with cobalt be limited to ruminants (except milk replacers),horses and rabbits at a level of 0.3 mg/kg DM of supplemental cobalt, and the max-imum amount permitted in the complete diet in the EU is 2 mg/kg DM.
Iodine
The concentration of iodine present in the animal body is very small and in the adultis usually less than 600 µg/kg. Although the element is distributed throughout thetissues and secretions, its only known role is in the synthesis of the two hormones,triiodothyronine (T3) and tetraiodothyronine (T4, thyroxine) produced in the thyroidgland (see p. 54).
Iodine is removed from iodides in the blood and combined with the amino acid ty-rosine to form monoiodotyrosine (T1) and diiodotyrosine (T2).Two molecules of T2 arecondensed to produce T4, the physiologically inactive transport form of the hormone,which is stored in the thyroid gland.T4 is released into the blood capillaries as requiredand is activated by deiodinase enzymes to produce the physiologically active T3. Theenzymes are selenium-dependent (see p. 131) and occur in the periphery where thehormone is needed, mainly in the liver and kidneys but also in the skin.
The thyroid hormones accelerate reactions in most organs and tissues in the body,thus increasing the basal metabolic rate, accelerating growth and increasing the oxy-gen consumption of the whole organism. They also control the development of thefoetus and are involved in immune defence, digestion, muscle function and seasonal-ity of reproduction.
Deficiency symptoms
When the diet contains insufficient iodine, the production of thyroxine is de-creased. The main indication of such a deficiency is an enlargement of the thyroidgland, termed endemic goitre, and is caused by compensatory hypertrophy of thegland. As the thyroid is situated in the neck, the deficiency condition in farm ani-mals manifests itself as a swelling of the neck, so-called ‘big neck’. Reproductive ab-normalities are one of the most outstanding consequences of reduced thyroidfunction; breeding animals deficient in iodine give birth to hairless, weak or deadyoung; brain development is impaired; oestrus is suppressed or irregular; and malefertility is reduced.
A dietary deficiency of iodine is not the sole cause of goitre: it is known that cer-tain foods contain goitrogenic compounds and cause goitre in animals if given inlarge amounts. These foods include most members of the Brassica genus, especiallykale, cabbage and rape, and also soya beans, linseed, peas and groundnuts. Goitro-gens have been reported in milk of cows fed on goitrogenic plants.A goitrogen pres-ent in brassicas has been identified as L-5-vinyl-2-oxazolidine-2-thione (goitrin),which inhibits the iodination of tyrosine and thus interferes with thyroxine synthe-sis.Therefore, it cannot be overcome by adding more iodine to the diet.Thiocyanate,which may also be present in members of the Brassica genus, is known to be goitro-genic and may be produced in the tissues from a cyanogenetic glycoside present insome foods. Goitrogenic activity of the thiocyanate type is prevented by supplying

Chapter 6 Minerals
128
adequate iodine in the diet. It has been reported that high dietary nitrate levels in-hibit the uptake of iodine.
Sources of iodine
Iodine occurs in traces in most foods and is present mainly as inorganic iodide, inwhich form it is absorbed from the digestive tract.The richest sources of this elementare foods of marine origin, and values as high as 6 g/kg DM have been reported forsome seaweeds; fishmeal is also a rich source of iodine. The iodine content of landplants is related to the amount of iodine present in the soil, and consequently widevariations occur in similar crops grown in different areas.
In areas where goitre is endemic, precautions are generally taken by supplement-ing the diet with the element, usually in the form of iodised salt. This contains theelement either as sodium or potassium iodide or as sodium iodate.
Iodine toxicity
The minimum toxic dietary level of iodine for calves of 80–112 kg body weight hasbeen shown to be about 50 mg/kg, although some experimental animals have beenadversely affected at lower levels. Symptoms of toxicity include depressions inweight gain and feed intake. In studies with laying hens, diets with iodine contents of312–5000 mg/kg DM stopped egg production within the first week at the higherlevel and reduced egg production at the lower level. The fertility of the eggs pro-duced was not affected, but early embryonic death, reduced hatchability and delayedhatching resulted. Excessively high levels of iodine supplementation should beavoided in diets for ewes in pregnancy because this has resulted in lambs with a re-duced ability to absorb immunoglobulins and vitamin E from colostrum. Pigs seemto be more tolerant of excess iodine and the minimum toxic level is considered to liebetween 400 mg/kg and 800 mg/kg.
Manganese
The amount of manganese present in the animal body is extremely small. Most tissuescontain traces of the element, the highest concentrations occurring in the bones, liver,kidney, pancreas and pituitary gland. Manganese is important in the animal body asan activator of many enzymes such as hydrolases and kinases and as a constituent ofarginase, pyruvate carboxylase and manganese superoxide dismutase.
Deficiency symptoms
Manganese deficiency has been found in ruminants, pigs and poultry. The effects ofacute deficiency are similar in all species and include retarded growth, skeletal ab-normalities, ataxia of the newborn and reproductive failure. Manganese, through itsactivation of glycosyl transferases, is required for the formation of the mucopolysac-charide that forms the organic matrix of bone.
Deficiencies of manganese in grazing ruminants are likely to be rare, although thereproductive performance of grazing Dorset Horn ewes in Australia was improved bygiving manganese over two consecutive years. Low-manganese diets for cows andgoats have been reported to depress or delay oestrus and conception, and to increaseabortion. Manganese is an important element in the diet of young chicks, a defi-ciency leading to perosis or ‘slipped tendon’, a malformation of the leg bones. Man-ganese deficiency is not, however, the only factor involved in the aetiology of this

Trace elements
129
condition, as perosis in young birds may be aggravated by high dietary intakes of cal-cium and phosphorus or a deficiency of choline. Another link between manganeseand choline deficiencies is shown in fatty infiltration of the liver and changes in theultrastructure of the liver.
Manganese deficiency in breeding birds reduces hatchability and shell thickness,and in chicks causes head retraction. In pigs, lameness is a symptom. Other abnor-malities associated with manganese deficiency include impaired glucose utilisationand a reduced vitamin K-induced blood-clotting response.
Sources of manganese
The element is widely distributed in foods, and most forages contain 40–200 mg/kgDM. The manganese content of pasture herbages, however, can vary over a muchwider range and in acid conditions may be as high as 500–600 mg/kg DM. Seeds andseed products contain moderate amounts, except for maize, which is low in the ele-ment.Yeast and most foods of animal origin are also poor sources of manganese. Richsources are rice bran and wheat offals. Most green foods contain adequate amounts.
Manganese toxicity
There is a wide margin of safety between the toxic dose of manganese and the nor-mal level in foods. Levels as high as 1 g/kg DM in the diet have been given to henswithout evidence of toxicity. Growing pigs are less tolerant, levels of 0.5 g/kg DMhaving been shown to depress appetite and retard growth.
Zinc
Zinc has been found in every tissue in the animal body. The element tends to accu-mulate in the bones rather than the liver, which is the main storage organ of many ofthe other trace elements. High concentrations have been found in the skin, hair andwool of animals. Several enzymes in the animal body are known to contain zinc;these enzymes include carbonic anhydrase, pancreatic carboxypeptidase, lactate de-hydrogenase, alcohol dehydrogenase, alkaline phosphatase and thymidine kinase. Inaddition, zinc is an activator of several enzyme systems. It is involved in cell replica-tion and differentiation, particularly in nucleic acid metabolism. Among the otherphysiological functions of zinc are the production, storage and secretion of hor-mones, involvement in the immune system and electrolyte balance.
Deficiency symptoms
Zinc deficiency in pigs is characterised by subnormal growth, depressed appetite,poor food conversion and parakeratosis. The latter is a reddening of the skin fol-lowed by eruptions that develop into scabs. A deficiency of this element is particu-larly liable to occur in young, intensively housed pigs offered a dry diet ad libitum,though a similar diet given wet may not cause the condition. It is aggravated by highcalcium levels in the diet and reduced by decreased calcium and increased phospho-rus levels. Pigs given a diet supplemented with high levels of copper, for growth pro-motion, have an increased requirement for zinc. Gross signs of zinc deficiency inchicks are retarded growth, foot abnormalities, ‘frizzled’ feathers, parakeratosis anda bone abnormality referred to as ‘swollen hock syndrome’.
Symptoms of zinc deficiency in calves include inflammation of the nose andmouth, stiffness of the joints, swollen feet and parakeratosis.The response of severely

Chapter 6 Minerals
130
zinc-deficient calves to supplemental zinc is rapid and dramatic. Improvements inskin condition are usually noted within 2–3 days.
Manifestations of zinc deficiency, responsive to zinc therapy, have been observedin growing and mature cattle in parts of Guyana, Greece,Australia and Scandinavia.As levels in the pasture herbage are apparently comparable with those of otherareas, the deficiency is believed to be conditioned by some factor in the herbage orgeneral environment. In dairy cows, low dietary zinc concentrations are associatedwith high somatic cell counts in their milk.
Sources of zinc
The element is fairly widely distributed. Yeast is a rich source, and zinc is concen-trated in the bran and germ of cereal grains.Animal protein by-products, such as fish-meal, are usually richer sources of the element than are plant protein supplements.
Zinc toxicity
Although cases of zinc poisoning have been reported, most animals have a high tol-erance for this element. Excessive amounts of zinc in the diet are known to depressfood consumption and may induce copper deficiency.
Molybdenum
The first indication of an essential metabolic role for molybdenum was obtained in1953, when it was discovered that xanthine oxidase, important in purine metabo-lism, was a metalloenzyme containing molybdenum. Subsequently the element wasshown to be a component of two other enzymes, aldehyde oxidase and sulphiteoxidase.The biological functions of molybdenum, apart from its reactions with copper(see p. 123), are concerned with the formation and activities of these three enzymes.In addition to being a component of xanthine oxidase, molybdenum participates in thereaction of the enzyme with cytochrome C and also facilitates the reduction ofcytochrome C by aldehyde oxidase.
Deficiency symptoms
In early studies with rats, low-molybdenum diets resulted in reduced levels of xan-thine oxidase but did not affect growth or purine metabolism. Similar molybdenum-deficient diets have been given to chicks without adverse effects, but when tungstate(a molybdenum antagonist) was added, growth was reduced and the chick’s ability tooxidise xanthine to uric acid was impaired. These effects were prevented by the ad-dition of molybdenum to the diet. A significant growth response has been obtainedin young lambs by the addition of molybdate to a semi-purified diet low in the ele-ment. It has been suggested that this growth effect could have arisen indirectly bystimulation of cellulose breakdown by ruminal microorganisms. Molybdenum defi-ciency has not been observed under natural conditions in any species.
Molybdenum toxicity
The toxic role of molybdenum in the condition known as ‘teart’ is described underthe section on copper (see p. 123). All cattle are susceptible to molybdenosis, withmilking cows and young animals suffering most. Sheep are less affected and horsesare not affected on teart pastures. Scouring and weight loss are the dominant mani-festations of the toxicity.

Trace elements
131
Selenium
The nutritional importance of selenium became evident in the 1950s, when it wasshown that most myopathies in sheep and cattle, and exudative diathesis inchicks, could be prevented by supplementing the diet with the element or vitaminE (see p. 85). A biochemical role of selenium in the animal body was demon-strated in 1973, when it was discovered that the element was a component of glu-tathione peroxidase, an enzyme that catalyses the removal of hydrogen peroxide,thereby protecting cell membranes from oxidative damage. Glutathione peroxi-dase contains four selenium atoms and forms a second line of defence after vita-min E, since some peroxidases remain even if vitamin E levels are adequate.Selenium has a sparing effect on vitamin E by ensuring normal absorption of thevitamin. This is due to its role in preserving the integrity of the pancreas andthereby ensuring satisfactory fat digestion. Selenium also reduces the amount ofvitamin E required to maintain the integrity of lipid membranes and aids theretention of vitamin E in plasma. Conversely, vitamin E spares selenium by main-taining the element in its active form and preventing its loss. It reduces the pro-duction of hydroperoxides and thus the amount of glutathione peroxidase neededto protect cells. However, there are limits to the mutual substitution of seleniumand vitamin E.
Vitamin E and selenium have roles in the immune system and protect againstheavy metal toxicity. Other mutual functions and effects of deficiency in farm ani-mals are discussed in the section on vitamin E (see pp. 81–86).
The other major role of selenium is in the production of the thyroid hormones(see p. 127), for which it is a component of the enzyme type I iodothyronine deiod-inase (ID1), which converts T4 to the physiologically active T3.When there is a defi-ciency of selenium the ratio of T4 : T3 increases.The enzyme is found primarily in theliver and kidney and not in the thyroid of farm animals.Type II iodothyronine deio-dinase (ID2) does not contain selenium and also converts T4 to T3, but as it is underfeedback control from T4 an increase in the latter, when selenium is deficient, com-pounds the problem. The major enzyme in ruminants is ID1 and in non-ruminantsID2.A third selenium-containing enzyme, ID3, has been found in the placenta. ID1 isparticularly important in the brown adipose tissue of newborn ruminants andreleases T3 for use in other tissues.
Deficiency symptoms
As mentioned above, the effects of selenium deficiency are often similar to thoseof vitamin E. In parts of Australia and New Zealand, a condition known as ‘illthrift’ occurs in lambs, beef cattle and dairy cows at pasture. The clinical signs in-clude loss of weight and sometimes death. Ill thrift can be prevented by seleniumtreatment with, in some instances, dramatic increases in growth and wool yield.Similar responses with sheep have also been noted in experiments carried out inselenium-deficient areas of Scotland, Canada and the USA. In hens, selenium defi-ciency reduces hatchability and egg production.The reduction in use of feed wheatfrom seleniferous regions of North America and Canada has reduced the plant-based dietary supply of selenium, especially in pig and poultry diets, resulting ingreater supplementation being required than previously. Owing to its role in thy-roid hormone production, a lack of selenium can produce the symptoms of iodinedeficiency.

Chapter 6 Minerals
132
Sources of selenium
The main form of selenium in most foods is protein-bound seleno-methionine. Sup-plements of selenium are provided by mineral salts containing sodium selenite, slow-release capsules and selenium-enriched yeast.
Selenium toxicity
The level of selenium in foods of plant origin is extremely variable and depends mainlyon the soil conditions under which they are grown. Normal levels of the element in pas-ture herbage are usually in the range 100–300 µg/kg DM. Some species of plants thatgrow in seleniferous areas contain very high levels of selenium. One such plant,Astragalus racemosus, grown in Wyoming, was reported to contain 14 g selenium/kgDM, while the legume Neptunia amplexicaulis grown on a selenised soil in Queens-land contained over 4 g/kg DM of the element. Localised seleniferous areas have alsobeen identified in Ireland, Israel and South Africa. Selenium is a highly toxic elementand a concentration in a dry diet of 5 mg/kg or 500 µg/kg in milk or water may be po-tentially dangerous to farm animals. ‘Alkali disease’ and ‘blind staggers’ are localisednames for chronic diseases of animals grazing certain seleniferous areas in the USA.Symptoms include dullness, stiffness of the joints, loss of hair from the mane or tail,and hoof deformities.Acute poisoning, which results in death from respiratory failure,can arise from sudden exposure to high selenium intakes.
Fluorine
The importance of fluorine in the prevention of dental caries in humans is well es-tablished. Fluorine was added to the list of essential elements in 1972 when it wasshown that the growth rate of rats was improved after small amounts were added toa low-fluorine diet. Under normal conditions a straightforward deficiency syndromein farm animals has not been observed, and even the results of studies with rodentsare equivocal.
Most plants have a limited capacity to absorb fluorine from the soil, and normallevels in pasture herbage range from about 2 mg/kg to 20 mg/kg DM. Cereals andother grains usually contain about 1–3 mg/kg DM only.
Fluorine is a very toxic element, with ruminants being more susceptible than non-ruminants. Levels of more than 20 mg/kg DM in the diet of cattle have resulted indental pitting and wear, leading to exposed pulp cavities. Further increases in fluo-rine cause depression of appetite, lameness and reduced production. Bone and jointabnormalities also occur, probably owing to ingested fluorine being deposited in thebone crystal lattice as calcium fluoride. The commonest sources of danger from thiselement are fluoride-containing water, herbage contaminated by dust from industrialpollution, and the use of soft or raw rock phosphate supplements. Processed phos-phates are generally safe.
Silicon
Rats previously fed on specially purified foods showed increased growth rates fromthe addition to the diet of 500 mg/kg of silicon (as sodium metasilicate).
Similar results have been obtained with chicks. Silicon is essential for growth andskeletal development in these two species. The element is believed to function as abiological cross-linking agent, possibly as an ether derivative of silicic acid of the

Trace elements
133
type R1—O—Si—O—R2. Such bridges are important in the strength, structure andresilience of connective tissue. In silicon-deficient rats and chicks, bone abnormali-ties occur because of a reduction in mucopolysaccharide synthesis in the formationof cartilage. Silicon is required for maximal activity of the enzyme prolyl hydroxy-lase, which is involved in collagen synthesis. It is also thought to be involved in otherprocesses involving mucopolysaccharides such as the growth and maintenance of ar-terial walls and the skin.
Silicon is so widely distributed in the environment and in foods that it is difficultto foresee any deficiencies of this element arising under practical conditions.Wholegrasses and cereals may contain as much as 14–19 g Si/kg DM, with levels of up to28 g/kg DM in some range grasses.
Silicon toxicity (silicosis) has long been known as an illness of miners caused bythe inhalation of silical particles into the lungs. Under some conditions, part of thesilicon present in urine is deposited in the kidney, bladder or urethra to form calculior uroliths. Silica urolithiasis occurs in grazing wethers in Western Australia and ingrazing steers in western Canada and northwestern parts of the USA. Excessive sil-ica in feeds, for example in rice straw, is known to depress organic matter digestibil-ity. In mature forage, silicon is in the form of solid particles, which are harder thandental tissue and lead to teeth wear in sheep.
Chromium
Chromium was first shown to be essential for normal glucose utilisation in rats.Mice and rats fed on diets composed of cereals and skimmed milk and containing100 µg chromium/kg wet weight were subsequently shown to grow faster if givena supplement of chromium acetate. Chromium appears to have a role in glucosetolerance, possibly forming a complex between insulin and its receptors. It has re-stored glucose tolerance in malnourished children. Chromium may also play a rolein lipid synthesis, and experiments have shown decreased serum cholesterol andincreased high-density lipoprotein cholesterol in cases of deficiency. There is alsothought to be an involvement in protein and nucleic acid metabolism. Investiga-tions with pigs have supported the above putative roles, with increased lean anddecreased fat deposition as a result of more efficient glucose metabolism and spar-ing of protein catabolism. Improved reproduction in sows has been reported withsupplements of organic sources of chromium. There have been positive responsesto chromium supplements where animals are under physiological stress, for exam-ple periparturient dairy cattle and stressed feedlot calves. Immune response, en-ergy status, dry matter intake and milk yield have been increased in primiparouscows and morbidity has been reduced in calves. The practical significance of theelement in the nutrition of farm animals is still being investigated and no recommen-dations for dietary levels have been made. Chromium is not a particularly toxic element in its trivalent form, and a wide margin of safety exists between the nor-mal amounts ingested and those likely to produce deleterious effects. The hexava-lent form is more toxic because it enters the cells to a greater extent and suppressesoxygen consumption and damages DNA. Levels of 50 mg chromium/kg DM in thediet have caused growth depression and liver and kidney damage in rats.Chromium in the form of its insoluble oxide is often used as a marker in digestibil-ity trials (see p. 241).

Chapter 6 Minerals
134
Vanadium
No specific biochemical function has been identified for vanadium, but it may havea role in the regulation of the activity of sodium–potassium ATPase, phosphoryltransferase enzymes, adenyl cyclase and protein kinase. It may also act as a cofactorfor certain enzymes.Vanadium deficiency has been demonstrated in rats, goats andchicks. Deficiency symptoms included impaired growth and reproduction, and dis-turbed lipid metabolism. In chicks consuming diets containing less than 10 µgvanadium/kg DM, growth of wing and tail feathers was significantly reduced. Subse-quent studies with chicks demonstrated a significant growth response when dietaryvanadium concentrations were increased from 30 µg to 3 mg/kg DM. In goats fed ondiets containing less than 10 µg vanadium/kg there was no effect on growth, butthere was increased incidence of abortion, reduced milk fat production and a highdeath rate in the kids.
There is little information about the vanadium content of foods, but levels in therange 30–110 µg/kg DM have been reported for ryegrass. Herring meal appears tobe a relatively rich source, containing about 2.7 mg/kg DM.Vanadium is a relativelytoxic element. When diets containing 30 mg/kg DM of the element were given tochicks, the growth rate was depressed; at levels of 200 mg/kg DM, the mortality ratewas high.
Nickel
A discrete biochemical function has not been firmly established for nickel, but it isthought that it may be a cofactor or structural component in metalloenzymes. It mayalso play a role in nucleic acid metabolism.
Physiological symptoms of nickel deficiency have been produced in chicks, ratsand pigs kept under laboratory conditions. Chicks given a diet containing nickel in aconcentration of less than 400 µg/kg DM developed skin pigmentation changes, der-matitis and swollen hocks. Diets with a low nickel content have produced scaly andcrusty skin in pigs, similar to the parakeratosis seen in zinc deficiency, which suggestsan involvement in zinc metabolism. Supplements of nickel have increased rumenbacterial urease activity.
Normal levels of the element in pasture herbage are 0.5–3.5 mg/kg DM, whilewheat grain contains 0.3–0.6 mg/kg DM. Nickel is a relatively non-toxic element, ispoorly absorbed from the digestive tract and does not normally present a serioushealth hazard.
Tin
In 1971 it was reported that a significant growth effect, in rats maintained on puri-fied amino acid diets in a trace-element-free environment, was obtained whenthe diets were supplemented with tin. These studies suggested that tin was an es-sential trace element for mammals. The element is normally present in foods inamounts less than 1 mg/kg DM, the values in pasture herbage grown in Scotland,for example, being of the order of 300–400 µg/kg DM. The nutritional importanceof this element has yet to be determined, but it is suggested that tin contributes tothe tertiary structure of protein or other macromolecules. Tin is poorly absorbed

Other elements
135
BOX 6.4 Enhanced trace element supplementation and health status and fertility in dairy cows
Several authors have reported that when dairy cows were given dietary supplements of certain traceelements, above the levels necessary for production, their health status (incidence of mastitis) andfertility were improved. In a review, Cottrill and Rymer (see Further reading) concluded that foriodine and manganese there is no evidence that feeding levels above requirements have any bene-fits. In some studies, raised levels of copper improved fertility and udder health, but results were in-consistent and no recommendation could be made with respect to the appropriate level ofsupplementation. The authors also pointed out the complexity surrounding copper absorption(molybdenum, sulphur and iron – see p. 123) and the potential cumulative toxicity of copper. In thecase of chromium, there were potential benefits but again there was insufficient evidence to makerecommendations. Udder health has been improved by increased levels of selenium, but the vitaminE status influences the effect. Again with zinc, the effects on somatic cell counts and mastitis havebeen too inconsistent to recommend giving zinc above requirements.
This is an area of continuing research, especially with the use of ‘organic’ mineral supplements(see p. 107).
from the digestive tract, especially in the inorganic form, and ingested tin has alow toxicity.
Arsenic
Arsenic is widely distributed throughout the tissues and fluids of the body but isconcentrated particularly in the skin, nails and hair. It has been shown that theelement is essential for the rat, chick, pig and goat. It is needed to form metabolitesof methionine, including cystine.Animals given an arsenic-deficient diet had roughcoats and slower growth rates than control animals given a supplement of arsenic.A long-term study with goats showed interference with reproduction (abortion,low birth weights) and milk production, and sudden death. The toxicity of theelement is well known; symptoms include nausea, vomiting, diarrhoea and severeabdominal pain. The toxicity of its compounds differs widely; trivalent arsenicals,which block lipoate-dependent enzymes, are more toxic than the pentavalentcompounds.
6.6 OTHER ELEMENTS
The essentiality of other elements, listed by some authorities, is the subject of de-bate. Often the levels required to produce a deficiency are so low as to be of no prac-tical significance in normal animal nutrition. For example, boron, which is essentialto plants, has been shown to increase growth rate and tibia weight and strength inbroilers, but the response was obtained at levels found only in boron-deficientplants. Lithium has been shown to be essential for goats, where it prevented growthretardation, impaired fertility and low birth weights, but again deficiency is unlikelyunder practical conditions.

Chapter 6 Minerals
136
SUMMARY
Minerals fulfil physiological, structural and regulatory functions. Mineral supplements take variousforms: mineral salts, rumen boluses, ‘organic’ compounds and pasture applications. The roles ofindividual mineral elements, and the effects of their deficiencies, are summarised below:
Mineral element Role Effects of deficiency
Calcium Bone and teeth, transmission of nerve impulses
Phosphorus Bone and teeth, energy metabolism Rickets, osteomalacia, depraved appetite, poor fertility
Potassium Osmoregulation, acid–base balance, nerve and muscle excitation
Sodium Acid–base balance, osmoregulation Dehydration, poor growth, poor egg production
Chlorine Acid–base balance, osmoregulation, gastric secretion
Sulphur Structure of amino acids, vitamins and hormones, chondroitin
Magnesium Bone, activator of enzymes for carbohydrate and lipid metabolism
Iron Haemoglobin, enzymes of electron transport chain
Rickets, osteomalacia, thin eggshells, milk fever
Retarded growth, weakness
Alkalosis
Equivalent to protein deficiency (urea-supplemented diets)
Nervous irritability and convulsions, hypomagnesaemia
Anaemia
Copper Haemoglobin synthesis, enzyme systems, pigments
Anaemia, poor growth, depigmentationof hair and wool, swayback
Cobalt Component of vitamin B12
Iodine Thyroid hormones Goitre; hairless, weak or dead youngManganese Enzyme activation Retarded growth, skeletal
abnormality, ataxiaZinc Enzyme component and activator Parakeratosis, poor growth,
depressed appetiteSelenium Component of glutathione peroxidase,
iodine metabolism, immune function
Pining (emaciation, anaemia, listlessness)
Myopathy, exudative diathesis
FURTHER READING
Agricultural and Food Research Council 1991 Technical Committee on Responses to Nutri-ents, Report no. 6.A reappraisal of the calcium and phosphorus requirements of sheep andcattle. Nutrition Abstracts and Reviews, Series B 61: 573–612.
Ammerman C B, Henry P R and Miles R D 1998 Supplemental organically-bound mineralcompounds in livestock nutrition. In: Garnsworthy P C and Wiseman J (eds) Recent Advances in Animal Nutrition, Nottingham, Nottingham University Press, 67–91.
Cottrill B and Rymer C 2001 The Effect of Enhanced Supplementation of Trace Elements onthe Health and Performance of Dairy Cows and on the Composition of Their Milk: AReport to the Milk Development Council, project no. 99/T2/27, Cirencester, MilkDevelopment Council.

Further reading
137
Ewing W N and Charlton S J 2005 The Minerals Directory, Packington, Context Publications.
McDowell L R 1992 Minerals in Animal and Human Nutrition, New York,Academic Press.
National Research Council 1980 Mineral Tolerances of Domestic Animals, Washington, DC,National Academy of Sciences.
Thompson J K and Fowler V R 1990 The evaluation of minerals in the diets of farm animals. In:Wiseman J and Cole D J A (eds) Feedstuff Evaluation, London, Butterworth, 235–59.
Underwood E J and Suttle N F 1999 The Mineral Nutrition of Livestock, 3rd edn,Wallingford,CABI.


PART 2
The digestion and metabolism of nutrients
This part describes the physical and chemical processes by which an animal obtains nutrientsfrom the chemical compounds that make up the foods ingested and explains how thesenutrients are subsequently utilised.
A key group of molecules required for both digestion and metabolism are the enzymes, andChapter 7 provides details of their chemistry, mode of action and the factors affecting theiractivity.
Chapter 8 is concerned with both the structure of animal digestive tracts and the mechanismsby which animals break down large molecules in foods during digestion to produce moleculesthat are small enough to be absorbed through the gut wall. Variations on the ‘simple stomach’monogastric system are described, leading on to specialised and highly developed systemsthat are dependent on microbial activity in the digestive tract.
Once the digested molecules are absorbed, they are used to provide energy and to producethe proteins, fats and carbohydrates that are required by the body. Chapter 9 describes themetabolic processes by which cells utilise and transform molecules and how these processesare controlled.


141
7.1 Classification of enzymes
7.2 Nature of enzymes
7.3 Mechanism of enzyme action
7.4 Specific nature of enzymes
7.5 Factors affecting enzyme activity
7.6 Nomenclature of enzymes
The existence of living things involves a continuous series of chemical reactions. Thus,green plants synthesise chemical compounds such as sugars, starch and proteins and inso doing fix and store energy. Subsequently these compounds are broken down by theplants themselves, or the animals that consume them, and the stored energy is utilised.The complex reactions involved in these processes are reversible and when not associ-ated with living organisms are often very slow. Extremes of temperature or pressure areoften required to increase the velocity of these reactions to practicable levels. In livingorganisms, such conditions do not exist; yet the storage and release of energy in suchorganisms must take place quickly when required, necessitating a high velocity from thereactions involved. The required velocity is achieved through the activity of numerouscatalysts present in living organisms.
A catalyst in the classical chemical sense is a substance that affects the velocity of achemical reaction without appearing in the final products; characteristically, the catalystremains unchanged in mass upon completion of the reaction. The catalysts found inliving organisms are organic in nature and are known as enzymes. They are capable ofincreasing the rate of chemical reaction by a factor of as much as 109–1012 times that ofthe non-catalysed reaction. The reactions catalysed by enzymes are theoreticallyreversible and should reach equilibrium. In living cells, reaction products are removedand the reactions are largely unidirectional and do not reach equilibrium. Rather, theyreach a steady state in which the concentrations of the reactants and products remainrelatively constant. Reactions will speed up under demand, or slow down when theproducts are not removed quickly enough to maintain the steady state. Enzymes affectboth the forward and the reverse reactions equally so that the steady state is notchanged; it is, however, attained more quickly. When one or more of the products is de-composed, the reaction may become virtually irreversible.
7 Enzymes

Chapter 7 Enzymes
Each living cell contains hundreds of enzymes and can function efficiently only if theaction of these enzymes is suitably coordinated. It is important to appreciate that withinthe cell, the enzymes exist in different compartments; the cell is not a bag of randomlydistributed enzymes. Thus, the enzymes used in the first stage of the oxidation of glu-cose (glycolysis) are present in the cytoplasm, whereas those involved in the formationof acetyl-CoA from pyruvate and its subsequent oxidation via the tricarboxylic acid cycleare found in the mitochondria (see Chapter 9).
This group includes:
■ dehydrogenases;■ oxidases;■ peroxidases;■ catalases;■ oxygenases;■ hydroxylases.
Transferases
The transferases are a large group of enzymes that catalyse the transfer of groupssuch as acetyl, amino and phosphate from one molecule to another. For example, inthe formation of citrate from oxalacetate during the release of energy in the body,addition of an acetyl group takes place in the presence of citrate synthetase:
142
CHOH + NAD+
CH3
COO–
C:O + NADH(+H+)
CH3
COO–
Lactate Nicotinamideadeninedinucleotide
Pyruvate Reduced NAD+
7.1 CLASSIFICATION OF ENZYMES
Enzymes are classified into six major groups according to their mode of action.
Oxidoreductases
The oxidoreductases catalyse the transfer of hydrogen, oxygen or electrons from onemolecule to another. For example, lactate is oxidised to pyruvate in the presence oflactate dehydrogenase. In the process, two electrons and two hydrogen atoms are re-moved from the alcohol group, and are transferred to NAD to form NADH(�H�),leaving a ketone.

Classification of enzymes
143
This group includes:
■ transaldolases and transketolases;■ acyl, glucosyl and phosphoryl transferases;■ kinases;■ phosphomutases.
Hydrolases
The hydrolases catalyse hydrolytic cleavage. Typical are the hydrolyses associatedwith fat and protein digestion, which are essential for the normal functioning of theorganism. A fat may be broken down to glycerides (acylglycerols) and fatty acidsunder the influence of a lipase:
Similarly, peptidases split proteins by hydrolysis of the peptide linkages betweenthe constituent amino acids.
This is a large group, including:
■ esterases;■ glycosidases;■ peptidases;■ phosphatases;■ thiolases;■ phospholipases;■ amidases;■ deaminases;■ ribonucleases.
Lyases
The lyases are enzymes that catalyse non-hydrolytic decompositions involving theremoval of certain groups such as in decarboxylation and deamination reactions.
CO.COO–
CH2.COO– + COS.CoA + H2O
CH3 CH2.COO–
C.OH.COO– + HS.CoA + H+
CH2.COO–
Oxalacetate Acetyl-CoA Citrate Coenzyme A
CH2.O.CO.R1
CH.O.CO.R2 + 2H2O
CH2.O.CO.R3
CH2OH
CH.O.CO.R2 + R3.COOH + R1.COOH
CH2OH
Triglyceride(triacylglycerol)
Monoglyceride(monoacylglycerol)
Fatty acids

Chapter 7 Enzymes
144
In addition to the above, the group includes:
■ aldolases;■ hydratases;■ dehydratases;■ synthases;■ lyases.
Isomerases
The isomerases catalyse intramolecular rearrangement in optical and positionalisomers.Typical of this class are the epimerases, such as uridine diphosphate glucose4-epimerase. This enzyme catalyses the change of configuration at the fourth carbonatom of glucose, and galactose is produced (see Chapter 9).The group includes:
■ racemases;■ isomerases;■ some of the mutases.
Ligases
The ligases, as the name implies, catalyse reactions where two molecules are boundtogether, with the breakdown of high-energy phosphate bonds such as in ATP, whichprovides the energy for the reaction to take place. The production of acetyl-CoAfrom acetate by acetyl coenzyme A synthetase is typical:
CH3
COOH
CH3
COS.CoA
Acetic acid Acetyl-CoA Pyrophosphate
H
S.COA
Coenzyme A
+ + ATP + H2O + AMP + PP
7.2 NATURE OF ENZYMES
The majority of enzymes are based on complex, high-molecular-weight proteins, butthere are exceptions, such as the ribozymes, which are RNA-based. Some proteinsmay themselves act as efficient catalysts, but many require the assistance of smallerentities to achieve this. Such substances, bound to the protein, are termed cofactors.
Coenzymes
Organic cofactors are known as coenzymes. They are relatively few in number, buteach coenzyme may be associated with a number of different enzymes and so playsa part in a large number of chemical reactions.Among the most important coenzymes
R
C:O
COOH
R
CHO + CO2
Pyruvate decarboxylase, for example, catalyses the conversion of a 2-oxo-acid to analdehyde, and carbon dioxide is removed:

Nature of enzymes
145
are nicotinamide adenine dinucleotide (NAD), thiamine pyrophosphate, pyridoxalphosphate and flavin mononucleotide. In such cases, the protein, referred to as theapoprotein, is catalytically inactive. However, when bound to the coenzyme it formsthe active holoenzyme. Flavin mononucleotide (Fig. 7.1) is a typical example of acoenzyme. Exchange of hydrogen atoms takes place at the positions marked *.
In some cases the coenzyme does not remain permanently attached to the apoen-zyme but is released after the reaction is completed.Thus, the oxidised form of NAD isstrongly bound to the apoenzyme in dehydrogenase systems, but when the oxidation iscomplete the reduced form is released from the enzyme and the oxidised form is regen-erated by reaction with other electron acceptors. In such cases, the coenzyme is actingmore as a second substrate than a true coenzyme. Many enzymes act out either or bothof these roles, depending upon the reaction with which they are concerned.
Metal cofactors
Some two-thirds of enzymes require metal cofactors if they are to carry out theirproper function. In some cases, the metals are attached by coordinate covalent link-ages to the enzyme protein or they may form part of prosthetic groups within theenzyme, as in the case of iron in the haem proteins (Fig. 7.2). Good examples of
CH2O P OH
CHOH
CHOH
CHOH
CH2
N
N CNH
CN OCH3
CH3∗
O
∗
O OH
Fig. 7.1 Flavin mononucleotide.
N N
CH
NN
CH
CH CHFe
Fig. 7.2 Haem grouping within the cytochrome molecule.

Chapter 7 Enzymes
146
MECHANISM OF ENZYME ACTION
If a chemical reaction is to take place, the reacting molecules must pass through a high-energy transition state.This may be envisaged as an intermediate stage in the reactionin which the molecules are distorted or strained, or have an unfavourable electronicarrangement. At any particular moment the molecules in a sample have differingenergies, but only a few will be able to pass the energy barrier represented by the tran-sition state. In this situation, the reaction will not proceed or may do so only very
ATP + Mg++ ATP–Mg complex
ATP–Mg complex + enzyme ATP–Mg–enzyme complex
Creatine Phosphocreatine
ATP–Mg–enzyme ADP + enzyme + Mg++
7.3
protein-bound metal cofactors are zinc and iron. Carboxypeptidase is a zincprotease that catalyses the hydrolytic cleavage of peptide bonds.The zinc generateshydrogen and hydroxyl ions, from bound water, which attack the peptide bond asshown here:
O H
H
C N CH2.CH2.RR.CH2CH2
HO
R.CH2.CH2COOH NH2.CH2.CH2.R
Enzyme
Amine
Zn++ +
OH–
Acid
H+
The cytochromes are important in certain oxidation reactions in the body inwhich they accept electrons from reduced substances, which are consequently oxi-dised.The iron forms part of the haem grouping within the cytochrome molecule, asshown in Fig. 7.2.The exchange of electrons takes place at the iron atom.
Metal cofactors do not always bind to the enzyme but rather bind to the primarysubstrate. The resulting substrate–metal complex binds to the enzyme and facili-tates its activity. Creatine kinase catalyses the transfer of phosphoryl groups fromadenosine triphosphate (ATP), which is broken down to adenosine diphosphate(ADP). The reaction requires the presence of magnesium ions. These, however, donot bind to the enzyme but bind to ATP, forming an ATP–Mg complex. It is thiscomplex that binds to the enzyme and allows transfer of the phosphoryl group:
Some enzymes are present in an inactive form that is changed to an active state atthe place and time when its action is required.Thus, trypsinogen is synthesised in thepancreas, transported to the small intestine and there changed to the active digestiveenzyme trypsin.This kind of mechanism confers considerable control over the sitingand timing of enzyme activity.The inactive precursors are known as zymogens.

Mechanism of enzyme action
147
Reaction
Freeenergy
Substrate
Activationenergy ofuncatalysedreaction Activation
energy ofcatalysedreaction
Product
Fig. 7.3 Mechanism of enzyme catalysis.
slowly. In the gaseous state or in solution, the energies of the molecules may be raisedby the provision of an outside source of energy in the form of heat; more moleculeswill pass the energy barrier and the reaction is speeded up. In the body this is not anoption, owing to the strict control exerted on body temperature. In such a situation,the same end may be achieved by lowering the barrier instead of increasing the energyof the molecules.This is the function performed by a catalyst.
In Fig. 7.3 the unbroken line illustrates the effect, on the rate of an uncatalysed re-action, of increasing inputs of energy.The apex of the curve represents the transitionstate and the energy that a molecule must possess for the reaction to take place.Thefree energy that must be provided to achieve this is the activation energy.The brokenline shows a similar plot for the catalysed reaction. In this case, the activation energyrequired by the molecule to achieve the transition state is lower. Consequently, moremolecules are able to attain it and the reaction rate is increased. It is important to ap-preciate that the catalyst does not change the equilibrium but merely changes thespeed with which equilibrium is attained.
Enzyme action involves the formation of a complex between the enzyme and thesubstrate or substrates. The complex then undergoes breakdown, yielding the prod-ucts and the unchanged enzyme:
The complexes are formed between the substrate and relatively few active siteson the enzyme surface.The bonding may be ionic:
E + S Δ ES Δ E + P
COO– +H3N.R
COO– +H3N.R
E

Chapter 7 Enzymes
148
or by hydrogen bonds:
or by covalent bonds typified by sulphydryl groups on the enzyme:
or by van der Waals bonds.These latter bonds arise as a result of non-specific attrac-tive forces between atoms when the distance between them is 3–4 Å. They areweaker than the ionic and hydrogen bonds but may be important because of thelarge number that may be formed when conditions are favourable.
The type of reaction envisaged for enzyme catalysis is illustrated by that sug-gested for the chymotrypsin-catalysed hydrolysis of an ester shown in Fig. 7.4, wherethe groups involved in the catalysis are the alcohol group of serine and the imidazoleof histidine.
The active sites are always small compared with the enzyme molecule and arethree-dimensional. They are usually clefts, crevices or pockets and have specificshapes. They are usually surrounded by amino acid chains, some of which help tobind the substrate and others that play a part in the actual catalytic process.
C:O HN
S C
H
OH
R
NH2
C:O + H2O
NH2
2NH3 + CO2
7.4 SPECIFIC NATURE OF ENZYMES
Enzyme specificity is said to be absolute if the action of the enzyme is limited to onesubstrate only.An example is urease, which only catalyses the breakdown of urea tocarbon dioxide and ammonia:
In most cases enzymes are able to catalyse reactions in more than one group ofsubstrates. In such cases the specificity is said to be relative. Such group specificitymay be of a low order, such as in the case of the digestive enzymes trypsin andpepsin, which catalyse the rupture of peptide bonds. In other cases it may be muchhigher. Chymotrypsin, for example, catalyses the hydrolytic cleavage only of peptidebonds in which the carboxyl residue is derived from an aromatic amino acid.
Enzyme specificity arises from the need for spatial conjunction of the activegroups of the substrate with the active site of the enzyme.This requires an exact fit of

Specific nature of enzymes
149
A H
NH
N
CH2Histidine
H + R
OCH2 C
O
OSerine
NH
N
CH2
A H OH
H
OCH2 C
R
O
NH
N
CH2
A
H
OCH2 C
R
O
HO–R
H2O
NH
N
CH2Histidine
H
OCH2Serine
HA
O
R
HA
NH
N
CH2
O
R
HA
NH
N
CH2
H
OCH2 C O
R
H
OCH2 C
R
O
OH
C
R
O
Alcohol (P1)
Enzyme Ester Enzyme–substrate complex
Acid (P2)
R
Fig. 7.4 Chymotrypsin-catalysed hydrolysis of an ester.
After Westheimer F H 1962 Advances in Enzymology 24: 464.
the substrate into the active site as a key fits into a lock. In the lock and key model ofenzyme action (Fig. 7.5), the necessary structures are considered to be preformed.
Although the lock and key model accounts for enzyme specificity, it does notexplain certain other aspects, and the induced-fit model is currently pre-eminent.This model predicates that the reacting sites need not be fully preformed but only so

Chapter 7 Enzymes
150
Enzyme Substrate
+
Fig. 7.5 Lock and key model of enzyme–substrate complex formation.
+
Fig. 7.6 Induced-fit model of enzyme–substrate complex formation.
7.5 FACTORS AFFECTING ENZYME ACTIVITY
Substrate concentration
In a system where the enzyme is in excess and the concentration remains constant, anincrease in substrate concentration increases the velocity of a reaction. This is due toincreased utilisation of the available active sites of the enzyme. If the substrate concen-tration continues to increase, utilisation of the available active sites becomes maximaland there is no further increase in the rate of reaction. In fact, continued increases insubstrate concentration may lead to a reduced rate, owing to an incomplete linkage of
far as to allow the substrate to position itself close to an active site on the enzyme.Interaction then causes distortion of both the enzyme and substrate, as a result ofwhich structures are produced that allow for complete conjunction of the two andsuccessful complex formation (Fig. 7.6). As a result of the distortion involved incomplex formation, strain is induced in the enzyme and this helps to pull the sub-strate into the transition state conformation.
In addition to distorting their substrates, enzymes frequently position groups inthe right position for the catalytic action to take place, especially in the case ofacid–base catalysis. In other instances, the enzyme sets a metal ion in just the rightposition to allow metal ion catalysis.

Factors affecting enzyme activity
151
enzyme and substrate resulting from competition for the active sites by the excess sub-strate molecules.
The effect of substrate concentration on the velocity of an enzyme-catalysedreaction is frequently represented in terms of the Michaelis–Menten constant, Km.Thisis the molar concentration of substrate at which half the centres of the enzyme are oc-cupied by substrate and the rate of reaction is half the maximum.Above Km, the effectof an increase in concentration of the substrate on the reaction decreases as themaximum is approached.At substrate concentrations below Km, increases in concen-tration will give large responses in terms of reaction rate.When physiological substrateconcentrations are much above an enzyme’s Km, the substrate is unlikely to be thecontrolling factor of a metabolic pathway. Many enzymes have Km values that approx-imate to their physiological concentrations. Changes in the latter will result in signifi-cant changes in reaction rate and are important in the control of metabolism.
Enzyme concentration
In a system where the substrate is present in excess, an increase in enzyme concen-tration gives a straight-line response in reaction velocity owing to the provision ofadditional active sites for the formation of enzyme–substrate complexes. Further in-creases in the enzyme concentration may result in some limiting factor, such as theavailability of the coenzyme, becoming operative. Enzymes are rarely saturated withsubstrate under physiological conditions.
Inhibitors
A wide variety of substances can act as inhibitors of enzyme activity. They fall intotwo main groups: reversible and non-reversible.
Reversible inhibition
Such inhibition involves non-covalent bonding of the inhibitor to the enzyme. Thegroup divides into three subgroups: competitive, non-competitive and uncompetitive.
A competitive inhibitor resembles the substrate in its chemical structure and is ableto combine with the enzyme to form an enzyme–inhibitor complex. In so doing itcompetes with the substrate for the active sites of the enzyme, and formation of theenzyme–substrate complex is inhibited.This type of inhibition may be reversed by theaddition of excess substrate, which displaces the inhibitor, forming normalenzyme–substrate complexes. One of the best-known examples is provided by thesulphonamide drugs.The synthesis of folic acid from p-aminobenzoic acid (PABA) is avital metabolic process in the bacteria controlled by these drugs. The similaritybetween PABA and sulphanilamide, released by the sulphonamides, is obvious:
COOH
NH2
Para-aminobenzoic acid
SO2NH2
NH2
Sulphanilamide

Chapter 7 Enzymes
152
The sulphanilamide forms a complex with the relevant enzyme, thus preventing nor-mal enzyme–substrate combination and the formation of folic acid.Addition of excessPABA overcomes the inhibition, since the formation of the enzyme–sulphanilamidecomplex is reversible.The situation may be visualised as shown in Fig. 7.7.
The extent of the inhibition will depend upon the relative concentrations of thetrue substrate and the inhibitor.
A non-competitive inhibitor does not bind to the active site but binds at someother site on the enzyme surface and may cause distortion of the enzyme and reducecatalytic activity. In the simplest case the inhibitor binds readily with both enzymeand substrate.Three types of complex are formed:
■ enzyme–substrate (ES);■ enzyme–inhibitor (EI);■ enzyme–inhibitor–substrate (EIS).
The reaction rate will be slower owing to the removal of enzyme from the system.The EI complex will be catalytically inert.The EIS complex may, however, be suscep-tible to reconversion to ES and make some contribution to catalytic activity. Non-competitive inhibition cannot be reversed by excess substrate, but it may be reversedby exhaustive dialysis.
In uncompetitive inhibition, the inhibitor binds to the enzyme–substrate complexand renders it inactive.
Irreversible inhibition
Such inhibition involves covalent bonding at the active site and cannot be reversedby excess substrate or by dialysis.The site is therefore blocked and made catalyticallyinactive. Most inhibitors in this group are highly toxic, e.g. the organophosphorusnerve poisons. Thus, diisopropyl fluorophosphate (DFP) reacts irreversibly with thehydroxyl group of serine:
Enzyme+ PABA+ sulphanilamide
Enzyme–PABAcomplex
Enzyme–sulphanilamidecomplex
Enzyme+ folic acid
Fig. 7.7 Competitive inhibition of PABA.
C:O
CH.CH2OH +
NH
O
CH.(CH3)2
O
CH.(CH3)2
C:O
CH.CH2.O.P:O + HF
NH
O
CH.(CH3)2
O
CH.(CH3)2
Enzyme Diisopropylphosphofluoridate
Inactive enzyme–inhibitorcomplex
F.P:O

Factors affecting enzyme activity
153
Any enzyme having an essential serine at its active site will be irreversibly inac-tivated by it. The serine proteases and acetylcholinesterases are typical examples.The latter is essential for nerve conduction and its inactivation results in rapidparalysis of vital functions. It is this action that makes the organophosphates suchpotent toxins.
Allosteric effects
The activity of some enzymes can be affected by molecules that bind to the enzymesbut that do not work in the same way as either competitive or non-competitive en-zyme inhibitors. Such molecules that bind to macromolecules are known as ligandsand may be small and simple or large and complex like proteins. They may be acti-vators or inhibitors and may even be substrates. They are commonly referred to aseffectors, modifiers or modulators.
Typically modulators bind to unique allosteric sites, which are quite distinct fromthe sites binding the substrate. The binding brings about a conformational change inthe enzyme, resulting in a change in the affinity of the enzyme for the substrate.Themodulators may increase or decrease the affinity and bind to activator and inhibitorysites, respectively.
The vast majority of allosteric enzymes are oligomers, i.e. they consist of severalsubunits or protomers. Binding of a modulator to one protomer may affect bindingat the other protomers so that the effect of an activator on the affinity of an enzymefor the substrate on one protomer has the same effect on the others.
Almost all metabolic pathways employ allosteric enzymes.The complex feedbackmechanisms controlling these pathways are, to a large part, the result of the action ofallosteric inhibitors and activators.
Environmental factors
A number of factors, including temperature, acidity and salt concentration, may in-fluence enzyme activity, but in the living animal these are not likely to be of muchimportance.
Temperature
Over a limited temperature range, the efficiency of enzyme-catalysed reactions isincreased by increasing the temperature.Very approximately, the speed of reaction isdoubled for each increase of 10 °C. As the temperature rises, a complicating factorcomes into play because denaturation of the enzyme protein begins.This is a molec-ular rearrangement that causes a loss of active sites on the enzyme surface and de-creases reaction efficiency. Above 50 °C destruction of the enzyme becomes morerapid, and most enzymes are destroyed when heated to 100 °C. The time for whichthe enzyme is subjected to a given temperature affects the magnitude of the loss ofactivity. Each enzyme has an optimum temperature at which it is most effective,which approximates to that of the cells in which it occurs. Thus, enzymes of micro-organisms adapted to cold conditions are able to function efficiently at temperaturesclose to zero, and others adapted to life in hot springs have optima in the region of 100 °C.

Chapter 7 Enzymes
154
Acidity
Hydrogen ion concentration has an important effect on the efficiency of enzymeaction. Most enzymes are most effective in the region of pH 6–7, which is similar tothat in cells. Extracellular enzymes may show maximum activity in the acid or alka-line pH ranges, but the actual range in which an individual enzyme works is onlyabout 2.5–3.0 units; outside this range, the activity declines very rapidly. The reduc-tion in efficiency brought about by a change in pH is due to changes in the degree ofionisation of the substrate and the enzyme.Where the linkage between active centresis electrostatic, the mechanism by which the intermediate complex is formed is af-fected and consequently the efficiency of enzyme action is reduced. In addition,highly acidic or alkaline conditions bring about denaturation of the enzyme and sub-sequent loss of activity.
7.6 NOMENCLATURE OF ENZYMES
Some enzymes were named in the early days of the study of enzymes and havenon-systematic names; for example, the digestive enzymes pepsin, trypsin andptyalin.
In 1972, the International Union of Pure and Applied Chemistry and the Interna-tional Union of Biochemistry recommended the use of two systems of nomenclaturefor enzymes, one systematic and one working or recommended. The recommendedname was not required to be very systematic but had to be short enough for conven-ient use.The systematic name, formed in accordance with definite rules, was to showthe action of the enzyme as exactly as possible, thus identifying it precisely. It was toconsist of two parts, the first naming the substrate and the second, ending -ase, indi-cating the type of reaction catalysed. In addition, code numbers were allocated toenzymes according to the following scheme:
■ The first number shows to which of the six main classes the enzyme belongs.■ The second number shows the subclass.■ The third number shows the sub-subclass.■ The fourth number identifies the enzyme.
Reaction
L-Lactate � NAD� topyruvate � NADH � H�
Lactate dehydrogenase
L-Lactate: NAD�
oxidoreductase1.1.1.27
L-Glutamate to 4-aminobutyrate � CO2
Glutamate decarboxylase
L-Glutamate 1-carboxylase
4.1.1.15
Hydrolysis of terminal non-reducing 1,4-linked alpha-D-glucose residues of alpha glucose (e.g.maltose to glucose)
Alpha-glucosidase Alpha-D-glucoside glucohydrolase
3.2.1.20
Recommended
name
Systematic
name
Code
number

Further reading
155
SUMMARY
1. Enzymes are organic catalysts. They are classi-fied into six major groups according to thefunctions they perform:
■ Oxidoreductases catalyse the transfer ofhydrogen, oxygen or electrons from onemolecule to another.
■ Tranferases catalyse transfer of groups fromone molecule to another.
■ Hydrolases catalyse hydrolytic cleavage.■ Lyases catalyse non-hydrolytic decompositions
such as decarboxylation and deamination.■ Isomerases catalyse intramolecular
rearrangements.■ Ligases catalyse bond formation, the energy
for which is derived from the breakdown ofhigh-energy compounds such as ATP.
2. The majority of enzymes are based on com-plex high-molecular-weight proteins, many ofwhich need organic cofactors (coenzymes) ifthey are to work efficiently. Others needmetallic cofactors, either bound to theenzyme by covalent bonds or forming anintegral part of the molecule. Others do notbind to the molecule but bind to the primarysubstrate.
3. An enzyme may be present in an inactive form(zymogen), which is changed to the activeform as and when required. A number of thedigestive enzymes are of this type, for exam-ple, trypsin.
4. Enzymes function by lowering the activationenergy of reactions.
5. Most enzymes are able to catalyse the reac-tions of more than one group of substancesand are described as being relatively specific.Others may catalyse one reaction for one sub-stance, in which case the specificity is describedas absolute.
6. The rate of enzyme action is influenced by:
■ substrate concentration;■ enzyme concentration;■ temperature;■ acidity;■ environment.
7. The first part of the name of an enzymeindicates the substrate attacked and the sec-ond part the type of reaction carried out. Inaddition, numbers are used to delineate class,subclass and sub-subclass.
FURTHER READING
Berg J M, Tymoczko J L and Stryer L 2006 Biochemistry, 6th edn, New York,W H Freeman.
Devlin T M (ed.) 1997 Textbook of Biochemistry with Clinical Correlations, 4th edn, NewYork, John Wiley & Sons.
Enzyme Nomenclature 1973 Recommendations (1972) of the International Union of Pureand Applied Chemistry and the International Union of Biochemistry, New York,AmericanElsevier.
Mathews C K and van Holde K E 1999 Biochemistry, 3rd edn, Redwood City, CA, BenjaminCummings Publishing Co.

156
8.1 Digestion in monogastric mammals
8.2 Microbial digestion in ruminants and other herbivores
8.3 Alternative sites of microbial digestion
8.4 Nutrient digestion and the environment
Many of the organic components of food are in the form of large insoluble molecules,which have to be broken down into simpler compounds before they can pass throughthe mucous membrane of the alimentary canal into the blood and lymph. The breaking-down process is termed ‘digestion’, and the passage of the digested nutrients throughthe mucous membrane ‘absorption’.
The processes important in digestion may be grouped into mechanical, chemical andmicrobial activities. The mechanical activities are mastication and the muscular contrac-tions of the alimentary canal. The main chemical action is brought about by enzymes se-creted by the animal in the various digestive juices, though it is possible that plantenzymes present in unprocessed foods may in some instances play a minor role in fooddigestion. Microbial digestion of food, also enzymic, is brought about by the action ofbacteria, protozoa and fungi, microorganisms that are of special significance in rumi-nant digestion. In monogastric animals, microbial activity occurs mainly in the large in-testine, although there is a low level of activity in the crop of birds and the stomach andsmall intestine of pigs.
8 Digestion
8.1 DIGESTION IN MONOGASTRIC MAMMALS
The alimentary canal
The various parts of the alimentary canal and its associated organs of the pig, whichwill be used as the reference animal, are shown in Fig. 8.1. Specific features of othertypes of digestive tract will be described after that of the pig.The digestive tract canbe considered as a tube extending from mouth to anus, lined with mucous mem-brane, whose function is the prehension, ingestion, comminution, digestion andabsorption of food, and the elimination of solid waste material.The various parts aremouth, pharynx, oesophagus, stomach, and small and large intestine.The movementof the intestinal contents along the tract is produced by peristaltic waves, which are

Digestion in monogastric mammals
157
Fig. 8.1 Diagrammatic representation of the digestive tract of the pig.
Source: After Moran E J Jr – See Further Reading
contractions of the circular muscle of the intestinal wall.The contractions are invol-untary and are under overall autonomic nervous control.The nervous plexus withinthe tissue layers of the gut wall integrates the activity of the muscles. Several differentkinds of movement of the intestinal wall are recognised, the functions of these beingthe transport of materials along the tract, the mixing of the digestive juices with thefood, and the bringing of the digested nutrients into contact with the intestinalmucous membrane for subsequent absorption.
The small intestine, which comprises the duodenum, the jejunum and the ileum,is the main absorption site and contains a series of finger-like projections, the villi,which greatly increase the surface area available for absorption of nutrients. Eachvillus contains an arteriole and venule, together with a drainage tube of the lym-phatic system, a lacteal.The venules ultimately drain into the hepatic portal system,and the lacteals into the thoracic lymphatic duct. The luminal side of each villus iscovered with projections, the microvilli, which are often referred to as the brushborder.
There are a number of secretions that flow into the alimentary canal from theliver, the pancreas and the wall of the canal, and many of these contain enzymes thatbring about the hydrolysis of the various food components (see Table 8.1). Some ofthe proteolytic enzymes present in the secretions are initially in the form of inactiveprecursors termed zymogens.These are activated after secretion into the tract.
Digestion in the mouth
This is mainly mechanical, mastication helping to break up large particles of foodand to mix it with saliva, which acts as a lubricant and is a medium for taste percep-tion.The lower incisor teeth are used for rooting and the inward-curved upper inci-sors grasp and shear food items.The premolars and molars are employed to crush thefood.The pig has taste buds throughout the oral cavity and they are concentrated onthe tongue.The saliva is secreted into the mouth by three pairs of salivary glands: theparotids, which are sited in front of each ear; the submandibular (submaxillary)glands, which lie on each side of the lower jaw; and the sublingual glands, which areunderneath the tongue. Saliva is about 99 per cent water, the remaining 1 per centconsisting of mucin, inorganic salts and the enzymes �-amylase and the complex
Liver
Pancreas Rectum
Smallintestine Colon
Caecum
Stomach Duodenum

Chapter 8 Digestion
158
Tab
le 8
.1M
ain
dig
esti
ve e
nzy
mes
Rec
om
men
ded
nam
eTr
ivia
l nam
eSy
stem
atic
nam
eN
um
ber
Sou
rce
Sub
stra
te
Enz
ymes
hyd
roly
sing
pe
ptid
e lin
ksPe
psin
––
3.4.
23G
astr
ic m
ucos
aP
rote
ins
and
pept
ides
Chy
mos
inR
enni
n–
3.4.
23.4
Gas
tric
muc
osa
(you
ng c
alve
s)P
rote
ins
and
pept
ides
Tryp
sin
––
3.4.
21.4
Panc
reas
Pro
tein
s an
d pe
ptid
es
Chy
mot
ryps
in–
–3.
4.21
.1Pa
ncre
asP
rote
ins
and
pept
ides
Car
boxy
pept
idas
e A
Car
boxy
pept
idas
ePe
ptid
yl- L
-am
ino-
acid
hyd
rola
se3.
4.12
.2Sm
all i
ntes
tine
Pept
ides
Car
boxy
pept
idas
e B
Pro
tam
inas
ePe
ptid
yl- L
-lysi
ne (
-L-a
rgin
ine)
hydr
olas
e3.
4.12
.3Sm
all i
ntes
tine
Pept
ides
Am
inop
epti
dase
s–
�-A
min
oacy
l-pe
ptid
e hy
drol
ases
3.4.
11Sm
all i
ntes
tine
Pept
ides
Dip
epti
dase
s–
Dip
epti
de h
ydro
lase
s3.
4.13
Smal
l int
esti
neD
ipep
tide
s
Enz
ymes
hyd
roly
sing
gl
ycos
ide
links
�-A
myl
ase
Dia
stas
e1,
4-�
-D-G
luca
n gl
ucan
ohyd
rola
se3.
2.1.
1Sa
liva,
panc
reas
Star
ch,g
lyco
gen,
dext
rin
�-G
luco
sida
seM
alta
se�
-D-G
luco
side
glu
cohy
drol
ase
3.2.
1.20
Smal
l int
esti
neM
alto
se
Olig
o-1,
6-gl
ucos
idas
eIs
omal
tase
Dex
trin
6-�
-glu
cano
hydr
olas
e3.
2.1.
10Sm
all i
ntes
tine
Dex
trin
s
�-G
alac
tosi
dase
Lac
tase
�-D
-Gal
acto
side
gal
acto
hydr
olas
e3.
2.1.
23Sm
all i
ntes
tine
Lac
tose
�-F
ruto
fura
nosi
dase
Sucr
ase
�-D
-Fru
ctof
uran
osid
e fr
ucto
hydr
olas
e3.
2.1.
26Sm
all i
ntes
tine
Sucr
ose
Enz
ymes
act
ing
on
este
r lin
ksTr
iacy
lgly
cero
l lip
ase
Lip
ase
Tria
cylg
lyce
rol a
cylh
ydro
lase
3.1.
1.3
Panc
reas
Tria
cylg
lyce
rols
Cho
lest
erol
est
eras
e–
Ster
ol-e
ster
hyd
rola
se3.
1.1.
13Pa
ncre
as a
nd s
mal
l int
esti
neC
hole
ster
ol e
ster
s
Pho
spho
lipas
e A
2L
ecit
hina
se A
Pho
spha
tide
2-a
cyl-
hydr
olas
e3.
1.1.
4Pa
ncre
as a
nd s
mal
l int
esti
neL
ecit
hins
and
cep
halin
s
Lyso
phos
phol
ipas
eLy
sole
cith
inas
eLy
sole
cith
in a
cyl-
hydr
olas
e3.
1.1.
5Sm
all i
ntes
tine
Lyso
leci
thin
Deo
xyri
bonu
clea
seD
Nas
eD
exoy
ribo
nucl
eate
5�-
olig
onuc
leot
idoh
ydro
lase
3.1.
4.5
Panc
reas
and
sm
all i
ntes
tine
DN
A
Rib
onuc
leas
e 1
RN
ase
Rib
onuc
leat
e 3�
-pyr
imid
ino-
ol
igon
ucle
otid
ohyd
rola
se
3.1.
4.22
Panc
reas
and
sm
all i
ntes
tine
RN
A
Nuc
leos
idas
e–
N-R
ibos
yl-p
urin
e ri
bohy
drol
ase
3.2.
2.1
Smal
l int
esti
neN
ucle
osid
es
Pho
spha
tase
s–
–3.
1.3
Smal
l int
esti
neO
rtho
phos
phor
ic a
cid
este
rs

Digestion in monogastric mammals
159
BOX 8.1 Studies of digestion
To study digestion in farm animals, especially ruminants, it is often necessary to obtain samples ofdigesta from various sections of the alimentary tract. Stomach contents can be sampled by means ofa tube inserted via the oesophagus. However, the sampling of this and other sections of the tractgenerally requires surgical modification of the animal by the formation of fistulas. A fistula is anopening created between a digestive organ and the exterior of the animal, and it is maintained bymeans of a rubber or plastic insert known as a cannula. For example, in ruminants a fistula may beformed between the posterior dorsal sac of the rumen and the animal’s flank. Such a fistula is nor-mally fitted with a cannula 25–125 mm in diameter, with a screw cap. Removal of the cap allowssamples of rumen contents to be taken. In both ruminants and pigs, similar, but smaller, cannulaemay be inserted into the true stomach and into selected points of the small or large intestines.Theintestines may also be fitted with a device known as a re-entrant cannula. For this the intestine issevered and both ends are brought close to the skin surface and joined by a tube running outsidethe animal.With this tube in position the digesta flow normally from the proximal to the distal por-tions of the intestine. However, if the tube is opened, digesta may be collected from the proximalpart, measured, sampled and returned to the distal part.The re-entrant cannula therefore allows theflow of digesta to be measured directly. In pigs, for example, a cannula at the terminal ileum is usedto determine how much protein digestion has occurred before the food residues are attacked bymicroorganisms in the caecum and colon.
Cannulated animals live a normal life and with care can be kept free of discomfort or pain forlong periods. Sheep with a rumen cannula are known to have survived for more than 10 years, wellbeyond their normal lifespan.
lysozyme. Some animals, such as the horse, cat and dog, lack salivary �-amylase,whereas the saliva of other species, humans included, has strong �-amylase activity.The enzyme is present in the saliva of the pig, but the activity is low. It is doubtfulwhether much digestion occurs in the mouth, since the food is quickly swallowedand passed along the oesophagus to the stomach, where the pH is unfavourable for �-amylase activity. It is possible, however, that some digestion of starch by the enzymecan occur in the stomach, since the food mass is not immediately mixed intimately withthe gastric juice. The pH of pig’s saliva is about 7.3, which is only slightly above thevalue regarded as optimal for �-amylase activity.This enzyme hydrolyses the �-(1S4)-glucan links in polysaccharides containing three or more �-(1S4)-linked D-glucoseunits. The enzyme therefore acts on starch, glycogen and related polysaccharides andoligosaccharides.When amylose, which contains exclusively �-(1S4)-glucosidic bonds(see p. 26), is attacked by �-amylase, random cleavages of these bonds give rise to amixture of glucose and maltose.Amylopectin, on the other hand, contains in additionto �-(1S4)-glucosidic bonds a number of branched �-(1S6)-glucosidic bonds, whichare not attacked by �-amylase, and the products include a mixture of branched andunbranched oligosaccharides (termed ‘limit dextrins’) in which �-(1S6)-bonds areabundant.
The enzyme lysozyme has been detected in many tissues and body fluids. It iscapable of hydrolysing the �-(1S4)-N-acetyl-glucosaminidic linkage of the repeatingdisaccharide unit in the polysaccharides of the cell walls of many species of bacteria,thereby killing and dissolving them.

Chapter 8 Digestion
160
Digestion in the stomach
The stomach of the adult pig has a capacity of about 8 l and consists of a simple com-partment, which functions not only as an organ for the digestion of food but also forstorage. Viewed from the exterior, the stomach can be seen to be divided into thecardia (entrance), fundus and pylorus (terminus), the cardia and pylorus beingsphincters controlling the passage of food through the stomach.The inner surface ofthe stomach is increased in area by an infolding of the epithelium and has four dis-tinct areas.The oesophageal area is an extension of the oesophagus into the stomachand the surface has no glands. Here, �-amylase activity may continue and there is anactive microbial population, mainly lactobacilli and streptococci. The cardia areacovers about one-third of the surface and secretes an alkaline, enzyme-free, viscousmucus formed of a gel-forming glycoprotein that protects the epithelium from acidattack. The gastric gland region covers a further third of the surface and secretes aglycoprotein and fucolipid mucus and contains the oxyntic cells, which producehydrochloric acid. In addition, this region also produces pepsinogen.The fourth areais the pyloric region, which is before the entry to the small intestine. This, area hasglands, like those in the cardia region, which secrete a protective mucus. Thus, thegastric juice consists of water, pepsinogens, inorganic salts, mucus, hydrochloric acidand the intrinsic factor important for the efficient absorption of vitamin B12.
A number of factors are concerned with the stimulation of the glands to secretegastric juice. Initially, in the cephalic phase, stimuli such as the sight and smell offood act via the vagus nerve. Then, in the gastric phase, secretion is maintained bychemical sensors and distension of the stomach. Finally, the presence of digesta inthe duodenum elicits secretion by neural and hormonal messages.
The pig’s stomach is rarely completely empty between meals and the slow mixingconditions are conducive to microbial fermentation at the oesophageal end and gastricdigestion at the pyloric end. Pepsinogens are the inactive forms of pepsins that hydrol-yse proteins.The acid concentration of the gastric juice varies with the diet but is gen-erally about 0.1 M, which is sufficient to lower the pH to 2.0. The acid activates thepepsinogens, converting them into pepsins by removing low-molecular-weight pep-tides from each precursor molecule. Four pepsins have been found in the pig, whichhave optimum activity at two different pH levels, 2.0 and 3.5. Pepsins preferentially at-tack those peptide bonds adjacent to aromatic amino acids, e.g. phenylalanine, trypto-phan and tyrosine, but they also have a significant action on linkages involvingglutamic acid and cysteine. Pepsins also have a strong clotting action on milk. Renninor chymosin, an enzyme that occurs in the gastric juice of the calf and the youngpiglet, resembles pepsins in its activity.The products of protein digestion in the stom-ach are mainly polypeptides of variable chain length and a few amino acids.
The emptying of the stomach contents into the duodenum is controlled by os-motic sensors in the duodenum. In addition, the presence of excess lipid reduces theemptying rate.
The epithelial surface of the pig’s stomach is susceptible to ulceration related tothe degree of processing of cereals in the diet (see p. 558).
Digestion in the small intestine
The partially digested food leaving the stomach enters the small intestine, where it ismixed with secretions from the duodenum, liver and pancreas.The majority of digestionand absorption occurs in the small intestine, the duodenal area being the site for

Digestion in monogastric mammals
161
mixing digesta and secretions and the jejunal area being the site of absorption. Theduodenal (Brunner’s) glands produce an alkaline secretion, which enters the duode-num through ducts situated between the villi.This secretion acts as a lubricant and alsoprotects the duodenal wall from the hydrochloric acid entering from the stomach.
Bile is secreted by the liver and passes to the duodenum through the bile duct. Itcontains the sodium and potassium salts of bile acids, chiefly glycocholic and tauro-cholic (see p. 49), phospholipids, the bile pigments biliverdin and bilirubin, which are the end products of haem catabolism, cholesterol and mucin. In all farm animalsexcept the horse, bile is stored in the gall bladder until required. The bile salts playan important part in digestion by activating pancreatic lipase and emulsifying fats.The daily requirement for bile acids is greater than the synthetic capacity of theliver, and an enterohepatic circulation exists to maintain the supply.
The pancreas is a gland that lies in the duodenal loop and has two secretory func-tions: the endocrine process for the production of insulin and the exocrine process forthe production of digestive enzymes (from the acinar cells), water and electrolytes(from the duct cells), which together form the pancreatic juice, which is secreted intothe duodenum through the pancreatic duct.The proportions of the different enzymeschange in response to the nature of the diet.
A number of factors induce the pancreas to secrete its juice into the duodenum.When acid enters the duodenum, the hormone secretin is liberated from the epitheliumof the small intestine into the blood. When it reaches the pancreatic circulation,secretin stimulates the pancreatic cells to secrete a watery fluid containing a highconcentration of bicarbonate ions but very little enzyme. Another hormone, chole-cystokinin (pancreozymin), is also liberated from the mucosa when peptides andother digestive products reach the duodenum.This hormone stimulates the secretioninto the pancreatic juice of proenzymes and enzymes such as trypsinogen, chy-motrypsinogen, procarboxypeptidases A and B, proelastase, �-amylase, lipase, lecithi-nases and nucleases. Unlike pepsin, these enzymes have pH optima around 7–9.The inactive zymogen trypsinogen is converted to the active trypsin by enteroki-nase, an enzyme liberated from the duodenal mucosa. This activation is also catal-ysed by trypsin itself, thus constituting an autocatalytic reaction. The activationprocess results in the liberation of a hexapeptide from the amino terminal end oftrypsinogen. Trypsin is very specific and acts only upon peptide linkages involvingthe carboxyl groups of lysine and arginine.Trypsin also converts chymotrypsinogeninto the active enzyme chymotrypsin, which has a specificity towards peptide bondsinvolving the carboxyl groups of tyrosine, tryptophan, phenylalanine and leucine.Procarboxypeptidases are converted by trypsin into the proteolytic enzymes car-boxypeptidases, which attack the peptides from the end of the chain, splitting off theterminal amino acid, which has a free �-carboxyl group. Such an enzyme is classifiedas an exopeptidase, as distinct from trypsin and chymotrypsin, which attack peptidebonds in the interior of the molecule and which are known as endopeptidases.
Pancreatic �-amylase is similar in function to the salivary amylase and attacks the�-(1S4)-glucan links in starch and glycogen.
The breakdown of fats is achieved by pancreatic lipase.This enzyme does not com-pletely hydrolyse triacylglycerols and the action stops at the monoacylglycerol stage.
Dietary fat leaves the stomach in the form of relatively large globules that aredifficult to hydrolyse rapidly. Fat hydrolysis is helped by emulsification, which isbrought about by the action of bile salts. These bile salts are detergents or am-phipaths, the sterol nucleus being lipid-soluble and the hydroxyl groups and ionised

Chapter 8 Digestion
162
β CHOOC.R2
α CH2OOC.R3
α’ CH2OOC.R1 R3.COOH
CHOOC.R2
CH2OOC.R1
CH2OH
R1.COOH
CHOOC.R2
CH2OH
CH2OH
Triacylglycerol Diacylglycerol Monoacylglycerol
conjugate of glycine or taurine being water-soluble (see p. 50).These amphipaths, inaddition to being emulsifying agents, also have the property of being able to aggre-gate together to form micelles. Although triacylglycerols are insoluble in these mi-celles, monoacylglycerols and most fatty acids dissolve, forming mixed micelles.Some fatty acids, e.g. stearic acid, are not readily soluble in pure bile salt micellesbut dissolve in mixed micelles.
Lecithinase A is an enzyme that hydrolyses the bond linking the fatty acid to the�-hydroxyl group of lecithin (see p. 45). The product formed from this hydrolysis,lysolecithin, is further hydrolysed by lysolecithinase (lecithinase B) to form glyc-erolphosphocholine and a fatty acid. Cholesterol esterase catalyses the splitting ofcholesterol esters.
The nucleic acids DNA and RNA (see p. 64) are hydrolysed by the polynucleoti-dases deoxyribonuclease (DNase) and ribonuclease (RNase), respectively.These en-zymes catalyse the cleavage of the ester bonds between the sugar and phosphoricacid in the nucleic acids.The end products are the component nucleotides. Nucleosi-dases attack the linkage between the sugar and the nitrogenous bases, liberating thefree purines and pyrimidines. Phosphatases complete the hydrolysis by separatingthe orthophosphoric acid from the ribose or deoxyribose.
The hydrolysis of oligosaccharides to monosaccharides and of small peptides toamino acids is brought about by enzymes associated with the intestinal villi. Only asmall proportion of hydrolysis occurs intraluminally and arises from enzymes presentin aged cells discarded from the intestinal mucosa. Most of the enzymatic hydrolysisoccurs at the luminal surface of the epithelial cells, although some peptides are ab-sorbed by the cells before being broken down by enzymes present in the cytoplasm.
Enzymes produced by the villi are sucrase, which converts sucrose to glucose andfructose; maltase, which breaks down maltose to two molecules of glucose; lactase,which hydrolyses lactose to one molecule of glucose and one of galactose; and oligo-1,6-glucosidase, which attacks the �-(1S6) links in limit dextrins.Aminopeptidasesact on the peptide bond adjacent to the free amino group of simple peptides,whereas dipeptidases complete the breakdown of dipeptides to amino acids.
Although the large intestine is recognised as the site of major microbial fermenta-tion (see below), there is a microbial population in the small intestine. Recent workwith sugar beet pulp given to pigs fitted with ileal cannulae showed that a large pro-portion (47 per cent) of the neutral detergent fibre fraction was digested before theterminal ileum.This breakdown is the result of microbial activity in the stomach andsmall intestine and acid hydrolysis of some of the fibre fractions.
Digestion in the large intestine
The main site of absorption of digested nutrients is the small intestine; by the time thefood material has reached the entrance to the colon, most of the hydrolysed nutrients

have been absorbed.With normal diets there is always a certain amount of material thatis resistant to the action of the enzymes secreted into the alimentary canal. The largeintestine plays an important role in the retrieval of nutrients, electrolytes and water inthe digesta. Pigs have a short caecum and long colon compared with other monogastricomnivores.The mucosal surface does not have villi, as in the small intestine, but thereare small projections that increase the surface area.As the ileal contents enter the largeintestine, the fluid and fine particles are preferentially retained by the ascending colon,whereas the coarser particles move distally at a faster rate. Cellulose and many of thehemicelluloses are not attacked by any of the enzymes present in the digestive secre-tions of the pig. In addition certain starches, such as raw potato starch, are resistant tohydrolysis by amylase. Lignin is known to be completely unaffected and is thus indi-gestible. It is also conceivable that lignified tissues may trap proteins and carbohydratesand protect them from the action of digestive enzymes.The glands of the large intestineare mainly mucous glands, which do not produce enzymes, and digestion in the largeintestine is therefore brought about by enzymes that have been carried down in thefood from the upper part of the tract, or it occurs as a result of microbial activity.
Extensive microbial activity occurs in the large intestine, especially the caecum.Here the slow rate of passage and abundant nutrient sources encourage the prolificgrowth of bacteria. There is a complex population of aerobic and obligate anaerobicbacteria, including lactobacilli, streptococci, coliforms, bacteroides, clostridia andyeasts.These metabolise a wide range of nitrogen and carbohydrate sources from bothdietary and endogenous residues, resulting in the formation of a number of products,including indole, skatole, phenol, hydrogen sulphide, amines, ammonia and thevolatile fatty acids (acetic, propionic and butyric).As with the rumen bacteria, the rel-ative numbers of the species change in response to the material available for fermenta-tion. More volatile fatty acids are produced from the finer particles as they have alarger surface area for attack by the bacteria. The digestion of cellulose and otherhigher polysaccharides is nevertheless small compared with that taking place in thehorse and ruminants, which have digestive systems adapted to deal with fibrous foods.With conventional pig diets, microbial fermentation accounts for 8–16 per cent of theorganic matter disappearing from the gastrointestinal tract.The products of microbialbreakdown of polysaccharides are not sugars but are mainly the volatile fatty acidslisted above. Lactic acid can be produced under some circumstances.The volatile fattyacids are absorbed and contribute to the energy supply of the pig.
Bacterial action in the large intestine may have a beneficial effect owing to thesynthesis of some of the B vitamins, which may be absorbed and utilised by the host.Synthesis of most of the vitamins in the digestive tract of the pig is, however, insuffi-cient to meet the daily requirements and a dietary source is needed.
The waste material, or faeces, voided from the large intestine via the anus consistsof water, undigested food residues, digestive secretions, epithelial cells from thetract, inorganic salts, bacteria and products of microbial decomposition.
Digestion in the young pig
From birth until about the age of 5 weeks the concentration and activity of many diges-tive secretions in the young pig are different from those in the adult animal. Duringthe first few days after birth the intestine is permeable to native proteins. In theyoung pig, as in other farm animals, this is essential for the transfer of �-globulins(antibodies) via the mother’s milk to the newborn animal. The ability of the youngpig to absorb these proteins declines rapidly and is low by 24 hours postpartum.
Digestion in monogastric mammals
163

Chapter 8 Digestion
164
Table 8.2 Weight of disaccharide hydrolysed per kilogram body weight per hourby small intestine enzymes in young pigs
Lactose (g) Sucrose (g) Maltose (g)
Newborn 5.9 0.06 0.35 weeks 0.8 1.3 2.5
The piglet stomach initially produces only a limited amount of hydrochloric acidand pepsinogen, but it does secrete chymosin. This operates at pH 3.5 to break thepeptide bonds between phenylalanine and methionine in casein. It clots milk,thereby avoiding flooding the small intestine with nutrients. As the piglet develops,pepsinogen and hydrochloric acid secretion increases.Table 8.2 shows the activity ofsome of the important carbohydrases in the young pig.
The activity of lactase is high at birth and reaches a maximum in the first week of lifeand then slowly declines over the third or fourth week. Maltase activity increases fromthe fourth week, while sucrase reaches a constant level between weeks 4 and 8. Theactivity of �-amylase is present at birth but remains low until about 4 weeks of age.
These differences in enzyme activities are of special significance where piglets arereared on early weaning diets. If young pigs are weaned at 14 days of age, their diet,especially regarding the types of carbohydrate, should be different from that for an-imals weaned later. Early weaning mixtures usually include a high proportion ofdried milk products containing lactose. For later weaning at 3–4 weeks, cookedcereals are included in the diet, since raw starch is incompletely digested in the smallintestine and passes to the large intestine, where it is fermented by bacteria, causingdiarrhoea.
Digestion in the fowl
The enzymes present in the digestive secretions of the fowl are similar to those ofmammals, although lactase has not been detected. However, the digestive tract ofthe fowl differs in a number of respects from that of the pig (see Fig. 8.2). In the fowl,the lips and cheeks are replaced by the beak, the teeth being absent.Taste is limited,the taste buds being located on the back half of the tongue and the adjacent phar-ynx.The crop is a diverticulum of the oesophagus, situated about two-thirds down itslength and just before its entry into the thorax. It is a pear-shaped sac formed as asingle lobe whose main function is to act as a reservoir for holding food. It is filledand emptied by peristalsis.The crop wall does not have mucus-secreting glands. It isnot essential to the bird, but its presence gives more flexibility in feeding activity.Salivary amylase is known to occur in the fowl, and the action of this enzyme onstarch continues in the crop. In addition, microbial activity occurs there during thestorage of food. Lactobacilli predominate, adhering to the crop wall.The major prod-ucts of fermentation are lactic and acetic acids.
The oesophagus terminates at the proventriculus or glandular stomach. This pro-duces hydrochloric acid and pepsinogen. The proventriculus has minimal inherentmotility and food passes through as a result of oesophageal contractions. It leads tothe gizzard, a muscular organ with internal ridges that undergoes rhythmic contractionsand grinds the food, with moisture, into a smooth paste. The gizzard wall produceskoilin, a protein–polysaccharide complex similar in its amino acid composition tokeratin, which hardens in the presence of hydrochloric acid. Digesta particles pass to

the small intestine when ground sufficiently; reflux of intestinal digesta into the giz-zard can also occur. The presence of grit in the gizzard, although not essential, hasbeen shown to increase the breakdown of whole grains by about 10 per cent. Prote-olysis occurs in the lumen of the gizzard. Thus, the proventriculus and gizzard areequivalent in function to the mammalian stomach.
The duodenum encloses the pancreas as in mammals. In the fowl, the three pan-creatic and two bile ducts (one from the gall bladder and one from the right lobe ofthe liver) open into the intestine at the termination of the duodenum. The arrange-ment and number of ducts differ among fowls, geese and turkeys.
The pancreatic juice of fowls contains the same enzymes as the mammalian secre-tion, and the digestion of proteins, fats and carbohydrates in the small intestine is be-lieved to be similar to that occurring in the pig. The intestinal mucosa producesmucin, �-amylase, maltase, sucrase and proteolytic enzymes.
Unlike young pigs, chicks have maltase and sucrase activities in their small intes-tine and, since they perform well on diets containing uncooked cereals, it can beassumed that they possess satisfactory amylase activity.
Where the small intestine joins the large intestine, there are two long blind sacsknown as the caeca.These function as absorptive organs but are not essential to thefowl, since surgical removal causes no harmful effects.There are bacteria associatedwith the mucosal surface of the caeca, and peristaltic activity mixes these with thedigesta and leads to its fermentation, with the production of volatile fatty acids.Experiments with adult fowls indicate that the cellulose present in cereal grains is notbroken down by microbial activity to any great extent during its passage through thedigestive tract, although some hemicellulose breakdown occurs. Similarly with geese,ligation of the caeca does not alter crude fibre digestibility and so it is unlikely thatthe volatile fatty acids make a large contribution to satisfying the energy require-ment of poultry.
The caeca empty by peristaltic contraction into the relatively short colon, whosemain function is the transport of digesta to its termination at the cloaca.The cloaca,
Digestion in monogastric mammals
165
CropLiver
Smallintestine
Caeca
Caeca
Colon
Cloaca
Proventriculus
Gizzard Pancreas
Duodenum
Fig. 8.2 Diagrammatic representation of the digestive tract of the fowl.
Source: After Moran E T Jr – See Further Reading

Chapter 8 Digestion
166
Dog(Canis familiaris)
Body length: 30 cm
0 cm 10
Fig. 8.3 Diagrammatic representation of the digestive tract of the dog.
Source: After Stevens C E and Hume I D 1995 Comparative Physiology of the Vertebrate Digestive System,2nd edn, Cambridge, Cambridge University Press.
from which faeces and urine are excreted together, combines the function of the rec-tum and bladder.
Digestion in the dog and cat
Dogs and cats are predominantly carnivores. The cat is the stricter carnivorewhereas the dog is more adaptable and omnivorous. In the natural state their foodis comprised mainly of fat and protein, with little carbohydrate. As a consequence,the digestive tract of the dog and cat is simpler than that of the pig, with empha-sis on digestion in the stomach and small intestine and a short large intestine(Fig. 8.3).
The saliva of dogs and cats has no �-amylase activity, as the natural diet is low instarch.The dog eats large meals and the stomach expands to provide temporary stor-age of food, but this is less important in the cat, which eats small meals.The stomachsecretes gastric lipase and pepsin, and the quantity of secretion is influenced by theamount of protein in the food and the volume of the meal. Pepsin is most active whenthe animal has ingested collagen and is important for the digestion of meat and, in viewof this, is more important in the cat. In dogs, gastric juice has antibacterial activity.The large intestine accounts for only about 8 per cent of the total digestion of food inthe dog, depending on the diet. The proportion is increased with diets containinglegumes and resistant starch. Similar to the pig, young dogs and cats are less efficientin digesting solid food than older animals.

Oesophagus
Rightdorsalcolon
Rightventralcolon
Smallintestine
Largeintestine
Caecum
Rectum
Stomach
Fig. 8.4 Diagrammatic representation of the digestive tract of the horse.
Source: After Colemann R Basic Horse Nutrition, www.ca.uky.edu/agc/pubs/asc/asc114/asc114.htm accessed on 06/08/09.
Pre-caecal digestion in the horse
The horse is a non-ruminant herbivore, having a simple monogastric digestive tractsimilar to that of the pig but with a much enlarged hind gut (especially the caecum),which contains a microbial population (Fig. 8.4).
The small intestine is the main site for the digestion of non-fibrous carbohydrate,protein and fat, and the microbes in the large intestine ferment fibrous materials, asin the ruminant (see p. 171).Thus, unlike the ruminant, the horse has enzymic diges-tion before microbial fermentation, and it falls between the pig and the ruminant inits ability to digest fibrous foods.The horse spends a long time chewing its food, dur-ing which copious amounts of mucus-containing saliva are added to ease swallowing.The saliva has no digestive enzyme activity but does contain bicarbonate, whichbuffers the swallowed digesta in the proximal region of the stomach.The stomach is
Digestion in monogastric mammals
167

Chapter 8 Digestion
168
relatively small, being only about 10 per cent of the total gastrointestinal tract, andis suited to frequent consumption of small quantities of food. Its major role is to reg-ulate the flow of digesta to the small intestine, ensuring efficient digestion there.Thestomach is rarely empty and the retention time of digesta in the stomach is short(2–6 hours), particularly in the grazing horse.There is limited microbial fermentationin the oesophageal and fundic regions of the stomach, with the production of lacticacid.Towards the pyloric region hydrochloric acid is added and the pH of the digestafalls. The small intestine represents about 30 per cent of the volume of the gastro-intestinal tract and 75 per cent of its length, and movement of digesta through it israpid. It is the main site of digestion of protein to amino acids and their absorption.Soluble carbohydrates, such as starches and sugars, are exposed to pancreatic amy-lase and �-glucosidase secreted by the cells in the wall of the small intestine. Amy-lase activity is low compared with that of the pig and may limit the rate of digestionof starches, allowing some starches to reach the large intestine if given in large quan-tities. The disaccharidase activity is similar to that in the pig. The horse has no gallbladder and thus cannot store bile: the presence of hydrochloric acid in the duode-num causes stimulation of bile secretion from the liver. The lack of a gall bladderdoes not seem to affect the digestion of fat. It is not certain whether the pancreaticsecretions have lipase activity.The remaining undigested material then passes to thelarge intestine and is exposed to microbial fermentation (see p. 186). Despite therapid transit of digesta through the small intestine, digestion and absorption are usu-ally efficient and the composition of the material entering the large intestine is fairlyuniform. This is important for the correct functioning of the large intestine, and in-stances of disturbance often result from inefficient digestion in the small intestine.
Absorption of digested nutrients
The main organ for the absorption of dietary nutrients by the monogastric mammalis the small intestine.This part of the tract is specially adapted for absorption becauseits inner surface area is increased by folding and the presence of villi. Although theduodenum has villi, this is primarily a mixing and neutralising site, and the jejunumis the major absorptive site.Absorption of a nutrient from the lumen of the intestinecan take place by passive transport, involving simple diffusion, provided there is ahigh concentration of the nutrient outside the cell and a low concentration inside.The vascular system in the villi is arranged so that the concentration gradient is max-imised. Nutrients such as monosaccharides, amino acids and small peptides are ab-sorbed at a faster rate than can be accounted for by passive diffusion.The absorptionof such molecules is aided by specific carrier transport systems in which carrier pro-teins reversibly bind to and transfer the nutrient across the brush border and basolat-eral membranes of the epithelial cells.The transfer may be by facilitative transport,in which the carrier transports the molecule down its concentration gradient. Alter-natively, absorption may be by a process of active transport (or co-transport). Here,the carrier has two specific binding sites and the organic nutrient is attached to oneof these while the other site picks up a sodium ion (in the case of monosaccharidesand amino acids) or a hydrogen ion (in the case of dipeptides).The sodium or hydro-gen ion travels down the chemical gradient and the loaded carrier thus moves acrossthe intestinal membrane and deposits the organic nutrient and the sodium or hydro-gen inside the cell.The empty carrier then returns across the membrane, free to pickup more nutrients.The sodium ion is actively pumped back to the lumen by Na�/K�

transporting ATPase. In the case of the dipeptide carrier, the hydrogen ion gradient ismaintained by a system involving Na� and H�, which generates an acidic microcli-mate on the small intestine surface. A number of different carriers are thought toexist, although some may carry more than one nutrient; for example, xylose can bebound by the same carrier as glucose. The carrier proteins are large complex mole-cules and have binding sites for specific nutrients or related groups of nutrients.Themolecular weight can exceed 50 000 and the sodium-linked glucose transporter ismade up of 664 amino acid residues (or molecules).
Since there are costs to the animal in synthesising and maintaining the carrierproteins, it would be inefficient to maintain a specific level of carrier when the sub-strate is not present. On the other hand, if insufficient carrier is available, the trans-port pathway will limit the assimilation of nutrients. Therefore, the carrier proteinsare regulated and show adaptation to the level of nutrient present in the gut.
A third method of absorption is by pinocytosis ‘cell drinking’, in which cells havethe capacity to engulf large molecules in solution or suspension. Such a process isparticularly important in many newborn suckled mammals in which immunoglobu-lins present in colostrum are absorbed intact.
Carbohydrates
The digestion of carbohydrates by enzymes secreted by the pig and other monogas-tric animals results in the production of monosaccharides. The formation of thesesimple sugars from disaccharides takes place on the surface of the microvillus mem-brane. The aldoses, such as glucose, are actively transported across the cell after at-tachment to the specific carrier and carried by the portal blood systems to the liver.The mechanism for the absorption of ketoses is unclear, although the existence of afacilitative carrier for fructose has been established.The rates of absorption of varioussugars differ. At equal concentrations, galactose, glucose, fructose, mannose, xyloseand arabinose are absorbed in decreasing order of magnitude.
Fats
After digestion fats are present in the small intestine in the solubilised form of mixedmicelles. Efficient absorption requires a rapid movement of the highly hydrophobicmolecule through the unstirred water layer adjacent to the mucosa. This is the rate-limiting stage of absorption.The mixed bile salt micelles, with their hydrophilic groups,aid this process.Absorption across the brush border membrane of the intestinal cells isby passive diffusion and is at its maximum in the jejunum.The bile salts are absorbedby an active process in the distal ileum. Following absorption there is a resynthesis oftriacyglycerols, a process that requires energy, and they are formed into chylomicrons(minute fat droplets), which then pass into the lacteals of the villi, enter the thoracicduct and join the general circulation. Medium- and short-chain fatty acids, such asthose occurring in butterfat, require neither bile salts nor micelle formation as they canbe absorbed very rapidly from the lumen of the intestine directly into the portal blood-stream. The entry of these fatty acids is sodium-dependent and takes place against aconcentration gradient by active transport. In fowls, the lymphatic system is negligibleand most of the fat is transported in the portal blood as low-density lipoproteins.
Proteins
The products of protein digestion in the lumen of the intestine are free amino acidsand small (oligo-) peptides.The latter enter the epithelial cells of the small intestine
Digestion in monogastric mammals
169

Chapter 8 Digestion
170
where, in the main, they are hydrolysed by specific di- and tripeptidases. However,some small peptides are absorbed intact and subsequently appear in the portalblood.The amino acids, which subsequently pass into the portal blood and thence tothe liver, are absorbed from the small intestine by an active transport mechanism,which in most cases is sodium-dependent. In the case of glycine, proline and lysine,the sodium molecule is unnecessary. Several systems have been described for aminoacid transfer, and these can be classified into four main groups. One is concernedwith the transfer of neutral amino acids and separate carriers transfer dicarboxylicand basic amino acids. In addition, there is a fourth system for the movement of theimino acids and glycine. These mechanisms, however, are not completely rigid andsome amino acids can be transferred by more than one system.The rates of absorp-tion of the amino acids differ; for example, the rate is higher for methionine thanvaline, which in turn is higher than that for threonine.
Reference has already been made to the absorption of intact proteins, such asimmunoglobulins, in the newborn animal by pinocytosis.
Minerals
Absorption of mineral elements is either by simple diffusion or by carrier-mediatedtransport. The exact mechanisms for all minerals have not been established, but theabsorption of calcium, for example, is regulated by 1,25-dehydroxycholecalciferol(see p. 80). Low alimentary pH favours calcium absorption, but absorption is inhib-ited by a number of dietary factors such as the presence of oxalates and phytates.Anexcess of either calcium or phosphorus interferes with the absorption of the other.The absorption of calcium is also influenced by the requirements of the animal. Forexample, the absorption of calcium from the digestive tract of laying hens is muchgreater when shell formation is in progress than when the shell gland is inactive.
The absorption of iron is to a large extent independent of the dietary source.Theanimal has difficulty in excreting iron from the body in any quantity, and a methodexists for regulating iron absorption to prevent excessive amounts entering the body(see p. 122). In adults the absorption of the element is generally low, but after severebleeding and during pregnancy the requirement for iron is increased so that absorp-tion of the element is also increased.Anaemia due to iron deficiency may, however,develop on low-iron diets. Experiments carried out with dogs have shown that theabsorption of iron by anaemic animals may be 20 times as great as that by normalhealthy dogs.
Another example of the mechanism of mineral absorption is shown by zinc.Thismineral is absorbed through the small intestine by a carrier-mediated process, withuptake at the brush border membrane being the rate-limiting step. In rats and hu-mans, the carrier becomes saturated at levels of zinc below that normally seen in thediet, and zinc uptake from aqueous solutions above this saturation level is by passivediffusion. Calcium is believed to inhibit the absorption of zinc.
It is thought that iodine in organic combination is less well absorbed than the in-organic form. Plants contain a higher proportion of inorganic iodide than do foods ofanimal origin.
Vitamins
The fat-soluble vitamins A, D, E and K pass through the intestinal mucosa mainly bythe same passive diffusion mechanism as for fats.Within the cells they may combinewith proteins and enter the general circulation as lipoproteins.

Vitamin A is more readily absorbed from the digestive tract than its precursorcarotene, although it is thought that vitamin A esters must first be hydrolysed by anesterase to the alcohol form before being absorbed. Phytosterols are poorly absorbed,and it is generally considered that unless ergosterol has been irradiated to vitaminD2 before ingestion it cannot be absorbed from the tract in any quantity.
Water-soluble vitamins are believed to be absorbed both by simple diffusion andby carrier-mediated transport, which is sodium-dependent.Vitamin B6 is absorbed bypassive diffusion, mainly in the small intestine, and the amount absorbed is relatedlinearly to the amount in the digesta.The importance of a carrier glycoprotein (intrin-sic factor) for the absorption of vitamin B12 has already been stressed (see p. 98).
Detoxification in the alimentary tract
Many food constituents are potentially toxic to the animal consuming them. Micro-bial contaminants are an obvious example; the digestive enzymes kill many bacteria,but some organisms may damage the gut, which allows them or the toxins they pro-duce to invade the animal’s tissues. Foreign proteins, especially those with endocrineactivity, could harm the animal if absorbed, but the gut provides an effective barrierto prevent their absorption before they are hydrolysed. The same is true of nucleicacids (whose breakdown is a matter of concern, as some animal foods may now bederived from genetically modified plants). Some of the toxic constituents of pastureplants are broken down in the rumen of cattle, sheep and goats (see p. 494).As men-tioned above, the animal body avoids excessive intake of the mineral elements cal-cium and iron by selective absorption.
Some larger molecules are able to bypass the barrier presented by the gut. Thismay be desirable in some instances (e.g. absorption of protein antibodies in the new-born animal and absorption of antibiotics administered orally), but undesirable inothers (e.g. apparent absorption of the proteins known as prions, which are responsi-ble for bovine spongiform encephalopathy; see p. 579).
Microbial digestion in ruminants and other herbivores
171
8.2 MICROBIAL DIGESTION IN RUMINANTS AND OTHER HERBIVORES
The foods of ruminants, forages and fibrous roughages, consist mainly of �-linkedpolysaccharides such as cellulose, which cannot be broken down by mammalian di-gestive enzymes. Ruminants have therefore evolved a special system of digestionthat involves microbial fermentation of food before its exposure to their own diges-tive enzymes. This part of the chapter describes the anatomical and physiologicaladaptations of the ruminant that facilitate microbial digestion, and outlines thebiochemistry of this form of digestion and its nutritional consequences. Herbivoresother than ruminants, such as the horse, have adopted systems of microbial digestionthat differ from those of ruminants, and these will be briefly described.
Anatomy and physiology of ruminant digestion
The stomach of the ruminant is divided into four compartments (Fig. 8.5). In theyoung suckling, the first two compartments, the rumen and its continuation the retic-ulum, are relatively undeveloped, and milk, on reaching the stomach, is channelled

Chapter 8 Digestion
172
Rumen
Small intestine
Rumen Abomasum
Reticulum
Omasum
Oesophagus
Fig. 8.5 Diagrammatic representation of the rumen, reticulum, omasum andabomasum of the ruminant, indicating the flow of digesta.
Source: After Annison E F and Lewis D 1959 Metabolism in the Rumen, London, Methuen and Co.
by a tube-like fold of tissue, known as the oesophageal or reticular groove, directlyto the third and fourth compartments, the omasum and abomasum. As the calf orlamb begins to eat solid food, the first two compartments (often considered togetheras the reticulo-rumen) enlarge greatly, until in the adult they comprise 85 per cent ofthe total capacity of the stomach. The consumption of fibrous foods, such as strawand hay, stimulates the enlargement of the reticulum. The fermentation of food bymicrobes in the rumen produces volatile fatty acids (see p. 176) and these, particu-larly butyric acid from the fermentation of concentrates such as cereals, encouragethe formation of papillae on the rumen wall. Papillae are small finger-like projectionsthat increase the surface area for the absorption of nutrients.Thus, a combination offibrous and starchy foods encourages the development of the rumen and assists theweaning process. In the adult, the oesophageal groove does not function under nor-mal feeding conditions, and both food and water pass into the reticulo-rumen. How-ever, the reflex closure of the groove to form a channel can be stimulated even inadults, particularly if they are allowed to drink from a teat.
Ruminant teeth and chewing actions are adapted for the efficient comminution offibrous foods.The cheek teeth are large and form an extensive grinding surface withmany ridges, which are resistant to wear. The distance between the right and leftteeth in the lower jaw is less than that in the upper jaw, so that when the jaws areclosed centrally only a narrow strip of the lower and upper teeth are in contact. Dur-ing chewing, the ruminant employs lateral jaw movements, which involve the teethon only one side at a time. Powerful muscles move the jaw in three phases – first thejaw is dropped, second it is moved laterally to one side on which chewing will occur,and finally it is vigorously carried up and inwards, engaging the teeth in a grindingfashion. The food is diluted with copious amounts of saliva, first during eating andagain during rumination: typical quantities of saliva produced per day are 150 l incattle and 10 l in sheep. Rumen contents contain 850–930 g water/kg on average, butthey often exist in two phases: a lower liquid phase, in which the finer food particlesare suspended, and a drier upper layer of coarser solid material. The breakdown of

food is accomplished partly by physical and partly by chemical means.The contentsof the rumen are continually mixed by the rhythmic contractions of its walls, andduring rumination material at the anterior end is drawn back into the oesophagusand returned by a wave of contraction to the mouth.Any liquid is rapidly swallowedagain, but coarser material is thoroughly chewed before being returned to therumen.The major factor inducing the animal to ruminate is probably the tactile stim-ulation of the epithelium of the anterior rumen; some diets, notably those containinglittle or no coarse roughage, may fail to provide sufficient stimulation for rumination.The time spent by the animal in rumination depends on the fibre content of the food.In grazing cattle it is commonly about 8 hours per day, or about equal to the timespent in grazing. Each bolus of food regurgitated is chewed 40–50 times and thus re-ceives a much more thorough mastication than during eating.
The reticulo-rumen provides a continuous culture system for anaerobic bacteria,protozoa and fungi. Food and water enter the rumen and the food is partially fer-mented to yield principally volatile fatty acids, microbial cells and the gasesmethane and carbon dioxide. The gases are lost by eructation (belching) and thevolatile fatty acids are mainly absorbed through the rumen wall.The microbial cells,together with undegraded food components, pass to the abomasum and small intes-tine; there they are digested by enzymes secreted by the host animal, and the prod-ucts of digestion are absorbed. In the large intestine there is a second phase ofmicrobial digestion. The volatile fatty acids produced in the large intestine areabsorbed, but microbial cells are excreted – with undigested food components – inthe faeces.
Like other continuous culture systems, the rumen requires a number of homeosta-tic mechanisms. The acids produced by fermentation are theoretically capable of re-ducing the pH of rumen liquor to 2.5–3.0, but under normal conditions the pH ismaintained at 5.5–6.5. Phosphate and bicarbonate contained in the saliva act asbuffers; in addition, the rapid absorption of the acids (and also of ammonia; see below)helps to stabilise the pH.The osmotic pressure of rumen contents is kept near that ofblood by the flux of ions between them. Oxygen entering with the food is quickly usedup and anaerobiosis is maintained. In the absence of oxygen, carbon is the ultimate ac-ceptor of hydrogen ions, hence the formation of methane.The temperature of rumenliquor remains close to that of the animal (38–42 °C). Finally, the undigested compo-nents of the food, together with soluble nutrients and bacteria, are eventually removedfrom the rumen by the passage of digesta through the reticulo-omasal orifice.
Rumen microorganisms
The bacteria number 109–1010 per millilitre of rumen contents. Over 200 specieshave been identified, and for descriptions of them the reader is referred to the workslisted at the end of this chapter. Most of these bacteria are non-spore-forming anaer-obes. Table 8.3 lists a number of the more important species and indicates the sub-strate they utilise and the products of the fermentation.This information is based onstudies of isolated species in vitro and is not completely applicable in vivo. For ex-ample, it appears from Table 8.3 that succinic acid is an important end product, but inpractice this is converted into propionic acid by other bacteria such as Selenomonasruminantium (see Fig. 8.6); such interactions between microorganisms are an impor-tant feature of rumen fermentation. A further point is that the activities of a givenspecies of bacteria may vary from one strain of that species to another. The total
Microbial digestion in ruminants and other herbivores
173

Chapter 8 Digestion
174
Table 8.3 Typical rumen bacteria, their energy sources and fermentation products in vitro
Species Description Typicalenergysources
Alternativeenergysources
Fibrobacter succinogenes
Gram-negative rods
Cellulose � � � Glucose (starch)
Ruminococcus flavefaciens
Catalase-negativestreptococci withyellow colonies
Cellulose � � � � Xylan
Ruminococcus albus
Single or paired cocci
Cellobiose � � Xylan
Streptococcus bovis
Gram-positive,short chains of cocci, capsulated
Starch � Glucose
Prevotella ruminicola
Gram-negative,oval or rod
Glucose � � � Xylan,starch
Megasphaera elsdenii
Large cocci,paired or in chains
Lactate � � � Glucose,glycerol
Lachnospira multipara
Gram-positive curved rods
Pectins � � Glucose,fructose
number of bacteria and the relative population of individual species vary with theanimal’s diet; for example, diets rich in concentrate foods promote high total countsand encourage the proliferation of lactobacilli.
Protozoa are present in much smaller numbers (106/ml) than bacteria but, beinglarger, may equal the latter in total mass. Over 100 species have been identified inthe rumen. In adult animals, most of the protozoa are ciliates belonging to two fam-ilies.The Isotrichidae, commonly called the holotrichs, are ovoid organisms coveredwith cilia; they include the genera Isotricha and Dasytricha. The Ophryoscolecidae,or oligotrichs, include many species that vary considerably in size, shape andappearance; they include the genera Entodinium, Diplodinium, Epidinium andOphryoscolex. The oligotrichs can ingest food particles and cannot utilise cellulose.A normal rumen flora (bacteria) and fauna (protozoa) is established quite early inlife, as early as 6 weeks of age in calves.
The fungi of the rumen have been studied for less than the other microorganisms,and their place in the rumen ecosystem has yet to be fully characterised. They arestrictly anaerobic, and their lifecycle includes a motile phase (as a zoospore) and avegetative phase (sporangium). During the latter phase they become attached tofood particles by rhizoids, which can penetrate cell walls. At least 12 species orstrains have been identified, typically those belonging to the genus Neocallimastix.The rumen fungi are capable of utilising most polysaccharides and many soluble sug-ars; some carbohydrates not used by these fungi are pectin, polygalacturonic acid,arabinose, fucose, mannose and galactose.The contribution of the rumen fungi to thefermentation of food has not yet been quantified, but it is known that they are mostnumerous (constituting 10 per cent of the microbial biomass) when diets are rich infibre (i.e. not cereal diets or young pasture herbage).
Typical fermentation products (excluding gases)
Acetic Propionic Butyric Lactic Succinic Formic

The rumen microorganisms can be envisaged as operating together, as so-calledconsortia, to attack and break down foods. Some, like the fungi, are capable of in-vading and colonising plant tissues; others follow up to ferment the spoils of the in-vasion. Detailed studies, including some involving electron micrography, have shownthat 75 per cent of rumen bacteria are attached to food particles.
As the microbial mass synthesised in the rumen provides about 20 per cent of thenutrients absorbed by the host animal, the composition of microorganisms is impor-tant.The bacterial dry matter contains about 100 g nitrogen/kg, but only 80 per centof this is in the form of amino acids, the remaining 20 per cent being present asnucleic acid nitrogen. Moreover, some of the amino acids are contained in the pepti-doglycan of the cell wall membrane and are not digested by the host animal.
Digestion of carbohydrates
The diet of the ruminant contains considerable quantities of cellulose, hemicellu-loses, starch and water-soluble carbohydrates that are mainly in the form of fructans.Thus, in young pasture herbage, which is frequently the sole food of the ruminant,each kilogram of dry matter may contain about 400 g cellulose and hemicelluloses,and 200 g of water-soluble carbohydrates. In mature herbage, and in hay and straw,the proportion of cellulose and hemicelluloses is much higher, and that of water-soluble carbohydrates is much lower.The �-linked carbohydrates are associated withlignin, which may comprise 20–120 g/kg DM. All the carbohydrates, but not lignin,are attacked by the rumen microorganisms; the principal bacterial species involved(see Table 8.3) are Fibrobacter succinogenes and the Ruminococci, and the fungi arealso thought to play an important role.
The breakdown of carbohydrates in the rumen may be divided into two stages,the first of which is the digestion of complex carbohydrates to simple sugars.This isbrought about by extracellular microbial enzymes and is thus analogous to the diges-tion of carbohydrates in non-ruminants. Cellulose is decomposed by one or more �-1,4-glucosidases to cellobiose, which is then converted either to glucose or, throughthe action of a phosphorylase, to glucose-1-phosphate. Starch and dextrins are firstconverted by amylases to maltose and isomaltose and then by maltases, maltosephosphorylases or 1,6-glucosidases to glucose or glucose-1-phosphate. Fructans arehydrolysed by enzymes attacking 2,1 and 2,6 linkages to give fructose, which mayalso be produced – together with glucose – by the digestion of sucrose (see Fig. 8.6).
Pentoses are the major product of hemicellulose breakdown, which is broughtabout by enzymes attacking the �-1,4 linkages to give xylose and uronic acids. Thelatter are then converted to xylose. Uronic acids are also produced from pectins,which are first hydrolysed to pectic acid and methanol by pectinesterase.The pecticacid is then attacked by polygalacturonidases to give galacturonic acids, which inturn yield xylose. Xylose may also be produced from hydrolysis of the xylans, whichmay form a significant part of the dry matter of grasses.
The simple sugars produced in the first stage of carbohydrate digestion in therumen are rarely detectable in the rumen liquor because they are immediately takenup and metabolised intracellularly by the microorganisms. For this second stage, thepathways involved are in many respects similar to those involved in the metabolismof carbohydrates by the animal itself, and are thus discussed in Chapter 10. How-ever, the main pathways are outlined in Fig. 8.7. The key intermediate (i.e. linkingthe pathways of Fig. 8.6 with those of Fig. 8.7) is pyruvate, and Fig. 8.7 shows the
Microbial digestion in ruminants and other herbivores
175

Chapter 8 Digestion
176
Cellulose
Cellobiose
Glucose-1-phosphate
Pectins Uronic acids
Hemicelluloses
Pentosans
Glucose-6-phosphate
Fructose-6-phosphate
Fructose-1,6-phosphate
Pyruvate
Starch
Maltose Isomaltose
Glucose
Sucrose
Fructose FructansPentoses
Fig. 8.6 Conversion of carbohydrates to pyruvate in the rumen.
pathways that link pyruvate with the major end products of rumen carbohydrate di-gestion, which are acetic, propionic and butyric acids, carbon dioxide and methane.Additional fatty acids are also formed in the rumen, generally in small quantities, bydeamination of amino acids; these are isobutyric acid from valine, valeric acid fromproline, 2-methyl butyric acid from isoleucine and 3-methyl butyric acid fromleucine. Figure 8.7 shows that propionate can be produced from pyruvate by severalalternative pathways.The pathway through lactate and acrylate predominates whenthe ruminant’s diet includes a high proportion of concentrates, and pathwaysthrough succinate are employed when the diet consists mainly of fibrous roughages.With concentrate diets, lactate produced by the first pathway may accumulate in therumen and threaten the animal with acidosis.
β-Hydroxybutyryl-CoA
Malonyl-
CoA
Formate
Methane
CO2 H2
Acetyl phosphate
Acetate
Acetyl Coenzyme A
Acetoacetyl-CoA
Crotonyl-CoA
Butyryl-CoA
Butyrate
Lactate
Lactyl-CoA
Acrylyl-CoA
Propionyl-CoA
Propionate
Oxalacetate
Malate
Fumarate
Succinate
Methylmalonyl-CoA
Succinyl-CoA
Pyruvate
Fig. 8.7 Conversion of pyruvate to volatile fatty acids in the rumen.

Table 8.4 Volatile fatty acids (VFAs) in the rumen liquor of cattle or sheep fed onvarious diets
Animal Diet Total VFA Individual VFA (molar proportions)
(mmoles/l) Acetic Propionic Butyric Others
Sheep Young ryegrass herbage
107 0.60 0.24 0.12 0.04
Cattle Mature ryegrass herbage
137 0.64 0.22 0.11 0.03
Cattle Grass silage 108 0.74 0.17 0.07 0.03Sheep Chopped lucerne hay 113 0.63 0.23 0.10 0.04
Ground lucerne hay 105 0.65 0.19 0.11 0.05Cattle Long hay (0.4),
concentrates (0.6)96 0.61 0.18 0.13 0.08
Pelleted hay (0.4),concentrates (0.6)
140 0.50 0.30 0.11 0.09
Sheep Hay : concentrate1 : 0 97 0.66 0.22 0.09 0.030.8 : 0.2 80 0.61 0.25 0.11 0.030.6 : 0.4 87 0.61 0.23 0.13 0.020.4 : 0.6 76 0.52 0.34 0.12 0.030.2 : 0.8 70 0.40 0.40 0.15 0.05
Cattle Barley (no ciliate protozoa in rumen)
146 0.48 0.28 0.14 0.10
Cattle Barley (ciliates present in rumen)
105 0.62 0.14 0.18 0.06
The overall equation for the rumen fermentation of hexoses is:
Microbial digestion in ruminants and other herbivores
177
Thus the molar proportions of the three volatile fatty acids (VFAs) derived fromhexose are acetate 0.65, propionate 0.21 and butyrate 0.14. Some examples of theactual concentrations and proportions of VFA in the rumen are given in Table 8.4.They differ from the proportions given above because carbohydrates other thanhexoses (and also amino acids) are fermented in the rumen.The relative concentra-tions of VFAs are often assumed to represent their relative rates of production(which are more difficult to measure; see Box 8.2), but this may be misleading ifindividual VFAs are absorbed at different rates. Their total concentration varieswidely according to the animal’s diet and the time that has elapsed since the previ-ous meal, but it is normally in the range of 70–150 mmol/l (equivalent to approxi-mately 5–10 g/l). The relative proportions of the acids also vary. Mature fibrousforages give rise to VFA mixtures containing a high proportion (about 70 per cent)of acetic acid. Less mature forages tend to give a rather lower proportion of aceticand a higher proportion of propionic acid.The addition of concentrates to a forage
57 Hexose 114 pyruvate 21 propionate + 20 CO2 + 73 CH4
65 acetate
14 butyrate

Chapter 8 Digestion
178
BOX 8.2 Measurement of volatile fatty acid (VFA) production
The production rate of VFAs in the rumen can be measured by infusion of isotopically labelledforms of the acids into the rumen via a cannula and by recording their dilution by newly formedVFA. If only one VFA is infused, production of the others can be estimated from their relative pro-portions in rumen liquor. However, infusion of all three major acids provides more reliable esti-mates because it allows for differences between them in rates of production and/or absorption.
also increases the proportion of propionic at the expense of acetic, this effect beingparticularly strong with diets containing a high proportion (0.6) of concentrates.With all-concentrate diets, the proportion of propionic may even exceed that ofacetic. However, even with this type of diet, acetic acid predominates if the rumenciliate protozoa survive. Grinding and pelleting of forage has little effect on theVFA proportions when the diet consists of forage alone, but it causes a switch fromacetic to propionic acid if the diet also contains concentrates.Table 8.4 also showsthat the proportion of butyric acid is less affected by diet than are the shorter-chain acids.
The total weight of acids produced may be as high as 4 kg per day in cows. Muchof the acid produced is absorbed directly from the rumen, reticulum and omasum, al-though 10–20 per cent may pass through the abomasum and be absorbed in thesmall intestine. In addition, some of the products of carbohydrate digestion in therumen are used by the microorganisms to form their own cellular polysaccharides,but the amounts of these passing to the small intestine are probably small and hardlysignificant.
The rate of gas production in the rumen is most rapid immediately after a meal andin the cow may exceed 30 l/hour.The typical composition of rumen gas is 40 per centcarbon dioxide, 30–40 per cent methane; 5 per cent hydrogen, and small and vary-ing proportions of oxygen and nitrogen (from ingested air). Carbon dioxide is pro-duced partly as a by-product of fermentation and partly by the reaction of organicacids with the bicarbonate present in the saliva. The basic reaction by whichmethane is formed is the reduction of carbon dioxide by hydrogen, some of whichmay be derived from formate. Methanogenesis, however, is a complicated processthat involves folic acid and vitamin B12.About 4.5 g of methane is formed for every100 g of carbohydrate digested, and the ruminant loses about 7 per cent of its foodenergy as methane (see Chapter 11).
Most of the gas produced is lost by eructation; if gas accumulates it causes thecondition known as bloat, in which the distension of the rumen may be so great as toresult in the collapse and death of the animal. Bloat occurs most commonly in dairycows grazing on young, clover-rich herbage and is due not so much to excessive gasproduction as to the failure of the animal to eructate. Frequently the gas is trapped inthe rumen in a foam, whose formation may be promoted by substances present inthe clover. It is also possible that the reflex controlling eructation is inhibited by aphysiologically active substance that is present in the food or formed during fermen-tation. Bloat is a particularly serious problem on the clover-rich pastures of NewZealand, where it is prevented by dosing the cows or spraying the pasture withantifoaming agents, such as vegetable oils.Another form of bloat, termed ‘feedlot bloat’,

occurs in cattle fattened intensively on diets containing much concentrate and littleroughage. Bloat-preventing agents are discussed in Chapter 24.
The extent to which cellulose is digested in the rumen depends particularly on thedegree of lignification of the plant material. Lignin, and also the related substancecutin, is resistant to attack by anaerobic bacteria, probably because of its low oxygencontent and its condensed structure (which inhibits hydrolysis). Lignin appears tohinder the breakdown of the cellulose with which it is associated. Thus, in youngpasture grass containing only 50 g lignin/kg DM, 80 per cent of the cellulose may bedigested, but in older herbage with 100 g lignin/kg, the proportion of cellulose digestedmay be less than 60 per cent. Ruminant diets based on cereals may contain as muchas 500 g/kg of starch (and sugars), of which over 90 per cent may be fermented inthe rumen and the rest digested in the small intestine.This fermentation is rapid, andthe resulting fall in the pH of rumen liquor inhibits cellulose-fermenting organismsand thus depresses the breakdown of cellulose.
The breakdown of cellulose and other resistant polysaccharides is undoubtedlythe most important digestive process taking place in the rumen. Besides contributingto the energy supply of the ruminant, it ensures that other nutrients that might escapedigestion are exposed to enzyme action. Although the main factor in the process isthe presence of microorganisms in the rumen, there are other factors of importance.The great size of the rumen (its contents normally contribute 10–20 per cent of theliveweight of ruminants) allows food to accumulate and ensures that sufficienttime is available for the rather slow breakdown of cellulose. In addition, the move-ments of the reticulo-rumen and the act of rumination play a part by breaking up thefood and exposing it to attack by microorganisms.
Digestion of protein
The digestion of protein in the rumen is illustrated in Fig. 8.8. Food proteins arehydrolysed to peptides and amino acids by rumen microorganisms, but some aminoacids are degraded further, to organic acids, ammonia and carbon dioxide.An exam-ple of the deamination of amino acids is provided by valine, which, as mentionedabove, is converted to isobutyric acid. Thus, the branched-chain acids found inrumen liquor are derived from amino acids. The main proteolytic organisms arePrevotella ruminicola, Peptostreptococci species and the protozoa. The ammoniaproduced, together with some small peptides and free amino acids, is utilised by therumen organisms to synthesise microbial proteins. Some of the microbial protein isbroken down in the rumen and its nitrogen is recycled (i.e. taken up by microorgan-isms).When the organisms are carried through to the abomasum and small intestine,their cell proteins are digested and absorbed.An important feature of the formationof microbial protein is that bacteria are capable of synthesising indispensable as wellas dispensable amino acids, thus rendering their host independent of dietary suppliesof the former.
The extent to which dietary protein is degraded to ammonia in the rumen, andconversely the extent to which it escapes rumen degradation and is subsequentlydigested in the small intestine, is discussed in Chapters 10 and 13.At this point it issufficient to emphasise that with most diets, the greater part (and sometimes all)of the protein reaching the ruminant’s small intestine will be microbial protein ofreasonably constant composition. The lesser part will be undegraded food protein,which will vary in amino acid composition according to the nature of the diet.
Microbial digestion in ruminants and other herbivores
179

Chapter 8 Digestion
180
Degradable protein
Food
Protein Non-protein N
Undegradable protein Non-protein N
Peptides
Amino acids
Microbial protein
Ammonia
Salivaryglands
UreaNH3
Kidney
Digestedin
small intestineExcreted in
urine
RumenLiver
Fig. 8.8 Digestion and metabolism of nitrogenous compounds in the rumen.
The ammonia in rumen liquor is the key intermediate in microbial degradationand synthesis of protein. If the diet is deficient in protein, or if the protein resistsdegradation, then the concentration of rumen ammonia will be low (about 50 mg/l)and the growth of rumen organisms will be slow; in consequence, the breakdownof carbohydrates will be retarded. On the other hand, if protein degradationproceeds more rapidly than synthesis, then ammonia will accumulate in rumenliquor and the optimum concentration will be exceeded. When this happens, am-monia is absorbed into the blood, carried to the liver and converted to urea (seeFig. 8.8). Some of this urea may be returned to the rumen via the saliva and alsodirectly through the rumen wall, but the greater part is excreted in the urine andthus wasted.
Estimates of the optimum concentration of ammonia in rumen liquor vary widely,from 85 mg/l to over 300 mg/l. Rather than expressing the optimum as the concen-tration in rumen liquor, it would probably be more realistic to relate ammonia to fer-mentable organic matter, since it is known that for each kilogram of organic matter

fermented, an approximately constant quantity of nitrogen is taken up by rumenbacteria as protein and nucleic acid (see below).
If the food is poorly supplied with protein and the concentration of ammonia inrumen liquor is low, the quantity of nitrogen returned to the rumen as urea from theblood (see Fig. 8.8) may exceed that absorbed from the rumen as ammonia.This netgain in ‘recycled’ nitrogen is converted to microbial protein, which means that thequantity of protein reaching the intestine may be greater than that in the food. Inthis way the ruminant is able to conserve nitrogen by returning to the rumen ureathat would otherwise be excreted in urine.
Although digestion is primarily the breakdown of complex molecules into sim-pler substances, a key feature of the digestive processes in ruminants is the produc-tion of microbial cells and hence the synthesis of microbial protein. If this synthesisis for any reason inefficient, food protein will be wasted and the host animal willsubsequently be presented with a mixture of digestible nutrients that is unbalancedwith respect to protein. In practice the rumen microorganisms synthesise protein inproportion to the quantities of nutrients that they ferment. With most feeds eachkilogram of organic matter digested in the rumen yields approximately 200 g ofmicrobial protein. Some rapidly fermented foods, such as immature forages rich insoluble carbohydrates, yield more microbial protein (up to 260 g/kg organic matterdigested). Conversely, foods that contain relatively high proportions of digestiblenutrients that are not fermented in the rumen give a lower yield of microbial protein(about 130 g/kg organic matter digested). Foods rich in fats are in this category butgenerally are not given to ruminants. Silages, however, contain nutrients that havealready been fermented or partly fermented; one of the major products of silagefermentation is lactic acid (see Chapter 19), and although this may be furthermetabolised in the rumen, the yield of rumen microbial protein per unit of organicmatter digested is lower with silages than with other foods.
The rumen microbes thus have a ‘levelling’ effect on the protein supply of theruminant; they supplement, in both quantity and quality, the protein of such foods aslow-quality roughages but have a deleterious effect on protein-rich concentrates. It ispossible to take additional advantage of the synthesising abilities of the rumen bacteriaby adding urea to the diet of ruminants (see below). A more recent development,discussed on p. 186, is the protection of good-quality proteins from degradation in therumen.
Utilisation of non-protein nitrogen compounds by the ruminant
Dietary protein is not the only contributor to the ammonia pool in the rumen. Asmuch as 30 per cent of the nitrogen in ruminant foods may be in the form of simpleorganic compounds such as amino acids, amides and amines (see Chapter 4) or of in-organic compounds such as nitrates. Most of these are readily degraded in therumen, their nitrogen entering the ammonia pool. In practice it is possible to capi-talise on the ability of rumen microorganisms to convert non-protein nitrogenouscompounds to protein, by adding such compounds to the diet. The substance mostcommonly employed is urea, but various derivatives of urea, and even ammoniumsalts, may also be used.
Urea entering the rumen is rapidly hydrolysed to ammonia by bacterial urease,and the rumen ammonia concentration is therefore liable to rise considerably. Forthis ammonia to be efficiently incorporated in microbial protein, two conditions
Microbial digestion in ruminants and other herbivores
181

Chapter 8 Digestion
182
must be met. First, the initial ammonia concentration must be below the optimum(otherwise the ammonia ‘peak’ produced will simply be absorbed and lost from theanimal as described above); second, the microorganisms must have a readily avail-able source of energy for protein synthesis. Feeding practices intended to meet theseconditions include mixing urea with other foods (to prolong the period over which itis ingested and deaminated). Such foods should be low in rumen-degradable proteinand high in readily fermentable carbohydrate.
It is important to avoid accidental overconsumption of urea, since the subsequentrapid absorption of ammonia from the rumen can overtax the ability of the liver toreconvert it to urea, hence causing the ammonia concentration of peripheral bloodto reach toxic levels.
Derivatives of urea have been used for animal feeding with the intention of retard-ing the release of ammonia. Biuret is less rapidly hydrolysed than urea but requires aperiod of several weeks for rumen microorganisms to adapt to it. However, neitherbiuret nor isobutylidene diurea (IBDU) nor urea–starch compounds have consistentlyproved superior to urea itself.
An additional non-protein nitrogenous compound that can be utilised by rumenbacteria, and hence by the ruminant, is uric acid. This is present in high concentra-tion in poultry excreta, and these are sometimes dried for inclusion in diets forruminants, although in some countries the use of excreta as a food is restricted orprohibited.
The practical significance of these non-protein nitrogenous substances as poten-tial protein sources is discussed in Chapter 23.
Digestion of lipids
The triacylglycerols present in the foods consumed by ruminants contain a high pro-portion of residues of the C18 polyunsaturated acids, linoleic and linolenic.These tri-acylglycerols are to a large extent hydrolysed in the rumen by bacterial lipases, asare phospholipids. Once they are released from ester combination, the unsaturatedfatty acids are hydrogenated by bacteria, yielding first a monoenoic acid and, ulti-mately, stearic acid. Both linoleic and linolenic acid have all-cis double bonds, butbefore they are hydrogenated one double bond in each is converted to the trans con-figuration; thus, trans acids can be detected in rumen contents.The rumen microor-ganisms also synthesise considerable quantities of lipids, which contain someunusual fatty acids (such as those containing branched chains); these acids are even-tually incorporated in the milk and body fats of ruminants.
The capacity of rumen microorganisms to digest lipids is strictly limited. Thelipid content of ruminant diets is normally low (i.e. �50 g/kg), and if it isincreased above 100 g/kg the activities of the rumen microbes are reduced. Thefermentation of fibre is retarded and food intake falls. Saturated fatty acids affectrumen fermentation less than do unsaturated fatty acids. Calcium salts of fattyacids have little effect on rumen fermentation and are used as fat supplements forruminants.
Unlike their short-chain counterparts, long-chain fatty acids are not absorbeddirectly from the rumen.When they reach the small intestine they are mainly saturatedand unesterified, but some – in the bacterial lipids – are esterified. Monoacylglycerols,which play an important role in the formation of mixed micelles in non-ruminants, arereplaced in ruminants by lysophosphatidyl choline.

As mentioned earlier (see p. 36), it is possible in non-ruminants to vary the fattyacid composition of body fats by altering the composition of dietary fats. In rumi-nants, this is normally not the case, and the predominating fatty acid of ruminantdepot fats is the stearic acid resulting from hydrogenation in the rumen. However, itis possible to treat dietary lipids in such a way that they are protected from attack inthe rumen but remain susceptible to enzymic hydrolysis and absorption in the smallintestine. If such lipids contain unsaturated acids, they will modify the compositionof body (and milk) fats (see Chapter 25).
Synthesis of vitamins
The synthesis by rumen microorganisms of all members of the vitamin B complexand of vitamin K has already been mentioned (see Chapter 5). In ruminants receiv-ing foods well supplied with B vitamins, the amounts synthesised are relativelysmall, but they increase if the vitamin intake in the diet decreases. The adult rumi-nant is therefore independent of a dietary source of these vitamins, but it should beremembered that adequate synthesis of vitamin B12 will take place only if there issufficient cobalt in the diet.
Dynamics of digestion in the ruminant
Food enters the rumen in the form of particles of various shapes and sizes, which areat first suspended in the liquid phase. The soluble constituents of these particles(such as sugars) are quickly dissolved and can thus be rapidly degraded by the rumenmicrobes. The insoluble constituents are colonised by microbes and slowly brokendown. In addition to these two fractions, a third component will consist of cell wallsso heavily encrusted with lignin or silica as to be undegradable in the rumen. Thedynamics of the rumen must be such that potentially degradable material is retainedlong enough to be digested, and that the products of digestion (together withundegradable material) are passed out of the stomach, either by transit to the lowergut or by absorption through the rumen wall.The partition required is aided by someof the physical characteristics of the rumen contents.The liquid phase of rumen con-tents may be envisaged as a tank of fixed volume, so that liquid or food entering itcauses a corresponding volume to flow out through the reticulo-omasal orifice.Thisliquid carries with it some of the soluble constituents of the food, some bacteria, thevolatile fatty acids that have not been absorbed through the rumen wall, and alsosome fine particles of food.
Food particles that are large, irregular in shape (e.g. long and thin plant frag-ments) and of low specific gravity tend to move to the top of the rumen (in somecases, floating on the liquid phase) and are retained; this is desirable, as large parti-cles will not have been subjected to mechanical and microbial breakdown. Whenthese particles are reduced to smaller and denser fragments, they descend in therumen liquor and can be washed out, as described above.
A critical size for particles passing out of the rumen of sheep has been estimatedby sieving digesta as about 1 mm (i.e. particles held on a sieve with holes of 1 mmare regarded as being too large to leave the rumen). For cattle, the critical size is con-sidered likely to be 3–4 mm. However, the passage of particles from the rumen is toocomplicated to be explained solely in terms of sieve dimensions.The reticulo-omasalorifice is not a sieve and is large enough to allow the passage of particles much
Microbial digestion in ruminants and other herbivores
183

Chapter 8 Digestion
184
BOX 8.3 Measures of rumen dynamics
The movement of digesta from the rumen can be expressed either as a rate of passage or as itsreciprocal, a retention time. The rate of passage of liquids is also known as the dilution rate. Thesecan be measured by the use of marker substances, which are either natural constituents of foods orindigestible additives (see p. 240). An example of the latter is the soluble but unabsorbable high-molecular-weight polymer polyethylene glycol. If a dose of this marker is injected into the rumenand allowed to mix uniformly, the subsequent decline in its concentration over time can be used tocalculate the fractional rate of passage of liquid from the rumen.Typically this might be in the range0.05–0.20 per hour, indicating that 5–20 per cent of the rumen liquor flows out of the organ eachhour. The passage of particulate matter from the rumen can be followed by marking or labellingsome of the food with the rare earth element ytterbium and then taking sequential samples of duo-denal digesta. An older method employed dyes to mark food particles, which allowed undigestedparticles in digesta or faeces to be identified and counted under a microscope. Typical rates ofpassage of particulate matter are 0.012–0.030 per hour, and typical retention times are30–80 hours. Studies of rumen dynamics have led to the development of complex mathematicalmodels (see Further reading at the end of this chapter).
greater in diameter than 1 mm.What seems to happen is that the mass of food parti-cles itself acts as a sieve, by what is termed a filter-bed effect, with large particlestrapping smaller ones.
The rate of passage of liquids through the rumen is faster with roughage dietsthan with those containing concentrates such as cereal grains, because greater rumi-nation of roughages adds more saliva to the digesta.Adding salts to the diet increaseswater intake and thus increases fluid flow through the rumen. An increased rate ofpassage of liquid may ‘wash out’ bacteria, thus reducing cellulolysis and increasingthe proportion of propionate in the mixture of volatile fatty acids produced. Moregenerally, anything that increases the rate of passage of digesta from the rumen isliable to reduce the extent of digestion in that organ; for the fibre constituents offoods, this is likely to be disadvantageous, but it may be an advantage with con-stituents such as protein and starch, which can be more efficiently digested in thelower gut (see below).As food intake rises, the ruminant responds by increasing thequantity held in the rumen (rumen ‘fill’) and/or the rate of passage, but eventuallylimits are reached that impose a restriction on intake. The feeding of ruminants forgreater productivity often depends on the raising of these limits, for example by re-placing slowly digested forages with rapidly digested concentrates, or by grindingforages to produce smaller, faster-moving particles.
Control and modification of rumen fermentation
As investigations have revealed the mechanisms of rumen digestion, attempts havebeen made to alter the patterns of digestion in ways that should improve the nutri-tion of ruminants. The primary approach has been to modify the microbial popula-tion in order to suppress undesirable processes (e.g. methane production; see Section8.4 and Chapter 11) or stimulate desirable processes (e.g. microbial protein synthe-sis).A secondary approach has been to protect nutrients from rumen fermentation inorder that they should be digested in the small intestine. Changing the bacterial

population through the introduction of specific organisms has generally proved diffi-cult to achieve, or if achieved has failed to yield nutritional benefits. Changing anexisting population by adding antibiotics to feeds has proved more effective,although the use of many antibiotics has been prohibited because of their value fortreating diseases in animals and humans, and the possibility that their wider applica-tion would lead to the evolution of resistant strains of disease-causing organisms.The antibiotics used today are mostly of the ionophore type, examples being mon-ensin and salinomycin.These are active against Gram-negative bacteria; by stimulat-ing the production of propionate and reducing the production of acetate andbutyrate, they improve the efficiency of utilisation of feed by growing ruminants.An-other recent development has been the use of substances known as probiotics, suchas live yeast cultures, to stimulate bacterial activity in the rumen. In some circum-stances these can stabilise rumen pH, increase propionate and reduce acetate pro-duction, and reduce methane and ammonia production. The use of antibiotics andprobiotics as additives to the diet is discussed in Chapter 24.
The advent of genetic engineering has raised hopes of providing, for example,bacteria with improved cellulolytic capabilities, or organisms able to manufacturespecific nutrients, such as the sulphur-containing amino acids needed for woolgrowth (see Chapter 14). Establishing such modified organisms in the rumen ecosys-tem is still a problem, although one successful application of this technology hasbeen to modify bacteria to produce the enzyme fluoracetate dehalogenase, whichthen protects ruminants against fluoracetate poisoning.
The rumen protozoal population has proved to be more susceptible to modifica-tion than the bacterial population, principally because protozoa can be totally elim-inated from the rumen. Ruminants reared from birth in isolation from otherruminants do not develop a protozoal population. Existing populations of protozoacan be eradicated by the use of high-starch diets, or by the administration of defau-nating agents such as copper sulphate. The ionophore monensin, which was origi-nally used to kill coccidia in poultry, also kills protozoa in ruminants (although thereis some evidence that rumen protozoa can adapt to and tolerate monensin).
The contribution of protozoa to rumen digestion, and hence to the nutrition andproductivity of ruminants, has long been a matter of controversy.Although protozoamake a significant contribution to the digestion of polysaccharides, they are retainedin the rumen and thus have the undesirable effect of ‘locking up’ microbial protein inthe rumen and preventing its passage to the small intestine. So although defaunationof the rumen reduces the digestion of polysaccharides (especially the hemicellu-loses), it increases the quantity of microbial protein reaching the duodenum byabout 25 per cent. If protozoa are absent from the rumen, their fibrolytic activitymay be taken over by fungi.There is, however, some evidence that protozoa have an-other valuable role in aiding the absorption of the minerals calcium, magnesium andphosphorus from the gut.
The current view of rumen protozoa is that with low-protein, forage-based diets,their presence is detrimental to the host, and defaunation can therefore increaseanimal productivity.With concentrate-based diets, better supplied with protein, thepresence of protozoa is beneficial. Ironically, it is difficult to keep ruminants free ofprotozoa when they are on a forage diet and difficult to maintain protozoa on aconcentrate diet.
A major objective in controlling rumen fermentation is to restrict the activity ofmicrobes to the components of the diet that the host animal cannot digest with its
Microbial digestion in ruminants and other herbivores
185

Chapter 8 Digestion
186
own enzymes (principally the �-linked polysaccharides) or cannot utilise withoutmicrobial intervention (non-protein nitrogenous compounds). The strategy forachieving this objective is based on the protection of other nutrients (soluble carbo-hydrates, such as starch and sugars, and high-quality proteins) from attack in therumen.We shall see later in this book that rumen fermentation of sugars is energeti-cally inefficient for the host animal and may also cause it to be short of glucose.Tac-tics for protecting nutrients from attack in the rumen are often based on heattreatment or chemical treatment of foods. Treatment with tannins or formaldehydemodifies the structure of proteins in such a way as to impede microbial attack butstill permit digestion by mammalian digestive enzymes. There are difficulties inachieving precisely the right degree of protection, however, and a more practical wayof getting proteins past the rumen is to use foods to which rumen microorganismsare unaccustomed and therefore unadapted; these are principally foods of animalorigin, such as fishmeals. Individual amino acids can be protected with agents basedon polymers or fats. Protecting soluble carbohydrates such as starch from rumenfermentation is much more difficult, although the starch in some foods (rice by-products and, to a much lesser degree, maize) partially escapes rumen fermentation.If intensively fed ruminants are given an energy-rich supplement, this is often in theform of the one class of nutrients that naturally escapes rumen fermentation, namelythe triglyceride fats.
Although man has had some success in arranging for nutrients to ‘bypass’ therumen, nature is more successful. In the young suckled ruminant, the oesophagealgroove mechanism (see p. 172) allows the high-quality nutrients contained in milk toavoid rumen fermentation, even though the lamb or calf is consuming pasture herbageand digesting it in a fully functional rumen.Attempts by man to prolong this efficientpartition into the adult life of the ruminant have been experimentally successful butfail commercially because of the high cost of milk or milk substitutes.
Another aspect of the control of rumen fermentation arises from the need to syn-chronise the supplies of energy and protein to the microorganisms. As mentionedearlier, the bacteria need a supply of energy to synthesise their cell proteins from de-graded food proteins, and their energy sources, the carbohydrates, are made avail-able at varying rates. It is therefore possible, for example, to supplement a rapidlydegraded source of protein with a rapidly degradable source of carbohydrate.An al-ternative approach to synchronisation would be to give rapidly and slowly degradedfoods at different times of the day. However, studies of rumen synchrony have yet tobe fully translated into feeding practice.
8.3 ALTERNATIVE SITES OF MICROBIAL DIGESTION
Its great size and its location at the anterior end of the gut make the rumen pre-em-inent as a digestive organ for fibrous foods. Large quantities of food can be storedrapidly for later mastication and fermentation; cell contents are released at an earlystage; and the main products of fermentation have ample opportunity to be ab-sorbed in the remainder of the tract.These advantages of rumen digestion are, how-ever, diminished by the disadvantage of all food constituents being exposed tofermentation. If fermentation is delayed until food reaches the large intestine, thisdisadvantage is overcome, but some of the benefits of the rumen are lost.
Alternative sites of microbial digestion
187
The parts of the large intestine that are capable of sustaining a significant micro-bial population are the colon and the caecum (see Fig. 8.1). The caecum is blind-ended and is duplicated in the fowl; in some animals the walls of both the caecumand the colon are sacculated. The digestive capacity of these organs depends ontheir volume relative to the rest of the tract, as that determines the time for whichfood residues may be delayed for fermentation.The substrate for the large intestinediffers from that entering the rumen, because most of the more readily digestiblenutrients will have been removed, and also some endogenous materials (such asmucopolysaccharides and enzymes) will have been added. However, as describedearlier (see p. 163), microbial digestion in the large intestine is similar to that occur-ring in the rumen. Volatile fatty acids are produced and absorbed; methane andother gases are present. Proteins and non-protein sources of nitrogen (such as ureafrom the bloodstream) are reformed into microbial proteins; in some cases, but notinvariably, these undergo proteolysis to amino acids, which may be absorbed.Water-soluble vitamins are synthesised and inorganic elements and water are reabsorbed.But in general, hind gut fermentation is less effective than rumen digestion, becausedigesta are not held for sufficient time and because many of the products of diges-tion (particularly microbial protein and vitamins) are not absorbed. Some species ofanimal overcome the last problem by practising coprophagy (the consumption offaeces).The rabbit has perfected this practice by producing two types of faeces, thenormal hard pellets, which are not eaten, and the soft faeces or caecotrophes, whichcontain well-fermented material from the caecum and which are consumed, hencethe alternative term caecotrophy.This division of digesta is achieved by colonic con-tractions, which separate the fibrous particles that form the hard pellets. Antiperi-staltic waves of contraction move fluid and non-fibre particles into the caecum,where microbial fermentation takes place.The caecotrophes are soft pellets of cae-cal contents with a glossy coat and are eaten directly from the anus and swallowedwhole. They remain intact in the stomach for some time and fermentation contin-ues. They then pass to the small intestine for digestion of the contents. Ruminantshave a substantial capacity for hind gut fermentation, and this is used to good effectwhen the diet or the level of feeding causes much fibrous material to reach thecaecum.
The horse is capable of living solely on fibrous forages. Unlike the ruminant,however, it has only one opportunity to chew its food and must therefore chew itthoroughly as it ingests it. At this stage large amounts of saliva are added, and thefood is sufficiently buffered to permit a limited amount of fermentation in thestomach. However, most microbial digestion takes place in the enlarged colon,which has a capacity exceeding 60 l, and the caecum, with a capacity of 25–35 l.These organs contain bacteria and protozoa, which digest the food constituents inthe same way as rumen microorganisms. It has been estimated that in the horse,hind gut fermentation accounts for 30 per cent of the digestion of dietary protein,15–30 per cent of that of soluble carbohydrate and 75–85 per cent of that of cellwall carbohydrate. With diets of hay and concentrates, horses digest about 85 percent of the organic matter that would be digested by ruminants. In the pig, the hindgut is less enlarged than in the horse, and forages are poorly digested. Neverthe-less, the pig can digest as much as 50 per cent of the cellulose and hemicellulose ofcereal grains and their by-products. If starch grains escape digestion in the smallintestine, as happens when pigs are fed on uncooked potatoes, these will also befermented.

Chapter 8 Digestion
188
Although poultry have two caeca and a colon in which to ferment food residues,they gain little or nothing from hind gut fermentation when fed on their usual con-centrate diets. Indeed, it has been suggested that in poultry the intestinal flora aremore of a handicap than an advantage, as ‘germ-free’ birds (i.e. reared in isolationand with no microorganisms) tend to grow larger than normal birds.
8.4 NUTRIENT DIGESTION AND THE ENVIRONMENT
Nutrition has important effects on the environment as a consequence of theprocesses of digestion (methane and phosphorus) or a combination of digestion andmetabolism (nitrogen). Methane is produced by the fermentation of foods in the gutby microbes, particularly in ruminants, and the decomposition of carbon compoundsin faeces stored as manure. Undigested phosphorus compounds are excreted in thefaeces. Undigested and waste products of the metabolism of nitrogen compounds areexcreted in the faeces and urine and the decomposition of these produces nitrousoxide (N2O).Ammonia in animal wastes is responsible for soil acidification and nu-trient enrichment.
Although carbon dioxide is the major gas contributing to climate change,methane and nitrous oxide are also significant contributors because of their warmingpotentials, which are 25 and 300 times that of carbon dioxide, respectively.The con-sequences of nitrogen digestion and metabolism on the environment are consideredin Chapter 13.
Methane
It has been estimated that 70 per cent of the methane in the earth’s atmosphere is aresult of human activity, and agriculture accounts for 60 per cent of this. Enteric fer-mentation makes up around 80 per cent of the agricultural production of methaneand around 20 per cent arises from animal wastes. Rumen and hind gut fermentationare similar processes. During rumen fermentation of organic matter, hydrogen is pro-duced and methanogenic bacteria use this with carbon dioxide to produce methaneand water. The methane leaves the rumen by eructation and this represents a loss of6–10 per cent of the gross energy of fermented foods. However, the methanogenicbacteria use the hydrogen as an energy source for growth and thereby make a smallcontribution to the microbial matter to be digested in the small intestine.The removalof hydrogen has a beneficial effect on the fermentation of plant cell wall carbohy-drates. Hydrogen is also used by other bacteria to synthesise propionic and butyricacids, and the pathway of use depends on the diet and the pH of the rumen contents.The activity of methanogenic bacteria, and thus the amount of methane produced, isreduced with increased rates of passage and digestion of food, increased levels offeeding, reduced rumen pH and the fermentation of starchy foods, all of which favourthe channelling of carbon and hydrogen into propionate production.
In order to reduce the climatic influence of methane from agricultural sources,ways of reducing the production from rumen fermentation are being investigated.Substances added to the food to decrease methane production include halogen ana-logues of methane. However, their effects tend to decrease over time as the rumenbacterial population adapts to their presence. Ionophore antibiotics (monensin; seeChapter 24) decrease methane production and increase propionate formation and

Summary
189
probiotics (Sacchromyces cerevisiae; see Chapter 24) are also beneficial. Otherpropionate-enhancing additives include fumaric and malic acids, which are precur-sors of propionate.Attempts to alter the microbial population in the rumen have metwith limited success, no doubt owing to the varied population and the capacity ofthe organisms to adapt. Increasing animal productivity can reduce methane produc-tion indirectly and directly. Indirectly methane is reduced because fewer animals arerequired to produce the same amount of meat or milk and the maintenance costs arelower. Direct effects arise from the type of diet required to increase production,namely high quantities of concentrate (starchy) foods and the low inclusion offibrous foods. As mentioned above, starchy foods increase the production of propi-onate and reduce methane as a result of the less favourable environment for themethane-producing bacteria. However, there are drawbacks from this approach inthat the animal is more susceptible to acidosis (see p. 176) and the use of cerealscompetes directly with humans (see Chapter 25).
Phosphorus
Undigested phosphorus-containing compounds in manure can potentially run offinto waterways and cause surface water pollution. In this way phosphorus can beresponsible for the enrichment of water courses with the detrimental effect of exces-sive growth of algae and other plants. Phosphorus-containing compounds in foodsvary in digestibility, and phytin phosphorus in cereals is poorly digested by non-ruminants (see Chapter 6), with a large proportion appearing in the faeces. In orderto supply sufficient digestible phosphorus, the diets of non-ruminants are supple-mented with inorganic phosphorus sources such as dicalcium phosphate.The key toreducing the use of phosphorus supplements and the overall intake of phosphorus isin making the element in the natural food sources more available to the animal.Thiscan be achieved by supplementing the diet of non-ruminants with the phytaseenzyme, which releases the phosphorus from phytin (see Chapter 24).
Dietary phosphorus supply in relation to requirements is coming under closescrutiny, especially for dairy and beef cattle, where allowances are often significantlyabove requirements in order to give a safety margin. There is increasing pressure toreduce safety margins so that allowances are closer to requirements and phosphorusis not wasted.
SUMMARY
1. In a simple-stomached animal, such as the pig,digestion begins when food reaches the stom-ach. Proteins are hydrolysed by pepsins at pH2.0–3.5 to polypeptides and a few amino acids.
2. In the small intestine, enzymes secreted bythe mucosa and by the pancreas continue thebreakdown of protein to amino acidsthrough the action of trypsin and car-boxypeptidases. Fats are made water-solublethrough emulsification by the bile salts
(secreted by the liver) and by partial hydroly-sis by lipases. Starch (and related �-linkedpolysaccharides) are hydrolysed by amylase todisaccharides, which are further hydrolysedto monosaccharides by specific enzymes (e.g.maltose by maltase, sucrose by sucrase, etc.).
3. In the large intestine, microorganismsproduce enzymes that hydrolyse and fer-ment �-linked polysaccharides, mainly tovolatile fatty acids.

Chapter 8 Digestion
190
4. In the young pig, enzyme activities arerestricted because the sole food is milk. In thestomach, chymosin causes partial breakdownand clotting of casein. Lactase activity is high,but the activity of starch-digesting enzymes,amylase and maltase, is low until the fourthweek of life.
5. In the fowl, digestion is aided by a storageorgan anterior to the proventriculus (thecrop) and a grinding organ posterior to thestomach (the gizzard). As part of the hindgut, the two blind-ended caeca facilitatemicrobial digestion, but this is not quantita-tively important.
6. Dogs and cats are predominantly meat eatersand consume little fibrous material. Conse-quently their digestive tracts are adapted tothe digestion of protein and fat and the largeintestine is small.
7. Absorption of nutrients occurs mainly in thesmall intestine. Carbohydrates are absorbed asmonosaccharides by active transport, a processinvolving carrier proteins. Amino acids andfatty acids are also absorbed by active trans-port, but emulsified triglycerides are absorbedby passive diffusion. Large molecules, espe-cially the immunoglobulins present incolostrum, are absorbed by a process knownas pinocytosis. Many minerals and vitaminsrequire special processes of absorption.
8. The alimentary tract has a detoxifying role, asit can inactivate some of the potentially dam-aging constituents of foods.
9. In ruminants, the large stomach compartmentknown as the reticulo-rumen allows regurgi-tation of food for mechanical breakdown byrumination and acts as a continuous fermen-tation system for anaerobic bacteria, protozoaand fungi.
10. In the rumen, carbohydrates (both �- and �-linked) are hydrolysed by various routes topyruvic acid, which is then fermented toacetic, propionic and butyric acids. The extentof breakdown and the proportions of theseacids are determined by the nature of thefood. Lignin is not digested and tends tointerfere with the digestion of other nutrients.
The volatile fatty acids are absorbed throughthe rumen wall. Methane and carbon dioxideare by-products of rumen fermentation.
11. Proteins in the rumen are hydrolysed to pep-tides and amino acids, and the latter may bedeaminated to yield ammonia. Microorgan-isms use these products, and also non-proteinsources of nitrogen, such as urea and uric acid,to synthesise microbial proteins. Microbial cellspass from the rumen to the abomasum (truestomach) and small intestine, where they aredigested by the host animal’s enzymes.
12. Lipids in the rumen are hydrolysed, and un-saturated fatty acids are then converted tosaturated fatty acids by hydrogenation.
13. For optimal rumen fermentation, foods mustbe held in the organ to allow time for theslow breakdown of plant cell walls, and themicroorganisms must receive balanced sup-plies of nitrogen (as ammonia) and energy(as carbohydrate).
14. Rumen breakdown of food protein is notalways desirable, because microbial proteinmay be inferior to it in both quantity andquality. Thus, food proteins are sometimesprotected from attack by rumen microorgan-isms. In suckled ruminants, there is a deviceknown as the oesophageal groove, whichchannels milk directly to the abomasum.
15. Microbial digestion continues in the largeintestine of ruminants; volatile fatty acidsand microbial protein are produced, but theprotein cannot be subsequently digested andabsorbed by the host animal.
16. In the horse, the large intestine is the princi-pal site of microbial digestion.
17. The nutrition of animals has environmentalconsequences. Methane, which contributes toglobal warming, is produced by fermentationin the gut and the degradation of manure.Nitrous oxide, which also contributes toglobal warming, arises from the degradationof animal wastes. Undigested phosphorus inmanure can cause nutrient enrichment ofwater courses.

Historical reference
191
FURTHER READING
Annison E F and Brydon W L 1998 Perspectives of ruminant nutrition and metabolism. 1.Metabolism in the rumen. Nutrition Research Reviews 11: 173–98.
Church D C 1976 Digestive Physiology and Nutrition of Ruminants, Vol. 1. DigestivePhysiology, 2nd edn, Corvallis, OR, O and B Books.
Cronje P 2000 Ruminant Physiology: Digestion, Metabolism, Growth and Reproduction,Proceedings of the Ninth International Symposium on Ruminant Physiology,Wallingford,UK, CABI. [See also other volumes in this series.]
Czerkawski J W 1986 An Introduction to Rumen Studies, Oxford, Pergamon Press.
Forbes J M and France J (eds) 1993 Quantitative Aspects of Ruminant Digestion andMetabolism,Wallingford, UK, CABI.
Frape D L 1998 Equine Nutrition and Feeding, 2nd edn, London, Blackwell Science.
Freeman B M (ed.) 1983 Physiology and Biochemistry of the Domestic Fowl, London,Academic Press.
Hobson P N and Stewart C S 1997 The Rumen Microbial Ecosystem, 2nd edn, London,Blackie Academic & Professional.
Kidder D E and Manners M J 1978 Digestion in the Pig, Bristol, Scientechnica.
Murray R K, Granner D K, Mayes P A and Rodwell V W 1993 Harper’s Biochemistry, 23rd edn,Norwalk, CT, Appleton and Lange.
Moran E T Jr 1982 The Comparative Nutrition of Fowl and Swine: The GastrointestinalSystems, University of Guelph, Ontario.
Moss A R, Jouanny J-P and Newbold, J 2000 Methane production by ruminants: its contribu-tion to global warming. Annales de Zootechnie 49: 231–53.
National Research Council 2006 The Nutrient Requirements of Dogs and Cats, Washington,DC, National Academy Press.
Sandford P A 1982 Digestive System Physiology, London, Edward Arnold.
Stevens C E and Hume I D 1995 Comparative Physiology of the Vertebrate Digestive System,2nd edn, Cambridge, Cambridge University Press.
Swenson M J (ed.) 1984 Dukes’s Physiology of Domestic Animals, Ithaca, NY, Comstock.
Van Soest P J 1994 Nutritional Ecology of the Ruminant, 2nd edn, Ithaca, NY, Comstock.
HISTORICAL REFERENCE
Hungate R E 1966 The Rumen and its Microbes, New York,Academic Press.

192
9.1 Energy metabolism
9.2 Protein synthesis
9.3 Fat synthesis
9.4 Carbohydrate synthesis
9.5 Control of metabolism
Metabolism is the name given to the sequence, or succession, of chemical reactions thattake place in the living organism. Some of the reactions involve the degradation ofcomplex compounds to simpler materials and are designated catabolic reactions,whereas other reactions involve the synthesis of more complex compounds from simplersubstances and are designated anabolic reactions. Waste products arise as a result ofmetabolism and these have to be chemically transformed and ultimately excreted; thereactions necessary for such transformations form part of general metabolism. As a re-sult of various catabolic reactions, energy is made available for mechanical work, trans-portation and anabolic activity such as the synthesis of carbohydrates, proteins andlipids. Figure 9.1 summarises the sources of the major metabolites available to the bodyand their subsequent metabolism.
The starting points of metabolism are the substances absorbed after the digestion offood. For all practical purposes we may regard the end products of carbohydrate diges-tion in the simple-stomached animal as glucose, together with very small amounts ofgalactose and fructose. These are absorbed into the portal blood and carried to the liver.In ruminant animals, the major part of the carbohydrate is broken down in the rumen toacetic, propionic and butyric acids, together with small amounts of branched-chain andhigher volatile acids. Butyric acid is changed during its passage across the rumen wall andpasses into the portal blood as (D-)�-hydroxybutyric acid (BHBA). Acetic acid and BHBApass from the liver via the systemic blood to various organs and tissues, where they areused as sources of energy and fatty acids. Propionic acid is converted to glucose in theliver and joins the liver glucose pool. This may be converted partly into glycogen andstored, or to fatty acids, reduced coenzymes and L-glycerol-3-phosphate and used for tri-acylglycerol synthesis. The remainder of the glucose enters the systemic blood supply andis carried to various body tissues, where it may be used as an energy source, as a sourceof reduced coenzymes for fatty acid synthesis, and for glycogen synthesis.
9 Metabolism

Metabolism
193
Bo
dy
tiss
ues
+ d
iet
Glu
cose
Pro
pio
nic
acid
Bu
tyri
cac
id
Ace
tic
acid
β-H
ydro
xy-b
uty
ric
acid
Free
fat
tyac
ids
Am
ino
acid
sTr
iacy
lgly
cero
ls
NA
DPH
(+H
)+ G
lyco
gen
Glu
cose
Live
r
Ener
gy
Free
fat
tyac
ids
Tria
cylg
lyce
rol
Ace
toac
etat
eB
HB
A
Gly
cero
l
Ket
o a
cid
s
Am
mo
nia
Ure
aPr
ote
ins
Syst
emic
blo
od
Ace
tate
BH
BA
Glu
cose
Tria
cylg
lyce
rol
Ace
toac
etat
eB
HB
AU
sed
for
ener
gy
Ure
aA
min
o a
cid
s
Use
d f
or
ener
gy
and
fatt
y ac
id s
ynth
esis
Use
d f
or
ener
gy,
fat
tyac
id, g
lyco
gen
an
dtr
igly
ceri
de
syn
thes
es:
NA
DPH
(+
H)
pro
du
ctio
n+
Use
d f
or
ener
gy,
trig
lyce
rid
e an
dfa
tty
acid
syn
thes
es
Excr
eted
inu
rin
e an
dsa
liva
Use
d f
or
pro
tein
syn
thes
is a
nd
amin
o a
cid
syn
thes
es
Fig
. 9.1
Sou
rces
an
d f
ates
of
maj
or
bo
dy
met
abo
lites
.
BH
BA
��
-hyd
roxy
bu
tyri
c ac
id; N
AD
PH (
�H
�)
�re
du
ced
nic
oti
nam
ide
aden
ine
din
ucl
eoti
de
ph
osp
hat
e.

Chapter 9 Metabolism
194
Digestion of proteins results in the production of amino acids and small peptides,which are absorbed via the intestinal villi into the portal blood and are carried to theliver, where they join the amino acid pool. They may then be used for protein synthesisin situ or may pass into the systemic blood, where they join the amino acids produced as aresult of tissue catabolism in providing the raw material for the synthesis of proteinsand other biologically important nitrogenous compounds. Amino acids in excess of thisrequirement are carried to the liver and broken down to ammonia and keto acids. Thelatter may be used for amino acid synthesis or the production of energy. Some of theammonia may be used in amination, but the majority is converted into urea and eitherexcreted in the urine or recycled in the saliva. In the ruminant animal a considerableamount of ammonia may be absorbed from the rumen into the portal blood, trans-formed into urea by the liver, and then excreted or recycled via saliva or through therumen wall.
Most dietary lipids enter the lacteals as chylomicrons, which enter the venous bloodvessels via the thoracic duct. The chylomicrons are about 500 nm in diameter with a thinlipoprotein envelope. A very small proportion of dietary triacylglycerols may be hydrol-ysed to glycerol and low-molecular-weight acids in the digestive tract and these are ab-sorbed directly into the portal blood supply. Circulating chylomicrons are absorbed bythe liver and the triacylglycerols are hydrolysed. The fatty acids so produced, along withfree fatty acids absorbed from the blood by the liver, may be catabolised for energy pro-duction or used for the synthesis of triacylglycerols. These then re-enter the blood sup-ply in the form of lipoprotein and are carried to various organs and tissues, where theymay be used for lipid synthesis, for energy production and for fatty acid synthesis. Fattyacids catabolised in excess of the liver’s requirement for energy are changed to (L-)�-hydroxybutyrate and acetoacetate, which are transported to various tissues andused as sources of energy.
9.1 ENERGY METABOLISM
Energy may be defined as the capacity to do work. There are various forms of en-ergy, such as chemical, thermal, electrical and radiant, all of which are interconvert-ible by suitable means. For example, the radiant energy of the sun is used by greenplants, via photosynthesis, to produce complex plant constituents, which are thenstored. The plants are consumed by animals and the constituents broken down, re-leasing energy, which is used by animals for mechanical work, for transport, formaintaining the integrity of cell membranes, for the synthesis of body componentsand for providing heat under cold conditions.
Since all forms of energy can be converted to heat, heat units have been used torepresent the energy involved in metabolism. Traditionally, the basic unit used hasbeen the thermochemical calorie (cal), based on the calorific value of benzoic acid asthe reference standard. However, the calorie is too small a unit for routine use andthe kilocalorie (1000 cal) or megacalorie (1 000 000 cal) is more commonly used inpractice. However, the International Union of Nutritional Sciences and the NationalCommittee of the International Union of Physiological Sciences have now suggestedthe joule (J) as the unit of energy for use in nutritional, metabolic and physiologicalstudies. This suggestion has been almost universally adopted and is followed in thisbook.The joule is defined as 1 newton per metre, and 4.184 J � 1 cal.

Energy metabolism
195
The chemical reactions taking place in the animal’s body are accompanied bychanges in the energy of the system. The portion of the energy change that is avail-able to do work is termed the free energy change, designated �G.When �G is nega-tive, the reaction is said to be exergonic and takes place spontaneously; when �G islarge and negative, the reaction proceeds almost to completion.When �G is positive,the reaction is termed endergonic and free energy has to be fed into the system inorder for the reaction to take place.When �G is large and positive, there is little ten-dency for the reaction to take place. Most of the synthetic reactions of the body areendergonic and the energy needed to drive them is obtained from exergonic cata-bolic reactions. Before the energy released by these changes can be utilised for syn-theses and other vital body processes, a link between the two must be established.This is provided by mediating compounds that take part in both processes, pickingup energy from one and transferring it to the other. Typical are adenosine triphos-phate (ATP), guanosine triphosphate (GTP), cytidine triphosphate (CTP) and uridinetriphosphate (UTP). By far the most important nucleotide triphosphate is ATP.Adenosine is formed from the purine base adenine and the sugar D-ribose. Phospho-rylation of the hydroxyl group at carbon atom 5 of the sugar gives adenosinemonophosphate (AMP) (see Chapter 4); successive additions of phosphate residuesgive adenosine diphosphate (ADP) and then the triphosphate. In its reactions withinthe cell, ATP functions as a complex with magnesium. The addition of the last twophosphate bonds requires a considerable amount of energy, which may be obtaineddirectly by reaction of AMP or ADP with an energy-rich material. For example, incarbohydrate breakdown, one of the steps is the change of phosphoenolpyruvate topyruvate, which results in one molecule of ATP being produced from ADP.
+
CH2
C:O~
COO–
P ADPMg2+
C:O *
CH3
COO–
ATP +
Phosphoenolpyruvate Pyruvate
When production of ATP from ADP takes place directly during a reaction, as inthis case, the process is known as substrate-level phosphorylation.
Alternatively, ATP may be produced indirectly. Most biological oxidations in-volve the removal of hydrogen from a substrate. However, the final combination ofhydrogen with oxygen to form water occurs only at the end of a series of reactions.A typical example is the removal of hydrogen coupled to nicotinamide adeninedinucleotide (NAD�), as illustrated in Fig. 9.2 for the oxidation of isocitrate to �-ketoglutarate.
In this example, hydrogen removed from isocitrate is accepted by NAD� and isthen passed to the flavin coenzyme.This donates two electrons to ubiquinone, andtwo protons (2H�) are formed. The electrons are then transferred via the sequen-tial cytochromes to cytochrome a3, which is capable of transferring the electrons tooxygen. The negatively charged oxygen finally unites with the two protons, yield-ing water. During the operation of this pathway, ATP is produced from ADP andinorganic phosphate, the process being called oxidative phosphorylation. It isconfined to the mitochondria and to the reduced NAD� produced within them.

Chapter 9 Metabolism
196
*Throughout this chapter, energy inputs are shown by an open box (�) and energy outputs by ablack box (�).
Considerations of energy release indicate that production of ATP takes place at thetransfer of hydrogen from reduced FAD to ubiquinone, at the transfer of electronsfrom cytochrome b to c1, and from cytochrome a to cytochrome a3.The flow of elec-trons leads to the transfer of protons from the matrix to the cytoplasmic side of theinner mitochondrial membrane. A proton-motive force consisting of a pH gradient(matrix side basic) and a membrane potential (matrix side negative) is then gener-ated. The flow of protons back to the matrix side through ATP synthase drives ATPsynthesis. The flow of electrons from NADH or FADH to O2 through the transferchain generates sufficient proton motive force for the synthesis of 2.5 and 1.5 molesof ATP, respectively.The series of reactions may be represented as:
NADH(+H+) � O � 2.5ADP � 2.5Pi NAD+ � 2.5 ATP � H2O
NAD(+H+)NAD+
FADFADH2
ATP
ATP
ATP
ADP + Pi
ADP + Pi
ADP + Pi
½O2H2O
Fe3+
Fe2+
Ubiquinone + 2H+Ubiquinone
α-KetoglutarateIsocitrate
2 Cytochrome bFe2+
2 Cytochrome b
2 Cytochrome c1Fe3+
2 Cytochrome c1
Fe3+2 Cytochrome c
Fe2+2 Cytochrome c
Fe2+2 Cytochrome a
Fe3+2 Cytochrome a
Fe2+2 Cytochrome a3
Fe2+2 Cytochrome a3
2e
Fig. 9.2 The oxidative phosphorylation system.

Energy metabolism
197
Since oxidative phosphorylation is confined to the mitochondria, reducedNAD� produced in the cell cytoplasm must cross the mitochondrial wall to beprocessed in this way. Reduced NAD� itself is not capable of doing so. Passage intothe mitochondria, of the reducing equivalents that it represents, is achieved by theoperation of the malate–aspartate shuttle or the glycerophosphate shuttle. In themalate– aspartate shuttle, no energy cost is involved. In the glycerophosphate shut-tle, the reducing equivalents enter the oxidative phosphorylation pathway at theFAD� stage and only 1.5 moles of ATP are produced. The malate–aspartate shut-tle is predominant in the liver, whereas muscle makes greater use of the glycerophos-phate pathway.
The energy fixed as ATP may be used for doing mechanical work during the per-formance of body processes that are essential for maintaining the animal. Both con-traction and relaxation of muscle involve reactions that require a supply of energy,which is provided by breakdown of ATP to ADP and inorganic phosphate. The en-ergy fixed in ATP may also be used to drive reactions in which the terminal phos-phate group is donated to a large variety of acceptor molecules. Among these isD-glucose:
� D-glucose : ADP � D-glucose phosphate
In this way the glucose is energised for subsequent biosynthetic reactions. In otherreactions, such as the first stage of fatty acid synthesis,ATP provides the energy andis broken down to AMP and inorganic phosphate:
Acetate + coenzyme A � 4 acetyl-coenzyme A � pyrophosphate � AMP
The role of ATP in trapping and utilising energy may be illustrated diagrammaticallyas shown in Fig. 9.3.
The quantity of energy that is made available by the rupture of each of the twoterminal phosphate bonds of ATP varies according to the conditions under which thehydrolysis takes place. Most authorities agree that under the conditions pertaining inintact cells the amount of energy is about 50 kJ/mole, but this varies with pH, mag-nesium ion concentration and the concentrations of ATP, ADP and phosphate. Thephosphate bonds are commonly referred to as high-energy bonds, represented by�[P]. This term is not thermodynamically accurate and many workers prefer to usethe term ‘high group transfer potential’.
Fixation of energy in the form of ATP is a transitory phenomenon and any energyproduced in excess of immediate requirements is stored in a more permanent form
ATP
ATP
ATP
ADP
AMP
Free energyfrom catabolism
Free energy for chemical work(biosynthesis), osmotic work(transport) and mechanicalwork (muscular contraction)
Fig. 9.3 The role of ATP in the utilisation of energy.

Chapter 9 Metabolism
198
in such compounds as the phosphocreatine of muscle, which is formed from creatinewhen ATP is in excess:
When the supply of ATP is insufficient to meet energy demand, more ATP is pro-duced from phosphocreatine by the reverse reaction.
Even compounds such as phosphocreatine are minor, temporary energy stores.The majority of energy stored in the body is stored as depot fat together with smallquantities of carbohydrate in the form of glycogen. In addition, protein may be usedto provide energy under certain circumstances.
In addition to using this stored energy, the body derives energy directly from nu-trients absorbed from the digestive tract. The most important of these in simple-stomached animals is glucose. However, in ruminant animals, the volatile fatty acidsoccupy this position.
Glucose as an energy source
The major pathway by which glucose is metabolised to give energy has two stages.The first, known as glycolysis, can occur under anaerobic conditions and results in theproduction of pyruvate.The sequence of reactions (Fig. 9.4), often referred to as theEmbden–Meyerhof pathway, takes place in the cell cytoplasm.
All the reactions in the pathway are reversible, but reactions 1, 3, 8 and 11 have largenegative �G values under physiological conditions and are essentially irreversible.Twomoles ofATP are used in the initial phosphorylations of steps 1 and 3, and the fructosediphosphate so formed breaks down to yield two moles of glyceraldehyde-3-phosphate.Subsequently, one mole of ATP is produced directly at each of steps 8 and 11. Fourmoles ofATP are thus produced from one mole of glucose. Since two moles ofATP areused up, the net production ofATP fromADP is two moles per mole of glucose. Underaerobic conditions the reduced NAD�, produced at step 7, may be oxidised via the ox-idative phosphorylation pathway and, assuming the operation of the malate–aspartateshuttle, 2.5 moles ofATP are produced per mole.The pyruvate produced by glycolysis istransported into the mitochondria, without energy cost, and is oxidised to carbondioxide and water, with further production of energy. The first step in this process isthe oxidative decarboxylation of pyruvate in the presence of thiamin diphosphate:
CH3
C:O + HS.CoA COS.CoA
COO–
CH3
NAD+ NADH(+H+)
+ CO2Pyruvate dehydrogenase
Pyruvate Coenzyme A Acetyl-coenzyme A
NH2
C:NH2
N.CH3 + ATP N.CH3 + ADP
CH2
COO–
CH2
C:NH2
COO–
NH~ P
Creatine kinase
Creatine Phosphocreatine
+ +

Energy metabolism
199
Glucose-6-phosphataseMg2+
ADP H2O
ATP Phosphate
1
2
5
9
7
4
ATP
ATP
Hexosediphosphatase
Fructose-diphosphate aldolase
Glyceraldehyde-3-phosphatedehydrogenase
Phosphoglycerate kinase
Phosphoglyceromutase
Enolase
Pyruvate kinase
Mg2+
Mg2+
Mg2+
10H2OH2O
Glucose-6-phosphate
Fructose-6-phosphate
Glucose
Fructose-1,6-phosphate
Glyceraldehyde-3-phosphate
3-Phosphoglyceroyl phosphate
3-Phosphoglycerate
2-Phosphoglycerate
Phosphoenolpyruvate
Pyruvate
Mg2+
ADP H2O
ATP Phosphate
3
Hexokinase
Glucosephosphateisomerase
6-Phosphofructokinase
Dihydroxyacetonephosphate
(6)
Triose phosphate
Isomerase NAD+
NADH + (H+)
8
ADP
Mg2+ 11
ADP
Fig. 9.4 The glycolytic pathway.
The hydrogen is removed via the normal NAD� pathway.The acetyl-coenzymeA produced is then oxidised to carbon dioxide and water via the tricarboxylic acidcycle (also known as the Kreb’s or citric acid cycle), as shown in Fig. 9.5.
The tricarboxylic acid cycle involves four dehydrogenations, three of which areNAD�-linked and one FAD-linked. In addition, one mole of GTP arises directlywith the change of succinyl-coenzyme A to succinate.The total ATP yield from theoxidation of one mole of glucose can now be estimated. The ATP yield from

Chapter 9 Metabolism
200
Acetyl-coenzyme A
Oxalacetate
NAD+Malate
Malate dehydrogenaseCitrate synthetase
Fumarase
Succinatedehydrogenase
Succinate coenzyme Asynthetase
Fumarate
Succinate
Succinyl-coenzyme A
FAD
GDP + Pi
Coenzyme A
Citrate
Aconitase
Isocitrate
Isocitrate dehydrogenase
Isocitrate dehydrogenase
α-Ketoglutarate
α-Ketoglutarate dehydrogenasecomplex
Oxalsuccinate
NAD
NAD+
CO2
CO2
Mg2+
Mg2+HS.CoA
GTP
FADH2
NADH (+H+)
NADH (+H+)
NADH (+H+)
Fig. 9.5 The tricarboxylic acid cycle.
substrate-level phosphorylation is determined by the stoichiometry of the chemicalreactions. However, the ATP yield from oxidative phosphorylation is less certain be-cause the stochiometries of proton-pumping, ATP synthesis and the metabolitetransport processes are not fixed values. As stated previously, the flow of a pair ofelectrons from NADH to O2 generates sufficient proton-motive force for the synthe-sis of about 2.5 moles of ATP. Similarly, the flow of electrons from FADH to O2generates sufficient proton-motive force for the synthesis of about 1.5 moles of ATP.Consequently, on average about 30 moles of ATP are produced from the completeoxidation of glucose (Table 9.1).
The capture of energy represented by the formation of 30 high-energy phosphatebonds may be calculated as 30 � 50 � 1500 kJ/mole of glucose. The total free en-ergy content of glucose is 2870 kJ/mole.The efficiency of free energy capture by thebody is thus 1500/2870 � 0.52. Such calculations assume perfect coupling of reac-tions and normal environmental cell conditions.
Table 9.1 ATP yield from the complete oxidation of 1 mole of glucose
1 mole glucose to 2 moles pyruvateATP yield (substrate-level phosphorylation) 22 NADH (oxidative phosphorylation glycerophosphate shuttle) 3
2 moles pyruvate to 2 moles acetyl-Co A2 NADH (oxidative phosphorylation malate–aspartate shuttle) 5
2 moles acetyl-Co A to CO2 + H2O
ATP yield (substrate-level phosphoryation) 22 FADH (oxidative phosporylation glycerophosphate shuttle) 36 NADH (oxidative phosphoryation glycerophosphate shuttle) 12
Total ATP yield per mole of glucose 30

Energy metabolism
201
Glycolysis takes place in the cell cytoplasm, whereas the decarboxylation of pyru-vate and the subsequent oxidation of acetyl-coenzyme A via the tricarboxylic acidcycle take place in the mitochondrial matrix. Under anaerobic conditions, oxygen isnot available for the oxidation of reduced NAD� by oxidative phosphorylation. Inorder to allow the release of a small amount of energy by continuing the breakdownof glucose to pyruvate, reduced NAD� must be converted to the oxidised form. Ifnot, step 7 of Fig. 9.4 will not take place and energy production will be blocked.Oxidation of reduced NAD� may be achieved under such conditions by the forma-tion of lactate from pyruvate in the presence of lactate dehydrogenase:
CH3
C:O CHOH
COO– COO–
CH3
NADH(+H+) NAD+
Lactate dehydrogenase
Pyruvate Lactate
When glucose is used as an energy source under anaerobic conditions, lactate ac-cumulates, eventually diffuses into the bloodstream, and is carried to highly aerobictissues such as the heart and the liver. Here it may undergo oxidative breakdown tocarbon dioxide and water, with further release of energy, or it may be reconvertedinto glucose. Recent evidence suggests that even in highly aerobic muscle tissue,much of the glucose used for energy is converted to lactate.
Another pathway by which glucose is metabolised within the body is that knownvariously as the pentose phosphate pathway, the phosphogluconate oxidative path-way and the hexose phosphate shunt.Although the system encompassing glycolysisand the tricarboxylic acid cycle is the major pathway of glucose metabolism in thebody, the pentose phosphate pathway is of considerable importance in the cytoplasmof the cells of the liver, adipose tissue and lactating mammary glands. The steps ofthis pathway are shown in Fig. 9.6.
The net result of this series of reactions is the removal of one carbon atom fromglucose as carbon dioxide and the production of two moles of reduced NADP�.Theoxidation of one mole of glucose may be represented as:
Unlike reduced NAD�, reduced NADP� is not used during oxidative phosphory-lation to produce ATP, and the main function of the pentose phosphate pathway is toprovide reduced NADP� for tissues that have a specific demand for it, particularlythose actively synthesising fatty acids. Almost one-third of the glucose metabolisedby the liver may follow this pathway, and this figure may be exceeded in adiposetissue. Reduced NADP� can be converted to reduced NAD� via an energy-linkedtranshydrogenase and thus serve indirectly as a source of ATP.
Glycogen as an energy source
Glycogen is the major form of carbohydrate storage in animals and is present in mostanimal cells. It may form up to 80 g/kg of fresh liver and up to 100 g/kg of freshmuscle. Most is present in the latter.The release of energy from glycogen necessitates
Glucose-6-phosphate � 12NADP+ 6CO2 � PO43– � 12NADPH(+H+)

Chapter 9 Metabolism
202
Glucose-6-
HexokinaseATP
ADP
P
Fructose-1,6-bis-
Glyceraldehyde 3-Transketolase
P
Glucose
NADP+
NADPH (+H+)
NADPH (+H+)
Phosphogluconatedehydrogenase
Ribosephosphate isomerase
Ribulose-3-epimerase
Ribulose-5- P
P
P
P
P
P
P
Glucose-6- dehydrogenaseP
6-Phosphogluconolactonase
6-Phosphoglucono-δ-lactone
6-Phosphogluconate
Ketogluconate-6- P
Transketolase
Transaldolase
Sedoheptulose-7-
Fructose-6-
Glucosephosphateisomerase
P
Xylulose-5- Ribose-5-
Erythrose 4-
Glyceraldehyde-3-
P Hexose-bis- isomeraseP
P
Fructose-bis- aldolase
NADP+
CO2
Fig. 9.6 The pentose phosphate pathway.
its breakdown to glucose, which is then degraded as described previously. Break-down of glycogen within cells takes place through the action of inorganic phosphateand glycogen phosphorylase.This enzyme catalyses the hydrolysis of the 1,4-glycosidiclinkages of the glycogen (see Chapter 2) and degradation begins at the non-reducingend of the chain. Glucose-1-phosphate molecules are released successively until abranch point is approached.A rearrangement of the molecule then takes place in thepresence of an oligotransferase, which exposes a terminal 1,6-linked glucose unit.Cleavage of the 1,6 linkage by an oligo-1,6-glucosidase releases free glucose, andglucose-1-phosphate is produced by further activity of the phosphorylase. The neteffect of glycogen breakdown is the production of glucose-1-phosphate plus a littleglucose. Glucose-1-phosphate is converted by phosphoglucomutase to glucose-6-phosphate, which enters glycolysis or the pentose phosphate pathway, as does theresidual glucose.The production of glucose-6-phosphate from glycogen does not in-volve expenditure of ATP, except for that used in the conversion of residual glucoseto glucose-6-phosphate. Energy production from glycogen is thus slightly more effi-cient than it is from glucose.
Propionic acid as an energy source
In ruminant animals, considerable amounts of propionate are produced from carbo-hydrate breakdown in the rumen.The acid then passes across the rumen wall, wherea little is changed to lactate.The remainder is carried to the liver, where it is converted

Energy metabolism
203
into glucose by gluconeogenesis. The first stage in this process is its conversion tosuccinyl-coenzyme A (Fig. 9.7).
This then enters the tricarboxylic acid cycle and is converted to malate (see Fig. 9.5),where the equivalent of 2.5 moles of ATP are produced.The malate is transported intothe cytosol, where it is converted to oxalacetate and then phosphoenolpyruvate:
CH3
CH2
COO–
Propionate +
CH3
CH2
COS.CoA
ATP
AMP + PPi
CH2
CH.COOH
COS.CoA
ATP
ADP + Pi
Acyl-CoA synthetase
Propionyl-CoA carboxylase
Methylmalonyl-CoA racemaseMethylmalonyl-CoA isomerase
COOH
CH2
CH2
COS.CoA
H
S
CoA
Coenzyme A
Propionyl-coenzyme A
Methylmalonyl-coenzyme A
Succinyl-coenzyme A
Fig. 9.7 Conversion of propionate to succinyl-coenzyme A.
COO–
CH2
CHOH NAD+
Malate dehydrogenase
COO–
NADH(+H+)
COO–
CH2
C:O
COO–
ITP
Phosphoenolpyruvatecarboxykinase
IDP
ATP ADP+Pi
CH2
C:O
COO–
Malate Oxalacetate Phosphoenolpyruvate
P~

The phosphoenolpyruvate may then be converted to fructose diphosphate byreversal of steps 10, 9, 8, 7 and 5 in the glycolytic sequence shown in Fig. 9.4.Thisis then converted to fructose-6-phosphate by hexose diphosphatase and then toglucose-6-phosphate by the reverse of step 2 and finally to glucose by glucose-6-phosphatase.The glucose may then eventually be used to provide energy.The energybalance sheet may be prepared as follows:
Chapter 9 Metabolism
204
ATP � ATP �
2 moles propionate to 2 moles succinyl-CoA 62 moles succinyl-CoA to 2 moles malate 52 moles malate to 2 moles phosphoenolpyruvate 5 22 moles phosphoenolpyruvate to 1 mole glucose 51 mole glucose to CO2 � H2O 30Total 40 13Net gain of ATP 27
There is thus a net gain of 13.5 moles of ATP per mole of propionic acid.Small amounts of propionic acid are present in the peripheral blood supply. They
may arise because of incomplete removal by the liver or from oxidation of fatty acidswith an odd number of carbon atoms. Such propionate could conceivably be used di-rectly for energy production.The pathway would be the same as that described as faras phosphoenolpyruvate.This would then follow glycolysis via pyruvate, acetyl-coen-zyme A and the tricarboxylic acid cycle.The balance sheet for this process is:
Therefore, this pathway is marginally more efficient than that via glucose.
Butyric acid as an energy source
Butyric acid produced in the rumen is converted to �-hydroxybutyrate (D-3-hydroxybutyrate) during absorption across the ruminal and omasal walls.The path-way for this conversion is shown in Fig. 9.8.
The D-3-hydroxybutyrate may then be used as a source of energy by a number oftissues, notably skeletal and heart muscle. In non-ruminant animals, but not rumi-nants, utilisation by the brain increases markedly under conditions of glucose short-age.The reactions involved in energy production are shown in Fig. 9.9.
ATP � ATP �
1 mole propionate to 1 mole succinyl-CoA 31 mole succinyl-CoA to 1 mole malate 2.51 mole malate to 1 mole phosphoenolpyruvate 2.5 11 mole phosphoenolpyruvate to 1 mole acetyl-CoA 3.51 mole acetyl-CoA to CO2 � H2O 10Total 18.5 4Net gain of ATP per mole of propionic acid 14.5

Energy metabolism
205
The acetyl-coenzyme A is metabolised via the tricarboxylic acid cycle. Wemay calculate the energy released from butyrate by the synthetase pathway asfollows:
CH3.CH2.CH2.COO–
ATP
CH3.CH2.CH2.COS.CoA
AMP
HS.CoA
H2O
H2O
FAD
FADH
CH3.CH:CH.COS.CoA
CH3.CHOH.CH2.COS.CoA
NAD+
NADH(+H+)
CH3.CO.CH2.COS.CoA
CH3.COS.CoA
CH3.C(CH3)(OH).CH2.COS.CoA
CH3.COS.CoA
CH3.CO.CH2.COO–
CH3.CHOH.CH2.COO–
NAD+
NADH(+H+)
Butyrate
Butyryl-CoA
Crotonyl-CoA
β-Hydroxybutyryl-CoA
Acetoacetyl-CoA
Hydroxymethyglutaryl-CoA
Acetoacetate
D-3-Hydroxybutyrate
D-3-Hydroxybutyrate dehydrogenase
Hydroxymethylglutaryl-CoA lyase
Hydroxymethylglutaryl-CoA synthase
β-Hydroxyacyl dehydrogenase
Enoyl-CoA hydratase
Acyl-CoA dehydrogenase
Acetyl-CoA synthetase
Fig. 9.8 Production of 3-hydroxybutyrate from butyrate.
ATP � ATP �
1 mole butyrate to 1 mole D-3-hydroxybutyrate 4 4.51 mole D-3-hydroxybutyrate to 2 moles acetyl-CoA 2.5 22 moles acetyl-CoA to CO2 � H2O 20Total 26.5 6.5Net gain of ATP per mole butyrate 20

Chapter 9 Metabolism
206
If the change of acetoacetate to acetoacetyl-coenzyme A takes place via thesuccinyl-coenzyme A pathway, there is a saving of two moles of ATP and the net gainper mole of butyric acid is equivalent to 22 high-energy phosphate bonds. However,the energy cost of producing succinyl-coenzyme A has to be taken into account, andthis pathway is then slightly less efficient than the other.
Acetic acid as an energy source
Acetic acid is the major product of carbohydrate digestion in ruminants and is theonly volatile fatty acid present in the peripheral blood in significant amounts. It isused by a wide variety of tissues as a source of energy.The initial reaction in this caseis conversion of acetate to acetyl-coenzyme A in the presence of acetyl-coenzyme Asynthetase:
CH3.CHOH.CH2.COO–
(D-3-Hydroxybutyrate)
CH3.CO.CH2.COS.CoA(Acetoacetyl-coenzyme A)
CH3.CO.CH2.COO–
(Acetoacetate)ATP
AMP
Coenzyme A
Pyrophosphate
2CH3.COS.CoA(Acetyl-coenzyme A)
Acyl-CoA synthetase
Acetyl-CoA acetyl transferase Coenzyme A
D-3-Hydroxybutyrate dehydrogenase
NAD+
Succinate
Succinyl-coenzyme A
β-Ketoacid-CoA transferase
NADH + (H+)
Fig. 9.9 Formation of acetyl-coenzyme A from D-3-hydroxybutyrate.
ATP
Acetyl-CoA synthetase
AMP+PPi
CH3
COS.CoA
+ H2O
CH3
COO–
+
H
S.CoA
Acetate Coenzyme A Acetyl-coenzyme A
The formation of the acetyl-coenzyme A takes place in the cell cytoplasm, whereasthe oxidation via the tricarboxylic acid cycle is confined to the mitochondrial matrix.The acetyl-coenzyme A is unable to cross the mitochondrial wall and has to be com-plexed with carnitine to achieve this.Within the mitochondrial matrix, the complex isbroken down, releasing acetyl-coenzyme A, which then enters the tricarboxylic acid

Energy metabolism
207
cycle and is oxidised to yield 10 moles of ATP per mole. Since two high-energy phos-phate bonds are used in the initial synthetase-mediated reaction, the net yield ofATP is 8 moles per mole of acetate.
Fat as an energy source
The store of triacylglycerol in the body is mobilised to provide energy by the actionof lipases, which catalyse the production of glycerol and fatty acids. The glycerol isglycogenic and enters the glycolytic pathway (see Fig. 9.4) as dihydroxyacetonephosphate, produced as shown in the following reactions:
CH2OH
CHOH
CH2OH NAD+
CH2OH
CHOH
CH2O
CH2OH
C:O
C:O~
Glycerol kinaseGlycerol-3-phosphatedehydrogenase
Glycerol L-Glycerol-3-phosphate
NAD+
(+H+)P~ATP ADP P
Dihydroxyacetonephosphate
Glucose may then be produced by the reverse of the aldolase reaction to givefructose-1,6-diphosphate, which is then converted to glucose by the action of hexosediphosphatase, glucose-6-phosphate isomerase and glucose-6-phosphatase. If theglucose is used to produce energy, we may assess the efficiency of glycerol as anenergy source:
ATP � ATP �
2 moles glycerol to 2 moles dihyrdoxyacetone phosphate 5 22 moles dihyrdroxyacetone phosphate to 1 mole glucose1 mole glucose to CO2 � H2O 30Total 35 2Net yield of ATP per mole glycerol 16.5
On the other hand, the dihydroxyacetone phosphate may enter the glycolyticpathway and be metabolised via pyruvate and the tricarboxylic acid cycle to carbondioxide and water, with energy being released. The efficiency of glycerol as an en-ergy source under these circumstances may be assessed as follows:
ATP � ATP �
1 mole glycerol to 1 mole dihydroxyacetone phosphate 2.5 11 mole dihydroxyacetone phosphate to 1 mole pyruvate 4.51 mole pyruvate to CO2 � H2O 12.5Total 19.5 1Net yield of ATP per mole glycerol 18.5

Chapter 9 Metabolism
208
By far the most important source of energy provided by triacylglycerols is derivedfrom the fatty acids. The major pathway for fatty acid degradation is �-oxidation,which results in a progressive shortening of the carbon chain by removal of two car-bon atoms at a time. The first stage of �-oxidation is the reaction of the fatty acidwith coenzyme A in the presence of ATP and fattyacyl-CoA ligase to give an acyl-coenzyme A.This occurs in the cell cytoplasm; the fattyacyl-CoA is then transferredinto the mitochondria as a complex with carnitine and is regenerated there. It thenundergoes a series of reactions to give an acyl-coenzyme A with two less carbonatoms than the original and a mole of acetyl-CoA is released. The pathway is illus-trated in Fig. 9.10.
During the splitting off of the two-carbon acetyl-coenzyme A, the equivalent of4 moles of ATP is produced.The remaining acyl-coenzyme undergoes the same seriesof reactions and the process continues until the carbon chain has been completelyconverted to acetyl-coenzyme A. This enters the tricarboxylic acid cycle and is oxi-dised to carbon dioxide and water, each mole of acetyl-CoA so metabolised giving10 moles of ATP. Since the initial ligase reaction is necessary only once for eachmolecule, more ATP is produced for the same expenditure of energy by the oxida-tion of long- rather than short-chain acids.The oxidation of the 16-carbon palmitateis illustrated in Fig. 9.11.
R.(CH2)n.CH2.CH2.COO–
R.(CH2)n.CH2.CH2.COS.CoA
R.(CH2)n.CH:CH.COS.CoA
R.(CH2)n.CHOH.CH2.COS.CoA
R.(CH2)n.CO.CH2.COS.CoA
R.(CH2)n.COS.CoA + CH3COS.CoA
ATP
2PPi + AMP
HS.CoA
H2O
H2O
FAD
FADH2
NAD+
HS.CoA
NADH(+H+)
Fatty acid
Acyl-CoA
Enoyl-CoA
β-Hydroxyacyl-CoA
β-Ketoacyl-CoA
Acyl-coenzyme A Acetyl-coenzyme A
Acetyl-CoA acyl transferase
β-Hydroxyacyl-CoAdehydrogenase
Enoyl-CoA hydratase
Acyl-CoA dehydrogenase
Fattyacyl-CoA ligase
Fig. 9.10 Oxidation of fatty acids to acetyl-coenzyme A.

Energy metabolism
209
The energy production in this sequence may be summarised as follows:
Amino acids as sources of energy
When amino acids are available in excess of the animal’s requirements, or when theanimal is forced to break down body tissues to maintain essential body processes,amino acids may be catabolised to provide energy. This is important in dogs andcats, which have been shown to be healthy on a carbohydrate-free diet. In animal
Palmitate
Palmitoyl-CoA
Myristoyl-CoA
Lauryl-CoA
Caproyl-CoA
Capryloyl-CoA
Caprooyl-CoA
Butyroyl-CoA
Acetyl-CoA
Acetyl-CoA
Acetyl-CoA
Acetyl-CoA
Acetyl-CoA
Acetyl-CoA
Acetyl-CoA
Acetyl-CoA
AMPATP
4ATP
4ATP
4ATP
4ATP
4ATP
4ATP
4ATP
Fig. 9.11 �-Oxidation of palmitate.
ATP � ATP �
1 mole palmitate to palmitoyl-CoA 21 mole palmitoyl-CoA to 8 moles acetyl-CoA 288 moles acetyl-CoA to CO2 � H2O 80Total 108 2Net gain of ATP per mole of palmitate 106

Chapter 9 Metabolism
210
tissues amino acid degradation takes place mainly in the liver, although the kidneyalso shows considerable activity. Muscle tissue is relatively inactive.
The first stage in the oxidative degradation of amino acids is the removal of theamino group by one of two main pathways, oxidative deamination or transamina-tion. In transamination the amino group is transferred to the �-carbon atom of a ketoacid, usually �-ketoglutarate, resulting in the production of another keto acid andglutamate.The reactions are catalysed by enzymes known as aminotransferases.Thereaction for aspartate may be represented as:
NH3
CH.COO– + C.COO–
CH2.COO– CH2
CH2.COO–
Aspartateaminotransferase
O
C.COO– + CH.COO–
CH2.COO– CH2
CH2.COO–
NH3+
Aspartate α-Ketoglutarate Oxalacetate Glutamate
O
The glutamate so formed, as well as that which becomes available from the diges-tive tract and from protein breakdown in the tissues, may undergo oxidative deami-nation in the presence of glutamate dehydrogenase:
NH3+
CH.COO–
CH2
Glutamate
NAD+ H2ONADH(+H+)
O
C.COO–
CH2
CH2.COO–
α-Ketoglutarate
+ NH4+
Glutamate dehydrogenase
CH2.COO–
The �-ketoglutarate may then be used in further transaminations and the reducedcoenzyme is oxidised by oxidative phosphorylation (see p. 196). Glutamate is theonly amino acid in mammalian tissue that undergoes oxidative deamination at an ap-preciable rate.The initial transaminations that give rise to it are therefore of major im-portance when amino acids are being used as sources of energy. Flavin-linked D- andL-amino acid oxidases, which catalyse the production of keto acids and ammonia, doexist but are of minor importance only.The final product of amino acid degradationis acetyl-coenzyme A, which is then processed via the tricarboxylic acid cycle toyield energy.The acetyl-CoA may be produced directly (as in the case of tryptophan,leucine and isoleucine), via pyruvate (alanine, glycine, serine, threonine and cys-teine) or via acetoacetyl-CoA (phenylalanine, tyrosine, leucine, lysine and trypto-phan). Other amino acids are degraded by pathways of varying complexity to giveproducts such as �-ketoglutarate, oxalacetate, fumarate and succinyl-CoA, whichenter the tricarboxylic acid cycle and yield acetyl-CoA via phosphoenolpyruvate(see p. 200).
One of the consequences of amino acid catabolism is the production of ammonia,which is highly toxic. Some of this may be used in amination during amino acid syn-thesis in the body. In this case, ammonia reacts with �-ketoglutarate to give glutamate,

Energy metabolism
211
which is then used for protein synthesis.The reaction is the reverse of oxidative deam-ination, except that NADP� takes the place of NAD�. However, most of the ammoniaproduced is excreted from the body as urea in mammals and uric acid in birds.
Deamination of amino acids occurs in all the organs of the body but primarily inthe liver. In most other tissues the ammonia is converted to glutamine or alanine (inmuscle) before being transported to the liver and regenerated. In mammals the am-monia is then converted into urea.This is a two-stage process requiring a supply ofenergy in the form of ATP. The first stage is the formation of carbamoyl phosphatefrom carbon dioxide and ammonia in the presence of carbamoyl phosphatesynthetase:
2ATP 2ADP+Pi
Carbamoyl phosphatesynthetase
CO2 + NH4+ + H2O NH2 C.O~
O
P
The carbamoyl phosphate then reacts with ornithine to start a cycle of reactions re-sulting in the production of urea (Fig. 9.12).
The aspartate entering the cycle is produced by reaction of glutamate with ox-alacetate, the former being produced from �-ketoglutarate plus ammonia releasedby deamination of an amino acid. The oxalacetate is derived from the fumarate re-leased in the production of arginine from arginosuccinate, which enters the tricar-boxylic acid cycle and is converted to malate and then oxalacetate.We then have asecond associated cycle linking the urea and the tricarboxylic acid cycles, which maybe visualised as shown in Fig. 9.13.
In ruminant animals, ammonia is absorbed directly from the rumen and under-goes the same series of reactions. Most of the urea is excreted, but a certain amount,depending upon the nitrogen status of the animal, is recycled via saliva and directlyacross the rumen wall.
Arginosuccinate
Citrulline
Aspartate
ATP
AMP
Arginosuccinatesynthetase
Arginosuccinatelyase
Arginine
Fumarate
Arginase
Ornithine
H2O
Urea Carbamoylphosphate
Ornithinecarbamoyltransferase
Mg2+
Fig. 9.12 The urea cycle.

Chapter 9 Metabolism
212
In assessing the efficiency of energy production from amino acids, the energyneeded for urea synthesis must be set against that obtained by oxidation of the car-bon skeleton of the acid. If we take aspartate as an example, this is first converted tooxalacetate and glutamate by reaction with �-ketoglutarate. The oxalacetate is oxi-dised via the phosphoenolpyruvate pathway and the tricarboxylic acid cycle. Theglutamate is deaminated to regenerate �-ketoglutarate and the ammonia released isconverted to urea.A balance sheet may be prepared:
Arginine Ureacycle
Citrulline
Fumarate Aspartate
Arginosuccinate
Ornithine
Malate
NAD+ NADH + H+Oxalacetate
Glutamate
α-Ketoglutarate
Amino acid
NH4+
NADH + H+
GlutamatedehydrogenaseH2O + NAD+
TCAcycle
Fig. 9.13 Linkage of the urea and tricarboxylic acid cycles.
ATP � ATP �
2 moles aspartate to glutamate � oxalacetate 0 02 moles glutamate to �-ketoglutarate � ammonia 5 02 moles ammonia to glutamine 0 21 mole ammonia to carbamoyl phosphate 0 21 mole citrulline to arginosuccinate 0 21 mole malate to oxalacetate 2.5 01 mole ammonia to aspartate 0 2.52 moles oxalacetate to carbon dioxide and water 20 0Total 27.5 8.5Net gain from 2 moles of aspartate 19Net gain from 1 mole of aspartate 9.5

Protein synthesis
213
O
C.COO–
CH2
CH2.COO–
+ NH4+
+
+ NADPH(+H+)
Glutamatedehydrogenase
NH3
CH.COO–
CH2
CH2.COO–
+ NADP+ + H2O
α-Ketoglutarate Glutamate
NH3+
CH.COO–
CH2
CH2.COO–
ATP
NH3+
CH.COO–
CH2
CH2.CONH2
Glutamine synthetase
Glutamate
ADP+ Pi
Glutamine
+ NH4+
Glutamine is then involved in a series of reactions with ribose-5-phosphate, glycineand aspartate to give inosinic acid, which contains a purine nucleus. This series ofreactions may be represented as follows:
2 Glutamine + Glycine + Aspartate
8 ATP
Inosinic acid + Fumarate
The ribose-5-phosphate residue is then removed, giving hypoxanthine, whichundergoes two xanthine-oxidase-mediated oxidations to give xanthine and thenuric acid (Fig. 9.14).
Elimination of 2 moles of ammonia results in a net loss of 6 moles of ATP; in ad-dition, 2 moles of glutamate, 1 mole glycine and 1 mole aspartate are used up and 1 mole fumarate is produced.
9.2 PROTEIN SYNTHESIS
Proteins are synthesised from amino acids, which become available either from theend products of digestion or as the result of synthetic processes within the body.Direct amination may take place as in the case of �-ketoglutarate, which yieldsglutamate:
In birds, ammonia is excreted as uric acid.This involves the incorporation of am-monia into glutamine by reaction with glutamate:

Chapter 9 Metabolism
214
NH
CHN
C
CC
O
N
CHN
Ribose-5-
Ribose-5-
NH
CHN
C
CC
O
NH
CHN
Hypoxanthine
O2 + H2
H2O2
Xanthine oxidase
NH
CNH
C
CC
O
NH
CHN
Xanthine
O2 + H2
H2O2
Xanthine oxidase
O
NH
CNH
C
CC
O
NH
CHN
Uric acid
O
O
Inosinic acidP
P Phosphorylase
Fig. 9.14 Conversion of inosinic acid to uric acid.
The glutamate may undergo further amination to give glutamine but, more im-portantly, may undergo transamination reactions with various keto acids to giveamino acids as shown in Fig. 9.15.

Protein synthesis
215
Glutamate is the source material of proline, which contains a five-membered ringstructure. The synthesis of proline takes place in two stages and requires energy inthe form of reduced NAD� and NADP�:
Glutamate
Oxalacetate
Pyruvate
Alanine-amino transferase
α-Ketoglutarate
α-Ketoglutarate
α-Ketoglutarate
Alanine Aspartate
Asparagine Serine
ATP
ADP
Asparagine synthetase
Aspartateamino transferase
Phosphoserine
Phosphoserinephosphatase
3-Phosphohydroxypyruvate
Phosphoserine transaminase
Fig. 9.15 Amino acid synthesis from glutamate.
CH2~
C:O
COO–
3-Phosphohydroxypyruvate
CH2OH
CH.NH3+
COO–
Alanine
Pyruvate
Serine-pyruvate-amino transferase
Glycine
Glyoxalate
Serine-glyoxalate-amino transferase
Serine
P
Amino acids other than glutamate may undergo such transaminations to producenew amino acids. Thus, both alanine and glycine react with phosphohydroxypyru-vate to give serine:
COO–
CHNH2
CH2
COO–
NADH(+H+) NAD
ADPATP
CH2CH2
CH CH.COO–
N
NADPH(+H+) NADP+ CH2CH2
CH CH.COO–
NH
Glutamate Δ’-Pyrroline 5-carboxylate Proline
Amino acids may also be formed by the reaction of keto acids with ammoniumsalts or urea; arginine, as we have already seen, may be synthesised during the for-mation of urea.
Not all amino acids are capable of being synthesised in the body, and others arenot synthesised at sufficient speed to satisfy the needs of the body. Both these

Chapter 9 Metabolism
216
groups have to be supplied to the animal. Such amino acids are known as essentialor indispensable amino acids (see Chapter 4).The words ‘essential’ and ‘indispensa-ble’, as used here, imply not that other amino acids are not required for the well-being of the animal but simply that a supply of them in the diet is unnecessary.All ofthe 25 amino acids normally found in the body are physiological essentials; some 10or 11 are dietary essentials.As would be expected, the actual list of essential aminoacids differs from species to species. In cattle and sheep, bacterial synthesis of aminoacids in the rumen renders the inclusion of any specific amino acids in the diet un-necessary, except under conditions of intensive production, as with high-yieldingdairy cows and small animals making high weight gains.
Amino acids are absorbed from the gut into the bloodstream by active transportand transferred to the cells.This requires a supply of energy, since the concentrationof amino acids in the cell may be up to 100 times that in the blood and transfer intothe cell has to take place against a very considerable concentration gradient.A con-tinuous exchange takes place between the blood and cellular amino acids, but notbetween the free amino acids and those of the tissue proteins. The tissue proteinsthemselves undergo breakdown and resynthesis, but their stability varies betweendifferent tissues. For example, liver protein has a half-life of 7 days whereas collagenis so stable that it may be considered to be almost completely inert.
The process of protein synthesis may be divided conveniently into four stages:activation of individual amino acids, initiation of peptide chain formation, chainelongation and chain termination.
Activation
The first step is enzymatic and requires the presence of ATP to give complexes:
The amino-acyl group is then coupled to a molecule of transfer RNA (tRNA):
Both reactions are catalysed by a single Mg2�-dependent aminoacyl synthetase,specific for the amino acid and the tRNA.The synthetases discriminate between the20 naturally occurring amino acids but the specificity is not absolute.The tRNA mol-ecule is composed of a single nucleotide chain containing 73–93 ribonucleotides(see Chapter 4) and exhibits considerable folding stabilised by hydrogen bonding.At one end of the chain is the final nucleotide arrangement of –C—C—A—OH, i.e.cytidine–cytidine–adenosine.The amino acid is attached to the ribose of the terminaladenosine.The other end of the chain frequently terminates in the nucleotide guano-sine.We may visualise a typical tRNA molecule as shown in Fig. 9.16.
There is at least one tRNA for each amino acid but only one amino acid for a giventRNA. Since the terminal regions of the various tRNA species are so similar, their speci-ficity resides within the interior of the molecules. This arrangement consists of a se-quence of three bases (anticodon), present in the anticodon loop near the centre of thechain, the nature and arrangement of which are specific for a particular amino acid.
When the amino acid has been coupled to the tRNA it is carried to one of thesites of protein synthesis, the ribosomes.These form part of the structures known as
Aminoacyl– tRNA + AMP + enzymeAminoacyl–AMP–enzyme + tRNA
Amino acid + ATP + enzyme Aminoacyl–AMP–enzyme + pyrophosphate
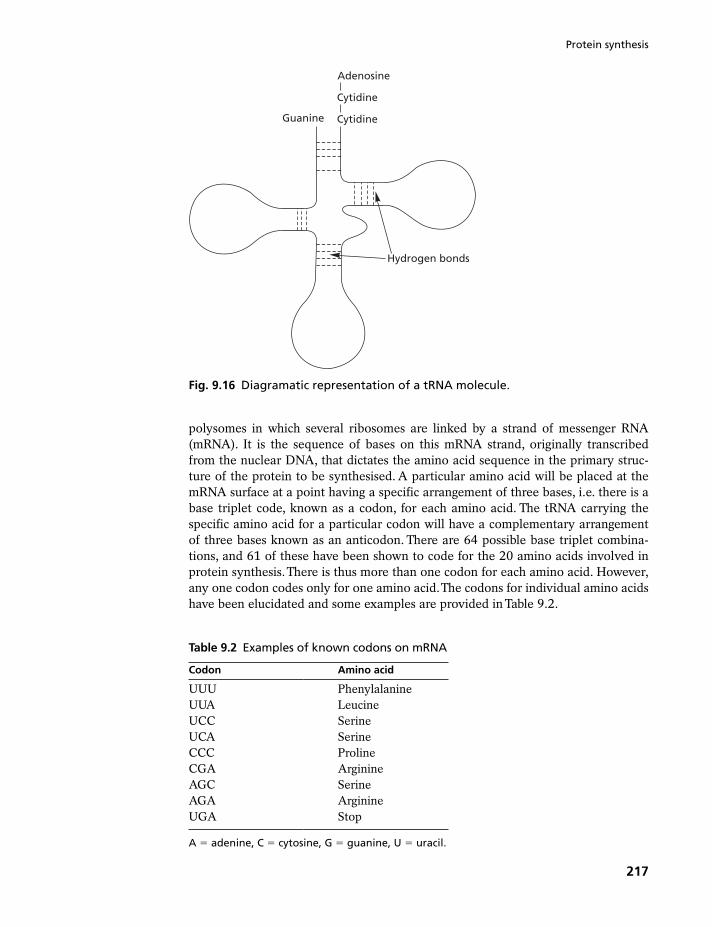
Protein synthesis
217
polysomes in which several ribosomes are linked by a strand of messenger RNA(mRNA). It is the sequence of bases on this mRNA strand, originally transcribedfrom the nuclear DNA, that dictates the amino acid sequence in the primary struc-ture of the protein to be synthesised. A particular amino acid will be placed at themRNA surface at a point having a specific arrangement of three bases, i.e. there is abase triplet code, known as a codon, for each amino acid. The tRNA carrying thespecific amino acid for a particular codon will have a complementary arrangementof three bases known as an anticodon. There are 64 possible base triplet combina-tions, and 61 of these have been shown to code for the 20 amino acids involved inprotein synthesis.There is thus more than one codon for each amino acid. However,any one codon codes only for one amino acid.The codons for individual amino acidshave been elucidated and some examples are provided in Table 9.2.
Adenosine
Cytidine
CytidineGuanine
Hydrogen bonds
Fig. 9.16 Diagramatic representation of a tRNA molecule.
Table 9.2 Examples of known codons on mRNA
Codon Amino acid
UUU PhenylalanineUUA LeucineUCC SerineUCA SerineCCC ProlineCGA ArginineAGC SerineAGA ArginineUGA Stop
A � adenine, C � cytosine, G � guanine, U � uracil.

Chapter 9 Metabolism
218
Initiation of peptide chain formation
The ribosomes of higher animals consist of two subunits designated 40S (Svedbergunits) and 60S, according to their sedimentation characteristics in an ultracentrifuge.These combine to form a functional 80S ribosome.
Initiation of peptide formation involves attachment of the smaller subunit to atRNA and the mRNA.The first tRNA codes for methionine and is placed at an AUGcodon (n) at the end of the mRNA chain (Phase 1 of Fig. 9.17).
The larger subunit becomes attached to form the complete ribosome, which isthen ready to accept the next tRNA–amino acid complex at codon n � 1 (Phase 2).The insertion of each amino acid residue requires the expenditure of one high-energy phosphate bond, as GTP.
Chain elongation
The requisite amino acid (AA2) is then placed at codon n � 1 by its specific tRNA, asshown in Phase 3 in Fig. 9.17.A peptide bond is then formed between AA1 (methio-nine) and AA2, and the tRNA for methionine is simultaneously ejected (Phase 4).Theribosome and the mRNA then move relative to one another; codon n � 1 is placed atthe position previously occupied by codon n and codon n � 2 moves into that previ-ously occupied by n � 1, as shown in Phase 5.The process is then repeated, with AA3being placed at n � 2, followed by formation of a peptide bond and movement of theribosome to expose codon n � 3. This continues until the chain is complete; eachmovement requires the expenditure of one high-energy bond in the form of GTP.
Termination
Chain elongation continues until a codon is reached that does not code for anyamino acid, i.e. UAA, UAG or UGA. It then ceases and the formed peptide chain isliberated by hydrolysis, which requires the rupture of one high-energy phosphatebond in GTP.The methionine residue is then removed enzymatically.
Large ribosomesubunit
Small ribosomesubunit
mRNA
nPhase 1
n+2 n+1 n+2 n+1 n+2n n n+1 n+2n n+1 n+2 n+3Phase 2 Phase 3 Phase 4 Phase 5
AA1 AA1 AA1 AA2AA1
AA2AA1
AA2
AA2
AA3
n+1
Fig. 9.17 Diagramatic representation of the sequence of events occurring in theribosome during the process of polypeptide synthesis.

Fat synthesis
219
Energy expended (kJ) Energy stored (kJ)
100 g amino acid 24372 moles ATP (activation) 170.81 mole GTP (initiation) 85.41 mole GTP (elongation) 85.41 mole GTP (termination) 85.4100 g protein 2437
2864 2437
Energetic efficiency � 2437�2864 � 0.85
NB The calculation assumes synchronous provision of the required amino acids; efficiency isprobably much less under normal conditions.
The polypeptide is the primary structure of the protein. The secondary structureinvolves twisting of the polypeptide chain to produce either an �-helix or a �-pleated sheet, both stabilised by hydrogen bonding.The tertiary structure involvesextensive coiling and folding of the chain and is again stabilised by hydrogen bond-ing, salt linkages and sulphur bridges.The quaternary structure involves polymerisa-tion of these basic units (see Chapter 4).
The mRNA forms a small proportion of the cell’s RNA and has only a transientexistence. In some microorganisms it may function as a template in synthesis 10–20times only; in mammalian tissues its active life may be much longer and in somecases it may persist for several days.
The mechanism of protein synthesis discussed above does not involve addition ofamino acids to preformed peptides; synthesis starts with an amino acid and apolypeptide chain is synthesised by the successive addition of single amino acids.Unless all the amino acids required to synthesise the peptide are present at the righttime, synthesis will not take place and the amino acids that are present are removedand may be catabolised. Considerable wastage of amino acids may thus take place ifan incomplete mixture is presented for synthesis.
Energy cost
During protein synthesis, energy is provided by hydrolysis of ATP and GTP, the pro-duction of each mole requiring the expenditure of 85.4 kJ by the body. If we makecertain assumptions, then an estimate of the energetic efficiency of protein synthesismay be made. Let us assume that the average gram molecular weight of amino acidsin a given protein is 100. In such a protein, the number of amino acids is large, say n,and the number of peptide bonds will be n - 1 but may be taken for all practical pur-poses as n.We may now construct an energy balance sheet as follows:
9.3 FAT SYNTHESIS
The glycerides (triacylglycerols) of the depot fat are derived from preformed glyc-erides or may be synthesised in the body from fattyacyl-CoAs and L-glycerol-3-phosphate.This can take place in most tissues but is confined mostly to the liver andadipose tissue.

Chapter 9 Metabolism
220
Synthesis of fattyacyl-CoAs
It is generally considered that there are three systems of fatty acid synthesis. Thefirst, which is highly active, is centred in the cell cytoplasm and results mainly in theproduction of palmitate from acetyl-coenzyme A or butyryl-coenzyme A. Nearly allother fatty acids are produced by modification of this acid.The second system occurschiefly in the endoplasmic reticulum and to a minor extent in the mitochondria. Itinvolves elongation of fatty acid chains by two-carbon addition, with malonyl-CoAas donor. The third system, confined to the endoplasmic reticulum, brings about desaturation of preformed fatty acids.
Cytosolic synthesis of palmitate
In non-ruminant animals, acetyl-coenzyme A is mainly produced in the mitochon-dria by oxidative decarboxylation of pyruvate produced from glucose by glycolysis(see p. 199), but also by oxidative degradation of amino and fatty acids. It must then
BOX 9.1 Genetic engineering
Recombinant DNA technology allows the spitting off of a DNA fragment containing a gene of inter-est and its linkage to a DNA molecule capable of self-replication.This can then be propagated by in-troduction into a living cell, such as a bacterium, and the characteristics for which the gene codesconferred to that cell. Early successes of this technique included the cloning and expression inEscherichia coli of a gene coding for human insulin, and the gene coding for rat growth hormone inmice. Such genetically modified animals are known as transgenic animals.
The introduction of genes that alter inherent biochemical pathways in organisms may be of sig-nificant interest in the nutrition of animals, since it could confer to them some ability that they didnot previously possess such as producing essential nutrients. For example:
■ The amino acid cysteine is essential for wool growth in sheep, which need a source of methionineto synthesise it. Certain bacteria have the ability to synthesise cysteine, with the pathway involv-ing the action of two enzymes, serine transacetylase and O-acetylserine sulphydralase. Thegenes coding for these enzymes have been successfully introduced into sheep, which then ex-press the appropriate pathways but, so far, only in inappropriate tissues.
■ Genes for biosynthesis of the essential amino acids threonine and lysine from aspartate havebeen successfully introduced into mouse cells as a preliminary to their introduction into the piggenome.
■ Transgenic mice have been produced that show pancreatic cellulase activity.The potential impor-tance of this achievement for improving digestion in monogastric animals is self-evident.
■ Gene transfer has already been used to introduce cellulase activity into hind gut bacteria. If theability to show cellulase activity under highly acid conditions could be conferred to rumenmicroorganisms, then it could have a significant effect in ameliorating the detrimental effects ofhigh-level concentrate feeding on fibre digestion and forage intake. The transgenic organismswould of course have to compete with the native rumen flora if they were to be successful inpractice.

Fat synthesis
221
be transported into the cell cytoplasm for fatty acid synthesis to take place. How-ever, the mitochondrial membrane is impervious to acetyl-CoA, which has to becomplexed with carnitine or changed to citrate before transport into the cytoplasm.Regeneration of acetyl-CoA then takes place as follows:
In the ruminant animal, acetate is absorbed directly from the gut and is changedto acetyl-CoA, in the presence of acetyl-CoA synthetase (see p. 206), in the cell cy-toplasm. This is the major source of acetyl-CoA in ruminants, in which ATP-citratelyase activity is greatly reduced and passage of mitochondrial acetyl-CoA to thecytoplasm is limited.
The system is active in liver, kidney, brain, lung, mammary gland and adipose tis-sue.The requirements of the system are reduced NADP�,ATP, HCO3
- as a source ofcarbon dioxide, and manganese ions. The first stage is the transformation of acetyl-coenzyme A to malonyl-coenzyme A:
Citrate � Coenzyme AATP-citrate lyase
ATP ADP
Acetyl-CoA � Oxalacetate
The malonyl-coenzyme A then reacts with acyl-carrier protein (ACP), in the pres-ence of malonyl-CoA-ACP transacylase, to give the malonyl–ACP complex.Acetyl-coenzyme A is then coupled with ACP in the presence of acetyl-CoA-ACPtransacylase, and this reacts with the malonyl–ACP, the chain length being increasedby two carbon atoms to give the butyryl–ACP complex. The reactions involved areshown in Fig. 9.18.
The butyryl–ACP complex then reacts with malonyl–ACP complex, resulting infurther elongation of the chain by two carbon atoms to give caproyl–ACP. Chainelongation takes place by successive reactions of the fattyacyl–ACP complexes withmalonyl–coenzyme A until the palmitoyl–ACP complex is produced, when it ceases.Palmitic acid is liberated by the action of a specific deacylase. The overall reactioncan be presented as:
CH3.COS.CoA + 7COO–.(CH2)COS.CoA + 14NADPH(+H+)
Acetyl-CoA Malonyl-CoA
CH3.(CH2)14.COO– + 7CO2 + 14NADP+ + 6H2O + 8HS.CoA
Palmitate Coenzyme A
CH3 � ATP � H2O � CO2
COS.CoA
Acetyl-CoA carboxylase
Mn2+CH2 � ADP � Pi
COS.CoA
COOH

Chapter 9 Metabolism
222
In assessing the energy requirements of the process, the energy cost of producingmalonyl-coenzyme A from acetyl-coenzyme A must be taken into account and canbe presented as:
COOH.CH2.COS.ACPMalonyl–ACP
CH3.COS.ACPAcetyl–ACP
+
CO2β-Ketoacyl-ACP synthase
CH3.CO.CH2.COS.ACP
Acetoacetyl–ACP
NADPH(+H+)
β-Ketoacyl-ACP reductase
β-Hydroxybutyryl–ACP
CH3.CHOH.CH2.COS.ACP
NADP+
NADPH(+H+)
Crotonyl-ACP hydratase
CH3.CH.CH.COS.ACP
Crotonyl–ACP
Enoyl-ACP reductase
H2O
CH3.CH2.CH2.COS.ACP
NADP+
Butyryl–ACP
Fig. 9.18 Cytosolic synthesis of fatty acids.
8Ac-CoA + 7ATP + 14NADPH(+H+)
C15H31.COO– + NADP+ + 7ADP + 6H2O + 7Pi
The mammary gland contains deacylases specific for short- and medium-chainacyl complexes, and acids of these chain lengths appear in milk fat.
Chain elongation
This system involves the incorporation of two carbon units into medium- and long-chain fatty acids and requires ATP and reduced NADP�.The pathway is illustrated inFig. 9.19.

Fat synthesis
223
The preferred substrate is palmitoyl-CoA, and in most tissues the product isstearate. Long-chain saturated acids with 18, 20, 22 and 24 carbon atoms are synthe-sised in the brain, where they are required as components of the brain lipids.
A mitochondrial system for elongation of fatty acid chains, using acetyl-CoA asthe two-carbon donor does exist but has limited activity with acyl-CoA substrateswith 16 or more carbon atoms and is probably concerned with the lengthening ofshorter chains.
Desaturation of preformed fatty acids
Double bonds may be introduced into fatty acid chains by the action of fattyacyl-CoA desaturases present in the endoplasmic reticulum. Thus, palmitoleic and oleicacids are produced from the corresponding saturated acids by a �9-desaturase
Fig. 9.19 Elongation of the fatty acid chain.
R.CH2.COO–
Fatty acid
ATP
AMP+PPi
Coenzyme AAcyl-CoA ligase
R.CH2.COS.CoA
Fatty acyl-coenzyme A
Malonyl-CoA
Coenzyme A
β-Ketoacyl-CoA synthase
R.CH2.CO.CH2.COS.CoA
β-Ketoacyl-coenzyme A
NADPH (+H+)
β-Ketoacyl-CoA reductase
NADP+
R.CH2.CHOH.CH2.COS.CoAβ-Hydroxyacyl-coenzyme A
H2O
Enoyl-CoA hydratase
R.CH2.CH:CH.COS.CoA
Enoyl-coenzyme A
NADP+
R.CH2.CH2.CH2.COS.CoA
Fatty acyl-coenzyme A
2,3-Unsaturated acyl-CoA reductaseNADPH (+H+)

Chapter 9 Metabolism
224
Synthesis of L-glycerol-3-phosphate
The usual precursor is dihydroxyacetone phosphate produced by the aldolase reac-tion of the glycolytic pathway. This is reduced by the NAD-linked glycerol-3-phosphate dehydrogenase:
It may also be formed from free glycerol, absorbed from the gut or arising fromcatalysis of triacylglycerols, in the presence of glycerol kinase.The reaction requiresthe expenditure of a high-energy bond as ATP.White adipose tissue does not containsignificant amounts of glycerol kinase, and so most glycerol phosphate is made avail-able by glycolysis.
Synthesis of triacylglycerols
The first stage is the acylation, in the presence of glycerol-3-phosphate acyl-transferase, of the free alcohol groups of the glycerol-3-phosphate by two moleculesof fattyacyl-CoA to yield a phosphatidic acid:
CH2
C:O
CH2O~
NAD+
Glycerol-3-phosphatedehydrogenase
Dihydroxyacetonephosphate
NADH(+H+)
CH2OH
CHOH
CH2O~
L-Glycerol-3-phosphate
P P
OH
H2O
CH3.(CH2)6.CH2.CH2.(CH2)6.COO–
Palmitate
CH3.(CH2)6.CH:CH.(CH2)6.COO–
Palmitoleate
O2
NAD+NADH(+H+)
Mammalian cells also contain �6 and �5 desaturases but do not have systemscapable of introducing double bonds beyond carbon atom 9. As a result it is notpossible for mammalian tissues to synthesise either linoleic acid (18:2�9,12) or �-linolenic acid (18:3�9,12,15).These have to be provided in the diet and are referred toas essential fatty acids (EFA). Once they have been ingested, a range of acids, includ-ing �-linolenic, arachidonic, eicosapentaenoic and docosahexanoic acids, can be syn-thesised from them by successive chain elongation and �6 and/or �5 desaturations(see Fig. 3.1 in Chapter 3).
system, steroyl-CoA desaturase, which introduces a double bond between carbonatoms 9 and 10.The system is confined to acids with a chain length of 15 or greater.

Fat synthesis
225
CH2OH
CHOH
CH2O~ P
CH2.OCO.R1
CHOH
CH2O~ P
CH2.OCO.R1
CHOCO.R2
CH2O~ P
L-Glycerol-3-phosphate Monoacylglycerol-3-phosphate Diacylglycerol-3-phosphate
R1.COS.CoA HS.CoA R2.COS.CoA HS.CoA
CH2OCO.R1
CHOCO.R2
CH2O~ P
Triacylglycerol
CH2OCO.R1
CHOCO.R2
CH2OH
Phosphatidatephosphatase
H2O Pi R3.COS.CoA HS.CoA
CH2OCO.R1
CHOCO.R2
CH2OCO.R3
DiacylglycerolDiacylglycerol-3-phosphate
Diacylglycerolacyltransferase
The reaction occurs preferentially with acids containing 16 and 18 carbon atoms.The phosphatidic acid is then hydrolysed to give a diacylglycerol, which reacts witha third fattyacyl-CoA to give a triacylglycerol:
Direct synthesis of triacylglycerols from 2-monoacylglycerols, arising from lipiddigestion in the intestine, takes place in the intestinal mucosa of higher animals.
Energy cost
The efficiency of fat synthesis may be calculated from the pathways described. Thecalculation for the synthesis of tripalmitin by the cytoplasmic system would be:
Energy
expended (kJ)
Energy
stored (kJ)
8 moles acetate 6996.08 moles acetate to acetyl-CoA 1366.47 moles acetyl-CoA to malonyl-CoA 597.87 additions of malonyl-CoA 3348.3Energy for 1 mole of palmitate 12 308.5Energy for 3 moles palmitate 36 925.50.5 mole of glucose 1435.00.5 mole glucose to dihydroxyacetone phosphate 85.41 mole dihydroxyacetone phosphate to
1 mole L-glycerol-3-phosphate 256.2Energy for 1 mole L-glycerol-3-phosphate 1776.6Total energy for 1 mole tripalmatin 38 702.1Energy stored in 1 mole tripalmatin 32 025.0
Efficiency of synthesis � 32 025.0�38 702.1 � 0.83

Chapter 9 Metabolism
226
Glucose cannot be produced from pyruvate by a simple reversal of the glycolyticsequence since three of the reactions, namely:
■ the conversion of glucose to glucose-6-phosphate,■ the conversion of fructose-6-phosphate to fructose 1,6-diphosphate, and■ the conversion of phosphoenolpyruvate to pyruvate,
are so highly exergonic as to be irreversible under normal cell conditions.In gluconeogenesis, the conversion of pyruvate to phosphoenolpyruvate is
achieved by a two-stage process involving:
■ pyruvate carboxylase, which converts pyruvate to oxalacetate (in non-ruminantanimals the enzyme is located in the mitochondria and conversion of pyruvate tooxalacetate can only occur in this location);
■ phosphoenolpyruvate carboxykinase, which converts oxalacetate to phospho-enolpyruvate.
CH3
CHOH
COO– NAD+
CH3
C:O
COO–
Lactate dehydrogenase
Lactate Pyruvate
NADH(+H+)
9.4 CARBOHYDRATE SYNTHESIS
Glucose
Glucose is an important substrate and energy source in animal tissues:
■ in the metabolism of nervous tissue and erythrocytes;■ as the source of glycerol-3-phosphate for fat synthesis;■ for the maintenance of blood sugar levels;■ for the maintenance of glycogen reserves especially in the liver and muscle;■ as the source of oxalacetate to allow oxidation of acetyl-CoA;■ to allow clearing of lactate and glycerol;■ as the precursor for other carbohydrates.
In non-ruminant animals, glucose becomes available as the result of carbohydrate di-gestion.When this source is inadequate, glucose may be synthesised from a variety ofnon-carbohydrate sources, mainly lactate, glycerol and glucogenic amino acids (gluco-neogenesis). In ruminant animals, little or no glucose becomes available as an end prod-uct of digestion; the demands for glucose do not, however, differ significantly fromthose of the non-ruminant.As a result ruminant animals have developed highly efficientglucose conservation and gluconeogenic mechanisms.As in the non-ruminant, glucosemay be synthesised from glycerol, lactate and the glucogenic amino acids, but the majorsource is propionate (about 90 per cent of which is used for glucose synthesis).
Lactate as a source of glucose
The first step in the production of glucose from lactate is its conversion to pyruvateby lactate dehydrogenase:

Carbohydrate synthesis
227
2 Oxalacetate
2 Phosphoenolpyruvate
2 Glyceraldehyde-3-phosphate
Fructose-1-6-bisphosphate
Fructose-6-phosphate
Glucose-6-phosphate
Glucose
2 Pyruvate
NADH(+H+)
NAD+
Pi
Pi
2 ATP
2 ADP
2 GTP
2 GDP
2 ATP
2 ADP
Fructose-1-6-bisphosphatase
Phosphoenolpyruvate carboxykinase
Pyruvate carboxylase
Glucose-6-phosphatase
Dihydroxyacetonephosphate
Reverseglycolysis
Reverseglycolysis
Fig. 9.20 Gluconeogenesis from pyruvate.
The latter may take place in the mitochondria and the phosphoenolpyruvate thenpasses into the cell cytoplasm. Alternatively, oxalacetate may be transferred into thecell cytoplasm by means of the glutamate–aspartate shuttle and converted to phospho-enolpyruvate by cytoplasmic phosphoenolpyruvate carboxykinase. In the ruminantanimal, pyruvate carboxylase is located in the cell cytoplasm as well as the mitochon-dria, and pyruvate can be changed to phosphoenolpyruvate entirely in the cytoplasm.
In the cell cytoplasm, the phosphoenolpyruvate is converted to fructose 1,6-diphosphate by the reverse of stages 10–5 of the glycolytic sequence (see Fig. 9.4).This is then changed to fructose-6-phosphate by fructose-1,6-diphosphatase andthen to glucose-6-phosphate by the reverse of stage 2.The final change to glucose isachieved by glucose-6-phosphatase.The whole process is illustrated in Fig. 9.20.
Amino acids as sources of glucose
Catabolism of amino acids, except for leucine and lysine, results in synthesis of tri-carboxylic acid cycle intermediates or the production of pyruvate (see p. 210). Con-version of the latter into glucose then takes place as shown in Fig. 9.20. Thetricarboxylic acid cycle intermediates enter the cycle and are converted into malate,

Chapter 9 Metabolism
228
Propionate Amino acids Lactate
Succinate TCAintermediates
Pyruvate
Malate Oxalacetate
Phosphoenolpyruvate
Glyceraldehyde-3-phosphate
Glycerol
Dihydroxy-acetone phosphate
Glucose
Fig. 9.21 Major pathways of gluconeogenesis.
which crosses into the cell cytoplasm, where it is converted into oxalacetate bymalate dehydrogenase:
The oxalacetate enters the glucogenic pathway.
Glycerol as a source of glucose
Glycerol is first phosphorylated, by glycerol kinase, to glycerol-3-phosphate. This isoxidised, by glycerol-3-phosphate dehydrogenase, to dihydroxyacetone phosphate,which enters the glucogenic pathway.
Propionate as a source of glucose
Propionate is first changed to succinyl-CoA (see Fig. 9.7). This enters the tricar-boxylic acid cycle and is converted to malate and leaves the mitochondria as such.Conversion to glucose then takes place via the usual route through oxalacetate andphosphoenolpyruvate.
The major pathways of gluconeogenesis are represented in Fig. 9.21.Consideration of the energy changes involved in the various metabolic pathways
shows that it involves a considerable demand for energy (Table 9.3).In non-ruminant animals, amino acids and lactate form the major sources for glu-
coneogenesis; in ruminant animals, propionate is pre-eminent. Under normal feeding
COO–
CHOH
CH2 NAD+
Malate dehydrogenase
Malate Oxalacetate
COO–
C:O
CH2NADH (+H+)
COO– COO–

Carbohydrate synthesis
229
Table 9.3 Energy cost of gluconeogenesis
Source Input Energy cost (kJ) Energy retained (kJ) Efficiency
Aspartate 2 moles + 10 ATP 3968 2870 0.72Propionate 2 moles + 4 ATP 3248 2870 0.88Lactate 2 moles + 6 ATP 3246 2870 0.88Glycerol 2 moles - 4 ATP 2982 2870 0.96
Glycogen synthesis
Glycogen is a complex polysaccharide made up of condensed glucose residues (seeChapter 2) and has the ability to add on further glucose units when they becomeavailable within the body. The actual source material for glycogen synthesis is uri-dine diphosphate glucose (UDPG), which is produced from a variety of sources asshown in Fig. 9.22.
Glycogen is produced by the reaction of uridine diphosphate glucose with primermolecules, the most active of which is glycogen itself. Molecules with as few as fourglucose residues may serve as primers, but the reaction rate is slow.As the complex-ity of the primer increases, so does the reaction rate. Synthesis involves the reaction
Galactose
ATPATP
Glucose Fructose
ATP
Phosphoglucomutase
Glucokinase Fructokinase
GalactokinaseGlucose-
6-phosphateFructose-
6-phosphateMannose-
6-phosphate
Mannose
ATP
Mannokinase
Glucose-1-phosphate
Galactose-1-phosphate
UTPGlucose-1-phosphate
uridyltransferasePPi
UDP glucose-4-epimerase
Galactose-1-phosphateuridyltransferase
ADP+ Pi
Uridinediphosphate galactose
Uridinediphosphate glucose
ADP+ Pi
ADP+ Pi
ADP+ Pi
Fig. 9.22 Formation of uridine diphospate glucose.
conditions propionate probably provides about 70 per cent of the glucose require-ment of ruminant animals, but it becomes of lesser importance as the level of feed-ing falls. Under starvation conditions its contribution approaches zero and glycerolbecomes of major significance in gluconeogenesis.

Chapter 9 Metabolism
230
ATP
UTP
ADP+Pi
PPi
Hexokinase
D-Glucose-6-phosphate
D-Glucose-1-phosphate
Uridine diphosphate D-glucose
Uridine diphosphate D-galactose
Phosphoglucomutase
D-Glucose
Glucose-1-phosphate uridyltransferase
UDP-glucose 4-epimerase
Fig. 9.23 Conversion of glucose to uridine diphosphate galactose.
of uridine diphosphate glucose with the fourth hydroxyl group of the non-reducingend of the primer chain in the presence of glycogen synthase:
UDP-glucose � (glucose)nGlycogen synthase (glucose)n�1 � UDP
The 1,6 linkages responsible for the branching within the glycogen molecule areformed by transfer of a terminal oligosaccharide fragment of six or seven glucoseresidues from the end of the glycogen chain to a 6-hydroxyl group in a glucoseresidue in the interior of the chain.This takes place in the presence of branching en-zyme or, more correctly, amylo-(1,4-1,6) transglycosylase.
Lactose synthesis
Lactose (milk sugar) is produced in large quantities in the mammary gland of lactat-ing animals. It is formed by condensation of one glucose and one galactose molecule.A supply of glucose is readily available, but the galactose has to be synthesised,virtually in its entirety, from glucose, and this involves a configurational change atcarbon atom 4.The glucose is first converted to glucose-1-phosphate and then to uri-dine diphosphate glucose, from which uridine diphosphate galactose is produced bythe action of UDP-galactose-4-epimerase, as shown in Fig. 9.23.
Lactose is then formed by the action of the UDP-D-galactose with glucose in thepresence of the lactose synthetase system:
UDP-galactose � D-glucose Lactose synthetase
UDP � lactose
The synthetase system is a complex of the enzyme galactosyl transferase with �-lactalbumin. The enzyme catalyses the attachment of galactose to protein contain-ing a carbohydrate residue; �-lactalbumin alters the specificity of the enzyme sothat it catalyses the linkage of galactose to glucose. The enzyme is present in thenon-lactating gland but is only feebly active.With the onset of lactation, �-lactalbuminis produced in the gland and in its presence the enzyme becomes highly active in

Carbohydrate synthesis
231
Energy
expended (kJ)
Energy
stored (kJ)
2 moles glucose 56062 moles glucose to 2 moles glucose-1-phosphate 170.81 mole glucose-1-phosphate to uridine diphoshate
galactose85.4
Energy required for 1 mole lactose 5862.2Energy retained in 1 mole lactose 5648.4
Energetic efficiency � 5648.4�5862.2 � 0.96
BOX 9.2 Metabolic disease
Metabolic disease results from metabolic stress caused when metabolic outputs exceed inputs, meta-bolic inputs exceed outputs, or a breakdown occurs in the processing system.
A typical example of a metabolic disease arising when metabolic output exceeds input is ketosis.Ketosis occurs in ruminant animals that have a high demand for glucose, such as dairy cows in earlylactation, where glucose is required for lactose synthesis in the udder, and ewes in late pregnancy,where glucose is required as an energy source for the developing fetus. In both cases, oxaloaceticacid is used preferentially for glucose synthesis via gluconeogenesis and is therefore not available tocombine with acetyl-CoA in the tricarboxylic acid cycle.The problem is often exacerbated becauseanimals are in negative energy balance and therefore mobilising body fat as a source of energy.Theacetyl-CoA arising from body fat mobilisation cannot be utilised efficiently owing to a lack of ox-aloacetic acid and is therefore converted to acetoacetate, D-�-hydroxybutyrate and acetone (ketonebodies), which accumulate in the bloodstream and become toxic.
An example of a metabolic disease arising when metabolic input exceeds output is NH3 toxicity.Amino acids and nitrogen in the bloodstream in excess of requirements are transported to the liver,where they are deaminated. Under the influence of glutamate dehydrogenase, the NH4 is combinedwith �-ketogluterate to produce glutarate. If ruminant animals are fed on high-protein diets, whererumen-degradable nitrogen (RDN) is provided in excess of the requirements for microbial proteinsynthesis or fermentable energy (FME) is deficient, then excess nitrogen may be absorbed across therumen wall into the bloodstream, taken to the liver, and converted to glutamate before excretionvia the urea cycle. However, the conversion of NH4 to glutarate depletes the available pool of �-ketogluterate and impairs the activity of the tricarboxylic acid cycle, resulting in reduced ATPformation and ammonia toxicity.
The metabolic role of many minerals and vitamins is as prosthetic groups or coenzymes in differ-ent enzyme systems. Consequently, mineral and vitamin deficiencies can cause a breakdown of theprocessing system and precipitate metabolic disease. For example, methylmalonyl-CoA isomerase(see p. 203) is an important vitamin B12-dependent enzyme in the gluconeogenic pathway. A defi-ciency of vitamin B12 (or cobalt) may reduce enzyme activity, decrease the efficiency of glucose syn-thesis and predispose the animal to ketosis. Similarly, ceruloplasmin is a copper-dependent enzymeresponsible for releasing iron from cells into blood plasma.A copper deficiency may reduce cerulo-plasmin activity, decrease the efficiency of iron utilisation for haemoglobin synthesis and predisposethe animal to anaemia.
catalysing the linkage.The energetic efficiency of lactose synthesis may be assessedas follows:

Chapter 9 Metabolism
232
Estimates of the energetic efficiency of the various synthetic processes presented,although interesting, should not be given too much weight since their validity de-pends on a number of factors, including assumptions of complete coupling underideal conditions, the availability of different substrates, and uncertainly with regardto ATP yield from the oxidation of NADH and FADH via oxidative phosphorylation.
9.5 CONTROL OF METABOLISM
An organism must adjust to a constantly changing internal and external environment.In order to achieve this, efficient intercellular communication has to be established.Such communication is vested in two distinct but integrated systems. The first is thenervous system with a fixed physical framework; the second is the endocrine systemutilising hormones that are transported from the secreting glands to various target tis-sues.The integration of the two systems is well illustrated by two examples: vasopressinis synthesised in the hypothalamus and is transported along nerve fibres to the pituitarygland, from which it is secreted; on the other hand, certain hormones such as insulinand adrenocorticotropic hormone (ACTH) have receptor sites within the brain. Hor-mones do not initiate processes but exert their control by regulating existing processes.This they do by influencing the rates of synthesis and breakdown of enzymes and by af-fecting the efficiency of enzyme catalysis and the permeability of cell membranes.
At the cellular level, chemical processes must take place at rates consistent withthe needs of the whole organism. This is achieved by control of enzyme activity,which depends upon:
■ the amount of enzyme available, which is the result of enzyme synthesis andbreakdown;
■ the presence of the enzyme in an active or inactive (proenzyme) form.Action ofthe enzyme then depends upon the presence of certain proteolytic agents, whichexpose or create active sites on the proenzyme.The enzymes concerned in diges-tion and blood clotting are typical examples;
■ the compartmentalisation of specific processes within the cytoplasm or organellesof the cell, brought about by the impermeability of membranes to the passage ofcertain metabolites; for example, fat synthesis takes place in the cell cytoplasm,whereas fat oxidation is limited to the mitochondria, and the futile cycling thatwould take place were the two processes to occur in the same locus is obviated.The impermeability may be overcome by shuttle systems that require cytoplasmicand organelle forms of the same catalytic activity.This provides a measure of finecontrol via the availability of substrate;
■ the presence of proteins that bind to enzymes and inhibit their activity, and ofsubstances that complex with, and render unavailable, metal ions essential for theactivity of specific enzymes;
■ the presence of proteins that alter the specificity of the enzyme; the role of �-lactalbumin in the case of galactosyl transferase is a good example – the level of�-lactalbumin is under hormonal control and therefore so is lactose synthesis;
■ the operation of feedback inhibition, probably the most common regulatorymechanism operating in metabolism. In this case, the activity of an enzyme is in-hibited by the presence of an end product of the reaction or pathway. In the syn-thesis of valine from pyruvate, for example, the first step is the formation of

Summary
acetolactate, catalysed by acetolactate synthetase.The activity of this enzyme andthe rate of valine formation are reduced by the presence of valine.A similar situ-ation arises when accumulation of an end product affects the rate of a reaction orpathway by a simple mass action effect. For example, the rate of glucose break-down via the gylcolytic pathway is controlled by the reaction
When ATP is being consumed rapidly, its breakdown ensures a plentiful supply ofADP and phosphoric acid; the reaction thus proceeds rapidly from left to right. If, onthe other hand,ATP is not being used, the supply of ADP and inorganic phosphate isreduced and so is the speed of the reaction.
1,3-diphosphoglycerate + ADP + Pi : 3-phosphoglycerate + ATP
SUMMARY
1. Metabolism is the name given to the se-quence or succession of chemical reactionsthat take place in living organisms. It involvesboth the synthesis (anabolism) and break-down (catabolism) of complex compounds.
2. Exergonic (catabolic) reactions release energyand endergonic (anabolic) reactions requirean input of energy. The two are linked bymediating compounds, the most importantof which is adenosine triphosphate (ATP).
3. ATP is produced from a number of energysubstrates by either substrate-level or oxida-tive phosphorylation. Glucose is oxidised viathe glycolytic pathway and the tricarboxyliccycle.
4. Glycogen is the main storage carbohydratein the animal’s body. It is first broken downto give glucose, which is then oxidised asdescribed. Acetic, propionic and butryricacids are metabolised in the tricarboxylicacid cycle.
5. Fat is the primary energy store in the body.Energy is released by lipolysis, followed by �-oxidation of the fatty acids. The glycerolis changed to glucose before oxidation.
6. Amino acids may be used as sources of en-ergy when in excess or when other forms ofenergy are deficient. The process involvesexcretion of the nitrogen as urea and isrelatively inefficient.
7. Protein synthesis requires activation of aminoacids, initiation of chain formation, chainelongation and termination, all of whichhave an energy cost.
8. Fatty acid synthesis occurs in the cell cyto-plasm and produces palmitic acid. The addi-tion of two-carbon units to preformed long-and medium-chain fatty acids takes place atthe endoplasmic reticulum, as does desatura-tion. However, mammals are incapable of in-troducing double bonds beyond carbon atom9 (see Chapter 3).
9. Lactose is synthesised from glucose and galac-tose in the mammary gland by a complex en-zyme system that is �-lactalbumin-dependent.
10. Glucose is central in a large number of meta-bolic processes. In monogastric animals, it isobtained by direct absorption from the smallintestine. In ruminant animals, this does nottake place and highly efficient gluconeogenicand glucose-conserving mechanisms havebeen developed.
11. On a whole-body basis, metabolism is con-trolled by an integrated system consisting ofa nervous system with a fixed physical struc-ture and an endocrine system secreting hor-mones that travel to various target tissues. Atthe cellular level, control is exerted by manip-ulation of the active enzyme supply and byfeedback inhibition.
233

FURTHER READING
Berg M J,Tymoczko J I and Stryer L 2006 Biochemistry, 6th edn, New York,W H Freeman.
Devlin T M (ed.) 1997 Textbook of Biochemistry with Clinical Correlations, 4th edn, NewYork, John Wiley & Sons.
Mathews C K and van Holde K E 1999 Biochemistry, 3rd edn, Redwood City, CA, BenjaminCummings Publishing Co.
Murray R K, Granner D K, Mayes P A and Rodwell V W 1993 Harper’s Biochemistry, 23rd edn,Norwalk, CT Appleton and Lange.
Chapter 9 Metabolism
234

PART 3
Quantifying the nutrient content offoods: digestibility, energy and proteinvalues
Part 2 described how animals obtain and utilise nutrients from foods. This part is concernedwith quantifying the amounts of nutrients supplied.
Chapter 10 describes ways of quantifying the digestion of nutrients over the whole digestivetract and for different sections using a range of digestibility techniques and then considers thefactors that affect digestibility.
Not all of the energy supplied by foods is available to the animal. There are losses associatedwith both digestion and metabolism. Chapter 11 discusses these losses and the methods usedto measure the efficiency of energy use by animals.
As a consequence of their differing digestive systems and related metabolism, differentsystems are used for expressing the energy value of foods according to the type of animalconcerned. Chapter 12 describes these systems and the methods used to predict the energyvalue of foods.
Chapter 13 examines the protein value of foods and the measures used to quantify proteinsupply to both monogastric and ruminant animals, which, again, differ as a consequenceof their digestive systems. Details are given of the current protein evaluation systems usedin the UK.


237
10.1 Measurement of digestibility
10.2 Validity of digestibility coefficients
10.3 Digestibility in different sections of the digestive tract
10.4 Factors affecting digestibility
10.5 Measurement of mineral availability
This chapter marks a change from qualitative to quantitative nutrition. The chapterspreceding it have shown which substances are required by animals, how they aresupplied from foods and the manner in which they are utilised. This chapter and thosefollowing it are concerned with the assessment of (1) the quantities in which nutrientsare supplied by foods, and (2) the quantities in which they are required by differentclasses of farm animal.
The potential value of a food to supply particular nutrients can be determined bychemical analysis. However, the actual value of the food to the animal can be deter-mined only after making allowances for the inevitable losses that occur during diges-tion, absorption and metabolism. The first and most important loss of nutrients isrepresented by the proportion that is not absorbed but is excreted in the faeces.
The digestibility of a food is most accurately defined as the proportion that is notexcreted in the faeces and that is, therefore, assumed to be absorbed by the animal. It iscommonly expressed in terms of dry matter and as a coefficient or a percentage. Forexample, if a cow ate 9 kg of hay containing 8 kg of dry matter and excreted 3 kg of drymatter in its faeces, the digestibility of the hay dry matter would be:
Digestibility coefficients can be calculated in the same way for each constituent ofthe dry matter. Although the proportion of the food not excreted in the faeces is com-monly assumed to be equal to that which is absorbed from the digestive tract, there areobjections to this assumption, which will be discussed later.
8 - 38
= 0.625 or 8 - 3
8* 100 = 62.5%
10 Evaluation of foods: digestibility

Chapter 10 Evaluation of foods: digestibility
238
10.1 MEASUREMENT OF DIGESTIBILITY
Digestibility trials
In a digestibility trial, the food under investigation is given to the animal in knownamounts and faecal output is measured. More than one animal (typically four) areused, because animals, even of the same species, age and sex, differ slightly in theirdigestive ability, and because replication allows more opportunity for the detectionof experimental error.
In trials with mammals, male or castrated animals are preferred to females be-cause it is then easier to separate the faeces from the urine. The animals should bedocile and in good health. Small animals can be confined in metabolism cages, whichfacilitate the separation of faeces and urine by an arrangement of sieves, but largeranimals such as cattle and sheep are fitted with harnesses and faeces-collection bagsmade of rubber or a similar impervious material. For females a bladder catheter canbe used to separate the urine from the faeces.
For poultry, the determination of digestibility is complicated by the fact that fae-ces and urine are voided from a single orifice, the cloaca.The compounds present inurine are mainly nitrogenous, and faeces and urine can be separated chemically ifthe nitrogenous compounds of urine can be separated from those of faeces.The sep-aration is based on the fact either that most urine nitrogen is in the form of uric acid,or that most faecal nitrogen is present as true protein. It is also possible to alter thefowl’s anatomy by surgery so that faeces and urine are voided separately.
If possible the food required for the trial should be mixed thoroughly beforehand toensure a uniform composition. Typically a digestibility trial consists of three periods,each lasting for 7–10 days. During the adaptation period, animals are gradually adaptedto the experimental diet. Once adapted, animals are then maintained on the experi-mental diet for a preliminary period to ensure that they are fully accustomed to the ex-perimental diet and to clear the digestive tract of previous food residues. Finally, duringthe collection period, food intake and faecal output are recorded. A longer collectionperiod generally provides more accurate results. With simple-stomached animals thefaecal output resulting from a particular input of food can be identified by adding an in-digestible coloured substance such as ferric oxide or carmine to the first and last mealsof the collection period; the beginning and the end of faecal collection are then delayeduntil the dye appears in and disappears from the excreta.With ruminants this method isnot successful because the dyed meal mixes with others in the rumen; instead, an arbi-trary time lag of 24–48 hours is normally allowed for the passage of food residues, i.e.the measurement of faecal output begins 1–2 days after that of food intake, and contin-ues for the same period after measurement of food intake has ended.
In all digestibility trials, and particularly those with ruminants, it is highly desir-able that meals should be given at the same time each day and that the amounts offood eaten should not vary from day to day.When intake is irregular there is the pos-sibility, for example, that if the last meal of the experimental period is unusuallylarge, then the subsequent increase in faecal output may be delayed until after theend of faecal collection. In this situation the output of faeces resulting from themeasured intake of food will be underestimated and digestibility overestimated.The trial is completed by analysing samples of the food used and the faecescollected. Box 10.1 provides an example of the calculation of nutrient digestibilitycoefficients for hay fed to sheep.

Measurement of digestibility
239
BOX 10.1 Calculation of the nutrient digestibility coefficients of hay fed to sheep
A digestibility trial was carried out using three sheep to determine the digestibility of hay. Duringthe 10-day faecal collection period, feed intake and faecal output were recorded. Samples of hayand faeces were analysed in the laboratory:
Notes
1. The average quantity of hay dry matter (DM) consumed was 1.63 kg/day and the averagequantity of DM excreted in the faeces was 0.76 kg/day. The chemical composition of the hayand faeces are presented in Section 1.
2. From the quantities of DM consumed and excreted and the chemical composition of the hay andfaeces, the quantities of individual nutrients consumed, excreted and (by difference) absorbedcan be calculated (Section 2).
3. Digestibility coefficients for each nutrient can then be calculated by expressing the weight of eachnutrient absorbed as a proportion of the weight consumed, e.g. DM digestibility = 0.87/1.63 =
0.534 (Section 3).4. Finally, the composition of the hay can be expressed in terms of digestible nutrients, e.g.
digestible organic matter = 919 � 0.560 = 515 g/kg DM (Section 4).
The general formula for the calculation of digestibility coefficients is:
A measure that is often used to reflect the energy concentration of foods is theconcentration of digestible organic matter in the dry matter (DOMD). For the hay inBox 10.1 this is 515 g/kg DM, or 51.5 per cent.This percentage figure is often referredto as the D value.
In the example presented in Box 10.1 the food in question was forage and could beoffered to the animals as the only ration component. Concentrate foods and fat sup-plements, however, may cause digestive disturbances if given alone to ruminants, andtheir digestibility is often determined by giving them in combination with forage ofknown digestibility.Thus, the hay in the example in Box 10.1 could have been used ina second trial in which the sheep also received 0.50 kg oats per day. If the dry mattercontent of the oats was 900 g/kg, then daily dry matter intake would increase by
nutrient consumed - nutrient in faecesnutrient consumed
Dry matter
(DM)
Organic
matter
Crude
protein
Ether
extract
Acid detergent
fibre
1. Nutrient analysis (g/kg DM)Hay 919 93 15 350Faeces 870 110 15 317
2. Nutrient flux (kg/day)Consumed 1.63 1.50 0.151 0.024 0.570Excreted 0.76 0.66 0.084 0.011 0.240Absorbed 0.87 0.84 0.067 0.013 0.330
3. Digestibility coefficients 0.534 0.560 0.444 0.541 0.5794. Digestible nutrients (g/kg DM) – 515 41 8 203

Chapter 10 Evaluation of foods: digestibility
240
0.45 kg. If faecal output increased from 0.76 kg to 0.91 kg per day, then the di-gestibility of the dry matter in oats would be calculated as follows:
In this example, the hay is designated as the basal diet and the oats as the testfood.The general formula for calculating the digestibility of the test food is:
Fat supplements are generally included in ruminant diets at relatively low levels.The digestibility of a fat supplement can be determined by assuming that long-chainfatty acids (LCFA) in a control diet and the basal ingredients of a diet containing thefat supplement have the same digestibility coefficients. If the intake and LCFA com-position of the fat supplement are known, then the LCFA intake from the fat supple-ment can be calculated. Similarly, if the digestibilities of the LCFA in the control dietare known, then the LCFA output from the basal ingredients can be subtracted fromthe total LCFA output of animals fed the supplemental fat to determine the outputof fatty acids derived from the supplemental fat. Fatty acid digestibility can then becalculated as indicated above. This technique is particularly advantageous when theLCFA composition of the basal ingredients and test fat are distinctly different, and ithas the advantage over other techniques involving total fat or gross energy as, rela-tive to the basal diet, the proportion of LCFA added is generally a lot higher.
Calculating the digestibility of concentrate foods and fat supplements by differenceassumes that the test food has no effect on the digestibility of the basal diet ingredi-ents.This is not always the case (see p. 248).
Indicator methods
In some circumstances the lack of suitable equipment or the particular nature of thetrial makes it impractical to measure either food intake or faecal output directly. Forinstance, when animals are fed as a group or in a grazing situation, it may be impossi-ble to measure the intake of each individual. However, digestibility can still be meas-ured if the food contains some indicator substance that is known to be completelyindigestible. If the concentrations of this indicator substance in the food and in smallsamples of the faeces of each animal are then determined, the ratio between theseconcentrations can be used to calculate digestibility. For example, if the concentrationof the indicator increased from 10 g/kg DM in the food to 20 g/kg DM in the faeces,this would mean that half of the dry matter had been digested and absorbed. In equa-tion form this is presented as:
nutrient in test food - (nutrient in faeces - nutrient in faeces from basal diet)
nutrient in test food
0.45 - (0.91 - 0.76)
0.45=
0.45 - 0.150.45
= 0.667
Dry matter digestibility =
indicator in faeces (g>kg DM) - indicator in food (g>kg DM)
Indicator in faeces (g>kg DM)
Internal or external indicators may be used. Internal indicators are natural con-stituents of the food such as lignin, acid-indigestible fibre or acid-insoluble ash (mainlysilica). More recently, the long-chain hydrocarbons (n-alkanes, C25–C35) found in thewaxy cuticle of leaves have been used as internal indicators, especially in grazing stud-ies. External indicators are substances that are added to foods. Chromic oxide (Cr2O3)

Measurement of digestibility
241
is perhaps the most common external indicator as it is very insoluble and hence indi-gestible; moreover, chromium (Cr) is not present as a natural constituent of mostfoods. In non-ruminant nutrition, titanium oxide (Ti2O3) is often used as an externalindicator.
External indicators such as chromic oxide may also be used to estimate faecal out-put rather than digestibility. In this application, the indicator is normally given for 10–15 days in fixed amounts (e.g. administered in a gelatin capsule) and once its excretionis assumed to have stabilised its concentration in faecal samples is determined. Faecaldry matter output (kg/day) is then calculated as:
For example, if an animal is given 10 g of chromic oxide per day and the concentra-tion of indicator in the faeces is 4 g/kg DM, then faeces output would be calculatedas 10/4 = 2.5 kg DM/day. If food intake is known, then dry matter digestibility couldbe calculated as (dry matter intake - faecal DM output)/DM intake.Alternatively, ifDM digestibility is known, then dry matter intake could be calculated as faecal DMoutput/DM digestibility. The n-alkane technique is very useful in this context. Asplants contain mainly odd-chain n-alkanes in their waxy cuticle, even-chain (C32)n-alkanes can be used as an external indicator to determine faecal output. At thesame time, the odd-chain n-alkanes (C35) can be used to estimate diet digestibility.Dry matter intake can then be estimated in group-fed or grazing animals.
Measuring the digestibility of herbage eaten by grazing animals presents a par-ticular problem. In theory, internal indicators such as lignin can be used to estimateherbage digestibility. However, in practice, this application of the indicator tech-nique is complicated by the difficulty of obtaining representative samples of thefood (i.e. pasture herbage) consumed. Animals graze selectively, preferring youngplants to old, and preferring leaf to stem, and a sample of the sward picked by handor cut with a mower is therefore unlikely to be representative of that consumed bythe animal. One way of obtaining representative samples is to use an animal withan oesophageal fistula (an opening from the lumen of the oesophagus to the skinsurface). When this is closed by a plug, food passes normally between mouth andstomach; when the plug is temporarily removed, herbage consumed can be col-lected in a bag hung below the fistula. Samples of grazed herbage obtained in thisway can then be analysed, together with samples of faeces, for the indicator. Then-alkane technique may also be useful in this context as there are large and charac-teristic differences in the n-alkane content of different plant species. By relating thepattern of faecal n-alkane output to the n-alkane pattern in different plant speciesor parts, the technique allows estimates of the diet composition of grazing animalsto be made.
Laboratory methods
Since digestibility trials are laborious and expensive to carry out, numerous attemptshave been made to determine the digestibility of foods by reproducing in the labora-tory the reactions that take place in the alimentary tract of the animal. Digestion innon-ruminants is not easily simulated in its entirety, but the digestibility of food pro-tein may be determined from its susceptibility to attack in vitro by pepsin and hy-drochloric acid. It is also possible to collect digestive tract secretions via cannulaeand to use them to digest foods in vitro.
Indicator dose (g>day)>indicator in faeces (g>kg DM)

Chapter 10 Evaluation of foods: digestibility
242
The digestibility of foods for ruminants can be measured quite accurately in the lab-oratory by treating them first with rumen liquor and then with pepsin. During the firststage of this so-called two-stage in vitro method, a finely ground sample of the food isincubated for 48 hours with buffered rumen liquor in a tube under anaerobic condi-tions. In the second stage, the bacteria are killed by acidifying with hydrochloric acidto pH 2 and are then digested (together with some undigested food protein) by incu-bating them with pepsin for a further 48 hours. The insoluble residue is filtered off,dried and ignited, and its organic matter subtracted from that present in the food toprovide an estimate of digestible organic matter. Digestibility determined in vitro isgenerally slightly lower than that determined in vivo, and corrective equations arerequired to relate one measure to the other; an example is illustrated in Fig. 10.1a.
Until it was superseded by other methods (see below), this technique was used rou-tinely in the analysis of farm forages for advisory purposes and for determining thedigestibility of small samples such as those available to the plant breeder. A furtherapplication is found in estimating the digestibility of grazed pasture herbage when thisis collected from an animal with an oesophageal fistula as described above.
Collection of rumen liquor used in the first stage of this laboratory procedurepresents a number of difficulties. Rumen liquor is collected from animals that havebeen fitted with a rumen fistula that allows direct access into the rumen. Alterna-tively, it can be obtained by stomach tube. However, there are animal welfare impli-cations associated with both of these techniques. In addition, rumen liquor may varyin its fermentative characteristics and solids content depending on the diet of the an-imal from which it is collected. In an attempt to obtain more repeatable estimates of
Fig. 10.1 Laboratory methods for estimating the dry matter digestibility of forages. (a) Incubation inrumen liquor followed by digestion with pepsin. (b) Digestion with pepsin followed by digestion withcellulase.
Adapted from Terry R A et al. 1978 Journal of the British Grassland Society 22: 13.
0.55
0.60
0.65
0.70
0.75
0.80
0.85All forages:
y =1.02x1 – 0.0041(RSD ± 0.016)
Dig
esti
bili
ty(
)in
viv
oy
0.55 0.60 0.65 0.70 0.75 0.80
( ) Rumen liquor and pepsin ( )a x1
0.50 0.55 0.60 0.65 0.70 0.75 0.80 0.85 0.90
Digestibility in vitro ( ) Pepsin and cellulase ( )b x2
Grasses:y = 0.3472 + 0.56x2
(RSD ± 0.018)
Legumes:
(RSD ± 0.032)Key:Grasses
Italian ryegrassPerennial ryegrassTimothy
LegumesLucerneRed cloverSainfoin
y = 0.0694 + 0.87x2

digestibility, rumen liquor is sometimes replaced by fungal cellulase preparations.Figure 10.1b shows how incubation with pepsin followed by incubation with cellu-lase can be used to estimate the digestibility of forages for sheep.The relationship inFig. 10.1b, however, is less close than that found for the same forages between di-gestibility estimated by fermentation with rumen liquor and that determined insheep (Fig. 10.1a). More recently, the pepsin pretreatment has been replaced by neu-tral detergent fibre (NDF) to give neutral cellulase digestibility (NCD). Both thepepsin–cellulase and NDF–cellulase methods require separate prediction equationsfor different forages, and the residual standard deviations for these equations arelarger than those of the single equation used for the rumen liquor–pepsin method.
Rumen liquor is also used in another laboratory method for assessing thedigestibility of foods of ruminants. In this method, the quantity or proportion of fooddigested is estimated indirectly from the volume of gas produced during fermenta-tion. Gas production in the rumen, and hence in the test tube, is proportional to thequantity of food fermented.About half of the gas is carbon dioxide arising from theneutralisation of acids by buffers, and the rest is a mixture of methane and carbondioxide arising from the fermentation of carbohydrates and proteins to volatile fattyacids. The advantage of this method over the laboratory methods discussed above isthat it can be readily applied to large numbers of food samples, especially if gas pro-duction is recorded automatically. One disadvantage is that gas production reflectsonly one aspect of rumen fermentation, namely volatile fatty acid production, andnot the synthesis of microbial biomass. Thus, gas production measurements need tobe related to the quantity of nutrients remaining after fermentation.
Over the past decade there has been a change in the routine evaluation of foods foradvisory purposes (e.g. evaluating a silage sample from a farm) from methods requiringrumen liquor obtained from fistulated animals to those requiring only laboratory appa-ratus. In Britain the preferred technique is near-infrared reflectance spectroscopy (seeChapter 1), which has been shown to provide more accurate predictions of digestibilitythan the two-stage in vitro method when applied to defined groups of feeds, such asgrass silages.This method is quickly executed and requires minimal sample preparation,but the equipment required is expensive, and the chemical nature of the food con-stituents contributing to the near-infrared spectrum has yet to be established.
Validity of digestibility coefficients
243
10.2 VALIDITY OF DIGESTIBILITY COEFFICIENTS
The assumption that the proportion of food digested and absorbed can be deter-mined by subtracting the proportion excreted in faeces from that consumed is opento question for two reasons. First, in ruminants, methane arising from the fermenta-tion of carbohydrates is lost by eructation and is not absorbed. This loss leads tooverestimation of the digestible carbohydrate and digestible energy content of rumi-nant foods. Second, as discussed in Chapter 8, not all the faeces consist of undi-gested food residues. Part of the faecal material is contributed by enzymes and othersubstances secreted into the gut and not reabsorbed, and by cellular materialabraded from the lining of the gut. Thus, if a pig, for example, is fed on a nitrogen-free diet, it continues to excrete nitrogen in the faeces. Since this nitrogen is derivedfrom the body and not directly from the food, it is known as metabolic faecal nitro-gen, and the amount excreted is approximately proportional to the animal’s dry mat-ter intake. Faeces also contain appreciable quantities of ether-extractable substances

Chapter 10 Evaluation of foods: digestibility
244
and minerals of metabolic origin. Since faeces serves as the route of excretion forcertain mineral elements, particularly calcium, some of the ash fraction in faeces iscontributed by mineral elements being secreted into the gut.
The excretion in faeces of substances not arising directly from the food leads tounderestimation of the proportion of the food actually absorbed by the animal.Thevalues obtained in digestibility trials are therefore called apparent digestibility coef-ficients to distinguish them from true digestibility coefficients. In practice, true di-gestibility coefficients are difficult to determine, because the fractions in faecesattributable to the food and to the animal are in most cases indistinguishable fromone another.Apparent digestibility coefficients for the organic constituents of foodsare satisfactory for most purposes, and they do represent the net result of the inges-tion of food.Apparent digestibility coefficients for some mineral elements, however,may be quite meaningless (see p. 251).
Table 10.1 Digestion of chopped or ground and pelleted dried grass in successiveportions of the alimentary tract of sheep
Food constituent: Organic matter Cellulose
Form of grass: Chopped Pelleted Chopped Pelleted
Proportion digested inStomach 0.52 0.45 0.80 0.56Small intestine 0.27 0.20 0.02 -0.02Large intestine 0.04 0.13 0.05 0.23Whole tract 0.83 0.78 0.87 0.77
After Beever D E, Coelho da Silva J P, Prescott J H D and Armstrong D G 1972 British Journal of Nutrition28: 347.
10.3 DIGESTIBILITY IN DIFFERENT SECTIONS OF THE DIGESTIVE TRACT
As explained in Chapter 8, nutrients may be absorbed from several parts of thedigestive tract. Even in non-ruminants, absorption occurs in two distinctly differentparts, the small and large intestines, and in ruminants volatile fatty acids are absorbedfrom the rumen. A food constituent that is digested (and absorbed) at one site maygive rise to nutrients that differ quite considerably from those resulting from its diges-tion at another site.The nutritive value of a food to the animal depends not only onthe extent to which it is digested (i.e. its digestibility) but also on its site of digestion.For example, a carbohydrate such as starch may be fermented in the rumen to volatilefatty acids (and methane) or digested in the small intestine to glucose.
The digestibility of foods in successive sections of the digestive tract is most con-veniently measured by the use of cannulated animals, prepared as described onp. 159.An example of the use of cannulated animals to measure digestion in succes-sive sections of the digestive tract of sheep is shown in Table 10.1. In this experimentthe sheep were cannulated at the duodenum and terminal ileum, thus allowing di-gestion to be partitioned between the stomach, the small intestine and the large in-testine.The whole tract digestibility of the organic matter of the pelleted grass (0.78)

Digestibility in different sections of the digestive tract
245
was considerably lower than that of the chopped grass (0.83), microbial digestion ofthe former being partially transferred from the stomach (i.e. the rumen) to the largeintestine. These differences were even more apparent for cellulose digestion, towhich the small intestine made a negligible contribution.
In Chapter 8 reference was made to the degradation of dietary protein in therumen. The nitrogen in food protein is either rumen-degradable (RDP) or rumen-undegradable (UDP).The RDP fraction is either used for microbial protein synthesisor absorbed across the rumen wall as ammonia, whereas the UDP fraction is resistantto microbial attack and escapes degradation.The fate of dietary protein (or nitrogen)in ruminants may be determined by collecting digesta from successive sections of thedigestive tract.Table 10.2 contrasts the digestion of nitrogen in two types of ryegrass.Although the two grasses were similar in total nitrogen content (line 1), considerablymore nitrogen was ‘lost’ from the stomach, presumably by absorption of ammonia,with the first grass (line 5). Conversely, with this grass, less nitrogen was absorbed inthe small intestine, expressed either as total nitrogen (line 6), protein (line 9) oramino acids (line 10). The difference between total nitrogen and protein nitrogenabsorption in the small intestine (lines 6–9) reflects absorption of ammonia, and thedifference between protein and amino acid nitrogen absorbed in the small intestine(lines 9 and 10) reflects the nucleic acid nitrogen of microbial protein.A further lossof nitrogen, again presumably as ammonia, occurred in the large intestine (line 7).The net outcome was that although the short-rotation ryegrass contained slightly lessnitrogen, of slightly lower overall digestibility, it provided the sheep with about 25 percent more in terms of absorbed amino acids than did the perennial ryegrass.With theperennial ryegrass, of the nitrogen absorbed (32.0 g/day), less than half (14.6 g/day)was in the form of amino acids.
Animals fitted with a rumen cannula can be used to estimate the proportion of afood that is digested in the rumen, or rumen degradability. Typically, food samples(3–5 g of dry matter) are placed in small bags made of permeable synthetic materialwith a standard pore size (400–1600 µm2), which are then inserted into the rumen
Table 10.2 Protein digestion and absorption by sheep given 800 g organic matterper day from one of two types of ryegrass
Perennial
ryegrass
Short-rotation
ryegrass
Total N (g/day) (1) In feed 37.8 34.9(2) At duodenum 27.8 31.7(3) At terminal ileum 9.0 9.3(4) In faeces 5.8 6.7
Total N absorbed (g/day) (5) Stomach 10.0 3.2(6) Small intestine 18.8 22.4(7) Large intestine 3.2 2.6(8) Overall 32.0 28.2
Protein N absorbed (g/day)a (9) In small intestine 15.0 19.1
Amino acid N absorbed (g/day) (10) In small intestine 14.6 18.3aProtein calculated as 6.25 (non-ammonia nitrogen).Adapted from MacRae J C and Ulyatt M J 1974 Journal of Agricultural Science, Cambridge 82: 309.

Chapter 10 Evaluation of foods: digestibility
246
through the cannula and incubated for different periods of time. Bags are withdrawnsuccessively and then washed and dried to determine the amount of undigested mate-rial remaining. The disappearance of food at any time point can then be predictedmathematically.This technique is known as the in sacco degradability technique and iscommonly used to measure protein supply to ruminants, which is described in moredetail in Chapter 13 (see also Fig. 10.2).
Another technique for studying the digestion of food in different sections of thedigestive tract involves the use of small bags similar to those employed to studyrumen degradability. For this so-called mobile nylon bag technique, small samples offood (0.5–1.0 g) contained in bags are inserted into the gut via a cannula (e.g. intothe duodenum) and later recovered via a second cannula (e.g. at the ileo-caecal junc-tion).The loss of nutrients between the two sites is taken to be the portion digestedand absorbed. This technique is commonly used in pigs; in this species, digestibilityto the end of the small intestine (sometimes called ‘ileal digestibility’) is reckoned togive a more accurate measure of the nutritive value of a food than would digestibil-ity in the whole tract. For example, suppose that with a food of high nutritive valueall the lysine was released from proteins and absorbed by the pig before the digestareached the end of the ileum (i.e. ileal lysine digestibility = 1.0). However, microor-ganisms in the caecum and colon are capable of synthesising additional lysine, whichwould be incorporated into microbial protein and excreted in faeces. This wouldreduce apparent lysine digestibility in the whole tract to less than 1.0. The mobile
Fig. 10.2 Disappearance of dry matter and nitrogen from samples of barley incubatedin artificial fibre bags in the rumen of sheep. Vertical lines indicate variation betweenreplicate samples, expressed as standard deviations.
Adapted from Mehrez A Z and Ørskov E R 1977 Journal of Agriculture Science, Cambridge88: 645.
10
10
30
30
50
50
70
70
90
90
6 9 12 24211815
Incubation period (h)
Dry matter
Nitrogen
Pro
po
rtio
n o
f b
arle
y d
isap
pea
rin
g (
%)
3

nylon bag technique is also used in horses, in which the bags may be introduced intothe stomach via a nasogastric tube.
As described in Chapter 8 some non-ruminant herbivores such as rabbits andhares have evolved as hind-gut fermentors. In these animals, indigestible dietary ma-terial is fermented to volatile fatty acids in the caecum and colon. In addition, micro-bial protein and vitamins are synthesised. However, in a similar way to horses, a lackof proteolytic enzymes and a transport system for vitamins in the hind gut preventsabsorption of these nutrients. As a consequence, hind-gut fermentors have evolveddifferent strategies to utilise nutrients synthesised by microbes. At certain times ofthe day rabbits and hares produce caecotrophes (soft faeces) with a high protein,vitamin and mineral content, whilst during the rest of the day they produce hard fae-ces, high in indigestible fibre. Caecotrophes typically represent one-third of total faecalmaterial.The caecotrophes are almost totally re-ingested and contribute 5–18 per centof dry matter and 15–30 per cent of nitrogen intake. Nutrient supply to rabbits, par-ticularly protein and amino acids, is the sum of the contribution from the diet andthe contribution from reingested soft faeces.Apparent whole tract digestibility is de-termined as described previously. However, the contribution of soft faeces is nor-mally assessed by placing a wooden collar (25 cm diameter) on the rabbit to preventcaecotrophy, typically for a 24-hour period.The hard and soft faecal pellets can thenbe separated and the contribution of caecotrophes to total dry matter and nutrientintake can be determined.
Factors affecting digestibility
247
10.4 FACTORS AFFECTING DIGESTIBILITY
Food composition
The digestibility of a food is closely related to its chemical composition, and a foodsuch as barley, which varies little in composition from one sample to another, willshow little variation in digestibility. Other foods, particularly fresh or conservedherbages, are much less constant in composition and therefore vary more in di-gestibility. The fibre fraction of a food has the greatest influence on its digestibility,and both the quantity and quality of the fibre are important.
Modern methods of food analysis attempt to distinguish between the cell wall andcell content fractions. When forages are heated with neutral detergent solution, thecell contents dissolve and the cell walls remain as a residue called neutral-detergentfibre (NDF) consisting of total cell wall material.The cell wall fraction may be furtherdivided into acid-detergent fibre (ADF), representing cellulose and lignin, and acid-detergent lignin (ADL), representing lignin (see Chapter 1). The cell contents are al-most completely digested (i.e. true digestibility = 1.0), although their apparentdigestibility will be approximately 10–15 per cent lower due to the excretion of meta-bolic products into the digestive tract (see p. 243). The digestibility of cell walls ismuch more variable and depends on the degree of lignification, which is expressed asADL. But cell wall digestibility also depends on the structure of plant tissues. Forexample, tropical grasses are generally less digestible than their temperate counter-parts because their leaves contain more vascular bundles, and hence more lignin, andbecause they have dense masses of cells that resist invasion by microorganisms.
The digestibility of foods may be reduced by nutrient deficiencies or excesses,particularly in ruminants. For example, a deficiency of rumen-degradable nitrogen or

Chapter 10 Evaluation of foods: digestibility
248
sulphur may restrict microbial protein synthesis and thus reduce fibre digestibility.An excess of dietary lipid will also inhibit the activity of rumen microorganisms.Thehigh silica content of some foods, particularly rice straw, reduces their digestibility.In foods for non-ruminants, anti-nutritional constituents that bind to proteins andamino acids, such as tannins and saponins, may reduce their digestibility.
Ration composition
The digestibility of a food is influenced not only by its own composition but also bythe composition of other foods consumed with it. These associative effects may bepositive or negative, although negative associative effects are perhaps the most com-mon.A positive associative effect occurs when the digestibility of one ration compo-nent is enhanced by feeding it in combination with another. For example, thedigestibility of poor-quality forage such as straw may be enhanced by feeding it incombination with a protein supplement. In this example, the provision of protein mayenhance the activity of the rumen microorganisms, which are then better able to di-gest the straw.A negative associative effect occurs when the digestibility of one rationcomponent is reduced by feeding it in combination with another. For example, thesupplementation of forage with a readily available source of carbohydrate such asstarch may reduce the digestibility of the forage. In these circumstances, rapid fer-mentation of starch to volatile fatty acids depresses the rumen pH to 6 or less. Thelow pH inhibits the activity of cellulolytic microorganisms and fibre digestibility isreduced. In addition to having an effect on cellulolysis through reducing rumen pH(‘pH effect’), starch may also have a more direct effect on cellulolysis. Some rumenmicroorganisms are capable of fermenting both starch and cellulose and may, giventhe choice, ferment starch in preference to cellulose (‘carbohydrate effect’). Hence,the reduction in cellulolysis observed on high-starch diets may be only partially alle-viated by the addition of buffering agents such as sodium bicarbonate.
The existence of associative effects presents a serious problem for ration formula-tion and the determination of digestibility by difference (see p. 240). For example, ifforage and concentrate foods have digestibility coefficients of 0.6 and 0.8, respec-tively, it may be assumed that the overall digestibility of a mixed ration containingequal proportions of forage and concentrate would be 0.7. However, due to associa-tive effects, this is unlikely to be the case, as digestibility of the forage is likely to bereduced by feeding it in combination with a concentrate.Although associative effectsare known to exist, their effect depends on the relative proportions of forage andconcentrate in the ration, the chemical composition of the ration components andthe level of feeding. Consequently, they are very difficult to predict and thereforecannot be accounted for in feeding systems.
Food processing
Foods are often processed before feeding in order to increase and optimise their di-gestibility. The commonest treatments applied are normally chopping, chaffing,crushing and grinding. Typically, cereal grains should be crushed for cattle andground for pigs, otherwise they may pass through the digestive tract intact. Thegrinding of cereal grains fed to cattle may enhance their rate of fermentation to suchan extent that it predisposes the animal to rumen acidosis. Sheep on the other handare able to effectively chew whole grain during rumination, thereby reducing the

Factors affecting digestibility
249
need for mechanical processing. However, this appears to be dependent on the dy-namics of regurgitation, which are influenced by both the type of cereal grain andthe nature of the basal diet. Oats appears to be more efficiently-regurgitated thanbarley, and regurgitation appears to be more difficult when cereal grains are fed incombination with forages such as silage, suggesting that grain shape and entrapmentin interwoven particles may be important factors. Consequently, if fed with silage,cereal grains should be crushed (see Chapter 22).
Forages are subjected to several processes of comminution. The mildest process,chaffing, has little direct effect on their digestibility but may reduce it indirectly bypreventing selection of the more digestible components by animals.The wafering offorages, a process involving their compression into round or square section blocks,also has little effect on their digestibility. The most severe process, fine grinding(often followed by pelleting), has a marked effect on the manner in which forages aredigested and hence on their digestibility. Because of their reduced particle size,ground forages pass through the rumen faster than long or chopped material. Conse-quently, the fibrous components may be less completely fermented (see Table 10.1).The grinding of forages may reduce the digestibility of the fibre fraction by as muchas 20 per cent and of the dry matter as a whole by 5–15 per cent. This reduction isoften greatest for forages with an intrinsically low digestibility, and it may be exag-gerated at high feeding levels, because although grinding increases the rate of passageand reduces digestibility, it also increases food intake (see Chapter 17).
Forages such as the cereal straws, in which the cellulose is mixed or bound with ahigh proportion of lignin, may be treated chemically to separate the two compo-nents.The treatment processes and their effects are described in detail in Chapter 20.The chemicals used are mainly alkalis (sodium and ammonium hydroxides), andthey improve the dry matter digestibility of cereal straws quite dramatically, from0.4 to 0.5–0.7.
Foods are sometimes subjected to heat treatment to improve their digestibility.Traditionally, potatoes are boiled before feeding to pigs, but heat may be applied toother foods as steam or by microwave irradiation (a process known as micronisa-tion).When applied to cereals, such processes cause relatively small increases in di-gestibility, although sorghum appears to be more responsive than other grains. Heattreatments are most effective when used for the specific purpose of inactivating di-gestive enzyme inhibitors that are present in some feeds.The best examples of theseinhibitors are found in protein concentrates (see Chapter 23). Potatoes, and rootcrops such as swedes (Brassica napus), may also contain protease inhibitors that areinactivated by heat treatment. In pigs, the benefit of such treatment is not so muchthe improvement in digestibility as the transfer of protein digestion from fermenta-tion in the caecum to normal enzyme digestion in the small intestine.
Enzyme supplementation of foods
In non-ruminants, the digestive system is ill-equipped to deal with some foods be-cause the animals lack appropriate enzyme systems. Enzyme preparations (usuallyof fungal origin) may be added to foods to increase nutrient availability. The mostconsistently successful enzyme additive has been the use of �-glucanase in poultrydiets containing barley. �-Glucans, which constitute a large part of the endospermcell wall of cereals (see Chapter 2), are largely indigestible. If they escape digestion,they appear in the excreta as gels that cause undesirable ‘sticky droppings’. �-Glucans

Chapter 10 Evaluation of foods: digestibility
250
also protect other dietary components from digestion. Consequently, their enzy-matic destruction causes a general improvement in digestibility. Further examples ofthe use of enzyme supplementation are described in Chapter 24.
Animal factors
Digestibility is more a property of the food rather than of the animal consuming it.However, this is not to say that a food given to different animals will be digested tothe same extent. The most important animal factor affecting digestibility is animalspecies. Foods that are low in fibre are equally well digested by both ruminants andnon-ruminants, but foods high in fibre are better digested by ruminants.Apparent di-gestibility coefficients for protein are frequently higher for pigs because their excre-tion of metabolic faecal nitrogen is smaller than that of ruminants. Differences indigestive ability between sheep and cattle tend to be small and of little significance,and hence digestibility values are often determined in sheep and applied to cattle.However, highly digestible foods such as cereal grains tend to be better digested insheep, and poorly digestible foods such as low-quality roughages tend to be betterdigested by cattle. Digestibility values determined in sheep are not always applicableto cattle; for example, the digestibility of the grain component in whole-crop cerealsilages (see Chapter 19) is lower in cattle than in sheep because whole grains passthrough the digestive tract intact.
Level of feeding
An increase in the quantity of food consumed by an animal generally causes anincrease in the rate of passage of digesta.The food is then exposed to the action ofdigestive enzymes for a shorter period of time and digestibility is reduced.
In animals, level of feeding is often expressed in multiples of the quantity of foodrequired for maintenance (i.e. the quantity required to maintain equilibrium; seeChapter 14). Maintenance is defined as unity. In ruminant feeding systems, the levelof feeding for growing and fattening animals can be 2.0–3.0 times their maintenancerequirement and for lactating animals 3.0–5.0 times their maintenance requirement.For high-fibre diets such as hay, silage and grazed grass, increasing the level of feed-ing by 1 unit (e.g. from maintenance to twice maintenance) reduces the digestibilityof the diet by only a small proportion (0.01–0.02). For mixed diets and those con-taining smaller particles, the reduction in digestibility per unit increase in feedinglevel is greater (0.02–0.03). For a typical dairy cow diet, the dry matter digestibilitymight fall from 0.75 at a maintenance level of feeding to 0.70 at three times mainte-nance. Falls of this magnitude may be due to negative associative effects, which be-come more pronounced at higher levels of feeding. The greatest reductions indigestibility with increasing feeding level occur with ground and pelleted forages andsome fibrous by-products (0.05 per unit change in level), the reason being that therate of passage of foods with a small particle size is increased to a greater extent thanis possible with long forages, which generally require more extensive fermentation inthe rumen before further passage.
In non-ruminants, level of feeding rises to 2.0–3.0 times maintenance in poultry,3.0–4.0 times maintenance in growing pigs and 4.0–6.0 times maintenance in lactatingsows, but there is little evidence for an effect of level of feeding on the digestibility ofconventional (i.e. low-fibre) diets.

Measurement of mineral availability
251
10.5 MEASUREMENT OF MINERAL AVAILABILITY
In many cases it is inappropriate to determine apparent digestibility coefficients formineral elements because endogenous excretion, arising from secretions into the di-gestive tract, can be high, particularly for minerals such as calcium, phosphorus,magnesium and iron. For example, in ruminants, the quantity of phosphorus se-creted into the gut via saliva is generally greater than the quantity in foods. Inaddition, the digestive tract is a major route of excretion for many mineral elementsthat have been absorbed in excess of requirements. For example, excess copper maybe excreted into the digestive tract in bile. For mineral elements, the measure of im-portance is true digestibility or ‘availability’.To measure the availability of a mineralelement one must distinguish between the proportion of mineral element in thefaeces that is of dietary origin and that which has been voided into the digestive tractfrom the animal’s tissues. This distinction may be made by labelling the elementwithin the body, and hence the proportion voided into the digestive tract, with aradioisotope.
Mineral elements in digesta exist in one of three forms: as metallic ions in solu-tion, as constituents of metallo-organic complexes in solution, and as constituents ofinsoluble substances. Those present in the first form are readily absorbed and thosein the third form are not absorbed at all. The metallo-organic complexes, some ofwhich are chelates (see p. 107), show variable availability. Some mineral elementsmay be converted from one form to another, and so broadly speaking the availabil-ity of an element depends on the form in which it occurs in the food and on the ex-tent to which conditions in the gut favour conversion from one form to another.Thus, the availability of sodium and potassium, which occur in digesta almost en-tirely as ions, is close to 1.0. At the other extreme, the availability of copper, whichoccurs almost entirely as soluble or insoluble complexes, is generally less than 0.1.Totake a further example, phosphorus is present in many foods as a constituent ofphytic acid (see p. 115), and its availability depends on the presence of phytases, ofmicrobial or animal origin, in the digestive tract. A potent factor controlling theinterconversion of soluble and insoluble forms of mineral elements is the pH of thedigesta. In addition, there may be specific agents that bind mineral elements andthus prevent their absorption. For example, calcium may be precipitated by oxalatesand copper by sulphides.
The availability of mineral elements is commonly high in young animals fed onmilk and milk products but declines as the diet changes to solid foods.An additionalcomplication is that the absorption, and hence apparent availability, of some mineralelements is under homeostatic control (determined by the animal’s need for them).Iron absorption, discussed in Chapter 8, is the clearest example of this effect, but inruminants the efficiency of calcium absorption also appears to be dependent on theanimal’s requirements.
Whilst no attempt is made here or in Chapter 8 to provide a complete list of fac-tors affecting the availability of mineral elements, those mentioned serve to illustratewhy availability coefficients are not included in tables of food composition. Theavailability of a mineral in a particular food depends so much on other constituentsof the diet and the type of animal that average availability coefficients would be oflittle significance.

Chapter 10 Evaluation of foods: digestibility
252
QUESTIONS
10.1 A pig was given 2.0 kg/day DM of a food containing 150 g/kg DM crude pro-tein and excreted 0.4 kg/day DM of faeces containing 175 g/kg DM protein.Calculate both the DM and the crude protein digestibility and the digestiblecrude protein (DCP) content of the food.
10.2 As a check on the measurement of digestibility in Question 1, the food con-tained 10.0 g/kg DM of chromic oxide as an indicator and the faeces contained50.0 g/kg DM chromic oxide. Did the measured DM digestibility agree withthat estimated using the indicator?
10.3 Of the 2.0 kg/day DM given to the pig in Question 1, 0.3 kg/day DM camefrom soya bean meal, containing 450 g/kg DM crude protein, for which theDM and crude protein digestibility coefficients were known to be 0.75 and0.85, respectively. The rest of the ration was a cereal. What was the DM andcrude protein digestibility of the cereal?
SUMMARY
1. The nutrient digestibility coefficients for afood (D) can be calculated from the weights ofnutrient consumed (I) and excreted in faeces(F) by the formula (I � F)/I.
2. In a typical digestibility trial, the food under in-vestigation is fed to animals for 21–30 days, withfaeces being collected for the last 7–10 days.
3. If food intake and/or faeces output cannot bemeasured quantitatively, digestibility may beestimated indirectly from the relative concen-trations of an indigestible substance in thefood and faeces known as an indicator.
4. The digestibility of foods may be estimated inthe laboratory (in vitro) by incubating them inrumen liquor or various chemical and enzy-matic techniques. Near-infrared reflectancespectroscopy (NIRS) is now used routinely toestimate the digestibility of foods for farmadvisory work.
5. For most nutrients a proportion of each nutri-ent excreted in faeces is derived from the ani-mal’s body and not from the food. The
measurement of apparent digestibility doesnot take this into account and thereforeunderestimates true digestibility.
6. The insertion of cannulae into different partsof the animal’s digestive allows digesta to besampled from each part and digestibility to becalculated for different sections. For example,rumen degradability can be estimated by in-serting small samples of food in syntheticnylon bags into the rumen through a rumencannula (in sacco).
7. The digestibility of a food in an animal de-pends on its chemical composition, the compo-sition of foods fed with it and the way inwhich it has been processed, together with itslevel of feeding and any additional enzymesupplementation or chemical treatment.
8. The digestibility of mineral elements (mineralavailability) is affected by secretion and excre-tion of minerals into the digestive tract, theform of the mineral element, interactions withother dietary components and the physiologi-cal state of the animal.

FURTHER READING
Ammerman C B, Baker D H and Lewis A J (eds) 1995 Bioavailability of Nutrients forAnimals: Amino Acids, Minerals and Vitamins, San Diego, CA,Academic Press.
British Society of Animal Science 1997 In Vitro Techniques for Measuring Nutrient Supply toRuminants, occasional publication, no. 22, Edinburgh, British Society of Animal Science.
Givens D I and Deaville E R 1999 The current and future role of near infrared reflectancespectroscopy in animal nutrition: a review. Australian Journal of Agricultural Research 50:1131–45.
Mayes R W and Dove H 2000 Measurement of dietary nutrient intake in free-rangingmammalian herbivores. Nutrition Research Reviews 13: 107–38.
Nutrition Society 1977 Methods for evaluating feeds for large farm animals. Proceedings ofthe Nutrition Society 36: 169–225.
Schneider B H and Flatt W P 1975 The Evaluation of Feeds through Digestibility Experiments,Athens, GA, University of Georgia Press.
Van Soest P J 1994 Nutritional Ecology of Ruminants, 2nd edn, Corvallis, OR, O and BBooks.
Wheeler J L and Mochrie R D (eds) 1981 Forage Evaluation: Concepts and Techniques,Melbourne, CSIRO and Lexington, KY,American Forage and Grassland Council.
Further reading
253

254
11.1 Demand for energy
11.2 Supply of energy
11.3 Animal calorimetry: methods of measuring heat production and energyretention
11.4 Utilisation of metabolisable energy
The major organic components present in food are required by animals as raw materi-als for the synthesis of body tissues and animal products such as milk and eggs. Theyare also needed as sources of energy to support work done by the animal. A unifyingfeature of these diverse functions is that they all involve a transfer of energy, whichapplies equally when chemical energy is converted into mechanical or heat energy, aswhen nutrients are oxidised, and when chemical energy is converted from one form toanother, for example when body fat is synthesised from dietary carbohydrate. Theability of a food to supply energy is therefore of great importance in determining itsnutritive value. The purpose of this chapter and the next is to discuss factors affectingthe energy content of foods, the partition of food energy within the animal, themeasurement of energy metabolism, and the different methods used to expressenergy supply.
11 Evaluation of foods: energy content of foods and energy partition within the animal
11.1 DEMAND FOR ENERGY
Before discussing the factors that affect energy supply from foods, it might be usefulto briefly explain the factors affecting energy demand, although these factors will bediscussed in more detail in Chapters 14, 15 and 16. An animal requires energy forboth maintenance and production. The energy requirement for maintenance repre-sents the energy required for the vital body processes that are essential for life, forexample the work associated with essential muscular activity (beating of the heart),the work associated with active transport (movement of dissolved substances againstthe concentration gradient), and the energy associated with the synthesis of essentialbody constituents such as enzymes and hormones.An animal deprived of food con-tinues to require energy for these processes, otherwise it will die. In a starved ani-mal, the energy required for vital body processes is obtained from the catabolism ofbody reserves, initially glycogen, but then body fat and protein. In a fed animal, the

Supply of energy
255
primary demand for energy is to meet this maintenance requirement and to preventthe catabolism of body tissues.
When the energy in food is used for maintenance, the animal does no work on itssurroundings and all the energy used is converted to heat, which, although useful formaintaining body temperature, is expended from the animal’s body. In a fasting ani-mal, the amount of heat produced is equal to the energy derived from tissue catabo-lism, which, when measured under specific conditions, is known as the animal’sbasal metabolic rate or fasting metabolism. The way in which estimates of basalmetabolism are used to assess the maintenance energy requirement of animals isexplained in Chapter 14.
Energy supplied by food in excess of the maintenance requirement is used forproduction. In young growing animals, energy is stored in new tissues primarily asprotein. However, as animals mature, an increasing proportion is stored as fat. Inpregnant and lactating animals, energy is stored in the products of conception (foetusand placenta) and in milk constituents, respectively. Other forms of production in-clude the energy required for activity or exercise and the energy required for thesynthesis of wool or eggs. No process, not even maintenance, can be said to have ab-solute priority for food energy; for example a young animal receiving adequate pro-tein but insufficient energy for maintenance may still continue to deposit bodyprotein, whilst breaking down body fat. Similarly, wool growth continues in animalsat sub-maintenance energy intakes and even in fasted animals.
BOX 11.1 Measurement of gross energy
Gross energy is measured in an apparatus called a bomb calorimeter, which in its simplest form is astrong steel vessel (bomb) resting in an insulated bucket of water. The food sample is pelleted andplaced in the bomb, which is then pressurised to 25 atmospheres with oxygen.The initial tempera-ture of the water in the bucket is recorded before the sample is electrically ignited.The food sampleburns vigorously in an atmosphere of oxygen, and the heat produced during oxidation is dissipatedthrough the wall of the bomb, causing the temperature of the water in the bucket to rise.When equi-librium is reached, the final temperature is recorded. The quantity of heat produced is then calcu-lated from the weight of the food sample oxidised, the weight of water, the temperature rise in thewater, and the specific heat capacities of the water and bomb. Bomb calorimetry is used to measurethe gross energy content of whole foods and their components and the energy content of animal tis-sues and excretory products.
11.2 SUPPLY OF ENERGY
Gross energy (GE)
Energy is stored in the chemical components of food as chemical energy.The amountof chemical energy in a food is measured by converting it to heat and determiningthe heat production.This is carried out by oxidising the food by burning.The amountof heat arising from the complete oxidation of a unit weight of food is known as itsgross energy (GE) value or heat of combustion (see Box 11.1).

Chapter 11 Evaluation of foods: energy content of foods and energy partition within the animal
256
Some typical GE values for various foods are presented in Fig. 11.1.The primarydeterminant of the GE content of organic compounds is their degree of oxidation, asexpressed as the ratio of carbon plus hydrogen to oxygen. All carbohydrates havesimilar ratios and therefore have approximately the same GE content (approximately17.5 MJ/kg DM). However, triglyceride fats typically have a higher ratio (containless oxygen) and therefore have a higher GE value (39.0 MJ/kg DM). Individual fattyacids vary in their GE content depending on their carbon chain length and degree ofsaturation, with those with shorter chains (volatile fatty acids) and a greater numberof double bonds having a lower energy content. Proteins have a higher GE contentthan carbohydrates because they contain the additional oxidisable elements nitrogenand sulphur. Methane has a very high GE content because it consists entirely of car-bon and hydrogen.
In spite of the differences in GE content between different food components, thefact that carbohydrates are the predominate component in the food of most farmanimals means that in reality GE values vary very little. Only foods rich in fat suchas full-fat soya bean meal, which contains 222 g/kg DM ether extract, have signifi-cantly higher values, and those rich in ash, which has no nutritional value, havesignificantly lower values. Most common foods have a GE content of approximately18.4 MJ/kg DM.
Fig. 11.1 Some typical gross energy values (MJ/kg DM).
Fat (from oilseeds) 39.0
Fat 39.3
Milk (400 g fat/kg) 24.9
Methane 55.0
Butterfat 38.5
Muscle 23.6
Grass hay 18.9
Oat straw 18.5
Maize grain 18.5
Linseed-oil meal 21.4
Oat grain 19.6
Lactic acid 15.2
Butyric acid 24.9
Propionic acid 20.8
Acetic acid 14.6
Casein 24.5
Cellulose 17.5
Starch 17.7
Glucose 15.6Foodconstituents
Fermentationproducts
Animal tissues(ash-free)
Volatile fatty acids
Foods

Supply of energy
257
Gross energy (= heat of combustion)
Digestible energy (= energy of digested food)Faeces energy
Urineenergy
Methaneenergy
Metabolisable energy
Heat increment Net energy
Used formaintenance
Used forproduction
(energy retentionor balance)
Total heat productionof animal
Fig. 11.2 The partition of food energy in animals. Losses of energy are shown asthe boxed items on the left.
Not all of the GE in foods is available for use by the animal. Some is lost from theanimal as various solid, liquid or gaseous excretory products, and some is lost asheat.These sources of energy loss are illustrated in Fig. 11.2.The subtraction of theseenergy losses from a food’s GE content produces further descriptive measures offood energy supply; for example, subtracting the GE lost in faeces from the GE infood gives a measure of digestible energy.This and other measures of energy supplywill now be discussed further.
Digestible energy (DE)
Digestible energy represents energy absorbed by the animal.Apparent digestible en-ergy is calculated as the GE provided by a unit of food minus the GE content of thefaeces resulting from the consumption of that unit of food. In the example digestibil-ity trial presented in Box 10.1 in Chapter 10, the sheep consumed 1.63 kg hay andexcreted 0.76 kg faecal DM. If we assume that the GE content of the hay and thefaeces, determined by bomb calorimetry, were 18.0 MJ/kg DM and 18.7 MJ/kg DM,respectively, then the total GE intake would be 29.3 MJ/day and the total GE outputwould be 14.2 MJ/day. The apparent GE digestibility and digestible energy contentof the hay would be calculated as follows:
As faecal energy loss represents by far the most important and variable loss of en-ergy from animal foods, DE is a far better measure of the energy available to supportanimal production than GE. Digestible energy is often used as the measure of energysupply for pigs and horses, where additional energy losses in urine and methane arerelatively small and consistent.
= 9.3 MJ/kg DM DE = 18.0 * 0.515
= 0.515
GE digestibility =
29.3 - 14.229.3

Chapter 11 Evaluation of foods: energy content of foods and energy partition within the animal
258
Metabolisable energy (ME)
In addition to energy lost in faeces, energy is also lost as energy-containing com-pounds in urine, and as combustible gases such as methane produced as a conse-quence of microbial fermentation in either the rumen or hind gut. Metabolisableenergy represents energy that is available for use by the animal and is calculated asDE minus energy lost in urine and combustible gases (see Box 11.2).The energy lostin urine is present as nitrogen-containing compounds such as urea, hippuric acid,creatinine and allantoin, and in non-nitrogenous compounds such as glucuronatesand citric acid.
The combustible gases produced in the rumen and hind gut consist almost en-tirely of methane (CH4). Methane production is closely related to food intake, andat a maintenance level of nutrition approximately 7–9 per cent of the gross energyof the food (11–13 per cent of the digestible energy) is lost as methane. At higherlevels of feeding, the proportion falls to 6–7 per cent of gross energy, the reductionbeing most marked for highly digestible foods. With previously fermented foods,such as brewer’s grain, methane production is low (3 per cent of gross energy).
When methane production cannot be easily measured directly, it can be estimatedas 8 per cent of gross energy intake. Another approximation allows the ME value of ruminant foods to be calculated from their DE value by multiplying by 0.81.Thisimplies that, on average, about 19 per cent of the energy apparently digested is excretedin the urine and as methane.
For poultry, ME is measured more easily than DE, because the faeces and urineare voided together.A rapid standardised method has been developed for determining
BOX 11.2 Measurement of metabolisable energy
The ME value of a food is determined in a feeding trial similar to a digestibility trial, but in whichurine and methane are collected as well as faeces. Metabolism cages for sheep and pigs usually in-corporate a device for collecting urine. With cattle, urine is collected in rubber urinals attachedbelow the abdomen for males and over the vulva for females, and is piped by gravity or suction toa collection vessel.An alternative method of collecting urine from females, which is commonly usedin pigs, is to insert a rubber catheter into the vagina.
When methane production is measured to estimate unproductive energy losses, the animal isusually kept in an airtight container known as a respiration chamber (see p. 267). More recently, thesignificance of methane production from ruminants in relation to global warming has stimulated thedevelopment of an alternative technique that allows methane to be measured from individual ani-mals, whether confined or not. In this technique, a calibrated permeation tube containing sulphurhexafluoride (SF6) is inserted into the rumen and releases SF6 through a permeable membrane at acontrolled rate.After a 5-day adaptation period, breath samples are collected from near the nose ofeach animal using capillary tubing over a 24-hour period into pre-evacuated canisters.The concen-trations of SF6 and CH4 are measured by gas chromatography and the methane emission rate, cor-rected for background levels, is calculated as:
where [CH4] and [SF6] are measured concentrations in excess of background and QSF6 is the rateof SF6 release from the permeation tube.
QCH4 = QSF6 * [CH4]>[SF6]

Supply of energy
259
the ME value of poultry foods. Cockerels are fasted (or fed a small quantity of glu-cose solution) for 48 hours until their digestive tract is empty, and then force-fed asingle meal (30–40 g) of the food under investigation using a stainless-steel funneland plunger inserted carefully down the oesophagus into the crop. Excreta are thencollected until all the residues arising from the single meal have been voided.At thesame time the small quantities of excreta voided by fasted (or glucose-fed) birds arecollected, as a measure of endogenous losses.The energy derived from these endoge-nous losses is then subtracted from the energy derived from the excreta of the fedbirds, and so the estimate of ME obtained is a true rather than apparent value (see p. 243).This is known as true metabolisable energy (TME) and is not directly compara-ble with measures of ME obtained using other techniques.
Factors affecting the metabolisable energy values of foods
Table 11.1 shows the ME values of a number of foods. It is clear that, of the energylosses so far considered, faecal losses are by far the most important. Even for highlydigestibility foods such as barley, twice as much energy is lost in the faeces as in theurine and methane. The main factors affecting the ME value of a food are thereforethose that influence its digestibility.These have been discussed earlier (see Chapter 10);the emphasis here is on urine and methane losses.
The ME value of a food will vary, depending on the species of animal to whichit is given or, more specifically, on the type of digestion to which it will be sub-jected. Fermentative digestion, in the rumen or further along the gut, incurs lossesof energy as methane. A lesser effect of the intervention of microorganisms in
Table 11.1 Metabolisable energy values of some typical foods (MJ/kg DM)
Animal Food Gross Energy lost in ME
energy Faeces Urine Methane
Fowl Maize 18.4 2.2 – 16.2Wheat 18.1 2.8 – 15.3Barley 18.2 4.9 – 13.3
Pig Maize 18.9 1.6 0.4 – 16.9Oats 19.4 5.5 0.6 – 13.3Barley 17.5 2.8 0.5 – 14.2Coconut cake meal 19.0 6.4 2.6 – 10.0
Sheep Barley 18.5 3.0 0.6 2.0 12.9Dried ryegrass (young) 19.5 3.4 1.5 1.6 13.0Dried ryegrass (mature) 19.0 7.1 0.6 1.4 9.9Grass hay (young) 18.0 5.4 0.9 1.5 10.2Grass hay (mature) 17.9 7.6 0.5 1.4 8.4Grass silage 19.0 5.0 0.9 1.5 11.6
Cattle Maize 18.9 2.8 0.8 1.3 14.0Barley 18.3 4.1 0.8 1.1 12.3Wheat bran 19.0 6.0 1.0 1.4 10.6Lucerne hay 18.3 8.2 1.0 1.3 7.8

Chapter 11 Evaluation of foods: energy content of foods and energy partition within the animal
260
digestion is an increase in the losses of energy in either urine (as the breakdownproducts of the nucleic acids of bacteria that have been digested and absorbed) orfaeces (as microorganisms grown in the hind gut and not digested). In general,losses of energy in methane and in urine are greater for ruminants than for non-ruminants, and so foods such as concentrates, which are digested to the same extentin ruminants and non-ruminants, will have a higher ME value for non-ruminants(cf. values for barley in Table 11.1). However, fibrous foods given to non-ruminantswill also incur losses due to fermentative digestion in the hind gut. In ruminants,foods such as silages that have been fermented before consumption by the animalwill incur smaller energy losses in digestion but will already have incurred losses inthe silo. Thus, silages are said to contain less fermentable metabolisable energy(FME) than comparable foods such as hays; this difference, however, is of greaterimportance to the protein nutrition of ruminants (see Chapters 8 and 13) than toenergy nutrition.
A final comment on the effect of animal species is that differences between cattleand sheep in urine and methane losses of energy are small and of no significance.
The ME value of a food will vary depending on whether the amino acids suppliedare retained by the animal for protein synthesis or deaminated and their nitrogen ex-creted in the urine as urea. For this reason, ME values are sometimes corrected tozero nitrogen balance by deducting either 28 kJ (pigs), 31 kJ (ruminants) or 34 kJ(poultry) for each 1 g of nitrogen retained. The factor most appropriate to eachspecies of animal depends on the extent to which nitrogen is excreted as urea (grossenergy 23 kJ/g nitrogen) or other compounds (e.g. uric acid, 28 kJ/g nitrogen). If ananimal is excreting more nitrogen in its urine than it is absorbing from its food (i.e. isin negative nitrogen balance; see Chapter 13), then some of the urine nitrogen is notderived from the food, and in this case the ME value must be subjected to a positivecorrection.
In ruminants, increases in the level of feeding and the manner in which food isprocessed may in some cases affect its ME value. As discussed earlier (see Chap-ter 10), increases in the level of feeding, or the grinding and pelleting of forages, resultin higher rates of passage and increased faecal energy loss (see Table 10.2 in Chap-ter 10). However, this may be partly offset by reductions in methane production.Nevertheless, for finely ground roughages and for mixed roughage and concentratediets, ME values are reduced by increases in level of feeding. For poultry, the grindingof cereals has no consistent effect on ME values.
In theory it should be possible to prevent the production of methane in therumen and thereby avoid losing 8–12 per cent of gross energy intake in this form.In practice it is possible to suppress methane production by adding antimicrobialdrugs to the diet (one effective chemical is chloroform), but the consequences arenot consistently favourable. Energy may be diverted to another gaseous by-product,hydrogen (see Fig. 8.3 in Chapter 8); furthermore, the rumen microorganisms mayadapt to the presence of the drug and revert to the synthesis of methane. The coc-cidiostat monensin, which has been widely used as a feed-borne growth promoterfor beef cattle, is considered to be a methane suppressant. However, there is someevidence that methanogenic microorganisms can adapt to this agent. Since the banon the use of antimicrobial growth promoters as feed additives by the EU inJanuary 2006 and the increasing recognition of methane from ruminants as animportant greenhouse gas, there has been renewed interest in alternative methods

Supply of energy
261
of reducing methane production with products such as yeast culture and plantextract (see Chapter 24).
Heat increment of foods
The ingestion of food by an animal is followed by losses of energy not only as thechemical energy of its solid, liquid and gaseous excreta but also as heat.Animals arecontinuously producing heat and losing it to their surroundings, either directly by ra-diation, conduction and convection, or indirectly by the evaporation of water. If afasting animal is given food, then within a few hours its heat production will increaseabove the level represented by basal metabolism.This increase is known as the heatincrement of the food; it is quite marked in humans after a large meal. The heat in-crement may be expressed in absolute terms (MJ/kg DM) or relatively as a propor-tion of either GE or ME. Unless the animal is in a particularly cold environment, thisheat energy is of no value to the animal and must be considered, like the energy ofthe excreta, as a tax on the energy of the food.
The causes of the heat increment are to be found in the processes associated withdigestion of foods and metabolism of the nutrients derived from them.The act of eat-ing, which includes chewing, swallowing and the secretion of saliva, requires muscu-lar activity, for which energy is supplied by the oxidation of nutrients; in ruminantschewing fibrous foods, the energy cost of eating is estimated to be 3–6 per cent ofME intake.The energy cost of rumination, however, is much less than the cost of eat-ing and is estimated to be about 0.3 per cent of ME intake. Ruminants also generateheat through the metabolism of their gut microorganisms; this is estimated toamount to about 7–8 per cent of ME intake (or alternatively 0.6 kJ per kJ ofmethane produced).
More heat is produced when nutrients are metabolised. For example, it wasshown in Chapter 9 that if glucose is oxidised for the formation of ATP, then the ef-ficiency of free energy capture is only about 0.52, with 0.48 being lost as heat. More-over, the efficiency will be even less if temporary storage of nutrients is required (e.g.glucose stored as glycogen) because more reactions are required. Similar inefficiencyis apparent in the synthesis of the body’s structural constituents. The linking of oneamino acid to another, for example, requires the expenditure of four pyrophosphatehigh-energy bonds, and if the ATP that provides these is obtained through glucoseoxidation, then about 2.5 MJ of energy will be released as heat for each kilogram ofprotein formed. Protein synthesis, it should be noted, occurs not only in growinganimals but also in those kept at a maintenance level, in which protein synthesis is apart of the process of protein turnover (see p. 216). Protein metabolism is estimatedto account for about 10 per cent of the animal’s heat production.The animal also ex-pends high-energy phosphate bonds to do the work involved in the movement ofsubstances (e.g. Na+ and K+ ions) against concentration gradients. This so-called ionpumping may also contribute 10 per cent of the animal’s heat production. Heat isproduced within the body in those regions with the most active metabolism.Thus, ithas been estimated that in ruminants, which have a large and metabolically activegut, as much as half of the total heat production originates from the gut and liver.
We shall see later that the heat increment of foods varies considerably, dependingon the nature of the food, the type of animal consuming it and the various processesfor which nutrients are used.

Chapter 11 Evaluation of foods: energy content of foods and energy partition within the animal
262
Net energy (NE) and energy retention
Subtraction of the heat increment of a food from its ME value gives the net energy(NE) value of a food.The NE value of a food is the energy that is available to the an-imal for useful purposes, i.e. for body maintenance and for various form of produc-tion (see Fig. 11.2).
Net energy used for maintenance is mainly used to perform work within the bodyand will leave the animal as heat. That used for growth and fattening and for milk,egg or wool production either is stored in the body or leaves it as chemical energy,and the quantity so used is referred to as the animal’s energy retention.
It is important to understand that of the heat lost by the animal only a part, theheat increment of the food, is truly waste energy, which can be regarded as a directtax on the food energy. The heat resulting from the energy used for body mainte-nance is considered to represent energy that has been used by the animal and de-graded into a useless form during the process of utilisation.
11.3 ANIMAL CALORIMETRY: METHODS FOR MEASURING HEATPRODUCTION AND ENERGY RETENTION
Calorimetry means the measurement of heat.The partition of food energy presentedin Fig. 11.2 shows that if the ME intake of an animal is known, then the measure-ment of its total heat production will allow its energy retention to be calculated bydifference (likewise, the measurement of energy retention will allow heat productionto be calculated). In practice, measurement of either heat production or energyretention is used to establish the NE value of a food.
The methods used to measure heat production and energy retention in animalscan be quite complicated, both in principle and in practice. In the past, the complex-ity and cost of the apparatus required for animal calorimetry limited its use to asmall number of nutritional research establishments. Improved funding of researchhas gradually removed this restriction, but even so, animal calorimetry remains aspecialised topic and few nutritionists become involved in it. Nevertheless, the studyof animal calorimetry on paper (as in this book) is valuable to all students of nutri-tion, because it reinforces their knowledge of the principles of energy metabolism. Inthe pages that follow, the principles of the methods used in animal calorimetry areexplained within the main body of the text, and the apparatus employed is describedin Boxes 11.3, 11.4 and 11.5.
The heat production of animals can be measured physically using a procedureknown as direct calorimetry. Alternatively, heat production can be estimated fromthe respiratory exchange of the animal. For this, a respiration chamber is normallyused and the approach is one of indirect calorimetry. Respiration chambers can alsobe used to estimate energy retention rather than heat production, by a procedureknown as the carbon and nitrogen balance technique.
Direct calorimetry
Animals do not store heat, except for relatively short periods of time, and whenmeasurements are made over periods of 24 hours or longer it is generally safe to as-sume that the quantity of heat lost from the animal is equal to the quantity produced.

Animal calorimetry: methods for measuring heat production and energy retention
263
To determine the heat increment of a food, animals are given the food at two levelsof ME intake and their heat production is measured at each level.The heat incrementis calculated as shown in Fig. 11.3. Two levels are needed because a part of the ani-mal’s heat production is contributed by its basal metabolism.An increase in food in-take causes total heat production to rise, but the basal metabolism is assumed toremain the same. The increase in heat production is thus the heat increment of theextra food given.
In the example shown in Fig. 11.3, food was given at two levels to supply 40 MJand 100 MJ ME.The additional energy, 60 MJ (BD in the figure) was associated withan increase in heat production of 24 MJ (CD in the figure).The heat increment as afraction of the additional energy provided can be calculated as follows:
It is also possible to make the lower level of intake zero, and to estimate the heatincrement as the difference in heat production between basal (or fasting) metabolismand that produced in the fed animal. Using this method, the heat increment of thefood can be calculated as follows:
If a single food is being investigated, then it may be given as the sole item of thediet at both levels. If the food is one that would not normally be given alone, thenthe lower level may be obtained by giving a basal ration and the higher level by the
BE>AE or 16>40 = 0.4
CD>BD or 24>60 = 0.4
Fig. 11.3 The difference method for estimating the heat increment of foods. A isthe basal metabolism and B and C represent heat production at metabolisableenergy intakes of 40 MJ and 100 MJ, respectively. For the sake of simplicity, therelationship between heat production and metabolisable energy intake is shownhere as being linear, i.e. ABC is a straight line; however, as explained later in thechapter, this is not usually the case.
80
60
Heatproduction
(MJ/day)40
20
0 20 40 60
Metabolisable energy intake (MJ/day)
80 100
D
C
B
EA

Chapter 11 Evaluation of foods: energy content of foods and energy partition within the animal
264
same basal ration plus some of the food under investigation. For example, the heatincrement of barley eaten by sheep could be measured by feeding the sheep first ona basal ration of hay and then on an equal amount of the same hay plus some of thebarley.
Because animal calorimeters are expensive to build and earlier types requiredmuch labour to operate them, animal calorimetry today is mainly carried out by theindirect method described below.
Indirect calorimetry by measurement of respiratory exchange
The substances that are oxidised in an animal’s body, and whose energy is thereforeconverted into heat, consist mainly of carbohydrates, fats and proteins. The overallreaction for the oxidation of a carbohydrate such as glucose is:
[11.1]
and for the oxidation of the typical fat such as tripalmitin is:
[11.2]
One gram-molecule of oxygen occupies 22.4 l at normal temperature and pres-sure (NPT). Thus, if an animal is obtaining all its energy from the oxidation of glu-cose, then the utilisation of one litre of oxygen would lead to the production of2820/(6 * 22.4) = 20.98 kJ of heat; for mixtures of carbohydrates, an average valueis 21.12 kJ/l. Such values are known as thermal equivalents of oxygen and are usedin indirect calorimetry to estimate heat production from oxygen consumption. Foranimals catabolising mixtures of fats, the thermal equivalent of oxygen is 19.61 kJ/l(cf. 19.73 kJ/l calculated for a single fat from Equation 11.2).
Animals do not normally obtain energy exclusively from either carbohydrate orfat. They oxidise a mixture of these (and protein). Consequently, in order to applythe appropriate thermal equivalent, it is necessary to know how much of the oxygenis used for oxidation of each nutrient. The proportions are calculated from what isknown as the respiratory quotient (RQ).This is the ratio between the volume of carbon
C3H5(OOC.C15H31)3 + 72.5O2 : 51CO2 + 49H2O + 3202 kJ
C6H12O6 + 6O2 : 6CO2 + 6H2O + 2820 kJ
BOX 11.3 Animal calorimeters
Heat is lost from an animal body principally by radiation, conduction and convection from bodysurfaces and by evaporation of water from the skin and lungs. An animal calorimeter is essentiallyan airtight, insulated chamber. In most early calorimeters, sensible heat losses (i.e. those associatedwith radiation, conduction and convection) were taken up in water circulated through coils withinthe chamber; the quantity of heat removed from the chamber was then calculated from the flowrate of water and the difference between its entry and exit temperature. Evaporative heat losseswere measured by recording the volume of air drawn through the chamber and its moisture contenton entry and exit. In a more recent type of calorimeter, the gradient layer calorimeter, the quantityof heat is measured electrically as it passes through the wall of the chamber. This type of calor-imeter lends itself to automation, and both sensible and evaporative heat losses can be recordedautomatically. Most calorimeters incorporate apparatus to measure respiratory exchange and there-fore can be used for indirect calorimetry as well.

Animal calorimetry: methods for measuring heat production and energy retention
265
dioxide produced by the animal and the volume of oxygen used. Since, under the sameconditions of temperature and pressure, equal volumes of gases contain equal num-bers of molecules, the RQ can be calculated from the molecules of carbon dioxideproduced and oxygen used. From Equation 11.1 the RQ for carbohydrate is calcu-lated as 6CO2/6O2 = 1, and from Equation 11.2 the RQ of the fat tripalmitin is cal-culated as 51CO2/72.5O2 = 0.70. If the RQ of an animal is known, the proportionsof fat and carbohydrate oxidised can then be determined from standard tables.For example, an RQ of 0.9 indicates the oxidation of a mixture of 67.5 per cent car-bohydrate and 32.5 per cent fat, and the thermal equivalent of oxygen for such amixture is 20.60 kJ/l.
The mixture oxidised generally includes protein. The quantity of proteincatabolised can be estimated from the output of nitrogen in the urine, with 0.16 g ofurinary nitrogen being excreted for each gram of protein oxidised.The heat of com-bustion of protein (i.e. the heat produced when it is completely oxidised) varies ac-cording to the amino acid proportions but averages 22.2 kJ/g. Protein, however, isincompletely oxidised in animals because the body cannot oxidise nitrogen, and theaverage amount of heat produced by the catabolism of protein is 18.0 kJ/g. For eachgram of protein oxidised, 0.77 l of carbon dioxide is produced and 0.96 l of oxygenused, giving an RQ of 0.8.
Heat is produced not only when nutrients are oxidised but also when they areused for the synthesis of animal tissues. However, it has been found that the quanti-ties of heat produced during tissue synthesis bear the same relationship to respira-tory exchange as they do when the nutrients are completely oxidised.
The relationship between respiratory exchange and heat production is disturbedif the oxidation of carbohydrate and fat is incomplete. This situation arises in themetabolic disorder known as ketosis, in which fatty acids are not completely oxi-dised to carbon dioxide and water, and carbon and hydrogen leave the body as ke-tones or ketone-like substances. Incomplete oxidation also occurs under normalconditions in ruminants, because an end product of carbohydrate fermentation inthe rumen is methane. In practice, heat production calculated from respiratory ex-change in ruminants is corrected for this effect by the deduction of 2.42 kJ for eachlitre of methane produced.
The calculations explained above may be combined into a single equation calledthe Brouwer equation (after the Dutch scientist E Brouwer):
[11.3]
where HP � heat production (kJ), VO2 � oxygen consumption (litres), VCO2 �
carbon dioxide production (litres), N � urinary nitrogen excretion (g) and CH4 �
methane production (litres).For poultry the N coefficient is 1.20 (instead of 5.90), as poultry excrete nitrogen
in the form of uric acid, which is more oxidised than urea.In some situations, discussed in more detail later, heat production has to be es-
timated from oxygen consumption alone. If a respiratory quotient of 0.82 and athermal equivalent of 20.0 kJ/l are assumed, then departures from this RQ in therange of 0.7–1.0 cause a maximum bias of no more than 3.5 per cent in the estimateof heat production.A further simplification is possible in respect of protein metab-olism.The thermal equivalent of oxygen used for protein oxidation is 18.8 kJ/l, notvery different from the value of 20.0 assumed for carbohydrate and fat oxidation.
HP = 16.18 VO2 + 5.16 VCO2 - 5.90 N - 2.42 CH4

Chapter 11 Evaluation of foods: energy content of foods and energy partition within the animal
266
If only a small proportion of the heat production is derived from protein oxidation,then it is unnecessary to assess it separately and urinary nitrogen output need notbe measured.
An example of the calculation of heat production from respiratory exchange isshown in Table 11.2. If the Brouwer equation (Equation 11.3) had been applied tothe respiratory exchange data of Table 11.2, then heat production would have beenestimated as 7858 kJ.
In recent years, the emphasis of scientists studying animal energetics has movedaway from whole-body metabolism towards studying the energy exchange of specificorgans or tissues.The basic methodology of such studies is that catheters are insertedinto the major blood vessels supplying and draining a particular organ. Both the flowand composition of blood are measured in order to allow oxygen uptake and carbondioxide production to be estimated. At the same time, the uptake of other metabo-lites, such as glucose, can also be measured.
Measurement of energy retention by the carbon and nitrogenbalance technique
In indirect calorimetry, using respiratory exchange, heat production is estimated, andenergy retention is calculated as the difference between metabolisable energy intakeand heat production (as in Table 11.2).An alternative approach is to estimate energyretention more directly and to calculate heat production by difference.
The main forms in which energy is stored by the growing and fattening animal areprotein and fat, as carbohydrate reserves of the body are small and relatively con-stant.The quantities of protein and fat stored can be estimated by carrying out a car-bon and nitrogen balance trial – that is, by measuring the amounts of these elements
Table 11.2 Calculation of the heat production of a calf from values for itsrespiratory exchange and urinary nitrogen excretion
Results of the experiment (/24 hours)Oxygen consumption (l) 392.0Carbon dioxide produced (l) 310.7Nitrogen excreted in urine (g) 14.8
Heat from protein metabolismProtein oxidised (g) (14.8 � 6.25) 92.5Heat produced (kJ) (92.5 � 18.0) 1665Oxygen used (l) (92.5 � 0.96) 88.8Carbon dioxide produced (l) (92.5 � 0.77) 71.2
Heat from carbohydrate and fat metabolismOxygen used (l) (392.0 – 88.8) 303.2Carbon dioxide produced (l) (310.7 – 71.2) 239.5Non-protein respiratory quotient (RQ) (239.5/303.2) 0.79Thermal equivalent of oxygen when RQ � 0.79 (kJ/l) 20.0Heat produced (kJ) (303.2 � 20.0) 6064
Total heat produced (kJ) (1665 � 6064) 7729
After Blaxter K L, Graham McC and Rook J A F 1955 Journal of Agricultural Science, Cambridge 45: 10.

Animal calorimetry: methods for measuring heat production and energy retention
267
BOX 11.4 Measurement of respiratory exchange using respiration chambers
The apparatus most commonly used for farm animals is a respiration chamber.The simplest type ofchamber, the closed-circuit type (Fig. 11.4a), consists of an airtight chamber for the animal togetherwith vessels holding absorbents for carbon dioxide and water vapour.The chamber incorporates de-vices for feeding, watering and even milking the animal.The oxygen used by the animal is replacedfrom a metered supply.At the end of a trial period (24 hours), the carbon dioxide produced can bemeasured by weighing the absorbent; any methane produced can be measured by sampling andanalysing the air in the chamber. The main disadvantage of the closed-circuit chamber is that largequantities of absorbents are required; thus, for a cow, 100 kg of soda lime would be needed eachday to absorb carbon dioxide and 250 kg of silica gel to absorb water vapour.
In the alternative, open-circuit type of chamber (Fig. 11.4b), air is drawn through the chamber ata metered rate and sampled for analysis on entry and exit.Thus, carbon dioxide production, methaneproduction and oxygen consumption can be estimated. As the differences in composition betweeninlet and outlet air must be kept small if conditions for the animal are to be kept normal, very accu-rate measures of gas flow and composition are required. Modern equipment, based on infraredanalysers, meet this criterion, and open-circuit chambers have now largely replaced closed-circuitchambers.With some chambers it is possible to alternate between closed- and open-circuit operation.Closed-circuit operation for perhaps 30 minutes, with no gas absorption, produces appreciablechanges in the composition of the chamber air.Then a brief period (about 3 minutes) of open-circuitoperation allows the chamber air to be flushed out through a flow meter and sampling device.
( ) Closed circuita
Valve
Meter
Chamber
Oxygeninlet
Pump
CO and water absorbers2
( ) Open circuitb
Pump Gas meterChamber
Aliquots of entryand exit air foroxygen analysis
Aliquots of exitair for CO andmethane analysis
2 For methaneanalysis
CO absorbers2
Fig. 11.4 Diagrams of respiration chambers.

Chapter 11 Evaluation of foods: energy content of foods and energy partition within the animal
268
entering and leaving the body and so, by difference, the amounts retained. The en-ergy retained can then be calculated by multiplying the quantities of nutrients storedby their calorific values.
Both carbon and nitrogen enter the body in food, and nitrogen leaves it in faecesand urine. However, carbon also leaves the body as methane and carbon dioxide.Consequently, the balance trial must therefore be carried out in a respiration cham-ber. The procedure for calculating energy retention from carbon and nitrogen bal-ance data is best illustrated by considering an animal in which storage of both fat andprotein is taking place. In such an animal, intakes of carbon and nitrogen will begreater than the quantities excreted, and the animal is said to be in positive balancewith respect to these elements.The quantity of protein stored is calculated by multi-plying the nitrogen balance by 1000/160 (= 6.25), as body protein is assumed tocontain 160 g N/kg. It also contains 512 g C/kg, and the amount of carbon stored asprotein can therefore be calculated.The remaining carbon is stored as fat, which con-tains 746 g C/kg. Fat storage is therefore calculated by dividing the carbon balance,less that stored as protein, by 0.746.The energy present in the protein and fat storedis then calculated by using average calorific values for body tissue.These values varyfrom one species to another; for cattle and sheep, those now recommended are39.3 MJ/kg for fat and 23.6 MJ/kg for protein.An example of this method of calcu-lating energy retention (and heat production) is shown in Table 11.3.
The advantages of the carbon and nitrogen balance technique are that no measureof oxygen consumption (or RQ) is required and that energy retention is subdividedinto that stored as protein and that stored as fat.
Measuring energy retention by the comparative slaughter technique
Because calorimetric experiments require elaborate apparatus and can only be con-ducted with small numbers of animals, energy retention is often measured in otherways. In many feeding trials the animal’s intake of digestible or metabolisable energycan be measured satisfactorily, but their energy retention can only be estimated fromchanges in liveweight.Weight change, however, provides an inaccurate estimate of en-ergy retention, first because it may simply represent changes in the contents of the gutor bladder, and second because the energy content of true tissue gain varies over awide range depending on the relative proportions of bone, muscle and fat deposited(see Chapter 14).These complications are only partly overcome when energy retention
BOX 11.5 Measurement of respiratory exchange in unconfined animals
Respiratory exchange can be measured without an animal chamber if the subject is fitted with aface mask, which is then connected to either a closed or an open circuit for determining either oxy-gen consumption alone or both oxygen consumption and carbon dioxide production.This method issuitable for short periods of measurement but cannot be used to estimate heat production when theanimal is eating. For longer-term measurements of energy metabolism in unconfined (e.g. grazing)animals, heat production can be estimated with reasonable accuracy from carbon dioxide produc-tion alone.The latter is measured by infusing into the body fluids a source of radio-labelled carbondioxide (14C sodium bicarbonate) and sampling body fluids to determine the degree to which thelabelled carbon dioxide is diluted by that produced by the animal.

Animal calorimetry: methods for measuring heat production and energy retention
269
is in the form of milk or eggs, where energy content can be easily measured becauseenergy retention in these products is invariably accompanied by retention in other tis-sues (e.g. lactating cows are normally gaining or losing weight and energy).
Energy retention can, however, be measured in feeding trials if the energy contentof the animal is estimated at the beginning and end of the experiment. In the com-parative slaughter method, this is done by dividing the animals into two groups andslaughtering one group of animals (the initial slaughter group) at the beginning ofthe trial.The energy content of the slaughtered animals is then determined by bombcalorimetry, the samples used being taken either from the whole, minced body orfrom body tissues that have been separated by dissection.A relationship is then ob-tained between the liveweight of the animals and their energy content, and this isused to predict the initial energy content of animals in the second group. The latterare slaughtered at the end of the trial and treated in the same manner as those in theinitial slaughter group.The energy gained can then be calculated.
Table 11.4 shows an example of the use of the comparative slaughter technique inan experiment in which, for comparative purposes, respiratory exchange calorimetrywas also employed. Cockerels were slaughtered either before or after a 4-day periodin respiration chambers. Their energy gain was calculated as the difference betweeninitial and final body energy content, and deducted from the bird’s knownmetabolisable energy intake to give an estimate of heat production, which agreedwithin 2 per cent with the estimate obtained by respiratory exchange calorimetry.Most comparative slaughter trials would last longer and hence give a greater incre-ment in energy balance than that shown in Table 11.4. It is also worth noting thatcomparative slaughter trials often give lower estimates of energy retention than tri-als conducted with animals in calorimeters, possibly because the former allow moreopportunity for animals to expend energy on muscular activity.
Table 11.3 Calculation of the energy retention and heat production of a sheepfrom its carbon and nitrogen balance
Results of experiment (/ 24 hours) C (g) N (g) Energy (MJ)Intake 684.5 41.67 28.41Excretion in faeces 279.3 13.96 11.47Excretion in urine 33.6 25.41 1.50Excretion in methane 20.3 – 1.49Excretion in CO2 278.0 – –Balance 73.3 2.30 –Intake of metabolisable energy – – 13.95
Protein and fat storageProtein stored (g) (2.3 � 6.25) 14.4Carbon stored as protein (g) (14.4 � 0.512) 7.4Carbon stored as fat (g) (73.3 - 7.4) 65.9Fat stored (g) (65.9/0.746) 88.3
Energy retention and heat productionEnergy stored as protein (MJ) (14.4 � (23.6/1000)) 0.34Energy stored as fat (MJ) (88.3 � (39.3/1000)) 3.47Total energy retention (MJ) (0.34 � 3.47) 3.81Heat production (MJ) 13.95 - 3.81 10.14
After Graham N McC 1955 Journal of Agricultural Science, Cambridge 46: 292.

Chapter 11 Evaluation of foods: energy content of foods and energy partition within the animal
270
The comparative slaughter method requires no elaborate apparatus but is expensiveand laborious when applied to larger animal species.The method becomes less costlyif body composition, and hence energy content, can be measured in the living ani-mal, or, failing that, in the whole, undissected carcass. Several chemical methodshave been developed for estimating body composition in vivo. For most of them theprinciple employed is that the lean body mass of animals (i.e. empty body weightless weight of fat) is relatively constant in composition. For example, in cattle 1 kglean body mass contains 729 g water, 216 g protein and 53 g ash.This means that ifthe weight of water in the living animal can be measured, the weights of protein andash can then be estimated. In addition, if the total weight is known, the weight of fatcan be estimated by subtracting the lean body mass. In practice, total body water canbe estimated by so-called dilution techniques, in which a known quantity of amarker substance is injected into the animal, allowed to equilibrate with body waterand its equilibrium concentration determined. The marker substances most com-monly used are water containing the radioactive isotope of hydrogen tritium, or itsheavy isotope deuterium. One difficulty with these techniques is that the markersmix not only with actual body water but also with water present in the gut (in rumi-nants as much as 30 per cent of total body water may be in gut contents).A secondchemical method for estimating body composition in vivo is based on the constantconcentration of potassium in the lean body mass.
The composition of a carcass is often estimated without dissection or chemicalanalysis from its specific gravity. Fat has an appreciably lower specific gravity thanbone and muscle, and the fatter the carcass, the lower will be its specific gravity.Thespecific gravity of a carcass is determined by weighing it in air and in water, but thismethod has technical difficulties (e.g. air trapped under water) that make it impre-cise. Nevertheless, estimates of energy utilisation obtained by comparative slaughterand specific gravity measurements have been used in the USA to establish a com-plete cattle feeding system (see Chapter 12).
Table 11.4 Use of the comparative slaughter technique to estimate the energyretention and heat production of poultry
Details of birds Initial Final Difference
Liveweight (g) 2755 2823 68Gross energy (kJ) 27491 28170 679Metabolisable energy intake (kJ) 2255Heat production (kJ) (2255–679) 1576Heat production by respiration calorimetry (kJ) 1548
After Fuller H L, Dale N M and Smith C F 1983 Journal of Nutrition 113: 1403.
11.4 UTILISATION OF METABOLISABLE ENERGY
The general relationship between the ME intake of an animal and its energy reten-tion is shown in Fig. 11.5.When ME intake is zero (i.e. the animal is fasted), energyretention is negative; in this situation, the animal uses its reserves to provide energyfor the maintenance of its essential bodily functions, and this energy leaves the ani-mal as heat.As ME intake increases, energy loss (i.e. negative retention) diminishes;

BOX 11.6 Efficiency factors (k) used to describe the efficiency of metabolisable energy(ME) utilisation
Utilisation of metabolisable energy
271
when energy retention is zero, ME intake is sufficient to meet the animal’s require-ment for body maintenance.As ME intake increases further, the animal begins to re-tain energy, either in its body tissues or in products such as milk and eggs.
The slope of the line relating retention to intake is a measure of the efficiency ofME utilisation. For example, if the ME intake of an animal was increased by 10 MJand its retention increased by 7 MJ, then the efficiency of utilisation of ME would becalculated as 7�10 = 0.7. (Conversely, the heat increment would be calculated as3�10 = 0.3 of the ME.) These efficiency values are conventionally called k factors,with the letter k carrying a subscript to indicate the function for which ME is beingused.The commonly used k factors are shown in Box 11.6.
The term kf has been used to denote both the specific efficiency of fat deposition(as indicated above) and the general efficiency of energy deposition in what wereonce called ‘fattening’ animals. Today, the preferred term for the latter use is kg, asanimals are now considered to grow rather than fatten.
Ener
gy
rete
nti
on
(M
J/d
ay)
ME intake (MJ/day)
20
15
10
5
0
−5
−100 10 20 30 40 50
Fig. 11.5 Efficiency of metabolisable energy utilisation (an example based onmetabolisable energy utilisation by a growing ruminant).
k factor Efficiency of ME utilisation for
km Maintenancekp Protein depositionkf Fat depositionkg (or kpf) Growth in generalkl Milk productionkc Foetal growth (the conceptus)kw Work (e.g. in draught animals)kwool Wool growth

Chapter 11 Evaluation of foods: energy content of foods and energy partition within the animal
272
In Fig. 11.5 the line relating ME intake to energy retention changes in slope whenthe ME intake reaches maintenance (energy retention = 0), becoming less steep andindicating a reduction in efficiency. Scientists argue as to whether there should be anabrupt bend (as in Fig. 11.5) or whether the relationship between ME intake and en-ergy retention should be represented by a smooth curve. Conceptually, however, it isconvenient to envisage a difference in the efficiency of ME utilisation below andabove maintenance. The apparently greater efficiency below maintenance is due tothe fact that km is not an absolute measure of the efficiency of energy utilisation fromabsorbed nutrients but is a relative measure of the efficiency with which nutrientsobtained from food can be used to replace energy sources obtained from body re-serves; this rather difficult concept is illustrated later.
An additional feature of Fig. 11.5 is the shaded area on either side of the lines.This is intended to indicate that the efficiency of ME utilisation is quite variable.Weshall see later that the principal causes of this variation in efficiency are, first, the na-ture of the chemical compounds from which ME is derived (hence the nature of thefood and the manner in which it is digested) and, second, the function for whichthese compounds are used by the animal.
Utilisation of metabolisable energy for maintenance
For maintenance purposes, the animal oxidises nutrients absorbed from its foodprincipally to provide energy for work. If no food is provided, then it obtains this en-ergy mainly by the oxidation of body fat.When food is provided, but in quantities in-sufficient to provide all the energy needed for maintenance, the task of providingATP is partially transferred from body fat reserves to the nutrients absorbed. If theenergy derived from these absorbed nutrients is transferred to ATP as efficiently asthat derived from body fat, then no additional heat will be produced, apart from thatassociated specifically with the consumption, digestion and absorption of food. Heatof fermentation comes into this category and also the work of digestion (i.e. heatarising from energy used for mastication of food and its propulsion through the gut,in the absorption of nutrients and in their transport to tissues).
The efficiency of free energy capture when body fats are oxidised and ATP isformed can be calculated from the reactions shown in Chapter 9 to be of the orderof 0.67. For glucose, to take an example of a nutrient, the efficiency is similar, atabout 0.70. One would therefore expect that glucose given to a fasting animal wouldbe utilised without any increase in heat production, or in other words with apparent(calorimetric) efficiency of 1.0. Table 11.5 shows that this is approximately true. Insheep the efficiency is reduced through fermentation losses if the glucose passes intothe rumen, but these losses are avoided if it is infused directly into the abomasum.
Table 11.5 also shows that, as one would expect, dietary fat is used for mainte-nance with high energetic efficiency. However, when protein is used to provide en-ergy for maintenance, there is an appreciable heat increment of about 0.2, which is inpart attributable to the energy required for urea synthesis (see Chapter 9). In rumi-nants, energy for maintenance is absorbed largely in the form of volatile fatty acids.Experiments in which the pure acids have been infused singly into the rumen of fast-ing sheep have shown that there are differences between them in the efficiency withwhich their energy is utilised (Table 11.5). But when the acids are combined intomixtures representing the extremes likely to be found in the rumen, the efficiency ofutilisation is uniform and high. Nevertheless the efficiency is still less than that for

Utilisation of metabolisable energy
273
glucose, and this discrepancy, together with the energy lost through heat of fermen-tation in ruminants, leads one to expect that ME will be utilised more efficiently formaintenance in those animals in which it is absorbed in the form of glucose than inruminants.
Very few experiments have been conducted to determine the efficiency of MEutilisation of foods for maintenance, and these few have been restricted almost en-tirely to ruminant animals fed forages. A selection of the results is presented inTable 11.5.
Most of the ME from forages would have been absorbed in the form of volatilefatty acids. The efficiency of ME utilisation is less, however, than for synthetic mix-tures of these acids, since with whole foods heat losses are increased by heat of fer-mentation and by the energy used for work of digestion. In spite of this, the ME inthese foods was used with quite high efficiency.
Utilisation of metabolisable energy for productive purposes
Although energy may be stored by animals in a wide variety of products – in bodyfat, muscle, milk, eggs and wool – the energy of these products is contained mainly infat and protein (only in milk is much energy stored as carbohydrate). The efficiency
Table 11.5 Efficiency of metabolisable energy utilisation for maintenance from various nutrients and foods
Ruminant Pig etc.a Fowl
Food constituentGlucose 0.94 (1.00)b 0.95 0.89Starch 0.80 0.88 0.97Olive oil 0.97 0.95Casein 0.70 (0.82)b 0.76 0.84
Fermentation productAcetic acid 0.59Propionic acid 0.86Butyric acid 0.76Mixture Ac 0.87Mixture Bd 0.86
ConcentratesMaize 0.80Balanced diets 0.70 0.85 0.90
ForagesDried ryegrass (young) 0.78Dried ryegrass (mature) 0.74Meadow hay 0.70Lucerne hay 0.82Grass silage 0.65–0.71
aIncluding dog and rat.bValues in parentheses are from administration via the duodenum.cMixture A: acetic acid 0.25, propionic acid 0.45, butyric acid 0.30.dMixture B: acetic acid 0.75, propionic acid 0.15, butyric acid 0.10.

Chapter 11 Evaluation of foods: energy content of foods and energy partition within the animal
274
with which ME is used for productive purposes therefore depends largely on the en-ergetic efficiency of the metabolic pathways involved in the synthesis of fat and pro-tein from absorbed nutrients. These pathways have been outlined in Chapter 9. Ingeneral, the synthesis of either fat or protein is a more complicated process than itscatabolism, in the same way that the construction of a building is more difficult thanits demolition. Not only must the building materials be present in the right propor-tions, but also they must arrive on the scene at the right time, and the absence of aparticular material may prevent or seriously impair the whole process. Thus, it wasshown in Chapter 9 that fatty acid synthesis is dependent on a supply of reducedNADP+. Because of the greater complexity of synthetic processes, it is more difficultto estimate their theoretical efficiency.
Utilisation of metabolisable energy for growth
In Chapter 9, the synthesis of a triacylglycerol from acetate and glucose was shownto have a theoretical efficiency of 0.83. A higher value would be expected for fatsynthesis from long-chain fatty acids of dietary origin, but a lower value would beexpected for the formation of fat from protein, as energy would be needed to syn-thesise the urea by which amino acid nitrogen would be excreted. In protein synthe-sis, the energy cost of linking amino acids together is relatively small, and if these arepresent in the right proportions the theoretical efficiency of protein synthesis isabout 0.85 (see Chapter 9). However, if some amino acids have to be synthesisedwhile others undergo deamination, the efficiency will be considerably less; as dis-cussed later, the observed efficiency of protein synthesis is generally much lowerthan the observed efficiency of fat synthesis. The synthesis of lactose from glucosecan be achieved with an efficiency of 0.96 (see Chapter 9), but in the dairy cow theglucose so utilised is largely derived from propionic acid (or possibly amino acids) bygluconeogenesis, and the efficiency of lactose synthesis will be lower.
The figures given above are all calculated from the appropriate metabolic path-ways, and in relating them to the efficiency of ME utilisation it is important to re-member that they will be reduced by those energy losses mentioned earlier (see p. 261) that are directly related to the consumption, digestion and absorption of food.Measuring in an animal the energetic efficiency with which a single body substancesuch as protein is synthesised is complicated by the fact mentioned previously thatanimals seldom store energy as single substances or even as single products. How-ever, when growing animals are storing energy as protein and fat, it is possible to cal-culate, by the mathematical procedure known as regression analysis, the energy usedfor each of these processes. Analyses of this kind have been made for many calori-metric experiments carried out with pigs, and the results are shown in Table 11.6.The actual values are always lower than the theoretical, the discrepancies beingrelatively small for fat deposition but much larger for protein deposition. Thus, forprotein, the value of about 0.5 estimated by calorimetry is much less than thetheoretical value, given earlier, of 0.85. The main reason for this large discrepancy isbelieved to be that protein deposition is not only a matter of protein synthesis but isthe consequence of two processes, synthesis and breakdown. Proteins in most bodytissues are continuously being broken down and resynthesised, by reactions thatgenerate heat.This turnover of protein reduces the calorimetric efficiency of proteindeposition. One would expect that proteins in tissues with a high rate of turnover(such as those in the alimentary tract) would be deposited with particularly low

Utilisation of metabolisable energy
275
calorimetric efficiency, whereas those with little or no turnover would be depositedmore efficiently.Thus, milk proteins, which leave the animal before they can be bro-ken down, should be synthesised with high calorimetric efficiency. For pigs (andother non-ruminants) on normal diets, one would expect the efficiency of ME utili-sation for growth as a whole to be intermediate between the efficiency values foundfor fat and protein deposition. In pigs, protein deposition commonly accounts for 20 per cent of total energy retention and the expected efficiency of ME utilsation forgrowth (kg) would therefore be 0.7. This value has been confirmed by many calori-metric experiments made with pigs.
In poultry, values for the efficiency of ME utilisation for growth are similar tothose found in pigs.They lie in the range 0.60–0.80 but for balanced diets are closeto 0.70.
For ruminants, the efficiency of utilisation of ME for growth is generally lowerthan that for pigs, and it is also more variable, as shown in Table 11.7. When cattleand sheep are fed on diets similar to those commonly given to pigs (i.e. based largelyon cereal-containing concentrates), the efficiency factor kg rarely exceeds 0.62 and istherefore about 10 per cent lower than the mean value for pigs suggested above(0.7). However, kg values for ruminants are much lower and more variable whenthey are fed on forages. The best forages, such as dried immature ryegrass, give kgvalues over 0.5, whereas poor-quality forages, such as wheat straw, give values as lowas 0.2.We shall see later (in Chapter 12) that the kg values of forages for ruminantsare related to their metabolisable energy concentrations.These kg values are clearlyfar below both the theoretical and calorimetric values shown in Table 11.6, and wenow need to consider how they can be explained.
Heat of fermentation, as explained earlier (see p. 261), accounts for part of thelower calorimetric efficiency of growth in ruminants; thus, it would explain much ofthe 10 per cent difference in kg between pigs and ruminants fed on similar, mainlyconcentrate-based diets. However, for a fuller explanation we need to consider the endproducts of digestion in ruminants.We have already seen in Chapter 8 that much of
Table 11.6 Typical values for the efficiency of metabolisable energy utilisation forgrowth in pigs
Form of energy stored Origin of value Substrate or diet Efficiency
Fat (kf) Theoretical Acetate + glucose 0.81Dietary fat 0.99Dietary protein 0.69
Actual (calorimetric) Normal diets 0.74Dietary fat 0.86Dietary carbohydrate 0.76Dietary protein 0.66Volatile fatty acids 0.65–0.71
Protein (kp) Theoretical Amino acids 0.88Actual (calorimetric) Amino acids 0.45–0.55
Protein and fat (kg) Actual Many diets (mean) 0.71Barley 0.60Maize 0.62Soya bean meal 0.48

Chapter 11 Evaluation of foods: energy content of foods and energy partition within the animal
276
the energy of the end products of digestion in ruminants is in the form of volatilefatty acids, with relatively small amounts of energy in the form of lipids, amino acids(from microbial and food protein) and carbohydrates that have escaped rumen fer-mentation. Furthermore, the composition of the volatile fatty acid mixture varies ac-cording to the diet fed, with a higher proportion of acetic acid being produced fromforage diets and a higher proportion of propionic acid being produced from concen-trate diets. At an early stage in the study of energy metabolism of ruminants, it wasrecognised that ME derived from poorly digested forages, such as straws and low-quality hays, was utilised for growth with low efficiency (0.2–0.4; see Table 11.7).Atfirst, this low efficiency was attributed to the ‘work of digestion’, the energy requiredfor mastication of fibrous foods and the propulsion of their undigested residuesthrough the gut. Later, it seemed likely that the high proportion of acetic acid asso-ciated with fibrous foods was responsible for their low kg values.When different mix-tures of volatile fatty acids were infused into the rumen of fattening sheep, largedifferences in kg was observed (see Table 11.7). However, subsequent experiments inwhich less extreme mixtures of volatile fatty acids were used, in which the acid mix-tures were better balanced with other nutrients (e.g. protein) and in which younger(growing rather than fattening) animals were used, showed much smaller effects ofvolatile fatty acid proportions on kg.The current view is that acetic acid derived froma well-balanced diet is used no less efficiently than propionic or butyric acid.Atten-tion has therefore been directed again at the work of digestion as the cause of low ef-ficiency of ME utilisation from low-quality forages.As explained earlier (see p. 262),the gut and associated tissues that are served by the portal blood system (the portal-drained viscera) are very metabolically active and have been shown to account foras much as 50 per cent of the heat increment of feeding in ruminants. As yet, a
Table 11.7 Efficiency of utilisation of metabolisable energy from various nutrientsand foods for growth and fattening in ruminants
Food constituent Fermentation productGlucose 0.54 (0.72)a Acetic acid 0.33–0.60Sucrose 0.58 Propionic acid 0.56Starch 0.64 Butyric acid 0.62Cellulose 0.61 Mixture Ab 0.58Groundnut oil 0.58 Mixture Bc 0.32Mixed proteins 0.51 Lactic acid 0.75Casein 0.50 (0.65)a Ethanol 0.72
Concentrates ForagesBarley 0.60 Dried ryegrass (young) 0.52Oats 0.61 Dried ryegrass (mature) 0.34Maize 0.62 Meadow hay 0.30Groundnut meal 0.54 Lucerne hay 0.52Soya bean meal 0.48 Grass silages 0.21–0.60
Wheat straw 0.24Dried grass (chopped) 0.31Dried grass (pelleted) 0.46
aValues in parentheses are for administration via the duodenum.bMixture A: acetic acid 0.25, propionic acid 0.45, butyric acid 0.30.cMixture B: acetic acid 0.75, propionic acid 0.15, butyric acid 0.10.

Utilisation of metabolisable energy
277
relationship between the fibrousness of a diet and the heat increment of feeding hasnot been established, but the processing of forages by grinding and pelleting hasbeen shown to improve the efficiency of ME utilisation (see Table 11.7).
Whatever the explanation for the poor efficiency of ME utilisation for growth byruminants given low-quality forages, the practical problem remains. Ruminant pro-duction systems based on such feeds, as is the case in most of the tropical develop-ing countries, are characterised by poor efficiency. Nevertheless, it is now recognisedthat the efficiency can be improved by ensuring that the volatile fatty acids arisingfrom digestion of poor-quality forages are balanced by supplements of other nutri-ents, especially protein and a-linked polysaccharides, which can escape fermentationin the rumen.
Utilisation of metabolisable energy for milk and egg production
The production of milk and eggs rarely occurs alone and is usually accompanied byeither gains or losses of fat or protein from the body of the lactating mammal or lay-ing bird.This means that estimates of the partial efficiency of ME utilisation for milkor egg synthesis are usually made by mathematical partition of the ME utilised. Asthe synthesis of milk or eggs requires more complex diets, it is not possible to pro-vide efficiency coefficients for single nutrients as was done for maintenance andgrowth in Tables 11.5–11.7.
Over the past 40 years, many energy balance trials have been conducted with lac-tating cows, principally in the USA and in the Netherlands; similar trials have alsobeen conducted using sheep and goats. Analysis of the results of these experimentshas shown that the efficiency of ME utilisation for milk synthesis (kl) varies relativelylittle over a wide range of diets, 0.56–0.66 for diets in the range 7.0–13.0 MJ/kgDM, respectively. Given the type of diet normally given to lactating ruminants, aconstant value of 0.60–0.62 is often adopted. From the same analysis, it has alsobeen calculated that when lactating animals are gaining energy (mainly as fat), theefficiency of ME utilisation for gain (kg) is only slightly less that that for milk synthe-sis (0.60).Thus, kg for lactating ruminants is at the top end of the range of efficiencyfactors for non-lactating ruminants (see Table 11.7). Lactating animals can also mo-bilise the energy in body reserves to support milk synthesis with an efficiency ofabout 0.84 (kt).This means that a cow that builds up her energy reserves towards theend of the first lactation, and then mobilises them for milk synthesis at the start ofthe next lactation, has an overall efficiency of 0.60 * 0.84 = 0.50.
Over the past 10 years a substantial number of calorimetric measurements havebeen conducted using dairy cows in the UK, and a new rationing system for dairycows (Feed into Milk 2004) has adopted a slightly different approach to the calcula-tion of ME requirements based on modelling the relationship between milk energyoutput and ME intake (see Chapter 12). These data indicate a curvilinear relation-ship between ME intake and milk energy output, as suggested for growing animals(see p. 272), and a variable value for (kl). The mathematically derived values for kgand kt from these studies are 0.65 and 0.78, respectively.
The higher efficiency of ME utilisation by lactating animals compared with grow-ing animals is probably the result of simpler forms of energy being stored in milk,namely lactose and both long - and short-chain fatty acids. Milk protein may also besynthesised efficiently because it is rapidly removed from the body and not subjectto the same turnover of amino acids experienced by other body proteins. In lactating

Chapter 11 Evaluation of foods: energy content of foods and energy partition within the animal
278
sows the efficiency of ME utilisation for milk synthesis is about the same as kg ingrowing pigs (0.65–0.70).
The efficiency of ME utilisation for egg synthesis in laying hens has been esti-mated to be in the range 0.60–0.80, with a mean value of 0.69. For egg protein syn-thesis the efficiency is estimated to be 0.45–0.50, and for egg lipids 0.75–0.80. Thesynthesis of body tissue in laying hens is also highly efficient (0.75–0.80).
Other factors affecting the utilisation of metabolisable energy
Associative effects
In Chapter 10 it was explained that the digestibility of a food is influenced not onlyby its own composition but also by the composition of other foods consumed with it.Associative effects of this kind have also been observed in relation to the efficiencyof ME utilisation. In one experiment, ME derived from maize meal was used for gainwith an apparent efficiency varying between 0.58 and 0.74, depending on the natureof the basal diet to which it was added. In ruminants, such differences are likely toarise through variations in the way in which the whole diet is digested, and hence inthe form in which energy substrates are absorbed. The implications are that valuesfor the efficiency of ME utilisation for individual foods are of limited significance.
Balance of nutrients
The effects of the relative proportions of nutrients in a diet have been partly coveredabove. However, a fattening animal will tend to use metabolisable energy more effi-ciently if it is provided as carbohydrate rather than protein. Similarly, if a growinganimal is provided with insufficient protein, or with insufficient amounts of a partic-ular amino acid, then protein synthesis will be reduced and it will tend to store en-ergy as fat rather than protein. In this situation, the efficiency of ME utilisation willprobably be altered.
Mineral and vitamin deficiencies can also interfere with the efficiency of MEutilisation. A deficiency of phosphorus has been shown to reduce the efficiency ofME utilisation in cattle by about 10 per cent.This effect is hardly surprising given thevital role of phosphorus in the energy-yielding reactions associated with intermedi-ary metabolism.
SUMMARY
1. The gross energy (GE) content of foods is meas-ured as the heat of combustion in a bombcalorimeter. Typical values are 17.5 MJ/kg, 23.6 MJ/kg and 39.3 MJ/kg DM for carbohy-drates, proteins and fats, respectively, with com-mon feeds being approximately 18.4 MJ/kg DM.
2. The digestible energy (DE) of a food is its GEminus the energy excreted in the faeces (bothexpressed as MJ/kg DM of food consumed).
3. The metabolisable energy (ME) of a food is itsGE minus the energy excreted in faeces, urineand methane (all expressed as MJ/kg DM foodconsumed).
4. Methane production by ruminants is usuallymeasured using a respiration chamber. How-ever, indirect methods such as the sulphurhexafluoride (SF6) technique may also beused.

Questions
279
5. Poultry excrete faeces and urine together (butnegligible methane). Apparent ME measure-ments (AME) can be corrected for endogenouslosses (measured in fasted birds) to provide estimates of true metabolisable energy (TME).
6. In ruminants, losses of energy in urine andmethane are relatively constant (amountingto about 19 per cent of DE) but may be af-fected by diet (e.g. high protein intake willincrease urine energy loss).
7. In addition to their energy losses in faeces,urine and methane, animals also lose energyas heat. Part of their heat loss arises from thework done by the animal in digesting andmetabolising food (heat increment of feed-ing). The remainder, called the basal or fast-ing metabolism, arises from the work doneby the animal associated with essential bodyprocesses (i.e. maintenance).
8. The net energy (NE) value of a food is calcu-lated by subtracting the heat increment fromits ME value. Net energy is used by the animalto meet its maintenance requirements and toform new body tissues (growth) or products(milk or eggs). The energy of these tissuesand products is known as energy retention.
9. The heat lost by animals may be measured di-rectly in an enclosed chamber called an ani-mal calorimeter. Alternatively, it may beestimated from the animal’s respiratory ex-change (oxygen consumption and carbondioxide production) in a respiration chamber.
10. Energy retention may be estimated indirectlyas ME intake minus heat production, or di-rectly from the animal’s carbon and nitrogenretention in a respiration chamber. It mayalso be measured using the comparativeslaughter technique, where a known amountof ME is given and body composition ismeasured at the beginning and end of theexperiment.
11. The two most important measurements whenevaluating food for energy are the ME valueand the efficiency of ME utilisation (k). Thelatter is calculated as NE output/ME intakeand varies depending on the species of ani-mal, the process for which ME is being usedand the nature of ME supply.
12. Foods with high ME values tend to havehigher k values because they are digestedand metabolised with less energy expendi-ture. Ruminants have lower k values than donon-ruminants, mainly because of the heatarising from microbial metabolism (heat offermentation).
13. The efficiency of ME utilisation for mainte-nance (km) is 0.7–0.8, and for tissue growth(kg) is 0.4–0.6, depending on the relativeproportion of protein and fat retained. Theefficiency of protein retention (kp) is lower(0.45–0.55) than that of fat retention (kf,0.65–0.85). For milk synthesis the efficiency(kl) is about 0.62 and for egg production0.70.
QUESTIONS
11.1 A sheep consuming 1.2 kg/day silage DM containing 19.0 MJ GE/kg excreted6.0 MJ GE/day in the faeces, 1.56 MJ GE/day in urine and 1.80 MJ GE/day asmethane. Calculate the DE and ME content of the silage.
11.2 The energy retention of the sheep used in Question 1 was measured by placingit in a respiration chamber. Whilst in the chamber, the sheep consumed 536 loxygen and excreted 429 l of carbon dioxide, 45.8 l of methane and 19.0 g ofurinary nitrogen. Using the Brouwer equation, calculate its heat productionand energy retention.
11.3 A pig in a respiration chamber stored 182.5 g carbon and 10.4 g nitrogen eachday. Calculate its protein and fat deposition and the energy content of tissue gain.

11.4 A growing steer was offered 8.0 kg DM maize silage (ME: 11.0 MJ/kg DM) andretained 12.0 MJ/day in its tissues. Its fasting metabolism (FM) was 42.0MJ/day and the efficiency of ME utilisation for maintenance (km) was 0.7. Cal-culate the efficiency of ME utilisation for gain (kg).
FURTHER READING
Blaxter K L 1967 The Energy Metabolism of Ruminants, London, Hutchinson.
Blaxter K L 1989 Energy Metabolism in Animals and Man, Cambridge, Cambridge UniversityPress.
McLean J A and Tobin G 1987 Animal and Human Calorimetry, Cambridge, CambridgeUniversity Press.
McCracken K, Unsworth E F and Wylie A R G 1998 Energy Metabolism of Farm Animals,Wallingford, CABI.
Minson D J 1990 Forage in Ruminant Nutrition, New York,Academic Press.
Reid J T, White C D, Anrique R and Fortin A 1980 Nutritional energetics of livestock: somepresent boundaries of knowledge and future research needs. Journal of Animal Science51: 1393–415.
Chapter 11 Evaluation of foods: energy content of foods and energy partition within the animal
280
281
12.1 Energy systems and energy models
12.2 Energy systems for ruminants
12.3 Energy systems for pigs and poultry
12.4 Energy systems for horses
12.5 Predicting the energy value of foods
For the farmer or nutritional advisor there are two essential steps in the scientific rationingof animals. First, the nutrient requirements of the animal must be assessed; second,foods must be selected to satisfy these requirements. This balance between supply anddemand is made separately for each nutrient. However, in most cases the nutrient giventop priority is energy. There are good reasons for this. In the first place energy-yieldingconstituents of foods such as carbohydrates are those present in the food in the great-est quantity. Consequently, if a diet is formulated to meet the requirement for other nu-trients first, but is then found to be deficient in energy, major changes to the foodstuffsused will probably be required. In contrast, a mineral or vitamin deficiency can often berectified very easily by the provision of a concentrated supplement.
A further feature of energy-yielding constituents that distinguishes them from othersis the manner in which animals respond to changes in energy supply. For example,whereas the performance of a steer gaining at 1.0 kg/day may eventually be reduced ifit is given a diet that is deficient in a particular nutrient, increases in the supply of a sin-gle nutrient above the requirement generally have little effect. Increasing the level ofvitamin A supplied to twice the requirement is unlikely to affect its liveweight gain(although it might increase its vitamin A reserves). However, if the supply of energy isincreased, the animal will attempt to retain more energy either in the form of protein(if nitrogen intake is adequate) or in the form of fat and its liveweight gain will in-crease. Energy is the main nutrient limiting animal production, and animals tend toshow a continuous response to changes in energy supply. If other nutrients are presentin quantities that are only just sufficient to meet requirements, then the response to anincrease in energy supply is likely to be an undesirable one. Increasing the storage ofbody fat, for example, is likely to increase the requirement for the minerals and vita-mins associated with body fat synthesis and therefore precipitate a deficiency of thesenutrients. When formulating diets, it is essential to ensure that the animal’s energy re-quirement is satisfied and that the correct balance between energy and other nutrientsis maintained.
12 Evaluation of foods: systems for expressing the energy value of foods

Chapter 12 Evaluation of foods: systems for expressing the energy value of foods
282
12.1 ENERGY SYSTEMS AND ENERGY MODELS
An energy system is essentially a set of rules relating energy supply to energy require-ments. The system can be used either to predict animal performance from a givenlevel of energy supply or to calculate the energy supply required to promote a par-ticular level of performance. The simplest energy systems consist of two sets of fig-ures, one set reflecting the animal’s energy requirements, and the other set the energyvalues of foods. Ideally both sets of figures should be expressed in similar units. Forexample, if an animal growing at a rate of 1.0 kg per day stores 15.0 MJ of energy,then its net energy requirement for growth would be 15.0 MJ/kg gain. If the food tobe given contained 5.0 MJ of net energy per kilogram, then the quantity required caneasily be calculated as . In this example, both the animal’s requirementfor energy and the energy value of its food are expressed in terms of net energy(NE), and the system used is described as a net energy system.We saw in the previ-ous chapter, however, that the NE content of a food is not a fixed value but variesdepending on the species of animal, the productive process and the nature of energysupply. For example, metabolisable energy supplied by a food is used more efficientlyfor maintenance than for growth (or for milk or egg production). Consequently, afood will have at least two NE values. For this reason, it may be preferable to state theenergy content of foods in units that are less variable, and in fact most energy systemsare based on metabolisable energy (ME) as the measure of energy supply. However,when food energy supply is expressed as ME and animal energy requirements areexpressed as NE, it is not possible to equate one with the other.To bring them togetheran additional factor is needed in the system, the efficiency of ME utilisation (k).Thus, in the example given above, if the energy content of the food was expressedas 10.0 MJ ME per kilogram and the efficiency of ME utilisation for growth (kg)was 0.5, the NE content of the food would be calculated as as before.
The use of efficiency factors allows energy systems to be more detailed and morecomplex than they would be if based solely on energy supply and requirements.Thus, it would be possible to subdivide food energy supply into that provided byprotein, fat and carbohydrate (energy substrates). Similarly, an animal’s energy re-quirement could be subdivided into that required for deposition of protein and thatrequired for the deposition of fat. Different efficiency constants could then be in-cluded to represent the biochemical pathways linking energy substrate supply to dif-ferent forms of energy retention.The system would then be what is commonly calleda ‘model’, although there is no sharp distinction between energy systems and models(energy systems can be described as simple models). Energy models are often highlycomplex and are generally intended as scientific rather than practical tools.They aredesigned to incorporate all the relevant scientific information that is currently avail-able, and their operation is useful in identifying gaps in current knowledge. In grow-ing animals they can be used to predict not only energy retention and growth ratebut also the way in which energy is partitioned between different tissues and organswithin an animal’s body. In the case of lactating animals, they can be used to predictenergy partition between different body tissues and milk constituents.
Such complexity is not included in current energy systems. However, the increas-ing use of computers for ration formulation (even on farm) makes it easier for prac-tical systems to become more complex and detailed without becoming unworkable.
10 * 0.5 = 5.0 MJ/kg
15/5 = 3 kg

Energy systems for ruminants
283
Nevertheless, in this chapter, the emphasis will be on practical energy systems ratherthan models. A book edited by M K Theodorou and J France (2000) (see Furtherreading) describes current developments in both systems and models.
Before some actual energy systems are discussed, two further points must be made.First, as described in the previous chapter, the techniques used to assess the energycontent of foods are often complicated, laborious and expensive. Consequently, theycannot be applied, for example, to samples of hay or silage supplied by a farmer toan advisory chemist. For this reason, an essential feature of most energy systems is amethod for predicting the energy content of foods from characteristics than can bemore easily determined in the laboratory. Second, it is important to realise that en-ergy systems for herbivores (ruminants and horses) are more complex than thoseused for pigs and poultry. The main reasons for this are the greater complexity of thedigestive tract (see Chapter 8) and the greater variety of foods used.
12.2 ENERGY SYSTEMS FOR RUMINANTS
Early energy systems
Energy systems have a history going back to the first half of the nineteenth century,but they did not provide an adequate description of energy utilisation until methodsof animal calorimetry became available in the second half of that century. Around1900, H P Armsby at the University of Pennsylvania and O Kellner at the MöckernExperiment Station in Germany used the results of their calorimetric studies todevise energy systems based on the NE value of foods. These systems differed insome respects, most evidently in the units used. Armsby expressed NE values interms of calories (the unit preceding joules), whereas Kellner, believing that farmerswould have difficulty in understanding calories, expressed NE values of foods rela-tive to the NE value of the common food constituent starch. For example, if the NEvalue of barley was found to be 1.91 Mcal (megacalories) per kilogram, and that ofstarch 2.36 Mcal/kg, then 1 kg of barley was calculated to have a starch equivalent of
. Both Kellner’s and Armsby’s systems encountered difficultiesbecause of differences in the NE values of foods for maintenance and growth, etc.,and they used approximations to avoid these problems. Kellner’s starch equivalentsystem was used (mainly in Europe) as the basis of practical rationing systems untilthe 1970s.A full description of the starch equivalent system was included in the firsttwo editions of this book (1966 and 1973).
Armsby’s NE system was incorporated in what was at one time the standard ref-erence work on the feeding of livestock in the USA, F B Morrison’s Feeds and Feed-ing, but was not much used in practice.The preferred system in the Americas was formany years the total digestible nutrients (TDN) system.The total digestible nutrientcontent of a food was calculated as the combined weight in 100 kg of food of digestiblecrude protein and digestible carbohydrate (crude fibre plus nitrogen-free extractives),plus 2.25 times the weight of digestible ether extract.The ether extract is multipliedby 2.25 because the energy value of fat is approximately 2.25 times higher than that ofcarbohydrate. If the digestible crude protein plus carbohydrate of the hay in Box 10.1(see p. 239) is calculated as the digestible organic matter minus the digestible etherextract (i.e. 515 - 8 = 507), then the TDN content would be calculated as 507 + (8 *2.25) = 525 g/kg, or 52.5 kg/100kg.The TDN system, like Kellner’s starch equivalent
1.91/2.36 = 0.81 kg

Chapter 12 Evaluation of foods: systems for expressing the energy value of foods
284
system, employed units that were not units of energy. However,TDN values can fairlyeasily be translated into ME values. Both systems are now virtually obsolete.
The UK metabolisable energy system
In the UK the energy system currently used for ruminants was first proposed by theAgricultural Research Council in 1965.The original system was then revised by theCouncil in 1980 and published as The Nutrient Requirements of Ruminant Live-stock (ARC 1980). In 1982, a working party consisting of research, advisory andcommercial nutritionists was set up to consider and test the ARC 1980 system andtheir recommendations, published in 1990, were implemented in the UK by meansof an advisory manual entitled Energy and Protein Requirements of Ruminants in1993. In 2004 an improved system, designed specifically for dairy cows, Feed intoMilk, was introduced (see Further reading). The description of the system providedhere is initially restricted to its essential features and its simplest forms of operation.The versions of the system that are used in practice include some modifications thatwill be discussed later. The system allows for the factorial calculation of the energyrequirements of six classes of livestock (cattle and sheep that are growing, pregnantor lactating), but the examples given in this chapter will be restricted to growing andlactating cattle.The energy requirements of the other classes of ruminants are referredto in later chapters.
In the UK metabolisable energy system, the energy values of foods are expressed interms of ME, and the ME value of a diet is calculated by adding together the relativecontributions from the foods making up that diet.The energy requirements of animalsare expressed in absolute terms, as NE. The essential feature of the system, linkingenergy supply with requirements, is a series of equations to predict the efficienciesof ME utilisation (k) for maintenance, pregnancy, growth and lactation (Table 12.1).These predictions are based on the ME concentration of the diet (M/D), although thisis expressed as the fraction ME/GE (sometimes called metabolisability), rather thanMJ/kg DM. Metabolisability can be calculated by dividing the ME content of the dietby its GE content, making the assumption that the mean gross energy value of food is18.4 MJ/kg DM (although this factor is too high for foods with a high ash content andtoo low for those with a high protein or fat content).The efficiency values presentedin Table 12.1 illustrate several points made earlier (in this chapter and in Chapter 11).
Table 12.1 Efficiency of metabolisable energy utilisation by ruminants formaintenance, pregnancy, growth and lactation
Dietary ME concentration (MJ/kg DM) 7.4 9.2 11.0 12.9
Metabolisability (qm) 0.4 0.5 0.6 0.7Maintenance (km) 0.643 0.678 0.714 0.750Pregnancy (kc)a 0.133 0.133 0.133 0.133Growth (kg) 0.218 0.396 0.474 0.552Lactation (kl) 0.560 0.595 0.630 0.665
Equations: km = 0.35qm + 0.503kg = 0.78qm + 0.006kl = 0.35qm + 0.420
a Constant value with no influence of qm.

Energy systems for ruminants
285
Although km and kl vary with metabolisability (qm), they vary much less than kg. Putanother way, kg for a low-quality food (qm = 0.4) is 50 per cent of km, whereas kg fora high-quality food (qm = 0.7) is 74 per cent of km.
The system can be used in two ways, either to predict the performance of animalsgiven a specific ration or to formulate a ration for a desired level of performance.Operation of the system is illustrated for beef cattle in Boxes 12.1 and 12.2 and anexample of ration formulation for dairy cows is presented in Box 12.3. Ration for-mulation is often more difficult than prediction of performance because the ME con-centration of the ration cannot be calculated until the ration has been formulated.This means that for factors that are dependent on qm, provisional data must be usedinitially, and the calculations have to be repeated until the factors and diet matcheach other.The repetition of calculations (known as iteration) is easily carried out bya computer, but if a computer is not available the approximate method illustrated inBox 12.2 can be used. For convenience, the example in Box 12.2 starts at the endpoint of the example in Box 12.1.
A new term required for Box 12.2 is kmp, the average efficiency with which ME isused for the combined functions of maintenance and production.This factor will beintermediate to km and kg and its value will vary depending on the production level
BOX 12.1 Prediction of performance in growing cattle
A 300 kg steer is offered a ration containing 4.5 kg hay (DM 890 g/kg; ME 8.0 MJ/kg DM) and2.2 kg of a cereal-based concentrate (DM 900 g/kg; ME 14.0 MJ/kg DM).
Calculation of energy supply (MJ ME/day)
Fresh intake (kg/day) Dry matter intake (kg/day) ME intake (MJ/day)
Hay 4.5 4.0 32Concentrate 2.2 2.0 28
Total 6.7 6.0 60
Calculation of energy requirements (MJ NE/day)
Maintenance (MJ/day) 23.0Liveweight gain (MJ/kg gain) 15.0km (from Table 12.1) 0.692kg (from Table 12.1) 0.427
Prediction of performance
ME requirement for maintenance (MJ/day) (23/0.692) 33.0ME available for gain (MJ/day) (60 - 33) 27.0NE gained (MJ/day) (27 * 0.427) 11.5Liveweight gain (kg/day) (11.5/15.0) 0.77
ME concentration of the ration (MJ/kg DM) (60/6) 10.0Metabolisability (qm) (10.0/18.4) 0.54

Chapter 12 Evaluation of foods: systems for expressing the energy value of foods
286
BOX 12.2 Ration formulation for growing cattle
A 300 kg steer is required to grow at a rate of 0.77 kg/day on a diet consisting of 3.0 kg hay (DM890 g/kg; ME 8.0 MJ/kg DM) and an unknown quantity of concentrate (DM 900 g/kg; ME 14.0 MJ/kg DM).
of the animal. It is calculated from the relative requirements of NE for maintenanceand production by the following formula:
The relative proportions of NE required for maintenance and production, calculatedas (NEm + NEg)�NEm, is sometimes referred to as animal production level (APL). Inthis example, the APL would be calculated as: (23 + 11.5)�23 = 1.5.
Prediction of performance in dairy cows is more difficult than in growing cattleand is complicated by the fact that cows are often gaining or losing weight at thesame time as producing milk. In order to predict milk production, estimates of bothmilk composition and liveweight change, are required. Similarly, in order to predictliveweight change, an estimate of milk production would be required. In reality, cowsare likely to partition energy supply between different body tissues and milk con-stituents, and predicting how they will respond to changes in energy supply presentsan ongoing challenge to nutritional research.
Ration formulation for dairy cows can be as complicated as it is for beef cattle be-cause the efficiency of ME utilisation for lactation varies with diet M/D and qm (see
kmp = (NEm + NEg)>(NEm>km + NEg>kg)
Calculation of energy requirement (MJ NE/day)
Maintenance 23.0Liveweight gain (0.77 kg/day) 11.5
Total 34.5
Ration formulation
NE supplied from hay (MJ/day) (3 * 0.89 * 4.03) 10.8NE required from concentrate (MJ/day) 34.5 – 10.80 23.7Concentrate DM required (kg/day) 23.7�9.84 2.4Fresh concentrate required (kg/day) 2.4�0.9 2.7
Food and efficiency data
Hay Concentrate
Metabolisability (qm) 0.435 0.760km 0.655 0.769kg 0.345 0.599kmp 0.504 0.703Net energy (MJ/kg DM) 4.03 9.84
Therefore, the ration required should consist of 3.0 kg hay and 2.7 kg concentrate per day.

Energy systems for ruminants
287
BOX 12.3 Ration formulation for dairy cows
A 600 kg cow is required to produce 30 l of milk per day (40 g/kg fat and 32 g/kg protein) on a rationconsisting of grass silage (DM 250 g/kg; ME 10.5 MJ/kg DM) and dairy concentrate (DM 860 g/kg;ME 13.0 MJ/kg DM). It is anticipated that the cow will consume 18.0 kg DM/day.
Table 12.1). However, in practice, some simplification is possible because the energyconcentration of dairy cow diets does not vary over such a wide range as that ofgrowing cattle, and it is reasonable to assume constant values. If km is assumed to be0.72 and kl is assumed to be 0.62, then ration formulation becomes relatively easy(see Box 12.3).The gross energy content of milk, and therefore the NE required formilk production, varies depending on its fat and protein content. In Box 12.3 the fatand protein content of the milk are assumed to be 40 g/kg and 32 g/kg, respectively,and the corresponding NE requirement for milk production is 3.12 MJ/kg. In prac-tice, it is also important to formulate diets that meet the animal’s energy require-ments at the lowest cost, within the constraint of dry matter intake (DMI). This canbe done by computer using a mathematical technique known as linear programming.However, a simple method of doing this, assuming that silage is the cheapest rationcomponent, is illustrated in Box 12.3. Ration formulation for dairy cows is often
ME concentration of the ration (MJ/kg DM) 209.0�18.0 11.6Metabolisability (qm) 11.6�18.4 0.63
Silage DM (kg/day) (18.0 * (13.0 - 11.6))�(13.0 - 10.5) 10.1Concentrate DM (kg/day) (18.0 - 10.1) 7.9Fresh silage (kg/day) (10.1�0.25) 40.4Fresh concentrate (kg/day) (7.9�0.86) 9.2
Calculation of energy requirements (MJ/day)
NE k ME
Maintenance 41.0 0.72 57.0Milk production 30 * 3.12 93.6 0.62 152.0
Total 134.6 209.0
Ration formulation
The relative proportions of silage and dairy concentrate required to satisfy the energy requirementswithin the constraint of dry matter intake can be calculated using the following equation:
where DMI = dry matter intake (kg), MC = ME content of the concentrate (MJ/kg DM), MF = MEcontent of the forage (MJ/kg DM) and M/D = energy concentration in ration required (MJ/kg DM).
Forage DM = (DMI * (MC - M>D))>(MC - MF)
Therefore, the ration required should consist of 40.4 kg silage and 9.2 kg dairy concentrate per day.

Chapter 12 Evaluation of foods: systems for expressing the energy value of foods
288
complicated by changes in body energy reserves. If cows are gaining weight and stor-ing body energy as fat, then their requirements need to be considered in term ofthree components: maintenance, milk production and tissue gain.Alternatively, if cowsare losing weight, then allowance must be made for the energy contributed frommobilisation of body fat reserves towards milk production.
Refinements of the UK metabolisable energy system
As the food intake of an animal increases, the metabolisability of the food declinesowing to an increase in rate of passage and a reduction in rumen retention time (seep. 260). Food intake can be defined as level of feeding, which is the ME intake rela-tive to that required for maintenance.Thus, in Box 12.1 the level of feeding would becalculated as 60/33 = 1.82. It must be noted, however, that this is not exactly thesame as the animal production level (APL), as the former is calculated in ME and thelatter in NE. For growing cattle the level of feeding is commonly 2–2.5, but for lactatingdairy cows and ewes it rises to 3–5. In the current version of the ME system, the MErequirement of lactating ewes (and until recently cows) is increased by 1.8 per centfor each unit increase in level of feeding above 1.Thus, for ewes with a level of feed-ing of 3, the calculated ME requirement would be increased by 2 * 1.8 = 3.6 per centto account for the effects of increasing food intake on the ME content of the ration (al-though it would be more logical to apply this correction for feeding level to the sup-ply side of the system).The effect of animal species (sheep v. cattle) and feeding levelon the ME concentration of foods has recently been re-evaluated.As a result, in theFeed into Milk system (FiM) (see Thomas 2004), it is recommended that the ME con-centration of foods fed at high production levels to dairy cows should only be re-duced by 2 per cent compared with values determined at maintenance with sheep.
As suggested in Chapter 11, increasing the energy intake of growing animals hasbeen shown to result in a progressive reduction in energy retention.This curvilinear-ity indicates an effect of level of feeding on the efficiency of ME utilisation. Forgrowing cattle kg is assumed to have its normal predicted level when the level offeeding is twice maintenance. However, if the level of feeding is greater than this kgis reduced, and if the level of feeding is less than this kg is increased. For example, ifcattle on a diet containing 10 MJ/kg DM are fed at 2.5 times maintenance, kg wouldbe reduced from 0.43 to 0.39.The same correction applies to growing lambs. In thecurrent version of the ME system the curvilinear relationship between net energy re-tention (R) and ME intake (I) in growing animals, both scaled by fasting metabolism,is described as follows:
where B = km/(km - kg) and k = km * ln(km/kg).Another refinement to the ME system that has been advocated but not generally
adopted is to modify kg depending on the nature of the diet. Evidence suggests thatin addition to varying with diet metabolisability and productive process, kg also varieswith the nature of the diet. For example, when diets containing 11 MJ/kg DM are for-mulated from high-quality forage, or poorer-quality forage plus concentrates, theconcentrate-based diet will have a kg value that is about 5 per cent higher than thatof the forage-based diet.Within forages, there is evidence that kg values are greaterfor temperate first-growth (spring) material than later growths with the same MEconcentration, and are higher for temperate than for tropical forages. However, it is
R = B(1 - e-kI) - I

Energy systems for ruminants
289
−0.4
−0.20.2 0.6 1.0 1.4 1.8 2.2
0.0
0.2
0.4
0.6
0.8
1.0
1.2
MEI directed towards milk productionMilk
en
erg
y d
eriv
ed f
rom
ME k1 = Δy/Δx
Δy
Δx
Fig. 12.1 Relationship between milk energy derived from metabolisable energyintake (MJ/kg W0.75) and metabolisable energy directed towards milk production(MJ/kg W 0.75).
From Thomas C 2004 Feed into Milk: A New Applied Feeding System for Dairy Cows, Nottingham,Nottingham University Press.
difficult to classify diets into different categories, and consequently the single equa-tion presented in Table 12.1 is used in the current version of the ME system.
The ME system as presented provides a sound basis for the scientific rationing ofruminant animals. However, evidence suggests that it does not adequately describethe energy requirements of modern high genetic merit dairy cows. Consequently, FiM2004 using a database of calorimetric measurements from high genetic merit cowsgiven diets representative of UK feeding practices, adopted a different approach tothe calculation of ME requirements based on modelling the relationship betweenmilk energy output (El) and ME intake. Using this approach, the efficiency of MEutilisation for lactation (kl) is defined as follows:
For example, if a group of dairy cows were producing 35 l/day of milk containing3.2 MJ/l, then milk energy output would be 109 MJ/day. If these same cows had adietary ME intake available for milk production of 175 MJ/day, then kl would becalculated as 109/175 = 0.622. For cows that are gaining weight (positive energy bal-ance), dietary ME available for milk production is calculated by subtracting the MEused for weight gain. Similarly, for cows that are losing weight (negative energy bal-ance), milk energy output is reduced by subtracting the net energy derived fromweight loss. In order to make these adjustments, an iterative statistical approach wasused to determine the efficiency of body energy utilisation for lactation (kt) and theefficiency of ME utilisation for gain (kg) to be 0.78 and 0.65, respectively. Once thesevalues had been obtained and ME intake and milk energy output adjusted accord-ingly, a curvilinear relationship between dietary ME intake available for milk produc-tion and milk energy output derived from dietary ME was obtained (Fig. 12.1).
The approach adopted by FiM 2004 for calculating the ME requirement of dairy cowsinvolves first calculating the ME requirement for weight gain, or the net energy avail-able for milk production from weight loss, and then calculating the ME requirement
kl =
milk energy derived from dietary MEdietary ME available for milk production

Chapter 12 Evaluation of foods: systems for expressing the energy value of foods
290
for maintenance and milk production from milk energy output corrected for weightloss (Elcorr). The ME required for weight gain (Mg
FiM) is calculated from the NErequirement for gain (EVg) as follows:
Similarly, the NE for milk production derived from weight loss (ElWC) is calcu-lated as follows:
The ME required for maintenance and production (Mml, (MJ/kg W0.75)) is calcu-lated as follows:
where Elcorr = (El + ElWC)�W0.75.Although the approach adopted by FiM 2004 is fundamentally different from the
factorial approach adopted by the ME system, it utilises existing information andprovides a sound biological framework for the incorporation of new developments.
In its review of the ME system in 1990, the working party referred to earlier con-cluded that the system generally underestimated the ME requirements of growingcattle (but not other classes of ruminants) and recommended that the energy re-quirement for growth (but not maintenance) should be increased by 10–15 per cent.In contrast, initial validation of FiM 2004 suggests that it slightly overpredicts MErequirements. Consequently, it is recommended that 10 MJ per day is subtractedfrom the calculated ME requirement of dairy cows. In both cases, the source of erroris unknown, but although it seems undesirable to introduce arbitrary correction fac-tors into otherwise logical systems, it is important that both systems accuratelyreflect levels of performance achieved in practice.
Alternative energy systems for ruminants
The Australian Standing Committee on Agriculture’s feeding standards for ruminants(CSIRO 1990), based on the ARC 1980 system, have been revised and updated (CSIRO2007).The differences between the Australian and ARC systems mainly reflect differ-ences in animal production systems between the two countries, the Australian systembeing intended mainly for use with grazing animals.To this effect, the Australian sys-tem incorporates refined estimates of maintenance requirements that include theenergy costs of grazing and employs refined estimates of kg for forage diets, whichtake into account the poorer efficiency of ME utilisation from tropical and later-growth temperate forages. The system also includes an estimate of the efficiency ofME utilisation for wool growth (kwool, 0.18). Finally, the Australian system makes nocorrections to kg for level of feeding, but for all classes of stock there is a positivecorrection to the maintenance requirement as total ME intake rises above the main-tenance level; this correction increases the maintenance requirement by 10 per centat a feeding level of twice maintenance.
In 1988 the European Association of Animal Production carried out a survey ofthe feeding systems in use in European countries. The report on energy systems forruminants (see Van der Honing and Alderman in Further reading) demonstrated thewide variety of systems in use in Europe, and it is not possible to describe all of themhere.The Netherlands, Belgium, France, Germany, Switzerland, Italy and Austria all
Mml = (loge((5.06 - Elcorr)>(5.06 + 0.453)))> - 0.1326
ElWC = EVg * weight loss * kt
Mg FiM
= (EVg * weight gain)>kg

Energy systems for ruminants
291
have systems with many features in common. However, the Dutch system will be de-scribed here as an example. The ME content of foods is calculated from digestiblenutrients and is then converted to a NE value. For growing animals, the basis for thisconversion is that the animal production level (see p. 286) is assumed to be constantat 1.5, and hence that kmp, as explained earlier in this chapter, has a unique value fora food of known ME concentration. Each food can therefore be given a single NEvalue for maintenance and production (NEmp), but this is converted to a unit valueby dividing it by the presumed NEmp of barley (6.9 MJ/kg, or about 8 MJ/kg DM). Forlactating cows a corresponding NE value for maintenance and lactation is calculatedby assuming that kl is 0.60 when diet qm = 0.57 (i.e. when M/D = 10.5 MJ/kg DM)and varies by 0.4 per cent with every unit change in diet qm. For example, if dietM/D = 11.5 and qm = 0.62, kl = 0.60 + (0.4 * (0.62 - 0.57)) = 0.62 and the NE valueof the food for lactation (NEl) = 11.5 * 0.62 = 7.1 MJ/kg DM.The calculation is fur-ther complicated by reducing the predicted value of NEl by 2.5 per cent to allow forthe normally high feeding level of dairy cows, and by converting NEl to a unit value(barley again being assuming to contain 6.9 MJ NE/kg). In addition to being used forcows, NEl values are used in the rationing of younger dairy animals (i.e. heifers beingused as dairy replacements).
The simplifying assumptions made by the Dutch scheme to calculate the NE val-ues of foods are therefore that (1) for growing animals APL = 1.5 and (2) for growingheifers, kmp = kl.A third assumption, which is not stated but is implicit in the system,is that km = kl.All three assumptions are liable to introduce inaccuracies that are al-lowed for by adjusting the NE requirements of animals. For example, with regard toassumption (2), it is recognised that in slowly growing heifers, where most of the en-ergy intake is used for maintenance, kl is an underestimate of kmp, whereas in rapidlygrowing heifers kl is an overestimate of kmp. The NE requirements of slow-growingheifers have therefore been reduced and those of fast-growing heifers increased tocancel out these biases in the estimation of the NE values of foods.
The energy systems grouped with the Dutch system are similar to it in principle,but differ in detail.Thus, the ME values of foods may be calculated by different pro-cedures, with different corrections being applied to account for the effects of level offeeding. In addition, the units employed may be MJ of energy rather than unit val-ues. For example, in Switzerland, the units are MJ of NE. Several countries inScandinavia have adopted NE systems that are based on Kellner’s starch equivalentsystem but now use Scandinavian feed units (Norway and Finland) or fattening feedunits (Denmark), although Sweden uses a ME system.
Having used a system based on total digestible nutrients (see p. 283) for manyyears, the USA has now changed to NE systems for beef and dairy cattle.These sys-tems are described in publications of the National Research Council (see Furtherreading). Metabolisable energy is calculated as 0.82 * DE and DE is calculated as4.409 Mcal (18.45 MJ) per kilogram of TDN. For beef cattle, foods are given NE val-ues for both maintenance (NEm) and gain (NEg), calculated from the ME content(Mcal/kg DM) of the food using the following equations:
These equations predict the NEm and NEg values of a food containing 11.0 MJ ME/kgDM (2.63 Mcal) to be 7.2 and 4.6 MJ/kg DM, respectively, compared with values
NEg = (1.42 ME) - (0.174 ME2) + (0.0122 ME3) - 1.65
NEm = (1.37 ME) - (0.138 ME2) + (0.0105 ME3) - 1.12

Chapter 12 Evaluation of foods: systems for expressing the energy value of foods
292
calculated using the UK ME system (derived from Table 12.1) of 7.8 and 5.2 MJ/kgDM, respectively. For a poor-quality food containing 7.4 MJ ME/kg DM (1.77 Mcal),NEm and NEg values calculated using the US system would be 3.9 and 1.6 MJ/kg DM,and corresponding values derived using the UK system would be 4.8 and 2.4 MJ/kgDM, respectively.Thus, values calculated using the US system are considerably lowerthan those derived using the UK system, particularly for poor-quality foods.
In the US system, NE values for lactation (NEl) are calculated from TDN, DE orNE by an equation similar to that used in the Dutch system. For example, in the USsystem, foods containing 10 or 12 MJ ME/kg DM would be calculated to provide 6.0and 7.1 MJ NEl/kg DM, respectively, whereas in the Dutch system, they would becalculated to provide 5.8 and 7.2 MJ NEl/kg DM, respectively. Net energy require-ments for body maintenance and milk synthesis are expressed as NEl, as they are inthe Dutch and related European systems.
The US NE systems for both beef and dairy cattle are currently being modifiedto incorporate the Cornell net carbohydrate and protein system referred to inChapter 1. This system includes calculations of both the energy and protein val-ues of feeds. The principle on which it operates is that if the quantity and charac-teristics (such as solubility) of each nutrient present in the food are known, thenthe rate at which it can be digested and the products of digestion that are ab-sorbed from the rumen and lower gut can be calculated. The energy and proteinvalues of these products can then be summed to give an estimate of the valuesof the food as a whole. To be operated efficiently, the system requires unusuallydetailed analytical data for the foods being used (see Box 1.1 in Chapter 1).Thus,carbohydrates in foods are divided into two kinds of fibre (fermentable or notfermentable in the rumen) and two kinds of non-fibrous components (starch andsugars). Proteins are similarly divided into five fractions, which vary in the ratesat which they are degraded in the rumen. In the latest versions of the US Na-tional Research Council publications referred to above, the procedures of theCornell system are offered as an alternative to simpler methods of calculating NEvalues from ME values. The latest US system for dairy cows is mentioned inChapter 16.
Future energy systems for ruminants
The first edition of this book was published in 1966 at a time when older energysystems such as Kellner’s starch equivalent system were being re-evaluated in lightof newly acquired calorimetric data and new systems, such as the UK ME system,were being introduced. The hope at the time was that new information on energymetabolism would help to produce a more accurate system that might be less com-plicated and therefore more acceptable for international use. In the event, this hopehas not been fully realised. Greater accuracy may perhaps have been achieved, butat the expense of greater complexity and an increase in the number of systemsbeing used.
The energy systems for ruminants that have been most improved are those relat-ing to the lactating dairy cow.As the reader will now appreciate, energy systems canaccommodate the dairy cow better than they can growing cattle (or sheep).The effi-ciency of ME utilisation varies less in dairy cows than in growing animals, and theenergy content of the product (milk) is less variable and more predictable than is thecase with liveweight gain. A number of studies have compared energy systems for

Energy systems for ruminants
293
Fig. 12.2 Comparison of energy systems for predicting the requirement of dairycows. The S/R ratio, calculated by dividing the energy intake by the calculatedenergy requirement, describes how precisely each system predicts energyrequirements.
Adapted from Kaustell K et al. 1997 Livestock Production Science 51: 255.
dairy cows, and the results of one such study are presented in Fig. 12.2. In this study,a data set of 51 milk production trials representing 261 diets was used to compareenergy supply (S) with calculated energy requirements (R) for nine different energysystems.The S/R ratio, calculated by dividing the energy intake by the calculated en-ergy requirement, and expressed as a percentage, describes how precisely each sys-tem predicts dietary energy supply.This study illustrates that although some systemsappear to be slightly better than others, most do not differ greatly.
Current energy system for dairy cows, whether based on ME or NE, do not considerthe characteristics of energy substrate supply. In contrast, mechanistic models are ableto take into account the site of digestion, the type of nutrients absorbed and the nutri-ents required for milk component synthesis. Consequently, they may be better ableto predict both nutrient supply and requirements. Figure 12.3 presents the results ofstudy designed to compare the ability of the Dutch NE system, the UK ME system(AFRC 1993), the Feed into Milk system (FiM 2004) and a mechanistic model topredict energy (or nutrient) requirements and supply for milk production from grass-based diets. For all systems, energy (or nutrient) supply exceeded requirements,although the extent of oversupply was greater for the AFRC 1993 system (11.4 percent) compared with the FiM 2004 system (8.5 per cent) and the Dutch NE system(6.4 per cent). However, for the mechanistic model, the predicted supply of gluco-genic nutrients was on average only 2.6 per cent higher than the requirement.
1 Metabolisable energy (UK, MAFF 1975)2 Metabolisable energy (Sweden)3 Metabolisable energy (UK, ARC 1980)4 Net energy lactation (Netherlands)5 Net energy fattening (Rostock)6 Net energy lactation (France)7 Net energy lactation (USA)8 Feed units (Finland)9 Feed units (Denmark)
180
85
90
95
100
105
110
2 3 4 5 6 7 8 9
S/R
rat
io (
%)

Chapter 12 Evaluation of foods: systems for expressing the energy value of foods
294
In the future, as energy systems become more complex to incorporate new informa-tion, and the need for simplicity is reduced by the increasing availability of computers,energy systems are likely to become parts of much larger mathematical models of nu-trient requirements that are capable of dealing simultaneously with energy, aminoacids, vitamins and minerals (and with the interactions between them). Complex sys-tems tend to obscure the principles upon which they are based. Consequently, stu-dents of animal nutrition should pay particular attention to the principles of energymetabolism outlined in the previous chapter and at the same time familiarise them-selves with the energy systems currently used in their own countries.
14
22
20
18
16
14
(a)
16 18 20 22Energy supply (kVEM/day)
Ener
gy
req
uir
emen
t (k
VEM
/day
)
170
250
230
210
190
170
(b)
190 210 230 250Energy supply (MJ/day)
Ener
gy
req
uir
emen
t (M
J/d
ay)
170
250
230
210
190
170
(c)
190 210 230 250Energy supply (MJ/day)
Ener
gy
req
uir
emen
t (M
J/d
ay)
1600
2400
2200
2000
1800
1600
(d)
1800 2000 2200 2400Nutrient supply (g/day)
Nu
trie
nt
req
uir
emen
t (g
/day
)
Fig. 12.3 Comparison of the supply and requirement for energy or glucogenicnutrients for grass-based diets using (a) the Dutch NE system, (b) the UK MEsystem, (c) the FiM system and (d) the mechanistic model. The solid line representsthe linear regression between supply and requirement, and the dashed line is theline of unity that represents a perfect match between supply and requirement.
From Dijkstra J et al. 2008 Animal Feed Science and Technology 143: 203.

Energy systems for pigs and poultry
295
12.3 ENERGY SYSTEMS FOR PIGS AND POULTRY
Energy systems for pigs and poultry are less complicated than those for ruminants,in both their derivation and application. One reason for this is that, because pigs andpoultry digest cellulose to a limited extent, they are limited to a range of foods that varylittle in their ME concentration. It is also generally considered that in pigs and poultrythe efficiency of ME utilisation differs to a relatively small extent between foods. Afurther reason is that, unlike ruminants, pigs and poultry are less commonly rationedfor a given level of production and are usually fed to appetite in the hope that theywill achieve maximum rates of meat or egg production. Nevertheless, the energyconcentration of foods and diets remains an important consideration because ani-mals tend to adjust their intake to provide a constant energy supply (see Chapter 17).If the energy concentration of the diet is increased (for example, by adding fat), thennon-ruminant animals tend to reduce their intake. Therefore, if no adjustment ismade to the concentrations of amino acids or other nutrients, they are likely to suf-fer deficiencies. In the practical rationing of pigs and poultry, the energy concentra-tion of the diet is considered to be more important than the energy requirement ofthe animal.
An NE system for pigs was first introduced at the same time as the starch equiva-lent system for ruminants (by G Fingerling, Kellner’s successor at the MöckernExperimental Station), and revised versions of this, or alternative NE systems, havebeen used in a few European countries until the present day. However, most coun-tries, including the USA and the UK, have based their energy systems for pigs on ei-ther DE or ME, although these two are closely related (ME = 0.96 DE). However,over the past 15 years, the greater range of foods available for inclusion in pig diets,including fibrous by-products, has prompted further development of NE systems.Asa measure of energy supply, NE is far superior to DE (or ME) if there are differencesbetween foods in the efficiency of ME utilisation. For many pig diets, the efficiencyof ME utilisation is reasonably constant; for example,Table 11.6 in Chapter 11 showsthat the efficiency of ME utilisation for growth (kg) is close to 0.71. Fibrous foodsprovide an exception, as the end products of fermentative digestion are used lessefficiently in the pig than is glucose absorbed from the small intestine (as they are inruminants). In 1981, the UK Agricultural Research Council, in its publication theNutrient Requirements of Pigs, suggested that the production of methane and heatloss associated with the metabolism of volatile fatty acids reduced the NE value of‘fermented’ DE to no more than two-thirds of the DE derived from energy substratesabsorbed from the small intestine.
It is also well recognised that when kg is subdivided into separate factors for dep-osition of protein (kp) and fat (kf), these factors are different. Consequently, separatevalues for kp (0.56) and kf (0.74) have been used to calculate the energy require-ment of pigs for growth in both the US and the UK systems.This difference has be-come increasingly important because of the breeding policy of selecting pigs to storeless fat and more protein.
As stated above, until recently, the energy system used for pigs in the UK wasbased on DE. However, after extensive consultation with the industry and otherstakeholders, an NE system was introduced in 2003 (see Further reading). In thissystem, both energy requirements and the energy value of foods are expressed interms of NE. As explained previously (see Chapter 10), the NE value of a food is

Chapter 12 Evaluation of foods: systems for expressing the energy value of foods
296
essentially the animal’s basal metabolic rate and energy required for protein andlipid retention, which is calculated by multiplying the ME value of the food by theefficiency of ME utilisation. However, as the efficiency of ME utilisation varies de-pending on energy substrate supply, the balance of processes (basal metabolism,protein and lipid retention) and the physiological state of the animal, the NEvalue of a food depends on both the characteristics of the food and those of theanimal to which it is fed. In the UK system, different NE values of foods are cal-culated for growing pigs and lactating sows, and for pregnant sows, based on themeasured DE or digestible nutrient composition of foods using prediction equationsas follows:
where ST, S, EE and CF indicate starch, sugars, ether extract and crude fibre, and DCPand DEE indicate digestible crude protein and digestible ether extract. Dres indicatesdigestible organic matter minus other digestible nutrients used in the equation.
Consequently, the NE values of foods high in protein and non-starch polysaccha-rides are lower compared with those high in starch and fats. Similarly, NE values offoods are lower for growing pigs and lactating sows compared with those for preg-nant sows (see Appendix A2.2.2). The NE system provides a more appropriateframework than the previous DE system for matching animal energy requirementswith energy supply from foods.
The first comprehensive energy system for poultry was developed in the USA byFraps, who used the comparative slaughter technique to measure energy retentionin young chickens. The figures obtained were called ‘productive energy values’ toemphasise that they were NE values for growth rather than maintenance. Fraps alsodevised methods for predicting the energy value of poultry foods from either theirgross or digestible nutrient composition. Fraps’s productive energy values were usedby some nutritionists to formulate diets until the early 1970s, but they were neverwidely accepted, and in most parts of the world ME has been used to express theenergy value of poultry foods. The use of ME is justified by the fact that commer-cial poultry production in different parts of the world is very similar, with bothbroiler and layer stock being produced by a small number of multinational breedingcompanies and subject to similar husbandry methods. As a consequence, theirNE requirements are relatively consistent and, given the range of foods normallyincluded in poultry diets, the efficiency of ME utilisation does not vary to any greatextent. However, modern poultry production is highly competitive, and recentcalorimetric studies have indicated that different energy substrates may be usedwith different efficiencies. In particular, ME supplied as fat is used more efficientlythan ME supplied as carbohydrate or protein. As a result, there has been renewedinterest in NE systems for poultry, which would include equations for predicting NEvalues from ME values, but these have not been adopted (see Further reading).Thefact that ME is so easily measured in poultry as both faeces and urine are voidedtogether is undoubtedly a strong factor favouring its retention in energy systemsfor poultry.
+ (0.0041 CP) + (0.0041 CF)
NE (MJ>kg DM) = (0.703 DE) + (0.0066 EE) + (0.0020 ST)
+ (0.0116 S) + (0.0086 Dres)
NE (MJ>kg DM) = (0.0121 DCP) + (0.0350 DEE) + (0.0143 ST)

Energy systems for horses
297
12.4 ENERGY SYSTEMS FOR HORSES
At one time, the US National Research Council used total digestible nutrients to ex-press both the energy requirements and energy value of foods for horses. However,there are now two main energy systems available for use with horses. In most partsof the world, including the Americas,Australasia and parts of Europe (including theUK), the system used is based on DE, but in France over the past 20 years a systembased on NE has been developed.The original DE system, first published by the Na-tional Research Council in 1989, was revised and reprinted in 2007. In the DE sys-tem, both energy requirements and energy supply are expressed in terms of DE, andDE requirements are calculated using a factorial approach similar to that adopted forruminants. However, because the number of feeding trials conducted with horses islimited, and the database of measured DE values for foods is smaller than for rumi-nants, food DE values are often predicted from their chemical composition.
The French NE system was originally developed by the Institut National de laRecherche Agronomique in 1984. In this system, both animal requirements and theenergy supply are expressed as Unite Fouragère Cheval (UFC; horse feed units). OneUFC is equivalent to the NE contained in 1 kg of barley (9.414 MJ).The system re-lies on maintenance being the major energy requirement of horses and therefore as-sumes that only one NE value for each food is required. To calculate NE values forfoods, the system utilises information on the gross energy values of foods and theirdigestibility, the efficiency of conversion of DE to ME, the relative proportions of dif-ferent energy substrates absorbed and the efficiency of energy substrate utilisation.The organic matter digestibility (OMD) and DE values of foods are predicted fromOMD values determined in sheep.The efficiency of conversion of ME to DE dependson the extent of energy losses in urine and methane. In horses, urine and methaneloses are much lower and less variable than in ruminants, with typical values being4.26 per cent and 1–4 per cent for urine and methane, respectively. However, reliableprediction of urine and methane losses has proved difficult and DE : ME ratios arepredicted from food composition, with typical values being 0.90–0.95 for cereals,0.84–0.88 for forages, legume seeds and cereal by-products, and 0.78–0.80 foroilseed meals. Because of the structure of the equine digestive tract (see Chapter 8),the nature of the energy substrates available for absorption depends on the chemicalcomposition of the food consumed and the site of digestion. Foods with the same DEvalue may contribute different energy substrates. In the French NE system, energysubstrates (glucose, long-chain fatty acids and amino acids) absorbed in the smallintestine are estimated from the enzymatic digestion of food components, basedon measured values in horses and those derived from studies with pigs and rumi-nants.The undigested food residue that leaves the small intestine is then subjectedto microbial fermentation in the hind gut and volatile fatty acid production is esti-mated from whole-tract OMD minus OM digested in the small intestine. The rela-tive proportions of different VFAs produced are then predicted from the fibrecontent of foods. Finally, the efficiency of ME utilisation for maintenance (km) iscalculated as follows:
where EGL, ELCFC, EAA and EVFA represent the energy absorbed as glucose, long-chainfatty acids, amino acids and volatile fatty acids, respectively.
km = 0.85 EGL + 0.80 ELCFA + 0.70 EAA + (0.63 to 0.68) EVFA

Chapter 12 Evaluation of foods: systems for expressing the energy value of foods
298
Because horses cannot ruminate, they spend twice as long as ruminants chewingtheir food, with a consequent energy cost, which depends on the physical form andnature of the food consumed.The NE system also takes into account the energy costof eating in assessing km.
Both the DE and NE systems have their strengths and limitations. Owing to thecomplexity of digestion and metabolism in horses, the relationship between DE andNE for a range of foods is poor. For example, forages are normally digested by micro-bial fermentation in the hind gut, with associated energy losses as methane, heat offermentation and the efficiency of utilisation of volatile fatty acids. On the otherhand, cereals are normally digested in the small intestine, with energy being absorbedand metabolised as glucose, with fewer energy losses. Consequently, the DE systemoverestimates energy supply from high-fibre feeds and underestimates energy supplyfrom high-starch feeds. However, this bias is reduced when mixed diets are fed. Inthe NE system, NE values are based on predicting the proportions of different energysubstrates absorbed. However, no account is taken of the effects of different feedsand feeding methods on the site and extent of digestion, or nutrient uptake. Forexample, the level of feeding and the extent of processing have been shown tohave a major impact on pre-caecal starch digestion and the relative proportions ofglucose and volatile fatty acids absorbed. In the NE system, the use of a single NEvalue for foods based on the efficiency of ME utilisation for maintenance is justi-fied by the fact that maintenance accounts for approximately 50–90 per cent of theenergy required by lactating and pregnant horses and 60–90 per cent of the energyrequired by growing and working horses. However, it is unlikely that ME will beused with the same efficiency for all physiological processes, and failure to accountfor differences between processes may introduce errors into the system for partic-ular types of horse, such as those undertaking heavy work or growing rapidly.Overall, both the DE and NE systems appear to produce similar results. However,although the NE system provides a sound theoretical framework for matching en-ergy supply to requirement and can readily incorporate new information, it iscomplex and may be considered incomplete. In addition, the use of barley as areference feed may be confusing in parts of the world where barley is not com-monly fed to horses. The DE system has the practical advantage that more isknown about predicting the DE value of foods from their chemical composition; itis also simple and therefore better understood by nutritionists, veterinarians andhorse owners.
12.5 PREDICTING THE ENERGY VALUE OF FOODS
The precision of any energy system depends on the accuracy with which the energycontent of individual foods or diets can be estimated. The ME content of grasssilage, for example, varies from perhaps 8.0 MJ/kg DM to 12.5 MJ/kg DM, depend-ing on the type of grass from which it is made and the silage-making processes em-ployed.A farmer wishing to assess silage quality may be able to get an approximateindication of its energy value by identifying the silage type and referring to an ap-propriate textbook (see Appendix 2). However, a more precise assessment can beobtained by subjecting the silage to chemical analysis and using the informationobtained to type the silage more accurately, or predict its energy value using pre-diction equations. For example, the following equations allow the energy values of

Predicting the energy value of foods
299
grass silages for ruminants and forages for horses to be predicted from their chemi-cal composition:
Ruminants (silages):
Horses (forages):
where MADF, NCD, ADF and CP indicate modified acid detergent fibre, neutralcellulose digestibility, acid detergent fibre and crude protein, respectively.
An alternative approach to chemical analysis is to estimate digestibility by in vitrofermentation (see p. 241) and predict the energy value from the digestible organicmatter content of the food. For forages given to ruminants, the following equation isoften used:
where DOMD (g) indicates digestible organic matter per kilogram of dry matter.The introduction of new methods of analysis, such as near-infrared spectrometry
(NIRS), has speeded up the prediction of digestibility and energy values for a rangeof foods (see Chapter 10). However, it must be remembered that all laboratory meth-ods of predicting the energy value of foods are dependent on the availability of reli-able data obtained from properly conducted metabolism trials with animals. It is thesystematic evaluation of many food samples in such trials that provides the regres-sion equations that are subsequently used to predict energy values from laboratorymeasurements.
For cereal grains and other concentrate foods, the prediction of energy value iseasier than for forages, because such foods are less variable in chemical composition;appropriate values can therefore be taken from tables in appropriate textbooks. How-ever, there are occasions when the energy values of concentrate foods need to be pre-dicted from their chemical composition. For example, many countries are introducinglegislation that requires compound feed manufacturers to declare the energy value(typically, the ME value) of their products. Consequently, a simple method of check-ing such values is required. In the UK, the following equations can be used to predictthe energy content of compound foods fed to ruminants, horses, pigs and poultry:
Ruminants:
Horses:
Pigs:
Poultry:
+ (0.01301 S)
ME (MJ/kg) = (0.01551 CP) + (0.03431 AEE) + (0.01669 ST)
- (0.0331 Ash) - (0.0140 NDF)
DE (MJ/kg DM) = 17.47 + (0.0079 CP) + (0.0158 AEE)
DE (MJ/kg) = 17.02 - (0.023 ADF)
ME (MJ/kg DM) = (0.014 NCDG) + (0.025 AEE)
ME (MJ/kg DM) = 0.016 DOMD
DE (MJ/kg) = 17.66 - (0.046 ADF) + (0.0139 CP) + (0.000468 ADF2)
ME (MJ/kg DM) = 5.45 + (0.0085 NCD)
ME (MJ/kg DM) = 15.0 - (0.0140 MADF)

Chapter 12 Evaluation of foods: systems for expressing the energy value of foods
300
where CP,AEE,Ash, ST and S indicate crude protein, acid ether extract, ash, starchand total sugars, respectively, and NCDG indicates neutral cellulose plus gamanasedigestibility.All are expressed as g/kg DM (ruminants and pigs) or g/kg food (horsesand poultry).
The four equations differ in principle.The equation for poultry assigns a logicallyderived factor for each constituent. For example, assuming the energy value of fat tobe 0.0393 MJ/g, the factor for acid ether extract indicates that 0.03431/0.0393 =
0.87 of the gross energy of the lipid in poultry food is metabolisable. The equationsfor horses and pigs start with a constant value and adjust it upwards, depending onthe protein and acid ether extract content, and downwards, depending on the ashand fibre content. The equation for ruminants is based on a biological rather than achemical evaluation of the food but includes an adjustment for acid ether extract.
Earlier equations were based on the original components of the proximate analysis.An example of an earlier equation for pig foods, based on a compilation of Europeanstudies made by the European Association for Animal Production, is:
The precision of this and other equations can be assessed from their residualstandard deviations (rsd). The ME equation based on proximate constituents (rsd0.54) is less precise than the DE equation based on modern analytical components(rsd 0.33).
- (0.0149 CF)
ME (MJ/kg DM) = (0.018 CP) + (0.0315 AEE) + (0.0163 NFE)
SUMMARY
1. Energy systems consist of three components:(1) the energy requirements of the animal,(2) the energy values of foods and (3) infor-mation of the efficiency of energy utilisationlinking (1) and (2).
2. Energy systems can be considered to besimple models used either to predict the per-formance of animals on a prescribed rationor to formulate rations for animals with adesired level of performance.
3. In the UK metabolisable energy system forruminants, animal requirements are expressedin terms of net energy (NE) and food energyvalues are expressed as metabolisable energy(ME). Animal ME requirements are calculatedusing efficiency factors (k) for differentproductive processes (e.g. maintenance,lactation or growth), which depend on theME concentration of the diet (M/D).
4. The UK metabolisable energy system hasbeen refined by including corrections to
account for the effects of level of feeding onboth the ME value of the foods and theefficiency of ME utilisation.
5. In the UK, the ME requirements of dairy cowsfor maintenance and lactation can be calcu-lated from the curvilinear relationshipbetween milk energy derived from dietaryME and dietary ME directed towards milkproduction proposed by Feed into Milk 2004.
6. As an alternative to ME, various countries incontinental Europe and the USA haveadopted energy systems based on NE. Inthese systems, the NE value of foods is calcu-lated from ME and different NE values arederived for different productive purposes(e.g. maintenance, growth or lactation).
7. Most energy systems for ruminants producesimilar results. However, as new informationbecomes available, the systems are becomingmore complex. In the future, with increasinguse of computers, mechanistic models may be

Further reading
301
g/kg DM
Crude protein 160Acid ether extract 50Neutral detergent fibre 150Ash 60
QUESTIONS
12.1 Predict the performance of a group of 30 kg wether lambs (castrated males)offered a diet consisting of 1.0 kg hay (DM 800 g/kg, ME 9.0 MJ/kg DM) and0.3 kg concentrate (DM 860 g/kg, ME 13.0 MJ/kg DM).The net energy require-ments for maintenance and growth of a 30 kg wether lamb are 3.2 MJ/day and14.0 MJ/kg, respectively.
12.2 Formulate a diet to meet the energy requirements of a group of 650 kgHolstein * Freisian cows producing 36 l milk. Grass silage (DM 280 g/kg, ME10.8 MJ/kg DM) and dairy concentrate (DM 860 g/kg, ME 13.5 MJ/kg DM)are available. It is anticipated that the cows will consume 19.5 kg/day dry mat-ter and no weight change is expected.The net energy requirements for mainte-nance and milk production are 44.8 MJ/day and 3.0 MJ/l, respectively.
12.3 A food intended for growing pigs was analysed in the laboratory to contain thefollowing chemical components:
able to more accurately predict animalenergy requirements and the energy valueof animal foods.
8. Energy systems for pigs and poultry arelargely based on either DE or ME because theefficiency of DE utilisation (or ME) is rela-tively constant. However, with increasing useof fibrous by-products and more informationon the efficiency of energy substrate utilisa-tion, there is renewed interest in NE systems.In the UK, a NE system has been introducedfor pigs.
9. Energy systems for horses, based on either DEor NE, produce similar results. The NE systemprovides a sound theoretical framework butis complex to use. The DE system is relativelysimple and easily understood by nutritionists,veterinarians and horse owners.
10. The energy value of some foods is variable.Consequently, most systems include equa-tions for predicting the energy value of foodsfrom their chemical composition determinedby laboratory analysis.
Calculate the digestible energy value of the food and the expected liveweightgain of 35 kg growing pigs (DE maintenance 7.0 MJ/day) offered 1.0 kg DMper head per day. The pig’s weight gain contains 210 g/kg muscle DM (170 gprotein) and 200 g/kg fat. (The information presented in both Chapters 11 and12 may be useful here.)
FURTHER READING
Agnew R E and Yan T 2000 Impact of recent research on energy feeding systems for dairy cat-tle. Livestock Production Science 66: 197–215.

Chapter 12 Evaluation of foods: systems for expressing the energy value of foods
302
Agricultural Research Council 1980 The Nutrient Requirements of Ruminant Livestock,Farnham Royal, Commonwealth Agricultural Bureaux.
Agricultural Research Council 1981 The Nutrient Requirements of Pigs, Farnham Royal, Com-monwealth Agricultural Bureaux.
Agricultural and Food Research Council (AFRC) 1993 Energy and Protein Requirements ofRuminants (An Advisory Manual prepared by the AFRC Technical Committee on Responsesto Nutrients),Wallingford, CABI.
Alderman G 1985 Prediction of the energy value of compound feeds. In: Haresign W and ColeD J A (eds) Recent Advances in Animal Nutrition – 1985, London, Butterworth.
Commonwealth Scientific and Industrial Research Organisation 2007 Nutrient Requirementsof Domesticated Ruminants, Collingwood,Vic.,Australia, CSIRO Publishing.
Henry Y,Vogt H and Zoiopoulos P E 1988 Feed evaluation and nutritional requirements: pigsand poultry. Livestock Production Science 19: 299–354.
Morris T R and Freeman B M (eds) 1974 Energy Requirements of Poultry, Poultry ScienceSymposium no. 9, Edinburgh, British Poultry Science.
National Academy of Sciences/National Research Council 2001 Nutrient Requirementsof Dairy Cattle, 7th rev. edn,Washington, DC, National Research Council.
National Academy of Sciences/National Research Council 2007 Nutrient Requirements ofHorses,Washington, DC, National Research Council.
National Academy of Sciences/National Research Council 2000 Nutrient Requirements ofBeef Cattle, 7th rev. edn,Washington, DC, National Research Council.
Pirgozliev V and Rose S P 1999 Net energy systems for poultry feeds: a quantitative review.World’s Poultry Science Journal 55: 23–36.
Theodorou M K and France J (eds) 2000 Feeding Systems and Feed Evaluation Models,Wallingford, CABI.
Thomas C 2004 Feed into Milk: A New Applied Feeding System for Dairy Cows, Nottingham,Nottingham University Press.
Van der Honing Y and Alderman G 1988 Feed evaluation and nutritional requirements:ruminants. Livestock Production Science 19: 217–78.
Van Es A J H 1978 Feed evaluation for ruminants 1: the systems in use from May 1977onwards in the Netherlands. Livestock Production Science 5: 331–45.
Whittemore C T 1997 An analysis of methods for the utilisation of net energy concepts toimprove the accuracy of feed evaluation in diets for pigs. Animal Feed Science andTechnology 68: 89–99.
Whittemore CT, Hazzledine MJ and Close WH 2003 The Nutrient Requirements of Pigs,Penicuik, British Society of Animal Science.
Wiseman J and Cole D J A (eds) 1990 Feedstuff Evaluation, London, Butterworth.
HISTORICAL REFERENCES
Armsby H P 1917 The Nutrition of Farm Animals, New York, Macmillan.
Kellner O 1926 The Scientific Feeding of Farm Animals, 2nd edn (translated by W Goodwin),London, Duckworth.

303
13.1 Crude protein
13.2 Digestible crude protein
13.3 Determination of endogenous nitrogen
13.4 Measures of protein quality for monogastric animals
13.5 Measures of food protein used in practice in the feeding of pigs and poultry
13.6 Measures of food protein used in practice in the feeding of horses
13.7 Measures of protein quality for ruminant animals
13.8 The UK metabolisable protein system
13.9 The UK Feed into Milk protein system for dairy cows
Proteins are made up of amino acids, the classification of which into essential (indis-pensable) and non-essential (dispensable) has already been described in Chapter 4 andin Chapter 9 under ‘protein synthesis’. For food to be used with maximum efficiency, theanimal must receive sufficient quantities of both the essential and non-essential aminoacids to meet its metabolic demands. Simple-stomached animals such as pigs and poul-try obtain these acids from the breakdown of food proteins during digestion and ab-sorption. In the case of ruminant animals, the situation is more complex.
Considerable degradation and synthesis of protein occur in the rumen, and the ma-terial that finally becomes available for digestion by the animal may differ considerablyfrom that originally present in the food. Different approaches to the evaluation of pro-tein sources are therefore necessary for ruminant and non-ruminant animals.
In the past, foods were evaluated as sources of protein by somewhat crude and sim-ple methods that took no account of the species of animal for which the foods were in-tended. Some of these methods are still sometimes used. These will be dealt with first,and then the more refined methods of assessing protein quality for simple-stomachedand ruminant animals will be discussed separately.
13 Evaluation of foods: protein
13.1 CRUDE PROTEIN
Most of the nitrogen required by the animal is used for protein synthesis. Most of thefood nitrogen is also present as protein, and it is convenient and almost universal for thenitrogen requirements of animals and the nitrogen status of foods to be stated in termsof protein. Chemically, the protein content of a food is calculated from its nitrogen

Chapter 13 Evaluation of foods: protein
304
content determined by a modification of the classical Kjeldahl technique or the Dumasmethod; this gives a figure that includes most forms of nitrogen, although nitrites,nitrates and certain cyclic nitrogen compounds require special techniques for theirrecovery. Two assumptions are made in calculating the protein content from that ofnitrogen: first, that all the nitrogen of the food is present as protein; and second, that allfood protein contains 160 g N/kg.The nitrogen content of the food is then expressed interms of crude protein (CP):
or more commonly:
Both the assumptions are unsound. Different food proteins have different nitro-gen contents and, therefore, different factors should be used in the conversion ofnitrogen to protein for individual foods. Table 13.1 shows the nitrogen contents ofa number of common proteins, together with the appropriate nitrogen conversionfactors.
Although fundamentally unsound, the use of an average conversion factor of 6.25for all food proteins is justified in practice, since protein requirements of farm ani-mals, expressed in terms of N � 6.25, are requirements for nitrogen and not for pro-tein per se. The publication of tables of protein contents based on true conversionfactors could lead to considerable confusion and inefficiency in feeding.The assump-tion that the whole of the food nitrogen is present as protein is also false, since manysimple nitrogenous compounds, such as amides, amino acids, glycosides, alkaloids,ammonium salts and compound lipids, may be present (see Chapter 4). Quantita-tively, only the amides and the amino acids are important, and these are present inlarge amounts in only a few foods such as young grass, silage and immature rootcrops.About 95 per cent of the nitrogen of most mature seeds is present as true pro-tein, whereas leaves have 80–90 per cent, stems and roots 60 per cent, and storageorgans such as potatoes and carrots 30–40 per cent, in this form. In the diets of pigsand poultry, cereals and oilseeds predominate, and they contain little non-protein ni-trogen. Hence, in practice, there is little to be gained from attempting to differentiatebetween the two types of nitrogen, particularly as a considerable proportion of the
CP (g/kg) = g N/kg * 6.25
CP (g/kg) = g N/kg * 1000/160
Table 13.1 Factors for converting nitrogen to crude protein
Food protein Nitrogen (g/kg) Conversion factor
Cotton seed 188.7 5.30Soya bean 175.1 5.71Barley 171.5 5.83Maize 160.0 6.25Oats 171.5 5.83Wheat 171.5 5.83Egg 160.0 6.25Meat 160.0 6.25Milk 156.8 6.38
Adapted from Jones D B 1931 USDA Circ. 183.

Digestible crude protein
305
non-protein fraction, amino acids and amides for example, may be utilised for aminoacid synthesis by the animal. Tradition apart, there seems little justification for theuse of the term ‘crude protein’ in nutrition. The expression of both animal require-ments and the status of foods in terms of nitrogen would be more logical and wouldavoid confusion.
13.2 DIGESTIBLE CRUDE PROTEIN
The crude protein figure provides a measure of the nitrogen present in the food butgives little indication of its value to the animal. Before the food becomes available tothe animal, the food must undergo digestion, during which it is broken down to sim-pler substances that are absorbed into the body.The digestible protein in a food maybe determined by digestibility trials in which nitrogen intake is measured along withthe nitrogen voided in the faeces, as described in Chapter 10.
Digestibility coefficients based on collection and analysis of digesta from the ter-minal ileum are generally considered to give a more accurate measure of the nitrogenabsorbed than do those based on the more usual faecal collection. Ileal collectioneliminates the lower gut as a source of errors and is justified since absorption fromthe large intestine is held to make little or no contribution to the protein status of theanimal. Furthermore, a higher correlation has been demonstrated between dailyliveweight gain in pigs and ileal rather than whole-tract digestibility (r � 0.76 v. 0.34),particularly with unusual protein sources.
It is assumed that the difference between the quantities of nitrogen in the foodand faeces (or digesta in the case of ileal collection) represents the quantity ab-sorbed in a utilisable form by the body and that all nitrogen that appears in the fae-ces is of dietary origin. In the light of the fate of ruminal ammonia (see Chapter 8)and the presence in faeces and digesta of nitrogen of metabolic or endogenous origin(see Chapter 10), these assumptions are untenable. The figures so obtained are forapparently digestible protein. Determination of the true digestibility must take ac-count of the contribution of nitrogen of endogenous origin to that of the digesta.Theendogenous nitrogen (EN) contains non-food substances entering the intestine, suchas saliva, bile, gastric and pancreatic secretions, and cells sloughed off the mucousmembrane of the gut. It may also contain significant amounts of bacterial nitrogen,which is not endogenous in origin. Endogenous nitrogen may be divided into twofractions: that which is unrelated to the quality and the quantity of the dietary pro-tein and is dependent only upon the quantity of dry matter passing through the gutand termed basal nitrogen loss (BN), and that which is related to the quality andquantity of the dietary protein and other ingredient characteristics such as fibre oranti-nutritional factors, and termed specific endogenous nitrogen (SN).These differ-ent fractions are shown in Fig. 13.1.
As a result of the inclusion of BN (which is constant for a given level of dry mat-ter intake), in the calculation of apparent digestibility, different values will be ob-tained for different levels of dietary protein inclusion. It has been suggested that thisanomaly may be overcome by eliminating BN from the calculation to give a figurefor ‘standardised digestiblity’. For pigs and poultry, amino acid supply rather thanprotein is considered, and ileal digestibility rather than whole-tract digestibility isused. Therefore, endogenous amino acids are calculated as the sum of basal amino

Chapter 13 Evaluation of foods: protein
306
Basal endogenous nitrogen (BN)
Specific endogenous nitrogen (SN)
Dietary origin nitrogen
Rate of incorporation of feedstuff in the diet ordietary nitrogen content
Amount ofnitrogenexcreted
Fig. 13.1 Origin of excreted nitrogen.
acid loss (BAA) and specific endogenous amino acid loss (SAA). Standardised ilealdigestibility (SID) is then calculated as follows:
Means of estimating BAA are described later.The use of standardised digestibility figures overcomes the problem of multiple
values and the systematic undervaluation of the digestibility of low-protein foodsthat is inherent in apparent digestibility figures. Standardised digestibility is some-times referred to as true digestibility, but it remains an apparent value and does notgive a realistic picture of the true digestibility of the nitrogen. For this, the specificendogenous contribution to faecal or digesta nitrogen (or amino acids) must betaken into account.
SID (g/kg) =
dietary AA intake - (ileal AA flow - ileal BAA flow)
dietary AA intake* 1000
13.3 DETERMINATION OF ENDOGENOUS NITROGEN
The magnitude of the endogenous nitrogen component may be estimated by one ofthe following procedures:
■ Measuring the nitrogen in digesta when protein-free diets are consumed, the as-sumption being that this is entirely endogenous in origin. The procedure is non-physiological, normal protein metabolism may be affected, and nitrogen secretioninto the gut may be reduced. Furthermore, the diet may lack the stimulatory ef-fect of normal diets on endogenous secretions. However, the fibrous nature ofprotein-free diets increase the contribution of that part of the endogenous compo-nent resulting from abrasion of the gut membrane.The technique cannot be usedwith ruminant animals as nitrogen-free diets inhibit rumen fermentation.
■ Measuring the nitrogen in digesta when completely digestible protein is consumed.

Determination of endogenous nitrogen
307
■ Measuring the recoveries of nitrogen, from digesta, when graded levels of proteinare consumed.The recoveries are regressed on intake; extrapolation to zero intakeis taken as the endogenous nitrogen loss. It is assumed that endogenous nitrogenloss is not related to protein intake. This is not a valid assumption and the esti-mates obtained by this method are, at best, minimum values.
■ Isotope dilution, in which the stable nitrogen isotope 15N is introduced in knownconcentration in the food. The concentration in the faeces/digesta is then mea-sured and the dilution with nitrogen of non-food (endogenous) origin is calculated.
■ Treating dietary lysine with guanidine to give homoarginine. This is assumed toescape digestion in the gut and any lysine appearing in the digesta is assumed to beof endogenous origin.The relationship between lysine and the other amino acids isconsidered to be constant and is used in calculating their true digestibility.
■ Peptide alimentation of the alimentary canal with hydrolysed casein and separa-tion of the exogenous and endogenous components on the basis of molecularweight, the endogenous being greater than 10 000.
The results may vary widely with the different techniques employed. Even two ofthe most favoured current techniques, that based on homoarginine and that using15N-labelled dietary protein, show average differences of about 5 per cent in the truedigestibility values derived from them. Some figures obtained using 15N labelling aregiven in Table 13.2.
As well as varying with the technique used, the magnitude of the endogenous ni-trogen fraction is influenced by the type and amount of non-starch polysaccharide inthe diet and the protein status of the experimental animals. Some workers considerthat endogenous secretions are a component of the net value of the food and that di-gesta nitrogen should be set against dietary nitrogen, whatever its origin. Others re-gard digestibility as purely a property of the food and consider that endogenousnitrogen should be eliminated from its calculation.The digestibility of the nitrogen ofa complete diet could then be calculated additively from the digestibility values ofthe proteins of the foods making up the diet. Owing to the variability of the valuesfor endogenous nitrogen, any assumed figure used to transform apparent to truedigestibility values will be of doubtful validity, and so will the resulting coefficients.
Table 13.2 Apparent and true ileal protein digestibility values as determined bythe 15N-isotope dilution techniques
Soya bean Canola Wheat Barley
meal meal
Digestibility (%)Apparent 83.8 66.0 80.0 69.5True 97.5 84.1 99.0 94.2
Endogenous proteinAs g/kg dry matter intake 25.5 30.5 27.4 27.7As percentage of total crude
protein present at the distal ileum84.6 53.5 94.5 81.1
As g/100 g crude protein intake 13.7 18.0 19.1 24.7
Adapted from Sauer W C and de Lange K 1992 Novel methods for determining protein and amino aciddigestibility values in feedstuffs. In: Nissen S (ed.) Modern Methods in Protein Nutrition and Metabolism,London, Academic Press.

Chapter 13 Evaluation of foods: protein
308
Most of the figures in current use are apparent values, but in feeding systems in whichmetabolic nitrogen loss is treated as part of the maintenance nitrogen demand, truerather than apparent coefficients have to be used.
There is evidence that figures for the apparent ileal digestibility of lysine, andsome other amino acids, overestimate availability to the animal, which reinforces theview that it is dangerous to equate digestibility with availability.
13.4 MEASURES OF PROTEIN QUALITY FOR MONOGASTRIC ANIMALS
Digestible protein figures are not entirely satisfactory measures of the value of a proteinto an animal, because the efficiency with which the absorbed protein is used differs con-siderably from one source to another. In order to allow for such differences, methods forevaluating proteins, such as the protein efficiency ratio (PER), the net protein retention(NPR) and the gross protein value (GPV), which are based on the growth response ofexperimental animals to the protein under consideration, have been devised.
Protein efficiency ratio
This is defined as follows:
The rat is the usual experimental animal.
Net protein retention
This is calculated as follows:
where given the test protein and of protein-free diet.
Gross protein value
The liveweight gains of chicks receiving a basal diet containing 80 g crude protein/kgare compared with those of chicks receiving the basal diet plus 30 g/kg of a test protein,and of yet others receiving the basal diet plus 30 g/kg of casein. The extra liveweightgain per unit of supplementary test protein stated as a proportion of the extraliveweight gain per unit of supplementary casein is the GPV of the test protein, i.e.:
where increased weight gain/g test protein and increased weightgain/g casein.
Nitrogen balance
Liveweight gains may not be related to protein stored, and a more accurate evalu-ation of a protein may be obtained by using the results of nitrogen balance exper-iments. In such experiments, the nitrogen consumed in the food is measured,
A° = gA = g
GPV = A>A°
NPG = groupTPG = group
NPR =
weight gain of TPG - weight loss of NPGweight of protein consumed
PER =
gain in body weight (g)
protein consumed (g)

Measures of protein quality for monogastric animals
309
together with that voided in the faeces, urine and any other nitrogen-containingproducts such as milk, wool and eggs. When the nitrogen intake is equal to theoutput, the animal is said to be in nitrogen equilibrium; when intake exceeds out-put, it is in positive balance; when output exceeds intake, it is in negative balance.Table 13.3 illustrates the calculation of a nitrogen balance for a 50 kg pig in posi-tive nitrogen balance to the extent of 21.79 g/day.
Balance trials are susceptible to several sources of error:
■ inadequate adaptation of experimental animals to the diet and the environment;■ collection and weighing of faeces and urine;■ storage of faeces and urine;■ preparation and sampling of faeces and urine for chemical analysis.
The results of balance trials have been shown to diverge considerably from thoseobtained with the comparative slaughter technique (see Chapter 11). This too is li-able to error, owing largely to the difficulty of animal selection for the initial slaugh-ter group, which, if inadequate, can invalidate the comparison with the slaughtergroup. With larger animals, errors can arise from poor sampling of the carcassesowing to their physical size.They have then to be dissected into component parts forsampling, instead of the body sampling possible with smaller animals. In general, thebalance technique gives higher estimates of nitrogen retention, and most authoritiesagree that such estimates are not as reliable as those based on slaughter.
Biological value
This is a direct measure of the proportion of the food protein that can be utilised bythe animal for synthesising body tissues and compounds, and may be defined as theproportion of the absorbed nitrogen that is retained by the body. A balance trial isconducted in which nitrogen intake and urinary and faecal excretions of nitrogen aremeasured, along with the endogenous fractions in these two materials.The biologicalvalue is then calculated as follows:
where MFN � metabolic (endogenous) faecal nitrogen and EUN � endogenousurinary nitrogen.
BV =
N intake - (faecal N - MFN) - (urinary N - EUN)
N intake - (faecal N - MFN)
Table 13.3 Nitrogen balance for a Large White/Landrace pig on a diet of wheat,soya bean meal and herring meal
Daily intake (g) Daily output (g)
Food nitrogen 46.42Faecal nitrogen 4.99Urinary nitrogen 19.64Nitrogen retained by body 21.79
Total 46.42 46.42Balance �21.79
Adapted from Morgan C A and Whittemore C T, unpublished.

Chapter 13 Evaluation of foods: protein
310
An example of such a calculation is given in Table 13.4.The endogenous urinary nitrogen results from irreversible reactions involved in
the breakdown and replacement of various protein secretions and structures withinthe body.Thus, both the faecal and urinary endogenous fractions represent nitrogenthat has been absorbed and utilised by the animal rather than nitrogen that cannotbe so utilised. Their exclusion from the faecal and urinary values in the above for-mula gives a measure of the true biological value.
In determining biological value, as much as possible of the dietary protein shouldbe provided by that under test. Protein intake must be sufficient to allow adequate ni-trogen retention, but it must not be in excess of that required for maximum retention;if the latter level were exceeded, then the general amino acid catabolism resultingwould depress the estimate of biological value. For the same reason, sufficient non-protein nitrogenous nutrients must be given to prevent protein being catabolised toprovide energy. The diet must also be adequate in other respects. Table 13.5 givesbiological values for the proteins of some typical foods.
Table 13.4 Calculation of biological value for maintenance andgrowth of the rat
Food consumed daily (g) 6.0Nitrogen in food (g/kg) 10.43Daily nitrogen intake (mg) 62.6Total nitrogen excreted daily in urine (mg) 32.8Endogenous nitrogen excreted daily in urine (mg) 22.0Total nitrogen excreted daily in faeces (mg) 20.9Metabolic faecal nitrogen excreted daily (mg) 10.7
Adapted from Mitchell H H 1942 Journal of Biological Chemistry 58: 873.
= 0.79
BV =
62.6 - 120.9 - 10.72 - 132.8 - 22.02
62.6 - 120.9 - 10.72
Table 13.5 Biological values of the protein invarious foods for maintenance and growth forthe growing pig
Food BV
Milk 0.95–0.97Fish meal 0.74–0.89Soya bean meal 0.63–0.76Cotton seed meal 0.63Linseed meal 0.61Maize 0.49–0.61Barley 0.57–0.71Peas 0.62–0.65
Adapted from Armstrong D G and Mitchell H H 1955Journal of Animal Science 14: 53.

Measures of protein quality for monogastric animals
311
Such biological values are for the combined functions of maintenance, meaningthe replacement of existing proteins, and growth (i.e. the formation of new tissues).Biological values for maintenance alone may be calculated from balance data.A lin-ear relationship exists between nitrogen intake and balance below equilibrium,which may be represented by the following equation:
where y � N balance, x � N absorbed, a � N loss at zero intake (all expressed as gNper basal kJ), and b � nitrogen balance index, i.e. that fraction of the absorbed nitro-gen retained by the body and is equal to the BV for maintenance.
The product of BV and digestibility is termed the net protein utilisation (NPU)and is the proportion of the nitrogen intake retained by the animal.
The amino acids absorbed by the animal are required for the synthesis of bodyproteins.The efficiency with which this synthesis is effected depends partly on howclosely the amino acid proportions of the absorbed mixture resemble those of thebody proteins and partly on the extent to which the proportions can be modified.The biological value of a food protein therefore depends upon the number andkinds of amino acids present in the molecule: the closer the amino acid compositionof the food protein approaches that of the body protein, the higher will be its bio-logical value.Animals have little ability to store amino acids in the free state, and ifan amino acid is not required immediately for protein synthesis then it is readilybroken down and either transformed into a non-essential amino acid or used as anenergy source. Since essential amino acids cannot be effectively synthesised in theanimal body, an imbalance of these in the diet leads to wastage. Food proteins witheither a deficiency or an excess of any particular amino acid will tend to have lowbiological values.
If we consider two food proteins, one deficient in lysine and rich in methionine,and the other deficient in methionine but containing an excess of lysine, then, ifthese proteins are given separately to young pigs, they will have low biological val-ues because of the imbalance of these acids. If, however, the two proteins are giventogether, then the mixture will be better balanced and have a higher value than ei-ther given alone. Such proteins complement each other. In practice, and for a similarreason, it often happens that a diet containing a large variety of proteins has a higherbiological value than a diet containing only a few proteins. This also explains whybiological values of individual foods cannot be applied when mixtures of foods areused, since the biological value of a mixture is not simply a mean of the individualcomponents. For the same reason, it is impossible to predict the value of a protein asa supplement to a given diet from its biological value.
Animal proteins generally have higher biological values than plant proteins, al-though there are exceptions. Gelatin, for example, is deficient in several essentialamino acids.
The amino acid composition of a given food protein will be relatively constant(see Appendix 2, Table A2.1.3), but that of the protein to be synthesised will varyconsiderably with the type of animal and the various functions it has to perform. Forthe normal growth of rats, pigs and chicks, for example, lysine, tryptophan, histidine,methionine, phenylalanine, leucine, isoleucine, threonine, valine and arginine aredietary essentials. Humans do not require histidine, whereas chicks need glycine, inaddition to those acids required by the rat, to ensure optimum growth. On the otherhand, arginine is not a dietary essential for maintenance of the rat or pig.
y = bx - a

Chapter 13 Evaluation of foods: protein
312
The situation is complicated further by the fact that some amino acids can be re-placed, at least in part, by others; for example, methionine can be partly replacedby cystine, and tyrosine can partly replace phenylalanine. In such cases, the twoamino acids are frequently considered together in assessing the animal’s require-ments. It is clear that no single figure for biological value will suffice as a measureof the nutritive value of a food protein for different animals and different func-tions. The differences between the amino acid requirements of young pigs andthose of laying hens, for example, are shown in Appendix 2, Tables A2.9.1 andA2.10.The consequent need for multiple figures severely limits the use of the bio-logical value concept in feeding practice.
The biological methods of evaluation reflect the content of the limiting aminoacid in the protein. Changes in the levels of other amino acids will not affect the val-ues until one or other of them becomes limiting.Thus, in milk protein, with an excessof lysine, change in lysine content will not affect the biological measures until it is re-duced to such a level that it itself becomes the limiting acid.The biological measuresare therefore of limited value in assessing the effects of certain processes, heat treat-ment for example, on nutritive value.
Since biological value is dependent primarily upon essential amino acid consti-tution, it would seem logical to assess the nutritive value of a protein by deter-mining its essential amino acid constitution and then comparing this with theknown amino acid requirements of a particular class of animal. Application ofmodern chromatographic techniques coupled with automated procedures allowsrelatively quick and convenient resolution of mixtures of amino acids. However,the acid hydrolysis used to produce such mixtures from protein destroys practi-cally all the tryptophan and a considerable proportion of the cystine and methio-nine.Tryptophan has to be released by a separate alkaline hydrolysis, and cystineand methionine have to be oxidised to cysteic acid and methionine sulphone toensure their quantitative recovery. Losses of amino acids and the production ofartefacts, which are greater with foods of high carbohydrate content, are reducedif the hydrolysis is carried out in vacuo. Evaluations of proteins in terms of eachindividual amino acid would be laborious and inconvenient, and several attemptshave been made to state the results of amino acid analyses in a more useful andconvenient form.
Chemical score
In this concept, it is considered that the quality of a protein is decided by the aminoacid that is in greatest deficit when compared with a standard.The standard generallyused has been egg protein, but many workers now use a defined amino acid mixture,the FAO Recommended Reference Amino Acid Pattern. The content of each of theessential amino acids of a protein is expressed as a proportion of that in the standard(the standard pattern ratio) and the lowest proportion taken as the score. In wheatprotein, for example, the essential amino acid in greatest deficit is lysine. The con-tents of lysine in egg and wheat proteins are 72 g/kg and 27 g/kg, respectively, andthe chemical score for wheat protein is therefore 27/72 � 0.37. Scores correlate wellwith biological values for rats and human beings, but not for poultry.They are usefulfor grouping proteins but suffer a serious disadvantage in that no account is taken ofthe deficiencies of acids other than that in greatest deficit.

Measures of protein quality for monogastric animals
313
The essential amino acid index (EAAI)
This is the geometric mean of the egg, or standard pattern, ratios of the essentialamino acids. It has the advantage of predicting the effect of supplementation in com-binations of proteins. On the other hand, it has the disadvantage that proteins of verydifferent amino acid composition may have the same or a very similar index.
Both the chemical score and the essential amino acid index are based upon grossamino acid composition. It would be more logical to use figures for the acids avail-able to the animal. Such figures may be obtained in several ways. Determinations ofdigestibility in vivo involve amino acid analyses of the food and faeces. The figuresso obtained are suspect because the faeces contain varying amounts of amino acidsnot present in the food, mainly as a result of microbial activity in the large intestine.Thus, net synthesis of methionine and lysine has been shown to take place in thehind gut of the pig. On the other hand, cysteine, threonine and tryptophan disappearfrom the large intestine but make little or no contribution to the amino acid nutri-tion of the animal. This drawback may be overcome by determining apparent ilealdigestibility, by measuring amino acids in the digesta at the terminal ileum instead ofin the faeces. A more accurate estimate of the dietary amino acids absorbed is pro-vided if the contribution of amino acids of endogenous origin to those found at theterminal ileum is used in the calculation of truly digestible amino acids. Digestibilitytrials in vivo are laborious, time-consuming, require considerable technical resourcesand skill, and are expensive. Determinations in vitro involve the action of one or, atmost, a few enzymes and are not strictly comparable with the action in vivo, whichentails a series of enzymes.
Biological assay of available amino acids
The available amino acid content of a food protein may be assayed by measuring theliveweight gain, food conversion efficiency or nitrogen retention of animals given theintact protein as a supplement to a diet deficient in the particular amino acid underinvestigation.The chick is the usual experimental animal and the response to the testmaterial is compared with the response to supplements of pure amino acids. Themethod has been used successfully for lysine, methionine and cystine but, in addi-tion to the usual disadvantages associated with biological methods – time, technicalexpertise and supply of suitable animals – there is the major problem of constructingdiets deficient in specific amino acids but adequate in other respects.
Microbiological assay of essential amino acids
Certain microorganisms have amino acid requirements similar to those of higher an-imals and have been used for the evaluation of food proteins.The methods are basedon measuring the growth of the microorganisms in culture media that include theprotein under test. Best results have been obtained with Streptococcus zymogenesand Tetrahymena pyriformis. The former is used after an acid or enzymic prediges-tion of the food protein; estimates of the availability of lysine and methionine haveagreed well with chick assays and measurements of NPU. T. pyriformis has intrinsicproteolytic activity and is used, for soluble proteins, without predigestion. Animproved method, using predigestion with the enzyme pronase and measuring

Chapter 13 Evaluation of foods: protein
314
response in terms of the tetrahymanol content of the culture medium, has given re-sults for available lysine, methionine and tryptophan that correlate well with thoseof biological assays.Tetrahymanol, the characteristic pentacyclic terpene synthesisedby T. pyriformis, is determined by gas–liquid chromatography.
Chemical methods
It would be ideal if there were simple chemical procedures for determining the avail-ability of amino acids, the results of which correlated well with those of acceptedbiological methods. The most widely used method is that for FDNB-reactive lysine,which was originally proposed by K J Carpenter and has since undergone modifica-tion both by Carpenter and by other workers.The theoretical justification for the useof the method is that practically the only source of utilisable lysine in foods is thatwhich has the epsilon-amino group free to react with various chemical reagents.Theprotein under test is allowed to react under alkaline conditions with fluoro-2,4-di-nitrobenzene (FDNB) to give DNP-lysine, the concentration of which can be meas-ured colorometrically. In practice, the method has been found to agree well withbiological procedures for evaluating proteins as supplements to diets, such as thosecontaining high proportions of cereals, in which lysine is limiting.The correlation hasalso been good with diets based largely on animal protein. With vegetable proteinand diets containing high levels of carbohydrate, the method is not so satisfactory,the results being too low owing to destruction of the coloured lysine derivative dur-ing acid hydrolysis. Various methods have been proposed to counter this, but nonehas proved completely satisfactory. From the available evidence it seems clear thatFDNB-available lysine overestimates the availability of the acid when applied toheat-treated meals, as illustrated in Table 13.6.
The gross protein value is probably the most commonly used biological method forevaluating proteins. Gross protein values measure the ability of proteins to supple-ment diets consisting largely of cereals and they correlate well with FDNB-reactivelysine figures.
Dye-binding methods
These have been used widely for estimating protein in such foods as cereals andmilk. The methods are rapid and give reproducible results, and attempts have beenmade to use them for measuring total basic amino acids and reactive lysine. The
Table 13.6 Mean amounts of total lysine, FDNB-reactive lysine and truly digestiblelysine in heat-treated meat and bone meals
Sample
1 2 3 4 5 6
Total lysine (g/100 g) 2.65 2.59 2.82 2.73 3.89 2.68FDNB-available lysine
(g/100 g)2.17 1.91 2.53 2.32 2.57 2.11
Ileal truly digestible lysine (g/100 g)
1.72 1.75 1.93 1.97 2.88 2.03
Adapted from Moughan P J 1991. In: Haresign W and Cole D J A (eds) Recent Advances in AnimalNutrition, London, Butterworth-Heinemann.

Measures of food protein used in practice in the feeding of pigs and poultry
315
latter requires blocking of the epsilon-amino group to prevent reaction with the dye.Orange G has been used, along with 2,4,6-trinitrobenzene sulphonic acid and propi-onic anhydride as blocking agents, and has proved effective for estimating the lysinecontent of cereals. It is less effective for fish and meat meals.
The increased use of synthetic lysine in foods presents a further problem. Thisamino acid has both amino groups available for reaction with FDNB. The resultingcompound is soluble in ether and is not estimated by the Carpenter method.
Interpretation of amino acid assays
Several factors may be responsible for a lack of agreement between estimates of pro-tein quality based on amino acid content and those made in animal experiments:
■ Even small changes in the concentration of one or more amino acids may increasethe amounts of others required to maintain growth rates.
■ Certain acids, such as tryptophan and histidine, may be toxic, albeit at concentra-tions far greater than normally occur in food proteins.
■ Antagonisms may exist between specific acids, which prejudice their utilisation.Thus, the addition of as little as 20 g/kg of leucine to a diet deficient in isoleucinemay have deleterious effects on performance, and the arginine requirement of therat may be increased by giving higher levels of lysine.
■ Antinutritional factors (ANF) are frequently present in foods used primarily asprotein sources. Chief among these are enzyme inhibitors, lectins, polyphenolsand certain non-protein amino acids. All are capable of lowering the absorptionand/or the utilisation of amino acids by the animal but are not taken into accountin evaluations of protein sources based on amino acid content. The nature andmode of action of anti-nutritional factors is dealt with in Chapter 24 with partic-ular reference to their importance in individual foods.
■ There is considerable evidence that growing animals, such as young rats andchicks, do not fulfil their growth potential if the dietary nitrogen is entirely in theform of essential amino acids.Additional nitrogen is required and is best suppliedas a mixture of non-essential amino acids; glutamate, alanine and ammonium cit-rate are also effective sources. Allowance must be made for these factors when aprotein source is being evaluated on the basis of its content of one or more essen-tial amino acids.
13.5 MEASURES OF FOOD PROTEIN USED IN PRACTICE IN THEFEEDING OF PIGS AND POULTRY
The difficulty of assessing the value of a dietary protein is reflected in the variety ofmethods that have been proposed, all of which have considerable limitations. Acrude protein figure gives a measure of the total nitrogen content and is useful sincethe digestibility of the proteins in foods commonly given to pigs and poultry is fairlyconstant.This is not true for new or unusual sources of protein, and this approach isnot a valid one.
The quality of dietary protein is indicated by stating the contents of all of theessential amino acids or of those most likely to be in deficit. Practical pig and poul-try diets are based largely on cereals, and assessment of foods as sources of proteinfor such animals is a matter of measuring their ability to supplement the amino acid

Chapter 13 Evaluation of foods: protein
316
deficiencies of the cereals.The main deficiencies in these cases are of lysine or methio-nine, and so the most useful measures of protein quality are those that reflect the avail-able lysine or methionine content of the food.The determination of available lysine isnow accepted as a routine procedure for protein foods in many laboratories.
Dietary protein for growing pigs can also be expressed in the form of ideal pro-tein.This is a modification of the chemical score. If the main limiting amino acid is ly-sine at 50 g/kg CP, then if we use the recommended content of lysine in the idealprotein of 70 g/kg CP, the score would be 50/70 � 0.70 and the ideal protein con-tent would be 700 g/kg CP. A diet with 170 g/kg of this protein would then supply170 � 0.7 � 119 g ideal protein/kg. Requirements are usually stated in terms of ap-parently digested ideal protein (ADIP) and a digestibility of 0.75 is assumed in trans-forming the ideal protein supply to an ADIP supply.
In the UK, the most recent method for describing amino acid requirements anddietary supply for pigs is standardised ileal digestible amino acids. The concept ofstandardised ilieal amino acids was described earlier on p. 306. This approach hasthe advantage over ideal protein by using ileal digestibility and therefore avoidingmicrobial amino acid production in the hind gut inherent in using whole-tract di-gestibility, and also accounting for basal endogenous amino acid loss.This approachalso avoids the feed value reducing as amino acid intake declines. The standardisedileal digestible amino acid requirement is calculated in relation to lysine, with thebalance of the other essential amino acids expressed for the processes of growth,pregnancy and lactation, as shown in Table 13.7.The balance of amino acids reflectsdifferences in the composition of the proteins synthesised. In the case of lactatingsows and young fast-growing pigs, the maintenance requirement is small in relationto the total, and the composition of the product (body and milk protein) will domi-nate the demand for amino acids. Consequently, for lactating sows, phenylalanine �tyrosine, leucine and valine are required in greater proportions, whereas pregnantsows have a relatively greater requirement for methionine � cystine.A value of 0.84
Table 13.7 Recommended balance of amino acids in relation to lysine (� 1.00)
Growing pigs Pregnant sows Lactating sows
(10–120 kg)
Lysine 1.00 1.00 1.00Methionine 0.30 0.37 0.30Methionine � cystine 0.59 0.65 0.55Threonine 0.65 0.71 0.66Tryptophan 0.19 0.20 0.18Isoleucine 0.58 0.70 0.60Leucine 1.00 1.00 1.12Histidine 0.34 0.33 0.40Phenylalanine 0.57 0.55 0.56Phenylalanine � tyrosine 1.00 1.00 1.14Valine 0.70 0.74 0.76
A minimum requirement for non-essential amino acids is approximately 2.5 times the level(g/kg diet) of the sum of the 11 named essential amino acids.
Adapted from British Society of Animal Science 2003 Nutrient Requirement Standards for Pigs, Penicuik,British Society of Animal Science.

Measures of food protein used in practice in the feeding of horses
317
can be used to convert standarised ileal digestible lysine (g/day) to total dietarylysine (g/day). In theory this conversion factor is variable, but in practice it is as-sumed to be constant. As the standardised measure debits basal endogenous lossesto the animals, feedstuffs are credited with a slightly higher (3–8 per cent) digestibleamino acid content than previously uncorrected ileal digestibility values.Values forthe standardised ileal digestibility of the essential amino acids in common pig feedingredients are presented in Appendix 2.
The concept of standardised ileal digestible amino acids makes no allowance foran excess of an individual amino acid, which, in certain circumstances, could be sub-stantial. It is usual therefore to limit the concentration of any one amino acid to lessthan 1.2 times that of the value presented in Table 13.7. It is also assumed in calcu-lating the requirement for standardised ileal digestible amino acids that the propor-tions of amino acids made available to the metabolic body pool are the same asthose in the dietary protein. This will not be so if the acids are not digested or ab-sorbed to the same extent.
For poultry, evaluation of protein sources is based upon the amounts of the threemajor limiting amino acids, lysine, methionine and tryptophan. It is generally as-sumed that diets adequate in these acids will automatically provide sufficientamounts of the others. As for pigs, dietary requirements and supply are based onstandardised ileal digestibility (SID). This may be measured using precision-fed cae-cectomised adult cockerels or, more commonly, young broilers fed a diet that includesan indigestible marker. The concentration of the marker in the ileal digesta deter-mined following slaughter allows apparent ileal digestibility to be calculated, which isthen corrected for basal amino acid flow from broilers fed a nitrogen-free diet.
13.6 MEASURES OF FOOD PROTEIN USED IN PRACTICE IN THEFEEDING OF HORSES
The digestion of protein within the horse occurs mainly in the fore gut through en-zymic digestion in the stomach and small intestine, as described in Chapter 8.Aminoacids produced from microbial protein synthesis in the hind gut are not absorbed insufficient quantities to provide any meaningful contribution to amino acid supply.For example, studies that have infused lysine into the hind gut have shown no effecton plasma lysine levels and there is no active absorption of amino acids in the largeintestine.
Within the horse, protein quality is predominately a function of the dietary aminoacid profile and the digestibility of the protein source in the fore gut. Despite this, therationing system used in the USA expresses dietary supply and requirements in rela-tion to dietary crude protein. This approach may be valid if the digestibility of theproteins in foods commonly given to horses is fairly constant, but it is questionableconsidering the range of protein content and quality present in many forages. Studiesthat have examined protein digestibility in horses have generally relied on apparenttotal tract digestibility and do not take into consideration endogenous secretions,which can vary between 3.5 mg and 5.8 mg N/g DM intake, or the contribution frommicrobial growth in the hind gut.True ileal digestibility values have been reported forhay, concentrates and mixed diets, and precaecal digestion of protein is approxi-mately 0.25–0.30 g/g in forages and 0.70–0.75 g/g in protein supplements.Values for

Chapter 13 Evaluation of foods: protein
318
forages will vary considerably, depending on species, stage of growth and proportionof non-protein nitrogen. Non-protein nitrogen sources such as urea, although di-gestible, do not contribute to amino acid supply and result in little or no nutri-tional benefit to the horse. Indeed, supplementation with urea results in anincrease in blood ammonia, urea and excretion of urea in the urine, and can leadto ammonia toxicity. A more accurate estimate of dietary protein supply can bemade by calculating the available protein (AP).The AP content of a feed (g/kg DM)is defined as the crude protein content (g/kg DM) minus the non-protein nitrogencontent (g/kg DM multiplied by 6.25) minus the acid detergent insoluble nitrogen(ADIN, g/kg DM, multiplied by 6.25).TheADIN content represents the bound proteinthat is unavailable for digestion and absorption.There is a strong correlation (r2 � 0.91)betweenAP and digestible protein, andAP is therefore a more useful mean of express-ing dietary supply. It is generally recommended for maintenance, pregnancy andgrowth that lysine contributes 0.043 of dietary crude protein content, but consideringthe differences in lysine requirements for different productive processes in the pig, itseems unlikely that a constant dietary lysine concentration should apply in horses.
In France a more sophisticated system, the Horse Digestible Crude Protein sys-tem (Matières Azotées Digestible Cheval; MADC), is used. The system is based onthe amino acid content of the feeds and whether they are digested in the small orlarge intestine. True nitrogen digestibility values in the small intestine are based onmeasurements made with ileal fistulated animals or from slaughter studies. TheFrench system makes an assumption that microbial protein produced in the large in-testine can be absorbed, although values are less than 10–30 per cent of the nitrogenflowing to the small intestine.The amino acid supply to the horse is then the sum ofthat truly digested in the small intestine and that digested in the large intestine. Al-ternatively, the MADC content of a feed can be estimated by multiplying the appar-ent digestible crude protein content by 1.0 for concentrates, by 0.90 for greenforages, by 0.85 for dried hays, by 0.80 for straw and by 0.70 for good-quality grasssilage. In Holland and Germany apparent digestible crude protein is used.
13.7 MEASURES OF PROTEIN QUALITY FOR RUMINANT ANIMALS
Traditionally, proteins in foods for ruminant animals have been evaluated in terms ofcrude protein (CP) or digestible crude protein (DCP). Realisation that the crude pro-tein fraction contained variable amounts of non-protein nitrogen led to the use oftrue protein instead of crude protein, but this was unsatisfactory since no allowancewas made for the nutritive value of the non-protein nitrogen fraction.The concept ofprotein equivalent (PE), introduced in 1925 but now no longer used in this context,was an attempt to overcome this difficulty by allowing the non-protein nitrogen frac-tion half the nutritive value of the true protein.The term ‘protein equivalent’ is cur-rently used in connection with foods containing urea. Such foods must by law besold with a statement of their content of protein equivalent of urea; this means theamount of urea nitrogen multiplied by 6.25.
The use of DCP for evaluating food proteins for ruminants has been largely aban-doned. This resulted from a growing awareness of the extensive degradative andsynthetic activities of the microorganisms of the rumen (see Chapter 8). Rumenmicroorganisms are responsible for providing the major part of the energy require-ments of the host animal by transforming dietary carbohydrates to acetate, propionate

Measures of protein quality for ruminant animals
319
Dietary crude protein
Degraded crude protein Undegraded crude protein
Slowly degradedcrude protein
Rapidly degradedcrude protein
Saliva
Urea Ammonia Peptides
Rumen
Amino acids
Protozoal proteinBacterial protein
Undegraded dietarycrude protein
Urine
Faeces Faeces
Tissue protein
Amino acids
Digestible microbial protein Digestible undegraded dietaryprotein
Abomasum andsmall intestine
Fig. 13.2 Fate of dietary crude protein in the ruminant animal.
and butyrate. In order to do this and to exploit the energy potential of the food fully,they must grow and multiply, and this involves large-scale synthesis of microbial pro-tein.The nitrogen for this is obtained, in the form of amino acids, peptides and ammo-nia, by breakdown of the nitrogen fraction of the food. Bacteria acting on thestructural carbohydrate (SC) fraction of the diet use only ammonia, whereas those act-ing on the non-structural fraction (NSC) derive about 65 per cent of their nitrogenfrom amino acids and peptides, and the remainder from ammonia.
The microbial protein passes from the rumen and is digested in the small intes-tine, and so makes a contribution to satisfying the amino acid requirements of thehost animal.The magnitude of this contribution depends upon the speed and extentof microbial breakdown of the dietary nitrogen fraction, the efficiency of the trans-formation of the degraded material into microbial protein (nitrogenous compounds),the digestibility of the microbial protein and the biological value of the latter.
The degradative and synthetic processes taking place in the rumen are of majorimportance in the nitrogen economy of the host animal since they determine the na-ture of the amino acid mix made available for protein synthesis at tissue level. Theseries of changes undergone by dietary protein between mouth and body tissue inthe ruminant animal is illustrated schematically in Fig. 13.2.

Chapter 13 Evaluation of foods: protein
320
Satisfying the demands of the rumen microorganisms for readily available nitro-gen is a major function of the diet, and to this end a certain proportion of the nitro-gen fraction must be degradable by the rumen microorganisms.
Current systems for the evaluation of food protein for ruminant animals involvedeterminations of the degradability of protein in the rumen, the synthesis of micro-bial protein, the digestion in the lower gut of both food and microbial proteins, andthe efficiency of utilisation of absorbed amino acids.The methods used to determinethese components of the system are described next, after which their use in the sys-tems will be illustrated.
Degradability of the nitrogen fraction of the diet
Nitrogen fractions within the diet will vary in their susceptibility to breakdown,from immediately degraded to undegradable, and from 0 to 1 in the extent to whichthey are degraded in the rumen and digested when they reach the small intestine(see Table 13.8).
Degradability will be affected by such factors as the surface area available for mi-crobial attack and the protective action of other constituents as well as the physicaland chemical nature of the protein. Claims have been made that the solubility of aprotein is correlated with ease of breakdown, but these do not survive critical exam-ination. Thus, casein, which is readily degraded in the rumen, is not readily soluble;whereas albumin, which is resistant to breakdown, is readily soluble. It has been sug-gested that a major factor affecting degradability is the amino acid sequence withinthe protein molecule. If this is so, then the nature of the microbially produced rumenpeptidases is of considerable importance and it seems doubtful whether any simplelaboratory test for degradability is possible.
The extent to which a nitrogen fraction is degraded in the rumen will dependupon its innate degradability and the time it spends in the rumen, i.e. rate of passage.As the rate of passage increases, so the extent of ruminal breakdown is reduced.
Measurement of degradability in vivo
This involves the measurement of dietary nitrogen intake, the endogenous nitrogen(EN), the non-ammonia nitrogen (NAN) and the microbial nitrogen (MN) of dietary
Table 13.8 Composition, rumen degradation and intestinal digestion of protein fractions
Fraction Composition Rumen degradation Intestinal
(%/hour) digestibility (%)
A Ammonia, nitrate, amino Instantaneous None reaches intestineacids, peptides
B1 Globulins, some albumins 200–300 100B2 Most albumins, glutelins 5–15 100B3 Prolamins, cell-wall proteins, 0.1–1.5 80
denatured proteinsC Maillard products, nitrogen bound 0 0
to lignin, tannin-bound protein
Adapted from Chalupa W and Sniffen C J 1994. In: Garnsworthy P C and Cole D J A (eds) Recent Advances in Animal Nutrition,Nottingham, University of Nottingham Press.

Measures of protein quality for ruminant animals
321
origin passing the duodenum. Degradability (Dg) of nitrogen is then expressed asfollows:
This method requires accurate measurement of duodenal flow and microbial andendogenous nitrogen. The flow measurement, which usually requires the use of adual-phase marker system, has a large coefficient of variation (between animals),and many published values must be suspect owing to the small number of animalsused in their determination. Microbial nitrogen in duodenal nitrogen is usually iden-tified by means of marker substances such as diaminopimelic acid (DAPA),aminoethylphosphoric acid (AEPA), ribonucleic acid and amino acids labelled with35S, 32P and 15N.The concentration of marker in the microorganisms is measured ina sample of rumen fluid. Different markers may give results that vary widely, some-times by as much as 100 per cent. The assumption that the microorganisms isolatedfrom rumen fluid are representative of those flowing to the duodenum is of doubtfulvalidity, since the latter include organisms normally adherent to food particlesand/or the rumen epithelium.The endogenous fraction constitutes about 50–200 g/kgof the duodenal nitrogen but is difficult to quantify.A value of 150 g/kg is frequentlyassumed. Measurements of degradability are thus subject to possible errors owing touncertainties in measuring duodenal flow and microbial and endogenous nitrogen,and are affected by dietary considerations such as the level of feeding and the sizeand frequency of meals. It has been calculated that estimates of degradability mayvary over a range of 0.3–0.35 owing to errors of determination alone. Despite its in-adequacies, this technique remains the only method currently available for provid-ing an absolute measure of protein degradability and is the standard against whichother methods have to be assessed.
Determination of degradability in sacco (or in situ)
This involves incubation of the food in synthetic fibre bags suspended in the rumen,as described in Chapter 10.The degradability is calculated as the difference betweenthe nitrogen initially present in the bag and that present after incubation, stated as aproportion of the initial nitrogen:
When protein disappearance (p) is regressed on time, p increases but at a reducingrate.The relationship may be described by an equation of the following form:
in which a, b and c are constants that may be fitted by an iterative least-squares pro-cedure.The relationship is illustrated in Fig. 13.3.
In Fig. 13.3, a is the intercept on the y-axis and represents degradability at zerotime. It is the part of the protein that is water-soluble and that is considered to be im-mediately degradable; b is the difference between a and the asymptote and repre-sents the part of the protein that is degraded more slowly; c is the rate ofdisappearance of the potentially degradable fraction b, and t is the time of exposure.The extent of protein breakdown will depend upon the time for which the protein
p = a + b(1 - e- ct)
Degradability =
initial N - N after incubationinitial N
Dg = 1 -
NAN - (MN + EN)
dietary N intake

Chapter 13 Evaluation of foods: protein
322
remains in the rumen (i.e. upon its rate of passage through the rumen).The effectivedegradability P may then be defined as follows:
in which r is the rate of passage from the rumen to the abomasum (see p. 325).Asthe time of incubation increases, so the fraction of the protein remaining in therumen falls to zero, as does the rate of breakdown, and P may then be defined asfollows:
In this equation, a is the immediately degradable protein and bc�(c � r) is theslowly degradable fraction.
If we assume a rate of passage of 0.05, with a � 0.30, b � 0.70 and c � 0.02, thenthe effective degradability would be 0.3 � 0.7 � 0.02�(0.02 � 0.05) � 0.50. Theprotein available to the rumen microorganisms would then be 0.50 � CP.
The technique is subject to several inherent sources of error, which must be con-trolled if reproducible results are to be obtained. Chief of these are sample size, bagsize, porosity of the bag material and treatment of the bags following removal fromthe rumen. Ring tests (i.e. tests carried out at several laboratories) have shown unac-ceptably high interlaboratory variability, indicating a need for strictly defined stan-dard procedures that have to be adhered to rigidly if the results are to be universallyapplied in practice. A standardised procedure is given in the document Agriculturaland Food Research Council (1992) Technical Committee on Responses to NutrientsReport No. 9, Nutrient Requirements of Ruminant Animals: Protein.
A basic assumption of this method is that disappearance of nitrogen from thebag, virtually reflecting solubility in rumen fluid, is synonymous with degradability.It has been known for some time that small amounts of food protein that are solu-bilised may leave the rumen without being degraded, and this must cast doubt onthe veracity of values obtained using the technique. Even more serious in this con-text is the recent observation that acid detergent insoluble nitrogen (ADIN), known
P = a + bc>(c + r)
P = a + 3bc>(c + r)431 - e- (c + r)t4
Proteindisappearance
1.00
0.80
0.60
0.40
0.20
6 12 18 24
a
b
t (h)
Fig. 13.3 Relationship of protein disappearance to time of incubation.

Measures of protein quality for ruminant animals
323
to be undegradable, may disappear during incubation.A further complication is thepresence in the bags of rumen bacteria, which contribute to the nitrogen of the con-tents. The error attributable to microbial attachment can be corrected for byanalysing the bag residues for a microbial marker, but this is expensive and time-consuming and seldom conducted. The effects of microbial attachment are greatestin feeds with a high fibre content and low nitrogen content.
Laboratory procedures for determining nitrogen degradabilitySolubility in buffer solutions
Significant correlations have been demonstrated between the degradability values forthe nitrogen fractions of foods and their solubility characteristics in a range of buffersolutions, including McDougall artificial saliva, borate–phosphate buffer and WiseBurroughs’s buffer.When the methods are used for a range of foods, errors of predic-tion may be high, but within food types predictions are improved sufficiently to allowthe use of buffer solubility in the routine monitoring of concentrate foods.
When used in conjunction with methods for the fractionation of dietary nitrogento predict degradability, solubility in buffer solution has shown good correlation withfigures based on enzyme solubility (see below).
Solubility in enzyme solutions
Solubilisation of protein by purified enzymes from fungi and bacteria has beenwidely investigated as a means of estimating degradability. Different proteases havegiven varying results when compared with the in sacco technique. This is not unex-pected in view of the fact that a single enzyme is being used to simulate the actionof the complex multienzyme system of the rumen. As with the buffer solutions, ac-curacy of prediction is poor over a range of foods but improves when the techniqueis applied within food types. The most promising enzyme sources have beenStreptococcus griseus, Streptococcus bovis, Bacteroides amylophilus andButyrovibrio strain 7. Streptococcus griseus protease is the preferred source of en-zyme for estimating degradability in the French protein digested in the intestine(PDI) system.The method used incorporates corrections for different food types, andthe regression equation of degradability in sacco on enzyme solubility has a quotedresidual standard deviation (rsd) of 0.025. Thus, estimates of degradability could beexpected to be within � 0.05 of the in sacco value on 95 per cent of occasions.
Chemical analysis
A number of workers have shown significant correlations between crude proteincontent and degradability, reflecting the decreased proportion of the nitrogen frac-tion bound to fibre with increasing nitrogen content.The following equation for pre-dicting the nitrogen degradability of grasses has been claimed to have an acceptableerror of prediction:
where Dg is degradability, CP and NDF are as g/kg and r is the outflow rate per hour.In the Cornell net protein and carbohydrate system, food protein is separated
into fractions based on a combination of borate–phosphate extractions and thedetergent system of carbohydrate analysis of Goering and Van Soest (Fig. 13.4).
Dg = (0.9 - 2.4r)(CP - 0.059NDF)>CP

Chapter 13 Evaluation of foods: protein
324
The protein is then allocated a degradability value based on the proportions ofthe various fractions present and their enzyme-determined degradability values (seeTable 13.8).
Near-infrared reflectance spectroscopy
Near-infrared reflectance spectroscopy (NIRS) measurements reflect the types andproportions of organic structures within a material.As such, they are used widely forthe routine analysis of foods and their nutritional evaluation (see Chapter 1). Thetechnique might therefore be expected to provide a solution to the problem of deter-mining degradability. Current indications are that NIRS has the ability to estimate ni-trogen degradability with a high degree of precision and considerable accuracy, withR2 values of 0.80–0.87 being claimed.
In vitro rumen fermentation techniques
In vitro techniques mimic rumen fermentation by incubating a test protein withrumen fluid. In order to improve repeatability and reproducibility, most techniqueshave been standardised. Systems can be either a simple batch system that measuresthe volume or pressure of gas produced as an indicator of microbial activity, or amore sophisticated continuous culture system, with the most developed being theRusitec or dual-phase continuous culture system. In general, in vitro measures ofrumen degradation are less time-consuming and expensive than in vivo measure-ments, but they are limited by their inability to recycle nitrogen to the rumenmicroorganisms. They also need a source of rumen fluid to start the culture andrequire the use of microbial markers with their inherent limitations, as describedearlier. End-product inhibition of batch cultures may cause severe deviations fromthe digestive process occurring in vivo.
Total nitrogen
Boratebuffersolution
Neutral-detergentsolution
Acid-detergentsolution
Soluble Insoluble Soluble SolubleInsoluble Insoluble
B1
B3
C
A
C
B1 B1
B2 B2 B2
B3 B3
C
AA
A=soluble in buffer; B1= oluble in buffer and precipitated by trichloracetic acid;B2= insoluble in buffer but soluble in neutral- and acid-detergent solutions;B3= insoluble in buffer, insoluble in neutral-detergent solution but solublein acid-detergent solution; C = nsoluble in buffer and both neutral- and acid-detergent solutions.
s
i
Fig. 13.4 Partitioning of dietary protein.
From Chalupa W and Sniffen C J 1994. In: Garnsworthy P C and Cole D J A (eds) Recent Advances in AnimalNutrition, Nottingham, University of Nottingham Press.

Measures of protein quality for ruminant animals
325
Rate of passage (r)
The extent to which a protein is broken down in the rumen depends not only on itsinnate degradability but also upon the length of time for which it is exposed tobreakdown and therefore upon its rate of passage through the rumen. It may be de-fined as follows:
where Dg � rumen degradability, Kd � rate of digestion and r � rate of passage.The rate of passage of food from the rumen is affected by a complex of food and
animal factors. Passage is faster for:
■ smaller particles;■ particles of higher density;■ more highly hydrated particles;■ more highly digested particles.
Passage will thus increase as digestion and rumination proceeds.Rate of passage increases with increased dry matter intake and is thereby affected
by a number of animal and environmental factors:
■ Advancing pregnancy limits rumen fill and increases rate of passage.■ Lactation increases intake and rate of passage.■ Excessive body condition can reduce intake and rate of passage.■ High environmental temperatures will reduce intake and throughput.
The value for r may be determined by treatment of the protein with dichromate.The treatment renders the protein completely indigestible, there is no loss ofchromium from the protein subsequent to treatment, and particle size distribution isnot affected. The rate of dilution of chromium in samples of rumen contents takenover a period of time (see Chapter 8) can therefore provide an estimate of the rate ofpassage of the protein from the rumen.
Efficiency of nitrogen capture
The efficiency with which nitrogen is captured by the microorganisms of the rumen de-pends not only upon the speed and extent of breakdown but also upon the synchro-nous provision of a readily available, utilisable source of energy to fuel the synthesis ofmicrobial protein. Failure to achieve this balance can result in too rapid and extensivea breakdown, and the synthetic powers of the rumen microorganisms may be over-whelmed.Wastage may then occur, since the excess ammonia is absorbed and largelyexcreted as urea; some, however, is recycled via the rumen wall and contributes fur-ther to the nitrogen economy of the rumen.The extent of recycling has been estimatedas about 70 per cent of nitrogen intake for diets of low protein content (about 50 g/kg)and as little as 11 per cent for foods with about 200 g/kg.The extent of recycling in aparticular situation may be calculated using the following equation:
where Y � recycled urea nitrogen as a percentage of nitrogen intake and X � percent crude protein in dry matter.
Y = 121.7 - 12.01X + 0.3235X2
Dg = Kd>(Kd + r)

Chapter 13 Evaluation of foods: protein
326
The part of the food crude protein that is immediately degradable is unlikely to beas effective a source of nitrogen for the microorganisms as that which is more slowlydegraded. It is generally considered that the slowly degraded nitrogen fraction is in-corporated into microbial protein with an efficiency of 1.0, whereas that immediatelydegraded is used less efficiently. Estimates of the efficiency with which immediatelydegraded protein is incorporated vary, but 0.8 is a commonly used figure.
Yield of microbial protein
The yield of microbial protein that becomes available for digestion and absorptionpost-ruminally by the host has been related to the energy of the diet stated in termsof digestible organic matter (DOM), digestible organic matter digested in the rumen(DOMADR), total digestible nutrients (TDN), metabolisable energy (ME), fer-mentable organic matter (FOM), fermentable metabolisable energy (FME), rumen-degradable carbohydrate and rumen-degradable dry matter. The last four eliminateproducts of fermentation and fat, neither of which is considered to provide energythat can be utilised by the rumen microorganisms.The energy of fermentation prod-ucts is significant in the case of silages and some distillery and brewery by-products.Hays are not considered to have undergone fermentation, though they oftencontain measurable amounts of fermentation acids such as acetic and propionic acid.The routine measurement of the contribution of fermentation products to metabolis-able energy in individual foods has not been a feasible proposition, and assumedvalues are commonly used.The validity of such values is questionable in view of thevariation in the magnitude and diversity of the fermentation products in individualfoods.
A simple relationship between available energy and microbial protein yield can-not reflect the true position. It takes no account of the following:
■ The maintenance requirement of the microorganisms, which has been estimatedto vary from 0.022 g to 0.187 g carbohydrate/g bacteria per hour: when fermen-tation is slow, as with diets rich in structural carbohydrate, maintenance costs maybe significant and estimates of microbial yield may be exaggerated.
■ The rumen environment: lowering the rumen pH from 6.7 to 5.7 has been shownto halve microbial protein production, which may be significant when diets arerich in soluble carbohydrate and low in fibre, with consequent production of lac-tic acid and ruminal acidosis.
■ Variation in the form of nitrogen required by the different types of microorgan-ism: thus, the organisms splitting non-structural carbohydrates (NSC) are able toutilise peptide nitrogen and ammonia, whereas those splitting structural carbohy-drates are unable to use amino nitrogen and have to rely on ammonia as theirsource of nitrogen. It has been shown that the yield of NSC-splitting bacteria isincreased by almost 20 per cent when the proportion of peptides in the totalNSC � peptides increases from 0 per cent to 14 per cent.Above 14 per cent thereis no further increase in yield.
The relationships used in predicting microbial protein from fermentable energyhave high standard errors of estimate and should be used with caution. In addition,such relationships may be used to calculate yields of microbial protein only whenthe supply of energy is limiting.When the supply of protein to the microorganisms islimiting, this will determine the yield of microbial protein.

Measures of protein quality for ruminant animals
327
Sophisticated models attempt to relate microbial yield to the rate of carbohydratefermentation and rate of passage, the theoretical growth rate, the energy cost of bacter-ial maintenance and the form of nitrogen available to the rumen microorganisms. Manyof the relationships involved in such calculations are based on laboratory characterisa-tion of the food, and the value of the model will depend on the validity of the relation-ships between the laboratory determinations and the values used in the models.
True digestibility of protein
The microbial protein synthesised in the rumen may be protozoal or bacterial, therelative proportions depending upon conditions within that organ. Thus, low rumenpH tends to reduce protozoal activity and stimulate that of certain bacteria.The mix-ture of bacterial and protozoal protein, along with dietary protein not degraded inthe rumen, passes to the abomasum and small intestine. Here, it is broken down toamino acids, which are then absorbed into the body. The digestibility of bacterialprotein is lower (about 0.75) than that of the protozoal (about 0.90), and the overalldigestibility of microbial protein will depend to some extent upon the rumen envi-ronment. However, protozoal protein constitutes only 5–15 per cent of the totalmicrobial protein flow from the rumen, and its influence on the overall digestibilityof microbial protein will be small. The composition of bacteria is variable, but thatshown in Table 13.9 is an acceptable approximation.
About 15 per cent of the total nitrogen is in the form of nucleic acids, about25 per cent is cell wall protein and the remainder is true protein.Available evidenceindicates that the digestibility of nucleic acid nitrogen is of the order of 0.8–0.9, andthat of microbial true protein 0.85–0.9. It is commonly assumed that the proteinassociated with the cell walls is completely indigestible. Most estimates of the truedigestibility of microbial protein are of the order of 0.85–0.87, which is higher thanmight be expected in view of the proportions of the fractions present in the protein.Although nucleic acids are highly digestible, their nitrogen is of no use to the animal,because after absorption it is totally excreted in the urine. Measurement of thesebreakdown products in the urine (particularly derivatives from purine-based nucleicacids) can be used to determine the extent of microbial growth in the rumen. Themeasurement of urinary purine derivatives avoids the need for surgically modifiedanimals and has been shown to correlate well with other measures of microbial pro-tein synthesis in the rumen. However, the output of purine derivatives in urine hasbeen shown to vary considerably throughout the day, requiring all of the urine to becollected.Attempts to relate microbial protein synthesis in the rumen to milk purinederivative levels have been unsuccessful.
Table 13.9 Composition of rumen bacteria
g/kg dry matter
Crude protein 625True protein 375Cell wall protein 155Nucleic acid (nitrogen � 6.25) 95Carbohydrate 210Fat 120Ash 45

Chapter 13 Evaluation of foods: protein
328
The digestibility of the undegraded dietary protein is a characteristic of the pro-tein mix in the food and may vary considerably from diet to diet.The true digestibil-ity of the undegraded dietary protein will vary with the proportion of the variousprotein fractions present. Thus, amino acids, peptides, globulins, albumins andglutelins will be almost completely digested; prolamins, proteins associated with thecell walls and denatured proteins will have digestibility values of about 0.8; the pro-tein of Maillard products and nitrogen bound to lignin will be completely indi-gestible. Some estimates of the true digestibility values of the various proteinfractions are shown in Table 13.8.
Digestibility has been shown to be related inversely to the content of acid deter-gent insoluble nitrogen (ADIN), which reflects the part of the food nitrogen that isbound closely to insoluble fibre.The digestible undegradable protein content (DUP)of a food is calculated thus:
This equation is based on the assumptions that ADIN is indigestible and that the di-gestible fraction has a true digestibility of 0.9.
In the case of foods such as maize gluten and some distillery and brewery by-products, which have been heat treated under moist conditions, Maillard-type reac-tions (see Chapter 4) may occur, resulting in an increase in the concentration ofnitrogenous compounds insoluble in acid detergent. Such ‘acquired ADIN’ does havea finite although low digestibility, and the above equation is unreliable when used forsuch foods. The use of ADIN is also limited in feeds with a high tannin content, astannins bind protein in the gut, resulting in a greater output in the faeces than intake.Other methods that have been used to estimate the digestibility of undegradableprotein in the small intestine include in vitro incubation with acid followed by pro-teases, and the insertion of mobile synthetic fibre bags containing previously rumi-nally degraded feed into the small intestine of cannulated animals, and recoveryfrom an ileal cannula or faeces.The difference between the protein inserted into thebag and recovered at the terminal ileum provides an estimate of true digestion of un-degraded protein in the small intestine.
Efficiency of utilisation of absorbed amino acids
The mixture of amino acids of dietary origin absorbed from the small intestine (i.e.the truly digested amino acids) is utilised for the synthesis of tissue protein.The effi-ciency of this process, which depends upon the composition of the mix relative tothat of the protein to be synthesised, is best represented by its true biological value.This will in turn depend upon the biological values of the digested undegradeddietary protein and the digested microbial protein, and upon the relative proportionsof each contributing to the mix. In addition, it will vary with the primary functionfor which it is required. Microbial protein is thought to have a relatively constantbiological value of about 0.8, whereas that of dietary origin will be variable andcharacteristic of the foods making up the diet. Prediction of such dietary values isextremely difficult, since the biological values of the individual proteins are no guideto their value in combinations. The variability of estimates with which truly di-gestible true protein presented for absorption is used for various functions is illus-trated in Table 13.10.
DUP = 0.9 (undegradable protein - ADIN * 6.25)

Measures of protein quality for ruminant animals
329
Growth 0.7Pregnancy 1.0Lactation 0.8Wool growth 0.3
Maintenance knm � 1.00Growth kng � 0.59Pregnancy knc � 0.85Lactation knl � 0.68Wool growth knw � 0.26
The Agricultural and Food Research Council, in its 1992 publication (see Furtherreading), describes the efficiency of utilisation of truly digested true protein in termsof the limiting efficiency of use of an ideally balanced amino acid mixture (kaai),taken as 0.85 under most conditions and 1.0 for maintenance. Relative values (RV)were then proposed for different functions:
Table 13.10 Comparison of estimates of the efficiency of utilisation of trulydigested true protein made in some protein evaluation systems for ruminants
System Maintenance Lactation Growth Wool/hair
PDI 0.64 0.28–0.68CPFD 0.80 0.80 0.80DVE 0.67 0.64AAT-PBV 0.75AP 0.67 0.67 0.50ADPLS 0.70 0.70 0.70 0.60CNCPS 0.67 0.65 0.41–0.75
PDI � the French protein digested in the intestine system; CPFD � the German crude proteinflow at duodenum system; DVE � the Dutch digestible protein in the intestine system; AAT-PBV � the Nordic system; AP � the American absorbed true protein system; ADPLS � theAustralian apparently digested protein leaving the stomach system; CNCPS � the Cornell netprotein and carbohydrate system.
The two factors were then combined to give the following working values (kn):
An alternative approach is to estimate the supply of essential amino acids madeavailable to the tissues (i.e. those absorbed from the small intestine) and to relatethis to the amino acid requirements of the animal.This approach needs informationon the truly digestible amino acid content of the undegraded dietary and the micro-bial protein.
The essential amino acid content of ruminal microbial protein is frequentlyclaimed to be relatively constant. In fact, large differences in the amino acid compo-sition of samples of microbial protein have been shown to exist. Some figures, basedon 441 samples from 35 experiments covering 61 diets, are given in Table 13.11.
There is evidence that the essential amino acid composition of undegradabledietary protein may differ significantly from that of the original dietary material, and

Chapter 13 Evaluation of foods: protein
330
it has been suggested that estimates of its contribution to the amino acid supplyshould be based on the amino acid profile of the insoluble fraction of the dietaryprotein rather than that of the whole dietary protein.A comparison of the essentialamino acid profiles of whole and insoluble proteins in some common foods is shownin Table 13.12.
Table 13.11 Amino acid composition of ruminal bacteria (g/100 g of amino acids)
Amino acid Mean Minimum Maximum Standard Coefficient of
deviation variation (%)
Arginine 5.1 3.8 6.8 0.7 13.2Histidine 2.0 1.2 3.6 0.4 21.3Isoleucine 5.7 4.6 6.7 0.4 7.4Leucine 8.1 5.3 9.7 0.8 10.3Lysine 7.9 4.9 9.5 0.9 11.9Methionine 2.6 1.1 4.9 0.7 25.6Phenylalanine 5.1 4.4 6.3 0.3 6.4Threonine 5.8 5.0 7.8 0.5 8.9Valine 6.2 4.7 7.6 0.6 10.1Alanine 7.5 5.0 8.6 0.6 7.3Aspartic acid 12.2 10.9 13.5 0.6 4.8Glutamic acid 13.1 11.6 14.4 0.7 5.3Glycine 5.8 5.0 7.6 0.5 8.2Proline 3.7 2.4 5.3 0.5 13.2Serine 4.6 3.4 5.4 0.4 8.9Tyrosine 4.9 3.9 7.7 0.6 13.2
From Clark J H, Klusmeyer T H and Cameron M R 1992 Journal of Dairy Science 75: 2304–23.
Table 13.12 Amino acid composition of whole and insoluble protein in somecommon foods (g/100 g protein)
Dried brewer’s Soya bean Maize Timothy
Maize grains meal silage hay
A B A B A B A B A B
Methionine 1.6 1.4 1.4 0.6 1.0 0.8 0.9 0.9 0.7 0.9Lysine 2.2 1.7 2.1 2.1 5.2 6.6 1.8 2.2 2.9 2.8Histidine 2.2 1.9 1.7 1.3 1.7 1.3 0.9 0.9 1.1 1.1Phenylalanine 4.2 4.5 4.4 3.9 4.1 3.9 3.0 3.1 3.4 3.4Threonine 2.7 2.7 2.6 2.3 3.0 3.0 2.4 2.2 2.9 2.8Leucine 10.3 11.6 8.1 6.8 6.2 6.2 6.5 6.9 5.2 5.4Isoleucine 3.4 2.9 3.8 3.2 4.4 4.3 2.8 2.5 3.4 2.8Valine 3.5 3.9 3.8 3.6 3.4 3.8 3.7 3.5 3.5 3.9Arginine 3.7 2.7 3.6 3.0 6.0 7.8 1.7 2.2 3.2 3.0
A is dietary protein. B is insoluble protein (aa in whole protein - aa in buffer-soluble protein -aa in cell wall protein).
After Muscato T V, Sniffen C J, Krishnamoorthy U and Van Soest P J 1983 Journal of Dairy Science 66:2198–207.

The UK metabolisable protein system
331
A measure of the effect of assuming one or other of the measures of amino acidcomposition can be gained if we consider the following daily ration:
DM (kg) CP (g) Methionine (g) Lysine (g)
A B A B
Maize silage 10.0 1100 9.9 9.9 19.8 24.2Maize 5.0 490 7.8 6.9 10.8 8.3Soya bean meal 3.0 1509 15.1 12.0 78.4 99.5Total 18.0 3099 32.8 28.8 109.0 132.0B as per cent of A 88 121
A is calculated by assuming the amino acid composition of the whole protein. B is calculatedby assuming the composition of the insoluble available fraction.
Amino acids are usually considered to have the same true digestibility as trueprotein, but there is evidence that the efficiency with which individual amino acidsare metabolised will vary with the biological value of the protein and the amino acidsupply relative to requirement.
A system for the quantitative nutrition of ruminant animals should embody theprocesses described, which requires that factors such as degradability, efficiency ofnitrogen capture, microbial protein yield, digestibility of microbial protein, digestibilityof dietary undegraded protein and the true biological value of the absorbed nitrogenor its essential amino acid content be quantified.
13.8 THE UK METABOLISABLE PROTEIN SYSTEM
The system is fully described in the 1992 report of the Agricultural and Food ResearchCouncil’s Technical Committee on Responses to Nutrients (see Further reading).
The microbial demand for protein is stated in terms of effective rumen-degradableprotein (ERDP) and foods have to be evaluated in the same terms. The ERDP of afood is calculated as follows:
where a, b and c are the fitted parameters derived from the determination in saccoof the degradability of the food, 0.8 is the efficiency of capture of the nitrogen of thereadily degradable fraction, and r is the outflow rate and is varied as follows:
ERDP = CP * 30.8a + bc>(c + r)4
Animal r
Cattle and sheep at low planes of nutrition 0.02Calves, beef cattle, sheep and dairy cows (up to twice
the maintenance level of feeding)0.05
Dairy cows yielding more than 15 kg of milk per day 0.08
Alternatively, the following equation may be used for calculating r for levels offeeding (L) as multiples of ME for maintenance:
r = -0.02 + 0.14(1 - e-0.35L)

Chapter 13 Evaluation of foods: protein
332
Account is thus taken of the differential capture of rapidly and slowly degradableproteins and the rate of passage through the rumen.
The demand for amino acids at tissue level is quantified in terms of truly di-gestible protein required to be absorbed from the small intestine and designated‘metabolisable protein’ (MP), as described in Chapters 14–16.
Microbial protein contributes towards satisfying this demand.The yield of micro-bial crude protein is related to the energy available to the rumen microorganisms interms of fermentable metabolisable energy:
MEferm is assumed to be 0.1 ME for silages and 0.05 ME for brewery and distilleryby-products, and MEfat is 35 MJ/kg. The assumption made here for silage must besuspect.The major fermentation product in well-made silages is lactate, and there isevidence that several rumen bacteria, notably Megasphaera elsdenii (see Table 8.3 inChapter 8), are able to utilise lactate with the production of propionate. The micro-bial crude protein yield (g) is calculated as follows:
where y � 9 at maintenance, 10 for growth and 11 for lactation; or alternatively:
The proportion of the microbial crude protein present as true protein is assumedto be 0.75 and the true digestibility to be 0.85, and the contribution of microbialprotein (DMP) to the truly absorbed amino acids is:
When this contribution is taken into account, there remains a residual metabolis-able protein requirement, which may be calculated as MP - DMP and which has tobe satisfied by the truly digestible undegraded protein of the diet.The true digestibil-ity of dietary undegraded protein is calculated on the assumption that the ADINcontent is indigestible and that the remainder has a true digestibility of 0.9.The trulydigestible undegraded true protein (DUP) is then:
where a, b and c are the usual in sacco constants and DUP, CP and ADIN are g/kg DM.The metabolisable protein supplied by the food may be calculated as MP (g/kg
DM) � DMP � DUP. An example of the evaluation of a protein source in theseterms is given in Box 13.1.
The metabolisable protein content of a food is of no use as a guide to the food’sability to satisfy the residual demand for metabolisable protein, since it includes acontribution from ERDP, which has already been taken into account in the form ofDMP. The protein content of foods is thus stated in terms of ERDP and DUP.
DUP = 0.95CP31 - a - bc>(c + r)4 - 6.25ADIN6
DMP (g>kg DM) = FME (y * 0.75 * 0.85) = 0.6375(FMEy)
y = 7 + 6(1 - e-0.35L)
FME (MJ)y
FME = ME - MEfat - MEferm

Feed into Milk
333
BOX 13.1 Evaluation of a protein source for a ruminant animal
Animal: 70 kg ewe with twin lambs producing 3 kg milk/day, y � 11.A concentrate feed has:
CP (g/kg DM) � 550EE (g/kg DM) � 20ME (MJ/kg DM) � 12.5a � 0.2b � 0.65c � 0.06r � 0.05ADIN (g/kg DM) � 0.20
Then:
ERDP (g/kg DM) � 550{0.8 � 0.2 � [0.65 � 0.06�(0.06 � 0.05)]} � 283FME (MJ/kg DM) � 12.5 - (35 � 0.02) � 11.8ERDP/FME � 283/11.8 � 23.98 > y and energy is limiting.
Then:
DMP (g) � 0.6375(11.8 � 11) � 82.7DUP (g/kg DM) � 0.9{[550(1 - 0.2 - (0.65 � 0.06�(0.06 � 0.05)))] - 6.25 � 0.2} � 219.4MP (g/kg)(DMP � DUP) � 82.7 � 219.4 � 302.1
Then:
ERDP � 283 g/kg DMDUP � 219 g/kg DM
13.9 FEED INTO MILK
A rationing system developed specifically for dairy cows, Feed into Milk (FiM) isnow used in the UK, full details of which can be obtained in the advisory manual byThomas (2004; see Further reading). The system retains many of the characteristicsof AFRC (1992), with a few notable modifications. For example, FME is replaced asthe unit of energy supply for microbial protein synthesis by adenosine triphosphate(ATP), which is derived from the degradation of feed dry matter in the rumen. Mi-crobial DM is produced in a three-stage process: microbial degradation of feeds tosimple compounds, the fermentation of these compounds to yield ATP, and the con-version of this ATP to microbial protein (Fig. 13.5). The microbial degradation offeeds is calculated using the in sacco degradability characteristics of feed DM andprotein, along with rumen outflow rates for liquid, forage and concentrates.
For both protein and DM degradability, FiM uses a modification of the in saccotechnique described by AFRC (1992). The soluble or ‘a’ fraction is in reality thewashable fraction that includes fine particles that leave the synthetic fibre bags butare not immediately available. FiM attempts to account for this by correcting forwater soluble losses (‘s’) by immersing the feed in water for 1 hour and filteringthrough a 16 µm filter paper and calculating ‘s’ using the following equation:
‘s’ =
(Xin - Xretained)
Xin

Chapter 13 Evaluation of foods: protein
334
where X is either g DM or nitrogen. Fine particles are then calculated as the differ-ence between the in sacco initial wash value (‘a’) and ‘s’. The fine particles are as-sumed to have the same degradability characteristics (‘b’ and ‘c’ values) as the largeparticles but flow out of the rumen with the liquid phase. The soluble component(‘s’) is assumed to have a rate of degradation of 0.9/hour and also flows out of therumen with the liquid fraction. For silages, the ‘s’ fraction is first corrected by sub-tracting fermentation acids.
The DM and nitrogen within a feed are considered to belong to one of threepools: the soluble/small particle pool (derived from both the forages and concen-trates), the forage particle pool, or the concentrate particle pool (depending onwhether the feed is a forage or concentrate).There is a a separate outflow rate fromthe rumen for the three pools: a liquid outflow rate for the soluble/small particlepool (kliq), a forage (kf) outflow rate for the long forage particles, and a concentrate(kc) outflow rate for the large concentrate particles.The outflow rates are calculated
Feed DM
Calculated using s, a, band c values for feed DM kliq kc kf
Yield of ATP dependson content of crudeprotein in feed
Efficiency of conversiondepends on rumenoutflow rate
YATP (ssp) YATP (conc.) YATP (forage)
Solubleand verysmallparticles
Concentrateparticles
Forageparticles
DegradedDM (g)
(forage)
DegradedDM (g)(conc.)
DegradedDM (g)
(ssp)
ATP yield (ATPy)conc. (mol/g DM)
ATP yield (ATPy)forage (mol/g DM)
ATP yield (ATPy)ssp (mol/g DM)
Total microbialprotein yield (g/day)
Fig. 13.5 Production of microbial protein from feed DM in Feed into Milk (FiM).kliq, kc and kf are fractional outflow rates from the rumen for small particles,concentrates and forages. ATPy is the yield of ATP from DM, and YATP is theefficiency of conversion of ATP into microbial protein from soluble and smallparticles (ssp), concentrates (conc.) and forage (forage).
Adapted from Thomas (2004).

Feed into Milk
335
from the DM intake, the animal liveweight (W) and the proportion of forage in theration:
where DMI is dry matter intake (kg/d),W is liveweight (kg) and f is the proportion offorage in the diet (DM basis). In practice, liquid, forage and concentrate outflow ratesare relatively constant over a range of DM intakes and forage proportions, as shownin Table 13.13.To simplify the calculations, set outflow rates of 0.08, 0.045 and 0.06for kliq, kf and kc, respectively, may be used.
Effective degradable nitrogen
The supply of effective degradable nitrogen (edn) from each feed is calculated fromthe degradability characteristics of the nitrogen fractions determined in sacco andthe appropriate outflow rates for the three fractions using the following equation:
where edn is effective degradable nitrogen, sN, bDN, bN and cN are the soluble,degradable small particle, degradable large particle nitrogen and fractional rate ofdegradation fractions of the feed (for either concentrates or forage). The proportionof nitrogen contained in the small particles (bDN) is calculated from the a, s and bfractions of the feed as (bN (aN - sN))�(1 - aN) and k is the fractional outflow rate ofthe forage (kf) or concentrate (kc), depending on the feed type being evaluated.Potential microbial crude protein supply from degradable nitrogen is determined asedn � 6.25.As in AFRC (1992), it is assumed that the true protein content of micro-bial crude protein is 750 g/kg crude protein and that the digestibility of the true pro-tein is 850 g/kg. Therefore, digestible microbial true protein (DMTP) is 0.6375microbial crude protein.The supply of digestible undegradable protein (DUP) is cal-culated in the same manner as described by AFRC (1992).
Degradability of dry matter
The effective degradability of the DM of the soluble/small particles (eddmssp) is cal-culated as follows:
eddmssp = (0.9s>(0.9 + kliq)) + (bDc>(c + kliq))
edn = (0.9sN>(0.9 + kliq)) + (bDN cN>(cN + kliq)) + (bN cN>(cN + k))
kc = 0.0025 + 1.25 kf
kf = 0.0035 + (0.22 DMI>W0.75) + 0.02f2
kliq = 0.0245 + (0.25 DMI>(W0.75) + 0.04f2
Table 13.13 Influence of DM intake and proportion of forage in thediet (kg DM/kg DM) on predicted liquid (kliq), forage (kf) andconcentrate (kc) outflow rates (proportion per hour) using FiM (2004)
DM intake (kg/day) 18 20 22
Forage proportion 0.8 0.5 0.35kliq 0.087 0.076 0.075kf 0.049 0.045 0.046kc 0.064 0.058 0.060

Chapter 13 Evaluation of foods: protein
336
For the large particles in concentrates or forages, the effective degradability(eddmlp) is calculated as follows:
Conversion of degraded dry matter to ATP
The degraded DM is then converted into a yield of ATP (mol/day) that is availablefor microbial maintenance and growth.An in vitro technique is proposed as the stan-dard reference method to estimate the efficiency of production of ATP per unit ofdegraded DM. Alternatively, the yield of ATP may be predicted from the followingequation:
Caution should be exercised when using this equation, particularly for feeds thatare high in non-protein nitrogen, as these may underestimate the ATP yield.
Conversion of ATP to microbial protein
The ATP yield (mol/kg DM) is converted by the rumen microbes to produce micro-bial DM.The efficiency of this conversion (YATP g microbial DM per mol ATP) is de-termined by the growth rate of the microbes, with faster-growing microbes using theenergy more efficiently than those growing more slowly. The rate of growth of themicrobes is determined by the phase with which they associate (i.e. soluble/smallparticles, forage or concentrate particles) and its outflow rate from the rumen and iscalculated as follows:
where k is the fractional outflow rate of liquid for the soluble/small particles, the for-age or concentrates, depending on the feed type. For example, for a liquid outflowrate of 0.08 per hour,YATP will be 13 g microbial DM per mol ATP, whereas a forageoutflow rate of 0.045 per hour will yield 11.3 g DM per mol ATP.The total yield ofmicrobial DM (MDM g/day) for a particular feed from each feed fraction is then cal-culated as follows:
whereATPssp � yieldATP from soluble/small particles (mol/g DM),YATPssp � efficiencyof conversion of ATP to microbial DM for microbes associates with soluble/smallparticles in forages or concentrates (g DM/mol ATP), ATPlp � yield ATP from largeparticles in forages or concentrates (mol/g DM), and YATPssp � efficiency of conver-sion of ATP to microbial DM for microbes associated with large particles (gDM/molATP).
Finally, to convert microbial DM to microbial protein, it is assumed that rumenmicrobes contain 100 gN/kg DM and that microbial crude protein consists of 160 gN/kg DM, providing a microbial crude protein content of 625 g/kg microbial DM.Microbial crude protein is converted to digestible microbial true protein by multiply-ing by 0.6375, as described earlier.
The preceding calculations are complicated and lend themselves more easilyto being undertaken by a computer program or spreadsheet than by hand. Ifconstant outflow rates for the liquid, forage and concentrates phases of 0.08, 0.045
MDM = (ATPssp * YATPssp) + (ATPlp * YATPlp)
YATP = 9 + 50k
ATP yield (mol/kg DM apparently degraded) = 27.3 - 0.0248CP (g/kg DM)
eddmlp = (bc>(c + k))

Summary
337
and 0.06 per hour, respectively, are used, then each feed will have a fixed metabolis-able protein supply derived from either the sum of the digestible microbial crudeprotein produced from the effectively degraded nitrogen supply and DUP (MPN), orthe sum of the digestible microbial protein produced from the rumen available en-ergy supply and DUP (MPE). These values are additive for each ingredient within aration, making diet formulation quick and simple. For example, a dairy cow fed 7 kgDM per day of a concentrate with an MPE value of 135 g/kg DM and an MPN valueof 158 g/kg DM and consuming 10.5 kg DM per day of grass silage with an MPEvalue of 84 g/kg DM and an MPN value of 89 g/kg DM would have a predicted dailymetabolisable protein supply from rumen available energy (MPE) of (7 � 135) �
(10.5 � 84) � 1827 g.The corresponding MPN values would be (7 � 158) � (10.5 �
89) � 2041 g.As the diet is limited first by MPE, daily metabolisable protein supplyis predicted to be 1827 g per day.The MPE and MPN values are routinely providedfor forages when analysed by NIRS.
FiM also assumes a constant ruminal pH of approximately pH 6.2 and ignores thedetrimental effects that low pH can have on ruminal metabolism. The system does,however, provide an estimate of whether rumen pH is likely to be altered throughthe calculation of a rumen stability value (RSV).The RSV of a feed is dependent onits fibre content, whether it is a concentrate or forage, and the potential acid load(PAL).The PAL content is a measure of the amount of acid that will be produced bythe feed on incubation with rumen liquor, expressed as meq/kg DM. Typically, haywill have a PAL of 800 meq/kg DM and barley 1150 meq/kg DM. The requirementfor RSV is affected by cow age, milk yield and quality, and the feeding system used.For example, fourth-lactation cows fed a total mixed ration will have a lower RSVrequirement than first-lactation animals fed concentrates twice daily in the parlour.If the RSV balance (RSV from diet - RSV requirement) is greater than �20, then itis assumed that no problems with acidosis should be encountered; if it is below 0,then it is advised that the diet should be modified.
SUMMARY
1. For food protein to be used with maximumefficiency, its constituent essential and non-essential amino acids must be present in thediet in sufficient quantities to meet the ani-mal’s metabolic demands.
2. Crude protein is a measure of food proteincalculated as nitrogen content multiplied by6.25. Digestible crude protein is calculated as6.25 times the difference between nitrogenintake and nitrogen voided in the faeces.
3. Ileal digestibility is measured as the differ-ence between nitrogen intake and nitrogenvoided at the terminal ileum.
4. For true digestibility, the endogenous compo-nent of the faecal or ileal matter must beknown.
5. Standardised digestibility takes account ofonly part of the endogenous nitrogen andremains an apparent figure.
6. Standardised methods (protein efficiencyratio, net protein ratio and gross proteinvalue) based on the growth response ofexperimental animals are used to evaluateprotein sources for monogastric animals.
7. Nitrogen balance is the difference betweennitrogen intake and nitrogen output in theform of faeces, urine, milk and eggs. As an es-timate of protein deposition in the animal’stissues, it is subject to several errors, and theresults have been known to diverge fromthose of the comparative slaughter technique.

Chapter 13 Evaluation of foods: protein
338
8. Biological value is stated as the proportion ofthe nitrogen intake that is actually retainedand takes account of endogenous urinary andfaecal nitrogen, whereas chemical score andthe essential amino acid index are based onthe proportion of the main limiting aminoacid of the protein in relation to that in astandard protein.
9. Assays of available amino acids may be madeby measuring the liveweight gain or food con-version efficiency of animals given the intactprotein as a supplement to a diet deficient in aparticular essential amino acid. Certain micro-organisms have amino acid requirementssimilar to those of higher animals and havebeen used for protein evaluation.
10. Determination of available lysine by reactionof fluoro-4-dinitrobenzene with the reactiveepsilon group has been shown to correlatewell with gross protein values of animalfoods and for supplements for high-cerealdiets.
11. Dye-binding methods have proved satisfac-tory for cereal and milk products.
12. Standardised ileal digestibility is now used forevaluating proteins for pigs. This approachhas the advantage of using ileal digestibilityand therefore avoiding microbial amino acidproduction in the hind gut inherent in usingwhole-tract digestibility, and also accountingfor basal endogenous amino acid loss. Valuesare also additive, simplifying diet formulation.
13. For poultry, evaluation of protein sources isalso based on standardised ileal digestibilityof the three major amino acids: lysine, me-thionine and tryptophan.
14. For horses, evaluation of protein sources isbased on crude protein or digestible crudeprotein.
15. In evaluating protein sources for ruminantanimals, account must be taken of:
■ the degradability of the protein within therumen;
■ the rate of passage of the food throughthe rumen;
■ the efficiency of capture of degraded pro-tein by the rumen microbes;
■ the yield of microbial protein;■ the true digestibility of the protein reach-
ing the small intestine;■ the efficiency of utilisation of nitrogen
absorbed from the small intestine.
16. The UK metabolisable protein system dividesthe requirement of an animal into that whichis required for supplying the needs of therumen microbes and that which is required attissue level. After estimating the contributionof microbial protein to satisfying this de-mand, the requirement for undegradeddietary protein is calculated.
17. The UK Feed into Milk (FiM) system uses ATPas the unit of energy for microbial growth,which is derived from the ruminal degradationof dietary DM and rumen outflow rates forliquid, concentrates and forages. Metabolis-able protein supply to the tissues is calculatedas the sum of that produced from rumen avail-able nitrogen plus digestible undegradableprotein (MPN) or rumen-available energy plusdigestible undegradable protein (MPE),whichever is the lower value. The system alsoprovides an indication of the effect of diet onrumen pH.
QUESTIONS
13.1 For a growing pig, calculate the apparent nitrogen retention when fed 1.5 kg/dayof a diet containing 29.5 g N/kg, with a daily faecal output of 5.6 g N and uri-nary nitrogen output of 19.5 g N.
13.2 Calculate the biological value (BV) of the following protein when consumed byrats. Daily food consumed was 6.4 g, nitrogen content of the food was 12.62 g/kg,total nitrogen excreted in the urine per day was 37 mg, endogenous nitrogen

Further reading
339
excreted in the urine per day was 23.0 mg, total nitrogen excreted in the faecesper day was 21.3 mg and metabolic faecal nitrogen excreted daily was 10.4 mg.
13.3 A protein feed for ruminants has the following in sacco degradability charac-teristics: a � 0.32, b � 0.51, c � 0.06.Assuming a rumen outflow rate of 0.05per hour, what is the predicted degradability? If the feed had a crude proteincontent of 240 g/kg DM, how much protein (g/kg DM) would be predicted tobe released within the rumen, and what would the ERDP content be?
13.4 Using Feed into Milk (FiM), what is the predicted supply of metabolisable pro-tein (MP) to a dairy cow fed 10 kg DM per day of grass silage, 2 kg DM per daysoya bean meal and 6 kg DM per day of molassed sugar beet pulp. The MPEand MPN content (g/kg DM) of the grass silage is 82 and 87, the soya beanmeal 271 and 417, and the sugar beet pulp 130 and 83, respectively.
FURTHER READING
Agricultural Research Council 1980 The Nutrient Requirements of Ruminant Livestock, Farn-ham Royal, Commonwealth Agricultural Bureaux.
Agricultural Research Council 1984 The Nutrient Requirements of Ruminant Livestock, Sup-plement No. 1, Farnham Royal, Commonwealth Agricultural Bureaux.
Agricultural and Food Research Council 1992 Technical Committee on Responses to Nutri-ents, report no. 9, Nutritive Requirements of Ruminant Animals: Protein, Farnham Royal,Commonwealth Agricultural Bureaux. (See also Nutrition Abstracts and Reviews, Series B62: 787–835.)
British Society of Animal Science 2003 Nutrient Requirement Standards for Pigs, Penicuik,British Society of Animal Science.
Chalupa W 1991 Model generated protein degradation nutrition information. In: Proceedingsof the Cornell Nutrition Conference, Ithaca, NY, p. 44.
Cronjé P B 2000 Ruminant Physiology: Digestion, Metabolism, Growth and Reproduction.Wallingford, CABI.
Julliand V and Martin-Rosset W 2004 Nutrition of the Performance Horse: Which System inEurope for Evaluating the Nutritional Requirements? Wageningen,Wageningen AcademicPublishers.
National Research Council 2007 Nutrient Requirements of Horses, 6th rev. edn,Washington,DC, National Academies Press.
National Research Council 2001 Nutrient Requirements of Dairy Cattle, 7th rev. edn,Washington,DC, National Academies Press.
Nissen S (ed.) 1992 Modern Methods in Protein Nutrition and Metabolism, London,AcademicPress.
Sejrsen K, Hvelplund T and Nielsen M O 2006 Ruminant Physiology: Digestion, Metabolismand Impact of Nutrition on Gene Expression, Immunology and Stress, Wageningen,Wageningen Academic Publishers.
Thomas C 2004 Feed into Milk: A New Applied Feeding System for Dairy Cows, Nottingham,Nottingham University Press.
Van Weerden I, van Weerden E J and Huisman J (eds) 1992 Nutritive and Digestive Physiologyin Monogastric Farm Animals,Wageningen, Pudoc.
Wiseman J and Cole D J A (eds) 1990 Feedstuff Evaluation, London, Butterworth.


PART 4
The nutrient requirements of animals
The animal uses the nutrients obtained from foods for a variety of purposes. This partdescribes how the nutrient requirements of the animal are quantified and expressed asfeeding standards.
Chapter 14 covers the nutrient requirements for maintenance and growth and explains howgrowth can be controlled by nutrient supply.
Nutrient requirements for reproduction are considered in Chapter 15, which also includesnutritional influences on puberty, fertility and fecundity and the requirements for eggproduction in poultry and growth of the foetus.
Chapter 16 describes the synthesis of milk components, followed by the requirements forlactation in the main farm animal species.
Formulation of a ration or diet requires knowledge of the nutrient requirements of theanimal (discussed in this part) and the nutritional value of the foods (discussed in Part 3) and,in order to combine these two, the amount of foods the animal can consume. Therefore,Chapter 17 gives details of factors affecting food intake in both monogastrics and ruminantsand the methods used to predict food intake.


343
14.1 Nutrient requirements for maintenance
14.2 Nutrient requirements for growth
14.3 Nutrient requirements for wool production
14.4 Mineral and vitamin requirements for maintenance and growth
14.5 Nutritional control of growth
The amounts of nutrients required by animals are often described by the general term‘feeding standards’. Two other terms used in the same context are ‘nutrient require-ments’ and ‘nutrient allowances’. Neither of these terms is strictly defined. However, a nutrient requirement is generally agreed to be the average amount required for a particular function, whereas a nutrient allowance is greater than this by a safetymargin designed primarily to allow for variations in the requirement between indi-vidual animals.
Feeding standards may be expressed either as quantities of nutrients or in dietaryproportions. Thus, the phosphorus requirement of a 50 kg pig might be stated as 11 g P/dayor as 5 g P/kg of the diet. The former method of expression is used mainly for animalsgiven exact quantities of foods, and the latter for animals fed to appetite. Various unitsare used for feeding standards. For example, the energy requirements of ruminantsmay be stated in terms of net energy (NE), metabolisable energy (ME), digestible en-ergy (DE) or feed units, and their protein requirements in terms of crude protein (CP),digestible crude protein (DCP) or metabolisable protein (MP). It is desirable that theunits used in the standards should be the same as those used in feed evaluation. Stan-dards may be provided separately for each process of the animal or as overall figuresfor combined processes. For example, the requirements of cattle and sheep are oftengiven separately for maintenance and for milk production, but those for growingchickens are for maintenance and growth combined. In some cases, the requirementsfor single processes are not known; this is particularly true for vitamin and trace elementrequirements.
As mentioned above, the translation of requirements into allowances that are usedin feeding practice often involves the addition of safety margins. The justification forsuch safety margin is illustrated by the following example. Suppose that in 500 kg cattlethe NE requirement for maintenance varies between individuals from 30 MJ/day to36 MJ/day, with a mean value of 33 MJ/day. Although some of this variation may reflectinaccuracies in the methods of measurement used, much of it undoubtedly reflects real
14 Feeding standards formaintenance and growth

Chapter 14 Feeding standards for maintenance and growth
344
differences between animals. If this is the case, then the adoption of a mean value of33 MJ/day as the value to be used in practice would result in some of the cattle beingoverfed and some being underfed. Underfeeding is generally regarded as the greaterevil, and so a safety margin is often added to the requirement when calculating theallowance to be fed. This safety margin is designed to ensure that no animals, or onlythose with an exceptionally high requirement, will be underfed. It may be an arbitraryvalue or, better, one based mathematically on the variation between animals; the largerthe variation, the greater the safety margin. The use of safety margins has been criti-cised on the grounds that overfeeding, say, 90 per cent of the population in order to en-sure that 10 per cent are not grossly underfed is wasteful. However, they are justifiedfor nutrients where the consequences of deficiency are serious and where the costs ofoversupply are relatively low (e.g. magnesium). However, for nutrients such as energy,the use of safety margins is probably not justified. Oversupply of energy is likely to beexpensive, and although animals will respond to the excess, an increase in the rate ofproduction may not be desirable as excess energy might be stored as body fat.
Individual variations between animals, and between samples of a food, must alwaysbe considered when applying feeding standards as such variation will inevitably lead toinaccuracies. For this reason, feeding standards should be considered as guides to feed-ing practice and not as inflexible rules; they do not replace the art of the farmer in thefiner adjustment of food intake to animal performance. The application of feedingstandards is not restricted to individual animals; they can also be used at farm scale tocalculate, for example, the total winter feed requirement of a dairy herd, or used atnational level to assist in planning food imports.
Between 1960 and the mid-1980s, feeding standards in the UK were developed byresearch scientists coordinated by the Agricultural Research Council, and translated intopractical manuals by nutritional advisors working for the Ministry of Agriculture andassociated governmental or commercial organisations (see Further reading). In 1983, asingle organisation comprising both research scientists and nutritional advisors, theTechnical Committee on Responses to Nutrients, became responsible for both revisingstandards and producing technical manuals. More recently, feeding standards for bothpigs and dairy cows have been developed by consortia consisting of both governmentbodies and commercial organisations. However, at the time of writing (2009), there isno UK organisation with overall responsibility for feeding standards, despite the contin-uing need for revision of current standards to incorporate new research findings.
Feeding standards have been developed in many other countries. In the USA, thestandards used have been developed by the National Research Council; similarly, Australiahas a national committee to develop and publish standards. In Europe, the Netherlandshas a Central Feed Bureau to publish and revise standards, and Germany, France and theScandinavian countries have similar organisations. Some of the manuals produced bythese organisations are listed in the further reading section, and examples of their useare included in the text. However, it is not possible to provide a comprehensive coverageof all the standards available.
The main users of feeding standards are commercial companies that supply concen-trate feeds as complete diets for pigs and poultry and as complementary feeds to foragesconsumed by ruminants. Nutritional advisers and consultants also use them to formulatediets and advise farmers. Commercial feed companies often modify published standardsin order to meet the specific needs of their customers. For example, the nutrient require-ments of poultry tend to change from one generation to the next because of the speedof genetic selection and improvement. Consequently, national feeding standards fail to

Nutrient requirements for maintenance
345
keep up with these changes. The variety of feeding standards available, the tendencyfor them to be frequently revised, and the increasing use of computers in ration formu-lation have encouraged users to be more flexible in their selection of feeding standards.In addition, the emphasis today is less on formulating rations to meet minimum require-ments and more on predicting animal responses to changes in nutrient supply (hencethe formation of the UK Technical Committee on Responses to Nutrients).
Feeding standards have been criticised on the grounds that they may not be appli-cable on farms. For example, grazing animals will eat what they can harvest ratherthan a prescribed ration. However, if grazing animals fail to grow because of a sus-pected copper deficiency, then knowledge of the copper requirement may be requiredto confirm that the element is deficient. In developing countries, standards are oftendifficult to apply because the foods needed to supplement local resources are notavailable. In developed countries, there may be a tendency to oversupply nutrientsthat are freely available and cheap (e.g. calcium). However, the need to avoid oversup-ply (by applying standards) has been recognised in countries where the excretion ofexcess nutrients by livestock causes environmental pollution, for example pollution ofsoil and water in the Netherlands by phosphorus and nitrogen compounds. In the nearfuture, feeding standards are likely to prescribe maximum as well as minimum levels ofnutrient supply.
14.1 NUTRIENT REQUIREMENTS FOR MAINTENANCE
An animal is in a state of maintenance when its body composition remains constant,when it does not give rise to any product such as milk, and when it does not performany work on its environment.As animals are rarely kept in this non-productive state,it might seem of academic interest to determine nutrient requirements for mainte-nance; however, the total requirements of many classes of animal, particularly rumi-nants, are calculated factorially by summation of the requirements for maintenanceand production. Consequently, knowledge of the maintenance requirements of ani-mals is of practical as well as theoretical significance.The relative importance of energyrequirements for maintenance is illustrated in Table 14.1, which shows the relativecontribution of maintenance and production to the total energy requirement of dif-ferent classes of animal.
The animals exemplified in Table 14.1 are all highly productive, but less produc-tive animals use proportionately more of their energy intake for maintenance. It maybe calculated, for example, that, on average, cattle in Africa use about 85 per cent oftheir energy intake for maintenance.
Animals deprived of food are forced to draw on their body reserves to meet theirnutrient requirements for maintenance.We have seen already that fasted animals mustcatabolise body reserves to provide the energy required for essential body processessuch as respiration and circulation of blood.As the energy so utilised leaves the bodyas heat, the animal is then in a state of negative energy balance.The same is also trueof other nutrients; for example, an animal fed on a protein-free diet will continue tolose nitrogen in its faeces and urine and is therefore in negative nitrogen balance.Thepurpose of a maintenance diet is to prevent this drain on body reserves, and themaintenance requirement for a nutrient can be defined as the quantity required toensure that the animal experiences neither a gain nor a loss of that nutrient.The re-quirement for maintenance is thus the minimum quantity promoting zero balance

Chapter 14 Feeding standards for maintenance and growth
346
(the qualification ‘minimum’ is necessary, because if the animal is unable to store thenutrient in question, then increasing the quantity supplied above that required formaintenance will still result in zero balance).
Energy requirements for maintenance
Basal and fasting metabolism
As explained earlier (see p. 261), energy expended in the maintenance of an animalleaves the body in the form of heat.The quantity of heat arising in this way is knownas the animal’s basal metabolism, and its measurement provides a direct estimate ofthe NE that the animal requires from its food in order to meet the demands of main-tenance. The measurement of basal metabolism is complicated by the fact that heatproduced by the animal comes not only from this source but also from the digestionand metabolism of food components (the heat increment of feeding) and from thevoluntary muscular activity of the animal. Heat production may also be increasedfurther if the animal is kept in a cold environment (see p. 350).
When basal metabolism is measured, the complicating effect of the heat incre-ment of feeding is eliminated by depriving the animal of food.The period of fast re-quired for the digestion and metabolism of previous meals to be completed variesconsiderably between species. In man an overnight fast is considered sufficient but inruminants digestion, absorption and metabolism continue for several days after feed-ing stops, and a fast of at least 4 days is needed; the same period is recommended forpigs, and a period of 2 days for fowl.There are a number of criteria for establishingwhether the animal has reached the post-absorptive state. If heat production can bemeasured continuously, then the most satisfactory indication is the decline in heatproduction to a steady, constant level.A second indication is given by the respiratoryquotient (see p. 264). During fasting, the oxidation mixture gradually changesfrom absorbed carbohydrate, fat and protein to body fat and some body protein.
Table 14.1 Relative contribution of maintenance and production to the totalenergy requirement of different classes of animals
Net energy requirement (MJ) Maintenance (%
total requirement)Maintenance Production
Daily values600 kg dairy cow producing 30 kg
of milk42 93 31
300 kg steer gaining 1 kg per day 23 16 5950 kg pig gaining 0.75 kg per day 7 10 411 kg broiler chicken gaining
35 g per day0.50 0.32 61
Annual values600 kg dairy cow producing
40 kg calf and 6000 kg milk15 727 18 600 46
200 kg sow producing 16 (1.5 kg) piglets and 750 kg milk
7 100 4 600 61
2.0 kg hen producing 250 eggs 190 95 67

Nutrient requirements for maintenance
347
This replacement in the mixture of carbohydrate by fat is accompanied by a declinein the non-protein respiratory quotient, and when the theoretical value for fat (0.7)is reached it can be assumed that energy is being obtained only from body reserves.In ruminants, an additional indication that the post-absorptive state has beenreached is a decline in methane production (and therefore digestive activity) to avery low level.
The contribution of voluntary muscular activity to heat production can be reducedto a low level when basal metabolism is measured in human subjects, but in farmanimals the cooperation needed to obtain a state of complete relaxation can rarely beachieved. Fasting may limit activity, but even the small activity represented by stand-ing as opposed to lying is sufficient to increase heat production. Consequently, in farmanimal studies the term ‘fasting metabolism’ is used in preference to ‘basal metabolism’,since strict basal conditions are unlikely to be obtained.A term often used in conjunc-tion with fasting metabolism is ‘fasting catabolism’; this includes the relatively smallquantities of energy lost by fasting animals in their urine.
Some typical values for fasting metabolism are given in Table 14.2.As one wouldexpect, the values are higher for larger than for smaller animals, but column 2 showsthat per unit of liveweight, fasting metabolism is still higher in small animals. At arelatively early stage in the study of basal metabolism, it was recognised that fastingheat production is related more closely to the surface area of animals than to theirweight, and it became customary to compare values for animals of different sizes byexpressing them in relation to surface area (column 3 of Table 14.2). The surface areaof animals is difficult to measure, and methods were therefore devised for predictingit from body weight. The principle of such methods is that, in bodies of the sameshape and of equal density, surface area is proportional to the two-thirds power ofweight (W0.67).The logical development of this approach was to omit the calculationof surface area and to express fasting metabolism in relation to W0.67.When the link be-tween fasting metabolism and body weight was examined further it was found thatthe closest relationship was between metabolism and W0.73, not W0.67. The functionW0.73 was used as a reference base for fasting metabolism of farm animals until 1964,when it was decided to round off the exponent to 0.75 (see column 4 of Table 14.2).
There has been considerable discussion as to whether surface area or W0.75 (oftencalled metabolic liveweight) is the better base. This will not be repeated here but iscontained in the books listed in Further reading. Mathematically, there is nothing to
Table 14.2 Some typical values for the fasting metabolism of adult animals of various species
Animal Liveweight (kg) Fasting metabolism (MJ/day)
Per
animal
(1)
Per kg
liveweight (W)
(2)
Per m2
surface area
(3)
Per
kg W0.75
(4)
Cow 500 34.1 0.068 7.0 0.32Pig 70 7.5 0.107 5.1 0.31Human 70 7.1 0.101 3.9 0.29Sheep 50 4.3 0.086 3.6 0.23Fowl 2 0.60 0.300 – 0.36Rat 0.3 0.12 0.400 3.6 0.30

Chapter 14 Feeding standards for maintenance and growth
348
choose between the two bases, for their relationships with fasting metabolism areequally close.
The fasting metabolism of adult animals ranging in size from mice to elephantswas found by S Brody to have an average value of 70 kcal/kg W0.73 per day; the ap-proximate equivalent is 0.27 MJ/kg W0.75 per day. There are, however, considerablevariations between species, as shown in Table 14.2. For example, cattle tend to havea fasting metabolism about 15 per cent higher than the interspecies mean, and sheephave a fasting metabolism that is 15 per cent lower.There are also variations withinspecies, notably those due to age and sex. Fasting metabolism per unit of metabolicliveweight is higher in young than in old animals, being for example 0.39 MJ/kg W0.75
per day in a young calf but only 0.32 MJ/kg W0.75 in a mature cow; it is also 15 percent higher in male cattle than in females or castrated males.
Energy balance and feeding trials
The quantity of energy required for maintenance is, by definition, that which pro-motes energy equilibrium (zero energy balance). This quantity can be estimated di-rectly in fed, as opposed to fasted, animals if the energy content of their food isknown and their energy balance can be measured in feeding trials. In theory thequantities of food given could be adjusted until the animals were in exact energyequilibrium, but in practice it is easier to allow them to make small gains or lossesand then to use a model of the kind depicted in Fig. 11.5 in Chapter 11 to estimatethe energy intake required for equilibrium. For example, suppose a 300 kg steer wasgiven 3.3 kg/day DM of a food with M/D of 11.0 MJ/kg DM and with a kg = 0.5. Ifthe steer retained 2.0 MJ/day, then its ME requirement for maintenance would becalculated as follows:
A similar approach can also be followed in feeding trials in which animals are notkept in calorimeters.The animals are given known quantities of food energy, and theirliveweights and liveweight gains or losses are measured. The partition of energy in-take between that used for maintenance and that used for liveweight gain can be madein two ways. The simpler method involves the use of known feeding standards forliveweight gain.The alternative is to use the figures for energy intake (I), liveweight(W) and liveweight gain (G) to solve the following equation:
The coefficients a and b then provide estimates of the quantities of food energyused for maintenance and for each unit of liveweight gain, respectively.This form ofanalysis can be extended to animals with more than one type of production, such asdairy cows, by adding extra terms to the right-hand side of the equation.
The main objection to using feeding trials to determine energy requirements formaintenance (and also for production) in this way is that liveweight change is a rela-tively poor measure of energy balance. However, it is possible to put the method ona sounder energy basis by using the comparative slaughter technique to estimatechanges in the energy content of animals.
Fasting metabolism as a basis for estimating maintenance requirements
The feeding trial method of estimating maintenance requirements has the advantageof being applied to animals kept under normal farm conditions, rather than under
I = aW0.75+ b G
(3.3 * 11) - (2>0.5) = 32.3 MJ ME/day

Nutrient requirements for maintenance
349
the somewhat unnatural conditions represented by fasting animals in a calorimeter.Consequently, it is often difficult to translate values for fasting metabolism into practi-cal maintenance requirements. One factor to be taken into account is that animals onthe farm commonly use more energy for voluntary muscular activity.Another factor isthat productive livestock must operate with a higher metabolic rate than fasted animalsand thereby incur a higher maintenance cost. Third, animals on the farm experiencegreater extremes of climate and may need to use energy specifically to maintain theirnormal body temperature.The first two factors are discussed below, and the effects ofclimate on energy requirements for maintenance are discussed on p. 350.
Estimates of the energy costs of various forms of voluntary muscular activity areshown in Table 14.3. In the first column the costs are given per unit of liveweight.Thesecond column gives estimates of the number of units of activity likely to be under-taken, and the third column gives estimated daily costs for a 50 kg sheep. For exam-ple, if the sheep walks 5.0 km per day (line 3) and the unit cost is 2.6 kJ perkilogram liveweight per kilometre, then a 50 kg sheep will incur a cost of 2.6 * 5.0 *50 = 650 kJ per day. Table 14.3 includes a value for fasting metabolism, and it can becalculated that the NE required by the sheep for maintenance will be increased by(650/4300) * 100 = 15.0 per cent if it walks 5.0 km per day.
Some of the activities listed in Table 14.3 are likely to be carried out by all ani-mals (standing, getting up and lying down, plus a minimal amount of locomotion).Consequently, their energy cost is always added to the fasting metabolism when calcu-lating maintenance requirements. For example, in the AFRC (1993) system (see Fur-ther reading), the activity allowance for a housed lactating ewe is 9.6 kJ per kilogramliveweight per day. For a 50 kg sheep this amounts to 480 kJ per day, or about 11 percent of the fasting metabolism.
The energy costs of eating (prehension, chewing and swallowing) and of rumina-tion are included in the heat increment of feeding (i.e. they are taken into account inthe estimation of efficiency constants, k). However, if animals are grazing, ratherthan having foods delivered to them, their energy requirements for muscular activitywill be much increased.Table 14.3 shows that if a 50 kg sheep has to walk 5 km andclimb 0.2 km a day in search of food, and has to extend its eating time from 2 hoursto 8 hours a day, its energy cost will be increased by 650 + 280 + 750 = 1680 kJ perday, which is equivalent to nearly 40 per cent of its fasting metabolism. In general,grazing animals are likely to have maintenance requirements that are 25–50 per centgreater than those of housed animals. However, the actual increase will depend upon
Table 14.3 Energy costs of physical activity in a 50 kg sheep
Activity Cost per kg
liveweight
Duration or
frequency
of activity
Cost per
day (kJ)
Standing 0.4 kJ/h 9 h/day 180Changing position 0.26 kJ 6 times/day 78Walking 2.6 kJ/km 5 km/day 650Climbing 28 kJ/km 0.2 km/day 280Eating 2.5 kJ/h 2–8 h/day 250–1000Ruminating 2.0 kJ/h 8 h/day 800Fasting metabolism 4300

Chapter 14 Feeding standards for maintenance and growth
350
the terrain and vegetation type. The efficiency with which ME is used to meet thecosts of muscular activity (kw) is generally assumed to be the same as km.
Although fasting metabolism is measured under standardised conditions, evi-dence suggests that the value obtained for a particular animal depends on that ani-mal’s previous energy status. If an animal on a high plane of nutrition is suddenlyfasted, then its metabolic rate will be higher than that of a similar animal that haspreviously been kept on a lower plane. In one comparison made with 35 kg lambs,those previously fed on a high plane had a fasting metabolism 20 per cent higherthan those previously fed on a moderate plane. The same effect is demonstratedwhen one attempts to provide animals with just enough food to keep their weightconstant (i.e. to keep them at maintenance).As time passes, the ration has to be pro-gressively reduced to maintain the required equilibrium. The inference is that ani-mals can adapt to low-level (maintenance) rations either by improving their efficiencyof energy utilisation or, more likely, by reducing non-essential muscular activity.Thismeans that if an animal’s fasting metabolism is determined after a period on a lowplane of nutrition, as is commonly the case, then the value obtained, even whenincreased to allow for additional muscular activity, may well underestimate its main-tenance requirement when offered a high plane of nutrition. This source of error isrecognised in the Australian energy system for ruminants (see p. 290), maintenancerequirements being increased as levels of energy intake rise.
The fasting metabolism of an animal when expressed per unit of metabolic weightmay vary depending on the animal’s body composition. Metabolically active tissuessuch as the internal organs and musculature require more energy for maintenancethan less metabolically active tissues. Consequently, a fat animal is likely to have alower fasting metabolism than a thin animal of the same weight.
Influence of climate on energy metabolism and requirements for maintenance
The influence of climate on the nutrition of farm animals is not confined to energyrequirements for maintenance but extends to other aspects of energy metabolismand also to nutrients other than energy. Nevertheless, climate has the greatest influ-ence on energy requirements, and in cold climates animals kept at or below themaintenance level are most affected.
Both mammals and birds are homeotherms, which means that they attempt tokeep their body temperature constant. Animals produce heat continuously and, ifthey are to maintain a constant body temperature, must lose heat to their surround-ings. The two main routes of heat loss are the so-called sensible losses by radiation,conduction and convection from their body surface, and evaporative losses of waterfrom the body surface and lungs (2.52 MJ/kg water).The rate at which heat is lost isdependent in the first instance on the difference in temperature between the animaland its surroundings; for farm animals, the rectal temperature, which is slightly lowerthan the deep body temperature, lies in the range 36–43 °C. The rate of heat loss isalso influenced by animal characteristics, such as insulation provided by the tissues andcoat, and by environmental characteristics, such as air velocity, relative humidity andsolar radiation. In effect, the rate of heat loss is determined by a complex interactionof factors contributed by both the animal and its environment.
Figure 14.1 illustrates the physics and physiology of heat loss from animals. Inthis example, the solid line represents the heat production of a fasted pig, resting ata ‘comfortable’ temperature of 22°C. Its heat production (and loss) is 5 MJ/day, and

Nutrient requirements for maintenance
351
Fed pig
Heat production
Fastedpig
Lowercriticaltemperature
Uppercriticaltemperaure
Thermoneutralzone
Evaporative loss
Temperature of environment ( C)o
Sensible loss
Hea
t p
rod
uct
ion
(M
J/d
ay)
10
5
5 10 15 20 25 30 35
Fig. 14.1 The effect of environmental temperature on the heat production of a pig.
this is divided almost equally between sensible and evaporative losses. If the air tem-perature is gradually reduced, the pig will begin to lose heat more rapidly. It canreduce this effect to a certain extent by reducing its evaporative losses and perhapsreducing blood flow (and heat transfer) to the body surface.The latter response willreduce the skin temperature and presumably make the animal feel cold.As the fall inair temperature continues, a stage is reached where the pig can maintain its deepbody temperature only by increasing its heat production, which it might do by in-creasing muscular activity, i.e. by shivering. The environmental temperature belowwhich heat production is increased is known as the lower critical temperature and inthis example is 20 °C.
If the pig were fed rather than fasted, then its heat production would be increasedby the heat increment of feeding and its lower critical temperature would be reduced(see Fig. 14.1, broken line). In this example, the pig would not have to increase itsheat production until the environmental temperature dropped to 7°C.
If this pig were subjected to an increasing temperature, it would have difficulty inlosing heat by sensible losses and would need to increase its evaporative loss. Even-tually, a temperature would be reached at which the pig would need to reduce itsheat production, which it might do by restricting its muscular activity and also by re-ducing its food intake.The temperature above which animals must reduce their heatproduction is known as the upper critical temperature.The range between the lowerand upper critical temperatures is known as the thermoneutral zone.
We can now move from this simple situation of the pig exposed to only one climaticvariable, temperature, to other animals and other climates.The lower critical temper-atures of animals kept in different environments are presented in Table 14.4. Rumi-nants have a wider thermoneutral zone and a lower critical temperature compared

Chapter 14 Feeding standards for maintenance and growth
352
with non-ruminants because ruminants have a greater capacity to regulate evapora-tive heat losses and their heat increment of feeding is higher (i.e. lower efficiencyconstants, k) than that of non-ruminants. In addition, ruminants tend to produceheat at a constant rate throughout the day, whereas non-ruminants tend to digest andmetabolise their food quickly and then experience cold when the heat increment hasdeclined. Smaller animals tend to be more susceptible to cold because they are oftenless well insulated. However, this is often balanced by having a higher basal metabolicrate per unit of body weight. Nevertheless, the lower critical temperature of an adultsheep (50 kg) is higher than that of a cow (500 kg) kept in a similar environment(Table 14.4).
An animal’s insulation depends on its subcutaneous fat (pig) and coat depth (sheepfleece, cattle hair, poultry feathers). Thus, a sheep that has been shorn is particularlyvulnerable to cold, even in summer, and especially if its food intake is restricted. Bydisturbing the coat or fleece, wind reduces insulation and, as shown in Table 14.4, in-creases the critical temperature. Rain increases heat loss both by reducing insulationand through the heat of vaporisation. In an adult sheep with a 50 mm coat, 30 mm ofrain per day can raise the critical temperature by 2–6 °C. In housed animals, insula-tion depends on the floor type and group size. Pigs kept on straw have a lower criti-cal temperature than that of pigs kept on concrete. Similarly, pigs kept in groups canhuddle together to reduce their surface area and lower their critical temperature.
The farm animals that are most likely to suffer from cold stress are newbornlambs, calves and pigs. They are small and tend to have poor insulation because oflow levels of subcutaneous fat or a thin coat of hair or wool. In addition, they are wetwhen born. If the newborn animal also fails to obtain sufficient milk from its mother,then its heat increment of feeding may be low. Newborn animals have a special type
Table 14.4 Some examples of the lower critical temperatures (°C) of farm animalsin different environments
Animal Type State Production level Wind speed (km/h)
0 15
Sheep Lamb Newborn – 28 34Adult Shorn Fasted 31 35
50 mm wool Fasted 22 28Maintenance 7 18Ad libitum -10 5
100 mm wool Ad libitum -40 –Cattle Calf Newborn – 18 28
Beef Store Maintenance -16 -3Growing (30 mm coat) Gaining 0.8 kg/day -32 -10
Cow Dairy (20 mm coat) Maintenance -8 1030 litres milk/day -30 -20
Floor
Straw Concrete
Pig Sow Adult 160 kg Maintenance 22 –Growing Individual High 14 19
Group High 7 13

Nutrient requirements for maintenance
353
of tissue known as brown adipose tissue for generating heat soon after birth, whichis deposited at strategic points such as the shoulder and abdomen. Fat droplets arestored in metabolically active cells that have a good blood supply. When the fat ismetabolised, the oxidation is uncoupled, with energy being released as heat ratherthan being captured as ATP. The heat so generated is then carried to other parts ofthe animal’s body by the blood. Reserves of brown adipose tissue are relatively smalland its protective role is limited. Consequently, it is very important that young ani-mals receive food in the form of colostrum and milk as soon as possible after birth.
A comparison of an animal’s lower critical temperature with the environmentaltemperature tells us whether the animal requires an additional source of energy toincrease its heat production. However, it does not tell us how much energy should besupplied. The various strategies for alleviating cold stress are (1) to make the envi-ronment warmer (e.g. improving the insulation of buildings or reducing draughts),(2) to allow the animal to increase its heat production from existing resources (e.g.by metabolising fat reserves) and (3) to increase the animal’s heat production bymanipulating its diet. The last would seem to be the preferable nutritional strategy.
In housed animals, the increase in heat loss for every 1 °C fall in temperaturebelow the lower critical temperature is reasonably constant.A value of 18 kJ per kgW0.75 per day has been quoted for adult pigs.Thus, if a sow weighing 160 kg (45 kgW0.75) were kept on a maintenance diet (19.4 MJ ME per day) at a temperature 5 °Cbelow its lower critical temperature (22°C), its daily heat loss would be potentially45 * 5 * 18 = 4050 kJ (4.05 MJ) greater than its heat production. This representsabout 20 per cent of its maintenance requirement.When ME is used to meet a deficitin heat production, the efficiency of ME utilisation is 100 per cent (i.e. k = 1). Con-sequently, the sow would require an additional 4.05 MJ ME/day to ensure energyequilibrium. An alternative strategy would be to increase the sow’s ME intake to alevel at which the additional heat increment would meet the heat deficit. For exam-ple, if kg was 0.7, the sow would need 13.5 MJ ME/day above its maintenancerequirement, which would yield 4.05 MJ as heat and 9.45 MJ as retained energy.
Laying hens are normally fed to appetite and are therefore able to adjust theirfood and energy intake to regulate body temperature.As the environmental temper-ature falls below 25 °C, their ME intake increases by 22 kJ for each 1 °C fall. For a1.8 kg bird, this is equivalent to 14 kJ per kg W0.75 (cf. 18 kJ for sows). The extraenergy consumed appears to be used solely to generate heat and has little effect onegg production. Calculations of this kind can be used by the farmer to determinewhether it is more economical to provide extra heat or insulation for poultry build-ings or extra food for the birds.
For housed ruminants, the increases in heat loss associated with a 1 °C fall in envi-ronmental temperature are comparable (10–20 kJ per kg W0.75 per day) to those forpigs and poultry, but are much greater (20–40 kJ) for ruminants kept out of doors andexposed to wind and rain. In ruminants it is often possible to influence heat productionby changing the quality of the diet. Metabolisable energy derived from low-qualityforage-based diets is used with a lower efficiency (k) than that derived from high-qualityconcentrate-based diets, and thus more heat is liberated to keep the animal warm.
In hot climates, the animal’s problem is one of disposing of the excess heat it pro-duces. We have seen already in Fig. 14.1 that as air temperature increases, sensibleheat losses (radiation, conduction and convection) reduce and more heat is lost byevaporation. Domestic species vary considerably in their ability to lose heat by theevaporation of water. Most mammals are poorly equipped with sweat glands and

Chapter 14 Feeding standards for maintenance and growth
354
birds have none. However, cattle, particularly tropical cattle (Bos indicus), are able tolose appreciable quantities of water and heat by sweating. Evaporation of water fromthe skin can be increased through surface water acquired by wallowing. However,the major route by which water vapour is lost is via the respiratory tract.The farmercan assist the animal to lose heat by providing shade, ventilation and possibly watersprays. However, if these and the animal’s own heat loss mechanisms become over-taxed, the animal has to reduce its heat production, which it does by reducing itsfood and energy intake.This means that potentially high-producing animals, such asdairy cows, are seriously handicapped in the tropics by their inability to maintainhigh levels of energy intake. Ruminant animals are generally poorly equipped for hotclimates because of their reliance on low-quality forage-based diets with a low effi-ciency of ME utilisation and a high heat increment of feeding.
Feeding standards for maintenance (energy)
Ruminants
Energy requirements for maintenance can be calculated from various feeding stan-dards. Although it is not possible to include all the standards, requirements calcu-lated using some of the most widely known standards are presented here.The energyrequirements for maintenance of cattle published by AFRC (1993) are based on fast-ing metabolism (F, MJ/day) and can be predicted as follows:
Fasting weight is predicted from liveweight (W ) by dividing by 1.08, and meta-bolic weight is calculated using the power 0.67 rather than the more usual 0.75.Thefasting metabolism of bulls is considered to be 15 per cent higher than that of steersand heifers of a similar weight, and an activity allowance (A, MJ/day) of 0.0071 Wand 0.0095 W is included for growing cattle and dairy cattle, respectively. Thus, theNE requirement for maintenance (NEm) of a 600 kg dairy cow would be calculatedas follows:
If the ME content of the cow’s diet was 11.0 MJ/kg DM, the efficiency of ME util-isation for maintenance (km) would be 0.714 (see Table 12.1 in Chapter 12) and theME requirement for maintenance (MEm) would be calculated as follows:
As stated previously, if an animal on a high plane of nutrition is suddenly fasted,then its fasting metabolism will be higher than that of a similar animal previously kepton a lower plane of nutrition. As the estimates of fasting metabolism adopted byAFRC (1993) were derived from beef and dairy steers fed at maintenance beforefasting, they may underestimate the fasting metabolism of dairy cows fed at higherlevels of production. Evidence suggests that the fasting metabolism of modern dairycows of high genetic merit, and on a high plane of nutrition, may be substantiallygreater than that previously suggested, and a value of 0.453 MJ/kgW0.75 has beenadopted by FiM (2004), which, based on their modelling approach (see Fig. 12.1),
= 59.2 MJ/day
MEm = 42.3>0.714
= 42.3 MJ/day
NEm = 0.53(600>1.08)0.67+ (0.0095 * 600)
F = 0.53(W>1.08)0.67

Nutrient requirements for maintenance
355
gives a fixed MEm of 0.647 MJ/kg W0.75. The higher maintenance requirement ofanimals at high levels of production probably reflects the higher mass of metaboli-cally active organs such as the gut and liver.
As with cattle, the maintenance requirements of sheep published by AFRC (1993)are based on fasting metabolism and an activity allowance that varies between0.0067 W for housed fattening lambs and 0.024 W for ewes on hill grazing.The NEmrequirement of a 50 kg hill ewe can be predicted as follows:
In contrast to AFRC (1993), where maintenance requirements are derived fromcalorimetric methods, the maintenance requirements of beef cattle published byNRC (2000) are derived using the comparative slaughter technique.This has the ad-vantage of allowing experiments to be conducted under conditions more similar tothose encountered in practice, and the effects of activity are implicitly incorporated.The NEm requirement of beef cattle can be predicted from empty body weight (EBW)as follows:
where .Maintenance requirements are then adjusted for the effects of breed and sex, with
the requirements of Bos indicus breeds being reduced by 10 per cent and the re-quirement of dairy breeds being increased by 20 per cent.The adjustment for effectsof sex is similar to that made by AFRC (1993). Further refinements are also includedfor the effects of climatic factors and previous nutritional status. The NEm require-ments of dairy cattle published by NRC (2001) are derived from calorimetric studiesand are predicted as follows:
It is interesting to note that the NEm requirements of beef cattle derived usingcomparative slaughter techniques and adjusted by 20 per cent for dairy breeds aresimilar to those of dairy cows derived using calorimetric methods.The NEm require-ment of sheep predicted by NRC (2007) of 0.23 W0.75 is similar to that adopted byAFRC (1993).
One of the most comprehensive approaches used to predict the energy require-ments for maintenance of ruminants is provided by CSIRO (2007), which hasadopted two generalised equations for the prediction of MEm as follows:
Ration formulation:
Prediction of performance:
where:
K = 1 for sheep and goats, 1.2 for B. indicus and 1.4 for B. taurus cattle;S = 1 for females and castrates and 1.15 for males;
M = 1 + (0.23 * proportion of DE from milk);A = age in years (maximum 6);
MEm = KSM(0.26 W 0.75 exp(-0.03A))>km + 0.09 MEI + MEgraze + Ecold
MEm = KSM(0.28 W 0.75 exp(-0.03A))>km + 0.1 MEp+ MEgraze + Ecold
NEm = 0.335 W0.75
EBW = W * 0.85
NEm = 0.322 EBW0.75
= 5.3 MJ/day
NEm = 0.23(W>1.08)0.75+ 0.024 W
Chapter 14 Feeding standards for maintenance and growth
356
km = efficiency of ME utilisation for maintenance;MEp = ME used directly for production;MEI = total ME intake;
MEgraze = additional energy expenditure of grazing;MEcold = additional energy expenditure when the temperature is below the lower
critical temperature.
The inclusion of MEp (or MEI) in the prediction of MEm recognises the fact thatfasting metabolism is known to vary directly with level of feeding.As a consequence,maintenance requirements predicted by CSIRO (2007) are 5–10 per cent higherthan those predicted by AFRC (1993).
Pigs and poultry
The energy requirements of pigs and poultry are normally stated for both maintenanceand production combined, although some theoretical standard maintenance require-ments have been calculated.The UK Technical Committee on Responses to Nutrientspredicts the maintenance requirements of sows (ME, MJ/day) to be 0.44 W0.75
(17.9 MJ for a 140 kg sow), with the requirement of boars being 15 per cent higher.Using the BSAS (2003) NE system, the fasting metabolism of pigs (F, MJ/day) is pre-dicted as 0.750 W 0.60 and an activity allowance of 0.1 and 0.05 times maintenanceis included for lactating sows or growing pigs, and boars, respectively.The activity ofpregnant sows is assumed to be negligible. For laying hens, the maintenance require-ment (ME MJ/day) is predicted to be 0.55 W 0.75.
Horses
The minimum maintenance requirements of horses (DE, MJ/day) predicted by NRC(2007) is 0.126 W, which is applicable to sedentary or docile horses. This value isincreased by 10 per cent (0.139 W ) for alert horses with moderate levels of activityand by 20 per cent (0.152 W ) for young active horses. Thus, a 500 kg horse withmoderate activity would require 69.5 MJ DE per day. Using the French NE system,the maintenance requirement of horses (NE, MJ/day) would be estimated to be0.351 W 0.75, which for a 500 kg horse gives 37.1 MJ/day. When this is convertedto DE and a 10 per cent activity allowance is included, this equates to 68.1 MJ/day,which is similar to that predicted by NRC (2007).
In addition to the energy required for maintenance, equine athletes also requireadditional energy for work (exercise). The amount of energy required for work de-pends on a variety of factors, such as level of training, type of exercise, rider weightand experience, and climate and ground conditions. Consequently, it is classified byNRC (2007) into four categories – light, moderate, heavy and very heavy work – andcalculated as 20, 40, 60 and 90 per cent of the maintenance requirement, respectively.Examples of the sort of activity associated with each level of work are presented inTable 14.5.
Protein requirements for maintenance
If an animal is fed on a nitrogen-free but otherwise adequate diet, it will continue tolose nitrogen in its faeces and urine.The nitrogen in faeces, as described earlier (seeChapter 10), consisting of enzymes and sloughed cells arising from the digestive tract,and from microbial residues, is referred to as metabolic faecal nitrogen (or protein).If the animal continues to eat, then it will continue to lose nitrogen in its faeces.

Nutrient requirements for maintenance
357
It is less obvious, perhaps, why an animal on a nitrogen-free diet should continueto lose nitrogen in its urine. In part, this excretion represents nitrogen that has beenincorporated into materials that are subsequently expended and that cannot be re-covered for reuse within the body. For example, the creatine of muscles is eventuallyconverted into creatinine, which is excreted in the urine. However, by far the greaterpart of the nitrogen in the urine of animals fed on a nitrogen-free diet is in the formof urea (in mammals), the typical by-product of amino acid catabolism, which arisesfrom the turnover of body protein, as described in Chapter 11. The rate of proteinturnover varies considerably from one tissue to another, with some proteins, such asthose in the liver and intestines, being replaced in hours or days, and others, such asthose in bone and nerve tissue, being replaced in months or years. The amino acidsreleased when body proteins are broken down form a pool from which replacementproteins can be synthesised.An amino acid may therefore be present in the liver oneday and in muscle protein the next. In effect, body proteins exchange amino acidsamong themselves. However, like protein synthesis from absorbed amino acids, thisrecycling is not completely efficient.Amino acids derived from one protein may notbe required in the next. Consequently, they are catabolised and the nitrogen con-verted to urea, which is subsequently excreted in urine.
When an animal is initially placed on a nitrogen-free diet, the quantity of nitrogenin its urine falls progressively for several days before stabilising at a lower level.When nitrogen is reintroduced, there is a similar lag in the re-establishment of equi-librium. This suggests that animals possess a protein reserve that can be utilised intimes of scarcity and restored in times of plenty.The tissues most readily depleted intimes of scarcity are those that are metabolically the most active and where the pro-teins are most labile, such as the liver. Depletion of liver nitrogen is associated with
Table 14.5 Examples of the weekly workload of horses in the light, moderate,heavy and very heavy exercise categories
Exercise
category
Mean
heart rate
(beats/min)
Description (hours/week) Types of events
Light 80 1–3 (40% walk, 50% trot, Recreational riding10% canter) Beginning training
Show horses (occasional)Moderate 90 3–5 (30% walk, 55% trot,
10% canter, 5% low jumping)
Recreational ridingSchool horsesShow horses (frequent)
Heavy 110 4–5 (20% walk, 50% trot,15% canter, 15% gallop and jumping)
Ranch workPoloLow/medium-level eventingRace training (middle stages)
Very heavy 110–150 Various, ranging from 1 hour per week of speedwork to 6–12 hours of slow work
Racing (speed or endurance)Elite three-day eventing
Adapted from National Research Council 2007, Nutrient Requirements of Horses, Washington, DC,National Research Council.

Chapter 14 Feeding standards for maintenance and growth
358
some reduction in enzyme activity, and the reserve protein is therefore considered tobe a ‘working reserve’, which consists of the cytoplasmic proteins themselves.
Once the reserve protein has been depleted, urinary nitrogen excretion reaches aminimal and approximately constant level. However, this level will be maintainedonly if energy intake is adequate. If tissue protein is catabolised specifically to pro-vide energy, then urinary nitrogen excretion will increase again.The amount of nitro-gen excreted at this minimal level is known as the endogenous urinary nitrogen andrepresents the smallest loss of body nitrogen commensurate with the continued exis-tence of the animal. Endogenous urinary nitrogen can therefore be used to estimatethe nitrogen (or protein) requirement for maintenance. It is analogous to basal me-tabolism, and in fact there is a relationship between the two. The proportionalitycommonly quoted is 2 mg endogenous urinary nitrogen per kcal basal metabolism(about 500 mg/MJ). For adult ruminants, however, the ratio is somewhat lower, at300–400 mg endogenous urinary nitrogen per MJ fasting metabolism.The reason forthis is that ruminants on low-protein diets are capable of recycling urea back to therumen or large intestine. As a consequence, nitrogen that would be excreted in theurine of non-ruminants is subsequently excreted in the form of microbial residues.The total or basal endogenous nitrogen is calculated as the sum of endogenous uri-nary nitrogen plus metabolic faecal nitrogen. For ruminants, basal endogenous ni-trogen is approximately 350 mg N/kg W 0.75 and is equivalent to 1000–1500 mg/MJfasting metabolism, which is two or three times higher than that in non-ruminants.
When nitrogen is reintroduced into the diet, the quantity of nitrogen excreted inthe urine increases because of the inefficiency of utilisation of amino acids derivedfrom the diet. Urinary nitrogen excreted in excess of the endogenous component isknown as exogenous urinary nitrogen.This name implies that such nitrogen is derivedfrom food and not from body origin. However, with the exception of the creatininefraction of the endogenous portion, it is doubtful whether such a strict division isjustified. It is better to regard the so-called exogenous fraction as the extension of anexisting nitrogen loss rather than an additional loss because it reflects mainly an in-crease in protein turnover and the inefficiency of amino acid utilisation.
The quantity of nitrogen (or protein) required for maintenance is that which willbalance the endogenous urinary and metabolic faecal losses of nitrogen (and also thesmall dermal losses in hair, scurf and sweat).The two most common methods used tomeasure these losses are analogous to those employed to measure energy require-ments for maintenance. The first, analogous to the determination of fasting catabo-lism, involves measuring the animal’s nitrogen losses when it is fed on a nitrogen-freediet, and calculating the quantity of food nitrogen required to balance these losses.The second, analogous to the measurement of maintenance requirements using feed-ing trials (see p. 348), involves measuring the nitrogen intake required to producenitrogen equilibrium.
Feeding standards for maintenance (protein)
Ruminants
The starting point for the factorial calculation of the protein requirements of rumi-nants adopted by AFRC (1993) is basal endogenous nitrogen (BEN) excretion, whichcan be predicted as follows:
BEN (g N/day) = 0.35 W 0.75

Nutrient requirements for maintenance
359
For a 600 kg cow the BEN loss would be 42.4 g/day. In cattle, dermal losses in hairand scurf are predicted to be 0.018 W 0.75, which gives an additional loss of 2.2 g/day,and a total loss of 44.6 g/day (or 279 g protein). In the UK metabolisable proteinsystem described in Chapter 13, absorbed amino acids are assumed to be utilised formaintenance with an efficiency of 1.0. Consequently, the metabolisable proteinrequirement for maintenance (MPm) of a 600 kg cow would be 279 g/day. The ap-proach adopted by AFRC (1993) has been criticised on the basis that estimates ofBEN were derived from studies conducted with animals nourished by intragastricinfusion and therefore lacking a fully functional rumen. In addition, it does not differ-entiate between endogenous urinary nitrogen and metabolic faecal nitrogen, whichis now known to vary directly with level of feeding.
Perhaps the greatest area of uncertainty in the estimation of protein requirementsfor maintenance is associated with the prediction of metabolic faecal nitrogen and theextent to which endogenous nitrogen secreted into the gut contributes to metabolicfaecal nitrogen output.The approach described by NRC (2001) and adopted by FiM(2004) for dairy cows recognises that metabolic faecal protein (MFP) varies directlywith level of feeding and that much of the endogenous nitrogen entering the diges-tive tract is reabsorbed, either directly or after degradation and incorporation intomicrobial protein. Endogenous urinary protein (EUP, g/day) and dermal losses inhair and scurf (g/day) are predicted as 4.1W 0.50 and 0.3W 0.60, respectively, whereasMFP (g/day) is predicted from dry matter intake (DMI, kg/d) as 30 * DMI. Thisapproach recognises that some of the microbial protein synthesised in the rumen isindigestible in the small intestine but may be degraded and absorbed in the largeintestine, and it assumes that 50 per cent of the indigestible microbial protein reach-ing the hind gut is excreted in the faeces. Finally, a correction for endogenous proteinis included, which again recognises that the excretion of enzymes and sloughed cellsvaries directly with level of feeding.Therefore, MPm is predicted as follows:
where DMI = dry matter intake (kg/day) and DMTP = digestible microbial trueprotein (g/d).
The protein requirements for maintenance adopted by CSIRO (2007) are basedon ARC (1980), but they specify separate estimates for EUP and MFP and recognisethat MFP varies directly with level of feeding. For B. taurus breeds of cattle, EUP ispredicted as follows:
For B. indicus breeds, the predicted quantity is reduced by 20 per cent. For sheep,EUP is predicted as follows:
For both cattle and sheep, MFP is predicted as 15.2 g/kg DMI, and dermal losses(g/day) are predicted as AFRC (1993) as 0.11W 0.75(0.018W 0.75
* 6.25).As indicated above, most of the protein systems for ruminants (see Chapter 13)
used around the world base their estimates of protein requirements for maintenanceon endogenous losses of nitrogen but use different factors to translate endogenouslosses into dietary requirements. For example, using the UK metabolisable protein
EUP (g/day) = 0.147 W + 3.375
EUP (g/day) = 16.1 ln W - 42.2
+ 2.34 DMI
MPm = 4.1 W 0.50+ 0.3 W 0.60
+ 30 DMI - 0.5((DMTP>0.8) - DMTP)

Chapter 14 Feeding standards for maintenance and growth
360
system, the MPm of a 600 kg cow can be calculated to be 279 g/day (as above).Thisprotein is likely to be derived from microbial protein (MCP).When an allowance ismade for the proportion of true protein in MCP (0.75) and for the digestibility ofthis true protein (0.85), the requirement for MCP is:
The quantity of MCP produced in the rumen depends on the quantity of organicmatter fermented and hence on the quantity of fermentable metabolisable energy(FME). For cattle fed at a maintenance level, the relationship is quantified as approx-imately 9 g MCP per MJ FME. Consequently, if the FME intake of the cow is 53 MJ/day(approximates to its energy requirement for maintenance), the quantity of MCP sup-plied would be 53 * 9 = 477 g/day.As can be seen, MCP alone (i.e. without any con-tribution from digestible undegradable protein, DUP) should be sufficient to meetthe animal’s requirement for maintenance. In fact, for ruminants, it is often thecase that a diet that satisfies the energy requirement for maintenance of the animaland the protein or nitrogen requirement of the rumen microorganisms will also sat-isfy the animal’s protein requirement for maintenance.
The final step in the calculation might be to estimate the minimum level of proteinrequired in the cow’s diet. As microbial protein supply, and hence the protein re-quirement of the rumen microorganisms, is greater than the animal’s requirement, thediet must supply sufficient effective rumen-degradable protein (ERDP) for the rumenmicroorganisms.Thus, ideally the diet should provide protein with a high degradabil-ity. If the diet had an FME content of 8 MJ/kg DM, then the quantity required wouldbe 53�8 = 6.6 kg/day and the ERDP content required would be 477�6.6 = 73 g/kgDM.This is similar to low- or medium-quality grass silage.At the low rumen outflowrate expected at maintenance levels of feeding (0.02), protein degradability of silagewould be about 0.7, so the minimum protein content of the silage would need to be73�0.7 = 104 g/kg DM. This diet would also supply about 15 g/kg DM of DUP,although the animal would not require this for maintenance.
Pigs and poultry
As with energy, the protein requirements of pigs and poultry are usually stated formaintenance and production together. However, it is possible to calculate the require-ments of these animals for maintenance alone from endogenous losses. For example,BSAS (2003) predicts that the protein requirement for maintenance of pigs can be metby supplying 0.9 g of standardised ileal digestible protein (see Chapter 13) per kgW 0.75
per day.The recommended lysine requirement of pigs for maintenance is calculatedas 5.4 per cent of the standardised ileal digestible protein requirement.
Horses
For horses, protein requirements are stated in terms of crude protein (CP), and themaintenance requirements published by NRC (2007) have been estimated by regress-ing nitrogen intake against nitrogen retention to give an average nitrogen require-ment for maintenance of 0.202 g N/kg/day, which is equivalent to a CP requirementof 1.26 g/kg/day. However, based on variation in maintenance requirements betweenhorses and the assumption that more active horses have more lean tissue to support,three levels for maintenance are provided, similar to those described for energy.
= 438 g
MCP for maintenance (g/day) = 279>(0.75 * 0.85)

Nutrient requirements for growth
361
Thus, the minimum CP requirements for maintenance of sedentary and more activehorses are predicted as 1.08 and 1.44 g/kg/day, respectively.
In addition to protein required for maintenance, horses that are undertaking work(exercise) require additional protein for muscle gain (MG) and sweat loss (SL). TheCP required for MG depends on the level of exercise intensity, and NRC (2007) esti-mates the requirement to be 0.089, 0.177, 0.266 and 0.354 g/kgW for horses under-taking light, moderate, heavy and very heavy exercise, respectively (see Table 14.5).Sweat loss also increases with exercise intensity and has been estimated to be 0.25,0.50, 1.00 and 2.00 per cent of body weight for horses in each exercise category. Onaverage, the CP content of sweat is 7.8 g/kg. If the efficiency of protein utilisation isassumed to be 50 per cent and the digestibility of dietary protein is assumed to be79 per cent, then the additional protein requirement for exercise can be predicted asfollows:
The recommended lysine requirement of horses for maintenance and exercise iscalculated as 4.3 per cent of the CP requirement.
CP exercise (g/day) = (MG * W ) + [(SL * 7.8 * W )>0.633]
Conception
Puberty
Age (years)
Live
wei
gh
t (k
g)
0
100
200
300
400
500
0 1 2 3 4 5 6
Fig. 14.2 The typical sigmoid growth curve of a dairy cow.
14.2 NUTRIENT REQUIREMENTS FOR GROWTH
As animals grow they increase in both size and weight.All animals start their lives as asingle cell weighing almost nothing, and then grow to reach mature weights that rangefrom 2 kg for a laying hen to over 1000 kg or more for a bull.The pattern by whichanimals grow from conception to maturity can be represented by a sigmoid (s-shaped)curve, as presented in Fig. 14.2. During the foetal period and from birth to puberty,the rate of growth increases; after puberty, it progressively decreases as the animalreaches maturity. In practice, a number of factors such as the animal’s environmentand nutrition may cause its growth to deviate from this sigmoid curve. Periods of

Chapter 14 Feeding standards for maintenance and growth
362
food scarcity (cold or dry seasons) may retard growth or even cause the animal to loseweight, after which periods of food abundance will allow the animal to grow morerapidly. In general, animals kept under conditions of so-called ‘intensive’ husbandrywill follow the growth curve illustrated in Fig. 14.2, whereas those kept under natural(extensive) conditions will follow more interrupted curves, with their overall growthrate being more variable than the idealised pattern.
As animals grow, not only do they increase in size and weight but also they showwhat is termed development. By this we mean that the various parts of the animal,defined as anatomical components (e.g. legs), organs (e.g. liver) and tissues (e.g. mus-cle) grow at different rates, so that as the animal grows its proportions change. Forexample, in cattle, the birth weight of a calf is approximately 40 kg and the head,which is relatively large, accounts for 6.2 per cent of its body weight. However, bythe time the calf reaches 100 kg, the head accounts for only 4.5 per cent of its bodyweight and this proportion continues to decline until the animal reaches maturity. Inthe 1940s, John Hammond, at Cambridge University, described the development ofanimals as a series of ‘growth waves’. For example, in relation to the major tissues,during early life (including prenatal life) nerve and bone tissues are given priority fornutrients and grow rapidly, later muscle has priority, and finally adipose tissue growsthe most rapidly.When animals grow fast, these waves of growth overlap each other,such that a fast-growing animal will begin to deposit substantial amounts of fatwhilst muscle growth is still in progress.
Animal growth and animal nutrition are inherently linked, in the sense that onecan influence the other.The growth pattern of an animal determines its nutrient re-quirements. Conversely, by altering its nutrition, an animal’s growth pattern can bemodified. Another aspect of this interaction is that the growth pattern of an animaldetermines the composition of the product of growth (i.e. meat), and so affects theconsumer of meat, man.
When feeding animals for meat production, farmers are often aiming to producecarcasses with a particular specification in terms of weight and composition. How-ever, animals used for other purposes, such as reproduction, milk or egg production,may need to follow growth patterns that differ from those of meat animals.The mainobjective of this section of the chapter is to show how nutrient requirements forgrowth are determined and how they may vary, depending on the nature of the ani-mal and the purpose for which it is kept.A secondary objective is to show how ani-mal growth and development may be modified by control of nutrition. Althoughgrowth starts from conception, that which occurs in utero (or in the avian egg) formsa specialised subject that is covered in Chapter 15. This section is concerned solelywith postnatal growth.
The chemical composition of gain
Although growth and development can be measured in terms of body parts, organsand tissues, nutritionists are primarily interested in growth of the chemical compo-nents that make up an animal’s body, because this determines their nutrient require-ments. Protein, water and ash (together with essential lipids such as phospholipids andcarbohydrates such as glycogen), are combined in relatively constant proportions toform the lean body mass of an animal referred to earlier (see p. 270). In addition, theanimal contains a variable proportion of storage lipid. Both protein and lipid contributeto the energy content of the body. In addition to these integral components, the body

Nutrient requirements for growth
363
Energy
Empty body weight (kg)
Protein
Fat
Ener
gy
(MJ)
Pro
tein
or
fat
(kg
)
0
20
40
60
80
100
120
140
160
0 50 100 150 200 250 300 350 400 450 500 550
1000
2000
3000
4000
5000
6000
7000
8000
Fig. 14.3 Growth of protein, fat and energy in cattle.
Plotted from the data of the Agricultural Research Council 1980 The Nutrient Requirements of RuminantLivestock, Farnham Royal, Commonwealth Agricultural Bureaux.
also contains the extraneous and variable gut and bladder contents.The growth of allthese components can be investigated by slaughtering and analysing animals at suc-cessive stages of growth. Figure 14.3 presents the results of a large data set showingthe body composition of cattle, with the weight of each body component being plot-ted against empty body weight, which is liveweight minus gut and bladder contents.
Figure 14.3 shows that as the empty body weight of an animal increases, theweights of all the chemical components that make up the body increase, but at dif-fering rates. Fat is deposited at an increasing rate and the lean body components(exemplified in Fig. 14.3 by protein) are deposited at decreasing rates. The energycontent of the body increases in a similar way to the fat content. The relationshipbetween the weight of each component and empty body weight appears to be curvi-linear. However, when all the weights are expressed as their logarithms, the relation-ships can be described by straight lines.
The equations for the logarithmic relationships are of the form:
where y = weight of the component and x = empty body weight.The algebraic formof this equation is:
Such equations are known as allometric equations and were first introduced by J SHuxley in 1932.The coefficient a is known as the growth coefficient and is a measure ofthe rate of growth of a part relative to the rate of growth of the whole animal. If it has avalue greater than unity, then the part is growing faster than the whole, and its contribu-tion to the whole is increasing.The part in question is thus described as a late-maturingpart. Conversely, if the growth coefficient is less than unity, then the part’s contributionto the whole is decreasing and the part can be described as early-maturing.
y = bxa
log y = log b + a log x

Chapter 14 Feeding standards for maintenance and growth
364
Differentiation of the allometric equations allows the composition of empty bodyweight gain to be determined for any particular body weight or range in bodyweights.Table 14.6 illustrates this procedure when applied to the data used to deriveFig. 14.3. The table shows that as the animal grows, the composition of its emptybody weight gain changes in accordance with Hammond’s growth waves. In earlylife, the gain consists mainly of the water, protein and minerals (ash) required forgrowth of bone and muscle; later, the gain contains a higher proportion of fat and asa result its energy content increases.
Allometric equations can be used to study growth in other ways. For example, therange of chemical components could be widened to include individual amino acidsor mineral elements, with the analysis being used to define the requirements forthese nutrients.They can also be applied to particular organs or tissues.
Although the principal factor influencing the composition of gain made by grow-ing animals, and hence their nutrient requirements for growth, is their body weight,there are other factors that affect the composition of gain.Animal species is an obvi-ous factor. At a specific weight, small species (low mature weight) will be at a moreadvanced stage of growth and maturity than large species. For example, at a liveweightof 60 kg the composition of gain made by sheep contains approximately 500 g/kg fat,whereas that of cattle contains only 75 g/kg.The composition of gain made by severalspecies is presented in Table 14.7.
If at a given empty body weight the composition of gain differs between smalland large species, then it seems logical that within a species, the composition ofgain will differ between small and large breeds. Table 14.8 illustrates this effect incattle. It seems that the real determinant of the composition of gain is not absolutebody weight but rather body weight relative to the mature weight of the animal.This theory is supported by looking at the effects of sex on the composition of gain(also presented in Table 14.8). Females are generally smaller than males at maturity.Consequently, at a specific weight their gain contains more fat and energy than thatof males. Castrates tend to be intermediate between males and females.
Table 14.6 Composition of the empty body weight (EBW) gain made by cattle of a medium-sized breed
Empty body
weight (kg)
Protein
(g/kg)
Fat
(g/kg)
Energy
(MJ/kg)
50 181 86 7.65100 167 148 9.76150 160 204 11.80200 155 256 13.72300 148 353 17.36400 144 442 20.77500 140 527 24.01
Log10 protein � 0.8893 � log10 EBW - 0.5037Log10 fat � 1.788 � log10 EBW � 2.657Energy � 23.6 � protein � 39.3 � Fat
Adapted from Agricultural Research Council 1980 The Nutrient Requirements of Farm Livestock, Farnham Royal, Commonwealth Agricultural Bureaux.

Nutrient requirements for growth
365
A final factor influencing the composition of gain is the growth rate of the animal.From the growth wave theory it seems logical that immature animals with limitednutrients available for growth, and therefore growing slowly, will use them for boneand muscle growth, whereas animals with more nutrients available will also store fat.Thus, the fat content (g/kg) of the gain of a pig growing at 0.9 kg/day is likely to begreater than that of a pig growing at 0.3 kg/day.This is commonly the case, althoughthe effect is small in very immature animals and in genotypes selected for restrictedfat deposition.
Feeding standards for growth (energy)
Ruminants
The UK Agricultural Research Council (ARC 1980) analysed data on the body compo-sition of a large number of cattle and sheep of different sexes slaughtered at variousweights and ages. Some of the results of these analyses for cattle are presented in
Table 14.7 Percentage composition and energy content of the gain made byanimals of various ages and liveweight
Animal
Liveweight
(kg) Age Composition of gain (g/kg)
Water Protein Fat Ash
Energy
(MJ/kg)
Fowl (White Leghorn 0.23 4.4 weeks 695 222 56 39 6.2pullets, slow growth)
0.7 11.5 weeks 619 233 86 37 10.01.4 22.4 weeks 565 144 251 22 12.8
Sheep (Shropshire 9 1.2 months 579 153 248 22 13.9ewes) 34 6.5 months 480 163 324 31 16.5
59 19.9 months 251 158 528 63 20.8Pig (Duroc-Jersey 23 – 390 127 460 29 21.0
females) 45 – 380 124 470 28 21.4114 – 340 110 520 24 23.3
Cow (Holstein heifers) 70 1.3 months 671 190 84 – 7.8230 10.6 months 594 165 189 – 11.4450 32.4 months 552 209 187 – 12.3
Table 14.8 Differences between breeds and sexes in the body composition ofcattle of 300 kg empty body weight
Component Breed Sex
Male Castrate Female
Protein (g/kg) Aberdeen-Angus 172 161 150Holstein 186 187 167
Fat (g/kg) Aberdeen-Angus 190 227 314Holstein 136 172 213
Calculated from the data of Ayala H J 1974. PhD thesis, Cornell University, Ithaca, NY, USA.
Adapted from Mitchell H H 1962 Comparative Nutrition of Man and Domestic Animals, Vol. 1, New Yorkand London, Academic Press.

Chapter 14 Feeding standards for maintenance and growth
366
Figs. 14.3 and 14.5. Based on these data, AFRC (1993) predicts that for cattle theenergy content of the gain made by castrate males of a medium-sized breed can bepredicted as follows:
where EVg = energy value of liveweight gain (MJ/kg),W = liveweight (kg) and LWG= liveweight gain (kg/day).
The first bracketed term in the equation describes the increasing energy contentof gain as cattle increase in size, and the second term describes the correction for theincreasing energy content of gain associated with higher liveweight gains. Thus, theenergy value of the gain (EVg) in a 100 kg animal gaining at 0.5 kg/day is predictedto be 7.9 MJ/kg, whereas the EVg in a 500 kg animal gaining at the same rate wouldbe 19.9 MJ/kg. The corresponding values for animals gaining at 1.0 kg/day are pre-dicted to be 8.6 MJ/kg and 21.6 MJ/kg, respectively.
To account for the effects of breed and sex on EVg, a simple 15 per cent correc-tion factor has been adopted.Thus, for small breeds (early-maturing) and females thevalue predicted is increased by 15 per cent, and for large breeds (late-maturing) andmales (bulls) the value is reduced by 15 per cent.Thus, a 500 kg female of a small breedgrowing at 0.5 kg/day would be predicted to gain 19.9 * 1.15 * 1.15 = 26.3 MJ/kg.
For sheep, the data analysed by ARC (1980) showed a large effect of sex on EVg,but only a small effect of breed (Merinos having more fat and hence a higher EVgthan other breeds), and no significant effect of rate of gain. Based on these data,AFRC (1993) predicts that for sheep EVg can be predicted as follows:
Males: EVg = 2.5 + 0.35WCastrates: EVg = 4.4 + 0.32WFemales: EVg = 2.1 + 0.45W
The predicted EVg of male, castrate and female lambs of 30 kg liveweight would be13.0 MJ/kg, 14.0 MJ/kg and 15.6 MJ/kg, respectively.
In Australia, CSIRO (2007) has adopted an ingenious approach that allows the EVgof both cattle and sheep, of almost any breed and of any rate of gain, to be predictedusing a simple set of equations.The basis of the approach adopted by CSIRO (2007)is to allocate a ‘standard reference weight’ (SRW) to each class of animal, which isdefined as ‘the liveweight that would be achieved by that animal when skeletal de-velopment is complete and the condition score is in the middle of the range (i.e. con-dition score 3 for beef and sheep)’.Thus, the SRW varies between breeds and sexesand is higher for large (late-maturing) breeds than for small (early-maturing) breeds.Similarly, the SRW for bulls is higher than that of castrates and females. For example,male, castrate and female Friesian cattle are allocated SRW of 770 kg, 660 kg and550 kg, respectively.The main variables for the prediction of EVg are the liveweightof the animal relative to its SRW and its rate of gain (R), as follows:
where Z = current W�SRW, R = adjustment for rate of gain or loss = (L - 2), where Lis level feeding (MEI�MEm), and a, b and c = coefficients used in the equation (a =
6.7, b = 20.3 and c = 1.0).Using this equation, the NEg of a 30 kg castrated Suffolk lamb (SRW 66 kg) fed at a
level of twice maintenance would be 19.2 MJ/kg, which is higher than that predictedby AFRC (1993).Although this approach has proved suitable for all breeds of sheep
NEg = (a + cR) + (b - cR)>[1 + exp(-6 (Z-0.4))]
EVg = (4.1 + 0.0332 W - 0.000009 W 2)>(1 - 0.1475 LWG)

Nutrient requirements for growth
367
and most breeds of cattle, it has had to be modified for large European breeds, suchas the Charolais and Simmental. These breeds are capable of making gains that areunusually low in fat and hence energy content. In the USA, the NRC (2000) has alsoadopted the concept of a standard reference weight to calculate the energy require-ments for gain in cattle.
Pigs
In the UK, the energy requirements for growth of pigs are published by BSAS (2003)and expressed in terms of NE. Three pig types are defined, which differ in theirgrowth characteristics, in particular the rate of protein deposition: exceptionally leanand fast-growing (maximum rate of protein retention 0.230 kg/day), intermediate(maximum rate of protein retention 0.170 kg/day) and commercial (maximum rateof protein retention 0.120 kg/day). The effects of sex are not specifically accountedfor, but males are considered to be lean and fast-growing and castrates are consid-ered to be commercial types. The growth of each pig type is modelled and NErequirements for both maintenance and growth are presented for pigs in differentweight categories.The fixed factors in the model are the NE requirements for main-tenance plus activity (0.750 W 0.75
* 1.10), as discussed previously, and the energycontent of protein and fat (23.6 MJ/kg and 39.3 MJ/kg, respectively).The model pre-dicts the rate of protein deposition (Pr) and lipid mass (Lt) from the protein mass(Pt) of each pig type as follows:
where Ptmax = the asymptote for protein mass (50, 40 and 30 kg for lean, intermedi-ate and commercial types, respectively), Pt = the present protein mass (kg), B = thegrowth rate parameter (0.0125, 0.0117 and 0.0110 for lean, intermediate and com-mercial types, respectively), and b = allometric exponent (1.10, 1.20 and 1.30 forlean, intermediate and commercial types, respectively).
Once the protein and lipid mass are known, the liveweight of the animal can becalculated from its body composition as the sum of its water, ash, protein and lipidcontent, assuming that lean tissue contains approximately 238 g/kg protein and thatgut fill constitutes 60 g/kg liveweight, as follows:
By modelling pig growth, the rates of protein and lipid retention at differentliveweights can be predicted and NE requirements calculated. For example, for a 65 kgintermediate-type pig, the model predicts that the rate of protein and lipid retentionwould be approximately 0.172 kg/day and 0.170 kg/day, respectively, and the NErequirement would be calculated for maintenance and growth as follows:
The model can also be used to predict animal performance. For example, if theNE intake of the pig was restricted to 20.0 MJ/day and the predicted rate of proteinretention is 0.172 kg/day, the rate of lipid retention can be predicted as follows:
NE intake = 20.0 MJ/dayNE for maintenance and activity [(0.750W 0.60) * 1.10] = 10.1
= 20.8 MJ/day
NE = [(0.750 W 0.60 ) * 1.10] + (23.6 * 0.172) + (39.3 * 0.170)
Liveweight (kg) = (3.62 Pt0.938+ 0.265 Pt0.928
+ Pt + Lt) * 1.06
Lt (kg) = 0.5 * Ptb
Pr (kg/day) = B * Pt * ln(Ptmax>Pt)

Chapter 14 Feeding standards for maintenance and growth
368
NE for production (20.0 - 10.1) = 9.9NE for protein deposition (23.6 * 0.172) = 4.1NE for fat deposition (9.9 - 4.1) = 5.8Fat deposited (5.8�39.3) = 0.147 kg/day
The energy requirements of growing pigs may also be expressed in terms of MEby assuming that the ME requirement for maintenance (MJ/day) is 0.44 W 0.75 andthat the efficiency of ME utilisation for protein and lipid retention is 0.44 and 0.74,respectively. Similarly, requirements can be expressed in terms of DE by assumingthat ME can be predicted as 0.96 * DE. For the example of the 65 kg intermediate-type pig given above, the ME and DE requirement would be 29.4 MJ/day and30.6 MJ/day, respectively.
In pigs, the fastest growth is achieved by allowing animals to eat to appetite, andmost commercial pig types can eat to appetite from birth to slaughter without layingdown excessive fat. Food intake is the link between nutrient requirements and theconcentration of nutrients in animal diets, and knowledge of food intake is essentialfor the practical application of feeding standards. Typically the food intake of pigsconsuming a diet with a NE content of 9.4 MJ/kg (DE 13.2 MJ/kg) would rise grad-ually from 1.01 kg/day at 20 kg to 1.96 kg/day at 50 kg and 2.62 kg/day at 90 kg.Where the food intake is different from published guidelines, then appropriateadjustments should be made to the nutrient concentration in the diet to ensure thatthe nutrient requirements of the pig are satisfied.
Poultry
With the exception of birds reared for breeding (see Chapter 15), growing poultryare normally fed to appetite, and nutrient requirements are therefore expressed notas quantities required per day but as the nutrient concentrations in the diet (seeAppendix 2,Table A2.10).
As explained in Chapter 17, the quantities of food eaten by poultry are inverselyrelated to the concentration of energy in their diets.This means that if the energy con-centration of a diet is increased without a corresponding change in the concentration of,for example, protein, then the birds will begin to eat less of the diet. Consequently,although their energy intake may remain approximately the same, their protein intakewill fall and the birds may be deficient in protein. In general, a nutrient concentrationthat is adequate for a diet of low energy content may be inadequate for a diet of higherenergy content. It follows that feeding standards expressed as nutrient concentrationsare satisfactory only when applied to a diet with a specific energy concentration. Thestandards presented in Appendix 2,Table A2.10 for chicks up to 6 weeks of age are ap-propriate to diets containing 11.5 MJ ME/kg and would need to be adjusted for dietscontaining more or less energy. Some adjustments are discussed later in this chapter.
Horses
The energy requirements of growing horses (DE, MJ/kg gain) published by NRC(2007) are derived from published studies in which the energy intake and growth rateof horses were recorded.The DE requirement for gain was estimated by subtractingthe DE requirement for maintenance from the DE intake and dividing by the dailygain. Using these data the DE requirement for gain (MJ/kg gain) can be predictedfrom the age of the animal in months (x) as:
DE (MJ/kg gain) = 8.33 + 5.06x - 0.088 x2

Nutrient requirements for growth
369
Note that the likely effects of breed, sex and rate of gain on the energy require-ments for gain are not taken into account by this equation. For a horse of 12 monthsof age, this equation predicts that the energy requirement for gain would be 56.4 MJ/kg.Using the French NE system, the energy requirement for growth is estimated usingan allometric equation, which varies with age and rate of gain.
Feeding standards for growth (protein)
Ruminants
In the UK, the protein requirements of growing animals are estimated using the fac-torial approach described earlier (see p. 358), with the protein requirement for growthbeing added to the protein requirements for maintenance to give the total proteinrequirement. In cattle, the net protein requirement for growth (NPg, g/day) is pre-dicted from the animal’s liveweight and its rate of gain (LWG, kg/day) as follows:
The predicted value is increased by 10 per cent for bulls and large breeds andreduced by 10 per cent for heifers and small breeds. Thus, the NPg of a 300 kg bullof a large breed gaining at 1.2 kg/day would be calculated as 128 * 1.10 * 1.10 *1.20 = 186 g/day. In sheep, NPg is also calculated from liveweight but, as with energy,no account is taken of rate of gain, as follows:
The approach adopted by CSIRO (2007) to calculate the protein requirement forgain is similar to that described for energy (see p. 355), with the NPg being calcu-lated from the liveweight of the animal relative to its standard reference weight(SRW) and its rate of gain as:
where Z =W�SRW, R = adjustment for rate of gain or loss = (L - 2), where L = levelof feeding (MEI�MEm), and a, b and c = coefficients used in equation (a = 5.0,b = 3.3 and c = 0.1).
Using this equation, the NPg of a 300 kg bull of a large breed (SRW 770 kg) fedat twice maintenance would be approximately 142 g/kg, which is slightly lower thanthe 154 g/kg predicted by AFRC (1993). In the USA, NRC (2000) adopts a similarapproach to that used by CSIRO (2007).
As stated previously, most protein systems for ruminants use different factors totranslate NP requirements into MP and dietary protein requirements. Using the UKmetabolisable protein system, the efficiency of MP utilisation for gain in both cattleand sheep is assumed to be 0.59. Thus, using the example given above, the MPrequirement for gain would be 186�0.59 = 315 g/day.When this is added to the MPrequirement for maintenance (166 g/day), the total MP requirement would be 481g/day. If the fermentable metabolisable energy (FME) intake is 64 MJ/day, the micro-bial protein yield would be 64 * 10 = 640 g/day, which would supply 640 * 0.75 *0.85 = 408 g of the animal’s MP requirement.The MP deficit, 481 - 408 = 73 g/day,would need to be supplied from digestible undegradable protein (DUP). Thus, the
NPg = (a - cR) - (b - cR)>[1 + exp(-6(Z-0.4))]
Females: MPg = LWG * (156.1 - 1.94 W + 0.0173 W2)
Males and castrates: MPg = LWG * (160.4 - 1.22 W + 0.0105 W2)
* (1.12 - 0.1223 LWG)
NPg = LWG * (168.07 - 0.16869 W + 0.0001633 W2)

Chapter 14 Feeding standards for maintenance and growth
370
diet would need to supply 640 g/day of effective rumen-degradable protein (ERDP)and 73 g/day of DUP. If the bull’s dry matter intake was 6.2 kg/day, the dietary con-centrations required would be 103 g/kg and 11.8 g/kg DM, respectively.
In the previous example of the calculation of protein requirements, the require-ment was calculated for maintenance only and could be satisfied by microbial proteinsupplied from the rumen. However, in young, rapidly growing animals, the proteinrequirement is relatively high compared with the energy requirement. Consequently,protein synthesis in the rumen is not always sufficient to satisfy the animal’s require-ments, and there is a need for undegradable dietary protein (UDP).To keep the cor-rect balance between rumen-degradable and -undegradable protein, a source of UDPwould probably need to be included. Alternatively, the total protein content of thediet could be increased.This might then supply sufficient UDP but would oversupplydegradable protein. Suckled animals at grass have a good supply of DUP, as milkprotein bypasses the rumen via the oesophageal groove (see p. 172), and have a goodsupply of ERDP from other foods such as grazed grass.
Pigs and poultry
In addition to a general requirement for protein, non-ruminant animals have a spe-cific dietary requirement for the ten or so essential (or indispensable) amino acids.Over the past 30 years many experiments have been conducted to determine thequantitative requirements for essential amino acids, and protein requirements havenow been supplemented (or even replaced) by requirements for some or all of theseamino acids. Requirements may also be stated in terms of ‘ideal protein’ (proteincontaining essential amino acids in exactly the proportions required by the animal)or ‘standardised ileal digestible amino acids’, as explained in Chapter 13.
In some circumstances it is possible to express protein requirements in terms oftotal protein alone, for example if animals are fed on a limited range of foods ofknown amino acid composition.This is the case for growing pigs in the USA that arefed mainly on maize and soya bean meal. Such a simplified approach cannot be sus-tained when a wider range of foods and by-products are used, and when diets mustbe formulated not only to maximise growth but also to optimise carcass composi-tion. Feed compounders therefore formulate pig diets to meet the requirements forat least three amino acids (lysine, methionine + cystine and threonine).They will alsotake into account the availability of certain amino acids, assessed from digestibilityat the terminal ileum (as explained in Chapter 10).
The requirements of pigs and poultry for essential amino acids
The requirement for an essential amino acid is assessed by feeding diets containingdifferent levels of the amino acid in question, but equal levels of the remainingacids, and measuring growth or nitrogen retention. Diets differing in the content ofone amino acid may be prepared from foods that are deficient in that amino acid,to which measured amounts of the pure amino acid are added. Figure 14.4 showsthe outcome of an experiment to determine the lysine requirement of chicks inwhich a diet low in lysine was supplemented to give diets ranging from 7g/kg to14 g/kg lysine. From this experiment, it was concluded that the lysine requirementwas 11 g/kg. In more recent experiments, it has been found to be more convenientto use synthetic diets in which much or all of the nitrogen is in the form of pureamino acids.

Nutrient requirements for growth
371
Mea
n li
vew
eig
ht
of
chic
ks a
t 6
wee
ks (
g)
L-Lysine in diet (g/kg)
300
400
500
600
700
7 8 9 10 11 12 13 14
Fig. 14.4 Growth of chicks given diets containing different levels of lysine.
Plotted from the data of Edwards H M, Norris L C and Heuser G F 1956 Poultry Science 35: 385.
Requirements for essential amino acids in poultry and pigs have been devised,and some of these are presented in Appendix 2, Tables A2.9 and A2.10. However,there are considerable complications associated with defining amino acid require-ments because of interactions between the essential amino acids, between essentialand non-essential amino acids, and between amino acids and other nutrients. Inchicks, the requirement for glycine is increased by low concentrations of methionine,arginine or B vitamins. Similarly, one amino acid may be converted to another. Forexample, if cystine or its metabolically active form cysteine is deficient in the diet, itcan be synthesised by the animal from methionine.The requirement for methionineis therefore partly dependent on the cystine (or cysteine) content of the diet, and thetwo amino acids are often considered together (i.e. the requirement is stated forcystine + methionine). It should be noted, however, that the two are not mutuallyinterconvertible; methionine is not synthesised from cystine and therefore part ofthe total requirement must always be met by methionine. Phenylalanine and tyrosinehave a similar relationship, and in the chick glycine and serine are interconvertible.
Further complications also arise from the relationships between amino acid re-quirements and the total protein content of the diet. If the latter is altered to com-pensate for a change in energy content, then the amino acid requirements will alsochange. For this reason, amino acid requirements are sometimes expressed as g/MJof DE or ME.
Formulating diets to meet the requirement for 10 or 11 essential amino acids islikely to be difficult, as in theory there is almost unlimited scope for adjusting dietarycomponents (including synthetic amino acids) to ensure that the essential aminoacid supply matches the requirement. However, in practice the relative proportions ofdifferent amino acids supplied by the diet often fail to match the requirements, andthey are inefficiently utilised because one or two amino acids are very markedlydeficient. By comparing the amino acid requirements with the amino acid composi-tion of typical diets, it has been shown that the ‘first-limiting’ amino acid for pigs is

Chapter 14 Feeding standards for maintenance and growth
372
lysine, whereas for chicks the ‘first-limiting’ amino acid is commonly methionine,although lysine and arginine may also be deficient.
In the UK the net protein (NP, kg/day) requirement of growing pigs is predictedfrom the protein requirement for maintenance (NPm) and the rate of protein reten-tion (Pr). As stated previously, BSAS (2003) predicts NPm as 0.0009 W0.75, and Prusing the equation presented on p. 367.The net lysine requirement is assumed to be5.8 per cent and 7.0 per cent of the maintenance and retained protein requirement, re-spectively, and, on the assumption that amino acids are supplied in balanced propor-tions, the efficiency of utilisation of absorbed amino acids is assumed to be 0.82(lower efficiencies (0.74–0.82) may be appropriate for some diets). In addition, thebasal endogenous loss of lysine is assumed to be 5 per cent of ingested lysine.Thus, thestandardised ileal digestible lysine requirement (SIDL, kg/day) is calculated as follows:
The dietary lysine requirement is calculated by assuming that the ileal digestibilityof lysine is 0.84.The balance of the other essential amino acids required is expressedrelative to lysine, where lysine equals 1.0 (Table 14.9).The minimum requirement fornon-essential amino acids, and hence the total protein requirement, is calculated as2.5 times the sum of the requirement for essential amino acids.
In practice, when formulating diets for pigs and poultry, it is essential to ensure thatthe diet provides sufficient protein and adequate levels of the most limiting amino acids
SIDL = {[(0.0009 W 0.75* 0.058) + (Pr * 0.07)]>0.82} * 1.05
Table 14.9 Example of the calculation of the essential amino acid requirementand the total protein requirement of a 65 kg intermediate-type growing pigretaining 0.172 kg protein per day
Essential amino acid Ideal balance of
essential amino
acids relative to
lysine
Standardised ileal
digestible amino
acid requirement
(g/day)
Dietary amino
acid requirement
(g/day)a
Lysine 1.00 16.9 20.1Methionine 0.30 5.1 6.1Methionine + cystine 0.59 9.8 11.6Threonine 0.65 11.0 13.1Tryptophan 0.19 3.2 3.8Isoleucine 0.58 9.8 11.7Leucine 1.00 16.9 20.1Histidine 0.34 5.7 6.8Phenylalanine 0.57 9.6 11.4Phenylalanine + tyrosine 1.00 19.9 23.7Valine 0.70 11.8 14.0
Total essential amino acids 105.0 124.9Total non-essential amino acids 262.5 312.2Total protein 367.5 437.1
aCalculated on the assumption that the standardised ileal digestibility of amino acids is 0.84.If true values are known and different, then values should be calculated accordingly.
Adapted from British Society of Animal Science 2003 Nutrient Requirement Standards for Pigs, Penicuik,British Society of Animal Science.

Nutrient requirements for wool production
373
(lysine and methionine). However, it should be remembered that, for pigs at least,total protein requirements have often been set relatively high in order to compen-sate for diets containing low-quality protein sources (i.e. those deficient in limitingamino acids). However, as more attention is paid to specific amino acids, the totalquantity of protein required will be reduced.
Horses
The protein requirement of young growing horses is expressed by NRC (2007) interms of CP and is calculated as the sum of the CP requirement for maintenance andbody weight gain.The highest of the three levels of protein required for maintenanceis adopted on the basis that young growing horses are more active.The protein con-tent of body weight gain is assumed to be 20 per cent and the efficiency of utilisationof absorbed protein for gain is assumed to vary with the age of the horse.The aver-age digestibility of dietary protein is assumed to be 79 per cent.Thus, the crude pro-tein requirement is calculated as follows:
where BWG = body weight gain (kg/day), E = efficiency of protein utilisation(4–6 months = 0.5, 7–8 months = 0.45, 9–10 months = 0.40, 11–12 months = 0.35,�12 months = 0.30).
Although evidence suggests that exercise improves the efficiency of protein utili-sation in horses, no allowance is currently included for this. Lysine has been shownto be the first limiting amino acid, and the lysine requirement is calculated as 4.3 percent of the CP requirement. The protein requirements of growing horses calculatedby the French NE system are similar to those predicted by NRC (2007).
CP (g/kg W ) = 1.44 W + [(BWG * 0.20)>E]>0.79
14.3 NUTRIENT REQUIREMENTS FOR WOOL PRODUCTION
Wool fibres grow from follicles formed by invagination of the epidermis, with a bulbat the base of the follicle being the site of active cell division.As the blood supply tothe epidermis is subject to large fluctuations (e.g. in response to environmental tem-perature), metabolism of the follicles needs to be protected from variations in oxygenand nutrient supply. Consequently, the follicles have stores of energy in the form ofglycogen and glutamine, which can be released by aerobic or anaerobic glycolysis,which is less dependent on a supply of oxygen than the tricarboxylic acid cycle andproduces lactate (see Chapter 9). Wool fibres consist almost entirely of the proteinkeratin, which is characterised by its high content of the sulphur-containing amino acidcystine, which is synthesised from the essential amino acid methionine. Methionine isalso used by the follicles to synthesise the polyamines required for protein synthesis.Thus, wool follicles require a good supply of the sulphur-containing amino acids.
The weight of wool produced by sheep varies considerably from one breed to an-other, and an average value is useful only as an example. The typical annual fleeceproduction of a 50 kg Merino would be approximately 5.0 kg, of which about 3.0 kg(60 per cent) represents clean dry wool fibres, with the remaining 2.0 kg (40 percent) being wool wax, suint, dirt and water.Wool wax is produced by the sebaceousglands and consists mainly of esters of cholesterol and other alcohols, along with thefatty acids normally found in glycerides. Suint, the secretion of the sudoriferous

Chapter 14 Feeding standards for maintenance and growth
374
glands, is a mixture of inorganic salts, potassium soaps and potassium salts of lowerfatty acids.
In order to grow in a year a fleece containing 3.0 kg protein, sheep would need todeposit approximately 8.2 g/day of protein or 1.3 g/day of nitrogen. If this latter fig-ure is compared with the 6.6 g/day nitrogen that a 50 kg sheep might lose as endoge-nous nitrogen, then it can be seen that in relation to its maintenance requirement,the sheep’s nitrogen requirement for wool production is relatively small. However,these figures do not tell the whole story because the efficiency of amino acid utilisa-tion for wool production is considerably lower than that for maintenance. The effi-ciency with which dietary protein is converted into wool depends on the relativeproportions of cystine and methionine. Keratin contains 100–120 g/kg of theseamino acids, compared with the 20–30 g/kg found in plant proteins and in microbialprotein synthesised in the rumen. As a consequence, the biological value of foodprotein for wool growth is likely to be not more than 0.3. In the UK metabolisableprotein system, the efficiency of MP utilisation for wool production is 0.26.
With regard to energy requirements, wool continues to grow even when sheep arechronically undernourished. Consequently, the energy required for wool productioncould be considered as an integral part of the energy requirement for maintenance.Indeed, many of the determinations of km and kg in sheep were derived from studiesconducted with sheep gaining 6.0 g of fleece per day. In the UK,AFRC (1993) sug-gests that the NE requirement for wool growth (NEw) (assuming a rate of fleecegrowth of 5.5 g/day) is either 0.13 MJ/day or 0.25 MJ/day for most breeds andwool-producing breeds of sheep, respectively, and the efficiency of ME utilisation forwool production (kw) is 0.18. Consequently, the ME requirement for wool produc-tion (MEw) is either 0.72 MJ/kg or 1.4 MJ/day. For most breeds of sheep, this amountis relatively small and is usually ignored.The approach adopted by CSIRO (2007) issimilar to that of AFRC (1993), in that the NEw for fleece growth is assumed to be0.13 MJ/day and kw is assumed to be 0.18. However, they accept that the energyrequirement for maintenance already includes an element for fleece growth, and it issuggested that an allowance for wool growth should be included only if wool growthexceeds 6.0 g/day.
As indicated above, nutrient requirements for wool production are relativelysmall. However, wool growth reflects the general nutrition of the animal. Althoughwool continues to grow at submaintenance levels of nutrition, the rate of wool pro-duction increases as the plane of nutrition increases and sheep gain in weight. In theAFRC (1993) system, the net protein requirement for wool production (NPw) islinked to the net protein requirement for growth (NPg) by the following equation:
Thus, for a 30 kg male lamb gaining at 0.2 kg/day, the predicted NPg would be9.2 g/day and NPw would be 3.9 g/day. As the efficiency of metabolisable protein(MP) utilisation for wool production is 0.26, the MP requirement for wool produc-tion would be 15 g/day.
CSIRO (2007) also recognises that the rate of wool growth, and therefore NPw,varies directly with plane of nutrition. Daily wool growth is predicted from eitherthe MP available for wool production or the ME available for wool production,whichever is limiting, on the assumption that wool growth is maximised when theMP : ME ratio available for wool production is 12.0 g/MJ. If the ratio is less than 12.0wool growth is predicted from MP supply, and if the ratio is greater than 12.0 wool
NPw = 3 + 0.1 NPg

Mineral and vitamin requirements for maintenance and growth
375
growth is predicted from ME supply. For Merino sheep the standard fleece weight(SFW) is predicted as 0.1 * standard reference weight (SRW), but this is scaled forother breeds of sheep and for supplementation with ‘protected’ sulphur-containingamino acids such as methionine. CSIRO also includes a correction for the effects ofday length and for the delayed maturation of secondary follicles in young lambs.Consequently, the daily rate of clean wool growth is predicted as follows:
where AF = 0.25 + 0.75(1 - exp(-0.025A)), where A is age in days, and DLF = 1 +c(DL - 12), where DL is day length in hours and c varies with breed (e.g. Merino0.03, Corriedale 0.06 Border Leicester 0.11).
Assuming no correction for age and day length, the daily rate of clean wool pro-duction for a 50 kg Merino sheep with a standard fleece weight of 5.0 kg whenMPw = 100 g/day and MEw = 10 MJ/day would be 11.6 g/day.
Wool quality is also influenced by nutrition. The diameter of wool fibres is in-creased at high levels of nutrition, and it is significant that finer wools come fromsheep kept in nutritionally less favoured areas.A period of starvation may cause anabrupt reduction in wool growth, which leaves a weak point in each fibre and is re-sponsible for the fault in fleeces with the self-explanatory name of ‘break’.An earlysign of copper deficiency in sheep is a loss of ‘crimp’ or waviness in wool.This is ac-companied by a general deterioration in quality, with the wool losing its elasticityand its affinity for dyes. These effects are thought to be due to the involvement ofcopper in the enzyme system responsible for disulphide linkages in keratin. Copperdeficiency also restricts the formation of melanin, the pigment of wool and hair. Zincdeficiency causes the production of brittle wool fibres. Many vitamin deficiencies af-fect wool and hair follicles, but, with the exception of cyanocobalamin (B12), thesedeficiencies are uncommon in sheep.
* (1.16 * MPw or 14 * MEw)
Clean wool growth (g/day) = (SFW>SRW) * AF * DLF
14.4 MINERAL AND VITAMIN REQUIREMENTS FOR MAINTENANCEAND GROWTH
This section is concerned with the general principles associated with the determina-tion of feeding standards for minerals and vitamins. No attempt will be made todiscuss individual nutrients as to do so would result in duplicating the material pre-sented in Chapters 5 and 6.
Minerals
Animals deprived of a dietary supply of mineral elements will continue to excrete thesenutrients.Where elements occur in the body as constituents of organic compounds,such as iron in haemoglobin, or iodine in thyroxine, they are released from thesecompounds when they are expended or ‘worn out’.To a large extent, the elements soliberated are often reutilised within the body. However, reutilisation is never com-plete and a proportion of each element will be lost from the body in the faeces andurine and through the skin.Where elements occur in an inorganic form, such as calcium,sodium, potassium and magnesium, losses will occur in the urine, such as those aris-ing from the maintenance of acid–base balance, and in the faeces owing to secretions

Chapter 14 Feeding standards for maintenance and growth
376
into the gut that are not reabsorbed. Because of these endogenous losses, animals re-quire minerals for maintenance.
Endogenous mineral losses are often small in relation to the mineral content ofthe body. For example, a 30 kg pig whose body contains about 230 g of calcium losesapproximately 0.9 g of calcium per day and therefore needs to replace about 0.4 percent of its body calcium. Similarly, the same pig contains approximately 40 g of sodiumand needs to replace 0.036 g or 0.09 per cent per day. In contrast, a pig would needto replace about 0.7 per cent of its body nitrogen per day.
The techniques used to determine mineral requirements are the same as thoseused to determine energy and protein requirements.A theoretical framework is pro-vided by using the factorial approach, whereas practical estimates of requirementscan be obtained using nutrient balance or growth trials. Since the mineral contentsof foods are usually expressed as the total or gross amounts present, requirementsare stated in the same terms. Nutrient standards must therefore take into accountthe differences in mineral availability that occur between different species and ageclasses of animal (see Chapter 10).
Factorial estimates of mineral requirements
The net requirement of a mineral element for maintenance plus growth is calculatedas the sum of the endogenous losses and the quantity retained. To determine thedietary requirement, the net requirement is divided by an average value for avail-ability. For example, a 300 kg heifer gaining 0.5 kg/day might have an endogenouscalcium loss of 5.0 g/day and be retaining 6.0 g/day. Its net calcium requirementwould therefore be 11.0 g/day. For an animal of this type, the availability of calciumis predicted to be about 0.68 and the daily calcium requirement would be calculatedas 11.0�0.68 = 16.0 g/day.
The problems associated with the factorial approach to mineral requirements are thesame as those associated with factorial estimates of protein requirement.Whereas themineral composition of liveweight gain may be readily (if laboriously) determined bycarcass analysis, the assessment of endogenous losses, and therefore availability, is moredifficult. Diets for ruminants that are completely free of an element are particularly dif-ficult to prepare. Perhaps because of these difficulties with the technique, theoreticalestimates of mineral requirements do not always agree with practical estimates.
Growth and balance trials
The biggest problem when determining mineral requirements by assessing the effectsof different levels of supply on animal performance is establishing satisfactory crite-ria for adequacy. For example, a level that is sufficient to prevent clinical signs of de-ficiency may be insufficient to support maximum growth. Similarly, for the elementscontained in bone, the level that gives the maximum rate of growth may be inade-quate if judged by the strength of bone produced.The position is complicated furtherby the mineral reserves of the animal. If reserves are large at the beginning of anexperiment of short duration, then they may be sufficient to promote normal healthand production, even if the dietary supply is inadequate. It is therefore desirable thatthe mineral balance of the animal is determined either directly or indirectly byanalysis of selected tissues. Even balance trials may be difficult to interpret, since ifthe element is one for which the animal has great storage capacity, then a dietarysupply that promotes less than maximum retention may still be quite adequate.In long-term experiments, such as those containing more than one production cycle

Mineral and vitamin requirements for maintenance and growth
377
(e.g. dairy cows), the health and productivity of the animals alone may be reliableindicators of minimum mineral requirements. However, for growing animals, whereexperiments are usually of shorter duration, measurements of liveweight gain shouldbe supplemented by measurements of mineral retention.
Feeding standards (minerals)
The mineral requirements presented in Appendix 2 are based partly on factorial cal-culations and partly on feeding trials. For all species, the elements that are most likelyto be deficient are calcium and phosphorus. Consequently, these have been subjectto most investigation. In the case of ruminants, estimates of calcium and phosphorusrequirements have changed markedly over the past 50 years as new information onendogenous losses and availability has become available. For example, the UK Agri-cultural Research Council in 1965 stated the phosphorus requirement of a 400 kg steergaining 0.75 kg/day to be 26 g/day; however, in 1980 this was revised to 18 g/day,and in 1991 it was revised again to 20 g/day.
In the UK the major and minor element requirements of both ruminants and pigsare published by ARC (1980) and ARC (1981), respectively. However, these sourcesare now relatively outdated and more recent information has been incorporated intomore contemporary feeding standards. For example, the mineral requirements of grow-ing cattle and sheep are published by NRC (2000), NRC (2006) and CSIRO (2007).Similarly, the mineral requirements of horses are published by NRC (2007), and themineral requirements of pigs are published by NRC (1998). In practice, large feedcompounders often derive information on mineral requirements from a variety ofsources, including mineral supply companies. Consequently, inclusion rates are oftenconsiderably higher than those recommended by feeding standards. As the objec-tives of animal nutrition change away from animal health and production, and moreemphasis is placed on product quality, human health and environmental impact,there is a need to re-evaluate mineral requirements.
Vitamins
There are no estimates of endogenous losses on which to base vitamin requirements.Therefore, standards must be based on feeding trials.As with the assessment of mineralrequirements, the main problem associated with the assessment of vitamin require-ments is establishing appropriate criteria for adequacy. Until recently, the main criteriahave been growth rate and freedom from signs of deficiency, as assessed by visualexamination of the animal or physiological tests, such as vitamin levels in the blood.Vitamin storage can also be assessed, either by tissue analysis or from indirect evidenceof tissue saturation provided by vitamin excretion in urine.The difficulties involved inassessing requirements are illustrated in Table 14.10, which shows that apparentrequirements vary considerably, depending on the preferred criteria for adequacy.
Table 14.10 The vitamin A requirement of calves
Minimum requirement for Vitamin A (iu/kg liveweight/day)
Prevention of night blindness 32Optimal growth 64Limited storage of vitamin A 250Maximal blood levels of vitamin A 500
From the data of Lewis J M and Wilson L T 1945 Journal of Nutrition 30: 467.

Chapter 14 Feeding standards for maintenance and growth
378
In practice, vitamin allowances must be high enough to prevent signs of deficiencyand not restrict growth rate. However, higher allowances that promote storage orhigher circulatory levels of the vitamin may be justified if they can be shown to en-hance animal health and productivity, or the quality of animal products. For example,high levels of vitamin E have been shown to prolong the shelf life of meat. In mostanimals, some storage is justified, as vitamin allowances are usually set at levels suf-ficient to maintain body stores, whereas both vitamin supply and requirements mayfluctuate.
The vitamin A and D requirements of older animals are normally considered tobe proportional to liveweight, whereas those of the vitamin B group and vitamin E,which are concerned more intimately with metabolism, vary with food intake orwith the intake of specific nutrients.Thus, the requirement for thiamin, which is par-ticularly concerned with carbohydrate metabolism, varies according to the relativeproportions of carbohydrate and fat in the diet. Similarly, riboflavin requirementsare increased by high protein intakes and vitamin E requirements are increased byhigh polyunsaturated fatty acid intakes. Requirements may also vary, according tothe extent to which B vitamins are synthesised in the alimentary tract. In ruminants,microbial synthesis in the rumen may make the animal independent of a dietarysupply. In pigs and poultry, considerable synthesis may take place in the lower gutbut the vitamins produced may fail to be absorbed.The contribution made by intes-tinal synthesis then depends on whether the animals are free to practise coprophagy(the eating of faeces). Finally, vitamin requirements are often determined using dietscontaining synthetic sources of vitamins, whose availability may well be higher thanthat of natural sources in foods.Although little is known about vitamin availability, awell-documented example of non-availability is provided by nicotinic acid in cere-als, some of which is in a bound form that is not available to pigs.
A further factor to be considered when formulating diets to provide requirementsfor vitamins is that many vitamins (as discussed in Chapter 5) are unstable and arepartly destroyed by exposure to heat and light. Consequently, the way in which foodsare stored and processed has a major impact on their vitamin content.
14.5 NUTRITIONAL CONTROL OF GROWTH
The preceding sections of this chapter have shown how the growth pattern of animalsdetermines their nutrient requirements.We must now consider the second aspect ofthe nutrition–growth interaction: how growth can be controlled by nutrition.The objec-tives of any person controlling animal growth by nutrition are generally twofold: touse the nutritional resources available to achieve a high growth rate, and to producea carcass that meets consumer requirements.The rate of growth of an animal is con-trolled by its nutrient intake, and particularly by its energy intake. Energy was de-scribed earlier (see p. 281) as the ‘pacemaker’ of animal production, and both natural(e.g. climatic) and imposed variations in the animal’s energy supply will be reflectedin its growth rate.A rapid growth rate is desirable because it minimises the ‘overhead’cost of maintenance per unit of meat produced. In developed countries, animal feedsare readily available, although their use may be restricted by cost. In developingcountries, feed supplies, particularly high-energy concentrates, are often limited ornon-existent and inadequate supplies are often spread over too many animals.

Nutritional control of growth
379
Until comparatively recently, fat was a highly prized component of meat because,as vegetable oils were not readily available until the late nineteenth century, manyconsumers needed a high energy intake to fuel their manual work. The ideal meatanimal was therefore one that fattened early in life and was provided by the geneticselection of small, early-maturing breeds (such as Aberdeen-Angus cattle).We havealready seen that animals that grow fast tend to deposit a greater amount of fat perunit of gain, and so in the past the twin aims of rapid growth and a desirable carcasswere compatible with each other. However, over the past 20–30 years, fat has cometo be regarded by many consumers as a less desirable component of the carcass, andthe control of growth by nutritional means has become more difficult by the incom-patibility of objectives – i.e. that animals fed for fast growth rates will become overfat.In current feeding systems this danger is avoided partly by using breeds or selectionsof animals that are larger and later-maturing; thus, the preferred beef animal oftoday is one from the large European breeds that grow rapidly and can be slaugh-tered when relatively immature, giving a large but lean carcass.Another way to pre-vent excessive fat deposition is to treat animals with ‘repartitioning agents’; these arehormones or related substances that alter the partition of energy between proteinand fat deposition.They include the sex hormones (both oestrogens and androgens),somatostatin (growth hormone) and cimaterol or clenbuterol (β-adrenergic agonists).Growth hormone, in particular, is a powerful repartitioning agent, and the discoveryof its effects has stimulated research into the use of genetic engineering to increasethe animal’s own production of the hormone. However, in many countries, includingmost of Europe, the use of these repartitioning agents is banned, mainly because ofconsumers’ concern over their possible presence in meat. Nevertheless, their oftendramatic effects serve to emphasise the scope for controlling growth by more accept-able methods, including nutrition.
The two objectives in controlling growth may sometimes be combined into one,the maximising of lean tissue (or protein) deposition. To achieve this it is essentialthat the animal’s protein supply should be optimal. In this and preceding chapters,much emphasis has been placed on the use of recently acquired knowledge to im-prove the protein nutrition of animals. Some examples include the systems intro-duced for calculating and meeting the protein requirements of ruminants and theconcept of ideal protein for non-ruminants.To ensure the correct partition of energybetween protein and fat deposition it is essential that protein supply should matchenergy supply. In ruminants in particular, protein supply is often insufficient to meetthe animal’s potential for protein deposition, and some energy will be used for fatdeposition.The ratio of energy to protein in the diet is often dictated by the require-ments of the rumen. However, this can be changed by supplying protein that is notdegraded in the rumen but digestible in the lower gut (digestible undegradable pro-tein, DUP; see Chapter 13). An extreme example of this is the feeding of overfatlambs on a low-energy (i.e. straw) and high-DUP (i.e. fishmeal) diet. With such adiet, lambs can be ‘remodelled’, by causing them to use body fat as an energy sourceto maintain protein deposition.
Opportunities exist for controlling growth through nutrition by the phasing of nu-trient intake; for example, food may be fed at a low level in early life and at a highlevel thereafter, or vice versa. Classic experiments on the phasing of nutrient intakewere conducted by Sir John Hammond and his colleagues, and their results providedthe background to Hammond’s growth wave theory, referred to earlier.The results ofone of these experiments are illustrated in Table 14.11. Twenty pigs were grown to

Chapter 14 Feeding standards for maintenance and growth
380
90 kg liveweight by providing low or high rates of food intake to achieve either lowor high growth rates. Some of the pigs were changed from one rate to the otherhalfway through the experiment (high–low and low–high), and others were kept onthe same rate throughout (high–high and low–low). The greatest differences in car-cass composition between the pigs were in their dissectible fat content.The pigs thatgrew fast throughout (high–high) had a fat content 108 g/kg higher than those thatgrew slowly throughout (low–low), and there was a difference of the same order be-tween the low–high and high–low groups.Those with most fat and least muscle, thelow–high group, fitted the growth wave theory, as a deficiency of nutrients in earlylife appeared to have restricted muscle growth, which had the highest priority at thatstage. However, if the results of the experiment are expressed in a different way, asthe fat-free carcass (see the second part of Table 14.11), it appears that tissues otherthan fat were not much affected by the treatments.The latter figures were calculatedby F W H Elsley and colleagues, who concluded that the main tissue affected by thephasing of nutrient intake was fat. Nevertheless, as we have already acknowledged,fat is important. For many years, bacon pigs had their food intake restricted so thatthey were fed according to a high–low sequence in order to limit fat deposition.More recently, the genotype of bacon pigs has been modified to provide animals thatvoluntarily restrict their intake as they approach bacon weight, and thus avoid ex-cessive fat deposition.
Another example of the effects of phasing of nutrient intake is found in the phe-nomenon of compensatory growth. In many of the more primitive, or ‘natural’, systemsof animal production, a period of food shortage is followed by one of abundantnutrient supply (i.e. a low–high sequence). During the ‘low’ phase growth is restricted,whereas during the ‘high’ phase animals frequently grow very rapidly.This compen-satory growth may allow animals to ‘catch up’ with similar animals that were notsubject to the low phase. An example of this is presented in Fig. 14.5. The mecha-nisms responsible for compensatory growth are not well understood. However, com-pensating animals often eat more food per unit of body weight than others and maydeposit a higher proportion of lean tissue relative to fat.Thus, their energy value ofgain may be lower, such that each unit of energy intake promotes a higher weight gain.
Table 14.11 Composition (g/kg) of the carcasses of pigs grown at different ratesand slaughtered at 90 kg
Growth rate: High–high High–low Low–high Low–low
Age at slaughter (weeks) 20 28 28 46
Composition of whole carcassBone 110 112 97 124Muscle 403 449 363 491Fat 383 334 441 275Skin, etc. 105 106 99 110
Composition of fat-free carcassBone 178 168 174 171Muscle 653 674 649 677Skin, etc. 170 160 177 152
After McMeekan CP 1940 Journal of Agricultural Science, Cambridge 30: 511.

Summary
381
SummerWinter
High
Medium
Low
Days
Live
wei
gh
t (k
g)
450
400
350
300
250
0 100 250 300 350150 20050200
Fig. 14.5 Compensatory growth in cattle. Animals were kept on high, mediumand low (maintenance) planes of nutrition during winter (days 0–168), and thengrazed together during the following summer (days 169–308).
Plotted from the data of Lawrence T L J and Pearce J 1964 Journal of Agricultural Science, Cambridge 63: 5.
Alternatively, during the low phase, animals may adapt to a low plane of nutrition bybecoming more efficient and reducing their maintenance requirements. It may thentake some time for their metabolism to adapt to a higher plane of nutrition duringthe high phase, resulting in more energy being available for weight gain. Althoughdifferences may exist in the body composition of animals that achieve a similarliveweight by different growth paths, insufficient evidence exists and they are nottaken into account by current feeding standards.
In conclusion, it is important to remember that the main factor influencing bodycomposition and therefore the nutrient requirements for growth is animal weight, asindicated by the allometric equations. However, departures from the general allomet-ric relationships, due to breed, sex, etc., are important in animal production because oftheir influence on nutrient requirements and the composition and value of the carcassproduced. In modern animal production systems, farmers (and the scientists assistingthem) are often trying to manipulate these allometric relationships to maximise leanmeat production.This objective can be achieved by genetic change, by the use (in somecountries) of growth-modifying agents and by the control of nutrition.
SUMMARY
1. Feeding standards are statements of theamounts of nutrients required by animals.They may be expressed as nutrient require-ments or, with the addition of a safety mar-gin, as nutrient allowances. In the UK, the
energy and protein requirements of growingruminants and pigs are those published byAFRC (1993) and BSAS (2003), respectively. Al-ternative standards are available from othercountries.

Chapter 14 Feeding standards for maintenance and growth
382
2. Energy requirements for maintenance aregenerally estimated from fasting heatproduction (i.e. basal or fasting metabo-lism) or feeding trials. Fasting metabolismis proportional to the metabolic liveweightof the animal (typically W 0.75). An averagevalue for mammals is 0.27 MJ/kg W 0.75, butthis will vary depending on the age andsex of the animal and the plane ofnutrition.
3. Energy requirements for maintenancealso include an additional energy allowancefor the muscular activity associated withsearching for, harvesting and chewingfood.
4. When animals are kept at low environmentaltemperatures, their heat losses, and hencetheir energy requirements for maintenance,are increased. An animal’s thermoneutralrange is defined by its lower and higher criti-cal temperatures and is affected by climaticconditions (sun, wind and rain), the insulat-ing properties of the animal and its environ-ment, and food intake. In young animalsbrown adipose tissue may be metabolisedto produce heat.
5. Protein requirements for maintenance areestimated from endogenous urinary nitrogenand metabolic faecal nitrogen excretion.There are also small losses of nitrogen in hairand scurf. In ruminants the protein require-ment for maintenance can generally be metby microbial protein synthesis.
6. Animal growth follows a sigmoid curve withtime, but different parts, organs and tissuesgrow at different rates. The relationshipbetween tissue weights and body weight can be described by so-called allometricequations. Typically bone and muscle areearly-maturing tissues, whereas fat is a late-maturing tissue. Energy and protein require-ments for growth are derived frommeasurements of the chemical compositionof gain. Requirements change as animals
mature and are modified by breed, sex andrate of gain.
7. Different feeding standards adopt differentapproaches to estimate energy and proteinrequirements for growth. Protein require-ments for pigs and poultry are generallymore detailed than those of ruminants andhorses because they include estimates ofrequirements for specific amino acids.
8. In sheep, the energy and protein require-ments for wool growth are relatively small.However, wool requires higher levels of sulphur-containing amino acids, copper andzinc. In practice wool growth is predictedfrom energy or protein supply.
9. Net mineral requirements for maintenanceand growth are calculated from endogenouslosses and the mineral content of body tis-sues. They are then translated into dietaryrequirements using appropriate availabilityfactors.
10. Vitamin requirements are usually determinedfrom feeding trials, which are complicated bythe difficulty of selecting appropriate criteriafor adequacy of supply.
11. Although animal nutrient requirementsare determined by patterns of growth, both growth and body composition can bemodified by nutrition. For example, a lowfollowed by a high plane of nutrition mayincrease fat deposition. The objectives ofcontrolling growth through nutrition areto use nutritional resources to achieve ahigh rate of gain and to produce acarcass that meets the requirements of the customer.
12. As fat is no longer considered a desirablecomponent of meat, control of growth isoften aimed at increasing muscle and reduc-ing fat growth. In some countries, reparti-tioning agents (synthetic hormones) may beused to increase muscle growth.

Historical reference
383
QUESTIONS
14.1 Using the AFRC (1993) system, calculate the metabolisable energy (ME) andmetabolisable protein (MP) requirements of a 300 kg bull of large breed gainingat 1.1 kg/day.Assume that the animal’s diet has an M/D value of 11.0 MJ/kg DM.
14.2 An 80 kg commercial-type pig with a maximum rate of protein deposition of0.120 kg/day is offered a diet that provides 20.0 MJ NE/day. Calculate the rateof fat deposition.
14.3 Using the NRC (2007) system, calculate the digestible energy (DE) and crudeprotein (CP) requirements of a 500 kg alert horse undertaking a moderatelevel of work.
FURTHER READING
Agricultural and Food Research Council (AFRC) 1993 Energy and Protein Requirements ofRuminants (An Advisory Manual Prepared by the AFRC Technical Committee on Re-sponses to Nutrients),Wallingford, CABI.
Black J L and Reis P J (eds) 1979 Physiological and Environmental Limitations to WoolGrowth, Armidale, NSW, University of New England Press.
Commonwealth Scientific and Industrial Research Organisation (CSIRO) 2007 Nutrient Re-quirements of Domesticated Ruminants, Collingwood, Vic., Australia, CSIRO Publishing.
Hynd P I 2000 The nutritional biochemistry of wool and hair follicles. Animal Science 70: 181–95.
Lawrence T L J and Fowler V R 1997 Growth of Farm Animals,Wallingford, CABI.
Leeson S and Summers J D 1997 Commercial Poultry Nutrition, 2nd edn, Guelph, Canada,University Books.
Mitchell H H 1962, 1964 Comparative Nutrition of Man and Domestic Animals (2 vols), NewYork,Academic Press.
National Academy of Sciences/National Research Council 2000 Nutrient Requirements ofBeef Cattle, 7th rev. edn,Washington, DC, National Research Council.
National Academy of Sciences/National Research Council 2001 Nutrient Requirements ofDairy Cattle, 7th rev. edn,Washington, DC, National Research Council.
National Academy of Sciences/National Research Council 2007 Nutrient Requirements ofHorses,Washington, DC, National Research Council.
O’Donovan P B 1984 Compensatory gain in cattle and sheep. Nutrition Abstracts and Reviews,Series B 54: 389.
PearsonA M and DutsonT R (eds) 1991 Growth Regulation in Farm Animals, London, Elsevier.
Reid J T (ed.) 1968 Body Composition in Animals and Man, publication no. 1598,Washington,DC, National Research Council.
Theodorou M K and France J (eds) 2000 Feeding Systems and Feed Evaluation Models,Wallingford, CABI.
Thomas C 2004 Feed into Milk: A New Applied Feeding System for Dairy Cows, Nottingham,Nottingham University Press.
Whittemore C T, Hazzledine M J and Close W H 2003 The Nutrient Requirements of Pigs,Penicuik, British Society of Animal Science.
HISTORICAL REFERENCE
Brody S 1945 Bioenergetics and Growth, New York, Reinhold.

384
15.1 Nutrition and the initiation of reproductive ability
15.2 Plane of nutrition, fertility and fecundity
15.3 Egg production in poultry
15.4 Nutrition and the growth of the foetus
In reproducing animals, as in growing animals, there is an interaction between nutritionand production. Reproduction increases the animal’s requirements for nutrients, but,conversely, the nutrient supply of animals can influence their reproductive processes.
The influence of nutrition on reproduction begins early in the animal’s life, with nu-tritional changes in utero influencing subsequent adult reproductive performance. Forexample, small ram lambs at birth tend to have a delay in the onset of puberty inde-pendent of their mature size, whilst a reduction in ovulation rate of 0.3 has beenreported in ewe lambs born to dams that experienced feeding levels of 0.5 comparedwith 1.0 maintenance during gestation. The plane of nutrition in young animals canalso affect the age at which they reach puberty. In mature animals, poor nutrition canreduce the production of ova and spermatozoa, so that the female either fails to con-ceive or produces fewer offspring than normal (i.e. litter size is reduced). In pregnancy,females have specific nutrient requirements for the maintenance and growth of thefoetus(es).
The quantities of nutrients required for the production of ova and spermatozoa bymammals are small and of little significance. Thus, the boar, which produces a largeejaculate of 150–250 ml, is estimated to require 0.4 MJ ME per ejaculate, which is equiv-alent to less than 2 per cent of its maintenance requirement for metabolisable energy(23.8 MJ/day). In birds, however, the quantities of nutrients required for egg productionare large; these will be discussed in a special section of this chapter. Even in pregnancy,nutrient requirements for the growth of foetuses are in total relatively small. For exam-ple, a ewe producing twin lambs weighing a total of 7 kg at birth will deposit about1.4 kg of protein in the foetuses and associated tissues (such as the placenta), which overa gestation period of 147 days is less than 10 g/day. In contrast, a growing sheep gaining300 g in liveweight per day would deposit in its tissues about 50 g of protein per day.However, in assessing nutrient requirements for reproduction, several important featuresof reproductive processes must be borne in mind. The first of these is that reproductionis often not the sole productive process being carried out by the animal. In the case ofcattle, for example, young females may be expected to conceive at 15–20 months of
15 Feeding standards for reproduction

Nutrition and the initiation of reproductive ability
385
age, at about half of their mature body weight, and will have to continue growingwhile producing a calf. After calving, the female will be expected to conceive againwithin 2–3 months, at a time when she is producing large quantities of milk.
The second important feature of nutrient requirements for reproduction is that theyvary considerably from one phase of the reproductive cycle to another. For example, theewe conceiving twins will have very small protein requirements for foetal growth at thestart of pregnancy, but by the last week of pregnancy she will be depositing as much as30 g of protein per day in the foetuses. The final point to bear in mind is that reproduc-tion is often an ‘all or nothing’ phenomenon, and the consequences of failure can besevere for the farmer. If a beef cow kept solely to produce and rear calves fails to con-ceive, then her output will be zero and her owner will suffer a financial loss. Also, smalllitters – such as one lamb instead of two – can make the difference between profit andloss. It is therefore of great importance to ensure that reproduction in farm animals isnot impaired by poor nutrition.
Research on the effects of nutrition on reproduction tends to make slow progressbecause the effects may be slow to manifest themselves and experiments must be oflong duration. Also, the large random variability in reproduction causes statisticalproblems that can be solved only by using large numbers of animals (e.g. 80 sows pertreatment to demonstrate a 5 per cent increase in litter size). Much recent researchhas been concerned with the mechanisms by which nutrition affects reproduction, andparticularly with endocrinological processes and gene expression. General undernutri-tion, and also the deficiency of a specific nutrient, can interfere with the synthesis ofhormones involved in reproduction. In other cases, nutrition may affect the rate atwhich a hormone is destroyed by metabolism or may alter the sensitivity to a hormoneof its target organ. Over the past 20 years the increasing use of techniques for super-ovulation of farm livestock and the culture in vitro of ova and embryos have bothstimulated interest in, and provided opportunities for, the study of nutritional effectson reproduction.
This chapter will explain the general relationships between nutrition and reproduc-tion at successive stages of the reproductive life of animals. Where appropriate, quanti-tative requirements for specific nutrients and energy will be presented and discussed.Much emphasis will be placed on the role of energy intake (or, in other words, the gen-eral plane of nutrition) in reproduction, because deficiencies and excesses of specificnutrients often affect reproduction through their influence on energy intake.
15.1 NUTRITION AND THE INITIATION OF REPRODUCTIVE ABILITY
Puberty in cattle is markedly influenced by the level of nutrition at which animalshave been reared. In general terms, the faster an animal grows, the earlier it reachessexual maturity. In cattle, puberty occurs at a particular liveweight or body sizerather than at a fixed age.This is illustrated in Table 15.1, which shows the effects ofthree planes of nutrition on the initiation of reproductive ability in dairy cattle. Al-though there were considerable differences in age at puberty between the threetreatments, differences in liveweight and in body size (as reflected in the measure-ment of height at withers) were much smaller. Other experiments have shown thatby liberal feeding with high-energy diets, it is possible to induce puberty in femalecattle even earlier than the 9.3 months of Table 15.1. Similar results are found forbulls: a high plane of nutrition alters metabolic hormone production, reducing the

Chapter 15 Feeding standards for reproduction
386
age at puberty due to increased gonadotrophin secretion.The attainment of pubertyin sheep is complicated by their seasonal breeding pattern. Spring-born ewe lambsthat are well nourished will reach puberty in the early autumn of the same year.Moderately fed lambs will also reach puberty in the same year, but later in thebreeding season and at a lower liveweight. Poorly fed lambs will fail to come intooestrus until the following breeding season (i.e. at 18 months of age).
In pigs, on the other hand, high planes of nutrition do not advance puberty to anymarked extent.The primary determinants of puberty in gilts are age (170–220 days),breed (cross-bred gilts reach puberty about 20 days before pure-breds) and the ageat which gilt meets boar (a sudden meeting after about 165 days of age may inducefirst oestrus).
In practice, the factor that decides when an animal is to be first used for breeding isbody size, and at puberty animals are usually considered to be too small for breeding.Thus, although heifers of the larger dairy breeds may be capable of conceiving at7 months of age, they are not normally mated until they are at least 15 months old.Thetendency today is for cattle, sheep and pigs of both sexes to be mated when relativelyyoung, which means that in the female the nutrient demands of pregnancy are added tothose of growth. Inadequate nutrition during pregnancy is liable to retard foetal growthand to delay the attainment of mature size by the mother. Incomplete skeletal develop-ment is particularly dangerous because it may lead to difficulties at parturition.
Rapid growth and the earlier attainment of a size appropriate to breeding has theeconomic advantage of reducing the non-productive part of the animal’s life. Withmeat-producing animals, a further advantage is that a high plane of nutrition in earlylife allows the selection for breeding purposes of the individuals that respond to lib-eral feeding most favourably in terms of growth and that may therefore be expectedto produce fast-growing offspring. But there are also some disadvantages of rapidgrowth in breeding stock, especially if there is excessive fat deposition. In dairy cat-tle, fatness in early life may prejudice the development of milk-secreting tissue, andthere is also some evidence that rapid early growth reduces the useful life of cows.Over-fat gilts do not mate as readily as normal animals, and during pregnancy theymay suffer more embryonic mortality. The rearing of breeding stock is a matter re-quiring more long-term research; at present, the best recommendation is that suchanimals should be fed at a plane of nutrition that allows rapid increase in size with-out excessive fat deposition.
Table 15.1 Age and size at puberty of Holstein cattle reared on different planes of nutrition
Plane of nutrition At puberty
Age (months) Weight (kg) Height at Empty body
withers (cm) fat (%)
High 11 MJ ME/kg DM 9.3 282 110 7.4210 g CP/kg DM
Medium 10.1 MJ ME/kg DM 10.8 282 112 7.2181 g CP/kg DM
Low 9.5 MJ ME/kg DM 16.5 316 119 7.0135 g CP/kg DM
From Chelikani et al. (2003) Theriogenology 60: 707.

Plane of nutrition, fertility and fecundity
387
Table 15.2 Effects of body condition and of change in conditionon the ovulation rate of Scottish Blackface ewes
Condition scorea Liveweighta (kg) Ovulation
(a) (b) (a) (b) rate
3.5 67
3.0 64 2.11
3.0 3.0 62 62 2.11
3.0 61 2.00
2.5 60
2.0 52
1.5 47 1.00
1.5 1.5 44 46 1.11
1.5 49 1.38
1.0 39
aColumn (a) shows the condition score or weight 6 weeks before mating,and column (b) shows the corresponding value at mating.
After Gunn R G, Doney J M and Russel A J F 1969 Journal of Agricultural Science,Cambridge 73: 289.
15.2 PLANE OF NUTRITION, FERTILITY AND FECUNDITY
Plane of nutrition of female animals
In female animals the primary determinant of fertility (i.e. whether or not the ani-mal conceives) and fecundity (i.e. litter size) is the number of ova shed from theovaries (the ovulation rate). In the cow the rate is normally 1, in the ewe it is nor-mally 1–3 (but may reach 10) and in the sow it is 15–25. Not all ova are fertilisedand survive to birth. For example, a flock of 100 ewes in a single oestrous cyclemight produce 220 ova, of which 190 would be fertilised. Of the 190 embryos, 175might survive for 15 days, to the point at which they become attached to the placenta,and of these 170 might complete the full gestation period of 147 days.Thus, the finallambing percentage (lambs born per 100 ewes mated) would be 170 per cent.
It has long been recognised that female sheep gaining weight or fat reserves in the3–4 weeks before mating are more likely to conceive and more likely to have twinsor triplets than those in poorer condition. This has led to the practice of ‘flushing’ewes by transferring them from a low to a high plane of nutrition (e.g. transferringthem from hill pastures to lowland pastures or fodder crops) before mating. Morerecently, it has been recognised that although a higher plane of nutrition may bevaluable for previously undernourished ewes, animals kept continuously on a higherplane will also have high fertility and fecundity. The degree of fatness of breedingstock is commonly assessed by means of ‘condition scoring’, in which fat depositsalong the back and tailhead are palpated and scored on a scale of 1 (low) to 5 (high).Table 15.2 demonstrates what are sometimes called the static and dynamic effects ofplane of nutrition on condition score and on fertility and fecundity in ewes. Thegreatest difference in ovulation rate was between ewes that were in good condition

Chapter 15 Feeding standards for reproduction
388
at mating (condition score 3) and those in poorer condition at mating (score 1.5). Inthe former ewes there was little effect of the changes in condition and weight thatoccurred in the 6 weeks preceding mating, but in the latter ewes those whose condi-tion had been improved (from score 1.0 to score 1.5) produced more ova than thosewhose condition had been reduced (from 2.0 to 1.5).
The gonadotrophic hormone luteinising hormone is needed for the maturation andrelease of oocytes, and a low plane of nutrition appears to reduce the frequency withwhich pulses of luteinising hormone are released.Thus, flushing may improve ovulationrate by preventing this effect. Another endocrinological explanation for the effect offlushing is that a high plane of nutrition promotes a greater production of insulin, whichencourages the uptake of glucose and the synthesis of steroid hormones by the ovary.There may also be a direct effect of nutrition on the ovary, as intravenous infusion ofglucose in sheep increases the growth of oocytes. However, a delicate nutritional bal-ance is required for sheep around the time of ovulation, as a high plane of nutrition canreduce the survival of oocytes and the embryos they become after fertilisation. Onereason for this effect is that a high plane of nutrition stimulates the metabolism (i.e.destruction) of progesterone, the hormone required for the establishment and mainte-nance of pregnancy. Thus, it is recommended that after the ewe has been mated,the flushing plane of nutrition should be reduced to about the maintenance level.
In cattle, a high plane of nutrition after mating is less damaging than in sheep (whichis fortunate, as cattle are expected to conceive at the stage of lactation when they arebeing fed for a high milk yield); their progesterone supply may be augmented at thistime by release of the hormone from mobilised fat reserves. Nevertheless, achievingreconception in cows 2 months after calving, at a time when the nutritional demands oflactation are high, is a problem for the dairy industry. In dairy cows in New York state,over a period of 17 years when milk yield increased by 33 per cent, the proportion ofcows conceiving to their first insemination fell from 66 per cent to 50 per cent. InBritain, conception rate to first service in dairy cows appears to be declining by nearly1 per cent per year, with a current average calving interval of over 14 months. Observa-tions such as these have led to the recommendation that cows should be regainingweight by the time they are inseminated or served by a bull, but it is often difficult toensure a positive energy balance at this time, even in well-fed cows. In situations of foodscarcity, as with cattle kept on natural pastures subject to drought, the recommendationis impossible to implement, and in such situations it is common to find that calvingintervals are extended from the desired 12 months to as much as 24 months.
In the sow, flushing seems to have little effect on litter size, possibly because pigsare commonly kept at higher planes of nutrition than sheep; however, flushing themaiden gilt for 10 days before mating can increase litter size. A number of studieshave demonstrated that energy restriction or low body condition can reduce repro-ductive performance in mares, whilst energy restriction just before parturition caninduce a premature birth. Excessive energy supply in horses generally does notimpair or improve reproductive efficiency, although in some instances it has beenassociated with twin pregnancies.
Plane of nutrition of male animals
In mammals, the spermatozoa and ova and the secretions associated with themrepresent only very small quantities of matter.The average ejaculate of the bull, forexample, contains 0.5 g of dry matter. It therefore seems reasonable to suppose that

Plane of nutrition, fertility and fecundity
389
nutrient requirements for the production of spermatozoa and ova are likely to be in-appreciable compared with the requirements for maintenance and for processes suchas growth and lactation.
If this were so, one would expect that adult male animals kept only for semenproduction would require no more than a maintenance ration appropriate to theirspecies and size. There is insufficient experimental evidence on which to base feed-ing standards for breeding males, but in practice such animals are given food well inexcess of that required for maintenance in females of the same weight. There isno reliable evidence that high planes of nutrition are beneficial for male fertility,although it is recognised that underfeeding has deleterious effects (see below). Theliberal feeding of males probably reflects the natural desire of farmers not to riskunderfeeding and so jeopardise the reproductive performance of the whole herd orflock. Males, however, do have a higher fasting metabolism and therefore a higherenergy requirement for maintenance than do females and castrates.As the durationof spermatogenesis in bulls, rams and goats is 54, 49 and 48 days, respectively, it isrecommended that adequate nutrition be provided for at least 2 months beforebreeding.
Effects of specific nutrients on fertility
Many nutrient deficiencies influence fertility indirectly, through their effects onthe general metabolism of the animal. For example, phosphorus deficiency ingrazing ruminants, which has often been associated with poor fertility, appears toaffect reproduction because it restricts many metabolic processes, hence foodintake and the general plane of nutrition. However, there is also some evidencethat phosphorus deficiency has a direct effect on reproduction through suppressingoestrous cycles.
Protein deficiency, especially in ruminants, can be expected to influence repro-duction because it reduces food intake. At the other extreme, it has been suggestedthat a supplement of digestible protein that is undegradable in the rumen (DUP; seeChapter 13) can increase the ovulation rate of both sheep and cattle. In Australia,lupin seed, which contains a high concentration of DUP, is used to flush ewes. Incontrast, rumen-degradable protein (RDP) given in excessive amounts to dairy cowsraises blood levels of ammonia (see Chapter 8), which in turn alters the ion fluxes inthe endometrium and reduces embryo survival. In pigs, short-term deprivation ofprotein has no effect on fertility, but a prolonged protein deficiency, especially inyounger animals, leads to reproductive failure. High dietary intake of crude proteinseems to depress fertility in horses, although an adequate intake of essential aminoacids, especially methionine, is important for the onset of the oestrus cycle in non-lactating mares.
In dairy cows, feeding diets containing high levels of starch (above 160 g/kgDM) are associated with elevated plasma insulin concentrations and an earlier re-sumption of oestrus postpartum. In contrast, for good oocyte quality and blasto-cyst development, low dietary starch and/or high fat concentrations are required.Strategies whereby high-starch diets are provided to dairy cows pre-service andlow starch diets post-service result in significant increases in conception rate com-pared with animals that have been offered only high- or low-starch diets. The im-plementation of this strategy may, however, prove to be difficult on many commercialdairy farms.

Chapter 15 Feeding standards for reproduction
390
Several studies in farm animals have shown that feeding or infusing differenttypes of polyunsaturated fatty acids, especially those of the n-3 and n-6 series, to fe-males can have both positive and negative effects on reproduction, primarily throughtheir effects on endogenous production of prostaglandins. For example, in sheep,feeding long-chain n-3 polyunsaturated fatty acids found in fish oil in late pregnancyincreases gestational length by 2–3 days, whilst in cattle, feeding linoleic acid reducesprogesterone concentrations and compromises early embryo survival. In the male,most recent work has focused on sperm production, and experiments in fowl andboars have demonstrated clear effects of dietary PUFAs on sperm membrane phos-pholipid composition and fertilising ability. For example, feeding fish oil to boarsincreases sperm motility and the number per ejaculate.
Vitamin A deficiency must be prolonged if it is to affect fertility; thus, animalsmay suffer blindness before their reproductive organs are affected (by keratinisationof the vagina or degeneration of the testes).An extreme and long-lasting deficiencyof vitamin A may prejudice embryonic development and the ovarian cycle of mares,although this rarely occurs. Recently β-carotene has been claimed to have a specificeffect on fertility (i.e. independent of its role as a precursor of vitamin A), but theclaim has yet to be adequately confirmed (see Chapter 6).
Vitamin E deficiency causes infertility in rats, but there is little evidence that thevitamin plays an essential role in maintaining fertility in cattle and sheep. In pigs,however, vitamin E-deficient diets have been reported to reduce reproductive per-formance. There is also evidence from experiments with mature fowls that a pro-longed vitamin E deficiency causes sterility in the male and reproductive failure inthe female; in the male, sterility may become permanent through degenerativechanges in the testes. In ruminants, a deficiency of the nutrient associated withvitamin E, selenium, reduces fertility, apparently by affecting fertilisation and alsothe viability of spermatozoa. In a series of trials in selenium-deficient areas ofNew Zealand, a supplement of selenium increased the lambing percentage from89 per cent to 98 per cent, but vitamin E had little effect. However, seleniumsupplementation allied with vitamin E for dairy cows has been shown to reducethe incidence of retained placenta (the condition in which the placenta fails to beexpelled after calving). In horses, a low intake of selenium can restrict the devel-opment of the embryo.
In non-ruminants, deficiencies of the B vitamins riboflavin and folic acid havebeen shown to reduce embryo survival.
In addition to selenium, the trace elements copper, molybdenum, iodine, man-ganese and zinc are important in influencing fertility. Herbage copper levels of lessthan 3 mg/kg DM delay the return to oestrus and hence lengthen the calving inter-val in cattle. Copper deficiency can be induced by excessive molybdenum in thediet (see Chapter 6). An excess of molybdenum in the diet of young cattle delaysand depresses oestrus, apparently because it reduces the secretion of luteinisinghormone. Deficiencies of copper and iodine reduce egg production in poultry. Adeficiency of manganese reduces fertility in sows by causing delayed or irregularoestrous cycles. Zinc deficiency is interesting because it affects reproductionthrough the male, in which it prevents spermatogenesis; zinc is a component of theenzyme thymidine kinase, which is required for spermatogenesis. In the female,zinc deficiency may possibly increase embryo mortality; thus, it reduces hatchabil-ity in poultry.

Egg production in poultry
391
BOX 15.1 Nutrient effects on embryonic gene expression, embryo survival andsubsequent performance
There is considerable interest in the area of nutritional influences on early embryonic gene expres-sion and subsequent effect on animal performance and health. Evidence of this was most clearlyseen in the large offspring syndrome (LOS), whereby it became evident that congenital abnormali-ties occurred in ruminant species following the transfer to recipient donors of in vitro produced em-bryos. Abnormally large calves and lambs (twice the normal birthweight in calves and up to fivetimes in lambs) were the most obvious feature, with gestation frequently being extended and otherabnormalities such as breathing difficulties, reluctance to suckle and sudden perinatal death beingseen. Evidence that in vitro culture led to errors in genomic imprinting was reported in sheep em-bryos, when it was shown that the reduction in expression of the gene encoding type II insulin-likegrowth factor receptor was associated with a loss of methylation of that gene. These abnormalitiesare associated with differences in the composition of in vitro culture media and with dietary strate-gies that modify uterine conditions. For example, alterations in both the level and the nature ofdietary protein result in elevated plasma and uterine ammonia and urea concentrations in donorewes that influence the incidence and severity of LOS following the transfer of these embryos to re-cipient ewes. The effects of maternal diet around the time of conception have since been extendedin sheep to include the effects of B vitamins (cobalamin and folate) and methionine deficiency,which have been shown to epigenetically alter DNA methylation in offspring that become obese,insulin-resistant and hypertensive by 2 years of age.These effects of maternal diet on the preimplant-ation embryo, with subsequent consequences for foetal development and lifetime performance andhealth of offspring, have far-reaching implications that extend beyond the traditional concept of nu-tritional effects on animal performance.
15.3 EGG PRODUCTION IN POULTRY
Rearing of hens
Birds intended for egg production are commonly fed to appetite during the rearingperiod, with the aim of achieving a liveweight of about 1.3 kg at 17 weeks of age, whenegg production begins, with a final body weight of around 1.5 kg for white and 1.9 kgfor brown strains. Restriction of food intake during rearing reduces costs but delaysthe onset of egg laying. Moreover, it is important that birds should be well grown at theonset of laying, because egg weight is related to body weight.Thus, pullets are rearedon diets high in metabolisable energy and protein (see Appendix 2,Table A.2.10).
In contrast to layers, pullets being reared as broiler breeders (i.e. meat-type birds)have to be restricted in food intake, otherwise they grow too fast and their subsequentegg production is much reduced. The recommended restriction to 40 per cent of ap-petite (i.e. their intake if unrestricted) leaves them hungry and often difficult to manage.
Nutrient requirements of laying hens
Productive flocks of layers produce an average of about 350 eggs per bird per year;thus, on an average day 350�365 � 95 per cent of birds will lay an egg. Egg produc-tion would not be expected to go below 75 per cent in a commercial flock. Theireggs weigh on average 60 g for white strains and 62 g for brown strains, have the

Chapter 15 Feeding standards for reproduction
392
chemical composition shown in Table 15.3, and have an energy value of about 375 kJ;this information can be used as the basis for a factorial calculation of the nutrientrequirements of layers.At one time, laying hens were rationed according to a systemin which they were given a certain amount of food per day for maintenance and acertain amount for the estimated egg production, but today they are almost invari-ably fed to appetite. Feeding standards for layers, as for other classes of poultry, aretherefore expressed in terms of nutrient proportions rather than quantities. The re-quirements of layers are shown in Appendix 2,Table A.2.10.
Energy
A hen weighing 2.0 kg has a fasting metabolism of about 0.36 MJ/kg W0.75 per day,or 0.60 MJ/day, and utilises metabolisable energy for maintenance and productionwith a combined efficiency of about 0.8. Its requirement for metabolisable energy
Table 15.3 Average composition of the hen’s egg
Per kg Per egg Proportion of nutrient
whole egg of 57 g in edible part of egg
Gross constituents (g)Water 668 38.1 1.00Protein 118 6.7 0.97Lipid 100 5.7 0.99Carbohydrate 8 0.5 1.00Ash 107 6.1 0.04
Amino acids (g)Arginine 7.2 0.41 0.97 (assumed forHistidine 2.6 0.15 all amino acids)Isoleucine 6.4 0.36Leucine 10.1 0.57Lysine 7.9 0.45Methionine 4.0 0.23Phenylalanine 6.0 0.34Threonine 5.5 0.31Tryptophan 2.2 0.13Valine 7.6 0.44
Major minerals (g)Calcium 37.3 2.13 0.01Phosphorus 2.3 0.13 0.85Sodium 1.2 0.066 1.00Potassium 1.3 0.075 1.00Magnesium 0.8 0.046 0.58
Trace elements (mg)Copper 5.0 0.3 1.00Iodine 0.3 0.02Iron 33 1.9 (traces of minor Manganese 0.3 0.02 elements in shell)Zinc 16 1.0Selenium 5.0 0.3

Egg production in poultry
393
for maintenance estimated from fasting metabolism would therefore be 0.60/0.8 �
0.75 MJ/day, and for 90 per cent egg production 0.375 � 0.9�0.8 � 0.42 MJ/day(total 1.17 MJ/day). Maintenance requirements increase as temperature falls; for ex-ample, 2 kg birds adapted to 25 °C would require an extra 0.018 MJ/day for each 1 °C fall in temperature below 25 °C. An alternative method of estimating energyrequirements is to fit regression equations to data obtained under practical feedingconditions for metabolisable energy intake and the weight, weight change and eggproduction of hens. Maintenance estimates derived in this way differentiate betweenhens of the smaller, white strains and the heavier, brown-feathered layers. Expressedper kg W, these are 0.480 MJ ME and 0.375 MJ ME per day, respectively, and so1.8 kg white and 2 kg brown birds would need 0.86 MJ ME and 0.75 MJ ME per day(cf. 0.61 MJ estimated above, from fasting metabolism).
In commercial practice, laying hens are almost invariably fed to appetite; theirmetabolisable energy intake is commensurate with the estimates of requirementdiscussed above (about 1.0–1.2 MJ/day) and they gain 1–2 g/day.Typical intakes are90 g/bird/day for white strain birds and 108 g/bird/day for brown strains. Hens adjusttheir food intake for the energy concentration of their diet, so that if the ME contentof the diet is reduced they eat more of it, and if ME content is increased they eat less(see Chapter 17). However, the adjustment of intake does not fully compensate forthe change in energy content, and the diets of layers are therefore kept to a smallrange in energy content, of 11.2–12.2 MJ ME/kg (12.5–13.5 MJ/kg DM). For Appen-dix 2, Table A2.10, a concentration of 11.1 MJ/kg (12.5 MJ/kg DM) has been as-sumed. Concentrations below 10 MJ/kg are likely to depress energy intake sufficientlyto reduce egg production, and concentrations greater than 13 MJ/kg usually increasebody weight gain rather than the number of eggs laid (although egg weight may beincreased).The food intake of hens, like their maintenance requirement, is affected bythe environmental temperature and falls by 1–2 per cent for each 1 °C rise in temper-ature in the range 10–30 °C.
Protein
Laying hens weighing 1.8 kg and consuming 110 g/day of a diet containing 11.1 MJME/kg require a total protein concentration of about 160 g/kg of diet.The amino acidrequirements of layers have not been defined as accurately as those of chicks, becauseit is difficult to maintain a satisfactory level of egg production if dietary protein isgiven as mixtures of pure amino acids. For factorial calculations, it is assumed thatamino acids can be incorporated in egg proteins with an average efficiency of 0.83.For example, the lysine content of eggs is 7.9 mg/g (see Table 15.3), so the hen’s pro-duction requirement for absorbed (i.e. available) lysine is 7.9�0.83 � 9.5 mg/g of eggproduced.An equation for predicting the available lysine requirement of hens is:
where L � available lysine (mg/day), E � egg production (g/day) and W � bodyweight (kg).
Thus, the term 60W estimates the maintenance requirement for available lysine.Similar equations are available for the other indispensable amino acids for which therequirements of layers have been quantified; in addition to lysine, these include me-thionine (often the first-limiting amino acid for layers), tryptophan and isoleucine.Glycine (or its substitute, serine) is apparently non-essential for layers.
L = 9.5E + 60W

Chapter 15 Feeding standards for reproduction
394
When the amino acid levels of diets for layers are set, account needs to be takenof the fact that individual birds within a flock will be producing eggs at differentrates, and their requirements will therefore differ. This is, of course, a problem withother livestock and other nutrients, but it has received special attention in its appli-cation to layers.The amino acid levels of the diet can be raised to ensure that the re-quirements of, say, 95 per cent of the flock will be satisfied, but this will increase thecost of the diet. Models have therefore been devised to compare the extra costs ofraising amino acid levels with the extra returns expected from egg production.
As the egg production of hens falls during the period of laying from the peak of90 per cent to perhaps 75 per cent, their requirements for amino acids (and othernutrients) decline. It is therefore possible to employ what is termed ‘phase feeding’to reduce the protein content of their diet from an initial 170 g/kg to about 150 g/kg.
Mineral elements
The laying hen’s requirement for calcium is two to three times greater than that of thenon-layer, because of the large quantities of calcium in the eggshell.The minimum re-quirement for maximum egg production is about 3 g/day, but maximum eggshellthickness is not achieved until calcium intake is increased to 3.8 g/day, with typicalvalues of 4.1 g/day currently being fed. The whole quantity of calcium required iscommonly included in the mash (meal) or pellets, but if the hen is given a separatesource of calcium, as grit, then it is capable of adjusting its intake to its requirements.The hen’s requirement for calcium fluctuates during the day, and for the 12–14 hoursin which it is forming the eggshell its requirement excedes the rate at which it can ab-sorb calcium.The hen therefore has to use its reserves of calcium, although it attemptsto maximise the quantity absorbed by selecting calcium-rich foods (when possible)and improving absorption from the gut.The use of high-energy-density diets results inlower feed intakes and generally greater productive output. A consequence of thisis that higher dietary concentrations of other nutrients are required – for example,many commercial diets now contain over 40 g/kg calcium. Phosphorus requirementsare difficult to define because of uncertainties regarding the availability of phytatephosphorus; requirements are therefore often stated as non-phytin phosphorus or asthe proportion of inorganic phosphorus to be added to the diet.
Other elements that are likely to be deficient in normal diets are sodium, chlo-rine, iron, iodine, manganese and zinc. Common salt is generally added to the diet oflaying hens and is beneficial in counteracting cannibalism and feather pecking. Therequirement of poultry for sodium is met by the provision of 3.8 g NaCl per kilo-gram of diet. In excessive amounts, salt is definitely harmful, although adult birdscan withstand 200 g/kg in the diet if adequate drinking water is available. The ironcontent of the egg is relatively high (see Table 15.3), and consequently the require-ment of the laying hen is large compared with the requirement for maintenance. Ex-cessive iron in the diet is, however, harmful and may give rise to rickets by renderingthe phosphorus of the diet unavailable. Iodine and manganese are particularly im-portant for breeding hens, since a deficiency of either leads to a reduction in thehatchability of eggs and may also reduce the viability of the chicks after hatching.The requirements for manganese are influenced by breed differences and by thelevels of calcium and phosphorus (and phytate) in the diet; manganese is more likelyto be deficient in diets predominantly rich in maize than in those based on wheat oroats. Zinc deficiency in the diet of laying hens adversely affects egg production andhatchability and results in the production of weak chicks with a high mortality rate.

Nutrition and the growth of the foetus
395
In the past, it is possible that the use of galvanised feeding and drinking troughs wasan important source of zinc.
Vitamins
An important feature of the vitamin requirements of laying hens is that the mini-mum amounts required to ensure maximum egg production may be insufficient toprovide for the normal growth of the chick, both before and after hatching. Require-ments for some vitamins are not known, but it appears that for most B vitamins thequantities needed for maximum hatchability are appreciably greater than those foregg production alone. For vitamins A and D this is not so.
The value of β-carotene as a source of vitamin A for poultry depends upon a num-ber of factors, and it has been suggested that in practice this provitamin should beconsidered as having, on a weight basis, only 33 per cent of the value of vitamin A.
Regarding vitamin D, it should be remembered that D3 (cholecalciferol) is aboutten times as potent for poultry as D2 (ergocalciferol).
15.4 NUTRITION AND THE GROWTH OF THE FOETUS
The role of the placenta
When the embryo becomes attached to the lining of the uterus, it produces tissuesthat link with those of the uterus to form the placenta; at this stage the embryo be-comes a foetus.The functions of the placenta are to feed nutrients into the foetus andto remove excretory products from it, and it carries out these functions by having ma-ternal and foetal blood vessels in close proximity to one another. Nutrients andmetabolites pass from one circulation to the other by the same three types of processthat operate in the gut (see Chapter 8). Simple diffusion (i.e. from high to low concen-tration) accounts for the transport of lactate, acetate, oxygen, carbon dioxide andurea; glucose also reaches the foetus by diffusion, but at a faster rate than can beaccounted for solely by a concentration gradient. Nutrients kept at a higher concen-tration in foetal blood than in maternal blood must reach the foetus by the energy-demanding process of active transport; amino acids, electrolytes (minerals) andwater-soluble vitamins enter the foetus by this process. Large molecules, such as lipidsand proteins, are generally unable to pass through the placenta, but in some speciesthe process of pinocytosis allows the transfer to the foetus of immunoglobulinsproduced by the mother. In farm animals, however, immunoglobulins are generallytransferred after birth via the first-drawn milk, or colostrum (see Chapter 16).
The placenta grows during the first two-thirds of pregnancy. In animals carryingtwo or more foetuses, the placental tissues have to be divided among them, therebyreducing the nutrient supply to each individual foetus and posing the danger that un-equal division may cause inadequate nourishment of some individuals and hence re-duce their birthweight; this is often the origin of the underweight (‘runt’) piglets in anewborn litter.The efficiency of the placenta in providing nutrients to the foetus(es)is dependent on its permeability and on the flow and nutrient concentrations of thematernal blood.Thus, circumstances that reduce the blood flow to the uterus, as heatstress may do by diverting blood to the mother’s exterior, will reduce foetal growth.
The main source of energy for the foetus is glucose. The placenta also utilisesglucose as an energy source for its transport operations. The foetus uses most of its

Chapter 15 Feeding standards for reproduction
396
glucose supply to synthesise and maintain tissues consisting mainly of protein. Smallexcesses of glucose are used to synthesise energy stores of glycogen and lipid. In farmanimals, however, these stores are small and amount to no more than 30 g of lipid perkilogram of body weight at birth. In ruminants, some acetate may also be used forlipid synthesis. In times of glucose scarcity, the foetus will use amino acids as an en-ergy source, but the latter are required mainly for protein synthesis.
Nutrient requirements for foetal growth
The growth of the foetus is accompanied by the growth of the placenta and also bythe fluid-containing sacs that surround the foetus. In addition, the uterus itself en-larges.The organs and tissues that grow with the foetus are known collectively as theadnexa. The quantities of nutrients deposited in the foetus can be determined bykilling animals at birth and analysing them, and the time course of nutrient deposi-tion during gestation can be determined by analysis of foetuses and adnexa obtainedfrom animals slaughtered at successive stages of pregnancy. Figure 15.1 illustratesnutrient deposition in sheep foetuses alone and in foetuses plus adnexa (the graviduterus); it is based on analyses made by the UK Agricultural Research Council of anumber of experimental studies of the kind described above, and applies to a lambweighing 4 kg at birth. Similar analyses have been made for cattle and pigs.
6000
0
0900
063 91 119 147
Days from conception
2.5
Total weightCalcium
60
0140
012
063 91 119 147
Sodium
Fat
Wei
gh
t (g
)En
erg
y (M
J)W
eig
ht
(g)
Energy
Protein
Wei
gh
t (g
)W
eig
ht
(g)
Wei
gh
t (g
)
Fig. 15.1 Growth of the sheep foetus (•) and gravid uterus (■).
Plotted from the equations of the Agricultural Research Council 1980 The Nutrient Requirements ofRuminant Livestock, Farnham Royal, Commonwealth Agricultural Bureaux.

Nutrition and the growth of the foetus
397
For the weight of the gravid uterus (uterus plus contents), and also for many of itscomponents, the values shown in Fig. 15.1 are extremely small before about 63 days(9 weeks) of gestation but then increase rapidly to full term, at 147 days (21 weeks).The increases are particularly rapid in the last one-third of pregnancy (i.e. from day100 onwards).They are also faster for the foetus than for the gravid uterus, becausethe adnexa make their growth earlier, in mid-gestation.This is illustrated most clearlyfor the component sodium, most of which in mid-gestation is located in the foetalfluids. The main organic component is protein; fat forms a small proportion of thefoetus, reaching only about 120 g, or 30 g/kg, at full term.
The patterns of growth shown in Fig. 15.1 can be described by what are known asGompertz growth equations, which have the form:
where Y � the weight of the foetus or a component of it, A, B and C � constants,and x � day of gestation.
Differentiation of the Gompertz equations allows the calculation of nutrient de-position at successive stages of gestation, and some illustrative figures are shown inTable 15.4. For comparative purposes, Table 15.4 includes some estimates of themaintenance requirements of 40 kg ewes, expressed as net requirements. Until thelast one-third of gestation, nutrient requirements for intrauterine growth are so smallrelative to the ewe’s maintenance requirements that they can be ignored. By the endof gestation, requirements for energy retention in the uterus are still small (17 percent of the net maintenance requirement), but those for specific nutrients become moreappreciable. For example, the intrauterine requirement for calcium is over twice asgreat as the net maintenance requirement by the end of gestation.
In horses, like farm animals, the majority of uterine and placental developmentoccurs during the second trimester. The DE requirements are relatively small untilapproximately day 150 of gestation, but they equate to 24 per cent of total DErequirements by day 340. Protein requirements for pregnancy in early to mid-gestationare also low and assumed to be equivalent to maintenance requirements. From thefifth month of gestation onwards, requirements equate to 2.5 g of dietary crudeprotein per gram of foetal weight. Therefore, by day 340 of gestation, when foetalweight is around 48 kg, total crude protein requirements increase from 630 g/day
log Y = A - Be-Cx
Table 15.4 Daily deposition of energy and selected nutrients in the uterus of asheep at successive stages of gestation, and leading to the birth of a 4 kg lamb
Days (and weeks) Deposited in uterus (per day)
from conception Energy (kJ) Protein (g) Calcium (g) Phosphorus (g)
63 (9) 49.3 1.80 0.05 0.0691 (13) 145.0 5.00 0.30 0.23119 (17) 347.0 11.56 0.85 0.45147 (21) 699.0 22.85 1.45 0.57Ewe maintenancea 4000 33 0.64 0.56
aApproximate net daily requirement for maintenance of a 40 kg ewe.
Adapted from Agricultural Research Council 1980 The Nutrient Requirements of Ruminant Livestock,Farnham Royal, Commonwealth Agricultural Bureaux.

Chapter 15 Feeding standards for reproduction
398
to approximately 840 g/day. Foal birthweight is estimated as 9.7 per cent of non-pregnant mare weight.
Energy metabolism during gestation
If a pregnant animal is given a constant daily allowance of food, its heat productionwill rise towards the end of gestation. The increase is due mainly to the additionalenergy required by the foetus for both maintenance and growth. It has been foundthat metabolisable energy taken in by the mother in addition to her own mainte-nance requirement is utilised by the foetus with comparatively low efficiency (i.e.low kc; see Chapter 11). For each additional MJ, only about 0.13 MJ is retained inthe foetus, but the apparent kc value of 0.13 is not directly comparable with theother k factors discussed in Chapter 11, because the heat production includes thebasal heat production of the foetus as well as the heat produced during synthesis offoetal tissues.The efficiency with which metabolisable energy is used for the growthof the foetus (i.e. excluding the maintenance of the foetus) has been estimated atabout 0.4.The demands of the foetus for maintenance and growth lead eventually toa considerable increase in the energy requirements of the mother. For example, for aewe weighing 40 kg at the start of gestation, and requiring 6 MJ of metabolisable en-ergy per day for maintenance, the total energy requirement will increase to about11 MJ/day by the end of gestation. Thus, the requirement for metabolisable energyin pregnancy is increased by far more than might be deduced from the storage ofenergy in the gravid uterus (see Table 15.4).
Consequences of malnutrition in pregnancy
Malnutrition – meaning both inadequate and excessive intakes of nutrients – may affectpregnancy in several ways. The fertilised egg may die at an early stage (i.e. embryoloss), or later in pregnancy the foetus may develop incorrectly and die; it may then beresorbed in utero, be expelled before full term (abortion) or be carried to full term(stillbirth). Less severe malnutrition may reduce the birthweight of the young, and theviability of small offspring may be diminished by their lack of strength or by their in-adequate reserves (e.g. of fat). In some circumstances, it is the mother, not the foetus,that suffers from malnutrition.The foetus has a high priority for nutrients and, if themother has a low intake, her reserves will be used to meet the needs of the foetus.Thispriority is seen most strikingly in the case of iron, for the foetus can be adequatelysupplied with iron when the mother herself is anaemic.The protection thus afforded
BOX 15.2 Mammary development
This takes place throughout pregnancy, but it is only in the later stages that it proceeds rapidlyenough to make appreciable nutrient demands. Even then the quantities of nutrients laid down inthe gland are quite small. In the heifer, for example, it has been shown by the analysis of animalsslaughtered at various intervals during pregnancy that even in the last 2 weeks, when mammarygrowth is proceeding at its fastest rate, the quantity of protein deposited daily is no more than 45 g;this is only 20 per cent of the net protein requirement for maintenance, or 30 per cent of the pro-tein deposited daily in the uterus at that stage of gestation.

Nutrition and the growth of the foetus
399
BOX 15.3 Extrauterine growth during gestation
The liveweight gains made by pregnant animals are often considerably greater than can be ac-counted for by the products of conception alone. For example, a litter of ten piglets and its associ-ated membranes may weigh 18 kg at birth, but sows frequently gain over 50 kg during gestation.The difference represents the growth of the mother herself, and sows may in their own tissues de-posit three to four times as much protein and five times as much calcium as is deposited in the prod-ucts of conception. This pregnancy anabolism, as it is sometimes called, is necessary in immatureanimals that are still growing, but it also occurs in older animals. Frequently, much of the weightgained during pregnancy is lost in the ensuing lactation.
If maternal growth (or regrowth) is regarded as an essential feature of gestation, then allowancemust be made for it in feeding standards.Table 15.5 shows the effect on the energy requirements of140 kg sows of providing for a maternal gain in gestation of 20 kg (most of this being made early ingestation, when requirements for foetal growth are small). Energy requirements for maternal growthare much larger than those for foetal growth; as a result, total daily energy requirement does notchange much over the course of pregnancy and as a consequence recent rationing systems assume afixed requirement of 0.5 MJ DE per day spread over the whole gestation.The practical consequenceof this is that sows are often given a flat rate of feed (about 2.0–2.8 kg of meal providing 18–26 MJ NEper day) throughout pregnancy.
Table 15.5 Digestible energy requirements (MJ/day) of a 140 kg sow formaintenance, foetal growth and maternal growth at successive stages of gestation
Day of Maintenance Requirement Total
gestation requirement for growth of requirement
Foetuses, Maternal
etc. tissuesa
10 19.1 0.0 7.7 26.840 20.4 0.2 6.6 27.280 23.6 0.8 2.5 26.9
115 27.0 2.2 0.8 30.0
aTotal gain in gestation of 20 kg.
Adapted from Agricultural Research Council 1981 The Nutrient Requirements of Pigs, Farnham Royal,Commonwealth Agricultural Bureaux.
Younger sows continue to grow lean tissue during pregnancy, and so changes in body weight arenot an accurate guide to changes in fat reserves (i.e. a sow gaining weight in pregnancy may still belosing fat). For this reason, the body condition score of sows may be included in models of energyrequirements (see Agricultural and Food Research Council 1991, in Further reading).
A high plane of feeding, especially towards the end of gestation, is sometimes advocated as ameans of increasing piglet birthweight and also the sow’s mammary development; the greater en-ergy reserves of the piglet and the greater milk yield of the sow should then increase the viabilityand growth of the litter. In practice, the improvements tend to be insignificant.
the foetus is not absolute, however, and in severe and prolonged deficiencies bothfoetus and mother will suffer.The degree of protection also varies from one nutrient toanother, for although ewes as a result of an insufficient supply of energy may lose15 kg of body substance during pregnancy and still give birth to normal lambs, an

Chapter 15 Feeding standards for reproduction
400
avitaminosis A that is without apparent effect on the ewe herself can lead to seriousabnormalities in the young.The effects of underfeeding in pregnancy will also dependon the reserves of the mother, and particularly on the stage of pregnancy at which itoccurs. In general, deficiencies are more serious the later they occur in pregnancy, butthis rule is not invariable; for example, vitamin A deficiency in early pregnancy, byinterfering with the initial development of certain organs, can lead to abnormalitiesand even death in the young.
Effects on the young
Deficiencies of individual nutrients in pregnancy must be severe to cause the deathof foetuses; protein and vitamin A are the nutrients most likely to be implicated,although deaths through iodine, calcium, riboflavin and pantothenic acid deficien-cies have also been observed. Congenital deformities of nutritional origin oftenarise from vitamin A deficiency, which causes eye and bone malformations in par-ticular. Iodine deficiency causes goitre in the unborn and in pigs has been observedto result in a complete lack of hair in the young. Hairlessness can also be caused byan inadequate supply of riboflavin during pregnancy. Copper deficiency in thepregnant ewe leads to the condition of swayback in the lamb, as described earlier(see p. 123).
In the early stages of pregnancy, when the nutritional demands of the embryo arestill insignificant, the energy intake of the mother may influence embryo survival. Insheep and pigs, both very low and very high intakes of energy at this stage may bedamaging, especially in females in poor condition at mating.As discussed earlier (seep. 388), the probable cause is a disturbance of the delicate hormone balance re-quired at this time for implantation of the embryo. There is now evidence, some ofwhich comes from the culture of embryos in vitro, that nutrition early in pregnancycan influence the later development of foetuses, for example by modifying the distri-bution of muscle fibres.
However, mid-pregnancy is a more critical period, because it is at this stage thatnutrition affects the growth of the placenta. In the ewe, about two-thirds of the vari-ation in lamb birthweight is associated with variation in placenta weight. In sheep, ahigh plane of nutrition in mid-pregnancy restricts the growth of the placenta, possi-bly because a good supply of nutrients in blood can be transferred to the foetus withless than maximal placental development. Later in pregnancy, however, when thedemands of the foetus are greater, its growth will be reduced because of the re-stricted growth of the placenta.The importance of this effect varies with the age andcondition of the ewe; the practical recommendation is to feed older ewes and thosein good body condition for a slight loss of weight in mid-pregnancy, but younger andthinner ewes should be fed to gain about 80 g/day. In pigs, a common recommenda-tion is that feeding for the first two-thirds of pregnancy should be at about the main-tenance level.
In the last one-third of pregnancy, the requirements of the foetus(es) increase rap-idly, and a low plane of nutrition at this time will restrict foetal growth. Ewes keptunder natural conditions (e.g. mountain pastures) are frequently underfed in latepregnancy and thus lose weight, produce lambs of low birthweight and have a reducedyield of colostrum. If the low plane of nutrition has been severe and prolongedenough, then additional feeding during the last few days of pregnancy has littleeffect. Low colostrum production may subsequently reduce lamb survival.Table 15.6

Nutrition and the growth of the foetus
401
illustrates the association between their weight losses, birthweights of their lambsand colostrum production.
Young animals should be born with reserves of mineral elements, particularlyiron and copper, and of vitamins A, D and E, because the milk, which may be thesole item of diet for a time after birth, is frequently poorly supplied with these nutri-ents.With regard to iron, it appears that if the mother is herself adequately suppliedand is not anaemic, then the administration of extra iron, whether in her food or byinjection, will have no influence on the iron reserves of the newborn. If, however, themother is anaemic these reserves, though not haemoglobin, may be reduced. Thecopper and fat-soluble vitamin reserves of the newborn are more susceptible toimprovement through the nutrition of the mother. Ewes supplemented with very highdietary levels of iodine in late pregnancy have reduced serum lamb immunoglobulin G(IgG) levels and a lower efficiency of colostoral IgG absorption, which can reducetheir ability to fight infection.
Effects on the mother
The high priority of the foetus for nutrients may mean that the mother is the moreseverely affected by dietary deficiencies. The ability of the foetus to make themother anaemic has already been mentioned; this situation is unusual in farm animalsbecause their diets are normally well supplied with iron.
The foetus has a high requirement for carbohydrate, and by virtue of its priorityis able to maintain the sugar concentration of its own blood at a level higher thanthat of the mother. If the glucose supply of the mother is insufficient, then herblood glucose may fall considerably to levels at which nerve tissues (which rely oncarbohydrate for energy) are affected.This occurs in sheep in the condition known aspregnancy toxaemia, which is prevalent in ewes in the last month of pregnancy. Af-fected animals become dull and lethargic, lose their appetite and show nervous signssuch as trembling and holding the head at an unusual angle; in animals showingthese signs, the mortality rate may be as high as 90 per cent. The disease occursmost frequently in ewes with more than one foetus – hence its alternative name‘twin lamb disease’ – and is most prevalent in times of food shortage and when theewes are subjected to stress in the form of inclement weather or transportation. Lossof appetite is especially common among fat ewes. Blood samples from affected ani-mals usually show, in addition to hypoglycaemia, a marked rise in ketone content
Table 15.6 The effects of energy intake during the last five weeks of pregnancyon the liveweight gains of ewes, lamb birthweight and colostrum production
Group Energy intake Liveweight change Birthweight of Colostrum (ml)
(MJ ME/day) of ewes (kg)a lambs (kg) in first 18 hours
High plane 13 �6.5 4.3 2054Low plane 4 �2.5 4.8 994Low/high
planeb4/13 �4 5.0 1315
aFrom 6 weeks before to immediately after parturition.bHigh plane during last 10 days of gestation.
Adapted from Mellor and Murray 1985 Research in Veterinary Science 39: 235.

Chapter 15 Feeding standards for reproduction
402
and an increase in plasma free fatty acids. In the later stages of the disease, the ani-mal may suffer metabolic acidosis and renal failure.
There does not appear to be one single cause of pregnancy toxaemia. The mainpredisposing factors are undoubtedly the high requirement of the foetus for glucoseand possibly a fall in the carbohydrate supply of the mother, which may arisethrough food shortage or through a decline in appetite in late pregnancy. One bio-chemical explanation for the disease hinges on the fact that the tricarboxylic acidcycle cannot function correctly without an adequate supply of oxalacetate, which isderived from glucose or such glucogenic substances as propionate, glycerol and cer-tain amino acids. If the oxalacetate supply is curtailed, then acetyl-CoA, which is de-rived from fats or from acetate arising through rumen fermentation, is unable toenter the cycle and so follows an alternative pathway of metabolism that culminatesin the formation of acetoacetate, β-hydroxybutyrate and acetone. In pregnancy tox-aemia, the balance between metabolites needing to enter the cycle is upset by a re-duction in glucose availability and an increase in acetyl-CoA production, the latterbeing caused by the animal having to metabolise its reserves of body fat.The clinicalsigns can thus be attributed both to hypoglycaemia and to the acidosis resulting fromhyperketonaemia.An additional factor is that increased production of cortisol by theadrenal cortex in response to stress may reduce the utilisation of glucose; this possi-bility is supported by the fact that hyperketonaemia may continue after the bloodglucose level has been restored to normal.
The disease has been treated by the injection of glucose, by feeding with sub-stances likely to increase blood glucose levels, and by hormone therapy. Only mod-erate success has been achieved, however, and there is no doubt that the control ofpregnancy toxaemia lies in the hands of the shepherd rather than the veterinary sur-geon. The condition can be prevented by ensuring an adequate food supply in latepregnancy and by using foods that supply glucose or its precursors rather thanacetate, i.e. concentrates rather than roughages.
SUMMARY
1. Nutrition can affect both the fertility and thefecundity of farm animals, through its influ-ence on age at puberty, on the production ofova and spermatozoa, and on the survival andgrowth of embryos and foetuses.
2. Cattle reach puberty at a specific skeletal sizerather than at a fixed age or weight. Pigs reachpuberty at a fixed age, and so nutrition has lit-tle effect. Well-nourished sheep reach pubertyat about 6 months of age, but poorer animalswill not reach puberty until the followingbreeding season (i.e. at 18 months of age).
3. Sheep in good or improving body conditionproduce more ova than those in poorer
condition. This observation has led to thepractice of ‘flushing’, by which the nutrition ofewes is improved for a few weeks before mating. In cattle, the demand for nutrients forlactation may interfere with reconception 2–3months after calving.
4. Deficiencies of protein, vitamins and mineralsaffect reproduction indirectly, through theireffects on the general health of animals, but afew have more specific effects on reproduc-tion. Thus, zinc deficiency in males reduces theproduction of spermatozoa, and vitamin Adeficiency causes congenital abnormalities in foetuses.

Further reading
403
QUESTIONS
15.1a For a ewe in body condition score 1.0 6 weeks before mating, what are theconsequences on liveweight and ovulation rate from increasing body condi-tion to 1.5 at mating compared with a ewe that was body condition 1.5 6 weeksbefore mating and served at 1.5?
15.1b For a ewe in body condition score 2.5 6 weeks before mating, what are theconsequences on liveweight and ovulation rate from increasing body condi-tion to 3.0 at mating compared with a ewe that was body condition 3.0 6 weeksbefore mating and served at body condition 3.0?
15.2 In cattle, what is the effect of a low plane of nutrition compared with a highplane of nutrition, on age, weight, withers height and empty body fat per cent at puberty?
15.3 For a flock of hens weighing 1.8 kg and producing 80 per cent egg output,calculate the metabolisable energy requirements.
15.4 What is the lysine requirement (mg/day) for a hen weighing 1.8 kg with an 80 per cent output, producing eggs weighing 57 g?
15.5 Explain why a high plane of nutrition during mid-pregnancy is detrimental tolamb birthweight and discuss why the nutrient demand of the developingfoetus is only of significance during the final trimester of pregnancy.
15.6 Discuss the main factors contributing to pregnancy toxaemia (twin lambdisease) in sheep, and outline dietary strategies to prevent this.
FURTHER READING
Agricultural and Food Research Council 1991 Technical Committee on Responses to Nutri-ents, report no. 4, Nutrient Requirements of Sows and Boars (see also Nutrition Abstractsand Reviews, Series B 60: 383–406).
5. Egg production in poultry imposes large requirements for nutrients, especially aminoacids and calcium, and these have been quanti-fied in the form of detailed feeding standards.
6. For mammals, net requirements for thegrowth of the foetus increase exponentiallyduring gestation and are quantitatively signifi-cant in the last one-third of this period. Nutri-ents are also required for the growth of thefoetal membranes, uterus, mammary glandsand (in some cases) the body reserves of themother.
7. The placenta has a key role in ensuring thatthe foetus receives optimal supplies of nutri-ents, but overfeeding in mid-pregnancy restricts the size of the placenta and hence
reduces birthweight. Underfeeding in latepregnancy also reduces birthweight.
8. Nutrient deficiencies in pregnancy may affecteither or both the mother and the foetus. Manyvitamin and mineral deficiencies (referred to inChapters 5 and 6) are manifested in the foetusfirst. In the ewe, pregnancy toxaemia – whichis basically a deficiency of glucose – is causedby the large demand for glucose by the foetus(often twin foetuses) and by a reduction infood intake in late gestation.
9. In horses, information regarding fertility andrequirements during pregnancy is lacking, although the general pattern of growth offoetal and non-foetal tissues appears similar tothat of cattle, sheep and pigs.

Chapter 15 Feeding standards for reproduction
404
Agricultural Research Council 1980 The Nutrient Requirements of Ruminant Livestock,Farnham Royal, Commonwealth Agricultural Bureaux.
Agricultural Research Council 1981 The Nutrient Requirements of Pigs, Farnham Royal,Commonwealth Agricultural Bureaux.
Agricultural Research Council 1984 The Nutrient Requirements of Ruminant Livestock,Supplement No. 1, Farnham Royal, Commonwealth Agricultural Bureaux.
British Society of Animal Science 2003 Nutrient Requirement Standards for Pigs, Penicuik,British Society of Animal Science.
Cromwell G L 2009 Landmark discoveries in swine nutrition in the past century. Journal ofAnimal Science 87: 778–92.
Dunn T G and Moss G E 1992 Effects of nutrient deficiencies and excesses on reproductiveefficiency of livestock. Journal of Animal Science 70: 1580.
Harris P A 1998 Developments in equine nutrition: comparing the beginning and end of thiscentury. Journal of Nutrition 128: 2698S.
Mahan D C 1990 Mineral nutrition of the sow. Journal of Animal Science 68: 573.
National Research Council 2007 Nutrient Requirements of Horses, 6th rev. edn,Washington,DC, National Academic Press.
O’Callaghan D and Boland M P 1999 Nutritional effects on ovulation, embryo developmentand the establishment of pregnancy in ruminants. Animal Science 68: 299–314.
Robinson J J, Sinclair K D and McEvoy T G 1999 Nutritional effects on foetal growth. AnimalScience 68: 315–31.
Robinson J J, Ashworth C J, Rooke J A, Mitchell L M and McEvoy T G 2006. Nutrition andfertility in ruminant livestock. Animal Feed Science and Technology 126: 259.
Rose S P 1996 Principles of Poultry Science,Wallingford, CABI.

Table 16.1 The composition of milk of farm animals (g/kg)
Fat Protein Lactose Calcium Phosphorus Magnesium
Cow 37 34 48 1.2 0.9 0.12Goat 45 33 41 1.3 1.1 0.20Ewe 74 55 48 1.6 1.3 0.17Sow 85 58 48 2.5 1.7 0.20Mare 15 23 64 1.1 0.6 0.06
405
16.1 Sources of milk constituents
16.2 Nutrient requirements of the lactating dairy cow
16.3 Nutrient requirements of the lactating dairy goat
16.4 Nutrient requirements of the lactating ewe
16.5 Nutrient requirements of the lactating sow
16.6 Nutrient requirements of the lactating mare
This chapter is concerned with the nutrient requirements for milk production, which in-volves a conversion of nutrients on a large scale and is a considerable biochemical andphysiological achievement. A high-yielding dairy cow, for example, may in a single lac-tation produce five times as much dry matter in the form of milk as is present in her ownbody. The raw materials from which the milk constituents are derived, and the energyfor the synthesis of certain of these in the mammary gland, are supplied by the food.The actual requirement for food depends upon the amount and composition of themilk being produced.
Qualitatively the milk of all species is similar in composition, although the detailedconstitution of the various fractions such as protein and fat varies from species tospecies. Table 16.1 shows the typical composition of the milk of farm animals.
The major constituent of milk is water. Dissolved in the water are a wide range of inor-ganic elements, soluble nitrogenous substances such as amino acids, creatine, urea andthe water-soluble protein albumin, lactose, enzymes, water-soluble vitamins of the B com-plex and vitamin C. In colloidal suspension in this solution are inorganic substances, mostlycompounds of calcium and phosphorus, and the protein casein. Dispersed throughout theaqueous phase is a suspension of minute milk fat globules. Triacylglycerols make up about98 per cent of the fat phase, the remainder being composed of certain fat-associated
16 Lactation

Chapter 16 Lactation
406
substances such as phospholipids, cholesterol, the fat-soluble vitamins, pigments, tracesof protein and heavy metals. The fat phase is usually referred to simply as ‘fat’ and theremaining constituents, other than water, are classified as ‘solids-not-fat’ (SNF).
16.1 SOURCES OF MILK CONSTITUENTS
All or most of the major milk constituents are synthesised in the mammary glandfrom various precursors that are selectively absorbed from the blood.The gland alsoexerts this selective filtering action on certain proteins, minerals and vitamins, whichare not elaborated by it but are simply transferred directly from the blood to the milk.
Milk proteins
About 95 per cent of the nitrogen in milk is in the form of protein, the remainderbeing present in substances such as urea, creatine, glucosamine and ammonia, whichfilter from the blood into the milk. In this respect milk functions as an alternative ex-cretory outlet to urine. The protein fraction is dominated by the caseins. In cow’smilk there are five of these, αs1-, αs2-, β-, κ- and γ-casein, which together containabout 78 per cent of the total milk nitrogen.The protein in next greatest amount isβ-lactoglobulin. The remainder of the fraction is made up of small amounts of α-lactalbumin, serum albumin and the immune globulins, pseudo-globulin andeuglobulin, all of which are absorbed directly from the blood.
Amino acids are absorbed by the mammary gland in quantities sufficient to ac-count for the protein synthesised within it. Considerable interconversion of aminoacids occurs before synthesis, and certain amino acids are important as sources ofothers. Thus, ornithine, which does not appear in milk protein, is absorbed and re-tained in large quantities by the mammary gland and has been shown to be a precur-sor of proline, glutamate and aspartate. Synthesis of the carbohydrate moieties ofthe proteins takes place in the mammary gland, as does phosphorylation of serineand threonine before their incorporation into the caseins.
Lactose
With the exception of traces of glucose, neutral and acid oligosaccharides and galac-tose, lactose is the only carbohydrate in milk. Chemically a molecule of lactose isproduced by the union of one glucose and one galactose residue in the presence ofan α-lactalbumin-dependent enzyme (see Chapter 9).The galactose is derived almostentirely from glucose, but a small part comes from glycerol.Virtually all the glucoseis derived from the blood.
Milk fat
Apart from a minor fraction associated with the fat globule membrane, milk fat con-sists of a mixture of triacylglycerols containing a wide range of saturated and unsat-urated fatty acids. The predominant saturated acid is palmitic acid and theunsaturated acids consist mainly of oleic acid with small contributions from linoleicacid and linolenic acid. The molar proportions of the fatty acids in the milk fats ofdifferent species are given in Table 16.2.
The fats are characterised by the presence of fatty acids of medium chain length(8:0 to 12:0) that are specific to the mammary gland. Ruminant milk fats are further

Table 16.3 Total fatty acid composition of bovine milk lipids
Fatty acid Weight (%) Fatty acid Weight (%)
C4:0 3.3 C16:0a 0.20
C6:0 2.3 C16:0 34.5C8:0 1.3 C16:1 1.4C10:0 2.7 C17:0 0.44C10:1 0.16 C18:0 9.8C12:0 2.9 C18:1 20.8C12:1 0.02 C18:2 1.9C14:0
a 0.04 C18:2 c-9,t-11 0.6C14:0 10.0 C18:2 t-10,c-12 0.01C14:1 0.85 C18:3 0.25C15:0 0.81 C20 0.13
aBranched chain.
Adapted from Givens D I, Kliem K E, Humphries D J, Shingfield K J and Morgan R 2009 Animal3: 1067–74.
Table 16.2 Fatty acid composition (molar proportions) of milk lipids
Fatty acid Cow Goat Sow Mare
SaturatedButanoic (C4:0) 0.031 0.013 – 0.004Hexanoic (C6:0) 0.019 0.028 – 0.009Octanoic (C8:0) 0.008 0.083 – 0.026Decanoic (C10:0) 0.020 0.129 0.002 0.055Dodecanoic (C12:0) 0.039 0.036 0.003 0.056Tetradecanoic (C14:0) 0.106 0.102 0.033 0.070Hexadecanoic (C16:0) 0.281 0.245 0.303 0.161Octadecanoic (C18:0) 0.085 0.098 0.040 0.029
UnsaturatedHexadecenoic (C16:1) – 0.009 0.099 0.075Octadecenoic (C18:1) 0.364 0.233 0.353 0.187Octadecadienoic (C18:2) 0.037 0.018 0.130 0.076Octadecatrienoic (C18:3) – – 0.025 0.161Others – 0.008 – 0.081
From Bickerstaff R 1970 Uptake and metabolism of fat in the lactating mammary gland. In:Falconer I (ed.) Lactation, London, Butterworth.
Sources of milk constituents
407
characterised by the presence of the low-molecular-weight butanoic (4:0) and hexa-noic (6:0) acids, which here form 0.05 of the total fatty acids, on a molar basis. Themilk fat of the mare also contains these acids, but the horse too is adapted for the fer-mentation of roughages with consequent production of volatile fatty acids in the gut.Table 16.3 gives a more comprehensive analysis of bovine milk fat and illustrates thewide range of fatty acids present. Over 400 fatty acids have been identified, includingthose with odd numbers of carbon atoms and those with branched chains.
The fatty acids of milk fat are derived from two sources. The first is the chylo-microns and very low-density lipoproteins of the blood.The second is synthesis from

Chapter 16 Lactation
408
acetate via the cytosolic malonyl-CoA pathway. In non-ruminant animals the acetateis produced from glucose absorbed from the blood, whereas in ruminants it is derivedfrom circulating blood acetate. Glucose also provides some of the glycerol moiety ofthe triacylglycerols, via the glycerol-3-phosphate pathway, as well as the reducedNADP� required for the cytosolic synthesis of the fatty acids.The major product ofthis pathway is palmitic acid. There is evidence that in non-ruminants this mayundergo chain elongation, but in ruminants this does not appear to be so.The 8:0 to12:0 acids are produced by premature termination of the pathway. In the non-ruminantthis is enzymatic, whereas in the ruminant it is an inherent property of the synthasesystem. Desaturation of acids takes place in both ruminant and non-ruminant mam-mary tissue, the products being 18:1 and 16:1 acids. The 4:0 and 6:0 acids are pro-duced mainly by de novo synthesis from acetate in the mammary gland. However,D-3-hydroxybutyrate can be absorbed from the blood and used as a source of butyryl-CoA, which then joins the cytosolic pathway. Ruminant mammary gland tissue isunique in being able to esterify these acids into triacylglycerols. Acids with oddnumbers of carbon atoms and those having branched chains are synthesised frompropionate via methyl malonyl coenzyme A and the synthetase system.
About half the total acids of milk fat arise from blood lipids and the rest from de novosynthesis in the mammary gland. Ultimately all the acids of milk fat originate from theproducts of digestion, but not all do so directly; some come from endogenous acetateand fatty acids after storage and mobilisation in the body, particularly in early lactation.
The part of the glycerol moiety of the fat that is not derived from glucose origi-nates in the acylglycerols of the blood.
Milk fat yield is influenced by the balance of fat synthesis and mobilisation. Thisis under hormonal control but depends upon the balance of glucogenic substances inthe products of digestion.Thus, a high proportion of propionate, glucose and aminoacids stimulates fat deposition in adipose tissue and reduces the supply of fat precur-sors to the mammary gland.
Minerals
The inorganic elements of milk may be divided conveniently into two groups.The firstis composed of the major elements calcium, phosphorus, sodium, magnesium andchlorine.The second group, the trace elements, contains some 25 elements whose pres-ence in milk has been well authenticated; these include metals such as aluminium andtin; the metalloids boron, arsenic and silicon; and the halogens fluorine, bromine andiodine. Such substances are present in very small amounts, and their presence in milkis coincidental with their presence in blood; nevertheless, they may have an importantbearing on the nutritive value of the milk and on the health and well-being of the suck-led animal.The inorganic constituents of milk are absorbed directly from the blood bythe mammary gland, which shows considerable selectivity; the gland is able to blockthe entry of some elements, such as selenium and fluorine, but allows the passage ofothers, such as zinc and molybdenum.This selectivity may be a considerable disadvan-tage when it acts against elements whose presence at increased levels in milk would bedesirable. Copper and iron, for example, are both elements important in haemoglobinformation and therefore for the nutrition of the young animal. Yet despite the factthat the levels of iron and copper in milk are never adequate, they cannot be raisedby giving increased amounts to the lactating animal, even when blood levels of theseelements are so raised. The iron content of colostrum, the milk produced in the

Sources of milk constituents
409
immediate postpartum period, may be up to 15 times that of normal milk. However,during this time, transfer of substances between blood and milk is abnormal.
Vitamins
Vitamins are not synthesised in the mammary gland and those present in milk areabsorbed from the blood. Milk has considerable vitamin A potency owing to thepresence of both vitamin A and β-carotene.The amounts of vitamins C and D pres-ent are very small, and vitamins E and K occur only as traces.There is a large rangeof B vitamins in milk, including thiamin, riboflavin, nicotinic acid, B6, pantothenicacid, biotin, folic acid, choline, B12 and inositol.
Figure 16.1 summarises the origins of the milk constituents.
Blood Mammary gland
Amino acids Amino acidsAmino acids
Casein
β-Lactoglobulin
α-Lactalbumin
Serum albuminImmune globulins
Lactose
Triacylglycerols
Minerals andvitamins
TriacylglycerolsC4:0 to C16:0
Serum albuminImmune globulins
Glucose Glucose
Galactose
Glycerol, 3- P
Monoacylglycerol
C18:0
C18:1
C18:2
C18:3
Lipid
Minerals andvitamins
Ruminant
Acetate Acetate
Non-ruminant
C18:1
C12:0 to C16:0
C18:0, C18:1, C18:2, C18:3
Glucose Glucose Acetate C10:0 to C18:0 Triacylglycerols
Lipid Lipid
Lipid Lipid C12:0 to C16:0
C18:0, C18:1, C18:2, C18:3
Butyryl-CoAβ-Hydroxybutyrate β-Hydroxybutyrate
Lipid
Fig. 16.1 Origin of the major milk constituents.

Chapter 16 Lactation
410
It will be clear from the foregoing that the mammary gland must be supplied with awide range of materials if it is to perform its function of producing milk. In order forspecific milk proteins to be synthesised, essential amino acids have to be available. Inaddition, a supply of non-essential amino acids or the raw materials for their synthesismust also be provided and non-specific milk proteins must be supplied as such.
Glucose and acetate are required for lactose and fat synthesis, and minerals andvitamins must be provided in quantities that allow the maintenance of normal levelsof these milk constituents. The substances themselves, or the raw materials fromwhich they are produced, have to be supplied either from the food or from the prod-ucts of microbial activity in the alimentary canal.
16.2 NUTRIENT REQUIREMENTS OF THE LACTATING DAIRY COW
The nutrient requirements of the dairy cow for milk production depend upon theamount of milk being produced and its composition.
Milk yield
The yield of milk is decided primarily by the breed of the cow. Generally speaking,the order of yield for the main British dairy breeds is Holstein, Friesian, Ayrshire,Guernsey and Jersey (Table 16.4).
There are, however, considerable intrabreed variations with strain and individual-ity. Thus, certain strains and individuals of a low-yielding breed may often outyieldothers of a higher-yielding breed. Old cows tend to have higher yields than youngeranimals, but the main short-term factor affecting milk yield is the stage of lactation.Yield in machine milked cows generally increases from parturition to about 35 dayspostpartum and then falls regularly at the rate of about 2–2.5 per cent per week(1.5–2.0 per cent for first-lactation animals) to the end of lactation. In individualcases, yield frequently reaches a peak earlier in lactation and the fall thereafter ismuch sharper.
As a result of these factors, the yield of milk may vary over a very wide range.Fortunately, such variations present little difficulty in assessing the nutrient require-ments of the cow, since yield is easily and conveniently measured.
When estimates of yield are necessary for the long-term planning of the feedingof the lactating cow, several useful generalisations may be made that allow predictionof yield at a given stage of lactation. Thus, peak yield may be calculated as one
Table 16.4 Milk yields of the main British breeds of dairy cows
Breed Average lactation yield (kg)
Holstein 8219Jersey 5617Ayrshire 6384Friesian 6784Guernsey 5587Shorthorn 6008All breeds 8020a
aWeighted for cow numbers.
Adapted from National Milk Records Production Annual Report 2008.

Nutrient requirements of the lactating dairy cow
411
two-hundredth of the expected lactation yield (one two-hundred and fiftieth forfirst-lactation animals) or as 1.1 times the yield recorded 2 weeks postpartum, e.g. afourth-lactation cow yielding 27 kg at this time could be expected to have a peakyield of 30 kg and have a lactation yield of 6000 kg.The assumption of a weekly rateof decline from peak yield of 2.5 per cent per week is useful in predicting milk yieldand also in monitoring deviations from normality during the progress of lactation.Such estimates are relatively imprecise, and attempts to increase accuracy have re-sulted in highly sophisticated mathematical descriptions of the changes in yield withlactation.
In 1976,Wood (see Further reading) suggested that the yield of milk on any daypostpartum (y) may be calculated using equations of the following type:
where n � week of location, a � a positive scalar directly related to total milk pro-duction, b � an index of the animal’s capacity to utilise energy for milk production, andc � a decay rate.
Values for a, b and c may be obtained from lactation yield data by a least-squaresprocedure.The constants for yield groups may then be used to predict week of peakyield (b/c) and daily yield in a given week of lactation.Typical figures for a cow withan expected lactation yield of 5500 kg would be:
a � 26.69b � 0.03996c � 0.00942
Week of peak yield would then be 4.24 (0.03996�0.00942) and predicted maxi-mum daily yield 27.17 kg.
The Wood equation has been criticised in that it predicts zero yield at parturition,which, in the light of the development of the secretory potential of the mammarygland at parturition, is obviously not so.A number of alternatives have been put for-ward. Most have been more complex and have proved to give less satisfactory per-formance.That of Emmans and Fisher 1986
marginally outperforms the Wood equation, the proportion of variation explained(R2) being 0.84 compared with 0.82, and dispersion around the regression line(residual standard deviation) being 1.74 compared with 1.86. In addition, it does notpredict zero yield at parturition and is more easily interpretable in biological terms.It does so, however, at the expense of increased complexity and the introduction ofan extra term.
The Agricultural and Food Research Council in 1993 proposed the use of theMorant equation (1989):
where b, c and k � constants varying with parity and lactation yield, a � the natu-ral log of the expected yield at day 150 of lactation, t � days since calving, andtl � (t - 150)�100.
Y(kg/day) = exp[a - btl (1 + ktl) + ctl2+ d>t]
dY/dt = a{exp[-exp(G0 - bt)]}[exp(-ct)]
y(n) = anbe- cn

Chapter 16 Lactation
412
Figure 16.2 shows constructed yield curves for the lactation of a cow yielding about7000 kg of milk in 48 weeks.
Milk composition
The composition of milk varies with a number of non-nutritional factors. Milkingtechnique may have a profound effect on fat content and thus on total solids content,since incomplete milking may leave a considerable volume of fat-rich milk in theudder. Unequal intervals between milkings may reduce yield and fat content when asingle interval exceeds 16 hours, especially with high-yielding cows. Diseases, par-ticularly mastitis, may reduce the yield and compositional quality of milk; lactoseand potassium contents are lowered and those of sodium and chloride raised.Changes in fat content are erratic, but crude protein shows little change. The netresult, depending upon the severity of the infection, is a reduction in solids-not-fatand total solids content.
In a well-managed herd, none of these factors should be of any importance. Cer-tain variations in composition have to be accepted, however, since they are in-evitable in a given herd.The factors responsible for these variations are breed, strain,individuality, age of cow and stage of lactation.
Effect of breed, strain within the breed and individuality on milk composition
There is a definite breed order in relation to milk quality, which is the reverse of thatfor milk yield. From Table 16.5 it can be seen that the Jersey produces the highest-quality milk and the high-yielding Holstein gives the lowest-quality product.
Typical values for the lactose, ash and major mineral content of different breedsis given in Table 16.6. Strain and individuality of the cows have an important effecton milk composition, and many Holstein cows may average more than 40 g fat/kgand 33 g protein/kg over a lactation, whereas some Channel Island cows may notmatch these figures. Typical ranges in composition within four breeds are given inTable 16.7.
30
20
10
028 56 84 112 140 168 196 224 252 280 308
MorantWoodEmmans
Lactation stage (days)
Yie
ld (
kg/d
ay)
Fig. 16.2 Yield prediction curves for lactation yield of about 7000 kg.

Table 16.7 Within-breed variation in the composition of cow’s milk (g/kg)a
Constituent (g/kg) Ayrshire Friesian Guernsey Shorthorn
Fat 35.7–38.7 33.2–37.2 43.1–49.0 33.7–38.1SNF 86.5–89.4 84.0–87.5 88.2–93.0 85.7–89.0Protein 33.0–34.7 32.0–34.4 33.9–37.3 31.6–34.2Lactose 43.7–46.8 43.0–46.0 45.7–47.3 43.8–45.9
aAnnual averages for individual herds.
Adapted from Rook J A F 1961 Dairy Science Abstracts 23: 251.
Table 16.6 Average values for the detailed composition of the milk of fourBritish dairy breeds
Constituent (g/kg) Ayrshire Friesian Guernsey Shorthorn
Lactose 45.7 44.6 46.2 45.1Ash 7.0 7.5 7.7 7.6Calcium 1.16 1.13 1.30 1.21Phosphorus 0.93 0.90 1.02 0.96
Adapted from Rook J A F 1961 Dairy Science Abstracts 23: 251.
Nutrient requirements of the lactating dairy cow
413
Effect of age on milk composition
As the age of the cow increases, so the quality of the milk produced becomes poorer.This is shown for Ayrshire cows in Table 16.8.
The regression of SNF content on age is linear and the decrease occurs almostequally in lactose and protein. Fat content, on the other hand, is relatively constantfor the first four lactations and then decreases gradually with age. Studies on com-mercial herds indicate that over the first five lactations there is a linear decline infat and SNF contents of about 2 g/kg and 4 g/kg, respectively. The age frequencydistribution of a herd may profoundly affect the composition of the mixed herdmilk.
Table 16.5 Average values for the fat and protein contents ofthe milk of the main British breeds of dairy cows
Breed Fat (g/kg) Protein (g/kg)
Holstein 39.1 32.2Jersey 52.9 38.4Ayrshire 40.5 33.3Friesian 40.7 33.5Guernsey 46.8 35.5Shorthorn 37.8 32.8All breeds 40.7a 32.9a
aWeighted for cow numbers.
Adapted from National Milk Records Production Annual Report 2008.

Chapter 16 Lactation
414
Effect of stage of lactation on milk composition
Advancing lactation has a marked effect on the composition of milk, which is ofpoorest quality during that period when yield is at its highest. Both fat and SNF con-tents are low at this time and then improve gradually until the last 3 months of thelactation, when the improvement is more rapid.The changes are shown for Ayrshirecows in Fig. 16.3.
Solids-not-fat content fell during the first 7 weeks of lactation, being the resultantof the fall in crude protein content from day 15 to day 45 (2.8 g/kg) and the rise inlactose content (0.4 g/kg) that took place during this period. Subsequently, the risein protein content outweighed the fall in lactose content and the SNF content rose tothe end of lactation. Fat content fell sharply in early lactation when yield was risingrapidly and then continued to fall more slowly, until day 75 of lactation.Thereafter,fat content rose slowly until day 195, after which the rise was much faster.
Assessment of milk composition is a more difficult task than assessment of milkyield, since there are five main variables to consider. Modern analytical methodsallow for routine milk analysis on a large scale, and values for fat, lactose and proteincontents of herd bulk milks are now readily available.When analytical results are notavailable, assumptions are often made concerning the quantitative relationships be-tween constituents, which allow composition to be predicted from the content of asingle, easily determined constituent, usually fat.
Energy requirements
Energy requirements for lactation involve an estimate of the gross energy value (EVl)of the milk, which may be used along with the yield to estimate the net energyrequirement for milk production.
The energy value of milk
Determination of the gross energy of milk involves either bomb calorimetry or a de-tailed chemical analysis; the amounts of fat, lactose and protein are then multipliedby their energy values and the products summed, as illustrated in Table 16.9.
Table 16.8 Effect of age of cow on the composition of milk (g/kg)
Lactation Fat Solids-not-fat Crude protein Lactose
1 41.1 90.1 33.6 47.22 40.6 89.2 33.5 46.23 40.3 88.2 32.8 45.94 40.2 88.4 33.0 45.75 39.0 87.2 32.6 45.36 39.1 87.4 33.0 44.87 39.4 86.7 32.5 44.88 38.2 86.5 32.3 44.49 40.3 87.0 32.7 44.8
10 38.3 86.6 32.5 44.611 37.7 86.1 31.6 44.6
After Waite R et al. 1956 Journal of Dairy Research 23: 65.

Nutrient requirements of the lactating dairy cow
415
+4
+2
0
0
0
0
–2
+6
+4
+2
–2
–4
+2
–2
–4
+4
+2
+2
15 45 75 105
Stage of lactation (days)
Solids-not-fat
Lactose
Crude protein
Fatg/kg
g/kg
g/kg
g/kg
135 165 195 225 255 285
Fig. 16.3 Effect of lactation on the composition of the milk of the dairy cow.
After Waite R et al. 1956 Journal of Dairy Research 23: 65.
Table 16.9 Calculation of the gross energy value of milk
Constituent Content (g/kg) Gross energy (MJ/kg) Gross energy (MJ/kg milk)
Fat 40 38.12 1.52Protein 34 24.52 0.83Carbohydrate 47 16.54 0.78Milk 3.13
The following equation based on the fat content of the milk can be used to calcu-late the energy content:
in which F is fat content (g/kg). The equation has a standard error of estimate of0.089 MJ/kg.
EVl(MJ/kg) = 1.509 + 0.0406F

Chapter 16 Lactation
416
More accurate assessments may be obtained by including protein (P) or proteinand lactose (L) (both g/kg) in the prediction equation:
The standard error of estimate is thus reduced to 0.066 and 0.035, respectively.When compositional data are not available, the energy values shown in Table 16.10,
based on breed average fat and SNF values, may be used, but with considerablereservations.
The net requirement for energy for milk production is the product of the energyvalue and the yield. The next step in the factorial estimate is the calculation of theamount of food energy required to provide the estimated net requirement. For this,the efficiency of utilisation of food energy for milk production must be known.
Efficiency of utilisation of food energy for milk production
From the calorimetric work of Forbes, Fries and Kellner, an efficiency of utilisationof metabolisable energy for milk production (kl) of about 0.70 is indicated. Morerecent estimates of kl have varied widely from 0.50 to 0.81, but the majority clusteraround 0.60–0.65. There is considerable evidence that much of the variation is dueto differences in the energy concentration of the diet.Van Es has suggested that theefficiency of utilisation of metabolisable energy for milk production is related tothe metabolisability (qm) of the diet, defined as the ME (MJ/kg DM) at the mainte-nance level as a proportion of the gross energy (MJ/kg DM). His implied relation-ships for (a) Dutch and (b) American data are:
(a)
(b)
where kl is the efficiency of utilisation of ME for milk production at zero weightchange. More recently,AFRC (1993) has suggested that kl is best calculated as follows:
It has become common in deriving energy allowances to assume that the gross en-ergy of the dry matter of all foods is constant at 18.4 MJ/kg and to transform this re-lationship to give:
kl = 0.019 M/D + 0.42
kl = 0.35qm + 0.42
kl = 0.466 + 0.28qm
kl = 0.385 + 0.38qm
EVl(MJ/kg) = 0.0384F + 0.0223P + 0.0199L - 0.108
EVl (MJ/kg) = 0.0376F + 0.0209P + 0.948
Table 16.10 Energy values of the milks of the mainBritish breeds of dairy cows
Breed Energy value (MJ/kg)
Holstein 3.09Jersey 3.74Ayrshire 3.17Friesian 3.18Shorthorn 3.05SCM 3.12a
aSolids corrected milk with 40 g fat/kg and 32 g protein/kg.

Nutrient requirements of the lactating dairy cow
417
allowing kl to be calculated from the energy concentration of the diet. For certainfoods, such as silage and high-fat dairy compounds, which frequently comprise amajor part of the diets of lactating cows, the assumption is not valid and the equa-tion based on metabolisability should be used. In such cases, estimates of the grossenergy of the foods are needed, since routine bomb calorimetry is not feasible.Values calculated from the proximate composition are an acceptable alternative:
in which CP, EE, CF and NFE are stated as g/kg.When neither calorimetric nor com-positional data are available, silages should be allocated a gross energy of 19.2 MJ/kgDM, high-oil compound foods a value of 19.4 MJ/kg DM and all other foods a valueof 18.4 MJ/kg DM. Efficiency of utilisation of ME for milk production will vary from0.61 to 0.67 for diets with qm 0.55 to 0.70. The range of energy concentrations en-countered with diets for milk production is narrow and it is widely held that a singlefactor could be adopted without causing significant error; 0.62 is widely used.
The efficiency of utilisation of metabolisable energy is influenced by the level ofprotein in the diet.When protein content is inadequate, body tissues are catabolisedto make good the deficiency, a process that is wasteful of energy.When protein con-tent is too high, excess amino acids are used as a source of energy. Since protein isused relatively inefficiently for this purpose, the overall efficiency of utilisation ofmetabolisable energy is reduced.
There is some evidence (Fig. 16.4) that the efficiency of utilisation of metabolis-able energy for milk production is influenced by the proportion of acetate in thefatty acids produced during rumen fermentation.
GE (MJ/kg) = 0.0226CP + 0.0407EE + 0.0192CF + 0.0177NFE
0.30 0.40 0.50 0.60 0.70 0.80 0.90
0.40
0.50
0.60
0.70
0.80
0.90
Effi
cien
cy o
f u
tilis
atio
n o
f M
E
Molar proportion of aceticacid in the volatile fatty acids
of rumen liquor
Fig. 16.4 Energetic efficiency of lactation.
After Blaxter K L 1967 The Energy Metabolism of Ruminants, London, Hutchinson, p. 259.

Chapter 16 Lactation
418
It would appear that when the proportion of acetate is below 0.50, the cow is un-able to synthesise sufficient of the lower- and medium-chain fatty acids that form alarge part of milk fat; when the proportion of acetate in the total fatty acid produc-tion is greater than 0.65, efficiency is lowered owing to a shortage of propionate.Thismay limit the extent of gluconeogenesis from propionate, and gluconeogenic aminoacids may be catabolised to make good the deficit. Gluconeogenesis from aminoacids is a less efficient process and overall efficiency will be reduced. In addition,such catabolism may result in a shortage of amino acids for protein synthesis. Theefficiency of utilisation of acetate depends on a supply of NADH, which in turndepends on a supply of glucose, which may be insufficient if gluconeogenesis isreduced.
There is other evidence that milk energy output is decreased when acetate formsless than 0.5–0.55 and propionate more than 0.35–0.45 of the rumen volatile fattyacids. This is thought to be the result of a reorientation of metabolism towards in-creased lipogenesis in adipose tissue and decreased lipogenesis in the mammary gland.
The inclusion of correction factors to allow for the effects of protein level andvolatile fatty acid patterns on kl is not justifiable, since the effects cannot be adequatelyquantified.At the same time,protein provides such a small proportion of the energy de-mand that any correction would be almost negligible.The effect of changes in the pro-portions of the volatile fatty acids within the normal range would be small and wouldin any case be partly taken into account by its association with energy concentration.
The requirement for metabolisable energy for milk production (Ml) may thus becalculated as:
The ME requirements of a cow producing milk having 40 g/kg fat, 34 g/kg proteinand 48 g/kg lactose, and receiving a diet with qm � 0.60, would be 5.0 MJ/kg.
Liveweight change in lactation
Lactating cows are usually gaining or losing body weight.A cow losing weight wouldbe making reserves of energy available to maintain her level of milk production. Ifon the other hand she was gaining weight, some of the production ration would bediverted from milk production for this purpose.
Values quoted in the literature for the energy value of liveweight gain in dairy cowsvary from 19 MJ/kg to 30 MJ/kg and appear to be related to body condition. In theCornell net protein and carbohydrate system and that of the National ResearchCouncil (2001), the energy value of liveweight change is linearly related to body con-dition score and liveweight, i.e. at high body condition scores, liveweight change has ahigher fat content and therefore a higher energy value; at low body condition scores,there is a lower fat content with a correspondingly lower energy content. In Australia alinear relationship with body condition score is used to predict the energy value ofliveweight gain. Stage of lactation can also affect the energy value of liveweight change.The ratio of protein to fat in mobilised body tissue falls for about the first 8 weeks of lac-tation and, as a result, the energy value of the tissue may be expected to increase.
AFRC (1993) postulated a value of 19 MJ/kg of liveweight change. This is verymuch lower than the value of 26 MJ/kg assumed earlier, and lower too than themean value of about 6 Mcal (25 MJ)/kg quoted in 2001 by the US National ResearchCouncil. The validity of a fixed value for the energy of body tissue is extremely
Ml(MJ/kg) = EVl>(0.35qm + 0.42)

Nutrient requirements of the lactating dairy cow
419
doubtful but, for purposes of illustration, a preferred value of 25 MJ/kg has been as-sumed in the following treatment.
There is general agreement that the efficiency with which metabolisable energy isused for tissue deposition (kg) in the lactating cow is higher than in the non-lactatinganimal.Values for kg of up to 0.84 have been quoted, but the majority of publishedwork suggests that kg is very similar to, but slightly lower than, kl. For this reason,the suggestion that kg � 0.95kl seems appropriate. Thus, for a cow gaining weight,each kilogram gained means that MJ of dietary metabolisable energyis unavailable for milk production, or that this amount of dietary metabolisable en-ergy must be supplied in addition to that required for maintenance and milk produc-tion. In net energy terms, each kilogram of weight gain may be regarded as adding
to the lactation demand.An estimate of the efficiency of utilisation of mobilised body tissue energy for lac-
tation gave a mean of 0.74, with a range of 0.72–0.75. This is much lower than thefigure of 0.84 used by AFRC (1993). If we accept the AFRC values, then, for eachkilogram of body tissue mobilised, 25 � 0.84 � 21 MJ of energy is secreted as milk.This is equivalent to an additional 33.9 (21�0.62) MJ of dietary metabolisable energyfor lactation, assuming a kl of 0.62.
The use in the future of a variable energy value of liveweight change and perhapsa lower efficiency of utilisation must be given very serious consideration.
Energy requirements for maintenance
As well as the production of milk, the diet of the lactating cow must provide theenergy for maintenance.This may be calculated as follows:
The activity allowance of 0.0091W applies to cows living indoors under normalloose housing conditions. It is based on certain assumptions of time spent standing,number of positional changes and distance walked and is valid only in situations inwhich these assumptions hold true (see Chapter 14). Available evidence indicatesthat under such conditions a cow spends about 14 hours standing, stands up and liesdown nine times and walks about 500 m, during a normal day’s activity.The coeffi-cient may then be calculated as shown in Box 16.1.
The subject of activity increments is dealt with more comprehensively inChapter 14.
Efficiency of utilisation of dietary metabolisable energy for maintenance (km) maybe calculated as follows:
km = 0.35qm + 0.503
Em (MJ/day) = 0.53 (W/1.08)0.67+ 0.0091W
25>0.95 = 26.3 MJ
25>(0.95 * kl)
BOX 16.1 AFRC (1993) energy costs of physical activity for dairy cows
Activity Energy cost Energy expended (MJ/kg/day)
Standing (14 hours) 10 kJ/kg/day 0.0058Positional changes (9) 0.26 kJ/kg 0.0023Walking (500 m/day) 2.0 J/kg/m 0.0010Total 0.0091

Chapter 16 Lactation
420
and the requirement for metabolisable energy for maintenance as:
There is some evidence that modern dairy cows have a higher maintenance re-quirement than that indicated by the above formula, probably owing to their greatergenetic merit. Such animals have a greater proportion of body protein mass, andthere is increasing evidence that the basal metabolic rate – and hence maintenancerequirement – is dependent upon lean body mass rather than total liveweight. Inaddition, the increased intake and metabolism of nutrients needed to satisfy thedemands of increased productivity may stimulate cardiac output, blood flow andoxygen consumption. Maintenance energy requirement has been shown to vary withthe proportion of fibre in the diet, owing to the increased work of rumination anddigestion, and an increased metabolic activity in the organs of the body.
In calculating the energy requirements of the dairy cow, cognisance must be takenof the decline in the efficiency of utilisation of metabolisable energy with increasinglevel of energy intake. In order to do this, the calculated requirement has to be in-creased accordingly. The procedure, which involves the use of a correction factor, isbest illustrated by an example, as shown in Box 16.2.
Mm(MJ/day) = [0.53(W>1.08)0.67+ 0.0091W]>(0.35qm + 0.503)
BOX 16.2 AFRC (1993) calculation of the metabolisable energy requirement of a 600 kgcow producing 30 kg/day of milk containing 40 g fat/kg and losing 0.4 kgliveweight/day on a diet having a qm of 0.6
ME for maintenance
ME for lactation
NE supplied by tissue mobilisation
Total ME requirement
Mmp = (135.9 + 59.0) * 1.0415 = 202.9 MJ/day
Correction factor for level of feeding (1 + 0.018Mp>Mm) = 1.0415
Mp = (94.0 - 8.40)>0.63 = 135.9 MJ/day
Mm = 42.04>0.713 = 59.0 MJ/day
Net energy spared by weight loss (10.0 * 0.84) = 8.4 MJ/day
Eg = -0.4 * 25 = 10.0 MJ/day
Ml = 93.99>0.63 = 149.2 MJ/day
kl = 0.35 * 0.61 + 0.42 = 0.630
El = 30(1.509 + 0.0406 * 40) = 94.0 MJ/day
km = 0.35 * 0.61 + 0.503 = 0.713
Em = 0.53 * (600>1.08)0.67+ 0.0091 * 600 = 42.0 MJ/day
Nutrient requirements of the lactating dairy cow
421
It is common to use a safety margin in calculating allowances in an attempt to min-imise the risks of underfeeding. A frequently used figure is 5 per cent, which wouldthen give a revised figure of 213 MJ/day for the requirement of the cow in this calcu-lation. There is evidence that the 5 per cent figure is inappropriate and that a safetymargin closer to 15 per cent would be required to ensure that only 10 per centof cows would be underfed. The high degree of variability implicit in the largesafety margins is due partly to imperfect information on the parameters of the predic-tion model and also to the heterogeneity of the subject population. A safety marginhas not been used in the box or in calculating the allowances given in the tables ofAppendix 2.
Feed into Milk energy requirements
The metabolisable energy system used by AFRC (1993) adopts a factorial approachto energy requirements, whereby total requirements are calculated as the sum of thatfor maintenance, milk production, liveweight change and foetal requirements. Morerecently, Feed into Milk (FiM) has been developed in the UK for dairy cow rationing.This system adopts a fundamentally different approach to calculating ME require-ments for higher genetic merit dairy cows by modelling the relationship between MEintake with requirements (see Chapter 12).
The ME required for weight gain (MgFiM) is calculated from the net energy re-
quirement for gain (EVg) by an equation similar to that of ARC (1980) as follows:
The net energy for milk production derived from weight loss (ElWC) is calculated asfollows:
A fixed value of 19.3 MJ/kg is assumed for the EVg, the same as that used by AFRC(1993). The use of a fixed value does not, however, reflect changes in the energy con-tent of the liveweight change at different body fat levels as used in a number of otherrationing systems.A fixed value for kg of 0.65 and kt of 0.78 is also used.This differsfrom AFRC (1993) by not changing as the quality of the diet (or metabolisability)changes and is a reflection of the relatively narrow range in the ME content of the ma-jority of diets fed to modern dairy cows. A lactating dairy cow gaining 1 kg/day wouldtherefore have an additional ME requirement of � 29.7 MJ/day.
One of the major differences between AFRC (1993) and FiM (2004) is the calcu-lation of a combined metabolisable energy requirements for maintenance, lactation,liveweight loss and a proportion of activity (Mml : MJ/kg W0.75) fitted using theMitscherlich relationship:
Elcorr is milk energy yield (MJ/kg W0.75), which is corrected for liveweight loss:
where W0.75 is metabolic liveweight, and El is the energy content of the milk output,calculated as the product of milk yield (Y, kg/day) and the energy value of the milk(EVl). Surprisingly, FiM predicts EVl from only the fat content of milk, despite themore accurate relationship obtained when milk protein content is included, anddespite the fact that both milk fat and protein are routinely analysed.
Elcorr = (El + ElWC)>W0.75
Mml = {loge[(5.06 - Elcorr)>(5.06 + 0.453)]}>-0.1326
(19.3 * 1)>0.65
ElWC = EVg * weight loss * kt
Mg
FiM= (EVg * weight gain)/kg

Chapter 16 Lactation
422
Because a proportion of the activity allowance (Mact) is included within Mml,the activity allowance within FiM reflects only the vertical movement allowance,calculated as where km is as defined by AFRC (1993). For a600 kg dairy cow yielding 30 kg/day and eating a diet with a qm of 0.6, theactivity allowance equates to only 1.1 MJ ME required per day, or less than0.5 per cent of daily ME requirements. The ME requirements for pregnancy (Mc)post 250 days are the same as that described by AFRC (1993) and are only of im-portance during the last several weeks of pregnancy. An initial evaluation of FiMsuggested that it slightly overpredicted the ME requirements of dairy cows. Con-sequently, it is recommended that 10 MJ per day is subtracted from the calcu-lated ME requirement.
The FiM total ME requirement (MreqFiM) is therefore defined as follows:
An analysis of studies where the digestibility was determined in both sheep atmaintenance and cattle fed at up to 4.8 maintenance revealed no clear effect of levelof feeding on the ME content of the diet, nor between species.Whilst FiM does cor-rect for level of feeding, a fixed increase in ME requirements of 0.02 ME is made,irrespective of feeding level.This is illustrated in Box 16.3.
Mreq
FiM= [(Mml * W0.75) + Mg
FiM + Mact + Mc] - 10
0.0013 * W(kg)/km,
BOX 16.3 FiM calculation of the metabolisable energy requirement of a 600 kg cowproducing 30 kg/day of milk containing 40 g fat/kg and losing 0.4 kgliveweight/day on a diet having a qm value of 0.6
ME for maintenance and production
ME for activity
Correction for level of feeding
Total ME requirement
Mreq
FiM= (219 + 1.1 - 10) * 1.02 = 214 MJ/day
Correction factor = 1 + 0.02 = 1.02
A = (0.0013 * 600)>0.71 = 1.10
km = 0.35 * 0.6 + 0.503 = 0.71
Mml = 1.78 * 121.2 = 219 MJ/day
Mml = loge[(5.06 - 0.726)>(5.06 + 0.453)]>-0.1326 = 1.81 MJ/kg W0.75
Elcorr = (94.0 - 6.0)>121.2 = 0.726 MJ/kg W0.75
W0.75= 6000.75
= 121.2 kg
Elwc = 19.3 * (-0.4) * 0.78 = -6.0 MJ/day
El = 30 * (1.509 + 0.0406 * 40) = 94.0 MJ/day

Nutrient requirements of the lactating dairy cow
423
10
20
30
40
0 50 100 150 200
Body weig
ht loss
Body weig
ht gain
Yie
ld o
f so
lids-
corr
ecte
d m
ilk (
kg/d
ay)
Intake of ME above maintenance (kj/day)
Fig. 16.5 The effect of intake of metabolisable energy (ME) on milk output andbody weight change.
Adapted from Broster W and Thomas C 1981 In: Haresign W (ed.) Recent Advances in Animal Nutrition,London, Butterworth, pp. 49–69.
The total ME calculated in Box 16.3 of 214 MJ/day is similar to the 213 MJ/day(5 per cent allowance) calculated by AFRC (1993) for the same production level(see Box 16.2).
Responses to increments of dietary energy
In experiments in which responses to the additions of energy to the diet have beenmeasured in terms of milk yield, it has been found that only part of the theoreticallyexpected increase in yield has been obtained. The discrepancy is the result of twofactors:
■ Additions of concentrate foods to the diet bring about concomitant decreases inthe roughage component, so that the increase in energy intake is less than isadded in the supplement. The replacement (or substitution) rate, defined aschange in forage intake per unit change in supplement intake, is greater for high-quality forages and at high intakes of supplement. In certain cases it may ap-proach unity and the increase in the intake of dietary energy resulting fromsupplementation may be very small.
■ Energy consumed by the lactating animal over and above that required for main-tenance is partitioned between milk production and body gain. Response to sup-plements of energy added to the diet is negatively curvilinear in the case of milkyield and positively curvilinear in the case of liveweight gain (Fig. 16.5).

Chapter 16 Lactation
424
Thus, an increase in energy intake will result in an increase in milk yield togetherwith a reduction in liveweight loss or an increase in liveweight gain. When thesechanges are considered along with the true increments of dietary energy, thenresponses approach the theoretical.
The ability of cows to divert part of their production ration for the growth oftheir own tissues, or alternatively to supplement the energy available for milkproduction by the breakdown of these tissues, varies considerably from one indi-vidual to another; cows of high yielding capacity use a higher proportion of aproduction ration for milk than those of lower potential. Within individuals thetendency is for the proportion of the energy of the increment that is used for milkproduction to decrease as the production ration is increased; in other words, theinput of energy required per kilogram increases as the milk yield of the cowincreases. Partitioning will also be influenced by the nature of the products ofrumen fermentation, particularly the relative proportions of the volatile fatty acids,as discussed above.
Response, in terms of milk yield, to the addition of concentrate foods to a fixed ra-tion is directly proportional to potential or current milk yield.This is well illustratedby the work of Blaxter, who allocated energy in excess of the level dictated by earlierstandards to cows of different yield groups. He showed that the response ranged from0.016 kg milk/MJ ME at a yield of 10 kg/day to 0.172 kg at 25 kg.A typical responseto an increment of energy under such conditions would be 0.14 kg milk/MJ changein metabolisable energy intake (MEI), with responses of 0.003 kg/MJ and 0.01 kg/MJMEI for yields of fat and solids-not-fat, respectively.
The major determinant of total lactation yield is peak yield, whether this isachieved as a result of cow potential or feeding practice. Furthermore, responses toincrements of energy decline as lactation progresses, and with low and mediumplanes of nutrition, elevation of energy intake in early lactation results in a 55 percent residual effect in later lactation. Theoretically, therefore, allocation of high lev-els of concentrate supplements to early lactation in order to ensure maximum peakyield should result in higher lactation yields. Experimental evidence does not en-tirely support this expectation, since enhanced persistency may counterbalance alow peak yield. Therefore, feeding systems that provide the same daily quantity ofconcentrates throughout lactation (e.g. flat rate feeding) have been shown to result ina similar milk yield to those that allocate a greater proportion in early lactation (e.g.feeding to yield or peak feeding).
For animals of high potential, it is very difficult to maintain generous levels offeeding in early lactation when intake of dry matter is low. Such animals must beprovided with high-energy concentrate foods and the finest-quality roughages ifgenerous levels of feeding are to be achieved.A major problem at this time is to en-sure that the ration does not cause rumen disorders and result in loss of appetiteand the production of low-fat milk. The proportion of roughage should thereforenot be allowed to fall below 35 per cent of the diet.Weight lost at this time needs tobe replaced before the next lactation, and this is usually achieved during late lacta-tion and the dry period. In the light of the evidence of the high efficiency of utilisa-tion of energy for body gain in the lactating cow, it may be that the most effectivemethod of replacing lost tissue is by deliberate feeding in excess of requirementduring late lactation to achieve a target energy reserve before drying off. In practice,body condition scoring, a visual measure of the fat reserves around the tail headand loin region of dairy cows, has been shown to closely relate to total body fat

Nutrient requirements of the lactating dairy cow
425
reserves. Body condition scores range from 1 (thin) to 5 (fat), with a target value of3.0 at drying off.
Protein requirements
In the ruminant animal, dietary protein performs two functions:
■ It must satisfy the nitrogen demands of the rumen microorganisms.■ It must supply the truly absorbable true protein required to satisfy the demand for
amino acid nitrogen at tissue level.
Metabolisable protein requirement
The metabolisable protein requirement may be defined as the quantity of truly ab-sorbable true protein required to satisfy the demand for amino acid nitrogen at tissuelevel.The net protein demand at tissue level is made up of the following:
■ A maintenance component, which may be calculated as 2.19 g/kg W0.75 per day.■ A dermal component resulting from the loss of hair and scurf, which may be cal-
culated as 0.1125 g/kg W0.75 per day.■ A milk component calculated as milk crude protein � 0.95 g/kg milk produced.
The factor of 0.95 is used because the non-protein nitrogen fraction of the milk,5 per cent of the total nitrogen, is regarded as excretory material that has alreadybeen used by the body and has therefore formed part of a previously satisfieddemand.When valid figures for protein content are not available, it may be calcu-lated from fat content (F) using regression equations such as that of Gaines andOverman:
Alternatively, the protein contents of the milks of the main British breeds of dairycows given in Table 16.5 may be used.
■ A component reflecting liveweight change (ΔW). Body tissue is assumed to con-tain 150 g protein per kilogram of empty body weight. Using a transformationfactor of 1.09, this becomes per kilogram of liveweight.
In order to calculate the quantities of metabolisable protein required to satisfythese net requirements, factors for the efficiency of utilisation of metabolisableprotein for maintenance, dermal losses, lactation and growth and the conversion ofmobilised body protein to milk protein are required. The following are recom-mended by AFRC (1993):
Maintenance � 1.0Dermal � 1.0Growth � 0.59Lactation � 0.68
Amino acids arising from the mobilisation of body protein are utilised with thesame efficiency as absorbed amino acids, and liveweight loss has a sparing action onmetabolisable protein requirement equal to its protein content, i.e. 138 g/kg.An ex-ample of the calculation of the metabolisable protein requirement of a lactating cowis given in Box 16.4.
150>1.09 = 138 g
Protein (g/kg) = 21.7 + 0.31F (g/kg)

Chapter 16 Lactation
426
BOX16.4 AFRC (1993) calculation of the metabolisable protein requirement of a 600 kgcow producing 30 kg/day of milk containing 32 g CP/kg, and losing0.4 kgW/day
Effective rumen-degradable protein requirement
The protein requirements of the rumen microorganisms are stated by AFRC (1993)in terms of effective rumen-degradable protein (ERDP). The requirement for ERDPmay be calculated relative to the dietary intake of fermentable metabolisable energy(FME) and is defined as follows:
where y is the requirement of ERDP (g/MJ of FME) and varies with level ofproduction.
The suggested values of y for different levels of animal performance are:
■ Animals at the maintenance level (M): y � 9.■ Low-yielding dairy cows (< 15 kg/day), beef cattle and sheep fed at less than
twice maintenance: y � 10.■ Ewes in late pregnancy or lactation and lactating dairy cows: y � 11.
Alternatively, y may be calculated using the following equation:
where L is the level of feeding relative to maintenance.This equation is a mathematical convenience that smoothes the relationship be-
tween y and L and thus avoids boundary problems. It is not based on experimentaldata.
Microbial protein contributes to satisfying the demand for metabolisable protein,but in the majority of cases, particularly at high levels of production, it cannot com-pletely satisfy the demand. The deficit has to be made good by the truly digestibleundegradable true protein (DUP) of the diet.
Microbial crude protein (FME � 11 for high-yielding dairy cows) is assumed tocontain 75 per cent of true protein (amino acids) and to have a true digestibility of0.85.The contribution of microbial protein (MCP) to metabolisable protein (MP) isthen MCP � 0.75 � 0.85, or 0.6375 MCP.The requirement for truly digestible un-degraded protein is then MP - 0.6375 MCP. An example of the calculation of theprotein requirements of a dairy cow using an assumed figure for FME is given inBox 16.5.
y = 7 + 6(1 - e-0.35L)
ERDP (g/day) = FME (MJ/day) * y
Net protein
requirement (g/day)
Maintenance 2.19 � 6000.75 1.00 265.5Dermal loss 0.1125 � 6000.75 1.00 13.6Milk 32 � 0.95 � 30 0.68 1341.2Weight loss -0.4 � 138 1.00 �55.2Metabolisable protein (265.5 � 13.6 � 1341.2 � 55.2) 1565.1
Efficiency
factor
Metabolisable protein
requirement (g/day)

Nutrient requirements of the lactating dairy cow
427
BOX 16.5 AFRC (1993) calculation of the protein requirements of a 600 kg cowproducing 30 kg of milk containing 32 g CP/kg, and losing 0.4 kg W/day
Metabolisable energy requirement (MJ/day) � 202Fermentable metabolisable energy of ration (MJ) � 175ERDP requirement (175 � 11) (g/day) � 1925Metabolisable protein requirement (g/day) � 1565Microbial protein contribution (1925 � 0.6375) (g/day) � 1227DUP requirement (1565 � 1227) (g/day) � 338
It is usual to use a safety margin of 5 per cent in converting requirements of pro-tein to allowances, but this is not suggested in this system. If safety margins are to beused, then they should be applied to the calculated requirement for ERDP and MP.However, in calculating the DUP allowance, the uncorrected ERDP should be usedto calculate truly digestible microbial true protein.
The application of the system to the evaluation of a ration as a protein source isstraightforward.The MP, ERDP, DUP and FME contents of a ration are easily calcu-lated from those of the constituents.The latter allows calculation of the requirementfor ERDP, which may then be compared with that supplied by the ration. IfERDP/FME is equal to or greater than 11 (i.e. energy is limiting), then the DUP re-quirement may be calculated as described above and this can be compared with thesupply (see Box 16.6).
The application of the system to the formulation of rations is rather more compli-cated.The ration must first be formulated to meet the requirement for metabolisable en-ergy. This allows the fermentable metabolisable energy content to be calculated. Onlythen may the requirement for ERDP be calculated.The ERDP and DUP status of the ra-tion has then to be assessed and brought into balance.This is most simply done by for-mulating a supplement having the same FME concentration as the basal ration and thenecessary ERDP and DUP concentrations.This is not an uncomplicated procedure.
If the ideal blend of degradable and undegradable protein is not achieved, therequirement may be considerably increased. The attainment of such a blend mayallow the use of cheaper sources of protein or justify the use of expensive protein orthe industrial processing needed to modify the degradability of unsuitable dietaryprotein, as discussed in Chapter 23.
Estimates of protein requirements may also be made from the results of feedingtrials. In these, diets are used that are accepted as satisfactory in all respects otherthan protein, and the minimum intake of protein adequate for maximum productionis determined. Such experiments have to be of a long-term nature since even on de-ficient diets production may be maintained owing to the cow’s ability to utilise herbody tissues. This will result in a negative nitrogen balance and studies of such bal-ances are often carried out to supplement the main feeding trial. In treating the re-sults of feeding trials, an allowance is made for protein required for maintenance andthe residue equated to milk production. Estimates of the digestible protein require-ment based on such trials have varied from 1.75 times that present in milk to as lit-tle as 1.25 times in more recent work.These low levels apply only where the contentof crude protein in the diet is of the order of 160 g/kg; where the content is reducedto about 120 g CP/kg, the requirement for milk production rises.

Requirement Supplied by ration
ME (MJ/day) 206 206.5ERDP (g/day) 1964 1987DUP (g/day) 439 604MP (g/day) 1691 1856
Chapter 16 Lactation
428
BOX 16.6 AFRC (1993) evaluation of a ration (qm � 0.6) for a 600 kg cow yielding30 kg milk with 40 g/kg fat and 35 g/kg protein, and losing 0.4 kg W/day
Requirement for metabolisable protein
Maintenance � 2.3 � 6000.75 � 279Milk � 35 � 0.95 � 30�0.68 � 1467Weight change � -0.4 � 138 � -55Total � 1691
Ration: (MP g/day):
Food kg DM (kg) ME (MJ) FME (MJ) ERDP (g) DUP (g)
Silage 35 8.05 84.5 62.8 886 185Maize gluten feed 2 1.80 22.9 20.7 234 74Compound 8.6 7.67 99.1 95.0 858 345Total 17.52 206.5 178.5 1978 604
ERDP/FME � 1978�178.5 � 11.08 and energy is limitingMCP � 178.5 � 11 � 1964 g/dayMCP contribution to metabolisable protein demand � 1964 � 0.6375 � 1252 g/dayDUP requirement � 1691 � 1252 � 439 g/day
Then:
Feed into Milk (FiM) protein requirements
The metabolisable protein system described above has been criticised as it results ina substantially lower metabolisable protein requirement and a higher predictionerror than comparable systems such as the French PDI, the NRC system used in theUSA, the Dutch DVE and the Nordic AAT/PBV system.This discrepancy was relatedto the low MP requirement for maintenance, which AFRC (1993) based on basal en-dogenous nitrogen losses at a maintenance level of feeding. This approach does notreflect any increase in nitrogen loss at higher levels of intake. The more recent FiMsystem attempts to rectify this discrepancy by including a metabolic faecal proteinrequirement that varies with DM intake (and therefore production level), based onthat proposed by NRC (2001). The maintenance requirement includes endogenousurinary protein (4.1 � W0.5) and hair and scurf (0.3 � W 0.6). Metabolic faecalprotein (MFP) is the amount of endogenous protein that is not reabsorbed andexcreted in the faeces and is related to the DM intake as follows:
MFP = 30 DMI

Nutrient requirements of the lactating dairy cow
429
where DMI is the total DM intake (kg/day). Some of the metabolic faecal protein(g/day) that is excreted is, in fact, undigested bacterial protein produced in therumen. This is adjusted for by subtracting the amount of indigestible rumen synthe-sised microbial true protein:
where DMTP is digestible microbial true protein (g/day). It is evident from this thatMP requirements for maintenance are dependent on the amount of microbialprotein synthesised in the rumen, and consequently the diet composition: thegreater the amount of microbial protein produced in the rumen, the lower the MPrequirement for maintenance. Finally, there is an adjustment made for endogenousprotein loss, defined as 2.34 � DM intake.
The MPFiM requirements for maintenance (g/day) are therefore defined as follows:
It is clear from the above that unlike in AFRC (1993), calculation of the proteinrequirement for maintenance is not possible unless the DM intake and predictedmicrobial protein synthesis in the rumen are known. In practice, most commercialdairy cow diets will result in a DMTP ranging from 1000 g/day to 1200 g/day,and a reasonable mid-point of 1100 g/day may be used if a computer rationingprogram is not available. The MP requirement for pregnancy, milk and body weight change in FiM are the same as that proposed by AFRC (1993).An exampleof a metabolisable protein requirement calculated according to FiM is provided inBox 16.7.
Compared with that determined according to AFRC (1993) in Box 16.4, FiMpredicts a higher MP requirement of 280 g/day, or an 18 per cent increase. Thisdifference is due entirely to an increase in MP requirement for maintenance.
Owing to the complexities of FiM, a computer program or spreadsheet is oftenrequired for rationing purposes. For example, as outlined in Chapter 13, the supply
MPm
FiM= 4.1W0.5
+ 0.3W0.6+ 30 TDMI - 0.5[(DMTP>0.8) - DMTP] + 2.34 DMI
0.5[(DMTP>0.8) - DMTP]
BOX 16.7 Calculation of the Feed into Milk protein requirements of a 600 kg cowconsuming 18 kg DM per day, producing 30 kg of milk containing 32 g CP/kgand losing 0.4 kg W/day (predicted digestible microbial true proteinproduction � 1100 g/day)
Maintenance 4.1 � 6000.5 � 0.3 � 6000.6 � 30 � 18 -0.5[(1100�0.8) - 1100] � 2.34 � 18
1.00 559
Milk 32 � 0.95 � 30 0.68 1341Weight loss -0.4 � 138 1.00 -55.2Metabolisable protein (633 � 1341 - 55.2) 1845
Metabolisable protein
requirement (g/day)
Efficiency
factor
Net protein
requirement (g/day)

Food Fresh DMI ME (MJ) MPE MPN
Grass silage 38.5 10 108 680 870Compound 12.0 10.3 134 1494 1627Total 50.7 20.3 242 2202 2529
Chapter 16 Lactation
430
of effective rumen-degradable nitrogen (EDN) from each feed ingredient isinfluenced by three rumen factional outflow rates (liquid, forage and concentrate),which in themselves are affected by the proportion of forage in the diet. Therumen-degradable DM and subsequent ATP supply for microbial growth issimilarly affected. However, for most dairy cow rations, FiM proposes that fixedoutflow rates for liquid, forage and concentrates of 0.08/hour, 0.045/hour and0.06/hour, respectively, be used. Under these circumstances, each feed now has afixed metabolisable protein yield from either rumen-degradable protein (MPN) orrumen-available energy (MPE). MPN is calculated as the sum of MP supplyderived from rumen-degradable protein added to the MP derived from undegrad-able protein (referred to as MPB). Similarly, MPE is calculated as the sum of MPderived from rumen energy supply to MPB. The MPN and MPE values for eachfeed are additive, resulting in a simple and quick method of diet evaluation. Itshould be borne in mind that diets should be formulated to ensure that MPN isgreater than MPE. An example of a diet formulated using this approach is pro-vided in Box 16.8.
Mineral requirements
AFRC Technical Committee report no. 6 (TCORN 6) proposed that the net dailyrequirement for calcium for maintenance (g/day) of the dairy cow may be calculatedas follows:
where DMI is defined as MEI�18.4 qm. For a 600 kg cow consuming 170 MJ ME on adiet with qm of 0.6, DMI would be 15.4. This gives a net requirement of 23.6 mg/kg W per day.
0.0079W + 0.66 DMI - 0.74
BOX 16.8 FiM evaluation of a ration for a 600 kg cow producing 34 kg of milkcontaining 32 g protein/kg and losing 0.5 kg W/day (MPE and MPNcalculated assuming standard liquid, forage and concentrate outflow ratesof 0.08, 0.045 and 0.06/hour)
Requirement Supplied by ration
ME (MJ/day) 240 242MP (g/day) 2085 2202
Total MPE is less than MPN, and therefore rumen energy supply is limiting and MP supply is2202 g/day.
Nutrient requirements of the lactating dairy cow
431
For the net phosphorus requirement, the TCORN calculation is:
For a 600 kg cow consuming 15.4 kg of dry matter, this suggests a net require-ment of 28.2 mg/kg W/day. In addition to the requirements for maintenance,calcium and phosphorus must be provided for milk production.TCORN 6 suggested1.2 g/kg and 0.9 g/kg for the calcium and phosphorus contents of milk.The require-ment for calcium by the developing foetus is small until the end of pregnancy, whenthe foetal skeleton begins to become calcified.
Availability values for calcium and phosphorus used by TCORN 6 are constant, at0.68 and 0.58.This has been criticised as not reflecting differences in availability ac-cording to dietary source. For example, NRC (2001) assumes an availability of cal-cium and phosphorus in forages of 0.30 and 0.64 and concentrates of 0.60 and 0.70respectively, although data supporting these coefficients are limited.
TCORN 6 suggested that for diets with qm greater than 0.7, maintenance re-quirements for phosphorus should be calculated using 1.0 instead of 1.6 in theabove formula, and that the availability factor should be changed to 0.7. Such asharp change can give rise to anomalies in calculating requirements. Thus, a phos-phorus requirement of 72 g/day would be changed to 57 g/day for a change of qmfrom 0.69 to 0.71, which we find unacceptable. In the light of these observationsand the fact that our previously used standards have proved satisfactory over manyyears, these were preferred, and they have been used, along with the TCORNmethods of calculating net requirements, for calculating the allowances in the tablesof Appendix 2.
The results of feeding trials suggest that allowances of calcium and phosphorusconsiderably lower than those indicated by factorial calculation can be given for longperiods with no ill effects on performance or reproduction.Thus, 25–28 g of calciumand 25 g of phosphorus per day have proved adequate for cows producing 4540 kgof milk per annum over four lactations, which implies a dietary requirement of1.10–1.32 g calcium and 1.10 g phosphorus per kilogram of milk. Feeding low levelsof dietary phosphorus to higher-yielding dairy cows producing 7500–8500 kg milkper annum also appears to have no adverse effects on production, bone strength orfertility when assessed over several lactations.The requirements given in Appendix 2,Table A2.3, have been derived by factorial calculation and are probably slightlyhigher than the minimum requirement, but they are considered necessary to ensurea normal lifespan and satisfactory reproduction. Balance experiments have shownthat even very liberal allowances of calcium and phosphorus are frequently inade-quate to meet the needs of the cow for these elements during the early part of thelactation. In the later stages and in the dry period, storage of calcium and phospho-rus takes place. Figure 16.6, for example, shows the cumulative weekly calciumand phosphorus balances throughout a 47-week lactation for a mature Ayrshire cowproducing 5000 kg of milk.
Despite the negative balances that occurred over considerable periods early inlactation, there was a net positive balance over the lactation and dry period as awhole. It has therefore become normal practice to consider the complete lactation inassessing calcium and phosphorus requirements; early negative balances are re-garded as normal, since no ill effects are evident as long as subsequent replenishmentof body reserves takes place, and daily requirements are formulated on the basis oftotal production over the lactation. However, although the lactation approach is
1.6(0.693 DMI - 0.06)
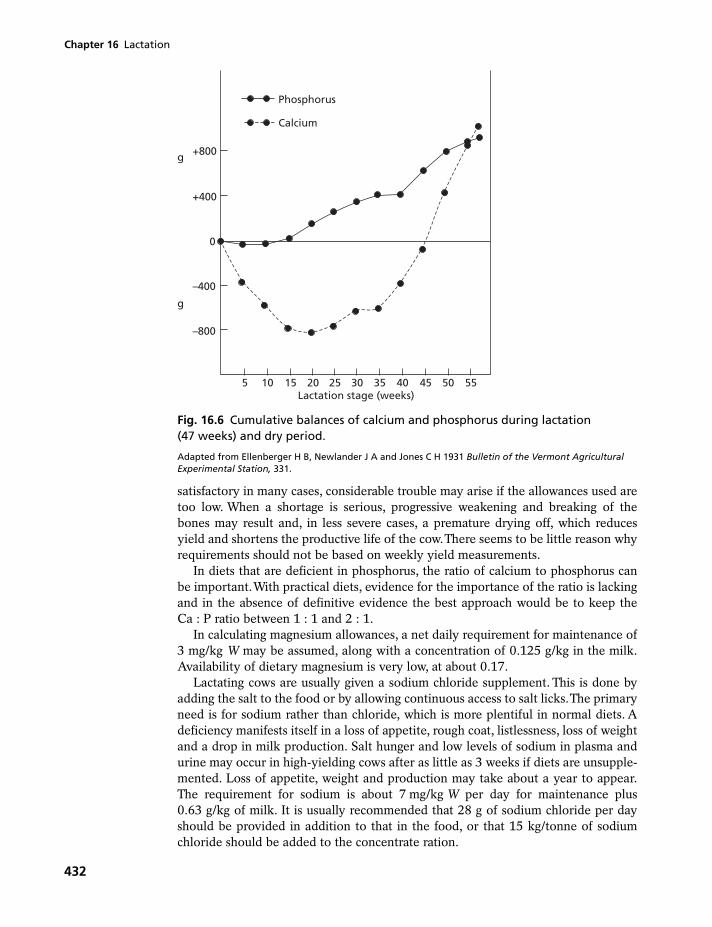
Chapter 16 Lactation
432
satisfactory in many cases, considerable trouble may arise if the allowances used aretoo low. When a shortage is serious, progressive weakening and breaking of thebones may result and, in less severe cases, a premature drying off, which reducesyield and shortens the productive life of the cow.There seems to be little reason whyrequirements should not be based on weekly yield measurements.
In diets that are deficient in phosphorus, the ratio of calcium to phosphorus canbe important.With practical diets, evidence for the importance of the ratio is lackingand in the absence of definitive evidence the best approach would be to keep theCa : P ratio between 1 : 1 and 2 : 1.
In calculating magnesium allowances, a net daily requirement for maintenance of3 mg/kg W may be assumed, along with a concentration of 0.125 g/kg in the milk.Availability of dietary magnesium is very low, at about 0.17.
Lactating cows are usually given a sodium chloride supplement. This is done byadding the salt to the food or by allowing continuous access to salt licks.The primaryneed is for sodium rather than chloride, which is more plentiful in normal diets. Adeficiency manifests itself in a loss of appetite, rough coat, listlessness, loss of weightand a drop in milk production. Salt hunger and low levels of sodium in plasma andurine may occur in high-yielding cows after as little as 3 weeks if diets are unsupple-mented. Loss of appetite, weight and production may take about a year to appear.The requirement for sodium is about 7 mg/kg W per day for maintenance plus0.63 g/kg of milk. It is usually recommended that 28 g of sodium chloride per dayshould be provided in addition to that in the food, or that 15 kg/tonne of sodiumchloride should be added to the concentrate ration.
Phosphorus
Calcium
–800
g
g
–400
0
+400
+800
5 10 15 20 25 30 35 40 45 50 55Lactation stage (weeks)
Fig. 16.6 Cumulative balances of calcium and phosphorus during lactation(47 weeks) and dry period.
Adapted from Ellenberger H B, Newlander J A and Jones C H 1931 Bulletin of the Vermont AgriculturalExperimental Station, 331.

Nutrient requirements of the lactating dairy cow
433
Vitamin requirements
Vitamins are required by the lactating animal to allow proper functioning of the physio-logical processes of milk production and as constituents of the milk itself. It has yet to beshown that there is a dietary requirement for vitamins specifically for lactation, but theyhave a role in the synthesis of milk constituents, as for instance biotin has in the synthe-sis of the milk fat. Most of the evidence points to the conclusion that as long as levels ofvitamins in the diet are sufficient for maintenance, normal growth and reproduction,then no further allowance for lactation need be made. However, normal levels of vita-mins in the milk must be maintained and sufficient amounts have to be given to allowfor this.The B vitamins are an exception, since an adequate supply becomes available asa result of microbial synthesis in the rumen. Maintenance of normal vitamin levels inmilk is particularly important where milk is the sole source of vitamins for the younganimal, as for example with the young pig and the suckled calf.
Winter milk has a vitamin A potency of about 2000 iu/kg. Apart from the almostcolourless vitamin A, milk contains variable amounts of the precursor β-carotene.Thisis a red pigment, yellow in dilute solution as in milk, to which it imparts a rich creamycolour. The vitamin A potency of milk varies widely, being particularly sensitive tochanges in dietary levels even though only about 3 per cent of the intake finds its wayinto the milk. Thus, green foods are excellent sources of the provitamin, as is shownby the deep yellow colour of milk produced by grazing cows. Some breeds, e.g. theJersey and the Guernsey, have higher ratios of β-carotene to vitamin A in their milks,which consequently have a deeper yellow colour. For example, feeding the ChannelIslands breeds with vitamin A in excess of levels adequate for reproduction may in-crease the potency of the milk by up to 20 times but has no effect on the yield orgross composition of the milk. Considerable storage of vitamin A takes place in thebody, and these reserves may be tapped to maintain levels in the milk. Since the new-born animal normally has small reserves, it is almost entirely dependent upon milkfor its supply and it is essential to feed the nursing mother during pregnancy and lac-tation so as to maintain the potency of the milk. No problem arises with cattle andsheep that are given early access to green food, but great care is required where this isnot so, as for example in winter-calving suckler herds. The daily requirement of thelactating cow is about 99 iu/kg W or 30 µg/kg W. More recently, NRC (2001)increased the allowance of Vitamin A to 110 iu/kg W for dry and lactating cowsbecause of potential improvements in mammary gland health during the dry periodin conjunction with substantial ruminal loss when high concentrate diets are fed.
There is some evidence that there may be a requirement for β-carotene itself,quite distinct from its function as a provitamin (see Chapters 5 and 15).
When lactating dairy cows are kept on diets deficient in vitamin D and irradiationis prevented, deficiency symptoms appear, showing that the vitamin is essential fornormal health. There is no evidence, however, for a requirement greater than thatwhich supports maintenance and reproduction. The vitamin D potency of milk islargely influenced by the extent of the cow’s exposure to sunlight, and large dietary in-takes are necessary for small increases in the concentration in the milk.Administrationof the vitamin has little effect in ameliorating the negative balances of calcium andphosphorus that occur in early lactation, but very heavy doses (20 000 000 iu/day)for 3–5 days prepartum and 1 day postpartum have been claimed to provide somecontrol of milk fever (see p. 113).The daily requirement of the lactating cow is about10 iu/kg W.

Chapter 16 Lactation
434
It was previously considered that a proportion of dietary vitamin E was destroyedin the rumen, but more recent evidence has revealed that virtually all flows to thesmall intestine for absorption. The vitamin E content of the basal diet is often vari-able and unknown, and therefore dietary supply is commonly based on supplemen-tal amounts, although it should be appreciated that for feeds that are naturally highin this vitamin (e.g. fresh forages) requirements could be substantially less (approxi-mately two-thirds of the supplementary requirements). There may also be a higherrequirement for vitamin E when diets high in polyunsaturated fatty acids are fed.There is some evidence of a benefit to additional vitamin E above that of require-ments in reducing mastitis and reproductive disorders, whilst high levels of supple-mentation to reduce oxidative flavours in milk and improve shelf life have beenadvocated.Whereas milk contains relatively low levels of vitamin E (approximately0.5 µg/ml), colostrum contains significantly more (around 3–6 µg/ml), whichmay justify higher feeding levels during the dry period. The Agricultural ResearchCouncil (1980) recommended a dietary level of approximately 15 mg/kg DM intake,although higher levels should be fed if dietary selenium levels are low or polyunsat-urated fatty acid levels high. More recently, NRC (2001) recommended a similarvalue of 20 IU/kg DM intake, which should be increased to 80 IU/kg DM intake dur-ing the dry period (where 1 IU � 1 mg of all-rac-α-tocopheryl acetate).
Dietary intakes of the B vitamins are of no significance in ruminant animals be-cause of ruminal synthesis. A physiological requirement, in addition to that neededfor maintaining normal levels in milk, does exist for many of them owing to their in-volvement in the complicated enzyme systems responsible for the synthesis of milk.
Effects of limitation of food intake on milk production
There is a great deal of evidence to show that reduction of food intake has a pro-found effect upon both the yield and the composition of milk.
When cows are kept without food, the yield drops to very low levels of about0.5 kg per milking within 3 days. At the same time, the solids-not-fat and fat con-tents rise to about twice their previous levels, the increases being due to a concentra-tion resulting from reduced yield. Less severe limitations reduce yields to a lesserextent; the solids-not-fat content is lowered but the effect on fat content is variable.
Limitation of the energy part of the diet has a greater effect on the solids-not-fatcontent than does limitation of the protein, although it is the protein fraction that isreduced in both cases. Lactose concentration shows little change, as would beexpected of the major determinant of the osmotic pressure of milk. Most of the fallin protein content is probably due to increased gluconeogenesis from amino acids,owing to a reduced propionate supply on low-energy diets.As a result, the supply ofamino acids to the mammary gland is reduced and so is protein synthesis. Lowdietary energy supply will also limit microbial protein synthesis in the rumen, andthus limit the amino acids available to the mammary gland. Throughout the winterfeeding period in the UK, there is a decline in milk yield and solids-not-fat contentin most herds, the rate of decline being most marked in the later period. The tradi-tional pattern is for both yield and solids-not-fat content to increase when the cowsare allowed access to spring pasture. It has been shown experimentally that wherelevels of winter feeding are high, such increases do not take place and indeed the op-posite effect may be produced. It would appear, therefore, that winter feeding ofdairy cows is frequently inadequate.

Nutrient requirements of the lactating dairy cow
435
Dietary factors affecting milk fat depression
There are several dietary factors known to influence the content of fat in cow’s milk.These include the ratio of forage to concentrates, dietary starch level, forage choplength, degree of processing of the concentrate, and inclusion of vegetable or marineoils, such as fish oil.The change to pasture feeding in spring is also frequently accom-panied by a fall in the fat content of the milk. Spring pastures have a low content offibre and are high in soluble carbohydrates; other diets having similar characteristicsalso bring about a decline in milk fat.There is much debate regarding the precise nu-tritional cause of milk fat depression, with three main theories being proposed. Thefirst relates to the production of volatile fatty acids within the rumen and subsequentsupply to the mammary gland. The second proposes that changes in rumen fermen-tation alter propionate production, which in turn increases insulin production andthe partition of nutrients between milk and body fat.The third, and most recent, the-ory relates to the production of intermediaries in the biohydrogenation pathway ofpolyunsaturated fatty acids in the rumen.
A decline in milk fat content is most obvious when the proportion of roughage inthe diet falls below 400 g/kg DM, and below 100 g/kg DM herd mean milk fat con-tent may be below 20 g/kg. Available data suggest that the measure of fibre mosthighly correlated with milk fat content is acid-detergent fibre (ADF), which consistsof cellulose, lignin, acid-detergent-insoluble nitrogen and acid-insoluble ash.The re-lationship between dietary ADF levels and milk fat content is depicted in Fig. 16.7.Generally, the ADF content of the diet should be maintained above 190 g/kg DM,but this may not be possible if energy requirements at times of highest yields are tobe met. Low-fibre diets fail to stimulate salivary secretion and hence diminish thebuffering power of the rumen liquor. Such diets are often fermented rapidly, givingrise to pronounced peaks of acid production and very low pH values. As a result,the activity of the cellulolytic fibre-digesting microorganisms is inhibited and thatof various starch utilisers encouraged.These changes are reflected in changes in thebalance of volatile fatty acids (VFA) in the rumen. For example, on high-fibre diets,
5010
20
30
40
50
100
Acid-detergent fibre content of the diet (g/kg DM)
Milk
fat
co
nte
nt
(g/k
g)
150 200 250
Fig. 16.7 Milk fat content and dietary acid-detergent fibre (ADF) concentration.
Adapted from Sutton, J D and Morant, S V 1989 Livestock Production Science 23, 219–37.

Chapter 16 Lactation
436
the molar proportions of the VFA are approximately 0.70 acetic acid, 0.18 propi-onic acid and 0.12 butyric acid. If the fibre content of the diet is reduced and thatof concentrates increased, the proportion of acetic acid falls, and in extreme casesmay be less than 0.40 of the total fatty acids. This fall is usually accompanied by adecrease in butyric acid and an increase in propionic acid, which may account for0.45 of the total acids present.The concentration of valeric acid may also decrease.This effect is most pronounced when the concentrates have a high content of rumi-nally available starch, such as wheat, or when the starch has been treated to in-crease its availability, as with the starch in flaked maize. A similar reduction inruminal pH, shift in VFA proportion and depression in milk fat occurs when the for-age is very finely ground.This effect is well illustrated in Table 16.11. In dairy cows,milk fatty acids are derived from two sources: de novo synthesis in the mammarygland, and uptake from the blood of preformed fatty acids derived from the absorp-tion of dietary fatty acids in the small intestine or mobilisation of body fat stores.De novo synthesis results in the production of C4 up to and including approxi-mately 50 per cent of C16 in milk fat, whereas uptake of preformed fatty acids ac-counts for approximately 50 per cent of C16 and all longer-chain fatty acids. Asdescribed in Chapter 3, ruminally produced acetate and to a lesser extent butyrateare the precursors for de novo milk fatty acid synthesis, and a decrease in mammarysupply of these VFA will reduce milk fat synthesis. It has been suggested that if theratio of acetic to propionic acid in the rumen contents falls below 3 : 1, then milk oflow fat content will be produced. Other workers have claimed that the most impor-tant determinant of milk fat content is the balance of glucogenic to non-glucogenicVFA in rumen contents, and that this is conveniently defined as the non-glucogenicratio (NGR) as follows:
where A, P, B and V are molar proportions of acetate, propionate, butyrate andvalerate in the rumen fluid. If the ratio falls below 3, the danger of low-fat milksbeing produced is increased.
Milk fat levels increase when acetate or butyrate have been infused and decreasewhen propionate has been infused, although the response has been relatively small(e.g. an increase in milk fat content of 20 per cent when acetate was infused and adecrease of 10 per cent when propionate was infused at rates likely to be encoun-tered within the rumen). Unfortunately, the measurement of VFA production rate indairy cows is inherently difficult and produces variable results, although in general
NGR = (A + 2B + V)>P + V
Table 16.11 Comparison of ruminal fermentation and fat content ofmilk produced from cows fed diets with varying chop length of thebasal alfalfa silage
Forage chop length Fine Medium Coarse
Ruminal pH 5.3 5.9 6.0Acetate : propionate 2.8 3.1 3.5Total chewing time (min/day) 570 671 735Milk yield (kg/day) 31.5 32.1 31.1Milk fat (g/kg) 30 36 38
After Grant R J, Colenbrander V F and Mertens D R 1990 Journal of Dairy Science 73: 1834.

Nutrient requirements of the lactating dairy cow
437
increasing concentrates and decreasing the fibre content of the diet results in anincrease in propionate production but has little effect on the rate of production ofacetate. The consequence of this is an apparent decrease in acetate proportion, al-though the actual supply to the mammary gland for de novo synthesis may be littleaffected.
The second theory of milk fat reduction relates to effects of insulin on dairy cowmetabolism. Insulin is a key hormone involved in the regulation of glucose and en-ergy status within the animal, with circulating levels increasing in response to bloodglucose or propionate concentrations. Increased production of propionate from thefermentation of starchy concentrates in the rumen results in an increase in the rate ofgluconeogensis in the liver and therefore increases blood glucose concentrations.Themammary gland is, however, comparatively insensitive to blood insulin levels, butother tissues such as adipose tissue are sensitive. Insulin’s role within milk fat de-pression therefore involves the partioning of nutrients away from the mammarygland and towards body fat depots.
Infusing glucose or propionate directly into the blood of dairy cows decreasesmilk fat concentration.This is associated with a reduction in plasma free fatty acids,which are indicative of body fat mobilisation, and reduce the liver synthesis of low-density lipoproteins and subsequent supply of these to the mammary gland for milkfat synthesis. It is also associated with an increased use of acetate and butyrate forlipid synthesis in body fat, depriving the mammary gland of precursors for de novofat synthesis. The results from infusion studies have, however, been highly variable,with changes in milk fat yield of between �4 and �16 per cent. Some have there-fore argued that this mechanism does not explain the range of milk fat depressionencountered under commercial feeding situations.
The third theory of milk fat depression (MFD) in dairy cows relates to interme-diaries produced during the biohydrogenation of polyunsaturated fatty acids in therumen. It has long been recognised that the inclusion of vegetable oils such as soyaor sunflower, or marine oils such as fish oil, result in large decreases in the contentof fat in milk. For example, the inclusion of soya oil at about 400 g/day in the dietof dairy cows can result in a decrease in milk fat content of around 10–15 g/kg,whilst cod-liver oil given at about 200 g/day can reduce milk fat content by 10 g/kg,with herring oil having a similar effect. As discussed in Chapter 3, dietary polyun-saturated fatty acids that enter the rumen are biohydrogenated to saturated fattyacids, but this process is not 100 per cent complete and a number of intermediariescan leave the rumen intact. These intermediaries include trans fatty acids, some ofwhich have been shown to have powerful effects on nutrient partioning and lipidmetabolism. Minimal changes in the structure of these intermediaries can have alarge influence on their biological potency. Milk fat depression is associated with aspecific increase in trans-10 18 : 1 and trans-10, cis-12 conjugated linoleic acid(CLA), which are produced as intermediaries in the biohydrogenation of linoleicacid. Linoleic acid is high in vegetable oils such as sunflower oil and soya oil. Acurvilinear relationship exists between the concentration of trans-10, cis-12 CLAand the decrease in milk fat yield, which is shown clearly in Fig. 16.8.Abomasal in-fusion of trans-10, cis-12 CLA has also exhibited a similar relationship. Accordingto the biohydrogenation theory, changes in the ruminal environment that encour-age the production of intermediaries such as trans-10, cis-12 CLA will result inmilk fat depression. For example, feeding a high-concentrate/low-fibre diet or a finelyground forage diet reduces ruminal pH and shifts the biohydrogenation pathway

Chapter 16 Lactation
438
towards trans-10, cis-12 CLA production in the rumen, probably as a consequenceof effects on specific groups of bacteria. This effect is increased if a source oflinoleic acid is present. It is argued that the decrease in the ruminal proportion ofacetic acid and increase in propionic acid that are associated with high-concentrate/low-fibre diets is merely a consequence of the ruminal conditions required to pro-duce intermediaries such as trans-10, cis-12 CLA.The inclusion of marine oils suchas fish oil does not always result in an increase in trans-10, cis-12 CLA in milk fatand yet they have a powerful effect on reducing milk fat content, and it appearsthat a number of other biohydrogenation intermediaries may also be involved.Recently, trans-9, cis-11 CLA and cis-10, trans-12 CLA have been identified as havingthe ability to depress milk fat levels.
It is worth noting that in countries such as the USA, the content of trans fattyacids (such as CLA) must be declared on food products, with a view to eliminatingthese from the human diet. This is because of an association between coronaryheart disease in man and trans fatty acids produced from partially hydrogenatedvegetable oils that are used in the manufacture of margarines and spreads. Suchproducts have a different profile of trans fatty acids compared with those observedin milk. Indeed, the most common trans fatty acid found in milk is cis-9, trans-11CLA, and there is evidence from laboratory animals that this fatty acid has a bene-ficial effect on protecting against certain types of cancer, coronary heart diseaseand diabetes.
There is a tendency for dietary fat to be regarded simply as a source of energy.It has been shown, however, that when fat is replaced by an isocaloric amount ofstarch in the diet of the lactating cow, then milk yields may be lowered. There isalso some evidence that diets having 50–70 g/kg DM of ether extract producemore milk than those containing less than 40 g/kg. Most forages and food grainshave low contents of lipids, of the order of 15–40 g/kg, and the fat content of thediet is usually boosted by that of supplementary compound foods.The provision ofhigh levels of dietary fat is particularly important with high-yielding cows, for
Fig. 16.8 Milk fat content and concentration of trans-10, cis-12 conjugated linoleicacid following abomasal infusion.
Adapted from Griinari J M and Bauman D E 2003 Update on theories of diet-induced milk fat depressionand potential applications. In: PC Garnsworthy and J Wiseman (eds) Recent Advances in Animal Nutrition,Nottingham, Nottingham University Press, pp. 115–55.
−60
−50
−40
y = 152x2 − 176xR2 = 0.96
−30
−20
−10
0
0.2
Milk fat trans-10, cis-12 CLA (g/100 g fatty acids)
% d
ecre
ase
in m
ilk f
at y
ield
0 0.4 0.6 0.8

Nutrient requirements of the lactating dairy cow
439
which the constraints of intake make it difficult to provide adequate energy. In ad-dition, increased saturated fat content at the expense of the starch fraction canhelp to correct the low-fat syndrome found with diets low in fibre and high instarch. This is the result of increased incorporation of long-chain fatty acids of thedietary fat into the milk fat whereas de novo synthesis of short-chain acids is de-creased. Protein concentration but not total protein secretion in the milk may bereduced. Unfortunately, added fat tends to impair fermentation and digestion ofplant cell wall constituents in the rumen and may depress intake. The effect isgreatest with roughages of high quality, and the effect in the case of low-qualitymaterials may be negligible. It is generally considered that not more than 0.5 kg offat should be added to the daily ration of a lactating cow. Higher levels may beused if the fat is protected so that its deleterious effects on the rumen are avoidedand normal hydrogenation, solubilisation and absorption take place. Prills (pellets)of calcium salts of fatty acids have proved to be an effective form of protected fat.Fatty acids in this form are less available and therefore less toxic to the micro-organisms of the rumen than are the free fatty acids produced by fat hydrolysis. Inaddition, the release of free fatty acids into the rumen following the ingestion offat results in the fixation of calcium, thus denied to the rumen microbes for whichit is essential. This does not occur with the calcium soaps and it has been claimedthat up to 15 per cent of the metabolisable energy requirement may be supplied bydietary fat when such products are used.
The nature of the dietary fat can have a profound effect on the composition ofmilk fat. Diets rich in acids up to palmitic generally increase the proportions of theseacids in milk fat at the expense of the C18 acids. Dietary fats rich in saturated and un-saturated acids result in increased yields of oleic and stearic acids with associated de-creases in shorter-chain acids, particularly palmitic acid.The secretion of linoleic andlinolenic acid or the longer-chain eicosapentaenoic or docosahexaenoic acids foundin fish oils is little affected by diet owing to the extensive hydrogenation that occursin the rumen and their preferential distribution in the phospolipid coating of the fatglobules, which is considerably lower in milk than the triacylglycerols.
Changes in dietary carbohydrate that reduce milk fat content tend to increaseprotein content if dietary protein supply is adequate.The effect may require 2–3 weeksto manifest itself and be of the order of 8 g protein/kg milk. It is probable that theincreased propionic acid production on such diets has a sparing effect on certainglucogenic amino acids such as glutamate, and more of these are then available tothe mammary gland for protein synthesis. Alternatively, such diets are often associ-ated with an increase in microbial protein synthesis in the rumen, which will increaseamino acid supply to the mammary gland. The increased intake of energy per se,which usually occurs on such diets, would have the same effect.
Reductions in dietary protein level may decrease milk yield and, almost invari-ably, non-protein nitrogen content. Milk protein is little affected until intake of pro-tein falls below 60 per cent of requirement. This is probably due to an insufficiencyof essential amino acids, primarily methionine, followed by threonine and trypto-phan. When duodenal amino acid supply has been measured and deficient aminoacids infused directly into the bloodstream, there have been large increases (approx-imately 5–8 g/kg) in milk protein content.The prediction of the amino acid profile atthe small intestine in dairy cows is fraught with difficulties, and feeding studies thathave attempted to rectify amino acid imbalances through supplementation have pro-duced variable results.

Chapter 16 Lactation
440
BOX 16.9 Nutrigenomic effects on lactation
Much is known about the biochemistry of milk synthesis, but the regulatory and cellular signalling sys-tems are less well understood. The development of genetic tools such as DNA microarrays, single-nucleotide polymorphism arrays and genotyping have led to the emergence of nutrigenomics in animalnutrition. Nutrigenomics is the study of how dietary nutrients interact with specific genes to influenceanimal performance, health and product quality. Specific nutrients can influence how DNA is tran-scribed into mRNA and then to proteins, including enzymes that control metabolism and health. Forexample, the expression of enzymes associated with milk fat synthesis is stimulated by a class of tran-scription factors, one of which is the sterol response element binding protein (SREBP) family. Inhibitionof one of these (SREBP1c) in mice has been shown to result in a 41 per cent decrease in milk fat con-centration. In dairy cows, the mammary expression of SREBP1 and proteins involved in the activationand translocation of SREBP is reduced by trans-10, cis-12 CLA and, as discussed previously, trans-10,cis-12 CLA is a potent inhibitor of milk fat synthesis in dairy cows. Polyunsaturated fatty acids, espe-cially long-chain n-3 fatty acids, are also associated with a reduction in milk fat synthesis and appear toact by a similar mechanism. In contrast to the effects in the mammary gland, trans-10, cis-12 CLA in-creases the expression of genes involved in the pathways of lipid synthesis in the adipose tissue, includ-ing fatty acid synthase and stearoyl-CoA desaturase. Minerals and vitamins can also influence geneexpression. For example, zinc interacts with cysteine and histidine to create zinc finger domains inDNA binding proteins, which can influence RNA synthesis. In zinc-deficient animals there is an in-creased expression of the gene for cholecystokinin production in the intestine, with the subsequent ef-fect of a reduced appetite. DNA microarray studies and other gene expression studies have suggestedthat biotin affects transcription of genes involved in glucose metabolism.The rapid developments in thisarea will provide a greater understanding of the mechanisms underlying nutritional effects and lead tostrategies to enhance animal performance, health, product quality and nutrient use.
16.3 NUTRIENT REQUIREMENTS OF THE LACTATING GOAT
In addition to the dairy cow, the goat is also used for the commercial production ofmilk for human consumption.As in the case of the dairy cow, nutrient requirementsdepend upon the amount of milk being produced and its composition.
Milk yield
Yield varies with breed (Table 16.12).A lactation normally lasts for about 10 months,during which time up to 1350 kg of milk may be produced. In the short term, the
Table 16.12 Total lactation milk yields of dairy goats in Englandand Wales
Breed Lactation milk yield (kg)
Anglo-Nubian 681Saanen 904British Saanen 970Toggenburg 672British Toggenburg 1090British Alpine 953Golden Guernsey 820
Adapted from AFRC 1994 The Nutrition of Goats, Technical Committee on Responsesto Nutrients report no. 10, Wallingford, CABI.

Nutrient requirements of the lactating goat
441
Fig. 16.9 Yield prediction for a goat producing about 750 kg milk/lactation.
Table 16.13 Composition (g/kg) of the milks of dairy goats in England and Wales
Breed Fat Protein Lactose Energy value (MJ/kg)
Anglo-Nubian 46.5 35.5 43.4 3.36Saanen 35.1 28.8 44.8 2.79British Saanen 37.6 29.2 42.8 2.86Toggenburg 37.1 28.6 45.8 2.87British Toggenburg 37.3 29.6 43.8 2.87British Alpine 41.1 31.1 43.3 3.05Golden Guernsey 41.9 31.7 43.3 3.09
major factor affecting yield will be the stage of lactation, with the pattern of milkproduction being similar to that for the dairy cow (see p. 412). Peak yield usuallyoccurs at about the sixth week postpartum and is maintained for the next 4 weeks,before declining at the rate of about 2.5–3 per cent per week. Estimates of yield maybe made using the following equation:
where n � days postpartum, n� � (n - 150)/100, A � the yield at day 150 of lacta-tion, B � persistency in the form of change in yield at day 150, and C � curvature inthe decline in yield in the period after the peak is achieved.
Figure 16.9 shows a plot of the estimated yields for a lactation yield of about 750 kg,with A � 3.47, B � -0.618 and C � -0.0707.
Milk composition
The composition of milk is primarily affected by the breed of the goat. Representa-tive figures for several breeds are given in Table 16.13.As with the dairy cow, breedsproducing the higher yields tend to give milk of poorer quality.
Stage of lactation also affects the composition of the milk. Fat and solids-not-fatcontent fall to a minimum at about 4 months postpartum, rise for the succeeding3 months and then increase slowly until the close of the lactation.
Y(kg/day) = A exp[B(1 + n¿>2)n¿ + Cn¿2 - 1.01>n)]
Yie
ld o
f m
ilk (
kg/d
ay)
Lactation stage (days)
5
4
3
2
1
30 60 90 150120 210 240 270 300180

Chapter 16 Lactation
442
Fat content has been shown to decrease with increasing parity and is lower foranimals with high lactation yields.
The nutrient requirements of the lactating goat may be derived factorially fromestimates of the requirements for maintenance, milk production and liveweight change.
Energy requirementMaintenance
Estimates of the fasting metabolism for lactating goats show considerable variation,but a mean value of 315 kJ/kg W0.75 per day, which closely resembles that of319 kJ/kg W0.75 per day for dairy cattle, is an acceptable estimate. This is the basicenergy requirement. It should be increased by about 10 per cent for animals keptindoors, 20 per cent for grazing animals under lowland conditions and 30 per centfor those on the hill, to allow for increased activity. In very dry or mountainoussituations these may have to be increased to as much as 100 per cent.
The efficiency of utilisation of metabolisable energy for maintenance (km) may becalculated as follows:
For a diet of qm � 0.6, km � 0.713, and the basic requirement for metabolisableenergy for maintenance for a 60 kg goat is then 0.315 � 600.75�0.713 � 9.52 MJ/day.For a goat on hill land, it should be increased to 12.4 MJ/day.
Milk production
The net requirement of energy for milk production is the gross energy of the milkproduced.This will depend upon the yield and the energy value (MJ/kg) of the milk.
In its 1998 publication (see Further reading), the Agricultural and Food ResearchCouncil proposed the use of the following equation for estimating the energy valueof goat’s milk:
When the protein content of the milk is not known, EVl may be calculated asfollows:
When no data are available, a value of 3.25 MJ/kg or breed values based uponthe figures in Table 16.13 may be adopted.
The efficiency of utilisation of metabolisable energy for milk production (kl) maybe calculated as follows:
The metabolisable energy requirement for the production of 1 kg of milk in thecase of an Anglo-Nubian goat receiving a diet of qm of 0.6 would then be 3.36�0.63 �5.33 MJ/day. The metabolisable energy requirement of a 60 kg goat of this breedproducing 3 kg of milk at pasture would be:
Lactating goats are almost always gaining or losing weight owing to the need formobilisation of body tissue to make good the difference between energy input and
(0.315 * 1.2 * 600.75>0.71) + (3 * 3.36>0.63) = 27.5 MJ/day
kl = 0.35qm + 0.42
EVl(MJ/kg) = 1.509 + 0.0406 * fat
EVl (MJ/kg) = 0.0376 * fat (g/kg) + 0.0209 * protein (g/kg) + 0.948
km = 0.35qm + 0.503

Nutrient requirements of the lactating goat
443
output. In the situation where a goat is being fed to gain weight, extra energy has tobe provided. AFRC (1998) suggests a value of 23.9 MJ/kg of liveweight change forthe EVg of lactating goats.This is equivalent to a dietary metabolisable energy contri-bution of 32.4 MJ (23.9 � 0.84�0.62). The efficiency of utilisation of metabolisableenergy for gain may be taken as 0.95 kl. For 1 kg of liveweight gain, a dietary intakeof metabolisable energy of 41 MJ [23.9�(0.62 � 0.95)] would be required.
As with cattle, a level of feeding correction should be used when calculating energyrequirements.
Protein requirementMaintenance
The net requirement for nitrogen for maintenance is that required to replace the en-dogenous urinary loss (EUN) plus part of the metabolic faecal nitrogen loss (MFN)plus loss of nitrogen in hair and scurf (D).The total is termed the basal endogenousnitrogen (BEN) and is of the order of 0.35 g/kg W0.75/day, which translates to ametabolisable protein demand of 2.19 g/kg W 0.75. Metabolisable protein is assumedto be used for maintenance with an efficiency of 1.0.
Lactation
Estimates of the crude protein contents of the milks of modern dairy goats (seeTable 16.13) range from 28.6 g/kg to 35.5 g/kg.Taking an average value of 30.6 g/kggives an acceptable true protein content of 27.5 g/kg, assuming that 10 per cent ofthe milk nitrogen is non-protein nitrogen.When the information is available, a preferredfigure should be used instead: for example, 32 g/kg for the Anglo-Nubian breed.Theefficiency of utilisation of metabolisable protein for milk production is 0.68 and themetabolisable protein requirement for milk production is then 32�0.68 � 47 g/kg.
When the lactating goat is losing weight, the mobilised tissue contributes nitrogento the production of milk. Efficiency of mobilisation is taken to be 1.0 and the mo-bilised nitrogen is used with an efficiency of 0.68.The protein content of liveweightchange (ΔW) in the lactating goat has been estimated as 138 g/kg. Liveweight lossthus contributes 138 � 0.68 � 93.8 g metabolisable protein per kilogram to the pro-duction of milk.
When the lactating goat is gaining weight, there is a requirement in excess of thatrequired for maintenance and lactation.Taking the protein content of liveweight gainto be 138 g/kg and the efficiency of utilisation of metabolisable protein for gain to be0.59 gives an extra dietary requirement of 234 g/kg of metabolisable protein.
The metabolisable protein requirement, where Y is milk yield in kilograms, is then:
when ΔW is positive and
when ΔW is negative.The daily requirement for degradable protein (ERDP) is given by (FME � 11) g,
where FME (MJ/day) is the fermentable metabolisable energy intake. The contribu-tion of dietary ERDP to satisfying metabolisable protein demand may be calculated,as for the cow, as 0.6375 � ERDP.
MP (g/day) = 2.19 * W0.75+ 27.5Y>0.68 - 138 * ¢W * 0.68
MP (g/day) = 2.19 * W0.75+ 27.5Y>0.68 + 138 * ¢W>0.59

Chapter 16 Lactation
444
BOX 16.10 Calculation of the requirements of a 60 kg Anglo-Nubian goat producing 5 kg/day milk at pasture and losing 50 g W/day
Mm (MJ/day) � (600.75 � 0.315 � 1.2)�0.713 � 11.43Ml (MJ/day) � 5 � 3.36�0.63 � 26.67Mg (MJ/day) � �0.05 � 32.4 � �1.62Mm � Mp (MJ/day) � 36.47Feeding level correction � 1 � 0.018 � Mp�Mm � 1.0394Mmp (MJ/day) � 36.47 � 1.0394 � 37.91FME (MJ/day) � 32.68ERDP (MJ/day) � 32.68 � 11 � 359.5MP (g/day) � (2.19 � 600.75) � (35.5 � 0.9 � 5�0.68) � (0.05 � 138) � 275.8Microbial protein supply (g/day) � 359.5 � 0.6375 � 229.2DUP (g/day) � 275.8 – 229.2 � 46.5Ca (g/day) � (2.37 � 5 � 1.3)�0.51 � 17.4P (g/day) � (3.71 � 5 � 0.9)�0.55 � 14.9Mg (g/day) � (50 � 0.0035 � 5 � 0.13)�0.17 � 4.9
The daily requirement for digestible undegraded protein (DUP) is calculated asfollows:
Requirements for calcium, phosphorus and magnesium
Endogenous losses (net requirements for maintenance) may be calculated as follows:
where DMI � metabolisable energy intake�18.4qm (NB: this is not a prediction ofpotential intake).
Milk may be taken to contain 1.3 g calcium, 0.9 g phosphorus and 0.13 g magne-sium per kilogram.
There is a dearth of information on the availability of dietary minerals for thegoat, and it is suggested that the values used for cattle, 0.51, 0.55 and 0.17 for cal-cium, phosphorus and magnesium, respectively, should be adopted.
An example of the calculation of the nutrient requirements of a goat with an as-sumed dry matter intake of 3.43 kg/day (37.91�18.4 � 0.6) is given in Box 16.10.
Magnesium (g/day) = 0.0035 W
Phosphorus (g/day) = 1.6(0.693 * DMI - 0.06)
Calcium (g/day) = 0.623 * DMI + 0.228
DUP (g/day) = MP - 0.6375 * ERDP
16.4 NUTRIENT REQUIREMENTS OF THE LACTATING EWE
The lactation of the ewe usually lasts 12–20 weeks, although individuals show con-siderable variations. Stage of lactation has a pronounced effect on milk yield, whichis maximal at the second to third week and then falls steadily, as shown for Suffolkewes in Fig. 16.10.

Nutrient requirements of the lactating ewe
445
Table 16.14 Lactation (12 weeks) yields of different breeds of sheep
Yield (kg)
Breed Twins Singles
Romney Marsh 148 115Cheviot – 91Border Leicester/Cheviot 211 124Suffolk 145 94Hampshire Down 79 75Scottish Blackface 142 102Finnish Landrace/Scottish Blackface 206 133
It has been calculated that about 38 per cent of the total yield is obtained in thefirst 4 weeks of lactation, 30 per cent in the succeeding 4 weeks, 21 per cent in thenext 4 weeks and 11 per cent in the final 4 weeks. Comparison of the milk yields ofdifferent breeds is difficult, since the data have been obtained under widely differingclimatic conditions, levels of feeding and sampling techniques. They indicate, how-ever, that differences do exist (Table 16.14) and that within-breed differences are fre-quently large.
Animals suckling more than one lamb produce more milk than those suckling sin-gle lambs.The higher yield is probably due to higher frequency of suckling and greateremptying of the udder, indicating that a single lamb is incapable of removing sufficientmilk from the udder to allow the full milking potential of the ewe to be fulfilled.
Data on the composition of the milk of the ewe suckling lambs are relatively few,although more data are available for machine-milked ewes. Factors such as samplingtechniques, stage of lactation and milking intervals all affect composition, and figuresare not strictly comparable and thus show considerable variation.Thus, published fig-ures for breed average fat and protein contents vary from 50 g/kg to 100 g/kg and
Fig. 16.10 Effect of stage of lactation on milk yield of the ewe.
From Wallace L R 1948 Journal of Agricultural Science, Cambridge 38: 93.
Week of lactation
Wee
kly
milk
yie
ld (
kg)
15
10
5
1 3 5 7 9 11 13 15 17 19

Chapter 16 Lactation
446
from 40 g/kg to 70 g/kg, respectively. Breed differences in composition are illustratedby the figures given in Table 16.15.
The composition of ewe’s milk is affected by stage of lactation as shown in Fig. 16.11.The changes are similar to those in the dairy cow if allowance is made for the differentlength of lactation.
The nutrient requirements of the lactating ewe may be derived factorially fromestimates of the requirements for maintenance, milk production and liveweightchange.
Table 16.15 Effect of breed on the composition of ewe’s milk (g/kg)
Breed Fat Protein
Suffolk 6.60 5.80Dorset 6.10 6.50Welsh Mountain 6.20 5.40East Friesian 6.64 6.21
After Bencini R 2001 Proceedings of the 7th Great Lakes Dairy Sheep Symposium.
Fat (g/kg)
Protein (g/kg)
Lactose (g/kg)
Week of lactation
Lactation mean
Lactation mean
Lactation mean
+15
+10
–10
+10
+5
–5
+5
+5
–5
–5
0
0
0
Fig. 16.11 Effect of stage of lactation on milk composition of Finnish Landrace �Blackface ewes.
Adapted from Peart J N et al. 1972 Journal of Agricultural Science, Cambridge 79: 303.

Nutrient requirements of the lactating ewe
447
Energy requirements
The net requirement for maintenance (Em) of housed ewes may be calculated as follows:
where W is liveweight (kg).The activity increment of 0.0096W will be greater for ewes kept outdoors. For
grazing sheep under lowland conditions, a value of 0.0109 would appear to be rea-sonable, and for hill sheep, 0.0196.
The energy value of ewe’s milk is given by the following:
in which F � fat content (g/kg) and D � day of lactation. Alternatively, a value of4.6 MJ/kg may be assumed when no information on composition is available.
Estimates of the energy value of mobilised body tissue in the lactating ewe havevaried from 17 MJ/kg to 68 MJ/kg, being particularly high and variable in early lac-tation. The figure of 68 MJ/kg is not acceptable and can be explained only in termsof simultaneous loss of fat accompanied by storage of water. In the absence of defin-itive evidence, it is proposed that, by analogy with the lactating cow, a figure of25 MJ/kg should be taken. Each kilogram of mobilised tissue contributes 25 � 0.84 �21.0 MJ net energy as milk and each kilogram of liveweight gain adds an additional25�0.95 � 26.3 MJ to the net lactation requirement of the animal for energy.
The relevant efficiency factors for calculating metabolisable energy requirementsare as follows:
Protein requirements
The requirement for metabolisable protein is made up of that for maintenance, cal-culated as 2.19 g/kg W 0.75, plus that for milk production calculated as 49�0.68 � 72 g/kgmilk, plus that for wool growth taken as 20.4 g/day, plus or minus an adjustmentfor liveweight change (ΔW), calculated as -119 g/kg ΔW when ΔW is negative, and�140 g/kg ΔW when ΔW is positive.
The requirement for effective degradable protein is given by ERDP (g/day) �
FME (MJ/day) � 11.The requirement for truly digested undegradable protein is:
when the animal is losing weight, and:
when the animal is gaining weight, where Y is milk yield in kilograms per day andΔW is liveweight change in kilograms per day.
Calcium, phosphorus and magnesium
As with the lactating dairy cow, the TCORN methods of calculating net require-ments, along with our previously used figures for availability, have been used in cal-culating the values given in the tables of Appendix 2.
DUP (g/day) = 2.19W0.75+ 49Y>0.68 + 20.4 + 140¢W - 0.6375 ERDP
DUP (g/day) = 2.19W0.75+ 49Y>0.68 + 20.4 - 119¢W - 0.6375 ERDP
kl = 0.35qm + 0.42
km = 0.35qm + 0.503
EVl(MJ/kg) = 0.0328F + 0.0025D + 2.20
Em(MJ/day) = 0.226(W/1.08)0.75+ 0.0096W

Chapter 16 Lactation
448
BOX 16.11 Calculation of the nutrient requirements of a 75 kg lowland ewe in thefourth week of lactation, suckling two lambs, receiving a diet of qm � 0.6and losing 100 g W/day
Em (MJ/day) � 0.226 � (75�1.08)0.75 � 0.0109 � 75 � 6.25km � 0.35 � 0.6 � 0.503 � 0.713Mm (MJ/day) � 8.77El (MJ/day) � 2.31 � 4.6 � 10.63kl � 0.35 � 0.6 � 0.42 � 0.63Ml (MJ/day) � 16.87Mg (MJ/day) � �0.1 � 21.0�0.63 � �3.33Mp(MJ/day) � 16.87 � 3.33 � 13.54Level of feeding correction � 1 � 0.018Mp/Mm � 1.0278Mmp (MJ/day) � 1.0278(Mm � Mp) � 22.93FME (MJ/day) � 20.3ERDP (g/day) � 20.3 � 11 � 223.3MP (g/day) � (2.19 � 750.75) � (2.31 � 72) � (-0.1 � 119) � 20.4 � 230.6DUP (g/day) � 230.6 � (223.3 � 0.6375) � 88.2
The net daily maintenance requirement for calcium, phosphorus and magnesiummay be calculated as follows:
The net requirements for milk production (g/kg) are 1.2 g calcium, 1.3 g phos-phorus and 0.17 g magnesium.Absorbability values are 0.51, 0.55 and 0.17 for cal-cium, phosphorus and magnesium, respectively.
For the purposes of calculating nutrient allowances, the milk yields given inTable 16.16 may be adopted.
An example of the calculation of the nutrient requirements of a lactating ewe isgiven in Box 16.11.
Mg (g/day) = 0.03W
P (g/day) = 1.6(0.693 * DMI) - 0.06
Ca (g/day) = 0.623 * DMI + 0.228
Table 16.16 Suggested milk yields for calculating nutrient allowances for lactating ewes
Hill One 86 1.21 1.09 0.75Two 130 1.90 1.63 1.11
Lowland One 140 2.00 1.80 1.20Two 190 2.90 2.31 1.56
Number of
lambs
Type of ewe
12 weeks
(kg)
Days 1–28
(kg/day)
Days 29–56
(kg/day)
Days 57–85
(kg/day)
Milk yield

Nutrient requirements of the lactating sow
449
Table 16.17 Variation in yield and composition of sow’s milk with stage of lactation
Week
1 2 3 4 5 6 7 8
Daily yield (kg) 5.10 6.51 7.12 7.18 6.95 6.59 5.70 4.89Fat (g/kg) 82.6 83.2 88.4 85.8 83.3 75.2 73.6 73.1SNF (g/kg) 115.2 113.2 111.8 114.1 117.3 120.5 126.1 129.9Protein (g/kg) 57.6 54.0 53.1 55.0 59.2 62.3 68.3 73.4Lactose (g/kg) 49.9 51.5 50.8 50.8 49.0 48.6 47.5 45.6Ash (g/kg) 7.7 7.7 7.9 8.3 9.1 9.6 10.3 10.9
After Elsley F W H 1970 Nutrition and lactation in the sow. In: Falconer I R (ed.) Lactation, London,Butterworth, p. 398.
The allowances given in the tables of Appendix 2 do not include a safety margin.Ewes that have been severely undernourished in pregnancy show a more rapid
decline in milk production during the subsequent lactation than adequately nour-ished animals.This accords with independent observations of reduced metabolic ca-pacity in ewes severely undernourished during pregnancy. Where restriction is lesssevere and ewes come to parturition in lean condition, they have been shown to milkas well when adequately nourished as do ewes with better condition scores at lamb-ing. Ewes will not maintain high milk production at the expense of body reserves,and even relatively small restrictions of intake depress milk production. Severe re-striction of nutrient intake (to provide maintenance only) may reduce milk produc-tion by as much as 50 per cent in 2–3 days. If restriction is continued beyond thetime when peak yield is normally achieved, then recovery of yield may not be ac-complished even if subsequent intake is raised.
16.5 NUTRIENT REQUIREMENTS OF THE LACTATING SOW
In most breeding units, lactation lasts for 3–6 weeks and many litters are weaned at3–4 weeks of age. Maximum yield of milk occurs at about 4 weeks and productionfalls gradually thereafter, as shown in Table 16.17.
Fat content rises to the third week and then falls to the end of lactation. Solids-not-fat content is at a minimum at the third week and then rises to the end of lacta-tion owing mainly to a rise in protein content.
Milk yield also varies with breed, age and litter size. It increases with the numberof piglets suckled, although yield per piglet decreases as shown in Table 16.18.
Table 16.18 Effect of litter size on milk yield in the sow
Daily milk yield (kg)
Number of pigs
4 5 6 7 8 9 10 11 12
Per litter 4.0 4.8 5.2 5.8 6.6 7.0 7.6 8.2 8.6Per pig 1.0 1.0 0.9 0.9 0.9 0.8 0.8 0.7 0.7
From Elsley F W H 1970 Nutrition and lactation in the sow. In: Falconer I R (ed.) Lactation, London, Butterworth, p. 396.

Chapter 16 Lactation
450
Modern hybrid sows of higher liveweight are generally considered to give higheryields than those shown in the tables. Various equations, similar to those for dairycows, have been proposed for predicting the yields for such sows. It is suggested thatthe following provides acceptable estimates:
where a is a scalar, t is day of lactation, u is e-exp (G - Blt) and describes the degreeof maturity of the mammary gland at parturition, and e–ct describes the rate of de-cline of secretory capacity.
Estimates of yield based on a � 18 and 24, c � 0.025, G � 0.5 and Bl � 0.1 aregiven in Table 16.19.
Energy requirements
Energy requirements for sows are calculated according to BSAS (2003) as net energy(NE), which has replaced older systems based on digestible energy (DE).The net en-ergy requirement of the lactating sow for dietary energy is the sum of that expendedin maintenance plus the gross energy of the milk less the contribution from mo-bilised body tissue. Fasting heat production is calculated as 0.750 MJ per kg W 0.60
per day and activity costs account for 0.10 of maintenance requirements for inten-sively housed sows, but will be higher for more active pigs. The net energy require-ment for milk is assumed to be 5.4 MJ/kg. Body fat that is mobilised to provideenergy for milk production is used with an efficiency of 0.85 and will provide 39.4 �0.85 � 33.5 MJ/kg of NE.A daily rate of body fat mobilisation of 0.25 kg is gener-ally assumed as being representative of commercial practice and will reduce dietaryrequirements by 8.4 MJ NE per day (0.25 � 33.5). Daily fat loss of 0.50 kg/day isnot exceptional in commercial practice, reducing daily NE requirements by 16.7 MJNE per day. It should be borne in mind that 1 kg of mobilised body weight containsapproximately 0.85 lipid, and account should be taken of this when measurementsbased on liveweight change are made. The daily NE requirements for a 225 kgsow producing 11 kg of milk and mobilising 0.25 kg lipid per day are presented inBox 16.12. As the NE value of a feed is a consequence of the digestion and utilisa-tion of the diet components, the NE content of a feed is less for growing pigs and lac-tating sows than for pregnant sows, as shown in Appendix 2. Previous systems ofcalculating the daily energy requirements of lactating sows were based on adding themetabolisable energy requirements for maintenance, milk yield and liveweight changeand then converting to digestible energy (DE) by dividing by 0.96. For comparison,a similar calculation has also been conducted and the DE requirements presented inBox 16.12. Alternatively, DE requirements may be approximated by the simplisticassumption that DE � NE�0.71.
Y (kg/day) = a * e-ct* u
Table 16.19 Estimates of the milk yields of sows (kg/day)
a
Day of lactation
7 14 21 28
18 6.8 8.4 8.7 8.124 9.1 11.3 11.6 10.8

Nutrient requirements of the lactating sow
451
There is the belief that it is desirable to feed for very high weight gains duringpregnancy and to rely heavily on the mobilisation of body reserves to supply the en-ergy requirement during lactation. High intakes in pregnancy can improve yield inthe subsequent lactation, but appetite in lactation is reduced. It has been claimedthat the reduction is of the order of 0.5 kg for each increase of 0.5 kg in pregnancyfeeding. As a result, weight loss in lactation may be excessive, leading to prolongedintervals between weaning and conception. The maximum tolerable weight loss inlactation is of the order of 10–12 kg. It is now considered that the greatest efficiencyof energy utilisation is achieved by giving adequate amounts of energy during lacta-tion after restricted intake during pregnancy. A true gain in sow body weight of12–15 kg over a complete reproductive cycle (about 25–27 kg during pregnancy)appears to give optimal reproductive performance and provides body reserves forlactation. When levels of food intake during lactation are designed to meet require-ment, sows lose less weight and produce more milk than animals on a lower nutritionalplane. On the other hand, piglets reared by sows receiving the higher intakes havefailed to show significant advantage. This is partly because the lower-yielding sowsproduced richer milk and partly because the increased yields were obtained afterthe third week, when creep feed was being eaten and the piglets on the low-yieldingsows ate more of this feed than the others. Consumption of creep feed is variableand cannot always be relied upon to make good the deficiencies in the milk yield ofthe sow; for safety, it would be preferable to feed the piglets via the milk rather thanby the more efficient direct creep feeding.There is evidence that low levels of energyduring lactation have a cumulative effect and that considerable reduction of milkyield and depletion of subcutaneous fat may occur over three lactations. Varioustechniques, including frequent feeding, wet feeding, pelleting, high-energy diets andavoidance of overfatness at farrowing, are used to ensure satisfactory intakes in lac-tation. It is important to appreciate the constraints of intake when diets are being
BOX 16.12 Net energy and comparable digestible energy requirements for a 250 kgsow producing 10 kg of milk per day and mobilising 0.25 kg of body lipidand being fed 7.5 kg/day
Net energy
Fasting metabolism � 0.750W 0.60 � 20.6 MJ/dayActivity allowance � 0.10 fasting metabolism � 2.06 MJ/dayMilk requirements � 10 kg � 5.4 MJ/kg � 54.0 MJ/dayMinus lipid mobilisation � 0.25 � 33.4 � 8.4 MJ/dayTotal net energy requirements � 20.6 � 2.06 � 54 � 8.4 � 68.3 MJ/dayNE MJ/kg diet � 68.3�7.5 � 9.1 MJ/kg
Digestible energy
Maintenance � (0.444W 0.75 � 1.10)�0.96 � 32 MJ/dayMilk requirements � [(10 kg � 5.4)�0.7]�0.96 � 80.4 MJ/dayMinus lipid mobilisation � 0.25 � 50 � 12.5 MJ/dayTotal digestible energy requirements � 32 � 80.4 - 12.5 � 99.9 MJ/dayDE MJ/kg diet � 99.9/7.5 � 13.3 MJ/kg

Chapter 16 Lactation
452
BOX 16.13 Standardised ileal digestible lysine requirements for a 250 kg sowproducing 10 kg of milk per day and fed 7.5 kg per day.
Maintenance � [(0.9W0.75 � 0.058)�0.82] � 1.05 � 4.2 g/dayLactation � [(10 kg/day � 54 � 0.073)�0.82] � 1.05 � 50.5 g/dayStandardised ileal digestible lysine g/day � 54.7 g/dayStandardised ileal digestible lysine g/kg diet � 54.7�7.5 � 7.3 g/kg dietTotal lysine g/day � 54.7�0.84 � 65.1 g/dayTotal lysine g/kg � 65.1�7.5 � 8.7 g/kg
formulated. Intakes may be as low as 4 kg/day at high temperatures but may reach7–8 kg in cool conditions. Under normal circumstances, intakes are rarely higherthan 6.5 kg and are more commonly about 5 kg.
Protein requirements
The lactating sow is a highly efficient converter of protein into milk. In the UK, dietaryrequirements for sows are calculated according to BSAS (2003) and are based on stan-dardised ileal digestible lysine and balancing the remaining essential amino acids.Thisis a more precise approach than previous systems that were based on dietary lysineconcentrations, which did not account for endogenous losses. Sow’s milk is assumed tocontain 54 g protein/kg, with a lysine concentration in the protein of 0.073 kg/kg.Daily maintenance requirements for protein are 0.9 g/kg W 0.75, with a lysine contentof 0.058 kg/kg.An efficiency of 0.82 is used for obligatory tissue protein turnover, andobligatory endogenous losses are 0.05 of requirements; therefore requirements formaintenance and lactation are multiplied by 1.05.An assumption is made that mater-nal body protein is in balance during lactation and therefore no adjustments are re-quired.Total lysine requirements may then be calculated using the ileal digestibility ofthe feed, or if unavailable a standard value of 0.84 � dietary lysine content can beused. Daily ileal digestible lysine requirements for a 250 kg sow producing 10 kg ofmilk and consuming 7.5 kg/day are presented in Box 16.13.
The remaining essential amino acids should be provided in the proportions rela-tive to lysine provided in Table 13.7 in Chapter 13. For example, the methionine re-quirements for lactation are 0.30 of that of lysine, resulting in a daily methioninerequirement of 19.5 g/day or 2.6 g/kg diet. Conducting a similar calculation for allthe essential amino acids, and assuming that the non-essential amino acids are typi-cally 1.5 times this level, results in a minimum ileal digestible protein content of 120 g/kg, or a dietary protein level of approximately 143 g/kg diet (120/0.84).
Evidence is accumulating that the high protein levels usually recommended forthe diets of lactating sows may be required only because of inadequate protein qual-ity. It has been demonstrated that the biological value of barley can be raised fromabout 0.56 to 0.72 by supplementation with 20 g of lysine per sow per day.This is toall intents and purposes the same as the figure of 0.73 for barley/fishmeal diets. Inthe light of this information, it has been suggested that diets containing as little as120 g crude protein per kilogram may be adequate for milk production, as long as ly-sine levels are adequate and intake is not less than 5 kg/day for a sow suckling eightpiglets. Such a low level of dietary crude protein would indicate a gross efficiency ofconversion of dietary to milk protein of 0.63, which is highly optimistic.

Nutrient requirements of the lactating mare
453
Mineral requirements
There is little evidence to suggest that minerals other than calcium and phosphorushave to be provided in the diet of lactating sows at levels above those necessary fornormal reproduction. Balance experiments indicate that the gross efficiency of utili-sation of calcium and phosphorus for lactation is about 0.47 and 0.5, respectively.Table 16.1 shows that the milk of the sow contains 2.5 g/kg of calcium and 1.7 g/kgof phosphorus.A sow producing 10 kg of milk per day would thus be secreting 25 gof calcium and 17 g of phosphorus. Obligatory losses (g/100 kg W) may be assumedto be 3.2 g calcium and 2 g phosphorus.The 200 kg sow (see above) would have thefollowing requirements:
A meal given at 7.5 kg/day would need to contain 8.9 g Ca/kg and 5.6 g P/kg.More recent estimates of the phosphorus requirements for pigs are based on di-gestible phosphorus, although assumptions made regarding the availability of inor-ganic and organic phosphorus sources are problematic. The phosphorus digestibilityin feeds may also be enhanced through the addition of phytases in the diet.
Vitamin requirements
Little information is available concerning the vitamin requirements for lactation inthe sow.Those given in the tables of Appendix 2 represent reasonable supplementa-tion levels during lactation. In commercial practice, levels some two to three timeshigher are often fed.
(2 * 2 + 10 * 1.7)>0.5 = 42.0 g P/day
(3.2 * 2 + 10 * 2.5)>0.47 = 66.8 g Ca/day
16.6 NUTRIENT REQUIREMENTS OF THE LACTATING MARE
The nutrient requirements of the mare for milk production depend upon the amountof milk being produced and upon its composition.
Milk yield
The yield of milk varies with breed, age, stage of lactation, nutrient intake in the latestages of pregnancy, current nutrient intake, and water availability. Some typicalmilk yields for mares of different liveweights are given in Table 16.20.
Table 16.20 Typical milk yields (kg/day) of mares of various body weights duringweeks 1–25 of lactation
Weeks 1–2 4–5 5–12 20–25
Quarter horse (500 kg) 10 14 10 –TB, standardbred (494 kg) 12–16 14–16 18 –Dutch saddlebred horse (600 kg) 14 16 19 11French draft (726 kg) 20 25 27 –
Adapted from Frape D 1998 Equine Nutrition and Feeding, 2nd edn, Oxford, Blackwell Science.

Chapter 16 Lactation
454
Yield for brood mares (kg/day) may be predicted as 3 per cent of liveweight dur-ing the first 3 months of lactation and 2 per cent of liveweight for months 4–6. Forponies the corresponding percentage values are 4 per cent and 3 per cent respectively.Alternatively, milk yield may be estimated as follows:
where Y � milk yield (kg), a � 0.0274 � mature weight (kg), d � day of lactation ande � natural log.A mare with a mature weight of 500 kg at day 30 of lactation would bepredicted to yield 16.7 kg/day, whereas at day 80 yield would be 14.8 kg/day.
Milk composition
Fat content rises to a maximum of approximately 18 g/kg at around week 2 of lacta-tion, where it remains relatively constant for most of lactation, before declining toapproximately 14 g/kg in late lactation. Protein content declines sharply to day 22 oflactation and then levels off at approximately 19.6 g/kg. Lactose shows a very slightrise as the lactation proceeds.The gross energy of the milk falls sharply in early lac-tation but from about day 12 shows little change from a value of about 2.1 MJ/kg.
Energy requirement
Energy standards may be derived factorially.This involves an estimate of the gross en-ergy value (EVl (MJ/kg)) of the milk, which, along with the yield (Y (kg)), may be usedto estimate the net energy requirement for milk production.The US National ResearchCouncil (NRC, 2007; see Further reading) assumes the gross energy content of mare’smilk to be 2.09 MJ/kg, which is the net requirement for milk production.
Digestible energy (DE) is assumed to be converted to milk energy with an effi-ciency of 0.6, and the requirement for milk production (DEl) is then 2.09�0.6 MJ.
In the French net energy system for horses, the gross energy of milk is assumed tobe 2.3 MJ/kg and the net requirement for milk production is 2.3Y MJ.
In addition to the requirement for the production of milk, the diet of the lactatingmare must provide the energy for maintenance. NRC (2007) proposes for mares ofless than 700 kg that DE required for maintenance (DEm) is calculated as follows:
For lactating mares above 700 kg body weight, it is assumed that activity is less andDE required for maintenance (DEm) is calculated as follows:
In the French net energy system, the requirement for maintenance is calculated as0.351 MJ/kg W 0.75, with factors used to allow for activity that depend upon the typeof horse and whether the animal is at work.Thus, for a riding horse at work, the fac-tor would be 1.05 at rest and 1.10 at work; for a draft animal at work, the factorswould be 1.0 and 1.05.
According to the NRC system, the energy requirement of a mare of 500 kgliveweight producing 15 kg of milk per day would be:
This value is 8 per cent higher than the allowance previously recommended byNRC (1989).
DE (MJ/day) = 0.152W + (15 * 2.09>0.6) = 76.0 + 52.3 = 128.3
DEm = 0.139 MJ/kg body weight
DEm = 0.152 MJ/kg body weight
Y = a * (d0.0953) * e(-0.0043d)

Nutrient requirements of the lactating mare
455
The energy requirement of the same animal according to the French systemwould be:
The French system provides tables of net energy values of some 149 foods formaintenance, which are considered applicable to lactation as well. The values arestated in terms of UFC (unité fouragère cheval); one UFC is equal to the net energyof standard barley, equal to 9.42 MJ/kg.
Protein requirements
The net protein requirement for milk production is the protein content of the milk.Up to day 22 of lactation, the crude protein content of milk (g/kg) can be estimatedas: 10 � (3.43 - 0.066 d), where d � days in milk.After day 22, milk protein concen-tration is assumed to be 19.6 g crude protein/kg. Using an efficiency of utilisation of50 per cent and a digestibility of 79 per cent results in a dietary crude protein re-quirement for milk production of approximately 50 g/kg milk. Previous protein re-quirements were based on digestible crude protein, but more recently NRC (2007)argues that the lack of information regarding digestible crude protein content of feed-stuffs commonly fed to horses does not justify its use, and that requirements shouldbe based on dietary crude protein.The crude protein requirement (g/day) for mainte-nance is therefore calculated as 1.44W and total requirements for milk production asCP requirement � 1.44W � 50Y. For a 500 kg mare producing 15 kg of milk, thedaily crude protein requirement (g/day) is estimated as 720 � 750 � 1470.
In the French system, the net requirement is taken to be 24 g/kg for the first 3months of lactation and 21 g/kg thereafter. Protein values of foods are stated interms of MADC (matières azotés digestibles cheval).The MADC is the protein trulydigested in the small and large intestine and is calculated as k � DCP, where k � 1.0,0.9, 0.85, 0.80 and 0.70 for concentrate foods, green forages, grass hay, barley strawand grass silage, respectively. The DCP requirements would then be 2.8, 3.1, 3.3, 3.5and 4.0 g DCP/kgW 0.75, respectively, for the five types of food above.
The amino acid balance in the protein is considered by NRC (2007) to be the sumof that required for maintenance and milk production. Lysine requirements for main-tenance are 4.3 per cent of CP requirements and lactation requirements are 3.3 g/kgmilk. For a 500 kg mare producing 15 kg of milk per day, total lysine requirements(g/day) are:
Mineral requirementsMaintenance
Endogenous losses of the major minerals, which represent the net requirements formaintenance, are:
Calcium � 20 mg/kg W/dayPhosphorus � 10 mg/kg W/dayMagnesium � 6 mg/kg W/day
(0.043 * 1.44W) + 3.3Y = 31 + 49.5 = 80.5
NE (MJ/day) = (0.351 * 5000.75) + (15 * 2.3) = 37.11 + 34.50 = 71.6

Chapter 16 Lactation
456
Table 16.21 Suggested minimum and maximum allowances ofsome vitamins for lactating mares
Minimum Maximum
Vitamin A (iu/kg W/day) 30–60 300Vitamin D (iu/kg W/day) 10 44Vitamin E (iu/kg W/day) 2 20Vitamin C (mg/kg W/day) Unknown 20
After National Academy of Sciences/National Research Council 1989 Nutrient Require-ments of Horses, 5th rev. edn, Washington, DC, NRC.
BOX 16.14 Calculation of the nutrient requirements of a 500 kg mare producing 16 kgof milk in early lactation
DEm (MJ/day) � 0.152W � 76DEl (MJ/day) � 16 � 2.09�0.6 � 55.7DEml (MJ/day) � 76 � 55.7 � 131.7CPm (g/day) � 1.44 � 500 � 720CPl (g/day) � 50 � 16 � 800CPml (g/day) � 720 � 800 � 1520Lysine (g/day) � (0.043 � 1.44 � 500) � 3.3 � 16 � 84Calcium (g/day) � (0.02 � 500 � 1.2 � 16)�0.5 � 58Phosphorus (g/day) � (0.01 � 500 � 0.75 � 16)�0.45 � 38Magnesium (g/day) � (0.006 � 500 � 0.09 � 16)�0.40 � 11
Milk production
The mineral composition of mare’s milk varies with stage of lactation. For the pur-pose of estimating dietary requirements, the following values are acceptable:
Months 1–3 of lactation Months 4–6 of lactation
Calcium (g/kg) 1.2 0.8Phosphorus (g/kg) 0.75 0.50Magnesium (g/kg) 0.09 0.045
Efficiency of absorption is 0.5 for calcium, 0.45 for phosphorus and 0.40 formagnesium.
Vitamin requirements
Only limited data are available on the vitamin requirements of horses, and definitivestatements are not possible at this time. Table 16.21 gives some tentative minimumlevels considered to be sufficient to allow normal functioning of the animal andmaximum levels designed to avoid toxicity.
The calculation by the NRC system of the requirements for a 500 kg mare pro-ducing 15 kg of milk is illustrated in Box 16.14.
Summary
457
SUMMARY
1. Lactation is a major physiological and bio-chemical undertaking.
2. The net requirements for milk production aredependent upon the amounts of nutrients secreted in the milk, and therefore upon milkyield and composition. In addition to a produc-tion requirement, a lactating animal may havean increased maintenance requirement.
3. If the efficiency with which a dietary nutrientis used to provide the net requirements isknown, then the dietary requirement may becalculated as the net requirement divided bythe efficiency of dietary nutrient utilisation.
4. Qualitatively the milks of farm animals are al-most identical in composition, consisting ofwater, fat, protein, lactose and mineral matter(dominated by calcium and phosphorus).
5. The constituents of milk either are absorbeddirectly from the blood or are synthesised inthe mammary gland from raw materials ab-sorbed from the blood. In either case theyoriginate in the food of the animal.
6. The yield and composition of milk vary withspecies, breed, strain within the breed, ageand stage of lactation.
7. Values for the efficiency of utilisation ofmetabolisable energy for maintenance and formilk production are related to the energy con-centration of the diet and are very similar.
8. Concentrate foods added to the diet rarelybring about the expected response in milkyield, because they cause a concomitant decrease in roughage intake, which is greaterfor high- than for low-quality roughages. Ad-ditionally, the extra concentrate increases theproportion of propionate in the rumen volatilefatty acids and the response is negatively curvi-linear in the case of milk yield and positively sofor liveweight gain.
9. High energy intakes must include a certainlevel of roughage in the diet if an acceptablerumen fermentation is to be maintained andproblems of acidosis, reduced intake and low-fat milk are to be avoided.
10. Reduction of food intake has a profound effect on both the yield and the compositionof milk. In extreme cases yield may be re-duced to very low levels in a matter of days.Limitation of the energy of the diet leads to a reduction in milk protein content, proba-bly because of diversion of amino acids togluconeogenesis.
11. The production of low-fat milk has tradition-ally been explained by a lack of coarseroughage in the diet resulting in loweracetate and higher propionate production inthe rumen. This ruminal volatile fatty acidprofile reduces mammary supply of acetatefor milk fat synthesis and/or increases bodyfat deposition. More recently, intermediariesin the biohydrogenation of polyunsaturatedfatty acids in the rumen have been proposedas the main mechanism controlling milk fatreduction.
12. Protein requirements for ruminant animals arestated in terms of metabolisable protein, andprotein supply to rumen microbes are ex-pressed in terms of effective rumen-degrad-able (ERDP) protein or effectiverumen-degradable nitrogen (EDN).
13. Maintenance energy requirements of lactat-ing ewes and goats are related to metabolicbody weight, with an additional allowancefor activity, which is least for animals kept in-doors and greatest for those on the hill inharsh climatic conditions. Their yield of milkwill depend mainly upon breed, stage of lac-tation and litter size. Energy and protein con-tent are chiefly a reflection of stage oflactation and breed.
14. The fat content of sow’s milk rises to aboutthe third week of lactation and falls there-after. Protein falls in early lactation and thenrises towards the end.
15. Milk yield in the sow varies with age, littersize and breed, with modern hybrid animalsbeing especially productive. Energy require-ments may be based on the conversion of

Chapter 16 Lactation
458
QUESTIONS
16.1 Calculate the daily metabolisable energy requirements of a dairy cow weighing625 kg, yielding 33 kg milk with 39 g/kg fat, and losing 0.5 kg/day on a diethaving a qm � 0.62, using AFRC (1993) and Feed into Milk (2004).
16.2 Calculate the daily metabolisable protein requirements of a dairy cow weigh-ing 625 kg, yielding 33 kg milk with 39 g/kg fat and 33 g/kg protein, andlosing 0.5 kg/day using AFRC (1993) and Feed into Milk (2004) (predicteddigestible microbial true protein production � 1100 g/day and eating 20 kgDM per day).
16.3 Calculate the daily metabolisable energy and metabolisable protein require-ments of a 55 kg hill ewe in the third week of lactation, suckling one lamb andreceiving a diet of qm of 3.55 and losing 100 g W/day.
16.4 Calculate the net energy and digestible energy requirements of a 200 kg sowproducing 11 kg of milk per day and mobilising 0.25 kg of body lipid. If thesow was consuming 8.0 kg of feed per day, what would the net energy anddigestible energy concentrations be (MJ/kg)?
16.5 Calculate the daily ileal digestible lysine and dietary lysine requirements of a200 kg sow producing 11 kg of milk per day and mobilising 0.25 kg of bodylipid. If the sow was consuming 8.0 kg of feed per day, what would the ilealdigestible lysine and and dietary lysine concentrations be (g/kg)?
16.6 Calculate the digestible energy, crude protein, lysine, calcium and phospho-rus requirements for a 600 kg mare producing 15 kg of milk per day in earlylactation.
dietary energy to milk energy with an effi-ciency of about 0.45.
16. Sows rely heavily upon the mobilisation ofbody reserves to satisfy the demands of milkproduction. Current thinking favours highdietary energy intakes at this time to min-imise weight loss. Energy inputs duringpregnancy are restricted to avoid loss ofappetite in the subsequent lactation.
17. Dietary protein is the sole source of essen-tial amino acids for the sow. Diets are usually formulated to standardised ileal digestible lysine, with the proportions ofthe other acids to lysine being kept thesame as those in the ideal protein.
18. The milk yield of the mare is related to bodyweight and stage of lactation.
19. The gross energy of mare’s milk falls to aboutday 12 of lactation and shows little changefrom about 2.1 MJ/kg thereafter. Energy re-quirements are stated as digestible energy(US NRC) or as net energy. In the French netenergy system, the unit used is the UFC (unitéfouragère cheval), equal to 1 kg of standardbarley (9.42 MJ/kg).
20. The mare’s protein requirement for mainte-nance is related to metabolic liveweight andbreed. Production requirement depends pri-marily on stage of lactation.
21. Dietary protein requirements are stated interms of crude protein or as MADC (matièresazotés digestibles cheval), the protein trulydigested in the intestine.

Further reading
459
FURTHER READING
Agnew R E and Yan T 2000 Impact of recent research on energy feeding systems for dairy cat-tle. Livestock Production Science 66: 197–215.
Agricultural and Food Research Council (AFRC) 1990 Technical Committee on Responses toNutrients report no. 4. Nutrient Requirements of Sows and Boars. Farnham Royal, Com-monwealth Agricultural Bureaux. (See also Nutrition Abstracts and Reviews, Series, B 60:383–406.)
Agricultural and Food Research Council (AFRC) 1992 Technical Committee on Responses toNutrients, report no. 5. Nutrient Requirements of Ruminant Animals: Energy, FarnhamRoyal, Commonwealth Agricultural Bureaux. (See also Nutrition Abstracts and Reviews,Series B 60: 729–804.)
Agricultural and Food Research Council (AFRC) 1992 Technical Committee on Responses toNutrients, report no. 9. Nutrient Requirements of Ruminant Animals: Protein, FarnhamRoyal, Commonwealth Agricultural Bureaux. (See also Nutrition Abstracts and Reviews,Series B 62: 787–835.)
Agricultural and Food Research Council (AFRC) 1993 Technical Committee on Responses toNutrients, Energy and Protein Requirements of Ruminants,Wallingford, CABI.
Agricultural and Food Research Council (AFRC) 1998 Technical Committee on Responses toNutrients, report no. 10. The Nutrition of Goats,Wallingford, CABI.
Agricultural Research Council 1980 The Nutrient Requirements of Ruminant Livestock, Farn-ham Royal, Commonwealth Agricultural Bureaux.
Agricultural Research Council 1981 The Nutrient Requirements of Pigs, Farnham Royal, Com-monwealth Agricultural Bureaux.
British Society of Animal Science 2003 Nutrient Requirement Standards for Pigs. Penicuik,British Society of Animal Science.
Commonwealth Scientific and Industrial Research Organisation (CSIRO) 2007 Nutrient Re-quirements of Domesticated and Ruminant Livestock, Melbourne, CSIRO.
Dewhurst J and Lee M R F 2004 Alternative strategies for manipulating milk fat in dairy cows.In: Garnsworthy P C and Wiseman J (eds) Recent Advances in Animal Nutrition, Nottingham,Nottingham University Press, pp. 255–75.
Falconer I R (ed.) 1998 Lactation, London, Butterworth.
Frape D 2004 Equine Nutrition and Feeding, 3rd edn, Oxford, Blackwell Science.
Griinari J M and Bauman D E 2003 Update on theories of diet-induced milk fat depressionand potential applications. In: Garnsworthy P C and Wiseman J (eds) Recent Advances inAnimal Nutrition, Nottingham, Nottingham University Press, 115–55.
Cannas A, Pulina G and Francesconi A H D 2008 Dairy Goats Feeding and Nutrition,Walling-ford, CABI.
Morant S V and Gnanasakthy A 1989 A new approach to the mathematical formulation of lac-tation curves. Animal Production 49: 151–62.
National Research Council 2001 Nutrient Requirements of Dairy Cattle, 7th rev. edn,Wash-ington, DC, National Academic Press.
National Research Council 2007 Nutrient Requirements of Horses, 6th rev. edn,Washington,DC, National Academic Press.
National Research Council 2007 Nutrient Requirements of Small Ruminants: Sheep, Goats,Cervids and New World Camelids, DC,Washington, National Academic Press.

Chapter 16 Lactation
460
Thomas C 2004 Feed into Milk: A New Applied Feeding System for Dairy Cows, Nottingham,Nottingham, University Press.
Theodorou M K and France J (eds) 2000 Feeding Systems and Feed Evaluation Models,Wallingford, CABI.
Wiseman J (ed.) 2007 Paradigms in Pig Science. Nottingham, Nottingham University Press.
Wood P D P 1976 Algebraic models of lactation curves for milk, fat and protein productionwith estimates of seasonal variation. Animal Production 22: 35–40.

461
17.1 Food intake in monogastric animals
17.2 Food intake in ruminants
17.3 Food intake in horses
17.4 Prediction of food intake
In previous chapters attention has been concentrated on the energy and nutrientrequirements of farm animals for maintenance and various productive processes. Anadditional important factor that must be considered is the quantity of food that an animalcan consume in a given period of time. The more food an animal consumes each day,the greater will be the opportunity for increasing its daily production. An increase inproduction that is obtained by higher food intakes is usually associated with an increasein overall efficiency of the production process, since maintenance costs are decreasedproportionately as productivity rises. There are, however, certain exceptions to the gen-eralisation; for example, with some breeds of bacon pigs, excessive intakes of food leadto very fat carcasses, which are unacceptable to the consumer and therefore economi-cally undesirable.
Feeding is a complex activity that includes such actions as the search for food, recog-nition of food and movement towards it, sensory appraisal of food, the initiation of eat-ing and ingestion. In the alimentary tract the food is digested and the nutrients arethen absorbed and metabolised. All these movements and processes can influence foodintake on a short-term basis. In addition it is necessary to consider why, in most matureanimals, body weight is maintained more or less constant over long periods of time,even if food is available ad libitum. Thus, the concepts of short- and long-term controlof food intake must be considered, the former being concerned with the initiation andcessation of individual meals and the latter with the maintenance of a long-term energybalance. Although many of these control systems are thought to be similar in all classesof farm animals, there are important differences between species that depend mainlyon the structure and function of the digestive tract.
Control mechanisms for the food intake of farm animals can be envisaged as operat-ing at three levels. At the metabolic level, concentrations of nutrients, metabolites orhormones may stimulate the nervous system to cause the animal to start or stop feeding.At the level of the digestive system, the quantities of digesta may determine whether ornot the animal ingests more food. Finally, external influences such as climatic variablesand the ease with which food can be ingested will also influence food intake. In
17 Voluntary intake of food

Chapter 17 Voluntary intake of food
462
monogastric animals fed on concentrated foods and protected from adverse environ-mental features, control is primarily at the metabolic level. As diets become more fibrous,control shifts to the digestive system, and in ruminants that are not grazing this is usuallythe operative level. For grazing ruminants, environmental factors assume greater impor-tance and may be the determinants of intake. The first part of this chapter is concernedwith monogastric animals and the second with ruminants (including grazing animals).Finally, consideration is given to factors influencing intake in horses.
17.1 FOOD INTAKE IN MONOGASTRIC ANIMALS
Control centres in the central nervous system
Feeding in mammals and birds is controlled by centres in the hypothalamus, situatedbeneath the cerebrum in the brain. It was originally proposed that there were twocentres of activity. The first of these was the feeding centre (lateral hypothalamus),which caused the animal to eat food unless inhibited by the second, the satietycentre (ventromedial hypothalamus), which received signals that the body as a resultof consumption of food. Quite simply it was considered that the animal wouldcontinue to eat unless the satiety centre received signals that inhibited the activity of the feeding centre.There is little doubt that this is an oversimplification and, althoughthe hypothalamus does play an important role in intake regulation, it is now believedthat other areas of the central nervous system are also involved.
Short-term regulationChemostatic theories
The release of nutrients from foods in the digestive tract, their absorption and passagevia the portal system to the liver, and their presence in circulating blood all provideopportunities for nutrients to signal their presence to the satiety centre of the hypo-thalamus.According to chemostatic theory, the rise in concentration at these sites ofsome critical substance sends a signal to the brain to cause the animal to stop eating,and a fall in concentration causes the animal to start eating. Earlier studies concen-trated on blood glucose concentration. Small doses of insulin, which lower theconcentration of glucose in blood, cause an animal to feel hungry and hence to starteating. It is also known that the blood glucose level rises after a meal and then fallsslowly. It has been suggested that glucoreceptors, perhaps located in the hypothala-mus itself, monitor either the absolute concentration of glucose in blood or the dif-ference in concentration between arterial and venous blood. More recent studieshave investigated receptors located closer to the point of origin of glucose (and othernutrients), in the gut and liver, which could evoke a faster response to the ingestionof food.Thus, glucose infused into the intestine or the hepatic portal system causes agreater reduction in intake than glucose infused into the peripheral circulation.Glucose in the duodenum has been shown to generate signals that are transmittedneurally and may cause the flow of digesta from the stomach to be retarded, hencereducing food intake. Another possible means of communication between the gutand the brain is provided by the peptide hormone cholecystokinin (CCK); this is re-leased into the gut when digestive products such as amino acids and fatty acids reachthe duodenum (see p. 161) and is known to act on the hypothalamus. Intravenous

Food intake in monogastric animals
463
injection of CCK has been shown to reduce food intake in chickens, decrease giz-zard motility and stimulate muscular activity in the duodenum, whilst in pigs it isthought to restrict the pylorus in the stomach, therefore restricting the passage offood. Other gut hormones such as ghrelin and somatostatin also play a role incontrolling food intake via their effects on the hyopthalamus. In the liver, glucoseand other nutrients that are oxidised in that organ are believed to send signals viathe vagus nerve that eventually reach the hypothalamus.
The short-term control of intake in the fowl does not seem to be influenced to thesame extent by blood glucose or other nutrients, and it appears that signals arereceived directly from the crop, as is explained later.
Thermostatic theory
This theory proposes that animals eat to keep warm and stop eating to prevent hy-perthermia. Heat is produced during the digestion and metabolism of food, and it isconsidered that this heat increment could provide one of the signals used in theshort-term regulation of food intake. It has been established that there are thermo-receptors, sensitive to changes in heat, present in the anterior hypothalamus and alsoperipherally in the skin, but experiments involving the heating or cooling of thehypothalamus have not induced consistent changes in food intake. However, at apractical level (as mentioned in Chapter 14), a high environmental temperaturecauses animals to reduce their heat production by eating less.
Long-term regulation
The long-term preservation of a relatively constant body weight, combined with ananimal’s desire to return to that body weight if it is altered by starvation or forcedfeeding, implies that some agent associated with energy storage acts as a signal for thelong-term regulation of food intake. One suggestion is that this might be fat deposition.Studies with poultry tend to support this lipostatic theory of regulation. Cockerelsforced to eat twice their normal intake of food deposited fat in the abdomen and liver.When force-feeding was stopped the birds fasted for 6–10 days, and when voluntaryfeeding recommenced food intake was low. It was evident from these studies that thebirds lost weight when force-feeding ceased, and tissue fat concentration decreased tolevels approaching normal after 23 days. In pigs, it would appear that any feedbackmechanism from body fat to the controlling centres of feeding is not as sensitive as thatin poultry and other animals.This insensitivity may have arisen through early geneticselection for rapid weight gain, when excessive carcass fat was not considered, as it istoday, an undesirable characteristic.The natural propensity of the modern pig to fattenis usually counteracted in practice by restricted feeding and also by selection of pigswith a smaller appetite. The role of fat depots in the regulation of food intake hasrecently been confirmed by the discovery of the hormone leptin (Box 15.1).
Sensory appraisal
The senses of sight, smell, touch and taste play an important role in stimulating ap-petite in man and in influencing the quantity of food ingested at any one meal. It isa common assumption that animals share the same attitudes to food as man, but it isnow generally accepted that the senses play a less important role in food intake in farmanimals than they do in man.

Chapter 17 Voluntary intake of food
464
BOX 17.1 The role of leptin in controlling intake and performance
Leptin is a single-chain polypeptide containing 146 amino acids. This polypeptide is secreted bywhite adipose tissue and acts on the hypothalamus, where it suppresses the release of neuropep-tide Y, a potent stimulant of food intake. Leptin therefore reduces food intake and increasesphysical activity and thermogenesis, probably through uncoupling ATP generation in the mito-chondria. Its discovery arose from the study of mice that were hyperphagic and therefore obese,and that lacked the gene for leptin. When these mice were treated with leptin, their food intakewas reduced to normal levels. Further experiments with other species, including farm animals,have shown that injecting leptin into individuals with no genetic deficiency of the hormone hasless dramatic effects than in the obese mice. Nevertheless, leptin is regarded as a key element inthe feedback control of food intake. For example, in pigs, intracerebroventricular injection of lep-tin reduces food intake by up to 90 per cent, whilst pregnant sows with high back fat levels ofover 25 mm have serum leptin concentrations of 5 ng/ml and intakes some 20 per cent lower thansows with back fat levels of less than 20 mm and serum leptin concentrations of 3 ng/ml. It mayappear unusual to consider the importance of a hormone that reduces food intake, but leptinprovides the first link between the peripheral blood supply and the central nervous system thatregulates long-term energy balance.
Leptin also has direct effects on a number of other factors influencing animal production. For ex-ample, leptin reduces fat deposition in adipose tissue, where it suppresses the expression of acetyl-CoA carboxylase, the rate-limiting enzyme involved in fat synthesis. Leptin also has direct effectson the reproductive system, where it induces the release of follicle-stimulating hormone andlutenising hormone from the anterior pituitary. Its effects on reproduction and embryonic develop-ment are broad and include factors such as inducing puberty, especially in thinner animals, andshortening the interval from parturition to oestrus.
The term ‘palatability’ is used to describe the degree of readiness with which aparticular food is selected and eaten, but palatability and food intake are not syn-onymous. Palatability involves only the senses of smell, touch and taste. Most do-mestic animals exhibit sniffing behaviour, but the extent to which the sense ofsmell is necessary in order to locate and select foods is difficult to measure. A va-riety of aromatic substances, such as dill, aniseed, coriander and fenugreek, arefrequently added to animal foods. The inference is that the odour from thesespices makes the food more attractive and hence increases intake. Although tran-sitory increases in food intake may occur, the effects of these additives have yet tobe convincingly demonstrated to be long-lasting in terms of overall increasedfood intake.
Similarly, with the sense of taste, most animals show preferences for certain foodswhen presented with a choice. Typical is the preference of young pigs for sucrosesolutions rather than water.The fowl is indifferent to solutions of the common sugarsbut finds xylose objectionable, and it will not ingest salt solutions in concentrationsbeyond the capacity of its excretory system. Every species studied has shown consid-erable individual variability; for example, in a litter of pigs tested with saccharinsolutions of different concentrations, some animals preferred high levels of thesweetener whereas others rejected them.

Food intake in monogastric animals
465
Physiological factors
The classical experiments of E F Adolph in 1947 demonstrated that when the diets ofrats were diluted with inert materials to produce a wide range of energy concentra-tion, the animals were able to adjust the amount of food eaten so that their energyintake remained constant. This concept that ‘animals eat for calories’ has also beenshown to apply to poultry and other non-ruminant farm animals. The manner inwhich chicks respond to diets of differing energy content is illustrated in Table 17.1,in which a normal diet containing 8.95 MJ productive energy (or about 13.2 MJmetabolisable energy) per kilogram was ‘diluted’ with increasing proportions of alow-energy constituent, oat hulls.The most diluted diet had an energy concentrationthat was only half that of the original and much lower than the range normally expe-rienced by chicks.The chicks responded by eating up to 25 per cent more food, buteven so energy intake declined by up to 29 per cent. If the energy content of a dietis increased by the addition of a concentrated source of energy such as fat, thenchicks respond in the opposite way.They eat less, but the reduction in intake may beinsufficient to prevent a rise in energy intake.Where extensive diet dilution is carriedout, by using low-digestibility materials, the ability to adjust the intake may be over-come because gastrointestinal capacity becomes a limiting factor. The crop appearsto be concerned with intake in the fowl, since cropectomised birds eat less than nor-mal when feeding time is restricted. Inflation or introduction of inert materials intothe crop is known to cause a decrease in food intake. In mammals, distension andtension receptors have been identified in the oesophagus, stomach, duodenum andsmall intestine. Distension in these areas of the tract increases the activity in thevagus nerve and in the satiety centre of the hypothalamus.
Experiments similar to that shown in Table 17.1 have been made with pigs andshow the same picture. In the mid-range of energy concentration, pigs can compensate
Table 17.1 The effects of reducing the energy content of the diet on the food andenergy intakes of chicks and on their growth
Diet no.
1 2 3 4 5
Energy content of dietProductive energy (MJ/kg) 8.95 7.91 6.82 5.73 4.64Metabolisable energy (MJ/kg) 13.18 11.59 10.21 8.91 7.45Metabolisable energy
(percentage of diet no. 1) 100 88 78 68 57
Performance of chicks to 11 weeks of age (percentage of result for diet no. 1)
Total food intake 100 101 113 117 125Total metabolisable energy intake 100 90 88 80 71Liveweight gain 100 99 102 98 98
Fat content of carcass at 11 weeks of age (percentage of dry matter)
(Male chicks only) 26.8 23.2 21.1 18.1 16.1
After Hill F W and Dansky L M 1954 Poultry Science, 33: 112.

Chapter 17 Voluntary intake of food
466
for variations in concentration, but with low-energy diets (e.g. containing 9 MJDE/kg), compensation is incomplete and energy intake is reduced. Conversely, if theenergy content of diets is increased to 15 MJ DE/kg by the addition of fat, pigs failto reduce their food intake proportionately and energy intake increases. For pigs,as for poultry, it has been suggested that energy intake with low-energy diets isrestricted by gut distension. It has also been suggested that high-energy diets tend tobe ‘overeaten’ because they fail to provide sufficient bulk.
The general relationship between food intake and energy requirement suggeststhat, as with energy, intake should vary not directly with liveweight but shouldvary with metabolic liveweight (W 0.75).This relationship is generally held to exist,although it may vary with the physiological state of the animal. For example, lactationis usually associated with a marked increase in food intake, and in the rat at thepeak of lactation, food intake may be nearly three times that of a non-lactatinganimal. In sows, the smaller the amount of food given during pregnancy, thegreater is the amount consumed during lactation. If fed ad libitum on normaldiets, pregnant sows overeat and become too fat, but their energy intake can bereduced by incorporating fibrous by-product foods, such as sugar beet pulp, intheir diet.
It would seem reasonable to assume that intake increases with exercise, and stud-ies with rats have shown that there is a linear relationship between food intake andthe duration of exercise. However, the limited information on farm animals suggeststhat exercise reduces intake in the short term, possibly because of fatigue.
Nutritional deficiencies
Utilisation by the tissues of the absorbed products of digestion depends upon the ef-ficient functioning of the many enzymes and coenzymes of the various metabolicpathways, and dietary deficiencies of indispensable amino acids, vitamins and min-erals are likely to affect the intake of food. In poultry, severe deficiencies of aminoacids reduce food intake whereas moderate deficiencies, insufficient to affect growthmarkedly, increase intake.When hens are given a diet containing high concentrationsof calcium (30 g/kg), intake is about 25 per cent greater on egg-forming than on non-egg-forming days. This large variation does not occur when low-calcium diets aregiven with calcium being provided separately as calcareous grit. It would appear thatlaying hens ‘eat for calcium’; the hormone controlling their calcium intake appearsto be oestradiol. The effects of specific deficiencies of trace elements, especiallycobalt, copper, zinc and manganese, and also vitamins such as retinol, cholecalcif-erol, thiamin and B12 on appetite have already been dealt with in Chapters 5 and 6.Mammals do not need to develop a calcium appetite, because they regulate theircalcium supply by varying absorption.
Choice feeding
Animals have precise nutritional requirements, but under natural conditions they arefaced with a wide variety of foods to choose from, some of which are nutritionallyinadequate.
The domestic rat and mouse are known to regulate their intakes of foods to sat-isfy, as far as the properties of the foods allow, their requirements for energy, proteinand certain other nutrients. In studies with farm animals, attention has concentrated

Food intake in monogastric animals
467
on poultry, and it has been demonstrated that the domestic fowl has specific ap-petites for calcium (as discussed above) and also for phosphorus, zinc, thiamin andvarious amino acids.
It is possible to feed poultry on two separate dietary components, such as a wholecereal grain (e.g. whole wheat) and a balancer food that contains relatively high lev-els of amino acids, vitamins and minerals.This practice is known as choice feeding; itallows the birds to balance the energy/protein ratio of their overall diet.The balancerfood is formulated so that equal proportions of the two foods are expected to beeaten; and because milling, mixing and pelleting costs are avoided for the wholecereal, total feeding costs can be reduced. The choice feeding system has been usedsuccessfully with large flocks of growing turkeys, but it has not proved consistentlysuccessful with broiler chickens and adult laying hens.The theory that poultry havea control system that allows them to choose suitable amounts of different foods tosatisfy their nutritional requirements is regarded as being too simplistic, and otherfactors such as the physical form of ingredients, composition of the food, troughposition and previous experience are also likely to be involved.
As early as 1915,T M Evvard, in the USA, reported that pigs were able to choosea satisfactory diet when given access to several foods, and that as they grew theychanged the proportions of the foods selected to maintain a suitable balance betweenprotein and energy. The pigs required a period of familiarisation with the foods inorder to be able to associate some of their properties with their nutritional effects.Recent investigations have confirmed the ability of pigs to select a diet of suitableprotein content when given a choice between pairs of foods differing in protein con-tent. Table 17.2 shows that when offered pairs of foods ranging in protein contentfrom 125 g/kg to 267 g/kg, four out of six groups of pigs (groups 2–5) were able toselect the proportions giving the appropriate protein concentration for their overalldiet of about 200 g/kg. The first group was offered foods that were both too low inprotein to allow the correct selection, and the last group was given foods that bothhad protein concentrations higher than the desired level. Related experiments haveshown that choice-fed pigs reduce the protein content of their selected diet as theirprotein requirements decline with increasing liveweight. Furthermore, pigs with thegenetic capacity to grow more lean tissue (intact males of breeds selected for baconproduction) select diets higher in protein content.
Table 17.2 Diet selection of young pigs offered a choice of foods differing incrude protein content
Group no. Protein content
(g/kg) of foodFood intake
(g/day)
Proportions of
foods 1 and 2
Protein content
of overall diet
(g/kg)1 2
1 125 174 1106 29:71 1602 125 213 1013 6:94 2083 125 267 1055 44:56 2044 174 213 1028 31:69 2025 174 267 1076 66:34 2056 213 267 1054 98:2 218
Adapted from the data of Kyriazakis I, Emmans G C and Whittemore C T 1990 Animal Production 51: 189.
Chapter 17 Voluntary intake of food
468
17.2 FOOD INTAKE IN RUMINANTS
Although food intake can be controlled at the metabolic level in ruminants, the sig-nals are likely to be different from those in monogastric animals.The amount of glu-cose absorbed from the digestive tract of the ruminant is relatively small and bloodglucose levels show little relation to feeding behaviour. It would therefore seem un-likely that a glucostatic mechanism of intake control could apply to ruminants. Amore likely chemostatic mechanism might involve the volatile fatty acids absorbedfrom the rumen. Intraruminal infusions of acetate and propionate have been shownto depress intake of concentrate diets by ruminants, and it is suggested that receptorsfor acetate and propionate occur on the luminal side of the reticulo-rumen. Infusionsof these acids into the hepatic portal vein also reduce intake, apparently via signalssent from the liver to the hypothalamus. Butyrate seems to have less effect on intakethan acetate or propionate, probably because butyrate is normally metabolised toacetoacetate and β-hydroxybutyrate by the rumen epithelium.With diets consistingmainly of roughages, infusions of volatile fatty acids have had less definite effects onintake. As mentioned above, in ruminants on such diets, control of intake appearsto be exercised at the level of the digestive system, and features of the food have animportant influence on intake.
Food characteristics that determine intake
Ruminants are adapted to the utilisation of what may be termed ‘bulky’ foods, butthey may nevertheless have difficulty in processing such foods. Rumination andfermentation are relatively slow processes, and fibrous foods may have to spend along time in the digestive tract for their digestible components to be extracted. Iffoods and their indigestible residues are detained in the digestive tract, the animal’sthroughput – and hence its daily intake – will be reduced. In many feeding situa-tions, intake seems to be restricted by the capacity of the rumen, with stretch andtension receptors in the rumen wall signalling the degree of ‘fill’ to the brain, but whatconstitutes the maximum – and hence critical – ‘fill’ of the rumen is uncertain. Thenotion that voluminous, ‘bulky’ foods, such as hay and straw, will fill the rumen to agreater degree than concentrates has received some support, although after beingchewed, the voluminous foods are not as ‘bulky’ as they are in the trough. Anotherconcept of rumen fill is that animals eat to maintain a constant amount of dry matterin the rumen; again, there is some experimental evidence for this, although there aresome foods (e.g. some types of silage) that do not promote as great a fill of dry matteras other foods. There is also doubt about the contribution of water to rumen fill.Water-filled balloons in the rumen, which reduce its effective volume, will reducefood intake, but water added to food does not have this effect. However, there issome evidence that foods with a particularly high content (about 900 g/kg) of waterbound within plant tissues promote a lesser dry matter intake than comparablefoods of lower water content.
It has long been recognised that in ruminants there is a positive relationship be-tween the digestibility of foods and their intake.A simple and early example of thisrelationship is shown in Fig. 17.1, which is derived from experiments in which sheepwere fed to appetite on various roughages as the sole item of diet. Intake more thandoubled as the energy digestibility of the food increased from 0.4 (oat hay; the lowestpoint on the graph) to 0.8 (artificially dried grass; the highest point).

Food intake in ruminants
469
A range in digestibility like that in Fig. 17.1 can also be created by taking a singleroughage and supplementing it with increasing proportions of highly digestible con-centrates; in these circumstances there is also a positive relationship between intakeand digestibility in ruminants (which contrasts with the negative relationship shownfor a monogastric species in Table 17.1).The effect on intake of adding a concentratesupplement to a roughage depends on the digestibility of that roughage. If its di-gestibility is low (e.g. cereal straw with dry matter digestibility of 0.4) total intakewill be increased more than if its digestibility is high (e.g. young grassland herbage,0.8). To put this another way, concentrate added to roughage of low digestibilitytends to be eaten in addition to the roughage, but when added to roughage of highdigestibility it tends to replace the roughage. This rate of replacement of forage bythe concentrate is often referred to as the substitution rate.
The examination of relationships of the kind illustrated in Fig. 17.1 has shownthat intake is actually more closely related to the rate of digestion of diets than todigestibility per se, although the two last measures are generally related to oneanother. In other words, foods that are digested rapidly, and are also of high digestibil-ity, promote high intakes.The faster the rate of digestion, the more rapidly the diges-tive tract is emptied, and the more space is made available for the next meal. Theprimary chemical component of foods that determines their rate of digestion is neu-tral-detergent fibre (NDF), which is itself a measure of cell wall content; thus, thereis a negative relationship between the NDF content of foods and the rate at whichthey are digested.
One consequence of the relationships just described is that foods that are equal indigestibility but differ in NDF (or cell wall) content will promote different intakes.An example is provided by the two families of pasture plants: grasses and legumes.At equal digestibility, legumes contain less cell wall (and hence more cell contents)and are consumed in quantities about 20 per cent greater than grasses.Another dif-ference between legumes and grasses is that in the former lignification is restricted tothe vascular bundles, whereas in grasses the lignin is more widely distributed andhas a greater inhibitory effect on rate of digestion.
Fig. 17.1 Food consumption and digestibility in sheep fed on roughages.
After Blaxter K L, Wainman F W and Wilson R S 1961 Animal Production 3: 51.
1.35
0.90
0.45
0 0.2 0.4 0.6 0.8 1.0
Apparent digestibility of dietary energy
Dry
mat
ter
inta
ke o
f 45
kg
sh
eep
(kg
/day
)

Chapter 17 Voluntary intake of food
470
Although rate of digestion and intake are related to the concentration of cell wallsin ruminant foods, the physical form of the cell walls also affects intake.The mechan-ical grinding of roughages partially destroys the structural organisation of cell walls,thereby accelerating their breakdown in the rumen and increasing food intake. Thiseffect is illustrated in Table 17.3, which shows also that the increase in intake due togrinding and pelleting was achieved despite a reduction in digestibility. The fineparticles produced in ground roughages pass rapidly out of the rumen, leaving roomfor more food but allowing some digestible material to escape undigested; this maybe digested in the small intestine or – if cell wall – by fermentation in the caecum.Weshall see later (Chapter 20) that chemical treatments of forages that disrupt the cellwall structure cause large increases in intake. Another example of the influence ofcell wall structure comes from the comparison of intakes of the leaves and stems ofpasture plants. Although the two components may be equal in digestibility, thecell walls in leaves are more easily broken down, so animals given leaves eat about40 per cent more dry matter per day than those offered stems.
The breakdown of food particles in the rumen and its effect on intake has beenthe subject of much research. In practice it is possible, as explained above, to over-come the resistance of plant cell walls by mechanical or chemical treatment, but theprocesses involved are expensive, may have undesirable side effects (e.g. mechanicaltreatment reducing digestibility), and cannot be applied to grazed forages. In thelonger term the aim is to identify new forage species or breed new varieties that arebroken down more rapidly in the rumen.
Nutrient deficiencies that reduce the activities of rumen microorganisms are liableto reduce food intake. The most common is protein or nitrogen deficiency, whichmay be corrected by supplementation with rumen-degradable protein or with a simplesource of nitrogen such as urea. However, supplements of undegradable protein mayalso increase the intake of low-protein forages, either because the nitrogen of pro-tein digested post-ruminally is partially recycled to the rumen or because of theeffect of protein on the animal’s tissue metabolism. Other nutrients whose deficien-cies are liable to restrict food intake in ruminants are sulphur, phosphorus, sodiumand cobalt.
There are some foods that are eaten in lesser quantity than would be expectedfrom their digestibility or cell wall content. These include some types of silage,
Table 17.3 The effects on dry matter intake and digestibility of grinding andpelleting roughage-based diets for sheep and cattle (mean values for three diets)
Measures Species Form of roughagea Percentage difference
Long Pelleted
Intake (g/kg W 0.75 Sheep 56.8 82.4 �45per day) Cattle 81.8 90.7 �11
Digestibility Sheep 0.672 0.586 �13Cattle 0.699 0.569 �19
aThe diets were dried grass, barn-dried hay and a mixture of 60 per cent hay and 40 per centbarley. For each diet the roughage was either ground and pelleted or left unprocessed (‘long’).
Adapted from Greenhalgh J F D and Reid G W 1973 Animal Production 16: 223.

Food intake in ruminants
471
particularly those with a high content of fermentation acids or those that have beenbadly fermented and hence have a high ammonia content (see Chapter 19). Thephysical form of the food may also be involved, as fine chopping of the silage – or ofthe grass from which the silage is made – will increase intake, possibly because itprevents the formation in the rumen of a dense mat of fibrous material. Sheep aremore likely than cattle to have subnormal intakes from silages and respond more tohaving their foods (including silages) chopped or ground.As shown in Table 16.11 inChapter 16, too fine a chop length may result in a rapid fall in ruminal pH and con-sequently reduce food intake. Attempts have been made to calculate the physicallyeffective NDF content (peNDF) of forages based on their NDF content and particlesize distribution measured using a series of sieves of different pore sizes. The mostwidely used system is that developed by workers at Pennyslvania State University inthe USA. Such an approach appears to work effectively when relatively dry foragesare used but has difficulty in dealing with the wide range in dry matter content ofUK forages.
Foods with intakes less than expected may also be labelled as ‘unpalatable’. Asdiscussed earlier (see p. 464), the concept of palatability is not easily defined, butthere is some evidence, obtained with low-quality roughages, that if some food is putdirectly into the rumen (via a cannula), then consumption by mouth is not decreasedproportionately and the animal therefore digests more than it would voluntarilyconsume. Generally, however, palatability is not thought to be an important factordetermining intake, except where the food is protected against consumption (e.g. byspines) or contaminated in some way (e.g. by excreta).
Animal factors affecting intake in ruminants
If the capacity of the rumen is a critical factor in determining the food intake ofruminants, then circumstances that change the relationship between the size of therumen and the size of the whole animal are likely to affect intake.As ruminants of agiven species grow, their food intake follows approximately the proportionality tometabolic body weight (W 0.75) referred to earlier. However, cattle have a greaterintake per unit of metabolic body weight than sheep; for example, a growing steer(300 kg) on a diet containing 11 MJ ME/kg DM will consume about 90 g DM/kgW0.75 per day (6.3 kg DM per animal per day), whereas a growing lamb (40 kg) willconsume only 60 g DM/kg W0.75 per day (0.96 kg per animal). Intake seems to berelated to fasting heat production, which is itself related to metabolic body weight(see Chapter 14) but is smaller per unit of metabolic body weight in sheep than incattle. When animals become excessively fat, their intake tends to stabilise or, inother words, not to increase as body weight continues to increase. This may be dueto abdominal fat deposits reducing the volume of the rumen, but it may also be ametabolic effect (i.e. lipostatic limitation of intake determined by the secretion ofleptin). Conversely, in very lean animals, intake per unit of metabolic body weighttends to be high.This effect is seen in animals showing compensatory growth after aperiod of food restriction (see p. 380); it is also seen in ruminants chronically shortof food, as in some developing countries, where animals appear to be constructed ofskin and bone enclosing a large rumen.
In pregnant animals, two opposing effects influence food intake. The increasedneed for nutrients for foetal development causes intake to rise. In the later stages ofpregnancy, the effective volume of the abdominal cavity is reduced as the foetus

Chapter 17 Voluntary intake of food
472
Fig. 17.2 Intake of gross energy and changes in milk production in lactating andnon-lactating cows.
After Hutton J B 1963 Proceedings, New Zealand Society for Animal Production 23: 39.
increases in size, and so is the space available for expansion of the rumen duringfeeding.As a result, intake will be depressed, especially if the diet consists predomi-nantly of roughage.
The increased intake in ruminants with the onset of lactation is well known.Thisincrease is mainly physiological in origin, although there may also be a physicaleffect from the reduction in fat deposits in the abdominal cavity.There is a noticeablelag in the response of food intake to the increased energy demand of lactation. Inearly lactation, the dairy cow loses weight, which is replaced at a later phase oflactation when milk yields are falling while intakes of DM remain high. Thesechanges are illustrated in Fig. 17.2 for lactating and non-lactating identical twin,Jersey cross-bred cows fed exclusively on fresh pasture herbage over a 36-weekperiod. The intakes of gross energy by the lactating cows were about 50 per centhigher than those of the non-lactating animals.
Environmental factors affecting the food intake of ruminantsGrazing ruminants
The intake of ruminants in their natural habitat (i.e. at pasture) is influenced notonly by the chemical composition and digestibility (or rate of digestion) of the pas-ture herbage but also by its physical structure and distribution. The grazing animalhas to be able to harvest sufficient herbage to meet its needs without undue expen-diture of energy. Its intake is determined by three factors – bite size (the quantity ofdry matter harvested at each bite), bite rate (number of bites per minute) and grazing
GE
con
sum
ed (
MJ/
day
)
Week after calving
Lactating
Non-lactating
Milk yield
18
16
Fat-
corr
ecte
d m
ilk (
kg/c
ow
/day
)
14
12
10
3632282420161284
250
200
150
100

Food intake in ruminants
473
time. For example, a grazing dairy cow (600 kg) has a maximum bite size of 0.6 g DM,grazes at 60 bites per minute and hence harvests at 36 g DM per minute, or 2.16 kgper hour.To achieve a reasonable intake of 16 kg DM per day it will therefore need tograze for 16�2.16 � 7.4 hours per day. Cows normally graze for about 8 hours perday, but sometimes for as much as 10 hours per day. In this instance, the cow shouldbe able to achieve the necessary intake in a grazing time within the 8-hour period.For the cow to achieve maximum bite size and bite rate, the herbage must be suitablydistributed. In general, relatively short (12–15 cm) and dense swards allow maximumbite size for cattle. Tall, spindly plants such as many tropical grasses restrict bite sizebecause the animal is unable to get a mouthful of herbage at each bite. Low plantdensity (e.g. less than 1500 kg DM/ha for sheep) is also a restricting factor and maybe exacerbated by the animal’s desire to graze selectively. Animals tend to preferrapidly digested leaf to slowly digested stem, and also prefer green to dead material.Some plants may be rejected because they are rendered unpalatable by protectivespines or by contamination with excreta. When given the choice between a puresward of perennial ryegrass or white clover, sheep and cattle will consume approxi-mately 70 per cent of their daily DM intake as clover, with grass consumption beingmost evident in the evening. One possible explanation for this behaviour is to in-crease the intake of the more slowly digestible fibre in the evening in an attempt toincrease gut fill and therefore avoid having to graze during the hours of darkness.
In a good grazing environment with short, dense swards of highly digestibleherbage, ruminants will consume as much dry matter as when food is offered to themin a trough, but in more difficult environments they often fail to achieve the intake offood that they are capable of digesting and metabolising.
Other environmental factors
Environmental temperature influences the intake of ruminants as it does of mono-gastric species.At temperatures below the thermoneutral zone (see p. 350), intake isincreased, and at temperatures above the thermoneutral zone, intake is reduced.Well-fed ruminants have a broad thermoneutral zone, extending to quite low criticaltemperatures at the lower end (see Table 14.4 in Chapter 14). However, at the upperend (i.e. in hot climates), temperature can exert a strong influence on intake, espe-cially in more productive animals with a high nutrient demand. For example, fortemperate (i.e. Bos taurus) breeds of cattle, it has been estimated that intake falls by2 per cent for every 1 °C rise in average daily temperature above 25 °C.
Another feature of the environment that has an effect on intake is day length.Thiseffect is most evident in deer, which reduce their food intake very severely as daylength declines; where short days coincide with a shortage of food, the effect is a sur-vival mechanism to ensure that the limited supplies of food last through the criticalperiod. Sheep also reduce their intake as days get shorter, but to a much lesser extentthan do deer. Cattle seem not to be affected by day length.
Ill-health can reduce the intake of both ruminants and non-ruminants. Contraryto popular opinion, infestations of gastrointestinal parasites tend to reduce intake,presumably because the interference with digestive function overrides any metabolicstimulus arising from a reduction in the absorption of nutrients.There is also evidencethat stimulation of the animal’s immune system, as happens with parasite infestations,may be responsible for a reduction in food intake. Infestations with external parasites,such as ticks, also reduce intake.
Chapter 17 Voluntary intake of food
474
17.3 FOOD INTAKE IN HORSES
Many of the principles affecting intake that have been discussed for ruminant andnon-ruminant farm animals are relevant to horses. The digestive processes in thehorse differ, however, to those in farm animals, with the absorption of glucose andamino acids occurring in the upper digestive tract and significant quantities of VFAbeing absorbed from fermentation of forages in the hind gut. In addition, most do-mesticated horses are now fed small volumes of high-energy feeds that are con-sumed relatively quickly, rather than large quantities of low-energy-density,high-fibre foods that are eaten over a long period of time. Like the situation withpregnant sows, this can lead to behavioural stereotypes and welfare issues.As a con-sequence, there has been a greater emphasis on factors influencing feeding behaviourin horses than on those influencing the control of feed intake and nutrient supply.
Chemostatic control of intake in horses includes the influence of blood glucose.For example, intravenous infusion of glucose reduces voluntary food intake within10–15 minutes. Products of hind gut fermentation such as VFA are also involved,and intragastric infusion of low concentrations of VFA increases intake in ponies,whereas high concentrations are associated with a reduction in intake and a greaterintermeal period. In general, though, horses appear less sensitive to metabolic feed-back than farm animals.
Horses spend less time chewing than ruminants, although a horse with a full set ofteeth is able to grind grains such as oats, barley and maize. It is still generally recom-mended that only oats should be left unprocessed. Similar to pigs and poultry, horsesare able to adjust their intake to meet energy requirements, although voluntary intakecan be greatly affected by the palatability and composition of the diet. For example,diluting the energy content of the diet fed to ponies with sawdust increases DM intakeuntil gut fill is achieved.As a consequence, the fibre content of hay does not appear tohave a major influence on intake, with an average daily intake value for mature horsesof approximately 2 kg DM/100 kg body weight. Mature and young horses have a max-imal daily DM intake of approximately 3–3.2 kg/100 kg body weight, whereas ponieshave a slightly higher value at 3.9 kg/100 kg body weight.
17.4 PREDICTION OF FOOD INTAKE
For both monogastric and ruminant species it is often necessary to be able to pre-dict intake.Animals are commonly fed to appetite, and it is not possible to predicttheir performance by the use of feeding standards without an estimate of intake.For pigs and poultry, prediction is relatively simple as it is based mainly on thecharacteristics of the animals involved (but it can become more complex in monogas-tric animals fed on fibrous foods). One simple equation used to predict the intakeof growing pigs fed on a standard diet (13.2 MJ DE) is fresh weight intake (kg/day) �3.2[1 - exp(-0.019W)], where W is the weight of the pig (kg). For a 35 kg pig, intakeis predicted to be 1.55 kg/day; for a 90 kg pig, the corresponding value is 2.62 kg/day.
For ruminants, prediction is much more difficult, as many food variables mayhave to be taken into account. For approximate predictions of intake there are somerules of thumb.Thus, the daily dry matter intake of beef cattle is often assumed to beabout 22 g/kg liveweight, whereas that of dairy cows is higher, at about 28 g/kg inearly lactation and 32 g/kg at peak intake (see Figure 17.2).

Prediction of food intake
475
An example of prediction equations for intake that may be used in conjunctionwith feeding standards is provided by the UK Agricultural Research Council’s Techni-cal Committee on Responses to Nutrients, which constructed a series of equations forpredicting the intake of grass silage by cattle (both dairy and beef) fed on silage andconcentrates.The following is an example of the equations derived for beef cattle:
where SDMI � silage dry matter intake (g/kg W 0.75 per day), CDMI � concentratedry matter intake (g/kg W0.75 per day), SDM � silage dry matter content (g/kg), AN �silage ammonia nitrogen content (g/kg total N), and DOMD � digestible organic matterin silage dry matter (g/kg).
Thus, this equation estimates that silage dry matter intake will be reduced byabout 0.54 g for each 1 kg of concentrate dry matter consumed. In addition, intakeof the silage is related to three measures of quality, two positively (dry matter con-tent and digestible organic matter content) and one negatively (ammonia nitrogen asa proportion of total nitrogen content). Other measures of silage quality employedin the equations were nitrogen content, butyric acid content and pH. Despitethis degree of complexity, the most precise of the equations could account for only60–70 per cent of the variation in intake, and so their accuracy of prediction waslimited. The UK Feed into Milk (FiM) intake equation for dairy cows is even morecomplicated than that described above for cattle. It accounts for around 93 per centof the variation in intake for grass-silage-based diets but only 75 per cent for mixedforage diets. Additional factors in the equation include the forage intake potential(FIP; g/kg W 0.75), which is the intake potential of a forage when provided as the solefeed and is predicted from the near-infrared (NIR) spectrum of the forage. Otherfactors include the concentrate crude protein content (g/kg DM) and body conditionscore (scale 1–5). Intake is predicted to decrease by 1.1 kg/day with each unitincrease in body condition score, which is consistent with the lipostatic control offeed intake described earlier.The inclusion of forage starch concentration (g/kg DM)in the equation reflects the increase in DM intake that is frequently seen whenstarchy forages such as maize or whole-crop wheat silages are included in dairy cowrations. For example, providing an equal mixture of grass silage and maize silagewith 0 g/kg and 300 g/kg DM starch, respectively, is predicted to increase DM intakeby approximately 1 kg DM/day compared with feeding grass silage alone. The fullequation is detailed below:
where FIP � forage intake potential (g/kg W0.75), CDMI � concentrate DM intake(kg/day), CS � body condition score (1–5 scale), W � liveweight (kg), El � energyoutput in the milk (MJ/day; see Chapter 16),WOL � week of lactation (constrainedto a maximum of 10), FS � forage starch concentration (g/kg DM), and CCP � crudeprotein concentration in the concentrate (g/kg DM).
The Australian Standing Committee on Agriculture has adopted a computer-basedmodel called GRAZFEED to predict the intake of grazing ruminants.The animal fac-tors in this model include the animal’s current weight in proportion to its so-called
+ 0.001988 (CCP * CDMI)
+ 0.04767El - 6.43(0.6916WOL) + 0.007182 * FS
+ 0.01896W + 0.7343CDMI - 0.00421(CDMI)2
DM intake (kg/d) = -7.98 + 0.1033FIP - 0.00814 (FIP * CDMI) - 1.1185 CS
SDMI = 24.96 - 0.5397CDMI + 0.1080SDM - 0.0264AN + 0.0458DOMD

Chapter 17 Voluntary intake of food
476
‘standard reference weight’ (SRW; see p. 366), body condition (i.e. fatness) and stageof lactation. The food factors include herbage digestibility and any supplementaryfoods.A correction is also made if the diet is deficient in rumen-degradable protein.Environmental factors in the model are the features of the pasture that determinethe structure of the sward, and there are also adjustments of intake for climatic factors.Expressing an animal’s liveweight as a proportion of its SRW has a large influence onpredicted intake. For example, a 400 kg steer that has reached its SRW (400 kg) ispredicted to eat 5.9 kg per day of dry matter from good-quality pasture (dry matterdigestibility 0.7), whereas a 400 kg animal of a larger breed that is only halfwaytowards its SRW (800 kg), and is therefore still growing, is predicted to eat 10.1 kgdry matter per day.
For the Cornell net carbohydrate and protein system for predicting the require-ments of cattle, the intake of lactating cows is predicted from the net energy contentof the food and the milk yield and milk fat content of the animal. Predicted valuesare then adjusted for six other factors: age, breed and body fat content of the cattle,the inclusion in the diet of any additives, the environmental temperature, and anothercomponent of the environment called ‘mud’.
SUMMARY
1. Control mechanisms for food intake operate atthe metabolic level (e.g. metabolite concentra-tions signalling the need to start or stop feed-ing) and at the level of the digestive system(e.g. signals from the degree of ‘fill’ of therumen). In addition, intake is influenced by fea-tures of the environment such as temperature.
2. In monogastric animals, control is mainly meta-bolic. In the short term, blood concentrationsof glucose and other nutrients may control in-take via the hypothalamus. In the longer term,fat depots send signals to the brain by the hormone messenger leptin.
3. The palatability of foods is not a major deter-minant of intake in farm animals, but it maybe of more importance in horses.
4. When the energy content of foods is changed,animals attempt to keep their energy intakeconstant by changing food intake, but thereare limits to the compensatory mechanism. Deficiencies of some specific nutrients, such asphosphorus, calcium, copper and thiamin, re-duce food intake. When given a choice of foods,animals are often able to select a diet with nutrient concentrations close to their needs.
5. Food intake in ruminants fed on high-energydiets is controlled metabolically, but in thosefed on forages it is limited by the rate at whichfood can be digested in the rumen. Forageswith a high content of cell walls (or neutral-detergent fibre) are digested slowly, are low indigestibility and promote low intakes. Disrupt-ing the cell walls of forages by mechanical orchemical treatment markedly increases intake.
6. Intake is related to metabolic weight (W 0.75). Inlate pregnancy it is restricted by the foetus reduc-ing rumen volume, but it increases in lactation.
7. When animals are grazing, their intake may berestricted by the distribution of herbage (e.g.short herbage restricting bite size). Grazing animals prefer leaves to stems and may rejectherbage that is dead or contaminated withexcreta.
8. Low environmental temperatures causeincreases in intake and high temperaturescause decreases.
9. For both monogastric and ruminant animals,there are equations for predicting intake fromfood composition and features of the animaland its environment.

Further reading
477
QUESTIONS
17.1 Using the intake prediction equation for pigs provided on p. 474, what is thepredicted intake for a growing pig of (a) 20 kg and (b) 75 kg?
17.2 A beef animal weighing 350 kg is being fed 2.35 kg/day of concentrates andprovided grass silage ad libitum. The grass silage has a dry matter content of250 g/kg, an ammonia-N content of 80 g/kg N and a DOMD value of 650 g/kgDM and the concentrates a dry matter content of 850 g/kg. From the equationprovided on p. 474, what is the predicted silage DM intake in g/kg W 0.75,kg DM/day and kg fresh weight/day?
17.3 Using the FiM intake equation provided on p. 475, predict the daily DM intakeof a dairy cow weighing 600 kg, in body condition score 2.5, producing 30 kgof milk with a fat content of 40 g/kg and in week 8 of lactation.The cow is feda basal ration of 50 : 50 grass silage and maize silage with a combined forageintake potential of 100 g/kg W 0.75 and starch content of 140 g/kgDM, and isfed 10 kg/day of a concentrate with a DM of 850 gDM/kg and a crude proteincontent of 250 g/kg DM.
17.4 From the information provided for horses on p. 474, what is the predicted DMand fresh weight intake of a 550 kg horse offered hay with a DM content of850 g/kg?
FURTHER READING
Agricultural and Food Research Council (AFRC) 1991 Technical Committee on Responses toNutrients, report no. 8. Voluntary Intake of Cattle, Wallingford, CABI (see also NutritionAbstracts and Reviews, Series B 61: 815–23).
Commonwealth Scientific and Industrial Research Organisation (CSIRO) 2007 NutrientRequirements of Domesticated and Ruminant Livestock, Melbourne, CSIRO.
Campling R C and Lean I J 1983 Food characteristics that limit voluntary intake. In: Rook J A F and Thomas P C (eds) Nutritional Physiology of Farm Animals, London, Longman.
Forbes J M 2007 Voluntary Food Intake and Diet Selection in Farm Animals, 2nd edn.,Wallingford, CABI.
Forbes J M,Varley M A and Lawrence T L J (eds) 1989 The Voluntary Food Intake of Pigs, Pen-cuik, British Society of Animal Production, occasional publication no. 13.
Hacker J B and Ternouth J H (eds) 1989 The Nutrition of Herbivores, Sydney,Academic Press.
Hill J 2007 Impacts of nutritional technology on feeds offered to horses: a review of effects ofprocessing on voluntary intake, digesta characteristic and feed utilization. Animal Feed Sci-ence and Technology 138: 92–117.
Houseknecht K L, Baile C A, Matteri R L and Spurlock M E 1998 The biology of leptin: areview. Journal of Animal Science 76: 1405–20.
National Research Council 2007 Nutrient Requirements of Horses, 6th rev. edn.,Washington,DC, National Academic Press.
Rutter SM 2006 Diet preference for grass and legumes in free-ranging domestic sheep and cattle:current theory and future application. Applied Animal Behaviour Science 97: 17–35.
Sykes A H 1983 Food intake and its control. In: Freeman B M (ed.) Physiology and Biochem-istry of the Domestic Fowl, London,Academic Press.


PART 5
The nutritional characteristics of foods
This part provides details of the foods that are commonly given to animals, including theirmain nutrient content and factors that need to be taken into account when they are used inanimal diets.
Grass and forage crops form the basis of the diet of herbivores and are considered in Chapter 18.
In order to supply food to animals throughout the year, forages and straws need to be har-vested at the appropriate time and conserved for feeding during the winter, when foragegrowth has declined. In some parts of the world, forages produced in the rainy season need tobe conserved for feeding during the dry period. In recent years, the most popular method ofconservation of grass has been as silage, and the ensilage process and nutritive value of theproduct are described in Chapter 19.
The other major method of conservation of forages is by drying, either naturally in the field ashay or straw or artificially as dried grass or lucerne. These foods are the subject of Chapter 20.
For ruminants, forages alone are not sufficient to achieve the levels of production required andfor monogastric animals, such as pigs and poultry, most forages are not appropriate since theirdigestion relies on microbial fermentation in the gut. In these situations, concentrated sourcesof nutrients are required and these foods are covered in the remaining chapters in this part.
The concentrated sources of energy in roots, tubers and cereals grains are described inChapters 21 and 22. Many energy and protein crops are grown primarily for human consump-tion, but during their processing by-products are created that are used as animal foods. Theby-products of cereal use by man are also considered in Chapter 22. Chapter 23 gives details of the major protein foods, both plant- and animal-derived, and specialist productssuch as synthetic amino acids and non-protein nitrogen sources.
In addition to the main foods considered above, other materials are often added to the dietsof animals in order to enhance the efficiency of nutrient use or modify conditions in the gutso that they are beneficial to the animal. These food additives are described in Chapter 24.


481
18.1 Pastures and grazing animals
18.2 Grasses
18.3 Legumes
18.4 Other forages
18 Grass and forage crops
18.1 PASTURES AND GRAZING ANIMALS
From a nutritional point of view, the simplest pastures are those created by sowing asingle species of pasture plant, which may be a grass such as Italian ryegrass or alegume such as lucerne (alfalfa). These pastures have a limited life (1–4 years) andare described as temporary pastures. Sown permanent pastures normally includeseveral species of both grasses and legumes. Natural grasslands have an even greaterspread of species, which will include herbs and shrubs (some of which may be regardedas weeds). In this chapter we shall describe first the nutritional value of grasses(i.e. species of the Gramineae), and then the value of legumes (Leguminoseae).The chapter concludes with a description of special crops grown in association withpastures.
The nutrition of the grazing animal is different from that of housed livestock, forseveral reasons. In the first place, its diet is variable.As indicated above, the variabil-ity may be due to the botanical composition of pastures. There is also variabilityover time, for different species may grow at different times of the year, and even asingle species will change in composition and nutritive value as it grows to maturity.A second important feature of the grazing animal is that it has to spend time and en-ergy in harvesting its food.Thus, a cow consuming 15 kg of dry matter a day from apasture yielding 1000 kg of dry matter per hectare must harvest an area of 150 m2
per day with a mowing apparatus only 0.1 m wide.The diet of the grazing animal istherefore difficult to evaluate; moreover, even if its nutritive value is known, the op-portunities for correcting its deficiencies may be limited.
At its best, pasture herbage is a food of high nutritive value for ruminants. For ex-ample, young, leafy herbage from a perennial ryegrass pasture may contain 12 MJ ofmetabolisable energy and 200 g crude protein per kilogram of DM, and be eaten inquantities sufficient for the needs of a dairy cow for maintenance and the productionof 25 kg of milk per day. Unfortunately, the nutritive value of herbage often falls far

Chapter 18 Grass and forage crops
482
below its optimum; soil and climate may be unsuitable for growing the most nutri-tious pasture plants, and the grazing management system employed may fail toensure that herbage is consistently grazed at the stage of growth when its nutritivevalue is at its highest. In many grazing situations, the herbage barely supplies themaintenance needs of the animal.Achieving the optimal nutrition of grazing animalsis a continuing challenge for nutritional scientists and farmers.
18.2 GRASSES
Pattern of growth
In cold and temperate climates, grass starts to grow in the spring when soil temper-atures reach 4–6 °C. From then on, the pattern of growth is very much the same,irrespective of species or cultivar. There is a rapid production of leaf, followed byan increase in the growth of the stem, leading to the ultimate emergence of theflowering head and, finally, to the formation of the seed. As the grass grows in thespring, the concentration of DM in the crop increases, at first slowly and then morerapidly as the stems grow and the ears emerge and, finally, more slowly as the earsbegin to ripen.
In hot climates, soil temperature is likely to be high enough to allow grass growththroughout the year, but growth is commonly restricted by lack of water.Where theclimate is characterised by clearly defined wet and dry seasons, grass growth is veryrapid during a warm wet season, but as the soil dries out the herbage matures anddies, leaving a feed resource that is sometimes described as ‘standing hay’. Even inwetter conditions, plants in deep shade at the base of the sward may die, thus givingsenescent herbage of inferior nutritive value.
The rate at which grass grows is dependent upon the environment, the nutrientsavailable and the amount of leaf within the sward that is intercepting light. Immedi-ately after harvesting there is a period of slow regrowth, followed by an acceleratedrate and finally a period of decreasing growth as the herbage matures. As grassswards increase in leaf area, the photosynthetic capacity of successive newly ex-panded leaves is progressively reduced because of the increasing shade in which theydevelop.The rate at which regrowth occurs depends upon the maturity of the crop atthe time of harvesting. If the grass is young and leafy, it recovers more quickly andstarts regrowth earlier than when mature herbage is harvested. Typical growth ratesfor temperate pastures in the spring are 40–100 kg DM per hectare per day.
Chemical composition
The composition of the dry matter of pasture grass is very variable; for example, thecrude protein content may range from as little as 30 g/kg in very mature herbage toover 300 g/kg in young, heavily fertilised grass.The fibre content is, broadly, relatedinversely to the crude protein content, and the acid-detergent fibre may range from200 g/kg to over 450 g/kg in very mature moorland species of grasses.
The moisture content of grass is of particular importance when a crop is beingharvested for conservation; it is high in very young material, usually 750–850 g/kg,and falls to about 650 g/kg as the plants mature.Weather conditions, however, greatlyinfluence the moisture content.

Table 18.1 Composition of the dry matter of a sample of Italian ryegrass cut at ayoung leafy stage (g/kg)
Grasses
483
The composition of the dry matter is dependent on the relative proportions of cellwalls and cell contents.The cell walls consist of cellulose and hemicelluloses, reinforcedwith lignin.The cellulose content is generally within the range of 200–300 g/kg DM andthat of hemicelluloses may vary from 100 g/kg to 300 g/kg DM.The concentrationsof both these polysaccharide components increase with maturity; so also does thatof lignin, which reduces the digestibility of the polysaccharides.
The cell contents include the water-soluble carbohydrates and much of the pro-tein.The water-soluble carbohydrates of grasses include fructans and the sugars glu-cose, fructose, sucrose, raffinose and stachyose (see Table 18.1). In temperate grassesthe storage carbohydrate fructan is the most abundant of the soluble carbohydratesand is found mainly in the stem. Grasses of tropical and subtropical origin accumu-late starches, instead of fructans, in their vegetative tissues and these are storedprimarily in the leaves. The water-soluble carbohydrate concentration of grasses isvery variable, ranging from as little as 25 g/kg DM in some tropical species to over300 g/kg DM in some cultivars of ryegrass.
Proteins are the main nitrogenous compounds in herbage, with true proteinaccounting for about 80 per cent of total nitrogen.Although the total protein contentdecreases with maturity, the relative proportions of amino acids do not alter greatly.Similarly, the amino acid composition of proteins varies little among grass species.This is not surprising, as up to half of the cellular protein in grasses is in the form ofa single enzyme, ribulose bisphosphate carboxylase, which plays an important rolein the photosynthetic fixation of carbon dioxide. Grass proteins are particularly richin the amino acid arginine and also contain appreciable amounts of glutamic acidand lysine.They have high biological values for growth compared with seed proteins,with methionine being the first and isoleucine the second limiting amino acid forgrowth. However, because of the considerable metabolism of amino acids in therumen, this factor is of little significance to ruminant animals. In general, the proteincontents of tropical grasses tend to be lower than those of temperate species.
The amino acid composition of forages is clearly important when the feeds areused as protein sources for non-ruminants. For ruminants, however, the most impor-tant characteristics of forage proteins are their rumen degradability and their overalldigestibility. In immature forages, both measures are commonly very high (0.7–0.8),
Proximatecomposition
Carbohydrates Nitrogenouscomponents
Otherconstituents
Crude protein 190 Glucose 16 Total N 30 Lignin 52Ether extract 45 Fructose 13 Protein N 27Crude fibre 208 Sucrose 45 Non-protein N 3Nitrogen-free Oligosaccharidesa 19
extractives 449 Fructans 70Ash 108 Galactan 9
Araban 29Xylan 63Cellulose 202
aExcluding sucrose.

Chapter 18 Grass and forage crops
484
but they decline as the forages mature (and their total protein content declines). Inmature herbage, a significant proportion of the protein may be indigestible becauseit is bound to fibre (acid-detergent insoluble nitrogen,ADIN; see p. 328).
The non-protein nitrogenous fraction of herbage varies with the physiologicalstate of the plant. Generally, the more favourable the growth conditions, the higheris the non-protein nitrogen content and the total nitrogen value, and as the plantsmature the contents of both decrease. The main components of the non-proteinnitrogen fraction are amino acids, and amides such as glutamine and asparagine,which are concerned in protein synthesis; nitrates may also be present, and thesemay be toxic for grazing animals.
The lipid content of grasses, as determined in the ether extract fraction, is com-paratively low and rarely exceeds 60 g/kg DM.The components of this group includetriacylglycerols, glycolipids, waxes, phospholipids and sterols.Triacylglycerols occuronly in small amounts and the major components are galactolipids, which constituteabout 60 per cent of the total lipid content.The main fatty acids in forages are listedin Table 3.5 in Chapter 3.The most abundant is alpha linolenic acid (18:3n-3), whichcomprises about 50 per cent of the total.This plant fatty acid is important in animalnutrition because it is the precursor of longer-chain polyunsaturated acids, which inhuman nutrition are regarded as being beneficial to health (see Chapter 25). Despitethe hydrogenation of unsaturated fatty acids in the rumen (see Chapter 8), some ofthe n-3 acids in grasses are absorbed unchanged by ruminants and influence the n-3content of meat and milk fats. Hydrogenation of the polyunsaturated fatty acids ingrasses gives rise to conjugated linoleic acid, another acid with health-protectingproperties (see Chapter 25).
The mineral content of pasture is very variable, depending upon the species, stageof growth, soil type, cultivation conditions and fertiliser application; an indication ofthe normal range in content of some essential elements is given in Table 18.2.
Green herbage is an exceptionally rich source of β-carotene, a precursor of vitaminA, and the dry matter of the young green crop may contain as much as 550 mg/kg.
Table 18.2 Ranges of essential mineral contents of temperatepasture grasses
Element Low Normal High
g/kg DMPotassium �12 15–30 �35Calcium �2.0 2.5–5.0 �6.0Phosphorus �2.0 2.0–3.5 �4.0Sulphur �2.0 2.0–3.5 �4.0Magnesium �1.0 1.2–2.0 �2.5
mg/kg DMIron �45 50–150 �200Manganese �30 40–200 �250Zinc �10 15–50 �75Copper �3.0 4.0–8.0 �10Molybdenum �0.40 0.5–3.0 �5.0Cobalt �0.06 0.08–0.25 �0.30Selenium �0.02 0.03–0.20 �0.25

Grasses
485
Herbage of this type supplies about 100 times the vitamin A requirement of a graz-ing cow when eaten in normal quantities.
It has generally been considered that growing plants do not contain vitamin D,although precursors are usually present. Studies suggest, however, that vitamin D maybe present in herbage but in relatively small amounts.The greater vitamin D contentof mature herbage than of young material may be caused in part by the presence ofdead leaves in which vitamin D2 has been produced from irradiated ergosterol.
Most green forage crops are good sources of vitamin E and of many of the B vita-mins, especially riboflavin.
Factors influencing the nutritive value of herbage
Stage of growth
Stage of growth is the most important factor influencing the composition and nutri-tive value of pasture herbage. As plants grow there is a greater need for fibrous tis-sues to maintain their structure, and therefore the main structural carbohydrates(cellulose and hemicelluloses) and lignin increase, and the concentration of proteindecreases; there is therefore an inverse relationship between the protein and fibrecontents in a given species, although this relationship can be upset by the applicationof nitrogenous fertilisers.
The variations in chemical composition of two species of grasses, perennial rye-grass (Lolium perenne) and purple moor grass (Molinea caerulea), at three stages ofgrowth, are shown in Table 18.3. In addition to the changes in organic components,changes also occur in the mineral or ash constituents.The total ash content decreasesas the plant matures.This is reflected in the calcium content, which follows a similar
Table 18.3 Composition and nutritional value of Lolium perenne and Molineacaerulea grown in Scotland and harvested at three stages of maturity
Lolium perenne Molinia caeruleaa
24 May 7 July 4 Aug 3 July 16 Aug 6 Oct
Proportion of leaf 0.63 0.29 0.27 0.95 0.87 0.78DM (g/kg) 165 338 300 374 468 428
Components of DMb
g/kg DMCP 143 69 48 149 97 59Ash 88 68 74 27 29 20ADF 227 316 347 327 414 435Lignin 16 41 49 52 95 95
Organic matterDigestibilityc 0.80 0.68 0.59 0.67 0.54 0.48Intakec (g/kg W0.75/day) 73 56 39 70 44 28
aHarvested from a hill sward containing about 80 per cent M. caerulea.bCP � crude protein; ADF � acid-detergent fibre.cDetermined using sheep.
After Armstrong R H, Common T G and Smith H K 1986 Grass and Forage Science 41: 53–60.

Chapter 18 Grass and forage crops
486
pattern to that of the total ash in grasses.The magnesium content is generally high inthe early spring but falls off sharply; during the summer it rises, reaching high valuesin the autumn.
The digestibility of the organic matter is one of the main factors determining thenutritive value of forage; this may be as high as 0.85 in young spring pasture grassand as low as 0.45 in winter forage. The basic determinant of forage digestibility isthe plant anatomy. Plant cell contents, being mainly soluble carbohydrates and pro-teins, are almost completely digestible, but cell walls vary in digestibility accordingto their degree of reinforcement with lignin.Thus, digestibility decreases as plants in-crease in maturity, but the relationship is complicated by there being a spring periodof up to a month during which the herbage digestibility remains fairly constant.Thisperiod has been described as the ‘plateau’. The end of this period is associated insome plant species with ear emergence, after which digestibility of organic mattermay decrease abruptly. In grasses grown in the UK, this rate of decrease is about0.004 units per day.
Digestibility of grasses is also influenced by leaf/stem ratios.Techniques involvingfermentation in vitro have enabled the digestibility of different fractions of plants tobe determined. In very young grass the stem is more digestible than the leaf, butwhereas with advancing maturity the digestibility of the leaf fraction decreases veryslowly, that of the stem fraction falls rapidly.As plants mature, the stem comprises anincreasing proportion of the total herbage and hence has a much greater influenceon the digestibility of the whole plant than the leaf.
The decrease in digestibility with stage of growth is also reflected in the metabolis-able and net energy values of grasses, as illustrated in Table 18.4.The low net energyvalue of mature herbage is not only due to a low organic matter digestibility but isalso associated with a high concentration of cellulose. The digestion of this polysac-charide in the rumen and the metabolism of the end products give rise to a high heatincrement (see Chapter 11).
Species
The Gramineae form a very large family that has been subdivided into 28 tribes, ofwhich the six largest contain most pasture grasses of economic importance.All six of
Constituents (g/kg DM)Crude protein 186 153 138 97Crude fibre 212 248 258 312Cellulose 253 284 299 356
Energy (MJ/kg DMa)Metabolisable 13.1 12.2 11.6 8.9Net (for maintenance) 10.3 9.3 8.8 7.3Net (for liveweight gain) 6.9 6.9 5.6 3.8
aDetermined using mature sheep.
After Armstrong D G 1960 Proceedings of the Eighth International Grassland Congress, p. 485.
Cut 1,
young leafy
Table 18.4 Nutritional value of four cuts of perennial ryegrass
Cut 4,
full seedCut 3, ear
emergence
Cut 2, late
leafy

Grasses
487
these tribes have a wide distribution, but their importance in any particular region isdetermined largely by the temperature and to a lesser extent by the rainfall.The dis-tribution of these tribes, and some agriculturally important members of them, areshown in Table 18.5.
In temperate areas with a reasonably uniform distribution of rainfall, grassesgrow and mature relatively slowly and thus can be utilised at an early stage ofgrowth when their nutritive value is high. In warmer climates, however, grassesmature more rapidly, their protein and phosphorus contents falling to very low lev-els, and their fibre content rising (see Table 18.6). In the wet tropics the herbageavailable is commonly fibrous but lush (i.e. high in water content); in drier areas themature herbage becomes desiccated and is grazed as ‘standing hay’. In both casesdigestibility is low, typical values for tropical herbage being 0.1–0.15 units lowerthan for temperate herbage.The differences in composition between temperate andtropical grasses are not only a result of climate.Temperate species of grasses belongto the C3 category of plants, in which the three-carbon compound phosphoglycer-ate is an important intermediate in the photosynthetic fixation of carbon dioxide.Most tropical grasses have a C4 pathway of photosynthesis, in which carbon dioxide
Table 18.5 The main tribes of the Gramineae, their areas of major importance,and some examples of their grassland species
Tribe Major areas Examples
Agrosteae All temperate Agrostis spp. – bent grassesPhleum pratense – timothy
Aveneae Cold and temperate Holcus lanatus – Yorkshire fogDanthonia pilosa – tussock grass
Festuceae Temperate,particularly USA
Lolium spp. – ryegrassesFestuca spp. – fescuesBromus spp. – bromesEragrostis curvula – weeping love grass
Andropogon gayanus – gambaHyparrhenia rufa – Jaragua
Tropical and warm temperate
Eragrosteae
Andropogoneae Tropics, particularly SE Asia
Paniceae Tropics and subtropics Digitaria decumbens – pangola grassPanicum maximum – Guinea grassPaspalum dilatatum – dallis grassPennisetum purpureum – elephant grass
Table 18.6 Composition (g/kg DM) and ME values (MJ/kg DM) of three cuts ofJaragua grass (Hyparrhenia rufa) grown in Brazil
Stage of growth Composition ME
Crude protein Crude fibre Ether extract Ash
Vegetative 92 289 26 149 8.4Full bloom 35 314 19 136 7.0Milk stage 28 337 15 115 6.5
Adapted from Gohl B 1981 Tropical Feeds, FAO, Rome.

Chapter 18 Grass and forage crops
488
is first fixed in a reaction involving the four-carbon compound oxalacetate. Thelow-protein contents often found in tropical grasses are an inherent characteristic ofC4 plant metabolism, which is associated with survival under conditions of low soilfertility. Another feature of tropical species is their storage of carbohydrates asstarch, rather than as fructans.
A further factor of nutritional importance is that the anatomy of the leaves oftropical grasses differs from that of temperate grasses. In tropical grasses there aremore vascular bundles and thick-walled bundle sheaths, and hence more lignin, andin the central tissue of the leaf the mesophyll cells are more densely packed thanthose in temperate grasses.Thus, in tropical grasses, intercellular air spaces representonly 3–12 per cent of leaf volume compared with 10–35 per cent in temperate species.This may partly explain why tropical grasses have a higher tensile strength than tem-perate grasses, a feature that retards both mechanical and microbial degradation in therumen.The consequences of this are lower digestibility of tropical grasses and lowervoluntary dry matter intake.
The selection of pasture species and cultivars is based on such agronomic charac-ters as persistency and productivity, but nutritive value is also taken into account.Cultivars within a species generally differ to only a small degree in nutritive value, ifthe comparison is made at the same stage of growth, but differences between compa-rable species may be larger.A classical example for the temperate grasses is the dif-ference between British cultivars of perennial ryegrass (Lolium perenne) and ofcocksfoot or orchard grass (Dactylis glomerata).At the same stage of growth, cocks-foot has a lower concentration of soluble carbohydrates and is lower in dry matterdigestibility than ryegrass.
Pasture species may also influence the value of the herbage through their growthhabit.As discussed in Chapter 17, tall and spindly (as opposed to short dense) swardsare difficult for the animal to harvest efficiently, and so its intake may be reduced.
In Britain, perennial ryegrass is the most important species of sown pastures, butItalian ryegrass (Lolium multiflorum), timothy (Phleum pratense), cocksfoot and thefescues (Festuca spp.) are also common. In older pastures these are accompanied byweed species, particularly meadowgrass (Poa pratensis),Yorkshire fog (Holcus lanatus)and the bents (Agrostis spp.). In the uplands, however, some of these weed species, suchas the bents, along with other species such as mat grass (Nardus stricta) and purplemoor grass (Molinia caerulea) (see Table 18.3), are valued constituents of the sward.
Soils, fertilisers and weather
The type of soil may influence the composition of the pasture, especially its mineralcontent. Plants normally react to a mineral deficiency in the soil either by limitingtheir growth or by reducing the concentration of the element in their tissues, or moreusually by both. In addition, deficiencies of mineral elements may affect the utilisa-tion of herbage; thus, in sheep, sulphur deficiency reduces the digestibility of herbage.The most common mineral deficiencies of grass herbage are those of phosphorus,magnesium, copper and cobalt.
The acidity of the soil is an important factor that can influence, in particular, theuptake of many trace elements by plants. Both manganese and cobalt are poorlyabsorbed by plants from calcareous soils, whereas low molybdenum levels ofherbage are usually associated with acid soils.The induced copper deficiency knownas teart (see p. 123), associated with high herbage molybdenum levels, generally oc-curs on pasture grown on soils derived from Lower Lias clay or limestone.

Grasses
489
Liberal dressings of fertilisers can markedly affect the mineral content of plants; itis also known that the application of nitrogenous fertilisers increases leaf area andrate of photosynthesis.As a consequence, the crude protein content, and frequentlythe amide and nitrate contents, are increased.
Application of nitrogenous fertilisers also depresses the water-soluble carbohy-drate content of temperate grasses, which may have an adverse effect on fermenta-tion if the crop is preserved as silage (see p. 499). Fertilisers may also affect, indirectly,the nutritive value of a sward by altering the botanical composition. For example,legumes do not thrive on a lime-deficient soil, while heavy dressings of nitrogenencourage growth of grasses and at the same time depress clover growth.
Such factors as climate and season may influence the nutritive value of pasture.The concentration of sugars and fructans, for example, can be influenced markedlyby the amount of sunshine received by the plant. Generally, on a dull cloudy day, thesoluble carbohydrate content of grass will be lower than on a fine sunny day. Rain-fall can affect the mineral composition of pasture herbage. Calcium, for example,tends to accumulate in plants during periods of drought but to be present in smallerconcentration when the soil moisture is high; on the other hand, phosphorus appearsto be present in higher concentrations when the rainfall is high.
Grazing system
In many traditional grazing systems, animals are kept on the same area of pasturethroughout the year (continuous grazing). In such systems, the ideal ‘stocking rate’(i.e. animals per unit area) is one that maintains a perfect balance between thegrowth of new herbage and its harvesting by animals; in this situation, the animal ispresented with a constant supply of young (and therefore nutritious) herbage. Inpractice, this ideal situation is rarely achieved. If the rate of growth exceeds the rateof harvesting, herbage accumulates and matures, thus reducing the nutritive valueof the material on offer. However, an increase in the amount of herbage on offer allowsthe animals to graze selectively, and they are able to compensate to some extent forthe general fall in nutritive value by selecting plants, or parts of plants, that arehigher in nutritive value than the rest. For example, leaf may be selected in prefer-ence to stem. Such selective grazing is particularly important with pastures contain-ing a wide variety of plants (e.g. shrubs and trees as well as grasses and herbaceouslegumes). If the rate of harvesting exceeds the rate of growth of the pasture, then the‘grazing pressure’ on the sward is said to increase. Selection by animals is reduced,and the pasture plants may be so denuded of foliage that their root reserves are de-pleted and they fail to regrow. Both under- and overgrazing of pastures may changetheir botanical composition and therefore the nutritive value of their herbage.
In rotational grazing systems, pastures are grazed for short periods at a highstocking rate and grazing pressure; animals harvest most of the herbage on offer, andthe pastures are then rested for longer periods of recovery. For example, farmersmight divide their pastures into 28 paddocks and graze each for 1 day, thus allowing27 days for regrowth. Once a rotation has been established, animals should receiveherbage of reasonably constant nutritive value. In these systems the balance betweenherbage grown and herbage harvested may also be controlled by varying the numbersof animals or paddocks (e.g. some paddocks may be cut for silage).
Pastures are not necessarily harvested by grazing. In some areas, grass may be cutby machine and transported to housed animals.This practice of ‘zero grazing’ allowsgreater control over the diet of grass-fed livestock.

Chapter 18 Grass and forage crops
490
Nutrient balance
The effects of the factors already considered may often be attributed to the balanceof the three major groups of nutrients in grasses, namely protein, fibre and solublecarbohydrates. High fibre levels reduce digestibility and energy value. High contentsof water-soluble carbohydrates are rapidly fermented in the rumen and may depressthe pH and so reduce fibre digestion. Conversely, low contents of these carbohy-drates reduce microbial protein synthesis in the rumen, leading to an increased up-take of ammonia, with consequent energy costs of urea synthesis. An additionalfeature of grass proteins is that their rumen-undegradable fraction is often low. Theeffect of an imbalance is illustrated by the comparison of spring and autumnherbages.Autumn grass is generally high in protein but low in water-soluble carbohy-drate. It is as digestible as spring grass, but its net energy value is lower, typically by15–20 per cent.
Ideally, nutrient imbalances in grazed herbages should be corrected by giving sup-plements, and in practice animals may be given, for example, starchy concentrates tocorrect a shortage of soluble carbohydrates. Supplements, however, may not be fullyeffective because they cannot be mixed with the herbage and therefore do not actevenly in the rumen. In the recent past, plant breeders have been successful in in-creasing the soluble carbohydrate content of pasture plants, particularly ryegrasses.
Nutritional disorders associated with grasses
Nitrate poisoning
As mentioned earlier, nitrate can accumulate in grasses. Nitrate per se is relativelynon-toxic to animals. The toxic effect in ruminants is caused by the reduction of ni-trate to nitrite in the rumen. Nitrite, but not nitrate, oxidises the ferrous iron ofhaemoglobin to the ferric state, producing a brown pigment, methaemoglobin,which is incapable of transporting oxygen to the body tissues. Toxic signs includetrembling, staggering, rapid respiration and death. It has been reported that toxicitymay occur in animals grazing herbage containing more than 0.7 g nitrate-N/kg DM(2.8 g NO3), although the lethal concentration is much higher than this. Some au-thorities have quoted a lethal figure for nitrate-N of 2.2 g/kg DM, whereas othershave suggested a value far in excess of this.A sudden intake of nitrate may be partic-ularly dangerous; experimentally this may be brought about by drenching, but it mayoccur in practice when herbage that is normally non-toxic is eaten unusually quickly.Nitrate is sometimes less toxic if the diet also contains soluble carbohydrates.The ni-trate content of grasses varies with species, variety and manuring, although theamount present is generally directly related to the crude protein content. Cerealgrasses, maize and weeds such as thistles and docks may also contain toxic concen-trations of nitrate.
Mycotoxicoses
Several related disorders of grazing animals have as their primary cause the invasionof grasses by fungi, which produce substances known as mycotoxins. The conditionknown as ‘ryegrass staggers’ occurs in ruminants and horses grazing perennial rye-grass in New Zealand,Australia, North America and (occasionally) Europe.Affectedanimals are uncoordinated and may collapse, although mortality is low. The endo-phytic fungus involved, Acremonium loliae, produces the neurotoxic alkaloid

Legumes
491
lolitrem B.The tropical pasture plant Paspalum is associated with the related condi-tion, paspalum staggers, but the fungus involved in this case is Claviceps paspali,which is related to the ergot fungus (see p. 68), and the toxins are known as paspali-nine and paspalitrem A and B.An ergot alkaloid, ergovaline, is also produced by thefungus Acremonium coenophialum, which infects the grass tall fescue. Ergovalinecauses the condition known as ‘fescue foot’, in which grazing animals become lameand develop gangrene at their extremities owing to vasoconstriction.The last myco-toxin to be considered is sporidesmin; this is produced by the fungus Pithomyceschartarum, which grows in the pasture litter. In Australasia it causes liver damage ingrazing animals, which leads to the release into the circulation of bile and the chloro-phyll breakdown product phylloerythrin. These compounds cause jaundice andphotosensitisation of the skin, hence the name of the disorder, ‘facial eczema’.
Control of these mycotoxicoses is based on the use of fungicides on pasture, onthe selection of resistant plants and animals, and on the modification of grazingpractices to avoid consumption of infected herbage (e.g. avoiding the grazing of in-fected dead plant material close to the ground).
Grass sickness
Horses grazing pasture after a dry period can develop this condition, for which thescientific name is equine dysautonomia. It is characterised by muscular tremors, dif-ficulty or inability in swallowing, regurgitation of stomach contents, abnormalstance, impaction of the colon and loss of weight.These signs are the results of dam-age to the autonomic nervous system.This damage extends to the nerve cells in theautonomic ganglia and in the enteric nervous system, the plexus of neurons withinthe intestinal wall. The exact cause of grass sickness is not known but there is evi-dence that a botulinum toxin is involved, this arising from the organism Clostridiumbotulinum type C in the soil or on the herbage. Large amounts of the toxin havebeen found in the gut of animals suffering acute signs of the condition, and anti-bodies have been isolated in chronically ill animals. It is thought that the animal’ssusceptibility to the toxin is affected by its immune defences in the gut mucosa and isalso influenced by a nutritional trigger involving the biochemical status of the grass.
18.3 LEGUMES
Pasture and field crop legumes
The family Leguminoseae contains about 18000 species, which are valued for theirability to grow in a symbiotic relationship with nitrogen-fixing bacteria and for theirdrought resistance. The commonest legumes found in pastures are the clovers(Trifolium spp.), the main representatives being red clover (T. pratense) and whiteclover (T. repens) in the cooler and wetter regions such as Europe and New Zealand,and subterranean clover (T. subterraneum) in drier areas such as southern Australia.
Nutritionally, the clovers are superior to grasses in protein and mineral content(particularly calcium, phosphorus, magnesium, copper and cobalt), and their nutri-tive value falls less with age. Studies with white clover have shown that the rates ofreduction in particle size and of movement of particulate matter from the rumen aremore rapid than with grass. Sheep and cattle offered white clover as fresh forage con-sumed 20 per cent more dry matter than from grass of the same metabolisable energy

Chapter 18 Grass and forage crops
492
content. Similar high voluntary intakes of dry matter have been obtained from redclover and other legumes.
The sugars present in clovers are similar to those found in grasses, the main sugarbeing sucrose. Fructans are generally absent, but starch is present and concentrationsof this polysaccharide as high as 50 g/kg DM have been reported in the dried leavesof red clover.
Many tropical pastures are deficient in indigenous legumes, but determined ef-forts are being made to introduce them. In Australia, for example, the South Ameri-can legume centro (Centrosema pubescens) has been introduced into pastures of thewet tropical type, and siratro (Macroptilium atropurpureum) has been bred fromMexican cultivars for use in drier areas. Because tropical legumes are similar anatom-ically to temperate legumes, they differ much less in digestibility than do tropical andtemperate grasses.
Lucerne or alfalfa (Medicago sativa) also occurs in pastures, but like many otherlegumes it is more commonly grown on its own. It is found in warm temperate areasand in many tropical and subtropical countries.The protein content is comparativelyhigh and declines only slowly with maturity (Table 18.7). Lucerne grown in the UKtends to be high in fibre, particularly the stem, and at the late flowering stage crudefibre may be as high as 500 g/kg DM. Lucerne cultivars are distinguished by the timeof flowering, and for UK conditions early-flowering types are recommended. Thesevarieties usually flower in the second week of June, but to obtain a cut with accept-able digestibility the crop should be first harvested at the early bud stage (end ofMay), when the expected digestible organic matter (DOM) content would be620–640 g/kg DM, and subsequently cut at 6- to 8-week intervals to give DOM valuesof 560–600 g/kg DM.
In Britain, the small area of lucerne grown is harvested mainly for silage or forartificial drying (see Chapter 20), but in other parts of the world, notably the USA(where it is known as alfalfa), the crop is also used for grazing.
Berseem or Egyptian clover (Trifolium alexandrinum) is an important legumegrown in the Mediterranean area and India. It is valued for its rapid growth in thecooler winter season in the subtropics and for its good recovery after cutting or graz-ing. It has a nutritive value very similar to that of lucerne.
Sainfoin (Onobrychis viciifolia) is a legume of less economic importance thanlucerne, and in the UK it is confined to a few main areas in the south. In commonwith most green forages, the leaf is richer than the stem in crude protein, ether ex-tract and minerals, especially calcium. Changes that occur in the composition of theplant are due mainly to variation in stem composition and leaf/stem ratio.The crudeprotein content in the dry matter may vary from 240 g/kg at the early flowering
Table 18.7 Composition of the dry matter of lucerne
Pre-bud In-bud Early flower
Crude fibre (g/kg) 220 282 300Ash (g/kg) 120 82 100Crude protein (g/kg) 253 205 171Digestible organic matter (g/kg) 670 620 540Metabolisable energy (MJ/kg) 10.2 9.4 8.2
Adapted from MAFF 1975 Energy Allowances and Feeding Systems for Ruminants, technical bulletin no. 33, London, HMSO, p. 70.

Legumes
493
stage to 140 g/kg at full flower. Corresponding crude fibre values at similar stages ofgrowth may be 140 g/kg and 270 g/kg DM.
Peas (Pisum sativum), beans (Vicia faba) and vetches (Vicia sativa) are sometimesgrown as green fodder crops.When cut at the early flowering stage, they are similar innutritive value to other legumes.
Leguminous trees and shrubs
Animals grazing mature grass pastures are often able to supplement their diet by con-suming the foliage of trees and shrubs, many of which are legumes.The collective termapplied to food obtained in this way is ‘browse’; in addition to being harvested by ani-mals, browse may be cut and carried to housed livestock. The foliage of leguminoustrees is high in protein (200–300 g/kg DM) and minerals, but it is also high in fibre(500–600 g neutral-detergent fibre per kilogram of DM).Tannins (see below) and possi-bly other constituents reduce the palatability of browse, and so its nutritional value maybe as a food reserve, to be consumed when grass herbage is no longer available.
One of the best-known browse species is leucaena (Leucaena leucocephala), alsoknown as ipil-ipil, which is a valuable tropical legume cultivated extensively in manyparts of the world, notably in SE Asia, Latin America and the West Indies. It is a valu-able source of protein and minerals and is also rich in β-carotene. However, it alsocontains the toxic amino acid mimosine (see below). Other examples of legumeforages are gliricidia (Gliricidia sepium), sesbania (Sesbania sesban) and acacia (Acaciaangustissima), all of which are cultivated in Africa.
Condensed tannins in legumes
Many legumes, especially the browse species, contain appreciable concentrations ofcondensed (i.e. non-hydrolysable) tannins whose role in nutrition is problematical.Low to moderate concentrations precipitate soluble plant proteins and thus protectthem against degradation in the rumen (see Chapter 8), but if the proteins are toofirmly bound to the tannins they are not digested in the small intestine. For foliage witha high concentration of condensed tannins (55 g/kg DM), digestibility (especially ofprotein) tends to be low. However, lower levels of condensed tannins (20–45 g/kg DM),found typically in some pasture legumes such as sainfoin and birdsfoot trefoil, areconsidered to be beneficial to ruminants. By protecting proteins from hydrolysis inthe rumen, they increase amino acid absorption from the small intestine. They alsomodify gas production in the rumen, thereby reducing the danger of bloat (see below)and possibly reducing methane production. Condensed tannins are also claimed torestrict the growth of gut parasites.The most common pasture legumes (the clovers)do not contain appreciable amounts of condensed tannins, but attempts are beingmade to introduce them by plant breeding.
Nutritional disorders associated with legumes
A disorder that is frequently encountered in cattle and sheep grazing on legume-dominated pastures is bloat. The most serious problems are associated with cloversand lucerne.The primary cause of bloat is the retention of the fermentation gases ina stable foam (frothy bloat), preventing their elimination by eructation. Soluble leafproteins are thought to play the major role in the formation of the foam (see p. 178).As discussed above, legumes that contain significant concentrations of condensed

Chapter 18 Grass and forage crops
494
tannins (20 g/kg), such as sainfoin, are unlikely to cause bloat, probably because ofthe ability of tannins to precipitate soluble proteins. Frothy bloat can be treated byadministration of vegetable oils or chemical surfactants, and in New Zealand thesesubstances may be sprayed on to legume-rich pastures to prevent bloat.
Associated with grazing sheep on pure lucerne is a sudden death syndrometermed ‘redgut’.This is thought to be caused by the rapid passage of highly digestibleforage through the rumen that causes increased fermentation in the large intestine. Inearly weaning experiments in New Zealand, 1–3 per cent of lambs grazing lucernedied of this disorder.The incidence was reduced when the lucerne was supplementedwith meadow hay.
A large number of species of plants are known to contain compounds that haveoestrogenic activity. Pasture plants containing these phytoestrogens are mainly ofthe species Trifolium subterraneum (subterranean clover), T. pratense (red clover),Medicago sativa (lucerne) and M. truncatula (barrel medic).The oestrogens in Trifoliumsp. are mainly isoflavones, whereas those in Medicago sp. are usually coumestans.
Naturally occurring isoflavones and coumestans have relatively weak oestro-genic activity, but this activity can be increased as a result of metabolism in therumen. For example, the main isoflavone in subterranean clover, formononetin, isconverted to equol in the rumen. Some plants, e.g. T. repens (white clover), are nor-mally non-oestrogenic but when infected with fungi can produce high concentrationsof coumestan.
The consumption of oestrogenic pasture plants by sheep leads to severe infertilityand postnatal death in lambs. The infertility can persist for long periods after theewes have been taken off the oestrogenic pastures. The main cause of the infertilityis a cystic glandular hyperplasia of the uterus, which causes an increased flow ofmucus and hence poor sperm penetration to the oviduct.A temporary infertility mayoccur in ewes grazing oestrogenic pastures at the time of mating. Fertility is restoredwhen sheep are moved to other pastures. Improved cultivars of subterranean clovercontaining lower contents of oestrogenic substances are now grown in Australia.
Cattle grazing oestrogenic pastures do not appear to suffer the severe infertilityproblems that affect sheep.
Leucaena contains the toxic amino acid mimosine. In the rumen this is convertedto dihydroxypyridine (DHP), a compound with goitrogenic properties (see p. 127).Ruminants consuming large quantities of leucaena may suffer weight loss, thyroiddysfunction and loss of hair or wool (alopecia). In countries with a natural popula-tion of leucaena, grazing animals possess a rumen microorganism capable of destroy-ing DHP (Synergistes jonesii). In Australia, the ill-effects of introduced leucaenahave been ameliorated by inoculating grazing animals with rumen contents takenfrom animals in Hawaii.
18.4 OTHER FORAGES
Cereals
Cereals are sometimes grown as green forage crops, either alone or mixed withlegumes. Like the grain, the forage is rich in carbohydrate and low in protein, itsnutritive value depending mainly on the stage of growth when harvested (seeTable 18.8).The crude protein content of the cereal at the grazing stage is generallywithin the range of 60–120 g/kg DM.At the time of ear formation, the concentration

Other forages
495
of crude fibre falls as a result of the great increase in starch, which tends to maintainthe digestibility value.
Sugarcane
Sugarcane (Saccharum officinarum) is a tropical or subtropical perennial grass thatgrows to a height of 4.5–6.0 m or more. The crop is processed for its sugar, whichleaves two by-products: molasses and a fibrous residue termed bagasse. Sugarcanemolasses is a high-energy, low-protein food similar in composition to the molassesobtained as a by-product from sugar beet (see p. 536). Bagasse is a high-fibre, low-protein product of very low digestibility that is sometimes mixed with the cane mo-lasses for cattle feeding.The unmolassed bagasse has a digestibility of about 0.28, butthis can be dramatically increased to about 0.55 by short-term (5–15 min) treatmentwith wet steam at 200°C. Steam-treated bagasse, supplemented with urea, has beenshown to be suitable as a maintenance feed for beef cows.
In some countries, the whole sugarcane crop is used as forage for ruminants.Thewhole crop on a dry matter basis has an ME value of about 9 MJ/kg and a low crudeprotein content of about 40 g/kg.
Brassicas
The genus Brassica comprises some 40 species, of which the following are of agricul-tural importance: kales, cabbages, rapes, turnips and swedes. Some of the brassicasare grown primarily as root crops, and these will be discussed in Chapter 21.
Table 18.8 Composition of whole barley at different stages of growth
Stage of growtha
1 2 3 4 5 6 7
Dry matter (g/kg) 191 200 258 293 353 387 425
Components of DM (g/kg)Crude protein 103 87 72 67 56 60 66Crude fibre 313 321 286 253 204 195 254WSCb 193 200 265 326 255 185 86Fructose 60 50 41 31 29 31 22Glucose 60 60 42 29 28 20 11Sucrose 19 15 23 33 21 20 4Fructans 31 33 72 128 122 66 23Starch 3 3 4 10 185 348 413Calcium 5.1 5.5 5.2 4.1 3.5 2.3 1.9Phosphorus 2.3 2.0 1.8 1.7 1.6 1.7 2.1D valuec 62 54 58 61 63 61 55
aStage of growth: 1 � heading completed, 2 � flowering, 3 � watery kernels, 4 � milkykernels, 5 � early mealy ripe, 6 � late mealy ripe, 7 � ripe for cutting.
bWater-soluble carbohydrates.cDigestible organic matter as a percentage of the dry matter (in vitro).
Adapted from Edwards R A, Donaldson E and MacGregor A W 1968 Journal of the Science of Food andAgriculture 19: 656–60; and MacGregor A W and Edwards R A 1968 Journal of the Science of Food andAgriculture 19: 661–6.

Chapter 18 Grass and forage crops
496
Kales (Brassica oleracea)
The kales include a very wide variety of plant types, which range from short leafyplants 30 cm high, to types 2 m tall with stems strong enough to be used in building.Thecommonest short type is thousandhead kale (var. fruticosa) and the commonest talltype is marrowstem kale (var. acephala), which is known in Australasia as chou moelier.They are grown in temperate parts of the world to provide green fodder during winter,but in drier areas they may also be used to supplement summer grazing.
Kales are low in dry matter content (about 140 g/kg), which is rich in protein(about 150 g/kg), water-soluble carbohydrates (200–250 g/kg) and calcium (10–20 g/kg),and their digestibility is generally high. The woody stems of marrowstem kale arelower in digestibility than the rest of the plant and may be rejected by animals.
Rapes
The rapes grown in Britain are usually swede-rapes (B. napus), although turnip-rapes(B. campestris) also occur. Rape may be included in seed mixtures for pastures, inorder to provide forage until the grasses become established. The nutritive value ofrapes is similar to that of the kales.A forage rape and kale hybrid (var. Swift) is val-ued for fast growth combined with winter hardiness.
Cabbages (B. oleracea, var. capitata)
These are grown for both human and animal consumption and range in type fromopen-leaved to drumhead.All have a low proportion of stem and hence are less fibrousthan either kales or rapes.
Toxicity of brassica forage crops
All brassicas, whether grown as forage, root or oilseed crops, contain goitrogenicsubstances (see p. 127). In the forage crops these are mainly of the thiocyanate type,which interferes with the uptake of iodine by the thyroid gland and whose effectscan be overcome by increasing the iodine content of the diet.All animals grazing onforage brassicas may develop goitre to some extent, but the most serious effects arefound in lambs born to ewes that have grazed on brassicas during pregnancy; theselambs may be born dead or deformed. It has been suggested (but not adequatelyconfirmed) that cows grazing on kales may secrete sufficient goitrogen in their milkto cause goitre in children drinking it.
Forage brassicas may also cause a haemolytic anaemia in ruminants, in extremecases of which the haemoglobin content of the blood falls to only one-third of its nor-mal value and the red cells are destroyed so rapidly that haemoglobin appears in theurine (haemoglobinuria).The condition is due to the presence in brassicas of the unusualamino acid S-methylcysteine sulphoxide, which in the rumen is reduced to dimethyldisulphide:
2CH3 S.CH2CHNH2COOH + H2
O
CH3.S.S.CH3 + 2CH3CO.COOH + 2NH3
S-methylcysteine sulphoxide Dimethyldisulphide
Pyruvicacid
The dimethyl disulphide is known to damage the red cells. Green brassicas con-tain 10–20 g S-methylcysteine sulphoxide per kilogram of DM. The condition is

Summary
497
best avoided by ensuring that when kale or rape is consumed for an extended period(i.e. more than a month), it contributes no more than half of the animal’s total drymatter intake.
Green tops
Mangel, fodder beet, sugar beet, turnip and swede tops may all be used for feedingfarm animals. Care is required when feeding with mangel, fodder and sugar beettops, since they contain a toxic ingredient that may lead to extensive scouring anddistress and, in extreme cases, death.The risk appears to be reduced by allowing theleaves to wilt.The toxicity has been attributed to oxalic acid and its salts, which aresupposed to be reduced or removed by wilting.A recent study casts some doubt onthis theory, since the oxalate content of the leaves is practically unaffected by wilting.It is possible that the toxic substances are not oxalates but other factors that aredestroyed during wilting.
Swede and turnip tops are safe for feeding and may have a crude protein content inthe dry matter as high as 200 g/kg, the digestibility of the organic matter being about0.70; like kale, rape and cabbage, they may cause haemolytic anaemia in ruminants.
Sugar beet tops generally contain the upper part of the root as well as the greenleaves and are more digestible, about 0.77.All these green tops are excellent sourcesof β-carotene.
SUMMARY
1. Temporary pastures often consist of a single,sown plant species, whereas permanent pas-tures include several species of grasses andlegumes. Natural grasslands consist of a widevariety of plants, including shrub species.
2. As grazing animals are free to select their diet,their nutrient intake is generally unknown.They generally have to work hard to harvesttheir food.
3. Grasses grow from green leafy material to mature stems and flowering heads, and theirpattern of growth is reflected in their chemicalcomposition. Fructans and other soluble carbo-hydrates decline from about 250 g/kg to 25 g/kg DM, and protein from 250 g/kg to 50 g/kg DM. Fibre, in the form of cellulose and hemicelluloses, increases to as much as 600 g/kg DM. If not restricted by soil supplies,grasses are good sources of minerals (and alsoof vitamins, except vitamin D). Digestibility andmetabolisable energy value of grasses decreaseas they mature.
4. Although growth stage is the main determinantof the nutritive value of grasses, there are rela-tively small differences among temperate speciesbut large differences between temperate andtropical species. The latter differences are dueto plant anatomy and photosynthetic path-ways. Variations in soils and fertiliser applica-tions have major effects on minerals in grasses,but may also affect other nutrients; thus, fertiliser nitrogen increases plant protein content.
5. Grazing systems that allow selection by ani-mals tend to cause the accumulation of matureherbage of low nutritive value.
6. Nutritional disorders associated with grass pastures include nitrate poisoning, variousmycotoxicoses and (in horses) grass sickness.
7. In comparison with grasses, pasture legumescontain more protein and minerals, and starchin place of fructans. They are digested morerapidly than grasses and therefore promote

Chapter 18 Grass and forage crops
498
QUESTIONS
18.1 Outline the advantages and disadvantages of including legumes in mixed-species pastures.
18.2 What are the main differences between tropical and temperate grass species?
FURTHER READING
Acamovic T, Stewart C S and Topps J H (eds) 1997 Legume forages and indigenous browse forruminants in the semi-arid tropics. Animal Feed Science and Technology 69: 1–287.
Barry T N and Blaney B J 1987 Secondary compounds of forages. In: Hacker J B and TernouthJ H (eds) The Nutrition of Herbivores, Sydney,Academic Press.
Butler G W and Bailey R W (eds) 1973 Chemistry and Biochemistry of Herbage, Vols 1–3,London,Academic Press.
Fahey G C, Collins M, Mertens D R and Moser L E 1994 Forage Quality, Evaluation and Uti-lization, Lexington, KY,American Society of Agronomy.
Hopkins A (ed.) 2000 Grass, Its Production and Utilisation, 3rd edn, Oxford, Blackwell Science.
Humphreys L R 1995 Tropical Forages: Their Role in Sustainable Agriculture, New York,Wiley-Blackwell.
Jones D I H and Wilson A D 1987 Nutritive quality of forage. In: Hacker J B and Ternouth J H(eds) The Nutrition of Herbivores, Sydney,Academic Press.
Leng R A 1990 Factors affecting the utilisation of ‘poor quality’ forages by ruminants particu-larly under tropical conditions. Nutrition Research Reviews 3: 277–303.
Mello J P F and Devendra C (eds) 1995 Tropical Legumes in Animal Nutrition,Wallingford, CABI.
Min B R, Barry T N,Attwood G T and McNabb W C 2003 The effect of condensed tannins onthe nutrition and health of ruminants fed fresh temperate forages: a review. Animal FeedScience and Technology 106: 3–19.
Minson D J 1990 Forage in Ruminant Nutrition, New York,Academic Press.
Murphy J J (ed.) 2005 Utilisation of Grazed Grass in Temperate Animal Systems,Wageningen,Wageningen Academic Press.
Sotomayor-Rios A and Pitman W D (eds) 2002 Tropical Forage Plants: Development and Use,Boca Raton, FL, CRC Press.
Thomas C, Reeve A and Fisher G E J (eds) 1991 Milk from Grass, 2nd edn, Reading, BritishGrassland Society.
Whiteman P C 1980 Tropical Pasture Science, Oxford, Oxford University Press.
higher intakes. Clovers are grown with grasses,but other legumes, such as lucerne (alfalfa),are often grown alone. Shrub and treelegumes, such as leucaena, provide browse forgrazing animals.
8. The disorder bloat, in which gas accumulatesin the rumen of grazing animals, is caused bylegumes such as the clovers that contain highconcentrations of soluble leaf proteins and low
concentrations of the condensed tannins,which precipitate proteins.
9. Other forage crops include immature cereals,sugarcane (and its fibrous by-product bagasse),various brassica species and the green tops ofroot crops. Brassicas such as kale containgoitrogens and also the unusual amino acid S-methylcysteine sulphoxide, which causeshaemolytic anaemia in ruminants.

499
19.1 Silage, ensilage and silos
19.2 Role of plant enzymes in ensilage
19.3 Role of microorganisms in ensilage
19.4 Nutrient losses in ensilage
19.5 Classification of silages
19.6 Nutritive value of silages
19.7 Whole crop cereal and legume silages
19 Silage
19.1 SILAGE, ENSILAGE AND SILOS
Silage is the material produced by the controlled fermentation of a crop of highmoisture content. Ensilage is the name given to the process, and the container, ifused, is called the silo.Almost any crop can be preserved as silage, but the common-est are grasses, legumes and whole cereals, especially wheat and maize.
The first essential objective in preserving crops by natural fermentation is theachievement of anaerobic conditions. In practice this is done by chopping the cropduring harvesting, by rapid filling of the silo, and by adequate consolidation and seal-ing.The main aim of sealing is to prevent re-entry and circulation of air during stor-age. Where oxygen is in contact with herbage for any period of time, aerobicmicrobial activity occurs and the material decays to a useless, inedible and fre-quently toxic product.
The second essential objective is to discourage the activities of undesirable micro-organisms such as clostridia and enterobacteria, which produce objectionable fermen-tation products. These microorganisms can be inhibited either by encouraging thegrowth of lactic acid bacteria or by using chemical additives. Lactic acid bacteria fer-ment the naturally occurring sugars (mainly glucose and fructose) in the crop to a mix-ture of acids, but predominantly lactic acid.The acids produced increase the hydrogenion concentration to a level at which the undesirable bacteria are inhibited.The criticalpH at which inhibition occurs varies with the dry matter content of the crop ensiled.The attainment of the critical pH is more difficult with crops of high buffering capacity.Legumes are more highly buffered than grasses and are consequently more difficult toensile satisfactorily.With grass crops having a dry matter content of about 200 g/kg, theachievement of a pH of about 4.0 will normally preserve the crop satisfactorily, as long

Chapter 19 Silage
500
as the silo remains airtight and is free from penetration by rain. Wet crops are verydifficult to ensile satisfactorily and should either be prewilted under good weatherconditions or treated with a suitable additive. Similarly, crops low in water-soluble car-bohydrates, and those that are highly buffered, must also be treated with an effectiveadditive before ensiling. In the tropical regions, conservation of forage is difficult owingto the short rainy season and high temperatures. Crops have to be harvested at anearly stage of growth and often in wet conditions.Therefore, haymaking is difficult andensilage of the crop is often the only option.Tropical grasses and legumes are difficultto ensile as they have a low water-soluble carbohydrate content and a high bufferingcapacity.Therefore, steps must be taken to ensure satisfactory ensilage. Options includewilting of very wet crops, the use of acid or inoculant additives, mixing of legumes withcereal crops, and adding cereals or molasses at ensilage to provide a source of water-soluble carbohydrates.
The types of silo in which the farmer may choose to ferment the crop are veryvaried, ranging from small plastic bags to large cylindrical towers built of concrete,steel or wood. In recent years the amount of silage conserved as big bales, usuallyweighing 0.5–0.75 tonnes and encased in plastic bags or wrapped in plastic film, hasincreased dramatically. Provided the bags are well sealed and not punctured duringstorage, this method of conserving grass is satisfactory.The development of effectivechopper balers has increased the efficiency of the technique and improved thepreservation and nutritional quality of the silage. Currently, about 20–25 per cent ofUK silages are made by this method, but the commonest silo used is still of theclamp or bunker type. This generally consists of three solid walls some 2–3 m inheight and often built beneath a Dutch barn to protect the silage from the weather.When full, the surface of these silos is covered with plastic sheeting and weightedwith some suitable material such as tyres or bales of straw.
19.2 ROLE OF PLANT ENZYMES IN ENSILAGE
Immediately after cutting the crop and during the early stages of ensiling, chemicalchanges occur as a result of the activity of enzymes present in the plant tissue. Theprocesses of respiration and proteolysis are of particular importance in influencingthe nutritional value of the final product.
Respiration
Respiration may be defined as the oxidative degradation of organic compounds toyield usable energy. In higher plants, as in animals, oxygen is the terminal electron ac-ceptor. Carbohydrates are the major respiratory source and the substrate for oxida-tion is usually a hexose sugar, which undergoes glycolysis and subsequent oxidationvia the tricarboxylic acid cycle to carbon dioxide and water. In the harvested plant,biosynthetic reactions are limited and virtually all the energy in the hexose is con-verted into heat. In the isolated plant this heat energy would be dissipated into the at-mosphere, but in the silo the heat is retained in the mass of herbage, causing anincrease in temperature. This loss of soluble carbohydrates, through respiration, is awasteful process and may result in such a depletion of substrate that subsequent fer-mentation may be adversely affected. Plant respiration will continue in the silo aslong as both oxygen and a supply of substrate are available. The simplest method oflimiting respiration is to achieve anaerobic conditions in the silo as rapidly as possible.

Role of microorganisms in ensilage
501
Proteolysis
In fresh herbage, 75–90 per cent of the total nitrogen is present as protein.After har-vesting, rapid proteolysis (hydrolysis of peptide bonds) occurs and, after a few days ofwilting in the field, the protein content may be reduced by as much as 50 per cent.Theextent of protein degradation varies with plant species, DM content and temperature.Once the material is ensiled, proteolysis continues but the activity declines as the pHfalls.The products of proteolysis are amino acids and peptides of varying chain length.
Further breakdown of amino acids occurs as a result of plant enzyme action, al-though this is considered to be limited. Most destruction of amino acids in silage isbrought about by microbial activity rather than by plant enzymes.
19.3 ROLE OF MICROORGANISMS IN ENSILAGE
Aerobic fungi and bacteria are the dominant microorganisms on fresh herbage, but asanaerobic conditions develop in the silo they are replaced by bacteria able to grow inthe absence of oxygen.These include lactic acid bacteria, clostridia and enterobacteria.
Lactic acid bacteria
The lactic acid bacteria, which are facultative anaerobes (able to grow in the pres-ence or absence of oxygen), are normally present on growing crops in small numbersbut usually multiply rapidly after harvesting, particularly if the crop is chopped orlacerated. They can be divided into two categories: the homofermentative bacteria(e.g. Lactobacillus plantarum, Pediococcus pentosaceus and Enterococcus faecalis)and the heterofermentative bacteria (e.g. Lactobacillus brevis and Leuconostocmesenteroides). When the crop is ensiled, the lactic acid bacteria continue to in-crease, fermenting the water-soluble carbohydrates in the crop (see p. 483) to or-ganic acids, mainly lactic acid, which reduce the pH value. The homofermentativelactic acid bacteria are more efficient at producing lactic acid from hexose sugarsthan are the heterofermentative organisms (see Table 19.1). During ensilage, somehydrolysis of hemicelluloses also occurs, liberating pentoses, which may be fer-mented to lactic and acetic acids by most types of lactic acid bacteria.
Clostridia
Clostridia are present on crops, but the main source in silage is soil contamination.They occur in the form of spores and grow only under strict anaerobic conditions.They can be divided into two major groups: saccharolytic clostridia and proteolyticclostridia. The saccharolytic bacteria (e.g. Clostridium butyricum and Clostridiumtyrobutyricum) ferment lactic acid and residual water-soluble carbohydrates to bu-tyric acid, resulting in a rise in the pH. Proteolytic clostridia (e.g. Clostridium bifer-mentans and Clostridium sporogenes) ferment mainly amino acids to a variety ofproducts, including acetic and butyric acids, amines and ammonia (see Table 19.1).
Clostridia grow best at pH 7.0–7.4. They cannot tolerate acid conditions, and apH of 4.2 is usually considered to be low enough to inhibit their growth.The natureof the acids responsible for lowering the pH is important, with undissociated organicacids being the most potent. Clostridia are particularly sensitive to water availabilityand require very wet conditions for active growth. With very wet crops (i.e. those

Chapter 19 Silage
502
Table 19.1 Some fermentation pathways in ensilage
Lactic acid bacteriaHomofermentative
Glucose : 2 lactic acidFructose : 2 lactic acidPentose : lactic acid � acetic acid
HeterofermentativeGlucose : lactic acid � ethanol � CO2
3 Fructose : lactic acid � 2 mannitol � acetic acid � CO2
Pentose : lactic acid � acetic acid
ClostridiaSaccharolytic
2 Lactic acid : butyric acid � 2CO2 � 2H2
ProteolyticDeamination
Glutamic acid : acetic acid � pyruvic acid � NH3
Lysine : acetic acid � butyric acid � 2NH3
DecarboxylationArginine : putrescine � CO2
Glutamic acid : γ-aminobutyric acid � CO2
Histidine : histamine � CO2
Lysine : cadaverine � CO2
Oxidation/reduction (Stickland)Alanine � 2 glycine : 3 acetic acid � 3NH3 � CO2
EnterobacteriaGlucose : acetic acid � ethanol � 2CO2 � 2H2
with a DM concentration of about 150 g/kg), even the achievement of a pH value aslow as 4 may not inhibit their activity. Growth of clostridia is severely restricted ifthe dry matter of the ensiled material is above 300 g/kg, but complete inhibitionmay require considerably higher figures, perhaps as much as 400 g/kg.
As well as being inimical to preservation, clostridia may be a health hazard to an-imals on diets based on contaminated silage.A number of cases of botulism, causedby Clostridium botulinum, have been reported in horses and cattle receiving suchdiets. The condition is uncommon in the UK but is more common in the USA andthe Baltic countries. It has been claimed to be the causative organism of grass sick-ness of horses, although a nutritional trigger has also been postulated.
Listeria
Low dry matter silages contaminated with soil may also contain Listeria monocyto-genes, a bacterium known to be responsible for several diseases such as meningo-encephalitis, anterior uveitis, and placentitis and subsequent abortion in cattle. Anumber of fatalities in ruminant animals (mainly sheep) on silage diets have beenconfirmed as listerioses. Listeriosis in horses is uncommon, probably because silageis rarely given to horses.
Meningoencaphalitis, abortion and fatal septicaemias of foals have been reportedfollowing infection with L. monocytogenes.The organism has not been isolated from

Role of microorganisms in ensilage
503
silages with a pH below 4.7. Big bale silages are particularly at risk, owing to theirhigh surface area/volume ratio and consequent increased susceptibility to the ingressof air and mould infestation.
Enterobacteria
The enterobacteria associated with silage, sometimes described as ‘acetic acid bacte-ria’ or ‘coliform bacteria’, are usually present in very low numbers on crops. Unlikethe clostridia, they are facultative anaerobes, and consequently they compete withthe lactic acid bacteria for the water-soluble carbohydrates.They ferment these to amixture of products including acetic acid, ethanol and hydrogen. Like the clostridia,they can decarboxylate and deaminate amino acids, with consequent production oflarge concentrations of ammonia.The optimum pH for the growth of these organismsis about 7.0, and they are usually active only in the early stages of fermentation,when the pH is favourable for their growth. Examples of species commonly found insilage are Escherichia coli and Erwinia herbicola.
Bacillus species
These species are widespread contaminants of harvested grass, but their growth inwell-preserved silage is limited by the development of lactic acid. However, they areabundant in silage that has undergone aerobic deterioration. Bovine abortions havebeen attributed to the consumption of silage contaminated with Bacillus lichiniformis.
Fungi
Fungi, which are present in soil and on vegetation, grow either as single cells, theyeasts, or as multicellular filamentous colonies, the moulds. Yeasts associated withsilages include species of Candida, Saccharomyces and Torulopsis. They play a par-ticularly important role in the deterioration of silage when it is exposed to air.
The majority of moulds are strict aerobes and are active on the surface layers ofsilage. A wide variety have been isolated from different types of silage, particularlywhen aerobic decomposition has occurred. Many of them are capable of producingmycotoxins. Some of the commoner mycotoxergenic fungi found in silage areshown, along with their associated mycotoxins, in Table 19.2.
Table 19.2 Some fungi, and their mycotoxins, found in silage
Fungus Mycotoxin
Penicillium roqueforti Roquefortine A, B and C; PR toxin; microfinolicacid; penicillic acid
Byssochlamys nivea PatulinPaecilomyces viriotii PatulinAspergillus clavatus Patulin; cytochanasin E; tryptoquinolinsAspergillus fumigatus Fumiclavines A and C; fumitoxins A, B and C;
gliotoxin, several tremorgensAspergillus flavus Aflatoxins; cyclopiazonic acidFusarium culmorum Dioxynivalenol; T2 toxin; HT toxin; zearelenoneFusarium crookwellense Zearelenone

Chapter 19 Silage
504
There have been relatively few cases in which mycotoxicosis has been definitivelyidentified as the cause of disease in animals consuming silage or in human beingshandling it. In part, this may be because of the ability of the rumen microbes tometabolise some of the toxins, as is the case with zearelenone, ochratoxin and someof the trichothecenes. In addition, the ruminant appears to be able to metabolise in-gested trichothecenes with considerable efficiency. Failure to prove a causative effectdoes not preclude the occurrence of disease at subclinical levels. Many of the proveneffects of the mycotoxins on fertility, the immune system and the nervous system arelong-term and may show only after continued exposure.The potential for deleteriouseffects on animals consuming spoiled silage and workers handling it does exist, asdoes the danger of transfer of the toxins into the human food chain. Silage that hasundergone aerobic deterioration owing to mould infestation should not be given toanimals, and workers handling such material should do so with great care.
The achievement of adequate compaction and sealing during the making of silageshould reduce aerobic deterioration to a minimum as long as access of air during stor-age is denied. This may be a particular problem with silage made in big bales. Evensmall perforations of the plastic may be very serious owing to the large surfacearea/volume ratio in the bales. Birds can be a particular problem in this respect, but net-ting of the bale stacks can provide an effective deterrent.The bagged silages, as distinctfrom the wrapped silages, are also susceptible at the neck, where fungal infestationresults from an inadequate tie.
In most cases deterioration occurs after opening of the silo and during feeding.Good management of the exposed surface to limit access of air is essential in thecase of clamp and bunker silos at this time. In this context, the width of the face andthe rate of usage of the silage will be the important factors to be taken into account.Silages made with additives that restrict fermentation, and that have raised pH andsignificant amounts of residual water-soluble carbohydrate, are particularly suscepti-ble. Some measure of protection against fungal infestation may be provided by addi-tives containing organic acids or their salts.
BOX 19.1 Practical steps to ensure the successful ensilage of crops
In order to retain the maximum amount of nutrients in the crop and to ensure a successful preser-vation, certain practical steps must be taken during the silage-making process.These reflect the needto minimise the plant enzyme activity and to promote the appropriate microbial fermentation de-scribed in the text:
■ Cut the crop after a period of sunshine to ensure the maximum sugar content.■ Wilt to achieve a dry matter content of 250 g/kg to reduce effluent.■ Eliminate contamination with soil at all stages to avoid clostridial fermentation.■ Chop to aid compaction in the silo and exclusion of air.■ When filling the silo, prevent air movement and oxidation and heating resulting from plant
enzyme action.■ Consolidate to expel trapped air (plant enzyme activity).■ Completely seal the silo against entry of air as soon as filling is completed to restrict plant
enzyme activity and promote anaerobic fermentation.■ For big bales, wrap well and move and stack carefully to avoid damage to the wrap and entry of air.

Nutrient losses in ensilage
505
19.4 NUTRIENT LOSSES IN ENSILAGE
Field losses
With crops cut and ensiled the same day, nutrient losses are negligible and even overa 24-hour wilting period losses of dry matter of not more than 1–2 per cent may beexpected. Over periods of wilting longer than 48 hours, considerable losses of nutri-ents can occur, depending upon weather conditions. Dry matter losses as high as 6per cent after 5 days and 10 per cent after 8 days of wilting in the field have been re-ported.The main nutrients affected are the water-soluble carbohydates and proteins,which are hydrolysed to amino acids.
Oxidation losses
These result from the action of plant and microbial enzymes on substrates, such assugars, in the presence of oxygen, with the concomitant formation of carbon dioxideand water. In a silo that has been rapidly filled and sealed, the oxygen trapped withinthe plant tissues is of little significance and causes dry matter losses of about only 1 per cent. Continuous exposure of herbage to oxygen, as sometimes occurs on thesides and upper surface of ensiled herbage, leads to the formation of inedible com-posted material. Measurements of this as surface waste can be misleading, sincelosses of dry matter of up to 75 per cent can occur in its formation, and the visiblewaste is only a small part of the lost material. Such losses may be particularly impor-tant when silage is made in big bales, owing to the high surface area/weight ratio andthe vulnerability of the bales to air penetration.
Fermentation losses
Although considerable biochemical changes occur during fermentation, especially tothe soluble carbohydrates and proteins, overall dry matter and energy losses arisingfrom the activities of lactic acid bacteria are low. Dry matter losses can be expected tobe less than 5 per cent and gross energy losses, because of the formation of high-energycompounds such as ethanol, are even less. In clostridial and enterobacterial fermenta-tions, nutrient losses will be much higher than in lactic acid bacterial fermentations be-cause of the evolution of the gases carbon dioxide, hydrogen and ammonia.
Effluent losses
In most silos, free drainage occurs and the liquid, or effluent, carries with it solublenutrients.The amount of effluent produced depends largely upon the initial moisturecontent of the crop. Several equations, based on the dry matter of the ensiled mate-rial, have been suggested for estimating effluent loss.Typical is that of Bastiman:
where Vn � volume of effluent produced (litre/t of herbage) and D � dry matter con-tent of herbage (kg/t).
As well as dry matter, factors such as type of silo, degree of consolidation and thenature and pretreatment of the crop all affect effluent loss, but this will be increasedif the silo is left uncovered so that rain enters. Effluent contains sugars, solublenitrogenous compounds, minerals and fermentation acids, all of which are valuable
Vn = 767 - 5.34D + 0.00936D2

Chapter 19 Silage
506
Table 19.3 Energy losses in the preservation of grass as silage
Process Classified as Approximate Causing factor
loss (%)
Residual respiration Unavoidable 1–2 Plant enzymesFermentation Unavoidable 2–4 MicroorganismsEffluent or field losses Mutually unavoidable 5–�7 or 2–�5 DM content, weather,
by wilting technique, management, cropsuitability
Secondary fermentation Avoidable 0–�5 Crop suitability, environmentin silo, DM content
Aerobic deterioration Avoidable 0–�10 Filling time, density, silo,during storage sealing, crop suitability
Aerobic deterioration after Avoidable 0–�15 As above, DM content silage,unloading (heating) unloading technique, season
Total 7– 40
After Zimmer E 1980 British Grassland Society Occasional Symposium No. 11 Brighton 1979 pp. 186–97.
>
Silage
Naturally fermented Additive-treateda
Well-preserved Badly preserved
Unwilted Wilted
Stimulants Inhibitors
Sugars Formic acidLactic acid bacteria Sulphuric acid
Enzymes Formaldehyde
Fig. 19.1 Classification of silages.aOnly a few commonly used examples are given.
nutrients. Ensiling crops with a dry matter content of about 150 g/kg may result ineffluent dry matter losses as high as 10 per cent.With crops wilted to about 300 g/kgDM, there may be little or no effluent loss.
A summary of the potential losses of energy occurring from cutting the cropthrough to feeding out the silage is shown in Table 19.3.
19.5 CLASSIFICATION OF SILAGES
Silages may be classified into two main categories, naturally fermented and additive-treated.These may be further subdivided as shown in Fig. 19.1.
Naturally fermented silages
Well-preserved unwilted silages
In this type of silage, commonly made from grasses and whole cereal crops, lactic acidbacteria have dominated the fermentation.A typical composition is shown inTable 19.4.

Classification of silages
507
Table 19.4 Typical composition of well-preserved silages made from perennialryegrassa and maize
Grass silages Maize silage
Unwilted Wilted
DM (g/kg) 186 316 285pH 3.9 4.2 3.9Total N (g/kg DM) 23.0 22.8 15.0Protein N (g/kg TNb) 235 289 545Ammonia N (g/kg TN) 78 79 63WSCc (g/kg DM) 10 47 16Starch (g/kg DM) – – 206Acetic acid (g/kg DM) 36 24 26Butyric acid (g/kg DM) 1.4 0.6 0Lactic acid (g/kg DM) 102 59 53Ethanol (g/kg DM) 12 6.4 �10
aBoth ryegrass silages made from the same ryegrass source.bTN � total nitrogen.cWSC � water-soluble carbohydrates.
Adapted from Donaldson E and Edwards R A 1976 Journal of the Science of Food and Agriculture 27:536–44; and Wilkinson J M and Phipps R H 1979 Journal of the Science of Food and Agriculture,Cambridge 92: 485–91.
These silages are characterised by having low pH values, usually between 3.7 and 4.2,and containing high concentrations of lactic acid. In grass silages, the lactic acid contentsgenerally lie in the range 80–120 g/kg DM, although higher amounts may be present ifsilages are made from wet crops rich in water-soluble carbohydrates. In maize silages,lactic acid contents are usually much lower than those of well-preserved grass silagesbecause of the higher DM content and lower buffering properties of the original crop.
The silages usually contain small amounts of acetic acid and may also contain tracesof propionic and butyric acids.Variable amounts of ethanol and mannitol derived fromthe activities of lactic acid bacteria and yeasts are present. Only very small quantities ofwater-soluble carbohydrates remain after fermentation, usually less than 20 g/kg DM.
The nitrogenous components of well-preserved silages are mainly in a soluble non-protein form in contrast to those present in fresh forage crops, where most of the totalnitrogen (TN) is present as protein. Some deamination of amino acids may occur duringfermentation, but this activity is likely to be low and consequently the ammonia con-tent of these silages will also be low, usually less than 100 g NH3 nitrogen/kg TN.
Because of the extensive changes to the water-soluble carbohydrates resulting in theformation of high-energy compounds such as ethanol (gross energy � 29.8 MJ/kg), thegross energy concentrations of these silages are higher than those of the parent material.
Well-preserved wilted silages
Wilting a crop before ensiling restricts fermentation increasingly as dry matter con-tent increases. In such wilted silages, clostridial and enterobacterial activities arenormally minimal, although some growth of lactic acid bacteria occurs, even inherbage wilted to dry matter contents as high as 500 g/kg. With very dry silages ofthis type, anaerobic storage in bunker silos is difficult and tower silos are preferredbecause there is less risk of air penetration. For bunker-type silos, a more normal aim

Chapter 19 Silage
508
is to prewilt the crop to a dry matter content of 280–320 g/kg.The composition of atypical wilted grass silage is shown in Table 19.4. In general, fermentation is re-stricted as dry matter content increases, and this is reflected in higher pH and solu-ble carbohydrate values, and in lower levels of fermentation acids.Wilting does notprevent proteolysis occurring, but if it is carried out rapidly, under good weatherconditions, then deamination of amino acids will be reduced.The gross energy con-tents are normally similar to those of the parent material.
Badly preserved silages
The term ‘badly preserved silages’ refers to silages in which either clostridia or entero-bacteria, or both, have dominated the fermentation. It does not include those silagesthat have deteriorated as a result of oxidation. Such aerobically deteriorated mate-rial is liable to be toxic and should never be offered to animals (see above).
Badly preserved silages are frequently produced from crops that either are ensiledat too high a moisture content or contain low levels of water-soluble carbohydrates.They may also be produced if the ensiled forage is deficient in lactic acid bacteria.The composition of two typical badly preserved silages, one made from cocksfootand one from lucerne, both low in dry matter and water-soluble carbohydrates, isshown in Table 19.5.
In general, silages of this type are characterised by having high pH values, usuallywithin the range 5.0–7.0. The main fermentation acid present is either acetic orbutyric acid. Lactic acid and residual water-soluble carbohydrates are present inlow concentrations or are absent. The ammonia nitrogen levels are usually above 200 g/kg TN.This ammonia, which is derived from the catabolism of amino acids, isaccompanied by other degradation products such as amines and various keto acidsand fatty acids (see Table 19.1).
Additive-treated silages
Silage additives can be classified into two main types: fermentation stimulants, suchas sugar-rich materials, inoculants and enzymes, which encourage the developmentof lactic acid bacteria; and fermentation inhibitors, such as acids and formalin, whichpartially or completely inhibit microbial growth.
Table 19.5 The composition of two badly preserved silages made fromeither cocksfoot (Dactylis glomerata) or lucerne (Medicago sativa)
Cocksfoot Lucerne
pH 5.4 7.0DM (g/kg) 162 131Total N (g/kg DM) 37 46Protein N (g/kg TN) 302 260Ammonia N (g/kg TN) 323 292WSC (g/kg DM) 4 nilAcetic acid (g/kg DM) 37 114Butyric acid (g/kg DM) 36 8Lactic acid (g/kg DM) 1 13
Adapted from McDonald P, Henderson A R and Heron S J E 1991 The Biochemistry of Silage,Marlow, Chalcombe Publications, p. 271.

Classification of silages
509
Fermentation stimulants
Molasses, which is a by-product of the sugar beet and sugarcane industries (see p. 536),was one of the earliest silage additives to be used as a source of sugars.The by-prod-uct has a water-soluble carbohydrate content of about 700 g/kg DM; the additive hasbeen shown to increase the dry matter and lactic acid contents, and to reduce the pHand ammonia levels in treated silages.
It was originally considered that, provided the general principles of silage makingwere adhered to, the natural lactic acid bacterial population on an ensiled cropwould be sufficient to ensure a satisfactory fermentation. However, it is now knownthat growing crops are often poor sources of lactic acid bacteria and that somestrains of these organisms are not ideally suited for ensiling purposes. A number ofcommercial inoculants containing freeze-dried cultures of homofermentative lacticacid bacteria are available and some of these have proved effective in improvingsilage fermentation. Successful control of fermentation, using these inoculants, de-pends upon a number of factors, including the inoculation rate, which should be atleast 105 (but preferably 106) colony-forming units (cfu)/g fresh crop, and the pres-ence of an adequate level of fermentable carbohydrates.The rapid domination of thefermentation by homolactic bacteria ensures the most efficient use of the water-solublecarbohydrates and, when levels of these in the crop are critical, increases the chancesof producing a well-preserved silage. An illustration of the beneficial effects of amixture of two homofermentative strains of lactic acid bacteria on the fermentationof an ensiled ryegrass crop is shown in Table 19.6.
When compared with the untreated control silage, the inoculated material had alower pH, higher concentrations of water-soluble carbohydrates and lactic acid, andlower concentrations of acetic acid and ethanol.
Table 19.6 Composition and nutritive value of grass silages inoculatedwith lactic acid bacteria compared with an untreated control
Untreated Inoculateda
DM (g/kg) 168 181pH 4.6 4.1Total N (g/kg DM) 33 32Protein N (g/kg TN) 386 407Ammonia N (g/kg TN) 130 88WSC (g/kg DM) 0 20Acetic acid (g/kg DM) 46 30Butyric acid (g/kg DM) 5 5Lactic acid (g/kg DM) 59 84Ethanol (g/kg DM) 13 7DM digestibilityb 0.74 0.77ME (MJ/kg DM) 11.4 12.5Silage DM intake (g/dayb) 681 792Liveweight gain (g/dayb) 71 129
aLactobacillus plantarum � Pediococcus pentosaceus (106 colony-forming units/g).bUsing lambs.
Adapted from Henderson A R, Seale D R, Anderson D H and Heron S J E 1990 In:Proceedings of the Eurobac Conference, Uppsala, August 1986, pp. 93–8.

Chapter 19 Silage
510
Some commercial silage additives now contain enzymes along with an inoculumof suitable strains of lactic acid bacteria. The enzymes are usually cellulases andhemicellulases, which degrade the cell walls of plants, thus releasing sugars, whichare then available for fermentation by the lactic acid bacteria. The enzymes appearto be most effective when added to young herbage ensiled at low dry matter content.
Fermentation inhibitors
A large number of chemical compounds have been tested as potential fermentation in-hibitors, but very few have been accepted for commercial use. One of the earliest wasa mixture of mineral acids proposed by A I Virtanen, the technique being referred to asthe AIV process.The acids, usually hydrochloric and sulphuric acids, were added to theherbage during ensiling in sufficent quantity to lower the pH value below 4.0. Thisprocess was for many years very popular in the Scandinavian countries and, if carriedout effectively, is a very efficient method of conserving nutrients. In recent years, how-ever, formic acid has largely replaced mineral acids in Scandinavia, and this organicacid, which is less corrosive than mineral acids, has also been accepted as an additivein many other countries. In the UK, it is commonly applied in the form of an aqueoussolution of ammonium tetraformate. The recommended application rate varies in therange 2.5–5 l/tonne of fresh crop, depending on the dry matter content of the crop.Complete inhibition of microbial growth does not take place, some lactic acid fermen-tation occurring.The beneficial effects of formic acid on the fermentation characteris-tics of crops low in water-soluble carbohydrates, such as legumes and grasses, havebeen well established and are shown in Table 19.7.
Table 19.7 Composition and nutritive value of grass silages treated with twodifferent additives
Untreated Formic acida Sulphuric acid +
formalinb
DM (g/kg) 181 184 176pH 3.8 3.7 4.0Total N (g/kg DM) 27 23 25Protein N (g/kg TN) 400 490 509Ammonia N (g/kg TN) 65 49 44WSC (g/kg DM) 7 84 81Acetic acid (g/kg DM) 34 15 25Butyric acid (g/kg DM) 0.02 0.03 0.21Lactic acid (g/kg DM) 98 44 64Ethanol (g/kg DM) 7 9 18DM digestibilityc 0.74 0.74 0.72ME (MJ/kg DM) 12.1 11.3 10.3Silage DM intake (g/dayc) 1020 1106 1020Liveweight gain (g/dayc) 200 231 236
a3.4 l/tonne of 85 per cent formic acid.b4.6 l/tonne containing 15 per cent sulphuric acid and 23 per cent formaldehyde.cUsing sheep.
Adapted from Henderson A R, McDonald P and Anderson D H 1982 Animal Feed Science and Technology 7: 303–14.

Nutritive value of silages
511
Formalin, a 40 per cent solution of formaldehyde in water, has been used as a fer-mentation inhibitor. It is applied either on its own or more effectively with an acidsuch as sulphuric or formic acid.Typical results of a sulphuric acid/formalin mixtureapplied to ryegrass at the rate of 4.6 l/tonne are shown in Table 19.7; the formalde-hyde combines with the protein, protecting it from hydrolysis by plant enzymes andmicroorganisms in the silo. The acid in the mixture acts as a fermentation inhibitor,preventing, in particular, the development of undesirable bacteria in the silage. For-malin is now used only in conjunction with formic acid, which has proved to be moreeffective than sulphuric acid. In Europe, the use of formaldehyde as an additive hasbeen banned owing to concern about its carcinogenic properties.
Table 19.8 Gross energy contents (MJ/kg DM) of silages and the grasses fromwhich they were made
No. Gross energy Standard Increase (%)
deviation (�/�)
Grasses 18 18.3 0.68Lactate silages 18 20.0 1.06 9.0
Grasses 7 18.4 0.45Wilted silages 7 19.1 0.40 3.8
Grasses 7 18.7 0.45Additive-treated silages 7 20.0 0.95 7.0
19.6 NUTRITIVE VALUE OF SILAGES
The nutritional value of a silage depends first upon the species and stage of growthof the harvested crop (see Chapter 18), and second upon the changes resulting fromthe activities of plant enzymes and microorganisms during the harvesting and stor-age period.
Energy
Gross energy
Owing to the production during ensilage of high-energy compounds, silages tend tohave higher gross energy values than the materials from which they were made.Themagnitude of the increase will depend upon the degree of fermentation which hasoccurred during ensiling.This is well illustrated by the data in Table 19.8.
In each case, ensilage has resulted in an increase in gross energy, but this is smallerfor the prewilted and additive-treated materials.
Metabolisable energy
The energy requirements of ruminant animals and the energy values of foods are cur-rently expressed in the UK in terms of metabolisable energy (see Chapters 11 and 12).
Faecal losses of energy when silages are consumed by animals usually lie between25 and 35 per cent and are mainly dependent upon the nature of the source mate-rial. The effects of the ensiling process on energy losses in the faeces are generally

Chapter 19 Silage
512
considered to be small. However, when the prewilting period is prolonged, and espe-cially when accompanied by adverse conditions such as high winds and intermittentrain, they may be increased by as much as 8 per cent. It has been claimed that theuse of formic acid as an additive in silage making has reduced faecal losses of energyby up to 7 per cent, but most work shows the reduction to be in the range of 0–2 percent. Formaldehyde, used as an additive at the rate of 6.4 l/tonne of fresh grass, hasbeen shown to reduce the digestibility of energy by 4–5 percentage units.
Losses of energy in urine, on silage diets, are variable, ranging from 3 to 7 per centof the gross energy. For most silages, a value of about 5 per cent would appear to be ac-ceptable.The major determinant of urinary energy loss appears to be the intake of ni-trogen. Following an intake of silage, the concentration of ammonia in rumen contentsrises sharply. It is generally considered that when the concentration exceeds 150 mg/l,the rumen microorganisms cannot fully utilise the nitrogen and the excess is lost asurea. It is important that a readily available source of energy is provided along with thesilage at this time if the rumen microorganisms are to make full use of the ammoniaand thus reduce potential loss of energy and nitrogen to the animal.
The most comprehensive studies involving energy losses as methane were thosecarried out at the Rowett Research Institute (see Further reading). For 48 silages,mean energy loss as methane was 7.7 per cent of the gross energy, with a standarddeviation of 0.71.
In practice, the metabolisable energy contents of silages vary widely, and it wouldbe very unwise to rely on an average figure for silages of any one class and evenmore so for individual materials. For over 2000 samples of farm grass silagesanalysed at the Scottish Agricultural College in the 2008–09 season, the range ofmetabolisable energy contents was 6.6–12.3 MJ/kg DM.
Routine determination of the ME of silages is frequently based on determinationof organic matter digestibility and an assumed relationship between digestible or-ganic matter and metabolisable energy. A comparison of some common methods ofestimating the organic matter digestibility of silage is given in Table 19.9. Clearly theNIRS method performs better than the chemical predictors, and even the in vitrotechnique, and it is now routinely used by the advisory services in the UK to assessthe nutritive value of silages.
Table 19.9 Comparison of several laboratory methods for predicting the organicmatter digestibility in vivo of grass silage
Validation statisticsaMethod
R2 SEP Slope Bias
NIRS (8-term) 0.76 2.6 0.93 -0.79In vitro OMDb 0.64 3.6 0.89 1.85Pepsin–cellulase 0.40 4.7 0.71 2.33Modified acid-detergent fibre 0.20 5.1 0.52 -0.59Acetyl bromide lignin 0.14 5.3 0.48 1.18
aR2 � proportion of variation explained by the regression equation; SEP � standard error ofprediction (%).
bOMD � organic matter digestibility.
After Barber et al. 1990 Animal Feed Science and Technology 28: 115–28.

Nutritive value of silages
513
The following equation is typical of the type of relationship with digestible or-ganic matter in dry matter (DOMD), which is used for calculating metabolisableenergy:
which assumes an energy loss in urine and methane of 15 per cent of the gross en-ergy, assumed to be 18.4 MJ/kg DM. For silages, this factor is likely to underestimatemetabolisable energy owing to the higher gross energy content of their dry matter.
Net energy
The net energy value of silages, like that of other foods, is related to metabolisableenergy by efficiency factors (k factors; see p. 271). For maintenance, the efficiency ofutilisation of metabolisable energy in good-quality silages (ME/GE qm � 0.56 - 0.70)has been found to vary over a narrow range of km � 0.68 - 0.71.As with other for-ages, efficiency of utilisation of silage metabolisable energy for growth and fatteningis lower and more variable (kg � 0.21 � 0.61; approximate mean 0.45). Calorimetricmeasurements of the efficiency of utilisation of silage metabolisable energy for lacta-tion are few in number, but they lie in the range 0.53–0.58 and are therefore lowerthan the commonly assumed value of 0.62.
In practice, most estimates of the productive potential of silages are based on kvalues calculated from the metabolisable energy concentration of the dry matter ofthe diet.A typical equation is that currently used in the UK for estimating kf:
This is based on calorimetric data and is derived from a general and not a silagepopulation. Frequently, an assumed value of 18.4 MJ/kg DM is used for GE in calcu-lating qm. This is acceptable for the general run of foods but is clearly inappropriatefor the majority of silages. Thus, for a silage with a metabolisable energy content of10.5 MJ/kg DM, the calculated value for kf would be 0.45, assuming a gross energycontent of 18.4, but 0.42, assuming a value of 19.6, which would be more appropri-ate for silage. Estimates of the productive potential of silages based on experimen-tally determined or book metabolisable energy values frequently appear to beoptimistic and this may, in part, be due to a failure to use an appropriate figure forGE in such equations.
Protein
The process of ensilage results in proteolysis and an increase in the proportion of am-monia nitrogen and free α-amino acid nitrogen in the silage compared with the origi-nal material.The proportion of potentially degradable nitrogen is reduced whereas theundegradable nitrogen, that associated with the cell walls, remains almost unchanged.Overall, there is an increase in the nitrogen that is readily available to the rumen mi-crobes and that may be regarded as rapidly degraded.
Prewilting, and the use of formic acid or formaldehyde as an additive in ensilage,will reduce the extent of proteolysis and give silages with lower contents of both am-monia nitrogen and free α-amino acid nitrogen, and will reduce the rate of degrada-tion of the nitrogen fraction.The use of bacterial inoculants and enzyme preparations asadditives will increase proteolysis and result in silages of higher effective degradability.
kf = 0.78qm + 0.006
ME (MJ/kg DM) = DOMD (g/kg DM) * 0.016

Chapter 19 Silage
514
The reduction in degradation rate will be beneficial with regard to nitrogen capture bythe rumen microbes and will reduce energy losses in urea. In the case of formalde-hyde, the beneficial effect in reducing degradability is accompanied by a lowereddigestibility in the lower gut.This may be significant when high levels of the additiveare used.
Nitrogen degradability values for silages show great variability, as illustrated inTable 19.10, and the use of tabulated values to characterise individual samples maylead to unacceptable errors in ration formulation.
The highly degradable nature of the nitrogen in most silages points to the needfor adequate supplementation of silage-based diets with a readily available supplyof carbohydrate, so that the rumen microbes can cope with the rapid influx of am-monia following an intake of silage and so maximise the synthesis of microbialprotein and minimise the loss of both nitrogen and energy. Silages, despite theirhigh gross energy contents, are generally considered to be poor sources of energyfor the microbes. This is recognised in the UK Metabolisable Protein System (seeChapter 13), where the metabolisable energy associated with fermentation acidsproduced during ensilage is discounted to give the fermentable metabolisable en-ergy (FME) that the rumen microbes can use. Similarly, in the Feed into Milk (FiM)system, for the calculation of the effectively degraded dry matter, the total fattyacids are subtracted from the soluble components so that they are discounted inthe calculation of ATP yield for microbial synthesis. Silage-based diets must, there-fore, contain a supplemental source of energy to maximise the utilisation of the ni-trogen of the diet. The addition of starch and certain sugars has been shown toincrease microbial protein synthesis in the rumen. A similar increase has been ob-tained by supplementing silage diets with soya bean meal, presumably by makingamino nitrogen available to rumen microorganisms otherwise dependent upon am-monia as their main source of nitrogen.
In general, the degradability of silage nitrogen is high, with most figures in therange of 75–85 per cent. Effective rumen degradability figures for various silages atdifferent outflow rates are given in Appendix 2, Table A.2.2.1. As previously indi-cated, such figures should be used only when valid estimates of degradability are notavailable, e.g. those based on NIRS (see Chapter 13).
Dry matter intake
The major determinant of nutrient intake on a silage diet is not the concentrations ofthe various nutrients the silage contains but the amount of it that is eaten.A numberof factors have been shown to affect dry matter intake (see Chapter 17).We are here
Table 19.10 Variation in rumen degradability of the protein of silages
Material No. Mean Standard Coefficient of 95% confidence
degradability deviation variation (%) limits
Pit, 1st cut 374 0.73 0.05 6.9 0.63–0.83Pit, 2nd cut 172 0.71 0.04 5.6 0.63–0.79Bale 15 0.74 0.05 6.8 0.64–0.84
After Weddell J R, Scottish Agricultural Colleges.

Nutritive value of silages
515
concerned with the silage characteristics that affect intake, and particularly thosethat may be used to give valid prediction of its potential intake. Among the charac-teristics that have been shown to be related to intake are:
■ pH;■ buffering capacity;■ lactate (g/kg DM);■ acetate (g/kg DM);■ butyrate (g/kg DM);■ ammonia nitrogen (g/kg TN);■ digestible organic matter (g/kg DM);■ rate of digestion;■ fibre (g/kg DM).
A number of these factors interact. Thus, the organic acids contribute to the acidityand to the buffering capacity of the silage, and their effects on intake will be re-flected in the effect of these two parameters. Similarily, high fibre concentrations, re-flecting the maturity of the crop, are associated with poor digestibility, slow rates ofdigestion and low intakes. However, if oxidation losses are high, there will be an in-crease in fibre content. Thus, we may be faced with similar levels of fibre of a verydifferent kind – one due to maturity of the crop and the other due to a concentrationeffect.The effect on dry matter intake will be different in each case.The complicatednature of the problem is highlighted further by pH. Here, the relationship withintake is not linear. Low pH reduces intake but so does high pH, the latter reflectingthe influence of the concentration of ammonia nitrogen in decreasing intake whileincreasing pH.
There is general acceptance of dry matter, digestible organic matter and ammonianitrogen as the major determinants of silage dry matter intake, and it behoves thesilage maker to optimise fermentation and to minimise secondary fermentation,clostridial activity and aerobic deterioration if satisfactory intakes of the product areto be achieved.
For the ration formulator, the problem is to predict how much silage dry matter aparticular animal will consume, so that its contribution to the animal’s nutrient re-quirements can be calculated. The traditional approach to the problem has been touse regression equations based on one or more of the parameters listed above.Typi-cal is the following equation (Lewis 1981) predicting the potential intake of silagedry matter (I) by dairy cattle:
where DM � dry matter (g/kg), DOMD � digestible organic matter (g/kg DM), andNH3-N � ammonia nitrogen (g/kg total nitrogen).
Such equations have worked well in practice, but published work would suggestthat the use of NIRS for predicting intake significantly improves prediction. A com-parison of some methods of prediction is given in Table 19.11.
Similar findings have been obtained by other workers, who quote a standarderror of prediction of 4.7 g/kg W0.75 and an R2 value of 0.79 from using an NIRStechnique for estimating silage dry matter intake in beef cattle.
Such estimates of silage dry matter intake have to be modified in the light of variousfactors, such as the class of animal to which it is to be offered, the level of concentrate
I (g/kg W0.75/day) = (0.103 * DM) + (0.0516 * DOMD) - (0.05 * NH3-N) + 45

Chapter 19 Silage
516
supplementation, the level of production, feeding technique and environmental fac-tors. For example, the equation for calculating I above is expanded for use with mixeddiets as follows:
Table 19.11 Comparison of the accuracy of some methods of predicting silage drymatter intake (expressed as the standard error of cross validation, g/kg metabolicliveweight per day)
Method Lambs Cows
Best equation based on traditional laboratory determinations (basal) 0.81 7.3Basal � fermentation values (HPLCa) 0.81 7.3Basal � fermentation values (ETb) 0.75 5.9NIRS on silage DM 0.52 5.1NIRS on wet silage 0.56 2.5
aHPLC � high-pressure liquid chromatography.bET � electrometric titration.
After Offer N W et al. 1998 Animal Science 66: 357–67.
where C � concentrate dry matter intake (g/kg W0.75/day) and Y � milk yield (kg/day).The UK Agricultural and Food Research Council proposed in 1992 the following
equation for predicting the intake of silage by cattle:
where F � P � yield of fat and protein (kg/day), Wn � weight of the cow in the weekunder consideration, C � concentrate dry matter (kg/day), and DOMD � digestibleorganic matter (g/kg DM).
The equation is claimed to be more accurate overall than the Lewis equation. Morerecently, a two-stage approach, similar to that of Lewis, has been adopted by FiM.Near-infrared reflectance spectroscopy is used to predict the forage intake potential(FIP), i.e. the intake of the silage when fed alone. Then the total dry matter intake(TDMI) is predicted using FIP (g/kg W0.75), the concentrate dry matter intake (CDMI,kg/day), the condition score of the cow (CS), the weight of the cow (W, kg), the milkenergy output (El MJ/day), the week of lactation (WOL), the forage starch concentra-tion (FS, g/kg DM) and the crude protein content of the concentrate (CCP, g/kg DM):
The intake potential of silages in horses has received less attention than that for rumi-nants. Horses consume high dry matter content silages and haylages well with dailydry matter intakes of around 60–100 g/kg W0.75. Low dry matter silages are not sowell consumed and dry matter intake may be only half of that of drier silages.
- 6.45(0.6919WOL) + 0.007182FS + 0.001988CCP * CDMI
+ 0.01896W + 0.7343CDMI - 0.00427CDMI2+ 0.04767El
TDMI (kg/day) = -7.98 + 0.1033FIP - 0.00814(FIP * CDMI) - 1.1185CS
+ 0.0136(DOMD)
SDMI(kg/day) = -3.74 - 0.387C + 1.48(F + P) + 0.0066Wn
+ 0.00175Y2
SDMI(kg/day) = (1.0681 - 0.002447IC - 0.00337C2- 10.9)W0.75>1000

Whole crop cereal and legume silages
517
However, this effect is not due to the dry matter content alone, since low dry mattersilages made from clover and lucerne have higher dry matter intake characteristicsthan grass silages of the same dry matter content. Dry matter intake is also related tonutrient requirements, with working horses showing higher intakes than those atmaintenance.
19.7 WHOLE CROP CEREAL AND LEGUME SILAGES
Wheat, barley and oat silage
The aim of preserving cereals as whole crop silage is to harvest the crop when theyield of digestible nutrients is at the maximum.As the crop matures the nutrients inthe grain increase as more starch is deposited but the digestibility of the straw de-creases. There is an optimum point where the yield from the grain and the strawcombined reach a maximum. For barley this occurs when the grain is at the firmdough stage and is hard. However, by this time, the moisture content of the crop israpidly decreasing and consolidation of the material in the silo can be difficult, re-sulting in the possibility of poor fermentation. In addition, the hard grains are notbroken sufficiently by cattle during chewing, and this leads to a waste in the form ofundigested grains passing out in the faeces. Therefore, traditionally, whole crop bar-ley, wheat and oat silages are made at a dry matter content of 250–450 g/kg whilethe crop is still mainly green and the grains are at the milky/soft cheese stage. Thisproduces a material that ferments well; the grains are efficiently digested and themetabolisable energy content is similar to grass silage, but the starch content ishigher and the crude protein content is lower.
As discussed above, the yield of dry matter and nutrients increases beyond thisstage.To avoid fermentation problems, whole crop cereal silages have been made ata dry matter of 500–600 g/kg using urea as an additive.This is converted to ammo-nia, which preserves the material. However, the problem of undigested grains stillpersists, leading to disappointing metabolisable energy values for this material.Also,as some of the material is still green at this stage, there was concern that the ammo-nia might react with sugars producing compounds called imidazoles, which have ef-fects on the brain (see ammonia treatment of hay in Chapter 20). More recently, theproblem of unbroken grains has been overcome by harvesting the crop with a forageharvester fitted with a grain processor to produce the material known as crackedwhole crop silage. In this way, the crop can be harvested when near to ripe, the grainsare full and the dry matter content is 650–800 g/kg.To ensure satisfactory preserva-tion and prevention of deterioration when the silage face is exposed to the air, whenthe silo is opened, the material must be treated with an additive.There are two com-mon alternatives: for the lower dry matter content material (around 650–750 g/kg),an inoculant can be used that multiplies in the silo to produce acids to reduce the pHand metabolites that have mould-inhibiting properties to prevent aerobic deteriora-tion. Crops at a higher dry matter content (above 700 g/kg) can be treated with urea.For successful preservation, it is essential that a source of the enzyme urease is in-cluded to ensure that the urea is rapidly converted to ammonia after incorporationinto the crop during ensilage. If any acidic fermentation occurs and there is littleurease present, the urea remains unchanged. Unlike other silages, which are acidic,this material is alkaline. The typical composition of whole crop cereal silages isshown in Table 19.12.
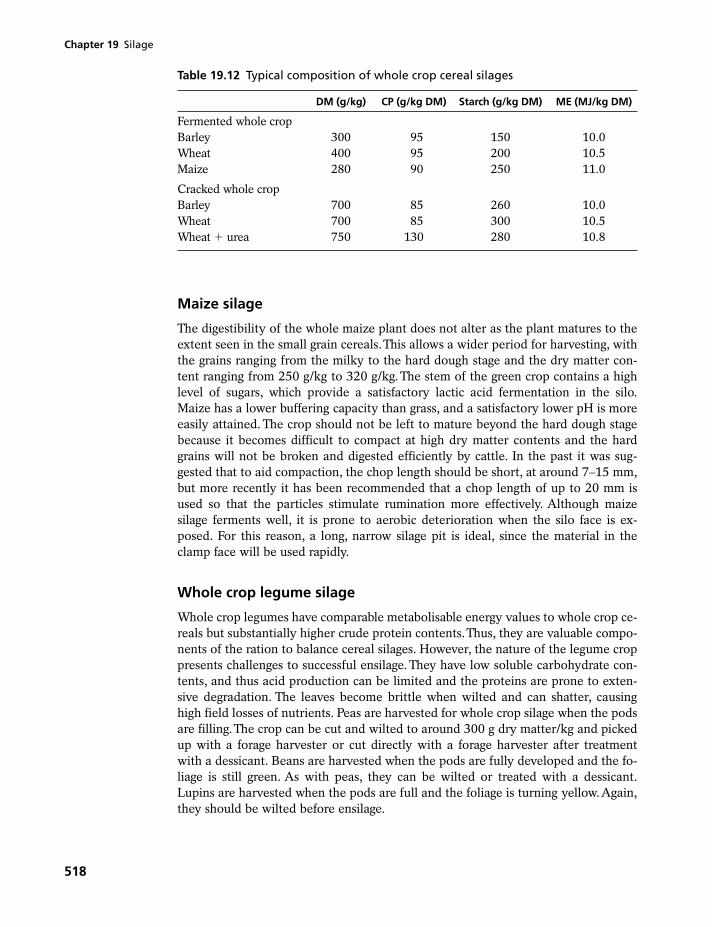
Chapter 19 Silage
518
Maize silage
The digestibility of the whole maize plant does not alter as the plant matures to theextent seen in the small grain cereals.This allows a wider period for harvesting, withthe grains ranging from the milky to the hard dough stage and the dry matter con-tent ranging from 250 g/kg to 320 g/kg. The stem of the green crop contains a highlevel of sugars, which provide a satisfactory lactic acid fermentation in the silo.Maize has a lower buffering capacity than grass, and a satisfactory lower pH is moreeasily attained. The crop should not be left to mature beyond the hard dough stagebecause it becomes difficult to compact at high dry matter contents and the hardgrains will not be broken and digested efficiently by cattle. In the past it was sug-gested that to aid compaction, the chop length should be short, at around 7–15 mm,but more recently it has been recommended that a chop length of up to 20 mm isused so that the particles stimulate rumination more effectively. Although maizesilage ferments well, it is prone to aerobic deterioration when the silo face is ex-posed. For this reason, a long, narrow silage pit is ideal, since the material in theclamp face will be used rapidly.
Whole crop legume silage
Whole crop legumes have comparable metabolisable energy values to whole crop ce-reals but substantially higher crude protein contents.Thus, they are valuable compo-nents of the ration to balance cereal silages. However, the nature of the legume croppresents challenges to successful ensilage. They have low soluble carbohydrate con-tents, and thus acid production can be limited and the proteins are prone to exten-sive degradation. The leaves become brittle when wilted and can shatter, causinghigh field losses of nutrients. Peas are harvested for whole crop silage when the podsare filling.The crop can be cut and wilted to around 300 g dry matter/kg and pickedup with a forage harvester or cut directly with a forage harvester after treatmentwith a dessicant. Beans are harvested when the pods are fully developed and the fo-liage is still green. As with peas, they can be wilted or treated with a dessicant.Lupins are harvested when the pods are full and the foliage is turning yellow.Again,they should be wilted before ensilage.
Table 19.12 Typical composition of whole crop cereal silages
DM (g/kg) CP (g/kg DM) Starch (g/kg DM) ME (MJ/kg DM)
Fermented whole cropBarley 300 95 150 10.0Wheat 400 95 200 10.5Maize 280 90 250 11.0
Cracked whole cropBarley 700 85 260 10.0Wheat 700 85 300 10.5Wheat � urea 750 130 280 10.8
Summary
519
SUMMARY
1. Silage is the material produced by controlledfermentation of a crop of high moisture con-tent. Ensilage is the name given to theprocess.
2. Ensilage is succesful if the activities of un-desirable organisms and the production ofobjectionable fermentation products areminimised, which is achieved by encouragingthe growth of lactic acid bacteria, whichlower the pH of the mass.
3. Stability of the preserved mass is maintainedby compaction and by efficient sealing ofthe silo.
4. In recent years, preservation in big bales hasincreased greatly at the expense of the morecommon bunker silo.
5. As a result of the activity of plant enzymes,water-soluble carbohydrates in the preserv-ing mass are dissipated as carbon dioxide andwater; temperature rises and preservationmay be put at risk owing to a shortage ofsubstrate for lactic acid production.
6. Plant enzymes also bring about proteolysisand the production of amino acids andpeptides from the protein of the originalmaterial.
7. The most efficient preservation is achieved bythe action of heterofermentative lactic acidbacteria.
8. Saccharolytic clostridia break lactic acid downto acetic and butyric acids, causing a rise inpH and putting preservation at risk. Prote-olytic clostridia break down amino acids withthe production of a number of unpleasantsubstances. Clostridium botulinum is thecausative organism of botulism and has beenassociated with grass sickness in horses.
9. There has been an increasing appreciation inrecent years of the importance of fungi inensilage owing to their action on cell wallstructures. A number of the fungi present insilage, particularly aerobically spoiled mate-rial, are capable of producing mycotoxins,
which can have very unpleasant effects onfarm animals and human beings.
10. Losses of nutrients arising from normal fer-mentation are minimal. Most losses occur asa result of aerobic deterioration before thematerial is ensiled, or as a result of ingress ofair during storage or after opening the silo.
11. Significant losses of dry matter may occur asa result of loss of effluent when crops of veryhigh moisture content are ensiled.
12. Additives are used in silage making if there isany doubt as to whether natural fermenta-tion is capable of ensuring satisfactorypreservation, or routinely as an insuranceagainst poor preservation. Stimulants providesubstrate for lactic acid production or boostthe population of desirable bacteria in thematerial to be ensiled. Fermentation in-hibitors are used to render the environmentinimical to the development of undesirablemicroorganisms.
13. The metabolisable energy contents of silagesare highly variable and difficult to predictsatisfactorily by laboratory means. Currently,near-infrared reflectance appears to be thebest single predictor.
14. Nitrogen degradability values are highly vari-able, and tabulated values are little morethan a rough guide.
15. Silage dry matter intakes tend to be low andare strongly influenced by a number of fac-tors, particularly pH, concentration of or-ganic acids, buffering capacity and ammonianitrogen content.
16. In silages made from the whole cereal crop,yields of dry matter and nutrients, especiallystarch, increase as the crop matures, but atlate maturity the material must be processedat harvest to ensure efficient digestion of thehard grains by cattle.
17. Whole crop legume silages can be difficult toensile successfully. They have higher crude pro-tein contents than whole crop cereal silages.

Chapter 19 Silage
520
QUESTIONS
19.1 Explain the role of plant enzymes and microbes in the process of ensilage.
19.2 What are the two classes of silage additive and how do they work? Give examplesof each type and describe the effect that the additives have on silage composition.
19.3 What factors affect the voluntary intake of silage?
19.4 Describe the causes of the losses of nutrients that can occur during silage making.
FURTHER READING
Batello C, Reynolds S, Speedy A, t’Mannetge L and Shelton M 1999 FAO Electronic Conferenceon Tropical Silage, www.fao.org/ag/AGP/AGPC/gp/SILAGE/Home.htm, accessed 8 April2010.
Lewis M 1981 In: Harkess R D and Castle M E (eds) Proceedings of the 6th Silage Conference,Edinburgh, pp. 35–6.
McDonald P, Henderson A R and Heron S J E 1991 The Biochemistry of Silage, 2nd edn,Marlow, Chalcombe Publications.
Merry R J, Jones R and Theodorou M K 2000 The conservation of grass. In: Hopkins A (ed.)Grass: Its Production and Utilization, 3rd edn, Oxford, Blackwell Science.
Murdoch J C 1989 The Conservation of Grass. In: Holmes W (ed.) Grass, Its Production andUtilization, 2nd edn, Oxford, Blackwell Scientific Publications.
Nash M J 1985 Crop Conservation and Storage, Oxford, Pergamon Press.
Stark B A and Wilkinson J M (eds) 1987 Developments in Silage, Marlow, Chalcombe Publications.
«Xtags error: Can’t find picture file:tag &pb[u2]»
521
20.1 Hay
20.2 Artificially dried forages
20.3 Straws and related by-products
20 Hay, artificially dried forages,straws and chaff
20.1 HAY
The traditional method of conserving green crops is that of haymaking, the successof which until fairly recently was entirely dependent upon the chance selection of aperiod of fine weather. The introduction of rapid drying techniques using field ma-chinery and barn drying equipment has, however, considerably improved the effi-ciency of the process and reduced the need to be dependent upon the weather.Although in many countries of western Europe, including Britain, ensilage has over-taken haymaking as the preferred mode of conservation of green forages, haymakingis generally the more common process.
The aim in haymaking is to reduce the moisture content of the green crop to alevel low enough to inhibit the action of plant and microbial enzymes.The moisturecontent of a green crop depends on many factors, but may range from about 650 g/kg to 850 g/kg, tending to fall as the plant matures. In order that a green cropmay be stored satisfactorily in a stack or bale, the moisture content must be reducedto 150–200 g/kg.The custom of cutting the crop in a mature state when the moisturecontent is at its lowest is clearly a sensible procedure for rapid drying and maximumyield, but unfortunately the more mature the herbage, the poorer is the nutritivevalue (see Chapter 18).
Chemical changes and losses during drying
Chemical changes resulting in losses of valuable nutrients inevitably arise during thedrying process. The magnitude of these losses depends to a large extent upon thespeed of drying. In the field the loss of water from the swath is governed by the nat-ural biological resistance of the leaf and swath to water loss, the prevailing weatherconditions and swath microclimate, and the mechanical treatment of the crop duringharvesting and conditioning.The losses of nutrients during haymaking arise from theaction of plant and microbial enzymes, chemical oxidation, leaching and mechanicaldamage.

Chapter 20 Hay, artificially dried forages, straws and chaff
522
Action of plant enzymes
In warm, dry, windy weather, the wet herbage, if properly handled and mechanicallyagitated, will dry rapidly and losses arising from plant enzyme activity will be small.The main changes involve the soluble carbohydrates and nitrogenous components. Inthe early stages of the drying process, changes in individual components of the water-soluble carbohydrates occur, such as the formation of fructose from hydrolysis of fruc-tans. During extended periods of drying, there is a considerable loss of hexoses as aresult of respiration, and this loss leads to an increase in the concentration of other con-stituents in the plant, especially the cell wall components, which are reflected in theneutral-detergent fibre content. In the freshly cut crop, proteases present in the plantcells rapidly hydrolyse the proteins to peptides and amino acids, hydrolysis being fol-lowed by some degradation of specific amino acids.The effects of wilting ryegrass underideal dry conditions and in a poor humid environment are compared in Table 20.1.
A number of devices and methods of treatment are used to speed up the dryingprocess in the field. Grass for hay made on a large scale is commonly cut with amower that incorporates a conditioner with rollers that break the cellular structureof the plant and allow the air to penetrate the resulting swath more easily.Additionalmachinery is used for turning, or tedding, the swath. For smaller-scale haymaking, amore traditional method that is practised notably in Switzerland, Italy, Germany andScandinavia is to make hay on racks, frames or tripods.Table 20.2 shows a comparison
Table 20.1 Changes in nitrogenous components of ryegrass/clover during the early stages of field drying
Dry matter Water-soluble Total N
(DM) (g/kg) carbohydrates (g/kg DM)
N components (g/kg total N)
(g/kg DM)
Protein N Non-protein N Ammonia N
Fresh grass 173 213 26.6 925 75 1.2Wilted 6 hours (dry conditions) 349 215 28.2 876 124 1.1
Wilted 48 hours (dry conditions) 462 203 28.9 835 165 2.6
Wilted 48 hours (humid conditions) 199 211 29.9 753 247 2.6
Wilted 144 hours (humid conditions) 375 175 31.0 690 310 26.4
From Carpintero M C, Henderson A R and McDonald P 1979 Grass and Forage Science 34: 311.
Table 20.2 Composition (g/kg DM) and nutritive value of perennial ryegrass and ofhay made from it by two methods in south-east Scotland
Fresh grass Tripod hay Field-cured hay
Organic matter 932 908 925Crude fibre 269 324 362Crude protein 128 121 99Digestible crude protein 81 72 47Digestible organic matter 711 614 547Metabolisable energya (MJ/kg DM) 10.7 9.2 8.2
aCalculated from digestible organic matter.

Hay
523
in composition and nutritive value between hay made by tripoding and thetraditional field-curing method. The difference between these two methods isreflected in the crude fibre, digestible crude protein, digestible organic matter andmetabolisable energy values.
Action of microorganisms
If drying is prolonged because of bad weather conditions, then changes broughtabout by the activity of bacteria and fungi may occur. Bacterial fermentation takesplace in cut herbage that has lain in the field for a few days, and leads to the produc-tion of small quantities of acetic and propionic acids. Mouldy hay is unpalatable andmay be harmful to farm animals and man because of the presence of mycotoxins.Such hay may also contain actinomycetes, which are responsible for the allergicdisease affecting man known as ‘farmer’s lung’.
Oxidation
When herbage is dried in the field, a certain amount of oxidation occurs.The visualeffects of this can be seen in the pigments, many of which are destroyed. The pro-vitamin carotene is an important compound affected and may be reduced from150–200 mg/kg in the dry matter of the fresh herbage to as little as 2–20 mg/kg inthe hay. Rapid drying of the crop by tripoding or barn drying conserves the carotenemore efficiently, and losses as low as 18 per cent in barn-dried hay have beenreported. On the other hand, sunlight has a beneficial effect on the vitamin D contentof hay because of irradiation of the ergosterol present in the green plants.
Leaching
Losses due to leaching by rain mainly affect the crop after it has been partly dried.Leaching causes a loss of soluble minerals, sugars and nitrogenous constituents, andhence a concentration of cell wall components, which is reflected in a higher fibrecontent. Rain may prolong the enzyme action within the cells, thus causing greaterlosses of soluble nutrients, and may also encourage the growth of moulds.
Mechanical damage
During the drying process, the leaves lose moisture more rapidly than the stems, so be-coming brittle and easily shattered by handling. Excessive mechanical handling is liableto cause a loss of this leafy material, and since the leaves at the hay stage are richer indigestible nutrients than are the stems, the resultant hay may be of low feeding value.Leaf loss during haymaking is particularly likely to occur with legumes such as lucerne.There are a number of modern machines available that reduce the losses caused by leafshattering. If the herbage is bruised or flattened, the drying rates of stems and leavesdiffer less. Baling the crop in the field at a moisture content of 300–400 g/kg, and sub-sequent drying by artificial ventilation, will reduce mechanical losses considerably.
Stage of growth
The stage of growth at the time of cutting is the most important crop factor deter-mining the nutritive value of the conserved product.The later the date of cutting, thelarger will be the yield, the lower the digestibility and net energy value, and thelower the voluntary intake of dry matter by animals. It follows that if their dryingconditions are similar, then hays made from early-cut crops will be of higher nutri-tive value than hays made from mature crops.

Chapter 20 Hay, artificially dried forages, straws and chaff
524
Plant species
The differences in chemical composition between species have already been dis-cussed in Chapter 18. Hays made from legumes are generally richer in protein andminerals than grass hay. Pure clover swards are not commonly grown for making intohay in the UK, although many ‘grass’ hays contain a certain amount of clover.Lucerne or alfalfa (Medicago sativa) is a very important legume that is grown as ahay crop in many countries. The value of lucerne hay lies in its relatively high con-tent of crude protein, which may be as high as 200 g/kg DM if it is made from a cropcut in the early bloom stage.
Cereals are sometimes cut green and made into hay, and this usually takes placewhen the grain is at the ‘milky’ stage. The nutritive values of cereal hays cut at thisstage of growth are similar to those of hays made from mature grass, although theprotein content is generally lower.Table 20.3 shows the composition of a number ofhays made from different species.These are representative values and give no indica-tion of the ranges in nutritive value. If extremes are considered, then it is possible toproduce hay of excellent quality with a digestible crude protein content of 115 g/kgDM and an ME value in excess of 10 MJ/kg DM (see Table 20.4). On the other hand,poor-quality hay made from mature herbage harvested under bad weather conditionsmay have a negative digestible crude protein content and an ME value below 7 MJ/kgDM; material of this type is no better in feeding value than oat straw.
Table 20.3 Composition and nutritive value of hays
Dry matter basis
No. of Crude fibre Crude Digestible Metabolisable
samples (g/kg) protein crude protein energya
(g/kg) (g/kg) (MJ/kg)
GrassesMeadow 686 298 113 67 8.8Mixed grass 68 301 114 63 8.6Cocksfoot 17 356 82 42 8.0
(orchard grass)Fescue 22 315 90 48 8.6Ryegrass 39 305 96 48 8.9Timothy 218 341 77 36 8.2
LegumesClover 284 319 143 89 8.6Lucerne 474 322 165 118 8.3Vetches 28 277 213 163 9.1Soya bean 42 366 156 101 7.8
CerealsBarley 19 265 93 52 8.6Oat 48 329 80 41 8.5Wheat 20 268 82 44 7.8
aCalculated from TDN values.
After Watson S J and Nash M J 1960 The Conservation of Grass and Forage Crops, Edinburgh, Oliver andBoyd.

Hay
525
Table 20.4 Composition (g/kg) and nutritive value of the dry matter of 47 grasshaysa made during 1963–65 in England and Wales
Range Mean SD
Ash 57–117 80 �11Crude fibre 274– 412 335 �31Crude protein 63–167 96 �22Digestible crude proteinb 21–115 51 –Digestible organic matter 391–711 563 �61Metabolisable energy (MJ/kg) 5.7–11.5 8.5 �1.1
aMainly ryegrass, but also including some timothy and meadow fescue hays.bEstimated from crude protein.
Adapted from MAFF 1972 ADAS Science Arm Report, London, HMSO, p. 95.
Changes during storage
The chemical changes and losses associated with haymaking do not completelycease when hay is stored in the stack or barn. The stored crop may contain100–300 g/kg moisture. At the higher moisture levels, chemical changes broughtabout by the action of plant enzymes and microorganisms are likely to occur.
Respiration ceases at about 40 °C, but the action of thermophilic bacteria may goon up to about 72°C.Above this temperature, chemical oxidation can cause furtherheating.The heat tends to accumulate in hay stored in bulk, and eventually combus-tion may occur.
Prolonged heating during storage can have an adverse effect on the proteins ofhay. New linkages are formed within and between peptide chains. Some of theselinkages are resistant to hydrolysis by proteases, thereby reducing the solubility anddigestibility of the proteins.
Susceptibility of proteins to heat damage is greatly enhanced in the presence of sug-ars, the damage being done by Maillard-type reactions (see p. 61).Temperature has animportant effect on the reaction rate, which is 9000 times faster at 70 °C than at 10 °C. The amino acid lysine is particularly susceptible to reactions of this type. Theproducts are colourless at first, but eventually they turn brown; the dark brown colourof overheated hays and other foods can be attributed mainly to Maillard reactions.
Losses of carotene during storage depend to a large extent on the temperature.Below 5 °C little or no loss is likely to occur, whereas in warm weather losses may beconsiderable.
The changes that take place during storage increase the proportion of cell wallconstituents and reduce nutritive value.
Overall losses
The overall losses during haymaking can be appreciable under poor weather condi-tions. In a study on six commercial farms carried out over a 3-year period in north-east England by the Agricultural Development and Advisory Service (ADAS), lossesof nutrients were measured between harvesting and feeding.Total dry matter lossesaveraged 19.3 per cent, made up of 13.7 per cent field loss and 5.6 per cent loss inthe bale. The losses of digestible organic matter and digestible crude protein wereboth about 27 per cent.

Chapter 20 Hay, artificially dried forages, straws and chaff
526
Hay preservatives
The main objective in using hay preservatives is to allow hay to be stored at moisturelevels that, in the absence of the preservative, would result in severe deteriorationthrough moulding. The chemical preservatives tested have included propionic acidand its less volatile derivative ammonium bispropionate. In the laboratory, propionicacid applied at a rate of 10 g/kg water (i.e. 3 kg/t of forage with a moisture contentof 300 g/kg) will prevent moulding and preserve the hay. However, in the field, it isdifficult to apply the preservative uniformly, and a higher application rate of 12 kgpropionic acid per tonne of forage with 300 g/kg of moisture is recommended. Hayswith moisture contents as high as 400–500 g/kg can, after propionate treatment, bestored satisfactorily, provided the additive is both applied in sufficient quantity anddistributed uniformly. Propionic acid should preferably be in a buffered form toimprove its handling characteristics. Biological additives such as lactic acid producingbacteria and enzyme preparations, as used for silage (see Chapter 19), have alsobeen used for hay. The bacterial additives need a supply of sugars and so should beused for early-cut (i.e. less fibrous) hays.
Anhydrous ammonia and urea, which are used to improve the nutritive value ofstraw (see p. 529), have also been used to preserve hay.Anhydrous ammonia injectedinto plastic-covered stacks of bales of moist hay has increased its stability, under aer-obic and anaerobic conditions, and has improved the nutritional value of the hay(but with some danger of the formation of toxins; see below).
ARTIFICIALLY DRIED FORAGES
The process of artificial drying is a very efficient, though expensive, method of con-serving forage crops. In northern Europe grass and grass–clover mixtures are thecommonest crops dried by this method, whereas in North America lucerne (alfalfa) isthe primary crop that is dehydrated. In both regions, artificially dried forage accountsfor less than 1 per cent of all conserved forage dry matter. The drying is broughtabout by passing the herbage rapidly through a rotating drum, where it meets hotgases at a temperature of about 800 °C.The temperature and time of drying are con-trolled very carefully so that the forage is never completely desiccated, and the finalproduct usually contains about 50–100 g/kg of moisture.As long as some moisture re-mains in the material, the temperature of the herbage is unlikely to exceed 100 °C.It is obvious, however, that if the material is left in contact with the hot gases toolong, then it will be charred or even completely incinerated.After drying, the forageis generally hammer milled and passed through a rotary die press to form pellets.Coarser products may be made by passing chopped material through a die press toform cobs or through a piston-type machine to form wafers.
Nutritive value
As a conservation technique, artificial drying is extremely efficient. Dry matterlosses from mechanical handling and drying are together unlikely to exceed 10 percent, and the nutritive value of the dried product is therefore close to that of thefresh crop.Typical analytical values from the British Association of Green Crop Dri-ers show dried grass to contain 200 g protein, 130 g sugars and 280 g acid-detergent
20.2
Straws and related by-products
527
fibre per kilogram of dry matter, and 10.2 MJ metabolisable energy per kilogram ofdry matter. Dried lucerne had a similar value for protein but contained less sugar (5 g/kg DM) and more ADF (360 g/kg DM). For horses, dried lucerne contains 9.5–10.0 MJDE/kg DM. High-temperature drying may reduce the digestibility offorage proteins, but it has the advantage of increasing the proportion of protein thatescapes rumen fermentation to about 0.4 (i.e. rumen protein degradability � 0.6).
With regard to minor nutrients, the carotene content of grass meal is quoted inthe above analytical data as 57 mg/kg DM, but high-quality dried grass could containas much as 150 mg/kg. During storage under ordinary commercial conditions for 6 months, dried forage exposed to light and air can lose as much as half its caroteneby oxidation. Dried forages may therefore be stored under refrigeration or inertgases to conserve carotene (and also vitamin E and the plant pigment xanthophyll).Because irradiation of sterols cannot take place during the rapid drying process, thevitamin D content of dried forage will be very low.
To convert 4–5 tonnes of fresh grass to 1 tonne of dried material requires about300 l of oil, and so although dried forages could be regarded as excellent feeds forruminants, the high cost of preparing them restricts their use to speciality feeds fornon-ruminants. In Britain, much of the dried forage is consumed by horses. Else-where, and especially in the USA, dried lucerne is used for poultry as a source ofvitamins and also to provide xanthophyll as an egg-yolk colourant.
STRAWS AND RELATED BY-PRODUCTS
Straws consist of the stems and leaves of plants after the removal of the ripe seedsby threshing, and are produced from most cereal crops and from some legumes.Chaff consists of the husk or glumes of the seed, which are separated from the grainduring threshing. Modern combine harvesters put out straw and chaff together, butolder methods of threshing (e.g. hand threshing) yield the two by-products sepa-rately. A by-product similar in composition to straw is sugarcane bagasse, describedearlier (see Chapter 18). Other fibrous by-products of cereals are referred to inChapter 22.All the straws and related by-products are extremely fibrous, most havea high content of lignin, and all are of low nutritive value. Their high fibre contentrestricts their use to that as food for ruminants.
On a world scale, the total production of straws and related materials has beencalculated to be sufficient to meet the maintenance needs of all ruminant livestock.However, the actual usage of straw as a food for livestock varies a great deal fromone part of the world to another. Much straw is produced in regions, such as theNorth American prairies, that have relatively few livestock, and the cost of transport-ing a bulky, low-value food to other regions is too great to permit its export. Otherparts of the world, such as Europe, produce a great deal of straw but are also wellsupplied with better-quality forages. In many tropical and subtropical countries thatcannot afford to use land for forage production, straw is the essential basal food forruminant livestock.
Maize, wheat and rice crops are the main sources of world straw supplies, but inthe UK barley provides much of the 15–20 per cent of total straw production that isused for animal feeding.When oats were grown for horses, oat straw was preferredfor animal feeding, but the decline in the area of this crop has made its straw lessimportant.
20.3

Chapter 20 Hay, artificially dried forages, straws and chaff
528
Barley and oat straw
Of the cereal straws, oat straw used to be popular in many areas of the UK as abulky food for store cattle, along with roots and concentrates, and in limited quanti-ties as a source of fibre for dairy cows. With the increasing use of barley grain as amajor concentrate food for farm animals, especially in northern Europe, large quan-tities of barley straw are available and attention has concentrated in recent years onmethods of trying to improve the nutritional value of this low-grade material.
The composition of both barley and oat straw may vary, although this is influencedmore by the stage of maturity of the crop at harvesting and environment than by thecultivar grown.The crude protein content of the dry matter of both straws is low, usu-ally in the range 20–50 g/kg, with the higher values obtained in crops grown under coldand wet conditions where they do not mature completely.The rumen degradability ofthe protein is relatively low (0.4), and of the undegradable protein much is likely to beindigestible. The major component of the dry matter is the fibre, which contains arelatively high proportion of lignin. The dry matter of barley straw consists of about400–450 g/kg of cellulose, 300–500 g/kg of hemicellulose and 80–120 g/kg of lignin.
The digestibility of the organic matter of these straws rarely exceeds 0.5 and themetabolisable energy value is about 7 MJ/kg DM or, in the case of winter barleycultivars, less than this. Of the ash fractions, silica is the main component and strawsgenerally are poor sources of essential mineral elements, as can be seen from theresults of a comparison between hays and barley straws shown in Table 20.5.
Apart from the low digestibility of these cereal straws, a major disadvantage is thelow intake obtained when they are given to ruminant animals.Whereas a 650 kg cowwill consume up to 12 kg of medium-quality hay, it will eat only about 9 kg of straw.Improvements in both digestibility and intake can be obtained by the addition ofnitrogen in the form of protein or urea.
Maize straw
Maize straw, or corn stover, has a higher nutrient content and is more digestible thanmost other straws. It has a crude protein content of about 60 g/kg DM and ametabolisable energy value of about 9 MJ/kg DM. In North America, corn stover is
Table 20.5 Some mineral contents of hay and barley straw obtained from 50 farmsin south-east Scotland, 1964–66
Hay Barley straw
Range Mean Range Mean
g/kg DMCa 3.0–6.3 4.6 1.5–4.5 3.1Mg 0.6–1.4 1.1 0.3–0.6 0.5Na 0.2–1.9 1.0 0.1–1.0 0.5
mg/kg DMCu 1.5–10.0 6.0 0.6–4.0 2.4Mn 30–150 80 1.8–22.0 12.1Fe 30–120 106 18–170 78
Adapted from Mackenzie E J and Purves D 1967 Edinburgh School Agricultural Experimental Work, p. 23.

Straws and related by-products
529
frequently used as a major part of the diet for dry, pregnant beef cows. The animalsmay be turned into the cornfields after the grain has been harvested or the stover maybe chopped, ensiled and consumed in a similar way to maize silage.Alternatively, thestover, after drying in the field, can be stacked or harvested as large round bales.
Rice straw
In many of the intensive rice-growing areas of the world, particularly Asia, this strawis used as a food for farm animals. Its protein content and metabolisable energyvalue are similar to those of spring barley straw. It has an exceptionally high ash con-tent, about 170 g/kg DM, which consists mainly of silica. The lignin content of thisstraw, about 60–70 g/kg DM is, however, lower than that of other cereal straws. Incontrast to other straws, the stems are more digestible than the leaves.
Wheat and rye straws
Wheat and rye straws are considered to be lower in nutritional value than barleystraw. However, the digestibility of most cereal straws can be markedly improvedwith alkali treatment (see below).
Legume straws
The straws of beans and peas are richer in protein, calcium and magnesium than thecereal straws and, if properly harvested, are useful roughage foods for ruminant ani-mals. Because of their thick fibrous stems, they are more difficult to dry than cerealstraws and frequently become mouldy during storage.
Alkali treatment of straws and other forages
When straw is exposed to an alkali, the ester linkages between lignin and the cellwall polysaccharides, cellulose and hemicelluloses, are hydrolysed, thereby causingthe carbohydrates to become more available to the microorganisms in the rumen.This effect was first used to improve the digestibility of straw in Germany in theearly 1900s, by a process that involved soaking straw for 1–2 days in a dilute solution(15–30 g/l) of sodium hydroxide and then washing to remove excess alkali. In theprocess currently used, chopped or milled straw is sprayed in a mixer with a smallvolume of concentrated sodium hydroxide (typically 170 l/t of straw of a solution of300 g/l of NaOH, supplying 50 kg NaOH).The product is not washed and the alkaliforms sodium carbonate, which gives the product a pH of 10–11.This process gives aproduct that may be mixed with other foods and may also be pelleted.
An alternative alkali to sodium hydroxide is ammonia, which may be applied tostraw in the anhydrous form or as a concentrated solution. As both forms arevolatile, the process has to be carried out in a sealed container, which may beformed by wrapping a stack of straw bales in plastic sheeting. As ammonia is aweaker alkali than sodium hydroxide, it reacts slowly with the straw; the timerequired for treatment ranges from 1 day, if heat is applied to raise the temperatureto 85 °C, to 1 month at winter temperatures.The ammonia is added at 30–35 kg/t ofstraw, and when the stack is exposed to the air about two-thirds of this is lost byvolatilisation.The remainder is bound to the straw and raises its crude protein content

Chapter 20 Hay, artificially dried forages, straws and chaff
530
Table 20.6 Performance of cattle and sheep fed on diets containing treatedand untreated roughagesa
Species Treatment Alkali
NaOH NH3
� � � �
Cattle No. of experiments 17 10Roughage in diet (%) 64 61Digestibilityb 0.56 0.64 0.58 0.63Intake (kg/day)b 7.2 8.1 6.8 7.8Liveweight gain (kg/day) 0.62 0.82 0.40 0.71
Sheep No. of experiments 10 7Roughage in diet (%) 66 65Digestibilityb 0.57 0.65 0.52 0.62Intake (g/day)b 994 1259 1156 1147Liveweight gain (g/day) 39 126 73 99
a The roughages used were mainly wheat and barley straws but included rice straw,and also maize by-products such as cobs and stalks. Some of the roughages wereground and pelleted.
bOf dry matter in total diet.
Adapted from Greenhalgh J F D 1983 Agricultural Progress 58: 11.
by about 50 g/kg. In addition to this advantage over sodium hydroxide, ammoniadoes not leave a residue of sodium (which increases the water intake of animals).
Both sodium hydroxide and ammonia have been used on a wide range of low-quality forages, including straws, husks and hays. Table 20.6 summarises the resultsof 44 experiments in which animals were fed on diets containing a high proportionof forage, either untreated or treated with sodium hydroxide or ammonia. It shouldbe noted that, in addition to improving digestibility, the alkali treatments causedincreases in intake.
A danger arising from ammonia treatment is that it may cause the production oftoxic imidazoles, which arise from reactions between ammonia and sugars. Foragescontaining more sugars than do straws, such as hays, are more likely to form imida-zoles, and their production is encouraged by high temperatures. The toxins cause aform of dementia, which in cattle is sometimes called ‘bovine bonkers’.
A chemical for treatment of forages that is easier to handle, and often cheaper,than ammonia is urea. When exposed to the enzyme urease, urea is hydrolysed toyield ammonia:
NH2—CO—NH2 � H2O S 2NH3 � CO2
Straw normally carries bacteria that secrete the necessary urease; it is importantthat the straw should be wet enough (about 300 g water per kilogram) to allow thehydrolysis to take place.After the application of urea, the straw is sealed in the sameway as for treatment with ammonia. Urea ammoniation of straw has proved reason-ably effective in improving its nutritive value but is not as consistently effective asammonia or sodium hydroxide.
Urea can also be used simply as a supplement to straw (i.e. be added at the timeof feeding). Table 20.7 compares the effects of adding urea at this time (in thisexperimental situation, by intra-ruminal infusion) with adding it to the straw a
dc dc
dc dc

Straws and related by-products
531
Table 20.7 A comparison of urea used to ammoniate rice straw with urea used as a dietary supplement for sheep
Straw treatmenta None None Urea Urea
Supplementb None Urea None Urea
(1) (2) (3) (4)
Dry matter digestibility 0.42 0.48 0.54 0.55Dry matter intake (g/day) 682 951 931 1114Liveweight change (g/day) �138 �20 �10 38Rumen ammonia-N (mg/litre) 12 104 57 203
aStraw sprayed with 1 l/kg of a solution containing 60 g urea, and then sealed for 28 days.b11.5 g urea and 2.35 g sodium sulphate per kilogram dry matter consumed, given bycontinuous intra-ruminal infusion.
Adapted from Djajanegara A and Doyle P T 1989 Animal Feed Science and Technology 27: 17.
month beforehand to generate ammonia. Both of these treatments, when appliedseparately (columns 2 and 3 versus column 1), improved intake and digestibility, andreduced the weight loss of the sheep, but the double treatment (column 4) gave thebest results, possibly because the urea-ammoniated straw (column 3) did not main-tain a sufficient concentration of ammonia in the rumen.
In addition to treating straw and hay, alkalis may be applied to whole crop cerealforages. In Chapter 19 the ensiling of cereals cut when immature was mentioned. Ifthey are cut later, the grain forms a greater proportion (e.g. 60 per cent) of the cropand its dry matter content is greater. Ammonia or sodium hydroxide raises thedigestibility of the straw in the crop and also acts as a preservative by preventingmould growth.
Other chemicals that have been used effectively to improve the digestibility ofstraw include alkaline hydrogen peroxide and mineral acids, but these are probablytoo expensive for practical use.
Supplementation of straws
Chemical treatments of straws have attracted a great deal of research interest, buttheir use in practice is somewhat limited. Countries that would benefit most fromthem have neither sufficient resources of chemicals nor the technology needed toapply them.The key to improvements in the utilisation of straw is supplementation.The first type of supplement required for straw is one that provides adequate sup-plies of nutrients for the rumen microorganisms, the critical nutrients being nitrogenand sulphur, and perhaps phosphorus, sodium and cobalt. In the case of the nitrogensupplement, the aim is to provide a reasonably constant rumen ammonia concentra-tion; if the nitrogen is in a soluble and rapidly degradable form, such as urea, thesupplement needs to be taken in frequently, in small quantities. Supplementarynutrients can be supplied as a solution sprayed on to the straw; alternatively, theymay be added to a small amount of concentrate food or offered to animals as feedblocks or licks. None of these methods is consistently effective, but the first ensuresthat straw and supplement are consumed together.
The second type of supplement required for straw is one that provides the animalwith additional protein that is not degraded in the rumen (digestible undegradableprotein; see Chapter 13).This often stimulates intake (see Chapter 17) and ensures a

Chapter 20 Hay, artificially dried forages, straws and chaff
532
proper balance between the protein and energy supplied to the animal’s tissues.However, supplements of this second type, which are often based on specially treatedvegetable protein sources, are in limited supply and expensive and therefore are un-suitable for widespread use in developing countries. In those countries, there is nowmuch interest in supplementing straw with locally available materials, especially for-ages from protein-rich leguminous shrubs such as Leucaena leucocephala andGliricidia sepium (see Chapter 19).These are valuable as sources of minerals and vita-mins, but they are less effective as sources of digestible undegradable protein.
SUMMARY
1. Hay is made mainly by the sun-drying of grassand other forage crops. After the crop hasbeen cut, its treatment in the field is intendedto minimise losses of valuable nutrients causedby the action of plant respiration, by micro-organisms, by oxidation, by leaching and bymechanical damage.
2. The nutritive value of hay is determined bythe growth stage and plant species of theparent crop, by field losses of nutrients andby changes taking place during storage(which can be reduced by the use of chemicalpreservatives). Even under good conditionsoverall loss of dry matter may be about 20 per cent.
3. Artificially dried forages are higher in nutritivevalue than hays; they are expensive to produceand may be given to non-ruminant livestock assources of minerals and vitamins.
4. Straws, mainly from cereals, are of low nutri-tive value but are important foods for rumi-nants, especially in developing countries.
5. The digestibility and intake of straws may beimproved by treatment with sodium hydroxideor ammonia (as a gas or derived from urea).Such treatment is expensive, and the moreappropriate way of making the best use ofstraws is to supplement them, especially with asource of rumen-degradable protein.
QUESTIONS
20.1 Review the factors that determine the nutritive value of hays.
20.2 Discuss the advantages and disadvantages of alternative methods for improvingthe nutritive value of straws.
FURTHER READING
Nash M J 1985 Crop Conservation and Storage, Oxford, Pergamon Press.
Staniforth A R 1979 Cereal Straw, Oxford, Clarendon Press.
Sullivan J T 1973 Drying and storing herbage as hay. In: Butler G W and Bailey R W (eds)Chemistry and Biochemistry of Herbage,Vol. 3, London,Academic Press.
Sundstöl F and Owen E (eds) 1984 Straw and Other Fibrous By-Products as Feed, Amsterdam,Elsevier.

533
21.1 Roots
21.2 Tubers
The most important root crops used in the feeding of farm animals are turnips, swedes(or rutabagas), mangels (or mangolds) and fodder beet. Sugar beet is another impor-tant root crop, but it is grown primarily for its sugar content and is normally not givenas such to animals. However, the two by-products of the sugar-extraction industry, sugarbeet pulp and molasses (from both sugar beet and sugarcane), are important andnutritionally valuable animal foods.
The main tubers are potatoes, cassava and sweet potatoes, the last two beingtropical crops.
ROOTS
The main characteristics of roots are their high moisture content (750–940 g/kg) andlow crude fibre content (40–130 g/kg DM). The organic matter of roots consistsmainly of sugars (500–750 g/kg DM) and is of high digestibility (about 0.80–0.87).Roots are generally low in crude protein content, although like most other crops thiscomponent can be influenced by the application of nitrogenous fertilisers. Thedegradability of protein in the rumen is high, at about 0.80–0.85.
21 Roots, tubers and related by-products
BOX 21.1 Importance of some root and tuber crops
In Britain the main root crops (turnips, swedes and fodder beet) were important feeds for ruminantsin the eighteenth and nineteenth centuries.They gave high yields in unfavourable environments andcould be stored for the duration of the winter. Increasing use of silages for winter feeding hasreduced the importance of root crops. By 2007 the area in Britain devoted to these crops had declinedto 140 000 ha (1997: 166 000 ha).
In contrast, the crops grown mainly for human consumption, but partly used to feed animals,have maintained their popularity, their current world areas (million hectares) being potatoes 18.5,sweet potatoes 8.1, cassava 19.0 and sugar beet 5.2.World production of cassava tubers is estimatedto be about 200 mt, of which about 20 per cent is used for animal feeding.
21.1

Chapter 21 Roots, tubers and related by-products
534
The composition is influenced by season and the variation may be quite large:low DM roots are produced in a wet season and relatively high DM roots in a hot dryseason. The composition also varies with size, the large root having lower DM andfibre contents and being of higher digestibility than the small root.Winter hardinessis associated with higher DM content and keeping quality. In the past, root cropshave been considered as an alternative to silage in ruminant diets, but their value ascereal replacements is now recognised. Roots are not a popular food for pigs andpoultry because of their bulky nature, although those that have higher DM contents,such as fodder beet, are given to pigs. The root crops listed in Table 21.1 are poorsources of vitamins.
Roots are often stored in clamps during winter; during this period, losses of drymatter of up to 10 per cent are not uncommon.
Swedes and turnips
Swedes (Brassica napus), which were introduced into Britain from Sweden about200 years ago, and turnips (Brassica campestris) are chemically very similar, al-though turnips generally contain less DM than swedes (see Table 21.1). Of the twotypes of turnip that are grown, the yellow-fleshed cultivars are of higher DM contentthan the white-fleshed cultivars.The ME value of swedes is usually higher than thatof turnips, i.e. about 13 MJ/kg and 11 MJ/kg DM, respectively (see Table 21.1).Themain sugars present are glucose and fructose.
Both swedes and turnips are liable to taint milk if given to dairy cows at or justbefore milking time. The volatile compound responsible for the taint is absorbedfrom the air by the milk and is not passed through the cow.
Table 21.1 Typical composition and nutritional values of roots, root by-products and tubers (drymatter basis)
Dry matter Organic Crude protein Crude fibre Rumen degradability MEa
(g/kg) matter (g/kg) (g/kg) (g/kg) of protein (MJ/kg)
RootsSwedes 120 942 108 100 0.85 12.8Turnips 80 922 122 111 0.85 11.2Mangels 110 933 100 58 0.85 12.4Fodder beet 185 925 62 53 0.85 11.8Sugar beet 230 970 48 48 – 13.7
Root by-productsBeet molasses 750 931 40 0 0.80 12.0
Sugar beet pulp 860 918 110 132 0.70 12.5(molassed)
TubersCassava 370 970 35 43 0.80 12.8Potatoes 210 957 110 38 0.85 13.3Sweet potatoes 320 966 39 38 – 12.7
aFor ruminants.

Roots
535
Mangels, fodder beet and sugar beet
These three crops are all members of the same species, Beta vulgaris, and for con-venience they are generally classified according to their dry matter content. Mangelsare the lowest in DM content, richest in crude protein and lowest in sugar content ofthe three types. Fodder beet can be regarded as lying between mangels and sugarbeet in terms of DM and sugar content, while sugar beet is richest in DM and sugarcontent but poorest in crude protein. On a DM basis, the ME values range fromabout 12 MJ/kg to 14 MJ/kg, the higher values applying to sugar beet. The mainsugar present in these roots is sucrose.
Mangels
Low-dry-matter mangels have a DM content of 90–120 g/kg. Medium-dry-mattermangels have a DM content of 120–150 g/kg; this group is usually smaller in sizethan the low-dry-matter group but usually develops fairly large tops.
It is customary to store mangels for a few weeks after lifting, since freshly liftedmangels may have a slightly purgative effect. The toxic effect is associated with thenitrate present, which on storage is converted into asparagine. Unlike turnips andswedes, mangels do not cause milk taints when given to dairy cows.
Fodder beet
Medium-dry-matter fodder beet contains 140–180 g/kg of dry matter, whereas thehigh-dry-matter varieties may contain up to 220 g/kg. In addition to varietal type,the DM content is also influenced by the stage of growth at harvesting and environ-mental conditions. Fodder beet is a poor source of protein (see Table 21.1).
Fodder beet is a popular food in Denmark and the Netherlands for dairy cattleand young ruminants. Care is required in feeding cattle on high-dry-matter fodderbeet, since excessive intakes may cause digestive upsets, hypocalcaemia and evendeath.The digestive disturbances are probably associated with the high sugar contentof the root.
The use of fodder beet as the bulk ration for feeding pigs has given satisfactoryresults, but experiments have shown that the fattening period is slightly longer thanwhen sugar beet is used.The digestibility of the organic matter of fodder beet is veryhigh (about 0.90).
Sugar beet
Most sugar beet is grown for commercial sugar production, though it is sometimesgiven to animals, especially cows and pigs. Because of its hardness, the beet shouldbe pulped or chopped before feeding.
After extraction of the sugar at a sugar beet factory, two valuable by-products areobtained, which are given to farm animals: sugar beet pulp and beet molasses.
Sugar beet pulp
The sugar beet on arrival at the factory is washed, sliced and soaked in water, whichremoves most of the sugars.After extraction of the sugar, the residue is called sugarbeet pulp. The water content of this product is 800–850 g/kg; the pulp may be soldin the fresh state for feeding farm animals, but because of transport difficulties it isfrequently dried to a moisture content of 100 g/kg. Since the extraction process

Chapter 21 Roots, tubers and related by-products
536
removes the water-soluble nutrients, the dried residue consists mainly of cell wallpolysaccharides, and consequently the crude fibre content is relatively high (about200 g/kg DM); the crude protein and phosphorus contents are low, the former beingabout 100 g/kg DM.
Most sugar beet pulp is now sold after drying and the addition of molasses; themolasses provides about 20 per cent of the dry matter and raises the water-solublecarbohydrate (i.e. sugar) content from 200 g/kg to 300 g/kg DM. Molassed sugarbeet pulp is used extensively as a food for dairy cows and is also given to fatteningcattle and sheep. Originally, the pulp was considered to be too fibrous a food forpigs, but recent studies have shown that the digestibility of beet pulp fibre is high, atabout 0.80–0.85, even for young pigs. It is recommended that up to 15 per cent mo-lassed sugar beet pulp may be included in the diet of growing pigs and up to 20 percent in the diets of finishers and sows.The product is not a suitable food for poultry.
Sugar beet pulp may be combined with other by-products such as distiller’s grains(see Chapter 22).
Beet molasses
After crystallisation and separation of the sugar from the water extract, a thick blackliquid termed beet molasses remains. This product contains 700–750 g/kg DM, ofwhich about 500 g consists of sugars. The molasses dry matter has a crude proteincontent of only 20–40 g/kg, most of this being in the form of non-protein nitroge-nous compounds, including the amine betaine, which is responsible for the ‘fishy’aroma associated with the extraction process.
Beet molasses is a laxative food and is normally given to animals in small quanti-ties. Usually molasses is added to beet pulp (as mentioned above) or to other foods,including bran, grains, malt culms, spent hops and sphagnum moss. Molasses is alsoused, generally at levels of 5–10 per cent, in the manufacture of compound cubesand pellets. The molasses not only improves the palatability of the product but alsoacts as a binding agent. An additional use of molasses is as a constituent (and bind-ing agent) in the compressed feed blocks that are used as protein, mineral and vita-min supplements for ruminants. Since beet molasses is a rich and relatively cheapsource of soluble sugars, it is sometimes used as an additive in silage making.
Molasses is used as the feedstock for a number of industrial fermentations.Whenthe sugars have been fermented and the fermentation products removed, there is aresidue rich in nitrogen-containing substances and ash.This is partially dried to givea material known as condensed molasses solubles (CMS), which contains about 350 g of crude protein per kilogram of DM.The CMS is then mixed with molasses inthe ratio 20 : 80 to give a protein-fortified food.
Cane molasses
Although sugarcane is not a root or tuber crop, one of its major by-products, canemolasses, is a similar food to beet molasses, and its use is therefore described in thischapter. In the tropical and subtropical countries where sugarcane is grown, there isoften a serious shortage of sugar- or starch-containing animal foods, and so cane mo-lasses is a valuable resource. In addition to its uses as a carrier for supplements suchas urea (see Chapter 23) and as a conditioner of compound foods, cane molasses isused as a source of supplementary energy for forage diets, and even as the maincomponent of diets. In Cuba, for example, diets for beef cattle have been based on

Tubers
537
cane molasses offered ad libitum and providing 500–800 g/kg of total dry matter in-take, together with some forage and a supplement of protein (preferably protein oflow rumen degradability). Such diets can give liveweight gains of about 1 kg/day butsometimes induce a condition in cattle known as molasses toxicity. This is charac-terised by uncoordination and blindness caused by deterioration of the brain similarto that seen in cerebrocortical necrosis (see p. 89) and is associated with an unusualrumen fermentation that gives rise to volatile fatty acid mixtures rich in butyrate andpoor in propionate.The condition is best avoided by ensuring that animals have suf-ficient good-quality forage available.
TUBERS
Tubers differ from the root crops in containing either starch or fructan instead ofsucrose or glucose as the main storage carbohydrate. They have higher dry matterand lower fibre contents (see Table 21.1) and consequently are more suitable thanroots for feeding pigs and poultry.
Potatoes
In potatoes (Solanum tuberosum) the main component is starch.The starch contentof the dry matter is about 700 g/kg; this carbohydrate is present in the form of gran-ules that vary in size depending upon the variety.The sugar content in the dry mat-ter of mature, freshly lifted potatoes rarely exceeds 50 g/kg, although values inexcess of this figure in stored potatoes have been obtained. The amount present isaffected by the temperature of storage, and values as high as 300 g/kg have beenreported for potatoes stored at 21°C.
The crude protein content of the dry matter ranges from about 90 g/kg to 123 g/kg,with a mean value of about 110 g/kg.About half of this is in the form of non-proteinnitrogenous compounds. One of these compounds is the alkaloid solanidine, whichoccurs free and also in combination as the glyco-alkaloids chaconine and solanine.Solanidine and its derivatives are toxic to animals, causing gastroenteritis.The alka-loid levels may be high in potatoes exposed to light.Associated with light exposureis greening due to the production of chlorophyll. Green potatoes should be regardedas suspect. Removal of the eyes and peel, in which the solanidine is concentrated,will reduce the toxicity, but this is not a practical proposition in feeding farmanimals.Young shoots, even if white, are also likely to be rich in solanidine and theseshould be removed and discarded before feeding. Immature potatoes have beenfound to contain more solanidine than mature tubers.The risk of toxicity is reducedconsiderably if potatoes are steamed or otherwise cooked, the water in which thetubers have been boiled being discarded. Ensiling also destroys some of the toxin,and so inclusion of slightly greened potatoes with grass should be acceptable. Rumi-nants are more resistant to toxicity than monogastric animals, presumably becauseof partial destruction of the toxin in the rumen.
The crude fibre content of potatoes is very low, usually less than 40 g/kg DM,which makes them particularly suitable for pigs and poultry. However, the protein inuncooked potatoes is frequently poorly digested by these animals, and protein di-gestibility coefficients as low as 0.23 have been reported for pigs. In similar trialswith cooked potatoes, digestibility coefficients for protein generally exceed 0.70.
21.2

Chapter 21 Roots, tubers and related by-products
538
Potatoes contain a protease inhibitor that reduces the digestibility not only of potatoprotein but also of protein in other components of the diet. The inhibitor is de-stroyed by heating; it is normal practice to cook potatoes for pigs and poultry,although cooking is unnecessary for ruminants, presumably because the inhibitor isdestroyed in the rumen. For pigs and poultry the ME value of cooked potatoes issimilar to that of maize, about 14–15 MJ/kg DM.
Potatoes are a poor source of minerals, except for the abundant element potas-sium; the calcium content is particularly low. The phosphorus content is ratherhigher, since this element is an integral part of the potato starch molecule, but some20 per cent of it is in the form of phytates (see p. 115).
During the storage of potatoes considerable changes in composition may occur.The main change is a conversion of some of the starch to sugar and the oxidation ofthis sugar, with the production of carbon dioxide during respiration.The respirationrate increases with an increase in temperature. There may also be a loss of waterfrom the tubers during storage.
Dried potatoes
The difficulty of storing potatoes satisfactorily for any prolonged period of time hasled to a number of processing methods. Several methods of drying are used. In onemethod the cooked potatoes are passed through heated rollers to produce dried po-tato flakes. In another method sliced tubers are dried directly in flue gases; the re-sultant potato slices are frequently ground to a meal before marketing.The productsare valuable concentrate foods for all classes of animal.
Potato processing wastes
These products are the dried residues obtained in the processing of potatoes for can-ning and chipping for human consumption. A typical product consists of peel andsmall pieces of tubers that have been coarsely ground and dried. Potato processingwastes are of variable composition, the crude fibre content ranging from about 30 g/kg to 70 g/kg DM and the crude protein from 70 g/kg to 140 g/kg DM. Pro-vided the products are free from soil contamination, they are useful foods if given insmall quantities to pigs, poultry and ruminants.
Cassava
Cassava (Manihot esculenta), also known as manioc, is a tropical shrubby perennialplant that produces tubers at the base of the stem.The chemical composition of thesetubers varies with maturity, cultivar and growing conditions. About 80 per cent ofthe carbohydrate is starch, and cassava tubers are used for the production of tapiocastarch for human consumption, although the tubers are also given to cattle, pigs andpoultry. The ME value of cassava is similar to that of potatoes, but it has higher drymatter and lower crude protein contents (see Table 21.1).
The use of fresh cassava tubers for animal feeding is limited by their low proteincontent and also their poor storage capability. The tubers can be stored by burial inpits or can be ensiled (i.e. fermented). Another limiting factor is that cassava plants(both tubers and foliage) are to a certain degree poisonous since they contain vary-ing proportions of two cyanogenetic glucosides (linamarin and lotaustralin), whichreadily break down to give hydrocyanic acid (see p. 23). In all cases care must be

Questions
539
taken in the use of the tuber; wherever the plant is grown, indigenous methods of re-moving the glucosides have been devised. Such treatments include boiling; gratingand squeezing; and grinding to a powder and then pressing.
For export to temperate countries, cassava is dried and pelleted. Dried cassava canbe used as a partial cereal grain replacer, provided the protein deficiency is rectified.
Cassava pomace is the residue from the extraction of starch from cassava tubers.Because of its high crude fibre content (about 270 g/kg DM), its use in the diets ofnon-ruminant animals should be restricted.
Sweet potatoes
The sweet potato (Ipomoea batatas) is a very important tropical plant whose tubersare widely grown for human consumption and as a commercial source of starch.Thetubers are of similar nutritional value to ordinary potatoes although of much higherdry matter and lower crude protein contents (see Table 22.1). Fresh tubers that aresurplus to requirements are often cut into small pieces, sun-dried and then ground toproduce a sweet potato meal, a high-energy food of low protein content. Sun-dryingdoes not destroy the trypsin inhibitors believed to be present in the tubers, andlevels in the diets of farm animals are usually restricted.
SUMMARY
1. The fodder root crops of temperate climates(turnips, swedes, mangels and fodder beet) arecharacterised by their high water content(750–940 g/kg), low crude fibre content(40–130 g/kg DM) and high sugar content(500–750 g/kg DM). Digestibility and ME valueare high (11–13 MJ/kg DM). They are mainlygiven to ruminants.
2. Sugar beet, grown mainly for extraction ofsugar, yields two by-products for animal feed-ing. Sugar beet pulp is similar in compositionto cereals, except for the replacement of starchby a high fibre content (200 g/kg DM). Beetmolasses (and also sugarcane molasses) containsugars and only 20–40 g protein per kilogram(mainly non-protein nitrogen). Excessiveamounts of molasses in ruminant diets give
rise to butyric acid in the rumen and may betoxic.
3. Potato tubers are rich in starch and low infibre, their ME value for pigs and poultrybeing 14–15 MJ/kg DM. Potato processingwastes (mainly peel) are higher in fibre thanwhole potatoes.
4. The tropical plant cassava has tubers rich instarch but low in protein. Dried cassava mealand by-products from starch extraction areused in animal feeds, but they must be pre-pared in such a way that cyanogenetic gluco-sides are inactivated.
5. Sweet potatoes may be dried for animal feed-ing, but they contain a trypsin inhibitor.
QUESTIONS
21.1 Describe the main differences in composition between roots and tubers.
21.2 Give three examples of potentially toxic constituents in roots and tubers.

Chapter 21 Roots, tubers and related by-products
540
FURTHER READING
Barber W P and Lonsdale C R 1980 By-products from cereal, sugarbeet and potato processing.In: Ørskov E R (ed.) By-Products and Wastes in Animal Feeding, occasional symposiumpublication no. 3, Reading, British Society of Animal Production.
Crawshaw R 2001 Co-Product Feeds, Nottingham, University of Nottingham Press.
Göhl B 1981 Tropical Feeds, Rome, FAO.
Greenhalgh J F D, McNaughton I H and Thow R F (eds) 1977 Brassica Fodder Crops, Edinburgh,Scottish Agricultural Development Council.
Hillocks R J,Thresh J M and Bellotti A C (eds) 2002 Cassava: Biology, Production and Utilisa-tion,Wallingford, CABI.
Kelly P 1983 Sugar beet pulp: a review. Animal Feed Science and Technology 8: 1–18.
Nash M J 1985 Crop Conservation and Storage, Oxford, Pergamon Press.
Oke O L 1978 Problems in the use of cassava as animal feed. Animal Feed Science and Tech-nology 3: 345–80.
Preston T R and Leng R A 1986 Matching Livestock Production Systems to Available Resources,Addis Ababa, International Livestock Centre for Africa.
Scott G J, Rosegrant M W and Ringler M W 2000 Roots and tubers for the 21st century: trends,projections and policy options. Food, Agriculture and the Environment Discussion Paper31,Washington, DC, International Food Policy Research Institute.

541
22.1 The nutrient composition of grains
22.2 Barley
22.3 Maize
22.4 Oats
22.5 Wheat
22.6 Other cereals
22.7 Cereal processing
Cereal grains and cereal by-products
22
22.1 THE NUTRIENT COMPOSITION OF GRAINS
The name ‘cereal’ is given to the members of the Gramineae that are cultivated fortheir seeds. Cereal grains are essentially carbohydrate concentrates, the main com-ponent of the dry matter being starch, which is concentrated in the endosperm (Fig. 22.1). The dry matter content of the grain depends on the harvesting methodand storage conditions but is generally within the range of 800–900 g/kg.
Of the nitrogenous components 85–90 per cent are in the form of proteins. Theproteins occur in all tissues of cereal grains, but higher concentrations are found in theembryo and aleurone layer than in the starchy endosperm, pericarp and testa.Withinthe endosperm, the concentration of protein increases from the centre to the periph-ery.The total content of protein in the grain is very variable; expressed as crude pro-tein it is normally in the range 80–120 g/kg DM, although some cultivars of wheatcontain as much as 220 g/kg DM. Cereal proteins are deficient in certain indispens-able amino acids, particularly lysine and methionine. It has been shown that the valueof cereal proteins for promoting growth in young chicks is in the order oats > barley> maize or wheat. The high relative value of oat protein for growth has been attrib-uted to its slightly higher lysine content.This is demonstrated in Fig. 22.2, which com-pares the main limiting amino acid components of a number of cereal grains.
The lipid content of cereal grains varies with species.Wheat, barley, rye and rice con-tain 10–30 g/kg DM, sorghum 30–40 g/kg DM and maize and oats 40–60 g/kg DM.Theembryo, or germ, contains more oil than the endosperm; in wheat, for example, theembryo has 100–170 g/kg DM of oil, while the endosperm contains only 10–20 g/kgDM.The embryo of rice is exceptionally rich in oil, containing as much as 350 g/kg DM.Cereal oils are unsaturated, the main acids being linoleic and oleic; because of this theytend to become rancid quickly and also produce a soft body fat in pigs and poultry.

Chapter 22 Cereal grains and cereal by-products
542
Pericarp
Testa
Aleurone
Endosperm
ScutellumColeoptileShootEpiblastRootColeorhiza
Bran
Embryoor germ
Am
ino
aci
d c
on
cen
trat
ion
(g
/16
g N
)
Arginine Lysine Methionine and cystine Tryptophan
Mi = milletS = sorghum
Ma = maizeR = rice
B = barleyO = oatsW = wheat
1.0
2.0
3.0
4.0
5.0
6.0
7.0
8.0
9.0
B Ma
Mi
O R S W B Ma
Mi
O R S W B Ma
Mi
O R S W B Ma
Mi
O R S WMi i
RO OM
Fig. 22.1 Longitudinal section of caryopsis (grain) of wheat.
Fig. 22.2 Main limiting indispensable amino acids of cereal grains (g/16 g N). Straight linesindicate requirements for chicks; dotted lines indicate requirements for growing pigs.

Barley
543
The crude fibre content of the harvested grains is highest in those, such as oatsand rice, that contain a husk or hull formed from the fused glumes (palea andlemma), and is lowest in the ‘naked’ grains, wheat and maize.The husk has a diluenteffect on the grain as a whole and reduces the energy value proportionally. Of thegrains as harvested, oats has the lowest metabolisable energy value and maize hasthe highest, the respective values (MJ/kg DM) for poultry being around 12 and 16and for ruminants 12 and 14.
Starch occurs in the endosperm of the grain in the form of granules, whose sizeand shape vary with different species. Cereal starches consist of about 25 per centamylose and 75 per cent amylopectin, although ‘waxy’ starches contain greater pro-portions of amylopectin.
The cereals are all deficient in calcium, containing less than 1 g/kg DM.The phos-phorus content is higher, being 3–5 g/kg DM, but part of this is present as phytic acid(see p. 115), which is concentrated in the aleurone layer. Cereal phytates have theproperty of being able to bind dietary calcium and probably magnesium, thus pre-venting their absorption from the gut; oat phytates are more effective in this respectthan barley, rye or wheat phytates.The cereal grains are deficient in vitamin D and,with the exception of yellow maize, in provitamins A.They are good sources of vita-min E and thiamin, but they have a low content of riboflavin. Most of the vitaminsare concentrated in the aleurone layer and the germ of the grain.
Calves, pigs and poultry depend upon cereal grains for their main source of en-ergy, and at certain stages of growth as much as 90 per cent of their diet may consistof cereals and cereal by-products. Cereals generally form a lower proportion of thetotal diet of ruminants, although they are the major component of the concentrateration.
22.2 BARLEY
Barley (Hordeum sativum) has always been a popular grain in the feeding of farmanimals, especially pigs. In most varieties of barley the kernel is surrounded by ahull, which forms about 10–14 per cent of the weight of the grain.
The metabolisable energy value (MJ/kg DM) is about 13.3 for ruminants and 13.2for poultry, and the net energy value for growing pigs is 11.0.The crude protein con-tent of barley grain ranges from about 60 g/kg to 160 g/kg DM, with an averagevalue of about 115 g/kg DM. As with all cereal grains, the protein is of low quality,being particularly deficient in the amino acid lysine. High-lysine mutants of barleyhave been produced by plant breeders and the superior nutritional value of two suchmutants – Notch 1 and Notch 2 – is shown in Table 22.1. Unfortunately, with manyof these mutants the yields of grain are much lower (about 30 per cent) than fromparent varieties, and the starch contents may be reduced.
The lipid content of barley grain is low, usually less than 25 g/kg DM.The range indry matter composition of 179 samples of barley grain harvested in Wales is given inTable 22.2.
In many parts of the world, and in particular in the UK, barley forms the main con-centrate in the diets of pigs and ruminants. In the ‘barley beef’ system of cattle feed-ing, beef cattle are fattened on concentrate diets consisting of about 85 per centbruised barley without the use of roughages. In this process the barley is usually

Chapter 22 Cereal grains and cereal by-products
544
Table 22.1 Composition and nutritive value of whole-grain barley samples ofparent variety NP 113, and of mutant varieties Notch 1 and Notch 2
NP 113 Notch 1 Notch 2
Protein (g/kg) 117 157 146Lysine (g/16 g N) 3.88 4.00 3.96Starch (g/kg) 662 396 414Crude fibre (g/kg) 70 104 128BVa 0.76 0.86 0.88NPUa 0.66 0.68 0.73
a Biological value and net protein utilisation with rats.
After Balaravi S P et al. 1976 Journal of the Science of Food and Agriculture 27: 545.
Table 22.2 Dry matter composition of 171 oat and 179 barley grain samples grown in Wales, 1961–63
Oats Barley
Range Mean Coeff. of Range Mean Coeff. of
variationa variationa
Proximate constitutents (g/kg)Crude protein 72–145 107 13.4 66–153 108 15.7Crude fibre 80–179 125 13.6 38–73 56 12.5Ether extract 9–80 52 20.2 11–32 19 15.8Ash 22–41 31 8.7 17–42 25 12.4
Major mineral elements (g/kg)Ca 0.7–1.8 1.1 18.2 0.5–1.6 0.8 25.6Mg 1.0–1.8 1.3 13.1 0.9–1.6 1.2 8.3K 3.1–6.5 4.7 17.0 3.5–6.3 4.9 12.2Na 0.04–0.6 0.2 47.8 0.06–0.4 0.2 41.2P 2.9–5.9 3.8 10.5 2.6–5.2 3.8 11.8Cl 0.4–1.8 0.9 33.3 0.8–2.2 1.4 21.4
Trace elements (mg/kg)Cu 3.0–8.2 4.7 17.0 3.5–19.8 6.6 27.3Co 0.02–0.17 0.05 53.0 0.02–0.18 0.07 48.6Mn 22–79 45 28.9 5–47 16 31.3Zn 21–70 37 27.0 19–77 37 77.0
Energy (MJ/kg)Metabolisable energy for poultry 9.5–14.4 12.1 7.2 12.9–15.0 14.1 2.6
a Standard deviation as % of mean.
After Morgan D E 1967 and 1968 Journal of the Science of Food and Agriculture 18: 21; and 19: 393.
treated so that the husk is kept in one piece and at the same time the endosperm isexposed, the best results being obtained by rolling grain at a moisture content of160–180 g/kg. Storage of high-moisture barley of this type can present a problem be-cause of the possibility of mould growth. Satisfactory preservation of the moist graincan be obtained if it is stored anaerobically.An additional or alternative safeguard isto treat the grain with a mould inhibitor such as propionic acid (see p. 526). Grain

Barley
545
stored at high moisture loses its vitamin E content. Certain hazards, such as rumenacidosis (rapid fermentation of the starch to lactic acid, resulting in depressionof digestion of fibre and food intake) and bloat (see p. 178), can be encounteredwith high-concentrate diets given to ruminants, and it is necessary to introducethis type of feeding gradually over a period of time. It is important that a proteinconcentrate with added vitamins A and D and minerals be used to supplement high-cereal diets of this type.
Barley should always have the awns removed before it is offered to poultry,otherwise digestive upsets may occur.
Barley by-productsBy-products of the brewing industry (Fig. 22.3)
In brewing, barley is first soaked and allowed to germinate. During this process,which is allowed to continue for about 6 days, a complete enzyme system for hy-drolysing starch to dextrins and maltose develops.Although the enzymatic reactionshave been initiated in this germination, or malting, process, the main conversion ofthe starch in the grain to maltose and other sugars takes place during the nextprocess, described as mashing. After germination but before mashing, the grain ormalt is dried, care being taken not to inactivate the enzymes. The sprouts are re-moved and are sold as malt culms or coombs. The dried malt is crushed, and smallamounts of other cereals such as maize or rice may be added.Water is sprayed on tothe mixture and the temperature of the mash increased to about 65 °C.
The object of mashing is to provide suitable conditions for the action of enzymeson the proteins and starch, the latter being converted to dextrins, maltose and small
Beer orlager
Spent hops
Wet spent grain: brewer’s grains
Dried rootlets: malt culms
Brewer’s yeast
Wort
Steep water
Barley + water
Cereals + water
Hops
Yeast
Fig. 22.3 The brewing process and its by-products.

Chapter 22 Cereal grains and cereal by-products
546
amounts of other sugars. After the mashing process is completed, the sugary liquid,or wort, is drained off, leaving brewer’s grains as a residue. Brewer’s grains are soldwet or dried as food for farm animals.
The wort is next boiled with hops, which give it a characteristic flavour andaroma; the hops are then filtered off and after drying are sold as spent hops. Thewort is then fermented in an open vessel with yeast for a number of days, duringwhich time most of the sugars are converted to alcohol and carbon dioxide. Theyeast is filtered off, dried and sold as brewer’s yeast.
The by-products obtained from the brewing process are therefore malt culms,brewer’s grains, spent hops and brewer’s yeast.
Malt culms
Malt culms consist of the plumule and radicle of barley and are relatively rich in crudeprotein (about 280 g/kg DM).They are also produced as a by-product of the distillingindustry (see below).They are not a high-energy food, however, and because of theirfibrous nature their use is generally restricted to the feeding of ruminants and horses.The quality of protein in malt culms is poor and this, together with the high fibre con-tent, limits their use for pigs to diets for pregnant sows, or at low levels in finishingdiets. Malt culms have a bitter flavour owing to the presence of the amino acid as-paragine, which forms about one-third of the crude protein. However, when mixedwith other foods they are accepted readily by cattle and have been included in concen-trate mixes at levels up to 500 g/kg. A related by-product is malt residual pellets,which comprise malt culms and other malt screenings. These have lower fibre andhigher starch contents than plain malt culms, giving a slightly higher ME for ruminants(11.5 MJ/kg v. 11 MJ/kg DM) and lower crude protein (220 g/kg v. 280 g/kg DM).
Brewer’s grains
Brewer’s grains, or draff, consist of the insoluble residue left after removal of thewort. In addition to the insoluble barley residue, this product may contain maize andrice residues and, because of this, the composition of the product can be very vari-able, as illustrated in Table 22.3.
Table 22.3 The nutritional value of fresh brewer’s grainsa
Mean Range
Dry matter (g/kg) 263 244–300Crude protein (g/kg DM) 234 184–262Crude fibre (g/kg DM) 176 155–204Ether extract (g/kg DM) 77 61–99Total ash (g/kg DM) 41 36–45Digestible organic matter (g/kg DMb) 594 552–643Metabolisable energy (MJ/kg DMc) 11.2 10.5–12.0Digestible crude protein (g/kg DMc) 185 139–213
a Results for seven samples selected from widely different sources in the UK.b In vitro.c Measured in sheep.
Adapted from Barber W P and Lonsdale C R 1980 Occasional Publication no. 3, Reading, British Society ofAnimal Production, pp. 61–9.

Barley
547
The fresh brewer’s grains contain about 700–760 g water/kg and may be given tocattle, sheep and horses in this fresh state or alternatively preserved as silage. Morebrewer’s grains are produced in summer than winter, and therefore ensilage is a pop-ular form of storage for winter feeding.The wet product can be dried to about 100 gwater/kg and sold as dried brewer’s grains.The rumen degradability of the protein ofthe dried product is about 0.6 compared with about 0.8 in the original barley.Brewer’s grains are a concentrated source of digestible fibre, and energy losses fromthe rumen as methane are lower than with high-starch feeds.They are high in phos-phorus but low in other minerals. Brewer’s grains have always been a popular foodfor dairy cows, but they are of little value for poultry.They are not very suitable forpigs except for pregnant sows, which have a large intake capacity and an active hindgut fermentation, which enables them to utilise this material.
Spent hops
Dried spent hops are a fibrous product and comparable to poor hay in nutritive value,but they are less palatable, probably because of their bitter flavour. This product israrely used as a food for animals today, most of it being sold for use as fertiliser.
Dried brewer’s yeast
Dried yeast is a protein-rich concentrate containing about 420 g crude protein/kg. Itis highly digestible and may be used for all classes of farm animal. The protein is offairly high nutritive value and is specially favoured for feeding pigs and poultry. It isa valuable source of many of the B group of vitamins, is relatively rich in phosphorusbut has a low calcium content. Other yeasts are now available as protein concen-trates; these are described in Chapter 23.
By-products of the distilling industry
In distilling, the soluble materials may be extracted, as in brewing, or the whole massfermented, the alcohol then being distilled off. The residue after filtration is sold aswet or dried distiller’s grains. In Scotland, whisky distilleries are either malt or graintypes (Fig. 22.4).The former use barley malt alone, whereas the latter use a mixtureof cereals, which may include barley, maize, wheat and oats.
Distiller’s grains (draff)
The composition of distiller’s grains depends on the starting materials and can varywidely (Table 22.4). Malt distiller’s grains are less variable in composition. Graindistiller’s grains have a higher energy content than malt distiller’s grains but have alower content of some minerals. In general, distiller’s grains are low in soluble min-erals, sodium and potassium, and also in calcium and magnesium. As with brewer’sgrains, distiller’s grains are a useful feed for dairy cows and are often ensiled for win-ter feeding. Most of the lipid in the original grain is retained in this by-product, andit has a high content of unsaturated fatty acids, which reduces microbial digestibilityof fibre in the rumen and depresses intake. Digestibility and intake can be improvedby the addition of calcium carbonate, which forms insoluble calcium soaps of theunsaturated fatty acids, thereby overcoming their effects on the rumen microbes.Thelow dry matter and high fibre contents restrict the inclusion of distiller’s grains in pigdiets to those for pregnant sows.The production of dried distiller’s grains (distiller’slight grains) has now ceased owing to the high costs of drying.

Chapter 22 Cereal grains and cereal by-products
548
Distiller’s solubles
After distilling off the alcohol, the liquor (‘spent wash’ in grain distilleries and ‘potale’ in malt distilleries) remaining in the whisky still is evaporated and then spraydried to produce a light-brown powder of variable composition known as ‘distiller’ssolubles’. Lime is added to aid drying so that it is rich in calcium. Only smallamounts of dried solubles are produced because of the high cost of drying, and theiruse is usually restricted to low levels in diets for pigs and poultry.They are a valuablesource of the B group of vitamins.Although the protein content is high, the heatingduring drying reduces the availability of the amino acids. The dried solubles are re-ported to stimulate the activity of the rumen microflora.A cruder preparation of potale is the condensed form ‘pot ale syrup’, which contains about 300–500 g DM/kg
Barley + water
Dried rootlets: malt culms
Malt
Wet spent malt: malt draff
Water
Wort
Pot ale
Superdraff
Malt distiller’slight grains
Malt distiller’sdark grains
Malt distiller’sdried solubles
Malt spirit
Malt whisky
Yeast
( )a
Barley + water
Dried rootlets: malt culms
Malt
Wet spent grains: grain draff
Cooked maize,wheat, etc. andwater
Wort
Spent wash Spent washsyrup
Grain distiller’sdark grains
Grain spirit
Grain whisky
Yeast
( )b
Pot ale syrup
Fig. 22.4 (a) The malt distilling process and its by-products. (b) The grain distillingprocess and its by-products.

Barley
549
and 350 g crude protein/kg DM and has a metabolisable energy value for ruminantsof 14.2 MJ/kg DM. Much of the crude protein is in the form of breakdown productssuch as peptides and amino acids and is virtually all degradable in the rumen. How-ever, the heat treatment results in the protein being of poor quality for pigs, and itshould be offered with good-quality protein sources, such as fishmeal. The mineralcontent of pot ale syrup is unbalanced, with low calcium and sodium but high phos-phorus and potassium contents. It should be given with caution to sheep because ofits high content of copper, present as a contaminant from copper stills.
Distiller’s dark grains
The spent wash or pot ale is often mixed (in proportions of 1 : 2–1 : 4) with thedistiller’s grains and dried together to yield a material sold as ‘distiller’s dried grainswith solubles’ or ‘dark grains’ (see Table 22.4).The mixture from malt distilleries is re-ferred to as ‘malt’ or ‘barley dark grains’, whereas that from grain distilleries is referredto as ‘grain’, ‘wheat’ or ‘maize dark grains’.They are usually pelleted. Grain dark grainshave the higher energy value owing to higher fat and protein contents and a lowerfibre content. Dark grains generally are a balanced feed for ruminants, but thedegradability of the protein may vary according to the drying process.Additionally,the quality of the undegradable protein may be poor as a result of heat damage.Thisfactor also limits the value of the protein for pigs, although with appropriate sup-plementation with amino acids the grains can form up to 15 per cent of the diets forgrowing and finishing pigs. Dry sows can be fed at higher levels. Like other distill-ery by-products, dark grains are a good source of phosphorus and the copper con-tent may be high, especially in malt distiller’s dark grains. Some distilleries sell themixed draff and pot ale syrup in the fresh state, a material known as ‘superdraff’,whereas others distil the alcohol directly from the fermented grain mixture, leavinga combined grain and solubles product that is then also sold fresh or dried.Thus, the
Table 22.4 The nutritive value of distiller’s grains
Malt distiller’s Grain distiller’s Malt distiller’s Grain distiller’s
grains grains (supergrains) dark grains dark grainsa
Dry matter (g/kg) 230 (270b) 260 900 890 (890)Crude protein (g/kg DM) 198 320 275 340 (317)Ether extract (g/kg DM) 125 106 35 69 (110)Crude fibre (g/kg DM) 174 160 121 89 (91)Ash (g/kg DM) 36 16 60 52 (46)Metabolisable energy (ruminants)
(MJ/kg DM) 11.1 (10.8b) 13.0 12.2 13.5 (14.0)Degradability of crude protein 0.80 0.80 0.70 0.70 (0.70)Digestible energy (pigsc) (MJ/kg DM) 11.7 12.0 10.0 10.5Lysine (g/kg DM) 5.8 6.9 8.9 7.8
a Values are for wheat-based (maize-based) dark grains.b Values for ensiled grains are given in parentheses.c Values are applicable for growing/finishing pigs, corrected for less efficient use of products of fermentation;values for dry sows are likely to be 10–15 per cent higher.
Adapted from Black H et al. 1991 Distillery By-products as Feeds for Livestock, Aberdeen, Scottish Agricultural College.

Chapter 22 Cereal grains and cereal by-products
550
BOX 22.1 Animal food by-products from the biofuel industries
The production of biofuels (ethanol, butanol and biodiesel) falls into two categories:
■ the fermentation of starch or sugar to produce alcohol, which is then obtained by distillation;■ the crushing and expelling of oil from oilseeds (e.g. rapeseed).
Both processes yield by-products that are useful foods for animals.The fermentation of starch from cereals produces ethanol.Wheat is the main grain in Europe and
maize in the USA.The process is analogous to grain whisky distilling described above (see p. 548).The cereal is ground, cooked, liquefied and allowed to cool, then yeast is added with nutrients andenzymes, the mash is fermented and the alcohol is distilled off. However, since in the industrialprocess enzymes are used to extract more starch from the grain, the resulting product, which is acombination of spent grains (like draff) and yeast (like spent wash), has less starch than the distiller’sdried grains and solubles (DDGS, or dark grains) product from whisky distilleries.The DDGS frombiofuel production has a similar feeding value for ruminants to dark grains.The nutritional value ofthe product varies with the processing plants, which is of concern to pig and poultry nutritionistswith respect to the digestibility and availability of amino acids. Enzyme preparations have beenproduced to improve the nutritional value of the product.
Sugars are extracted from sugar beet roots, as described on p. 535, and are fermented to producebutanol. The by-product is the familiar sugar beet pulp (see p. 535), which is a valuable fibrousenergy source for ruminants and can also be fed to pigs. In the Americas, sugars extracted fromsugarcane are also fermented to produce alcohol; the fibrous by-product, bagasse (see p. 495), is oflow quality and is only appropriate for feeding to ruminants.
The crushing and expelling of oil from oilseeds is described on p. 563 and yields rapeseed meal.The meal from the expeller process has higher oil and lower protein contents than solvent-extractedmeals and has a higher energy value. In some cases the seed is merely crushed and even higher levelsof oil remain.The oil is refined and hydrolysed, yielding fatty acids for biodiesel and glycerol, whichhas several uses, including medical, pharmaceutical, cosmetic and industrial applications and asanimal food.The gross energy of pure glycerol is 18.1 MJ/kg but the process results in materials withvarying degrees of water content and contamination. One contaminant that must be controlled ismethanol, which causes digestive and metabolic disorders. Glycerol is used to alleviate ketosis indairy cows since it is a glucose precursor. Commercial products have a ruminant ME value ofaround 15 MJ/kg and DE and NE values in growing pigs of around 15.5 MJ/kg and 14 MJ/kg,respectively.
distilleries differ in details of the distilling process, resulting in versions of by-productsthat are specific to the distillery.
A detailed account of the processes and by-products of the brewing and distillingindustries is given by Crawshaw (see Further reading).
By-products of the pearl barley industry
In the preparation of pearl barley for human consumption, the bran coat is removedand the kernel is polished to produce a white shiny grain. During this process three by-products, described as coarse, medium and fine dust, are produced; these are frequently

Maize
551
mixed and sold as barley feed. Barley feed contains about 140 g crude protein/kg DMand about 100 g crude fibre/kg DM.The amount of this product available in the UK isvery small.
22.3 MAIZE
A number of different types of maize (Zea mays) exist, and the grain appears in avariety of colours, yellow, white and red.Yellow maize contains a pigment, cryptox-anthin, that is a precursor of vitamin A. In the USA, where it is known as corn, largeamounts of this cereal are grown, the yellow varieties being preferred for animalfeeding.The pigmented grain tends to colour the carcass fat, which in the UK is notconsidered desirable, so that white maize varieties are preferred for fattening ani-mals. However, the pigment is useful in diets for laying hens, where it contributes tothe production of the orange coloration of egg yolk.
Maize, like the other cereal grains, has certain limitations as a food for farmanimals.Though an excellent source of digestible energy it is low in protein, and theproteins present are of poor quality (see Fig. 22.2). Maize contains about 730 gstarch/kg DM, is very low in fibre and has a high metabolisable energy value. Thestarch in maize is digested more slowly in the rumen than that of other grains, and athigh levels of feeding a proportion of the starch passes into the small intestine,where it is digested and absorbed as glucose.This may have advantages in conditionssuch as ketosis (see p. 265), although some of the glucose is used by the viscera andthis reduces the amount reaching the liver.When the starch is cooked during process-ing, it is readily fermented in the rumen.The oil content of maize varies from 40 g/kgto 60 g/kg DM and is high in linoleic acid, which is an important factor in the dietcontrolling the egg size of hens. However, it tends to produce a soft body fat.
The crude protein content of maize is very variable and generally ranges fromabout 90 g/kg to 140 g/kg DM, although varieties have been developed containingeven higher contents. In the USA, the tendency has been to develop hybrid varietiesof lower protein content.
The maize kernel contains two main types of protein. Zein, occurring in theendosperm, is quantitatively the more important, but this protein is deficient in theindispensable amino acids tryptophan and lysine (see Fig. 22.2). The other protein,maize glutelin, occurring in lesser amounts in the endosperm and also in the germ, isa better source of these two amino acids. Varieties of maize have been producedwith amino acid components different from those present in normal maize. One suchvariety is Opaque-2, which has a high lysine content. The difference between thisvariety and normal maize is primarily attributed to the zein/glutelin ratio.
Opaque-2 has been reported to be nutritionally superior to normal maize for therat, pig, man and chick, but only in methionine-supplemented diets.A newer variety,Floury-2, has increased contents of both methionine and lysine and has been shownin studies with chicks to be superior to Opaque-2 maize in diets not supplementedwith methionine.
Maize by-products
In the manufacture of starch and glucose from maize, a number of by-products areobtained that are suitable for feeding farm animals (Fig. 22.5).

Chapter 22 Cereal grains and cereal by-products
552
The cleaned maize is soaked in a dilute acid solution and is then coarsely ground.The maize germ floats to the surface and is removed for further processing. Thedegermed grain is then finely ground and the bran is separated by wet screening.The remaining liquid consists of a suspension of starch and protein (gluten), whichare separated by centrifugation. The process gives rise to three by-products – germ,bran and gluten.
The germ is very rich in oil, which is valued by the human food industry, and mostis extracted before producing the germ meal. Maize germ meal is a variable product,depending on the degree of separation at milling (starch and fibre content) and theextraction process – screw versus solvent (oil content). In a study of five samples ofthe meal, the starch, neutral-detergent fibre and oil contents were in the ranges435–570 g/kg, 220–572 g/kg and 35–127 g/kg DM, respectively. In the UK, theFeeding Stuffs Regulations require the declaration of oil and protein content. Theprotein has a good amino acid balance.The oil in high oil content meals can oxidiserapidly if they are not stored under the appropriate conditions. Maize gluten(prairie) meal has a very high protein content (up to about 700 g/kg DM) and is highin pigments, and so it is valued in poultry diets. The three by-products (germ, branand gluten) are frequently mixed together and sold as maize gluten feed. This foodhas a variable protein content, normally in the range 200–250 g/kg DM, of whichabout 0.6 is degraded in the rumen. Dark brown material indicates heat damage,which will decrease the digestibility of the protein. Maize gluten feed has a crudefibre content of about 80 g/kg DM, and metabolisable energy values of about9 MJ/kg and 12.5 MJ/kg DM for poultry and ruminants, respectively, and a netenergy value for growing pigs of 8 MJ/kg DM. Since it is a milled product, the fibrewill not have the same effect as a long roughage in ruminant diets. Nevertheless,
Maize grain
Soak in dilute acid
Coarse grind
Fine grind
Wet screen
Centrifuge
Germ
Extract
Maize germ meal OilBran
Starch Gluten(prairie meal)
Maize gluten feed
Fig. 22.5 The processing of maize to produce starch and the by-products formed.

Oats
553
maize gluten feed has been used as a substantial proportion of the concentrate feedof dairy cows. It is generally limited to about 10–20 per cent in pig foods.
22.4 OATS
The oat (Avena sativa) has always been a favourite cereal for ruminant animals andhorses but has been less popular in pig and poultry feeding because of its compara-tively high fibre content and low energy value.
The nutritive value of oats depends to a large extent on the proportion of kernel(groat) to hull. The proportion of hull in the whole grain depends upon the variety,environment and season, and can vary from 23 per cent to 35 per cent (average27 per cent). Oats of high hull content are richer in crude fibre and have a lowermetabolisable energy value than low-hulled oats.
The crude protein content, which ranges from 70 g/kg DM to 150 g/kg DM, is in-creased by the application of nitrogenous fertilisers. Oat proteins are of poor qualityand are deficient in the essential amino acids methionine, histidine and tryptophan,the amount of each of these acids in oat protein being generally below 20 g/kg.Thelysine content is also low but is slightly higher than that of the other cereal proteins.Glutamic acid is the most abundant amino acid of oat protein, which may contain upto 200 g/kg.
The oil content of oats is higher than that of most of the other cereal grains, andabout 60 per cent of it is present in the endosperm. As mentioned earlier, the oil isrich in unsaturated fatty acids and has a softening effect on the body fat.The range indry matter composition of 171 samples of oat grain harvested in Wales is shown inTable 22.2.
The husk of a variant of oats, naked oats (Avena nuda), is removed easily duringthreshing, leaving the kernel. Originally the yield and nutritional quality were low,but an improved variety, Rhiannon, was subsequently developed by the Welsh PlantBreeding Station (now the Institute for Biological and Environmental Rural Sciences).Naked oats have about 130–140 g crude protein, 6 g lysine and 100 g oil/kg DM.
Oat by-products
During the commercial preparation of oatmeal for human consumption, a number ofby-products are obtained that are available for animal feeding. When the oats arereceived at the mill they contain a number of foreign grains, mainly other cerealsand weed seeds, which are removed as cockle before processing.The cleaned oats arethen stabilised by steaming to inactivate the enzyme lipase, which is located almostentirely in the pericarp of the kernel. After stabilisation, the oats are kiln driedbefore passing on to the huller, which removes the husks. The kernels are thenbrushed or scoured to detach the fine hairs that cover much of their surface.
The main by-products of oatmeal milling are oat husks or hulls, oat dust andmeal seeds.The hulls form the main by-product, about 70 per cent of the total, andthe commercial product consists of the true husks with a variable proportion, up to10 per cent, of kernel material. Oat hulls are of very low feeding value, being littlebetter than oat straw. Their crude protein content is so low (about 30 g/kg DM)that in digestibility studies negative digestibility coefficients for nitrogen are likely

Chapter 22 Cereal grains and cereal by-products
554
to be obtained, as the amount of metabolic nitrogen excreted is greater than thatdigested from them. The crude fibre content is usually in the range 350–380 g/kgDM, which makes the by-product valueless as food for animals other than ruminants.
Oat dust is rich in kernel material and includes the kernel hairs removed from thegrain during brushing. It has a protein content of about 100 g/kg DM. Meal seeds con-sist of slivers of husk and fragments of kernels in approximately equal proportions.
Oat hulls may be combined with oat dust in the proportion in which theycome from the mill (4 : 1) to produce a product sold as ‘oat feed’. This material israther better in feeding value than the hulls alone, but the digestibility of theprotein is still low. In the UK oat feed should not, by legal definition, containmore than 270 g crude fibre/kg. An alternative use for the hulls is in the brewingindustry, where they are often added to the malt to assist in the drainage of wortfrom the mash tun.
The dehusked oats themselves (kernels or groats) are of high nutritive value, con-taining about 180 g crude protein/kg DM and less than 30 g crude fibre/kg DM.Thegroats are generally too expensive to give to farm animals and are ground into oat-meal after removal of the tips.The tips are mixed with any residues that accumulateduring the flow of the oats during milling and the product is designated ‘flowmeal’.Flowmeal can be a very valuable food, since it may contain the germ; most of thisby-product, however, is absorbed by the compound trade.
Cooked oatflakes, although expensive, are a useful ingredient in the diet of veryyoung piglets.
22.5 WHEAT
Grain of wheat (Triticum aestivum) is very variable in composition.The crude pro-tein content, for example, may range from 60 g/kg DM to 220 g/kg DM, though itis normally in the range 80–140 g/kg DM. Climate, soil fertility and variety influ-ence the protein content. The amount and properties of the proteins present inwheat are very important in deciding the quality of the grain for flour production.The most important proteins present in the endosperm are a prolamin (gliadin)and a glutelin (glutenin).The mixture of proteins present in the endosperm is oftenreferred to as ‘gluten’. The amino acid composition of these two proteins differs,glutenin containing about three times as much lysine as that present in gliadin.Themain amino acids present in wheat gluten are the dispensable acids glutamic acid(330 g/kg) and proline (120 g/kg). Wheat glutens vary in properties, and it ismainly the properties of the gluten that determine whether the flour is suitable forbread or biscuit making. All glutens possess the property of elasticity. Strongglutens are preferred for bread making and form a dough that traps the gasesproduced during yeast fermentation.
This property of gluten is considered to be the main reason why finely groundwheat is unpalatable when given in any quantity to animals. Wheat, especially iffinely milled, forms a pasty mass in the mouth and rumen, and this may lead todigestive upsets. Poultry are less susceptible, although wheat with a high gluten con-tent should not be given since a doughy mass may accumulate in the crop. Newlyharvested wheat is apparently more harmful in this respect than wheat that has beenstored for some time.

Other cereals
555
Wheat by-products
The wheat grain consists of about 82 per cent endosperm, 15 per cent bran or seed coat,and 3 per cent germ. In modern flour milling, the object is to separate the endospermfrom the bran and germ.The wheat, after careful cleaning and conditioning, is blendedinto a suitable mix (grist), depending upon the type of flour required, and is passedthrough a series of rollers arranged in pairs.The first pair of rollers have a tearing actionand release the bran coat from the endosperm.The rollers gradually break up the ker-nels and at the end of the various stages the flour is removed by sieving.The proportionof flour obtained from the original grain is known as the extraction rate.The mechani-cal limitations of milling are such that in practice about 75 per cent is the limit of whiteflour extraction; higher extraction rates result in the inclusion of bran and germ withthe flour. In the UK, wholemeal and brown flour are frequently made by adding all, orsome of, the milling by-products, respectively, to the straight-run white flour. Alterna-tively, the whole grain may be ground between stones to form a coarse wholemeal.
In the production of white flour, the extraction rate varies in different countries,but in the UK it is about 74 per cent. The remaining 26 per cent constitutes theresidues, or offals. Before roller milling replaced stone milling, many different gradesof wheat offals were sold.The names of these varied in different parts of the countryand even from mill to mill. Some names simply indicate the quality of the by-product or the stage of the process at which they arose, for example middlings andthirds. In modern roller milling, the offals may be sold complete as straight-runwheat feed or as three separate products – germ, fine wheat feed (shorts in the USA;pollard in Australia) and coarse wheat feed or bran.
The germ or embryo is very rich in protein (ca. 250 g/kg DM), low in fibre, and anexcellent source of thiamin and vitamin E. It may be collected separately or may beallowed to flow on to the fine wheat feed by-product.
Fine wheat feed varies considerably in composition, depending on the originalgrist and the extraction rate.The crude protein content is generally within the range160–210 g/kg DM and the crude fibre content about 40–100 g/kg DM. Fine wheatfeed can be safely used for all classes of farm animals and levels up to 30 per centcan be used satisfactorily in diets for finishing pigs.
Coarse wheat feed, or bran, contains more fibre and less protein than fine wheat feedand has always been a popular food for horses. It is not considered to be a suitable foodfor pigs and poultry because of its high fibre content. However, very little bran is nowavailable for feeding animals, as most of it is used in the preparation of breakfast cereals.
22.6 OTHER CEREALS
Rice
Rice (Oryza sativa), the main cereal crop of eastern and southern Asia, requires a sub-tropical or warm temperate climate, and little is grown in Europe north of latitude 49°.
Rice, when threshed, has a thick fibrous husk or hull like that of oats, and in thisstate is known as rough rice.The hull amounts to some 20 per cent of the total weightand is rich in silica.The hull is easily removed to leave a product known as brown rice.Brown rice is still invested in the bran, which may be removed with the aleuronelayer and the germ by skinning and polishing, thus producing polished rice.

Chapter 22 Cereal grains and cereal by-products
556
Rough rice may be used as a food for ruminants and horses, but brown rice ispreferable for pigs and compares favourably with maize in protein and energy value.Most rice, however, is used for human consumption and little is available in the UKfor farm animals.
The two main by-products obtained from rice milling are the hulls and rice meal.The hulls are high in fibre content and can contain up to 210 g/kg DM of silica.Theyalso have sharp edges, which may irritate the intestine and should never be given toanimals. Rice meal or rice bran comprises the pericarp, the aleurone layer, the germand some of the endosperm, and is a valuable product containing about 120–145 gcrude protein/kg DM and 110–180 g oil/kg DM. The oil is particularly unsaturatedand may become rancid very quickly; if it is removed, a product, extracted rice bran,of better keeping quality is obtained. The amounts of oil, crude protein and crudefibre in rice meal sold in the UK must be declared.
In the preparation of starch from rice, a product known as rice sludge or rice slump isleft as a residue.The dried product has a crude protein content of about 280 g/kg DMand low crude fibre and oil contents, and is suitable for ruminants and pigs.
Rye
The use of rye (Secale cereale) in the UK is relatively small and little is grown forfeeding farm animals. Rye grain is very similar to wheat in composition, although ryeprotein has higher lysine and lower tryptophan contents than wheat protein. It is re-garded as being the least palatable of the cereal grains. It is also liable to cause diges-tive upsets and should always be given with care and in restricted amounts.
Rye contaminated with ergot (Claviceps purpurea) may be dangerous to animals.This fungus contains a mixture of alkaloids, of which ergotamine and ergometrineare the most important and, in view of their action on uterine muscle, have been im-plicated as a cause of abortion in cattle consuming ergot-infested rye. However, it isnot certain that the quantity of ergotamine could be sufficient to cause abortion.More importantly, chronic poisoning by the alkaloids causes injury to the epitheliumof the capillaries, reducing blood flow and resulting in coldness and insensitivity ofthe extremities. Subsequently, lameness and necrotic lesions occur in the feet, tailand ears of mammals and the comb, tongue and wattle of birds.
Like wheat, rye should be crushed or coarsely ground for feeding to animals. Ryeis not commonly given to poultry. Studies with chicks have shown that rye containsat least two detrimental factors, an appetite-depressing factor located primarily inthe bran, and a growth-depressing factor found in all parts of the grain.
Most of the rye grown in the UK is used for the production of rye breads andspeciality products for human consumption. Some is used for brewing and distilling.The offals from the production of rye malt are rye bran and rye malt culms, but theseare available in such small amounts in the UK as to be of little importance.
Triticale
Triticale is a hybrid cereal derived from crossing wheat with rye. Its name is derivedfrom a combination of the two generic terms for the parent cereals (Triticum andSecale). The objective in crossing the two cereals was to combine the desirablecharacteristics of wheat, such as grain quality, productivity and disease resistance,with the vigour and hardiness of rye.

Other cereals
557
Triticale is grown commercially in central and northern Europe, North Americaand South America, mainly for animal feeding. Its composition is very variable; Hun-garian strains, for example, can range in crude protein content from 110 g/kg DM to185 g/kg DM. Recent strains of triticale are at least equal in protein content towheat, and the quality of protein in the hybrid is better than that in wheat becauseof its higher proportion of lysine and sulphur-containing amino acids. However, it isdeficient in tryptophan. As with rye, triticale is subject to ergot infestation. Studiesusing this hybrid have demonstrated increased liver abscesses in steers when com-pared with sorghum diets. Triticale contains trypsin inhibitors and alkyl resorcinols,and both of these have been implicated in problems of poor palatability and per-formance in pigs. It is generally recommended that triticale be limited to 50 per centof the grain in the diets of farm animals.
Millet
The name ‘millet’ is frequently applied to several species of cereals that produce smallgrains and are widely cultivated in the tropics and warm temperate regions of the world.
The most important members of this group include Pennisetum americanum(pearl or bulrush millet), Panicum miliaceum (proso or broomcorn millet), Setariaitalica (foxtail or Italian millet), Eleusine coracana (finger or birdsfoot millet),Paspalum scorbiculatum (kodo or ditch millet) and Echinochloa crusgalli (Japaneseor barnyard millet).
The composition of millet is very variable, the crude protein content beinggenerally within the range 100–120 g/kg DM, the ether extract 20–50 g/kg DM andthe crude fibre 20–90 g/kg DM.
Millet has a nutritive value very similar to that of oats and contains a high contentof indigestible fibre owing to the presence of hulls, which are not removed by ordi-nary harvesting methods. Millet is a small seed and is usually ground for feedinganimals other than poultry.
Sorghum
Sorghum (Sorghum bicolor) is the main food grain in Africa and parts of India andChina.This cereal is also grown in the southern parts of the USA, where it is the secondmost important feed grain. It is more drought-resistant than maize, for which it is usedas a replacement. There are many different types of sorghum (e.g. dari, milo) and, asthey vary in grain size, typical analyses can be misleading when applied to individualsamples.
The kernel of sorghum is very similar to that of maize, although it is smaller in size.It generally contains rather more protein but less oil than maize and has no pigment-ing xanthophylls. Dark varieties contain tannins, which reduce protein digestibility.Whole sorghum grains can be given to sheep and poultry but are usually ground forother animals. Care is needed in the grinding process, as this may produce a finepowder, which is pasty and unpalatable.
Cereal grain screenings
Grain screenings are the residues from the preparation, storage and shipment of cerealproducts and comprise broken pieces of grain, small grains and the dust from the outerlayers of the grain. Their properties and nutritional quality vary widely according to

Chapter 22 Cereal grains and cereal by-products
558
factors such as type and method of processing of grain and collection point in the sys-tem. Screenings from the individual cereals may be sold separately or in combination.Problems associated with their use include the presence of weed seeds and, in oldproducts, mycotoxins and rancidity of oils.
22.7 CEREAL PROCESSING
The processing of cereals for use as animal foods, by simple techniques such asrolling or grinding, has been common practice for many years. More recently, a rangeof other techniques have become available, and these can be classified into two basictypes – hot processes, in which heat is either applied or created during the treatmentprocess, and cold processes, in which the temperature of the grain is not increasedsignificantly. The hot treatments include steam flaking, micronisation, roasting andhot pelleting. Steam flaking is often carried out on maize by cooking the grain withsteam, and then passing it through rollers to produce a thin flake, which is thendried. Flaked maize is considered to be more acceptable to animals and is of slightlyhigher digestibility than the unprocessed grain. Steaming and flaking are also knownto increase the proportion of propionic acid in the volatile fatty acids in the rumen.Whereas about 75 per cent of the starch of ground maize is digested in the rumen,this is increased to about 95 per cent following steaming and flaking. Even largereffects have been recorded with sorghum (ground 42 per cent v. steam processed91 per cent). Conversely, the starch of ground barley is well digested in the rumen, asis that of ground wheat.
The term ‘micronisation’, in the context of grain processing, is used specifically todescribe cooking by radiant heat followed by crushing in a roller mill. In this processthe starch granules swell, fracture and gelatinise, thus making them more available toenzyme attack in the digestive tract. For poultry, hot (steam) pelleting appears to besuperior to cold pelleting, as measured by growth rate and feed conversion effi-ciency. Steam-processed or pressure-cooked sorghum grains also appear to be betterutilised than unprocessed sorghum by chicks. Cooked cereals are also desirable inthe diet of young pigs, which have a limited capacity to digest raw starch.
The ‘cold processes’ include grinding, rolling, cracking or crimping, cold pelleting,and addition of organic acids or alkalis. Grinding of cereals is essential for maximumperformance of poultry kept under intensive conditions as they do not have accessto grit, which is used in the gizzard to break down grains. Pigs are rather poor chew-ers of food; when given whole cereal grains, a high proportion passes through the gutundigested. Therefore, pigs are usually given ground grains; those receiving groundbarley generally perform better than those given crimped barley. Efficient rolling toproduce flattened grains is also successful. The degree of grinding should not beexcessive, as grinding beyond a certain fineness does not improve digestibility orperformance and can precipitate problems with regard to the health of the pigs. Finegrinding can produce dusty material that can be inhaled and can cause irritation tothe eyes and may induce vomiting. In addition, feeding with finely ground cereals,particularly wheat and maize, is associated with ulceration of the oesophageal regionof the stomach. Here, the fine particles result in very fluid stomach contents, andpepsin and acid are transported very easily within the stomach and reach the unpro-tected oesophageal region. The increased fluidity may also result in regurgitation of

Cereal processing
559
duodenal digesta.With wheat there is the additional problem of fine grinding produc-ing an unpalatable pasty mass in the mouth. However, coarse grinding of wheat re-sults in poor digestibility; efficient rolling of the grain produces the best product, butthis can be difficult to achieve. Owing to their high fibre content, fine grinding of oatsproduces the best response.
In the case of horses, starch digestibility from cereals over the whole gut is high,irrespective of the cereal source. However, this masks the extent of digestion in thedifferent segments of the gut. It is important that the starch is mainly digested pre-caecally, since starch that reaches the large intestine will be fermented by the micro-bial population to produce acids, including lactic acid.Although the fermentation ofstarch in the large intestine has improved the utilisation of very poor roughages, suchas straw, probably by providing additional nutrients to the microbes, lactic acidproduction is detrimental to the health of the horse. Lactic acid reduces the pH ofthe digesta, irritates the gut wall, and causes the death of the normal fibre-digestingbacteria with the release of endotoxins, which are absorbed into the bloodstreamand can cause laminitis. Opportunity for starch digestion in the small intestine of thehorse is limited by a rapid transit of digesta and limited �-amylase activity. Thecapacity for digestion of starch in the small intestine is around 3 g/kg body weightper meal, depending on the source of the starch.Thus, methods of processing cerealsto ensure rapid digestion of starch in the small intestine are desirable. In the case ofoats, the size of the grain is appropriate for effective disruption by chewing, and thestarch granules are small and easily digested, and so oats can be given whole tohorses. Barley and wheat grains are small and escape efficient breakage during chew-ing, and they need to be physically broken in order to expose the endosperm. Maizegrains, on the other hand, are large but tend to be hard, and so they also requirebreakage. Bruising or coarse grinding of cereal grains rather than complete disinte-gration by fine grinding is more desirable since the latter does not give a furtherincrease in starch digestion and creates an unpalatable, pasty product that is lessstable in storage. Heat treatment by steam flaking, micronisation or extrusionincreases the susceptibility of the starch to digestion in the small intestine andreduces the amount reaching the large intestine.
It is generally accepted that for cattle, barley grain should be coarse ground orrolled.When consumed whole, a large proportion of the grains escape chewing anddigestion, the amount being greater for older animals, possibly owing to their largerreticulo-omasal orifice allowing the grains to escape from the rumen more easily.The proportion escaping digestion also depends on the forage/grain ratio in the diet.In high-grain diets, such as those used for ‘barley beef’ production, more of thewhole grain is digested and the proportion appearing in the faeces can drop signifi-cantly, especially with light barley. In such cases, the benefit from processing mustbe weighed against its cost. Studies with grains in nylon bags suspended in therumen of cattle have shown that only minor damage to the seed coat is required forefficient digestion by the microflora. Therefore, the degree of processing should beminimal, as this avoids acidic conditions in the rumen.With sheep, however, becausethey masticate their feed so well, there is generally no advantage in processinggrains.This is illustrated in Table 22.5, which shows the results of a study with early-weaned lambs given whole grains or ground and pelleted grains. There were nomarked effects of grinding and pelleting on liveweight gain and food conversion ef-ficiency, although there were differences between cereals. Although processing hadno effect on nitrogen digestibility, it significantly depressed the organic matter

Chapter 22 Cereal grains and cereal by-products
560
digestibility of barley and increased that of wheat. Furthermore, whole grain feed-ing had two additional advantages over pelleted grain. First, high levels of pelletedbarley for lambs resulted in unacceptably soft fat, which was due to the depositionof increased amounts of branched chain and odd-numbered fatty acids. This oc-curred as a result of a failure of the liver to metabolise the increased propionate,leading to its direct incorporation into fatty acids (odd-numbered chains) and theutilisation of methyl malonate (branched chains). Second, the occurrence of ru-menitis in lambs fed on high-concentrate diets was less pronounced with whole bar-ley than with rolled and pelleted barley.This may be related to the lower rumen pHwith processed barley. One exception to the use of whole grain in sheep diets is thatit should not be given to ewes as a supplement to silage. Here, a significant propor-tion of the grains would escape digestion.
Organic acids, such as propionic acid, are sometimes added to high-moisturegrain, especially barley, as a mould inhibitor. Unless the acid is effectively distrib-uted, patches of mouldy grain may present a health hazard. Certain Fusariumspecies have been associated with such mouldy grain, and these are known to pro-duce metabolites such as zearalenone, which has oestrogenic activity and can causevulvovaginitis and the characteristic splay-leg syndrome in pigs.The required rate ofapplication of the acid increases with the moisture content of the grain. With graincontaining up to 250 g moisture/kg (750 g dry matter/kg), barley can be treated andstored whole and processed at the time of feeding. Alternatively, the grain can beprocessed and the acid applied before sealing in a pit. This technique generally re-quires a higher rate of application (by about 10 per cent) of acid.With higher mois-ture contents of 350–450 g/kg, the grain can be crimped and the propionic acid, incombination with other short-chain fatty acids and formaldehyde, is applied beforestorage of the grain in a sealed pit. The latter two methods result in a product thatdoes not require further processing before being given to cattle.
Chemical treatment with sodium hydroxide, in granular form or solution, hasbeen used as an alternative to mechanical treatment (e.g. rolling) of barley and othercereal grains.The intention is to soften the husk but not to expose the endosperm torapid fermentation in the rumen, which would create excessively acid conditions.Originally, in practice it proved difficult to achieve these objectives by sodium
Table 22.5 Performance and digestibility of early weaned lambs given four cereals
Cereal Processing Liveweight Feed conversion Digestibility
gain (g/day) efficiency Organic matter Nitrogen
(kg feed/kg gain)
Barley Whole, loose 340 2.75 0.81 0.72Ground, pelleted 347 2.79 0.77 0.66
Maize Whole, loose 345 2.52 0.84 0.75Ground, pelleted 346 2.62 0.82 0.69
Oats Whole, loose 241 3.07 0.70 0.78Ground, pelleted 238 3.33 0.68 0.77
Wheat Whole, loose 303 2.97 0.83 0.71Ground, pelleted 323 2.56 0.87 0.76
Adapted from Ørskov E R, Fraser C and Gordon J G 1974 British Journal of Nutrition 32: 59; and Ørskov E R, Fraser C and McHattie I1974 Animal Production 18: 85.

Summary
561
hydroxide treatment of barley. However, a method of treating barley and wheatgrains has been developed using a mixer wagon. Sodium hydroxide and water(depending on the moisture content of the grain) are added, followed by mixing andthen spreading the treated grain to allow it to cool. It is then heaped up and is readyfor feeding after 4 days. Treated wheat grain is considered to have beneficial effectson dairy cows, especially in counteracting very acid or highly buffered silages, inaddition to any effects of reducing the rate of fermentation in the rumen.
Satisfactory liveweight gains have been achieved with ammonia-treated wholemoist barley and wheat given to beef cattle. Use of ammonia preserves the grain andincreases its crude protein (rumen-degradable protein) content in addition to elimi-nating the need to dry and process the grain. Ammonia-treated grain was eaten at aslower rate than processed grain, which is advantageous in that it reduces the chanceof the development of acid conditions in the rumen. Although some whole grainpassed through the animal undigested, this had no effect on performance. Treatinggrain with ammonia requires specialised equipment.A more simple method of treat-ment has now been adopted that uses a solution of urea and employs the naturalurease enzyme activity of the grain to release ammonia, which dissolves in the mois-ture on the grain.This method is easily applied on farm and retains all the advantagesof ammonia treatment outlined above. Grain is harvested at 250–300 g moisture/kgand a concentrated urea solution is applied using an auger at the rate of 30 g urea/kgDM for wheat or 40 g/kg DM for barley.The grain is then sealed in a clamp and leftfor 4 weeks, during which time the urea is converted to ammonia, which attacks theseed coat.
SUMMARY
1. Cereals are the principal sources of energy indiets for non-ruminants and in concentratesfor ruminants.
2. Cereals are characterised by high starch andlow fibre contents.
3. The crude protein content of cereals rangesfrom 80 g/kg to 130 g/kg dry matter.
4. The calcium content is low. The phosphoruscontent is moderate but has a reduced avail-ability to non-ruminants, much of it being inthe form of phytate phosphorus.
5. There are many cereal by-products from thehuman food-processing industry that are use-ful as foods for animals. The by-products ofthe brewing industry are malt culms, brewer’sgrains, spent hops and dried brewer’s yeast.The main by-products of the distilling industryare distiller’s grains, pot ale syrup and drieddistiller’s dark grains. Maize by-products fromstarch production include maize germ meal,
prairie meal and maize gluten feed. Oatmilling by-products include oat hulls, oat feedand flowmeal. Wheat bran and wheat feed areby-products of flour milling.
6. There are several methods of processing ofcereals. The extent of or need for processingvaries between the grains and the targetanimals. Generally, the outer layer of the grainhas to be disrupted in some way in order toensure efficient digestion of the starchy en-dosperm. Inapproproiate processing can leadto problems such as gastric ulcers in pigs andacidosis in the hind gut of horses. Poultry thathave access to grit, and sheep, can be givenwhole grains.
7. Organic acids are used to preserve high-moisture grain.
8. Chemical treatment with sodium hydroxide,ammonia or urea can be used as an alternativeto physical processing of grains for ruminants.

Chapter 22 Cereal grains and cereal by-products
562
QUESTIONS
22.1 How should cereal grains be processed for cattle, sheep, pigs, poultry andhorses?
22.2 What problems can occur with diets containing large amounts of cerealswhen fed to cattle?
22.3 Describe the limitations of cereal proteins for livestock.
22.4 Describe the by-products of the brewing and distilling industries that areused as animal foods.
FURTHER READING
Black H, Edwards S, Kay M and Thomas S 1991 Distillery By-Products as Feeds for Live-stock,Aberdeen, Scottish Agricultural College.
Church D C 1984 Livestock Feeds and Feeding, 2nd edn, Corvallis, OR, O and B Books.
Crawshaw R 2001 Co-Product Feeds, Nottingham, Nottingham University Press.
Duffus C M and Slaughter J C 1980 Seeds and Their Uses, Chichester, John Wiley & Sons.
Gõhl B 1981 Tropical Feeds, Rome, FAO.
Kent N L 1983 Technology of Cereals, 3rd edn, Oxford, Pergamon Press.
Ørskov E R 1981 Recent advances in the understanding of cereal processing for ruminants.In: Haresign W and Cole D J A (eds) Recent Developments in Ruminant Nutrition,London, Butterworth.
Symposium 1999 Premium grains for livestock. Australian Journal of Agricultural Research50: 629–908.

563
23.1 Oilseed cakes and meals
23.2 Oilseed residues of minor importance
23.3 Leguminous seeds
23.4 Animal protein concentrates
23.5 Milk products
23.6 Single-cell protein
23.7 Synthetic amino acids
23.8 Non-protein nitrogen compounds as protein sources
23 Protein concentrates
23.1 OILSEED CAKES AND MEALS
Oilseed cakes and meals are the residues remaining after removal of the greater partof the oil from oilseeds.The residues are rich in protein (200–500 g/kg) and most arevaluable foods for farm animals.The total usage of these products by the animal feedindustry in Britain in 2008 was of the order of 2.6 million tonnes. This is similar tothe figure of 2.7 million in 1999, but less than the 3.5 million tonnes used in 1991.
Soya bean meal made up about 45 per cent of the total in 2008 (compared with38 per cent in 1999), and rapeseed, at 29 per cent, was again the next largest contrib-utor (Table 23.1).The trend from 2005 to 2008 indicates an increased usage of bothsoya bean and rapeseed meal, but particularly for soya bean meal. By contrast, usageof sunflower meal and whole seeds decreased, contributing 8 per cent and 1.5 per centin 2008, respectively. The remaining 16 per cent encompassed a wide range of lesswell-known products such as sheanut, sesame and guar as well as the more familiarproducts such as linseed and cotton seed meals.
Most oilseed residues are of tropical origin; they include groundnut, cotton seedand soya bean. Some seeds such as castor bean yield residues are unsuitable for ani-mal consumption because they contain toxic substances.
Two main processes are used for removing oil from oilseeds. One uses pressure toforce out the oil, and the other uses an organic solvent, usually hexane, to dissolvethe oil from the seed. Some seeds, such as groundnut, cotton seed and sunflower,have a thick coat or husk, rich in fibre and of low digestibility, which lowers the nu-tritive value of the material. It may be completely or partially removed by crackingand riddling, a process known as decortication. The effect of decortication of cottonseed upon the nutritive value of the cake derived from it is shown in Table 23.2.

Chapter 23 Protein concentrates
564
Table 23.1 Usage of oilseed products by the British feed-compounding industry,2005–2008
Raw material Usage per year (million tonnes)a
2005 2006 2007 2008
Soya bean meal 0.888 0.982 1.161 1.198(40.0) (40.3) (44.4) (45.3)
Rapeseed meal 0.606 0.666 0.712 0.768(27.8) (27.3) (27.5) (29.0)
Sunflower meal 0.266 0.286 0.256 0.204(12.0) (11.7) (9.8) (7.7)
Whole oilseeds 0.049 0.051 0.058 0.04(2.2) (2.1) (2.2) (1.5)
Others 0.399 0.452 0.421 0.434(18.0) (18.6) (16.1) (16.4)
Total 2.217 2.438 2.614 2.643
a Figures in parenthesis are percentages of the total.
Removal of the husk lowers the crude fibre content and has an important effect inimproving the apparent digestibility of the other constituents.As a result, the nutritivevalue of the decorticated cake is raised significantly above that of the undecorticatedcake. The latter is suitable for feeding adult ruminants only. In this class of animal, itmay have a particular role in maintaining the fibre levels of the diets. Undecorticatedcakes are rarely produced nowadays but partial decortication is widely practised.
In the press process, the seed from which oil is to be removed is cracked andcrushed to produce flakes about 0.25 mm thick, which are cooked at temperatures upto 104 °C for 15–20 minutes. The temperature is then raised to about 110–115 °Cuntil the moisture content is reduced to about 30 g/kg. The material is then passedthrough a perforated horizontal cylinder in which revolves a screw of variable pitchthat gives pressures up to 40 MN/m2. The residue from screw pressing usually has an oil content of 25–40 g/kg. The cylindrical presses used for extraction are called expellers and the method of extraction is usually referred to as the expeller process.
Only material with an oil content of less than 350 g/kg is suitable for solventextraction. If material of higher oil content is to be so treated, it first undergoes amodified screw pressing to lower the oil content to a suitable level.The first stage in
Table 23.2 Composition and nutritive value of cotton seed cakes
Composition (g/kg)
Dry matter Crude protein Ether extract N-free extractives Crude fibre Ash
Undecorticated 880 231 55 400 248 66Decorticated 900 457 89 293 87 74
Digestibility Metabolisable
Crude protein Ether extract N-free extractives Crude fibreenergy (MJ/kg DM)
Undecorticated 0.77 0.94 0.54 0.20 8.5Decorticated 0.86 0.94 0.67 0.28 12.3

Oilseed cakes and meals
565
solvent extraction is flaking; after this, the solvent is allowed to percolate throughthe flakes, or a process of steeping may be used.The oil content of the residual ma-terial is usually below 10 g/kg and it still contains some solvent, which is removed byheating. Some meals may benefit from being heated, and advantage is taken of theevaporation of the solvent to do this; soya bean meal, for example, is toasted at thisstage in its production.
About 950 g/kg of the nitrogen in oilseed meals is present as true protein, whichhas an apparent digestibility of 0.75–0.90 and is of good quality. When biologicalvalue is used as the criterion for judging protein quality, that of the oilseed proteinsis considerably higher than that of the cereals (Table 23.3).
Some of the oilseed proteins approach animal proteins such as fishmeal and meatmeal in quality, though as a class they are not as good. Certainly the oilseed proteinsare of poorer quality than the better animal proteins such as those of milk and eggs.The figures for protein efficiency ratio and gross protein value confirm the goodquality of the oilseed proteins, but their chemical scores are low. This means thatthey have a poorly balanced amino acid constitution, having a large deficit of at leastone essential amino acid. In general, oilseed proteins have a low cystine and methio-nine content and a variable but usually low lysine content. As a result, they cannotprovide adequate supplementation of the cereal proteins with which they are com-monly combined, and they are often used in conjunction with an animal proteinwhen given to simple-stomached animals. The quality of the protein in a particularoilseed is relatively constant, but that of the cake or meal derived from it may varydepending upon the conditions used for the removal of the oil. The high tempera-tures and pressures of the expeller process may denature the protein and reduce itsdigestibility, with a consequent lowering of its nutritive value. For ruminant animals,such a denaturation may be beneficial owing to an associated reduction in degrad-ability. The high temperatures and pressures also allow control of deleterious sub-stances such as gossypol and goitrin. Solvent extraction does not involve pressing,temperatures are comparatively low, and the protein value of the meals is almost thesame as that of the original seed.
Owing to EU legislation prohibiting the use in ruminant diets of animal-derivedprotein sources, which are generally high in undegradable protein, sources of rumi-nally protected vegetable protein sources have been developed.These sources have a
Table 23.3 Nutritive value of some food proteins
Source Biological Chemical Protein efficiency Gross protein
value (rat) score ratio (rat) value (chick)
Oats 0.65 0.46Wheat 0.67 0.37 1.5Maize 0.55 0.28 1.2Cotton seed meal 0.80 0.37 2.0 0.77Groundnut meal 0.58 0.24 1.7 0.48Soya bean meal 0.75 0.49 2.3 0.79White fishmeal 0.77 1.02Milk 0.85 0.69 2.8 0.90Whole egg 0.95 1.00 3.8

Chapter 23 Protein concentrates
566
reduced rumen-degradable protein content and subsequently increased undegrad-able protein content when compared with unprotected sources.They are most usefulwhen fed to higher-producing animals such as high-yielding dairy cows, lactatingewes, and young growing animals that have a higher digestible undegradable proteinrequirement. Several methods to reduce the rate and extent of ruminal degradationof feed proteins have been developed, including heat treatment and the use of chem-ical agents such as formaldehyde or lignosulphate, a by-product of the wood pulpindustry that contains a variety of sugars, particularly xylose. Heat processingdecreases protein degradation in the rumen by denaturing proteins and the forma-tion of protein–carbohydrate cross-links (Maillard reactions) and protein–proteincross-links. Underheating results in little effect on ruminal degradability, whereasoverheating reduces intestinal digestibility and a significant loss of lysine. Chemicalssuch as aldehydes introduce cross-linkages in proteins that are resistant to microbialattack, whereas the combination of heat and xylose enhances non-enzymic browning(Maillard reactions) due to the increased availability of sugar aldehydes that reactwith the protein. In general, these protected sources decrease rumen-degradableprotein and increase the rumen-undegradable protein content by approximately100–350 g/kg dietary protein, although it also reduces intestinal digestibility. In theCornell net carbohydrate and protein system, Maillard products are assumed to betotally indigestible.
The oilseed cakes may make a significant contribution to the energy content ofthe diet, particularly when the oil content is high.This will depend upon the processused and its efficiency. Expeller soya bean meal may have an oil content of 66 g/kgDM and a metabolisable energy concentration for ruminants of 14 MJ/kg DM,whereas solvent-extracted meal has 17 g of oil and 12.3 MJ of metabolisable energyper kilogram of dry matter. Digestive disturbances may result from uncontrolled useof cakes rich in oil and, if the oil is unsaturated, milk or body fat may be soft and thecarcass quality lowered.
The oilseed meals usually have a high phosphorus content, which tends to aggra-vate their generally low calcium content. They may provide useful amounts of the B vitamins but are poor sources of carotene and vitamin E.
Soya bean meal
Soya beans contain 160–210 g/kg of oil and are normally solvent-extracted; theresidual meal has an oil content of about 10 g/kg. Hi-Pro soya does not have thehulls reblended and is therefore generally higher in protein and energy and lower infibre than other sources.The meal is generally regarded as one of the best sources ofprotein available to animals, and in 2008 it was the major protein source used inanimal feeding in the UK.The protein contains all the essential amino acids, but theconcentrations of cystine and methionine are suboptimal. Methionine is the first lim-iting amino acid and may be particularly important in high-energy diets.
Soya bean meal contains a number of toxic, stimulatory and inhibitory substancesincluding allergenic, goitrogenic and anticoagulant factors. Of particular importancein nutrition are the protease inhibitors, of which six have been identified. Two ofthese, the Kunitz anti-trypsin factor and the Bowman–Birk chymotrypsin inhibitor,are of practical significance. The protease inhibitors are partly responsible for thegrowth-retarding property of raw soya beans and unheated soya bean meal. Theretardation has been attributed to inhibition of protein digestion, but there is evidence

Oilseed cakes and meals
567
that pancreatic hyperactivity results in increased production of trypsin and chy-motrypsin.The consequent loss of cystine and methionine accentuates the marginalstatus of soya bean meal with regard to these acids and results in induced deficien-cies of both. The Kunitz factor, but not the Bowman–Birk factor, is inactivated(30–40 per cent) by human gastric juice in vivo at pH 1.5–2.0. However, the pH ofthe stomach is above 2.0 most of the time. The Bowman–Birk factor is inactivated in its passage through the intestine of the chick.
Another substance contributing to the growth retardation is a haemagglutenin,which is capable of agglutinating red blood cells in rats, rabbits and human beingsbut not in sheep and calves.The toxic agent belongs to a group of compounds knownas lectins.These are proteins capable of recognising and binding reversibly to the car-bohydrate moieties of glycoproteins on the surface of cell membranes, and theyhave been shown to be responsible for impaired growth and death in test animals.They exert their toxicity by binding to the epithelial cells lining the small intestine,disrupting the brush border and reducing the efficiency of the absorption of nutri-ents. Lectins have also been shown to cause inhibition of brush-border hydrolases. Ithas been suggested that lectins impair the body’s defence system against bacterialinfection, and there is then an increased tendency for invasion of the body by the gutmicroflora. Others have postulated that lectins encourage colonisation of the smallintestine by coliforms. About half the growth-retarding effect of soya bean meal inmonogastric animals has been attributed to the lectin content. Their toxicity varies,being extreme in the castor bean but relatively mild in the soya bean.The inhibitorsare inactivated by heating, which accounts for the preference shown for toasted mealsfor simple-stomached animals. For ruminant animals, the inhibitors are not impor-tant and toasting is unnecessary.The process of toasting must be carefully controlledsince overheating will reduce the availability of lysine and arginine and reduce thevalue of the protein.
Provided the meal has been properly prepared (has less than a specified maxi-mum urease activity of 0.4 mg N/g per minute), it forms a very valuable food forfarm animals. However, if soya bean meal is used as the major protein food forsimple-stomached animals, certain problems arise.The meal is a poor source of B vi-tamins, and these must be provided either as a supplement or in the form of an ani-mal protein such as fishmeal. If such supplementation is not practised, sows mayproduce weak litters that grow slowly because of reduced milk yields; older pigsshow lack of coordination and failure to walk. On such diets, breeding hens produceeggs of poor hatchability, giving chicks of poor quality; such chicks may have anincreased susceptibility to haemorrhages owing to a shortage of vitamin K. Soya beanmeal is a better source of calcium and phosphorus than the cereal grains, but when itreplaces animal protein foods, adjustments must be made in the diet, particularly forrapidly growing animals and laying hens. As long as adequate supplementation ispractised, it may form up to 400 kg/t of poultry diets and 250 kg/t of pig diets.
Soya bean meal contains about 1 g/kg of genistein, which has oestrogenic proper-ties and a potency of 4.44 � 10�6 times that of diethylstilboestrol.The effect of thisconstituent on growth rate has not been elucidated.
The oil in the soya bean has a laxative effect and may cause soft body fat to beproduced. The extracted meal does not contain sufficient oil to cause this problem,but it should be borne in mind in view of the increasing tendency to use full-fat soyabean products in dietary formulations, especially for pigs. The full-fat products areproduced by batch pressure cooking or extrusion of the whole bean. The extruded

Chapter 23 Protein concentrates
568
product has a higher metabolisable energy content, but this advantage is nullified ifthe products are ground and pelleted.
Soya protein concentrates are produced by solvent extraction and removal ofinsoluble carbohydrate. Protein concentration is of the order of 70 per cent. Duringprocessing, antigenic and antinutritional substances are removed and the materialsare suitable for inclusion in calf milk replacers and baby pig diets.
Cotton seed meal
The protein of cotton seed meal is of good quality but has the common disadvantageof oilseed proteins of having a low content of cystine, methionine and lysine, lysinebeing the first limiting amino acid.The calcium content is low and, since the calciumto phosphorus ratio is about 1:6, deficiencies of calcium may easily arise. It is a goodthough variable source of thiamin but a poor source of carotene.
When cotton seed meal is used as a protein source for young, pregnant or nursingpigs, or young or laying poultry, it needs to be supplemented with fishmeal to makegood a shortage of essential amino acids and calcium. A supplement of vitamins Aand D should also be provided. Pigs and poultry do not readily accept the meal,mainly because of its dry, dusty nature. No such difficulty is encountered with lactat-ing cows, although complications may arise when large amounts are given, since themilk fat tends to become hard and firm. Butter made from such fat is often difficultto churn and tends to develop tallowy taints.Another factor to be considered whenusing cotton seed meal is its costive action.This is not normally a problem and mayindeed be beneficial in diets containing large amounts of laxative constituents.
Cotton seeds may contain from 0.3 g/kg to 20 g/kg DM of a yellow pigmentknown as gossypol, and concentrations of 4–17 g/kg DM have been quoted for thekernels. Gossypol is a polyphenolic aldehyde (alkanal), which is an antioxidant andpolymerisation inhibitor toxic to simple-stomached animals. The general symptomsof gossypol toxicity are depressed appetite, loss of weight, laboured breathing andcardiac irregularity. Death is usually associated with a reduced oxygen-carrying ca-pacity of the blood, haemolytic effects on the erythrocytes and circulatory failure.Post-mortem examinations usually show extensive oedema in the body cavities, in-dicating an effect on membrane permeability.Although acute toxicity is uncommon,ingestion of small amounts over a prolonged period can be lethal. In the past it hasbeen considered important to distinguish between free (soluble in 70–30 v/v aque-ous acetone) and bound gossypol, since only the former was considered to be phys-iologically active. It is now considered that some of the bound material is active, butthis does not negate the general thesis that it is the free gossypol content that deter-mines the toxic potency of the material. The free gossypol content of cotton seedmeal decreases during processing and varies according to the methods used. Screw-pressed materials have 200–500 mg free gossypol/kg, prepressed solvent-extractedmeals 200–700 mg/kg and solvent-extracted 1000–5000 mg/kg. Processing condi-tions have to be carefully controlled to prevent loss of protein quality owing to thebinding of gossypol to lysine at high temperatures. Fortunately, the shearing effect ofthe screw press in the expeller process is an efficient gossypol inactivator at temper-atures that do not reduce protein quality.
It is generally considered that pig and poultry diets should not contain more than100 mg free gossypol/kg and that inclusions of cotton seed meal should be in therange 50–100 kg/t. Particular care is required with laying hens, since comparatively

Oilseed cakes and meals
569
low levels of the meal may cause an olive-green discoloration of the yolk in storage.An associated pink discoloration of the albumen is now considered to be due tocyclopropenoids and not gossypol, as was once thought.Treatment with ferrous sul-phate can ameliorate the effects of gossypol, with doses ranging from 1 to 4 partsferrous sulphate to 1 part gossypol. Ruminant animals do not show ill effects, evenwhen they consume large quantities of cotton seed meal.
In the UK, the free gossypol content of foods is strictly controlled by law. Straightfoods, except cotton cake and meal, must not contain more than 20 mg/kg; the samelimit applies to complete foods for laying hens and piglets. For poultry and calves,the limit is 100 mg/kg, for pigs 60 mg/kg and for cattle, sheep and goats 500 mg/kg.Cotton cakes and meals are allowed to contain up to 1200 mg free gossypol/kg.Theconcentrations refer to foods with a moisture content of 120 g/kg.
Coconut meal
The oil content of coconut meal varies from 25 g/kg to 65 g/kg, meals of higher oilcontent being very useful in the preparation of high-energy diets. However, they suf-fer the disadvantage of being susceptible to becoming rancid in store.The protein islow in lysine and histidine, and this, together with the generally high fibre content ofabout 120 g/kg, limits the use of the meal for simple-stomached animals. It is usuallyrecommended that it should form less than 25 kg/t of pig diets and less than 50 kg/tof poultry diets. When low-fibre coconut meals are available for simple-stomachedanimals, they have to be supplemented with animal proteins to make good theiramino acid deficiences. Neither protein quality nor fibre content is limiting for rumi-nant animals, and coconut meal provides an acceptable and very useful protein sup-plement. In diets for dairy cows it is claimed to increase milk fat content. Somepublished work has shown increased butterfat contents in the milk of cows givensupplements of coconut meal, but the basal diet had a fat content of about 10 g/kgonly. The milk fats produced on diets containing considerable amounts of coconutmeal are firm and excellent for butter making.
Coconut meal has the valuable property of absorbing up to half its own weight ofmolasses and as a result is popular in compounding.
Palm kernel meal
Palm kernel meal generally refers to the product obtained after solvent extraction ofpalm oil from the oil palm, whereas palm kernel cake is produced by mechanical ex-traction. In practice, the term ‘palm kernel meal’ is often used to describe eitherproduct. This food has a comparatively low content of protein, and the balance ofamino acids is poor. The first limiting amino acid is lysine. The ratio of calcium tophosphorus is more favourable than in many other oilseed residues.The meal is dryand gritty, especially the solvent-extracted product, and is not readily eaten; it istherefore used in mixtures with more acceptable foods. Attempts to use it mixedwith molasses, as molassed palm kernel cake, have not been successful. It has a rep-utation for increasing the fat content of milk, and its chief use is for dairy cows. Palmkernel meal has been described as being balanced for milk production, but in fact itcontains too high a proportion of protein to energy.
Palm kernel meal has traditionally not been used widely in pig and poultry diets.This is partly because it is unpalatable and partly because of its high fibre content

Chapter 23 Protein concentrates
570
(150 g/kg DM), which reduces its digestibility for such animals. The highest level ofpalm kernel meal recommended in the diet of simple-stomached animals is about 50 kg/t. More recent studies have demonstrated acceptable performance in chicks,with inclusion rates of up to 400 kg/t, provided the diets are balanced for aminoacids and metabolisable energy. Additionally, the relatively high content of β-man-nan in palm kernel meal has been suggested to act as a prebiotic and reduce intes-tinal load of Salmonella and improve the immune system in birds. In dairy cows,palm kernel meal has been included at up to 150 g/kg DM without an adverse effecton milk yield or composition.
Linseed meal
Linseed meal is unique among the oilseed residues in that it contains 30–100 g/kg of mucilage.This is almost completely indigestible by non-ruminant animals but canbe broken down by the microbial population of the rumen. It is readily dispersible inwater, forming a viscous slime. Immature linseed contains a small amount of acyanogenetic glycoside, linamarin, and an associated enzyme, linase, which is capa-ble of hydrolysing it with the evolution of hydrogen cyanide; this is extremely toxic.Death results from combination of the cyanide with cytochrome oxidase, leading toan immediate cessation of cellular respiration and anoxia. Low-temperature removalof oil may produce a meal in which unchanged linamarin and linase persist; suchmeals have proven toxic when given as a gruel, since cyanide production begins assoon as the water is added.The meals are safe if given in the dry state, since the pHof the stomach contents of the pig is sufficiently low to inactivate linase. Normal pro-cessing conditions destroy linase, and most of the linamarin and the resultant mealsare quite safe. In ruminant animals the hydrogen cyanide formed by linase action isabsorbed into the blood very slowly and this, coupled with its rapid detoxification inthe liver and excretion via the kidney and lungs, ensures that it never reaches toxic lev-els in the blood. In the UK, linseed cake and meal must, by law, contain less than 350 mg of hydrocyanic acid per kilogram of food with a moisture content of 120 g/kg.
It has been reported that linseed meal has a protective action against seleniumpoisoning.The protein of linseed meal is of poorer quality than those of soya bean orcotton seed meals, having lower methionine and lysine contents. Linseed meal hasonly a moderate calcium content but is rich in phosphorus, part of which is presentas phytate. It is a useful source of thiamin, riboflavin, nicotinamide, pantothenic acidand choline.
Linseed meal has a very good reputation as a food for ruminant animals, which is not easy to justify on the basis of its proximate analysis. Part of the reputation may be the result of the ability of the mucilage to absorb large amounts of water,resulting in an increase in the bulk of the meal; this may increase retention time inthe rumen and give a better opportunity for microbial digestion. The lubricatingcharacter of the mucilage also protects the gut wall against mechanical damage and,together with the bulkiness, regulates excretion and is claimed to prevent constipa-tion without causing looseness. Linseed meal given to fattening animals results infaster gains than other vegetable protein supplements making the same protein con-tribution; cattle attain a very good sleek appearance, though the body fat may besoft.The meal is readily eaten by dairy cows but tends to produce a soft milk fat thatis susceptible to the development of oxidative rancidity. Both of these observationsrelate to residual levels of α-linolenic acid in the meal.

Oilseed cakes and meals
571
Linseed meal is an excellent protein food for pigs as long as it is given with ananimal protein supplement to make good its deficiencies of methionine, lysine andcalcium.This is particularly important with diets containing large amounts of maize.
Linseed meal is not a satisfactory food for inclusion in poultry diets. Retardationof chick growth has been reported on diets containing 50 kg/t of linseed meal anddeaths in turkey poults with 100 kg/t of diet. These adverse effects can be avoided by autoclaving the meal or by increasing the levels of vitamin B6 in the diet; the untreated meal is thought to contain an unidentified antipyridoxine factor. Someworkers consider the adverse effects of the meal to be due to the mucilage, since thiscollects as a gummy mass on the beak, causing necrosis and malformation and reducing the bird’s ability to eat. Pelleting or coarse granulation can overcome thistrouble. If linseed meal has to be included in poultry diets, then the levels should not exceed 30 kg/t.
Rapeseed meal
The 2006 world production of rapeseed was estimated at about 47 million tonnes, upconsiderably from the 11.5 million tonnes produced in 1981. The largest rapeseed-producing country in 2006 was China, at 12 million tonnes, compared with approx-imately 2 million tonnes harvested in the UK. Usage of rapeseed meal in the animalfeed industry in Britain has increased from 0.57 million tonnes in 1996 to 0.77 mil-lion tonnes in 2008. Extraction of the oil by a prepress solvent extraction procedureleaves a residue containing about 400 g protein/kg DM. It contains more fibre (140g/kg DM) than soya bean meal; its metabolisable energy value is lower, about 7.4MJ/kg DM for poultry and 12.0 MJ/kg DM for ruminants, and it has a digestible en-ergy content of 11.8 and 12.3 for pigs and horses, respectively. Both protein contentand digestibility are lower than for soya bean meal, but the balance of essentialamino acids compares favourably, the rapeseed meal having less lysine but more me-thionine. The balance of calcium and phosphorus is satisfactory and it contains ahigher phosphorus content than other oilseed residues.
In the past, the use of rapeseed meals produced from rape (Brassica napus) grownin Europe was restricted, particularly for pigs and poultry, by the presence of glucosi-nolates (thioglucosides) accompanied by a thioglucosidase known as myrosinase.Under a variety of conditions, these may give rise to isothiocyanates, organic thio-cyanates, nitriles and 5-vinyloxazolidine-2-thione (goitrin).They exhibit a variety oftoxic effects manifested as goitres, and liver and kidney poisoning.Their presence isnot serious for ruminant animals, although there is some evidence of reduced intake,minor liver damage and reduced volatile fatty acid production when the toxins havebeen administered orally.With pigs, meals with high glucosinolate levels may reducefood intake, growth and carcass quality. Piglets have shown poor survival rates andenlarged thyroids when maternal diets included high levels of glucosinolates.
Rapeseeds contain erucic acid, which has been known to cause heart lesions inexperimental animals, but it is unlikely to be a problem for farm animals since itpartitions with the oil during extraction.
A certain measure of control of the goitrogenic activity of meals is achieved bymanipulating the pretreatment of the seed before extraction so as to ensure theearliest possible destruction of myrosinase. Such control is only partial, since bac-terial thioglucosidases produced in the gut may hydrolyse residual glucosinolate inthe meal.

Chapter 23 Protein concentrates
572
Glucosinolates are no longer a problem when rapeseed meals are consumed asthe meals are now produced from varieties that have greatly reduced contents ofglucosinolates and erucic acid (often referred to as ‘double-zero varieties’). The po-tential for using low-glucosinolate meals in pig and poultry diets is considerable, butaccount must be taken of the need for amino acid supplementation, especially withlysine, when high levels of inclusion are practised. It must be borne in mind thatantinutritional factors are still present, even if at reduced levels, in the low-glucosinolate meals. This is of particular importance with the early-weaned pig,where reduction in intake may be significant, and with breeding animals, owing tothe possible effects on the foetus. Rapeseed meal is often referred to in North Amer-ica as Canola (a trademarked brand name).This was a variety of rapeseed developedin the early 1970s by Canadian plant breeders to remove the antinutritional compo-nents (erucic acid and glucosinolates) from rapeseed.
Rapeseed meals frequently contain tannins. These are polyphenolic compoundsthat complex with proteins and carbohydrates to form enzyme-resistant substrateswith a consequent lowering of digestibility. This may also result from the combina-tion of the tannins with digestive enzymes, with a consequent loss of activity.Tannins may cause damage to the intestinal mucosa and are known to interfere withiron absorption.
Evidence on permissible levels of inclusion of rapeseed meals in the diet is con-flicting; some acceptable values for different animals are given in Box 23.1.
The highly variable responses to dietary inclusions of rapeseed meals require that,in practice, such figures are applied with caution. Some authorities, for example,consider that rapeseed meals should not be used in starter or sow diets and that lev-els in grower and finisher diets should not exceed 50 kg/t and 100 kg/t, respectively.
Chick growth may be adversely affected if inclusion rates exceed 50 kg/t.The eggsof some hens producing brown-shelled eggs are susceptible to the development offishy taints when rapeseed meals are included in the diet. This is because of theinability of these birds to oxidise trimethylamine produced from the polyphenoliccholine ester sinapine.
For ruminant animals, rapeseed meal may be used as the sole source of dietaryprotein.
In the UK, whole foods must, by law, contain less than 1000 mg 5-vinyloxazolidinethione per kilogram, except those for laying hens, which must contain less than500 mg/kg. Levels of isothiocyanates in whole foods are strictly prescribed, and rape
BOX 23.1 Best estimates of permissible levels of inclusion of rapeseed meal in pig diets (kg/t)
High-glucosinolate rapeseed meal Low-glucosinolate rapeseed meal
UK Canada
Starting pigs (7–15 kg W) 40 50 80Growing pigs (15–45 kg W ) 50 100 120Finishing pigs (>45 kg W ) 80 150 150Gilts 0 100 120Sows 30 120 120

Oilseed cakes and meals
573
cakes and meals must contain less than 4000 mg allylthiocyanate per kilogramreferred to a moisture content of 120 kg/t.
Groundnut meal
The seeds of the groundnut are borne in pods, usually in pairs or threes. The seedscontain 250–300 g/kg of crude protein and 350–600 g/kg of lipid material.The podor husk is largely fibrous. Groundnut meal is now usually made from the kernels,and only occasionally is the whole pod used as the source of an undecorticated meal. The most common method of extraction is screw pressing, giving a meal with50–100 g/kg of oil. Lower oil levels can be achieved only by solvent extraction, butthis has to be preceded by screw pressing to reduce the initially high oil content.Thecomposition of the meal will depend on the raw material and the method of extrac-tion used.
The protein of groundnut meal has suboptimal amounts of cystine and methio-nine, although the first limiting amino acid is lysine.When the meal is used in high-cereal diets, adequate supplementation with animal protein is necessary. This alsoensures that the deficiencies of vitamin B12 and calcium are made good. Such sup-plementation is particularly important for young fast-growing animals such as pigsand poultry. The palatability of the meal for pigs is high, but it should not formmore than 25 per cent of the diet, as it tends to produce a soft body fat and mayhave a troublesome laxative action. This also limits its use for lactating cows, forwhom it otherwise forms an excellent and acceptable protein source. It has beenreported that both a growth factor and an antitrypsin factor occur in groundnutmeal. The latter has antiplasmin activity and so shortens bleeding time; it isdestroyed by heating.
In 1961, reports appeared that implicated certain batches of groundnut meal in the poisoning of turkey poults and ducklings. The toxic factor was shown to be a metabolite of the fungus Aspergillus flavus and was named aflatoxin. This is nowknown to be a mixture of four compounds designated aflatoxins B1, G1, B2 and G2,of which B1 is the most toxic. There are considerable species differences in the sus-ceptibility to these toxins: turkey poults and ducklings are highly susceptible, andcalves and pigs are susceptible, but mice and sheep are classed as resistant. Younganimals are more susceptible than adults of the same species. A common feature inaffected animals is liver damage with marked bile duct proliferation, liver necrosisand, in many cases, hepatic tumours. In fact, aflatoxin has been shown to be a potentliver toxin and a very active carcinogen.
There are several reports of deaths in calves under 6 months of age when fed on contaminated groundnut meal. Older cattle are more resistant, but cases of deathsin store cattle, and loss of appetite and reduced milk yield in cows, have beenreported. Deaths have occurred in 6-month-old steers given 1 mg/kg of aflatoxin B1in their diet for a period of 133 days, and liveweight gains were generally signifi-cantly reduced. Administration of 0.2 mg/kg of aflatoxin B1 in the diets of Ayrshirecalves significantly reduced liveweight gains. Experiments on the inclusion of150–200 kg/t of toxic groundnut in dairy cow diets have shown significant falls inmilk yield.A metabolite of aflatoxin known as aflatoxin M1, which causes liver dam-age in ducklings, has been shown to be present in the milk of cows fed on toxicmeals. The effect of aflatoxin on human beings has not been clearly established.There have been no reports of clinical poisoning in sheep.

Chapter 23 Protein concentrates
574
Aflatoxins are relatively stable to heat, and methods of eliminating them frommeals are elaborate.The best method of control is suitable storage to prevent mouldgrowth, although aflatoxins may be produced in the growing crop. In the UK,prescribed maximum limits for aflatoxins in foods for animals are laid down by law(see Box 23.2).
The stringency of these standards, together with the difficulty of ensuring thatgroundnut products comply with them, has been a major factor contributing to thedecline in the usage of groundnut products in the UK compounding industry, wherethey now occupy a minor position.
Sunflower seed meal
The meal is produced when the oil is removed from the seed by hydraulic pressureor solvent extraction.The hulls are usually partially rather than completely removed,but the resulting high-fibre meals (up to 420 g NDF/kg DM) are readily accepted byolder animals, provided they are finely ground. Removing the hulls from the mealproduces a more digestible product with a higher crude protein content and is oftenreferred to as HiPro sunflower meal.
Solvent-extracted meals contain, on average, about 220 g crude fibre and 430 gcrude protein per kilogram of dry matter and have metabolisable energy contents of 8.1 MJ/kg DM, 10.4 MJ/kg DM and 11.2 MJ/kg DM for poultry, cattle and sheep,respectively. For pigs and horses, a digestible energy content of 10.6 MJ/kg DM and10.1 MJ/kg DM respectively would be appropriate. Expeller meals have higher fat,lower crude fibre and crude protein contents and metabolisable energy values ofabout 13 MJ/kg DM for cattle. Sunflower oil has a high content of polyunsaturatedfatty acids and may cause soft body fat in pigs, particularly when expeller meals aregiven. The oil is very susceptible to oxidation, and the meals have a short shelf lifeowing to the development of rancidity, which renders them unpalatable. The mealsare useful sources of protein, which is low in lysine, the main limiting amino acid,but has about twice as much methionine as soya protein.
BOX 23.2 UK prescribed limits for aflatoxins in foods for animals (mg aflatoxin B1/kgreferred to a moisture content of 120 g/kg)
Straight feeding stuffs 0.05Except groundnut, copra, palm kernel, cotton seed, babasu, maize and
products derived from the processing thereof 0.02Complete feeding stuffs for cattle, sheep and goats (except dairy animals,
calves, lambs and kids) 0.05Complete feeding stuffs for pigs and poultry (except piglets and chicks) 0.02Other complete feeding stuffs 0.01Complementary feeding stuffs for cattle, sheep and goats (except
complementary feeding stuffs for dairy animals, calves and lambs) 0.05Complementary feeding stuffs for pigs and poultry (except young animals) 0.03Other complementary feeding stuffs 0.005

Oilseed residues of minor importance
575
Maximum rates of inclusion in diets are 200 kg/t for adult cattle, 150 kg/t foradult sheep, 25 kg/t for growing pigs, 50 kg/t for finishing pigs and 100 kg/t for sows.They are not recommended for calves, lambs or young pigs. For adult poultry, sun-flower meals may be included at 100 kg/t of the diet, but they are not recommendedfor young birds.
Sesame seed meal
The meals currently available may be produced by hydraulic pressing or solventextraction. The former have the lower protein content (about 400 g/kg DM com-pared with 500 g/kg DM for the solvent-extracted material) but have oil contents ofmore than 100 g/kg DM compared with 20 g/kg DM for the extracted meal andmake a significantly greater contribution to the energy of the diet.
The protein is rich in leucine, arginine and methionine but is relatively low inlysine.The meal therefore needs to be combined with foods rich in lysine when givento pigs and poultry. For ruminants, the protein has a degradability of 0.65–0.75,depending upon the rate of passage through the rumen.
The residual oil of the cake or meal is highly unsaturated and may result in softbody and milk fat if consumed in excessive amounts and may also impart a disagree-able flavour to milk.The oil rapidly becomes rancid and unpalatable, and meals con-taining it have been implicated in cases of vitamin E deficiency.The meal has a highcontent of phytic acid, which makes much of its phosphorus unavailable; rationscontaining the meal may also need extra supplementation with calcium.
The hulls of sesame seeds contain oxalates, and it is essential that meals should becompletely decorticated in order to avoid toxicity.
Meals in good condition are palatable but have a laxative action. The diets ofyoung ruminants should not contain more than 50 kg/t, whereas the maximum in-clusion rate for adults is 100–150 kg/t. The meal should not be given to young pigsor poultry, but it may be included at up to 50 kg/t for adults of these species.
23.2 OILSEED RESIDUES OF MINOR IMPORTANCE
A number of less well-known meals are available in relatively small amounts.These are usually of poor feeding value and low palatability and frequently con-tain toxic material.Their use is thus limited to certain classes of animal at low ratesof inclusion.
Extracted cocoa bean meal
The meals contain varying concentrations of theobromine, an alkaloid that is lethalto chickens and toxic to other monogastric animals and young ruminants.The mate-rials are therefore suitable only for adult ruminants. They have a protein content ofabout 150 g/kg DM, with an apparent digestibility for cattle of about 0.40. Quotedmetabolisable energy values range from 5.3 MJ/kg DM for cattle to 9.0 MJ/kg DMfor sheep. The suggested maximum dietary inclusion rate for adult ruminants is 30 kg/t of the total ration. Owing to the risk of a positive drug test, cocoa productsshould not be given to racing horses.

Chapter 23 Protein concentrates
576
Sheanut meal
There is an increased interest in sheanut meal due to a greater demand for shea fat incosmetics and as a cocoa butter substitute in chocolate.The meals are very variablein their nutritive value, with a mean protein content of about 150 g/kg DM, but thiscan range from 80 g/kg DM to 250 g/kg DM. Their protein digestibility (cattle) isvery low, at about 0.12.The energy value for adult ruminants is usually considered tobe about half that of barley.They contain an alkaloid, saponine, which causes injuryto the digestive mucosa and haemolytic changes in the blood. It is particularly toxicto pigs but can be tolerated by adult ruminants.The meals are bitter to the taste andof low palatability and can contain substantial quantities of tannins and theo-bromine (3,7-dimethylxanthine), a purine derived alkaloid that can be toxic.Sheanut meal may be included at a maximum inclusion rate of 100 kg/t in the totalration of adult beef cattle and 50 kg/t for other adult ruminants.The product shouldcarry a guarantee of saponine content if its use is to be considered. Soaking withwater and fermentation of the meal before feeding has been shown to reduce thenegative effects of some of the antinutritional factors. Even relatively low inclusionrates (25 g/kg) in poultry diets can, however, decrease performance.
23.3 LEGUMINOUS SEEDS
The Leguminosae are a large family of plants, with about 12 000 recognised species.Four tribes within the family are of particular importance, since they include all thecommon peas and beans.The Hedysareae contain the groundnut; the Vicieae includethe genera Vicia, Cicer, Pisum, Lens and Lathyrus; the Genisteae contain the genusLupinus; and the Phaseoleae include the genera Phaseolus, Dolichos and Glycine.
The combined usage of peas and beans by British compounders decreased from174 500 tonnes in 1999 to 118 500 tonnes in 2005 and 68 500 tonnes in 2008, withbeans forming about 60 per cent of the total.
Many leguminous plants are toxic to animals. Consumption of certain specieswithin the genus Lathyrus, such as the Indian pea (L. sativus), may result in the con-dition known as lathyrism. This may take the form of osteolathyrism (caused by thepresence in the seed of β-L-glutamylaminopropionitrile) or neurolathyrism (the formaffecting human beings and of which β-N-oxalyl-L-α,β-diaminopropionic acid isthought to be the causative agent).The former is characterised by bone deformationsand weakness in connective tissue.The latter is characterised by retardation of sexualdevelopment and increasing paralysis, which may prove fatal if the larynx is affected.
Vicia faba (broad bean) may cause the condition in man known as favism.This ischaracterised by haemolytic anaemia, and affected individuals have nausea, short-ness of breath, abdominal pain, fevers and sometimes renal failure. The diseaseoccurs in individuals with a genetic deficiency of glucose-6-phosphate dehydroge-nase in their erythrocytes. It has been suggested that the causative agents aredivicine and isouramil, pyrimidine derivatives present in the seed.
Phaseolus lunatus beans (lima bean, Java bean) contain the cyanogenetic gluco-side phaseolunatin, which is extremely toxic when hydrolysed.The glucoside is present,but only in small quantities, in cultivated varieties of P. lunatus such as the butterbean. A number of species, including Cicer ensiformis, Dolichus biflorus, D. lablab,P. lunatus, P. vulgaris and P. communis, are known to contain lectins, which are toxic

Leguminous seeds
577
upon oral ingestion. Unfamiliar leguminous seeds should be treated with cautionuntil they have been proved to be safe.
Beans
Beans belong mainly to the Vicieae and Phaseoleae and are used as food for humanbeings and animals all over the world.The chief member of the Vicieae is Vicia faba,known as the broad bean, horse bean, tick bean and field bean.The most numerousgenus in the Phaseoleae is Phaseolus, and the best-known species is P. vulgaris, witha number of varieties known as French, dwarf and navy beans. There are a largenumber of other Phaseolus species that are locally important as sources of food,such as butter beans (P. lunatus) and runner beans (P. coccineus), as are several othergenera, such as Vigna, Dolichus and Canavalia. Nutritionally, the species are verysimilar, being good sources of protein with a high lysine content; they are goodsources of energy and phosphorus but have low contents of calcium. Beans havelittle or no carotene or vitamin C, but they may contain significant amounts ofthiamin, nicotinamide and riboflavin.
There are a large number of varieties of field bean, which fall into two classes:winter and spring.The winter varieties outyield the spring varieties, the yield levelsin the UK being about 3.8 and 3.4 tonnes/hectare, respectively. Spring varieties usu-ally have a higher protein content than winter varieties, about 270 g/kg DM com-pared with 230 g/kg DM, and a lower fibre content, about 69 g/kg DM comparedwith 78 g/kg DM. These fibre levels are higher than in the common cereals, exceptfor oats. The ether extract concentration in both winter and spring beans is low,about 13 g/kg DM, but it has a high proportion of linoleic and α-linolenic acids.Themineral composition of beans is similar to that of the cereals and the oilseedresidues, with high phosphorus and low calcium concentrations. They contain littleor no sodium or chlorine and are poor sources of manganese.
Beans are regarded primarily as sources of protein of relatively good quality.Thisis a reflection of the amino acid composition characterised by a high lysine contentsimilar to that of fishmeal protein; levels of cystine and methionine are lower than incommon animal and vegetable proteins.
As well as being a good source of protein, beans make a significant contributionto the energy economy of the animal, having a metabolisable energy content of 13.5 MJ/kg DM for ruminants and 12.0 MJ/kg DM for poultry and a digestible energycontent of 13.3 MJ/kg DM for pigs.
Beans are used in the diets of all the major classes of farm animal. Levels in thediets of calves up to 3 months of age are usually of the order of 150 kg/t but can beincreased considerably thereafter. Mixtures containing 400 kg/t have been usedquite satisfactorily for intensively fed steers. The beans are usually cracked, kibbledor coarsely ground for feeding, but it would appear that whole beans are quite satis-factory for older ruminants, which rapidly adapt to chewing them. Dairy cow con-centrates may contain 150–200 kg/t of beans, and recent work has shown that levelsof up to 350 kg/t may be used with no loss of milk yield.
For pigs, beans are usually ground to pass a 3 mm screen and are used in sow,weaner and fattening diets; it is not usual to include them in creep feeds.Although thereis no objective evidence in its support, the view is widely held that newly harvestedbeans should be allowed to mature for several weeks before being given to pigs. Theusual rate of inclusion of beans is 50–150 kg/t and should not exceed 200 kg/t.

Chapter 23 Protein concentrates
578
Cystine and methionine are important in the diets of poultry owing to the de-mands of feathering, and beans may be expected to be of limited value for poultry.Traditionally, they have been little used in poultry diets, but evidence indicates thatfield beans can be used to replace soya bean meal as long as adequate methioninesupplementation is practised.
Many species of beans, including the field bean, have been shown to containantitryptic factors. In beans grown in the UK, the latter have not been shown to haveany significant effect on performance.
Peas
The peas grown as a source of protein for animals in the UK (Pisum sativum) belongto the Vicieae. Other species, such as the chick pea (Cicer arietinum) in India, are im-portant locally. Peas are basically similar to beans but have lower contents of crudeprotein (260 g/kg DM) and crude fibre (<60 g/kg DM). The oil content is slightlyhigher than that of beans, but the degree of saturation is similar. Like beans, peas areregarded primarily as a source of protein. That of peas has the better balance ofamino acids, having higher contents of lysine, methionine and cystine. However,methionine is still the main limiting amino acid. Peas make a significant contributionto the energy intake of the animal, having a metabolisable energy content of 13.4 MJ/kg DM for ruminants and 12.7 MJ/kg DM for poultry, and a digestibleenergy content of 15.0 MJ/kg DM for pigs.
The maximum rate of inclusion of peas in ruminant diets may be as high as 400 kg/t,but problems of mixing and cubing limit their inclusion in pelleted foods to a maximumof 200 kg/t.They are particularly useful in that they are able to replace soya bean mealin pig and poultry diets, whereas beans are largely confined to ruminant diets.
Lupin seed meal
Lupin seed meal is made by grinding the whole seeds. It is a useful European-grownsource of protein.There are three species of lupin, distinguished by the colour of theflowers.Those of Lupinus albus are white, those of L. angustifolius blue and those ofL. luteus yellow.Within species, there are sweet and bitter varieties. The latter con-tain 10–20 g/kg of toxic alkaloids such as lupinin and angustifolin and should not begiven to animals; even sweet varieties may contain low levels of alkaloids. For safety,the alkaloid content must be less than 0.6 g/kg.
The seed coat is fibrous, and its inclusion in the meal adversely affects its di-gestibility, especially for young monogastric animals.White varieties have the lowestfibre and highest oil and protein contents, and meals made from them are more valu-able for pigs and poultry than are the blue and yellow varieties. A typical meal willhave a metabolisable energy content of 11.5 MJ/kg DM for poultry and 13.2 MJ/kg DMfor ruminants, and a digestible energy content for pigs of 17.3 MJ/kg DM.The aminoacid pattern is not well balanced, and diets containing significant quantities of themeal may require supplementation with methionine, which is the first limiting amino acid.
Maximum levels of inclusion are 150 kg/t for ruminant diets, 100 kg/t for adultpoultry and pigs, and 50 kg/t for growing pigs and broilers.
Because of rapid oxidation of the oil, the meal has to be used immediately or anantioxidant must be incorporated.

Animal protein concentrates
579
ANIMAL PROTEIN CONCENTRATES
These materials are given to animals in much smaller amounts than the foods so fardiscussed, because they are not used primarily as sources of protein per se but areused to make good deficiencies of certain essential amino acids from which non-ru-minants may suffer when they are fed on all-vegetable-protein diets. In addition,they often make a significant contribution to the animal’s mineral nutrition and sup-ply various vitamins of the B complex. A further reason why these products aregiven in limited quantities to farm animals is that they are expensive, which makestheir large-scale use uneconomic.Total usage of animal substances in the compoundindustry in the UK in 1992 was 409 000 tonnes, but this had fallen to 177 700 tonnesin 1999 and 117 800 tonnes in 2008. In 1992, over half was meat and bone meal,the rest being fishmeal with minor contributions from other sources such as bloodmeal and feather meal.
Production of animal protein foods in the UK is controlled by the Processed Ani-mal Protein Order 1989.This states that producers must be registered and lays downprocedures for the sampling and testing of foods for Salmonella bacteria. Samplesmust be taken on each day that a consignment leaves the premises, and then submit-ted for testing. When food produced on the premises is incorporated in a feedingstuff for livestock or poultry kept on those premises, then on each day immediatelybefore any supplies of any such processed animal protein are incorporated in suchfeeding stuff, a sample must be taken and submitted for testing.The Order also laysdown procedures in the event of a sample failing a test.
Although Salmonella infection from meat and bone meal continues to be a mat-ter of concern, the greater concern at the time of writing is that of infection ofanimal (and human) consumers with forms of spongiform encephalopathy. Undercurrent UK legislation (the Bovine Spongiform Encephalopathy (No. 2) Order 1996(SI 1996 No. 3163)), mammalian meat and bone meal cannot be given to ruminantor non-ruminant animals; mammalian protein other than meat and bone meal maybe given to non-ruminant animals but not to ruminant animals.
A European Council decision of 4 December 2000, which remains in force butunder review, defined ‘processed animal proteins’ as meat and bone meal, meatmeal, bone meal, blood meal, dried plasma and other blood products, hydrolysedproteins, hoof meal, horn meal, poultry offal meal, dry greaves, fishmeal, dicalciumphosphate and gelatin. It directs that member states shall prohibit the use ofprocessed animal proteins as food for farmed animals that are kept, fattened or bredfor the production of food for human beings. Fishmeal may be given to non-ruminants,and the prohibition does not apply to milk and milk products.
Meat by-products
Although animal foods based on mammalian meat are prohibited from being used asfood for farmed animals in the UK and Europe, there are areas where this may beallowed. For this reason, we have decided to include a few general comments on thenutritive value of such products. It may also be that, at some future date, current pro-hibitions on their use in Europe may be lifted.
The protein of meat by-products is of good quality (BV approximately 0.67 foradult man) and is particularly useful as a lysine supplement. Unfortunately, it is apoor source of methionine and tryptophan. Various unidentified beneficial factors
23.4

Chapter 23 Protein concentrates
580
have been claimed to be present in meat meals, among them the enteric growthfactor from the intestinal tract of swine, the Ackerman factor and a growth factorlocated in the ash.
Meat products are more valuable for simple-stomached than for ruminant animalssince the latter have less need of a dietary supply of high-quality protein. The lowmethionine and tryptophan levels of the meals reduce their value, since they cannotadequately make good the deficiencies of these amino acids in the high-cereal dietsof pigs and poultry. This is especially so when high proportions of maize are given,maize being particularly low in tryptophan. Usually meat meal is given in conjunc-tion with another animal or vegetable protein to complement its low content of me-thionine and tryptophan. Both meat meal and meat and bone meal are eaten readilyby pigs and poultry and may be given at levels of up to 150 kg/t of the diet for lay-ing hens and young pigs; for fattening pigs, the level is usually kept below 100 kg/t.As well as being less beneficial for ruminants than for simple-stomached animals,these products are not readily accepted by ruminants and must be introduced intotheir diets gradually. Considerable care is required in storing meat products toprevent the development of rancidity and loss of vitamin potency.
Fishmeal
The use of fishmeal by the British animal feed industry decreased from 193 000 tonnesin 1996 to 118 000 tonnes in 2008. Fishmeal is produced by cooking fish and thenpressing the cooked mass to remove most of the oil and water.The aqueous liquor isconcentrated and added to the pressed mass and the whole dried. In the UK, fish-meal is legally defined as ‘the product obtained by processing whole or parts of fishfrom which part of the oil may have been removed and to which fish solubles mayhave been re-added’. Fish solubles are ‘the product obtained during the manufactureof fishmeal which has been separated and stabilized by acidification or drying’(Feeding Stuffs Regulations 2005). About 90 per cent of the raw material used infishmeal production consists of oily species such as anchovies, capelin and men-haden, the remaining 10 per cent consisting of fish (plus some of the offal) of speciessuch as haddock and cod.
Nutritionally, the drying process is very important, since overdrying may signifi-cantly reduce the quality of the product. There are two main types of dryer: directand indirect. In the former, hot air (at about 500°C) is passed over the material as itis tumbled in a cylindrical drum. The temperature of the material should remain inthe range 80–95 °C, but it may be much higher if the process is not carefully con-trolled. In the indirect method, the dryers are steam-jacketed cylinders or cylinderscontaining steam-heated discs, which again tumble the material during drying. Thelatter process is slower but controlled more easily. The dried product is ground sothat less than 10 per cent passes a 1 mm screen and more than 90 per cent passes a10 mm screen.
In well-produced meals the protein has a digestibility of between 0.93 and 0.95,but meals that are heated too strongly in processing may have values as low as 0.60.The quality of protein in fishmeal is high though variable, as indicated by values of0.36 and 0.82 quoted as the biological value for rats. Processing conditions, particu-larly the degree and length of time of heating, are probably the major determinantsof protein quality, as shown by the figures for available lysine quoted in Table 23.4.

Animal protein concentrates
581
Values of 0.58 for r � 0.02, 0.44 for r � 0.05 and 0.38 for r � 0.08 (r � passagerate from the rumen; see p. 325) have been quoted for the rumen degradability offishmeal protein, and it is pre-eminent as a source of undegradable protein for rumi-nant animals, although EU legislation currently bans its use.
The protein contents of various fishmeals vary over a range of about 500–750 g/kg,but the composition of the protein is relatively constant. It is rich in the essentialamino acids, particularly lysine, cystine, methionine and tryptophan, and is a valu-able supplement to cereal-based diets, particularly where they contain much maize.The essential amino acid composition is compared with that of ideal protein (seeTable 13.7 in Chapter 13) in Box 23.3.
Fishmeals have a high mineral content (100–220 g/kg), which is of value nutri-tionally since it contains a high proportion of calcium and phosphorus and a numberof desirable trace minerals, including manganese, iron and iodine. They are a goodsource of B complex vitamins, particularly choline, B12 and riboflavin, and have en-hanced nutritional value because of their content of growth factors known collec-tively as the animal protein factor (APF).
Fishmeals contain high levels of polyunsaturated fatty acids, and the ratio of omega-3 to the more abundant omega-6 acids is particularly desirable; they also
Table 23.4 Effect of various heat treatments on the availablelysine contents of fishmeals
Treatment Available lysine (g/kg CP)
Freeze dried 86Oven dried
105 °C for 6 hours 83170 °C for 6 hours 69
BOX 23.3 Ratio of the essential amino acids to lysine in fishmeal protein and idealprotein for growing pigs
Amino acid Fishmeal Ideal protein
Lysine 1.0 1.0Methionine + cystine 0.45 0.59Trytophan 0.14 0.19Threonine 0.57 0.65Leucine 1.01 1.00Isoleucine 0.62 0.58Valine 0.73 0.70Histidine 0.29 0.34Phenylalanine � tyrosine 1.04 1.00

Chapter 23 Protein concentrates
582
contain significant amouts of eicosapentaenoic and docosohexenoic acids (see Chapter 3). Increased levels of these substances are advantageous to human beingsconsuming them.
The energy of fishmeals is present entirely in the form of fat and protein and islargely a reflection of the oil content. In the past, the energy value for animals hasbeen underestimated, particularly in the case of ruminants, for which average valuesin the region of 14 MJ/kg of metabolisable energy are now accepted as realistic.
A wide variety of fishmeals are available, depending upon the country of origin,the raw material and the process used. For convenience, the meals currently avail-able in the UK may be grouped into:
■ South American fishmeals;■ herring-type fishmeals;■ UK-produced meal, which may contain a proportion of offal.
Typical figures for composition and nutritive value are given in Table 23.5.The current trend in the marketing of fishmeals is towards specialised products
tailored to suit particular species.Thus, special low-temperature meals are producedfor aquaculture and for early-weaned pigs, and ruminant-grade products havestrictly controlled levels of soluble nitrogen.
Fishmeals find their greatest use with simple-stomached animals. They are usedmostly in diets for young animals, whose demand for protein and the indispensableamino acids is particularly high and for whom the growth-promoting effects of APFare valuable. Such diets may include up to 150 kg/t of fishmeal.With older animals,which need less protein, the level of fishmeal in the diet is brought down to about50 kg/t, and it may be eliminated entirely from diets for those animals in the laststages of fattening. This is partly for economic reasons, since the protein needs ofsuch animals are small, and partly to remove any possibility of a fishy taint in thefinished carcass.This possibility must also be considered carefully with animals pro-ducing milk and eggs, which are vulnerable to taint development. Fully ruminantanimals are able to obtain amino acids and B vitamins by microbial synthesis, andthe importance of fishmeal for such animals is as a source of undegradable protein.This is of particular importance for actively growing and pregnant animals. Rates ofinclusion in the diet are usually about 50 kg/t. For lactating cows, the daily intake offishmeal should be limited to not more than 1 kg.Above this, the intake of oil couldexceed 100 g/day, which would have detrimental effects on fermentation in therumen.
Table 23.5 Composition and nutritive value of some typical fishmeals
Herring South American UK-produced
Crude protein (g/kg) 730 660 640Oil (g/kg) 70 60 65Calcium (g/kg) 20 45 80Phosphorus (g/kg) 15 30 50ME (MJ/kg DM)
Ruminant 17.8 14.6 14.6Poultry 14.9 13.9 13.4
DE (MJ/kg DM, pigs) 19.6 19.0 17.0

Animal protein concentrates
583
The nitrite content of fishmeals sold in the UK is strictly controlled by legislation. Itmay not be more than 60 mg/kg of food referred to a moisture content of 120 mg/kgand stated as sodium nitrite.This is equivalent to 14 mg nitrite nitrogen/kg DM.
Blood meal
In the UK, blood meal is defined as ‘the product obtained by drying the blood ofslaughtered warm-blooded animals.The product must be substantially free of foreignmatter’ (Feeding Stuffs Regulations 2005).
It is manufactured by passing live steam through blood until the temperaturereaches 100 °C. This ensures efficient sterilisation and causes the blood to clot. It isthen drained, pressed to express occluded serum, dried by steam heating andground.
Blood meal is a chocolate-coloured powder with a characteristic smell. It containsabout 800 g/kg of protein, small amounts of ash and oil, and about 100 g/kg ofwater. It is important nutritionally only as a source of protein. Blood meal is one ofthe richest sources of lysine and a rich source of arginine, methionine, cystine andleucine, but it is deficient in isoleucine and contains less glycine than fish, meat, ormeat and bone meals. Owing to the poor balance of amino acids, its biological valueis low; in addition, it has a low digestibility. It has the advantage, in certain situa-tions, that its protein has a very low rumen degradability (about 0.20).
The meal is unpalatable and its use has reduced growth rates in poultry so that itis not recommended for young stock. For older birds, rates of inclusion are limited toabout 10–20 kg/t of the diet. It should not be included in creep foods for pigs. Nor-mal levels of inclusion for older animals are of the order of 50 kg/t of diet, and it isusually used along with a high-quality protein source. At levels over 100 kg/t of the diet, it tends to cause scouring and is best regarded as a food for boosting dietarylysine levels.
Hydrolysed feather meal
The Feeding Stuffs Regulations 2005 define this material as the ‘product obtained byhydrolysing, drying and grinding poultry feathers’.
The meal is produced by steam cooking under pressures of 2.8–3.55 kg/cm2 for30–45 minutes, when temperatures of 140–150 °C are achieved.
Feather meal has a high protein content, typically about 850 g/kg, with individualsamples varying from 610 g/kg to 930 g/kg. Histidine and lysine are joint first limitingamino acids, with methionine being third limiting. Ileal digestibility is of the order of 0.5, with digestibility values for individual amino acids varying from 0.20 to 0.70.There is some evidence that protein digestibility may be improved if processing is car-ried out at higher pressures for a shorter time.Typically, the meal has a digestible energyvalue for pigs of 12.6 MJ/kg DM and metabolisable energy values of 13.7 MJ/kg DM,12.5 MJ/kg DM and 13.6 MJ/kg DM for poultry, cattle and sheep, respectively.Varia-tions in processing conditions may have a marked effect on nutritive value.
The meal is of low palatability and must be introduced into the diet gradually.Dietary rates of inclusion are generally low, being of the order of 25–30 kg/t of thetotal ration for adult ruminants, 25 kg/t for layers, broilers and turkeys, and 10 kg/tfor calves, lambs, sows, and growing and finishing pigs. The meal is not used forweaner and creep-fed pigs or chicks.

Chapter 23 Protein concentrates
584
MILK PRODUCTS
Whole milk
Whole milk from cows contains about 875 g/kg of water and 125 g/kg of dry matter,usually referred to as the total solids. Of this, about 37.5 g/kg is fat. The remainder,termed the solids-not-fat (SNF), consists of protein (33 g/kg), lactose (47 g/kg) andash (7.5 g/kg). Most of the fat consists of neutral triacylglycerols having a character-istically high proportion of fatty acids of low molecular weight and providing anexcellent source of energy. It has about 2.25 times the energy value of the milk sugaror lactose.The crude protein fraction of milk is complex, about 5 per cent of the ni-trogen being non-protein. Casein, the chief milk protein, contains about 78 per centof the total nitrogen and is of excellent quality, but it is marred by a slight deficiencyof the sulphur-containing amino acids, cystine and methionine. Fortunately,β-lactoglobulin is rich in these acids and so the combined milk proteins have a bio-logical value of about 0.85.The most economical use of the protein is in supplement-ing poor-quality proteins such as those of the cereals, for which purpose it is betterthan either the meat or fish products.When milk products are used to replace fish-meal or meat and bone meal, the diet must be supplemented with inorganic ele-ments, particularly calcium and phosphorus, since the ash content of milk is low.Milk has a low magnesium content and is seriously deficient in iron. Normally milkis a good source of vitamin A but a poor one of vitamins D and E. It is a good sourceof thiamin and riboflavin and contains small amounts of vitamin B12.
Whole milk is consumed by suckled calves, lambs, young dairy and bull calves,and animals being prepared for competition. Two milk by-products are widely usedand are valuable foods for farm animals.
Skim milk
This is the residue after the cream has been separated from milk by centrifugal force.The fat content is very low, below 10 g/kg, and the gross energy is much reduced,about 1.5 MJ/kg as compared with 3.1 MJ/kg for whole milk. Removal of the fat inthe cream also means that skim milk is a poor source of the fat-soluble vitamins, butit does result in a concentration of the SNF constituents. Skim milk finds its main useas a protein supplement in the diets of simple-stomached animals and is rarely usedfor ruminant animals; it is particularly effective in making good the amino aciddeficiencies of the largely cereal diets of young pigs and poultry. It is usually given topigs in the liquid state and is limited to a per capita consumption of 2.8–3.4 l(3.0–3.6 kg) per day.When the price is suitable, it may be given ad libitum, and up to23 l (24 kg) per pig per day may be consumed along with about 1 kg of meal. Scour-ing may occur at these levels but can be avoided with reasonable care. Liquid skimmilk must always be given in the same state, either fresh or sour, if digestive upsetsare to be avoided. It may be preserved by adding 1.5 l of formalin to 1000 l of skimmilk. For feeding poultry, skim milk is normally used as a powder and may form up
23.5
There is a risk of contamination of the base material with Salmonella, and it isimportant that strict control of processing conditions should be maintained in orderto minimise the risk of this in the finished product.

Single-cell protein
585
to 150 kg/t of the diet. It contains about 350 g/kg of protein, the quality of whichvaries according to the manufacturing process used: roller-dried skim milk is sub-jected to a higher drying temperature than the spray-dried product and has a lowerdigestibility and biological value (Table 23.6). For poultry, skim milk has the disad-vantage of having a low cystine content.
Whey
When milk is treated with rennet in the process of cheese making, casein is precipi-tated and carries down with it most of the fat and about half the calcium and phos-phorus.The remaining serum is known as whey, which, as a result of the partitioningof the milk constituents in the rennet coagulation, is a poorer source of energy (1.1 MJ/kg), fat-soluble vitamins, calcium and phosphorus. Sweet whey (pH > 5.6) isproduced from rennet-coagulated cheese production, whereas acid whey (pH < 5.1)is produced from the manufacture of cottage cheese. Quantitatively, whey is a poorersource of protein than milk, but most of the protein is β-lactoglobulin and is of verygood quality.Whey is usually given ad libitum in the liquid state to pigs. Dried skimmilk and whey find their main use as constituents of proprietary milk replacers foryoung calves. Unlike those of skim milk, whey proteins do not clot in the stomachand may give rise to digestive problems at high rates of inclusion. The major carbo-hydrate present in whey is lactose, which has been shown to be antiprotozoal and increase microbial protein synthesis within the rumen. Lactose has also beendemonstrated to have a stabilising effect on ruminal pH when included at rates of 50 g/kg DM, which is independent of its effect on protozoal numbers.
Table 23.6 Effect of processing on the nutritive value of skim milk
Digestibility Biological value Available lysine
of protein of protein (g/kg CP)
Spray-dried 0.96 0.89 81Roller-dried 0.92 0.82 59
23.6 SINGLE-CELL PROTEIN
Protein for feeding animals has been produced by microbial fermentation. Single-cell organisms such as yeasts and bacteria grow very quickly and can double theircell mass, even in large-scale industrial fermenters, in 3–4 hours.A range of nutrientsubstrates can be used, including cereal grains, sugar beet, sugarcane and its by-products, hydrolysates from wood and plants, and waste products from food manu-facture. Bacteria such as Pseudomonas spp. can be grown on more unconventionalmaterials such as methanol, ethanol, alkanes, alkanals and organic acids.The figuresin Table 23.7 show that the material obtained by culturing different organisms variesconsiderably in composition.
The protein content of bacteria is higher than that of yeasts and contains higherconcentrations of the sulphur-containing amino acids but a lower concentration oflysine. Single-cell protein (SCP) contains unusually high levels of nucleic acids, rang-ing from 50 g/kg DM to 120 g/kg DM in yeasts and from 80 g/kg DM to 160 g/kg DM

Chapter 23 Protein concentrates
586
in bacteria. Some of the purine and pyrimidine bases in these acids can be used fornucleic acid biosynthesis. Large amounts of uric acid or allantoin, the end productsof nucleic acid catabolism, are excreted in the urine of animals consuming SCP.Theoil content of yeasts and bacteria varies from 25 g/kg DM to 236 g/kg DM, and theoils themselves are rich in unsaturated fatty acids. Although SCP does contain acrude fibre fraction, which can be quite high in some yeasts, it is not composed ofcellulose, hemicelluloses and lignin as in foods of plant origin; the fibre consistschiefly of glucans, mannans and chitin.
Studies with pigs have yielded digestibility coefficients for energy varying from0.70 to 0.90 for yeasts grown on whey and n-paraffins, respectively, and a value of0.80 was obtained for a bacterium grown on methanol.The inclusion of up to 150 kg/tof SCP in pig diets has given levels of animal production comparable with thoseobtained with diets containing soya bean meal or fishmeal. Similarly encouragingresults have been obtained with calves, although it is usually recommended that themaximum level of inclusion of alkane yeasts in calf milk substitutes should be 80 kg/t.
In the case of poultry, dietary SCP concentrations of 20–50 kg/t have provedoptimal for broilers, and 100 kg/t has been suggested for diets for laying hens.
Table 23.7 Chemical composition of single-cell protein (SCP) grown on different substrates (g/kg DM)
Substrates Microorganism DM (g/kg) Organic Crude Crude Crude Ash
used matter protein fat fibre
Gas oil Candida lipolytica 916 914 678 25 44 86Gas oil Candida lipolytica 903 917 494 132 41 84n-Paraffin Candida lipolytica 932 934 644 92 47 66n-Paraffin Candida lipolytica 914 933 480 236 47 67n-Alkanes Pichia guillerm 971 941 501 122 76 59Whey (lactic acid) Candida pseudotropicalis 900 900 640 56 50 100Methanol Candida boidinii 938 939 388 77 107 61Methanol Pseudomonas methylica 967 903 819 79 5 97Sulphite liquor Candida utilis 917 925 553 79 13 75Molasses Saccharomyces cerevisiae 908 932 515 63 18 68Extract of malt Saccharomyces carlsbergensis 899 926 458 31 11 74
After Schulz E and Oslage H J 1976 Animal Feed Science and Technology 1: 9.
23.7 SYNTHETIC AMINO ACIDS
Meeting the requirements of non-ruminants for a balanced supply of essentialamino acids requires the use of expensive protein sources, such as fishmeal, or highlevels of less well-balanced protein sources such as soya bean meal (see Chapter 13).Economics dictate that the latter option is usually taken, and, in order to meet therequirements for the limiting amino acid, an excess of total protein has to be sup-plied. This is deaminated and the nitrogen is excreted; both processes requireenergy, and such protein oversupply is wasteful in terms of both protein and energymetabolism. In addition, the excreted nitrogen may be a source of pollution in theenvironment.

Non-protein nitrogen compounds as protein sources
587
An alternative to the use of high dietary levels of unbalanced proteins is to usethem at lower levels, but in combination with supplements of free amino acids.Thisreduces the total amount of protein given and, since the amino acid balance is moreappropriate, the efficiency of energy and protein use is improved and less nitrogen iswasted. Amino acids can be produced industrially by chemical and microbialprocesses and are readily available.
Pig and poultry diets based on cereals and vegetable protein sources are nowroutinely supplemented with L-lysine hydrochloride (supplying 780 g lysine/kg), DL-methionine and L-threonine. A diet for a finishing pig, which has to contain 10 glysine/kg, required a combination of 750 g barley and 250 g soya bean meal/kg, andthis mix has a crude protein content of 185 g/kg (see Appendix 2, Table A.2.2.2).With the inclusion of 2 g of lysine hydrochloride, the same lysine content can beachieved with a mix of 808 g barley and 190 g soya bean meal, and the protein con-tent is reduced to 165 g/kg. Such reductions in crude protein content have main-tained a balanced supply of amino acids and resulted in improved rates of liveweightgain and food conversion efficiency. It is important that the supplementary acids arenot used excessively to satisfy the animal’s requirements, since this may bring aboutan undersupply of other essential amino acids.
In high-producing ruminant animals such as dairy cows, the first limiting aminoacid is generally methionine, followed by lysine, particularly if the diet is high inmaize silage or grain.To increase tissue methionine or lysine supply in ruminants re-quires the supplement to be protected against microbial activity in the rumen butsubsequently be available for absorption in the small intestine. Protection is gener-ally in the form of surface coating with a fatty acid, pH-sensitive polymer, mineralmixture, or chemically modified molecules such as D,L-2-hydroxy-4-(methylthio)-butanoic acid. The surface coating of amino acids causes problems when pelleting.The bioavailability (i.e. the proportion absorbed to that fed) of protected methionineproducts is in the range 500–810 g/kg. The response to feeding protected aminoacids on milk production in dairy cows is variable and dependent on factors includ-ing the basal ration and animal production level.
23.8 NON-PROTEIN NITROGEN COMPOUNDS AS PROTEIN SOURCES
Non-protein nitrogen compounds are recognised as useful sources of nitrogen forruminant animals, and simple nitrogenous compounds such as ammonium salts oforganic acids can be utilised to a very limited extent by pigs and poultry. Commer-cially, non-protein nitrogen compounds are important for ruminants only. Their usedepends upon the ability of the rumen microorganisms to use them in the synthesis oftheir own cellular tissues (see Chapter 8), and they are thus able to satisfy the microbialportion of the animal’s demand for nitrogen and, by way of the microbial protein, atleast part of its nitrogen demand at tissue level.The compounds investigated includeurea, ammonium salts of organic acids, inorganic ammonium salts and various amidesas well as thiourea, hydrazine and biuret. Studies in vitro have shown that ammo-nium acetate, ammonium succinate, acetamide and diammonium phosphate are bet-ter substrates for microbial protein synthesis than urea, but from considerations ofprice, convenience, palatability and toxicity, urea has been the most widely used andinvestigated non-protein nitrogen compound in foods for farm animals.

Chapter 23 Protein concentrates
588
Urea
Urea is a white, crystalline, deliquescent solid with the following formula:
Pure urea has a nitrogen content of 466 g/kg, which is equivalent to a crude proteincontent of 466 � 6.25 � 2913 g/kg. Feed urea contains an inert conditioner to keepit flowing freely, and this reduces its nitrogen content to 464 g/kg, equivalent to2900 g/kg crude protein. Urea is hydrolysed by the urease activity of the rumenmicroorganisms with the production of ammonia:
The ease and speed with which this reaction occurs when urea enters the rumengives rise to two major problems owing to excessive absorption of ammonia from therumen.Thus, wastage of nitrogen may occur, and there may be a danger of ammoniatoxicity. This is characterised by muscular twitching, ataxia, excessive salivation,tetany, bloat and respiration defects (both rapid, shallow and slow, deep breathinghave been reported). Dietary levels of urea vary in their effects and it is not possibleto give accurate safety limits for any particular animal.Thus, sheep receiving as littleas 8.5 g per day have died, whereas others have consumed up to 100 g per daywithout ill effects. Toxic symptoms appear when the ammonia level of peripheralblood exceeds 500 µmol/l, and the lethal level is about 1500 µmol/l. Such levels areusually associated with ruminal ammonia concentrations of about 800 mg/l, the ac-tual level depending upon pH.Ammonia, which is the actual toxic agent in urea poi-soning, is most toxic at high ruminal pH owing to the increased permeability of therumen wall to un-ionised ammonia compared with the ammonium ion, which pre-dominates at low pH.
Urea should be given in such a way as to slow down its rate of breakdown andencourage ammonia utilisation for protein synthesis. It is most effective when givenas a supplement to diets of low protein content, particularly if the protein is resistantto microbial breakdown. The diet should also contain a source of readily availableenergy so that microbial protein synthesis is enhanced and wastage reduced. At thesame time, the entry of readily available carbohydrate into the rumen will bringabout a rapid fall in rumen pH and so reduce the likelihood of toxicity. Many of thedifficulties encountered with urea would be avoided if the amount and size of mealswere restricted. To avoid the danger of toxicity, not more than one-third of thedietary nitrogen should be provided as urea and, where possible, this should be inthe form of frequent and small intakes.
Urea, like other non-protein nitrogen sources, will not be used efficiently by theruminant animal unless the diet does not contain sufficient degradable protein tosatisfy the needs of its rumen microorganisms.
NH2
C:O
NH2
NH2
C:O H2O
NH2
2NH3 CO2+ +

Non-protein nitrogen compounds as protein sources
589
Although urea provides an acceptable protein source, there is evidence thatwhere it forms a major part of dietary nitrogen, deficiencies of the sulphur-containing amino acids may occur. In such cases, supplementation of the diet with asulphur source may be necessary. An allowance of 0.13 g of anhydrous sodium sul-phate per gram of urea is generally considered to be optimal. Urea does not provideenergy, minerals or vitamins for the animal, and when it is used to replace conven-tional protein sources care must be taken to ensure that satisfactory dietary levels ofthese nutrients are maintained by adequate supplementation.
Urea is available in proprietary foods in several forms. It may be included in solidblocks that provide vitamin and mineral supplementation and contain a readilyavailable source of energy, usually starch. Animals are allowed free access to theblocks, intake being restricted by the blocks having to be licked and by their highsalt content.There is some danger of excessive urea intakes if the block should crum-ble or if there should be a readily available source of water that allows the animal tocope with the high salt intakes. Solutions of urea containing molasses as the energysource and carrying a variable amount of mineral and vitamin supplementation are also in use. Like the blocks, they contain 50–60 g urea and about 250 g sugar per kilogram and are supplied in special feeders in which the animal licks a ballfloating in the solution.
Several proprietary concentrate foods contain urea at levels in the range of10–30 g/kg. Protein supplements for balancing cereals usually contain about100 g/kg urea but there are some highly concentrated products with as much as500 g/kg.When urea is included in the concentrate diet, thorough mixing is essentialto prevent localised concentrations, which may have toxic effects. Urea is sometimesadded to the roughage or concentrate portion of the ration as a solution containingabout 350 g urea and 100 g molasses per kilogram.
Urea may be used for all classes of ruminants but is less effective in animals inwhich the rumen is not fully functional. Low-intensity, ranch-like conditions, inwhich animals are fed on diets containing poor-quality protein in low concentra-tion, are very suitable for the use of block or liquid foods. Under such conditions,raising the nitrogen content of the diet may increase the digestibility and intakeof the roughage owing to stimulation of microbial activity. Beef cattle and sheepconsuming small amounts of concentrates are able to utilise urea efficiently, as areanimals receiving large quantities of concentrate ad libitum, resulting in small andfrequent intakes of food. Low-yielding dairy cows use urea-containing concen-trates efficiently owing to their low concentrate intakes; cows of moderate andhigh yield receiving large meals of concentrates at milking do not. There is muchevidence for reduced performance by such animals given diets containing urea.
When straws and other low-quality roughages are treated with ammonia (see p. 529), about 0.3–0.5 of the ammonia is retained by the roughage and may beutilised by the rumen microorganisms in the same way as ammonia derived fromurea. Similarly, urea treatment of whole crop cereals can be used to produce an alka-line preserved forage with a pH of approximately pH 8.0, and increase the crudeprotein content by 40–80 g/kg DM.
Slower-release urea-based sources
Means to reduce the rate of nitrogen release from urea in the rumen (and subse-quent post-feeding peak in rumen and plasma ammonia concentrations) have been

Chapter 23 Protein concentrates
590
developed, with varying degrees of success. Sources evaluated include calcium-chloride-bound urea, isobutylidene diurea, acetyl urea, tung- and linseed-oil-coatedurea, formaldehyde-treated urea, natural zeolite, polymer-coated or fatty-acid-coatedurea, and biuret.
Biuret is produced by heating urea. It is a colourless, crystalline compound withthe following formula:
NH2 . CO . NH . CO . NH2
It contains 408 g N/kg, equivalent to 2550 g CP/kg. Biuret is utilised by rumi-nants, but a considerable period of adaptation is required.Adaptation is speeded byinoculation with rumen liquor from an adapted rumen.The nitrogen of biuret is notutilised as efficiently as that of urea, and it is very much more expensive. It has theconsiderable advantage that it is non-toxic even at levels very much higher thanthose likely to be found in foods.
Compound foods containing urea, must by law carry a declaration of:
■ the name of the material;■ the amount present;■ the proportion of nitrogen, expressed as protein equivalent, provided by the non-
protein nitrogenous content of the food;■ directions for use specifying the animals for which the food is intended and the
maximum level of non-protein nitrogen, which must not be exceeded in the dailyration.
Poultry waste
In the UK, poultry waste is legally defined as ‘the product obtained by drying andgrinding waste from slaughtered poultry. The product must be substantially free offeathers’ (Feeding Stuffs Regulations 2005).
Despite aesthetic objections, dried poultry excreta have been used successfullyfor ruminants.
Poultry manures vary considerably in composition, depending upon their origins.That from caged layers has a lower fibre content than broiler litter, which has a baseof the straw, wood chips or sawdust used as bedding. Broiler litters also vary in com-position depending upon the number of batches put through between changes ofbedding. Both types of waste have a high ash content, particularly that of layers, usu-ally about 280 g/kg DM. Digestibility is low and, although metabolisable energy val-ues of 6–9 MJ/kg DM have been quoted, 7.5 MJ/kg DM is probably a realistic figure.Protein (N � 6.25) contents are variable, between 250 g/kg DM and 350 g/kg DM,with a digestibility of about 0.65. Most of the nitrogen (600 g/kg at least) is presentas non-protein compounds, mostly urates, which must be converted first into ureaand then into ammonia in order to be utilised by the animal.The conversion to ureais usually a slow process, and wastage and the danger of toxicity are both less thanwith foods containing urea itself. Layer wastes are excellent sources of calcium(about 65 g/kg DM), but the ratio of calcium to phosphorus is rather wide, at 3 : 1;broiler litters have less calcium, with ratios closer to 1 : 1.
Dietary inclusion rates of up to 250 kg/t for dairy cows and up to 400 kg/t for fat-tening cattle have been used and have supported very acceptable levels of perform-ance. Thus, dairy cows given 110 kg per tonne of diet to replace half the soya bean

Summary
591
of a control diet yielded 20 kg milk, the same as the control, but gained only 0.58 kg/day compared with 0.95 kg/day for the controls.With fattening steers, con-centrate diets containing wastes have supported gains of the order of 1 kg/day, but ithas been estimated that for each inclusion of 100 kg excreta per tonne of diet,liveweight gains are reduced by about 40 g/kg.
One of the major anxieties constraining the use of poultry wastes in animal dietshas been the fear of health hazards arising from the presence of pathogens such asSalmonella and the presence of pesticide and drug residues. The heat treatmentinvolved in drying and the ensiling procedures used for storing the materials appearto offer satisfactory control of pathogens, and pesticides have not proved to be aproblem. Drug residues may be a hazard, but this can be overcome by having a with-drawal period of 3 weeks before slaughter.
The best method of treating poultry wastes for use as animal foods is by drying,but this is costly; ensiling, either alone, with forage, or with barley meal and malt,has proved satisfactory.
The Feeding Stuffs Regulations 2005 state that ‘no person shall put into circula-tion for use as a feeding stuff, or use as a feeding stuff, any material which containsfaeces, urine or separated digestive tract contents resulting from the emptying or re-moval of the digestive tract, irrespective of any form of treatment or admixture’.Taken in conjunction with the requirements of the Processed Animal Protein Order(see above), this makes the use of poultry waste virtually impossible.
Poultry wastes must, by law, carry a declaration of the amount of protein equiva-lent of uric acid if 1 per cent or greater and of calcium if in excess of 2 per cent.
SUMMARY
1. Oilseed cakes and meals are the residues re-maining after oil is removed from oilseeds.They are rich in protein and are valuable foods for animals.
2. About 2.6 million tonnes were used by theBritish food-compounding industry in 2008, ofwhich soya bean meal contributed 45 per cent,rapeseed meal 29 per cent, and sunflower meal8 per cent.
3. They usually have a high content of phospho-rus, which tends to exacerbate the generallylow calcium content.
4. The quality of oilseed protein is higher than thatof the cereals, and the best may approach thatof some animal proteins. In general, they have a low content of methionine and cystine, and avariable though usually low lysine content.
5. Oilseeds contain antinutritional factors, andsome, such as castor oil seeds, are so toxic as to
preclude their use as foods unless stringentconditions are attached to their use.
6. Protein quality of leguminous seeds such aspeas and beans is good, with methionine themain limiting amino acid.
7. Animal protein concentrates are used primarilyin small amounts to make good deficiencies ofcertain indispensable amino acids, minerals andB vitamins in the diets of non-ruminant animals.
8. The use of various meat by-products as foodfor certain animals is currently prohibited inthe UK and Europe.
9. About 120 000 tonnes of fishmeal was con-sumed by animals in Britain in 2008 (althoughits use is now restricted to non-ruminants). The quality of the protein is high and it is, in addition, an excellent source of calcium,phosphorus, choline, vitamin B12 andriboflavin. Fishmeals transmit high levels

Chapter 23 Protein concentrates
592
QUESTIONS
23.1 Compare and contrast the nutritive value of soya bean meal, rapeseed mealand linseed meal in pig and poultry diets.
23.2 Discuss the antinutritive factors present in groundnut meal and sheanut mealand explain how these limit their inclusion in farm animal diets.
23.3 Compare and contrast the use of urea sources and protected amino acids in thediet of high-yielding dairy cows and poultry.
FURTHER READING
Bell J M 1993 Factors affecting the nutritional value of canola meal: a review. CanadianJournal of Animal Science 73: 679–97.
Briggs M H (ed.) 1967 Urea as a Protein Supplement, London, Pergamon Press.
Dei H K, Rose S P and Mackenzie A M 2007 Shea nut (Vitellaria paradoxa) meal as a feedingredient for poultry. World’s Poultry Science Journal 63, 611–24.
D’Mello J P F 2002 Amino acids in Animal Nutrition, 2nd edn,Wallingford, CABI.
El Boushy A R Y and van der Poel A F B 2000 Handbook of Poultry Feed from WasteProcessing and Use, 2nd edn, Dordrecht, Kluwer Academic Publisher.
Ewing W N 1997 The Feeds Directory,Ashby de la Zouche, Context Publications.
Erikson D R 1995 Practical Handbook of Soyabean Processing and Utilization, Champaign,IL,AOCS Press.
Liener I E 1980 Toxic Constituents of Plant Foodstuffs, 2nd edn, New York, Academic Press.
Liener I E 1990 Naturally occurring toxic factors in animal feedstuffs. In: Wiseman J and ColeD J A (eds) Feedstuff Evaluation, London, Butterworth.
Makkar H P S, Saânchez M and Speedy A W 2007 Feed Supplementation Blocks: Urea-Molasses Multinutrient Blocks – Simple and Effective Feed Supplement Technology forRuminant Agriculture, Rome, FAO.
McNab J M and Boorman K N 2002 Poultry Feedstuffs: Supply Composition and NutritiveValue,Wallingford, CABI.
of polyunsaturated acids to animals consumingthem, which may benefit human beings con-suming their products.
10. Milk products supply protein of high quality.They are used mainly in pig diets and foryoung animals in general, such as calves.
11. The use of synthetic amino acids as dietarysupplements has increased in the past fewyears and it is now routine to add L-lysine hy-drochloride, DL-methionine and L-threonine
to pig and poultry diets. Ruminally protectedamino acids such as methionine or lysine maybe useful in the diets of high-producing rumi-nants such as dairy cows.
12. Non-protein materials such as urea are usedto provide a supply of degradable nitrogenfor the rumen bacteria and thus protein forthe host ruminant. Care is needed to ensurean adequate supply of energy and sulphur forthe bacteria.

Further reading
593
National Academy of Sciences 1976 Urea and Other Non-protein Nitrogenous Compounds inAnimal Nutrition,Washington, DC, NAS Publishing and Printing Office.
Sundi B, Kumar A and Dingle J 2006 Palm kerneal meal in broiler diets: effect on chick per-formance and health. World’s Poultry Science Journal 62: 316–27.
Thacker P A and Kirkwood R N 1990 Nontraditional Feed Sources for Use in Swine Nutrition,Boston, MA, Butterworths.
Takayuki S and Bjeldanes L F 2009 Introduction to Food Toxicology, 2nd edn, New York,Academic Press.
Oleszek W and Marston A 2000. Saponins in Food, Feedstuffs and Medicinal Plants,Dordrecht, Kluwer Academic Publishers.

594
24.1 Antibiotics
24.2 Probiotics
24.3 Oligosaccharides
24.4 Enzymes
24.5 Organic acids
24.6 Spray-dried plasma
24.7 Modifiers of rumen fermentation
Food additives are materials that are administered to the animal to enhance the effec-tiveness of nutrients and exert their effects in the gut or on the gut wall cells. There areclear theoretical reasons why these additives should be effective but, given the dynamicnature of the gut physiology, it is often very difficult to demonstrate the effects in prac-tice. For example, the effects of added organic acids within the gut lumen are difficultto quantify, even when re-entrant cannulae are employed.
Food additives24
24.1 ANTIBIOTICS
Antibiotics are chemical compounds that, when given in small amounts, halt thegrowth of bacteria. They are produced by other microorganisms, e.g. fungi, and arealso synthesised in the laboratory.They are used at therapeutic levels, by injection orin food or water, to treat diseases caused by bacteria. In addition, subtherapeutic lev-els of antibiotics are added to the food to enhance the rate of growth. The variousgroups of antibiotics act in different ways to reduce the numbers of specific bacteriain the gut (see Box 24.1), and thereby increase the efficiency of nutrient utilisation.This is brought about by:
■ reduction or elimination of the activity of pathogenic bacteria that may causesubclinical infection, thus allowing the host to achieve production levels closer totheir potential;
■ elimination of bacteria that produce toxins that reduce the growth of the hostanimal;
■ stimulation of the growth of microorganisms that synthesise unidentifiednutrients;

Antibiotics
595
BOX 24.1 Modes of action of antibiotics
Antibiotics halt the growth of bacteria by interfering with their cellular metabolism. There arefour groups:
■ Antibiotics that interfere with the synthesis of the material forming the bacterial cell wall andcause the cell to burst: These are high-molecular-weight (>1200) compounds that act on Gram-positive bacteria. They are poorly absorbed by the host and thus are non-toxic, leave no de-tectable residues and have no withdrawal period (i.e. a period of time during which thecompound must be removed from the food before the animal is slaughtered). Avoparcin andflavomycin are examples of this type of antibiotic.
■ Inhibitors of bacterial protein synthesis: These are also primarily active against Gram-positivebacteria and have a medium molecular weight (>500). Although they are absorbed to a greaterextent than the higher-molecular-weight compounds, they do not have a withdrawal period.Examples of this type of antibiotic include tylosin and virginiamycin.
■ Inhibitors of bacterial DNA synthesis: These can have a broad spectrum of activity, have a lowmolecular weight (about 250) and require withdrawal periods. Nitrofurans and quinoxaline-N-oxides fall into this category of antibiotics.
■ Ionophore antibiotics:These interfere with the electrolyte balance (Na/K) of the bacterial cell bytransporting potassium into the cell, which then requires energy to pump it out. Eventually theion pump fails to operate efficiently and potassium accumulates inside the cell.Water enters byosmosis and the cell ruptures. Monensin sodium is an example of this type of antibiotic.
■ reduction of the growth of microorganisms that compete with the host animal (thefermentation of nutrients by bacteria is a wasteful process compared with directabsorption);
■ increased absorptive capacity of the small intestine through a decrease in thethickness of the intestinal wall.
These effects may be coupled with a reduced turnover of mucosal cells and reducedmucous secretion.The gut accounts for a large proportion of the energy and proteinrequired to maintain an animal, and any reduction in the mass of the gut and cellturnover will release nutrients for other purposes such as growth.
Antibiotic growth promoters have been used mainly in pig and poultry foods, typ-ically at levels of 20–40 mg/kg, which give improvements of 4–16 per cent in growthrate and 2–7 per cent in efficiency of food conversion. The response is greatest inyoung animals and animals consuming diets containing vegetable protein rather thananimal protein. Mortality in young pigs is also reduced. The effect is less in healthyherds and flocks. Young pre-ruminant calves also respond to growth-promoting anti-biotics in the same manner as non-ruminants. Since ruminants depend primarily onbacteria in the rumen for their nutrient supply, the use of antibiotics in ruminant dietsmight be considered to be disadvantageous. However, certain antibiotics of theionophore type (e.g. monensin sodium) have been found to be effective, particularlywith low-roughage/high-concentrate diets, in controlling the proportion of undesir-able bacteria in the rumen without disturbing the overall fermentation. There aresmall changes in the fermentation, however, such as reduced methane production andincreased propionic acid proportions, which improve productivity. Monensin sodium

Chapter 24 Food additives
596
at 20–30 mg/kg of food improves the efficiency of food conversion by increasing therate of gain with the same food intake or by maintaining the rate of gain at a lowerfood intake. Amino acid degradation is decreased and the additional propionic acidmay, under certain circumstances, spare amino acids for gluconeogenesis.
The widespread use of antibiotics coupled with the ability of resistant bacterialstrains to evolve over a short period of time and transfer resistance to other strains hasresulted in populations of bacteria that are resistant to many antibiotics.This has lim-ited the effectiveness of antibiotic treatment against disease and, whereas at one timea bacterial infection could be treated with a range of antibiotics, now some bacteriaare sensitive to a single antibiotic only.There is concern that if such bacteria gain resist-ance to this antibiotic, then the disease becomes untreatable. For this reason, the use ofantibiotics as growth promoters has been curtailed by legislation in recent years, and inthe EU the use of antibiotics as growth promoters is no longer permitted.
Another material that enhances the growth of pigs, and is thought to act via theantibacterial effects described above, is copper (see Chapter 6).When added to theirfood, as copper sulphate, at levels far in excess of the requirement for normal func-tions (e.g. 200 mg Cu/kg compared with 5 mg Cu/kg), pigs grow faster. Concern overthe accumulation of copper in the environment, and the potential toxic effect of apply-ing manure of high copper content to pasture grazed by sheep, has resulted in legis-lation in the EU to control the amount of copper that may be added to pig foods.Thefood of young pigs up to 12 weeks of age may contain 170 mg Cu/kg, but this mustbe reduced to 25 mg/kg thereafter, as for other classes of pig.
24.2 PROBIOTICS
In contrast to the use of antibiotics as nutritional modifiers, which destroy bacteria,the inclusion of probiotics in foods is designed to encourage certain strains of bac-teria in the gut at the expense of less desirable ones.A probiotic is defined as a livemicrobial food supplement that beneficially affects the host animal by improvingthe intestinal microbial balance.Although the digestive tract of all animals is sterileat birth, contact with the mother and the environment leads to the establishment ofa varied microflora. The beneficial microorganisms produce enzymes that comple-ment the digestive ability of the host, and their presence provides a barrier againstinvading pathogens. Digestive upsets are common at times of stress (e.g. weaning),and feeding desirable bacteria such as Lactobacilli in these situations is preferableto using antibiotics, which destroy the desirable bacteria as well as the harmfulspecies.
It has been suggested that the desirable bacteria exert their effects in a numberof ways:
■ Adhesion to the digestive tract wall to prevent colonisation by pathogenic micro-organisms: Detrimental bacteria, such as E. coli, need to become attached to thegut wall to exert their harmful effects. Attachment is achieved by means of hair-like structures, called fimbriae, on the bacterial surface.The fimbriae are made upof proteins, called lectins, which recognise and selectively combine with specificoligosaccharide receptor sites on the gut wall. Lactobacilli successfully competefor these attachment sites, as shown in Fig. 24.1.

Probiotics
597
■ Neutralisation of enterotoxins produced by pathogenic bacteria that cause fluidloss: There is some evidence that live probiotic bacteria can neutralise these tox-ins, but the active substance has not been identified.
■ Bactericidal activity: Lactobacilli ferment lactose to lactic acid, thereby reducingthe pH to a level that harmful bacteria cannot tolerate. Hydrogen peroxide is alsoproduced, which inhibits the growth of Gram-negative bacteria. It has also beenreported that lactic acid producing bacteria of the Streptococcus andLactobacillus species produce antibiotics.
■ Prevention of amine synthesis: Coliform bacteria decarboxylate amino acids toproduce amines, which irritate the gut, are toxic and are concurrent with the inci-dence of diarrhoea. If desirable bacteria prevent the coliforms proliferating, thenamine production will also be prevented.
■ Enhanced immune competence: Oral inoculation of young pigs with Lactobacillihas elevated serum protein and white blood cell counts.This may aid the develop-ment of the immune system by stimulation of the production of antibodies andincreased phagocytic activity.
Other postulated effects include beneficial interaction with bile salts, increased diges-tive enzyme production, more efficient absorption of nutrients, and greater vitaminproduction.
In a review of the response of pigs of various ages to the administration of pro-biotics, it was concluded that probiotics were effective for young pigs, in which thedigestive tract is still developing after weaning. However, probiotics were less effec-tive for growing and finishing pigs, which already have a balanced population ofmicroorganisms.To be effective, the desirable microorganism should not be harmfulto the host animal, should be resistant to bile and acid, should colonise the gut effi-ciently, should inhibit pathogenic activity, and should be viable and stable undermanufacturing and storage conditions.
Fig. 24.1 (a) A mixed population of bacteria with substantial attachmentof pathogenic bacteria. (b) Competitive exclusion of pathogens due topreferential attachment of non-pathogens. It should be noted that therecognition of receptor sites (carbohydrates) by the bacterial fimbriae(lectins) is very specific to different types of organism.
Adapted from Ewing W N and Cole D J A 1994 The Living Gut, Dungannon, Context.
(a)
Pathogenic bacteria
Pathogenic bacteria
Enterocyte
Enterocyte
Gut wall
Gut wall
Non-pathogenicbacteria
Non-pathogenicbacteria
(b)

Chapter 24 Food additives
598
In monogastric animals, strains of Lactobacilli,Bacillus subtilis and Streptococci havebeen used as probiotics. In ruminant animals, the application of yeast (Saccharomycescerevisiae) in the form of live culture, or dead cells with culture extracts, has provedsuccessful in beneficially modifying rumen fermentation.
Yeast cultures can stimulate forage intake by increasing the rate of digestion offibre in the rumen in the first 24 hours after its consumption. Overall digestibility isnot affected. It is likely that this improvement in early digestion and intake isbrought about by alterations in the numbers and species of microorganisms in therumen. The precise means by which the effect is achieved have not yet been con-firmed, but there are a number of probable mechanisms (Fig. 24.2).
It is thought that metabolites of dead and live yeast cells (B vitamins, branched-chain fatty acids, amino acids and peptides) stimulate the growth of the bacterialspecies Megasphaera elsdenii.This utilises the lactic acid produced from the rapid fer-mentation of starch and sugars associated with high-concentrate diets. Live yeasts fer-ment sugars derived from the degradation of starch, thus competing with thelactic-acid-producing bacteria, and thereby stabilise rumen pH and reduce the risk ofacidosis. Live yeast cultures also scavenge oxygen in the rumen, helping to maintainanaerobic conditions and favouring the growth of cellulolytic bacteria.The increase inforage intake can result in improved liveweight gain, milk yield and milk fat content,although the effects are often small in dairy cows. The addition of yeast to intensivebeef diets has increased daily liveweight gain and food conversion efficiency. Improvedfibre digestion has also been reported in horses when yeast cultures have been given.
Increasedremoval of hydrogen
Removal ofstarch/sugars
Lower lacticacid production
Bufferingaction
Improved rumenpH stability
Increased rates offibre digestion
Provision ofgrowth factors
Increased nutrientabsorption
Reduced methaneproduction
Increased microbialprotein production
Increased cellulolytic numbersand activity
Increased forageintake
Increased animalperformance
Fig. 24.2 Suggested modes of action of yeast cultures in the rumen.
Adapted from Offer N W 1991 Yeast culture: its role in maximising fibre digestion in the rumen. FeedCompounder January: 16–19.

Oligosaccharides
599
24.3 OLIGOSACCHARIDES
Oligosaccharides (2–20 monosaccharide units; see Chapter 2) have been claimed asbeneficial nutritional modifiers for monogastric farm animals.They fall into the groupof materials also known as prebiotics, which are defined as compounds other thandietary nutrients that modify the balance of the microfloral population by promot-ing the growth of beneficial bacteria and thereby provide a healthier intestinalenvironment. Oligosaccharides occur naturally in foods: soya bean meal, rapeseedmeal and legumes contain �-galactooligosaccharides (GOS); cereals contain fructo-oligosaccharides (FOS); milk products have trans-galactooligosaccharides (TOS);and yeast cell walls contain mannanoligosaccharides (MOS).They are also producedcommercially.
It has been suggested that these compounds achieve their beneficial effects in thegut in two ways. First, although they are not easily digested by the host digestive en-zymes, compounds such as FOS can be fermented by the favourable bacteria (e.g.Bifidobacteria and Lactobacilli), giving them a competitive advantage. This shifts themicrobial population towards such microorganisms and away from the harmful species.
Second, the gut microbial population may be altered by the oligosaccharide inter-fering with the attachment of harmful bacteria to the gut wall. As a means of cellrecognition, all cell types have a unique configuration of carbohydrate-containingcompounds (glycoproteins and glycolipids) on their surface. As described above inthe section on probiotics, pathogenic bacterial cells have surface compounds calledlectins that recognise these carbohydrates and by which they attach to the gut cells.Once attached, the bacteria are able to multiply and produce their harmful effects.Species such as Salmonella and E. coli have a mannose-specific lectin that binds tomannose residues on the gut mucosal surface. By introducing mannose-containingcompounds (MOS) into the diet, the binding by pathogenic bacteria is disrupted andinstead they bind to the oligosaccharide and are carried out of the gut with the pas-sage of the digesta (Fig. 24.3).Yeasts have mannans in the cell wall structure and formthe basis of some commercial products that are claimed to act in this way. Indeed,
Fig. 24.3 The lectin–carbohydrate combination is specific to a particular organism.However, if the same carbohydrate (e.g. an oligosaccharide) is provided in thediet, harmful bacteria can be encouraged to attach to these and they do notadhere to the gut wall but are excreted without producing toxins.
From Ewing W N and Cole D J A 1994 The Living Gut, Dungannon, Context.
Digesta flow
Freecarbohydrates
Pathogenicbacteria
Fimbriae
Enterocyte
Gut wall
Surfacecarbohydratereceptors
Non-pathogenicbacteria

Chapter 24 Food additives
600
the presence of such yeast fragments has been said to be the reason why yeast prod-ucts are beneficial.
The efficacy of products containing oligosaccharides is currently the subject of ac-tive experimentation. There can be no guarantee that an oligosaccharide will favourthe growth of beneficial species in a complex microflora such as that found in the pigintestine. Experiments have shown that piglets given an oral challenge of E. coliresponded to GOS with a reduced pH of ileal digesta and reduced population of col-iforms. Supplements of FOS and TOS have reduced the numbers of aerobic bacteriain the gut of weaned piglets, and there are reports of a reduced incidence of diarrhoea.Under farm conditions, improvements in gain and food conversion efficiency of theorder of 4–6 per cent have been recorded. In other experiments, reduced digesta pH hasbeen reported, but without a detectable change in the composition of the microflora,microbial metabolites or production responses. These conflicting results may havearisen because the diet already contained some oligosaccharides or because experi-mental conditions tend to be less stressful than those on farms.
24.4 ENZYMES
The mammalian digestive enzymes are described in Chapter 8. Not all compoundsin foods are broken down by these enzymes, and so some potential nutrients are un-available. The chemical structure of plant cells (fibre), the limited time available foractivity in certain parts of the gut and the presence of antinutritive compounds insome foods hinder the release of nutrients. Early experiments with supplementalenzymes to overcome these limitations yielded variable responses, mainly becausethey were impure materials.As a result of advances in biotechnology, more effectiveenzyme preparations can now be produced in large quantities and relatively inex-pensively. Therefore, supplementation of the diet as a means of improving nutritivevalue is becoming commonplace.
The enzymes used as food additives act in a number of ways. First, they can im-prove the availability of plant storage polysaccharides (e.g. starch), oils and proteins,which are protected from digestive enzymes by the impermeable cell wall structures.Thus, cellulases can be used to break down cellulose, which is not degraded by en-dogenous mammalian enzymes. Even in ruminant animals, in which the rumenmicroflora possess cellulase, fibrolytic enzymes have been used, but responses havebeen variable owing to the complex nature of the rumen fermentation system andother factors such as lignin encrustation of cellulose. Responses in pigs and poultryof the order of 5–10 per cent improvement in liveweight gain and 10 per cent im-provement in food conversion efficiency have been recorded. Supplementation of awheat by-product diet with cellulase increased the ileal digestibility of non-starchpolysaccharides from 0.192 to 0.359 and crude protein from 0.65 to 0.71.
Second, enzymes are employed to break down materials that interfere with thedigestion, absorption and utilisation of nutrients.The major application in this area hasbeen to break down carbohydrate fractions in cereal cell walls, the �-glucans andarabinoxylans, which are resistant to attack by digestive enzymes.These materials hin-der the digestion and absorption of other nutrients by forming a viscous gum in thedigestive tract. In pigs, it has been suggested that the increased viscosity brought aboutby �-glucans in the stomach contents may affect the natural sieving of particles.Thus,large particles are suspended in the viscous digesta and pass through to the duodenum

Enzymes
601
Table 24.1 Effect of �-glucanase addition to hulless barley (Scout) on foodconsumption, weight gain and food to gain ratio of broilers
Broilers 0–6 weeks
Diet type Intake (g) Gain (g) Gain : food
Wheat 2910 1529 0.525Barley 2941 1473 0.501Barley + enzyme 2992 1638 0.547
Broilers at 3 weeks
Diet type Cumulative intake (g) Body weight (g) Gain : food
Maize 1002 756 0.713Barley 987 593 0.569Barley + enzyme 1001 746 0.705
Adapted from Rotter B A, Marquardt R R and Guenter W 1989 Enzymes in feed: they really can be madeto work, Alltech European Lecture Tour, February–March 1989.
instead of falling to the bottom of the stomach, resulting in less efficient digestion. Itis also possible that the increase in viscosity disturbs peristalsis and pancreatic secre-tion. In poultry, the viscous nature of the digesta results in poor performance andsticky droppings, which present a problem in the management of litter waste. Sup-plements of �-glucanase to barley-based diets improved the rate of gain and foodconversion efficiency of broilers to values similar to those for wheat- or maize-baseddiets (Table 24.1). The �-glucanase also reduced litter problems and improved themetabolisable energy of the diet.
Supplementation of pig foods improves ileal and whole tract digestibility of nu-trients. In breaking down the �-glucans, the enzymes reduce the viscosity of thedigesta, thus allowing better movement of endogenous enzymes through the massand more efficient digestion and absorption of nutrients. It is still not clearwhether viscosity per se is responsible for the effects or whether it is an indicatorof conditions pertaining in the gut lumen that cause the problems. The responsediffers between pigs and poultry because of differences in digestive physiologybetween the two species (see Box 24.2).
BOX 24.2 Enzyme action in pigs and poultry
Enzymes have found major commercial application in pig and poultry diets and are used extensivelyfor the latter. Differences in efficiency have been reported between the species, the effect generallybeing greater in poultry; this is possibly due to the differences in gut physiology between the twospecies.There is a greater reduction in the viscosity of digesta in the small intestine by enzymes in poul-try, probably because of the lower water content than in pigs.The longer retention time in the stomachand acidic nature of stomach contents in the pig (around pH 3) is more destructive to enzymes than themilder conditions in the crop (pH 4–5). New commercial enzymes have been selected for their pH sta-bility. Finally, pigs have a longer small intestine than poultry and the resultant increased retention timeallows more time for the endogenous enzymes to act.Thus, there is more opportunity for supplementalenzymes to have an effect in poultry owing to their limited digestive tract.

Chapter 24 Food additives
602
Phytase is in this category of enzyme. It releases the orthophosphate groups fromphytic acid, which is only partially broken down by non-ruminants and is the majorform of phosphorus in cereal grains and oilseeds (see p. 115).This results in a greateravailability of phosphorus to the animal, and the amount of inorganic phosphorusadded to the diet can be reduced, with beneficial effects on the environment throughreduced phosphorus excretion.
In the third area of enzyme application, the aim is to supplement the enzymecomplement of young animals, in which the rate of endogenous enzyme productionmay be limiting. Early-weaned pigs have limited amylase, protease and lipase activ-ity (see Chapter 8), and enhancement of the extent of digestion of nutrients wouldimprove performance and reduce the incidence of the diarrhoea that results fromundigested nutrients reaching the hind gut and being fermented by bacteria.
Finally, enzymes can increase the efficiency of utilisation of nutrients in monogas-tric animals by releasing them for uptake from the small intestine rather than allow-ing fermentation in the hind gut, which results in products of lower value to theanimal (e.g. volatile fatty acids).
In order to be effective when incorporated into the animal’s diet, enzymes mustsurvive storage at ambient temperature, the manufacturing process (heating and pel-leting) and wide fluctuations in pH in the gut, be resistant to intestinal proteases, andhave specific activity on feed components in the upper digestive tract. The enzymeshould be selected on the basis of its target substrate. Commercial enzymes are de-rived from a wide range of sources, particularly fungi such as Trichoderma longi-brachiatum, Aspergillus niger and Humicola insolens.A summary of the applicationof enzymes is given in Table 24.2.
Table 24.2 Enzyme supplementation of diets
Diet constituent Problem component Enzyme
Barley and oats �-Glucan: glucose �-1,4 linked spine with �-1,3 side linkages; sequenceof linkages varies between barleyand oats and between cultivars
�-glucanase
Arabinoxylans: �-1,4 xylopyranose residues spine with terminalarabinofuranosyl substitutes
Pentosanase orxylanase
Wheat (also rye andtriticale)
Cellulose CellulaseFibrous materialsLimited digestion of protein in young
animalsProteinasesSoya bean and soya
productsLow availability of phytin phosphorus
in monogastricsPhytaseGrains and seeds
24.5 ORGANIC ACIDS
Efficient digestion of food in young pigs depends on the secretion of sufficient acidin the stomach.Acid additives have been used mainly in the diets of early-weaned pigs.Here their use relates to the digestive physiology of the young pig and the replace-ment of sow’s milk with solid food at weaning. The suckled piglet obtains nutrients

Organic acids
603
on a little-and-often basis, sucking about once every hour.The milk clots in the stom-ach, and the limited secretion of hydrochloric acid is augmented by lactic acid pro-duced from the fermentation of lactose by Lactobacilli.This ensures that the pH fallsto a level that favours efficient protein hydrolysis and suppresses harmful bacteria.Thereafter, there is a steady release of nutrients from the clot to the small intestine.The solid food presented at weaning is less digestible than milk, is consumed inlarger, less frequent meals, and has a higher buffering capacity. The limited hy-drochloric acid production is not sufficient to ensure that the pH falls to a level thatprevents the growth of pathogenic bacteria. In addition, the nutrients may overloadthe immature digestive and absorptive capacity of the small intestine, and their fer-mentation in the hind gut results in diarrhoea.
In order to overcome these problems, acids have been added to weaning diets toaugment gastric HCl, giving a rapid fall in pH with beneficial effects on protein di-gestion and the gut microflora. Although inorganic acids have been used to supplyhydrogen ions, and hence reduce pH, organic acids have additional desirable proper-ties. In their salt form, they are odourless and easy to handle; they lower the pH andacid binding capacity of the food; and the anion has an antimicrobial effect onmoulds and bacteria in the food (see Box 24.3), thereby improving food quality.Theanion has been reported to act as a complexing agent for cations, such as Ca++ andMg++, thus improving their retention. It is also suggested that the presence of short-chain fatty acids in the small intestine reduces the damage to the villi of the gut wallthat is associated with weaning. Finally, organic acids, once absorbed by the pig, canbe used as substrates in intermediary metabolism, principally as energy sources.
It has proved difficult to obtain experimental evidence for all of these purportedeffects of organic acids. In an extensive review, Partenen and Mroz (1999) examinedthe evidence for their modes of action. Only a few studies have demonstrated a re-duction in gastric pH, but the methodology of sampling is difficult, given diurnalvariations, differing proportions of food and secretions, and timing of sampling. Toconfirm such effects of organic acids, a study is required with permanent fixed pHelectrodes within the stomach. There is evidence of a positive effect on the ileal di-gestibility of amino acids and the retention of nutrients in growing pigs.The magni-tude of the effect depends on the acid used and its concentration, the age of the pigand the composition of the diet.With regard to minerals, the absorption of calciumand phosphorus has been improved, but variable results have been obtained for theretention of these minerals. Addition of organic acids has had beneficial effects onmicrobial counts and species in some studies, but there has been little work on theeffects on gut morphology to test the theory of an improvement of the structure ofthe villi. Finally, in some studies, the addition of formic, fumaric and citric acids to
BOX 24.3 Antimicrobial action of organic acids
Organic acids change from the undissociated to the dissociated form, depending on the pH of theenvironment. In the undissociated form they can diffuse rapidly through the semi-permeable mem-brane into the cytoplasm of the microorganism. Once inside, at a pH of around 7, the acid becomesdissociated and acts by suppressing the cellular enzyme and transport systems. Acids with a highpKa (which are 50 per cent dissociated), longer-chain-length acids and unsaturated acids are themost effective.

Chapter 24 Food additives
604
the diet has increased the activity of enzymes associated with intermediary metabo-lism, indicating that the acids do contribute to nutrient metabolism.
Although the exact modes of action of the acids are not clear, their addition topig diets has proved beneficial in terms of nutrient digestibility, growth and foodconversion efficiency (Table 24.3). This is so particularly for newly weaned pigs,when coupled with good feeding management procedures.
Formic and propionic acids are more effective than fumaric or citric acids at thesame rate of inclusion because the former have a lower molecular weight. Suggestedlevels of inclusion of acid (kg/tonne diet) are formic acid 6–8, propionic acid 8–10,fumaric acid 12–15 and citric acid 20–25, but recommendations vary.
Table 24.3 Effect of graded levels of fumaric acid on the growth rate and foodconversion efficiency of young pigs (10.0–18.7 kg)
Fumaric acid (%)
0 1 2 3 4
Diet pH 5.96 4.77 4.33 3.98 3.80Liveweight gain (g/day) 261 261 257 296 297Food intake (g/day) 501 484 445 493 493Gain : food (kg gain/kg food) 0.52 0.54 0.57 0.60 0.60
Adapted from Easter R A 1988 Acidification of diets for pigs. In: Haresign W and Cole D J A (eds) RecentAdvances in Animal Nutrition – 1988, London, Butterworth.
24.6 SPRAY-DRIED PLASMA
As described above in the section on organic acid additives, the early-weaned pigletfaces challenges owing to its immature digestive and immune systems.These can re-sult in damage to the gut villi, which reduces nutrient absorption, and an increasedchallenge from disease organisms.A source of highly digestible nutrients is essential,and one product that supplies readily digestible amino acids is spray-dried plasma(SDP). This is manufactured from blood collected from slaughterhouses and is rap-idly dried to preserve the protein fraction. It has a high protein content, and the pro-tein fraction comprises albumins, globins and globulins, including immunoglobulins.Its amino acid pattern is similar to sow’s milk, being high in lysine, tryptophan andthreonine. It is, however, low in methionine and isoleucine.
Inclusion of SDP in the diet improves food intake and food conversion efficiencyover a wide range of pig types and environments, but it is particularly effective insituations where there is a high level of exposure to pathogens. SDP is a palatableingredient and by promoting food intake at weaning it helps to maintain villusstructure and function and hence efficient digestion and absorption of nutrients.Asa source of nutrients, there is no difference between porcine and bovine sources ofplasma.
The normal level of inclusion of SDP in the diet is 20–80 g/kg, and at this highlevel and as a source of protein it would normally be included in Chapter 23 underanimal protein concentrates. However, it is thought that the product has growth-promoting properties beyond its use as a supply of digestible amino acids.

Modifiers of rumen fermentation
605
Part of the growth-promoting and beneficial health effects of SDP has been attrib-uted to the presence of immunoglobulins.The evidence suggests that the immunoglob-ulins are not absorbed by the piglet to enhance the immune system but that they mayact within the gut, preventing bacteria and viruses from damaging the gut wall, andthereby intestinal function is maintained – increased villi surface area, increasedenzyme production and reduced diarrhoea. In this latter immune effect, some recentresearch reports suggest that SDP of porcine origin is superior to that from bovines.
24.7 MODIFIERS OF RUMEN FERMENTATION
Rumen fermentation processes are usually kept within narrow bounds and, as theyform an integrated system, any changes made have more than one outcome. Thus,modification of the processes to one desired target is difficult. Nevertheless, thereare products that are used to modify the fermentation to achieve specific results (seealso Chapter 8).
The use of antibiotics and probiotics was discussed above. Other rumen modifiersinclude buffers, methane inhibitors and bloat-preventing substances.
Buffers are included in ruminant diets to regulate rumen pH to levels that favourthe activity of cellulolytic organisms (pH 6–7). Diets rich in readily fermentable car-bohydrate create acidic conditions and increase lactic acid formation, both of whichare detrimental to the cellulolytic bacteria.This reduces food intake and predisposesthe animal to acidosis. Secondary problems include reduced milk fat production,rumenitis, ketosis, laminitis and liver abscesses. Chemicals such as sodium bicarbon-ate, sodium carbonate, calcium carbonate and magnesium oxide buffer the hydrogenions and increase the dilution rate of the liquids in the rumen.This increases the effi-ciency of microbial protein synthesis and, as a result of the shorter retention time,allows starch and protein to escape to the intestines.The activity of cellulolytic bac-teria and the proportion of acetate in the rumen volatile fatty acids are increased. Inthe USA it has become common to add up to 200 g NaHCO3/day, and sometimesalso MgO, to the rations of cows in early lactation. It has been suggested that, sincebicarbonate buffers are expended once the CO2 is released, it would be advanta-geous to use certain clays and bentonites that contain insoluble and hence undegrad-able anions and would allow the buffering action to be carried further down thedigestive tract.
Antibiotics such as virginiamycin and monensin have been used to select againstbacteria that produce lactic acid. Certain probiotics encourage the uptake of lacticacid (see above).
The production of methane in the rumen is a wasteful process (up to 10 per centof the gross energy) and contributes to the earth’s greenhouse gases.The use of addi-tives to suppress methane production is discussed in Chapter 8 (see p. 188).
Under normal conditions, rumen fermentation produces gases that, by the action ofruminal and reticular contractions, accumulate in the area known as the cardia, fromwhich they are passed up the oesophagus in the process of eructation. Bloat occurs if thegas becomes trapped and the animal is not able to clear it. Rumen stasis due to acidosisis one of the causes of free gas bloat, but on certain pastures, particularly those rich inlegumes, and on high-concentrate (feedlot) diets, the fermentation process in the rumencan result in rumen gases being trapped within fluid bubbles.Therefore, the gas cannotbe eructated as normal and pressure builds up in the rumen.The condition is known as

Chapter 24 Food additives
606
frothy bloat. In the case of legume bloat, the frothing is due to chemicals associated withthe plant.With high-concentrate diets, the normal function of the rumen is disrupted bythe rapid accumulation of fermentation acids and the release of bacterial mucopolysac-charides during cell lysis, which result in increased viscosity of the rumen fluid and theformation of the stable foam. In the case of pasture bloat, there are management prac-tices (e.g. feeding hay or straw before turning cattle on to grass/clover pastures so thatthey are not hungry, not turning animals on to wet, immature pasture and avoiding inter-mittent grazing) to reduce its incidence, but often these are insufficient.Antibiotics havebeen used to change the end products of fermentation in order to produce fewer froth-forming materials. However, specific antifoaming agents are more commonly used.Thesereduce the surface tension of the rumen fluid, preventing the formation of the stablefoam.Vegetable oils (especially linseed oil), lecithin, animal fats, mineral oils, detergents(pluronics) and the synthetic polymer poloxalene fall into this category of agent. Theadditive alkylarylsulphonate prevents the release of pectin derivatives, which causefrothing.The main problem with such additives is the maintenance of an adequate con-centration in the rumen, since liquids quickly pass through. Spraying the forage with oilhas proved successful. In New Zealand, a product containing pluronic detergents andalcohol ethoxylate is used for pasture bloat, but its effectiveness, and that of other pas-ture bloat remedies, for feedlot bloat is not known. For the latter type of bloat, the effec-tiveness of the ionophore antibiotics has been partially attributed to the lower absoluteamount and daily variation of food intake.The addition of sodium chloride at 40 g/kgdiet DM has been suggested as a preventive measure, as this increases the rate of passageof fluids from the rumen, but it also depresses food intake.
SUMMARY
1. Food additives are administered to the animalto improve the effectiveness of nutrients.
2. Antibiotics reduce the number of bacteria inthe gut and increase the availability of nutri-ents to the animal. The widespread use of an-tibiotics has resulted in populations of bacteriathat are resistant to many antibiotics, and inseveral countries their use for growth promo-tion is restricted or forbidden.
3. Probiotics are live microbial supplements thatbenefit the animal by improving the intestinalmicrobial balance. The beneficial microorgan-isms displace pathogenic bacteria and produceenzymes that complement the digestive abilityof the host.
4. Oligosaccharides may be fermented by favour-able bacteria, thereby shifting the populationtowards such microorganisms and away fromharmful species. They also interfere with theattachment of harmful bacteria to the gut wall.
5. Exogenous enzymes are added to the animal’sfood to supplement its own digestive enzymesand to break down antinutritive fractions infoods.
6. The diets of young pigs may include organicacids, which reduce gut pH, with beneficialeffects on protein digestion and control of thegut microflora.
7. Spray-dried plasma is a palatable source ofdigestible amino acids for newly weanedpiglets. Its immunoglobulin content enhancesgut health.
8. Products that are used to modify rumen fer-mentation include buffers, which regulaterumen pH and favour the activity of cellulolyticbacteria, compounds to suppress methane pro-duction, and bloat-preventing compounds,which prevent the build-up of gas trapped infoam in the rumen fluid.

Further reading
607
QUESTIONS
24.1 Compare and contrast the actions of antibiotics and probiotics as growthpromoters.
24.2 The use of antibiotics as growth promoters has been curtailed in some coun-tries. Discuss the measures that can be taken in diet formulation and the use ofalternative food additives to ensure efficient animal production.
FURTHER READING
Bedford M R and Schulze H 1998 Exogenous enzymes for pigs and poultry. NutritionResearch Reviews 11: 91–114.
Ewing W N and Cole D J A 1994 The Living Gut, Dungannon, Context.
Jouany J P 1994 Methods of manipulating the microbial metabolism in the rumen. Annales deZootechnie, 43: 49–62.
Partenen K H and Mroz Z 1999 Organic acids for performance enhancement in pigs. NutritionResearch Reviews 12: 117–45.


PART 6
Animal products and human nutrition
The final part of this book consists of one chapter and moves away from considerations of theanimal to the consumers of animal products.
The purpose of farming animals is to produce food (milk, meat, eggs), materials (wool, hide)and work (draught) that are of use to man. Chapter 25 describes the trends in consumptionand nutrient contribution from animal products and then considers aspects of animal produc-tion that have an influence on the environment and human health.


25.1 Comparative nutrition
25.2 The contribution of animal products to human requirements
25.3 Objections to the use of animal products
25.4 Future trends in the consumption of animal products
Animal products – meat (including fish), milk, milk products and eggs – are used princi-pally as food for man, although some may also be used to feed other animals. In devel-oped countries, the by-products of the meat industry are used to feed companionanimals (cats and dogs) and may also be incorporated in the diets of farm animals (e.g.as meat and bone meal). Milk by-products are used to make milk replacers for younganimals reared away from their dams. In this chapter, we review the use of animal prod-ucts as food for man and companion animals; their use for feeding farm animals is dis-cussed in Chapter 24.
25 Animal nutrition and the consumers of animal products
611
25.1 COMPARATIVE NUTRITION
The nutrient requirements of farm animals have been discussed in earlier chapters.Here, some selected values from these chapters are compared with the nutrient re-quirements of human beings and their companion, the dog. Table 25.1 summarisesthe requirements of 30 kg growing individuals of the species, sheep, pig, dog andman, and Table 25.2 gives values for three of these species in a state of maintenance.
BOX 25.1 Alternative uses of animals
Although animals are used mainly as sources of food, it is well to remember that they also provideother benefits for man. Skins, wool and hair are utilised to make clothing and other fabrics, such ascarpets. In many countries, animals are much used for draught purposes, to carry loads and pull farmmachinery.As the alternatives to these uses are derived mainly from fossil fuels, there are clear incen-tives to maintain an interest in these animal products.Animals are also used to provide vaccines andother medical products for man; the range of these products is currently being extended by the appli-cation of genetic engineering.

Chapter 25 Animal nutrition and the consumers of animal products
612
Table 25.1 Comparative nutrient requirements of man and some domestic animalsfor growing animals of 30 kg liveweighta
Species Mana Dogb Pigc Sheepd
Energy (MJ/day) 9 15 21 10Protein (g/day) 40 250 300 180Lysine (g/day) 2 8 17 –Methionine � cystine (g/day) 0.8 5 8 –Calcium (g/day) 0.70 10 11 3.4Phosphorus (g/day) 0.65 8 8 5Copper (mg/day) 1.0 7 9 4Thiamin (mg/day) 0.9 1.0 3.0 –Riboflavin (mg/day) 1.2 2.2 4.5 –Vitamin A (iu/day) 1500 5000 6000 1200Vitamin D (iu/day) 400 500 1200 200
aMainly UK estimated average requirements or recommended dietary allowances: averagesfor males and females (Garrow J S, James W P T and Ralph A (eds) 2000 Human Nutritionand Dietetics, 10th edn, Edinburgh, Churchill Livingstone).
bAmerican Association of Feed Control Officials.cAppendix 2, mainly Table A.2.9.1 and A.2.9.2 (1.5 kg of food per day).dAppendix 2, Tables A.2.7.1 and A.2.7.2 (150 g/day of liveweight gain).
Table 25.2 Comparative nutrient requirements of man and some domestic animalsfor animals maintained at 50 kg liveweighta
Species Manb Dogc Sheepd
Energy (MJ/day) 9 8.4 6.5Protein (g/day) 40 48 100Lysine (g/day) 3.6 3.6 –Methionine + cystine (g/day) 0.8 2.5 –Calcium (g/day) 0.70 3.4 1.2Phosphorus (g/day) 0.55 2.9 1.2Copper (mg/day) 1.2 4.2 3Thiamin (mg/day) 0.9 0.6 –Riboflavin (mg/day) 1.2 1.3 –Vitamin A (iu/day) 1 500 2 850 1 200Vitamin D (iu/day) 200 285 200
aPigs are not included in this table because they are not normally maintained at 50 kgliveweight.
b, c, dSee Table 25.1 for comparative sources.
For growing animals (see Table 25.1), requirements vary markedly betweenspecies, with fast-growing species having greater requirements. For example, thefast-growing pig needs 6–7 times as much protein and 15–20 times as much calciumper day as a teenage human being of the same weight.The requirements of the grow-ing dog are also high, while those of the slower-growing sheep are intermediate tothose of the pig and humans. For adult animals requiring nutrients for maintenance

The contribution of animal products to human requirements
613
only (see Table 25.2), requirements are again generally higher for the domestic ani-mals than for man, but the differences are smaller than for growing animals. Indeed,for energy, man’s requirement for maintenance is greater than that of the otherspecies.
These figures demonstrate that although human beings tend to be concerned withtheir nutrient intakes, their domestic animals have relatively greater needs for nutri-ents, especially if they are to grow or produce rapidly.
Table 25.3 Contribution of various food groups to world food supplies (FAO)
Food group Energy (%) Protein (%)
Cereals 47 43Roots, tubers and pulses 7 10Nuts, oils, vegetable fats 10 4Sugar and sugar products 8 2Vegetables and fruits 6 7
All plant products 78 66
Meat 8 15Eggs 1 2Fish 1 5Milk 5 11Other 1 1Animal fats 2 0
All animal products 18 34Other foods 5 0
25.2 THE CONTRIBUTION OF ANIMAL PRODUCTS TO HUMANREQUIREMENTS
After comparing the nutrient requirements of man with those of domestic animals,we must now assess the quantities of nutrients supplied by the latter species tohuman diets. The contribution of animal products to world food supplies is sum-marised in Table 25.3. In total, animal products provide about one-sixth of energysupplies and one-third of protein supplies; meat is the major contributor, followedby milk and milk products. The figures for individual countries differ considerablyfrom the world averages (Table 25.4). Thus, in North America and most Europeancountries, meat consumption is 30–40 times greater than in the countries of Africaand the Indian subcontinent, although for India the discrepancy for milk consump-tion is not as great.
When the figures in Tables 25.3 and 25.4 are translated into nutrient intakes for indi-vidual countries, they show that there are substantial departures from the world aver-ages of about 2.0 MJ of energy and 29 g of protein per person per day (Table 25.5). Inthe developed countries of Europe and North America, and also in pastoral countries(Australia and Argentina), animal products supply about 4 MJ of energy per day, orabout one-third of total energy intake.Their contribution of protein is about 70 g per day,

Chapter 25 Animal nutrition and the consumers of animal products
614
Table 25.4 Meat and milk consumption in selectedcountries (kg/head/year) (FAO)
Country or region Meat Milk
USA 125.6 257.6Argentina 86.1 164.2France 93.4 290.2UK 84.3 243.5
Burundi 3.7 3.6Bangladesh 3.3 15.0India 5.7 63.5Sri Lanka 6.9 32.8
which is greater than man’s total requirements. However, there are differences betweencountries in the proportions of the three categories of animal products. For example,the USA, despite its substantial dairy industry, has reduced its consumption of animalfats (i.e. butter). Butter consumption in Spain is low because of the use of olive oil. InChina, energy intake from meat is relatively high, but protein intake is relatively low be-cause the meat eaten is mainly fat pork. In contrast, Japan has a low energy intake fromanimal products, but protein intake is high because the figure of 51 g per day includesfish. In India, animal products supply only 0.64 MJ and 10 g of protein per day (or, re-spectively, 6 and 15 per cent of total intakes), whereas in the USA, the correspondingfigures are 26 and 64 per cent. In Nigeria (and in many of the countries of West andCentral Africa), the contributions of animal products are very small. In Kenya, they aregreater because there is more pastoral agriculture.
The main factor determining the intake of animal products is the wealth of thehuman population, but this factor is modulated by additional factors, especially the
Table 25.5 Contribution of animal products to human diets (FAO, 2008)
Energy (MJ/day) Protein (g/day)
Meat and Milk and Animal Total Total animala
offal eggs fats animal
World 0.96 0.60 0.25 1.81 29France 2.07 1.69 1.12 4.88 74Spain 1.89 1.27 0.30 3.46 70UK 1.96 1.52 0.64 4.12 59USA 1.92 1.71 0.46 4.09 74Australia 2.12 1.15 0.96 4.23 70Argentina 2.12 1.01 0.30 3.43 57China 1.96 0.48 0.19 2.63 37Japan 0.74 0.72 0.15 1.61 51India 0.09 0.31 0.24 0.64 10Kenya 0.33 0.60 0.03 0.96 15Nigeria 0.15 0.08 0.02 0.25 8
aIncludes fish.

The contribution of animal products to human requirements
615
availability of alternative sources of food and the religious beliefs and social customsof consumers. Thus, there are parts of the world, such as arctic and desert areas,where crop production is not feasible and the human population is largely depend-ent on animals for a protein supply. In arctic areas, Eskimos eat fish and eat other an-imals that also live on fish. In desert areas, nomadic people survive on the productsof animals such as the camel, which can live on the sparse natural vegetation.
The consumption of pig meat is prohibited by several of the major religiousgroups (Muslims, Jews and Hindus), who regard pigs as ‘unclean’ animals, probablybecause of their ability to infect man with certain parasites (discussed later).Hindus and many Muslims do not eat beef. However, sheep meat and chicken arenot commonly proscribed, except by people who choose to be vegetarians.The con-sumption of milk, milk products and eggs is subject to fewer religious and socialrestrictions, although the extreme vegetarians known as vegans exclude these fromtheir diets. In many parts of the world, fresh milk is not consumed by adults, whothen lose the ability to secrete the digestive enzyme lactase and hence to digest lac-tose. They are said to be ‘lactose-intolerant’; if they subsequently ingest foods con-taining lactose, it is fermented in the large intestine and causes a digestive upset.These restrictions clearly influence the global and national patterns of consumptionof animal products that are illustrated in Table 25.5. For example, in India, where pigmeat and beef are generally not eaten, meat consumption is very low and milk, milkproducts and eggs supply a high proportion of animal protein intake. In the USA,which has a wealthy population whose eating habits are not so much determined byreligious beliefs, both meat and milk are consumed in large amounts.
Within the world’s poorer, developing countries, there is a close relationship be-tween social class (i.e. wealth) and the consumption of animal products, with theconsumption patterns of richer people approaching those of the developed coun-tries. In the developed countries, however, this relationship is much less marked, aseven poorer people can afford meat and milk products.Table 25.6 illustrates the con-sumption pattern for social classes in Britain and shows that the differences betweenclasses are very small.The type of meat consumed may vary between social classes,however, with richer people eating more steaks and fewer hamburgers, hence moreprotein and less fat. Richer people also consume more meat outside their homes (ca. 10 per cent). Milk consumption tends to decline as income increases. Statisticsfrom the same source as those in Table 25.6 show that older people eat more meatthan do young people, the greatest difference being between those under 30 years ofage (909 g/head/week) and those aged 50–65 years (1342 g).
In developed countries, the patterns of consumption of animal products are liableto become ever more confused by the growing awareness of consumers of moral
Table 25.6 Effect of income on the consumption of meat and milkin the UK (g/head/week)
Gross weekly income of head of household (£)
0–214 215–383 384–623 624–938 >938
Meat 1114 1134 1143 1152 1126Milk 2283 2210 2024 1908 1809
Department for Environment, Food and Rural Affairs 2006 Family Food: Report onthe Expenditure and Food Survey. © Crown copyright. Reproduced by permission ofthe Controller of Her Majesty’s Stationery Office.

Chapter 25 Animal nutrition and the consumers of animal products
616
objections to, and possible health risks from, such foods. In Britain, vegetarians arethought to form only about 7 per cent of the population, but there are additional cat-egories of people who claim to eat only a little meat or to eat only white meats(chicken and possibly pork) and not red meat (beef and lamb). Others reject thewhite meats because they dislike the intensive farming methods used to producethem. Concern for human health, which is discussed later, centres on the avoidanceof the saturated fats found in many animal products.
Over the world as a whole, as people and countries get richer, they tend to increasetheir consumption of animal products, but this eventually reaches a plateau.The level ofthe plateau is not necessarily the same for all: thus, meat consumption in Britain and inEurope seems to have levelled off at 80–90 kg per head per year, whereas the averagefigure for the USA is 115 kg. Consumer preference for animal products may be basedpartly on their supposed superior nutritional value but is probably determined morestrongly by their organoleptic characteristics (i.e. their taste and texture).Wholly veg-etable diets are often thought of as bland and unexciting, and meat and other animalproducts are used to add variety. Improved methods of preservation of animal products,such as refrigeration, heat processing, canning and vacuum sealing, have made it easierfor people to enjoy a continuous supply of these products. However, the improvedavailability of foods in general also means that people can experiment with exoticingredients and culinary techniques that – like animal products – add variety to theirdiet. Thus, people eventually reach a point on the scale of affluence at which they nolonger need or desire to increase their consumption of animal products.
The phrase ‘need or desire . . . animal products’ introduces the question of their es-sentiality in human nutrition. Do we really need these foods or do we just like or pre-fer them? The continuing successful existence of vegetarians, and – more particularly –vegans demonstrates the non-essentiality of animal products for man; all the nutrientsrequired by man can be met by foods not of animal origin.There are, however, severalmajor nutritional advantages in meeting man’s requirements partly from animal ratherthan entirely from plant sources. The first is that animal products supply nutrients inproportions closer to those required by man. This is best illustrated by the essentialamino acids. Table 25.1 shows that a growing child requires 2 g of lysine and 40 g oftotal protein a day, a ratio of 5 g lysine per 100 g protein. For rice and wheat proteins,the lysine/protein ratio is much lower (2.8 and 3.1, respectively), and so these cerealsneed to be balanced in the diet by a lysine-rich protein source. A good-quality plantprotein such as that of the soya bean has a lysine/protein ratio of 6.4, but animal pro-teins in milk and beef have even more favourable ratios of 8.2 and 9.1, respectively.Thus, animal proteins are valuable for supplementing the proteins of staple foods suchas cereals by supplying lysine and other essential amino acids, and this is particularlyimportant for growing children, for whom amino acid requirements are most critical. Iflysine requirements have to be met with cereal proteins, then protein intake has to behigh and much of it is wasted.
There is one essential nutrient, vitamin B12 (cyanocobalamin), which is synthesisedby microorganisms and present in animal products but virtually absent from plant-derived foods.Vegans in particular have to ensure that they have a supply of this nutri-ent from a supplementary source such as yeast (see Chapter 5). Animal products arealso good sources of other vitamins, especially vitaminA, thiamin, riboflavin and niacin.
Another advantage of animal-derived foods for man is that their nutrients are moreaccessible for digestion than those of plant-derived foods. Plant cell walls impededigestion in the stomach and small intestine, and although they may be digested in

Objections to the use of animal products
617
the large intestine, the consequent release of nutrients may be too late to allow effi-cient absorption. Some minerals in plant tissues are bound in compounds that resistdigestion, an example being phosphorus in phytates (see pp. 115 and 602). Animalproducts are good sources of the minerals iron, calcium and zinc.
25.3 OBJECTIONS TO THE USE OF ANIMAL PRODUCTS
Ethical and environmental objections
Objections to the use of animals to feed human beings arise first from ethical consid-erations, a full discussion of which is beyond the scope of this book. The primaryargument, in brief, is that man have no right to exploit other animal species.The ob-jections to using animals are lessened if they are not killed (i.e. kept for milk or eggproduction) and increased if they are kept under unnatural and perhaps harmful con-ditions. A second type of ethical argument is that plant-derived foods should not bediverted to animal feeding when they could be used directly to feed human popula-tions that may be short of food. Until quite recently (e.g. the nineteenth century inBritain and other early developing countries), this argument did not apply becausefarm animals were used as scavengers to convert plants and plant by-products inedi-ble by man into human foods. Some land areas can be used to grow forages but notfood crops, and the world’s crop by-products contribute today about 500 Mt of drymatter per year as animal feeds.The argument against animal-derived foods has gath-ered force, however, with the increasing use of cereal and other grain crops for animalfeeding. In developed countries, other than those with a predominantly pastoral agri-culture, around 70 per cent of the cereals grown are used to feed livestock, and evenin developing countries (including those with food shortages) considerable areas ofland are used to grow crops for animal feeding. Over the world as a whole, cerealusage as animal feed amounts to 115 kg per person per year; the range across coun-tries is from 4 kg in India and sub-Saharan Africa to 600 kg in the USA.
Objections to the use of animals to provide human food are also made on envi-ronmental grounds. Overgrazing can destroy plant communities, demand for addi-tional grazing can cause deforestation, the excreta of intensively kept livestock causepollution problems, and methane from ruminants contributes to global warming.These raise complex issues that cannot be explored fully in this book.
The direct nutritional objections to animal-derived foods arise mainly from twosources. First, farm animals may harbour organisms such as pathogenic bacteria and in-testinal parasites that may be transmissible to man through the consumption of animalproducts. Second, some of the supposedly valuable nutrients in animal products – fats,in particular – have been implicated in the causation of certain diseases of man.
Nutrition and human health
The Merck Veterinary Manual lists 150 diseases transmissible from animals to man(known collectively as zoonoses), but the majority of these are transferred by con-tact or bites or are carried by wild animals. The food-borne diseases of man thatarise from farm animals form a relatively small, but nevertheless important, groupand are summarised in Box 25.2. The infection of man with these diseases can be minimised by various means, the first of which involves their restriction in, or

Chapter 25 Animal nutrition and the consumers of animal products
618
elimination from, animals. One example is the regular use of anthelmintics to restrictintestinal parasites, and another is the slaughter of infected stock to restrict or erad-icate bovine tuberculosis. The milk-borne disease tuberculosis also provides an ex-ample of another means of controlling infection, this being the treatment of animalproducts before they are consumed. The pasteurisation (heat treatment) of milk isdesigned to kill tuberculosis bacilli and other bacteria. Attention to hygiene inslaughterhouses and food stores, and appropriate cooking of meat, are also impor-tant in the control of zoonoses.
Antibiotics in feeds (see Chapter 24) have been used in intensive livestock sys-tems to restrict infections, but their routine administration is now prohibited or dis-couraged because of the danger of producing antibiotic-resistant organisms.
Of the diseases listed, those regarded today as being the most important indeveloped countries are the enteric infections from Campylobacter, E. coli andSalmonella organisms. Although cases of food poisoning have always occurred,people today are now less tolerant of them, both mentally (food is expected to besafe) and perhaps physically (as a generally cleaner environment has prevented thedevelopment of resistance to the organisms responsible).
Not listed in Box 25.2 is the zoonosis arising from bovine spongiform en-cephalopathy (BSE), or ‘mad cow disease’. There is no conclusive evidence that thetransmissible spongiform encephalopathies of man are acquired from animals, but theoccurrence of so-called ‘new variant’ Creutzfeld–Jakob disease in man that has coin-cided with an epidemic of mad cow disease in cattle and related species has led to the
BOX 25.2 Some important diseases transmissible in food from farm animals to man
Disease and causative organism Farm animals involved
BacteriaBrucellosis (undulant fever) Brucella abortus Cattle
B. melitensis Goats, sheepCampylobacter enteritis Campylobacter spp. All farm animalsClostridial diseases Clostridium botulinum Domestic animals
C. perfringensColiform infections Escherichia coli Poultry, pigs and cattleListeriosis Listeria monocytogenes All farm animalsSalmonellosis Salmonella spp. Poultry, pigs, cattle and horsesTuberculosis Mycobacterium bovis Cattle
ProtozoaSarcocytosis (cyst formation) Sarcocystis suihominis Pigs and cattleCryptosporidiosis (diarrhoea) Cryptosporidium parvum Cattle
Cestodes, trematodes and nematodesFascioliasis (liver fluke) Fasciola hepatica Cattle and sheepTapeworms Echinococcus and Taenia spp. Cattle, sheep and pigsTrichinosis (cyst formation) Trichinella spiralis Pigs
Source: The Merck Veterinary Manual, 9th edn, 2008, Whitehouse Station, NJ, Merck and Co.

Objections to the use of animal products
619
introduction of special control measures to prevent the transmission of BSE from cat-tle to man, and also to eradicate it from domestic animals (see also Chapter 23).
The chief chemical constituents of animal products that are implicated in diseasesof man are fats in general and saturated fatty acids in particular. The diseases withwhich they are associated are those of the circulatory system that are characterisedby damage to the arterial walls (atherogenesis) and the formation of blood clots(thrombogenesis).When arteries are damaged, fibrous plaques containing lipids areformed, and these may break away to form clots. If clots form in the blood vesselsand impede the blood supply to the heart muscle, they cause what is commonlycalled ‘a coronary’ (i.e. coronary heart disease); if they block the vessels supplyingthe brain, they cause stroke; if they block the vessels of the lungs, they cause pul-monary embolism.These conditions are frequently fatal; if the patient survives, he orshe may then be severely disabled. Similar conditions can be caused by the ruptureof damaged blood vessels.
The link between fatty deposits in the circulatory system and dietary fats is thelipid transport system that employs lipoproteins (see Chapter 3 and 9).The lipopro-teins occur in various forms, which are defined by their density (see Table 3.6,p. 48), and the concentrations of these forms in blood are used to assess the risk ofheart attacks and strokes. High-risk factors are high concentrations of low-densitylipoproteins (LDL) and very low-density lipoproteins (VLDL). Conversely, high con-centrations of high-density lipoproteins (HDL) indicate a low risk.A high concentra-tion of blood cholesterol, which is a constituent of lipoproteins, is also regarded as a high-risk indicator. The significance of these indicators is a matter of continuing research and debate. Thus, some authorities consider cholesterol level to be a poorindicator. LDL are now thought to be dangerous when present as small particles, astate characterised by a raised concentration of triacylglycerols.
As mentioned earlier, saturated fatty acids (SFA) of foods are regarded as thecause of a high-risk pattern of blood lipoproteins; octadecanoic (stearic, C18) acidand tetradecanoic (myristic, C14) acid and also all trans acids are considered to bethe most damaging.With increasing consumption of SFA, blood levels of cholesteroland LDL are raised. Conversely, the polyunsaturated fatty acids (PUFA) are judgedto be beneficial, although the various families of PUFA differ in their effects; the n-6 PUFA (which occur mainly in plant lipids) reduce the blood concentration ofLDL, and the n-3 PUFA (from fish lipids) reduce VLDL. It is considered desirable tohave a balance in the diet of n-6 to n-3 PUFA: the recommended maximum ratio is4 : 1. In between the SFA and PUFA are the monounsaturated fatty acids (MUFA),such as octadecenoic (oleic, 18 : 1) acid, which are regarded as neutral or possiblybeneficial to blood lipoproteins.
As the association between lipid consumption and cardiovascular disease hasbeen exposed and explored, many countries have produced nutritional guidelinesthat are intended to encourage people to reduce their intake of fat and especially ofSFA. A common recommendation is that fat should provide no more than 30 percent of total energy intake, and that this fat should be divided equally among SFA,MUFA and PUFA (i.e. each supplying 10 per cent of energy intake).A less extremeproposal is that the ratio of PUFA to SFA (called the P/S ratio) should be 0.5–0.8.
In Britain, fat intake fell over the period 1990–2000 but has since stabilised atabout 38 per cent of energy intake, with a P/S ratio of 0.47, and so further changesare needed to meet the guidelines.The USA and many other affluent countries havesimilar levels of fat consumption.Although consumers can and do reduce their total

Chapter 25 Animal nutrition and the consumers of animal products
620
BOX 25.3 Evidence for the association between dietary lipids and cardiovasculardisease in man
The evidence comes mainly from the analysis of statistics for cardiovascular disease and diet compo-sition obtained either from national populations or from smaller groups within countries. In additionto these retrospective studies, there have also been prospective investigations in which the diet andhealth of selected groups of people have been studied for long periods. Finally, there have been someintervention trials in which the diets of groups of people have been altered – for example, by reduc-ing lipid consumption – and the consequences determined by comparing their health with that ofcontrol groups. Laboratory animals do not provide a satisfactory model for cardiovascular disease;closely controlled experimentation is therefore difficult, although pigs are used in some studies.
A common finding from the retrospective studies has been that communities with a high intake ofSFA (e.g. SFA providing 15–25 per cent of energy intake) have a high incidence of coronary heart dis-ease (CHD). Nevertheless, there are anomalies in the data, the most commonly quoted being thehigher incidence of CHD in Britain than in France despite very similar intakes of lipid and SFA. Acomparison of vegetarians and meat eaters in Britain showed that the former had lower levels of bloodcholesterol (4.88 mmol/l v. 5.31 mmol/l) and were 24 per cent less likely to die from CHD. Over thequarter-century that has passed since dietary fat was first linked to CHD, many developed countrieshave shown a fall in the incidence of CHD. On the other hand, the richer inhabitants of developingcountries, who can afford the fat-rich diets of developed countries, are now experiencing CHD.
intake of fat, they have more difficulty in modifying the proportions in their diet ofthe three main types of fatty acids. Only plant lipids have the 10 : 10 : 10 ratio sug-gested above. The fats of terrestrial animals have a predominance of saturated fattyacids.Thus, in milk fat the ratio SFA : MUFA : PUFA is 8.5 : 3.3 : 0.3, and in meat itis 8.3 : 8.3 : 2.0.
The figures given above demonstrate the difficulty – perhaps even the impossibil-ity – of meeting the guidelines for fat consumption with a diet containing a high pro-portion of animal products. The preferred strategy of those who wish to meet theguidelines seems to be a reduction in intake of animal fat but no reduction in con-sumption of the other constituents of animal products. In other words, people tendto maintain their consumption of meat and milk (and their derivatives), but to selectagainst the fat in these foods. Selection can be exercised by switching from high-fatmeat to that containing less fat in total and less SFA in particular; this is one reasonfor the continuing replacement of beef by chicken. Fat may be trimmed from jointsof meat and replaced as a cooking aid by vegetable oils. Much of the milk consumedin liquid form has its fat content reduced to around 20 g/kg (i.e. half the ‘natural’content); in Britain, fat-reduced milks account for more than 50 per cent of liquidconsumption. Of milk products, butter has to a large extent been replaced by spreadsbased on vegetable oils (although all the milk fat produced in Britain is still con-sumed in some form or another).
Animal nutritionists, in association with animal breeders, have responded to thechallenge of maintaining the acceptability of animal-derived foods by modifying theirlipid constituents.As discussed earlier (see Chapter 14), animals are selected for lean-ness, are fed to give maximal growth of muscle, and are slaughtered when immature(and hence have less fat).With pigs and poultry, it is possible to modify the constitution

Objections to the use of animal products
621
of body fats via their diet; for example, the proportions of n-3 and n-6 PUFA can bechanged. Ruminants tend to deposit saturated fat because the unsaturated lipids oftheir plant diet are hydrogenated in the rumen (see Chapter 8). The fat content ofcow’s milk can be reduced by feeding the cow on an extreme type of diet (typically, adiet low in fibre), but the reduction is achieved only by upsetting the normal metabo-lism of the animal (see Chapter 16).This raises the question of whether it is morally ac-ceptable to disadvantage the animal in order to meet the perceived needs of itsconsumer. Pigs selected to be ultralean have metabolic problems, and all pigs rely onsubcutaneous fat to provide insulation against a cold environment.
For the past 10–15 years there has been much interest in modifying the fattyacid composition of meat and milk fats.There are two objectives, the first of whichis to increase the proportions of the long-chain polyunsaturated fatty acids(PUFA), specifically eicosopentaenoic acid (EPA) and docosohexaenoic (DHA)acid, which are considered to have special benefits to human health.This objectivecan be achieved by increasing the proportion in dietary lipids of alpha linolenicacid (LNA), which is the precursor of EPA and DHA. Changing the diet of rumi-nants from conserved forages and concentrates to fresh forages (e.g. grazed grassesand clovers) increases the intake of LNA and, despite rumen hydrogenation ofPUFA, this increases the proportion of long-chain PUFA in meat and milk fats, andalso lowers the n-6 : n-3 ratio. The second objective is to bring about a more gen-eral increase in PUFA so that the P/S ratio of milk and meat fats is brought closerto the target value of 0.5–0.8 suggested earlier. This is much more difficult toachieve than the first objective because of the larger quantities of PUFA involved.With non-ruminants, some change in the P/S ratio can be achieved by dietary ma-nipulation. With ruminants, however, it is generally necessary to provide specificsupplements of PUFA and to give them in a form that protects them from hydro-genation in the rumen.
The World Cancer Research Fund has conducted a comprehensive review of thecauses of cancer (see Further reading). It concludes that red meats (i.e. beef, lamb andpig meat) increase the risk to consumers of contracting colorectal cancer; red meats arealso associated – although less certainly – with other cancers (e.g. of the lung and pan-creas). The risk is increased if the meat is processed, for example by smoking, or iscooked at very high temperature (which gives rise to carcinogens such as heterocyclicaromatic amines).The review recommends that the average consumption of red meatby a population should not exceed 450 g of fresh meat (300 g when cooked) per per-son per week (i.e. 23 kg fresh meat per year). For an individual consumer, the limitshould be 700 g fresh meat per week (36 kg per year).These figures may be comparedwith the world average consumption of about 25 kg of red meat per head per year, andcontrasted with the average for developed countries of about 55 kg. Figures from thereview suggest that increasing red meat consumption from 25 kg to 55 kg per yearwould increase the risk of colorectal cancer by about 25 per cent. Although theserecommendations come from an authoritative source, the association between meatconsumption and cancer continues to be controversial (see Further reading).
The place of animal fats – and particularly the fats of ruminants – in the diet ofman has been given a new dimension by the discovery that one particular fatty acid,known popularly as conjugated linoleic acid (CLA) or more precisely as cis-9,trans-11 octadecadienoic acid, has a beneficial role in the body. This acid has beenshown to be antiatherogenic and anticarcinogenic, and also to limit obesity and

Chapter 25 Animal nutrition and the consumers of animal products
622
Table 25.7 Current and future demand for meat in the world and selected subunits (kg/head/year)
Meat
World
Developed Developing
China India
Sub-Saharan
countries countries Africa
1993/2020 1993/2020 1993/2020 1993/2020 1993/2020 1993/2020
Beef 9.8/10.7 25.2/25.8 5.2/7.4 2.1/4.4 2.6/4.0 4.1/5.5Pig 13.7/15.8 29.4/29.4 9.0/12.8 24.5/43.1 0.4/0.7 1.2/1.5Sheep and goat 1.8/2.1 2.8/3.2 1.5/1.9 1.2/1.4 0.7/0.8 1.6/1.8Poultry 8.5/10.7 20.3/24.7 5.0/7.7 5.0/10.7 0.5/0.9 1.9/2.4All 33.9/39.3 77.7/83.0 20.8/29.7 32.8/59.6 4.3/6.5 8.8/11.1
Adapted from Rosegrant M W, Leach N and Gerpacio R V 1999 Alternative futures for world cereal and meat consumption.
Proceedings of the Nutrition Society 58: 219–34.
stimulate immune function.The CLA is produced in the rumen as an intermediate inthe bacterial hydrogenation of unsaturated fatty acids present in the diet (hence its al-ternative name of rumenic acid), but it may also be synthesised in animal tissues. It istherefore present in both milk and meat from ruminants. Ruminants given foods thatcontain relatively high concentrations of unsaturated fatty acids, such as young pas-ture herbage, produce fats with particularly high contents of CLA.
25.4 FUTURE TRENDS IN THE CONSUMPTION OF ANIMALPRODUCTS
Despite the arguments advanced against meat consumption – on ethical, environ-mental and health grounds – world demand for all types of meat is predicted toincrease steadily over the next 20 years (Table 25.7). For meat in total, consump-tion per person per year in the developed countries is predicted to continue torise slowly, by 0.2 per cent per year, but for the developing countries the corres-ponding figure is much greater, at 1.6 per cent per year. World demand on anabsolute basis (i.e. allowing for population growth) is predicted to increase morerapidly, by 0.6 per cent per year in developed countries and by 4.1 per cent peryear in developing countries.There are some interesting differences in the projec-tions for individual animal species; for example, the demand for and productionof pig meat in the developed countries is predicted to grow more slowly than thatfor poultry meat.
It is possible that the arguments against the consumption of meat have yet tomake their full impact on consumers. However, it has been calculated that if con-sumers in the developed countries (i.e. those most likely to be influenced by anti-meat arguments) were to reduce their meat consumption by half over the interval1993–2020, then world demand for meat would still increase, by about 1.5 per centper year. Moreover, additional projections show that because of the adverse eco-nomic effects on world agriculture of a reduced demand for meat in the developedcountries, the partial switch from animal to vegetable foods would not increase theworld supply of food per person per day by any significant amount.

Further reading
623
SUMMARY
1. The nutrient requirements of man may becompared with those of domestic animals,exemplified by the dog, pig and sheep.Requirements of growing animals differ con-siderably between species, mainly because ofdifferences in growth rate, but those for adultmaintenance are less discordant.
2. Foods derived from animals provide one-thirdof the protein and one-sixth of the energy sup-plied to the world’s human population. Figuresfor individual countries vary widely, with therichest countries consuming ten times as muchanimal protein per head as the poorest coun-tries. Although wealth is the main determinantof meat and milk consumption, environmentand religion are also important influences.
3. Human beings have no specific need for ani-mal products, but these products are bettersources of some important nutrients (e.g. ironand vitamin B12) than are plant products.
4. Animal products present hazards to consumersfrom food-borne diseases and from the satu-rated fats they contain. The latter problem isbeing reduced by advice to consumers and bymodifying the concentration and constitutionof fats in animal products.
5. Meat consumption, both in total and per headof the world population, is predicted to in-crease over the next 20 years, but by more indeveloping countries than in developed.
QUESTIONS
25.1 Summarise the arguments for and against the consumption of animal productsby man.What are your conclusions?
25.2 What are the major diseases of man that may arise from the consumption ofmeat and milk products?
FURTHER READING
Bradford G E 1999 Contributions of animal agriculture to meeting global human fooddemand. Livestock Production Science 59: 95–112.
Cheeke P R 1993 Impacts of Livestock Production on Society, Diet/Health and the Environ-ment, Danville, IL, Interstate Publishers.
Department for Environment, Food and Rural Affairs 2006 Family Food: Report on the Expen-diture and Food Survey, London, Her Majesty’s Stationery Office.
Food and Agriculture Organisation of the United Nations 2008 Annual Yearbook 2007–08(and other FAO publications: see the FAO website, www.fao.org), Rome, FAO.
Garrow J S, James W P T and Ralph A (eds) 2000 Human Nutrition and Dietetics, 10th edn,Edinburgh, Churchill Livingstone.
Givens D I 2005 The role of animal nutrition in improving the nutritive value of animal-derived foods in relation to chronic disease. Proceedings of the Nutrition Society 64: 1–8.
Kerry J, Kerry J and Ledward D (eds) 2002 Meat Processing: Improving Quality, Cambridge,Woodhead Publishing.
Lichtenstein A H et al. 1998 Dietary fat consumption and health. Nutrition Research Reviews56: S3–19.

Chapter 25 Animal nutrition and the consumers of animal products
624
McAfee A J, McSorley E M, Cuskelly G J, Moss B W, Wallace J M W, Bonham M P and Fearon A M 2010 Red meat consumption: an overview of the risks and benefits. Meat Science 84: 1–13.
Nutrition Society (UK) 1999 Symposium: meat or wheat for the next millenium? Proceedingsof the Nutrition Society 58: 209–75.
Scollan N D, Kim E J, Lee M R F,Whittington F and Richardson R I 2008 Environmental im-pacts on the n-3 content of foods from ruminant animals. In: Givens I, Baxter S, MinihaneA M and Shaw E (eds) Health Benefits of Organic Food: Effects of the Environment,Wallingford, CABI.
World Cancer Research Fund and American Institute for Cancer Research 2007 Food, Nutrition,Physical Activity and the Prevention of Cancer: A Global Perspective, London,WCRF.

625
10.1 DM digestibility � (2.0 � 0.4)�2.0 � 0.800CP intake � 2.0 � 150 � 300 g/dayCP output � 0.4 � 175 � 70 g/dayCP digestibility � (300 � 70)�300 � 0.767
10.2 DM digestibility � (50 � 10)�50 � 0.800The two methods of measuring DM digestibility were in agreement.
10.3 DM intake from soya � 0.3 kg/dayDM intake from cereal � 2.0 � 0.3 � 1.7 kg/dayDM output from soya � 0.3 � (1 � 0.75) � 0.075 kg/dayDM output from cereal � 0.4 � 0.075 � 0.325 kg/dayDM digestibility of cereal � (1.7 � 0.325)�1.7 � 0.809
CP intake from soya � 0.3 � 450 � 135 g/dayCP intake from cereals � 300 � 135 � 165 g/dayCP output from soya � 135 � (1 � 0.85) � 20.3 g/dayCP output from cereal � 70 � 20.3 � 49.7 g/dayCP digestibility of cereal � (165 � 49.7)�165 � 0.699
11.1 DE � GE intake � GE faecesME � GE intake � (GE faeces � GE urine � GE methane)
GE intake � 1.2 � 19.0 � 22.8 MJ/dayDE � 22.8 � 6.0 � 16.8 MJ
� 16.8�1.2 � 14.0 MJ/kg DMME � 22.8 � (6.0 � 1.56 � 1.80) � 13.44
� 13.44�1.2 � 11.20 MJ/kg DM
11.2 Heat production � 16.18VO2 � 5.16VCO2 � 5.90N � 2.42CH4� (16.18 � 536) � (5.16 � 429) � (5.90 � 19)
� (2.42 � 45.8)� 8672 � 2214 � 112 � 111� 10 663 kJ (10.66 MJ)
Energy retention � 13.44 � 10.66� 2.78 MJ
11.3 Protein stored � 10.4 � 6.25 � 65.0 g/dayProtein carbon stored � 65 � 0.512 � 33.28 g/dayFat carbon stored � 182.5 � 33.28 � 149.22 g/dayFat stored � 149.22�0.746 � 200.0 g/dayEnergy stored � (65.0 � 23.6) � (200 � 39.3)
� 9394 kJ/day (9.39 MJ/day)
Appendix 1: Solutions to numerical questions

Appendix 1
626
11.4 ME intake � 8.0 � 11.0 � 88.0 MJ/dayME used for maintenance � 42.0�0.70 � 60.0 MJ/dayME available for gain � 88.0 � 60.0 � 28.0 MJ/daykg � 12.0�28.0 � 0.43
12.1
M�D � 10.55�1.06 � 9.97 MJ/kg DMqm � 9.97�18.4 � 0.54
km � (0.35 * q) � 0.503 � 0.693kg � (0.78 * q) � 0.006 � 0.428
ME maintenance � 3.2�0.693 � 4.62 MJ/dayME available for gain � 10.55 � 4.62 � 5.93 MJ/dayLiveweight gain � 5.93 � 0.428�14.0 � 0.18 kg/day
12.2
M�D � 236.4�19.5 � 12.12 MJ/kg DMqm � 12.12�18.4 � 0.66
Forage DM � [DMI * (MC � M/D)]�(MC � MF)� [19.5 * (13.5 � 12.12)]�(13.5 � 10.8)� 9.97 kg/day
Concentrate DM � 19.5 � 9.97� 9.53 kg/day
Fresh forage � 9.97�0.280� 35.61 kg/day
Fresh concentrate � 9.53�0.860� 11.55 kg/day
12.3 DE � 17.47 � (0.0079 * 160) � (0.0158 * 50) � (0.0331 * 60) � (0.0140 * 150)
� 15.96 MJ/kgDE maintenance � 7.0 MJ/dayDE available for gain � 15.96 � 7.0
� 8.96 MJ/daykp � 0.56kf � 0.74
DMI (kg/day) MEI (MJ/day)
)1.0 Hay 0.80 7.200.3 Concentrate 0.26 3.35
–––– –––––Total 1.06 10.55
NE (MJ/day) k ME (MJ/day)
Maintenance 44.8 0.72 62.2Milk production 108.0 0.62 174.2
––––– –––––Total 152.8 236.4

Appendix 1
627
Mean efficiency (kpf) � (170 * 0.56) � (200 * 0.74)�370� 0.66
Energy retention � 8.96 * 0.66� 5.91 MJ/day
Energy value of gain � (170 * 23.6) � (200 * 39.3)�1000� 11.87 MJ/kg
Liveweight gain � 5.91�11.87� 0.50 kg/day
13.1 19.15 g N per day.
13.2 BV � 0.80.
13.3 Degradability � 0.32 � (0.51 � 0.06)�(0.06 � 0.05) � 0.60 kg/kg.Amountof protein degraded in the rumen � 0.60 � 240 � 144 g/kg DM. ERDP �(0.8 � 0.32) � (0.51 � 0.06)�(0.06 � 0.05) � 0.54 � 240 � 130 g/kg DM.
13.4 MPE supply (g/kg DM) � (10 � 82) � (2 � 271) � (6 � 130) � 2142 g/day.MPN supply (g/kg DM) � (10 � 87) � (2 � 417) � (6 � 83) � 2202 g/day.Diet is limited by MPE, and so MP supply is 2142 g/day.
14.1 Fasting metabolism (F) � 0.53(W�1.08)0.67
� 23.0 MJ/day
Correction for sex � 23.0 * 1.15� 26.4 MJ/day
Activity (A) � 0.0071 * W� 2.1 MJ/day
Metabolisability (qm) � 11.0�18.4� 0.597
km � (0.35 * qm) � 0.503� 0.712
ME maintenance (MEm) � (F � A)�km� (26.4 � 2.1)�0.712� 40.0 MJ/day
EVg � [4.1 � (0.0332 W ) � (0.000009 W2)]�(1 � 0.1475 LWG)� 15.83 MJ/kg
Correction for breed, sex and rate of gain � 15.83 * 0.70 * 1.1� 12.1 MJ/day
kg � 0.78 qm � 0.006� 0.472
ME gain (MEg) � NEg�kg� 12.12�0.472� 25.7 MJ/day
ME total � MEm � MEg� 40.0 � 25.7� 65.7 MJ/day
Basal endogenous nitrogen � 0.35 * W 0.75
� 25.2 g/day
Hair and scurf � 0.018 * W 0.75
� 1.3 g/day
kpm � 1.0
MP maintenance (MPm) � (25.2 � 1.3)�1.0 * 6.25� 165.6 g/day
NPg � 168.07 � (0.16869 * W ) � (0.0001633 W 2) * (1.12 � 0.1223 * LWG)� 130.0 g/kg
Correction for breed, sex and weight gain � 130.0 * 1.20 * 1.1� 172.0 g/day
kpg � 0.59
MP gain (MPg) � NEg�kpg� 172.0�0.59� 291.0 g/day
MP total � MPm � MPg� 165.6 � 291.0� 457.0 g/day
14.2 NE intake � 20.0 MJ/day
NE maintenance � activity � (0.750 W 0.60) * 1.10� 11.44 MJ/day
NE available for gain � 20.0 � 11.44� 8.56 MJ/day
Protein retention (Pt) � 0.120 kg/day
NE retained as protein � 0.120 * 23.6� 2.83 MJ/day
NE retained as fat � 8.56 � 2.83� 5.73 MJ/day
Fat retention (Lt) � 5.73/39.3� 0.146 kg/day
14.3 DE maintenance (DEm) � 0.139 * W� 69.5 MJ/day
DE exercise (DEe) � 69.5 * 0.4� 27.8 MJ/day
DE total � DEm � DEe� 69.5 � 27.8� 97.3 MJ/day
CP maintenance (CPm) � 1.44 * W� 720.0 g/day
CP exercise (CPe) � (MG * W ) � [(SL * 7.8 * W )�0.633]� (0.177 * W ) � [(0.005 * 7.8 * W )�0.633]� 119.3 g/day
Appendix 1
628

CP total � CPm � CPe� 720.0 � 119.3� 839.3 g/day
15.1a From Table 15.2, increasing body condition from 1.0 to 1.5 will result in abody weight at service of approximately 49 kg and an ovulation rate of 1.38.A ewe that remains at condition score 1.5 will have a similar body weight of46 kg but an ovulation rate of only 1.1.
15.1b From Table 15.2, increasing body condition from 2.5 to 3.0 will result in abody weight at service of approximately 61 kg and an ovulation rate of 2.0.A ewe that remains at condition score 3.0 will have a similar body weight of62 kg and a similar ovulation rate of 2.1.
15.2 From Table 15.1, a low compared with a high plane of nutrition will result inan animal that is slightly heavier (316 kg v. 282 kg), larger (119 cm v.110 cm) and lower in fat (7.0 per cent v. 7.4 per cent) but reach puberty 7 months later (16.5 months v. 9.3 months).
15.3 Maintenance � (0.36W 0.75)�0.8 � 0.70 MJ/day. Egg output � 0.375 �
0.8�0.8 � 0.375 MJ/day.Total ME requirement � 1.08 MJ/day.
15.4 Lysine (mg/day) � 9.5 (57 � 0.80) � 60 � 1.8 � 433 � 108 � 541.
16.1 AFRC (1993)Mm � 43.3�0.72 � 60.1 MJ/dayNet energy spared by weight loss � (�0.5 � 25) � 0.84 � 10.5MJ/dayMp� (33(1.509 � 0.0406 � 39) � 10.5)�0.64 � 143 MJ/dayMmp � (60.1 � 143) � 1.043 � 212 MJ/day5% safety margin � 212 � 1.05 � 223 MJ/day
FiM
El � 33(1.509 � 0.0406 � 39) � 102 MJ/dayElwc � 19.3 � (�0.5) � 0.78 � �7.5 MJ/dayW 0.75 � 6250.75 � 125 kgElcorr � (102 � 7.5)�125 � 0.756 MJ/kgW 0.75
Mml � loge [(5.06 � 0.726)�(5.06 � 0.453)]��0.1326 � 1.87 MJ/kgW 0.75
Mml � 1.87 � 125 � 234 MJ/dayA � (0.0013 � 625)�0.72 � 1.13Mreq
FIM � (234 � 1.13 � 10) � 1.02 � 230 MJ/day
16.2 AFRC (1993)
MPm � 2.19 � 6250.75 � 273 g/dayMPd � 0.1125 � 6250.75 � 14.1 g/dayMPl � (33 � 0.95 � 33)�0.68 � 1521 g/dayMPg � �0.5 � 138 � �69 g/dayTotal � 273 � 14.1 � 1521 � 69 � 1739 g/day
Appendix 1
629

FiM
MPm � 4.1 � 6250.5 � 0.3 � 6000.6 � 30 � 20 � 0.5[(1100�0.8) � 1100] � 2.34 � 20 � 625.7
MPl � (33 � 0.95 � 33)�0.68 � 1521 g/dayMPg � �0.5 � 138 � �69 g/dayTotal � 626.1 � 1521 � 69 � 2078 g/day
16.3 Metabolisable energy:Em � 0.226 � (55�1.08)0.75 � 0.0196 � 55 � 5.38 MJ/daykm � 0.35 � 0.55 � 0.503 � 0.70Mm � 5.38�0.70 � 7.7 MJ/daykl � 0.35 � 0.55 � 0.42 � 0.61Ml � (1.21 � 4.6)�0.61 � 9.1 MJ/dayMg � �0.1 � 21�0.61 � �3.4 MJ/dayMp � 9.1 � 3.4 � 5.7 MJ/dayLevel of feeding adjustment � 1 � 0.018 � (Mp�Mm) � 1.013Mmp � (7.7 � 5.7) � 1.013 � 13.6 MJ/dayMP � (2.19 � 550.75) � (1.21 � 72) � (�0.1 � 119) � 20.4 � 140 g/day
16.4 NEm � (0.75 � 2000.60) � 1.1 � 19.8 MJ/dayNEl � 11 � 5.4 � 59.4 MJ/dayNEg � �0.25 � 33.4 � �8.4 MJ/dayNEmp � 19.8 � 59.4 � 8.4 � 70.8 MJ/dayNE (MJ/kg) � 70.8�8.0 � 8.85DEmp � 70.8�0.71 � 99.7 MJ/dayDE (MJ/kg) � 99.7�8 � 12.5
16.5 Maintenance � [(2000.75 � 0.9 � 0.058)�0.82] � 1.05 � 3.6 g/dayLactation � [(11 � 54 � 0.073)�0.82] � 1.05 � 55.5 g/dayIleal digestible lysine (g/day) � 3.6 � 55.5 � 59.1 or 7.4 g/kgLysine (g/day) � 59.1�0.84 � 73.0 or 9.1 g/kg
16.6 DEml � (0.152 � 600) � (15 � 2.09�0.6) � 91.2 � 52.2 � 143 MJ/dayCPml � (1.44 � 600) � (50 � 15) � 864 � 750 � 1614 g/dayLysine (g/day) � (0.043 � 1.44 � 600) � (3.3 � 15) � 37.2 � 49.5 � 86.7Ca (g/day) � [(0.02 � 600) � (1.2 � 15)]�0.5 � (12 � 18)�0.5 � 60P (g/day) � [(0.01 � 600) � (0.75 � 15)]�0.45 � (6 � 11.3)�0.45 � 38.4
17.1 1.01 kg/day; 2.43 kg/day
17.2 66.4 g/kg W0.75, 5.37 kg DM/day, 21.5 kg fresh weight/day
17.3 Milk energy output (El) � 30 � (1.509 � 0.0406) � 94 MJ/day. Total DMintake � 19.3 kg DM/day.
17.4 11 kg DM and 12.9 kg fresh.
Appendix 1
630
631
The data given in these tables have been compiled from a number of sources, a fulllist of which is given at the end of the appendix.Absence of figures does not imply azero but merely indicates that the information was not given in these sources.
COMPOSITION AND NUTRITIVE VALUE, TABLES A2.1 AND A2.2
The composition of a particular food is variable, and figures given in these tablesshould be regarded as representative examples and not constant values. For morecomprehensive data, readers should consult the references.
NUTRIENT ALLOWANCES, TABLES A2.3–A2.13
The scientific feeding of farm animals is based on standards expressed in terms ofeither ‘nutrient requirements’ or ‘nutrient allowances’. These terms are defined inChapter 14.The figures in the tables are mainly nutrient requirements as they do notinclude safety margins. Only the figures for vitamins have safety margins. It has notbeen possible to include every class of farm animal in these tables; only a represen-tative selection is given. For more detailed information, readers should consult therelevant references.
ABBREVIATIONS USED IN THE TABLES
ADF Acid-detergent fibreADIN Acid-detergent insoluble nitrogenAvail. AvailableCF Crude fibreCP Crude proteinD Digestible organic matter in dry matterDE Digestible energydec. DecorticatedDM Dry matterDMI Dry matter intakeDUP Digestible undegradable proteinEE Ether extractERDP Effective rumen-degradable proteinexp. Expellerextr. Extracted
Appendix 2: Notes on tables

Appendix 2
632
FME Fermentable metabolisable energyME Metabolisable energyMP Metabolisable proteinMPB Metabolisable protein derived from digestible undegradable proteinMPE Metabolisable protein derived from energy supply to the rumen plus
MPBMPN Metabolisable protein derived from nitrogen supply to the rumen plus
MPBNDF Neutral-detergent fibreqm Metabolisability of gross energyW Liveweight

Appendix 2
633
Table A2.1.1 Chemical composition of foods
Food Dry matter basis (g/kg)
DM (g/kg) EECF Ash CP NDF ADF ADIN Starch
and
sugar
Green cropsBarley in flower 250 316 16 64 68Cabbage 150 160 47 107 160 244 136 320Clover, red, early-flowering 190 274 37 84 179 272Clover, white, early-flowering 190 232 42 116 237 400 253 84Grass, young (75–80D) 200 130 55 105 156 572 289 1.3Grass, mature (60–65D) 282 200 40 100 100 647 312 0.7Kale 140 179 36 136 157 243 197 2.3 284Lucerne, early–flowering 240 300 17 100 171 442Maize 190 289 26 63 89Rape 140 250 57 93 200Sugar beet tops 160 100 31 212 125Sugarcane 279 312 22 57 97Swede tops 120 125 42 183 192
SilagesBarley, whole crop 324 248 15 153 64 575 274 2.2 267Grass, young 250 270 52 91 186 566 359 1.3Grass, mature 294 340 52 110 125 603 387 0.5Lucerne 250 296 84 100 168 495 406 1.7 16Maize, whole crop 210 233 57 62 110 480 277 2.7 211Potato 270 26 19 52 81
HaysClover, red 850 266 39 84 184 280 2.2Grass, poor-quality 800 380 16 70 55 725 452 1.2Grass, good-quality 900 298 18 82 110 650 364 0.5Lucerne, early-flowering 850 302 13 95 225 493 375 2.1
Dried herbageGrass 929 210 38 102 190 541 282 2.3 148Lucerne 900 247 51 100 220 465 336 2.0 81
StrawsBarley 860 394 21 53 38 811 509 1.0 32Barley, ammoniated 871 450 15 46 70 778 542 2.0 20Bean 860 501 9 53 52 778 542 19Oat 860 394 22 57 34 736 525 0.6 20Oat, ammoniated 843 431 18 66 75 735 522 1.0 16Pea 860 410 19 77 105 412Wheat 860 417 15 71 34 809 502 0.8Wheat, ammoniated 869 434 13 56 68 773 544 1.5 13
continued

Appendix 2
634
Roots and tubersArtichoke, Jerusalem 200 35 10 55 75Cassava 370 43 9 30 35 114 63 692Fodder beet 183 56 3 81 63 136 72 0.9 660Mangels 120 58 8 67 83Potatoes 210 38 5 43 90 73 44 1.6 638Sugar beet pulp, dried 900 203 7 34 99 372 213 1.6 82Sugar beet pulp, dried molassed 876 132 4 88 110 321 179 0.9 300Sugar beet molasses 750 0 0 69 47 632Sugarcane molasses 737 0 4 100 55 657Swedes 120 100 17 58 108 140 125 0.2 587Sweet potatoes 320 38 16 34 39 75 0.2Turnips 90 111 22 78 122 254 70 1.6
Cereals and by-productsBarley 860 53 17 26 115 201 64 0.4 599Barley, brewer’s grains 263 176 77 41 234 618 264 3.9 51Barley, malt culms 900 156 22 80 271 463 163 171Brewer’s yeast, dried 900 2 11 102 443Grain distiller’s grains 250 200 65 40 265 575 320 15.8Grain distiller’s dark grains 890 89 108 46 317 343 216 10 75Malt distiller’s grains 248 199 86 34 211 673 294 23Malt distiller’s dark grains 907 121 67 60 275 420 175 65Maize 860 24 42 13 98 117 28 1.3 717Maize, flaked 900 17 49 10 110 101Maize, gluten feed 900 39 38 28 262 383 114 1.4 210Maize, gluten meal 904 12 29 11 669 55 6.4 158Millet 860 93 44 44 121Oats 860 105 49 33 109 290 149 0.4 482Oats, naked 854 45 97 23 119 114 42 0.5 597Oat husks 900 351 11 42 21Pot ale syrup 483 2 2 95 374 6 36Rice, brown 907 23 9 111Rice, bran (extracted) 905 11 149 166 350 275 1.4 256Rice, polished 860 17 5 9 77Rye 860 26 19 21 124 357Sorghum 860 21 43 27 108 107 57 745Wheat 860 26 19 21 124 124 30 0.4 701Wheat bran 880 114 45 67 170 474 137 259Wheat feed 880 74 45 50 178 364 111 0.4 333Wheat germ meal 889 82 48 279
Table A2.1.1 (cont.)
Food Dry matter basis (g/kg)
DM (g/kg) EECF Ash CP NDF ADF ADIN Starch
and
sugar

Appendix 2
635
Oilseed by-productsCoconut meal 900 153 76 72 220 450 270 2.5Cotton seed meal, undecorticated 900 248 54 66 231 390 260 3.2Cotton seed meal, decorticated 900 87 89 74 457 300 2.0Groundnut meal, undecorticated 900 273 21 47 343Groundnut meal, decorticated 900 88 8 63 552 180 146 2.0Linseed meal 900 102 36 73 404 192 131 2.0 95Palm kernel meal 900 167 10 44 227 693 470 3.0 51Rapeseed meal 899 152 29 80 400 295 206 3.6 147Soya bean meal 900 58 17 62 503 125 91 2.2 124Soya bean meal, full-fat 898 48 222 54 415 122 82 91Sunflower meal, undecorticated 900 323 80 50 297 379 220 2.5Sunflower meal, decorticated 900 134 152 117 430 260 2.0
Leguminous seedsBeans, field 860 80 15 36 275 168 123 0.5 412Gram 860 57 13Peas 860 63 19 32 261 116 76 4.8 497
Animal by-productsBlood meal 870 9 40 919 0Feather meal, hydrolysed 907 5 64 25 892 2Fishmeal, UK-produced 915 69 238 699 0Fishmeal, herring 920 75 122 793 0Fishmeal, South American 900 60 197 733 0Meat meal 900 0 148 42 810 0Meat and bone meal 900 0 50 62 597 0Milk, cow’s whole 128 0 305 55 266 0Milk, skim 100 0 70 80 350 0Milk, whey 66 0 30 106 106 0
Table A2.1.1 (cont.)
Food Dry matter basis (g/kg)
DM (g/kg) EECF Ash CP NDF ADF ADIN Starch
and
sugar

Appendix 2
636
Table A2.1.2 Mineral contents of foods (DM basis)
Food (g/kg) (g/kg) (g/kg) (g/kg) (mg/kg) (mg/kg) (mg/kg) (mg/kg) (mg/kg)
Green cropsGrass, close grazing 5.0 3.5 1.7 1.9 8.0 – – 0.10 0.05Grass, extensive grazing 4.8 2.8 1.7 1.7 7.0 16 5.0 0.08 0.04Kale 21.0 3.2 2.5 2.0 4.5 38 – 0.10 0.05Lucerne, late vegetative 21.9 3.3 2.7 2.1 11.0 41 – 0.17 –Turnip tops 24.2 3.1 2.8 3.1 8.0 – – 0.08 0.06
SilagesCereal, vegetative 4.0 2.7 1.0 1.8 6.0 80 25 0.07 0.06Grass, early 8.0 4.0 3.0 3.0 11.0 90 25 – 0.10Grass, mature 3.0 2.0 0.9 1.0 3.0 94 30 0.05 0.02
HaysClover 15.3 2.5 4.3 1.9 11.0 73 17 0.16 –Grass, poor-quality 2.5 1.5 0.8 1.0 2.0 70 17 0.05 0.01Grass, good-quality 7.0 3.5 2.5 2.5 9.0 100 21 0.20 0.07Lucerne, mature 11.3 1.8 2.7 0.8 14.0 44 24 0.09 –
StrawsBarley 4.5 0.7 0.8 1.1 3.2 84 16 0.04 0.04Oat 4.0 0.7 1.3 3.7 4.0 69 29 0.04 0.02
Roots and tubersCassava, dried 2.0 1.0 – 0.2 – 20 – – –Mangels 2.9 2.1 5.3 9.9 9.4 – – 0.09 0.03Potatoes 1.0 2.1 1.0 0.5 4.5 42 28 0.06 0.03Sugar beet pulp, 5.7 0.8 2.4 2.5 11.0 51 32 0.10 0.02
molassed, driedSwedes 3.6 3.2 1.2 2.6 3.8 21 19 0.07 0.03Turnips 5.0 3.6 1.4 2.2 2.7 35 36 0.04 0.03
Cereals and by-productsBarley 0.5 4.0 1.3 0.2 4.8 18 19 0.04 0.02Brewer’s grains, dried 3.2 7.8 1.8 0.4 25.0 50 – 0.03 –Brewer’s yeast 1.3 15.1 2.5 0.8 35.3 6 42 – –Distiller’s grains, malt 1.7 3.7 1.4 0.9 10.0 – – 0.02 0.02Maize 0.3 2.7 1.1 0.2 2.5 6 16 0.02 0.02Maize gluten meal 1.6 5.0 0.6 1.0 30.0 8 190 0.08 –Millet 0.6 3.1 1.8 0.4 24.4 32 16 0.04 –Oats 0.8 3.7 1.3 0.2 3.6 42 41 0.04 0.03Oat feed 1.5 2.9 1.0 0.2 3.9 – – 0.04 0.03Rice 0.7 3.2 1.5 0.6 3.0 20 17 0.05 –Rye 0.7 3.7 1.4 0.3 8.0 66 36 – –
Pho
sph
oru
s
Mag
nes
ium
Sod
ium
Co
pp
er
Man
gan
ese
Zin
c
Co
bal
t
Sele
niu
m
Cal
ciu
m

Appendix 2
637
Table A2.1.2 (cont.)
Food (g/kg) (g/kg) (g/kg) (g/kg) (mg/kg) (mg/kg) (mg/kg) (mg/kg) (mg/kg)
Sorghum 0.5 3.5 1.9 0.4 10.8 16 15 0.14 –Wheat 0.5 3.5 1.2 0.1 5.0 42 50 0.05 0.02Wheat bran 1.6 13.6 5.0 0.4 12.9 143 189 0.03 0.40Wheat feed 1.1 8.0 3.3 0.4 17.5 – – 0.03 0.04
Oilseeds and by-productsCoconut meal 2.3 6.6 2.8 0.4 20.4 59 – 0.14 –Cotton seed meal, dec. 1.9 12.4 5.0 0.6 16.0 25 79 0.05 –Groundnut meal, dec. 2.9 6.8 1.7 0.8 17.0 29 22 0.12 –Linseed meal 4.1 8.6 5.8 0.7 25.0 42 – 0.55 0.91Soya bean meal 3.5 6.8 3.0 0.4 25.0 32 61 0.20 0.55
Leguminous seedsBeans 1.0 5.5 2.0 0.1 14.0 16 46 0.20 –Peas 1.5 4.4 1.4 0.5 – – 33 – –
Animal by-productsFishmeal 79.0 44.0 3.6 4.5 9.0 21 119 0.14 2.00Meat and bone meal 120 58.0 2.5 7.2 24.0 – – 0.20 0.20Whey, dried 9.2 8.2 1.4 7.0 50.0 6 3 0.13 –
Pho
sph
oru
s
Mag
nes
ium
Sod
ium
Co
pp
er
Man
gan
ese
Zin
c
Co
bal
t
Sele
niu
m
Cal
ciu
m

Appendix 2
638
Tab
le A
2.1.
3A
min
o a
cid
co
mp
osi
tio
n o
f fo
od
s (g
/kg
) (f
resh
bas
is)
Foo
d(g
/kg
)(g
/kg
)
Gre
en c
rops
Dri
ed g
rass
897
23.5
7.6
1.7
7.5
2.9
5.8
10.9
7.1
3.0
7.1
6.1
6.5
1.2
4.8
4.9
Dri
ed lu
cern
e–
35.7
10.9
2.5
10.2
4.7
9.3
16.1
11.7
2.8
10.5
9.0
9.2
1.6
8.2
11.3
Cer
eals
and
by-
prod
ucts
Bar
ley
856
15.6
5.4
2.2
4.1
4.1
3.5
6.9
3.8
2.1
5.0
4.3
3.4
1.0
3.4
5.1
Bre
wer
’s y
east
,dri
ed93
071
.021
.95.
021
.910
.721
.431
.932
.37.
018
.1–
20.6
4.9
14.9
23.2
Dis
tille
r’s
dark
gra
ins
900
39.4
10.1
4.3
10.6
4.5
8.5
15.5
9.6
4.3
8.9
9.3
8.8
2.1
7.5
11.7
Dis
tille
r’s
solu
bles
–42
.93.
82.
412
.94.
08.
013
.06.
83.
47
.76.
46.
03.
68.
512
.8M
aize
852
13.5
4.3
1.9
3.3
2.6
3.0
11.1
2.5
2.3
4.5
4.3
3.2
0.4
3.9
4.3
Mai
ze g
lute
n m
eal
–10
6.2
24.1
12.6
17.4
14.0
28.4
117.
710
.824
.541
.037
.724
.02.
634
.733
.0O
ats
869
16.8
7.0
4.0
5.7
2.3
3.7
7.3
4.5
2.6
5.1
5.7
3.7
0.7
4.1
5.1
Ric
e,po
lishe
d,br
oken
890
13.9
6.2
0.8
6.3
1.7
3.5
5.2
2.4
1.5
3.6
13.6
2.9
1.3
4.1
5.0
(bre
wer
’s r
ice)
Sorg
hum
870
14.1
3.4
1.6
3.5
1.9
4.2
11.8
2.1
1.6
4.2
3.9
2.9
1.0
3.8
5.3
Whe
at85
816
.25.
22.
34.
12.
53.
57
.13.
12.
14.
84.
83.
11.
23.
3 4.
5W
heat
feed
858
22.6
10.2
3.4
7.8
4.0
4.7
9.5
6.4
3.2
6.1
6.5
4.0
2.2
4.6
7.1
Tyrosine
Valine
Arginine
Cystine
Glycine
Histidine
Isoleucine
Leucine
Lysine
Methionine
Phenylalanine
Serine
Threonine
Tryptophan
DM
Nit
rog
en

Appendix 2
639
Oils
eed
by-p
rodu
cts
Cot
ton
seed
mea
l90
066
.245
.96.
417
.011
.013
.3
24.1
17.1
5.2
22.2
–13
.24.
710
.218
.9G
roun
dnut
mea
l89
775
.557
.05.
626
.411
.315
.7
29.9
16.4
5.6
25.1
23.1
13.5
3.0
19.9
20.7
Lup
in s
eed
mea
l–
60.8
42.7
6.2
13.6
8.5
16.5
26.8
17.0
3.0
13.1
17.4
12.1
1.8
18.5
14.6
Rap
esee
d m
eal
899
50.0
23.2
7.6
18.5
9.9
14.2
25.9
21.5
7.9
14.3
16.3
16.8
1.7
11.5
18.6
Soya
bea
n m
eal
861
70.9
35.3
6.0
19.5
12.6
20.3
35
.028
.57.
923
.023
.517
.95.
517
.722
.2Su
nflo
wer
see
d m
eal
–44
.523
.14.
615
.67
.211
.618
.510
.17.
613
.411
.910
.41.
48.
114
.3
Leg
umin
ous
seed
sB
eans
(V
icia
faba
)–
39.8
22.2
3.9
10.5
6.
19.
718
.315
.81.
810
.111
.79.
11.
68.
911
.2Pe
as (
Pis
um s
ativ
um)
–31
.417
.13.
08.
75.
38.
214
.415
.22.
58.
99.
58.
00.
97.
29.
2
Ani
mal
by-
prod
ucts
Fish
mea
l91
810
0.0
40.5
6.7
50.6
14.1
26
.144
.648
.215
.228
.828
.324
.96.
921
.430
.7M
eat
and
bone
mea
l95
773
.332
.42.
770
.67.
711
.626
.122
.06.
514
.616
.014
.32.
19.
619
.6W
hey,
drie
d93
019
.23.
43.
03.
01.
88.
211
.99.
71.
93.
33.
28.
91.
92.
56.
8

Appendix 2
640
Table A2.1.4 Vitamin potency of foods (fresh basis)
Food (x 000 iu/kg) (iu/kg) (mg/kg) (mg/kg) (mg/kg) (mg/kg) (mg/kg) (mg/kg) (mg/kg)
Green cropsGrass, dried 328 150 – 15.5 74 – – – 890Lucerne, dried 267 200 – 16.6 43 – – 0.003 1110
Cereals and by–productsBarley 0.7 20 1.9 1.8 55 8 3.0 – 990Brewer’s yeast, dried – – 91.8 37.0 448 109 42.8 – 3984Maize 5.0 22 3.5 1.0 24 4 7.0 – 620Oats 0.6 20 6.0 1.1 12 – 1.0 – 946Rice – 12 – 0.4 15 – – – 780Rye 0.2 17 3.6 1.6 19 8 2.6 – 419Sorghum 0.7 12 4.0 1.1 41 12 3.2 – 450Wheat 0.4 13 4.5 1.4 48 10 3.4 – 1090Wheat, fine middlings 0.5 20 – 2.2 100 – – – 1110Wheat, coarse middlings 0.4 57 – 2.4 95 – – – 1170
Oilseed by–productsCoconut meal – 16 – 3.3 27 – – – 1110Cotton seed meal 0.3 39 6.4 5.1 38 10 5.3 – 2753
(dec. exp.)Groundnut meal – 3 5.7 11.0 170 53 10.0 – 2396
(dec. extr.)Groundnut meal 0.3 3 7.1 5.2 166 47 10.0 – 1655
(dec. exp.)Linseed meal (extr.) 0.4 – – 3.5 40 – – – 1660Soya bean meal (extr.) – 2 4.5 2.9 29 16 6.0 – 2794
Animal by–productsFishmeal – 8 2.1 6.0 49 10 4.1 0.081 5180Meat meal – 1 0.2 5.5 57 5 3.0 0.068 2077Milk, dried skim 0.3 1 – 21.0 12 – – 0.055 1060
aFor chicks. In the case of plant products, the values for pigs and ruminants are about half those quoted.
Vit
amin
E
Thia
min
Rib
ofl
avin
Nic
oti
nic
aci
d
Pan
toth
enic
aci
d
Vit
amin
B6
Vit
amin
B12
Ch
olin
e
Vit
amin
A p
ote
ncy
a

Appendix 2
641
Tab
le A
2.2.
1N
utr
itiv
e va
lues
of
foo
ds
for
rum
inan
ts a
nd
ho
rses
Foo
dR
um
inan
ts
ME
FME
(MJ/
kg D
M)
(MJ/
kg D
M)
ERD
P (g
/kg
DM
)D
UP
(g/k
g D
M)
Feed
into
Milk
Ho
rses
DE
0.02
a0.
050.
08
0.02
0.05
0.08
MPE
MPN
MPB
(MJ/
kg D
M)
Gre
en c
rops
Bar
ley,
in f
low
er10
.09.
4C
abba
ge10
.89.
2C
love
r,re
d,ea
rly-
flow
erin
g10
.28.
911
516
543
10.6
Clo
ver,
whi
te,e
arly
-flo
wer
ing
9.0
7.5
10.5
Gra
ss,y
oung
(75
–80D
)12
.211
.413
412
211
012
2433
9810
433
11.1
Gra
ss,m
atur
e (6
0–65
D)
10.0
9.3
7666
6018
2632
9.2
Kal
e11
.09.
712
711
811
014
2229
108
109
28L
ucer
ne,e
arly
-flo
wer
ing
8.2
7.6
9012
030
9.7
Mai
ze8.
87.
9R
ape
9.5
7.5
Suga
r be
et t
ops
9.9
8.8
Suga
rcan
e8.
98.
1Sw
ede
tops
9.2
7.7
Sila
ges
Bar
ley,
who
le c
rop
8.7
7.8
4542
404
710
9.5
Gra
ss,y
oung
11.6
9.2
158
149
124
1826
3110
297
339.
6G
rass
,mat
ure
10.0
9.0
106
100
9614
2023
6380
248.
3L
ucer
ne8.
57.
715
014
413
97
2427
8912
541
9.2
Mai
ze,w
hole
cro
p10
.89.
789
8684
47
988
6024
11.5
Pota
to11
.810
.6
Hay
sC
love
r,re
d9.
68.
69.
3G
rass
,poo
r-qu
alit
y7.
06.
336
3029
1014
19
5138
168.
5G
rass
,goo
d-qu
alit
y9.
58.
675
6355
2940
47
6568
329.
9L
ucer
ne,e
arly
-flo
wer
ing
8.2
7.4
173
161
151
3545
5597
130
569.
5
cont
inue
d
Appendix 2
642
Tab
le A
2.2.
1(c
on
t.)
Foo
dR
um
inan
ts
ME
FME
(MJ/
kg D
M)
(MJ/
kg D
M)
ERD
P (g
/kg
DM
)D
UP
(g/k
g D
M)
Feed
into
Milk
Ho
rses
DE
0.02
a0.
050.
08
0.02
0.05
0.08
MPE
MPN
MPB
(MJ/
kg D
M)
Dri
ed h
erba
geG
rass
10.6
9.5
137
116
105
3554
6412
512
963
10.9
Luc
erne
9.1
8.2
178
161
150
2642
52
103
138
679.
5
Stra
ws
Bar
ley
6.5
5.8
2523
216
810
4923
86.
8B
arle
y,am
mon
iate
d7.
57.
050
4846
78
10B
ean
7.4
7.1
Oat
7.0
6.7
2320
186
911
5729
256.
8O
at,a
mm
onia
ted
7.8
7.2
3023
2135
4143
Pea
6.7
6.0
Whe
at6.
15.
823
2018
68
1062
2924
6.8
Whe
at,a
mm
onia
ted
7.4
6.9
4847
469
1111
Roo
ts a
nd t
uber
sA
rtic
hoke
,Jer
usal
em13
.212
.9C
assa
va12
.812
.5Fo
dder
bee
t11
.911
.852
4947
57
999
4010
Man
gels
12.4
12.1
Pota
toes
12.5
12.3
7471
686
811
103
6626
Suga
r be
et p
ulp,
drie
d12
.712
.568
5446
1932
38
104
6934
11.7
Suga
r be
et p
ulp,
drie
d m
olas
sed
12.5
12.4
6752
4610
2938
119
7547
11.9
Suga
r be
et m
olas
ses
12.9
12.9
3737
3710
1010
17.0
Suga
rcan
e m
olas
ses
4444
4411
1111
6530
1617
.0Sw
edes
12.8
12.2
Swee
t po
tato
es12
.712
.1Tu
rnip
s11
.210
.410
096
9211
14
18

Appendix 2
643
Cer
eals
and
by-
prod
ucts
Bar
ley
12.8
12.2
9690
858
1418
9398
3215
.4B
arle
y,br
ewer
’s g
rain
s11
.28.
515
712
610
848
7592
150
188
123
11.7
Bar
ley,
mal
t cu
lms
11.2
10.4
168
212
124
12.0
Bre
wer
’s y
east
,dri
ed11
.711
.3G
rain
dis
tille
r’s
grai
ns14
.710
.918
515
510
835
6110
470
200
21G
rain
dis
tille
r’s
dark
gra
ins
14.8
10.5
204
154
133
5296
115
114
203
60M
alt
dist
iller
’s g
rain
s10
.27.
2M
alt
dist
iller
’s d
ark
grai
ns12
.29.
918
119
312
812
.5M
alt
dist
iller
’s d
ried
sol
uble
s12
.4M
aize
14.2
12.7
4332
2842
5255
104
7743
16.2
Mai
ze,f
lake
d15
.013
.312
882
6816
.2M
aize
,glu
ten
feed
12.7
11.5
228
204
191
2344
5611
415
055
14.2
Mai
ze,g
lute
n m
eal
17.5
16.4
348
233
182
253
355
404
400
508
388
15.1
Mill
et11
.39.
8O
ats
12.0
10.3
8685
8418
1920
8868
4113
.7O
ats,
nake
d14
.811
.795
9492
1920
2214
.4O
at h
usks
4.9
4.5
4734
246.
4Po
t al
e sy
rup
15.4
15.3
106
229
27R
ice,
brow
n15
.9R
ice,
bran
(ex
trac
ted)
11.0
7.9
101
9185
5059
6584
121
6014
.0R
ice,
polis
hed
15.0
14.8
Rye
14.0
13.3
111
7119
16.1
Sorg
hum
13.4
11.9
118
8863
15.7
Whe
at13
.612
.910
410
097
1619
2210
670
2516
.0W
heat
bra
n10
.18.
510
212
349
13.5
Whe
at fe
ed12
.010
.413
511
710
536
5263
142
139
6714
.2W
heat
ger
m m
eal
Oils
eed
by-p
rodu
cts
Coc
onut
mea
l12
.710
.013
492
7563
101
117
Cot
ton
seed
mea
l,un
deco
rtic
ated
8.5
6.6
191
273
150
Cot
ton
seed
mea
l,de
cort
icat
ed12
.39.
234
326
522
459
125
165
156
301
121
12.5
Gro
undn
ut m
eal,
unde
cort
icat
ed9.
28.
5G
roun
dnut
mea
l,de
cort
icat
ed13
.711
.344
737
032
046
127
169
110
347
9013
.9L
inse
ed m
eal
11.9
8.9
323
283
259
6198
120
198
294
153
11.9
cont
inue
d

Tab
le A
2.2.
1(c
on
t.)
Foo
dR
um
inan
ts
ME
FME
(MJ/
kg D
M)
(MJ/
kg D
M)
ERD
P (g
/kg
DM
)D
UP
(g/k
g D
M)
Feed
into
Milk
Ho
rses
DE
0.02
a0.
050.
08
0.02
0.05
0.08
MPE
MPN
MPB
(MJ/
kg D
M)
Palm
ker
nel m
eal
11.6
8.7
161
118
9828
5767
13
514
593
Rap
esee
d m
eal
12.0
11.0
332
296
268
4173
9913
626
484
13.0
Soya
bea
n m
eal
13.3
12.7
433
342
287
7014
719
424
036
819
414
.6So
ya b
ean
mea
l,fu
ll-fa
t15
.57.
7Su
nflo
wer
mea
l,un
deco
rtic
ated
9.5
6.7
258
232
211
2145
6311
524
476
Sunf
low
er m
eal,
deco
rtic
ated
10.4
10.0
374
335
305
2754
7413
529
298
10.1
Leg
umin
ous
seed
sB
eans
,fie
ld13
.413
.022
820
919
539
5769
154
220
108
Gra
m12
.412
.0Pe
as13
.813
.321
119
117
712
3042
132
180
6214
.4
Ani
mal
by-
prod
ucts
Blo
od m
eal
12.8
12.5
Feat
her
mea
l,hy
drol
ysed
12.5
10.3
Fish
mea
l,U
K-p
rodu
ced
14.6
12.2
447
350
308
182
350
391
432
561
409
17.0
Fish
mea
l,he
rrin
g17
.815
.250
839
734
920
639
7 44
417
.0Fi
shm
eal,
Sout
h A
mer
ican
14.6
12.5
469
367
323
191
367
410
17.0
Mea
t m
eal
16.3
11.1
Mea
t m
eal,
low
-fat
Mea
t an
d bo
ne m
eal
9.7
8.0
Milk
,cow
’s w
hole
20.2
9.5
Milk
,ski
m15
.312
.916
.9M
ilk,w
hey
14.5
13.5
17.0
aR
um
en o
utf
low
rat
e.
Appendix 2
644

Appendix 2
645
Tab
le A
2.2.
2C
om
po
siti
on
of
ing
red
ien
ts c
om
mo
nly
use
d in
th
e d
iet
of
pig
s (M
J o
r g
/kg
at
the
dry
mat
ter
giv
en)
(BSA
S, 2
003)
Foo
dD
M (
g/k
g)
NE
gro
win
g p
igs
NE
pre
gn
ant
sow
sD
iges
tib
le
Stan
dar
dis
ed il
eal d
iges
tib
le a
min
o a
cid
(g
/kg
)
and
lact
atin
g(M
J/kg
) p
ho
sph
oru
s (g
/kg
)Ly
sin
eM
eth
ion
ine
�Th
reo
nin
eTr
ypto
ph
an
sow
s (M
J/kg
)cy
stei
ne
Bar
ley
870
9.6
9.8
1.1
2.8
3.3
2.5
1.0
Whe
at87
010
.510
.71.
22.
53.
62.
61.
1M
aize
870
11.1
11.3
0.7
1.8
2.9
2.3
0.4
Oat
s87
08.
08.
41.
33.
03.
72.
31.
0W
heat
feed
880
7.7
8.1
2.6
4.6
4.4
3.6
1.7
Mai
ze g
lute
n fe
ed88
07.
07.
71.
84.
05.
54.
70.
9Su
gar
beet
pul
p89
06.
67.
10.
42.
91.
01.
00.
3Pe
as86
09.
79.
91.
812
.53.
75.
91.
4B
eans
860
8.6
8.8
1.8
12.8
3.7
6.9
1.6
Sunf
low
er m
eal
890
5.4
6.0
1.8
9.6
11.5
9.8
3.5
Rap
esee
d m
eal
900
6.5
6.9
3.5
14.0
12.8
11.0
3.4
Soya
bea
n m
eal (
44)*
875
8.1
8.6
2.1
24.0
11.3
14.5
5.2
HiP
ro s
oya
mea
l (48
)*87
58.
48.
82.
126
.612
.516
.35.
7Fu
ll-fa
t so
ya88
011
.411
.81.
918
.98.
911
.93.
7Fi
shm
eal
920
10.0
10.0
15.0
50.0
23.4
27.0
6.5
Dri
ed s
kim
med
milk
950
11.1
11.1
9.0
26.2
11.4
14.0
4.4
Dri
ed w
hey
950
11.5
11.5
5.0
8.1
3.5
5.7
1.4
* 44 a
nd
48%
cru
de
pro
tein

Appendix 2
646
Tab
le A
2.2.
3M
etab
olis
able
en
erg
y (M
J/kg
), a
vaila
ble
ph
osp
ho
rus
(g/k
g)
and
sta
nd
ard
ised
ilea
l dig
esti
ble
am
ino
aci
ds
(g/k
g)
in c
om
mo
nin
gre
die
nts
use
d f
or
po
ult
ry
ME
P av
ail.
Lysi
ne
Met
hio
nin
eC
ysti
ne
Thre
on
ine
Tryp
top
han
Arg
inin
eIs
ole
uci
ne
Val
ine
Alfa
lfa m
eal (
dehy
drat
ed)
6.2
2.3
4.3
2.0
0.7
5.3
3.4
6.5
6.5
7.8
Bar
ley
11.4
1.5
4.7
1.6
2.2
3.1
1.2
4.3
3.8
5.3
Can
ola
mea
l8.
93.
018
.45.
93.
612
.53.
520
.011
.915
.3C
anol
a oi
l36
.9–
––
––
––
––
Mai
ze14
.20.
92.
21.
71.
62.
50.
63.
72.
83.
9M
aize
dis
tille
r’s
dark
gra
ins
11.6
4.8
5.5
4.3
4.2
6.9
1.7
7.0
8.0
10.5
Mai
ze g
lute
n fe
ed7.
32.
24.
34.
33.
46.
80.
98.
84.
98.
7M
aize
glu
ten
mea
l15
.61.
87.
616
.78.
615
.82.
016
.319
.823
.0C
otto
n se
ed m
eal (
exp.
)8.
83.
29.
94.
04.
48.
84.
038
.19.
313
.6C
otto
n se
ed m
eal (
solv
.)8.
53.
211
.13.
74.
69.
14.
241
.09.
413
.5A
nim
al fa
t33
.2–
––
––
––
––
Fish
mea
l (m
enha
den)
12.4
30.0
40.4
14.6
3.6
22.0
3.9
29.9
20.4
23.2
Fish
mea
l (an
chov
y)11
.828
.542
.116
.34.
321
.65.
927
.725
.528
.2L
inse
ed (
who
le)
16.6
–8.
32.
83.
47.
02.
018
.98.
410
.1L
inse
ed (
exp.
)6.
5–
9.6
3.9
4.1
––
24.7
14.6
12.5
Lin
seed
(so
lv.)
5.9
–9.
63.
94.
2–
–25
.715
.513
.3M
eat
and
bone
mea
l 7.
147
.021
.15.
71.
913
.42.
028
.114
.318
.7M
olas
ses,
cane
8.3
––
––
––
––
–O
ats
10.7
1.4
3.5
1.7
1.8
2.4
1.4
7.5
4.7
5.5
Pean
ut m
eal (
ext.
)9.
21.
811
.83.
55.
411
.94.
042
.816
.023
.1R
apes
eed
mea
l7.
43.
017
.05.
64.
211
.73.
717
.711
.114
.3R
ice
12.3
0.9
1.9
1.2
0.7
2.2
1.0
5.4
2.8
3.9
Ric
e br
an8.
52.
43.
71.
30.
72.
80.
83.
92.
94.
5R
ye11
.41.
03.
21.
31.
72.
81.
14.
24.
35.
0Sa
fflo
wer
mea
l (so
lv.)
6.3
2.3
5.7
2.8
2.7
3.7
2.1
16.0
2.2
8.1
Sesa
me
mea
l (ex
p.)
9.5
2.4
11.2
12.4
5.0
13.5
6.9
42.5
19.8
22.3
Sorg
hum
13.9
1.0
2.4
0.9
1.6
2.2
0.8
3.5
5.4
4.6
Soya
bea
n m
eal (
42%
: exp
.)10
.22.
024
.55.
45.
114
.35.
129
.225
.519
.6So
ya b
ean
mea
l (44
%: s
olv.
)9.
42.
026
.15.
95.
514
.55.
331
.622
.321
.1So
ya b
ean
mea
l (46
%: s
olv.
)10
.42.
127
.26.
45.
817
.06.
233
.523
.123
.8So
ya o
il36
.9–
––
––
––
––
Soya
bea
n,fu
ll-fa
t (c
ooke
d)14
.02.
020
.94.
84.
313
.94.
525
.218
.717
.2Su
nflo
wer
mea
l (ex
p.)
9.7
2.5
17.4
14.7
6.4
13.1
5.2
34.9
21.4
20.9
Sunf
low
er m
eal (
solv
.)7.
42.
514
.813
.85.
612
.34.
432
.618
.720
.0W
heat
bra
n5.
53.
84.
41.
62.
23.
62.
58.
84.
75.
4W
heat
mid
dlin
gs8.
82.
85.
61.
01.
43.
71.
68.
05.
76.
2W
heat
har
d13
.31.
23.
42.
32.
73.
01.
55.
16.
56.
2W
heat
,sof
t13
.51.
12.
61.
31.
82.
21.
03.
44.
04.
3

Appendix 2
647
Table A2.3 Feeding standards for lactating and pregnant cattle based on FiM3.1 Daily requirements of cows producing milk of 38 g fat and 34 g protein/kg and weighing 650 kg
Milk yield (kg/day) 15 25 35 45 Days pregnant
Liveweight change (kg/day) �0.6 �0.2 �0.3 �0.6 225 270
qm 0.59 0.62 0.64 0.66 0.44 0.63DMI (kg) 14.9 17.7 20.2 23.6 11.0 9.6ME (MJ) 166 205 245 293 90 113MP (g) 1 341 1 758 2 205 2 727 398 504Ca (g) 101 118 141 168 34 45P (g) 57 74 93 115 25 27Mg (g) 28 36 45 54 16 16Na (g) 15 21 27 34 5 7Vitamin A (iu) 60 000 71 000 81 000 94 000 41 000Vitamin D (iu) 11 000 13 000 15 000 18 000 7 700Vitamin E (iu) 328 389 445 519 230
3.2 Daily requirements of cows producing milk of 52 g fat and 42 g protein/kg and weighing 450 kg
Milk yield (kg/day) 10 20 30 Days pregnant
Liveweight change (kg/day) �0.4 �0.1 �0.4 225 270
qm 0.60 0.60 0.65 0.45 0.63DMI (kg) 11.1 15.9 18.8 8.1 7.7ME (MJ) 125 177 230 69 92MP (g) 1 057 1 703 2 246 289 441Ca (g) 69 89 113 27 38P (g) 40 62 82 20 23Mg (g) 19 28 37 12 12Na (g) 10 16 22 4 6Vitamin A (iu) 45 000 64 000 75 000 32 000Vitamin D (iu) 8 000 12 000 14 000 6 000Vitamin E (iu) 244 349 414 175

Appendix 2
648
Table A2.4 Feeding standards for growing cattle4.1 Daily requirements of cattle of 200 kg liveweight
Categorya Component Liveweight gain (kg/day)bDM intakeb
0 0.5 0.75 1.0 1.25 (kg/day)
Heifers of ME (MJ) 27/26 44/40 56/50 –/62 –/78 5.0/6.5 small-sized breeds MP (g) 122 224 270 313 377
Castrate males ME (MJ) 27/26 40/37 49/45 –/54 –/65 5.0/6.5of medium-sized MP (g) 122 249 306 361 411breeds
Bulls of ME (MJ) 31/30 40/37 45/42 52/47 –/54 5.0/6.5large-sized breeds MP (g) 122 274 343 408 469
All breeds Ca (g) 4 16 22 28 32P (g) 5 15 20 25 27Mg (g) 3.5 4.8 5.4 6.0 6.6Na (g) 1.5 2.3 2.7 3.1 3.5Vitamin A (iu) 14 000Vitamin D (iu) 1 200Vitamin E (iu) 115
4.2 Daily requirements of cattle of 400 kg liveweight
Categorya Component Liveweight gain (kg/day)bDM intakeb
0 0.5 0.75 1.0 1.25 (kg/day)
Heifers of ME (MJ) 44/42 70/64 88/79 –/97 –/120 8.5/11.0small-sized breeds MP (g) 206 297 338 377 413
Castrate males of ME (MJ) 44/42 64/59 79/71 95/84 –/100 8.5/11.0medium-sized MP (g) 206 319 371 420 465breeds
Bulls of ME (MJ) 50/48 64/60 72/67 82/75 94/86 8.5/11.0large-sized breeds MP (g) 206 342 404 463 517
All breeds Ca (g) 8 19 25 31 34P (g) 9 19 24 31 31Mg (g) 7.1 8.3 8.9 9.5 10.1Na (g) 2.6 3.8 4.2 4.6 5.0Vitamin A (iu) 28 000Vitamin D (iu) 2 400Vitamin E (iu) 195
aCategories: there is a range of nine categories of growing cattle (combinations of three breed sizes and three sexes). Of the threecategories illustrated in this table, castrates of medium-sized breeds are the median category, and the other two are the extremesof the range.bWhere two values separated by a solidus (/) are given, the first is for diets with metabolisability (qm) of 0.55 and the second fordiets with qm of 0.65. A blank before the solidus indicates that the performance level is unlikely to be achieved with a diet of lowermetabolisability.

Appendix 2
649
Table A2.5 Feeding standards for pregnant ewes5.1 Daily requirements of ewes assuming zero weight change
Ewe Component Days from conception
weight Single lamb Twin lambs
(kg) 98 112 126 140 98 112 126 140
55 DMI (kg) 1.2 1.2 1.2 1.1 1.3 1.3 1.3 1.2ME (MJ) 7.9 8.8 9.9 11.3 8.9 10.2 12.0 14.4a
MP (g) 72 76 82 89 77 84 93 104Ca (g) 3.1 3.8 4.5 5.1 3.9 5.0 6.2 7.2P (g) 2.7 2.9 3.0 3.0 3.2 3.5 3.8 3.8Mg (g) 1.0 1.0 1.3 1.3 1.0 1.0 1.5 1.5Na (g) 1.8 1.8Vitamin A (iu) 5500 5500Vitamin D (iu) 550 550Vitamin E (iu) 40 45
75 DMI (kg) 1.5 1.5 1.5 1.4 1.6 1.6 1.6 1.5ME (MJ) 10.1 11.1 12.5 14.3 11.3 12.9 15.2 18.2a
MP (g) 86 91 98 106 92 100 111 126Ca (g) 3.8 4.6 5.6 6.3 4.7 6.0 7.6 8.9P (g) 3.4 3.6 3.8 3.8 4.0 4.4 4.7 4.8Mg (g) 1.3 1.3 1.7 1.7 1.3 1.3 2.0 2.0Na (g) 2.5 2.5Vitamin A (iu) 7500 7500Vitamin D (iu) 750 750Vitamin E (iu) 55 60
aThese energy levels are not attainable, owing to inadequate DMI.

Appendix 2
650
Table A2.5 (cont.)5.2 Daily requirements of 55 kg pregnant ewes losing 50 g liveweight/day and 75 kg ewes losing 75 gliveweight/day
Ewe Component Days from conception
weight Single lamb Twin lambs
(kg) 98 112 126 140 98 112 126 140
55 DMI (kg) 1.2 1.2 1.2 1.1 1.3 1.3 1.3 1.2ME (MJ) 6.0 6.8 7.9 9.3 6.9 8.2 10.0 12.3MP (g) 66 70 76 83 71 78 87 98Ca (g) 3.1 3.8 4.5 5.1 3.9 5.0 6.2 7.2P (g) 2.7 2.9 3.0 3.0 3.2 3.5 3.8 3.8Mg (g) 1.0 1.0 1.3 1.3 1.0 1.0 1.5 1.5Na (g) 1.8 1.8Vitamin A (iu) 5500 5500Vitamin D (iu) 550 550Vitamin E (iu) 40 45
75 DMI (kg) 1.5 1.5 1.5 1.4 1.6 1.6 1.6 1.5ME (MJ) 7.1 8.1 9.4 11.2 8.2 9.9 12.2 15.1MP (g) 77 82 89 98 83 91 102 117Ca (g) 3.8 4.6 5.6 6.3 4.7 6.0 7.6 8.9P (g) 3.4 3.6 3.8 3.8 4.0 4.4 4.7 4.8Mg (g) 1.3 1.3 1.7 1.7 1.3 1.3 2.0 2.0Na (g) 2.5 2.5Vitamin A (iu) 7500 7500Vitamin D (iu) 750 750Vitamin E (iu) 55 60

Appendix 2
651
Table A2.6 Feeding standards for lactating ewes6.1 Daily requirements of lactating ewes kept outdoors and assuming zeroweight change. qm � 0.625
Ewe Component Week of lactation
weight Single lamb Twin lambs
(kg) 1–4 5–8 9–12 1–4 5–8 9–12
55 DMI (kg) 1.5 1.7 1.6 1.6 1.8 1.7ME (MJ) 16.7 15.8 13.2 22.0a 20.0 16.0MP (g) 154 145 120 204 184 146Ca (g) 6.1 5.9 4.8 8.4 7.8 6.0P (g) 5.4 5.5 4.6 7.2 6.9 5.6Mg (g) 2.2 2.1 1.7 2.9 2.6 2.1Na (g) 2.1 2.0 1.9 2.4 2.3 2.0 Vitamin A (iu) 5500 5500Vitamin D (iu) 550 550Vitamin E (iu) 40 45
75 DMI (kg) 1.9 2.2 2.0 2.0 2.3 2.1ME (MJ) 23.8a 22.3 17.7 30.9a 26.3 20.4MP (g) 223 209 164 289 246 191Ca (g) 9.0 8.8 6.7 12.0 10.5 7.9P(g) 8.0 8.1 6.4 10.2 9.4 7.4Mg (g) 3.3 3.1 2.5 4.2 3.6 2.9Na (g) 3.0 2.9 2.6 3.4 3.1 2.8 Vitamin A (iu) 7500 7500Vitamin D (iu) 750 750Vitamin E (iu) 55 60
aThese energy levels are not attainable owing to inadequate DMI.

Table A2.6 (cont.)6.2 Daily requirements of 55 kg lactating ewes kept outdoors and losing 50 gliveweight/day and 75 kg ewes losing 75 g liveweight/day (qm � 0.625)
Ewe Component Week of lactation
weight Single lamb Twin lambs
(kg) 1–4 5–8 9–12 1–4 5–8 9–12
55 DMI (kg) 1.5 1.7 1.6 1.6 1.8 1.7ME (MJ) 14.9 14.0 11.5 20.2a 18.1 14.2MP (g) 148 139 114 198 179 140 Ca (g) 6.1 5.9 4.8 8.4 7.8 6.0P (g) 5.4 5.5 4.6 7.2 6.9 5.6Mg (g) 2.2 2.1 1.7 2.9 2.6 2.1Na (g) 2.1 2.0 1.9 2.4 2.3 2.0 Vitamin A (iu) 5500 5500Vitamin D (iu) 550 550Vitamin E (iu) 40 45
75 DMI (kg) 1.9 2.2 2.0 2.0 2.3 2.1ME (MJ) 21.1 19.6 15.0 28.1a 23.5 17.7MP (g) 214 200 155 280 237 182 Ca (g) 9.0 8.8 6.7 12.0 10.5 7.9P (g) 8.0 8.1 6.4 10.2 9.4 7.4Mg (g) 3.3 3.1 2.5 4.2 3.6 2.9Na (g) 3.0 2.9 2.6 3.4 3.1 2.8 Vitamin A (iu) 7500 7500Vitamin D (iu) 750 750Vitamin E (iu) 55 60
aThese energy levels are not attainable owing to inadequate DMI.
Appendix 2
652

Appendix 2
653
Table A2.7 Feeding standards for growing lambs7.1 Daily requirements of lambs of 20 kg liveweight
Category Component Liveweight gain (g/day)aDM intakea
0 50 100 150 (kg/day)
Females ME (MJ) 3.4/3.2 4.5/4.2 5.8/5.3 –/6.5 0.46/0.56MP (g) 21b 45 58 71
Castrate males ME (MJ) 3.4/3.2 4.5/4.2 5.7/5.2 –/6.2 0.46/0.56MP (g) 21b 47 61 76
Males ME (MJ) 3.9/3.7 4.8/4.5 5.8/5.4 –/6.4 0.46/0.56MP (g) 21b 47 61 76
All sexes Ca (g) 0.7 1.6 2.5 3.4P (g) 0.5 1.0 2.0 3.0Mg (g) 0.38 0.50 0.61 0.72Na (g) 0.57 0.63 0.69 0.75Vitamin A (iu) 660Vitamin D (iu) 120Vitamin E (iu) 21
aWhere two values separated by a solidus (/) are given, the first is for diets with a metabolisability (qm) of0.55 and the second for diets with qm of 0.65. A blank before the solidus indicates that the performancelevel is unlikely to be achieved with a diet of lower metabolisability.bThis basal requirement for maintenance does not include an allowance of protein for wool growth.If lambs were kept at a maintenance level, they would continue to grow wool and would need anadditional 11 g/day of MP for this purpose.
7.2 Daily requirements of lambs of 35 kg liveweight
Category Component Liveweight gain (g/day)aDM intakea
0 50 100 150 (kg/day)
Females ME (MJ) 5.2/5.0 7.0/6.5 9.1/8.2 –/10.2 0.77/0.92MP (g) 31b 54 65 77
Castrate males ME (MJ) 5.2/5.0 6.8/6.3 8.5/7.8 –/9.5 0.77/0.92MP (g) 31b 56 70 83
Males ME (MJ) 6.0/5.7 7.4/6.9 9.0/8.3 –/9.8 0.77/0.92MP (g) 31b 56 70 83
All sexes Ca (g) 0.9 1.7 2.5 3.4P (g) 0.9 1.6 2.4 3.5Mg (g) 0.62 0.74 0.85 1.00Na (g) 0.99 1.05 1.10 1.15Vitamin A (iu) 1200Vitamin D (iu) 210Vitamin E (iu) 25
a,bSee Table 7.1.

Table A2.8 Dietary allowances (mg/kg DM) of trace elements for ruminants
Cattle Sheep
Copper Pre-ruminant calf 2 Pre-ruminant lamb 1Others 12 Growing lambs 3
Others 6Iron Before weaning 30 All classes 30
After weaning 40>150 kg liveweight 30Pregnant and lactating 40
Iodine Winter 0.5 Winter 0.5Summer 0.15 Summer 0.15Presence of goitrogens 2.00 Presence of goitrogens 2.00
Cobalt All classes 0.3 All classes 0.3Selenium Dairy cows 0.3 All classes 0.10
Others 0.10Zinc All classes 40 All classes 40Manganese All classes 40 All classes 40
Table A2.9.1 Typical net energy and standardised ileal digestible (SID) amino acidcontent of pig diets (MJ or g/kg air dry food) (BSAS, 2003)
Growing pigsa
Component 30–60 kg 60–90 kg Pregnant sowsb Lactating sowsc
Food (kg/day) 1.39–2.18 2.18–2.62 2.8 8.0Net energy (MJ/kg) 9.3 9.0 9.4d 9.0SID (g/kg)Lysine 8.1 7.1 4.0 7.4Methionine 2.4 2.1 1.5 2.2Methionine + cystine 4.8 4.2 2.6 4.1Threonine 5.3 4.6 2.8 4.9Tryptophan 1.5 1.3 0.8 1.3
aIntermediate-type pig.b225 kg gaining 37.5 kg in pregnancy.c225 kg, milk yield 11kg/day.dPregnancy food intake controlled to manage body gain. Diets of lower density may be justified ongrounds of gut health and pig welfare.
Appendix 2
654

Appendix 2
655
Table A2.9.2 Typical mineral, trace element and vitamin content of pig diets (g, mg or iu/kg air dry food)a (BSAS, 2003)
Component Growing pigsb Pregnant sows Lactating sows
30–60 kg 60–90 kg
Calcium (g/kg) 7.2 6.8 7.2 8.0Digestible phosphorus 2.5 2.4 2.3 3.2Sodium 1.7 1.7 1.7 2.0Chloride 1.6 1.5 1.4 1.8Magnesium 0.4 0.4 0.4 0.4
Zinc (mg/kg) 100 80 80 80Manganese 30 25 20 20Iron 80 80 80 80Cobalt 0.2 0.2 0.2 0.2Iodine 0.2 0.2 0.2 0.2Selenium 0.2 0.2 0.2 0.25Copper 6 6 6 6
Vitamin A (iu/kg) 4000 4000 8500 8500Vitamin D 800 600 800 1000Vitamin E 50 50 50 50Vitamin K (mg/kg) 2 1 1.5 1.5Thiamin 2 2 2 2Riboflavin 3 2 5 5Nicotinic acid 20 20 20 20Pantothenic acid 10 10 15 15Pyridoxine 2 2 3 3Cyanocobalamin 0.03 0.02 0.03 0.03Biotin 0.1 0.05 0.2 0.2Folic acid 0.5 0.5 3 3Choline 100 50 300 300
aTrace element and vitamin content assumes a net energy value of 9.4 MJ/kg.bIntermediate-type pig.

Appendix 2
656
Table A2.10 Typical dietary nutrient levels for poultry (fresh basis)10.1 Chickens
Growing chicks Pullets
0–3 7–12 12–18 Laying Breeding Broiler Broiler Broiler
weeks weeks weeks hens hens starter grower finisher
ME (MJ/kg) 12.0 11.9 11.7 11.8 11.7 12.7 13.2 13.4Crude protein (g/kg) 200 175 162 183 145–155 220–250 210–230 190–230
Digestible amino acids (g/kg)b
Arginine 10.6 8.6 7.3 9.8 6.2 13.1 11.4 10.2Isoleucine 6.9 5.9 5.2 7.2 6.2 8.5 7.5 6.7Lysine 9.9 8.0 6.7 9.1 5.8 12.7 11.0 9.7Methionine 4.5 3.8 3.2 4.5 2.8 4.7 4.2 3.8Methionine + cystine 7.5 6.5 6.0 7.7 5.2 9.4 8.4 7.6Threonine 6.3 5.4 4.6 6.4 4.2 8.3 7.3 6.5Tryptophan 1.8 1.7 1.4 1.9 1.3 2.0 1.8 1.6Valine 7.1 6.2 5.6 8.2 4.9 9.5 8.4 7.5
Major minerals (g/kg)Calcium 10 10 14 43 30 10.5 9.0 8.5Phosphorus (average) 4.5 4.3 4.5 4.7 3.5 5 4.5 4.2Magnesium – – – – – 3.0 2.5 2.5Sodium 1.8 1.7 1.8 1.9 2.0 2.0 2.0 1.8Potassium – – – – 7.5 7 6.5 6.5
Trace minerals (mg/kg; supplementary levels)Copper 11.0 11.0 11.0 5.5 10 16 16 16Iodine 1.7 1.7 1.7 1.7 2.0 1.25 1.25 1.25Iron 55 55 55 55 50 40 40 40Manganese 88 88 88 88 120 120 120 120Zinc 88 88 88 88 100 100 100 100Selenium 0.3 0.3 0.3 0.3 0.3 0.3 0.3 0.3
Vitamins (iu/kg; supplementary levels)a
A 9 900 9 900 9 900 8 800 12 000 12 000 10 000 10 000D3 3 300 3 300 3 300 3 300 3 500 5 000 5 000 4 000E 22.1 22.1 22.1 16.5 100 75 50 50
Vitamins (mg/kg; supplementary levels)a
K 3.3 3.3 3.3 2.2 5 3 3 2Thiamin 2.2 2.2 2.2 1.7 3 3 2 2Riboflavin 6.6 6.6 6.6 5.5 12 8 6 5Nicotinic acid – – – – 50 55 55 35Pantothenic acid 11 11 11 6.6 13 13 13 13Choline 110 110 110 110 1 000 1 600 1 500 1 400B12 0.022 0.022 0.022 0.022 0.03 0.016 0.016 0.010
aSupplementary trace minerals and vitamins levels required differ according to whether the basal diet is wheat or maize.bFor broilers = true whole tract digestibility and for laying hens = standardised ileal digestibility.

Appendix 2
657
Table A2.10 (cont.)10.2 Turkeys
Growing chicks Breeding
0–4 weeks 9–12 weeks 17–20 weeks turkeys
ME (MJ/kg) 11.8 12.2 12.4 11.9Crude protein (g/kg) 160–175
Digestible amino acids (g/kg)Arginine 18.2 13.2 8.9 8.3Lysine 16.6 12 8.2 7.9Methionine 5.9 4.9 3.8 3.9Methionine + cystine 11.0 9 6.9 6.4Threonine 10.3 7.3 5.0 5Tryptophan 2.7 2.0 1.4 1.8
Major minerals (g/kg)Calcium 13.5 11.5 8.2 27Phosphorus (average) 7.6 6.1 4.1 4Sodium 1.5 1.6 1.6 1.5
Trace minerals (mg/kg; supplementary levels)Copper 20 20 20 10Iodine 2 2 2 3Iron 50 20 20 45Manganese 120 100 100 120Zinc 100 70 70 110Selenium 0.2 0.2 0.2 0.4
Vitamins (iu/kg; supplementary levels)a
A 15 000 10 000 8 000 12 000D3 5 000 3 000 2 000 5 000E 100 80 50 120
Vitamins (mg/kg; supplementary levels)a
K 5 3 3 5Thiamin 5 1 3 4Riboflavin 8 6 6 20Nicotinic acid 75 50 40 80Pantothenic acid 25 15 15 28Pyridoxine 7 5 3 6 Biotin 0.3 0.3 0.2 0.3Folic acid 3 2 2 6B12 0.02 0.02 0.02 0.04Choline chloride 400 150 100 1 600
aSupplementary trace minerals and vitamins levels required differ according to whether the basal diet is wheat or maize.

Appendix 2
658
Table A2.11 Feeding standards for horses11.1 Daily requirement of horses of 400 kg mature weight
Weight Gain/milk Vitamin A
(kg) (kg/day) DE (MJ) CP (g) Lysine (g) Ca (g) P (g) Mg (g) K (g) (iu)
Mature horsesa
Minimum 400 51 432 19 16 11 6 20 12 000Average 400 56 504 22 16 11 6 20 12 000Elevated 400 61 576 25 16 11 6 20 12 000
StallionsNon-breeding 400 61 576 25 16 11 6 20 12 000Breeding 400 73 631 27 24 14 8 23 18 000
Pregnant mares9 months 427 0.33 64 637 27 29 21 6 21 26 40010 months 439 0.42 68 673 29 29 21 6 21 26 40011 months 453 0.52 72 714 31 29 21 6 21 26 400
Lactating mares1 month 400 13.0 106 1228 68 47 31 9 38 26 4003 months 400 12.0 103 1174 64 45 29 9 37 26 4006 months 400 8.7 91 1012 54 30 19 7 27 26 400
Working horsesb
Light work 400 67 559 24 24 14 8 23 18 000Moderate work 400 78 614 26 28 17 9 26 18 000Heavy work 400 89 689 30 32 23 12 31 18 000Very heavy work 400 115 804 35 32 23 12 42 18 000
Growing horses6 months 173 0.58 52 541 23 31 17 3 10 8 00012 months 257 0.36 63 677 29 30 17 4 14 12 00018 months 310 0.23 64 639 28 30 17 5 16 14 00024 months 343 0.14 63 616 29 29 16 5 18 16 000
aMinimum maintenance applies to adult horses with sedentary lifestyle; average maintenance applies to adult horses with alerttemperaments and moderate voluntary activity; and elevated maintenance applies to adult horses with a nervous temperament orhigh voluntary activity.

Appendix 2
659
Table A2.11 (cont.)11.2 Daily requirements of horses of 500 kg mature weight
Weight Gain/milk Vitamin A
(kg) (kg/day) DE (MJ) CP (g) Lysine (g) Ca (g) P (g) Mg (g) K (g) (iu)
Mature horsesa
Minimum 500 64 540 23 20 14 8 25 15 000Average 500 70 630 27 20 14 8 25 15 000Elevated 500 76 720 31 20 14 8 25 15 000
StallionsNon-breeding 500 76 720 31 20 14 8 25 15 000Breeding 500 91 789 34 30 18 10 29 22 500
Pregnant mares9 months 534 0.41 80 797 34 36 26 8 26 30 00010 months 548 0.52 85 841 36 36 26 8 26 30 00011 months 566 0.65 90 893 38 36 26 8 26 30 000
Lactating mares1 month 500 16.3 133 1535 85 59 38 11 48 30 0003 months 500 15.0 128 1468 80 56 36 11 46 30 0006 months 500 10.9 114 1265 67 37 23 9 34 30 000
Working horsesb
Light work 500 84 699 30 30 18 10 29 22 500Moderate work 500 97 768 33 35 21 12 32 22 500Heavy work 500 111 862 37 40 29 15 39 22 500Very heavy work 500 144 1004 43 40 29 15 53 22 500
Growing horses6 months 216 0.72 65 676 29 39 22 4 13 10 00012 months 321 0.45 79 846 36 38 21 5 17 14 50018 months 387 0.29 80 799 34 37 21 6 20 17 40024 months 429 0.18 78 770 33 37 20 7 22 19 300
aMinimum maintenance applies to adult horses with sedentary lifestyle; average maintenance applies to adult horses with alerttemperaments and moderate voluntary activity; and elevated maintenance applies to adult horses with a nervous temperament orhigh voluntary activity.

Appendix 2
660
Table A2.11 (cont.)11.3 Daily requirements of horses of 600 kg mature weight
Weight Gain/milk Vitamin A
(kg) (kg/day) DE (MJ) CP (g) Lysine (g) Ca (g) P (g) Mg (g) K (g) (iu)
Mature horsesa
Minimum 600 76 648 28 24 17 9 30 18 000Average 600 84 756 33 24 17 9 30 18 000Elevated 600 91 864 37 24 17 9 30 18 000
StallionsNon-breeding 600 91 864 37 24 17 9 30 18 000Breeding 600 109 947 41 36 22 11 34 27 000
Pregnant mares9 months 641 0.49 97 956 41 43 32 9 31 36 00010 months 658 0.63 101 1009 43 43 32 9 31 36 00011 months 679 0.78 108 1072 46 43 32 9 31 36 000
Lactating mares1 month 600 20.0 159 1842 102 71 46 13 57 36 0003 months 600 18.0 154 1761 96 67 43 13 55 36 0006 months 600 13.0 137 1518 80 45 28 11 41 36 000
Working horsesb
Light work 600 100 839 36 36 22 11 34 27 000Moderate work 600 117 921 37 42 25 14 38 27 000Heavy work 600 134 1034 45 48 35 18 47 27 000Very heavy work 600 173 1205 52 48 35 18 64 27 000
Growing horses6 months 259 0.87 78 811 35 46 26 5 16 11 70012 months 385 0.54 94 1015 44 45 25 7 21 17 30018 months 465 0.34 97 959 41 45 25 7 24 20 90024 months 515 0.22 94 924 40 44 24 8 26 23 200
aMinimum maintenance applies to adult horses with sedentary lifestyle; average maintenance applies to adult horses with alerttemperaments and moderate voluntary activity; and elevated maintenance applies to adult horses with a nervous temperament orhigh voluntary activity.bExamples of the type of regular exercise performed by horses in each category are provided in Chapter 14.

Appendix 2
661
Table A2.12 Dietary allowances of horses for sodium, sulphur, trace elements and vitamins
Maintenance Pregnant and Growing horses Working horses
lactating mares
Sodium (g/kg DM) 1.0 1.0 1.0 3.0Chlorine (g/kg DM) 4.0 4.0 4.0 7.0Sulphur (g/kg DM) 1.5 1.5 1.5 1.5Iron (mg/kg DM) 40 50 50 40Manganese (mg/kg DM) 40 40 40 40Copper (mg/kg DM) 10 10 10 10Zinc (mg/kg DM) 40 40 40 40Selenium (mg/kg DM) 0.1 0.1 0.1 0.1Iodine (mg/kg DM) 0.35 0.35 0.35 0.35Cobalt (mg/kg DM) 0.1 0.1 0.1 0.1Vitamin A (iu/kg DM) 2000 3000 2000 2000Vitamin D (iu/kg DM) 330 330 800 330Vitamin E (iu/kg DM 50 80 80 80Thiamin (mg/kg DM) 3 3 3 5Riboflavin (mg/kg DM) 2 2 2 2

Table A2.13 Water allowances for farm animals13.1 Cattle and sheep
kg water/kg DM intake
Environmental temperature (°C)
<16 16–20 >20
CattleCalves, up to 6 weeks 7.0 8.0 9.0Cattle, growing or adult, pregnant or non-pregnant 5.4 6.1 7.0
SheepLambs, up to 4 weeks 4.0 5.0 6.0Sheep, growing or adult, non-pregnant 2.0 2.5 3.0Ewes, mid-pregnancy, twin-bearing 3.3 4.1 4.9Ewes, late pregnancy, twin-bearing 4.4 5.5 6.6Ewes, lactating, first month 4.0 5.0 6.0Ewes, lactating, second/third month 3.0 3.7 4.5
13.2 Lactating cows (600 kg liveweight)
Milk yield (kg/day) Daily water intake (kg/head)
Environmental temperature (°C)
<16 16–20 >20
10 81 92 10520 92 104 11930 103 116 13340 113 128 147
13.3 Pigs
Daily water intake (kg/head)
Growing pigs 1.5–2.0 at 15 kg liveweight, increasing to 6.0 at 90 kg liveweightNon-pregnant sows 5.0Pregnant sows 5.0–8.0Lactating sows 15.0–20.0
Appendix 2
662

Appendix 2
663
Table A2.14 Values for metabolic liveweight (W 0.75) for weights at 10 kg intervals to 690 kg
Hundreds Tens
0 10 20 30 40 50 60 70 80 90
0 0 5.6 9.5 12.8 15.9 18.8 21.6 24.2 26.8 29.2100 31.6 34.0 36.3 38.5 40.7 42.9 45.0 47.1 49.1 51.2200 53.2 55.2 57.1 59.1 61.0 62.9 64.8 66.6 68.4 70.3300 72.1 73.9 75.7 77.4 79.2 80.9 82.6 84.4 86.1 87.8400 89.4 91.1 92.8 94.4 96.1 97.7 99.3 100.9 102.6 104.2500 105.7 107.3 108.9 110.5 112.0 113.6 115.1 116.7 118.2 119.7600 121.2 122.7 124.2 125.7 127.2 128.7 130.2 131.7 133.2 134.6

Appendix 2
664
REFERENCES
AFRC 1990 Technical Committee on Responses to Nutrients, Report no. 6,A reappraisal ofthe calcium and phosphorus requirements of sheep and cattle, Nutrition Abstracts andReviews (Series B) 61, 573–612.
AFRC 1993 Technical Committee on Responses to Nutrients, Energy and Protein Require-ments of Ruminants. An Advisory Manual,Wallingford, CABI.
Agricultural Research Council, London 1980 The Nutrient Requirements of Ruminant Live-stock, Farnham Royal, Commonwealth Agricultural Bureaux.
Agricultural Research Council, London 1981 The Nutrient Requirements of Pigs, FarnhamRoyal, Commonwealth Agricultural Bureaux.
Aviagen 2009 Feed Programs for BUT Commercial Turkeys.Available at: www.aviagen.com/ss/turkey-products/.
Aviagen 2009 Ross 308 Broiler Nutrient Specification.Available at: www.aviagen.com/ss/ross-308/.
Black H, Edwards S, Kay M and Thomas S 1991 Distillery By-Products as Feeds for Livestock,Aberdeen, Scottish Agricultural College.
BSAS 2003 Nutrient Requirement Standards for Pigs, Penicuik, BSAS.
Hyline 2010 Hyline Brown: Commercial Management Guide 2009–2011. Available at:www.hy-line.com/userdocs/managementguides/2009_Hy-Line_Brown.pdf.
MAFF 1990 UK Tables of Nutritive Value and Chemical Composition of Feedingstuffs, Aberdeen,Rowett Research Institute.
National Academy of Sciences/National Research Council 1989 Nutrient Requirementsof Horses,Washington, DC, National Academies Press.
National Academy of Sciences/National Research Council 2001 Nutrient Requirements ofDairy Cows, 7th rev. edn,Washington, DC, National Academies Press.
National Academy of Sciences/National Research Council 2007 Nutrient Requirements ofHorses, 6th edn,Washington, DC, National Academies Press.
Poultry Research Centre 1981 Analytical Data of Poultry Feedstuffs, 1. General and AminoAcid Analyses, 1977–1980, Occasional Publication no. 1, Roslin, Poultry Research Centre.
Thomas C 2004 Feed into Milk: A New Applied Feeding System for Dairy Cows, Nottingham,Nottingham University Press.

adenosine monophosphate (AMP) 64, 65,195, 197
adenosine triphosphate (ATP) 65, 146,195–233, 272, 333–6, 353
Adolph, E.F. 465adrenal corticosteroids 50, 402aflatoxin 573–4Africa 345Agricultural Development and Advisory
Service (ADAS) 525Agricultural and Food Research Council
(UK) (AFRC) 295, 329, 333, 344, 349,354–6, 358–9, 365–6, 369, 377, 396–9,411, 416, 418, 419, 421, 434, 442, 516
energy system 284, 290, 293–4metabolisable protein requirement
425–6, 428, 429metabolisable protein system 331–3, 374Technical Committee on Responses to
Nutrients (TCORN) 322, 331, 344,356, 430–1, 447, 475
Agricultural Research Council (UK) (ARC)see Agricultural and Food ResearchCouncil
Agropyron repens 28Agrostis spp. see bentsAIV silage 510alanine 55, 62, 66, 93, 210, 211, 215, 315,
502albumins 62, 320, 406, 604alcohol dehydrogenase 106, 129aldaric acids 22aldehyde oxidase 130aldehydes 16, 18, 41, 566aldonic acids 22aldosterone 50alfalfa see lucernealimentary canal 156–90alkali disease 132alkali-treatment 529–31alkaloids 68, 537, 556, 578alkalosis 110, 117alkanes 241alkylarylsulphonate 606allantoin 67, 258, 586
665
Aberdeen-Angus 365, 379abomasum 172, 173, 178, 179abortion 503
from ergot poisoning 556from malnutrition 398from manganese deficiency 128from Vitamin A deficiency 77
absorption 156, 168–71, 179–81acetic acid 164, 185, 436–7, 438
in intake regulation 468in large intestine 163metabolism 192, 193, 206–7, 402in rumen 176–8, 417–18in silage 501–3, 507–10utilisation of
for growth 274–7for maintenance 273for milk production 417–18
acetoacetate 193, 194acetone 23acetyl coenzymeA 88, 89, 142–3, 144, 176,
198–210, 220–6, 231, 402acetyl coenzymeA carboxylase 96acetylcholine 97acid ether extract 6acid fibre, indigestible 240acid-base balance 105, 110–12acid-detergent fibre (ADF) 8–9, 247, 299,
435, 526–7acid-detergent insoluble nitrogen (ADIN)
318, 322–3, 328, 484acid-detergent lignin 9, 247acidosis 402, 605Ackerman factor 580Acremonium coenophialum 491Acremonium loliae 490acrylate 176activators 153, 232active tansport 168, 395activity allowance 350, 419, 422, 447acyl-carrier protein 93, 221–2adenine 63–5, 195, 217adenosine 64, 65, 195, 216, 217adenosine diphosphate (ADP) 65, 146,
195–233
Index

allometric equation 363–4, 368, 381alopecia 494aluminium 104, 408American net energy system 291–2amides 67, 181, 304amines 49, 66–7, 163, 181, 501
biogenic 66amino acids 53–9, 61, 193, 194, 226,
227–8, 303–31, 327absorbed, efficiency of utilisation
328–31absorption 168, 170, 246antagonisms 315assays 313–15available 313basal loss (BAA) 306catabolism 209–132, 357in cereals 541–57chemical properties 57–8deamination 210, 501, 502, 503,
507, 508deficiencies 466determination 12–13, 312dispensable 216, 311–12essential see indispensable amino acidsin forages 483–4forumulae 54–6in genetic engineering 220in grass 483indispensable see indispensable
amino acidsin milk 406as products of digestion 160, 161,
162, 179protection of 186in protein concentrates 565–79, 581–9in protein synthesis 213–19requirements of
dog 612horse 373man 612pig 370–3, 452, 612poultry 370–3, 393–4ruminants 59
in silage 501–10as source of energy 209–13standardised ileal digestible 316synthesis 88, 194, 213–15, 220synthetic 370, 371, 586–7
amino sugars 21aminobutyric acid 57, 502aminoethylphosphoric acid 321aminopeptidases 158, 162
ammonia 194, 320in blood 389and the environment 188in metabolism 148, 163, 193, 210–13in milk 406in rumen 179–81, 185, 245, 325, 326,
530, 531, 588in silage 501–3, 507–10, 517toxicity 231treatment of grain 561treatment of hay 526treatment of straw 529–31
ammonium bispropionate 526ammonium citrate 315ammonium tetraformate 510amphipaths 162amygdalin 23amylase 24, 157–61, 164, 165, 168,
175, 602amylopectin 26, 159, 543amylose 26, 543anabolic reactions 192anabolism 192, 399anaemia 231
copper deficiency 123folic acid deficiency 95haemolytic 496, 576iron deficiency 121, 170, 401pernicious 98vitamin K deficiency 87vitamin K excess 101
androgens 50, 379anhydrous ammonia 529animal production level (APL) 285–6,
288, 291animal products
contribution to human requirements613–17
essentiality to man 616future trends in consumption 622non-food 611objections to consumption 615, 617
animal protein concentrates 579–84animal protein factor (APF) 581antibiotics 171, 185, 618
as feed additives 594–6, 606, 618antibodies 164, 171anticodon 216antifoaming agents 606antinutritional factors 315antioxidants 41, 71, 83, 527, 568apo-enzyme 145arabans 483
Index
666

arabinans 17, 26arabinose 17, 19, 23, 29, 169arabinoxylan 600, 602arachidonic acid 36, 38, 39arginine 62, 66, 161, 211, 212, 217, 483,
502, 575, 583in eggs 392formula 56as indispensable amino acid 58, 311, 371requirement 315, 542synythesis 215
Armsby, H.P. 283arsenic 104, 135, 408artificially-dried forage 492, 526–7ascorbic acid see vitamin Cash 6, 256, 270
acid-insoluble 240asparagine 55, 67, 215, 484, 534aspartic acid 55, 66, 67, 210–13Aspergillus flavus 573associative effect of foods 248, 278Astragalus racemosus 132atherosclerosis 48atropine 68Australian Standing Committee on Agricul-
ture 290, 329, 350, 366–7, 418, 475–6availability of minerals 107–8, 251, 376,
432, 443, 447–8Avena sativa see oatsavidin 96avoparcin 595Ayrshire 119, 410, 413, 416, 431
bacillus 503bacteria
composition 174in digestive tract 162, 163, 171, 171–88in silage 499, 502–3, 505as silage additives 510
bacteroides 163bagasse 495, 527, 550Barber, R.S. 124barley
by-products 545–51feed 551grain 259, 275, 276, 541, 542, 543–5,
558–61, 601, 602hay 524pearl 550–1protein 310silage 517–18straw 528whole crop 495
basal metabolism 255, 346–7, 358Bastiman equation 505beans 576–8
for silage 493, 518Beckmann process 529bents (Agrostis spp.) 487, 488benzaldehyde 23beri-beri 70berseem 492Beta vulgaris 535betaine 66–7, 97, 536bile 161, 162, 165, 168, 169
acids 48, 49–50, 597bilirubin 161biliverdin 161biodiesel 550biofuel industries 550biological value (BV) 309–12
in factorial calculations 452of food proteins 59, 565, 580–1, 584of microbial protein 328for wool growth 374
biotin 87, 96–7, 117, 409birdsfoot trefoil 493biuret 182, 587, 590Blaxter, K.L. 424blind staggers 132blindness 537bloat 178–9, 493–4, 545, 588, 605–6
preventing agents 606blocks (feed) 109, 589blood 409, 462
dried 583minerals in 104, 112, 114, 119, 120, 121sugar in 225
blood meal 583body composition
condition scoring 387–8estimation of 269–70
bomb calorimeter 255, 269bombesin 60bone 81, 105, 112–14, 118, 362bone flour 113boron 104, 135, 408Bos indicus 354, 355botulism 502bovine spongiform encephalopathy (BSE)
171, 579, 618–19bracken poisoning 89bran 120, 536, 555Brassica campestris 496, 534Brassica napus 496, 534, 571Brassica oleracea 496
Index
667

brassicas 127, 495–6, 534Braude, R. 124breeding, age when first used 386brewer’s grains 258, 326, 536, 545, 546–7
amino acid composition 330brewer’s yeast 545, 546, 547British Society of Animal Science (BSAS)
360, 367, 450, 452Brody, S. 348bromes 487bromine 408Brouwer, E. 265brown fat 131, 353browse 493Brunner’s glands 161buffers 173, 248, 323, 435, 499, 507, 515,
518, 561, 603, 605butanoic acid see butyric acidbutanol 550butterfat 37, 256butyric acid 10, 35, 163, 172, 185, 436–7
in intake regulation 468in rumen 176–8in silage 501, 502, 507–10utilisation of 192, 193, 204–6, 273, 276
cabbage 86, 496cadaverine 66, 502caeca 165–6, 188caecotrophes 247caecum 157, 163, 167, 187calcium 105, 106, 107, 111, 112–14, 113
absorption 170, 603in animal body 104availability 251binding protein 80in cereals 543, 544deficiencies 466deficiency symptoms 81, 112–13in eggs 392in forages 489in grasses 484, 485interrelations with
manganese 129phosphorus 113–14, 432zinc 129
in meal 567, 568, 569, 570, 571,573, 582
in milk 408, 413, 585requirements for
egg production 394lactation 431–2, 444, 448, 453,
455, 456
maintenance and growth 375–8reproduction 399
calcium phosphate 113calcium soaps 439calf
digestion in 171–2, 186, 595vitamin deficiency symptoms 77, 80,
85, 90vitamin requirements 377
callose 17, 28calorie 194, 465calorimeter
animal 262–70, 348, 355bomb 255, 269gradient layer 264
calorimetry 262–70direct 262–4indirect 264–8
Campylobacter spp 618cancer 621cannibalism 117, 394cannula 159, 244–6, 246, 471, 594canola meal see rapeseed mealcapric acid 36caproic acid 35, 41caprylic acid 35, 36carbamoyl phosphate 211carbohydrate effect 248carbohydrates 5, 16–31
absorption 168, 169classification 16–18complex 17determination 6digestion 158–68, 175–9in eggs 392empirical formula 16in grasses 483, 489, 490metabolism 192–207
vitamins in 72in milk 406non-structural (NSC) 8, 9, 326oxidation 198–202, 264in silage 500–10synthesis 226–32utilisation, for production 274–7water soluble, in grasses 483
carbon balance 266–8, 269carbon dioxide 264–5carbonic anhydrase 106, 129carboxyglutamic acid 57, 87carboxypeptidase 106, 146, 158, 161carcass 270, 309, 362, 379, 380carcinogens 573
Index
668

carmine 238carnaubic acid 46carnaubyl alcohol 46carnitine 99carotene 73, 75–6, 78, 171, 390, 395, 433
in artificially dried forage 526in grasses 484, 527in hay 523, 525in milk 409see also vitamin A
Carpenter, K.J. 314carrots 24cartilage 21caseins 59, 63, 164, 256, 273, 276,
406, 584hydrolysed 307
cassava 23, 533, 534, 538–9castor bean 38, 563, 567cat 3, 39, 58–9, 78, 80, 159, 166–7catabolic reactions 192catabolism 192–213catalase 83catalysts 141, 147catheter 266cation-anion difference (CAD) 110cattle
abortions 503critical temperature 352dietary electrolyte balance 110, 111digestion in 559feeding standards
for growth 361–7, 369–70intake regulation 471, 516lactation 414–40maintenance 354–6, 358–60reproduction 384–90
FiM energy requirements 421hypervitaminosis D 101milk fever 110, 111, 113mineral deficiency symptoms
114, 116, 119–20, 125–6, 128,129–30
mineral requirements 135, 390vitamin deficiency symptoms 77, 78,
85, 99vitamin requirements 84, 390see also calves; milk; ruminants and
individual breedscellobiose 17, 25, 174, 175, 176cellulases 220, 241, 243, 510, 600, 602cellulolysis, and starch 248cellulose 17, 18, 25, 27–8, 175, 247, 249,
256, 529
digestionin fowls 165in pigs 163, 187in ruminants 171–88, 247
in grass 483, 485, 486Centrosema pubescens (centro) 492cephalins 44, 45cereal
consumption 617forage 494–5grain screenings 557–8grains 82, 93, 95, 96, 115, 248–9, 541–62hay 524processing 248–9, 558–61straws 527–32
cerebrocortical necrosis 89cerebrosides 44ceruloplasmin 106, 122, 231cetyl alcohol 46chaconine 537chaff 527chaffing 249Charolais 367chelates 105, 107–9, 251chemical score 312, 565chemostatic theory of intake regulation
462–3, 468, 474chick see poultrychick pea 578chitin 21, 28–9, 586chlorine 104, 105, 116, 117, 408, 412, 544chloroform 260chlorophyll 51, 75, 105, 537choice feeding 466–7cholecalciferol 49, 78–81
see also vitamin Dcholecystokinin 161, 462–3cholesterol 48–9, 50, 62, 133, 161, 162, 373
in blood 48, 619, 620cholesterol esterase 158choline 44, 45, 97, 409, 570chondroitin 17, 29chou moelier 496chromatography 12–13, 312, 314
gas-liquid 12–13, 37high-performance liquid 13ion-exchange 13reverse-phase 13
chromic oxide 240-1‘chromium 104, 133, 325chromoproteins 63chylomicrons 48, 169, 194chymosin 158, 160, 164
Index
669

chymotrypsin 148, 149, 158, 161, 566–7chymotrypsinogen 161cimaterol 379citric acid 142–3, 200, 258, 603–4citrulline 211, 212Claviceps paspali 491climate 350–4, 393, 401, 473, 476, 486,
487, 489climate change 188–9cloaca 166clostridia 66, 163, 491, 499–502, 505,
507, 508clovers 43, 87, 178, 242, 491–4, 524clubbed down 90cobalamins see vitamin B12cobalt 99, 104, 105, 109, 125–7, 470, 484
deficiency symptoms 126in grass 488sources 126toxicity 126–7
cocaine 68cocksfoot 37, 43, 488, 508, 524cocoa bean meal 575coconut meal 259, 569coconut oil 38cod liver oil 37, 74, 78, 79, 437codons 217–18coenzyme A 87, 93–4, 117, 143, 144,
197–209coenzymes 144–5, 192–233cold stress 352–3, 473coliform bacteria 163, 503collagen 54, 62colon 157, 163, 187colostrum 77, 79, 408–9, 434comparative nutrition 611–13comparative slaughter 268–70, 309,
348, 355competitive inhibition 151–2Compositae 28, 38condensed molasses solubles 536coniine 68conjugated linoleic acid 437–8, 484, 621–2cooking of foods 249, 537–8copper 104–5, 106, 122–5, 130, 251,
401, 549in animal body 104, 122bolus 109in cereals 544deficiency symptoms 123, 231, 390, 400in egg production 390, 392in grass 488as growth promoter 124, 596
in milk 408and molybdenum 130in pasture 484sources of 109, 124toxicity 106, 124–5in wool production 122, 375
copper oxide needles 109copper sulphate 124, 185copper-molybdenum-sulphur interrelations
123–4coprophagy 87, 187, 378corn stover 528–9Cornell Net Carbohydrate and Protein
System 9, 13, 292, 323–4, 329,418, 476, 566
coronary heart disease 48, 49, 619, 620corticosterone 50cortisol 50, 402cottonseed cake (or meal) 120, 310, 563,
564, 565, 568–9Cottrill, B. 135coumestans 494cow see calves; cattle; ruminantcrazy chick disease 85creatine 198, 357, 406creatine kinase 146creatine phosphokinase 85creatinine 258, 357, 358crop by-products 617crop (of fowl) 164, 463, 465crude fibre 6–7
cereals 544determination of 6effect on digestibility 247effect on milk composition 435hays 524, 525
crude protein 6cereals 544determination of 6as feeding standard 303–5, 317hays 524, 525microbial 426nitrogen conversion factors 304straw 528
cryptoxanthine 75, 551CSIRO 355–6, 359, 369, 374–5, 377curled toe paralysis 90cutin 47cyanocobalamin see vitamin B12cyanogenetic glycosides 23, 127, 538–9,
570, 571cysteine 55, 57, 62, 117, 118, 123, 160,
210, 220, 313
Index
670

cystine 57, 117, 118, 312, 313, 316, 542in animal protein concentrate 581, 583association with methionine 312in legume seeds 577, 578in milk 584in oilseed meals 565–8, 573in wool 118, 373, 374
cytidine 216, 217cytochrome oxidase 106, 122cytochromes 33, 63, 105, 106, 121, 130,
145, 146, 196cytosine 63–5, 217
D value 252, 495Dactylis glomerata see cocksfootDasytricha 174Daucus carota see carrotsday length 473deamination 210, 211, 501, 502, 503,
507, 508decanoic acid see capric aciddegradable protein see rumen degradable
protein7-dehydrocholesterol 49, 79dehydroretinol 74dehydroxycholecalciferol 170dementia 530deoxy sugars 21deoxyadenosylcobalamin 98deoxyribonuclease 158, 162deoxyribonucleic acid (DNA) 21, 64, 65,
80, 95, 105, 162, 217, 220, 440deoxyribose 21, 64, 65detoxification 171deuterium 270development 362dextrins 17, 27, 158, 159, 162, 545dhurrin 23diacylglycerols 40, 162diaminopimelic acid (DAPA) 321dicalcium phosphate 189dicoumarol 87dietary electrolyte balance 110dietary undetermined anion 110digestibility 237–53
estimated from gas production 243factors affecting 247–50fat supplements 240of grass 242, 486of hay 523ileal 246, 305–6, 307–8, 313, 370, 600,
603, 3721in sacco 246, 252, 486
in vitro 241–3, 252, 486and intake 465, 468–71, 476measurement 237, 238–47, 320–1of proteins 305–6of silage 509, 510, 512, 515, 518standardised (SD) 305–6of straw 528, 529–31trials 238–40
digestibility coefficient 237, 239apparent 244true 244validity 243–4
digestible crude protein 305–6, 318hays 524, 525
digestible energy 257as feeding standard for horses 297–8as feeding standard for pigs 295, 296,
450–1digestible organic matter 239, 297, 299,
326, 475, 513apparently digested in the rumen (DO-
MADR) 326hay 525
digestion 156–91in different sections of digestive tract
244–7and the environment 188–9in fowls 164–6, 188in horses 167–8, 187in pigs 156–64rate of 183, 184, 468in ruminants 171–88studies of 159work of 272, 276
digestive tract 156–7of horse 187of ruminant 171–2see also individual parts
dihydroxyacetone 17dihydroxyacetone phosphate 199, 207, 224dihydroxycholecalciferol 80, 111, 112dihydroxypyridine 494diiodotyrosine 127diisopropyl fluorophosphate (DFP) 152dilution rate 184dilution techniques of estimating body
composition 270dimethyl disulphide 496dipeptidases 158, 162disaccharides 17, 23–5diseases transmissible in food to humans
617–19dispensable amino acids 216, 311–12
Index
671

distiller’s grains 115, 547–8dark grains 549–60supergrains 549
distiller’s solubles 548–9diverticulum 164DNA see deoxyribonucleic aciddocosahexaenoic acid 36, 38,
45, 621dodecanoic acid see lauric aciddog 3, 78, 159
digestion in 166–7nutrient requirements 612
Dolichos biflorus 576Dolichos lablab 576draff 115, 120, 546, 547–8
see also distiller’s grainsdried grass 526–7dry matter 4, 5, 333–7
intake 514–17factors affecting 515
dulcitol 22duodenal juice 161duodenum 157, 160, 165, 168,
246, 465Dutch
net energy system 291, 293–4protein system 329, 428
dye-binding 314–15
Echinochloa crusgalli see milletEFA see essential fatty acidsegg 391–2
hatchability 394production 113, 114, 277–8, 391–5taint 571vitamins in 74, 79
eicosanoic acid see arachidic acideicosanoids 38, 39eicosapentaenoic acid 39, 621eicosatetraenoic acid 45Eijkmann, C. 70elastin 62Eleusine coracana see milletElsley, F.W.H. 380Embden and Meyerhof pathway 198–201embryo, in vitro produced 391Emmans, G.C. 411emulsification (during digestion) 161, 162encephalomacia 85endergonic reactions 195endogenous urinary nitrogen see nitrogenendopeptidases 161endoplasmic reticulum 220, 223
energycontent of foods 254–80content of liveweight gain 362–7, 418–19cost of eating 261, 349–50demand 254–6digestible see digestible energyfeed unit 291, 293gross see gross energyintake, man 613–17metabolisable see metabolisable energymetabolism 194–213models 282–3, 293–4net see net energyproductive values for poultry 296requirement for
egg production 392–3growth 365–9lactation 414–25, 442–3, 447, 450–2maintenance 346–54physical activity 349pregnancy 396–401wool production 374
retention - measurementby carbon/nitrogen balance 266–8, 269by comparative slaughter technique
268–70systems 281–302
energy balance 348Englyst, H. 10ensilage 499–506, 521, 537, 547
legumes 518nutrient losses 505–6steps for successful 504
Enterobacteria 503Enterococcus faecalis 501enterokinase 161enterostatin 60environment, and digestion 188–9enzootic ataxia 123enzymes 141–55, 192–233
acidity effects 154allosteric effects 153
activator sites 153inhibitory sites 153
classes 142–4cofactors 144–6concentration 151digestive 156–90feed additives 249–50, 600–2in feed evaluation 242–3, 323genes for 220inhibitors 151–3, 249microbial 171
Index
672

mode of action 146–50, 600–2nature of 144–6nomenclature 154in plants 500–1, 505, 511, 522–3, 545silage additives 508–10specificity 148–50substrate concentration 150–1table summarising main 158temperature effects 153
epimerases 144equine dysautonomia 491ergocalciferol 78–9
see also vitamin Dergosterol 49, 79, 171, 485, 523ergot 68, 556, 557erucic acid 38, 571, 572Erwinia herbicola 503erythrocuprein 122erythrose 17Escherichia coli 86, 94, 220, 503, 596, 618essential amino acid index (EAAI) 313essential amino acids see indispensable
amino acidsessential fatty acids (EFA) 38–40, 42, 224
deficiency 38essential oils 50ethanol 276, 502, 503, 505, 507, 509, 510, 550ethanolamine 44, 45ether extract 6, 544ethylaminediaminetetraacetic acid (EDTA)
107–8euglobin 406European Association for Animal
Production 300Evvard,T.M. 467exergonic reactions 195exogenous urinary nitrogen see nitrogenexopeptidases 161exudative diathesis 85, 131
facial excema 491facilitative transport (in absorption) 168factorial method of estimating nutrient
requirements 345energy requirements 416, 421, 446, 447,
450–1, 454minerals 376, 377, 431, 447–8, 453protein requirements 358–9, 369, 425,
443–4faeces 87, 163, 184, 238–47, 257
collection of 238falling disease 123farmer’s lung 523
fasting catabolism 347fasting metabolism 255, 346–9, 354–5,
356, 389fats 33–43
absorption 169brown 33, 353and cardiovascular disease 619chemical properties 40–3composition 36–8, 38digestion 42, 158, 161–2, 182–3, 240energy value 32, 256hydrogenation 42–3, 182–3hydrolysis 40melting point 36metabolism 207–9, 402
vitamins in 72milk 38, 406–8, 409, 413, 414, 415, 434,
435–40oxidation 40–1, 264storage 268, 362–5structure 34–6synthesis 219–25
energy cost 225taints in 40, 45utilisation
for maintenance 272, 273for production 274–7
fattening 362–5, 379fatty acids 34–43, 143, 162, 163, 192–209
absorption 169chain elongation 222–3cis and trans configuration 35, 182desaturation 223–4essential see essential fatty acidsfamilies 35in milk fat 406–8, 434, 435–40monounsaturated 619nomenclature 35oxidation 40–1, 207–9, 264, 265polyunsaturated 619, 621saturated 619, 620synthesis 220–4trans 42–3, 619see also volatile fatty acids
fatty liver and kidney syndrome (FLKS) 96favism 576feathers 62, 77, 92, 122, 134
meal 583–4Feed into Milk system (FiM) 293, 294,
354–5, 359, 514, 516energy requirements 421–3food intake prediction 475protein requirements 333–7, 428–30
Index
673

feedback inhibition 153, 232–3feeding standards
for egg production 391–5for growth 361–73for lactation 405–58for maintenance 343–61, 375–8for pregnancy 396–402for reproduction 384–90safety factors in 343–4, 421, 427for wool growth 373–5
feeding trials 348fermentable energy (FME) see under
metabolisable energyfermentable organic matter (FOM) 180–1, 326ferric oxide (as marker) 238ferritin 100, 121fertilizers (nitrogenous) 120, 489, 533, 553fescue foot 491Festuca spp. 487, 488, 524fibre 247, 482, 483, 600
acid-detergent (ADF) 8–9, 247, 299, 435,526–7
component of common foods 11dietary 9neutral-detergent fibre (NDF) 8, 243,
247, 323, 468, 469Fibrobacter succinogenes 174, 175fimbriae 596, 597Fingerling G 295fish meal 122, 567, 568, 579, 580–3
protein 310, 315, 565as source of minerals 113, 115, 117, 128,
130, 581as source of vitamins 81, 86, 581
fish oil 435, 437, 438, 439Fisher. C. 411fistulated animals 159, 241, 242flavin adenine dinucleotide (FAD) 87,
90, 196flavin mononucleotide (FMN) 87, 90, 145flavomycin 595flavoproteins 63, 90Floury-2 (maize) 551flowmeal 554fluoracetate dehalogenase 185fluorine 104, 106, 113, 132, 408fluoro-2,4-dinitrobenzene (FDNB) 314, 315flushing 387–8fodder beet 533, 534, 535
tops 497foetus 395–402, 471–2folacin, see also folic acidfolic acid 87, 94–5, 151–2, 178, 390, 409
foodadditives 594–607digestibility of 237–53digestion of 156–90energy content of 254–80energy value of 281–302intake of 184, 461–77, 514–17protein evaluation 303–39
food intake, prediction 474–6Forbes, E. B. 416formaldehyde 186, 511, 512, 513, 514, 566formalin 510, 511, 513, 584formic acid 176, 510, 512, 603–4formononetin 494fowl see poultryFraps, G. S. 296free energy change 195free radicals 41, 76, 83–4, 100French
net energy system 290, 297, 356, 369,454–5
protein system 318, 323, 329, 373,428, 455
Fries, J.A. 416Friesian 410, 413, 416fructans 17, 20, 28, 175, 483, 492, 537fructooligosaccharides 599, 600fructose 17, 20, 21, 22, 25, 26, 28, 162,
169, 175, 483, 502fructose phosphate 198, 199, 202, 204fructosides 22fructofuranosidase 158fumaric acid 176, 189, 200, 211–13, 603–4fungi 29, 174–5, 185, 494, 503–4, 523, 573
cellulase of 243Funk, C. 70
Gaines,W.L. 425galactans 17, 28, 483galactolipids 43, 484galactooligosaccharides 599, 600galactosamine 21, 29, 62galactose 17, 20, 22, 24, 25, 26, 28, 29, 43,
162, 169, 230, 406galactosidase 158galactosides 22galacturonic acid 29gall bladder 161gallates 41gallic acid 41gangliosides 44Garrow, J. S. 612gastric juice 160
Index
674

gelatine 73, 311genetic engineering 171, 185, 220, 379, 381genistein 567German
energy systems 283, 290protein system 329
gizzard 165gleptoferron 121gliadin 554Gliricidia sepium 532globins 604globulins 62, 164, 320, 604glucagon 60glucanase 249, 601glucans 17, 26–8, 249–50, 586, 600–1glucaric acid 22gluconeogenesis 274
energy cost 228–9from amino acids 226, 227–8from glycerol 228from lactate 226–7from propionate 228from pyruvate 226–7
gluconic acid 22glucosaminans 28–9glucosamine 17, 21, 28, 29, 62, 406glucose 17, 18, 20–9, 256, 474, 502
in grass 483in intake regulation 462, 474metabolism of 175, 193, 197, 198–204,
207, 226–32, 256, 261, 437in milk 406in pregnancy toxaemia 401–2as product of digestion 159, 162, 256utilisation of
for foetal growth 395–6for maintenance 272, 273for production 274–7
glucose-1-phosphate 21, 230glucose-6-phosphate 21, 199glucosidase 158glucosides 22, 168glucosinolate 571–2glucostatic theory of intake regulation 462glucuronates 258glucuronic acid 22, 29, 100glutamic acid 55, 57, 66, 67, 95, 154, 160,
315, 483, 553, 554metabolism of 210–15, 502
glutamic dehydrogenase 213glutamine 55, 67, 211, 213, 214, 484glutathione peroxidase 82–3, 106, 131glutelin 320, 551, 554
gluten 328, 552, 554glycans 16glyceraldehyde 17glycerides 34glycerol 32, 33, 34, 44, 550
metabolism of 193, 194, 207in milk fat 408as source of glucose 228synthesis of 224
glycerol-3-phosphate 224glycerolphosphocholine 162glycine 55, 58, 62, 66, 95, 162, 170, 210,
213, 502requirement by chick 311, 371, 393
glycocholic acid 50, 161glycogen 17, 18, 27, 192, 193
digestion of 159, 161as energy source 201–2reserves 225synthesis of 229–30
glycolipids 17, 18, 32–3, 43–4, 484glycolysis 198–201glycoproteins 17, 18, 20, 62glycosides 22–3goat 134, 135
energy requirements 442–3lactation requirements 440–4milk composition 441–2milk yield 440–1mineral requirements 444protein requirement 443
goitre 127, 400, 494, 496, 571goitrin 127, 571goitrogens 127, 494, 496Gompertz growth equations 397gonadotrophic hormones 388gossypol 568–9Gramineae 28, 481, 486–8, 541–61grass 481–91
chemical composition 482–5dried 275, 276, 526–7
vitamins in 527energy value 290factors influencing nutritive value 485–90growth pattern 482silage 499–520
grass sickness 491, 502grasses, tropical 487–8grazing
animals 345, 462, 472–3continuous 489energy cost of 290pressure 489
Index
675

grazing – continuedtime 173, 473zero 489
grinding of foods 27, 177, 178, 184, 248–9,260, 470, 526, 558–9
groats 553gross energy 255–7
of milk 415–16, 417, 450, 454of silage 511
gross protein value (GPV) 308,314, 565
groundnut meal 276, 563, 565,573–4
groundnut oil 276growth
coefficient 363compensatory 380–1, 471composition of gain 362–5
determinants 364–5control of 378–81energy requirements for 365–9energy utilisation for 274–7extra-uterine 399feeding standards for 361–73mineral and vitamin requirements for
375–8modifying agents 381protein requirements for 369–73
growth curves 361–2guanidine 307guanine 63–5, 216, 216–17guar 563Guernsey 410, 413gulonolactone oxidase 100gums 17, 29
haem 63, 105, 145, 146haemagglutenin 567haemoglobin 63, 105, 121, 122, 401,
490, 496haemolytic anaemia 496, 576haemosiderin 121hair 122, 123, 359, 425, 428, 494halibut liver oil 74, 79Hammond, J. 362, 364, 379hay 238–40, 259, 260, 286, 326,
521–6, 528changes during storage 525chemical changes 521–5composition and nutritive value -
comparison 524losses 525preservatives 526
heatof combustion 255of fermentation 272, 275increment of foods 261–79, 463increment of gestation 398loss from body 255–79, 346–54production 262–70, 346–54stress 110, 353–4, 473
heating of foods 249, 495, 529,580–1, 602
hemicellulases 510hemicelluloses 17, 19, 29, 529
digestion of 163, 165, 175, 185in grass 483, 485
hen see poultryheptoses 16, 17, 20herring meal 134, 582herring oil 437heteroglycans 16, 17, 29hexadecanoic acid see palmitic acidhexanoic acid see caproic acidhexose-phosphate shunt see pentose
phosphate pathwayhexoses 16, 17, 20hind-gut fermentors 247hippuric acid 258histamine 66, 502histidine 56, 58, 66, 95, 311, 315, 316, 392,
502, 553, 569histones 62Hogg, J. 125Holcus lanatus see Yorkshire fogholoenzyme 145holotrichs 174Holstein (Friesian) 365, 366, 386, 410, 412,
413, 416homoarginine 307homoglycans 16, 17, 26–9Hopkins, F. G. 70hops 536, 545, 546, 547Hordeum sativum see barleyhormones
adrenal 50, 402growth 379gut 161, 463metabolic 117, 402, 408,
462–4sex 50, 379, 384–90see also individual hormones
horse 3, 527digestion in 159, 167–8, 187,
559, 598energy systems 297–8
Index
676

feeding standardsfor lactation 453–6for maintenance 356, 360–1for reproduction 388–90
grass sickness 491, 502intake regulation 474milk fat 407protein evaluation 317–18requirements
energy 356, 357, 368–9, 454–5minerals 377, 455–6protein 360–1, 373, 455vitamins 87, 88, 99, 456
silage dry matter intake 516–17vitamin deficiency symptoms 85–6
Huxley, J. S. 363hyaluronic acid 17, 29hydrocyanic acid 538hydrogen 188hydrogen cyanide 23, 570hydrogen peroxide 531hydrogen sulphide 118, 163hydrolases 143hydrolysed feather meal 583–4hydroperoxide 40–1hydroxy-eicosatrienoic acid 39hydroxybutyrate 192, 193, 194,
204–6, 408hydroxycholecalciferol 79hydroxycobalamin 98hydroxyl radical 83hydroxylysine 54hydroxyproline 54, 62Hyparrhenia rufa see Jaragua grasshyperketonaemia 402hypervitaminosis 100–1hypocalcaemia 80, 113, 535hypoglycaemia 401hypomagnesaemia 119hypomagnesaemic tetany 116,
119–20hypothalamus 462–4, 465, 468hypoxanthine 213, 214
ideal protein 316, 370, 379apparently digested (ADIP) 316
ileum 157, 246ill thrift 131imidazoles 529, 530immunoglobulins 170, 395, 604, 605in sacco techniques 246in vitro techniques 241–3, 486indicators (marker substances) 240–1, 321
indispensable amino acids 58–9, 216, 329–30importance in protein evaluation 311–18,
370–3requirements 370–3, 393, 452
indole 163infertility 77, 114, 389–90, 494inhibitors 151–3, 510–11inoculants 509–10inorganic matter 5inosinic acid 213, 214inositol 44, 99, 409insulin 117, 388, 437, 462intake of food see food intakeinternational units 76, 79, 82intestine
large 163, 187small 157–62, 168, 179, 465, 601, 602
intrinsic factor 98inulin 17, 28invertase see sucraseiodine 104, 105, 127–8, 496
absorption 170in animal body 127deficiency symptoms 127–8in eggs 392in milk 408requirements for
egg production 390, 394maintenance and growth 375reproduction 390, 400, 401
sources 128toxicity 128
iodothyronine deiodinase 106, 131ion pumping 261Ipomoea batatas see sweet potatoiron 105, 106, 109, 121–2, 375
absorption 121, 122, 170in animal body 104, 121availability 121, 251deficiency symptoms 121dextran 121in eggs 392in grass 484in milk 408–9in pregnancy 398–9, 401in proteins 146requirement for egg production 394sources 122toxicity 122
isobutylidene diurea 182isobutyric acid 176isocitric acid 196, 200isoelectric point 58
Index
677

isoflavones 494isokestose 25isoleucine 55, 58, 176, 210, 311, 315, 316,
392, 393, 483isomerases 144isoprene 50isothiocyanates 571, 572–3isotopes 251, 268, 270Isotrichidae 174Italian ryegrass 242, 481, 483, 488
jacobine 68James,W. P.T. 612Jaragua grass 487Java beans 23jejunum 157, 168Jersey 119, 410, 412, 413, 416, 472joule 194
kale 86, 127, 496, 497Kellner, O. 283, 291, 292, 295, 416keratin 62, 373, 374kestose 17, 25keto acids 194, 508ketoglutaric acid 196, 200, 210–15ketones 41, 265, 401ketoses 169ketosis 231, 265, 550, 551, 605kilocalorie 194Kjeldahl, J. 6, 304koilin 165
L-5-vinyl-2-oxazolidine-2-thione 127, 571see also goitrin
lactalbumin 230–1, 232, 406lactase 158, 162, 164lactation 277–8, 325, 388, 405–60, 466,
472mineral requirements 430–2nutrigenomic effects 440tetany 119
lactic acid 24, 168, 181, 256, 332, 510,597, 598
in gut 176, 559in metabolism 142, 154, 163, 164, 201,
202, 276in silage 499, 501–10as source of glucose 226–7
lactic acid bacteria 499–510, 596–8lactobacilli 163, 164Lactobacillus brevis 501Lactobacillus plantarum 501lactoglobulin 406, 584, 585
lactose 17, 24digestion of 162, 164, 603intolerance 615in milk 406, 412, 413, 414, 415, 446,
449, 584, 585synthesis of 230–1, 274
laminitis 559, 605lanolin 47lard 37large intestine see intestinelarge offspring syndrome (LOS) 391lathyrism 576Lathyrus sativus 576laurel oil 34lauric acid 34, 36, 37, 38, 46leaching 523lead 104lean body mass 270, 362lecithinases 158, 161, 162lecithins 44, 45, 97, 162lectins 315, 567, 596, 597legume 469
forages 491–4hay 524nutritional disorders 493–4, 605seeds 576–8silage 499straw 527, 529trees and shrubs 493whole crop silage 518
leptin 60, 463, 464Leucaena leucocephala 493, 494, 532leucine 55, 58, 161, 176, 210, 217, 311,
315, 316, 392, 575, 583Leuconostoc mesenteroides 501leukotrienes 38, 39levan 17, 28level of feeding 250, 260, 288–90, 426Lewis, M. 515, 516ligases 144lignin 30, 163, 527, 528, 529
effect on digestibility 19, 175, 247in grass 483, 484as indicator 240, 241
lignosulphate 566limestone 113, 114linamarin 23, 538, 570Lind, J. 70linoleic acid 32, 35–40, 43, 45, 224, 390,
437–8, 439in cereals 541, 551conjugated 437–8, 484, 621–2in grasses 484
Index
678

in legume seeds 577in milk fat 406in rumen 182
linolenic acid 35–40, 43, 439, 621in grasses 484in legume seeds 577in milk fat 406in rumen 182
linseed 37, 40cyanogenetic glucosides in
23, 570meal 120, 310, 570–1mucilage 29, 570oil 34
lipase 40, 50, 158, 161, 166,553, 602
lipids 5, 32–52, 248in cereal grains 541, 543classification 32–3digestion of 161–2in eggs 392in grasses 484metabolism 194synthesis 194see also fats
lipoic acid 99lipolysis 40lipoproteins 62–3, 194, 437
in blood 48, 619lipostatic theory of intake regulation 463listeria 502–3Listeriosis 502–3lithium 104, 135liver 74, 157
fatty syndrome 96importance in metabolism 180, 192–4,
201, 202–3, 261necrosis 573secretions 161
Lolium multiflorum see Italian ryegrassLolium perenne see perennial ryegrasslosses of nutrients (silage) 505–6lotaustralin 23, 538lucerne 86, 242, 436, 492, 494, 508
dried 526, 527hay 177, 259, 273, 276, 523, 524
lupin seed meal 389, 578lupinin 578lupins 518Lupinus spp. 578lutein 75luteinising hormone 388lyases 143–4
lysine 54, 56, 59, 62, 66, 161, 170, 210,307, 311–18, 502, 587, 604, 616
in animal protein concentrates 579,580–1, 583
in cereal grains 541, 542, 543, 544, 549,551, 553–4, 556, 557
in eggs 392, 393FDNB reactive 314, 315in grasses 483in hay 525as indispensable amino acid 58, 311,
316–17, 371–3in legume seeds 577, 578in oilseed meals 567–75requirement
by horse 455by pig 370, 371–2, 452by poultry 370–1, 393
in single cell protein 585synthesis 220
lysophosphatidyl choline 182lysophospholipase 158lysozyme 159
Macroptilium atropurpureum see siratromagnesium 104, 111, 118–20, 197, 216, 344
absorption 120in animal body 118–19availability 107, 251in cereals 544deficiency symptoms 119–20in eggs 392in enzyme action 146in grass 484, 488losses from body 251, 376, 443in milk 408, 432, 443, 448requirement for lactation 455, 456sources 120tetany 119–20
Maillard reactions 61, 320, 328, 525, 566maintenance 326
energy requirements 285–8, 346–54,392–3, 419–21, 442, 447, 450
feeding standards 343–61mineral and vitamin requirements 375–8protein requirements 356–61utilisation of energy 272–3, 284, 287,
297–8maize 273, 275, 276, 278, 370
amino acid composition 330by-products 551–3grain 92, 259, 310, 541, 542, 543, 547,
549, 550, 551, 558, 559, 560, 565
Index
679

maize – continuedsilage 330, 499, 507, 518starch 186, 436straw 527, 528–9
maize gluten feed 552malic acid 176, 189, 200, 203, 212malonyl coenzyme A 220, 221malonyl-ACP 221–2malt culms 536, 545, 546maltase 158, 162, 164, 165, 175maltose 17, 24–5, 27, 545
digestion of 162, 175as product of digestion 159
mammary gland 230, 398, 399,405–58
mannutrient intakes - world comparison
613–17nutrient requirements 612
manganese 104, 128–9in animal body 128in cereals 544deficiency symptoms 128–9in eggs 392in enzyme action 106, 221in grass 484, 488and reproduction 128, 390requirements for egg production 394sources 129toxicity 129
mangelroots 24, 534tops 497
Manihot esculenta see cassavamanioc see cassavamannans 17, 28, 586, 599mannitol 22, 502, 507mannose 17, 20, 22, 28, 29, 169margarine 42markers 184, 270, 325mastitis 84, 412mat grass 488matieres azotés digestibles cheval
(MADC) 455meadow hay 273, 276meadowgrass 488meat and bone meal 113, 580meat by-products 579–80meat meal 580Medicago sativa see lucerneMedicago truncatula 494megacalorie 194Melilotus albus 87
melissic acid 46menadione 86, 101menaquinone 86menhaden oil 37Merino 366metabolic disease 231metabolic faecal nitrogen see nitrogenmetabolic liveweight 347–8,
466, 471metabolisability 284, 285, 288metabolisable energy 258–79,
284–94artificially dried forage 526cereals 544efficiency 282Feed into Milk requirements 421fermentable (FME) 231, 260, 326, 360,
369, 514hays 524, 525horse diets 299–300pig diets 299–300poultry diets 258–9, 299–300prediction 298–9requirements for
egg production 392–3growth 368maintenance 348–54milk production 416–54
ruminant diets 299–300silage 509, 510, 511–13, 517straw 528systems of rationing 283–300utilisation 270–8, 295–6
associative effects 278balance of nutrients 278for egg production 277–8for growth 274–7for heat production 353for lactation 277–8, 416–18for maintenance 272–3wool growth 374–5for wool growth 290
metabolisable protein 331–3, 359–60, 369,425–30
Metabolisable Protein System (UK) 514metabolism 192–234
control of 232–3methaemoglobin 490methane 173, 176, 178, 184, 187, 243,
256–61, 265, 347, 512, 547and the environment 188–9inhibitors 185, 598, 605
methanol 550
Index
680

methionine 55, 95, 97, 117, 118, 164, 217,311–17, 391
association with cystine 312, 316,370, 371
association with glycine 371available 313–14, 316in cereal grains 541, 542, 551, 553in eggs 392in grass 483as indispensable amino acid 58, 59in protein concentrates 565–8,
571–84, 587requirement by
pig 452poultry 371, 393
in wool 373, 374methylcobalamin 87, 98methylmalonyl coenzyme A 99, 203methylmalonyl coenzyme A isomerase 231micelles 162, 169, 182Michaelis-Menten constant 151microbial fermentation 168microfibrils (of cellulose) 28micronisation 249, 558, 559middlings 555milk
compositionchemical 405–10, 412–15, 441–2,
445–6, 449, 454effect of age 413–14effect of lactation stage 414, 415
consumption 614–15digestion 164, 185fat-reduced 620fats 413, 414, 415, 434, 435–40fatty acid composition 407minerals in 113, 115, 121, 124, 401,
408–9peptides in 59–60products 584–5protein 310, 439, 565requirements for production of 405–58taints in 534, 582utilisation of energy for production of
277–8, 286–8, 289–90, 292–4,416–18
vitamins in 409–10, 433–4yields 410–12, 423–5, 434, 439–40,
444–5, 449–50, 453–4see also lactation
milk fever 110, 111, 113, 433milk vitamins in 74, 79, 90, 92, 96,
401, 584
millet 542, 557mimosine 493, 494minerals 103–36
absorption 170availability 107–8, 251, 376, 432, 444,
447–8body compartments 104in cereals 547deficiencies 466deficiency effects 136deficiency symptoms 103–36determination 12and enzymes 105, 106essential, meaning of term 103in grass 484–5, 488in hay and straw 528in legumes 492in milk 408–9organic complexes 107–9requirements for
egg production 392, 394–5lactation 430–2, 444, 447–8, 453,
455–6maintenance and growth 375–7
summary of roles 136supplements 106, 107–9in tubers 538
Mitchell, K. G. 124mitochondria 33, 195, 196, 197, 198, 201,
208, 220, 221, 223Mitscherlich relationship 421mobile nylon bag technique
(MNBT) 246–7modified acid-detergent fibre (MADF)
9, 299moisture, determination 6molasses 25, 120, 495, 509, 534, 535,
536–7, 569, 589molasses toxicity 537Molinia caerulea see purple moor grassmolybdenum 104, 106, 123–4, 130
in animal body 130and copper 130deficiency symptoms 130in enzymes 106, 130in grass 484, 488in milk 408toxicity 124, 130, 390
monensin 185, 188, 261, 595–6, 605monoacylglycerols 40, 143, 161, 162, 182monoglycerides see monoacylglycerolsmonoiodotyrosine 127monopteroylglutamic acid 95
Index
681

monosaccharides 16, 18–23, 162derivatives 20–3list 17properties 18structure 18
Morant, S.V. 411morphine 68Morrison, F. B. 283mouth, digestion in 157–9Mroz, Z. 603mucilages 17, 29, 570mucin 157, 161, 165mucopolysaccharides 133mucosal block theory 121mulberry heart disease 83muscular dystrophy 85mycosterols 47, 48mycotoxins 490–1, 503–4, 523, 573myelin 46, 123myopathy 85, 131myricyl palmitate 46myristic acid 36, 37myrosinase 571
naphthoquinones see vitamin KNational Research Council (USA) (NRC)
292, 297, 355, 356, 359, 360, 367,368, 369, 377, 418, 428, 431, 433,454, 456
near infrared reflectance spectroscopy(NIRS) 13–14, 243, 299, 324, 516
necrosis of the liver 573Neptunia amplexicaulis 132net energy 257, 262
determination 262–70requirements for
growth 366–9lactation 416–25, 442–3, 447, 450–1maintenance 346, 354–6, 419–21wool growth 374
systems for 282horses 297–8pigs and poultry 295–6ruminants 283–94, 354–6
value ofgrass 486, 490silage 513
net protein retention (NPR) 308net protein utilisation (NPU) 311, 313Neurath, H. 61neutral cellulase digestibility (NCD) 243neutral-detergent fibre (NDF) 8, 243, 247,
323, 468, 469
nickel 104, 134nicotinamide 87, 90–2, 570nicotinamide adenine dinucleotide (NAD)
87, 91, 142, 145, 193–242nicotinamide adenine dinucleotide
phosphate (NADP) 87, 91, 193–232nicotine 68nicotinic acid 90, 378, 409night blindness 77nitrates 67, 181, 320, 484, 490nitrites 67, 490, 583nitrofurans 595nitrogen 188
balance 266–8, 269, 308–9, 311, 358basal loss (BN) 305deficiency of 470degradable see rumen degradable nitrogenendogenous - determination 306–8endogenous urinary 305–8, 309, 310,
358, 374exogenous urinary 358faecal 305, 309, 310isotope (15N) 307metabolic faecal 243, 250, 309, 356,
358, 359rumen 325–6undegradable see undegradable proteinurinary 265–8, 309, 310, 356–8see also crude protein
nitrogen-free extractives 6–7nitrous oxide 188non-glucogenic ratio (NGR) 436non-protein nitrogenous (NPN) compounds
63–8, 181–2, 587–91Nordic (Scandinavian)
energy systems 291, 293protein systems 329, 428
nucleases 161nucleic acids 5, 63–5, 162, 175,
327, 585–6nucleosidases 158, 162nucleosides 64–5nucleotides 64–5, 216nutrient requirements 40, 343, 612
oat 565by-products 465, 553–4dust 553, 554grain 259, 276, 541, 542, 543, 553, 559,
560, 602hay 524hulls 553, 554naked grain 553
Index
682

silage 517–18straw 527–8
oat feed 554oat hay poisoning 67octadecanoic acid see stearic acidoctanoic acid see caprylic acidoesophageal groove 172, 185oesophagus 159, 164, 241, 242, 465oestrogens 50, 379, 494, 560oil extraction 550, 563–5oilseed cakes and meals 563–76oleic acid 32, 35, 36, 37, 38, 42, 439, 541
in milk fat 406synthesis of 223–4
oligo-1,6-glucosidase 158, 162oligosaccharides 16, 17, 23–6, 159, 162,
599–600oligotrichs 174omasum 172, 178Onobrychis viciifolia see sainfoinopaque-2 (maize) 551Ophryoscolecidae 174organic acids 5
food additives 602–4organic matter 5ornithine 211, 212, 406orotic acid 99Oryza sativa see riceosteomalacia 81, 112–13, 114ova 384, 385, 387, 388–9Overman O.R. 425oxalacetic acid 142–3, 176, 200, 203,
210–12, 221, 226, 267, 402, 488oxalates 170, 251, 497, 575oxalic acid 497oxalsuccinnic acid 200oxidation
of energy sources 195–213, 264–6of fats 40–1, 45in hay 523, 525in silage 505of vitamins 73, 75
oxidative decarboxylation 88, 89, 198oxidative phosphorylation 195–233oxidoreductases 142
palatability 464, 471palm kernel meal 569–70palmitic acid 36, 37, 208–9, 220–4, 406,
408, 439palmitoleic acid 32, 36, 223–4pancreas 146, 157, 158, 161, 165pancreatic juice 161
pangamic acid 99Panicum miliaceum see milletpantoic acid 93pantothenic acid 87, 93–4, 400, 409, 570para-aminobenzoic acid 151–2parakeratosis 129parasites 473parathyroid glands 80, 111, 112, 113parathyroid hormone 117parotid glands 157Partenen, K.H. 603partitioning 424Paspalum dilatatum 487, 491Paspalum scorbiculatum see milletpassage rate (from rumen) 184, 249, 250,
325, 491, 494passive transport (in absorption) 168pasture 43, 481–94
see also grasspeas 310, 493, 518, 578peat scours 124pectic acid 29, 175pectic substances 17, 29pectin 29, 175Pediococcus pentosaceus 501pelleting of foods 177, 178, 244–5, 249,
260, 277, 470, 526, 558, 559–60,571, 587
Pennisetum americanum see milletpentanone 41pentosanase 602pentose phosphate pathway 88, 89,
201, 202pentoses 16, 17, 19, 175, 502pepsin 158, 160, 166, 242, 243pepsinogen 160, 164peptidases 143peptide linkage 59, 160, 161, 218peptides 59–60, 158, 179, 326
alimentation 307chain formation 219elongation 219opioid 59termination 219
Peptostreptococci 179perennial ryegrass 43, 242, 245, 485, 487,
488, 490–1, 507, 522, 524peristalsis 156–7, 164, 166perosis 97, 128peroxides 83phase feeding 394phaseolunatin 576Phaseolus spp. 576, 577
Index
683

phenol 41, 163phenylalanine 56, 66, 160, 161, 164,
210, 217association with tyrosine 312, 371in eggs 392as indispensable amino acid 58, 311, 316
phenylethylamine 66Phleum pratense see timothyphosphatases 106, 158, 162phosphatidic acid 44, 224–5phosphatidylethanolamines 45phosphocreatine 198phosphoenolpyruvate 195, 199, 203–4phosphogluconate oxidative pathway see
pentose phosphate pathwayphosphoglycerate 199, 487phosphoglycerides 44–5phospholipase 158phospholipids 44–6, 50, 114, 161, 182, 484
ether 46phosphoproteins 63, 114phosphoric acid
in carbohydrates 20–1in lipids 44, 45in metabolism 195–233in nucleic acids 63–5in proteins 63
phosphorus 104, 105, 107, 114–15, 188,543, 549
absorption 170, 603in animal body 114association with carbohydrates 20–1availability 115, 251in cereals 544deficiency 81, 113, 114–15, 278, 470in eggs 392and the environment 189in grass 484, 488, 489interrelation with
calcium 113–14, 115, 568magnesium 115manganese 129zinc 129
in meal 566, 567, 568, 569, 570,571, 582
in metabolism 193–233in milk 408, 413, 585requirements for
egg production 394lactation 431–2, 444, 448, 453,
455, 456maintenance and growth 377reproduction 389
phosphorylationoxidative 195–233substrate level 195
phosphoserine 215phosvitin 63photosynthesis 3phylloquinone 86phytase 115, 189, 251, 602phytates 115, 170, 394, 543Phytelaphas macrocarpa 28phytic acid 115, 251, 394, 575phytin 189phytosterols 47, 48, 171, 549pica 114, 126pig
amino acid requirements 58, 316composition 365, 367, 380critical temperature 351, 352, 353dietary electrolyte balance 110digestion and absorption 156–64, 187,
246, 558–9, 595–7, 600–1, 602–4energy
requirements 346–8, 356, 367–8, 450–2systems for 295–6utilisation by 273, 275
essential fatty acid requirements 39feeding standards for
growth 367–8lactation 449–53maintenance 346, 356, 360reproduction 384–90, 399, 400
food intake prediction 474hypervitaminosis A 100intake regulation in 462–7mineral deficiency symptoms 123, 129mineral requirements 376, 377, 453protein evaluation for 304–17protein requirements 360, 370–3, 389, 452vitamin deficiency symptoms 80–1, 85,
88, 90, 91, 93, 94, 96, 97, 99vitamin requirements 378, 453
pigletanaemia 121digestion in 163–4
pining 125pinocytosis 169, 170, 395Pisum sativum see peasPithomyces chartarum 490pituitary hormones 380, 388placenta 384, 390, 395–6, 400plasma, spray-dried 604–5plasmologens 46pluronics 606
Index
684

pollution 345, 617poloxalene 606polyethylene glycol 184polyneuritis 89polynucleotides 64polypeptides 60–1, 219polyphenols 315polysaccharides 16–18, 26–9, 159–63,
175–9, 185, 229non-starch (NSP) 9–10
polysomes 217polyunsaturated fatty acids 34–40, 39,
48–9, 85, 390, 437, 440n-3 49, 581, 619n-6 49, 581, 619
postabsorptive state 346–7pot ale 548–9potassium 104, 105, 115–16, 251
in animal body 115–16, 270in cereals 544deficiency symptoms 116in eggs 392in grass 484interrelationship with magnesium 120losses from body 376in milk 412in suint 374
potato 187, 534, 537–8poultry 527
amino acid requirements 58, 59, 311,370–3, 393–4
dietary electrolyte balance 110digestibility measurements with 238digestion in 165, 188, 595, 600, 601energy 273
requirements 346–8, 353, 356, 368,392–3
systems for 295–6utilisation 270, 275, 278, 296, 392–3
feeding standards 368, 370–3, 391–5maintenance 346, 360
hypervitaminosis A 100intake regulation 463–7mineral deficiency symptoms 113, 116,
128, 129, 134mineral requirements 390, 394–5protein
evaluation 304–17requirements 360, 370–3, 393–4
taste 164vitamin deficiency symptoms 77–8, 81,
85, 87, 89, 90, 91–2, 93, 94, 95, 96,97, 99
vitamin requirements 378, 390, 395waste 182, 590–1
pregnancy 325, 395–402, 466, 471–2anabolism 399toxaemia 401–2
Prevotella ruminicola 174, 179probiotics 185, 189, 596–8procarboxypeptidase 161Processed Animal Protein Order 579, 591productive energy 296proelastase 161progesterone 50, 388prolamins 320proline 54, 56, 66, 170, 176, 215, 217, 554prolyl hydroxylase 133propionic acid 163, 204, 226, 439, 558, 604
as food preservative 526, 560in intake regulation 468metabolism 99, 126, 192, 202–4in rumen 176–8, 185, 188–9, 436–7, 438in silage 507as source of glucose 228utilisation
for maintenance 273for production 274, 276
propionyl coenzyme A carboxylase 96prostaglandins 38–9, 49, 95prosthetic groups 62–3, 145protamines 62protease inhibitors 249protein concentrates 563–93protein efficiency ratio (PER) 308, 565protein equivalent (PE) 318proteins 5, 53–63
absorption 168, 169–70in animal body 268, 362–5, 367, 379in artificially dried forage 526, 527carrier 168–9in cereals 541–57choice feeding 467classification 61–3deficiency 470degradable see rumen degradable proteindenaturation 61determination of amino acid composition
12–13digestibility 245, 246digestion 158–68, 179–81, 184–6, 602in eggs 392energy value 256, 367equivalent 318evaluation 303–39in grass 482, 483–4, 490
Index
685

proteins – continuedin hay 525in legumes 492–3metabolic faecal (MFP) 428–9metabolisable 331–3, 359–60metabolism 194, 261microbial 175, 179, 181, 184, 317,
318–19, 324–37, 336–7, 359,360, 426–7
in milk 406, 412, 413, 414, 415,425, 439, 443–4, 447, 449,452, 455
oxidation 265, 266vitamins in 72
properties 61requirements for
egg production 393–4Feed into Milk system (FiM)
428–30growth 369–73lactation 417, 425–30, 443–4, 447,
452, 455maintenance 356–61reproduction 389, 397–8wool production 373–5
in silage 507–11, 513–14solubility 323storage 268, 362–5, 379structure 60–1synthesis 194, 213–19, 261
activation of amino acids 216–17energy cost 219peptide chain elongation 218peptide chain formation - initiation 218peptide chain termination 218–19
truly digestible 327–8turnover 216, 274–5, 357undegradable see undegradable proteinin wool 373, 374
proteolysis 501, 508proteolytic enzymes 161, 165prothrombin 86–7protozoa 174, 185, 327, 618proventriculus 164–5provitamins 73, 75–6, 79proximate analysis of foods 5–7, 300pseudoglobulin 406Pseudomonas spp. 585, 586Pteridium aquilinum 89pteroylmonoglutamic acid 95puberty 361, 384, 385–6purines 63–5, 95, 130, 162,
327, 586
purple moor grass 485, 488putrescine 66, 502pyridoxal 87, 92–3pyridoxal phosphate 92–3, 145pyridoxamine 92–3pyridoxine 92–3pyrimadines 63–5, 162, 586pyruvate carboxylase 96, 106pyruvic acid 89, 142, 154, 175–6, 176, 195,
198–201, 207, 210, 502gluconeogenesis from 226–7
quinine 68quinones 41quinoxaline 595
rabbit 187, 247radioactive isotopes 106, 115, 120, 251,
268, 270, 321raffinose 17, 25, 483ragwort 68Ralph,A. 612rancidity 41, 569rape 127, 496, 497rapeseed
meal 563, 564, 571–3oil 37, 550
rate of passage 184, 320, 322, 325rectum 157redgut 494rennin 158, 160repartitioning agents 379reproduction 384–404respiration chamber 258, 262, 264–7respiration (in plants) 500respiratory exchange 264–8respiratory quotient 264–8, 268, 347retention time 184reticulo-rumen 172, 173reticulum 171, 172, 178retinaldehyde 76retinol see vitamin Arhamnose 21, 28, 29rhodopsin 76, 77riboflavin 73, 87, 89–90, 378, 390, 400,
409, 485, 543, 570ribonuclease 158, 162ribonucleic acid (RNA) 19, 64–5, 80, 95,
105, 162, 216–19, 321, 440ribose 17, 19, 63–5ribosomes 216–18ribozymes 144ribulose 17, 19, 202
Index
686

ribulose bisphosphate carboxylase 483rice
by-products 186, 556grain 541, 542, 555–6straw 248, 529, 530
ricinine 68ricinoleic acid 38rickets 80–1, 112, 113, 114, 394roots 533–7Rowett Research Institute 512rubidium 104rumen
bacteria, amino acid composition 330control of fermentation in 184–6, 595,
598, 605–6digestion in 159, 171–88, 437dilution rate 184dynamics 183–4fill 184, 468microorganisms 173–5
see also individual organismspH 185, 248, 326, 327, 559, 605protein breakdown in 179–81, 321–3,
324–37synchrony 186synthesis of vitamins in 88, 89, 90, 94,
99, 125–6, 183rumen degradability 245–6rumen degradable dry matter 326rumen degradable nitrogen (RDN) 231
effective 430rumen degradable protein (RDP) 180, 182,
245, 318–31, 389, 470, 514, 528,565–6
effective (ERDP) 331–2, 360, 370, 426–8,443, 447
rumen stability value (RSV) 337rumen undegradable protein (UDP) 245rumenic acid 42, 43rumenitis 605ruminants
amino acid requirements 59crude protein - fate 319digestibility measurements with 238–43,
245–6digestion in 159, 171–88energy requirements 275–7, 346, 350,
353–6, 365–7, 398, 414–25energy systems for 283–94essential fatty acid requirements 40feeding standards, maintenance 346,
354–6, 358–60food intake prediction 474–5
intake regulation in 468–73mineral deficiency symptoms 125–6mineral requirements 376, 377protein evaluation for 318–31
absorbed amino acids - efficiency ofutilisation 328–31
degradability of nitrogen fraction320–4
efficiency of nitrogen capture 325–6in vitro fermentation techniques 324microbial protein yield 326–7true digestibility 327–8, 329
protein requirements 13, 358–60,369–70, 374–5, 397–8, 425–30, 566
Feed into Milk 333–7silage dry matter intake 516teeth and chewing action 172trans fatty acids 42–3utilisation of energy by 272–3vitamin requirements 81, 88
rumination 172–3, 349Ruminococci 174, 175rutin 99rye 541, 543
grain 556straw 527, 529
ryegrass 245, 259, 273, 275, 276, 481–91,509, 524
oil 37staggers 490see also Italian ryegrass; perennial ryegrass
Rymer, C. 135
S-methylcysteine sulphoxide 496saccharin 464Saccharum officinarum see sugar caneSacchromyces cerevisiae 189sainfoin 242, 492–3, 493, 494salinomycin 185saliva 157, 158, 159, 166, 167, 172, 180,
194, 211Salmonella 570, 579, 584, 591, 599, 618salt see sodium chloridesaponification 40saponine 248, 576Scandinavian feed unit system 291, 293,
329, 428Scottish Agricultural College 512scurvy 70, 100seaweed 128sebaceous glands 373Secale cereale see ryesecretin 161
Index
687

sedoheptulose 17, 20selenium 104, 106, 109, 131–2, 390, 484
in body 131deficiency symptoms 131in eggs 392interrelationship with vitamin E 82–3,
85, 131toxicity 132
Selenomonas ruminantium 172sensory appraisal 463–4serine 44, 55, 66, 95, 210, 215, 217, 371serum albumin 406sesame seed meal 563, 575Setaria italica see milletsheanut meal 563, 576sheep
copper poisoning 124–5critical temperature 352digestibility trials with 238–40, 244–5digestion in 159, 171–88, 559–60energy requirements 346–52, 355, 365–7,
374, 396–401, 447energy utilisation 272–3feeding standards for
growth 365–7lactation 444–9maintenance 346, 355reproduction 384–90, 396–402
infertility 494intake regulation 468–73mineral deficiency symptoms 123, 125–6mineral requirements 375, 377, 400–1,
447–8nutrient requirements 612protein requirements 358–60, 369–70,
374–5, 389, 447vitamin deficiency symptoms 77, 78,
85, 90vitamin requirements 390, 391, 399–401wool production 373–5
Shorthorn 410, 413, 416silage 181, 259, 260, 273, 276, 298–9, 326,
332, 417, 470–1, 475, 492, 499–520classification 506–11nutritive value 511–17
silica 133, 248, 528, 529, 555, 556silicon 104, 133, 408silicosis 133silos 499, 500Simmental 367single-cell protein 585–6siratro 492skatole 163
skim milk 584–5small intestine see intestinesoap 40sodium 104, 105, 116–17, 168–9, 170, 251,
376, 470in animal body 116, 397in cereals 544deficiency symptoms 116in eggs 392losses from body 375, 376in milk 408, 412, 432sources 117
sodium bicarbonate 248sodium chloride 116, 117
requirements for 394, 432toxicity 117
sodium hydroxide treatmentgrain 560–1straw 249, 529–31
soil, acidity 488solanidine 537solanine 68, 537Solanum tuberosum see potatosolids-not-fat (SNF) 406, 412, 413, 414,
415, 416, 434, 584somatostatin 379sorbitol 22sorghum 541, 542, 557, 558soya bean 37, 563, 564
hay 524meal 96, 256, 275, 276, 310, 330, 370,
565, 566–8, 602oil 34, 437
specific gravity of animals 270spectroscopy
atomic absorption 12flame emission 12inductively coupled plasma emission 12near infrared reflectance (NIRS) 13–14,
243, 299, 324, 516nuclear magnetic resonance (NMR) 14
spermaceti 47spermatozoa 384–90, 494spermidine 66spermine 66sphagnum moss 536sphingomyelins 45–6sphingosine 43, 44, 45–6spices 464splay-leg syndrome 560sporidesmin 491spray-dried plasma 604–5stachyose 17, 25–6, 483
Index
688

stage of growth (of plants) 485–6, 523standard reference weight (SRW) 366–7,
369, 476starch 8, 17, 18, 26–7, 256, 388–9
and cellulolysis 248in cereal grains 541–5, 550–2, 558, 559digestion
by fowls 164–5by pigs 159, 161, 187by ruminants 175–8, 186
in legumes 492in silage 507in sugar cane 536in tubers 537, 538, 539utilisation for
maintenance 273production 276, 291
starch equivalent 283, 292steam flaking 558, 559stearic acid 36, 37, 42, 182, 183, 439stereoisomers 18sterility 390steroids 47–50, 380, 388
basic structural unit 47sterol response element binding protein
(SREBP) 440sterols 47–9, 79, 484Stickland reactions 502stiff lamb disease 85stocking rate 489stomach 157, 159, 160, 164, 166, 167–8,
463, 465ulcers 558
stravidin 97straw 527–32
alkali-treated 249, 589supplementation 531–2
streptavidin 97streptococci 24, 163, 174, 179, 313, 597strychnine 68suberin 47sublingual glands 157submandibular glands 157submaxillary glands 157succinate dehydrogenase 106succinic acid 99, 176, 199, 200succinyl coenzyme A 88, 99, 176, 203–4sucrase 24, 158, 162, 164, 165sucrose 17, 23–4, 25, 464, 483, 492, 535
digestion 158, 162sudoriferous glands 373–4sugar acids 22sugar alcohols 22
sugar beet 24, 25, 66–7, 534, 535molasses 535, 536pulp 29, 113, 162, 534, 535–6tops 497
sugarcane 24, 495molasses 536–7
sugars 8, 18–22, 589absorption 168, 169in artificially dried forage 526biofuel 550digestion 158–64, 292in grass 483in roots 533–7in silage 499–510use of term 16
suint 373–4sulphanilamide 151–2sulphite oxidase 106, 130sulphur 53, 55, 57, 62, 104, 105, 107, 111,
117–18, 123–4, 373, 470, 484, 488, 589sulphuric acid 510sunflower seed meal 563, 564, 574–5superoxide dismutase 83, 106surface area (of animals) 347swayback 123, 400sweat, horses 361swede 533, 534
tops 497sweet clover disease 87sweet potato 534, 539Synergistes jonesii 494
taints 40, 41, 67, 534, 572, 582tallow 37tannins 186, 248, 328, 570, 576
condensed 493taste 164taste buds 157taurine 58–9, 162taurocholic acid 161teart (pastures) 123, 130, 488teeth 157temperature 153, 255, 325, 393, 525, 526,
530, 580–1body 350, 463critical 351–4, 473
terpenes 50–1tetany 119–20, 588tetradecanoic acid see myristic acidtetrahydrofolic acid 87, 95tetrahymena 313–14tetrahymenol 314tetraiodothyronine 127, 131
Index
689

tetrasaccharides 17, 25–6tetroses 16, 17theobromine 575, 576thermal equivalent of oxygen 264thermoneutral zone 351–2thermostatic theory of intake regulation 463thiamin 73, 87, 88–9, 117, 378, 409, 543,
555, 570thiamin diphosphate 198
see also thiamin pyrophosphatethiamin pyrophosphate (TPP) 87, 88–9, 145thiaminase 89thiocyanate 127, 496, 571thioglucosides 571thiourea 587threonine 55, 58, 210, 311, 313, 316, 370,
392, 604synthesis 220synthetic 587
thrombin 57, 86thromboxanes 38, 39, 49thumps 121thymine 63–5thyroglobulin 54thyroid gland 127, 496thyroxine 54, 57, 105, 106, 127, 131timnodonic acid 36timothy 242, 330, 488, 524tin 104, 134–5, 408titanium dioxide 241tocopherols 41, 73, 81–4
see also vitamin Etocotrienols 82total digestible nutrients (TDN) 283–4,
291, 326toxins 68, 171, 537, 594trace elements 104, 121–35trans fatty acids 42–3, 437–8, 619transamination 58, 67, 210, 214transferases 118, 142–3transferrin 100transgalactooligosaccharides 599, 600transgenic animals 220transmethylation 97trefoil 23triacylglycerols 32, 34–8, 49, 143, 158, 161,
162, 169, 182, 192, 193, 194, 208,219, 224–5, 256, 405, 406, 408, 439,484, 584
tricarboxylic acid cycle 199–200, 203–4,205, 207, 208, 210–11, 231
Trifolium spp. see cloverstriglyceride see triacylglycerols
triiodothyronine 54, 127, 131trimethylamine 67, 572triolein 35trioses 16, 17tripalmitin 225, 264trisaccharides 17, 25triticale 556–7Triticum aestivum see wheattritium 270tropical grasses 487–8true metabolisable energy 259true protein 6, 304, 318trypsin 146, 158, 161
inhibitors 539, 566, 578trypsinogen 146, 161tryptamine 66tryptophan 56, 58, 66, 90, 160, 161, 210,
311–17, 392, 393, 604in cereal grains 542, 551, 553, 556, 557in meal 579, 580, 581
tubers 533, 534, 537–9turacin 122turkeys 95, 117turnip
roots 533, 534tops 497
tussock grass 487twin lamb disease 401tylosin 595tyramine 66tyrosine 54, 56, 66, 127, 160, 161, 210,
312, 316, 371
ubiquinone 196ultra-violet light 49, 79undegradable dietary protein (UDP)
328, 528digestible (DUP) 332, 360, 369–70, 379,
389, 427, 444, 447, 531underfeeding 344, 380–1, 385, 386, 387,
398–402, 421, 449, 471unité fouragère cheval (UFC) 297, 455uracil 63, 65, 217urea 67, 517
in diet 118, 318, 495, 530–1, 588–90metabolism of 148, 180–1, 211–12in milk 406in rumen 180, 181–2, 530in saliva 180in tissues 180, 187, 193toxicity 588treatment of foods 530, 561in urine 180, 193, 194, 258, 260, 357
Index
690

urease 148, 181, 517, 530, 588uric acid 67, 182, 213, 214, 238, 586, 591uridine diphosphate galactose 229–31uridine diphosphate glucose 229–30urine 180, 238, 356–8
energy losses in 257–60minerals in 375
urolithiasis 115uronic acids 22, 175USA
net energy system 283–4, 291–2protein system 329, 428
vaccenic acid 42, 43valeric acid 176, 436valine 55, 58, 88, 176, 179, 232–3, 311,
316, 392Van Es,A.J.H. 416Van Soest, P.J. 8, 9vanadium 104, 134vegetarians 615, 616vernolic acid 38vetches 493, 524Vicia faba 576vicianin 23villi 157, 168vinquish 125virginiamycin 595, 605Virtanen A.I. 510vision 76, 537vitamin A 73, 74–8, 83, 409, 485,
543, 551absorption 170, 171chemical nature 74hypervitaminosis 100liver reserves 74metabolism 76provitamins 75–6requirements for
egg production 395growth 377lactation 433pregnancy 399–400, 401
role in visual cycle 76sources 74symptoms of deficiency 77–8, 377, 390,
399–400, 401vitamin A2 74vitamin B complex 66, 73, 87–99, 547,
548, 567requirements for
egg production 395growth 378
synthesisin intestine 163in rumen 183
vitamin B1 see thiaminvitamin B2 see riboflavinvitamin B6 73, 92–3, 171, 409vitamin B12 73, 87, 88, 97–9, 105, 106,
125–6, 171, 178, 183, 231, 375, 391,409, 616
chemical nature 97–8deficiency symptoms 99metabolism 98–9sources 98, 573
vitamin C 62, 73, 83, 99–100, 409vitamin D 71, 73, 78–81, 112, 401,
409, 543absorption 170chemical nature 49, 78–9in grasses 485hypervitaminosis 100, 101metabolism 79–80potency of different forms 81provitamins 79and radiant energy 79requirements for
egg production 395lactation 433
in roughages 527sources 79symptoms of deficiency 80–1
vitamin E 41, 71–2, 73, 81–6, 378, 401,409, 527
absorption 170in cereals 82, 543, 545, 555chemical nature 81–2in grain 82in grasses 485interrelationships with selenium 82–3,
85, 131metabolism 82–4requirements for
lactation 434sources 82symptoms of deficiency
85–6, 390vitamin K 73, 86–7, 409
absorption 170chemical nature 86hypervitaminosis 101metabolism 86–7sources 86, 567symptoms of deficiency 87synthesis 86, 183
Index
691

vitamins 5, 70–102absorption 50, 170–1and biochemistry 71–3in cereals 543discovery 70in dried grass 527and energy utilisation 278in milk 409requirements for
egg production 395lactation 433–4, 453, 456maintenance and growth 377–8
summary 101supplementation 71synthesis 163, 183, 597
volatile fatty acids 163, 165–6, 187, 326,435–7
in intake regulation 468, 474metabolism 202–7in rumen 172, 173, 176–8, 184utilisation for
maintenance 272, 273production 274–7
voluntary food intake see food intake
wafering of foods 249water 4
in animal body 270, 362, 364in foods 468, 521, 526, 533, 535metabolic 4pollution 189in salt poisoning 394
waxes 46–7, 373, 484wheat
by-products 555grain 28, 259, 541, 542, 543, 549,
550, 554, 558–9, 560, 565,601, 602
structure 542hay 524silage 499, 517–18straw 275, 527, 529
whey 585white muscle disease 85white-fish meal see fishmealwhole crop legume silage 518whole crop silage 517–18
cracked 517wilting 505, 507–8
Wood, P.D.P. 411wool 373–5, 447
loss 494minerals in 118, 122, 131pigmentation 122, 123production 255, 374protein synthesis 220quality 375
xanthine 106, 213, 214xanthine oxidase 130xanthophylls 75, 527xerophthalmia 77xylanase 602xylans 17, 19, 26, 29, 175, 483xylose 17, 19, 29, 169, 175, 464, 566xylulose 17, 19, 202
yeast 163in cereal by-products 545, 546, 547as probiotic 185, 598in silage 502, 507as source of minerals 109, 120,
129, 130as source of vitamins 81, 88, 90–7
Yorkshire fog 487, 488ytterbium 184
Zea mays see maizezeaxanthin 75zein 551zinc 104, 105, 106, 129–30, 375
absorption 109, 170in animal body 129in cereals 544deficiency symptoms 129–30,
390, 394in eggs 392in grass 484in milk 408requirements for
egg production 394–5reproduction 390
sources 130toxicity 130
zoonoses 617–19zoosterols 47, 48zwitter ions 57zymogens 146, 157, 161
Index
692


Copyright © 2022 FDOKUMEN