NUTRITION IN SPORT - CiteSeerX
698
NUTRITION IN SPORT VOLUME VII OF THE ENCYCLOPAEDIA OF SPORTS MEDICINE AN IOC MEDICAL COMMISSION PUBLICATION IN COLLABORATION WITH THE INTERNATIONAL FEDERATION OF SPORTS MEDICINE EDITED BY RONALD J. MAUGHAN
-
Upload
khangminh22 -
Category
Documents
-
view
0 -
download
0
Transcript of NUTRITION IN SPORT - CiteSeerX

NUTRITION IN SPORT
VOLUME VII OF THE ENCYCLOPAEDIA OF SPORTS MEDICINE
AN IOC MEDICAL COMMISSION PUBLICATION
IN COLLABORATION WITH THE
INTERNATIONAL FEDERATION OF SPORTS MEDICINE
EDITED BY
RONALD J. MAUGHAN


NUTRITION IN SPORT

IOC MEDICAL COMMISSION
SUB-COMMISSION ON PUBLICATIONS IN THE SPORT SCIENCES
Howard G. Knuttgen PhD (Co-ordinator)Boston, Massachusetts, USA
Francesco Conconi MDFerrara, Italy
Harm Kuipers MD, PhDMaastricht, The Netherlands
Per A.F.H. Renström MD, PhDStockholm, Sweden
Richard H. Strauss MDLos Angeles, California, USA

NUTRITION IN SPORT
VOLUME VII OF THE ENCYCLOPAEDIA OF SPORTS MEDICINE
AN IOC MEDICAL COMMISSION PUBLICATION
IN COLLABORATION WITH THE
INTERNATIONAL FEDERATION OF SPORTS MEDICINE
EDITED BY
RONALD J. MAUGHAN
© 2000 byBlackwell Science LtdEditorial Offices:Osney Mead, Oxford OX2 0EL25 John Street, London, WC1N 2BL23 Ainslie Place, Edinburgh EH3 6AJ350 Main Street, Malden
MA 02148 5018, USA54 University Street, Carlton
Victoria 3053, Australia10, rue Casimir Delavigne
75006 Paris, France
Other Editorial Offices:Blackwell Wissenschafts-Verlag GmbHKurfürstendamm 5710707 Berlin, Germany
Blackwell Science KKMG Kodenmacho Building7–10 Kodenmacho NihombashiChuo-ku, Tokyo 104, Japan
The right of the Author to beidentified as the Author of this Workhas been asserted in accordancewith the Copyright, Designs andPatents Act 1988.
All rights reserved. No part ofthis publication may be reproduced,stored in a retrieval system, ortransmitted, in any form or by anymeans, electronic, mechanical,photocopying, recording or otherwise,except as permitted by the UKCopyright, Designs and Patents Act1988, without the prior permissionof the copyright owner.
First published 2000
Set by Excel Typesetters Co., Hong KongPrinted and bound in Great Britainat MPG Books Ltd, Bodmin, Cornwall
The Blackwell Science logo is atrade mark of Blackwell Science Ltd,registered at the United KingdomTrade Marks Registry
Part title illustrations by Grahame Baker
distributors
Marston Book Services LtdPO Box 269Abingdon, Oxon OX14 4YN(Orders: Tel: 01235 465500
Fax: 01235 465555)
USABlackwell Science, Inc.Commerce Place350 Main StreetMalden, MA 02148 5018(Orders: Tel: 800 759 6102
781 388 8250Fax: 781 388 8255)
CanadaLogin Brothers Book Company324 Saulteaux CrescentWinnipeg, Manitoba R3J 3T2(Orders: Tel: 204 837-2987)
AustraliaBlackwell Science Pty Ltd54 University StreetCarlton, Victoria 3053(Orders: Tel: 3 9347 0300
Fax: 3 9347 5001)
A catalogue record for this titleis available from the British Library
ISBN 0-632-05094-2
Library of CongressCataloging-in-publication Data
Nutrition in sport/edited by Ronald J. Maughan.p. cm. — (Encyclopedia of sports medicine; ISSN
v .7)‘An IOC Medical Commission publication in collabora-
tion with the International Federation of Sports Medicine.’ISBN 0-632-05094-21. Nutrition. 2. Energy metabolism. 3. Exercise —
Physiological aspects. 4. Athletes — Nutrition.I. Maughan, Ronald J. II. IOC Medical Commission.III. International Federation of Sports Medicine.IV. Series.QP141.N793 1999616.3¢9¢0088796 — dc21 99-12066
CIP
For further information onBlackwell Science, visit our website:www.blackwell-science.com

Contents
9 Amino Acid Metabolism in Exercise, 119a.j.m. wagenmakers
10 Effects of Exercise on Protein Metabolism, 133p.w.r. lemon
11 Amino Acids, Fatigue and Immunodepression in Exercise, 153e.a. newsholme and l.m. castell
12 Nutrition, Neurotransmitters and CentralNervous System Fatigue, 171j.m. davis
13 Fat Metabolism during Exercise, 184j.a. hawley, a.e. jeukendrup andf. brouns
14 Adaptations to a High Fat Diet, 192b. kiens and j.w. helge
15 Temperature Regulation and Fluid andElectrolyte Balance, 203r.j. maughan and e.r. nadel
16 Effects of Dehydration and Rehydration onPerformance, 216m.n. sawka, w.a. latzkaand s.j. montain
17 Water and Electrolyte Loss and Replacement in Exercise, 226r.j. maughan
List of Contributors, ix
Forewords, xiii
Preface, xv
Part 1: Nutrition and Exercise
1 Basic Exercise Physiology, 3h.g. knuttgen
2 Biochemistry of Exercise, 17m. gleeson
3 Exercise, Nutrition and Health, 39a.e. hardman
4 Energy Costs of Exercise and Sport, 53h.j. montoye
5 Dietary Carbohydrates, 73l.m. burke
6 Carbohydrate Metabolism in Exercise, 85e. hultman and p.l. greenhaff
7 Optimization of Glycogen Stores, 97j.l . ivy
8 Carbohydrate Replacement during Exercise, 112m. hargreaves
v

18 Gastrointestinal Function and Exercise, 241n.j. rehrer and d.f. gerrard
19 Rehydration and Recovery after Exercise, 256s.m. shirreffs
20 Vitamins: Metabolic Functions, 266m. fogelholm
21 Vitamins: Effects of Exercise on Requirements, 281j. chen
22 Exercise-induced Oxidative Stress andAntioxidant Nutrients, 292c.k. sen, s. roy and l. packer
23 Minerals: Calcium, 318k.p. aulin
24 Minerals: Iron, 326e.r. eichner
25 Trace Minerals, 339p.m. clarkson
26 Nutritional Ergogenic Aids, 356m.h. williams andb.c. leutholtz
27 Creatine, 367p.l. greenhaff
28 Caffeine, 379l.l. spriet and r.a. howlett
29 Bicarbonate and Citrate, 393l.r. mcnaughton
30 Alcohol in Sport, 405l.m. burke and r.j. maughan
Part 2: Special Considerations
31 The Female Athlete, 417k.a. gabel
vi contents
32 The Young Athlete, 429v.b. unnithan anda.d.g. baxter-jones
33 The Vegetarian Athlete, 442j.r. berning
34 The Diabetic Athlete, 457j. jensen and b. leighton
Part 3: Practical Issues
35 The Overweight Athlete, 469m.m. manore
36 The Travelling Athlete, 484a.c. grandjean and j.s . ruud
37 Overtraining: Nutritional Intervention, 492h. kuipers
38 Exercise at Climatic Extremes, 497m.a. febbraio
39 Eating Disorders in Athletes, 510j. sundgot-borgen
40 Sports Nutrition Products, 523r. murray
Part 4: Sport-specific Nutrition
41 Sprinting, 535c.w. nicholas
42 Distance Running, 550j.a. hawley, e.-j. schabortand t.d. noakes
43 Cycling, 562a.e. jeukendrup
44 Team Sports, 574j. bangsbo
45 Gymnastics, 588d. benardot
46 Swimming, 609r.l. sharp
47 Weightlifting and Power Events, 621v.a. rogozkin
48 Racquet Sports, 632m. hargreaves
49 Weight Category Sports, 637j.h. wilmore
50 Skating, 646a.c. snyder and c. foster
51 Cross-country Skiing, 656b. ekblom and u. bergh
Index, 663
contents vii


List of Contributors
P.M. CLARKSON PhD, Department of ExerciseScience, University of Massachusetts, Amherst, Mass-achusetts 01003, USA
J .M. DAVIS PhD, Department of Exercise Science,University of South Carolina, Columbia, South Carolina29209, USA
E.R. EICHNER MD, Section of Hematology (EB-271), University of Oklahoma, Health Sciences Center,Oklahoma City, Oklahoma 73190, USA
B. EKBLOM MD, Department of Physiology andPharmacology, Karolinska Institute, Stockholm, Sweden
M.A. FEBBRAIO PhD, Exercise Physiology and Metabolism Laboratory, Department of Physiology, University of Melbourne, Parkville 3052,Australia
M. FOGELHOLM ScD, University of Helsinki,Lahti Research and Training Centre, Saimaankatu 11,15140 Lahti, Finland
C. FOSTER PhD, Department of Exercise and SportScience, University of Wisconsin-La Crosse, La Crosse,Wisconsin 54601, USA
K.A. GABEL PhD, RD, School of Family and Consumer Sciences, College of Agriculture, University ofIdaho, Moscow, Idaho 8344-3183, USA
D.F. GERRARD MB, ChB, Dunedin School ofMedicine, PO Box 913, University of Otago, Dunedin,New Zealand
M. GLEESON PhD, School of Sport and Exercise
K.P. AULIN MD, PhD, Department of Medical Sciences, University of Uppsala; Institute of Sport Sciences, Dalarna University, S-79188 Falun, Sweden
J . BANGSBO PhD, Department of Human Physiology, August Krogh Institute, University ofCopenhagen, 13 Universitetsparken, DK-2100 Copenhagen, Denmark
A.D.G. BAXTER-JONES PhD, Departmentof Child Health, University of Aberdeen, Foresterhill,Aberdeen AB25 2ZD, UK
D. BENARDOT PhD, Center for Sports MedicineScience and Technology, Georgia State University,Atlanta, Georgia 30303, USA
U. BERGH PhD, Defence Research Establishment,17290 Stockholm, Sweden
J .R. BERNING PhD, Department of Biology, Uni-versity of Colorado at Colorado Springs, 1420 AustinBluffs Parkway, Colorado Springs, Colorado 80933, USA
F. BROUNS PhD, Department of Human Biology,Maastricht University, 6200 MD Maastricht, TheNetherlands
L.M. BURKE PhD, Australian Institute of Sport,PO Box 176, Belconnen, Australian Capital Territory2616, Australia
L.M. CASTELL MSc, University Department ofBiochemistry, South Parks Road, Oxford OX1 3QU, UK
J. CHEN MD, Institute of Sports Medicine, BeijingMedical University, Beijing 100083, China
ix

Sciences, University of Birmingham, Birmingham B152TT, UK
A.C. GRANDJEAN Ed.D, International Centerfor Sports Nutrition, Center for Human Nutrition, 502 South 44th Street, Omaha, Nebraska 68105-1065,USA
P.L. GREENHAFF PhD, School of BiomedicalSciences, Queens Medical Centre, Nottingham NG72UH, UK
A.E. HARDMAN PhD, Department of PhysicalEducation, Sports Science and Recreation Management,Loughborough University, Loughborough LE11 3TU, UK
M. HARGREAVES PhD, School of Health Sci-ences, Deakin University, Burwood 3125, Australia
J .A. HAWLEY PhD, Department of HumanBiology and Movement Science, Faculty of Biomedicaland Health Science, RMIT University, PO Box 71, Bundoora, Victoria 3083, Australia
J .W. HELGE PhD, Copenhagen Muscle ResearchCentre, August Krogh Institute, University of Copen-hagen, 13 Universitetsparken, DK-2100 Copenhagen,Denmark
R.A. HOWLETT PhD, Department of Medicine,University of California-San Diego, La Jolla, California92093-0623, USA
E. HULTMAN MD, Department of Medical Labora-tory, Science and Technology, Division of Clinical Chem-istry, Hiddinge University Hospital, KarolinskaInstitute, S-14186 Huddinge, Sweden
J .L. IVY PhD, Exercise Physiology and MetabolismLaboratory, University of Texas at Austin, Belmont Hall, Austin, Texas 78712, USA
J . JENSEN PhD, Department of Physiology, NationalInstitute of Occupational Health, PO Box 8149 Dep, N-0033 Oslo, Norway
A.E. JEUKENDRUP PhD, School of Sport andExercise Sciences, University of Birmingham, Birmingham B15 2TT, UK
x list of contributors
B. KIENS PhD, Copenhagen Muscle Research Centre,August Krogh Institute, University of Copenhagen, 13Universitetsparken, DK-2100 Copenhagen, Denmark
H.G. KNUTTGEN PhD, Department of PhysicalMedicine and Rehabilitation, Harvard University andSpaulding Rehabilitation Hospital, 125 Nashua Street,Boston, Massachusetts 02114-1198, USA
H. KUIPERS MD, Department of Movement Sci-ences, Maastricht University, PO Box 616, Maastricht6200 MD, The Netherlands
W.A. LATZKA ScD, US Army Research Instituteof Environmental Medicine, Kansas Street, Natick, Mass-achusetts 01760, USA
B. LEIGHTON PhD, Zeneca Pharmaceuticals,Alderley Park, Macclesfield SK10 4TG, UK
P.W.R. LEMON PhD, 3M Centre, University of Western Ontario, London, Ontario N6A 3K7, Canada
B.C. LEUTHOLTZ PhD, Department of ExerciseScience, Physical Education and Recreation, Old Dominion University, Norfolk, Virginia 23529-0196,USA
L.R. McNAUGHTON PhD, Department of LifeScience, Kingston University, Penrhyn Road, Kingston-upon-Thames, Surrey KT1 2EE, UK
M.M. MANORE PhD, Food and Nutrition Labora-tory, Department of Family Resources, Arizona StateUniversity, Tempe, Arizona 85287-2502, USA
R.J . MAUGHAN PhD, Department of Biochemi-cal Sciences, University Medical School, Foresterhill,Aberdeen AB25 2ZD, UK
S.J . MONTAIN PhD, US Army Research Instituteof Environmental Medicine, Kansas Street, Natick, Mass-achusetts 01760, USA
H.J. MONTOYE PhD, Department of Kinesiology,College of Education, Michigan State University, EastLansig, Michigan 48824-1049, USA
R. MURRAY PhD, Exercise Physiology Laboratory,

Quaker Oats Company, 617 West Main Street, Barrington, Illinois 60010, USA
E.R. NADEL PhD, John B. Pierce Foundation Lab-oratory, Yale University School of Medicine, 290 Con-gress Avenue, New Haven, Connecticut 06519, USA (DrE.R. Nadel unfortunately passed away during publica-tion of this volume)
E.A. NEWSHOLME MA, PhD, DSc, University Department of Biochemistry, South ParksRoad, Oxford OX1 3QU, UK
C.W. NICHOLAS PhD, Department of PhysicalEducation and Sports Science, University of Lough-borough, Loughborough, Leicestershire LE11 3TU, UK
T.D. NOAKES MB, ChB, Sports Science Instituteof South Africa, Newlands, 7800 South Africa
L. PACKER PhD, Department of Molecular and CellBiology, University of California at Berkeley, 251 LifeScience Addition, Berkeley, California 94720-3200, USA
N.J. REHRER PhD, School of Physical Education,PO Box 56, Otago University, Dunedin, New Zealand
V.A. ROGOZKIN PhD, Research Institute ofPhysical Culture, Pr Dinamo 2, St Petersburg 197110,Russia
S. ROY PhD, Department of Molecular and CellBiology, University of California at Berkeley, 251 LifeScience Addition, Berkeley, California 94720-3200, USA
J .S . RUUD MS, RD, Center for Human Nutrition,502 South 44th Street, Omaha, Nebraska 68105-1065,USA
M.N. SAWKA PhD, US Army Research Institute ofEnvironmental Medicine, Kansas Street, Natick, Mass-achusetts 10760, USA
E.-J . SCHABORT MSc, Sports Science Institute ofSouth Africa, Newlands, 7800 South Africa
C.K. SEN PhD, Department of Molecular and CellBiology, University of California at Berkeley, 251 LifeScience Addition, Berkeley, California 94720-3200, USA
R.L. SHARP PhD, Department of Health andHuman Performance, Iowa State University, Ames, Iowa50011-1160, USA
S.M. SHIRREFFS PhD, Department of BiomedicalSciences, University Medical School, Foresterhill,Aberdeen AB25 2ZD, UK
A.C. SNYDER PhD, Department of Human Kinet-ics, University of Wisconsin-Milwaukee, PO Box 413,Milwaukee, Wisconsin 53201, USA
L.L. SPRIET PhD, Department of Human Biologyand Nutritional Sciences, University of Guelph, Guelph,Ontario N1G 2W1, Canada
J . SUNDGOT-BORGEN PhD, Department ofBiology and Sports Medicine, Norwegian University ofSport and Physical Education, Oslo, Norway
V.B. UNNITHAN PhD, Department of Exerciseand Sport Science, University of San Francisco, 2130Fulton Street, San Francisco, California 94117-1080,USA
A.J.M. WAGENMAKERS PhD, Departmentof Human Biology, Maastricht University, PO Box 616,6200 MD Maastricht, The Netherlands
M.H. WILLIAMS PhD, Human PerformanceLaboratory, Old Dominion University, Norfolk, Virginia23529-0196, USA
J .H. WILMORE PhD, Department of Health andKinesiology, Texas A&M University, 158 Read Building,College Station, Texas 77843-2443, USA
list of contributors xi


Forewords
xiii
On behalf of the International Olympic Com-mittee, I should like to welcome Volume VII of the Encyclopaedia of Sports Medicine series.This new volume addresses nutrition in sport.Emphasis is given to the role of proper nutri-tion in enhancing good health, well being and the performance capacity of men and women athletes.
I should like to thank all those involved in thepreparation of this volume whose work is highlyrespected and appreciated by the whole OlympicFamily.Juan Antonio SamaranchMarqués de Samaranch
In planning the year-round conditioning pro-gramme and making the final preparations forcompetition, each athlete must carefully considerfood intake in order to ensure that all tissues andbody systems have available the essential ele-ments for the provision of energy and properfunction. Proper nutrition is also essential for
maintenance of a body mass and compositionappropriate to each sport event.
The new volume, Nutrition in Sport, provides awealth of information on the relationship of themetabolism of carbohydrates, fats and proteinsas well as the important involvement of vitaminsand minerals to success in sports performance.Special consideration is given to optimal per-formance in specific sports events. Emphasis isgiven to the role of proper nutrition in enhanc-ing good health, well being and the performancecapacity of men and women athletes. The editor,Professor Ronald J. Maughan, has recruited over60 of the world’s leading nutritionists and physi-ologists to participate in this project. On behalf of the International Olympic Committee and itsMedical Commission I should like to extend oursincere appreciation to the members of our Sub-commission on Publications in the Sport Sciencesand to Blackwell Science, who have made thepublication of this book possible.Prince Alexandre de MerodeChairman, IOC Medical Commission


Preface
xv
At an international Consensus Conference heldin 1991 at the offices of the International OlympicCommittee in Lausanne, a small group of expertsconducted a comprehensive review of the avail-able information and concluded that ‘Diet sig-nificantly influences athletic performance’. Thisstatement is unequivocal: what we eat and drink,how much we consume and when it is consumedcan all have positive or negative effects on per-formance in training and in competition. For the athlete striving to succeed at the highest level and training to the limits of what can be tolerated, this offers an avenue that cannot beignored. Choosing the right foods will not makethe mediocre performer into a world beater, but apoor choice of diet will certainly prevent all ath-letes from realizing their full potential. This maynot be a major concern for the recreational ath-lete or for the ‘weekend warrior’ who train andcompete for enjoyment and for the health bene-fits that exercise participation confers. For thecommitted athlete, however, there seems littlepoint in taking other aspects of performance seri-ously and neglecting diet.
In spite of the importance of diet for health aswell as for athletic performance, there are manypopular misconceptions, and this reflects in partthe limited availability of reliable information.Until recently, there were few books on sportsnutrition available to the coach and athlete or to the scientist with an interest in this area, butseveral have been published in the last decade.Few of these, however, have encompassed thewhole breadth of the subject from the basic
science to the practical issues that affect trainingand competition. In keeping with the format ofthe previous volumes in this series and with theconcept that is implied by the term encyclopae-dia, this volume has attempted to do that. Itbrings together sports nutrition—the underlyingscience that allows identification of nutritionalgoals—and sports dietetics—the practical appli-cation of that science on an individual basis todefine the eating strategies that will allow athletes to achieve those goals. This aim has been made possible by the enthusiastic participa-tion in the preparation of this book by leadingexperts, including both scientists and practi-tioners, from around the world who have con-tributed to the 51 chapters of this book. In manycases, individual chapters are the result of a col-laborative effort involving authors from morethan one country, bringing a true internationalperspective. This reflects the internationaldimension of science and the sense of sharedpurpose among those who work in this field.Although there is an element of competition inscience, it is not parochial and the knowledge it generates is available to all. The depth andbreadth of the expertise of these authors makesthat knowledge available and serves to empha-size those areas where there is a broad consensusof opinion, and to pinpoint areas of uncertaintywhere more information is required.
The contents of this book are divided into foursections, each emphasizing different aspects ofthe art and science of sports nutrition. The first,and largest, section covers the basic science that

underpins the practice of sports nutrition; thesechapters provide definitive information in theform of comprehensive reviews of specific topics.In the second section, a variety of special situa-tions are considered: this begins the move fromthe underlying science to practical application bybringing together information from differentsources to focus on specific issues that affect per-formance. The second section of the book dealswith the nutritional needs of special populationsand the strategies that must be developed tomeet those needs. The third section focuses on some of the practical issues encountered inworking with élite-level athletes. The finalsection of the book provides a detailed coverageof the specific issues relating to preparing for,and competing in, a wide range of differentsports: this section highlights the diversity ofsport and reminds the reader that the generali-zations that are inevitably made in the pre-
ceding sections must be applied with caution when dealing with individuals competing insports that place very different demands on participants.
The sheer size of this book reflects the breadthand depth of the field of sports nutrition. It is atestimony to the expertise of the authors that theinformation this volume contains is presented in a way that will be useful to those engaged inresearch and teaching as well as being accessibleto those who can benefit most from its practicalapplication. These include exercise scientists andsports physicians, nutritionists and dietitians.Some background knowledge is necessary for a full appreciation of the contents, but theinformed and educated coach and athlete shouldfind much of interest.
Ron Maughan1999
xvi preface

PART 1
NUTRITION AND EXERCISE


Introduction
The performance of sport, as with all physicalexercise, is dependent upon the coordinated acti-vation of the athlete’s skeletal muscles. Themuscles constitute the sources of the forces andpower required for skilled movement. Unfortu-nately, the description and quantification of exer-cise is frequently made awkward, if not difficult,by a variety of terms, some of which are confus-ing or inaccurate. Through the years, terms havebeen regularly misused and units of measure-ment inappropriately applied.
Exercise
The term exercise, itself, has been defined in dif-ferent ways by different sources in the literature.For the Encyclopaedia of Sports Medicine series ofpublications, the definition has been accepted as‘any and all activity involving generation of forceby activated skeletal muscle’ (Komi 1992). Thiswould include activities of daily living, activitiesof labour, activities for physical conditioning andphysical recreation, as well as participation insport competition. In the Encyclopaedia of SportsMedicine series, a sport will be considered as any organized activity that involves exercise,rules governing the event and the element ofcompetition.
To bring about movement of the body partsand coordinate the skills of a sport, the centralnervous system activates the striated, voluntarymuscle cells which are the principal constituents
of the various structures called skeletal muscles.The response of muscle cells to neural stimula-tion is to produce force.
In order to develop force, skeletal muscle cellsare activated by electrochemical impulses arriv-ing via efferent neurones, the cell bodies of whichare located in the anterior horn of the gray matterof the spinal cord. When the threshold of excita-tion of the muscle cells of a motor unit has beenattained, electrochemical events within eachmuscle cell (fibre) result in the cylindrical fibregenerating force along its longitudinal axis inorder to draw the ends of the cylinder towards its midsection. In this way, the activated fibresdevelop force between the attachments of themuscle in which they are contained. It has beenproposed that this process be referred to as amuscle ‘action’ (Cavanagh 1988) rather than‘contraction’ due to the fact that any activatedindividual fibre and, indeed, an entire musclemay: (i) shorten the distance along its longitudi-nal axis, (ii) be held at the same length by anopposing force, or (iii) be forcibly stretched inlength by an opposing force. The term action hasthe advantage of being independent of a changein length or of direction. By definition, contractionmeans shortening only.
The terminology employed to identify thethree actions thus deserves discussion and expla-nation. The interaction of muscle force develop-ment and the external forces will result in actionsthat produce static exercise (no movement aboutthe related joints) or in dynamic exercise (result-ing in a change in joint angles). Static exercise of
Chapter 1
Basic Exercise Physiology
HOWARD G. KNUTTGEN
3

activated muscle is traditionally referred to asisometric. Force is developed but, as there is nomovement, no work is performed. All othermuscle actions involve movement and aretermed dynamic. The term concentric is tradition-ally used to identify a shortening action and theterm eccentric is used to identify a lengtheningaction, although the origin of these terms isobscure (Table 1.1) (Knuttgen & Kraemer 1987).
The International System
Some years ago, the world of science adopted anInternational System of Measurement (BureauInternational des Poids et Mésures 1977; LeSystème International, abbreviated as SI) to quan-tify all physical entities and processes. The unitof force in the SI is the newton (N). One newton isquantified as the force which imparts to a mass of1 kilogram an acceleration of 1 metre per secondper second. To develop force, a muscle cellrequires energy, and the SI unit for energy is thejoule (J).
When force is expressed through a displace-ment (i.e. movement of body parts is occurring),work is measured as force (N) multiplied by thedistance (m) of the displacement, and work canbe calculated as force¥ distance: 1N¥ 1m= 1J.During movement, the performance of workinvolves conversion of one form of energy (J) toanother. The SI unit for energy is the same unitused to quantify work. One joule is the energy of1 newton acting through a distance of 1 metre.
Any energy used by the muscle for force devel-opment that does not result in work becomesheat, the SI unit for heat also being the joule.Obviously, direct relationships exist amongenergy, work and heat and they are quantified
4 nutrition and exercise
with the same unit, the joule. Throughout thispublication, the term energy will most often referto metabolic energy.
When time [SI unit, the second (s)] becomes afactor in quantifying energy release, the perfor-mance of work or the generation of heat, then therate of energy release, work performance or heatgeneration is presented as power, the SI unit forwhich is the watt (W) (1 J¥1 s–1 =1 W). In exercisein which 150 W of external power is produced ata metabolic cost of 750 W, then the rate of heatproduction is 600W.
Attention should be called at this point to thefact that, when describing exercise and sport,physiologists and nutritionists can be interestedin the available energy content that can bemetabolized from the food ingested (J), the totalstored energy available for the muscle cells (J),the total energy utilized during a conditioningsession or sports performance (J), or the rate atwhich muscle cells are called upon to producepower (W).
The joule and the calorie
As described above, the joule is the SI unit usedto quantify energy, work and heat. This providesa simple and efficient basis for describing therelationship among nutrition, exercise perfor-mance, body heat generation and heat dissipa-tion, both in terms of total amounts (in joules) oras power (in watts). Unfortunately, the calorieand its multiple, the kilocalorie (kcal), have beenutilized for so long in nutritional circles that achange to the description of the energy content offoods in joules is being implemented very slowly.Instead of utilizing the convenient relationshipsamong newtons, joules, seconds and watts, conversion factors need to be employed. Forexample, 1cal=4.186 J and 1kcal= 4.186kJ.
When a mechanically braked cycle ergometeris used for an exercise bout, one method ofobtaining the desired power production wouldbe to have the subject cycle at a pace that wouldproduce a ‘velocity’ of the flywheel rim of 5 m·s–1
and provide an opposing force (sometimestermed ‘resistance’) of 60 N. The simplest way of
Table 1.1 Classification of exercise and muscle actiontypes.
Exercise Muscle action Muscle length
Dynamic Concentric DecreasesDynamic Eccentric IncreasesStatic Isometric No change

quantifying exercise is with SI units. The bout ofexercise can be described as follows:
Power developed on the ergometer: 300W
Duration of exercise: 600 s (10 min)
Metabolic power (derived from oxygen uptake):1500W
Total metabolic energy utilized =1500 W¥ 600s= 900000 J=900 kJ
Mechanical efficiency =300 W/1500 W¥ 100=20%
If work is calculated by using a ‘kilogram offorce’ (an improper unit of measurement!), akilogram-metre can be utilized as an unsanc-tioned unit to quantify work. Conversion factorswould be utilized to convert kilogram-metresper unit of time into the correct unit for power,the watt. If the calorie is used to quantify meta-bolic energy, conversion factors must be utilizedto obtain a measurement of metabolic power thatcan be compared to the power transferred to thecycle ergometer. It is far easier to utilize SI unitsthroughout all research activity and scientificwriting: the newton, the metre, the second, thejoule and the watt. (It is important to call atten-tion to the fact that a kilogram-metre [kg-m] inthe SI is actually the correct unit of measurementfor torque.)
There are an infinite number of configurationsof force and velocity (determined by cadence onthe ergometer) that can produce the desiredexternal power produced and therefore meta-bolic power desired.
In this volume, the editorial decision wasmade to acknowledge the continued and exten-sive use of the kilocalorie (kcal) in much of thescientific literature for the quantification of theenergy content of foods and therefore to permitthe use of this unit of measurement in the variouschapters where considered expedient.
Energy for muscle activity
The mechanical and biochemical events associ-ated with muscle cell force development are
described in detail in Chapter 2. However, it isworth making the following general commentsand observations as related to nutrition for sport.
The immediate source of energy for muscleforce and power production is adenosinetriphosphate (ATP). ATP is the final biochemicalcarrier of energy to the myofilaments for the gen-eration of force. The breakdown of phosphocrea-tine (PCr) serves to reconstitute ATP when othersources contribute little or no energy. Eachmuscle cell then becomes dependent on fat (fattyacids), carbohydrate (glucose and glycogen) and,to a very limited extent, protein (amino acids) asthe sources of energy to resynthesize ATP andPCr during exercise. All persons concerned withthe nutrition of the athlete must consider thenutritional demands of the long-term condition-ing programme, the preparation for competitionand the competitive event itself, when planningindividual meals as well as the weekly andmonthly dietary programmes.
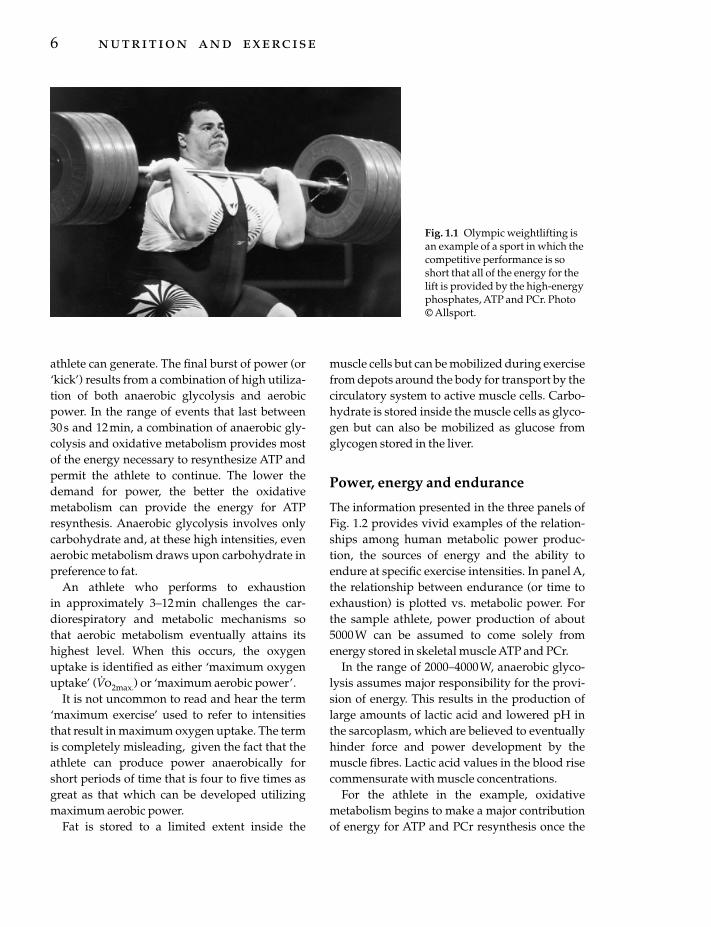
It is generally accepted that the muscle cellsobtain all the energy needed for short-term sportperformance of a few seconds (as in the throwingand jumping events of track and field, weight-lifting and springboard and platform diving)from ATP and PCr (Fig. 1.1). These compoundsare then resynthesized during recovery. When asport performance lasts approximately 10 s (e.g.the 100-m run), other energy sources, includingespecially anaerobic glycolysis (resulting in lacticacid formation in the muscle), must also con-tribute to the resynthesis of ATP. The lower theintensity and the longer the event, the better ableis aerobic glycolysis to contribute energy. It isalso assumed that, during events that are stillconsidered ‘sprints’ but that last longer than afew seconds, aerobic metabolism begins to makea contribution to ATP resynthesis.
As the duration of the exercise periodincreases still further, the energy from the oxida-tion of a combination of fat and carbohydratebecomes a significant source of energy. If exerciselasts 15min or longer, such intensities demand asteady-state of aerobic metabolism (i.e. lowerthan maximum aerobic metabolism) except forany final effort that calls forth all the power the
basic exercise physiology 5
athlete can generate. The final burst of power (or‘kick’) results from a combination of high utiliza-tion of both anaerobic glycolysis and aerobicpower. In the range of events that last between 30s and 12min, a combination of anaerobic gly-colysis and oxidative metabolism provides mostof the energy necessary to resynthesize ATP andpermit the athlete to continue. The lower thedemand for power, the better the oxidativemetabolism can provide the energy for ATPresynthesis. Anaerobic glycolysis involves onlycarbohydrate and, at these high intensities, evenaerobic metabolism draws upon carbohydrate inpreference to fat.
An athlete who performs to exhaustion in approximately 3–12 min challenges the car-diorespiratory and metabolic mechanisms sothat aerobic metabolism eventually attains itshighest level. When this occurs, the oxygenuptake is identified as either ‘maximum oxygenuptake’ (V
.o2max.) or ‘maximum aerobic power’.
It is not uncommon to read and hear the term‘maximum exercise’ used to refer to intensitiesthat result in maximum oxygen uptake. The termis completely misleading, given the fact that theathlete can produce power anaerobically forshort periods of time that is four to five times asgreat as that which can be developed utilizingmaximum aerobic power.
Fat is stored to a limited extent inside the
6 nutrition and exercise
muscle cells but can be mobilized during exercisefrom depots around the body for transport by thecirculatory system to active muscle cells. Carbo-hydrate is stored inside the muscle cells as glyco-gen but can also be mobilized as glucose fromglycogen stored in the liver.
Power, energy and endurance
The information presented in the three panels ofFig. 1.2 provides vivid examples of the relation-ships among human metabolic power produc-tion, the sources of energy and the ability toendure at specific exercise intensities. In panel A,the relationship between endurance (or time toexhaustion) is plotted vs. metabolic power. Forthe sample athlete, power production of about5000W can be assumed to come solely fromenergy stored in skeletal muscle ATP and PCr.
In the range of 2000–4000W, anaerobic glyco-lysis assumes major responsibility for the provi-sion of energy. This results in the production oflarge amounts of lactic acid and lowered pH inthe sarcoplasm, which are believed to eventuallyhinder force and power development by themuscle fibres. Lactic acid values in the blood risecommensurate with muscle concentrations.
For the athlete in the example, oxidativemetabolism begins to make a major contributionof energy for ATP and PCr resynthesis once the
Fig. 1.1 Olympic weightlifting isan example of a sport in which thecompetitive performance is soshort that all of the energy for thelift is provided by the high-energyphosphates, ATP and PCr. Photo© Allsport.

power output falls to approximately 2000W. It is at power productions of 1500–1800W thatthe maximum oxygen uptake (V
.o2max. of 2.7
mmol · s–1) is elicited for this athlete during thefinal stage of an exercise bout. At 1500 W, theathlete could sustain exercise for approximately8min but at 1800W, for less than 5min.
Below 1500W (Fig. 1.2b), the athlete is able tosustain exercise for extended periods with com-pletely or nearly completely aerobic metabolism,utilizing fat and carbohydrate to resynthesizeATP and PCr. The letter ‘M’ is placed on the
abscissa to indicate the power production corre-sponding to about 75–80% V
.o2max. that the
athlete could sustain for a marathon (42.2 km). Atany higher level, the athlete would enlist anaero-bic glycolysis, accumulate lactate and lower pHvalues in the skeletal muscle cells, and be forced,eventually, to reduce power or stop.
Note the relatively narrow range of power pro-duction that can be produced completely aerobi-cally by comparing Fig. 1.2b with Fig. 1.2a.Marathon pace in this example would constituteapproximately 24% of maximum power produc-
basic exercise physiology 7
*
*
***
*
* *
40
30
20
10
0
End
ura
nce
tim
e to
exh
aust
ion
(m
in)
0 2000 4000 6000
Metabolic power (W)
3
2
1
1.0
0.9
0.8
0.7
100
75
50
25
0
0
25
50
75
100
Rest 500 1000 1500 2000 6000 Rest 500 1000 1500 2000 6000
Metabolic power (W) Metabolic power (W)
M
VO
2 (m
mo
l. s–1
).
RQ
%CHO
%Fat
(a)
(b) (c)
Fig. 1.2 The relationships of (a) endurance time, (b) oxygen uptake in steady state, and (c) respiratory quotient(RQ) and percentage substrate utilization to human metabolic power production. Values presented for power arerepresentative for an 80-kg athlete.

tion and the range for maximum aerobic powerwould constitute approximately 30% of maxi-mum power production (Fig. 1.3).
In Fig. 1.2c, the relationship of respiratory quo-tient (RQ) as determined from steady-state respi-ratory exchange ratio (RER) to metabolic poweris presented. RER, which compares oxygenuptake to carbon dioxide removal in the lungs,attains steady state at lower levels of power pro-duction (in this example, less than 1500 W). Thevalues for RQ vs. power production are modifiedfrom Åstrand and Rodahl (1986). A range is pre-sented to accommodate different values thatmight be obtained during different days as aresult of variations in the athlete’s diet. Utilizingboth the left-side and the right-side ordinates, theobserved RQs indicate a high utilization of car-bohydrate from approximately 75% of maximumaerobic power and upwards. The higher the intensity, the greater is the contribution ofcarbohydrate.
An athlete maintaining a diet high in carbohy-drate will maintain a higher RQ at all levels ofaerobic exercise, whereas the RQ of an athletewith a low intake of carbohydrate will remainremarkably lower. During long-lasting eventsand training bouts, the RQ will become lower atany chosen intensity the longer the exercise lasts,as it is related to increasing free fatty acid avail-
8 nutrition and exercise
ability and falling levels of glycogen in the activemuscles. RQ can also be affected by the ingestionof a substance such as caffeine which results in anenhanced utilization of fatty acids for the energydemands of exercise.
Skeletal muscle
A skeletal muscle is made up predominantly ofextrafusal skeletal muscle fibres, long cylindricalcells which run the length of the muscle, be itshort or long (e.g. 1–300mm). Intrafusal fibresare the small skeletal muscle cells found in themuscle spindles which assist in controlling thebody’s coordinated movement. The muscle alsoincludes connective tissue which provides someorganization to the muscle’s internal structure(white connective tissue) and elasticity (yellowconnective tissue). Arteries, veins and capillariesmade up of smooth muscle, connective tissueand epithelial cells are found throughout eachmuscle, serving as the combination delivery/removal system. Afferent and efferent neuronesconnect each muscle to the central nervoussystem to provide the muscle with motor controland send sensory information to the centralnervous system. Fat is found within and betweenmuscle cells in quantities that become reflected inthe person’s total body composition and percent-
Fig. 1.3 Marathon pace for arunner requires approximately75–80% of maximal aerobic powerand approximately 24% of theanaerobic power the samemuscles could produce for astrength exercise. Photo © NOPP / Larry Bessel.

age body fat. Therefore, each muscle is made upof cells representing the four basic tissue groups:muscle, connective, nervous and epithelial.
Extrafusal fibres can be further divided amonggroups based upon the interrelated twitch char-acteristics and metabolic capabilities. Fibres of a particular motor unit (defined as a motorneurone together with the extrafusal fibres itinnervates) that attain peak force developmentrelatively slowly are routinely termed ‘slowtwitch’ or type I fibres. Fibres that attain peakforce relatively more rapidly are termed ‘fasttwitch’ or type II fibres and further subdividedinto type IIa, type IIab and type IIb groups, asbased on myosin ATPase staining (Fig. 1.4).
Type I fibres are characterized by high mito-chondrial density, high myoglobin content, highaerobic metabolism and modest glycolytic capac-ity. Early anatomists described muscles withwhat we now identify as high type I fibre popula-tion as ‘red muscle’ because of the darker colourcaused by the high myoglobin content. Type IIfibres have high glycolytic capability, low mito-chondrial density and low capacity for aerobicmetabolism. Types IIa, IIab and IIb fibres are lowin myoglobin content, the reason for their beingidentified many decades ago as white musclefibres.
The total number of muscle fibres in a particu-
lar muscle and the proportion identified as type Iand type II appear to be genetically dominated,with small changes occurring through condition-ing, injury, ageing, etc. It should also be men-tioned that, while type II motor units are termedfast twitch and type I motor units are termedslow twitch, the comparison is on relative termsand all extrafusal muscle fibres attain peak forceand shorten extremely fast. The differencesamong them are great, however, and the shorten-ing velocity is generally considered to be 4–10times faster for the type II fibres than for type Ifibres.
The maximum force that can be developed byan activated muscle is directly related to thephysiological cross-section of the muscle, a termthat describes the collective cross-sectional areaof the muscle cells, excluding the connectivetissue (including fat), nervous tissue and bloodvessels. The larger the physiological cross-section of muscle, the greater is the muscle’sability to generate peak force (strength). Consid-erable evidence exists to confirm the importanceof the type II fibre population of a muscle to itsability to develop high force and power.
A high type I fibre population and the accom-panying increased capillarization to supplyoxygen has been shown to be important for sus-tained, rhythmic exercise which depends on
basic exercise physiology 9
Fig. 1.4 Cross-section of humanmuscle showing the mosaicpattern of fibres: darkest stain =type I; lightest stain = type IIa;medium light stain = type IIab;medium dark stain = type IIb.Photo courtesy of William J.Kraemer.

aerobic metabolism. For example, a marathonrunner can utilize over 12000 repeated muscleactions of each leg in completing the 42.2-kmcourse.
The characteristics and capabilities of themuscle fibres can be substantially modified byspecific training programmes. Athletes engagingin sports which involve wide ranges of powerand continuously varying amounts of aerobicand anaerobic metabolism must utilize a pro-gramme of conditioning that raises both theanaerobic and aerobic capabilities of the threefibre types. Examples of such sports are soccer,basketball and tennis.
Physiological support systems
While muscle cells may obtain energy for forceand power production from both anaerobicsources (the breakdown of ATP and PCr; anaero-bic glycolysis) and aerobic sources (aerobic gly-colysis and b-oxidation of fatty acids, bothleading to the provision of electrons to the elec-tron transport system in the mitochondria), theentire human organism and all of its componentcells are fundamentally aerobic. Exercise per-formed at low enough intensities can be per-formed entirely with energy from aerobicmetabolism. The provision of significantamounts of energy for muscular activity by theanaerobic mechanisms, however, is limited inamount and therefore in time. Most importantly,the return to the pre-exercise or resting state following any amount of anaerobic energyrelease is accomplished exclusively by aerobicmetabolism.
Therefore, the essential features in the provi-sion of oxygen for metabolism during aerobicexercise and recovery following anaerobic exer-cise become pulmonary ventilation (air move-ment into and out of the lungs), externalrespiration (exchange of O2 and CO2 betweenalveoli and pulmonary capillary blood), bloodcirculation and internal respiration (exchange ofO2 and CO2 between systemic capillary bloodand interstitial fluid). The essential elements asregards these processes are cardiac output, blood
10 nutrition and exercise
volume, blood composition and skeletal musclecapillarization.
Pulmonary ventilation and external respiration
Movement of air into and out of the lungs isaccomplished by the diaphragm and variousmuscles of the neck and trunk. Pulmonary venti-lation is usually accomplished as a subconsciousactivity under the influence of chemical stimuliprovided by the systemic arterial blood to anervous centre in the brain stem. While thiscentre serves the sole function of controlling theminute volume of pulmonary ventilation (byinteraction of frequency of ventilation and mag-nitude of tidal volume), it is interesting to notethat it is identified anatomically and physiologi-cally as the ‘respiratory centre.’
For continuous aerobic activity that wouldinvolve attainment of a ‘steady state’ of oxygenuptake (and carbon dioxide elimination) via the lungs, pulmonary ventilation correspondsdirectly to oxygen uptake by an approximate 20 : 1 ratio (litres per minute are used in the presentation of both variables). Starting at rest,an 80-kg athlete would expect the values pre-sented in Table 1.2 for oxygen uptake and pul-monary ventilation.
The increase in the ratio for the highest level ofactivity reflects the increased acidity of the blooddue to the production in the muscle and appear-
Table 1.2 Representative data for steady-state oxygenuptake and ventilatory minute volume at rest andduring various intensities of constant-intensityexercise (for an 80-kg athlete). The maximum aerobicpower is 4.5 l · min-1.
V.
o2 V.
E(l · min-1) (l · min-1)
Rest 0.25 5-- 1.00 20-- 2.00 40-- 3.00 60Intense aerobic exercise 3.50 70Intense aerobic exercise with 4.00 100
anaerobic contribution

ance in the blood of lactic acid, as related to theanaerobic metabolism.
For the athlete performing aerobic exerciseunder most conditions, it is considered that theindividual’s capacity for ventilation is adequateto provide O2 from the atmosphere to the alveoliand to carry CO2 from the alveoli to the atmos-phere. In elite endurance athletes who are highlyconditioned for aerobic metabolism and are per-forming near their capacities for aerobic powerproduction, it can be frequently observed thatblood leaving the lungs via the pulmonary veinsis not as saturated with oxygen as it is under theconditions of rest and submaximal aerobic exer-cise. It can thus be concluded that, under the veryspecial conditions where a very highly condi-tioned athlete is performing high-intensityaerobic exercise, pulmonary ventilation serves asa limiting factor for external respiration andtherefore oxygen uptake.
Circulation
For the delivery of oxygen, the removal of carbondioxide and the transport of anabolites andcatabolites to and from the body cells, the organ-ism is dependent upon the circulation of theblood. With regard to the aerobic metabolismrelated to exercise and recovery, the most impor-tant factors are: the oxygen-carrying capacity ofthe blood, the blood volume available, the abilityof the heart to pump blood (cardiac output) andthe capillarization of the skeletal muscles.
The term cardiac output can actually refer to theamount of blood ejected through the aorta or thepulmonary arteries per minute (‘minute volume’or Q
.) or the amount of blood ejected per sys-
tole (‘stroke volume’ or SV). The relationshipbetween minute volume and stroke volumeincludes the contraction frequency of the heart(fH) as follows: Q
.= fH ·SV.
The relationship of these variables withoxygen uptake includes the unloading factor ofoxygen in the tissues as determined from thecontent of oxygen in systemic arterial blood(Cao2) and the content in systemic mixed venousblood (Cvo2). It is:
V.o2 = fH · SV ·a-vo2diff.
Representative values for an 80-kg athlete arepresented in Table 1.3. It can be observed that therelationship between aerobic power (oxygenuptake) and heart rate is essentially rectilinear.Stroke volume increases from a resting value of104ml to near maximum values even duringlow-intensity aerobic exercise. The increase incardiac minute volume as higher levels ofoxygen uptake are attained is accounted for bythe increase in heart rate.
Meanwhile, the arteriovenous oxygen differ-ence continues to increase due solely to thelowered concentration of oxygen in systemicmixed venous blood leaving the active tissues.The arterial concentration remains constant at avalue of approximately 20 ml · l–1 blood, indicat-ing that pulmonary capillary blood becomes
basic exercise physiology 11
Table 1.3 Representative data for steady-state oxygen uptake and circulatory variables at rest and during variousintensities of constant-intensity exercise (for an 80-kg athlete). The maximum aerobic power for the athlete is 4.5 l · min-1 and maximum fH is 195.
V.
o2 Q.
fH a-vo2diff.(l · min-1) (l · min-1) (beats · min-1) SV (ml) (ml O2 · l-1)
Rest 0.25 6.4 60 104 40-- 1.00 12.3 100 123 81-- 2.00 14.8 120 123 136-- 3.00 17.2 140 123 174Intense aerobic exercise 3.50 19.7 160 123 178Intense aerobic exercise with 4.00 22.1 180 123 180
anaerobic contribution

completely saturated with O2 obtained from the alveoli. It should be noted that, at the high-est levels of oxygen uptake, highly trainedendurance athletes (e.g. distance runners andcross-country skiers) show a lowered oxygensaturation in arterial blood. This is taken to indi-cate that the blood flow through the lungs duringsuch intense aerobic exercise for these athletesexceeds the capacity of the ventilatory system toprovide oxygen to the lungs.
As will be discussed, maximum aerobic power(V
.o2max.) can be increased mainly by increasing
the stroke volume capability of the heart, which increases the minute volume capability.Maximum heart rate does not increase withaerobic conditioning but, actually, it eitherremains the same or decreases.
The V.o2max. of 4.5 l · min–1 corresponds to a
metabolic power production of 1500 W. As theathlete in the example is capable of power pro-duction for short periods (e.g. 1–20s) in the rangeof 3000–6000W, the question could be raised as towhat values for the circulatory variables wouldbe expected during such exercise performance.The answer is that these values, if measured,would be irrelevant. The athlete would be per-forming in the range of power production whereoxidative (aerobic) metabolism contributes littleor no energy and the muscles will rely on ATP,PCr and anaerobic glycolysis.
Adaptations to conditioning
The adaptations of the human organism to pro-grammes of exercise conditioning are highly spe-cific to the exercise programme (i.e. the stimulus)provided. Adaptations to resistance training forstrength, to anaerobic training (as in sprinting)and to endurance (aerobic) training are very dif-ferent and, if used inappropriately, can actuallyserve to be counterproductive.
Aerobic conditioning
For athletes engaged in events lasting approxi-mately 3min or longer, aerobic conditioning is acrucial factor in preparing for competition (Fig.
12 nutrition and exercise
1.5). For events lasting between 1 and 3 min,aerobic conditioning is important but anaerobicsources of energy for the power demandsbecome more important the higher the exerciseintensity and the shorter the accompanying per-formance time. It also makes a great differencewhether or not the athlete performs to exhaus-tion (such as in the 10-km run) or is involved inone half of a soccer match (45min) whichinvolves a wide range of aerobic/anaerobicintensities and intermittent activity. Also, skillmay be more important than any other perfor-mance consideration.
If an increase in aerobic power is required, theathlete must follow a programme designed toincrease the cardiac output capability (SV and
Fig. 1.5 A sport such as road cycling dependspredominantly upon aerobic metabolism. Photo ©Allsport / M. Powell.

Q.), the total circulating haemoglobin and the
capillarization of the skeletal muscles that areinvolved. Such conditioning also serves toenhance the aerobic metabolic capacities of theskeletal muscle cells including both type I andtype II fibres.
The programme would consist of a combina-tion of interval training and some extendedbouts of exercise (e.g. 10–60 min) consistent withthe particular competitive event. Dependingupon the individual athlete and the point in timerelative to the competitive season, the athlete willtrain vigorously three to seven times per week.
It is important to note that such aerobic condi-tioning can adversely affect the particular skele-tal muscles involved as regards the ability for thegeneration of high power and the explosiveeffort involved in activities such as jumping andthrowing. The adaptation of the systems of thebody and, in particular, the skeletal muscles willbe specific to the conditioning stimulus or, inother words, the conditioning programme.
Anaerobic conditioning
For events lasting less than 10 min, energyobtained from anaerobic glycolysis is an impor-tant factor; the shorter the event the greater is thecontribution of this source. There is an obviousoverlapping with oxidative metabolism thelonger the duration of the activity.
With a programme of conditioning that com-bines a considerable amount of strength trainingwith very high but continuous exercise intensitythat mimics the event (e.g. the 100-m run, the100-m swim, wrestling), the emphasis is on anappropriate increase in the size of type II musclecells, enhancing the capability of the cells foranaerobic glycolysis, and increasing the concen-trations of ATP and PCr. Most, if not all, type IIbfibres that exist at the initiation of such condition-ing convert to type IIa. Except for the shortestlasting performances (weightlifting, high jump,pole vault, discus, shot-put, javelin), mainte-nance of high concentrations of glycogen in the muscle cells through proper nutrition isimportant.
Strength conditioning
Increases in maximum force production(strength) and maximal power of the muscles arebrought about through exercise programmes ofvery high opposing force (routinely termed‘resistance’) that limits repetitions to approxi-mately 20 or fewer and therefore a duration ofless than 30s. Exercise programmes based onhigher repetitions (e.g. 30–50 repetitions leadingto exhaustion) develop local muscular endur-ance but are not conducive to strength devel-opment. Exercise involving many repetitions in a bout (e.g. 400–1000 repetitions) brings about physiological adaptations that result inenhanced aerobic performance that can be espe-cially counterproductive to power developmentand, to a lesser extent, on the performance ofstrength tests.
‘Resistance training’ is performed with avariety of exercise machines, free weights oreven the use of gravity acting upon the athlete’sbody mass. Most resistance training (strength)programmes are based on a system of exercise toa repetition maximum (RM) as presented in themid-1940s by DeLorme (1945). Every time theathlete performs a particular exercise, the bout isperformed for the maximum number of repeti-tions, or RM, possible and this number isrecorded along with the mass lifted or opposingforce imposed by an exercise machine. Repeatedtesting at increasingly higher opposing force willeventually lead to the determination of a 1RM, inwhich the athlete can perform the movement butonce and not repeat it. In this system, the masslifted or opposing force is described as theathlete’s strength at that particular point in timeand for the particular movement.
Bouts of strength exercise and the daily pro-gramme can be based on percentages of a 1 RM,preferably, within heavy (3–5), medium (9–10)and light (15–18) RM zones (Fleck & Kraemer1997). The number of bouts performed in a set,the number of sets performed per day and thenumber of daily workouts per week are then pre-scribed for each movement or muscle group asbased on the point in time in the competitive
basic exercise physiology 13
season, the physical condition of the athlete, pro-gramme variation for both physiological andpsychological considerations and programmeobjectives.
The principal adaptation of the athlete’s bodyis the increase in size (commonly termed hyper-trophy) of type II muscle cells. It is generally heldthat no interchange takes place between type Iand type II fibres as the result of specific condi-tioning programmes.
As the force development capability of amuscle is directly related to its physiologicalcross-section, the increase in size of the musclecells is the principal reason for increased forcedevelopment. The energy requirement for per-formance of a 1 RM is quite small, as is the perfor-mance of any bout of exercise from the 1 RM to a20 RM. However, the total energy requirement ofperforming multiple bouts of exercise for each ofa number of movements or exercises (e.g. 10) in adaily workout is large. This deserves careful con-sideration from the standpoint of the athlete’snutrition, both in terms of quantity and content.In addition to the total energy balance andaccompanying maintenance of appropriate bodymass, consideration must be given to suitableprotein intake.
Adaptations of skeletal muscle
Muscle cells and the structure of an individual
14 nutrition and exercise
muscle, in general, respond in very differentways to the unique exercise stimulus that is pro-vided. The muscles respond to the acute stimulusby providing the forces and power demanded bysuch widely diverse performances as weight-lifting, high jumping, 100-m sprinting andrunning at marathon pace. Following a singlebout of exercise or a single day’s conditioningsession, however, the individual muscle fibresand the total muscle recover to a physiologicalstate with little or no measurable change.
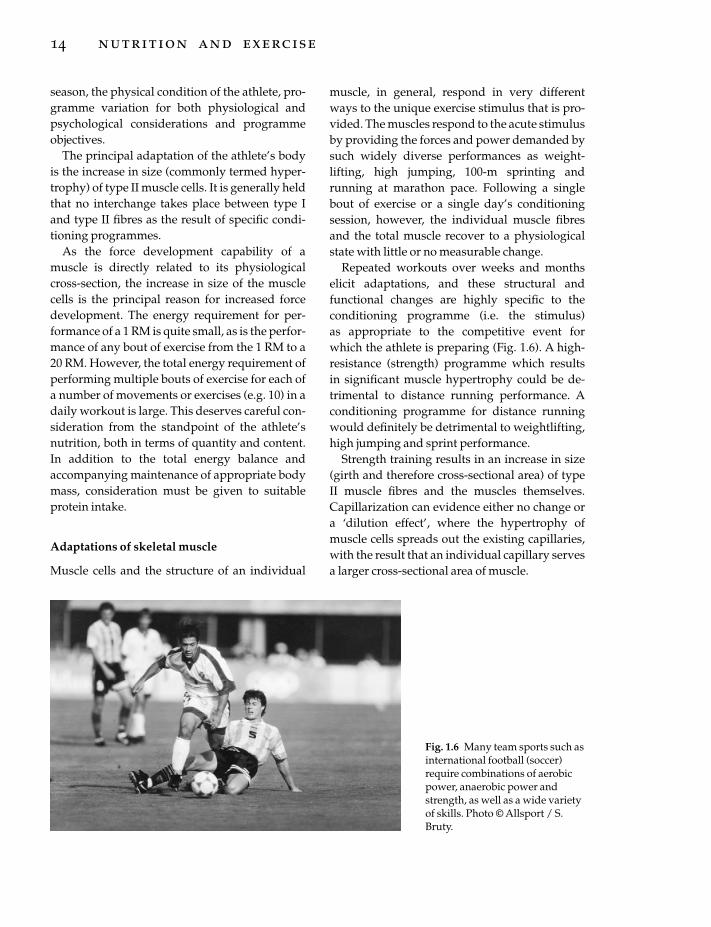
Repeated workouts over weeks and monthselicit adaptations, and these structural and functional changes are highly specific to the conditioning programme (i.e. the stimulus) as appropriate to the competitive event for which the athlete is preparing (Fig. 1.6). A high-resistance (strength) programme which results in significant muscle hypertrophy could be de-trimental to distance running performance. Aconditioning programme for distance runningwould definitely be detrimental to weightlifting,high jumping and sprint performance.
Strength training results in an increase in size(girth and therefore cross-sectional area) of typeII muscle fibres and the muscles themselves.Capillarization can evidence either no change ora ‘dilution effect’, where the hypertrophy ofmuscle cells spreads out the existing capillaries,with the result that an individual capillary servesa larger cross-sectional area of muscle.
Fig. 1.6 Many team sports such asinternational football (soccer)require combinations of aerobicpower, anaerobic power andstrength, as well as a wide varietyof skills. Photo © Allsport / S.Bruty.
A combination of strength and anaerobic conditioning, as appropriate to sprinters, resultsin some hypertrophy and an increase in theanaerobic metabolic capabilities of type II fibres.The resting concentrations of ATP and PCrincrease as well as the capability of the cells toproduce force and power with energy fromanaerobic glycolysis.
In both strength conditioning and combinationstrength/anaerobic conditioning, there is little orno adaptation of the cardiovascular system interms of stroke volume, minute volume or bloodcomposition.
Highly aerobic training involving a largenumber of movement repetitions (e.g. 500–2000)results in adaptations to both muscle cells and tothe cardiovascular system. The aerobic metaboliccapacities of type I fibres is greatly enhanced, asis, to a lesser extent, the aerobic capacity of type IIfibres. This includes increases in mitochondrialcount, myoglobin content and glycogen storage.An increase in capillarization provides enhancedcapability for oxygen and substrate delivery andfor carbon dioxide and catabolite removal. Theabilities of the muscle for high force and powerdevelopment diminish.
Nutrition of an athlete
All of the factors involving muscle, ventilation/respiration and circulation are important indetermining the success of a particular individ-ual in competing in a particular sport. Additionalfactors involve coordination (skilled movement),body size and motivation. However, energy isneeded for the performance of short-term explo-sive events, long-term endurance events and themany sport activities that involve the develop-ment of varying amounts of power during thecourse of a contest. Therefore, proper nutritionmust be considered to be a key element to successin a wide variety of competitive sports.
Frequently overlooked by athletes when con-sidering the nutrition of sport is the tremendoustime and energy involved in the conditioningprogramme between competitions and/orleading up to a competitive season. Performance
of a throwing event in track and field or ofOlympic weightlifting events takes but a fewseconds of time, but preparation involves manyhours of skill practice and conditioning.
The nutrition of an athlete is a 12-months-of-the-year consideration. Too often, the focus ofattention is placed on the days or even hoursleading up to a competitive event. While pre-event food ingestion is of great importance,optimal health and optimal performance aredependent on year-around planning. Undercertain circumstances, nutrition during an eventand/or immediately following an event alsocarry great importance.
Each athlete must perform at an appropriatebody weight. In addition to the total massinvolved, the relative contribution to total mass by muscle, fat and bone is of importance.Optimal values for the various constituents arebest developed through a combination of pro-per diet and appropriate conditioning that is continuous.
The moment a competitive event begins, theathlete should be at appropriate body mass, suf-ficiently hydrated, possess proper amounts ofvitamins and minerals, and be nourished withsufficient carbohydrate that an appropriatebalance of carbohydrate and fat metabolism willprovide the energy for the ensuing muscularactivity.
Nutritional and energetic limits to performance
It can be generally accepted that each athleteenters his/her event with fat stores in excess ofwhat will be utilized during the course of a com-petition. It is well known, however, that thehigher the intensity of the muscular activity, thegreater the proportion of energy that the muscleswill obtain from carbohydrate (glucose andglycogen) compared with that obtained from fat(fatty acids).
Herein lies a major challenge to athletes competing in a wide range of sports involvingmoderate intensity and long duration, that ofensuring that the carbohydrate stores in the
basic exercise physiology 15

skeletal muscles and liver are optimal as theevent starts. Skeletal muscle cells will dependboth on endogenous glycogen stores as well ascarbohydrate delivered by the blood as glucose.The nervous system depends totally on glucoseobtained from the blood for its completelyaerobic metabolism. Insufficient glucose for thenervous system results in loss of control andcoordination of the muscles and the movements.There is a small amount of glucose circulating inthe blood as an event starts, but the bloodglucose level must be maintained from glycogenstored in the liver. Low glycogen concentrationsin the skeletal muscle cells reduce an athlete’scapacity for power production. Low bloodglucose can therefore adversely affect bothnervous system function and muscle function.
The athlete’s conditioning programme mustbe planned with great care and appreciation forthe specific demands of each event or sport activ-ity. The force, power, metabolic and associatednutritional demands of both competition and theconditioning programmes involve great differ-ences among such varied activities as Olympicweightlifting, high jumping, 100-m running, 400-m swimming, tennis, field hockey, basket-ball, road cycling, cross-country skiing andmarathon running.
16 nutrition and exercise
References
Åstrand, P.-O. & Rodahl, K. (1986) Textbook of WorkPhysiology. McGraw-Hill, New York.
Bureau International des Poids et Mésures (1977) LeSystème International d’Unités (SI), 3rd edn. Sèvres,France.
Cavanagh, P.R. (1988) On ‘muscle action’ vs. ‘musclecontraction.’ Journal of Biomechanics 22, 69.
DeLorme, T.L. (1945) Restoration of muscle power byheavy resistance exercises. Journal of Bone and JointSurgery 27, 645–667.
Fleck, S.J. & Kraemer, W.J. (1997) Designing ResistanceTraining Programs. Human Kinetics, Champaign, IL.
Knuttgen, H.G. & Kraemer, W.J. (1987) Terminologyand measurement in exercise performance. Journal ofApplied Sports Science Research 1, 1–10.
Komi, P.V. (ed.) (1992) Strength and Power in Sport.Blackwell Scientific Publications, Oxford.
Further reading
Dirix, A., Knuttgen, H.G. & Tittel, K. (eds) (1992) TheOlympic Book of Sports Medicine. Blackwell ScientificPublications, Oxford.
Komi, P.V. & Knuttgen, H.G. (1996) Sport science andmodern training. In Sports Science Studies, Vol. 8, pp.44–62. Verlag Karl Hofmann, Schorndorf.
Shephard, R.J. & Åstrand, P.-O. (eds) (1992) Endurancein Sport. Blackwell Scientific Publications, Oxford.

Introduction
Answers to questions in exercise physiology andsports nutrition, including the most fundamentalones such as the causes of fatigue, can only beobtained by an understanding of cellular, subcel-lular and molecular mechanisms to explain howthe body responds to acute and chronic exercise.Biochemistry usually refers to the study of eventsat the subcellular and molecular level, and this iswhere the emphasis is placed in this chapter. Inparticular, this brief review describes the sourcesof energy available for muscle force generationand explains how acute exercise modifies energymetabolism. For further details, see Maughan et al. (1997) and Hargreaves (1995). Training alsomodifies the metabolic response to exercise andtraining-induced adaptations encompass bothbiochemical responses (e.g. changes in enzymeactivities in trained muscles) and physiologicalresponses (e.g. changes in maximal cardiacoutput and maximal oxygen uptake, V
.o2max.)
(Saltin 1985).
Skeletal muscle
Individual muscles are made up of many parallelmuscle fibres that may (or may not) extend theentire length of the muscle. The interior of themuscle fibre is filled with sarcoplasm (muscle cellcytoplasm), a red viscous fluid containing nuclei,mitochondria, myoglobin and about 500 thread-like myofibrils, 1–3 mm thick, continuous fromend to end in the muscle fibre. The red colour
is due to the presence of myoglobin, an intra-cellular respiratory pigment. Surrounding themyofibrils is an elaborate form of smooth endo-plasmic reticulum called the sarcoplasmic reticu-lum. Its interconnecting membranous tubules liein the narrow spaces between the myofibrils, sur-rounding and running parallel to them. Fat (astriacylglycerol droplets), glycogen, phosphocre-atine (PCr) and adenosine triphosphate (ATP)are found in the sarcoplasm as energy stores. Themyofibrils are composed of overlapping thin andthick filaments and it is the arrangement of thesefilaments that gives skeletal muscle its striatedappearance. The thin filaments are comprised ofthe protein actin; located on the actin are twoother types of protein, tropomyosin and tro-ponin. The thick filaments contain the proteinmyosin.
When calcium and ATP are present in suffi-cient quantities, the filaments interact to formactomyosin and shorten by sliding over eachother. Sliding of the filaments begins when themyosin heads form cross bridges attached toactive sites on the actin subunits of the thin fila-ments. Each cross bridge attaches and detachesseveral times during a contraction, in a ratchet-like action, pulling the thin filaments towards thecentre of the sarcomere. When a muscle fibre contracts, its sarcomeres shorten. As this eventoccurs in sarcomeres throughout the cell, thewhole muscle fibre shortens in length.
The attachment of the myosin cross bridgesrequires the presence of calcium ions. In therelaxed state, calcium is sequestered in the sar-
Chapter 2
Biochemistry of Exercise
MICHAEL GLEESON
17
coplasmic reticulum, and in the absence ofcalcium, the myosin-binding sites on actin arephysically blocked by the tropomyosin rods (Fig.2.1). Electrical excitation passing as an actionpotential along the sarcolemma and down the T-tubules leads to calcium release from the sar-coplasmic reticulum into the sarcoplasm andsubsequent activation and contraction of the fila-
18 nutrition and exercise
ment array (Frank 1982). The calcium ions bindto troponin, causing a change in its conformationthat physically moves tropomyosin away fromthe myosin binding sites on the underlying actinchain. Excitation is initiated by the arrival of anerve impulse at the muscle membrane via themotor end plate. Activated or ‘cocked’ myosinheads now bind to the actin, and as this happens
Thick filament H-zone Thin filament
Z-line Z-line
(a)
Myosin heads containing ATPase activity andactin-binding sites
(b)
Ca2+ binding sites
Troponin complex Tropomysin G-actin
(c)
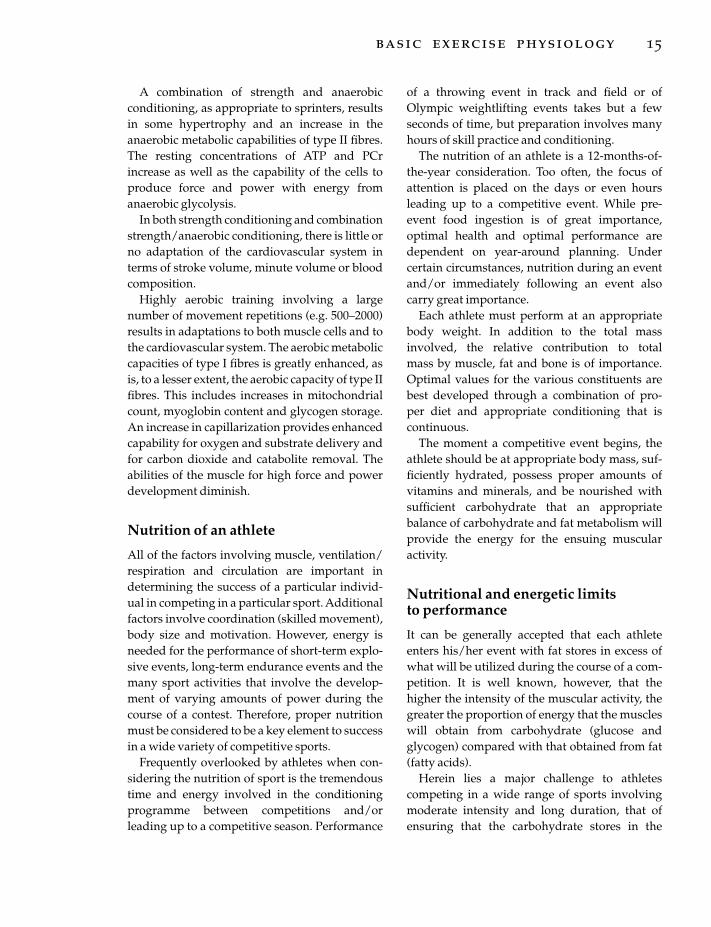
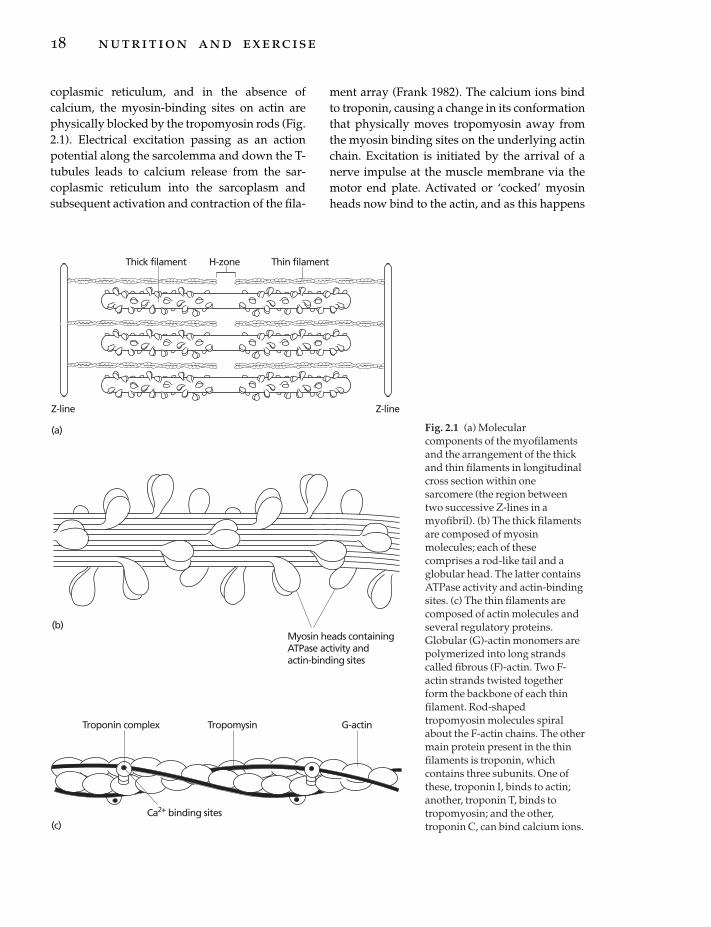
Fig. 2.1 (a) Molecularcomponents of the myofilamentsand the arrangement of the thickand thin filaments in longitudinalcross section within onesarcomere (the region betweentwo successive Z-lines in amyofibril). (b) The thick filamentsare composed of myosinmolecules; each of thesecomprises a rod-like tail and aglobular head. The latter containsATPase activity and actin-bindingsites. (c) The thin filaments arecomposed of actin molecules andseveral regulatory proteins.Globular (G)-actin monomers arepolymerized into long strandscalled fibrous (F)-actin. Two F-actin strands twisted togetherform the backbone of each thinfilament. Rod-shapedtropomyosin molecules spiralabout the F-actin chains. The othermain protein present in the thinfilaments is troponin, whichcontains three subunits. One ofthese, troponin I, binds to actin;another, troponin T, binds totropomyosin; and the other,troponin C, can bind calcium ions.
the myosin head changes from its activated con-figuration to its bent shape, which causes thehead to pull on the thin filament, sliding ittowards the centre of the sarcomere. This actionrepresents the power stroke of the cross bridgecycle, and simultaneously adenosine diphos-phate (ADP) and inorganic phosphate (Pi) arereleased from the myosin head. As a new ATPmolecule binds to the myosin head at the ATPaseactive site, the myosin cross bridge detachesfrom the actin. Hydrolysis of the ATP to ADP andPi by the ATPase provides the energy required toreturn the myosin to its activated ‘cocked’ state,empowering it with the potential energy neededfor the next cross bridge attachment–powerstroke sequence. While the myosin is in the acti-vated state, the ADP and Pi remain attached tothe myosin head. Now the myosin head canattach to another actin unit farther along the thinfilament, and the cycle of attachment, powerstroke, detachment and activation of myosin isrepeated. Sliding of the filaments in this mannercontinues as long as calcium is present (at a con-centration in excess of 10mmol · l–1) in the sar-coplasm. Removal and sequestration of thecalcium by the ATP-dependent calcium pump(ATPase) of the sarcoplasmic reticulum restoresthe tropomyosin inhibition of cross bridge for-mation and the muscle fibre relaxes.
Fibre types
The existence of different fibre types in skeletalmuscle is readily apparent and has long been rec-ognized; the detailed physiological and bio-chemical bases for these differences and theirfunctional significance have, however, only morerecently been established. Much of the impetusfor these investigations has come from the reali-zation that success in athletic events whichrequire either the ability to generate a highpower output or great endurance is dependent inlarge part on the proportions of the different fibretypes which are present in the muscles. Themuscle fibres are, however, extremely plastic,and although the fibre type distribution is geneti-cally determined, and not easily altered, an
appropriate training programme will have amajor effect on the metabolic potential of themuscle, irrespective of the fibre types present.
Fibre type classification is usually based onhistochemical staining of serial cross-sections.On this basis, human muscle fibres are com-monly divided into three major kinds: types I, IIaand IIb. These are analogous to the muscle fibresfrom animals that have been classified on thebasis of their directly determined functionalproperties as (i) slow twitch fibres, (ii) fast twitch,fatigue resistant fibres, and (iii) fast twitch,fatiguable fibres, respectively. The myosin of thedifferent fibre types exists in different molecularforms (isoforms), and the myofibrillar ATPaseactivity of the different fibre types displays dif-ferential pH sensitivity; this provides the basisfor the differential histochemical staining of thefibre types (Åstrand & Rodahl 1986). The bio-chemical characteristics of the three major fibretypes are summarized in Table 2.1.
Type I fibres are small-diameter red cells thatcontain relatively slow acting myosin ATPasesand hence contract slowly. The red colour is dueto the presence of myoglobin, an intracellularrespiratory pigment, capable of binding oxygenand only releasing it at very low partial pressures(as are found in the proximity of the mitochon-dria). Type I fibres have numerous mitochondria,mostly located close to the periphery of the fibre,near to the blood capillaries which provide a richsupply of oxygen and nutrients. These fibrespossess a high capacity for oxidative metabo-lism, are extremely fatigue resistant, and are specialized for the performance of repeated con-tractions over prolonged periods.
Type IIb fibres are much paler, because theycontain little myoglobin. They possess rapidlyacting myosin ATPases and so their contraction(and relaxation) time is relatively fast. They havefewer mitochondria and a poorer capillarysupply, but greater glycogen and PCr stores thanthe type I fibres. A high activity of glycogenolyticand glycolytic enzymes endows type IIb fibreswith a high capacity for rapid (but relativelyshort-lived) ATP production in the absence ofoxygen (anaerobic capacity). As a result, lactic
biochemistry of exercise 19

acid accumulates quickly in these fibres and theyfatigue rapidly. Hence, these fibres are bestsuited for delivering rapid, powerful contrac-tions for brief periods. The metabolic characteris-tics of type IIa fibres lie between the extremeproperties of the other two fibre types. Theycontain fast-acting myosin ATPases like the typeIIb fibres, but have an oxidative capacity moreakin to that of the type I fibres.
The differences in activation threshold of themotor neurones supplying the different fibretypes determine the order in which fibres arerecruited during exercise, and this in turn influ-ences the metabolic response to exercise. Duringmost forms of movement, there appears to be anorderly hierarchy of motor unit recruitment,which roughly corresponds with a progressionfrom type I to type IIa to type IIb. It follows thatduring light exercise, mostly type I fibres will berecruited; during moderate exercise, both type Iand type IIa will be recruited; and during moresevere exercise, all fibre types will contribute toforce production.
Whole muscles in the body contain a mixtureof these three different fibre types, though theproportions in which they are found differ substantially between different muscles and canalso differ between different individuals. Forexample, muscles involved in maintaining
20 nutrition and exercise
posture (e.g. soleus in the leg) have a high pro-portion (usually more than 70%) of type I fibres,which is in keeping with their function in main-taining prolonged, chronic, but relatively weakcontractions. Fast type II fibres, however, pre-dominate in muscles where rapid movementsare required (e.g. in the muscles of the hand andthe eye). Other muscles, such as the quadricepsgroup in the leg, contain a variable mixture offibre types. The fibre type composition in suchmuscles is a genetically determined attribute,which does not appear to be pliable to a signifi-cant degree by training. Hence, athletic capabili-ties are inborn to a large extent (assuming thegenetic potential of the individual is realizedthrough appropriate nutrition and training). Thevastus lateralis muscle of successful marathonrunners has been shown to have a high percent-age (about 80%) of type I fibres, while that of elitesprinters contains a higher percentage (about60%) of the type II fast twitch fibres (see Komi &Karlsson 1978).
Sources of energy for muscle force generation
Energy can be defined as the potential for per-forming work or producing force. Developmentof force by skeletal muscles requires a source of
Table 2.1 Biochemical characteristics of human muscle fibre types. Values of metabolic characteristics of type IIfibres are shown relative to those found in type I fibres.
Characteristic Type I Type IIa Type IIb
Nomenclature Slow, red Fast, red Fast, whiteFatigue resistant Fatigue resistant FatiguableOxidative Oxidative/glycolytic Glycolytic
Capillary density 1.0 0.8 0.6Mitochondrial density 1.0 0.7 0.4Myoglobin content 1.0 0.6 0.3Phosphorylase activity 1.0 2.1 3.1PFK activity 1.0 1.8 2.3Citrate synthase activity 1.0 0.8 0.6SDH activity 1.0 0.7 0.4Glycogen content 1.0 1.3 1.5Triacylglycerol content 1.0 0.4 0.2Phosphocreatine content 1.0 1.2 1.2Myosin ATPase activity 1.0 >2 >2
ATP, adenosine triphosphate; PFK, phosphofructokinase; SDH, succinate dehydrogenase.
chemical energy in the form of ATP; in fact,energy from the hydrolysis of ATP is harnessedto power all forms of biological work. In muscle,energy from the hydrolysis of ATP by myosinATPase activates specific sites on the contractileelements, as described previously, causing themuscle fibre to shorten. The hydrolysis of ATPyields approximately 31kJ of free energy permole of ATP degraded to ADP and inorganicphosphate (Pi):
ATP +H2O fi ADP+ H+ +Pi –31kJ ·mol–1 ATP
Active reuptake of calcium ions by the sarcoplas-mic reticulum also requires ATP, as does therestoration of the sarcolemmal membrane poten-tial via the action of the Na+–K+-ATPase. Thereare three different mechanisms involved in theresynthesis of ATP for muscle force generation:1 Phosphocreatine (PCr) hydrolysis.2 Glycolysis, which involves metabolism ofglucose-6-phosphate (G6P), derived from muscleglycogen or blood-borne glucose, and producesATP by substrate-level phosphorylation reactions.3 The products of carbohydrate, fat, protein andalcohol metabolism can enter the tricarboxylicacid (TCA) cycle in the mitochondria and be oxi-dized to carbon dioxide and water. This processis known as oxidative phosphorylation andyields energy for the synthesis of ATP.
The purpose of these mechanisms is to regen-erate ATP at sufficient rates to prevent a signifi-cant fall in the intramuscular ATP concentration.The resting concentration of ATP in skeletalmuscle is quite low at about 20–25 mmol ·kg–1
dry matter (dm) of muscle, which in itself couldonly provide enough energy to sustain a fewseconds of intense exercise. PCr breakdown andglycolysis are anaerobic mechanisms (that is,they do not use oxygen) and occur in the sar-coplasm. Both use only one specific substrate forenergy production (i.e. PCr and G6P). Theaerobic (oxygen-requiring) processes in the mito-chondria can utilize a variety of different sub-strates. The sarcoplasm contains a variety ofenzymes which can convert carbohydrates, fatsand proteins into usable substrate, primarily a 2-carbon acetyl group linked to coenzyme A
(acetyl-CoA) which can be completely oxidizedin the mitochondria with the resultant produc-tion of ATP. A general summary of the mainenergy sources and pathways of energy metabo-lism is presented in Fig. 2.2.
Anaerobic metabolism
Phosphocreatine
Some of the energy for ATP resynthesis is sup-plied rapidly and without the need for oxygen byPCr. Within the muscle fibre, the concentration ofPCr is about 3–4 times greater than that of ATP.When PCr is broken down to creatine and inor-ganic phosphate by the action of the enzyme cre-atine kinase, a large amount of free energy isreleased (43 kJ ·mol–1 PCr) and, because PCr has ahigher free energy of hydrolysis than ATP, itsphosphate is donated directly to the ADP mole-cule to reform ATP. The PCr can be regarded as aback-up energy store: when the ATP contentbegins to fall during exercise, the PCr is brokendown, releasing energy for restoration of ATP.During very intense exercise the PCr store can bealmost completely depleted. There is a close rela-tionship between the intensity of exercise and therate at which PCr is broken down. The reactionsof ATP and PCr hydrolysis are reversible, andwhen energy is readily available from othersources (oxidative phosphorylation), creatineand phosphate can be rejoined to form PCr:
ADP+ PCr+H+ ¤ ATP+ Cr – 43kJ ·mol–1 PCr
Note that the resynthesis of ATP via breakdownof PCr buffers some of the hydrogen ions formedas a result of ATP hydrolysis. The PCr in muscleis immediately available at the onset of exerciseand can be used to resynthesize ATP at a veryhigh rate. This high rate of energy transfer corre-sponds to the ability to produce a high poweroutput. The major disadvantage of this system isits limited capacity (Table 2.2); the total amountof energy available is small. If no other energysource is available to the muscle, fatigue willoccur rapidly. An additional pathway to regener-ate ATP when ATP and PCr stores are depleted isthrough a kinase reaction that utilizes two mole-
biochemistry of exercise 21

cules of ADP to generate one molecule of ATP(and one molecule of adenosine monophos-phate, AMP). This reaction is catalysed by theenzyme called myokinase:
ADP+ ADPfi ATP +AMP–31kJ ·mol–1 ADP
This reaction only becomes important duringexercise of high intensity. Even then, the amount
22 nutrition and exercise
of energy it makes available in the form of ATP isextremely limited and the real importance of thereaction may be in the formation of AMP whichis a potent allosteric activator of a number ofenzymes involved in energy metabolism.
It is known that the total adenylate pool candecline rapidly if the AMP concentration of thecell begins to rise during muscle force genera-
Fats Carbohydrates Proteins
Triacylglycerols
Fatty acids + glycerol Glucose/glycogen Amino acids
Transaminationdeamination
Ammonia
Urea
Glutamate
GlycineLactate
Acetoacetate
Pyruvate
Glycolysis
Alanine
Acetyl-CoA
O2
O2 H2O
CO2
β-oxidation
Oxaloacetate Citrate
TCAcycle
NADH + H+
NAD+
Electron transportchain
Fig. 2.2 Summary of the mainpathways of energy metabolismusing carbohydrate, fats and proteinas energy sources. Carbohydratemay participate in both anaerobicand aerobic pathways. In glycolysis,glucose or glycogen are brokendown to lactate under anaerobicconditions and pyruvate underaerobic conditions. The pyruvate isconverted to acetyl-coenzyme A(CoA) and is completely oxidized inthe tricarboxylic (TCA) cycle. Fats inthe form of triacylglycerols arehydrolysed to fatty acids andglycerol, the latter entering theglycolytic pathway (in liver but notin muscle) and the fatty acids beingconverted via the b-oxidationpathway to acetyl-CoA andsubsequently oxidized in the TCAcycle. Protein catabolism canprovide amino acids that can beconverted by removal of the aminogroup into either TCA cycleintermediates or into pyruvate oracetoacetate and subsequenttransformation to acetyl-CoA.
Table 2.2a Capacity and power of anaerobic systems for the production of adenosine triphosphate (ATP).
Capacity Power(mmol ATP · kg-1 dm) (mmol ATP · kg-1 dm · s-1)
Phosphagen system 55–95 9.0Glycolytic system 190–300 4.5Combined 250–370 11.0
Values are expressed per kilogram dry matter (dm) of muscle and are based on estimates of ATP provision duringhigh-intensity exercise of human vastus lateralis muscle.

tion. This decline occurs principally via deami-nation of AMP to inosine monophosphate (IMP)but also by the dephosphorylation of AMP toadenosine. The loss of AMP may initially appearcounterproductive because of the reduction inthe total adenylate pool. However, it should benoted that the deamination of AMP to IMP onlyoccurs under low ATP/ADP ratio conditionsand, by preventing excessive accumulation ofADP and AMP, enables the adenylate kinasereactions to continue, resulting in an increase inthe ATP/ADP ratio and continuing muscle forcegeneration. Furthermore, it has been proposedthat the free energy of ATP hydrolysis willdecrease when ADP and Pi accumulate, whichcould further impair muscle force generation.For these reasons, adenine nucleotide loss hasbeen suggested to be of importance to musclefunction during conditions of metabolic crisis;for example, during maximal exercise and in thelater stages of prolonged submaximal exercisewhen glycogen stores become depleted (Sahlin &Broberg 1990).
Glycolysis
Under normal conditions, muscle clearly doesnot fatigue after only a few seconds of effort, so asource of energy other than ATP and PCr must beavailable. This is derived from glycolysis, whichis the name given to the pathway involving thebreakdown of glucose (or glycogen), the endproduct of this series of chemical reactions being
pyruvate. This process does not require oxygen,but does result in energy in the form of ATP beingavailable to the muscle from reactions involvingsubstrate-level phosphorylation. In order for thereactions to proceed, however, the pyruvatemust be removed; in low-intensity exercise,when adequate oxygen is available to the muscle,pyruvate is converted to carbon dioxide andwater by oxidative metabolism in the mitochon-dria. In some situations the majority of the pyru-vate is removed by conversion to lactate, areaction that does not involve oxygen.
A specific transporter protein (GLUT-4) isinvolved in the passage of glucose moleculesacross the cell membrane. Once the glucose mol-ecule is inside the cell, the first step of glycolysisis an irreversible phosphorylation catalysed byhexokinase to prevent loss of this valuable nutri-ent from the cell: glucose is converted to G6P.This step is effectively irreversible, at least as faras muscle is concerned. Liver has a phosphataseenzyme which catalyses the reverse reaction,allowing free glucose to leave the cell and enterthe circulation, but this enzyme is absent frommuscle. The hexokinase reaction is an energy-consuming reaction, requiring the investment ofone molecule of ATP per molecule of glucose.This also ensures a concentration gradient forglucose across the cell membrane down whichtransport can occur. Hexokinase is inhibited byan accumulation of the reaction product G6P, andduring high-intensity exercise, the increasingconcentration of G6P limits the contribution that
biochemistry of exercise 23
Table 2.2b Maximal rates of adenosine triphosphate (ATP) resynthesis from anaerobic and aerobic metabolism andapproximate delay time before maximal rates are attained following onset of exercise.
Max rate of ATP resynthesis(mmol ATP · kg-1 dm · s-1) Delay time
Fat oxidation 1.0 > 2hGlucose (from blood) 1.0 Approx. 90min
oxidationGlycogen oxidation 2.8 Several minutesGlycolysis 4.5 5–10sPCr breakdown 9.0 Instantaneous
PCr, phosphocreatine.

the blood glucose can make to carbohydratemetabolism in the active muscles.
If glycogen, rather than blood glucose, is thesubstrate for glycolysis, the first step is to split offa single glucose molecule. This is achieved by theenzyme glycogen phosphorylase, and the pro-ducts are glucose-1-phosphate and a glycogenmolecule that is one glucose residue shorter thanthe original. The substrates are glycogen andinorganic phosphate, so, unlike the hexokinasereaction, there is no breakdown of ATP in thisfirst reaction. Phosphorylase acts on the a-1,4carbon bonds at the free ends of the glycogenmolecule, but cannot break the a-1,6 bondsforming the branch points. These are hydrolysedby the combined actions of a debranchingenzyme and amylo-1,6-glucosidase, releasingfree glucose which is quickly phosphorylated toG6P by the action of hexokinase. There is anaccumulation of free glucose within the musclecell only in very high-intensity exercise whereglycogenolysis is proceeding rapidly: becausethere are relatively few a-1,6 bonds, no morethan about 10% of the glucose residues appear asfree glucose. The enzyme phosphoglucomutaseensures that glucose-1-phosphate formed by theaction of phosphorylase on glycogen is rapidlyconverted to G6P, which then proceeds down theglycolytic pathway.
The sequence of reactions that convert G6P topyruvate is shown in Fig. 2.3. Briefly, following afurther phosphorylation, the glucose molecule iscleaved to form two molecules of the three-carbon sugar glyceraldehyde-3-phosphate. Thesecond stage of glycolysis involves the conver-sion of this into pyruvate, accompanied by theformation of ATP and reduction of nicotinamideadenine dinucleotide (NAD+) to NADH.
The net effect of glycolysis can thus be seen tobe the conversion of one molecule of glucose totwo molecules of pyruvate, with the net forma-tion of two molecules of ATP and the conversionof two molecules of NAD+ to NADH. If glycogenrather than glucose is the starting point, threemolecules of ATP are produced, as there is noinitial investment of ATP when the first phospho-rylation step occurs. Although this net energyyield appears to be small, the relatively large car-
24 nutrition and exercise
bohydrate store available and the rapid rate atwhich glycolysis can proceed mean that theenergy that can be supplied in this way is crucialfor the performance of intense exercise. The 800-m runner, for example, obtains about 60% ofthe total energy requirement from anaerobicmetabolism, and may convert about 100 g of car-bohydrate (mostly glycogen, and equivalent toabout 550mmol of glucose) to lactate in less than2min. The amount of ATP released in this way(three ATP molecules per glucose moleculedegraded, about 1667 mmol of ATP in total) farexceeds that available from PCr hydrolysis. Thishigh rate of anaerobic metabolism allows notonly a faster ‘steady state’ speed than would bepossible if aerobic metabolism alone had to berelied upon, but also allows a faster pace in theearly stages before the cardiovascular system hasadjusted to the demands and the delivery andutilization of oxygen have increased in responseto the exercise stimulus.
The reactions of glycolysis occur in the cyto-plasm of the cell and some pyruvate will escapefrom tissues such as active muscle when the rateof glycolysis is high, but most is further metabo-lized. The fate of the pyruvate produced by gly-colysis during exercise will depend not only onfactors such as exercise intensity, but also on themetabolic capacity of the tissue. When glycolysisproceeds rapidly, the problem for the cell is thatthe availability of NAD+, which is necessary as a cofactor in the glyceraldehyde-3-phosphatedehydrogenase reaction, becomes limiting. Theamount of NAD+ in the cell is very small (onlyabout 0.8mmol ·kg–1 dm) relative to the rate atwhich glycolysis can proceed. In high-intensityexercise, the rate of turnover of ATP can be about8mmol ·kg–1 dm · s–1. If the NADH formed byglycolysis is not reoxidized to NAD+ at an equalrate, glycolysis will be unable to proceed and tocontribute to energy supply.
There are two main processes available forregeneration of NAD+ in muscle. Reduction ofpyruvate to lactate will achieve this, and thisreaction has the advantage that it can proceed inthe absence of oxygen. Lactate can accumulatewithin the muscle fibres, reaching much higherconcentrations than those reached by any of the

glycolytic intermediates, but when this happens,the associated hydrogen ions cause intracellularpH to fall. Some lactate will diffuse into the extra-cellular space and will eventually begin to accu-mulate in the blood. The lactate that leaves the
muscle fibres is accompanied by hydrogen ions,and this has the effect of making the buffer capac-ity of the extracellular space available to handlesome of the hydrogen ions that would otherwisecause the intracellular pH to fall to a point where
biochemistry of exercise 25
Glucose
Glycolysis
ATPADP
ADPATP
ADPATP
ATPADP
Glucose-6-phosphate
Hexokinase
PhosphoglucomutaseGlucose-1-phosphate
GlycogenPi Glycogen
phosphorylase
Glucose-phospate isomerase
Fructose-6-phosphate
Fructose-1,6-bisphosphate
6-phosphofructokinase
Aldolase
Dihydroxyacetone phosphate Glyceraldehyde-3-phosphate
Triose-phosphateisomerase
Pi, NAD+
NADH
NADHNAD+
NAD+
NADH
Glyceraldehyde-phosphatedehydrogenase
1,3-diphosphoglycerate
Phosphoglycerate kinase
3-phosphoglycerate
Phosphoglyceromutase
2-phosphoglycerate
Enolase
Phosphoenolpyruvate
Pyruvate kinase
Pyruvate
Lactate dehydrogenase
Lactate
CoA
Pyruvate dehydrogenase
Acetyl-CoA TCA cycle
Mitochondrion
Cytosol
Cleavage
SUBSTRATELEVEL
PHOSPHORYLATIONOF ADP
Sugaractivation
Fig. 2.3 The reactions of glycolysis. Glucose, a six-carbon sugar, is first phosphorylated and then cleaved to formtwo molecules of the three-carbon sugar glyceraldehyde-3-phosphate, which is subsequently converted intopyruvate, accompanied by the formation of ATP and reduction of NAD+ to NADH. Glycolysis makes twomolecules of ATP available for each molecule of glucose that passes through the pathway. If muscle glycogen is thestarting substrate, three ATP molecules are generated for each glucose unit passing down the pathway. Pyruvatemay enter the mitochondria and be converted into acetyl-CoA, or be reduced to form lactate in the cytosol.Enzymes are set in small type; Pi, inorganic phosphate; TCA, tricarboxylic acid.

it would interfere with cell function. The normalpH of the muscle cell at rest is about 7.1, but thiscan fall to as low as 6.4 in high-intensity exercise,when large amounts of lactate are formed. At thispH, the contractile mechanism begins to fail, andsome inhibition of key enzymes, such as phos-phorylase and phosphofructokinase, may occur.A low pH also stimulates free nerve endings inthe muscle, resulting in the perception of pain.Although the negative effects of the acidosisresulting from lactate accumulation are oftenstressed, it must be remembered that the energymade available by anaerobic glycolysis allowsthe performance of high-intensity exercise thatwould otherwise not be possible.
Aerobic metabolism
As an alternative to conversion to lactate, pyru-vate may undergo oxidative metabolism to CO2and water. This process occurs within the mito-chondrion, and pyruvate which is produced inthe sarcoplasm is transported across the mito-chondrial membrane by a specific carrier protein.The first step to occur within the mitochondrionis the conversion, by oxidative decarboxylation,of the three-carbon pyruvate to a two-carbonacetate group which is linked by a thio-esterbond to coenzyme A (CoA) to form acetyl-CoA.This reaction, in which NAD+ is converted toNADH, is catalysed by the pyruvate dehydro-genase enzyme complex. Acetyl-CoA is alsoformed from the metabolism of fatty acids withinthe mitochondria, in a metabolic pathway calledb-oxidation which, as its name implies, is anoxygen-requiring process.
Acetyl-CoA is oxidized to CO2 in the TCAcycle: this series of reactions is also known as the Krebs cycle, after Hans Krebs, who firstdescribed the reactions involved, or the citricacid cycle, as citrate is one of the key intermedi-ates in the process. The reactions involve combi-nation of acetyl-CoA with oxaloacetate to formcitrate, a six-carbon TCA. A series of reactionsleads to the sequential loss of hydrogen atomsand CO2, resulting in the regeneration ofoxaloacetate:
26 nutrition and exercise
acetyl-CoA+ADP +Pi + 3NAD+ + FAD+ 3H2O fi2CO2 +CoA + ATP+ 3NADH +3H+ + FADH2
Since acetyl-CoA is also a product of fatty acidoxidation, the final steps of oxidative degrada-tion are therefore common to both fat and carbo-hydrate. The hydrogen atoms are carried by thereduced coenzymes NADH and flavin adeninedinucleotide (FADH2). These act as carriers anddonate pairs of electrons to the electron transportchain allowing oxidative phosphorylation withthe subsequent regeneration of ATP from ADP.
A summary of the reactions involved in theTCA cycle is shown in Fig. 2.4. Note that molecu-lar O2 does not participate directly in the reac-tions of the TCA cycle. In essence, the mostimportant function of the TCA cycle is to gener-ate hydrogen atoms for their subsequent passageto the electron transport chain by means ofNADH and FADH2 (Fig. 2.5). The aerobic processof electron transport-oxidative phosphorylationregenerates ATP from ADP, thus conservingsome of the chemical potential energy containedwithin the original substrates in the form of high-energy phosphates. As long as there is an ade-quate supply of O2, and substrate is available,NAD+ and FAD are continuously regeneratedand TCA metabolism proceeds. This systemcannot function without the use of oxygen. Foreach molecule of NADH that enters the electrontransport chain, three molecules of ATP are gen-erated, and for each molecule of FADH2, twomolecules of ATP are formed. Thus, for each mol-ecule of acetyl-CoA undergoing complete oxida-tion in the TCA cycle, a total of 12 ATP moleculesare formed.
The transfer of electrons through the electrontransport chain located on the inner mitochond-rial membrane causes hydrogen ions or protons(H+) from the inner mitochondrial matrix to bepumped across the inner mitochondrial mem-brane into the space between the inner and outermitochondrial membranes. The high concentra-tion of positively charged hydrogen ions in thisouter chamber cause the H+ ions to flow back intothe mitochondrial matrix through an ATP syn-thase protein complex embedded in the inner

mitochondrial membrane. The flow of H+ ions(protons) through this complex constitutes aproton-motive force that is used to drive ATPsynthesis. In terms of the energy conservation ofaerobic glucose metabolism, the overall reactionstarting with glucose as the fuel can be summa-rized as follows:
glucose+6O2 + 38ADP+ 38Pi fi6CO2 +6H2O +38ATP
The total ATP synthesis of 38 mol per mole ofglucose oxidized are accounted for primarily byoxidation of reduced coenzymes in the terminalrespiratory system as follows:
ATP synthesized Source2 Glycolysis6 NADH by glycolysis
24 NADH4 FADH22 GTP
biochemistry of exercise 27
Oxaloacetate Ci
trat
e
cis-aconitate
Isocitrate
α-ketoglutarate
Succinyl-CoASucc
inat
e
Fumarate
Malate
TCA cycle
Pyruvate
NADH + H+
NADH + H+
NAD+
NADH + H+
NAD+
NADH + H+
NAD+
NAD+
Acetyl-CoA
CoA
CoA
CO2
CO2
CO2
CO2
H2O
H2O
H2OFADH2
FAD
Pyruvatecarboxylase
Malatedehydrogenase
Fumarase
Succinatedehydrogenase
Nucleotidediphosphatekinase
Succinylthiokinase
α-ketoglutaratedehydrogenase
Isocitratedehydrogenase
Aconitase
Aconitase
Pyruvatedehydrogenase
complex
Citratesynthase
CoA
GTP
ATP ADP
GDP
CoA
Fig. 2.4 Summary of reactions of the tricarboxylic acid (TCA) cycle showing sites of substrate levelphosphorylation, CO2 production and NAD+ and flavin adenine dinucleotide (FAD) reduction. The two-carbon(2C) acetate units of acetyl-CoA are combined with 4C oxaloacetate to form 6C citrate. The latter undergoes twosuccessive decarboxylation reactions to yield 4C succinate which in subsequent reactions is converted into 4Coxaloacetate, completing the TCA cycle. Enzymes are set in small type; GDP, guanosine diphosphate; GTP,guanosine triphosphate.

One potential problem with the oxidativeregeneration of NAD+ is that the reactions ofoxidative phosphorylation occur within themitochondria, whereas glycolysis is a cytosolicprocess, and the inner mitochondrial membraneis impermeable to NADH and to NAD+. Withoutregeneration of the NAD+ in the cytoplasm, glycolysis will stop so there must be a mecha-nism for the effective oxidation of the NADHformed during glycolysis. This separation isovercome by a number of substrate shuttleswhich transfer reducing equivalents into themitochondrion.
28 nutrition and exercise
Some of the pyruvate formed may be con-verted to the amino acid alanine. Some may alsobe converted to the four-carbon compoundoxaloacetate by the incorporation of CO2 in areaction catalysed by pyruvate carboxylase. Thisconversion to oxaloacetate can be the first step inthe resynthesis of glucose by the process of glu-coneogenesis. Alternatively, this may be impor-tant as an anapleurotic reaction: these arereactions which maintain the intracellular con-centration of crucial intermediates (e.g. of theTCA cycle) which might otherwise becomedepleted.
Inner mitochondrialmembrane
β-oxidationof fatty acids
Coenzyme A
Acetyl-CoA
Pyruvate
NADH
NADHNADH
FADH2
CO2
CO2
NADH
ATP
TCAcycle
Hydrogen is transported by reduced coenzymes
(carrier molecules) of the electron
NADHFADH2
NADH
NAD+
H+
H+H+
O2e–
e–e–
H2O
H+ADP + Pi
ATP
ADP
ATP
ADP
ATP synthase
O2
Outer mitochondrialmembrane
Fatty acidsPyruvate
CO2
Electron transport chain:reduced coenzyme
complexes are oxidized
Fig. 2.5 Schematic diagram showing the relationship of the tricarboxylic (TCA) cycle to the electron transportchain. The main function of the TCA cycle is to reduce the coenzymes NAD+ and flavin adenine dinucleotide (FAD)to NADH and FADH2 which act as carriers of H+ ions and electrons which are donated to the electron transportchain. Molecular oxygen acts as the terminal electron acceptor and the hydrogen ion gradient generated across theinner mitochondrial membrane is used to drive the synthesis of ATP from ADP and Pi.

Carbohydrate and fat stores
Carbohydrates (CHO) are stored in the body asthe glucose polymer called glycogen. Normally,about 300–400 g of glycogen is stored in themuscles of an adult human. Skeletal muscle con-tains a significant store of glycogen in the sar-coplasm. The glycogen content of skeletal muscleat rest is approximately 54–72 g · kg–1 dm (300–400mmol glucosyl units ·kg–1 dm). The liver alsocontains glycogen; about 90–110 g are stored inthe liver of an adult human in the postabsorptivestate, which can be released into the circulation inorder to maintain the blood glucose concentra-tion at about 5mmol · l–1 (0.9 g · l–1). Fats are storedas triacylglycerol mainly in white adipose tissue.This must first be broken down by a lipaseenzyme to release free fatty acids (FFA) into thecirculation for uptake by working muscle. Skele-tal muscle also contains some triacylglycerol(about 50 mmol·kg–1 dm) which can be used asenergy source during exercise following lipoly-sis, and this source of fuel may become relativelymore important after exercise training. Fat storesin the body are far larger than those of CHO(Table 2.3) and fat is a more efficient storage formof energy, releasing 37kJ · g–1, whereas CHOreleases 16 kJ · g–1. Each gram of CHO stored alsoretains about 3g of water, further decreasing theefficiency of CHO as an energy source. The ener-gy cost of running a marathon is about 12000kJ;if this could be achieved by the oxidation of
fat alone, the total amount of fat required wouldbe about 320g, whereas 750 g of CHO and anadditional 2.3kg of associated water would berequired if CHO oxidation were the sole sourceof energy. Apart from considerations of theweight to be carried, this amount of CHOexceeds the total amount normally stored in theliver, muscles and blood combined. The totalstorage capacity for fat is extremely large, and formost practical purposes the amount of energystored in the form of fat is far in excess of thatrequired for any exercise task (Table 2.3).
Protein is not stored, other than as functionallyimportant molecules (e.g. structural proteins,enzymes, ion channels, receptors, contractileproteins, etc.), and the concentration of freeamino acids in most extracellular and intracellu-lar body fluids is quite low (e.g. total free aminoacid concentration in muscle sarcoplasm is about50mmol · l–1). It is not surprising, then, that inmost situations, CHO and fats supply most of theenergy required to regenerate ATP to fuel muscu-lar work. In most situations, protein catabolismcontributes less than 5% of the energy provisionfor muscle contraction during physical activity.Protein catabolism can provide both ketogenicand glucogenic amino acids which may eventu-ally be oxidized either by deamination and con-version into one of the intermediate substrates inthe TCA cycle, or conversion to pyruvate or ace-toacetate and eventual transformation to acetyl-CoA. During starvation and when glycogen
biochemistry of exercise 29
Table 2.3 Energy stores in the average man.
Mass (kg) Energy (kJ) Exercise time (min)
Liver glycogen 0.08 1 280 16Muscle glycogen 0.40 6400 80Blood glucose 0.01 160 2Fat 10.5 388500 4856Protein 12.0 204000 2550
Values assume a body mass of 70kg and a fat content of 15% of body mass. The value for blood glucose includes theglucose content of extracellular fluid. Not all of this, and not more than a very small part of the total protein, is available for use during exercise. Also shown are the approximate times these stores would last for if they were theonly source of energy available during exercise at marathon running pace (equivalent to an energy expenditure ofabout 80kJ · min-1).

stores become depleted, protein catabolism maybecome an increasingly important source ofenergy for muscular work.
Regulation of energy metabolism
Intracellular factors
Experiments in which muscle biopsies weretaken before and immediately after exercise indi-cate that the intramuscular ATP concentrationremains fairly constant. Thus, ATP is constantlybeing regenerated by other energy-liberatingreactions, at a rate equal to which it is being used.This situation provides a sensitive mechanismfor the control of energy metabolism within thecell. The sum of cellular ATP, ADP and AMPconcentrations is termed the total adeninenucleotide pool. The extent to which the totaladenine nucleotide pool is phosphorylated isknown as the energy charge of the cell, and it is agood indicator of the energy status of the cell.The rate at which ATP is resynthesized duringexercise is known to be regulated by the energycharge of the muscle cell. For example, thedecline in cellular concentration of ATP at theonset of muscle force generation and parallelincreases in ADP and AMP concentrations (i.e. adecline in the energy charge) will directly stimu-late anaerobic and oxidative ATP resynthesis.The relatively low concentration of ATP (andADP) inside the cell means that any increase inthe rate of hydrolysis of ATP (e.g. at the onset ofexercise) will produce a rapid change in the ratioof ATP to ADP (and will also increase the intra-cellular concentration of AMP). These changes,in turn, activate enzymes which immediatelystimulate the breakdown of intramuscular fuelstores to provide energy for ATP resynthesis. Inthis way, energy metabolism increases rapidlyfollowing the start of exercise.
ATP, ADP and AMP act as allosteric activatorsor inhibitors of the enzymatic reactions involvedin PCr, CHO and fat degradation and utilization(Fig. 2.6). For example, as already mentioned,creatine kinase, the enzyme responsible for therapid rephosphorylation of ATP at the initiation
30 nutrition and exercise
of muscle force generation, is rapidly activatedby an increase in cytoplasmic ADP concentrationand is inhibited by an increase in cellular ATPconcentration. Similarly, glycogen phosphory-lase, the enzyme which catalyses the conversionof glycogen to glucose-1-phosphate, is activatedby increases in AMP and Pi (and calcium ion)concentration and is inhibited by an increase inATP concentration.
The rate limiting step in the glycolyticpathway is the conversion of fructose-6-phosphate to fructose-1,6-diphosphate and iscatalysed by phosphofructokinase (PFK). Theactivity of this complex enzyme is affected bymany intracellular factors, and it plays an impor-tant role in controlling flux through the pathway.The PFK reaction is the first opportunity for reg-ulation at a point which will affect the metabo-lism of both glucose and glycogen. The activity ofPFK is stimulated by increased concentrations ofADP, AMP, Pi, ammonia and fructose-6-phos-phate and is inhibited by ATP, H+, citrate, phos-phoglycerate and phosphoenolpyruvate. Thus,the rate of glycolysis will be stimulated whenATP and glycogen breakdown are increased atthe onset of exercise. Accumulation of citrate andthus inhibition of PFK may occur when the rateof the TCA cycle is high and provides a meanswhereby the limited stores of CHO can be sparedwhen the availability of fatty acids is high. Inhi-bition of PFK will also cause accumulation ofG6P, which will inhibit the activity of hexokinaseand reduce the entry into the muscle of glucosewhich is not needed.
Conversion of pyruvate to acetyl-CoA by thepyruvate dehydrogenase complex is the rate-limiting step in CHO oxidation and is stimulatedby an increased intracellular concentration ofcalcium, and decreased ratios of ATP/ADP,acetyl-CoA/free CoA and NADH/NAD+ ratioand thus offers another site of regulation of therelative rates of fat and CHO catabolism. If therate of formation of acetyl-CoA from the b-oxidation of fatty acids is high, as after 1–2 h ofsubmaximal exercise, then this could reduce theamount of acetyl-CoA derived from pyruvate,cause accumulation of phosphoenol pyruvate

and inhibition of PFK, thus slowing the rate ofglycolysis and glycogenolysis. This forms thebasis of the ‘glucose–fatty acid cycle’ proposedby Randle et al. (1963), which has for many yearsbeen accepted to be the key regulatory mecha-nism in the control of CHO and fat utilization byskeletal muscle. However, recent work has chal-lenged this hypothesis and it seems likely that
the regulation of the integration of fat and CHOcatabolism in exercising skeletal muscle mustreside elsewhere, e.g. at the level of glucoseuptake into muscle, glycogen breakdown byphosphorylase or the entry of fatty acids into themitochondria. A detailed discussion is beyondthe scope of this review; for further details, seeHargreaves (1995) and Maughan et al. (1997).
biochemistry of exercise 31
Muscle glycogen
1+
+
–
–
––
–
AMP, Pi, Ca2+, adrenaline (cAMP)
ATP
ADP
Glucose-1-P
Glucose-6-P
Fructose-6-P
Fructose-1,6-bp
PEP
Pyruvate
5
Acetyl-CoA
Oxaloacetate
TCA cycle
Succinyl-CoA
α-ketoglutarate
Citrate
ATPNADH
ATP, NADH
Ca2+, ADP, CoA, NAD+
4
3
2
10
9
8
6
7
Glucagon, adrenaline,noradrenalineInsulin
Liver glycogen
Plasma glucose
Adipose tissue andmuscle
triacylglycerolAdrenaline, glucagon,cortisolInsulin
Fatty acids
Fatty acyl-CoA
β-oxidation
NAD+
Muscle proteinCortisol
Insulin
ADP, AMP, Pi, NH+4
ATP, H+
Activators
Inhibitors
Amino acids
+
–
+
–
+
+
–
+
+
–
Fig. 2.6 Metabolic pathways of importance to energy provision during exercise showing the main sites ofregulation and the principal hormonal and allosteric activators and inhibitors. Enzymes: 1, glycogenphosphorylase (muscle); 2, glycogen phosphorylase (liver); 3, hexokinase; 4, phosphofructokinase; 5, pyruvatedehydrogenase; 6, hormone-sensitive lipase; 7, carnitine acyl-transferase; 8, 3-hydroxyacyl dehydrogenase; 9,citrate synthase; 10, proteases. AMP, adenosine monophosphate; cAMP, cyclic AMP; PEP, phosphoenolpyruvate; Pi, inorganic phosphate; TCA, tricarboxylic acid.

A key regulatory point in the TCA cycle is thereaction catalysed by citrate synthase. The activ-ity of this enzyme is inhibited by ATP, NADH,succinyl-CoA and fatty acyl-CoA; the activity ofthe enzyme is also affected by citrate availability.Hence, when cellular energy levels are high, fluxthrough the TCA cycle is relatively low, but canbe greatly increased when ATP and NADH uti-lization is increased, as during exercise.
Hormones
Many hormones influence energy metabolism inthe body (for a detailed review, see Galbo 1983).During exercise, the interaction between insulin,glucagon and the catecholamines (adrenalineand noradrenaline) is mostly responsible for fuelsubstrate availability and utilization; cortisol andgrowth hormone also have some significanteffects.
Insulin is secreted by the b-cells of the islets ofLangerhans in the pancreas. Its basic biologicaleffects are to inhibit lipolysis and increase theuptake of glucose from the blood by the tissues,especially skeletal muscle, liver and adiposetissue; the cellular uptake of amino acids is alsostimulated by insulin. These effects reduce theplasma glucose concentration, inhibit the releaseof glucose from the liver, promote the synthesisof glycogen (in liver and muscle), promote syn-thesis of lipid and inhibit FFA release (in adiposetissue), increase muscle amino acid uptake andenhance protein synthesis. The primary stimulusfor increased insulin secretion is a rise in theblood glucose concentration (e.g. following ameal). Exercise usually results in a fall in insulinsecretion.
Glucagon is secreted by the a-cells of the pan-creatic islets and basically exerts effects that areopposite to those of insulin. It raises the bloodglucose level by increasing the rate of glycogenbreakdown (glycogenolysis) in the liver. It alsopromotes the formation of glucose from non-carbohydrate precursors (gluconeogenesis) inthe liver. The primary stimulus for increasedsecretion of glucagon is a fall in the concentration
32 nutrition and exercise
of glucose in blood. During most types of exer-cise, the blood glucose concentration does notfall, but during prolonged exercise, when liverglycogen stores become depleted, a drop in theblood glucose concentration (hypoglycaemia)may occur.
The catecholamines adrenaline and noradren-aline are released from the adrenal medulla.Noradrenaline is also released from sympatheticnerve endings and leakage from such synapsesappears to be the main source of the noradrena-line found in blood plasma. The catecholamineshave many systemic effects throughout the body,including stimulation of the heart rate and con-tractility and alteration of blood vessel diame-ters. They also influence substrate availability,with the effects of adrenaline being the moreimportant of the two. Adrenaline, like glucagon,promotes glycogenolysis in both liver andmuscle (see Fig. 2.6). Adrenaline also promoteslipolysis in adipose tissue, increasing the avail-ability of plasma FFA and inhibits insulin secre-tion. The primary stimulus for catecholaminesecretion is the activation of the sympatheticnervous system by stressors such as exercise,hypotension and hypoglycaemia. Substantialincreases in the plasma catecholamine concentra-tion can occur within seconds of the onset ofhigh-intensity exercise. However, the relativeexercise intensity has to be above about 50%V.o2max. in order to significantly elevate the
plasma catecholamine concentration.Growth hormone, secreted from the anterior
pituitary gland, also stimulates mobilization ofFFA from adipose tissue and increases in plasmagrowth hormone concentration are related to the intensity of exercise performed. During prolonged strenuous exercise, cortisol secretionfrom the adrenal cortex is increased. Cortisol is asteroid hormone that increases the effectivenessof the actions of catecholamines in some tissues(e.g. its actions further promote lipolysis inadipose tissue). However, its main effects are topromote protein degradation and amino acidrelease from muscle and to stimulate gluconeo-genesis in the liver. The primary stimulus to

cortisol secretion is stress-induced release ofadrenocorticotrophic hormone from the anteriorpituitary gland.
Metabolic responses to exercise
Undoubtedly the most important factor influenc-ing the metabolic response to exercise is the exer-cise intensity. The physical fitness of the subjectalso modifies the metabolic response to exerciseand other factors, including exercise duration,substrate availability, nutritional status, diet,feeding during exercise, mode of exercise, priorexercise, drugs and environmental factors, suchas temperature and altitude, are also important.Several of these factors are dealt with in subse-quent chapters and here a brief discussion islimited to consideration of the effects of exerciseintensity, duration and training on the metabolicresponses to exercise and the possible metaboliccauses of fatigue.
High-intensity exercise
ATP is the only fuel that can be used directly forskeletal muscle force generation. There is suffi-cient ATP available to fuel about 2 s of maximalintensity exercise and therefore for muscle forcegeneration to continue it must be resynthesizedvery rapidly from ADP. During high-intensityexercise, the relatively low rate of ATP resynthe-sis from oxidative phosphorylation results in therapid activation of anaerobic energy productionfrom PCr and glycogen hydrolysis. PCr break-down is initiated at the immediate onset of con-traction to buffer the rapid accumulation of ADPresulting from ATP hydrolysis. However, the rateof PCr hydrolysis begins to decline after only afew seconds of maximal force generation (Fig.2.7).
If high-intensity exercise is to continue beyondonly a few seconds, there must be markedincreases in the contribution from glycolysis to
biochemistry of exercise 33
ATP
pro
duct
ion
(mm
ol.k
g–1
dm. s–
1 )
10
0
8
6
4
0–1.3
Exercise time (s)
2
0–2.6 0–5 0–10 10–20 20–30
Fig. 2.7 Rates of anaerobic ATPresynthesis from phosphocreatine(PCr) hydrolysis ( ) andglycolysis ( ) during maximalisometric contraction in humanskeletal muscle. Rates werecalculated from metabolitechanges measured in biopsysamples of muscle obtainedduring intermittent electricallyevoked contractions over a periodof 30 s. Note that the rate of ATPresynthesis from PCr hydrolysis ishighest in the first few seconds ofexercise, but falls to almost zeroafter 20 s. The rate of ATPresynthesis from glycolysis peaksafter about 5 s, is maintained for afurther 15 s but falls during thelast 10 s of the exercise bout. FromMaughan et al. (1997).

34 nutrition and exercise
ATP resynthesis. Anaerobic glycolysis involvesseveral more steps than PCr hydrolysis.However, compared with oxidative phosphory-lation, it is still very rapid. It is initiated at theonset of contraction, but, unlike PCr hydrolysis,does not reach a maximal rate until after 5 s ofexercise and can be maintained at this level forseveral seconds during maximal muscle forcegeneration (Fig. 2.7). The mechanism(s) responsi-ble for the eventual decline in glycolysis duringmaximal exercise have not been resolved. Exer-cise at an intensity equivalent to 95–100% V
.o2max.
can be sustained for durations approaching 5min before fatigue is evident. Under these con-ditions, CHO oxidation can make a significantcontribution to ATP production, but its relativeimportance is often underestimated.
Fatigue has been defined as the inability tomaintain a given or expected force or poweroutput and is an inevitable feature of maximalexercise. Typically, the loss of power output orforce production is likely to be in the region of40–60% of the maximum observed during 30s ofall-out exercise. Fatigue is not a simple processwith a single cause; many factors may contributeto fatigue. However, during maximal short dura-tion exercise, it will be caused primarily by agradual decline in anaerobic ATP production orincrease in ADP accumulation caused by a deple-tion of PCr and a fall in the rate of glycolysis. Inhigh-intensity exercise lasting 1–5 min, lactic acidaccumulation may contribute to the fatigueprocess. At physiological pH values, lactic acidalmost completely dissociates into its constituentlactate and hydrogen ions; studies using animalmuscle preparations have demonstrated thatdirect inhibition of force production can beachieved by increasing hydrogen and lactate ionconcentrations. A reduced muscle pH may causesome inhibition of PFK and phosphorylase,reducing the rate of ATP resynthesis from glyco-lysis, though it is thought that this is unlikely tobe important in exercising muscle because the invitro inhibition of PFK by a reduced pH isreversed in the presence of other allosteric activa-tors such as AMP (Spriet 1991). It would alsoappear that lactate and hydrogen ion accumula-
tion can result in muscle fatigue independent ofone another but the latter is the more commonlycited mechanism. However, although likely to berelated to the fatigue process it is unlikely thatboth lactate and hydrogen ion accumulation iswholly responsible for the development ofmuscle fatigue. For example, studies involvinghuman volunteers have demonstrated thatmuscle force generation following fatiguingexercise can recover rapidly, despite also havinga very low muscle pH value. The general consen-sus at the moment appears to be that the mainte-nance of force production during high-intensityexercise is pH dependent, but the initial forcegeneration is more related to PCr availability.
One of the consequences of rapid PCr hydroly-sis during high-intensity exercise is the accumu-lation of Pi, which has been shown to inhibitmuscle contraction coupling directly. However,the simultaneous depletion of PCr and Pi accu-mulation makes it difficult to separate the effectof PCr depletion from Pi accumulation in vivo.This problem is further confounded by the paral-lel increases in hydrogen and lactate ions whichoccur during high-intensity exercise. All of thesemetabolites have been independently implicatedwith muscle fatigue.
As described earlier, calcium release by the sarcoplasmic reticulum as a consequence ofmuscle depolarization is essential for the activa-tion of muscle contraction coupling. It has beendemonstrated that during fatiguing contractionsthere is a slowing of calcium transport and pro-gressively smaller calcium transients which has been attributed to a reduction in calciumreuptake by the sarcoplasmic reticulum and/orincreased calcium binding. Strong evidence thata disruption of calcium handling is responsiblefor fatigue comes from studies showing that thestimulation of sarcoplasmic reticulum calciumrelease caused by the administration of calciumto isolated muscle can improve muscle force pro-duction, even in the presence of a low muscle pH.Alternatively, fatigue during high-intensity exer-cise may be associated with an excitation-coupling failure and possibly a reduced nervousdrive due to reflex inhibition at the spinal level.
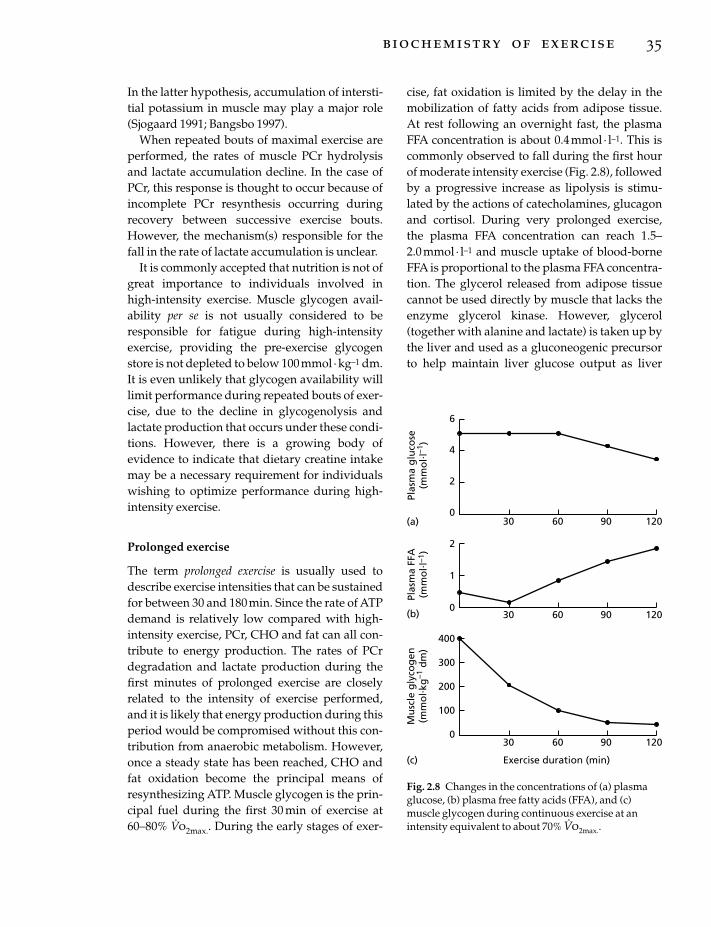
In the latter hypothesis, accumulation of intersti-tial potassium in muscle may play a major role(Sjogaard 1991; Bangsbo 1997).
When repeated bouts of maximal exercise areperformed, the rates of muscle PCr hydrolysisand lactate accumulation decline. In the case ofPCr, this response is thought to occur because ofincomplete PCr resynthesis occurring duringrecovery between successive exercise bouts.However, the mechanism(s) responsible for thefall in the rate of lactate accumulation is unclear.
It is commonly accepted that nutrition is not ofgreat importance to individuals involved inhigh-intensity exercise. Muscle glycogen avail-ability per se is not usually considered to beresponsible for fatigue during high-intensityexercise, providing the pre-exercise glycogenstore is not depleted to below 100mmol ·kg–1 dm.It is even unlikely that glycogen availability willlimit performance during repeated bouts of exer-cise, due to the decline in glycogenolysis andlactate production that occurs under these condi-tions. However, there is a growing body of evidence to indicate that dietary creatine intakemay be a necessary requirement for individualswishing to optimize performance during high-intensity exercise.
Prolonged exercise
The term prolonged exercise is usually used todescribe exercise intensities that can be sustainedfor between 30 and 180min. Since the rate of ATPdemand is relatively low compared with high-intensity exercise, PCr, CHO and fat can all con-tribute to energy production. The rates of PCrdegradation and lactate production during thefirst minutes of prolonged exercise are closelyrelated to the intensity of exercise performed,and it is likely that energy production during thisperiod would be compromised without this con-tribution from anaerobic metabolism. However,once a steady state has been reached, CHO andfat oxidation become the principal means ofresynthesizing ATP. Muscle glycogen is the prin-cipal fuel during the first 30 min of exercise at60–80% V
.o2max.. During the early stages of exer-
cise, fat oxidation is limited by the delay in themobilization of fatty acids from adipose tissue.At rest following an overnight fast, the plasmaFFA concentration is about 0.4mmol · l–1. This iscommonly observed to fall during the first hourof moderate intensity exercise (Fig. 2.8), followedby a progressive increase as lipolysis is stimu-lated by the actions of catecholamines, glucagonand cortisol. During very prolonged exercise, the plasma FFA concentration can reach 1.5–2.0mmol · l–1 and muscle uptake of blood-borneFFA is proportional to the plasma FFA concentra-tion. The glycerol released from adipose tissuecannot be used directly by muscle that lacks theenzyme glycerol kinase. However, glycerol(together with alanine and lactate) is taken up bythe liver and used as a gluconeogenic precursorto help maintain liver glucose output as liver
biochemistry of exercise 35
6
4
2
0
2
1
0
400
300
200
100
030 60 90 120
Exercise duration (min)
Plas
ma
glu
cose
(mm
ol. l
–1)
Plas
ma
FFA
(mm
ol. l
–1)
Mu
scle
gly
cog
en(m
mo
l. kg
–1 d
m)
(a)
(b)
(c)
30 60 90 120
30 60 90 120
Fig. 2.8 Changes in the concentrations of (a) plasmaglucose, (b) plasma free fatty acids (FFA), and (c)muscle glycogen during continuous exercise at anintensity equivalent to about 70% V
.o2max..

glycogen levels decline. The utilization of bloodglucose is greater at higher workrates andincreases with exercise duration during pro-longed submaximal exercise and peaks afterabout 90 min (Fig. 2.9). The decline in bloodglucose uptake after this time is attributable tothe increasing availability of plasma FFA as fuel(which appears to directly inhibit muscle glucoseuptake) and the depletion of liver glycogenstores.
At marathon-running pace, muscle CHOstores alone could fuel about 80min of exercisebefore becoming depleted (Table 2.3). However,the simultaneous utilization of body fat andhepatic CHO stores enables ATP production tobe maintained and exercise to continue. Ulti-mately, though, ATP production becomes com-promised due to muscle and hepatic CHO storesbecoming depleted and the inability of fat oxida-tion to increase sufficiently to offset this deficit.The rate of ATP resynthesis from fat oxidationalone cannot meet the ATP requirement for exer-cise intensities higher than about 50–60% V
.o2max..
It is currently unknown which factor limits themaximal rate of fat oxidation during exercise (i.e.
36 nutrition and exercise
why it cannot increase to compensate for CHOdepletion), but it must precede acetyl-CoA for-mation, as from this point fat and CHO share thesame fate. The limitation may reside in the rate ofuptake of FFA into muscle from blood or thetransport of FFA into the mitochondria ratherthan in the rate of b-oxidation of FFA in the mitochondria.
It is generally accepted that the glucose–fattyacid cycle regulates the integration of CHO and fat oxidation during prolonged exercise.However, whilst this may be true of restingmuscle, recent evidence (Dyck et al. 1993) sug-gests that the cycle does not operate in exercisingmuscle and that the site of regulation must resideelsewhere (e.g. at the level of phosphorylaseand/or malonyl-CoA). From the literature, itwould appear that the integration of muscleCHO and fat utilization during prolonged exer-cise is complex and unresolved.
The glycogen store of human muscle is fairlyinsensitive to change in sedentary individuals.However, the combination of exercise anddietary manipulation can have dramatic effectson muscle glycogen storage. A clear positive rela-tionship has been shown to exist between muscleglycogen content and subsequent enduranceperformance. Furthermore, the ingestion of CHOduring prolonged exercise has been shown todecrease muscle glycogen utilization and fatmobilization and oxidation, and to increase therate of CHO oxidation and endurance capacity. Itis clear therefore that the contribution of orallyingested CHO to total ATP production underthese conditions must be greater than that nor-mally derived from fat oxidation. The precisebiochemical mechanism by which muscle glyco-gen depletion results in fatigue is presently unre-solved (Green 1991). However, it is plausible thatthe inability of muscle to maintain the rate of ATPsynthesis in the glycogen depleted state results inADP and Pi accumulation and consequentlyfatigue development.
Unlike skeletal muscle, starvation will rapidlydeplete the liver of CHO. The rate of hepaticglucose release in resting postabsorptive individ-uals is sufficient to match the CHO demands of
Fig. 2.9 Changes in the relative contributions of themajor fuel sources to ATP resynthesis duringprolonged submaximal exercise at an intensityequivalent to about 70% V
.o2max. (approximately 10
times the resting metabolic rate). , blood glucose; , plasma free fatty acids; �, muscle glycogen and
triacylglycerol.
Rate
of A
TP re
synt
hesis
0(rest) Exercise duration (min)
30 60 90 120
25%
25%
50%
33%
36%
31%
41%
45%
14%
30%
62%
8%
only the central nervous system. Approximately70% of this release is derived from liver CHOstores and the remainder from liver gluconeoge-nesis. During exercise, the rate of hepatic glucoserelease has been shown to be related to exerciseintensity. Ninety percent of this release is derivedfrom liver CHO stores, ultimately resulting inliver glycogen depletion.
Thus, CHO ingestion during exercise couldalso delay fatigue development by slowing therate of liver glycogen depletion and helping to maintain the blood glucose concentration.Central fatigue is a possibility during prolongedexercise and undoubtedly the development ofhypoglycaemia could contribute to this.
Metabolic adaptation to exercise training
Adaptations to aerobic endurance traininginclude increases in capillary density and mito-chondrial size and number in trained muscle.The activity of TCA cycle and other oxidativeenzymes are increased with a concomitantincrease in the capacity to oxidize both lipid andCHO. Training adaptations in muscle affect substrate utilization. Endurance training alsoincreases the relative cross-sectional area of typeI fibres, increases intramuscular content of tri-acylglycerol, and increases the capacity to use fatas an energy source during submaximal exercise.Trained subjects also appear to demonstrate anincreased reliance on intramuscular triacylglyc-erol as an energy source during exercise. Theseeffects, and other physiological effects of train-ing, including increased maximum cardiacoutput and V
.o2max., improved oxygen delivery to
working muscle (Saltin 1985) and attenuatedhormonal responses to exercise (Galbo 1983),decrease the rate of utilization of muscle glyco-gen and blood glucose and decrease the rate ofaccumulation of lactate during submaximal exer-cise. These adaptations contribute to the markedimprovement in endurance capacity followingtraining.
Alterations in substrate use with endurancetraining could be due, at least in part, to a lesser
degree of disturbance to ATP homeostasis duringexercise. With an increased mitochondrial oxida-tive capacity after training, smaller decreases inATP and PCr and smaller increases in ADP and Piare needed during exercise to balance the rate ofATP synthesis with the rate of ATP utilization. Inother words, with more mitochondria, theamount of oxygen as well as the ADP and Pirequired per mitochondrion will be less aftertraining than before training. The smallerincrease in ADP concentration would result inless formation of AMP by the myokinase reac-tion, and also less IMP and ammonia would beformed as a result of AMP deamination. Smallerincreases in the concentrations of ADP, AMP, Piand ammonia could account for the slower rateof glycolysis and glycogenolysis in trained thanin untrained muscle.
Training for strength, power or speed has littleif any effect on aerobic capacity. Heavy resistancetraining or sprinting bring about specific changesin the immediate (ATP and PCr) and short-term(glycolytic) energy delivery systems, increases inmuscle buffering capacity and improvements instrength and/or sprint performance. Heavyresistance training for several months causeshypertrophy of the muscle fibres, thus increasingtotal muscle mass and the maximum poweroutput that can be developed. Stretch, contrac-tion and damage of muscle fibres during exerciseprovide the stimuli for adaptation, whichinvolves changes in the expression of differentmyosin isoforms.
References
Åstrand, P.-O. & Rodahl, K. (1986) Textbook of WorkPhysiology. McGraw-Hill, New York.
Bangsbo, J. (1997) Physiology of muscle fatigue duringintense exercise. In The Clinical Pharmacology of Sportand Exercise (ed. T. Reilly & M. Orme), pp. 123–133.Elsevier, Amsterdam.
Dyck, D.J., Putman, C.T., Heigenhauser, G.J.F.,Hultman, E. & Spriet, L.L. (1993) Regulation offat–carbohydrate interaction in skeletal muscleduring intense aerobic cycling. American Journal ofPhysiology 265, E852–E859.
Frank, G.B. (1982) Roles of intracellular and triggercalcium ions in excitation–contraction coupling in
biochemistry of exercise 37

skeletal muscle. Canadian Journal of Physiology andPharmacology 60, 427–439.
Galbo, H. (1983) Hormonal and Metabolic Adaptation toExercise. Verlag, New York.
Green, H.J. (1991) How important is endogenousmuscle glycogen to fatigue in prolonged exercise?Canadian Journal of Physiology and Pharmacology 69,290–297.
Hargreaves, M. (1995) Exercise Metabolism. HumanKinetics, Champaign, IL.
Komi, P.V. & Karlsson, J. (1978) Skeletal muscle fibretypes, enzyme activities and physical performance in young males and females. Acta Physiologica Scandinavica 103, 210–218.
Maughan, R.J., Gleeson, M. & Greenhaff, P.L. (1997) Biochemistry of Exercise and Training. OxfordUniversity Press, Oxford.
Randle, P.J., Garland, P.B., Hales, C.N. & Newsholme,
38 nutrition and exercise
E.A. (1963) The glucose fatty acid cycle: its role ininsulin sensitivity and the metabolic disturbances ofdiabetes mellitus. Lancet i, 786–789.
Sahlin, K. & Broberg, S. (1990) Adenine nucleotidedepletion in human muscle during exercise: causal-ity and significance of AMP deamination. Interna-tional Journal of Sports Medicine 11, S62–S67.
Saltin, B. (1985) Physiological adaptation to physicalconditioning. Acta Medica Scandinavica 711 (Suppl.),11–24.
Sjogaard, G. (1991) Role of exercise-induced potassiumfluxes underlying muscle fatigue: a brief review.Canadian Journal of Physiology and Pharmacology 69,238–245.
Spriet, L.L. (1991) Phosphofructokinase activity andacidosis during short-term tetanic contractions.Canadian Journal of Physiology and Pharmacology 69,298–304.
Introduction
By virtue of its mass and unique potential to increase metabolic rate, skeletal muscle isman’s largest ‘metabolic organ’. Energy ex-penditure is increased profoundly during ex-ercise with the body’s large muscles andindividuals who engage regularly and fre-quently in such exercise have enhanced energyrequirements. These are met through increasednutrient intake, particularly of carbohydrate, sothat the relative contributions of macronutrientsto energy intake may be altered. This in itselfmay constitute a more healthy diet but, in addi-tion, the metabolic handling of dietary fats and carbohydrates is improved, changes which helpreduce the risk of developing several chronic diseases, specifically atherosclerotic vascular dis-eases, non-insulin-dependent diabetes (NIDDM,also known as adult-onset or type II diabetes)and possibly some cancers (Bouchard et al. 1994).
An example of an association between diseaserisk and energy turnover is given in Table 3.1,which shows average daily energy intakes inprospective studies of coronary heart disease(CHD). Men who subsequently had fatal attacksshowed lower levels of energy intake than survivors, an apparent paradox in the light of the increase in CHD risk associated with overweight, obesity and the deleterious meta-bolic sequelae of these. One explanation is that the men with higher energy intakes weremore physically active, and that their exercise
afforded a level of protection against CHD, compared with more sedentary men who ateless.
Thus, the transition from a sedentary to an active state is associated with a higher energy turnover, with important implications for the transport, storage and utilization of thebody’s metabolic fuels. All of these are altered in the trained state such that regular exercisersexperience a lower risk of what has been called ‘metabolic, hypertensive cardiovasculardisease’. Higher energy turnover may also beassociated with improved weight regulationbecause food intake appears to be more closelycoupled to energy expenditure with more exercise.
Rather than prolonging life, regular exerciseprotects against premature death, with an esti-mated increase in longevity in men on average ofone or two years (Paffenbarger et al. 1986). More-over, lower all-cause mortality has recently beenreported for physically active women (Blair et al.1996), although evidence is much less extensive.People who take exercise also maintain a betterquality of life into old age, being less likely than sedentary individuals to develop functionallimitations.
This chapter will identify some of the healthgains which accrue from the biological inter-actions between exercise and the body’s meta-bolism of dietary carbohydrate and fats. Fordiscussion of the evidence for a specific role ofdiet in promoting health, the reader is referred toother sources (WHO 1990).
Chapter 3
Exercise, Nutrition and Health
ADRIANNE E. HARDMAN
39

Atherosclerotic vascular diseases
Pathological changes to the arterial wall give riseto atherosclerotic plaques, complex structureswhich result from proliferation of the smoothmuscle cells and collagen, with deposition ofcholesterol-rich lipid. These probably begin asfatty streaks which develop when lipid-ladenmacrophages accumulate after the integrity ofthe endothelium is breached and blood compo-nents are exposed to collagen in the wall of theartery. The clinical outcome depends on thesite(s) and extent of the lesion: in coronary arter-ies, myocardial blood flow is reduced, leading to chest pain on effort (angina) and a risk ofthrombotic occlusion (heart attack) and/or dis-turbances in the electrical coordination of con-traction; blood supply to the limbs is impairedwhen the arteries supplying the legs are narrowed, imposing severe limits on walkingcapability; and stroke occurs when there isthrombolytic occlusion of a cerebral artery or alocal haemorrhage from a vessel with atheroscle-rotic damage. Links with nutrition are clear from,for example, the association between levels ofsaturated fat in the diet and the risk of CHD.
Coronary heart disease
Epidemiological studies have shown significantassociations between indices of both physicalactivity (a behaviour) and physical fitness (a set of characteristics arising from the regular pursuance of this behaviour) and risk of the com-monest manifestation of atherosclerosis, CHD —a disease responsible for one in four male deathsand one in five female deaths in the UK in 1994.
40 nutrition and exercise
We must be careful in our interpretation of asso-ciations, however, because exercisers may beconstitutionally different from sedentary peoplein ways which decrease the likelihood of theirdeveloping the disease. Complementary scien-tific evidence of plausible mechanisms has muchto contribute and the role of exercise in this willbe discussed later.
More than 50 population studies have com-pared the risk of CHD in physically active menwith that of their sedentary counterparts. Carefulscrutiny of their findings shows that sedentarymen experience about twice the risk seen inactive men (see Whaley & Blair 1995). This rela-tive risk is of the same order of magnitude as thatassociated with hypertension (systolic bloodpressure > 150mmHg vs.< 120mmHg), smoking(≥ 20 cigarettes ·day–1 vs. no smoking) and highserum total cholesterol levels (> 6.9mmol · l–1 vs.£5.6 mmol · l–1). Estimates of the protective effectof exercise are highest in those studies with thesoundest design and methodology and no studyhas found a higher risk in active men. The effect isindependent of hypertension, smoking and hightotal cholesterol levels.
Early studies compared groups of men withdifferent levels of occupational work. Forexample, postal workers who walked and cycleddelivering mail and dock workers with highlevels of habitual on-the-job energy expenditureexperienced less heart disease than colleagues inless physically demanding jobs. Leisure timephysical activity has also been studied and aninverse, graded relationship between leisuretime physical activity and CHD was foundamong graduates (alumni) of Harvard and Pennsylvania universities (Paffenbarger et al.
Table 3.1 Average daily energy intake (MJ) and future risk of coronary heart disease. Adapted from Wood (1987).
Cohort Heart disease victims Survivors
English banking and 11.11 12.00London bus workers
Framingham, Massachusetts 9.91 10.97Puerto Rico 9.30 10.02Honolulu, Hawaii 8.99 9.70

1986); the risk of first attack was one quarter toone third lower in men who expended more than8.36MJ ·week–1 (2000 kcal ·week–1) in physicalactivity (sports, garden work, walking, stair-climbing, etc.) than in classmates whose exercise energy expenditure was lower, i.e. hightotal energy expenditure in exercise was a determinant of risk.
By contrast, prospective study of English civilservants found no association between totalexercise energy expenditure and risk of heartattack (Morris et al. 1990); only men reporting‘vigorous’ exercise experienced a lower risk thansedentary men. Vigorous was defined as exerciselikely to involve peaks of energy expenditure of31kJ ·min–1 (7.5 kcal · min–1) or more. This isabout the rate of energy expenditure of a middle-aged man of average weight during fast walking,so it is not surprising that men who reported that their usual speed of walking was ‘fast’ (> 6.4km ·h–1) experienced a particularly low rateof attack. Low rates were also reported for menwho did considerable amounts of cycling.
Increasingly, studies have measured physicalfitness rather than, or as well as, physical activity.Their findings are broadly similar, i.e. a two- tothreefold increase in the risk of cardiovasculardeath in men when comparing the least fit withthe most fit groups (Whaley & Blair 1995). The
limited data available suggest an effect of at leastthis magnitude for women.
Given the diverse methodologies and cohortsstudied, the clarity with which the inverse,graded relationship between level of physicalactivity or fitness and risk of mortality from CHDemerges is noteworthy. Figure 3.1 summarizesthe findings of seven studies in which eitherleisure time activity (questionnaire) or fitness(laboratory exercise test) was assessed prior to afollow-up period of 7–17 years. The precisepattern differs between studies, but it is clearthat, whilst men with only moderate levels ofactivity or fitness experience some degree of pro-tection, higher levels tend to confer greater protection. Some studies, however, suggest thatthe relationship may be curvilinear — CHD riskdecreasing steeply at the lower end of the contin-uum, reaching an asymptote in the mid-range.Thus, for men in the age group most studied(approximately 40–60 years), values for V
.o2max.
of around 35 ml · kg–1 ·min–1 have been proposedas being sufficient to confer a worthwhile — notnecessarily optimal — decrease in risk; evidencefor women is scanty, but a comparable value isprobably at least 2 or 3ml · kg–1 ·min–1 lower.
Two aspects of the evidence strengthen theargument that the relation of activity and fitnesswith CHD risk may be causal. First, only current
exercise, nutrition and health 41
Fig. 3.1 The relationship between the level of physical activity (Paffenbarger et al. 1986; Ekelund et al. 1988; Morriset al. 1990; Leon 1991; Shaper & Wannamethee 1991) or fitness (Blair et al. 1989; Sandvik et al. 1993) and risk ofcoronary heart disease among men in prospective studies. Adapted from Haskell (1994).
++
+
++
+
100
80
60
40
20
0
Red
uct
ion
in c
oro
nar
yev
ents
/mo
rtal
ity
Physical activity/fitness level
Paffenbarger et al., 1986Morris et al., 1990Blair et al., 1989Leon, 1991Ekelund et al., 1988Sandvik et al., 1993Shaper & Wannamethee, 1991

and continuing activity protects against heartdisease; men who were active in their youth butbecame sedentary in middle-age experience arisk similar to that of men who had never beenactive. Second, men who improved either theirphysical activity level or their fitness levelbetween one observation period and anothersome years later experienced a lower risk ofdeath than men who remain sedentary. To putthese levels of risk reduction into perspective,taking up physical activity was as effective asstopping smoking.
The role of exercise intensity in determiningCHD risk is still uncertain. Several key studieshave shown substantial reductions in risk withaccumulation of physical activity, most of whichwas at a moderate intensity (see Haskell 1994).However, other evidence argues that more vigor-ous physical activity may provide unique bene-fits. These uncertainties should not, however,detract from the wealth of evidence, gatheredover a long period and in different populations,that identifies physical inactivity as a major riskfactor for CHD.
Mechanisms by which exercise might confer alower risk of CHD include effects on blood pres-sure, weight regulation, lipoprotein metabolismand insulin sensitivity — all of which are dis-cussed below. Another suggestion, arising fromthe evidence referred to above that only currentexercise protects against CHD, involves an effecton the acute phase of the disease — the throm-botic component, for example. This possibility is supported by associations between exercisehabits and haemostatic factors and is an area jus-tifying more research.
Stroke
Atherosclerotic damage to cerebral arteries is aprominent feature of stroke, so an effect of ha-bitual exercise on the risk of having a stroke isplausible, but there is little direct evidence. In theBritish Regional Heart Study (Wannamethee &Shaper 1992), the age-adjusted rate for strokesshowed a steep and significant inverse gradientwith physical activity category in men with or
42 nutrition and exercise
without heart disease or stroke at baseline; therisk in moderately active subjects was less thanhalf that reported for inactive men. Data from theHonolulu Heart Program (Abbott et al. 1994)show an association between the risk of strokeand a physical activity index in older middle-aged men (55–68 years) but not in younger men(45–54 years); the excess incidence of haemor-rhagic stroke in inactive/partially active menwas three- to fourfold. For thromboembolicstroke, among non-smokers the risk for inactivemen was nearly double that for active men butthere was no effect in smokers.
Hypertension
About 16% of men and 14% of women inEngland have hypertension (systolic blood pres-sure >159 mmHg and/or diastolic > 94mmHg).It is a major public health problem; even mild tomoderate elevations in blood pressure substan-tially increase the risk of developing CHD,stroke, congestive heart failure and intermittentclaudication in both men and women.
There is some evidence that high levels ofphysical activity decrease the risk of developinghypertension (see Paffenbarger et al. 1991). Forexample, of 5500 male Harvard alumni free ofhypertension at entry to the study, 14% devel-oped the disease during 14 years’ observation.Contemporary vigorous exercise alone was asso-ciated with lower incidence, chiefly among menwho were overweight-for-height. Similar conclu-sions arise from study of fitness levels in relationto risk of hypertension: during follow-up of 6000men and women over 1–12 years (median, 4) therisk of developing hypertension was 1.5 timesgreater for those with low fitness (the bottom75% of the sample) than for those deemed tohave high fitness (the top 25%).
The rationale for a role for exercise in the pre-vention of hypertension is that, during exercise,there is marked dilation of blood vessels in activeskeletal muscle, decreasing resistance to flow.This persists during the recovery period, possi-bly contributing to the chronic lowering of (arte-rial) blood pressure which is often associated

with regular aerobic exercise. The propositionthat exercise brings blood pressure down hasbeen tested experimentally. Valid conclusionscan only be drawn from studies including non-exercising control subjects, because blood pres-sures tend to fall with repeated measurementswhen people become accustomed to the proce-dure. Controlled exercise intervention trials havefound an average reduction of 3/3 mmHg (systolic/diastolic) in normotensives, withsomewhat greater reductions in borderlinehypertensives and hypertensives, i.e. 6/7 mmHgand 10/8mmHg, respectively (Bouchard et al.1994). These conclusions are based on restingblood pressure measured in clinic or laboratory;reductions in measures made during the normalliving conditions tend to be less consistent andsmaller but more evidence is needed. Moderateintensity training (<70% V
.o2max.) leads to reduc-
tions in systolic blood pressure which are up to40% greater than those resulting from training athigher intensity, possibly because of the lesserresponse of the sympathetic nervous system.
The blood-pressure lowering effect of exerciseprobably occurs very rapidly, possibly after aslittle as 1 week of exercise training. Repeatedshort-term effects during recovery from individ-ual exercise sessions may therefore be important.For example, in sedentary hypertensives, bloodpressure is reduced for up to 8–12 h after a singleexercise session. Longer training programmesproduce somewhat larger reductions in bloodpressures, however, suggesting that adaptiveeffects of habitual exercise, i.e. training, may actsynergistically to enhance short-term effects.
Glucose/insulin dynamics
Diabetes mellitus afflicts about 2% of individualsin Western populations. By far the most commontype is NIDDM, the incidence of which risessteeply with age. It is characterized by the failureof insulin to act effectively in target tissues suchas muscle, liver and adipose tissue. The pancreasresponds with enhanced secretion by its b-cellsand plasma insulin levels are chronically high.Glucose intolerance (an abnormally high blood
glucose response to a standard 75g oral load)develops gradually, fasting plasma glucose andinsulin levels rising in parallel until the formerreaches 7–8 mmol · l–1 (compared with normalvalues of around 4–5 mmol · l–1). At this stage the b-cells of the pancreas fail to maintain adequateinsulin secretion and so there is a progressive fallin the fasting concentration. Profound glucoseintolerance then develops and the conditionworsens to overt NIDDM, the severity of which is determined by the inadequacy of b-cellfunction.
Resistance to insulin-stimulated glucoseuptake is the most important precursor ofNIDDM and a common characteristic occurringin approximately 25% of the population. It is aprominent feature of obesity. Normal glucosetolerance is maintained but at the expense ofhyperinsulinaemia, which leads to multiple der-angements of metabolism — for example, highplasma levels of triacylglyceride (TAG) and lowlevels of high-density lipoprotein (HDL) choles-terol. In the longer term, these result in damageto blood vessels, with increased risk of develop-ing CHD, hypertension and problems of themicrocirculation, including renal disease andretinal damage.
Risk of NIDDM
Prospective studies show an inverse relationshipbetween energy expenditure in leisure timeactivity and the risk of subsequently developingNIDDM (Kriska et al. 1994). For example, amongmale ex-students of the University of Pennsylva-nia the incidence of NIDDM decreased by some6% for each 2.1MJ (500kcal) expended per weekin physical activity. US male physicians whoexercised ‘vigorously’ at least once per weekexperienced only 64% of the risk of developingNIDDM, compared with those who exercisedless frequently. Findings have been similar formiddle-aged women, those taking part in vigor-ous exercise experiencing only two thirds of therisk seen in other women. There are indicationsthat the influence of physical activity may be particularly strong in those who are overweight.
exercise, nutrition and health 43

Potential mechanisms
The primary targets for insulin-stimulatedglucose disposal are skeletal muscle and adiposetissue and influences on their glucose transportand metabolism dictate whole-body responsive-ness to insulin. Muscle, representing some 40%of body mass, is probably the more importanttissue.
Insulin-mediated glucose uptake into skeletalmuscle proceeds by a series of steps, the first ofwhich is insulin binding to receptors on the outersurface of the cell membrane. Glucose transportis achieved via ‘facilitated diffusion’, a processwhich involves a mobile protein carrier (GLUT-4) which facilitates its transport across the mem-brane and is thought to be rate-limiting. Besidesits action on glucose transport, insulin inhibitsglycogenolysis, promoting glycogen synthesis.Muscle glycogen is reduced during exercise, cre-ating the need for enhanced uptake and storageand raising the possibility that improved respon-siveness of this tissue to insulin might exert animportant influence on the body as a whole,explaining the lower incidence of NIDDM inphysically active people.
It is more than 25 years since the first report ofmarkedly lower plasma insulin concentrations inendurance-trained middle-aged men — both inthe fasted state and after an oral glucose load —than in comparable sedentary men. These find-ings have generally been interpreted as a sign ofincreased insulin sensitivity in peripheraltissues, since hepatic glucose output is sup-pressed after glucose ingestion. Later studieshave confirmed this, measuring reduced insulinsecretion and a shift in the insulin/glucose dis-posal response curve, promoting glucose trans-port and storage. Whole-body non-oxidativeglucose disposal during glucose infusion ishigher in endurance-trained athletes than insedentary controls. Total activity of glycogensynthase and insulin-stimulated activation of theenzyme is enhanced as trained muscle adapts tothe increased intracellular availability of glucoseby developing an enhanced capacity for glucosestorage as glycogen.
The mechanisms by which training enhances
44 nutrition and exercise
glucose uptake in skeletal muscle are local ratherthan systemic and probably involve changes inlevels of the muscle glucose transporter GLUT-4.Endurance-trained athletes possess higher levelsof GLUT-4 than sedentary controls and levels aremarkedly higher in trained than in untrainedmuscle from the same individual, in associationwith a higher insulin-stimulated glucose uptake.Glucose uptake depends on its rate of delivery to the tissue, however, as well as that tissue’sresponsiveness to insulin. Insulin stimulatesincreases in blood flow to muscle in a dose-responsive manner and this effect could, specu-latively, be enhanced in athletes because ofimproved capillarization.
Following each exercise session, glucoseuptake into skeletal muscle increases. This ispartly an insulin-independent contractile effectwhich persists for several hours afterwards but,in addition, the response to insulin of the glucosetransport system is improved. This usually lasts longer, for at least 48 h. As stated above,these may be responses to the need to replenishmuscle glycogen; certainly exhaustive, intermit-tent glycogen-depleting exercise at 85% V
.o2max.
results in increased non-oxidative glucose dis-posal when measured 12h later.
When endurance-trained people refrain fromtraining, their enhanced insulin action is rapidlyreversed. The timescale of this reversal is notclear; training effects have been reported topersist for as little as 36 h but more typically forabout 3 days, so that levels seen in sedentarypeople are approached within 1 week. Could thegood insulin sensitivity which characterizes ath-letes be attributable to residual effects of their lasttraining session, rather than to any long-termadaptive effects? The answer to this question is‘probably not’. Studies have compared theresponse of a trained leg to a single session ofexercise with that of an untrained (contralateral)leg to identical exercise; insulin action wasimproved in the trained leg but there was noeffect in the untrained leg. The effect of trainingon insulin-mediated glucose disposal in musclehas therefore been described as a genuine adap-tation to training — but short-lived.
Whole-body insulin sensitivity is directly and

positively related to muscle mass and, long-term,there may be additional effects of regular activityif muscle mass increases. By contrast with theeffects of endurance training, which leads to predominantly qualitative changes in muscleinsulin/glucose dynamics, the main effect ofstrength, and perhaps sprint, training may be to increase the quantity of muscle. Indeed,increases in lean body mass gained throughstrength training have been reported to beclosely related to reductions in the total insulinresponse during an oral glucose tolerance test.
Net effect of training
Laboratory study has shown that exerciseincreases insulin sensitivity and decreasesglucose-stimulated b-cell insulin secretion. Itdoes not follow, however, that training sparesinsulin secretion and blood glucose levels in reallife because training necessitates an increase infood intake. A study from Copenhagen makesthe point well (Dela et al. 1992). These workerscompared trained male athletes with untrainedcontrols during their (different) ordinary livingconditions as well as in the laboratory (Table 3.2).The higher daily energy intakes of the athletes —mean of 18.6MJ · day–1 (4440 kJ ·day–1), comparedwith 12.5MJ ·day–1 (2986 kcal · day–1) for the
sedentary men — reflected mainly differences incarbohydrate intake (678 vs. 294g · day–1). Fol-lowing oral glucose loads comprising identicalfractions of daily carbohydrate intake, the areasunder the plasma glucose and insulin concentra-tion vs. time curves did not differ between ath-letes and untrained men. The two groups alsohad identical 24-h glucose responses during aday when they went about their normal activities(including one or two training sessions for theathletes). It seems that training, rather thansparing the pancreas, elicits adaptations in theaction of insulin which allow the necessaryincreases in food intake without potentiallyharmful hyperglycaemia and overloading of b-cells. During the day of normal activity, arterialinsulin concentrations were, however, some 40%lower (NS) in athletes because of enhancedhepatic clearance. As insulin may directly pro-mote both atherosclerosis and hypertension, alower circulating level of the hormone may initself be advantageous.
The example just presented is an extreme case,with the athletes (one 800-m runner, one 1500-mrunner and five triathletes) consuming some 50%more food energy than the sedentary compari-son group. It is not atypical, however, as otherresearchers have found almost 80% of theincreased energy intake associated with high
exercise, nutrition and health 45
Table 3.2 Integrated glucose and insulin responses to the same absolute oral glucose load (1g · kg-1 body mass), tothe same relative oral glucose load (27.7% of usual daily carbohydrate intake) and to food consumed underordinary living conditions during a 24-h period. Adapted from Dela et al. (1992).
Glucose Insulin
(mmol · l-1 · 3h-1) (pmol ·ml-1 · 3h-1)Same absolute load
Untrained 1277* 58*Trained 1040 24
Same % daily carbohydrate intakeUntrained (1g · kg-1 body mass) 1277 58Trained (2.3g · kg-1 body mass) 1173 44
(mol · l-1 · 24h-1) (pmol · ml-1 · 24h-1)24-h responses, ordinary living
Untrained 7.3 175Trained 7.4 124
*Significantly different from trained, P < 0.05.

volume training was from carbohydrate. Similar,if smaller, effects on carbohydrate intake alsotend to occur with more modest, non-athletic,levels of exercise. For example, when a group ofmiddle-aged men took up jogging, their averagedaily energy intake increased by about 1.25 MJ ·day–1 (300 kcal ·day–1) after 2 years (12.5%) andthis was almost all from carbohydrate (anincrease of 70g · day–1, about 30%) (Wood et al.1985).
Lipoprotein metabolism
The body’s major energy store is TAG, a hydro-phobic molecule which is transported throughthe watery plasma in particles called lipo-proteins. Lipoproteins comprise a core of fattymaterial (cholesteryl esters as well as TAG) surrounded by a relatively hydrophilic coat com-prising phospholipid, free cholesterol and one ormore protein molecules known as apolipopro-teins. The main categories are (in order ofincreasing density): chylomicrons, very lowdensity lipoproteins (VLDL), low-densitylipoproteins (LDL) and HDL. A brief outline oftheir metabolism helps understand both theinfluence of exercise and the potential implica-tions for health.
The function of chylomicrons is to carry TAGand cholesterol derived from the diet. Their mainrole is to deliver TAG to peripheral tissues andcholesterol to the liver. Secreted by the cells of theintestinal wall, they enter the bloodstream viathe lymphatics. As they pass through the capil-lary beds of adipose tissue and muscle, their TAGis hydrolysed by the enzyme lipoprotein lipase(LPL), the non-esterified fatty acids (NEFA)released mostly being taken up by the tissues. As TAG is lost, the chylomicrons shrink and cholesterol-rich remnant particles are removedby hepatic receptors.
By contrast, VLDL distribute TAG from theliver to other tissues. Like chylomicrons, they area substrate for LPL and become TAG-depleted asthey pass through capillary beds. Their remnantsare LDL which carry (in ester form) some 70% ofthe cholesterol in the circulation, delivering it to
46 nutrition and exercise
a variety of tissues, according to their needs.Plasma total cholesterol concentration, in epi-demiological study shown to be strongly andpositively related to the risk of CHD, predomi-nantly reflects LDL cholesterol.
HDL provide a means by which cholesterol isrouted from peripheral tissues to the liver whereit is disposed of safely, mainly via synthesis intobile acids. HDL receive unesterified cholesterolwhich is released as excess surface materialduring the degradation of TAG-rich particles,but also incorporate cholesterol from the body’scells when this is present in excess of needs. Thispathway has been termed ‘reverse cholesteroltransport’ and may be the mechanism underly-ing the inverse relationship between HDL cho-lesterol and the risk of CHD. In women, forexample, an increase of 0.26 mmol · l–1 (about20%) in HDL cholesterol is associated with a42–50% decrease in CHD risk. An alternativeexplanation is that low HDL-cholesterol may bea marker for some defect in the metabolism ofTAG-rich lipoproteins which means that chy-lomicron remnants and LDL remain in the cir-culation for longer, becoming correspondinglysmaller and more readily taken up into athero-sclerotic lesions. There is clear evidence of thisfor LDL, but also increasing awareness that thechylomicron remnant may also be atherogenic,not least because it may contain 30 times as manycholesterol molecules as a typical LDL particle.The view that atherogenesis is a postprandialphenomenon is gaining support and patientswith known coronary artery disease show a moremarked and prolonged rise in plasma TAG con-centrations following an oral fat load thanhealthy controls.
Insulin plays an important role in fat metabo-lism, coordinating events during the postpran-dial period. LPL activity in adipose tissue isstimulated and mobilization of NEFA isdepressed through inhibition of hormone sensitive lipase and plasma NEFA levels fallmarkedly.
When insulin sensitivity is poor, fat metabo-lism is disordered: there is failure to stimulateLPL, so TAG-removal rate falls; failure to sup-

press release of NEFA from adipose tissue,leading to high plasma levels; and inappropriatehepatic VLDL secretion which exacerbates therise in plasma TAG. Remnant particles of theTAG-rich lipoproteins persist in the circulationfor longer, their smaller size increasing theiratherogenic potential.
Thus, insulin resistance may lie at the heart ofthe abnormalities of lipoprotein metabolismwhich are key features of the ‘metabolic syn-drome’, i.e. low HDL cholesterol, high TAGlevels and possibly also a preponderance of smalldense LDL. It is not entirely clear, however,which is the ‘chicken’ and which the ‘egg’ herebecause an argument may be advanced for anunderlying role of abnormal fat metabolism —secondary to the excessive delivery of TAG toadipose tissue and muscle — in the pathogenesisof insulin resistance. Either way, exercise may bebeneficial because of its potential to improve fuelhomeostasis through its effects on the assimila-tion, mobilization and oxidation of fat fuels.Alterations to lipoprotein metabolism result.
Effects of physical activity
Well-trained endurance runners, men andwomen, possess lipoprotein profiles consistentwith a low risk of CHD (Durstine & Haskell1994). HDL cholesterol is typically 20–30%higher than in comparable sedentary controls.Triglycerides are low, particularly when veteranathletes (> 40 years) are studied. Total cholesterolconcentrations stand out as low only when thecontrol group is large and representative of thewider population. Athletes trained specificallyfor strength and power do not differ from seden-tary individuals in these ways.
Less athletic, but physically active, people alsoshow lipoprotein profiles which are consistentwith a reduced risk of cardiovascular disease.For example, data from the Lipid Clinics Prevalence Study showed that men and womenwho reported some ‘strenuous’ physical activitygenerally had higher HDL cholesterol levels than those who reported none (Haskell et al.1980). Differences were independent of age, body
mass index, alcohol use and cigarette smoking.Even simple exercise like walking has beenlinked to elevated HDL levels, with relationshipsbetween distance walked per day and the con-centration of HDL2, the subfraction that accountsfor most of the difference in total HDL choles-terol between athletes and controls. In addition,men and women who habitually walk 12–20km ·week–1 are only half as likely to possess anunfavourable ratio of total to HDL cholesterol(> 5) as a comparable no-exercise group. Thuscross-sectional observations of ordinary men andwomen, and of everyday activity, provide a basisfor proposing that endurance exercise influenceslipoprotein metabolism.
Longitudinal studies are less consistent but,for HDL cholesterol, the consensus is that, overmonths rather than weeks, endurance exerciseinvolving a minimum expenditure of about 15MJ ·week–1 (3580 kcal ·week–1) causes an in-crease and that the magnitude of this tends to begreater when there is weight loss.
The majority of longitudinal studies haveemployed rather high intensity exercise, mostfrequently jogging/running, but evidence isgradually becoming available that more accessi-ble, self-governed exercise regimens may also beeffective (Després & Lamarche 1994). Forexample, in previously sedentary middle-agedwomen who had rather low levels of HDLcholesterol (mean, 1.2mmol · l–1) at base line,walking briskly for about 20 km·week–1 over ayear resulted in a 27% increase. Increases in HDLcholesterol do not always mirror changes infitness, however. Figure 3.2 shows the main find-ings of one study which examined the effect ofthe intensity of walking in women over 24 weeks;fast walking at 8km· h–1 produced greaterimprovements in fitness than walking the samedistance at slower speed, but increases in HDLcholesterol did not differ between groupswalking at different speeds. Several other studieshave confirmed these findings.
Dietary modifications recommended to over-weight people invariably combine energy intakerestriction with decreases in the intake of satu-rated fats and cholesterol. Such changes can
exercise, nutrition and health 47

reduce HDL levels and, given the inverseassociation between HDL cholesterol and therisk of CHD, theoretically may diminish theanticipated beneficial effects of decreased lowdensity lipoprotein cholesterol. Exercise may beone way to offset a diet-related fall in HDL cho-lesterol. Comparison of two different interven-tions in sedentary overweight men and women,i.e. a low energy, low fat diet alone with the samediet plus exercise (brisk walking and jogging)showed that the addition of exercise to the lowfat diet resulted in more favourable changes inHDL cholesterol than diet alone; in men, dietplus exercise provoked in a greater rise in HDLcholesterol than did diet only; and in womenonly the diet-plus-exercise group showed afavourable change in the ratio of LDL cholesterolto HDL cholesterol.
It was mentioned above that changes inlipoproteins tend to be greater when an exerciseregimen is accompanied by weight loss. There is
48 nutrition and exercise
also an effect which is independent of weightchange, which appears to be linked to adapta-tions in skeletal muscle. During exercise there is anet efflux of HDL2 across a trained leg, but notacross the contralateral untrained leg (Kiens &Lithell 1989). The rate of HDL2 synthesis is posi-tively and strongly related to the rate of VLDLdegradation. As the rate-limiting step in VLDLdegradation is LPL activity, this points to skeletalmuscle LPL as an important determinant of theeffects of exercise on lipoprotein metabolism.
Postprandial lipoprotein metabolism
High levels of muscle LPL activity, leading to anenhanced metabolic capacity for TAG may there-fore explain the elevated HDL cholesterol levelsin physically active people. Endurance trainedmen and women show high levels of plasma andmuscle LPL activity, together with high rates ofTAG clearance (compared with sedentary con-
∆V
O2m
ax (m
l. kg–1
. min
–1)
6
0
4
2
–2 –6%
–4
+4%
+9%
+16%
Controls Strollers Briskwalkers
Fastwalkers
(a)
∆H
DL
chol
este
rol (
mm
ol. l–1
)
0
+1%
+6%
+4%
+6%
Controls Strollers Briskwalkers
Fastwalkers
(b)
0.12
0.09
0.06
0.03
.
Fig. 3.2 Changes in (a) maximal oxygen uptake (V.o2 max.) and (b) serum high-density lipoprotein (HDL) cholesterol
concentration in control subjects (n = 10/13) and in three groups of previously sedentary women who walked 4.8km · day–1 for 24 weeks. One group walked at 4.8 km · h–1 (n = 17/18, strollers), one group at 6 km · h–1 (n = 12, briskwalkers) and one group at 8 km · h–1 (n = 13, fast walkers). Adapted from Duncan et al. (1991).

trols). The high LPL levels probably arise fromenhanced capillarization in the muscle of athletesbecause the enzyme is bound to the luminalsurface of capillary endothelium.
There are also short-term effects of recent exer-cise on postprandial TAG clearance. Duringrecovery TAG clearance rates are increased,reducing the postprandial rise in plasma TAGconcentration. The effect is greater after moder-ate intensity exercise (60% V
.o2max.) than after low
intensity exercise (30% V.o2max.) of the same dura-
tion probably because of its greater energyexpenditure; if energy expenditure is held con-stant the effects on lipaemia of low and moderateintensity exercise are strikingly similar (Tsetsonis& Hardman 1996). These short-term benefitsmay therefore be potentially greater for trainedpeople because their higher V
.o2max. values
and greater endurance capability allow them toexpend more energy than untrained individualsbefore becoming fatigued.
People spend the majority of their lives in the postprandial state and exercise-induced de-creases in postprandial lipaemia may be clini-cally important in the long term. When TAGclearance is good, the postprandial rise in TAG isreduced and TAG-rich particles will remain inthe circulation for shorter periods, decreasing theatherogenic stimulus. Clinical evidence is consis-tent with this view because case-control studieshave shown that postprandial TAG levels accu-rately predict the presence or absence of coro-nary artery disease.
Energy balance
In the UK, overweight (body mass index 25–30kg ·m–2) and obesity (body mass index >30 kg ·m–2) are a serious problem. More than 50% ofmen and more than one third of women in theage group 45–54 are overweight, whilst nearly20% of both sexes are obese. Figures are evenworse in the US, where mean body weightincreased by 3.6kg between 1976/80 and1988/91. The health hazards of carrying excessweight are well documented so its prevalencerightly gives rise to concern. Recent findings
have particularly emphasized the importance ofthe regional distribution on body fat in relation tothe risk of atherosclerotic metabolic disease. Aswith so many aspects of human health, there issubstantial genetic control but environmentalfactors — diet, physical activity — modify theseinfluences profoundly.
The energy stores of the body are, of course,determined by the balance between energyintake and energy expenditure and any exercisecontributes to energy expenditure. Although formost people the expenditure in habitual exerciserarely accounts for more than 20% of the total,physical activity is the only way in which energyexpenditure can be increased voluntarily. Itsimportance in helping to control body weightand body fat content — for individuals or for pop-ulations — is still a matter of debate, despite thefact that there is a fairly consistent negative rela-tionship between level of activity and body massindex or skinfold thicknesses.
The energy stored in 1 kg of adipose tissue is approximately 32.4MJ (7740 kcal). Energyexpenditure during weight-bearing activitiesdepends on body mass; for example, walking or running 1.6km expends (net) about 220 kJ(52 kcal) for a 50-kg person, but about 350 kJ(84 kcal) for an 80-kg person, i.e. about 4.2kJ ·kg–1
body weight · km–1 (1 kcal · kg–1 body weight ·km–1). Theoretically, therefore (and disregardingthe small postexercise elevation of metabolic ratewhich, in non-athletes, probably never exceeds10% of exercise expenditure), walking an extramile every day for a year would expend (net) anestimated total of 80–128MJ (19 100–30580 kJ),i.e. the energy equivalent of 2.5–4 kg of adiposetissue. Resting metabolic rate decreases, how-ever, as body mass falls and energy intake will be stimulated, offsetting this deficit. As plannedexercise increases, there may also be a sponta-neous decrease in the physical activities of every-day living. The situation is far from simple.
What tends to happen in practice? The consen-sus in the literature is that relatively smallincreases in physical activity (for example,walking 3.2 km·day–1, three times per week,adding up to 2.1–2.5 MJ or 500–600 kcal gross) are
exercise, nutrition and health 49

not associated with changes in body fatness over3–6 months (Haskell 1991). Above this amount ofexercise, there tends to be a consistent loss ofbody fat, 0.12 kg · week–1 for men (a little less forwomen), total exercise energy expenditure beingthe variable most strongly related to the bodymass change. Thus, the natural adjustments toincreased exercise levels reduce, but do not elimi-nate, the theoretical energy deficit. For example,in a study where sedentary men followed a pro-gramme of jogging for 2 years with no instruc-tions about dietary intake, energy intake roseover the first 6 months by about 1.3 MJ · day–1
(310 kcal ·day–1). This compensation, however,did not increase further, remaining less than theenergy expenditure of exercise so that a gradualloss of body fat occurred.
Physical activity is increasingly viewed as animportant adjunct to restriction of dietaryenergy. For example, the addition of exercise to alow energy diet has been reported to enhanceweight and fat loss and prevent a fall in restingmetabolic rate and it may also help with theintractable problem of weight maintenance afterweight loss. The most important role for activityis probably that which is least well explored, i.e.prevention of weight gain. Some information on the relationship of activity with longer-termweight change in the general population is avail-able from the NHANES-I Epidemiologic Follow-
50 nutrition and exercise
up Study in the USA; this found that the risk ofmajor weight gain (> 13kg) over a 10-year periodwas twice as high among inactive men and sevenfold higher among inactive women, com-pared with men and women of high activity level(Williamson et al. 1993).
Exercise may influence the distribution ofbody fat as well as the amount. In populationstudies, individuals practising vigorous activi-ties on a regular basis have lower waist-to-hipratios than others, even after the effect of subcu-taneous fat is adjusted for. Training has some-times been reported to decrease this ratio even inthe absence of a reduction in body weight. Onereason may be that the metabolic state of the vis-ceral fat depot is such that it should be readilymobilized during weight loss.
For individuals who are overweight, thehealth gains from increased physical activityshould not be judged solely by the extent ofchange in body fatness; several prospectivestudies have shown that overweight men andwomen who are physically active have lowerrates of morbidity and mortality than compara-ble sedentary people.
Fat balance
The energy balance equation (change in energystores = energy intake – energy expenditure) has
Fig. 3.3 Sport offers anopportunity to people who wishto take exercise for health reasonsrather than as a competitiveoutlet. Photo courtesy of RonMaughan.

traditionally provided the theoretical frameworkfor understanding of the nature of energybalance in humans. More recently, alternativeapproaches have been proposed which takeaccount of how different fuels are partitionedamong metabolic pathways. The body respondsdifferently to overfeeding with different nutri-ents, suggesting that balance equations for sepa-rate nutrients might be more informative.Protein balance is achieved on a day-to-daybasis, with oxidation of intake in excess of needs;and carbohydrate intake stimulates both glyco-gen storage and glucose oxidation, with negligi-ble conversion to TAG under dietary conditionsof industrialized countries. In marked contrast,fat intake has little influence on fat oxidation sothat energy balance is virtually equivalent to fat balance and there is a strong relationshipbetween fat balance and energy balance evenover a period as short as 24 h. Chronic imbalancebetween fat intake and fat oxidation may there-fore predispose to increased fat storage.
This line of thinking leads to the conclusionthat physical activity has greater potential toinfluence body energy stores than would bededuced on the basis of the tradtional energybalance equation. Fat oxidation is of courseenhanced during submaximal exercise, and moreso in people who are well trained. It is alsoenhanced for some hours afterwards, even whenthe postexercise elevation of metabolic rate hasdisappeared (Calles-Escandon et al. 1996). Theresponse to a fatty meal is changed, with greaterpostprandial fat oxidation (Tsetsonis et al. 1997).There might be synergistic benefits of increasedexercise if, as discussed above, there is anincreased appetite for high carbohydrate foods.
Conclusion
Substantial elevations in mortality are seen insedentary and unfit men and women. Withregard to CHD, a biological gradient has beendocumented convincingly, although its exactpattern remains unclear; high levels of rathervigorous endurance exercise may be necessaryfor optimal benefit but some studies show that
risk decreases steeply at the lower end of thephysical activity (or fitness) continuum, reachingan asymptote in the mid-range. Detailed infor-mation about the influence of either the amountof exercise or the independent effect of intensityis not available for the relation of physical activ-ity with the development of either hypertensionor NIDDM.
Information on the mechanisms by whichactivity decreases the risk of these diseases isincomplete, but adaptive changes in the metabo-lism of fat and carbohydrate, giving rise to ‘meta-bolic fitness’, are undoubtedly involved. Many ofthe health gains associated with high levels ofphysical activity can be explained through theconsequences of increased exercise for the intakeand metabolism of these macronutrients.
References
Abbolt, R.D., Rodriguez, B.L., Burchfiel, C.M. & Curb,J.D. (1994) Physical activity in older middle-agedmen and reduced risk of stroke: the Honolulu HeartProgram. American Journal of Epidemiology 139,881–893.
Blair, S.N., Kohl, H.W., Paffenbarger, R.S. et al. (1989)Physical fitness and all-cause mortality: a prospec-tive study of healthy men and women. Journalof the American Medical Association 262, 2395–2401.
Blair, S.N., Kampert, J.B., Kohl, H.W. et al. (1996) Influ-ences of cardiorespiratory fitness and other pre-cursors on cardiovascular disease and all-causemortality in men and women. Journal of the AmericanMedical Association 276, 205–210.
Bouchard, C., Shephard, R.J. & Stephens, T. (eds) (1994) Consensus statement. In Physical Activity,Fitness and Health, pp. 9–76. Human Kinetics, Champaign, IL.
Calles-Escandon, J., Goran, M.I., O’Connell, M. et al.(1996) Exercise increases fat oxidation at rest un-related to changes in energy balance or lipolysis.American Journal of Physiology, Endocrinology andMetabolism 270, E1009–E1014.
Dela, F., Mikines, K.J. & von Linstow, M. et al. (1992)Does training spare insulin secretion and diminishglucose levels in real life? Diabetes Care 15 (Suppl. 4),1712–1715.
Després, J.-P. & Lamarche, B. (1994) Low-intensityendurance exercise training, plasma lipoproteinsand the risk of coronary heart disease. Journal of Internal Medicine 236, 7–22.
Duncan, J.J., Gordon, N.F. & Scott, C.B. (1991) Women
exercise, nutrition and health 51

walking for health and fitness: how much is enough?Journal of the American Medical Association 266,3295–3299.
Durstine, J.L. & Haskell, W.L. (1994) Effects of exercisetraining on plasma lipids and lipoproteins. Exerciseand Sport Science Reviews 22, 477–521.
Ekelund, L.-G., Haskell, W.L., Johnson, M.S. et al.(1988) Physical fitness as a predictor of cardio-vascular mortality in asymptomatic North Americanmen. New England Journal of Medicine 319, 1379–1384.
Haskell, W.L. (1991) Dose–response relationshipbetween physical activity and disease risk factors. InSport for All (ed. P. Oja & R. Telema), pp. 125–133.Elsevier Science Publications, Amsterdam.
Haskell, W.L. (1994) Health consequences of physicalactivity: understanding and challenges regardingdose–response. Medicine and Science in Sports andExercise 26, 649–660.
Haskell, W.L., Taylor, H.L., Wood, P.D., Schrott, H. &Heiss, G. (1980) Strenuous physical activity, tread-mill exercise test performance and plasma high-density lipoprotein cholesterol. The Lipid ResearchClinics Program Prevalence Study. Circulation 62(Suppl. IV), 53–61.
Kiens, B. & Lithell, H. (1989) Lipoprotein metabolisminfluenced by training-induced changes in humanskeletal muscle. Journal of Clinical Investigation 83,558–564.
Kriska, A.M., Blair, S.N. & Pereira, M.A. (1994) Thepotential role of physical activity in the prevention ofnon-insulin-dependent diabetes mellitus: the epi-demiological evidence. Exercise and Sports ScienceReviews 22, 121–143.
Leon, A.S. (1991) Physical activity and risk of ischaemic heart disease. In Sport for All (ed. P. Oja &R. Telema), pp. 251–264. Elsevier Science Publishers,Amsterdam.
Morris, J.N., Clayton, D.G., Everitt, M.G. et al. (1990)Exercise in leisure time: coronary attack and deathrates. British Heart Journal 63, 325–334.
52 nutrition and exercise
Paffenbarger, R.S., Hyde, R.T., Wing, A.L. et al. (1986)Physical activity, all-cause mortality, and longevityof college alumni. New England Journal of Medicine314, 605–613.
Paffenbarger, R.S., Jung, D.L., Leung, R.W. et al. (1991)Physical activity and hypertension: an epidemiologi-cal view. Annals of Internal Medicine 23, 319–327.
Sandvik, L., Erikssen, J., Thaulow, E. et al. (1993) Physi-cal fitness as a predictor of mortality among healthy,middle-aged Norwegian men. New England Journal ofMedicine 328, 533–537.
Shaper, A.G. & Wannamethee, G. (1991) Physical activ-ity and ischaemic heart disease in middle-agedBritish men. British Heart Journal 66, 384–394.
Tsetsonis, N.V. & Hardman, A.E. (1996) Reduction inpostprandial lipemia after walking: influence ofexercise intensity. Medicine in Science Sports and Exer-cise 28, 1235–1242.
Tsetsonis, N.V., Hardman, A.E. & Mastana, S.S. (1997)Acute effects of exercise on postprandial lipemia: acomparative study in trained and untrained middle-aged women. American Journal of Clinical Nutrition65, 525–533.
Wannamethee, G. & Shaper, A.G. (1992) Physical activ-ity and stroke in British middle-aged men. BritishMedical Journal 304, 597–601.
Whaley, M.H. & Blair, S.N. (1995) Epidemiology ofphysical activity, physical fitness and coronary heartdisease. Journal of Cardiovascular Risk 2, 289–295.
WHO (1990) Diet, Nutrition, and the Prevention of ChronicDiseases. World Health Organization, Geneva.
Williamson, D.F., Madans, J., Anda, R.F. et al. (1993)Recreational physical activity and ten-year weightchange in a US national cohort. International Journal ofObesity 17, 279–286.
Wood, P.D. (1987) Exercise, plasma lipids, weight regu-lation. In Exercise, Heart, Health: Conference Report.Coronary Prevention Group, London.
Wood, P.D., Terry, R.B. & Haskell, W.L. (1985) Metabo-lism of substrates: diet, lipoprotein metabolism andexercise. Federation Proceedings 44, 358–363.
Introduction
In the middle of the 18th century, Lavoisier con-ceived the first law of thermodynamics, thatenergy can be neither created nor destroyed butonly changed from one form to another. Thisprinciple of the conservation of energy was laterformulated by Mayer in 1842 and Helmholtz in 1847, but it remained for Joule, a brewer, to provide experimental data to support theconcept (Fenn & Rahn 1964). When Lavoisier andLaplace demonstrated that muscular exerciseconsumes oxygen and produces carbon dioxide(Chapman & Mitchell 1965), the stage was set forlearning how to measure energy expenditure. Itwas clear then that the energy in the food con-sumed should equal the energy expended.
Energy is expended in three ways in humansand other warm-blooded animals. A certainamount of energy is required at rest to maintainbody temperature and involuntary muscularcontraction for functions such as circulation andrespiration. This energy level represents theresting metabolic rate. Second, some energy isrequired to digest and assimilate food. Thisprocess, formerly called specific dynamic actionand now referred to as dietary induced thermogene-sis or thermic effect of food, adds about 10% to theresting metabolic rate. These two represent but asmall part of the total energy expenditure andcan be altered only very slightly in individuals.By far the most important source of variationbetween individuals in energy expenditure(when adjusted for body size) is the muscular
activity carried out. The sources of this activityare one’s daily work, leisure pursuits, and trans-portation to and from work or other destinations(which some investigators include as part ofleisure time activity).
In the International System of Units (SI), theunit of measurement for heat production is thejoule (named for James Prescott Joule, who didpioneering work in metabolism).
One observation about energy expenditure isessential to keep in mind. The intake or expendi-ture of joules is related to body size. A smallperson who is very active may expend a similarnumber of kilojoules in 24 h as a large personwho is sedentary. So if exercise is to be expressedas energy expenditure in joules or calories, bodysize must be taken into account. To this end,energy expended or ingested is sometimes givenas kilojoules or kilocalories per unit of bodyweight or, in the case of oxygen (O2) uptake, asmillilitres of O2 per kilogram of body weight. The use of METs (an abbreviation for ‘metabolicequivalent’) is another approach to correcting forbody weight. A MET represents the ratio ofenergy expended in kilojoules divided by restingenergy expenditure in kilojoules, either mea-sured or estimated from body size. In estimatingresting (not basal) energy expenditure, a value of 4.2kJ per kilogram of body weight per hour or3.5ml O2 utilized per kilogram of body weightper minute gives reasonably satisfactory resultsin most cases. Although neither method isperfect, the MET approach is more popular andprobably more useful. Although he did not use
Chapter 4
Energy Costs of Exercise and Sport
HENRY J. MONTOYE
53
the term MET, LaGrange (1905) almost a centuryago expressed the strenuousness of activities as aratio of exercise metabolism to resting metabo-lism. The World Health Organization adoptedthe same principle in its physical activity index.Among exercise physiologists, it is almost uni-versally accepted to use METs to express energyexpenditure in relation to body weight. InAppendix 4.1, the energy cost of activities isexpressed in METs as well as kilojoules per kilo-gram of body weight.
Methods of measurement
The direct measurement of energy expenditure(heat production) by a living animal or humanbeing is possible. Although the engineeringproblems are formidable, the heat producedwhile the subject is in a sealed, insulatedchamber can be measured.
A room calorimeter measures the heat pro-duced by the subject at rest or during exercise bycirculating water through pipes in the insulatedchamber and carefully measuring, at frequentintervals, the temperature of the ingoing and out-going water and the water flow. Sophisticatedengineering is required to prevent heat loss fromthe chamber by other means. The latent heat of the water vaporized must be determined by measuring the vapour in the ventilating aircurrent. Calorimeters have been built in whichair flow and temperature are measured by meansof thermocouples using the thermal gradientprinciple (Carlson & Hsieh 1970; Jéquier et al.1987). Energy exchange during muscular exer-cise can be measured by installing an exercisedevice (treadmill, cycle ergometer, etc.) in thechamber.
Webb (Webb 1980; Webb et al. 1980) alsodescribes an insulated, water-cooled suit wornby the subject in which the flow of water throughthe suit and the temperature of the incoming andoutgoing water are measured to determine heatproduction. The suit has been modified by Hambraeus et al. (1991). When energy is trans-formed from food to heat and muscular work,oxygen is consumed and thus the oxygen con-
54 nutrition and exercise
sumed could be measured to ascertain energyexpenditure. The term indirect calorimetry isapplied to the method of estimating energyexpenditure from oxygen consumption andcarbon dioxide production because heat produc-tion is not measured directly.
A room calorimeter can be constructed inwhich expired air is analysed to estimate heatproduction. Atwater and Benedict (1905) showedthat by measuring the oxygen consumed andcarbon dioxide produced, heat production couldindeed be estimated with reasonable accuracy.This kind of calorimeter is usually referred to as arespiration chamber.
However, room calorimeters and respirationchambers are confining. Even Webb’s water-cooled suit, because of the computer and othernecessary equipment, is confined to the labora-tory. Hence, although the energy cost of someactivities (walking at various grades on a tread-mill, riding a stationary cycle at various resis-tances and speeds, certain calisthenic exercises,for examples) can be measured with calorimetersor respiration chambers, the energy cost of manysports activities or occupational tasks cannot bemeasured in this way.
There are several simpler techniques for mea-suring oxygen uptake. One, called the closedcircuit method, requires the subject to be isolatedfrom outside air. The respirometer originallycontains pure oxygen, and as the subject breathesin this closed system the carbon dioxide is con-tinuously removed as it passes through sodalime. The gas volume gradually decreases, andthe rate of decrease is a measure of the rate ofoxygen consumption. Regnault and Reiset devel-oped this system in 1849, and by measuring thecarbon dioxide absorbed they discovered the respiratory quotient (Fenn & Rahn 1964). Thismethod works reasonably well for measuringresting or basal metabolic rate, but absorbing thelarge volume of carbon dioxide produced duringprolonged, strenuous exercise becomes a prob-lem. The open circuit method described next ismore suited to measuring exercise metabolism.
Two procedures in the open circuit methodhave been developed. In one, the flow-through
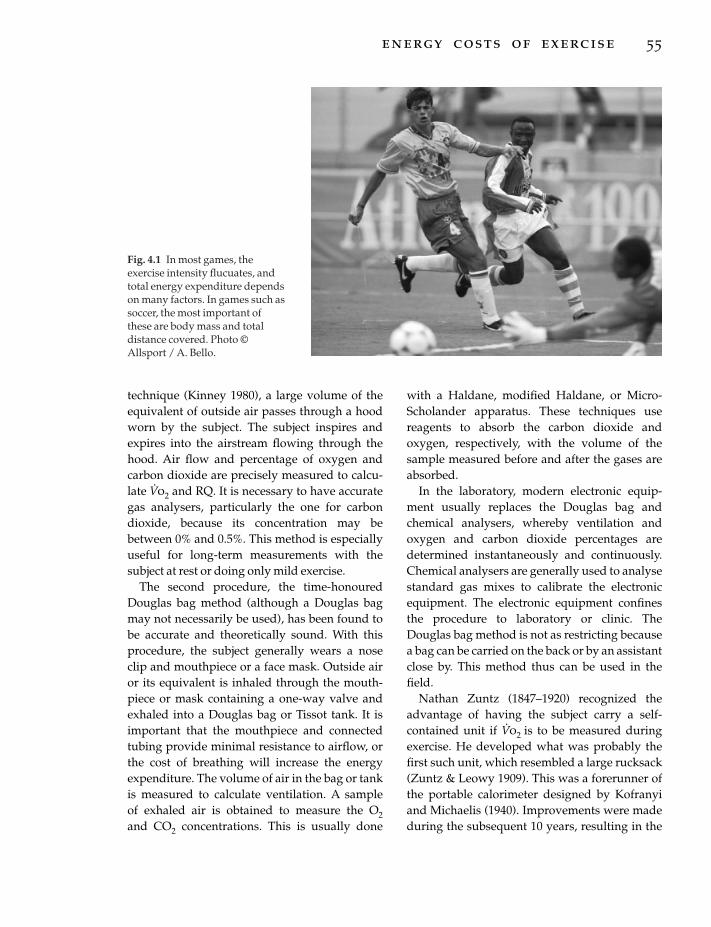
technique (Kinney 1980), a large volume of theequivalent of outside air passes through a hoodworn by the subject. The subject inspires andexpires into the airstream flowing through thehood. Air flow and percentage of oxygen andcarbon dioxide are precisely measured to calcu-late V
.o2 and RQ. It is necessary to have accurate
gas analysers, particularly the one for carbondioxide, because its concentration may bebetween 0% and 0.5%. This method is especiallyuseful for long-term measurements with thesubject at rest or doing only mild exercise.
The second procedure, the time-honouredDouglas bag method (although a Douglas bagmay not necessarily be used), has been found tobe accurate and theoretically sound. With thisprocedure, the subject generally wears a noseclip and mouthpiece or a face mask. Outside airor its equivalent is inhaled through the mouth-piece or mask containing a one-way valve andexhaled into a Douglas bag or Tissot tank. It isimportant that the mouthpiece and connectedtubing provide minimal resistance to airflow, orthe cost of breathing will increase the energyexpenditure. The volume of air in the bag or tankis measured to calculate ventilation. A sample of exhaled air is obtained to measure the O2and CO2 concentrations. This is usually done
with a Haldane, modified Haldane, or Micro-Scholander apparatus. These techniques usereagents to absorb the carbon dioxide andoxygen, respectively, with the volume of thesample measured before and after the gases areabsorbed.
In the laboratory, modern electronic equip-ment usually replaces the Douglas bag andchemical analysers, whereby ventilation andoxygen and carbon dioxide percentages aredetermined instantaneously and continuously.Chemical analysers are generally used to analysestandard gas mixes to calibrate the electronicequipment. The electronic equipment confinesthe procedure to laboratory or clinic. TheDouglas bag method is not as restricting becausea bag can be carried on the back or by an assistantclose by. This method thus can be used in thefield.
Nathan Zuntz (1847–1920) recognized theadvantage of having the subject carry a self-contained unit if V
.o2 is to be measured during
exercise. He developed what was probably thefirst such unit, which resembled a large rucksack(Zuntz & Leowy 1909). This was a forerunner ofthe portable calorimeter designed by Kofranyiand Michaelis (1940). Improvements were madeduring the subsequent 10 years, resulting in the
energy costs of exercise 55
Fig. 4.1 In most games, theexercise intensity flucuates, andtotal energy expenditure dependson many factors. In games such assoccer, the most important ofthese are body mass and totaldistance covered. Photo ©Allsport / A. Bello.

model by Müller and Franz (1952). This alsoresembles a rucksack but is smaller and lighterthan Zuntz’s apparatus.
The Müller–Franz calorimeter registers venti-lation and siphons off a small percentage of theexpired air into a small attached bag for lateranalysis. This apparatus functions reasonablywell during rest or moderate exercise. At airflowsof about 80–100 l ·min–1, the meter begins tounder-record ventilation (Orsini & Passmore1951; Insull 1954; Montoye et al. 1958) and henceunderestimate energy expenditure. At severeexercise, where instantaneous flows can reach200 l or more per minute, the instrument seri-ously underestimates energy expenditure. Thereis also a potential error due to diffusion of the gasthrough the bag, which becomes more seriousthe longer the delay in analysing the gas. In addi-tion to these limitations, there may be some inter-ference in particular activities (the calorimeterweighs about 3 kg), although the instrument canbe carried in a bicycle basket or by an assistant.Also, the rates of energy expenditure are aver-aged over the entire collection period.
Wolff (1958) improved the Kofranyi–Michaelisrespirometer. His integrating motor pneumota-chograph (IMP) is available from J. LanghamThompson Ltd, Bushey Heath, Herts, UK. The IMP has some of the limitations of theKofranyi–Michaelis respirometer. Ventilation isintegrated electrically rather than mechanicallylowering the expiratory resistance. Also, sampleswith smaller percentages are possible. Thisgroup (Humphrey & Wolff 1977) later developeda more advanced instrument, the oxylog, avail-able from P.K. Morgan Ltd, Rainham, Kent, UK.This battery-operated, self-contained, portableinstrument weighs about the same as theKofranyi–Michaelis respirometer, but it is engi-neered for on-line measurement of oxygen con-sumption. Carbon dioxide is not measured. It hasbeen found to be reasonably accurate in fieldmeasurements during rest and up to moderatelystrenuous exercise (Harrison et al. 1982; McNeillet al. 1987; Collins et al. 1988). The error wasreported to be 2–3% at 4 METs, but the errorincreases at lower and higher workloads
56 nutrition and exercise
(Patterson & Fisher 1979). Ikegami et al. (1988)added a telemetry capacity to the oxylog so V
.o2
could be recorded remotely at 1-min intervals.Nutritionists and others have estimated
energy expenditure by measuring the energy infood consumed. However, this method estimatesan average energy expenditure over days orweeks and hence is not suitable for the measure-ment of the energy cost of individual activities.Similarly the use of doubly labelled water(Montoye et al. 1996) which some consider thegold standard for estimating habitual energyexpenditure, also is not useful for measuringenergy expenditure of specific activities becauseit too only provides an average energy expendi-ture over a week or two.
Because of the difficulties encountered in mea-suring V
.o2 in the field, there is interest in the
simpler but less direct method — recording phys-iological data associated with energy expen-diture. Advancements in telemetry and otheraspects of bioengineering have made such tech-niques more attractive.
From the beginning of their existence, humansmust have observed that pulse rate and ventila-tion increase during strenuous activity. Systolicblood pressure, electromyographs, and bodytemperature are also roughly proportional to theintensity of exercise. All of these variables can betelemetered, or entered on portable recorders.
Of the physiological variables, heart rate (HR)is the easiest to measure in the field. The relation-ship between HR and energy expenditure wasshown as early as 1907, when Benedict (1907)reported that changes in pulse rate were corre-lated with changes in heat production in any oneindividual. He later suggested that pulse ratemay provide a practical and satisfactory methodfor estimating total metabolism.
Murlin and Greer in 1914 confirmed Benedict’sresults. They measured respiratory metabolismand HR simultaneously in subjects who wereresting and doing moderate work. Their resultsindicated that HR was a good index of oxygenconsumption. Thus, when work can be carefullycontrolled (as, for example, on a treadmill orbicycle), V
.o2 and HR are closely related and the

relationship is linear over much of the rangewhen the measurements are taken on one indi-vidual (Montoye 1970). The linear relationship ofHR with V
.o2 can be understood from the Fick
equation: V.o2 = HR·SV (a - V
.o2diff.). Over a wide
range of exercise, stroke volume and a - V.o2diff.
do not change greatly; consequently, the increasein HR reflects an increase in V
.o2. Some investiga-
tors have presented data showing that relation-ship is not linear over the full range from rest tostrenuous activity (Henderson & Prince 1914;Booyens & Hervey 1960; Malhotra et al. 1963;Bradfield et al. 1969; Berg 1971; Viteri et al. 1971;Warnold & Lenner 1977). Most agree that duringexercise HR is more consistent and there is agreater tendency toward linearity than whenresting values are included.
Under many conditions, considerable errormay be expected when energy expenditure isestimated from the heart rate. There is some day-to-day variation in HR at a given energy expen-diture. To this must be added other sources oferror. High ambient temperature and humidityor emotion may raise the HR with little effect onoxygen requirement of the work. Training lowersthe HR at which tasks of a given energy cost areperformed. For example, active workers exerciseat lower rates than sedentary men when theworkload is equal (Taylor & Parlin 1966; Taylor1967). Females have higher rates during exercisethan males (Montoye 1975). Fatigue (Lundgren1947; Booyens & Hervey 1960) and state ofhydration (Lundgren 1947) affect the HR–V
.o2
relationship. Heart rates are higher for a givenenergy expenditure in anaemic children (Gandra& Bradfield 1971). Furthermore, certain kinds ofactivities, such as work with the arms only, willelicit higher HR than work done with the legsand arms, even though the oxygen cost is thesame (Durin & Namyslowski 1958; Payne et al.1971; Vokac et al. 1975; Anderson et al. 1981;Collins et al. 1991). Andrews (1971) has shownthat HR–V
.o2 slopes were the same for arm and
leg exercise but the intercepts were different.Static exercise increases HR above that expectedon the basis of oxygen requirement (Hansen &Maggio 1960; Mass et al. 1989).
Saris et al. (1982) showed that over 5h, chang-ing the strenuousness of activities has an effecton the accuracy of the HR-to-energy expenditureconversion, especially for quiet activities aftermoderate exercise: the energy expenditure isoverestimated. This phenomenon may con-tribute to the overestimation of total energyexpenditure regardless of what V
.o2–HR regres-
sion equation is used.If one wishes to express the energy expendi-
ture in kilojoules from the oxygen utilized (i.e.not measuring heat produced), it must be recog-nized that the kilojoules of heat produced by theutilization of 1 litre of oxygen varies with thefoodstuffs consumed. The combustion of 1 litreof oxygen yields 19.59kJ (4.68kcal) from fatalone, 18.75 kJ (4.48kcal) from protein alone, and 21.18kJ (5.06 kcal) from carbohydrate starchalone. Even this is not precise because withineach of these three main food sources, the kilo-joules of heat from 1 litre of oxygen can vary. For example, considering different types ofmacronutrients, Brody (1974) gives 18.4kJ(4.4 kcal) for cottonseed oil and corn oil, 19.3kJ (4.6 kcal) for butterfat, 21.18kJ (5.06kcal)for starch, and 21.26kJ (5.08kcal) for sucrose.Similarly, the production of heat from 1 litre ofcarbon dioxide varies with the foodstuffs metab-olized. For precise conversion of oxygen utiliza-tion to energy expenditure, the proportions offat, carbohydrates, and protein being utilized canbe determined by the nitrogen that appears in theurine during the time of observation. About 1g ofnitrogen is excreted for every 6.25g of proteinmetabolized.
The ratio of the volume of carbon dioxide pro-duced to the volume of oxygen consumed, theso-called respiratory quotient (RQ), gives a reason-able approximation of the percentage of carbo-hydrate and fat being burned, the ratio being 0.7when pure fat is the source of energy and 1.00 when it is pure carbohydrate. These ratiosassume a ‘steady state,’ which exists when theoxygen uptake equals the oxygen requirement ofthe tissues and there is no accumulation of lacticacid. Heart rate, ventilation, and cardiac outputremain at fairly constant levels during a steady
energy costs of exercise 57

state. RQ is not representative of the foodstuffsbeing oxidized in a non-steady state, such as atthe start of exercise or during the onset of acido-sis of alkalosis as may occur during strenuousexercise or some disease states. The term respira-tory exchange ratio (RER) rather than RQ is usedwhen a steady state does not exist.
Variations in the caloric equivalents of differ-ent fat, different carbohydrate, and differentprotein sources can be ignored because the errorproduced is very small. This is because in anormal diet the mixture of different types of fat,carbohydrate, and protein balances out the dif-ferences in caloric equivalents. Even the errorintroduced by not measuring the percentage of protein being used can be ignored in mostinstances because the caloric equivalents ofoxygen are similar for carbohydrates andprotein. No matter how diverse the actual com-position of the food oxidized, the error in esti-mating energy expenditure is unlikely to be morethan 2–4%. An error of 100% in the estimation ofurinary excretion of nitrogen leads to only a 1%error in energy expenditure.
A table of energy costs of exercise and sport
A list of energy costs of various activities is pre-sented in Appendix 4.1. This is a modification ofthe list shown in appendix C of the publicationby Montoye and others (1996) which in turn wasa modification of the list by Ainsworth et al.(1993). Appreciation is hereby acknowledged forthe willingness of these authors to allow the liststo be modified once again and reproduced in thischapter.
Many of the values of this list came from the following sources: Bannister and Brown(1968); the 7-Day Recall Physical Activity Questionnaire (Blair et al. 1985); Durnin andPassmore (1967); Howley and Glover (1974); theAmerican Health Foundation’s Physical ActivityList (Leon 1981); McArdle et al. (1988); Passmoreand Durnin (1955); Tecumseh Questionnaire(Reiff et al. 1967a, 1967b). Some values have beenadded from the following sources: Collins et al.
58 nutrition and exercise
(1991); Geissler et al. (1981); Getchell (1968); Goffet al. (1956); Mandli et al. (1989); Nelson et al.(1988); Seliger (1968); Stray-Gundersen andGalanes (1991); Veicsteinas et al. (1984);VonHofen et al. (1989); Watts et al. (1990);Wigaeus and Kilbom (1980).
Much of the data in this appendix are derivedfrom actual measurement by indirect calorime-try. However, where data are not available, thefigures are based on educated guesses. For someactivities, the values are not the values obtainedexclusively during execution of the activities. Forexample, folk dancing requires a higher valuethan that shown. However, in an hour of folkdancing, considerable time is spent standing,receiving directions, and so on, so the valueshown represents the estimated average value.On the other hand, walking usually is done con-tinuously, so its values represent the actualenergy cost of doing the activity.
Adults (usually young adults) served as sub-jects in determining most of the metabolic costsof activities that have been reported in the litera-ture. Little data is based on children and theelderly. The energy expended by children in kilo-joules per kilogram of body weight in perform-ing even common activities such as walking issignificantly higher than when the same activi-ties are done by adults (Montoye 1982). This isprobably because of children’s greater ratio ofsurface area to body weight and poorer coordina-tion than adults. Even if the resting energyexpenditure is also higher in children, the METvalues of activities in the table are probably alittle low for children. Data from Torún et al.(1983) have shown the same results. This has alsobeen shown to be true for infants (Torún et al.1983). Data on energy cost of activities areneeded to create a table for children.
Data on the energy cost of elderly adults arealso needed. Although walking at the same ratemay elicit an energy expenditure not much dif-ferent than in young adults, the elderly generallywalk slower, play tennis at less intensity, skateless vigorously, and the like, so the estimate ofhabitual energy expenditure in the elderlyrequires other energy cost values.

The numerical values in the third column is theMET rating (the energy cost of the activitydivided by the resting, not basal, energy expen-diture). The last columns contain the approxi-mate energy cost of the activity expressed askilojoules or kilocalories per hour per kilogramof body mass.
Acknowledgements
The editorial assistance of Ms Joann Janes isappreciated.
References
Ainsworth, B.E., Haskell, W.L., Leon, A.S. et al. (1993)Compendium of physical activities: classification ofenergy costs of human physical activities. Medicineand Science in Sports and Exercise 25, 71–80.
Anderson, R.M., Liv, K., Stamler, J., Van Horn, L. &Hoeksema, R. (1981) Assessment of individual physical activity level: intra-individual vs. inter-individual variability (Abstract). Medicine and Sciencein Sports and Exercise 13, 100.
Andrews, R.B. (1971) Net heart rates substitute for respiratory calorimetry. American Journal of ClinicalNutrition 24, 1139–1147.
Atwater, W.O. & Benedict, F.G. (1905) A RespirationCalorimeter with Applicances for the Direct Determina-tion of Oxygen. Publication no. 42. Carnegie Instituteof Washington, Washington, DC.
Bannister, E.W. & Brown, S.R. (1968) The relativeenergy requirements of physical activity. In ExercisePhysiology (ed. H.B. Falls), pp. 267–322. AcademicPress, New York.
Benedict, F.G. (1907) The Influences of Inanition on Metabolism. Publication no. 77. Carnegie Institute,Washington, DC.
Berg, K. (1971) Heart rate telemetry for evaluation ofthe energy expenditure of children with cerebralpalsy. American Journal of Clinical Nutrition 24,1438–1445.
Blair, S.N., Haskell, W.L., Ho, P. et al. (1985) Assessmentof habitual physical activity by a 7-day recall in a community survey and controlled experiment.American Journal of Epidemiology 122, 794–804.
Booyens, J. & Hervey, G.R. (1960) The pulse rate as a means of measuring metabolic rate in man. Canadian Journal of Biochemical Physiology 38,1301–1309.
Bradfield, R.B., Huntzicker, P.B. & Fruehan, G.J. (1969)Simultaneous comparison of respirometer and heartrate telemetry techniques as measures of human
energy expenditure. American Journal of ClinicalNutrition 22, 696–700.
Brody, S. (1974, original work published 1945) Bioener-getics and Growth. Collier Macmillan, New York.
Carlson, L.D. & Hsieh, A.C.L. (1970) Control of EnergyExchange. Macmillan, New York.
Chapman, C.B. & Mitchell, J.H. (1965) The physiologyof exercise. Scientific American 212, 88–96.
Collins, K.J., Abdel-Rahman, T.A. & Awad El Karim,M.A. (1988) Schistosomiasis: field studies of energyexpenditure in agricultural workers in the Sudan. In Capacity for Work in the Tropics (ed. K.J. Collins &D.F. Roberts), pp. 235–247. Cambridge UniversityPress, Cambridge.
Collins, M.A., Cureton, K.J., Hill, D.W. & Ray, C.A.(1991) Relationship of heart rate to oxygen uptakeduring weight lifting exercise. Medicine and Science inSports and Exercise 23, 636–640.
Durin, N. & Namyslowski, L. (1958) Individual varia-tions in energy expenditure of standardized activi-ties. Journal of Physiology 143, 573–578.
Durnin, J.V.G.A. & Passmore, R. (1967) Energy Work andLeisure. Heinemann Educational Books, London.
Fenn, W.O. & Rahn, H. (eds) (1964) Handbook of Physiology: Section 3. Respiration: Vol. 1. AmericanPhysiological Society, Washington, DC.
Gandra, Y.R. & Bradfield, R.B. (1971) Energy expendi-ture and oxygen handling efficiency of anemicschool children. American Journal of Clinical Nutrition24, 1451–1456.
Geissler, C.A., Brun, T.A., Mirbagheri, I., Soheli, A.,Naghibi, A. & Hedayat, H. (1981) The energy expen-diture of female carpet weavers and rural women inIran. American Journal of Clinical Nutrition 34,2776–2783.
Getchell, L.H. (1968) Energy cost of playing golf.Archives of Physical Medical Rehabilitation 49, 31–35.
Goff, L.G., Frassetto, R. & Specht, H. (1956) Oxygenrequirement in underwater swimming. Journal ofApplied Physiology 9, 219–221.
Hambraeus, L., Forslund, A. & Sjödin, A. (1991) Theuse of a suit calorimeter in combination with indirectrespiratory calorimetry for studies on the effect of diet and exercise on energy balance in healthyadults [abstract]. Federation of American Societies forExperimental Biology Journal 5, A1648.
Hansen, O.E. & Maggio, M. (1960) Static work andheart rate. Internationales Zeitschrift für AngewandtePhysiologie Einschleisslich Arbeitsphysiologie 18, 242–247.
Harrison, M.H., Brown, G.A. & Belyasin, A.J. (1982)The oxylog: an evaluation. Ergonomics 25(a), 809–820.
Henderson, Y. & Prince, A.L. (1914) The oxygen pulseand the systolic discharge. American Journal of Physiology 35, 106–115.
Howley, E.T. & Glover, M.E. (1974) The caloric costs of
energy costs of exercise 59

running and walking one mile for men and women.Medicine and Science in Sports and Exercise 6, 235–237.
Humphrey, S.J.E. & Wolff, H.S. (1977) The oxylog(Abstract). Journal of Physiology 267, 120.
Ikegami, Y., Hiruta, S., Ikegami, H. & Miyamura, M.(1988) Development of a telemetry system for mea-suring oxygen uptake during sports activities. European Journal of Applied Physiology 57, 622–626.
Insull, W. (1954) Indirect Calorimetry by New Techniques:A Description and Evaluation. Report no. 146, MedicalNutrition Laboratory. US Army, Fitzsimmons ArmyHospital, Denver, CO.
Jéquier, E., Acheson, K. & Schutz, Y. (1987) Assessmentof energy expenditure and fuel utilization in man.Annual Review of Nutrition 7, 187–208.
Kinney, J.M. (1980) The application of indirectcalorimetry to clinical studies. In Assessment ofEnergy Metabolism in Health and Disease, pp. 42–48.Ross Laboratories, Columbus, OH.
Kofranyi, E. & Michaelis, H.F. (1940) Ein tragbarerApparat zur Bestimmung des Gasstoffwechsels [A portable apparatus to determine metabolism].Arbeitsphysiologie 11, 148–150.
LaGrange, F. (1905) Physiology of Bodily Exercise. D.Appleton, New York.
Leon, A.S. (1981) Approximate energy expendituresand fitness values of sports and recreational and household activities. In The Book of Health and PhysicalFitness (ed. E.L. Wynder), pp. 283–341. Watts, NewYork.
Lundgren, N.P.V. (1947) The physiological effects of time schedule work on lumber workers. ActaPhysiologica Scandinavica 13 (Suppl. 41), 1–137.
McArdle, W.D., Katch, F.I. & Katch, V.L. (1988) ExercisePhysiology: Energy, Nutrition, and Human Performance,2nd edn. Lea & Febiger, Philadelphia.
McNeill, G., Cox, M.D. & Rivers, J.P.W. (1987) Theoxylog oxygen consumption meter: a portable devicefor measurement of energy expenditure. AmericanJournal of Clinical Nutrition 45, 1415–1419.
Malhotra, M.S., Sen Gupta, J. & Rai, R.M. (1963) Pulsecount as a measure of energy expenditure. Journal ofApplied Physiology 18, 994–996.
Mandli, M., Hoffman, M.D., Jones, G.M., Bota, B. &Clifford, P.S. (1989) Nordic ski training: in-line skatesor roller skis? (Abstract) Medicine and Science in Sportsand Exercise 21, S64.
Mass, S., Kok, M.L., Westra, H.G. & Kemper, H.C.G.(1989) The validity of the use of heart rate in estimat-ing oxygen consumption in static and in combinedstatic/dynamic exercise. Ergonomics 32, 141–148.
Montoye, H.J. (1970) Circulatory-respiratory fitness. InAn Introduction to Measurement in Physical Education,Vol. 4 (ed. H.J. Montoye), pp. 41–87. Phi EpsilonKappa Fraternity, Indianapolis, IN.
Montoye, H.J. (1975) Physical Activity and Health: an Epi-
60 nutrition and exercise
demiologic Study of a Total Community. Prentice-Hall,Englewood Cliffs, NJ.
Montoye, H.J. (1982) Age and oxygen utilizationduring submaximal treadmill exercise in males.Journal of Gerontology 37, 396–402.
Montoye, H.J., Kemper, H.C.G., Saris, W.H.M. & Wash-burn, R.A. (1996) Measuring Physical Activity andEnergy Expenditure. Human Kinetics, Champaign, IL.
Montoye, H.J., Van Huss, W.D., Reineke, E.P. & Cockrell, J. (1958) An investigation of the Müller–Franz calorimeter. Arbeitsphysiologie 17, 28–33.
Müller, E.A. & Franz, H. (1952) Energieverbraughsmes-sungen bei beruflicher Arbeit mit einer verbesertenRespirationsgasuhr (The measurement of energyconsumption during occupational work with an im-proved respirometer). Arbeitsphysiologie 14, 499–504.
Murlin, J.R. & Greer, J.R. (1914) The relation of heartaction to the respiratory metabolism. AmericanJournal of Physiology 33, 253–282.
Nelson, D.J., Pells, A.E. III, Greenen, D.L. & White, T.P.(1988) Cardiac frequency and caloric cost of aerobicdancing in young women. Research Quarterly forExercise and Sport 59, 229–233.
Orsini, D. & Passmore, R. (1951) The energy expendedcarrying loads up and down stairs: experimentsusing the Kofranyi–Michaelis calorimeter. Journal ofPhysiology 115, 95–100.
Passmore, R. & Durnin, J.V.G.A. (1955) Human energyexpenditure. Physiological Reviews 35, 801–840.
Patterson, R.P. & Fisher, S.V. (1979) Energy measure-ments in ambulation and activities of daily living:development and evaluation of a portable measur-ing system (Abstract). Archives of Physical and MedicalRehabilitation 60, 534–535.
Payne, P.R., Wheeler, E.F. & Salvosa, C.B. (1971) Predic-tion of daily energy expenditure from average pulse rate. American Journal of Clinical Nutrition24, 1164–1170.
Reiff, G.G., Montoye, H.J., Remington, R.D., Napier,J.A., Metzner, H.L. & Epstein, F.H. (1967a) Assessment of physical activity by questionnaire andinterview. Journal of Sports Medicine and PhysicalFitness 7, 1–32.
Reiff, G.G., Montoye, H.J., Remington, R.D., Napier,J.A., Metzner, H.L. & Epstein, F.H. (1967b) Assess-ment of physical activity by questionnaire and inter-view. In Physical Activity and the Heart (ed. M.J.Karvonen & A.J. Barry), pp. 336–371. Charles C.Thomas, Springfield, IL.
Saris, W.H.M., Baecke, J. & Binkhorst, R.A. (1982) Valid-ity of the assessment of energy expenditure fromheart rate. In Aerobic Power and Daily Physical Activityin Children (ed. W.H.M. Saris), pp. 100–117.University of Nymegen, Meppel, Krips-Repro, TheNetherlands.
Seliger, V. (1968) Energy metabolism in selected physi-

cal exercises. Internationale Zeitschrift für AngewandePhysiologie Einschliesslich Arabeitsphysiologie 25, 104–120.
Stray-Gundersen, J. & Galanes, J. (1991) The metabolicdemands of roller skating compared to snow skiing[abstract]. Medicine and Science in Sports and Exercise23, S107.
Taylor, H.L. (1967) Occupational factors in the study ofcoronary heart disease and physical activity. Cana-dian Medical Association Journal 96, 825–831.
Taylor, H.L. & Parlin, R.W. (1966) The physical activityof railroad clerks and switchmen: Estimation of theon-the-job caloric expenditure by time and task mea-surements and classification of recreational activityby a questionnaire. Paper presented at ‘Three Days ofCardiology,’ Seattle, WA, June.
Torún, B., Chew, F. & Mendoza, R.D. (1983) Energy costof activities of preschool children. Nutrition Research3, 401–406.
Veicsteinas, A., Ferretti, G., Margonato, V., Rosa, G. &Tagliabue, D. (1984) Energy cost of and energysources for alpine skiing in top athletes. Journal ofApplied Physiology 56, 1187–1190.
Viteri, F.E., Torún, B., Galicia, J. & Herrera, E. (1971)Determining energy costs of agricultural activities by respirometer and energy balance techniques.American Journal of Clinical Nutrition 24, 1418–1430.
Vokac, Z., Bell, H., Bautz-Holter, E. & Rodahl, J. (1975)Oxygen uptake/heart rate relationship in leg andarm exercise, sitting and standing. Journal of AppliedPhysiology 39, 54–59.
VonHofen, D., Auble, T.E. & Schwartz, L. (1989)Aerobic requirements for pumping vs. carrying 9 kghand weights while running (Abstract). Medicine andScience in Sports and Exercise 21, S7.
Warnold, T. & Lenner, A.R. (1977) Evaluation of theheart rate method to determine the daily energyexpenditure in disease: a study in juvenile diabe-tics. American Journal of Clinical Nutrition 30, 304–315.
Watts, P.B., Martin, D.T., Schmeling, M.H., Silta, B.C. &Watts, A.G. (1990) Exertional intensities and energyrequirements of technical mountaineering at moder-ate altitudes. Journal of Sports Medicine and PhysicalFitness 30, 365–376.
Webb, P. (1980) The measurement of energy exchangein man: an analysis. American Journal of Clinical Nutrition 33, 1299–1310.
Webb, P., Annis, J.F. & Troutman, S.J. Jr (1980) Energybalance in man measured by direct and indirectcalorimetry. American Journal of Clinical Nutrition 33,1287–1298.
Wigaeus, E. & Kilbom, A. (1980) Physical demandsduring folk dancing. European Journal of Applied Physiology 45, 117–183.
Wolff, H.S. (1958) The integrating pneumotachograph:a new instrument for the measurement of energyexpenditures by indirect calorimetry. QuarterlyJournal of Exercise Physiology 43, 270–283.
Zuntz, N. & Leowy, A. (1909) Lehrbuch der Physiologiebes Menschen (Textbook of Human Physiology). F.C.W.Vogel, Leipzig, Germany.
energy costs of exercise 61
Appendix 4.1 A compendium of the energy costs of different physical activities.
kJ ·h-1 ·kg-1
(kcal ·h-1 ·kg-1)Activity category Specific activity (kcal h-1 ·kg-1) METs body wt
Bicycling Mountain biking 8.5 35 (8.3)Bicycling < 16km · h-1, general, leisure, to work or for pleasure 4.0 17 (4.0)Bicycling 16–19km · h-1, leisure, slow, light effort 6.0 25 (5.9)Bicycling 19.1–22.4km · h-1, leisure, moderate effort 8.0 33 (7.8)Bicycling 22.5–25.5km · h-1, racing or leisure, fast, vigorous effort 10.0 42 (10.0)Bicycling 25.6–30.5km · h-1, racing/not drafting or > 30.5km · h-1 12.0 50 (11.9)
drafting, very fast, racing generalBicycling > 30.5km · h-1, racing, not drafting 16.0 67 (15.9)Bicycling Unicycling 5.0 21 (5.0)Conditioning exercise Bicycling, stationary, general 5.0 21 (5.0)Conditioning exercise Bicycling, stationary, 50W, very light effort 3.0 13 (3.1)Conditioning exercise Bicycling, stationary, 100W, light effort 5.5 23 (5.5)Conditioning exercise Bicycling, stationary, 150W, moderate effort 7.0 29 (6.9)Conditioning exercise Bicycling, stationary, 200W, vigorous effort 10.5 44 (10.5)Conditioning exercise Bicycling, stationary, 250W, very vigorous effort 12.5 52 (12.4)Conditioning exercise Calisthenics (e.g. push-ups, pull-ups, sit-ups), heavy, 8.0 33 (7.8)
vigorous effort

62 nutrition and exercise
kJ ·h-1 ·kg-1
(kcal ·h-1 ·kg-1)Activity category Specific activity METs body wt
Conditioning exercise Calisthenics, home exercise, light or moderate effort, 4.5 19 (4.5)general (e.g. back exercises), going up and down from floor
Conditioning exercise Circuit training, general 8.0 33 (7.8)Conditioning exercise Weight lifting (free weight, nautilus or universal-type), 6.0 25 (5.9)
power lifting or body building, vigorous effortConditioning exercise Health club exercise, general 5.5 23 (5.5)Conditioning exercise Stair-treadmill ergometer, general 6.0 25 (5.9)Conditioning exercise Rowing, stationary ergometer, general 9.5 40 (9.5)Conditioning exercise Rowing, stationary, 50W, light effort 3.5 15 (3.6)Conditioning exercise Rowing stationary, 100W, moderate effort 7.0 29 (6.9)Conditioning exercise Rowing, stationary, 150W, vigorous effort 8.5 35 (8.3)Conditioning exercise Rowing, stationary, 200W, very vigorous effort 12.0 50 (11.9)Conditioning exercise Ski machine, general 9.5 40 (9.5)Conditioning exercise Slimnastics 6.0 25 (5.9)Conditioning exercise Stretching, hatha yoga 4.0 17 (4.0)Conditioning exercise Teaching aerobics exercise class, assumes participation 6.0 25 (5.9)Conditioning exercise Water aerobics, water calisthenics 4.0 17 (4.0)Conditioning exercise Weight lifting (free, nautilus or universal-type), light or 3.0 13 (3.1)
moderate effort, light workout, generalConditioning exercise Whirlpool, sitting 1.0 4 (0.9)Dancing Aerobic, ballet or modern, twist 6.0 25 (5.9)Dancing Aerobic, general 6.0 25 (5.9)Dancing Aerobic, low impact 5.0 21 (5.0)Dancing Aerobic, high impact 7.0 29 (6.9)Dancing General 4.5 19 (4.5)Dancing Ballroom, fast (e.g. disco, folk, square) 5.5 23 (5.5)Dancing Ballroom, slow (e.g. waltz, foxtrot, slow dancing) 3.0 13 (3.1)Fishing and hunting Fishing, general 5.0 21 (5.0)Fishing and hunting Digging worms with shovel 4.0 17 (4.0)Fishing and hunting Fishing from river bank and walking 5.0 21 (5.0)Fishing and hunting Fishing from boat, sitting 2.5 10 (2.4)Fishing and hunting Fishing from river bank, standing 3.5 15 (3.6)Fishing and hunting Fishing in stream, in waders 6.0 25 (5.9)Fishing and hunting Fishing, ice, sitting 2.0 8 (1.9)Fishing and hunting Hunting, bow and arrow or crossbow 2.5 10 (2.4)Fishing and hunting Hunting, deer, elk, large game 6.0 25 (5.9)Fishing and hunting Hunting, duck, wading 2.5 10 (2.4)Fishing and hunting Hunting, general 5.0 21 (5.0)Fishing and hunting Hunting, pheasants or grouse 6.0 25 (5.9)Fishing and hunting Hunting, rabbit, squirrel, prairie chick, racoon, small game 5.0 21 (5.0)Fishing and hunting Pistol shooting or trap shooting, standing 2.5 10 (2.4)Home activities Carpet sweeping, sweeping floors 2.5 10 (2.4)Home activities Cleaning, heavy or major (e.g. washing car, washing 4.5 19 (4.5)
windows, mopping, cleaning garage), vigorous effortHome activities Cleaning, house or cabin, general 3.5 15 (3.6)Home activities Cleaning, light (dusting, straightening up, vacuuming, 2.5 10 (2.4)
changing linen, carrying out rubbish), moderate effortHome activities Washing dishes, standing or in general (not broken into 2.3 9 (2.1)
stand/walk components)

kJ ·h-1 ·kg-1
(kcal ·h-1 ·kg-1)Activity category Specific activity METs body wt
Home activities Washing dishes, clearing dishes from table (walking) 2.3 9 (2.1)Home activities Cooking or preparing food, standing or sitting or in general 2.5 10 (2.4)
(not broken into stand/walk components)Home activities Serving food, setting table (implied walking or standing) 2.5 10 (2.4)Home activities Cooking or food preparation, walking 2.5 10 (2.4)Home activities Putting away groceries (e.g. carrying groceries, shopping 2.5 10 (2.4)
without a trolley)Home activities Carrying groceries upstairs 8.0 33 (7.8)Home activities Food shopping, with trolley 3.5 15 (3.6)Home activities Shopping (non-grocery shopping), standing 2.0 8 (1.9)Home activities Shopping (non-grocery shopping), walking 2.3 9 (2.1)Home activities Ironing 2.3 9 (2.1)Home activities Sitting, knitting, sewing, light wrapping (presents) 1.5 6 (1.4)Home activities Laundry, folding or hanging clothes, putting clothes in 2.0 8 (1.9)
washer or dryer, packing suitcase (implied standing)Home activities Putting away clothes, gathering clothes to pack, putting 2.3 9 (2.1)
away laundry (implied walking)Home activities Making beds 2.0 8 (1.9)Home activities Making maple syrup (tapping trees, carrying buckets, 5.0 21 (5.0)
carrying wood, etc.)Home activities Moving furniture, household 6.0 25 (5.9)Home activities Scrubbing floors on hands and knees 5.5 23 (5.5)Home activities Sweeping garage, pavement or outside of house 4.0 17 (4.0)Home activities Moving household items, carrying boxes 7.0 29 (6.9)Home activities Packing/unpacking boxes, occasional lifting of household 3.5 15 (3.6)
items, light–moderate effort (standing)Home activities Putting away household items, moderate effort (implied 3.0 13 (3.1)
walking)Home activities Move household items upstairs, carrying boxes or furniture 9.0 38 (9.0)Home activities Light (e.g. pumping gas, changing light bulb, etc.), standing 2.5 10 (2.4)Home activities Light, non-cleaning (e.g. getting ready to leave, shutting/ 3.0 13 (3.1)
locking doors, closing windows, etc.), walkingHome activities Playing with child(ren), light effort (sitting) 2.5 10 (2.4)Home activities Playing with child(ren), light effort (standing) 2.8 12 (2.8)Home activities Playing with child(ren), moderate effort (walking/running) 4.0 17 (4.0)Home activities Playing with child(ren), vigorous effort (walking/running) 5.0 21 (5.0)Home activities Child care: sitting/kneeling—dressing, bathing, grooming, 3.0 13 (3.1)
feeding, occasional lifting of child, light effortHome activities Child care: standing—dressing, bathing, grooming, feeding, 3.5 15 (3.6)
occasional lifting of child, light effortHome activities Weaving at a loom, sitting 2.0 8 (1.9)Home repair Car body work 4.5 19 (4.5)Home repair Car repair 3.0 13 (3.1)Home repair Carpentry, general, workshop 3.0 13 (3.1)Home repair Carpentry, outside house, installing rain gutters 6.0 25 (5.9)Home repair Carpentry, finishing or refinishing cabinets or furniture 4.5 19 (4.5)Home repair Carpentry, sawing hardwood 7.5 31 (7.4)Home repair Caulking, chinking log cabin 5.0 21 (5.0)Home repair Caulking, except log cabin 4.5 19 (4.5)Home repair Cleaning, gutters 5.0 21 (5.0)
energy costs of exercise 63

kJ ·h-1 ·kg-1
(kcal ·h-1 ·kg-1)Activity category Specific activity METs body wt
Home repair Excavating garage 5.0 21 (5.0)Home repair Hanging storm windows 5.0 21 (5.0)Home repair Laying or removing carpet 4.5 19 (4.5)Home repair Laying tile or linoleum 4.5 19 (4.5)Home repair Painting, outside house 5.0 21 (5.0)Home repair Painting, papering, plastering, scraping, inside house, 4.5 19 (4.5)
hanging sheet rock, remodellingHome repair Putting on and removing of sailboat tarpaulin 3.0 13 (3.1)Home repair Roofing 6.0 25 (5.9)Home repair Sanding floors with a power sander 4.5 19 (4.5)Home repair Scraping and painting sailboat or power boat 4.5 19 (4.5)Home repair Spreading dirt with a shovel 5.0 21 (5.0)Home repair Washing and waxing hull of sailboat, car, powerboat, 4.5 19 (4.5)
airplaneHome repair Washing fence 4.5 19 (4.5)Home repair Wiring, plumbing 3.0 13 (3.1)Inactivity, quiet Lying quietly, reclining (watching television), lying quietly 1.0 4 (0.9)
in bed—awakeInactivity, quiet Sitting quietly (riding in a car, listening to a lecture or 1.0 4 (0.9)
music, watching television or a film)Inactivity, quiet Sleeping 0.9 4 (0.9)Inactivity, quiet Standing quietly (standing in a line) 1.2 5 (1.2)Inactivity, light Writing, reclining 1.0 4 (0.9)Inactivity, light Talking or talking on phone, reclining 1.0 4 (0.9)Inactivity, light Reading, reclining 1.0 4 (0.9)Lawn and garden Carrying, loading or stacking wood, loading/unloading or 5.0 21 (5.0)
carrying lumberLawn and garden Chopping wood, splitting logs 6.0 25 (5.9)Lawn and garden Clearing land, hauling branches 5.0 21 (5.0)Lawn and garden Digging sandpit 5.0 21 (5.0)Lawn and garden Digging, spading, filling garden 5.0 21 (5.0)Lawn and garden Gardening with heavy power tools, tilling a garden (see 6.0 25 (5.9)
Occupation, Shovelling)Lawn and garden Laying crushed rock 5.0 21 (5.0)Lawn and garden Laying sod 5.0 21 (5.0)Lawn and garden Mowing lawn, general 5.5 23 (5.5)Lawn and garden Mowing lawn, riding mower 2.5 10 (2.4)Lawn and garden Mowing lawn, walk, hand mower 6.0 25 (5.9)Lawn and garden Mowing lawn, walking, power mower 4.5 19 (4.5)Lawn and garden Operating snow blower, walking 4.5 19 (4.5)Lawn and garden Planting seedlings, shrubs 4.0 17 (4.0)Lawn and garden Planting trees 4.5 19 (4.5)Lawn and garden Raking lawn 4.0 17 (4.0)Lawn and garden Raking roof with snow rake 4.0 17 (4.0)Lawn and garden Riding snow blower 3.0 13 (3.1)Lawn and garden Collecting grass/leaves 4.0 17 (4.0)Lawn and garden Shovelling snow by hand 6.0 25 (5.9)Lawn and garden Trimming shrubs or trees, manual cutter 4.5 19 (4.5)Lawn and garden Trimming shrubs or trees, power cutter 3.5 15 (3.6)Lawn and garden Walking, applying fertilizer or seeding a lawn 2.5 10 (2.4)Lawn and garden Watering lawn or garden, standing or walking 1.5 6 (1.4)
64 nutrition and exercise

kJ ·h-1 ·kg-1
(kcal ·h-1 ·kg-1)Activity category Specific activity METs body wt
Lawn and garden Weeding, cultivating garden 4.5 19 (4.5)Lawn and garden Gardening, general 5.0 21 (5.0)Lawn and garden Tidying up yard, light effort (implied walking/standing) 3.0 13 (3.1)Miscellaneous Card playing, playing board games (sitting) 1.5 6 (1.4)Miscellaneous Drawing or writing, casino gambling (standing) 2.0 8 (1.9)Miscellaneous Reading, book, newspaper, etc. (sitting) 1.3 5 (1.2)Miscellaneous Writing, desk work (sitting) 1.8 7.5 (1.8)Miscellaneous Talking or talking on the phone (standing) 1.8 7.5 (1.8)Miscellaneous Talking or talking on the phone (sitting) 1.5 6 (1.4)Miscellaneous Studying, general, including reading and/or writing 1.8 7.5 (1.8)
(sitting)Miscellaneous In class, general, including note-taking or class discussion 1.8 7.5 (1.8)
(sitting)Miscellaneous Reading (standing) 1.8 7.5 (1.8)Music playing Accordion 1.8 7.5 (1.8)Music playing Cello 2.0 8 (1.9)Music playing Conducting 2.5 10 (2.4)Music playing Drums 4.0 17 (4.0)Music playing Flute (sitting) 2.0 8 (1.9)Music playing Horn 2.0 8 (1.9)Music playing Piano or organ 2.5 10 (2.4)Music playing Trombone 3.5 15 (3.6)Music playing Trumpet 2.5 10 (2.4)Music playing Violin 2.5 10 (2.4)Music playing Woodwind 2.0 8 (1.9)Music playing Guitar, classical, folk (sitting) 2.0 8 (1.9)Music playing Guitar, rock and roll band (standing) 3.0 13 (3.1)Music playing Marching band, playing an instrument, baton twirling 4.0 17 (4.0)
(walking)Music playing Marching band, drum major (walking) 3.5 15 (3.6)Occupation Bakery, general 4.0 17 (4.0)Occupation Bookbinding 2.3 9 (2.1)Occupation Building road (including hauling debris, driving heavy 6.0 25 (5.9)
machinery)Occupation Building road, directing traffic (standing) 2.0 8 (1.9)Occupation Carpentry, general 3.5 15 (3.6)Occupation Carrying heavy loads, such as bricks 8.0 33 (7.8)Occupation Carrying moderate loads up stairs, moving boxes (7–18kg) 8.0 33 (7.8)Occupation Chambermaid 2.5 10 (2.4)Occupation Coal mining, drilling coal, rock 6.5 27 (6.4)Occupation Coal mining, erecting supports 6.5 27 (6.4)Occupation Coal mining, general 6.0 25 (5.9)Occupation Coal mining, shovelling coal 7.0 29 (6.9)Occupation Construction, outside, remodelling 5.5 23 (5.5)Occupation Electrical work, plumbing 3.5 15 (3.6)Occupation Farming, baling hay, cleaning barn, poultry work 8.0 33 (5.5)Occupation Farming, chasing cattle, non-strenuous 3.5 15 (3.6)Occupation Farming, driving harvester 2.5 10 (2.4)Occupation Farming, driving tractor 2.5 10 (2.4)Occupation Farming, feeding small animals 4.0 17 (4.0)Occupation Farming, feeding cattle 4.5 19 (4.5)
energy costs of exercise 65

kJ ·h-1 ·kg-1
(kcal ·h-1 ·kg-1)Activity category Specific activity METs body wt
Occupation Farming, forking straw bales 8.0 33 (5.5)Occupation Farming, milking by hand 3.0 13 (3.1)Occupation Farming, milking by machine 1.5 6 (1.4)Occupation Farming, shovelling grain 5.5 23 (5.5)Occupation Fire fighter, general 12.0 50 (11.9)Occupation Fire fighter, climbing ladder with full gear 11.0 46 (10.9)Occupation Fire fighter, hauling hoses on ground 8.0 33 (7.8)Occupation Forestry, chopping with axe, fast 17.0 71 (16.9)Occupation Forestry, chopping with axe, slow 5.0 21 (5.0)Occupation Forestry, removing bark from trees 7.0 29 (6.9)Occupation Forestry, carrying logs 11.0 46 (10.9)Occupation Forestry, felling trees 8.0 33 (7.8)Occupation Forestry, general 8.0 33 (7.8)Occupation Forestry, hoeing 5.0 21 (5.0)Occupation Forestry, planting by hand 6.0 25 (5.9)Occupation Forestry, sawing by hand 7.0 29 (6.9)Occupation Forestry, sawing, power 4.5 19 (4.5)Occupation Forestry, trimming trees 9.0 38 (9.0)Occupation Forestry, weeding 4.0 17 (4.0)Occupation Furriery 4.5 19 (4.5)Occupation Horse grooming 6.0 25 (5.9)Occupation Locksmith 3.5 15 (3.6)Occupation Machine tooling, machining, working sheet metal 2.5 10 (2.4)Occupation Machine tooling, operating lathe 3.0 13 (3.1)Occupation Machine tooling, operating punch press 5.0 21 (5.0)Occupation Machine tooling, tapping and drilling 4.0 17 (4.0)Occupation Machine tooling, welding 3.0 13 (3.1)Occupation Masonry, concrete 7.0 29 (6.9)Occupation Masseur, masseuse (standing) 4.0 17 (4.0)Occupation Moving, pushing heavy objects, 40kg or more (desks, 7.0 29 (6.9)
moving van work)Occupation Operating heavy duty equipment/automated, not driving 2.5 10 (2.4)Occupation Orange grove work 4.5 19 (4.5)Occupation Printing (standing) 2.3 9 (2.1)Occupation Police, directing traffic (standing) 2.5 10 (2.4)Occupation Police, driving a squad car (sitting) 2.0 8 (1.9)Occupation Police, riding in a squad car (sitting) 1.3 5 (1.2)Occupation Police, making an arrest (standing) 8.0 33 (7.8)Occupation Shoe repair, general 2.5 10 (2.4)Occupation Shovelling, digging ditches 8.5 35 (8.3)Occupation Shovelling, heavy (more than 7kg · min-1) 9.0 38 (9.0)Occupation Shovelling, light (less than 4.5kg · min-1) 6.0 25 (5.9)Occupation Shovelling, moderate (4.5–7kg · min-1) 7.0 29 (6.9)Occupation Light office work, in general (chemistry lab work, light use 1.5 6 (1.4)
of hand tools, watch repair or microassembly, lightassembly/repair) (sitting)
Occupation Meetings, general, and/or with talking involved (sitting) 1.5 6 (1.4)Occupation Moderate (e.g. heavy levers, riding mower/forklift, crane 2.5 10 (2.4)
operation), sittingOccupation Light (e.g. bartending, store clerk, assembling, filing, 2.5 10 (2.4)
photocopying, putting up Christmas tree), standing
66 nutrition and exercise
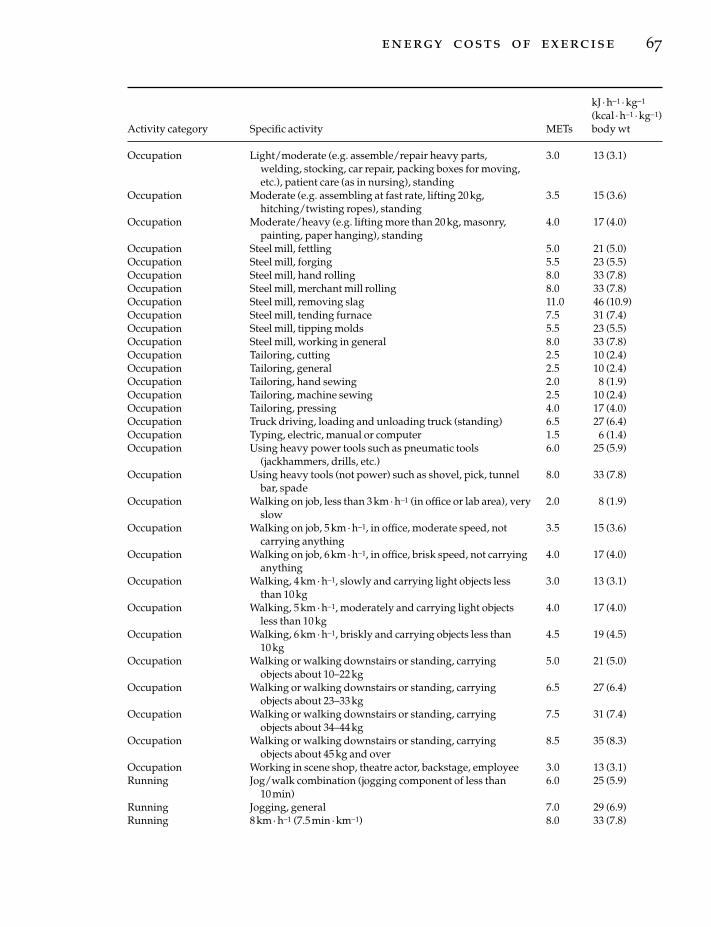
kJ ·h-1 ·kg-1
(kcal ·h-1 ·kg-1)Activity category Specific activity METs body wt
Occupation Light/moderate (e.g. assemble/repair heavy parts, 3.0 13 (3.1)welding, stocking, car repair, packing boxes for moving,etc.), patient care (as in nursing), standing
Occupation Moderate (e.g. assembling at fast rate, lifting 20kg, 3.5 15 (3.6)hitching/twisting ropes), standing
Occupation Moderate/heavy (e.g. lifting more than 20kg, masonry, 4.0 17 (4.0)painting, paper hanging), standing
Occupation Steel mill, fettling 5.0 21 (5.0)Occupation Steel mill, forging 5.5 23 (5.5)Occupation Steel mill, hand rolling 8.0 33 (7.8)Occupation Steel mill, merchant mill rolling 8.0 33 (7.8)Occupation Steel mill, removing slag 11.0 46 (10.9)Occupation Steel mill, tending furnace 7.5 31 (7.4)Occupation Steel mill, tipping molds 5.5 23 (5.5)Occupation Steel mill, working in general 8.0 33 (7.8)Occupation Tailoring, cutting 2.5 10 (2.4)Occupation Tailoring, general 2.5 10 (2.4)Occupation Tailoring, hand sewing 2.0 8 (1.9)Occupation Tailoring, machine sewing 2.5 10 (2.4)Occupation Tailoring, pressing 4.0 17 (4.0)Occupation Truck driving, loading and unloading truck (standing) 6.5 27 (6.4)Occupation Typing, electric, manual or computer 1.5 6 (1.4)Occupation Using heavy power tools such as pneumatic tools 6.0 25 (5.9)
(jackhammers, drills, etc.)Occupation Using heavy tools (not power) such as shovel, pick, tunnel 8.0 33 (7.8)
bar, spadeOccupation Walking on job, less than 3km · h-1 (in office or lab area), very 2.0 8 (1.9)
slowOccupation Walking on job, 5 km · h-1, in office, moderate speed, not 3.5 15 (3.6)
carrying anythingOccupation Walking on job, 6 km · h-1, in office, brisk speed, not carrying 4.0 17 (4.0)
anythingOccupation Walking, 4km · h-1, slowly and carrying light objects less 3.0 13 (3.1)
than 10kgOccupation Walking, 5km · h-1, moderately and carrying light objects 4.0 17 (4.0)
less than 10kgOccupation Walking, 6km · h-1, briskly and carrying objects less than 4.5 19 (4.5)
10kgOccupation Walking or walking downstairs or standing, carrying 5.0 21 (5.0)
objects about 10–22kgOccupation Walking or walking downstairs or standing, carrying 6.5 27 (6.4)
objects about 23–33kgOccupation Walking or walking downstairs or standing, carrying 7.5 31 (7.4)
objects about 34–44kgOccupation Walking or walking downstairs or standing, carrying 8.5 35 (8.3)
objects about 45kg and overOccupation Working in scene shop, theatre actor, backstage, employee 3.0 13 (3.1)Running Jog/walk combination (jogging component of less than 6.0 25 (5.9)
10min)Running Jogging, general 7.0 29 (6.9)Running 8km · h-1 (7.5min · km-1) 8.0 33 (7.8)
energy costs of exercise 67

kJ ·h-1 ·kg-1
(kcal ·h-1 ·kg-1)Activity category Specific activity METs body wt
Running 9.6km · h-1 (6.25min · km-1) 10.0 42 (10.0)Running 10.8km · h-1 (5.5min · km-1) 11.0 46 (10.9)Running 11.3km · h-1 (5.3min · km-1) 11.5 48 (11.4)Running 12km · h-1 (5.0min · km-1) 12.5 52 (12.4)Running 12.8km · h-1 (4.7min · km-1) 13.5 56 (13.3)Running 13.8km · h-1 (4.3min · km-1) 14.0 59 (14.0)Running 14.5km · h-1 (4.1min · km-1) 15.0 63 (15.0)Running 16.1km · h-1 (3.7min · km-1) 16.0 67 (15.9)Running 17.5km · h-1 (3.4min · km-1) 18.0 75 (17.8)Running Running, cross-country 9.0 38 (9.0)Running Running, general 8.0 33 (7.8)Running Running, in place 8.0 33 (7.8)Running Running upstairs 15.0 63 (15.0)Running Running on a track, team practice 10.0 42 (10.0)Running Running, training, pushing wheelchair, marathon wheeling 8.0 33 (7.8)Running Running, wheeling, general 3.0 13 (3.1)Self-care Getting ready for bed, in general (standing) 2.5 10 (2.4)Self-care Sitting on toilet 1.0 4 (0.9)Self-care Bathing, sitting 2.0 8 (1.9)Self-care Dressing, undressing, standing or sitting 2.5 10 (2.4)Self-care Eating, sitting 1.5 6 (1.4)Self-care Talking and eating or eating only, standing 2.0 8 (1.9)Self-care Grooming (e.g. washing, shaving, brushing teeth, urinating, 2.5 10 (2.4)
washing hands, putting on make-up), sitting or standingSelf-care Showering, towelling off, standing 4.0 17 (4.0)Sexual activity Active, vigorous effort 1.5 6 (1.4)Sexual activity General, moderate effort 1.3 5 (1.2)Sexual activity Passive, light effort, kissing, hugging 1.0 4 (0.9)Sports Archery (non-hunting) 3.5 15 (3.6)Sports Badminton, competitive 7.0 29 (6.9)Sports Badminton, social singles and doubles, general 4.5 19 (4.5)Sports Basketball, game 8.0 33 (7.8)Sports Basketball, non-game, general 6.0 25 (5.9)Sports Basketball, officiating 7.0 29 (6.9)Sports Basketball, shooting baskets 4.5 19 (4.5)Sports Basketball, wheelchair 6.5 27 (6.4)Sports Billiards 2.5 10 (2.4)Sports Bowling 3.0 13 (3.1)Sports Boxing, in ring, general 12.0 50 (11.9)Sports Boxing, punching bag 6.0 25 (5.9)Sports Boxing, sparring 9.0 38 (9.0)Sports Broomball 7.0 29 (6.9)Sports Children’s games (hopscotch, 4-square, dodgeball, 5.0 21 (5.0)
playground apparatus, t-ball, tetherball, marbles, jacks,arcade games)
Sports Coaching: football, soccer, basketball, baseball swimming, 4.0 17 (4.0)etc.
Sports Cricket (batting, bowling) 5.0 21 (5.0)Sports Croquet 2.5 10 (2.4)Sports Curling 4.0 17 (4.0)Sports Darts, wall or lawn 2.5 10 (2.4)Sports Drag racing, pushing or driving a car 6.0 25 (5.9)
68 nutrition and exercise

kJ ·h-1 ·kg-1
(kcal ·h-1 ·kg-1)Activity category Specific activity METs body wt
Sports Fencing 6.0 25 (5.9)Sports Football, competitive 9.0 38 (9.0)Sports Football, touch, flag, general 8.0 33 (7.8)Sports Football or baseball, playing catch 2.5 10 (2.4)Sports Frisbee playing, general 3.0 13 (3.1)Sports Frisbee, ultimate 3.5 15 (3.6)Sports Golf, general 4.5 19 (4.5)Sports Golf, carrying clubs 5.5 23 (5.5)Sports Golf, miniature, driving range 3.0 13 (3.1)Sports Golf, pulling clubs 5.0 21 (5.0)Sports Golf, using power cart 3.5 15 (3.6)Sports Gymnastics, general 4.0 17 (4.0)Sports Handball, competitive 12.0 50 (11.9)Sports Handball, team 8.0 33 (7.8)Sports Hang gliding 3.5 15 (3.6)Sports Hockey, field 8.0 33 (7.8)Sports Hockey, ice 8.0 33 (7.8)Sports Horseback riding, general 4.0 17 (4.0)Sports Horseback riding, saddling horse 3.5 15 (3.6)Sports Horseback riding,trotting 6.5 27 (6.4)Sports Horseback riding, walking 2.5 10 (2.4)Sports Horseshoe pitching, quoits 3.0 13 (3.1)Sports Jai alai 12.0 50 (11.9)Sports Judo, jujitsu, karate, kick boxing, tae kwan do 10.0 42 (10.0)Sports Juggling 4.0 17 (4.0)Sports Kickball 7.0 29 (6.9)Sports Lacrosse 8.0 33 (7.8)Sports Moto-cross 4.0 17 (4.0)Sports Orienteering 9.0 38 (9.0)Sports Paddleball, competitive 12.0 50 (11.9)Sports Paddleball, casual, general 6.0 25 (5.9)Sports Polo 8.0 33 (7.8)Sports Racketball, competitive 12.0 50 (11.9)Sports Racketball, casual, general 7.0 29 (6.9)Sports Rock climbing, ascending rock 11.0 46 (10.9)Sports Rock climbing, rapelling 8.0 33 (7.8)Sports Rope jumping, fast 12.0 50 (11.9)Sports Rope jumping, moderate, general 10.0 42 (10.0)Sports Rope jumping, slow 8.0 33 (7.8)Sports Rugby 10.0 42 (10.0)Sports Shuffleboard, lawn bowling 3.0 13 (3.1)Sports Skateboarding 5.0 21 (5.0)Sports Skating, roller 7.0 29 (6.9)Sports In-line skating, 16km · h-1 7.5 31 (7.4)Sports In-line skating, 18km · h-1 8.5 35 (8.3)Sports In-line skating, 19km · h-1 10.0 42 (10.0)Sports Rollerskiing, 16km · h-1, no grade 8.0 33 (7.8)Sports Rollerskiing, 18km · h-1, no grade 10.0 42 (10.0)Sports Rollerskiing, 19km · h-1, no grade 11.0 46 (10.9)Sports Rollerskiing, 14.5km · h-1, 6% grade 12.0 50 (11.9)Sports Sky diving 3.5 15 (3.6)Sports Soccer, competitive 10.0 42 (10.0)
energy costs of exercise 69

kJ ·h-1 ·kg-1
(kcal ·h-1 ·kg-1)Activity category Specific activity METs body wt
Sports Soccer, casual, general 7.0 29 (6.9)Sports Softball or baseball, fast or slow pitch general 5.0 21 (5.0)Sports Softball, officiating 4.0 17 (4.0)Sports Softball, pitching 6.0 25 (5.9)Sports Squash 12.0 50 (11.9)Sports Table tennis, ping-pong 4.0 17 (4.0)Sports Tai chi 4.0 17 (4.0)Sports Tennis, general 7.0 29 (6.9)Sports Tennis, doubles 6.0 25 (5.9)Sports Tennis, singles 8.0 33 (7.8)Sports Trampoline 3.5 15 (3.6)Sports Volleyball, competitive, in gymnasium 4.0 17 (4.0)Sports Volleyball, non-competitive; 6–9 member team, general 3.0 13 (3.1)Sports Volleyball, beach 8.0 33 (7.8)Sports Wrestling (one match = 5min) 6.0 25 (5.9)Transportation Driving car or light truck (not a semi) 2.0 8 (1.9)Transportation Flying airplane 2.0 8 (1.9)Transportation Motor scooter, motor cycle 2.5 10 (2.4)Transportation Pushing plane in and out of hangar 6.0 25 (5.9)Transportation Driving heavy truck, tractor, bus 3.0 13 (3.1)Walking Backpacking, general 7.0 29 (6.9)Walking Carrying infant or 7-kg load (e.g. suitcase), on level ground 3.5 15 (3.6)
or downstairsWalking Carrying load upstairs, general 9.0 38 (9.0)Walking Carrying 0.5–7-kg load upstairs 5.0 21 (5.0)Walking Carrying 7.5–10.5-kg load upstairs 6.0 25 (5.9)Walking Carrying 11–22-kg load upstairs 8.0 33 (7.8)Walking Carrying 22.5–34-kg load upstairs 10.0 42 (10.0)Walking Carrying > 34-kg load upstairs 12.0 50 (11.9)Walking Climbing hills with 0–4-kg load 7.0 29 (6.9)Walking Climbing hills with 4.5–9-kg load 7.5 31 (7.4)Walking Climbing hills with 9.5–19-kg load 8.0 33 (7.8)Walking Climbing hills with > 19-kg load 9.0 38 (9.0)Walking Downstairs 3.0 13 (3.1)Walking Hiking, cross-country 6.0 25 (5.9)Walking Marching, rapidly, military 6.5 27 (6.4)Walking Pushing or pulling buggy with child 2.5 10 (2.4)Walking Race walking 6.5 27 (6.4)Walking Rock or mountain climbing 8.0 33 (7.8)Walking Upstairs, using or climbing up ladder 8.0 33 (7.8)Walking Using crutches 4.0 17 (4.0)Walking Less than 3km · h-1 on level ground, strolling, household 2.0 8 (1.9)
walking, very slowWalking 3km · h-1 on level ground, slow pace, firm surface 2.5 10 (2.4)Walking 4km · h-1, firm surface 3.0 13 (3.1)Walking 4km · h-1, downhill 3.0 13 (3.1)Walking 5km · h-1, on level ground, moderate pace, firm surface 3.5 15 (3.6)Walking 5.5km · h-1, on level ground, brisk pace, firm surface 4.0 17 (4.0)Walking 5.5km · h-1, uphill 6.0 25 (5.9)Walking 6km · h-1, on level ground, firm surface, very brisk pace 4.0 17 (4.0)Walking 7km · h-1, on level ground, firm surface, very brisk pace 4.5 19 (4.5)Walking For pleasure, work break, walking the dog 3.5 15 (3.6)
70 nutrition and exercise

kJ ·h-1 ·kg-1
(kcal ·h-1 ·kg-1)Activity category Specific activity METs body wt
Walking On grass track 5.0 21 (5.0)Walking To work or school 4.0 17 (4.0)Water activities Boating, power 2.5 10 (2.4)Water activities Canoeing, on camping trip 4.0 17 (4.0)Water activities Canoeing, portaging 7.0 29 (6.9)Water activities Canoeing, rowing, 3–6km · h-1, light effort 3.0 13 (3.1)Water activities Canoeing, rowing, 6.5–9km · h-1, moderate effort 7.0 29 (6.9)Water activities Canoeing, rowing, > 9km · h-1, vigorous effort 12.0 50 (11.9)Water activities Canoeing, rowing, for pleasure, general 3.5 15 (3.6)Water activities Canoeing, rowing, in competition, or crew or sculling 12.0 50 (11.9)Water activities Diving, springboard or platform 3.0 13 (3.1)Water activities Kayaking 5.0 21 (5.0)Water activities Paddleboat 4.0 17 (4.0)Water activities Sailing, boat and board sailing, wind-surfing, ice sailing, 3.0 13 (3.1)
generalWater activities Sailing, in competition 5.0 21 (5.0)Water activities Sailing, Sunfish/Laser/Hobby Cat, keel boats, ocean 3.0 13 (3.1)
sailing, yachtingWater activities Skiing, water 6.0 25 (5.9)Water activities Skindiving or scuba diving as frogman 12.0 50 (11.9)Water activities Skindiving, fast 16.0 67 (15.9)Water activities Skindiving, moderate 12.5 52 (12.4)Water activities Skindiving, scuba diving, general 7.0 29 (6.9)Water activities Snorkeling 5.0 21 (5.0)Water activities Surfing, body or board 3.0 13 (3.1)Water activities Swimming laps, freestyle, fast, vigorous effort 10.0 42 (10.0)Water activities Swimming laps, freestyle, slow, moderate or light effort 8.0 33 (7.8)Water activities Swimming, backstroke, general 8.0 33 (7.8)Water activities Swimming, breaststroke, general 10.0 42 (10.0)Water activities Swimming, butterfly, general 11.0 46 (10.9)Water activities Swimming, crawl, fast (75m · min-1), vigorous effort 11.0 46 (10.9)Water activities Swimming, crawl, slow (50m · min-1), moderate or light 8.0 33 (7.8)
effortWater activities Swimming, lake, ocean, river 6.0 25 (5.9)Water activities Swimming, leisurely, not lap swimming, general 6.0 25 (5.9)Water activities Swimming, sidestroke, general 8.0 33 (7.8)Water activities Swimming, synchronized 8.0 33 (7.8)Water activities Swimming, treading water, fast, vigorous effort 10.0 42 (10.0)Water activities Swimming,treading water, moderate effort, general 4.0 17 (4.0)Water activities Swimming, underwater, 1.5km · h-1 7.0 29 (6.9)Water activities Water polo 10.0 42 (10.0)Water activities Water volleyball 3.0 13 (3.1)Water activities Whitewater rafting, kayaking, or canoeing, non- 5.0 21 (5.0)
competitiveWinter activities Moving ice house (set up/drill holes, etc.) 6.0 25 (5.9)Winter activities Skating, ice, 15km · h-1 or less 5.5 23 (5.5)Winter activities Skating, ice, general 7.0 29 (6.9)Winter activities Skating, ice, rapidly, more than 9km · h-1 9.0 38 (9.0)Winter activities Skating, speed, competitive 15.0 63 (15.0)Winter activities Skating, figure 9.0 38 (9.0)Winter activities Ski jumping (climbing up carrying skis) 7.0 29 (6.9)Winter activities Skiing, general 7.0 29 (6.9)
energy costs of exercise 71

kJ ·h-1 ·kg-1
(kcal ·h-1 ·kg-1)Activity category Specific activity METs body wt
Winter activities Skiing, cross-country, 4km · h-1, slow or light effort, ski 7.0 29 (6.9)walking
Winter activities Skiing, cross-country, 6–8km · h-1, moderate speed and 8.0 33 (7.8)effort, general
Winter activities Skiing, cross-country, 8.1–13km · h-1, brisk speed, vigorous 9.0 38 (9.0)effort
Winter activities Skiing, cross-country, 13km · h-1, racing 14.0 59 (14.0)Winter activities Skiing, cross-country, hard snow, uphill, maximum effort 16.5 69 (16.4)Winter activities Skiing, downhill, light effort 5.0 21 (5.0)Winter activities Skiing, downhill, moderate effort, general 6.0 25 (5.9)Winter activities Skiing, downhill, vigorous effort, racing 8.0 33 (7.8)Winter activities Sledding, tobogganing, bobsledding, luge 7.0 29 (6.9)Winter activities Snow shoeing 8.0 33 (7.8)Winter activities Snowmobiling 3.5 15 (3.6)
72 nutrition and exercise

Introduction
Dietary carbohydrates (CHOs) provide the majorenergy source in the diets of most people andinclude a range of compounds which share thecommon basic elements of carbon, hydrogen andoxygen, and an empirical formula of (CH2O)n.CHOs occurring naturally in foods, or morerecently, manufactured by special chemical tech-niques and added during food processing, aregenerally classified according to their chemicalstructure. However, this system does not accountfor the variety and overlap of functional, meta-bolic and nutritional characteristics of ‘CHOfoods’. This chapter will describe briefly thetypes of CHOs in our diets, and then focus on thefeatures of CHO-rich foods that may be of inter-est to athletes and physically active people, justi-fying the recommendations of many expertnutrition bodies that we should further increaseour dietary CHO intake.
Structural classification of CHOs
Carbohydrates are classified according to thedegree of polymerization, or number of saccha-ride units, in the CHO molecule. Table 5.1 liststhe various saccharide categories along withexamples of commonly consumed CHOs. Themain monosaccharides, glucose and fructose, arepresent in fruits and vegetables, while fructose isnow provided in processed foods in increasingamounts due to the use of high-fructose sweet-eners derived from the chemical treatment of
corn starch. Sucrose is generally the most abun-dant disaccharide in Westernized diets, withfoods providing naturally occurring and/oradded sources of this sugar, while lactose is pro-vided primarily by dairy foods such as milk,yoghurt and ice cream. Oligosaccharides makeup only a small amount of dietary CHO intake;for example, raffinose, stachyose and verbascoseare unusual CHOs found in legumes, while fructo-oligosaccharides appear in other vegeta-bles. Glucose polymers, short chains of 3–15glucose units commercially produced by thechemical or enzymatic breakdown of starch,have found a small dietary niche in processedfoods, including sports foods such as sportsdrinks.
Starch is quantitatively the most importantfood CHO, and may occur as amylose in whichthe saccharide linkages are almost entirelystraight a-1,4 or linear bonds, or as amylopectinin which a mixture of a-1,4 and a-1,6 bonds givesa highly branched structure. Starch is the plantstorage CHO, and is found predominantly ingrains, legumes and some vegetables and fruit.The non-starch polysaccharides (NSPs) includestructural cell wall components (hemicelluloseand cellulose, and pectins) as well as storagepolysaccharides, gums and mucilages. TheseNSPs share the characteristic of being largelyundigested in the small intestine, and togetherwith lignin comprise ‘dietary fibre’. For furtherreview, see Asp (1995).
Chapter 5
Dietary Carbohydrates
LOUISE M. BURKE
73
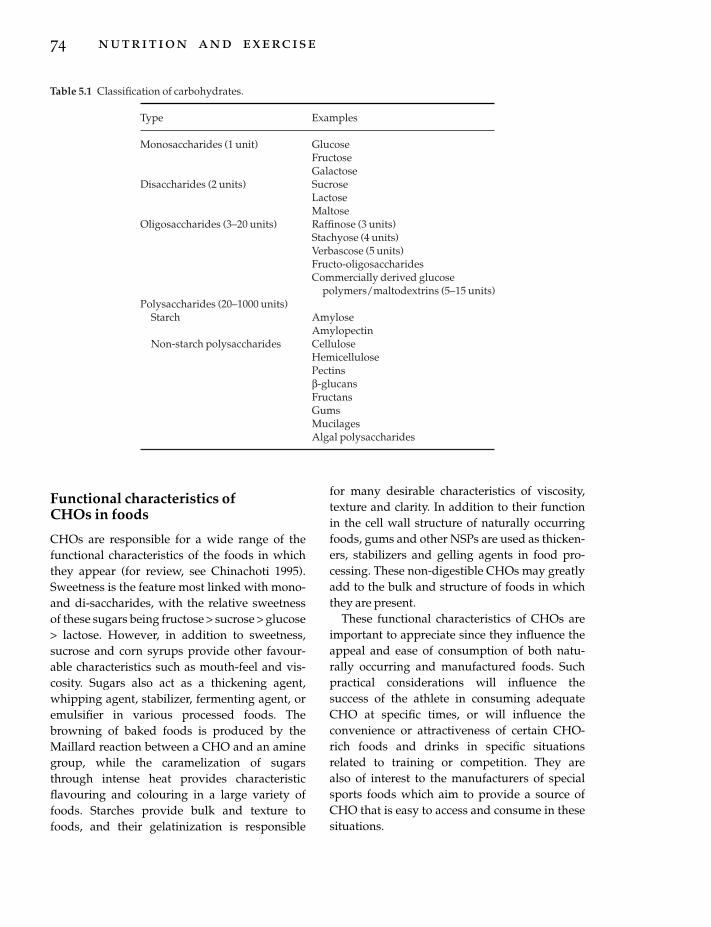
Functional characteristics of CHOs in foods
CHOs are responsible for a wide range of thefunctional characteristics of the foods in whichthey appear (for review, see Chinachoti 1995).Sweetness is the feature most linked with mono-and di-saccharides, with the relative sweetnessof these sugars being fructose > sucrose > glucose> lactose. However, in addition to sweetness,sucrose and corn syrups provide other favour-able characteristics such as mouth-feel and vis-cosity. Sugars also act as a thickening agent,whipping agent, stabilizer, fermenting agent, oremulsifier in various processed foods. Thebrowning of baked foods is produced by theMaillard reaction between a CHO and an aminegroup, while the caramelization of sugarsthrough intense heat provides characteristicflavouring and colouring in a large variety offoods. Starches provide bulk and texture tofoods, and their gelatinization is responsible
74 nutrition and exercise
for many desirable characteristics of viscosity,texture and clarity. In addition to their functionin the cell wall structure of naturally occurringfoods, gums and other NSPs are used as thicken-ers, stabilizers and gelling agents in food pro-cessing. These non-digestible CHOs may greatlyadd to the bulk and structure of foods in whichthey are present.
These functional characteristics of CHOs areimportant to appreciate since they influence theappeal and ease of consumption of both natu-rally occurring and manufactured foods. Suchpractical considerations will influence thesuccess of the athlete in consuming adequateCHO at specific times, or will influence the convenience or attractiveness of certain CHO-rich foods and drinks in specific situationsrelated to training or competition. They are also of interest to the manufacturers of specialsports foods which aim to provide a source ofCHO that is easy to access and consume in thesesituations.
Table 5.1 Classification of carbohydrates.
Type Examples
Monosaccharides (1 unit) GlucoseFructoseGalactose
Disaccharides (2 units) SucroseLactoseMaltose
Oligosaccharides (3–20 units) Raffinose (3 units)Stachyose (4 units)Verbascose (5 units)Fructo-oligosaccharidesCommercially derived glucose
polymers/maltodextrins (5–15 units)Polysaccharides (20–1000 units)
Starch AmyloseAmylopectin
Non-starch polysaccharides CelluloseHemicellulosePectinsb-glucansFructansGumsMucilagesAlgal polysaccharides

Limitations of the ‘simple’ vs.‘complex’ classification of CHO foods
Traditionally, foods containing significantamounts of CHOs have been categorized accord-ing to the structural classification of the princi-pally occurring CHO. This has led to a simplisticdivision of CHO-containing foods into ‘simple’CHOs (containing mono-, di- and oligo-saccharides) or ‘complex’ CHOs (containingpolysaccharides). A variety of beliefs about themetabolic and nutritional characteristics of CHOfoods have been apportioned to these categories:1 ‘Simple’ CHO foods cause large and rapidexcursions of blood glucose levels on ingestion (arapid rise followed by a rapid and often greaterfall). They are prized for their sweetness but aregenerally not nutritious. ‘Simple’ CHOs are com-pletely digested and are a cause of dental caries.2 ‘Complex’ CHO foods are nutritious foodswhich contain significant amounts of other nutri-ents, including dietary fibre. The digestion andabsorption of complex CHO foods are completebut slower, producing a flatter and more sus-tained blood glucose and insulin response totheir ingestion. 3 Dietary fibre is an inert substance found innutritious or complex CHO foods. It is undi-gested, and plays a major role in maintainingbowel function and regularity.
While this classification system may have beendeveloped as a simple nutrition education toolfor the lay person, it encompasses many erro-neous beliefs which have, in fact, confused bothnutrition science and practice. Such misconcep-tions have spilled over into the area of sportsnutrition.
An oversimplification which underpins manyof these misconceptions is the labelling of foodsaccording to a significant nutrient in their com-position. To describe bananas, bread or lasagneas ‘CHO foods’ is to undervalue the complexnature of foods and the cocktail of chemicals ofwhich each is composed. Most naturally occur-ring foods contain a mixture of CHO types, oftenof both simple and complex structure, as well asother macro- and micronutrients, and a large
array of non-nutrient chemicals. This mixture iseven more intricate in the case of processedfoods, and composite foods and dishes (e.g. lasagne, pizza). Therefore it is preferable to use a description such as ‘CHO-rich’ or ‘CHO-containing’, which better recognizes the hetero-geneity of characteristics of each food, and thepresence of other nutrients. As shown in Table5.2, many CHO-rich foods containing mostlysimple CHOs are also good sources of protein,fibre and micronutrients, and conform to dietaryguidelines that promote moderation of the intakeof fats and oils. On the other hand, there are anumber of examples of CHO-rich foods contain-ing mostly complex CHOs which have low nutri-ent density and/or a high fat content, and mightbe considered less ‘nutritious’. Clearly, a judge-ment of the nutritional value of a food based onthe structural nature of its CHOs is invalid, and isfurther confused by the occurrence of foods thatcontain significant amounts of both simple andcomplex CHO types (Table 5.2).
Notwithstanding this difficulty of dividingfoods cleanly into two categories, there is littlecorrelation between the structural type of CHOsin foods and their actual effect on blood glucoseand insulin levels. Data collected since the 1970shave shown overwhelmingly that postprandialresponses to various CHO-rich foods vary fromthat predicted by the simple vs. complex CHOmodel. Several CHO-rich foods containing pre-dominantly sugars (e.g. fruit and sweeteneddairy products) produce a flattened bloodglucose curve when ingested, while other foodshigh in complex carbohydrates (e.g. bread andpotatoes) produce a high blood glucoseresponse, similar to that following the ingestionof glucose itself. Furthermore, the presence ofdietary fibre in foods does not always seem todelay absorption and flatten the postprandialblood glucose curve; blood glucose responses towholemeal bread are similar to those followingthe consumption of white bread.
The availability of carbohydrate types mustalso be readdressed. A number of simple CHOsare not well digested and absorbed by all people;lactose is poorly digested by a small percentage
dietary carbohydrates 75

of Western populations and the majority of Asianand native populations (e.g. Australian aborigi-nals) due to a deficiency of the enzyme lactase,whereas fructose is best absorbed in the presenceof other carbohydrates in the intestine, and ispoorly absorbed when consumed in largeamounts on its own (for review, see Gudmand-Hoyer 1994; Southgate 1995). The incompletedigestion of starch is now also recognized. Theterm resistant starch has been coined to describestarch fractions in food that pass undigested intothe large bowel. These include particles that are indigestible due to lack of physical contactwith digestive enzymes (such as only partiallychewed or milled grains and legumes, or wholeseeds), or starch found in ungelatinized granulessuch as in raw bananas, uncooked potatoes, or
76 nutrition and exercise
high amylose-content cereals. Finally, somestarch is made resistant by cooking or process-ing. Foods that have been baked at high tempera-tures (e.g. bread, cornflakes), or cooled afterbeing cooked to make the starch soluble or gela-tinized (e.g. cold baked potato) may contain sig-nificant amounts of starch that has retrograded(had the water-bound structure disturbed). Forreview, see Englyst et al. (1992). There is an argu-ment to include resistant starch as a componentof dietary fibre.
In any case, the view of dietary fibre needs tobe updated to recognize it as a group of diversecompounds which are far from inert. Althoughthey may be undigested in the small intestine,many are fermented by bacteria in the largebowel and may provide a number of their health
Table 5.2 Examples of the overlap between the nutritional and structural classification of CHO-rich foods.
‘Nutritious’* ‘Less nutritious’
‘Simple’ CHO-rich foods Fruit Sugar (sucrose)Fruit juice Honey, jam, syrupsCanned fruit Soft drinks, flavoured mineralDried fruit waterFlavoured milk, yoghurt and other Sports drinks
sweetened dairy foods (especially ‘Carbohydrate loading’low-fat types) supplements
Liquid meal supplements Sweets, chocolatesSome sports bars Jelly, mousses and high-fat
dessertsIce cream
‘Complex’ CHO-rich foods Bread, muffins, bagels PastryBreakfast cereals Potato crispsPasta and noodles Chips/friesRice and other grains CroissantsStarchy vegetables (e.g. potatoes, corn)Legumes and pulsesPizza bases
CHO-rich foods with mixture Low-fat cake and dessert recipes High-fat cakes, pastries, biscuits,of ‘simple’ and ‘complex’ Sweetened and fruit-containing dessertsCHOs breakfast cereal Granola/muesli bars
Baked beans Some sports barsSome fruits and vegetables (e.g.
bananas, pumpkin)Some sports bars
* In this chapter, ‘nutritious’ foods are defined as those providing significant amounts of protein and macronutri-ents, and contributing less than 30% of energy from fat. ‘Less nutritious’ foods are those providing insignificantamounts of other nutrients, and/or having a fat content of more than 30% of total energy.

benefits via this process and the subsequentrelease of short chain fatty acids. While somecomponents of dietary fibre are responsible foradding faecal bulk and enhancing regularity,various types of dietary fibre offer other appar-ent health benefits related to glycaemic control,lipid metabolism, weight control and reducedrisk of colonic cancer (for review, see Baghurstet al. 1996).
Finally, the issue of dental caries is alsocomplex and cannot be entirely explained by theconsumption of sucrose and foods rich in simpleCHOs. Starch also provides a source of fer-mentable CHO for the development of caries,and the frequency of intake of CHOs and thephysical form of the CHO food/drink whichdetermines the length of time of adhesion to theteeth are important factors in the aetiology ofdental decay. Other aetiological factors includefluoride, oral hygiene practices and salivary flow(for review, see Navia 1994).
Glycaemic index
In recognition of the lack of uniformity and theinability to predict blood glucose responses tothe consumption of various CHO-rich foods, theconcept of the glycaemic index was introducedby Jenkins in the early 1980s (Jenkins et al. 1981).The glycaemic index is a ranking of foods basedon their actual postprandial blood glucoseresponse compared to a reference food, eitherglucose or white bread. The glycaemic index iscalculated by measuring the incremental areaunder the blood glucose curve following theingestion of a portion of the test food providing50g of CHO, compared with the area under theblood glucose curve following an equal CHOintake from the reference food, with all testsbeing conducted after an overnight fast. Tables ofthe measured glycaemic index of various CHO-rich foods have now been published interna-tionally (Foster-Powell & Brand-Miller 1995).Thorough research in this area has shown thatthe glycaemic index has acceptable reproducibil-ity within and between individuals and can beapplied to a mixed meal containing CHO-rich
foods (for reviews, see Wolever 1990; Truswell1992).
Many factors influence the glycaemic index ofCHO-rich foods including the food form (e.g.particle size due to degree of milling or process-ing, texture and viscosity including the presenceof soluble fibres) and the degree of food process-ing and cooking (e.g. degree of gelatinization orretrograding of starch, disruption to the cellstructure). The presence of fructose or lactose,and the ratio of amylopectin to amylose in starch are important, as are the presence ofstarch–protein or starch–fat interactions, or com-pounds known as ‘antinutrients’ (e.g. phytates,lectins). Finally, even the ripeness of some fruitssuch as bananas (i.e. degree of conversion ofstarches to sugars) may affect their glycaemicindex (see Wolever 1990).
Table 5.3 summarizes the glycaemic index ofsome common CHO-rich foods, and illustratesthe impossibility of predicting the glycaemicindex of a food based simply on its composition.The glycaemic index concept has been used tomanipulate the glucose and insulin response todiets of equal CHO content; lowering the gly-caemic index has been shown to improve themetabolic profiles of individuals with diabetesand hyperlipidaemia (Wolever et al. 1991) and toincrease postmeal satiety (Holt et al. 1992). Thusthe glycaemic index has gained recognition as auseful education tool in the management of dia-betes and hyperlipidaemias.
More recently, it has been suggested that themanipulation of the glycaemic index of meals orthe diet may have application in the area ofsports nutrition to optimize CHO availability forexercise; high glycaemic index CHO-rich mealshave been reported to enhance the storage ofmuscle glycogen during recovery from pro-longed exercise compared with CHO-rich foodsof low glycaemic index (Burke et al. 1993). CHO-rich drinks or foods with moderate to high gly-caemic index have been suggested as the mostappropriate source of CHO intake during pro-longed exercise (Coyle 1991); whereas there hasbeen some publicity (Thomas et al. 1991), but notuniversal agreement (Febbraio & Stewart 1996),
dietary carbohydrates 77

that the intake of a pre-exercise meal composedof low glycaemic index CHO-rich foods mayenhance endurance or performance during suchexercise events. Clearly, the use of the glycaemic
78 nutrition and exercise
index may have implications for the athlete anddeserves further attention. However, it is notintended to provide a universal system to rankthe virtues of CHO-rich foods. There are anumber of other attributes of foods which maybe of value to the athlete; these are often specificto the individual and the exercise situation.
Other valuable characteristics ofCHO-rich foods for athletes
Nutrient density and alignment with goals ofhealthy eating
The guidelines for healthy eating, and for ath-letes in particular, recommend that CHO andCHO-rich foods should provide the majority ofdietary energy. However, for optimal health andperformance, athletes must also achieve theirrequirements for protein and micronutrients,including any increase in requirement that mayresult from a heavy exercise programme (seeChapters 10, 21, 23–25). Thus, CHO-rich foodswhich also provide significant sources of othernutrients are of value in allowing the athlete tomeet a number of nutritional goals simultane-ously. This is an important consideration in theeveryday or training diet of the athlete, particu-larly for those individuals with very high carbo-hydrate needs and/or restricted energy intake.In other words, as CHO increases its importancein the total food base, particularly a food base ofsmall size, so should there be an increase in thefocus on nutrient-dense types of CHO-richfoods.
Many CHO-rich foods provide valuableamounts of other nutrients, or at least can be con-structed into a nutritious CHO-rich meal usingtypical food combinations. Breads, rice, pasta,breakfast cereals and other grain-based foodsprovide significant amounts of B vitamins andsmaller amounts of some minerals, especially incases such as breakfast cereals where fortificationhas occurred. Legumes, pulses and soya prod-ucts are also valuable sources of these nutrients.Protein provided by legumes and grain foods issignificant, even in a non-vegetarian diet, with
Table 5.3 Examples of the glycaemic index (GI) ofCHO-rich foods.
Food GI
High GI (> 70) Glucose 100Cornflakes 84Cocopops 77Instant mashed potato 83Baked potato 85Sports drink 95Jelly beans 80White bread 70Weetbix 70Watermelon 72Honey 73
Moderate GI Wholemeal bread 69(55–70) One-minute oats 66
Muesli flake cereal 68Muffins (cake style) 62Soft drink 68Brown/white rice 59Arrowroot biscuit 66Ice-cream 61Mangoes 55Orange juice 57Sucrose 65
Low GI (< 55) Ripe banana 52Porridge 49Mixed grain bread 45All Bran 42Parboiled rice 47Milk 27Flavoured yoghurt 33Chocolate 49Unripe banana 30Apple 36Orange 43Pasta 41Baked beans 40Kidney beans 27Red lentils 26Fructose 20
GI has been based on glucose as a reference food.Where white bread is used as a reference food, GIvalues are higher by approximately 1.4. See Foster-Powell & Brand-Miller (1995).

complementation of amino acids occurring viaother foods eaten over the day. Fruits and vegeta-bles provide fair to excellent sources of b-carotenes, some B vitamins and ascorbic acid, inaddition to other non-nutrient chemicals thatmay confer health advantages. Legumes andsoya products also provide such phytochemicals.Sweetened dairy foods (e.g. flavoured yoghurtsand milk drinks) provide an excellent source ofcalcium, protein and riboflavin. The potential fornutritional value increases in the case of compos-ite dishes and food combinations; for example,milk eaten with breakfast cereal, fillings added tosandwiches and rolls, or the toppings and saucesadded to rice, pasta or pizza can all optimize thenutrient profile of CHO-rich meals. Specialsports foods which are nutrient-rich includeliquid meal supplements and some (fortified)sports bars.
Most naturally occurring CHO-rich foods arelow in fat, in keeping with general health guide-lines. However, the athlete may also find low-fatand reduced fat options among processed CHO-rich foods or dishes, ranging from low-fat sweet-ened dairy products to special recipes for bakeryproducts and composite dishes with minimaladded fats/oils. Moderation of fat intake will bean important strategy for athletes who havelimited energy budgets; for example, athletestrying to achieve or maintain a lower body fat level, or athletes in aesthetic/skill-basedsports such as gymnastics and figure skatingwho must remain small and lean without thecontribution of a high-energy expenditure train-ing programme.
Practical issues
The athlete is often encouraged to eat CHO atspecial times, or in quantities greater than thatwhich would be provided in an everyday diet ordictated by their appetite and hunger. Therefore,CHO-rich foods and drinks that are appealing,available or able to be easily consumed will havevalue in helping the athlete to meet CHO intakerecommendations. Sweet-tasting foods anddrinks are generally appealing to people; indeed,
the flavour of a CHO-containing drink mayencourage greater intake of fluid during andafter exercise, thus promoting better hydration aswell as achieving CHO intake goals at thesetimes. Sports drinks provide an example of afood that is tailor-made for athletes, providingCHO at a concentration suitable for optimaldelivery of both fluid and CHO during and afterexercise. The taste profile is manipulatedtowards preferences experienced while exercis-ing or dehydrated; excessive sweetness in theseproducts is avoided by using a mixture ofglucose polymers along with mono- and di-saccharides, with a little sodium being added toenhance the palatability. Sports bars are anotherconvenience food in a compact form that can beeasily carried and consumed ‘on the run’, eitherliterally during exercise, or as a general part of anathlete’s busy day. Other sports products, such ashigh CHO powders and drinks, CHO-rich gelsand nutrient-dense liquid meal supplements,also offer the advantages of compactness,minimal preparation and known CHO composi-tion. Since CHO intake guidelines may specify arecommended amount of CHO to be consumedin a given situation, foods of known or standard-ized CHO content such as these specializedsports products are often popular among ath-letes. However, food tables and ready reckonersof the CHO content of food can make everydayfoods more ‘user friendly’.
Compactness and ease of consumption arefood attributes that are important to an athletewith very high energy and CHO requirements,or in the choice of a pre-exercise or postexercisemeal. CHO-rich foods that are high in fibre, par-ticularly in combination with a high watercontent and an intact, rigid structure, are bulky;they involve greater volumes of food, longereating time, and greater stomach fullness toprovide a given amount of CHO (Table 5.4). Thismay prevent the athlete from reaching their CHOintake targets, or may be a cause of gastrointes-tinal discomfort, particularly during exercise.CHO-rich foods that are less fibrous, require lesschewing, or have a greater CHO (lower water)density, may be more practical when CHO has to
dietary carbohydrates 79

be consumed in large amounts. For example,‘white’ or refined bread and cereal products may be chosen over wholemeal products, andprocessed fruit and juices may be more easilyeaten than fresh fruit. Sugars, jams and syrupsmay be added to foods or meals to provide anadditional low-bulk CHO source, while confec-tionery items and CHO-rich drinks (e.g. fromsoft drinks to nutrient-rich milk shakes and fruitsmoothies) are also compact forms of dietaryCHO. In the postexercise situation, an athlete’sCHO intake may be challenged by fatigue andloss of appetite. CHO-containing drinks, orCHO-rich foods with fluid-like appearance (e.g.flavoured yoghurt and other sweetened dairyfoods) may have appeal to an athlete who isdehydrated. Food that can be presented in smallportions (e.g. sandwich fingers and fruit pieces)may encourage continued nibbling, and be moreattractive to an athlete with a depressed appetite,than large food volumes or whole foods with arigid structure. Conversely, for an athlete whoneeds to restrict energy intake, CHO-rich foodsproviding long eating times, large volume andstomach fullness, and high satiety value mayassist with this goal.
Finally, the athlete may be required to eat CHOin situations where access to food or facilities forfood preparation are poor. This may include the
80 nutrition and exercise
post-training or competition situation, or the‘grazing’ pattern of frequent intake during abusy day that is characteristic of athletes withhigh-energy intakes. Thus, CHO-rich foodswhich require minimal preparation, are portable,or have good storage properties may be of prac-tical value. These include naturally occurringfoods (e.g. fruit) as well as processed and conve-nience foods such as bars, confectionery items,bakery items and special sports foods.
Recommendations for CHO intake for athletes
Historically, population dietary guidelines haveconsidered CHO as an ‘energy filler’, making upenergy requirements after protein requirementshave been met and fat intake has been moder-ated. Population guidelines in Westernizedcountries generally recommend an increase inCHO intake, particularly from nutritious CHO-rich foods, to provide at least 50–55% of totaldietary energy (US Department of Agriculture1990; National Health and Medical ResearchCouncil 1992). This tradition of providing guide-lines as a percentage of dietary energy reflects thedesire to encourage a relative decrease in fatintake and increase in CHO intake across thevarious energy intakes of individuals in a popu-
Table 5.4 Practical characteristics of CHO-rich foods which may promote or deter their consumption.
Serve size for EnergyFood 100g CHO (MJ and kcal)
Water contentHigh Green beans 4500g (30 cups) 3.1MJ (740kcal)High Sports drink 1.4 l 1.6MJ (400kcal)Low Jelly beans 100g 1.6MJ (400kcal)
Fibre contentHigh Boiled brown rice 310g (2 cups) 1.9MJ (450kcal)Low Boiled white rice 310g (2 cups) 1.9MK (450kcal)
Fat contentHigh Croissants 290g (4–5) 4.6MJ (1100kcal)Low Bread rolls 210g (2–3) 2.2MJ (530kcal)
CHO-rich drinks can be consumed in large amounts since they are rapidly emptied and absorbed, and contribute tofluid requirements. However, CHO-rich foods with a high water content particularly in a high-fibre matrix, requirechewing and a large volume to provide similar amounts of CHO. Even in low-water-content foods a high-fibrecontent can limit intake by increasing the time needed to chew and eat them, and by increasing gastric fullness.High-fat CHO-rich foods may not be suitable for athletes with restricted energy intakes.

lation. However, recent research into CHO andfibre has suggested that CHO intake recommen-dations might be made on their own accord. Ath-letes are one group who merit specific CHOintake goals, in order to meet the fuel needs oftraining, competition and recovery (see Chapters7 and 8) including the following.1 To maximize muscle glycogen recovery afterexercise to enhance daily training, or to ‘load’ themuscle with glycogen before a prolonged exer-cise competition, the athlete should consume adiet providing 7–10g CHO per kilogram of bodymass (BM) per 24 h (see Chapter 7).2 To enhance early recovery after exercise, theathlete should consume at least 1g CHO ·kg–1
BM within 30min after the session is completed(see Chapter 7).3 To enhance fuel availability for a prolongedexercise session (particularly competition), theathlete should consume a CHO-rich meal pro-viding 1–4g CHO · kg–1 BM during the 1–4 hbefore the session (see Chapter 7).4 To provide an additional source of CHOduring prolonged moderate and high intensityevents, the athlete should consume 30–60g CHO· h–1 during exercise (see Chapter 8).
These guidelines are generally directedtowards athletes undertaking endurance exer-cise, and need to be modified according to theindividual needs of the athlete and their sport.
Since athletes may range considerably in bodysize (e.g. from a 35-kg gymnast to a 130-kg rugbyplayer), it is convenient to provide CHO intakeguidelines on the basis of BM and allow these tobe scaled accordingly. It has been relatively easyto develop and validate the benefits of guidelinesaddressing acute intake of CHO; for example, alarge number of studies have shown that theingestion of CHO during prolonged moderate-to high-intensity exercise enhances enduranceand performance (see Chapter 8), and musclebiopsy studies have determined the rate ofmuscle glycogen storage following variousamounts and types of CHO intake (see Chapter7).
The development of CHO intake guidelinesfor the everyday diet of the athlete has been moreproblematic. This is partly due to terminology,and partly due to the failure of studies to provideunequivocal evidence to support the recommen-dations. Population dietary guidelines recom-mending a CHO intake of at least 50–55% of totalenergy are appropriate to address the healthneeds and fuel requirements of athletes under-taking a moderate training load. However, theCHO needs of athletes with a heavy training orcompetition schedule have been a recent sourceof conflict. Firstly, some authorities have sug-gested that athletes undertaking prolonged dailyexercise sessions should increase CHO intakes to
dietary carbohydrates 81
Fig. 5.1 Athletes making foodchoices may need guidance toensure that dietary goals are met.Photo courtesy of RaymondBesant.

65–70% of dietary energy (American DieteticAssociation 1993). However, the rigid interpreta-tion of this guideline may prove unnecessary andunfeasible for some athletes. Athletes with veryhigh energy intakes (e.g. >16–20 MJ · day–1 or>4000–5000 kcal ·day–1) will achieve absolutecarbohydrates of over 700–800g CHO · day–1
with such a dietary prescription. This mayexceed their combined requirement for dailyglycogen storage and training fuel and, further-more, be bulky to consume. Athletes with suchhigh energy intakes may be able to meet theirdaily needs for glycogen recovery with a diet of50–60% of energy. Therefore, it is preferable toprovide CHO intake recommendations in grams(relative to the BM of the athlete) and allow flexi-bility for the athlete to meet their requirements
82 nutrition and exercise
within the context of their energy needs andother dietary goals. Some athletes, principallyfemales, appear to have lower energy intakesthan might be expected. These athletes may needto devote a greater proportion of their dietaryintake (e.g. up to 65–70% of energy) to CHOintake, and even then may fail to meet theabsolute CHO intakes suggested for optimaldaily glycogen recovery (for review, see Burke1995).
The most interesting point of debate aboutcurrent CHO intake recommendations, however,lies with the failure of longitudinal studies toshow clear-cut benefits to training adaptationand performance with high CHO intakes com-pared to moderate CHO diets (Table 5.5).Although studies show that higher CHO intakes,
Table 5.5 Longitudinal studies comparing high CHO intakes (HCHO) and moderate CHO intakes (MCHO) on thetraining adaptation and performance of athletes in intensive training.
Duration Daily CHOof study intake*
Reference Athletes (days) (g · kg-1 BM) Muscle glycogen Effects on performance
Costill Swimmers 10 8.2 vs. 5.3 Declined in MCHO, Training performance et al. 1988 maintained in HCHO impaired in MCHO group,
but swim trials unchanged
Kirwan Runners 5 8.0 vs. 3.9 Declined in both Reduction in running et al. 1988 groups, but greater economy and increase in
reductions in MCHO perception of effortduring training sessions in MCHO
Lamb et al. Swimmers 9 12.1 vs. 6.5 NA No difference in 1990 performance of interval
training
Simonsen Rowers 28 10 vs. 5 Maintained in MCHO, Power output maintained et al. 1991 increased in HCHO during ergometer trials in
MCHO; trend toward small improvement at end of study in HCHO
Sherman Runners 7 10 vs. 5 Declined in MCHO, No impairment of high- et al. 1993 maintained in HCHO intensity run to exhaustion
in either group
Sherman Cyclists 7 10 vs. 5 Declined in MCHO, No impairment of high- et al. 1993 maintained in HCHO intensity cycle to
exhaustion in either group
BM, body mass; NA, not available.*High intake vs. moderate intake of CHO compared in each study.

consistent with the guidelines above, allowbetter recovery/maintenance of muscle glyco-gen levels during periods of heavy training, theredoes not appear to be consistent and significantenhancement of performance in the high CHOgroup at the end of the study period, nor impair-ment of performance in the moderate CHOgroup (for review, see Sherman & Wimer 1991;Sherman et al. 1993). It has been suggested thatathletes may adapt to the lower CHO intake andmuscle glycogen depletion. However, it is alsopossible that the protocols used to measure per-formance in these studies were not sufficientlysensitive to detect the differences between thegroups, that the studies were not conducted oversufficiently long periods to elicit clear differencesin performance, and that the area is confused bysome overlap between what is considered ‘mod-erate’ and ‘high’ CHO intakes (Sherman et al.1993). In any case, there is clear proof fromstudies of acute dietary manipulation thatendurance and performance are enhanced whenbody CHO stores are optimized, and that carbo-hydrate depletion causes an impairment of per-formance (see Chapters 6–8). Furthermore, thereis anecdotal evidence, including comments fromthe studies above, that athletes complain of‘tiredness’ and ‘muscle fatigue’ during trainingwhen dietary carbohydrate is insufficient. There-fore, the recommendation that athletes shouldconsume a high CHO diet to cover the fuel cost of their training loads and recovery remainsprudent, and further long-term studies areawaited to adequately test the benefit of thisstrategy.
Conclusion
Dietary CHO is provided by a wide variety ofCHO-rich foods and drinks. There is no univer-sal system that can adequately describe thediverse metabolic, functional and nutritional fea-tures of these various foods. Dietary guidelinesfor athletes make recommendations for every-day intake of CHO as well as CHO intake for spe-cific situations pre, during and postexercisesessions. Athletes are encouraged to meet these
guidelines by choosing CHO-rich foods anddrinks that offer appropriate characteristics suchas nutrient-density, desirable glycaemic index,appeal and practicality according to the require-ments of the situation.
References
American Dietetic Association and Canadian DieteticAssociation (1993) Position stand on nutrition forphysical fitness and athletic performance for adults.Journal of the American Dietetic Association 93, 691–696.
Asp, N.G.L. (1995) Classification and methodology offood carbohydrates as related to nutritional effects.American Journal of Clinical Nutrition 61 (Suppl.),930S–937S.
Baghurst, P.A., Baghurst, K.I. & Record, S.J. (1996)Dietary fibre, non-starch polysaccharides and resis-tant starch: a review. Food Australia 48 (Suppl.),S1–S36.
Burke, L.M. (1995) Nutrition for the female athlete. InNutrition in Women’s Health (ed. D. Krummel & P.Kris-Etherton), pp. 263–298. Aspen Publishers,Gaithersburg, MD.
Burke, L.M., Collier, G.R. & Hargreaves, M. (1993)Muscle glycogen storage after prolonged exercise:effect of the glycemic index of carbohydrate feed-ings. Journal of Applied Physiology 75, 1019–1023.
Chinachoti, P. (1995) Carbohydrates: functionality infoods. American Journal of Clinical Nutrition 61(Suppl.), 922S–929S.
Costill, D.L., Flynn, M.G., Kirwan, J.P. et al. (1988)Effects of repeated days of intensified training onmuscle glycogen and swimming performance. Medicine and Science in Sports and Exercise 20, 249–254.
Coyle, E.F. (1991) Timing and method of increased car-bohydrate intake to cope with heavy training, com-petition and recovery. Journal of Sports Science 9(Suppl.), 29–52.
Englyst, H.N., Kingman, S.M. & Cummings, J.H. (1992)Classifications and measurement of nutritionallyimportant starch fractions. European Journal of Clinical Nutrition 46 (Suppl. 2), S33–S50.
Febbraio, M.A. & Stewart, K.L. (1996) CHO feedingbefore prolonged exercise: effect of glycemic indexon muscle glycogenolysis and exercise performance.Journal of Applied Physiology 81, 1115–1120.
Foster-Powell, K. & Brand-Miller, J. (1995) Interna-tional tables of glycemic index. American Journal ofClinical Nutrition 62 (Suppl.), 871S–893S.
Gudmand-Hoyer, E. (1994) The clinical significance ofdisaccharide maldigestion. American Journal of Clini-cal Nutrition 59 (Suppl.), 735S–741S.
dietary carbohydrates 83

Holt, S., Brand, J., Soveny, C. & Hansky, J. (1992) Rela-tionship of satiety to postprandial glycaemic, insulinand cholecystokinin responses. Appetite 18, 129–141.
Jenkins, D.J.A., Wolever, T.M.S., Taylor, R.H. et al. (1981)Glycemic index of foods: a physiological basis forcarbohydrate exchange. American Journal of ClinicalNutrition 34, 362–366.
Kirwan, J.P., Costill, D.L., Mitchell, J.B. et al. (1988) Car-bohydrate balance in competitive runners duringsuccessive days of intense training. Journal of AppliedPhysiology 65, 2601–2606.
Lamb, D.R., Rinehardt, K.R., Bartels, R.L., Sherman,W.M. & Snook, J.T. (1990) Dietary carbohydrate andintensity of interval swim training. American Journalof Clinical Nutrition 52, 1058–1063.
National Health and Medical Research Council (1992)Dietary Guidelines for Australians. Australian Govern-ment Publishing Service, Canberra.
Navia, J.M. (1994) Carbohydrates and dental health.American Journal of Clinical Nutrition 59 (Suppl.),719S–727S.
Sherman, W.M. & Wimer, G.S. (1991) Insufficientdietary carbohydrate during training: does it impairathletic performance? International Journal of SportNutrition 1, 28–44.
Sherman, W.M., Doyle, J.A., Lamb, D. & Strauss, H.(1993) Dietary carbohydrate, muscle glycogen, and
84 nutrition and exercise
exercise performance during 7 d of training. American Journal of Clinical Nutrition 57, 27–31.
Simonsen, J.C., Sherman, W.M., Lamb, D.R., Dernbach,A.R., Doyle, J.A. & Strauss, R. (1991) Dietary carbo-hydrate, muscle glycogen and power output duringrowing training. Journal of Applied Physiology 70,1500–1505.
Southgate, D.A.T. (1995) Digestion and metabolism ofsugars. American Journal of Clinical Nutrition 62(Suppl.), 203S–211S.
Thomas, D.E., Brotherhood, J.R. & Brand, J.C. (1991)Carbohydrate feeding before exercise: effect ofglycemic index. International Journal of Sports Medicine 12, 180–186.
Truswell, A.S. (1992) Glycaemic index of foods. European Journal of Clinical Nutrition 46 (Suppl. 2),S91–S101.
US Department of Agriculture and Health and HumanServices (1990) Dietary Guidelines for Americans.Home and Garden Bulletin no. 232. United StatesDepartment of Agriculture and Health and HumanServices, Washington, DC.
Wolever, T.M.S. (1990) The glycemic index. WorldReview of Nutrition and Dietetics 62, 120–185.
Wolever, T.M., Jenkins, D.J., Jenkins, A.L. & Josse, R.G.(1991) The glycemic index: methodology and clinicalimplications. American Journal of Clinical Nutrition 54,846–854.
Introduction
During exercise, the energy demands of musclecontraction will fluctuate enormously. Formuscle contraction to occur, chemical energystored in the form of adenosine triphosphate(ATP) must be converted into mechanical energyat rates appropriate to the needs of the muscle.However, the muscle store of ATP is relativelysmall and therefore for exercise to continuebeyond a few seconds ATP must be resynthe-sized from phosphocreatine, carbohydrate andfat. It is generally accepted that carbohydrate isthe major substrate for ATP resynthesis duringintense exercise. The carbohydrate stores of thebody are principally located in skeletal muscleand liver, with small amounts also being foundin the form of circulating glucose. The amount of energy stored as glycogen amounts to ap-proximately 6000 kJ (1430 kcal) and 1500 kJ (360 kcal) in muscle and liver, respectively, whichis very small compared with the body store of tri-acylglycerol (340 MJ, 81200kcal), the alternative fuel for ATP resynthesis. Triacylglycerol is thepreferred substrate for energy production inresting muscle and can cover the energydemands of exercise up to 50% of maximaloxygen consumption. At higher exercise inten-sities, the relative contribution of fat to totalenergy production falls and carbohydrate oxida-tion increases, such that carbohydrate is the sole fuel oxidized at the highest exercise intensi-ties. This is due to an increasing recruitment ofthe glycolytic type II muscle fibres and an activa-
tion of glycolytic enzymes when ATP turnoverrate is increased. The maximal rate of ATP pro-duction from lipid is lower than that of carbohy-drate. In addition, the ATP yield per mole ofoxygen utilized is lower for lipid compared withcarbohydrate. In contrast with lipid, carbohy-drate can be metabolized anaerobically via gly-colysis. The lactate accumulation that occursalmost instantaneously at the onset of contrac-tion demonstrates that the activation of thispathway is extremely rapid. It should be notedthat the anaerobic utilization of carbohydratewill be indispensable during the transition fromrest to steady-state exercise and during maximalexercise. Furthermore, the relatively small storeof body carbohydrate will limit exercise perfor-mance during prolonged intense exercise due tothe depletion of muscle and liver glycogenstores.
The body store and maximal rates of ATPresynthesis from phosphocreatine, carbohydrateand lipid are shown in Table 6.1.
Regulation of muscle carbohydrateutilization during exercise
Glycogenolysis is the hydrolysis of muscle glycogen to glucose-1-phosphate, which is transformed to glucose-6-phosphate via a phosphoglucomutase reaction. The glucose-6-phosphate formed, together with that derivedfrom the phosphorylation of blood glucose byhexokinase at the muscle cell membrane, entersthe glycolytic pathway which is a series of
Chapter 6
Carbohydrate Metabolism in Exercise
ERIC HULTMAN AND PAUL L. GREENHAFF
85
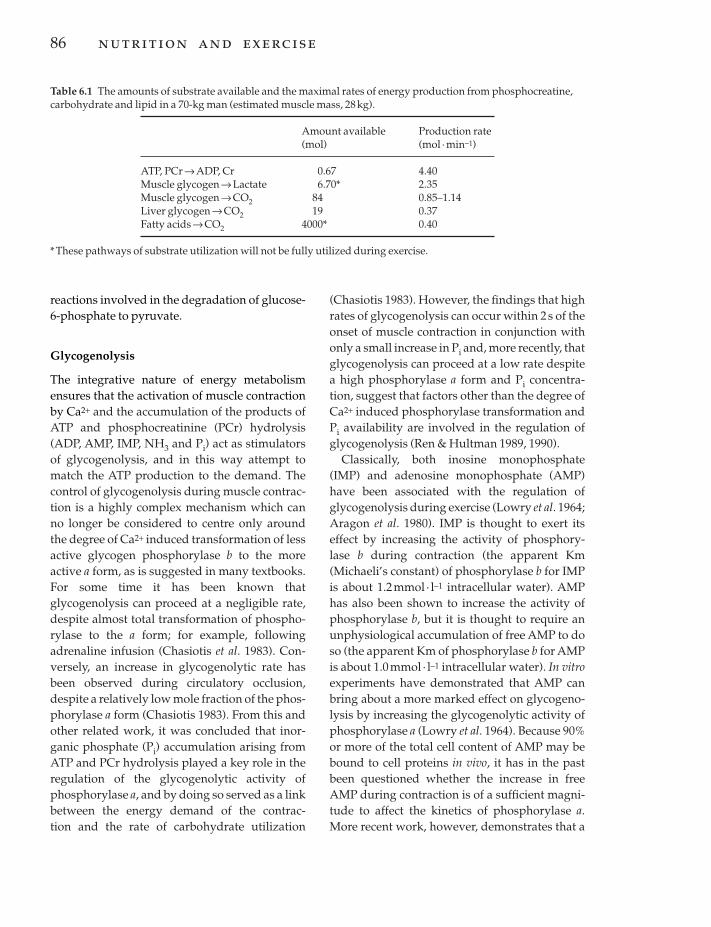
reactions involved in the degradation of glucose-6-phosphate to pyruvate.
Glycogenolysis
The integrative nature of energy metabolismensures that the activation of muscle contractionby Ca2+ and the accumulation of the products ofATP and phosphocreatinine (PCr) hydrolysis(ADP, AMP, IMP, NH3 and Pi) act as stimulatorsof glycogenolysis, and in this way attempt tomatch the ATP production to the demand. Thecontrol of glycogenolysis during muscle contrac-tion is a highly complex mechanism which canno longer be considered to centre only aroundthe degree of Ca2+ induced transformation of lessactive glycogen phosphorylase b to the moreactive a form, as is suggested in many textbooks.For some time it has been known thatglycogenolysis can proceed at a negligible rate,despite almost total transformation of phospho-rylase to the a form; for example, followingadrenaline infusion (Chasiotis et al. 1983). Con-versely, an increase in glycogenolytic rate hasbeen observed during circulatory occlusion,despite a relatively low mole fraction of the phos-phorylase a form (Chasiotis 1983). From this andother related work, it was concluded that inor-ganic phosphate (Pi) accumulation arising fromATP and PCr hydrolysis played a key role in theregulation of the glycogenolytic activity of phosphorylase a, and by doing so served as a linkbetween the energy demand of the contrac-tion and the rate of carbohydrate utilization
86 nutrition and exercise
(Chasiotis 1983). However, the findings that highrates of glycogenolysis can occur within 2s of theonset of muscle contraction in conjunction withonly a small increase in Pi and, more recently, thatglycogenolysis can proceed at a low rate despitea high phosphorylase a form and Pi concentra-tion, suggest that factors other than the degree ofCa2+ induced phosphorylase transformation andPi availability are involved in the regulation ofglycogenolysis (Ren & Hultman 1989, 1990).
Classically, both inosine monophosphate(IMP) and adenosine monophosphate (AMP)have been associated with the regulation ofglycogenolysis during exercise (Lowry et al. 1964;Aragon et al. 1980). IMP is thought to exert itseffect by increasing the activity of phosphory-lase b during contraction (the apparent Km(Michaeli’s constant) of phosphorylase b for IMPis about 1.2mmol · l–1 intracellular water). AMPhas also been shown to increase the activity ofphosphorylase b, but it is thought to require anunphysiological accumulation of free AMP to doso (the apparent Km of phosphorylase b for AMPis about 1.0mmol · l–1 intracellular water). In vitroexperiments have demonstrated that AMP canbring about a more marked effect on glycogeno-lysis by increasing the glycogenolytic activity ofphosphorylase a (Lowry et al. 1964). Because 90%or more of the total cell content of AMP may bebound to cell proteins in vivo, it has in the pastbeen questioned whether the increase in freeAMP during contraction is of a sufficient magni-tude to affect the kinetics of phosphorylase a.More recent work, however, demonstrates that a
Table 6.1 The amounts of substrate available and the maximal rates of energy production from phosphocreatine,carbohydrate and lipid in a 70-kg man (estimated muscle mass, 28kg).
Amount available Production rate(mol) (mol · min-1)
ATP, PCr Æ ADP, Cr 0.67 4.40Muscle glycogen Æ Lactate 6.70* 2.35Muscle glycogen Æ CO2 84 0.85–1.14Liver glycogen Æ CO2 19 0.37Fatty acids Æ CO2 4000* 0.40
*These pathways of substrate utilization will not be fully utilized during exercise.

small increase in AMP concentration (10mmol ·l–1) can markedly increase the in vitro activity ofphosphorylase a (Ren & Hultman 1990). Further-more, in vivo evidence demonstrating a closerelationship between muscle ATP turnover andglycogen utilization suggests that an exercise-induced increase in free AMP and inorganicphosphate may be the key regulators of glycogendegradation during muscle contraction (Ren &Hultman 1990).
Glycolysis
From the preceding discussions it can be seenthat the rate of glycogenolysis is determined by the activity of glycogen phosphorylase.However, it is the activity of phosphofructo-kinase (PFK) that dictates the overall rate of gly-colytic flux (Tornheim & Lowenstein 1976). PFKacts as a gate to the flow of hexose units throughglycolysis and there is no other enzyme subse-quent to PFK that is capable of matching flux ratewith the physiological demand for ATP. Stimula-tion of glycogen phosphorylase by adrenalineand/or exercise results in the accumulation ofglucose-6-phosphate demonstrating that PFK isthe rate limiting step in the degradation ofhexose units to pyruvate (Richter et al. 1986).
ATP is known to be the most potent allostericinhibitor of PFK. The most important activatorsor deinhibitors of PFK are adenosine diphos-phate (ADP), AMP, Pi, fructose-6-phosphate,glucose 1–6 bisphosphate, fructose 1–6 and 2–6bisphosphates and, under extreme conditions,ammonia. Removal of the ATP-mediated inhibi-tion of PFK during contraction, together with theaccumulation of the positive modulators of PFK,is responsible for the increase in flux through theenzyme during exercise and thereby is responsi-ble for matching glycolytic flux with the energydemand of contraction.
Hydrogen ion and citrate accumulation duringcontraction have been suggested to be capable of decreasing the activity of PFK and, thereby, the rate of glycolysis during intense exercise.However, it is now generally accepted that theextent of this inhibition of glycolysis during exer-
cise is overcome in the in vivo situation by theaccumulation of PFK activators (Spriet et al.1987).
Pyruvate oxidation
It has been accepted for some time that the ratelimiting step in carbohydrate oxidation is thedecarboxylation of pyruvate to acetyl-coenzymeA (CoA), which is controlled by the pyruvatedehydrogenase complex (PDC), and is essen-tially an irreversible reaction committing pyru-vate to entry into the tricarboxylic acid (TCA)cycle and oxidation (Wieland 1983). The PDC is aconglomerate of three enzymes located withinthe inner mitochondrial membrane. Adding toits complexity, PDC also has two regulatoryenzymes: a phosphatase and a kinase which regulate an activation–inactivation cycle. In-creased ratios of ATP/ADP, acetyl-CoA/CoAand NADH/NAD+ activate the kinase, resultingin the inactivation of the enzyme. Conversely,decreases in the above ratios and the presence of pyruvate will inactivate the kinase, whilstincreases in calcium will activate the phos-phatase, together resulting in the activation ofPDC. Thus, it can be seen that the increases incalcium and pyruvate availability at the onset ofcontraction will result in the rapid activation ofPDC. These factors, together with the subsequentdecrease in the ATP/ADP ratio as contractioncontinues, will result in continued flux throughthe reaction (Constantin-Teodosiu et al. 1991).
Following decarboxylation of pyruvate by thePDC reaction, acetyl-CoA enters the TCA cycle,resulting in the formation of citrate, in a reactioncatalysed by citrate synthase. The rate of fluxthrough the TCA cycle is thought to be regulatedby citrate synthase, isocitrate dehydrogenase,and a-ketoglutarate dehydrogenase. The activityof these enzymes is controlled by the mitochon-drial ratios of ATP/ADP and NADH/NAD+.Good agreement has been found between themaximal activity of a-ketoglutarate dehydroge-nase and flux through PDC and the TCA cycle.
The last stage in pyruvate oxidation involvesNADH and FADH generated in the TCA cycle
carbohydrate metabolism in exercise 87

entering the electron transport chain. In the elec-tron transport chain, NADH and FADH are oxidized and the energy generated is used torephosphorylate ADP to ATP. The rate of fluxthrough the electron transport chain will be regu-lated by the availability of NADH, oxygen andADP (Chance & Williams 1955). Finally, thetranslocation of ATP and ADP across the mito-chondrial membrane is thought to be effected bycreatine by way of the mitochondrial creatinekinase reaction (Moreadith & Jacobus 1982),thereby linking mitochondrial ATP production tothe ATPase activity in the contractile system.
Lactate production
Considerable controversy exists concerning themechanism responsible for lactate accumulationduring intense muscle contraction. The mostwidely accepted theory attributes this to a highrate of energy demand coupled with an inade-quate oxygen supply. In short, when tissueoxygen supply begins to limit oxidative ATP pro-duction, resulting in the accumulation of mito-chondrial and cytosolic NADH, flux throughglycolysis and a high cytosolic NAD+/NADHratio are maintained by the reduction of pyruvateto lactate. However, it has been suggested thatthe reduction in mitochondrial redox stateduring contraction is insignificant, thereby indi-cating that reduced oxygen availability is not theonly cause of lactate accumulation during con-traction (Graham & Saltin 1989). In addition,there are data to indicate that it is the activationof the PDC and the rate of acetyl group produc-tion, and not oxygen availability, which primar-ily regulates lactate production during intensemuscle contraction (Timmons et al. 1996). Fur-thermore, it has also been shown that for anygiven workload, lactate accumulation can be significantly altered by pre-exercise dietarymanipulation (Jansson 1980; Putman et al. 1993).Taken together, these findings suggest that animbalance between pyruvate formation anddecarboxylation to acetyl-CoA will dictate theextent of lactate formation during exercise as
88 nutrition and exercise
seen, for example, during the transition periodfrom rest to steady-state exercise.
Glycogen utilization with respect toexercise intensity
Maximal exercise
During submaximal (steady-state) exercise, ATPresynthesis can be adequately achieved by oxida-tive combustion of fat and carbohydrate stores.However, during high-intensity (non-steadystate) exercise, the relatively slow activation andrate of energy delivery of oxidative phosphoryla-tion cannot meet the energy requirements of contraction. In this situation, anaerobic energydelivery is essential for contraction to continue.Typically, oxidative energy delivery requiresseveral minutes to reach a steady state, due prin-cipally to the number and complexity of the reac-tions involved. Once achieved, the maximal rateof ATP production is in the region of approxi-mately 2.5mmol ·kg–1 dry matter (dm) · s–1. Onthe other hand, anaerobic energy delivery isrestricted to the cytosol, its activation is almostinstantaneous and it can deliver ATP at a rate inexcess of 11 mmol · kg–1 dm · s–1. The downside,however, is that this can be maintained for only afew seconds before beginning to decline. Ofcourse, oxidative and anaerobic ATP resynthesisshould not be considered to function indepen-dently of one another. It has been demonstratedthat as the duration of exercise increases, the contribution from anaerobic energy deliverydecreases, whilst that from aerobic is seen toincrease.
Figure 6.1 shows that maximal rates of ATPresynthesis from PCr and glycogen degradationcan only be maintained for short time periodsduring maximal contraction in man (Hultman et al. 1991). The rate of PCr degradation is at itsmaximum immediately after the initiation ofcontraction and begins to decline after only 1.3 s.Conversely, the corresponding rate of glycolysisdoes not peak until after approximately 5 s ofcontraction and does not begin to decline until

after 20s of contraction. This suggests that therapid utilization of PCr may buffer the momen-tary lag in energy provision from glycolysis, andthat the contribution of the latter to ATP resyn-thesis rises as exercise duration increases andPCr availability declines. This point exemplifiesthe critical importance of PCr at the onset of con-traction. Without this large hydrolysis of PCr, it islikely that muscle force production would almostinstantaneously be impaired, which is indeed thecase in muscles in which the PCr store has beenreplaced with a Cr analogue (Meyer et al. 1986). Itis also important to note that ultimately there is aprogressive decline in the rate of ATP resynthesisfrom both substrates during this type of exercise.For example, during the last 10 s of exercisedepicted in Fig. 6.1, the rate of ATP productionfrom PCr hydrolysis had declined to approxi-mately 2% of the peak rate. Similarly, the corre-sponding rate of ATP resynthesis from glycogenhydrolysis had fallen to approximately 40%.
The above example concerns exercise ofmaximal intensity lasting about 30s. However,
non-steady-state exercise, albeit less intense, canbe sustained for durations approaching 5–15minbefore fatigue is evident. Under these conditions,carbohydrate oxidation can make a major con-tribution to ATP production and therefore itsimportance should not be underestimated.
It has been demonstrated that during 3.2minof fatiguing exercise, oxidative phosphorylationcan contribute as much as 55% of total energyproduction (Bangsbo et al. 1990). This indicatesthe importance of substrate oxidation duringhigh-intensity exercise, a point which is oftenoverlooked. Under these conditions, muscleglycogen is the principal fuel utilized as muscleglucose uptake is inhibited by glucose 6-phosphate accumulation and adipose tissuelipolysis is inhibited by lactate accumulation.
Submaximal exercise
The term submaximal exercise is typically used todefine exercise intensities which can be sustainedfor durations falling between 30 and 180min.
carbohydrate metabolism in exercise 89
ATP
pro
duct
ion
(mm
ol. k
g–1 m
uscl
e.s–1
)
10
0
8
6
4
0–1.3
Exercise time (s)
2
0–2.6 0–5 0–10 10–20 20–30
Fig. 6.1 Rates of anaerobic ATPformation from phosphocreatineand glycolysis during maximalintermittent electrically evokedisometric contraction in man (seeHultman et al. 1991). Note that thereference base for the muscle datain the figures and text is drymuscle. This is because the musclesamples were freeze-dried prior tobiochemical analysis. To convert towet weight, values should bedivided by 4.3. This assumes 1 kgof wet muscle contains 70 ml ofextracellular water and 700 ml ofintracellular water. ,phosphocreatine; , glycolysis.

In practice, this is usually exercise intensitiesbetween 60% and 85% of maximal oxygen con-sumption. Continuous exercise of any longerduration (i.e. an intensity of less than 60% ofmaximal oxygen consumption) is probably notlimited by substrate availability and, providingadequate hydration is maintained, can probablybe sustained for several hours or even days!Unlike maximal intensity exercise, the rate ofmuscle ATP production required during pro-longed exercise is relatively low (< 2.5mmol ·kg–1
dm ·s–1) and therefore PCr, carbohydrate and fatcan all contribute to ATP resynthesis. However,carbohydrate is without question the mostimportant fuel source.
It can be calculated that the maximum rate of ATP production from carbohydrate oxidationwill be approximately 2.0–2.8 mmol ·kg–1
dm ·s–1 (based upon a maximum oxygen con-sumption of 3–4 l ·min–1), which corresponds to a glycogen utilization rate of approximately 4mmol ·kg–1 dm· min–1. Therefore, it can be seenthat carbohydrate could meet the energy require-ments of prolonged exercise. However, becausethe muscle store of glycogen is in the region of350mmol ·kg–1 dm, under normal conditions, itcan be calculated that it could only sustain in theregion of 80 min of exercise. This was demon-strated in the 1960s by Bergström and Hultman(1967). The authors also demonstrated that if theglycogen store of muscle was increased bydietary means, exercise duration increased inparallel (Bergström et al. 1967). Of course, carbo-hydrate is also delivered to skeletal muscle fromhepatic stores in the form of blood glucose andthis can generate ATP at a maximum rate ofapproximately 1mmol ·kg–1 dm ·s–1.
The majority of hepatic glucose release duringexercise (1.5–5.5mmol ·min–1) is utilized byskeletal muscle. Only 0.5 mmol ·min–1 is utilizedby extramuscular tissue during exercise. Muscleglucose utilization is dependent on glucosesupply, transport and metabolism. If bloodglucose is unchanged, as in the majority of exer-cise conditions, glucose supply to muscle is dic-tated by muscle blood flow, which increaseslinearly with exercise intensity and can increase
90 nutrition and exercise
by 20-fold from rest to maximal exercise. Theincrease in muscle glucose delivery as a result ofthe exercise- mediated increase in blood flow isprobably more important for muscle glucoseuptake during exercise than the insulin and con-traction-induced increase in membrane glucosetransport capacity (see Richter & Hespel 1996).As exercise continues, plasma insulin concentra-tion declines, which facilitates hepatic glucoserelease and reduces glucose utilization by extra-muscular tissue. However, insulin supply tomuscle probably remains elevated above basalsupply due to the contraction-induced elevationin muscle blood flow.
Hexokinase is responsible for the phosphory-lation of glucose by ATP when it enters themuscle cell. The enzyme is allosterically inhib-ited by glucose-6-phosphate, the product of thehexokinase reaction and an intermediate of gly-colysis. Thus, during short-term high-intensityexercise and at the onset of prolonged sub-maximal exercise, glucose phosphorylation byhexokinase will be inhibited by glucose-6-phosphate accumulation. This will increase theconcentration of glucose in the extra- and intra-cellular water and will contribute to the increasein blood glucose observed during high-intensityexercise. However, as submaximal exercise continues, the decline in muscle glucose-6-phosphate results in an increase in glucose phosphorylation.
In comparison with muscle glycogen metabo-lism, relatively little is known about the inter-action between exercise and hepatic glycogenmetabolism in man. This is not because of a lack ofinterest but because of the invasive nature of theliver biopsy technique. The few studies that havebeen performed in healthy volunteers using thistechnique have demonstrated that the rate ofliver glucose release in the postabsorptive state isin the region of 0.8 mmol glucose · min–1, which is sufficient to meet the carbohydrate demands of the brain and obligatory glucolytic tissues.Approximately 60% of this release (0.5mmol ·min–1) is derived from liver glycogen stores andthe remainder is synthesized by gluconeogenesisin the liver using lactate, pyruvate, glycerol and

amino acids as substrates (Hultman & Nilson1971; Nilsson & Hultman 1973).
The rate of hepatic glucose release during exer-cise in the postabsorptive state has been shownto be mainly a function of exercise intensity (Fig.6.2) (Hultman 1967; Wahren et al. 1971; Ahlborg etal. 1974; Ahlborg & Felig 1982). The uptake ofgluconeogenic precursors by the liver is onlymarginally increased during the initial 40 min ofsubmaximal exercise but increases further asexercise continues (Ahlborg et al. 1974). Most(more than 90%) of the glucose release is derivedfrom liver glycogenolysis resulting in a declineand ultimately depletion of liver glycogen stores.Direct measurements of liver glycogen concen-tration in the postabsorptive state and following60min of exercise at 75% of maximal oxygen con-sumption showed a 50% decrease in the liverglycogen concentration with exercise (Fig. 6.3).This corresponded to a glycogen degradationrate of 4.2 mmol · min–1 (assuming 1.8 kg of liver)and suggested that the liver glycogen storewould have been depleted within 120min ofexercise at this intensity.
The exact mechanisms responsible for theregulation of liver glucose release at the onsetand during exercise are still unresolved.However, it is known that the decline in blood
insulin concentration and increases in adrenalineand glucagon with increasing exercise durationtogether with afferent nervous feedback fromcontracting muscle will stimulate liver glucoserelease (for more complete information, see Kjaer1995).
carbohydrate metabolism in exercise 91
6
5
4
3
2
1
0H
epat
ic g
luco
se p
rod
uct
ion
(mm
ol. m
in–1
)0
(rest)10 20 30 40 120 180 240
Work time (min)
85%
75%
55%
30%
Fig. 6.2 Hepatic glucose releaseduring exercise at 30%, 55%, 75%and 85% of maximal oxygenconsumption in men. FromAhlborg et al. (1974), Ahlborg andFelig (1982), Wahren et al. (1971)and Hultman (1967).
Live
r gly
coge
n (m
mol
. kg–1
wet
wt)
400
0
300
200
Rest
100
Exercise
Fig. 6.3 Hepatic glycogen concentration in men at restfollowing an overnight fast (n = 33) and following anovernight fast and 60 min of exercise at approximately75% of maximal oxygen consumption in a secondgroup of subjects (n = 14). Biopsy samples wereobtained at the same time of day in both groups ofsubjects. From Hultman and Nilsson (1971).

Muscle fibre type responses
The conclusions presented so far have beenbased on metabolite changes measured in biopsysamples obtained from the quadriceps femorismuscle group. However, it is known that humanskeletal muscle is composed of at least two func-tionally and metabolically different fibre types.Type I fibres are characterized as being slow con-tracting, fatigue resistant, having a low peakpower output and favouring aerobic metabolismfor ATP resynthesis during contraction. Con-versely, in comparison, type II fibres are fast con-tracting, fatigue rapidly, have a high peak poweroutput and favour mainly anaerobic metabolismfor ATP resynthesis (Burke & Edgerton 1975).
Maximal exercise
Evidence from animal studies performed onmuscles composed of predominantly type I ortype II fibres and from one study performed
92 nutrition and exercise
using bundles of similar human muscle fibretypes, suggest that the rapid and marked rise andsubsequent decline in maximal power outputobserved during intense muscle contraction inman may be closely related to activation andrapid fatigue of type II fibres during contraction(Faulkner et al. 1986).
Figure 6.4 demonstrates glycogen degradationin type I and type II muscle fibres duringmaximal exercise under four different experi-mental conditions. Notice that during intensecontraction the rates of glycogenolysis are higherin type II than in type I fibres. This is true for bothdynamic exercise (Greenhaff et al. 1994; treadmillsprinting) and electrically induced isometric contractions (Greenhaff et al. 1991, 1993). Therates of glycogenolysis observed in both fibretypes during treadmill sprinting and intermit-tent isometric contraction with circulationoccluded, are in good agreement with the V
.max. of
phosphorylase measured in both fibre types(Harris et al. 1976), suggesting that glycogenoly-
5
0
4
3
2
Opencirc.
Electrical stimulation
1
Gly
coge
noly
tic ra
te (g
luco
se u
nits
, mm
ol. s–1
. kg–1
)
Open circ.and
adrenaline
Occludedcirc.
Sprinting
Fig. 6.4 Glycogenolytic rates intype I ( ) and type II (�) humanmuscle fibres during 30 s ofintermittent electrically evokedmaximal isometric contractionwith intact circulation (circ.), intactcirculation with adrenalineinfusion, occluded circulation andduring 30 s of maximal sprintrunning. Adapted from Greenhaffet al. (1991, 1993, 1994).

sis is occurring at a near maximal rate duringintense exercise. Surprisingly, during intermit-tent isometric contraction with circulation intact,when the rest interval between contractions is ofthe order of 1.6s, the rate of glycogenolysis intype I fibres is almost negligible. The correspond-ing rate in type II fibres is almost maximal andsimilar to that seen during contraction with cir-culatory occlusion. This suggests that duringmaximal exercise glycogenolysis in type II fibresis invariably occurring at a maximal rate, irre-spective of the experimental conditions, whilethe rate in type I fibres is probably very muchrelated to cellular oxygen availability.
Submaximal exercise
In contrast to maximal exercise, the rate ofglycogenolysis during submaximal exercise isgreatest in type I fibres, especially during theinitial period of exercise (Ball-Burnett et al. 1990).This phenomenon is likely to be the result of dif-ferences in the recruitment pattern betweenmuscle fibre types. If exercise is continued, glyco-gen utilization occurs in both fibre types butdepletion is observed first in the type I musclefibres. The consumption of carbohydrate duringexhaustive submaximal exercise has been shownto offset the depletion of glycogen specifically intype I fibres (Tsintzas et al. 1996).
Fatigue mechanisms related to carbohydrate metabolism
What is clear from the literature is that glycogenavailability per se is not usually considered to be responsible for fatigue development during maximal exercise, providing the pre-exercise glycogen store is not depleted to below100mmol ·kg-1 dm. It is even unlikely that gly-cogen availability will limit performance dur-ing repeated bouts of exercise, due to the declinein glycogenolysis and lactate production thatoccurs under these conditions. It is more prob-able that fatigue development during maximalexercise will be caused by a gradual decline in anaerobic ATP production caused by the
depletion of PCr and a fall in the rate ofglycogenolysis.
Lactic acid accumulation during high-intensity exercise is considered to producemuscle fatigue as a result of H+ and Pi accumula-tion. An increase in hydrogen ion concentrationwill negatively affect phosphorylase activity,thereby delaying the rate of glycogenolysis, bydelaying transformation of the b form to the aform (Danforth 1965; Chasiotis 1983) and bydecreasing the HPO4
2+, the dibasic form of Pi,which is the substrate for phosphorylase. Theinhibition of PFK discussed previously seems tobe at least partly offset by an increase in the acti-vators of PFK, especially ADP, AMP and Pi, whenthe rate of ATP utilization is higher than the rateof oxidative ATP resynthesis. The increase inADP and Pi, especially the H2PO4
– form, in aci-dotic muscle is known to have inhibitory effectson contractile function (Cook & Pate 1985; Noseket al. 1987). However, there is no evidence of adirect relationship between the decline in muscleforce during contraction and H+ accumulation.For example, studies involving human volun-teers have demonstrated that muscle-force gen-eration following fatiguing exercise can recoverrapidly, despite having a very low muscle pHvalue (Sahlin & Ren 1989). The general consensusat the moment appears to be that the initial gen-eration of muscle force production is dependenton the capacity to generate ATP but the mainte-nance of force generation is also pH dependent.
Despite the wealth of information showingthat carbohydrate availability is essential to per-formance during submaximal exercise, the bio-chemical mechanism(s) by which fatigue isbrought about in the carbohydrate depleted stateare still unclear. Recent evidence suggests thatcarbohydrate depletion will result in an inabilityto rephosphorylate ADP to ATP at the requiredrate, possibly because of a decrease in the rate offlux through the TCA cycle as a result of a declinein muscle TCA cycle intermediates (Sahlin et al.1990). The consequent rise in ADP concentrationwill bring about fatigue, perhaps as a directinhibitory effect of ADP and/or Pi on contractioncoupling.
carbohydrate metabolism in exercise 93

Conclusion
The carbohydrate stores of the body, liver andmuscle glycogen, are utilized immediately atstart of exercise. Glucose output from the liverclosely matches the increased glucose require-ment of the contracting muscles, keeping theblood glucose concentration unchanged duringsubmaximal exercise. Blood glucose levels arenormally seen only to increase in the initialperiod of intense exercise and to fall when thehepatic glycogen store is depleted near toexhaustion. The regulation of the hepatic glucoserelease is a complex process dependent on bothhormonal control and feedback signals from con-tracting muscles.
Glucose uptake by exercising muscle isdirectly related to exercise intensity and regu-lated by muscle blood flow and facilitated byincreased glucose transport capacity of theplasma membrane of the contracting muscle. Themaximal rate of glucose uptake at a normal bloodglucose concentration is about 0.4 mmol ·min–1 ·kg–1 exercising muscle. Glucose utilization is alsodependent on the glucose phosphorylationcapacity mediated by the activity of hexokinase.
The major carbohydrate store of the body ismuscle glycogen, which is used in concert withthe hepatic glycogen store to provide the exercis-ing muscle with energy.
The rate of utilization is low at rest and duringlow-intensity exercise, when blood-borne glu-cose and free fatty acids are the major sources offuel for ATP resynthesis. With increasing exerciseintensity, the use of carbohydrate as an energysubstrate increases gradually to cover almost allthe energy demand of contraction at exerciseintensities near the subject’s maximal oxygenuptake. The maximal rate of oxidative energyproduction from muscle glycogen is of the orderof 35 mmol ATP ·min–1 ·kg–1 exercising muscle,corresponding to a glycogen degradation rate of1mmol ·min–1 ·kg–1 wet muscle. The mecha-nism(s) controlling the integration of fat and car-bohydrate utilization during exercise are poorlyunderstood and, as yet, unresolved.
The muscle glycogen store can also produce
94 nutrition and exercise
ATP anaerobically and at a rate that is twice thatof oxidative ATP regeneration. Anaerobic energydelivery can be activated within milliseconds,while the aerobic energy production needsseveral minutes to reach a steady state. Thus,anaerobic carbohydrate utilization will be im-portant as an energy provider during the transi-tion period between rest and exercise and duringperiods of intense exercise when the energydemand of contraction exceeds the capacity ofoxidative ATP regeneration.
It can be concluded that carbohydrate is usedas fuel at onset of exercise at all intensities and isan obligatory fuel for the continuation of exerciseat intensities above 50–60% of the subject’smaximal oxygen uptake. Depletion of the musclecarbohydrate stores will impair exercise perfor-mance at this range of exercise intensities.Exhaustion of the liver glycogen store duringprolonged exercise results in hypoglycaemiawhich also impairs continued exercise performance.
Carbohydrate metabolism in exercisingmuscle is initiated by Ca2+ release from the sar-coplasmic reticulum and thereafter is regulatedby the rate of ATP degradation via the phospho-rylation state of the high-energy phosphate pool(ATP, ADP, AMP, PCr) and Pi. AMP and Piconcentrations regulate the flux through the glycolytic pathway while Ca2+ and pyruvate con-centrations are the main regulators of PDH activ-ity which, together with the intramitochondrialconcentration of ADP, determines the rate of car-bohydrate oxidation. The result is a tight match-ing of ATP generation from carbohydrate sourceswith the ATP demand of contracting muscle.
Other influences on carbohydrate metabolismduring exercise include diet, training status andhormonal balance.
References
Ahlborg, G. & Felig, P. (1982) Lactate and glucoseexchange across the forearm, legs and splanchnicbed during and after prolonged leg exercise. Journalof Clinical Investigation 69, 45–54.
Ahlborg, G., Felig, P., Hagenfeldt, L., Hendler, R. &

Wahren, J. (1974) Substrate turnover during pro-longed exercise in man: splanchnic and leg metabo-lism of glucose, free fatty acids and amino acids.Journal of Clinical Investigation 53, 1080–1090.
Aragon, J.J., Tornheim, K. & Lowenstein, J.M. (1980) Ona possible role of IMP in the regulation of phosphory-lase activity in skeletal muscle. FEBS Letters 117,K56–K64.
Ball-Burnett, M., Green, H.J. & Houston, M.E. (1990)Energy metabolism in slow and fast twitch musclefibres during prolonged cycle exercise. Journal ofPhysiology 437, 257–267.
Bangsbo, J., Gollnick, P.D., Graham, T.E. et al. (1990)Anaerobic energy production and O2 deficit–debtrelationship during exhaustive exercise in humans.Journal of Physiology 422, 539–559.
Bergström, J. & Hultman, E. (1967) A study of glycogenmetabolism during exercise in man. ScandinavianJournal of Clinical Laboratory Investigation 19, 218–228.
Bergström, J., Hermansson, L., Hultman, E. & Saltin, B.(1967) Diet, muscle glycogen and physical perfor-mance. Acta Physiologica Scandinavica 71, 140–150.
Burke, R.W. & Edgerton, V.R. (1975) Motor unit proper-ties and selective involvement in movement. Exerciseand Sports Science Reviews 3, 31–81.
Chance, B. & Williams, G.R. (1955) Respiratoryenzymes in oxidative phosphorylation. I. Kinetics ofoxygen utilisation. Journal of Biological Chemistry 217,383–393.
Chasiotis, D. (1983) The regulation of glycogen phos-phorylase and glycogen breakdown in human skeletal muscle. Acta Physiologica Scandinavica 518(Suppl.), 1–68.
Chasiotis, D., Sahlin, K. & Hultman, E. (1983) Regula-tion of glycogenolysis in human muscle in responseto epinephrine infusion. Journal of Applied Physiology54, 45–50.
Constantin-Teodosiu, D., Carlin, J.J., Cederblad, G.,Harris, R.C. & Hultman, E. (1991) Acetyl group accu-mulation and pyruvate dehydrogensae activity inhuman muscle during incremental exercise. ActaPhysiologica Scandinavica 143, 367–372.
Cook, R. & Pate, E. (1985) The effects of ADP and phos-phate on the contraction of muscle fibres. BiophysicsJournal 48, 789–798.
Danforth, W.H. (1965) Activation of glycolytic pathwayin muscle. In Control of Energy Metabolism (ed. B.Chance & R.W. Estabrook), pp. 287–296. AcademicPress, New York.
Faulkner, J.A., Claflin, D.R. & McCully, K.K. (1986)Power output of fast and slow fibres from humanskeletal muscles. In Human Power Output (ed. N.L.Jones, N. McCartney & A.J. McComas), pp. 81–89.Human Kinetics, Champaign, IL.
Graham, T.E. & Saltin, B. (1989) Estimation of the mito-chondrial redox state in human skeletal muscle
during exercise. Journal of Applied Physiology 66,561–566.
Greenhaff, P.L., Ren, J.-M., Soderlund, K. & Hultman,E. (1991) Energy metabolism in single human musclefibres during contraction without and with epineph-rine infusion. American Journal of Physiology 260,E713–E718.
Greenhaff, P.L., Soderlund, K., Ren, J.-M. & Hultman,E. (1993) Energy metabolism in single human musclefibres during intermittent contraction with occludedcirculation. Journal of Physiology 460, 443–453.
Greenhaff, P.L., Nevill, M.E., Soderlund, K. et al. (1994)The metabolic responses of human type I and IImuscle fibres during maximal treadmill sprinting.Journal of Physiology 478, 149–155.
Harris, R.C., Essen, B. & Hultman, E. (1976) Glycogenphosphorylase in biopsy samples and single musclefibres of musculus quadriceps femoris of man at rest.Scandinavian Journal of Clinical Laboratory Investiga-tion 36, 521–526.
Hultman, E. (1967) Studies on muscle glycogen andactive phosphate in man with special reference toexercise and diet. Scandinavian Journal of Clinical Laboratory Investigation 19 (Suppl. 94), 1–63.
Hultman, E. & Nilsson, L.H. son (1971) Liver glycogenin man, effects of different diets and muscular exer-cise. In Muscle Metabolism during Intense Exercise (ed.B. Pernow & B. Saltin), pp. 143–151. Plenum Press,London.
Hultman, E., Greenhaff, P.L., Ren, J.-M. & Soderlund,K. (1991) Energy metabolism and fatigue duringintense muscle contraction. Biochemical Society Trans-actions 19, 347–353.
Jansson, E. (1980) Diet and muscle metabolism in man.Acta Physiologica Scandinavica 487 (Suppl.), 1–24.
Kjaer, M. (1995) Hepatic fuel metabolism during exer-cise. In Exercise Metabolism (ed. M. Hargreaves), pp.73–97. Human Kinetics, Champaign, IL.
Lowry, O.H., Schulz, D.W. & Passoneau, J.V. (1964)Effects of adenylic acid on the kinetics of musclephosphorylase a. Journal of Biological Chemistry 239,1947–1953.
Meyer, R.A., Brown, T.R., Krilowicz, B.L. & Kushmerick, M.J. (1986) Phosphagen and intracellu-lar pH changes during contraction of creatine-depleted rat muscle. American Journal of Physiology250, C264–C274.
Moreadith, R.W. & Jacobus, W.E. (1982) Creatine kinaseof heart mitochondria: functional coupling to ADPtransfer to the adenine nucleotide translocase.Journal of Biological Chemistry 257, 899–905.
Nilsson, L.H. son & Hultman, E. (1973) Liver glyco-gen in man: the effect of total starvation or a carbohydrate-poor diet followed by carbohydratefeedings. Scandinavian Journal of Clinical LaboratoryInvestigation 32, 325–330.
carbohydrate metabolism in exercise 95

Nosek, T.M., Fender, K.Y. & Godt, R.E. (1987) It is dipro-tonated inorganic phosphate that depresses force inskinned skeletal muscle fibres. Science 236, 191–193.
Putman, C.T., Spriet, L.L., Hultman, E., Lindinger, M.I.,Lands, L.C., McKelvie, R.S., Cederblad, G., Jones,N.L. & Heigenhauser, G.J.F. (1993) Pyruvate de-hydrogenase activity and acetyl group accumulationduring exercise after different diets. American Journalof Physiology 265, E752–E760.
Ren, J.-M. & Hultman, E. (1989) Regulation ofglycogenolysis in human skeletal muscle. Journal ofApplied Physiology 67, 2243–2248.
Ren, J.-M. & Hultman, E. (1990) Regulation of phospho-rylase a activity in human skeletal muscle. Journal ofApplied Physiology 69, 919–923.
Richter, E.R. & Hespel, P. (1996) Determinants ofglucose uptake in contracting muscle. In Biochemistryof Exercise IX (ed. R. Maughan & S. Shirreffs), pp.51–60. Human Kinetics, Champaign.
Richter, E.R., Sonne, B., Ploug, T., Kjaer, M., Mikines, K.& Galbo, H. (1986) Regulation of carbohydratemetabolism in exercise. In Biochemistry of Exercise IV(ed. B. Saltin), pp. 151–166. Human Kinetics, Cham-paign, IL.
Sahlin, K. & Ren, J.-M. (1989) Relationship of contrac-tion capacity to metabolic changes during recoveryfrom fatigueing contraction. Journal of Applied Physi-ology 67, 648–654.
96 nutrition and exercise
Sahlin, K., Katz, A. & Broberg, S. (1990) Tricarboxyliccycle intermediates in human muscle during sub-maximal exercise. American Journal of Physiology 259,C834–C841.
Spriet, L.L., Soderlund, K., Bergstrom, M. & Hultman,E. (1987) Skeletal muscle glycogenolysis, glyxcolysisand pH during electrical stimulation in man. Journalof Applied Physiology 62, 611–615.
Timmons, J.A., Poucher, S.M., Constantin-Teodosiu, D.,Worrall, V., Macdonald, I.A. & Greenhaff, P.L. (1996)Increased acetyl group availability enhances con-tractile function of canine skeletal muscle duringischemia. Journal of Clinical Investigation 97, 879–883.
Tornheim, K. & Lowenstein, J.M. (1976) Control ofphosphofructokinase from rat skeletal muscle.Journal of Biological Chemistry 251, 7322–7328.
Tsintzas, O.-K., Williams, C., Boobis, L. & Greenhaff,P.L. (1996) Carbohydrate ingestion and single musclefibre glycogen metabolism during prolongedrunning in man. Journal of Applied Physiology 81,801–809.
Wahren, J., Felig, P., Ahlborg, G. & Jorfelt, L. (1971)Glucose metabolism during leg exercise in man.Journal of Clinical Investigation 50, 2715–2725.
Wieland, O.H. (1983) The mammalian pyruvate de-hydrogenase complex, structure and regulation.Reviews in Physiology Biochemistry and Pharmacology96, 123–170.

Introduction
The importance of carbohydrates as a fuel sourceduring physical activity has been recognized formany years (Krogh & Lindhard 1920; Levine et al.1924; Dill et al. 1932). Krogh and Lindhard (1920)reported that subjects placed on a high fat dietcomplained of feeling tired and had difficultyperforming a standardized 2-h exercise protocolon a cycle ergometer. However, 3 days on a highcarbohydrate diet relieved their symptoms oftiredness and the subjects were able to completethe 2-h exercise task without undue stress. Simi-larly, Christensen and Hansen (1939a, 1939b)found that the capacity for prolonged exercisewas three times greater after 3–7 days on a highcarbohydrate diet as opposed to a high fat-protein diet. They also reported that exhaustionwas accompanied by hypoglycaemia, and thatingestion of a carbohydrate supplement duringrecovery rapidly returned the blood glucose con-centration back to normal and allowed consider-able additional exercise to be performed. Theseresults were in agreement with the earlier obser-vations of Levine et al. (1924), who found thatblood glucose levels of runners fell to very lowlevels during a marathon. They also noted that inconjunction with this hypoglycaemic state, theparticipants were physically fatigued and dis-played neuroglucopenia symptoms such as muscular twitching and disorientation. Based onthese observations, it was generally acceptedthat hypoglycaemia resulting from liver glyco-gen depletion was responsible for fatigue dur-
ing prolonged strenuous exercise. However, thisview would be modified as technical advancesallowed the direct investigation of musclemetabolism during and following prolongedstrenuous exercise.
Based on the findings of several Scandinavianresearch groups, it became apparent that there is an increased reliance on muscle glycogen as afuel source as exercise intensity increases, andthat perception of fatigue during prolongedstrenuous exercise parallels the declining muscleglycogen stores. It was also found that aerobicendurance is directly related to the initial muscleglycogen stores, and that strenuous exercisecould not be maintained once these stores aredepleted (Hermansen et al. 1965; Ahlborg et al.1967a; Bergström et al. 1967; Hultman 1967).
The amount of glycogen stored in skeletalmuscle, however, is limited. If muscle glycogenwas the only fuel source available, it could becompletely depleted within 90min of moderateintensity exercise. Therefore, because of thelimited availability of muscle glycogen and itsimportance during prolonged strenuous exer-cise, methods for increasing its concentrationabove normal prior to exercise and for its rapidrestoration after exercise have been extensivelyinvestigated. This chapter discusses our currentunderstanding of the regulation of muscle glyco-gen synthesis, the effect of diet and exercise onthe muscle glycogen concentration prior to exer-cise, and methods for muscle glycogen restora-tion immediately after exercise. The chapterconcludes with recommendations for increasing
Chapter 7
Optimization of Glycogen Stores
JOHN L. IVY
97

and maintaining muscle glycogen stores for com-petition and training.
Regulation of muscle glycogen synthesis
Figure 7.1 illustrates the metabolic reactions controlling glycogen synthesis. Upon crossingthe sarcolemma, glucose is rapidly converted toglucose-6-phosphate (G6P) by the enzyme hex-okinase. The G6P is then converted to glucose-1-phosphate (G1P) by phosphoglucomutase. Next,uridine triphosphate and G1P are combined toform uridine diphosphate (UDP)-glucose, whichserves as a glycosyl carrier. The glucose attachedto the UDP-glucose is then transferred to the ter-minal glucose residue at the non-reducing end ofa glucan chain to form an a(1 Æ 4) glycosidiclinkage. This reaction is catalysed by the enzymeglycogen synthase. The initial formation of the glucan chain, however, is controlled by theprotein glycogenin, which is a UDP-glucose-requiring glucosyltransferase. The first stepinvolves the covalent attachment of glucose to asingle tyrosine residue on glycogenin. This reac-tion is brought about autocatalytically by glyco-genin itself. The next step is the extension of theglucan chain which involves the sequential addi-tion of up to seven further glucosyl residues. Theglucan primer is elongated by glycogen syn-thase, but only when glycogenin and glycogensynthase are complexed together. Finally, amylo
98 nutrition and exercise
(1,4 Æ1,6) transglycosylase catalyses the transferof a terminal oligosaccharide fragment of six orseven glucosyl residues from the end of theglucan chain to the 6-hydroxyl group of a glucoseresidue of the same or another chain. This occursin such a manner as to form an a(1 Æ 6) linkageand thus create a compact molecular structure.The synthesis of the glycogen molecule is termi-nated by the dissociation of glycogen synthasefrom glycogenin (Smythe & Cohen 1991; Alonsoet al. 1995).
Following its depletion by exercise, muscleglycogen synthesis occurs in a biphasic manner(Bergström & Hultman 1967b; Piehl 1974; Ivy1977; Maehlum et al. 1977; Price et al. 1994). Ini-tially, there is a rapid synthesis of muscle glyco-gen that does not require the presence of insulin(Ivy 1977; Maehlum et al. 1977; Price et al. 1994).In normal humans, the rate of synthesis duringthis insulin-independent phase has been foundto range between 12 and 30mmol · g–1 wetweight ·h–1 and to last for about 45–60 min. Thesecond phase is insulin dependent (Ivy 1977;Maehlum et al. 1977; Price et al. 1994) and in theabsence of carbohydrate supplementation occursat a rate that is approximately seven- to 10-foldslower than that of the rapid phase (Price et al.1994). If supplemented immediately after exer-cise with carbohydrates, however, the rate ofsynthesis during the slow phase can be increasedseveral-fold, and if supplementation persists, themuscle glycogen level can be increased above
–
+
Hexokinase
Glucose
Glucose transporter
Glycogen synthase + glycogenin
D I
Glycogen
UDP-glucose
UDP-glucose pyrophosphorylase
Glucose-1-phosphate
PhosphoglucomutaseGlucose-6-phosphate
Fig. 7.1 The metabolic reactionsand the enzymes controlling thereactions that are responsible forthe synthesis of muscle glycogen.Enzymes are in italic. See text fordetails.

normal (Bergström et al. 1967). This elevation inmuscle glycogen above normal is referred to asglycogen supercompensation. Interestingly, theeffectiveness of the carbohydrate supplement tospeed muscle glycogen recovery during the slowphase is directly related to the plasma insulinresponse to the supplement (Ivy 1991).
Rapid phase of glycogen synthesis after exercise
After exercise that is of sufficient intensity andduration to deplete the muscle glycogen stores,the activity of glycogen synthase is increased.Glycogen synthase is the rate-limiting enzyme inthe glycogen synthesis pathway. Its activity isstrongly influenced by the muscle glycogen concentration (Danforth 1965; Bergström et al.1972; Adolfsson 1973). Generally, the percentageof glycogen synthase in its active I-form isinversely related to the muscle glycogen concen-tration. That is, as the muscle glycogen concen-tration declines the percentage of glycogensynthase in the I-form increases. Conversely, asthe glycogen concentration increases the percent-age of glycogen synthase in its inactive D-formincreases.
An exercise-induced increase in glycogen syn-thase activity can catalyse the rapid restoration ofglycogen only if adequate substrate is available.Thus, an additional factor that makes possiblethe rapid increase in muscle glycogen after exer-cise is a protracted increase in the permeability ofthe muscle cell membrane to glucose (Holloszy &Narahara 1965; Ivy & Holloszy 1981; Richter et al.1982). The increase in glucose transport inducedby muscle contractile activity, however, reversesrapidly in the absence of insulin, with most of the effect lost within several hours (Cartee et al.1989). This rapid decline in muscle glucose trans-port appears to be inversely related to the muscleglycogen concentration (Cartee et al. 1989;Richter et al. 1984). Thus, the increase in mem-brane permeability to glucose, together with theactivation of glycogen synthase, allows for aninitial rapid insulin-independent resynthesis ofmuscle glycogen following exercise.
Slow phase of muscle glycogen synthesis after exercise
After the direct, insulin-independent effect ofexercise on glucose transport subsides, it israpidly replaced by a marked increase in the sen-sitivity of muscle glucose transport and glycogensynthesis to insulin (Garetto et al. 1984; Richter et al. 1984; Cartee et al. 1989). The magnitude ofthe increased insulin sensitivity induced by exer-cise can be extremely high, and result in muscleglucose uptake and glycogen synthesis withinsulin concentrations that normally have nodetectable effect on either process (Cartee et al.1989; Price et al. 1994). Furthermore, this increasein sensitivity can be sustained for a very longperiod of time, and does not appear to reversecompletely until glycogen supercompensationhas occurred (Garetto et al. 1984; Cartee et al.1989). These findings therefore suggest that anincrease in muscle insulin sensitivity is a pri-mary component of the slow phase of glycogensynthesis.
Although the percentage of glycogen synthasein the I-form may be as high as 80% immediatelyafter exercise-induced glycogen depletion, asglycogen levels are normalized the percentage ofglycogen synthase I decreases back to the pre-exercise level or lower in a negative feedbackmanner (Danforth 1965; Bergström et al. 1972;Adolfsson 1973; Terjung et al. 1974). However,during the slow synthesis phase of glycogen,glycogen synthase appears to be transformedinto an intermediate form which has a depressedactivity ratio, but enhanced sensitivity to activa-tion by G6P (Kochan et al. 1981). Thus, a secondimportant component of the slow phase of glyco-gen synthase appears to be an increase in the sen-sitivity of glycogen synthase to G6P.
Another possible mechanism that might contribute to an increase in glycogen synthe-sis during the slow insulin-dependent phase ofrecovery is an increase in GLUT-4 concentration.Recently, Ren et al. (1994) reported an increase inGLUT-4 protein in skeletal muscle of rats after asingle prolonged exercise session. The increase inGLUT-4 protein was accompanied by a propor-
optimization of glycogen stores 99

tional increase in insulin-stimulated glucosetransport and glycogen synthesis. Ren et al.(1994) concluded that a rapid increase in GLUT-4expression is an early adaptation of muscle toexercise to enhance replenishment of muscleglycogen stores.
Effect of carbohydrate supplementation
It is evident that the exercise-induced increase inmuscle permeability to glucose, insulin sensitiv-ity, and glycogen synthase activity are, together,not sufficient to result in the rapid repletion andsupercompensation of the glycogen stores, sinceonly a small increase in muscle glycogen occursfollowing exercise in the absence of carbohydratefeeding (Bergström et al. 1967; Bergström &Hultman 1967b; Maehlum & Hermansen 1978;Ivy et al. 1988b). Probable factors that prevent therapid repletion of muscle glycogen in the fastedstate are a depressed circulating insulin concen-tration, and an increase in plasma free fatty acidsand fatty acid oxidation by muscle (Ivy et al.1988a). These conditions are actually advanta-geous during fasting as they serve to slowmuscle glucose uptake and conserve bloodglucose for use by the nervous system until suffi-cient carbohydrate is available.
Carbohydrate feeding after exercise probablystimulates glycogen synthesis by increasing arte-rial plasma insulin and glucose concentrations.The increase in circulating insulin not only func-tions to increase muscle glucose uptake, but alsofunctions to keep glycogen synthase activity elevated. It may also play a role in increasingGLUT-4 expression which would facilitateinsulin-stimulated glucose transport (Ren et al.1993; Hansen et al. 1995; Brozinick et al. 1996).With increasing plasma glucose concentration,glucose transport increases regardless of thelevel of muscle permeability to glucose (Nesheret al. 1985). Therefore, the increase in arterialplasma glucose concentration functions toincrease the rate of glucose transport, furtherincreasing substrate availability, and provid-ing sufficient G6P for activation of glycogen synthase.
100 nutrition and exercise
It has also been demonstrated that the in-sulin response to carbohydrate supplementationincreases over subsequent days while glucosetolerance remains the same or actually improves(Ivy et al. 1985). This increase in insulin responseto carbohydrate loading is thought to be theresult of an increase in the pancreatic response toglucose (Szanto & Yudkin 1969). Since insulin isrequired for normal glycogen repletion andsupercompensation, it is possible that the hyper-insulinaemic response following several days ofhigh carbohydrate consumption is responsiblefor the increased sensitivity of glycogen synthaseto G6P. The elevated plasma insulin may alsoserve to increase the rate of muscle glucose trans-port, thus increasing the availability of glucose toglycogen synthase, as well as possibly increasingthe intracellular concentration of G6P. Hexoki-nase activity in muscle is also increased duringsubsequent days of carbohydrate loading (Ivy et al. 1983). This too could be of functional signifi-cance since an increase in hexokinase activitywould prevent the rate-limiting step in glucoseuptake from shifting from transport to glucosephosphorylation as the G6P concentrationincreased.
Glycogen supercompensationregimens
The discovery by Bergström and Hultman(1967b) that a high carbohydrate diet followingthe depletion of muscle glycogen by exercisewould result in an above normal muscle glyco-gen concentration led to a series of studies toidentify the regimen of exercise and diet thatwould best supercompensate the muscle glyco-gen stores. Bergström et al. (1967) had subjectsexercise to exhaustion to deplete their muscleglycogen stores. Six of the subjects then receiveda high fat–protein diet for 3 days. This was fol-lowed by another exhaustive exercise bout and 3 days of a high carbohydrate diet. The remain-ing three subjects followed the same protocol as above except the order of administration of the diets was reversed. When the high car-bohydrate diet followed the high fat–protein

diet, the muscle glycogen concentration was 205.5mmol ·g–1 wet weight. This represented a100% increase above the initial muscle glycogenconcentration. When the high carbohydrate dietpreceded the high fat–protein diet, the muscleglycogen concentration was 183.9mmol ·g–1 wetweight following the high carbohydrate diet. Itwas suggested that a period of carbohydrate-freediet further stimulated glycogen synthesis whencarbohydrates were given following exercise.Based on this study and several similar studies(Ahlborg et al. 1967b; Bergström & Hultman1967a), it was recommended that the best way toglycogen supercompensate was, first, to depletethe muscle glycogen stores with an exhaustiveexercise bout; second, to eat a carbohydrate-freediet for 3 days; third, to deplete the glycogenstores once more with an exhaustive exercisebout; and fourth, to consume a high carbohy-drate diet for 3 days.
Because of the strenuous nature of thisregimen, many athletes have found it impracti-cal, even though it has been used successfully byvery elite performers. The 3 days of low carbohy-drate diet may cause hypoglycaemia, irritabilityand chronic fatigue. The two bouts of exhaustiveexercise prior to competition may result in injury,soreness and fatigue, and prevents a proper taperbefore competition. To address this problem,Sherman et al. (1981) studied three types ofmuscle glycogen supercompensation regimenson six trained runners. Over a 6-day period, the subjects ran at approximately 75% of V
.o2max.
for 90 min, 40min, 40 min, 20 min, 20min, andrested, respectively. During each taper, the sub-jects received one of three dietary treatments:1 a mixed diet composed of 50% carbohydrate(control diet),2 a low carbohydrate diet (25% carbohydrate)for the first 3 days and a high carbohydrate diet(70% carbohydrate) for the last 3 days (classicdiet), and3 a mixed diet (50% carbohydrate) for the first 3 days and a high carbohydrate diet (70% carbo-hydrate) the last 3 days (modified diet).
Muscle biopsies were obtained on the morningof the 4th and 7th days of each trial. During the
control treatment, muscle glycogen concen-trations of the gastrocnemius were 135 and 163mmol ·g–1 wet weight on days 4 and 7, respec-tively. During the classic treatment, the corre-sponding muscle glycogen concentrations were80 and 210mmol ·g–1 wet weight, and during the modified treatment they were 135 and 204mmol ·g–1 wet weight (Fig. 7.2). These resultssuggest that a normal training taper in conjunc-tion with a moderate carbohydrate–high carbo-hydrate diet sequence is as effective as the classicglycogen supercompensation regimen for highlytrained endurance athletes.
Enhancement of glycogen synthesisafter exercise
Long-term recovery
The amount of carbohydrate consumed has a sig-nificant effect on the rate of glycogen storageafter exercise. Unless sufficient carbohydrate is ingested, muscle glycogen will not be nor-malized on a day-to-day basis between trainingbouts, nor will efforts to supercompensatemuscle glycogen stores be successful. In general,with an increase in carbohydrate ingestion thereis an increase in muscle glycogen storage. Costillet al. (1981) reported that consuming 150–650gcarbohydrate · day–1 resulted in a proportion-ately greater muscle glycogen synthesis duringthe initial 24h after exercise, and that consump-tion of more than 600 g carbohydrate · day–1 wasof no additional benefit (Fig. 7.3). It has also beendemonstrated that when the carbohydrate con-centration of the diet was inadequate, successivedays of intense, prolonged exercise resulted in agradual reduction in the muscle glycogen storesand a deterioration in performance (Costill et al.1971; Sherman et al. 1993). For example, Shermanet al. (1993) fed endurance athletes either 5 or 10gcarbohydrate · kg–1 ·day–1 over 7 days of con-trolled training. The lower carbohydrate dietcontained 42% of energy from carbohydrate andthe higher carbohydrate diet contained 84% ofenergy from carbohydrate. Both diet and exercisewere controlled during the 7 days prior to the
optimization of glycogen stores 101

experimental period to ensure that subjectsstarted with similar muscle glycogen levels. Thelower carbohydrate diet produced a significant30% decline in muscle glycogen by day 5 of train-ing, which was then maintained through day 7.However, there was no decline in muscle glyco-gen during the 7 days of training when the ath-letes consumed the higher carbohydrate diet.
102 nutrition and exercise
The type of carbohydrate consumed alsoappears to have an effect on the rate of glycogenresynthesis following exercise. Costill et al. (1971)fed glycogen-depleted runners a starch orglucose diet (650g carbohydrate · day–1) duringthe 2 days following depletion. During the first24h there was no difference in the synthesis ofmuscle glycogen between the two diets, but afterthe 2nd day, the starch diet resulted in a sig-nificantly greater glycogen synthesis than theglucose diet. A difference in glycogen storagebetween simple and complex carbohydrates,however, was not demonstrated by Roberts et al.(1988). Following glycogen-depleting exercise,their subjects were fed diets consisting of either88% simple and 12% complex carbohydrates or15% simple and 85% complex carbohydrates.After 3 days of recovery, it was found that thetwo diets had produced equivalent increases inmuscle glycogen storage. The difference betweenstudies is not immediately clear, but may be dueto differences in the glycaemic indexes of the dif-ferent carbohydrates provided.
The only study that appears to have investi-gated the impact of the glycaemic index of car-bohydrate on muscle glycogen storage after
220
165
110
55
00 1 2 3 4 5 6
Regimen (days)
Gly
cog
en(µ
mo
l. g–1
wet
wt)
Exercise
Exercise Exercise
Fig. 7.2 A comparison of the classic Bergström et al. (1967) glycogen supercompensation method and amodification of that method by Sherman et al. (1983). The classic method (—) consisted of depleting the glycogenstores with an exhaustive exercise bout, followed by 3 days on a low carbohydrate diet. This was followed withanother glycogen-depleting exercise and 3 days on a high carbohydrate diet. The modifications by Sherman (- - - -)included a hard exercise bout that was followed by 6 days of exercise tapering. During the first 3 days of the taper, amixed diet consisting of 50% carbohydrates was consumed. During the last 3 days, a high carbohydrate diet wasconsumed. The two values for the classic regimen on day 3 represent before and after an exhaustive exercise bout.�, low carbohydrate diet; �, mixed diet; �, high carbohydrate diet. From Sherman et al. (1983), with permission.
80
60
40
20
0
–200 200 400 600
Consumed carbohydrate (g.day–1)
Gly
cog
en s
tora
ge
(µm
ol. g
–1 w
et w
t.h
–1)
Fig. 7.3 The relationship between the amount ofcarbohydrate consumed and the rate of muscleglycogen storage during a 24-h period after glycogendepletion by exercise. From Costill et al. (1981), withpermission.

exercise was conducted by Burke et al. (1993).Subjects were exercised to deplete the muscleglycogen stores on two separate occasions andprovided a diet composed of carbohydrate witha high glycaemic index on one occasion, and adiet composed of carbohydrate with a low glycaemic index on the other. Total carbohy-drate intake over the 24-h recovery period was 10g · kg–1 body weight, evenly distributedbetween meals eaten at 0, 4, 8 and 21 h after exer-cise. The increase in muscle glycogen averaged106mmol ·g–1 wet weight for the high glycaemicindex carbohydrate and 71.5mmol · g–1 wetweight for the low glycaemic index. The differ-ence in glycogen storage was significant. Thisfinding suggests that the increase in muscleglycogen content during long-term recovery isaffected by the amount and glycaemic index ofthe carbohydrate consumed.
Short-term recovery
While procedures for increasing muscle glyco-gen above normal levels in preparation for com-petition and maintaining normal glycogen levelson a day-to-day basis have been defined, theseprocedures do not address the problem of athletic competitions that require the rapidresynthesis of muscle glycogen within hours.Although it is unlikely that muscle glycogenstores could be completely resynthesized withina few hours by nutritional supplementationalone, it would be of benefit to the athlete if sup-plementation procedures which maximized therate of muscle glycogen storage after exercisewere defined. Factors that influence the rate ofmuscle glycogen storage immediately followingexercise are the timing, amount and type of car-bohydrate supplement consumed, the frequencyof feeding, and the type of exercise performed.
timing of carbohydrateconsumption after exercise
The time elapsed between competition or a pro-longed exercise bout and the consumption of acarbohydrate supplement will critically influ-ence the rate of muscle glycogen resynthesis (Ivy
et al. 1988a). When carbohydrate supplementsare provided immediately after exercise, theygenerally result in a rate of glycogen resynthesisof between 5 and 6mmol · g–1 wet weight ·h–1
(Maehlum et al. 1977; Blom et al. 1987; Ivy et al.1988a, 1988b). This rate is maintained for approx-imately 2 h and then declines by approximately50% over the next 2 h as the blood glucose andinsulin levels decline to after-exercise levels (Ivyet al. 1988a). If the supplement is delayed for 2 h,the rate of glycogen resynthesis during the 2 himmediately after consumption ranges between3 and 4mmol · g–1 wet weight · h–1, or about 50% asfast as when the supplement is provided imme-diately after exercise (Fig. 7.4). This lower rate of glycogen resynthesis occurs despite normalincreases in blood glucose and insulin levels. Itappears that when the carbohydrate supplementis delayed for several hours after exercise, themuscle becomes insulin resistant, reducing therate of muscle glucose uptake and glycogen
optimization of glycogen stores 103
Fig. 7.4 Muscle glycogen storage during the first 2 hand second 2 h of recovery from exercise. The open barrepresents the glycogen storage when thecarbohydrate supplement was provided immediatelyafter exercise, and the black bar represents theglycogen storage when the supplement was delayeduntil 2 h into recovery. The carbohydrate supplementconsisted of a 23% solution of glucose polymers (2 g · kg–1 body weight). From Ivy et al. (1988a), withpermission.
Gly
coge
n sy
nthe
sis (µ
mol
. g–1
wet
wt)
20
0
15
10
0–120
5
120–240
Time after exercise (min)
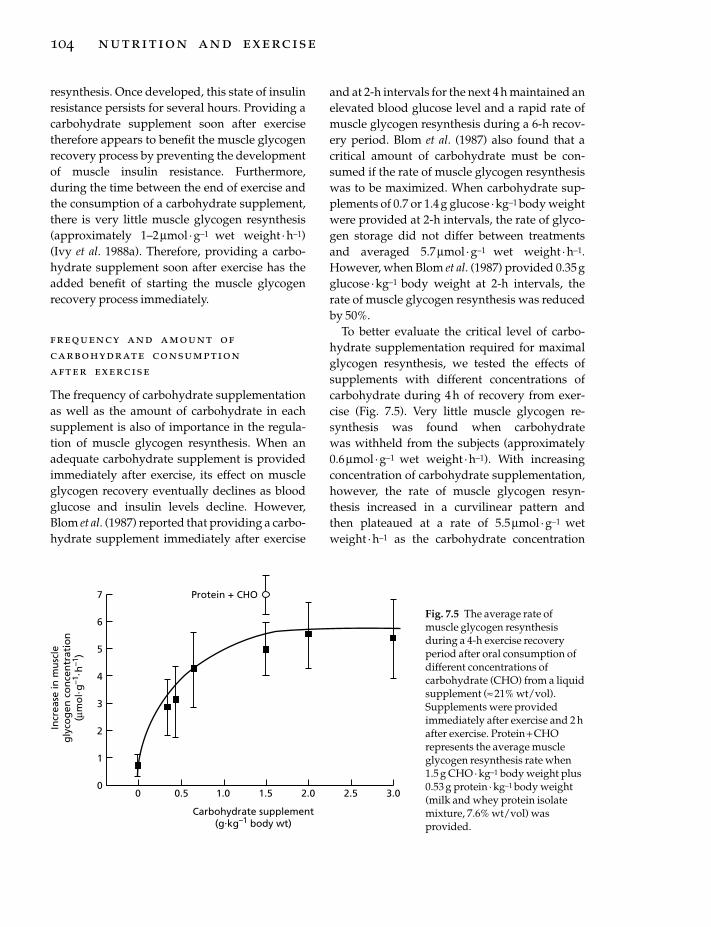
resynthesis. Once developed, this state of insulinresistance persists for several hours. Providing acarbohydrate supplement soon after exercisetherefore appears to benefit the muscle glycogenrecovery process by preventing the developmentof muscle insulin resistance. Furthermore,during the time between the end of exercise andthe consumption of a carbohydrate supplement,there is very little muscle glycogen resynthesis(approximately 1–2mmol · g–1 wet weight · h–1)(Ivy et al. 1988a). Therefore, providing a carbo-hydrate supplement soon after exercise has theadded benefit of starting the muscle glycogenrecovery process immediately.
frequency and amount ofcarbohydrate consumptionafter exercise
The frequency of carbohydrate supplementationas well as the amount of carbohydrate in eachsupplement is also of importance in the regula-tion of muscle glycogen resynthesis. When anadequate carbohydrate supplement is providedimmediately after exercise, its effect on muscleglycogen recovery eventually declines as bloodglucose and insulin levels decline. However,Blom et al. (1987) reported that providing a carbo-hydrate supplement immediately after exercise
104 nutrition and exercise
and at 2-h intervals for the next 4 h maintained anelevated blood glucose level and a rapid rate ofmuscle glycogen resynthesis during a 6-h recov-ery period. Blom et al. (1987) also found that acritical amount of carbohydrate must be con-sumed if the rate of muscle glycogen resynthesiswas to be maximized. When carbohydrate sup-plements of 0.7 or 1.4 g glucose · kg–1 body weightwere provided at 2-h intervals, the rate of glyco-gen storage did not differ between treatmentsand averaged 5.7mmol · g–1 wet weight ·h–1.However, when Blom et al. (1987) provided 0.35gglucose ·kg–1 body weight at 2-h intervals, therate of muscle glycogen resynthesis was reducedby 50%.
To better evaluate the critical level of carbo-hydrate supplementation required for maximalglycogen resynthesis, we tested the effects ofsupplements with different concentrations ofcarbohydrate during 4h of recovery from exer-cise (Fig. 7.5). Very little muscle glycogen re-synthesis was found when carbohydrate was withheld from the subjects (approximately0.6mmol ·g–1 wet weight ·h–1). With increasingconcentration of carbohydrate supplementation,however, the rate of muscle glycogen resyn-thesis increased in a curvilinear pattern and then plateaued at a rate of 5.5mmol · g–1 wetweight ·h–1 as the carbohydrate concentration
7
6
5
4
3
2
1
0
Protein + CHO
0 0.5 1.0 1.5 2.0 2.5 3.0
Carbohydrate supplement(g.kg–1 body wt)
Incr
ease
in m
usc
leg
lyco
gen
co
nce
ntr
atio
n(µ
mo
l.g
–1. h
–1)
Fig. 7.5 The average rate ofmuscle glycogen resynthesisduring a 4-h exercise recoveryperiod after oral consumption ofdifferent concentrations ofcarbohydrate (CHO) from a liquidsupplement (ª 21% wt/vol).Supplements were providedimmediately after exercise and 2 hafter exercise. Protein + CHOrepresents the average muscleglycogen resynthesis rate when1.5 g CHO · kg–1 body weight plus0.53 g protein · kg–1 body weight(milk and whey protein isolatemixture, 7.6% wt/vol) wasprovided.

approached 1–1.5g ·kg–1 body weight. Theseresults imply that when carbohydrate supple-ments are provided at 2-h intervals in amountsbelow 1g ·kg–1 body weight, the rate of muscleglycogen resynthesis will be submaximal. Thereduced rate of resynthesis is probably due to theinability of a small carbohydrate supplement toadequately increase and maintain blood glucoseand insulin levels for a 2-h interval, as smallersupplements taken more frequently have beenfound to be adequate (Doyle et al. 1993).
The reason for similar glycogen resynthesisrates when carbohydrate supplements exceed 1 g · kg–1 body weight was not immediately clear.Estimates of gastric emptying rates, based on theresearch of Hunt et al. (1985), suggest that carbo-hydrate available to the muscle was far in excessof the amount actually converted to glycogen.This would indicate that under conditions ofhigh carbohydrate supplementation, the rate-limiting step in glycogen resynthesis is eitherglucose transport or the processing of glucosethrough the glycogen synthetic pathway. To testthis hypothesis, Reed et al. (1989) continuouslyinfused glycogen-depleted subjects with 3 gglucose ·kg–1 body weight during the first 3.75hof a 4-h exercise recovery period. The rate ofmuscle glycogen resynthesis during infusionwas then compared with that which occurredwhen a liquid supplement containing 1.5gglucose ·kg–1 body weight was consumed imme-diately after and 2h after exercise. During infu-sion, blood glucose increased to 10mm, whereasthe blood glucose level only reached 6mm whenthe liquid glucose supplement was consumedorally. Despite this large difference in bloodglucose, the rates of muscle glycogen resynthesiswere virtually identical at the end of the recoveryperiods. The results of Reed et al. (1989) thereforesupport the hypothesis that glycogen resynthesisis not limited by glucose availability when ade-quate carbohydrate is consumed.
Prior research studies employing glucose infu-sion (Ahlborg et al. 1967b; Bergström & Hultman1967c; Roch-Norlund et al. 1972), however, havegenerally demonstrated greater rates of glycogensynthesis than those reported by Reed et al.
(1989). Possibly accounting for the difference insynthesis rates are the different rates of glucoseinfusion. The rates of glucose infusion in theearlier studies were much faster and plasmaglucose concentrations two to three times higherthan those reported by Reed et al. (1989). It islikely that plasma insulin concentrations in theearlier studies were greater as well, althoughthese results were not reported.
It was of interest to note that in the study byReed et al. (1989) the plasma insulin responseduring the infusion treatment was similar to thatproduced by the liquid supplement, and there-fore could account for the similar rates of glyco-gen storage for these two treatments. The bloodinsulin concentration plays a major role in deter-mining the rate of muscle glycogen storage.Insulin stimulates both muscle glucose transportand activation of glycogen synthase. The resultsraised the possibility that increasing the insulinresponse to a carbohydrate supplement couldincrease the rate of muscle glucose uptake andglycogen storage.
protein plus carbohydrate
Certain amino acids are effective secretagoguesof insulin and have been found to synergisticallyincrease the blood insulin response to a carbohy-drate load when administered in combination(Floyd et al. 1966; Fajans et al. 1967). Of the 20amino acids normally found in protein, the mosteffective insulin secretagogue is arginine (Fajanset al. 1967). When infused with carbohydrate,arginine has been found to increase the insulinresponse fivefold above that produced by thecarbohydrate or arginine alone. However, wehave found the use of amino acids to be impracti-cal when added to a carbohydrate supplementbecause they produce many unwanted side-effects such as mild borborygmus and diarrhoea.
Protein meals and supplements also have beenfound to enhance the insulin response to a carbo-hydrate load and do not produce the unwantedside-effects of the amino acids (Rabinowitz et al.1966; Pallota & Kennedy 1968; Spiller et al. 1987).For example, Spiller et al. (1987) demonstrated an
optimization of glycogen stores 105

increased blood insulin response and decreasedblood glucose response with the addition ofprotein to a 58g carbohydrate supplement. Theinsulin response was found to be directly pro-portional and the glucose response inverselyproportional to the protein content of the carbohydrate–protein supplement. No adverseside-effects were reported.
We therefore investigated the effects of a car-bohydrate–protein supplement on muscle glyco-gen resynthesis after exercise (Zawadzki et al.1992). The supplements tested consisted of 112gcarbohydrate or 112g carbohydrate plus 40.7 gprotein (21% wt/vol mixture). The supplementswere administered immediately after exerciseand 2 h after exercise. It was found that the com-bination of carbohydrate plus protein resulted ina synergistic insulin response. In conjunctionwith the greater insulin response was a signifi-cantly lower blood glucose response and a 38%faster rate of muscle glycogen storage com-pared with carbohydrate supplementationalone. Rates of muscle glycogen resynthesis aver-aged 7.1mmol · g–1 wet weight ·h–1 for the carbo-hydrate–protein treatment and 5.0mmol · g–1 wetweight ·h–1 for the carbohydrate treatmentduring the 4-h recovery period (see Fig. 7.5). Itwas also found that carbohydrate oxidation ratesand blood lactate concentrations for the carbohy-
106 nutrition and exercise
drate–protein and carbohydrate treatments were similar. These results suggested that theincreased rate of muscle glycogen resynthesisduring the carbohydrate–protein treatment wasthe result of an increased clearance of glucose bythe muscle due to the increased blood insulinresponse. Since the carbohydrate–protein sup-plement was palatable and there were nounwanted side-effects, it would appear to be aviable supplement for postexercise glycogenrecovery.
differences insimple carbohydrates
The effect of supplements composed of predomi-nately glucose, fructose and sucrose have alsobeen investigated (Blom et al. 1987). Glucose andfructose are metabolized differently. They havedifferent gastric emptying rates and are absorbedinto the blood at different rates. Furthermore, theinsulin response to a glucose supplement is gen-erally much greater than that of a fructose sup-plement. Blom et al. (1987) found that ingestionof glucose or sucrose was twice as effective asfructose for restoration of muscle glycogen (Fig.7.6). They suggested that the differences betweenthe glucose and fructose supplementations werethe result of the way the body metabolized these
Incr
ease
in m
usc
leg
lyco
gen
co
nce
ntr
atio
n(µ
mo
l. kg
–1 w
et w
t)
40
20
00 1 2 3 4 5 6
Time (h)
GlucoseSucrose
Fructose
Fig. 7.6 Increases in muscleglycogen concentration whenglucose, fructose and sucrose areprovided in amounts of 0.7 g · kg–1
body weight immediately afterexercise and at 2-h intervals.From Blom et al. (1987), withpermission.
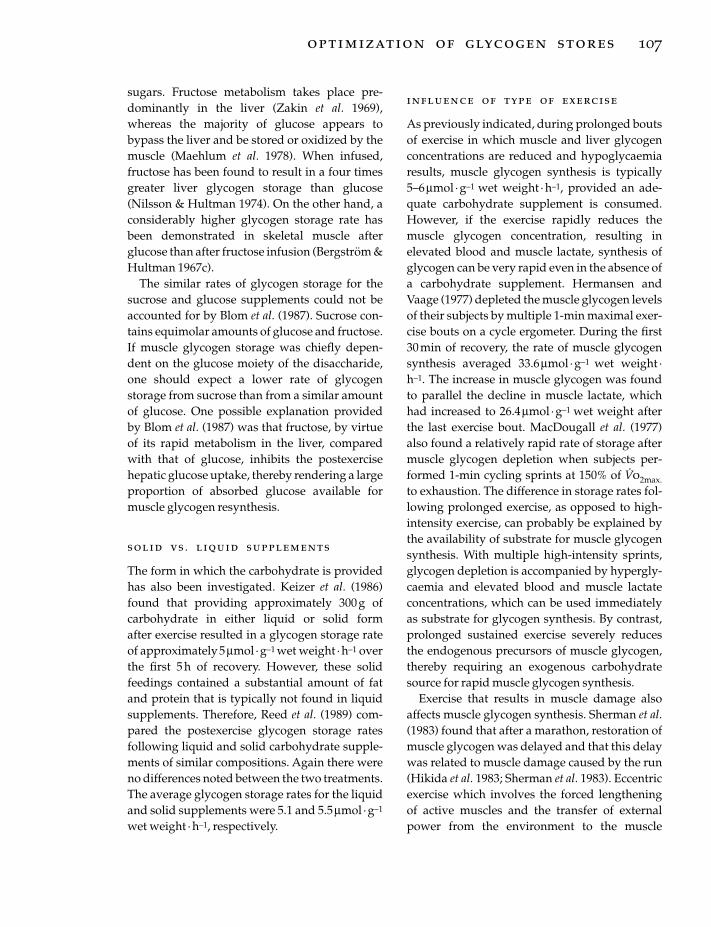
sugars. Fructose metabolism takes place pre-dominantly in the liver (Zakin et al. 1969),whereas the majority of glucose appears tobypass the liver and be stored or oxidized by themuscle (Maehlum et al. 1978). When infused,fructose has been found to result in a four timesgreater liver glycogen storage than glucose(Nilsson & Hultman 1974). On the other hand, aconsiderably higher glycogen storage rate hasbeen demonstrated in skeletal muscle afterglucose than after fructose infusion (Bergström &Hultman 1967c).
The similar rates of glycogen storage for thesucrose and glucose supplements could not beaccounted for by Blom et al. (1987). Sucrose con-tains equimolar amounts of glucose and fructose.If muscle glycogen storage was chiefly depen-dent on the glucose moiety of the disaccharide,one should expect a lower rate of glycogenstorage from sucrose than from a similar amountof glucose. One possible explanation providedby Blom et al. (1987) was that fructose, by virtueof its rapid metabolism in the liver, comparedwith that of glucose, inhibits the postexercisehepatic glucose uptake, thereby rendering a largeproportion of absorbed glucose available formuscle glycogen resynthesis.
solid vs. liquid supplements
The form in which the carbohydrate is providedhas also been investigated. Keizer et al. (1986)found that providing approximately 300g of carbohydrate in either liquid or solid form after exercise resulted in a glycogen storage rateof approximately5mmol ·g–1 wet weight ·h–1 overthe first 5 h of recovery. However, these solidfeedings contained a substantial amount of fatand protein that is typically not found in liquidsupplements. Therefore, Reed et al. (1989) com-pared the postexercise glycogen storage rates following liquid and solid carbohydrate supple-ments of similar compositions. Again there wereno differences noted between the two treatments.The average glycogen storage rates for the liquidand solid supplements were 5.1 and 5.5mmol ·g–1
wet weight ·h–1, respectively.
influence of type of exercise
As previously indicated, during prolonged boutsof exercise in which muscle and liver glycogenconcentrations are reduced and hypoglycaemiaresults, muscle glycogen synthesis is typically5–6mmol ·g–1 wet weight ·h–1, provided an ade-quate carbohydrate supplement is consumed.However, if the exercise rapidly reduces themuscle glycogen concentration, resulting in elevated blood and muscle lactate, synthesis ofglycogen can be very rapid even in the absence ofa carbohydrate supplement. Hermansen andVaage (1977) depleted the muscle glycogen levelsof their subjects by multiple 1-min maximal exer-cise bouts on a cycle ergometer. During the first30min of recovery, the rate of muscle glycogensynthesis averaged 33.6mmol ·g–1 wet weight ·h–1. The increase in muscle glycogen was foundto parallel the decline in muscle lactate, whichhad increased to 26.4mmol ·g–1 wet weight afterthe last exercise bout. MacDougall et al. (1977)also found a relatively rapid rate of storage aftermuscle glycogen depletion when subjects per-formed 1-min cycling sprints at 150% of V
.o2max.
to exhaustion. The difference in storage rates fol-lowing prolonged exercise, as opposed to high-intensity exercise, can probably be explained bythe availability of substrate for muscle glycogensynthesis. With multiple high-intensity sprints,glycogen depletion is accompanied by hypergly-caemia and elevated blood and muscle lactateconcentrations, which can be used immediatelyas substrate for glycogen synthesis. By contrast,prolonged sustained exercise severely reducesthe endogenous precursors of muscle glycogen,thereby requiring an exogenous carbohydratesource for rapid muscle glycogen synthesis.
Exercise that results in muscle damage alsoaffects muscle glycogen synthesis. Sherman et al.(1983) found that after a marathon, restoration ofmuscle glycogen was delayed and that this delaywas related to muscle damage caused by the run(Hikida et al. 1983; Sherman et al. 1983). Eccentricexercise which involves the forced lengtheningof active muscles and the transfer of externalpower from the environment to the muscle
optimization of glycogen stores 107

causes severe muscle damage. O’Reilly et al.(1987) reported that muscle glycogen storesreduced by eccentric exercise were still signifi-cantly below normal levels after 10 days of recov-ery. Costill et al. (1990) also found that the rate ofmuscle glycogen resynthesis was significantlyreduced following glycogen depletion by exer-cise that incorporated a substantial eccentriccomponent, and that the reduced rate of resyn-thesis was associated with muscle damage. Morerecently, Asp et al. (1995) demonstrated thatmuscle damage induced by eccentric exerciseresulted in a down regulation of GLUT-4 proteinthat lasted for several days. In addition, it wasnot until the GLUT-4 protein returned to the pre-exercise concentration that normal muscle glyco-gen levels were restored. These results suggestthat muscle damage following exercise can limitglucose uptake due to a reduced GLUT-4 proteinconcentration, and that this limits the restorationof muscle glycogen.
Recommendations
From a dietary position, the first concern of theendurance athlete is that energy consumptionand energy expenditure be in balance (Sherman1995). The endurance athlete may expend 15–30MJ ·day–1 when training. If consumption isinadequate and not balanced with expenditure,the athlete’s training and competitive abilitieswill eventually be adversely affected. It is alsoimportant that a substantial percentage of thediet consist of carbohydrate. It was suggested bySherman and Lamb (1988) that the enduranceathelete’s diet consists of approximately 65% car-bohydrate during strenuous training. However,this percentage can be modified according toactual energy consumption. What is important isthe amount of carbohydrate consumed. Costill et al. (1981) recommended that endurancetrained athletes consume approximately 8 g car-bohydrate · kg–1 body weight ·day–1 to maintain anormal muscle glycogen concentration duringtraining. Similarly, a recommendation of 7g carbohydrate · kg–1 body weight · day–1 was pro-vided by Sherman (1995).
108 nutrition and exercise
Prior to competition, the muscle and liverglycogen stores should be maximized. For thebest results with the least amount of stress, it isrecommended that a hard training bout be per-formed 7 days prior to competition to reduce themuscle glycogen stores. During the next 3 days,training should be of moderate intensity andduration and a well-balanced mixed diet com-posed of about 45–50% carbohydrate consumed.During the next 3 days, training should be grad-ually tapered and the carbohydrate content ofthe diet should be increased to 70%. This shouldresult in muscle glycogen stores similar to thatnormally produced by the classic glycogensupercompensation regimen, but with much lessstress and fatigue.
For the rapid replenishment of muscle glyco-gen stores, one should consume a carbohydratesupplement in excess of 1 g ·kg–1 body weightimmediately after competition or after a trainingbout. Continuation of supplementation every 2hwill maintain a maximal rate of storage up to 6h after exercise; smaller supplements takenmore frequently are also effective. Increasing the amount of carbohydrate consumption above 1.0–1.5 g ·kg–1 body weight · supplement–1
appears to provide no additional benefit, andmay have the adverse effects of causing nauseaand diarrhoea. Supplements composed ofglucose or glucose polymers are more effec-tive for the replenishment of muscle glycogen stores after exercise than supplements composedof predominantly fructose. However, some fructose is recommended because it is more effec-tive than glucose in the replenishment of liverglycogen. It might also be of benefit to includesome protein with the carbohydrate supplementas this will enhance the rate of glycogen resyn-thesis. Finally, carbohydrates in solid or liquidform can be consumed immediately after exer-cise with similar results. However, a liquid supplement immediately after exercise is recom-mended because it is easier to digest and lessfilling, and therefore will not tend to adverselyaffect one’s normal appetite. A liquid supple-ment also provides a source of fluid for rapidrehydration.

References
Adolfsson, S. (1973) Effect of contraction in vitro onglycogen content and glycogen synthetase activity inmuscle. Acta Physiologica Scandinavica 88, 189–197.
Ahlborg, B., Bergström, J., Ekelund, L.G. & Hultman, E.(1967a) Muscle glycogen and muscle electrolytesduring prolonged physical exercise. Acta PhysiologicaScandinavica 70, 129–142.
Ahlborg, B.G., Bergström, J., Brohult, J., Ekelund, L.G.,Hultman, E. & Maschio, G. (1967b) Human muscleglycogen content and capacity for prolonged exer-cise after different diets. Foersvarsmedicin 3, 85–99.
Alonso, M.D., Lomako, J. & Lomako, W.M. (1995) Anew look at the biogenesis of glycogen. FASEBJournal 9, 1126–1137.
Asp, S., Daugaard, J.R. & Richter, E.A. (1995) Eccentricexercise decreases glucose transporter GLUT4protein in human skeletal muscle. Journal of Physiol-ogy 482, 705–712.
Bergström, J. & Hultman, E. (1967a) A study of theglycogen metabolism during exercise in man. Scandi-navian Journal of Clinical and Laboratory Investigation19, 218–226.
Bergström, J. & Hultman, E. (1967b) Muscle glycogensynthesis after exercise: an enhancing factor local-ized to the muscle cells in man. Nature 210, 309–310.
Bergström, J. & Hultman, E. (1967c) Synthesis ofmuscle glycogen in man after glucose and fructoseinfusion. Acta Medica Scandinavica 182, 93–107.
Bergström, J., Hermansen, L., Hultman, E. & Saltin, B.(1967) Diet, muscle glycogen and physical perfor-mance. Acta Physiologica Scandinavica 71, 140–150.
Bergström, J., Hultman, E. & Roch-Norlund, A.E.(1972) Muscle glycogen synthetase in normal sub-jects. Scandinavian Journal of Clinical and LaboratoryInvestigation 29, 231–236.
Blom, P.C.S., Høstmark, A.T., Vaage, O., Kardel, K.R. &Maehlum, S. (1987) Effect of different post-exercisesugar diets on the rate of muscle glycogen synthesis.Medicine and Science in Sports and Exercise 19, 491–496.
Brozinick, J.T. Jr, Yaspelkis, B.B. III, Wilson, C.M. et al.(1996) Glucose transport and GLUT4 distribution inskeletal muscle of GLUT4 transgenic mice. Biochem-istry Journal 313, 133–140.
Burke, L.M., Collier, G.R. & Hargreaves, M. (1993)Muscle glycogen storage after prolonged exercise:effect of the glycaemic index of carbohydrate feed-ings. Journal of Applied Physiology 75, 1019–1023.
Cartee, G.D., Young, D.A., Sleeper, M.D., Zierath, J.,Wallberg-Henriksson, H. & Holloszy, J.O. (1989) Pro-longed increase in insulin-stimulated glucose trans-port in muscle after exercise. American Journal ofPhysiology 256, E494–E499.
Christensen, E.H. & Hansen, O. (1939a) Arbeits-
fähigkeit und Ernünhrung. Skandinavisches Archiv fürPhysiologie 81, 160–171.
Christensen, E.H. & Hansen, O. (1939b) Hypo-glykämie, Arbeitsfähigkeit und Ernührung. Skandi-navisches Archiv für Physiologie 81, 172–179.
Costill, D.L., Bowers, R., Branam, G. & Sparks, K. (1971)Muscle glycogen utilization during prolonged exer-cise on successive days. Journal of Applied Physiology31, 834–838.
Costill, D.L., Sherman, W.M., Fink, W.J., Maresh, C.,Witten, M. & Miller, J.M. (1981) The role of dietarycarbohydrate in muscle glycogen resynthesis afterstrenuous running. American Journal of Clinical Nutri-tion 34, 1831–1836.
Costill, D.L., Pascol, D.D., Fink, W.J., Robergs, R.A.,Barr, S.I. & Pearson, D. (1990) Impaired muscleglycogen resynthesis after eccentric exercise. Journalof Applied Physiology 69, 46–50.
Danforth, W.H. (1965) Glycogen synthetase activity inskeletal muscle: interconversion of two forms andcontrol of glycogen synthesis. Journal of BiologicalChemistry 240, 588–593.
Dill, D.B., Edwards, H.T. & Talbott, J.H. (1932) Studies in muscular activity. VII. Factors limiting the capacity for work. Journal of Physiology 77, 49–62.
Doyle, J.A., Sherman, W.M. & Strauss, R.L. (1993)Effects of eccentric and concentric exercise on muscleglycogen replenishment. Journal of Applied Physiology74, 1848–1855.
Fajans, S.S., Floyd, J.C. Jr, Knopf, R.F. & Conn, J.W.(1967) Effect of amino acids and proteins on insulinsecretion in man. Recent Progress in Hormone Research23, 617–662.
Floyd, J.C. Jr, Fajans, S.S., Conn, J.W., Knopf, R.F. &Rull, J. (1966) Stimulation of insulin secretion byamino acids. Journal of Clinical Investigation 45,1487–1502.
Garetto, L.P., Richter, E.A., Goodman, M.N. & Ruderman, N.B. (1984) Enhanced muscle glucosemetabolism after exercise in the rat: the two phases.American Journal of Physiology 246, E471–E475.
Hansen, P.A., Gulve, E.A., Marshall, B.A. et al. (1995)Skeletal muscle glucose transport and metabolismare enhanced in transgenic mice overexpressing theGlut4 glucose transporter. Journal of Biological Chem-istry 270, 1679–1684.
Hermansen, L. & Vaage, O. (1977) Lactate disappear-ance and glycogen synthesis in human muscle aftermaximal exercise. American Journal of Physiology 233,E422–E429.
Hermansen, L., Hultman, E. & Saltin, B. (1965) Muscleglycogen during prolonged severe exercise. ActaPhysiologica Scandinavica 71, 334–346.
Hikida, R., Staron, R., Hagerman, F., Sherman, W. &Costill, D. (1983) Muscle fiber necrosis associated
optimization of glycogen stores 109
with human marathon running. Journal of Neurologi-cal Science 59, 185–203.
Holloszy, J.O. & Narahara, H.T. (1965) Studies of tis-sue permeability. X. Changes in permeability to 3-methylglucose associated with contraction of iso-lated frog muscle. Journal of Biological Chemistry 240,3493–3500.
Hultman, E. (1967) Studies on muscle metabolism ofglycogen and active phosphate in man with specialreference to exercise and diet. Scandinavian Journal ofClinical and Laboratory Investigation 19 (Suppl. 94),1–63.
Hunt, J.N., Smith, J.L. & Jiang, C.L. (1985) Effect of mealvolume and energy density on the gastric emptyingof carbohydrate. Gastroenterology 89, 1326–1330.
Ivy, J.L. (1977) Role of insulin during exercise-inducedglycogenesis in muscle: effect on cyclic AMP. Ameri-can Journal of Physiology 236, E509–E513.
Ivy, J.L. (1991) Muscle glycogen synthesis before andafter exercise. Sports Medicine 11, 6–19.
Ivy, J.L. & Holloszy, J.O. (1981) Persistent increase inglucose uptake by rat skeletal muscle following exer-cise. American Journal of Physiology 241, C200–C203.
Ivy, J.L., Sherman, W.M., Miller, W., Farrall, S. & Frishberg, B. (1983) Glycogen synthesis: effect of dietand training. In Biochemistry of Exercise (eds H.G.Knuttgen, J.A. Vogel & J. Poortmans), pp. 291–296.Human Kinetics, Champaign, IL.
Ivy, J.L., Frishberg, B.A., Farrell, S.W., Miller, W.J. &Sherman, W.M. (1985) Effects of elevated and exercise-reduced muscle glycogen levels on insulinsensitivity. Journal of Applied Physiology 59, 154–159.
Ivy, J.L., Katz, A.L., Cutler, C.L., Sherman, W.M. &Coyle, E.F. (1988a) Muscle glycogen synthesis afterexercise: effect of time of carbohydrate ingestion.Journal of Applied Physiology 64, 1480–1485.
Ivy, J.L., Lee, M.C., Brozinick, J.T. & Reed, M.J. (1988b)Muscle glycogen storage after different amounts ofcarbohydrate ingestion. Journal of Applied Physiology65, 2018–2023.
Keizer, H.A., vanKuipers, H., Kranenburg, G. &Guerten, P. (1986) Influence of lipid and solid mealson muscle glycogen resynthesis, plasma fuelhormone response, and maximal physical workcapacity. International Journal of Sports Medicine 8,99–104.
Kochan, R.G., Lamb, D.R., Reimann, E.M. & Schlender,K.K. (1981) Modified assays to detect activation ofglycogen synthase following exercise. AmericanJournal of Physiology 240, E197–E202.
Krogh, A. & Lindhard, J. (1920) Relative value of fat andcarbohydrate as a source of muscular energy: withappendices on the correlation between standardmetabolism and the respiratory quotient during restand work. Biochemistry Journal 14, 290–298.
Levine, S.A., Gordon, B. & Derrick, C.L. (1924) Some
110 nutrition and exercise
changes in the chemical constituents of the blood fol-lowing a marathon race: with special reference to thedevelopment of hypoglycemia. Journal of the Ameri-can Medical Association 82, 1778–1779.
MacDougall, J.D., Ward, G.R., Sale, D.G. & Sutton, J.R.(1977) Muscle glycogen repletion after high-intensityintermittent exercise. Journal of Applied Physiology 42,129–132.
Maehlum, S. & Hermansen, L. (1978) Muscle glycogenduring recovery after prolonged severe exercise infasting subjects. Scandinavian Journal of Clinical andLaboratory Investigation 38, 557–560.
Maehlum, S., Høstmark, A.T. & Hermansen, L. (1977)Synthesis of muscle glycogen during recovery afterprolonged severe exercise in diabetic and non-diabetic subjects. Scandinavian Journal of Clinical andLaboratory Investigation 37, 309–316.
Maehlum, S., Felig, P. & Wahren, J. (1978) Splanchnicglucose and muscle glycogen metabolism afterglucose feeding post-exercise recovery. AmericanJournal of Physiology 235, E255–E260.
Nesher, R., Karl, S.E. & Kipnis, D.M. (1985) Dissociationof effects of insulin and contraction on glucose trans-port ion rat epitrochlearis muscle. American Journal ofPhysiology 249, C226–C232.
Nilsson, L.H. & Hultman, E. (1974) Liver and muscleglycogen in man after glucose and fructose infusion.Scandinavian Journal of Clinical and Laboratory Investi-gation 33, 5–10.
O’Reilly, K.P., Warhol, M.J., Fielding, R.A., Frontera,W.A., Meredith, C.N. & Evans, W.J. (1987) Eccentricexercise-induced muscle damage impairs muscleglycogen repletion. Journal of Applied Physiology 63,252–256.
Pallotta, J.A. & Kennedy, P.J. (1968) Response of plasmainsulin and growth hormone to carbohydrate andprotein feeding. Metabolism 17, 901–908.
Piehl, K. (1974) Time-course for refilling of glycogenstores in human muscle fibers following exercise-induced glycogen depletion. Acta Physiologica Scan-dinavica 90, 297–302.
Price, T.B., Rothman, D.L., Taylor, R., Avison, M.J.,Shulman, G.I. & Shulman, R.G. (1994) Humanmuscle glycogen resynthesis after exercise: insulin-dependent and -independent phases. Journal ofApplied Physiology 76, 104–111.
Rabinowitz, D., Merimee, T.J., Maffezzoli, R. &Burgess, J.A. (1966) Patterns of hormonal releaseafter glucose, protein, and glucose plus protein.Lancet 2, 454–457.
Reed, M.J., Brozinick, J.T., Lee, M.C. & Ivy, J.L. (1989)Muscle glycogen storage postexercise: effect of modeof carbohydrate administration. Journal of AppliedPhysiology 66, 720–726.
Ren, J.-M., Marshall, B.A., Gulve, E.A. et al. (1993) Evi-dence from transgenic mice that glucose transport is

rate-limiting for glycogen deposition and glycolysisin skeletal muscle. Journal of Biological Chemistry 268,16113–16115.
Ren, J.-M., Semenkovich, C.F., Gulve, E.A., Gao, J. &Holloszy, J.O. (1994) Exercise induces rapid increasesin GLUT4 expression, glucose transport capacity,and insulin-stimulated glycogen storage in muscle.Journal of Biological Chemistry 269, 14396–14401.
Richter, E.A., Garetto, L.P., Goodman, N.M. & Ruderman, N.B. (1982) Muscle glycogen metabolismfollowing exercise in the rat. Increased sensitivity toinsulin. Journal of Clinical Investigation 69, 785–793.
Richter, E.A., Garetto, L.P., Goodman, N.M. & Ruderman, N.B. (1984) Enhanced muscle glycogenmetabolism after exercise: modulation by localfactors. American Journal of Physiology 246, E476–E482.
Roberts, K.M., Noble, E.G., Hayden, D.B. & Taylor,A.W. (1988) Simple and complex carbohydrate-richdiets and muscle glycogen content of marathonrunners. European Journal of Applied Physiology 57,70–74.
Roch-Norlund, A.E., Bergström, J. & Hultman, E.(1972) Muscle glycogen and glycogen synthetase innormal subjects and in patients with diabetes melli-tus: effect of intravenous glucose and insulin ad-ministration. Scandinavian Journal of Clinical andLaboratory Investigation 30, 77–84.
Sherman, W.M. (1995) Metabolism of sugars and physi-cal performance. American Journal of Clinical Nutrition62 (Suppl.), 228s–241s.
Sherman, W.M. & Lamb, D.R. (1988) Nutrition and pro-longed exercise. In Perspectives in Exercise Science andSports Medicine: Prolonged Exercise (ed. D.R. Lamb),pp. 213–277. Benchmark Press, Indianapolis, IN.
Sherman, W.M., Costill, D.L., Fink, W.J. & Miller, J.M.
(1981) The effect of exercise and diet manipulationon muscle glycogen and its subsequent utilizationduring performance. International Journal of SportsMedicine 2, 114–118.
Sherman, W.M., Doyle, J.A., Lamb, D.R. & Strauss, R.H.(1993) Dietary carbohydrate, muscle glycogen, andexercise performance during 7 d of training. Ameri-can Journal of Clinical Nutrition 57, 27–31.
Sherman, W.M., Costill, D.L., Fink, W., Hagerman, F.,Armstrong, L. & Murray, T. (1983) Effect of a 42.2-kmfootrace and subsequent rest or exercise on muscleglycogen and enzymes. Journal of Applied Physiology55, 1219–1224.
Smythe, C. & Cohen, P. (1991) The discovery of glyco-genin and the priming mechanism for glycogen biogenesis. European Journal of Biochemistry 200, 625–631.
Spiller, G.A., Jensen, C.D., Pattison, T.S., Chuck, C.S.,Whittam, J.H. & Scala, J. (1987) Effect of protein doseon serum glucose and insulin response to sugars.American Journal of Clinical Nutrition 46, 474–480.
Szanto, S. & Yudkin, J. (1969) The effect of dietarysucrose on blood lipids, serum insulin, platelet adhe-siveness and body weight in human volunteers. Post-graduate Medical Journal 45, 602–607.
Terjung, R.L., Baldwin, K.M., Winder, W.W. & Holloszy,J.O. (1974) Glycogen in different types of muscle andin liver after exhausting exercise. American Journal ofPhysiology 226, 1387–1391.
Zakin, D., Herfman, R.H. & Gordon, W.C. (1969) Theconversion of glucose and fructose to fatty acids inthe human liver. Biochemical Medicine 2, 427–437.
Zawadzki, K.M., Yaspelkis, B.B. & Ivy, J.L. (1992) Carbohydrate-protein complex increases the rate of muscle glycogen storage after exercise. Journal ofApplied Physiology 72, 1854–1859.
optimization of glycogen stores 111

Introduction
Muscle glycogen depletion and/or hypogly-caemia are associated with fatigue during pro-longed strenuous exercise (Hermansen et al.1967; Coyle et al. 1986), highlighting the criticalimportance of carbohydrate (CHO) availabil-ity for intramuscular adenosine triphosphatesupply (Norman et al. 1987; Sahlin et al. 1990;Spencer et al. 1991). In the early part of thiscentury, the benefit of CHO ingestion during pro-longed exercise was recognized in a classic fieldstudy (Gordon et al. 1925). Over the years since,numerous controlled, laboratory studies havedemonstrated that ingestion of CHO during pro-longed, strenuous exercise results in enhancedexercise performance. Many studies have usedexercise time to fatigue as their measure ofendurance capacity and this is increased by CHOingestion (Coyle et al. 1983, 1986; Björkman et al.1984; Coggan & Coyle 1987, 1989; Sasaki et al.1987; Spencer et al. 1991; Davis et al. 1992; Wilber& Moffatt 1992; Tsintzas et al. 1996a, 1996b).Recently it has been argued that time to fatigue is not a reliable test of endurance performance(Jeukendrup et al. 1996); however, in well-motivated subjects, who have been familiarizedwith the testing procedures, it remains a usefullaboratory test for elucidating mechanisms offatigue. Nevertheless, there are no Olympicevents in ‘exercise time to fatigue’, and it isperhaps more appropriate to assess enduranceperformance by tests that measure the time takento complete a standard task or the work output in
a certain amount of time. Using such tests, CHOingestion has been shown to improve perfor-mance as measured by enhanced work output orreduced exercise time (Neufer et al. 1987; Coggan& Coyle 1988; Mitchell et al. 1989; Williams etal. 1990; Murray et al. 1991; Tsintzas et al. 1993;Below et al. 1995; McConell et al. 1996;Jeukendrup et al. 1997). The increases in exerciseperformance with CHO ingestion are believed to be due to maintenance of a high rate of CHO oxidation and increased CHO availabilitywithin contracting skeletal muscle (Coyle et al.1986; Coggan & Coyle 1987; Tsintzas et al. 1996a).In addition, the prevention of neuroglucopeniaand effects on central nervous system functionmay play a role (Davis et al. 1992). Interestingly,several recent studies have observed improvedhigh-intensity and intermittent exercise perfor-mance with CHO ingestion when, under normalcircumstances, CHO availability is not thoughtto be limiting (Anantaraman et al. 1995; Ball et al.1995; Below et al. 1995; Nicholas et al. 1995; Daviset al. 1997; Jeukendrup et al. 1997). The mecha-nisms underlying the ergogenic benefit of CHOingestion under these circumstances remain to bedetermined, but may involve small increases inintramuscular CHO availability under condi-tions of high CHO utilization. Performance in a20-km cycle time trial, lasting about 30min, wasnot affected by CHO ingestion (Palmer et al.1998).
Chapter 8
Carbohydrate Replacement during Exercise
MARK HARGREAVES
112

Metabolic responses to CHOingestion during exercise
Ingestion of CHO during prolonged, strenuousexercise results in higher blood glucose levelsand rates of CHO oxidation late in exercise (Fig.8.1) (Coyle et al. 1986; Coggan & Coyle 1987).Liver glucose output is reduced by CHO inges-tion (Fig. 8.2) (Bosch et al. 1994; McConell et al.1994) and while the tracer method used cannotdistinguish between liver glycogenolysis andgluconeogenesis, it is likely that there is a signifi-cant liver glycogen sparing effect of CHO inges-tion. A reduction in splanchnic gluconeogenicprecursor and oxygen uptake during prolonged,low-intensity exercise following CHO ingestion
suggests a lower rate of gluconeogenesis(Ahlborg & Felig 1976) and this has recently beenconfirmed in experiments using tracers to esti-mate rates of gluconeogenesis (Jeukendrup et al.1999). Muscle glucose uptake during exercise, asmeasured by tracer-determined glucose Rd, isincreased by CHO ingestion (McConell et al.1994). This is consistent with previous observa-tions of increased leg glucose uptake during low-intensity exercise (Ahlborg & Felig 1976) andelevated rates of glucose disposal and oxidationduring strenuous exercise when blood glucoseavailability is increased (Coggan et al. 1991;Coyle et al. 1991; Bosch et al. 1994; Hawley et al.1994; Howlett et al. 1998).
Most, if not all, studies utilizing prolonged
carbohydrate replacement during exercise 113
CHO
Placebo
CHO
Placebo
*
*
*
**
*
**
*
0 1 2 3 4
0 1 2 3 4
(a)
Plas
ma
glu
cose
(mM
)
6
5
4
3
2
2.6
2.2
1.8
1.4
Car
bo
hyd
rate
oxi
dat
ion
(g.m
in–1
)
(b) Exercise time (h)
Fig. 8.1 (a) Plasma glucose and(b) rates of carbohydrate (CHO)oxidation during exercise tofatigue at 70–74% V
.o 2peak with
ingestion of either a placebo (�)or CHO (�) solution every 20min. Values are means ± SEM(n = 7). *, difference from CHO, P < 0.05. Adapted from Coyle et al.(1986).
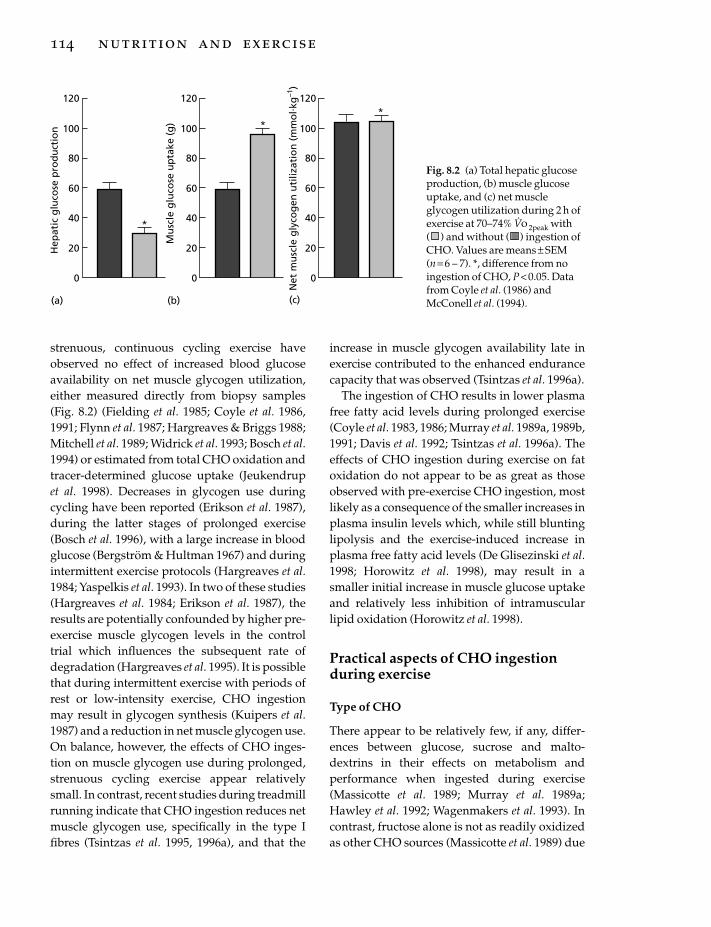
strenuous, continuous cycling exercise haveobserved no effect of increased blood glucoseavailability on net muscle glycogen utilization,either measured directly from biopsy samples(Fig. 8.2) (Fielding et al. 1985; Coyle et al. 1986,1991; Flynn et al. 1987; Hargreaves & Briggs 1988;Mitchell et al. 1989; Widrick et al. 1993; Bosch et al.1994) or estimated from total CHO oxidation andtracer-determined glucose uptake (Jeukendrupet al. 1998). Decreases in glycogen use duringcycling have been reported (Erikson et al. 1987),during the latter stages of prolonged exercise(Bosch et al. 1996), with a large increase in bloodglucose (Bergström & Hultman 1967) and duringintermittent exercise protocols (Hargreaves et al.1984; Yaspelkis et al. 1993). In two of these studies(Hargreaves et al. 1984; Erikson et al. 1987), theresults are potentially confounded by higher pre-exercise muscle glycogen levels in the controltrial which influences the subsequent rate ofdegradation (Hargreaves et al. 1995). It is possiblethat during intermittent exercise with periods ofrest or low-intensity exercise, CHO ingestionmay result in glycogen synthesis (Kuipers et al.1987) and a reduction in net muscle glycogen use.On balance, however, the effects of CHO inges-tion on muscle glycogen use during prolonged,strenuous cycling exercise appear relativelysmall. In contrast, recent studies during treadmillrunning indicate that CHO ingestion reduces netmuscle glycogen use, specifically in the type Ifibres (Tsintzas et al. 1995, 1996a), and that the
114 nutrition and exercise
increase in muscle glycogen availability late inexercise contributed to the enhanced endurancecapacity that was observed (Tsintzas et al. 1996a).
The ingestion of CHO results in lower plasmafree fatty acid levels during prolonged exercise(Coyle et al. 1983, 1986; Murray et al. 1989a, 1989b,1991; Davis et al. 1992; Tsintzas et al. 1996a). Theeffects of CHO ingestion during exercise on fatoxidation do not appear to be as great as thoseobserved with pre-exercise CHO ingestion, mostlikely as a consequence of the smaller increases inplasma insulin levels which, while still bluntinglipolysis and the exercise-induced increase inplasma free fatty acid levels (De Glisezinski et al.1998; Horowitz et al. 1998), may result in asmaller initial increase in muscle glucose uptakeand relatively less inhibition of intramuscularlipid oxidation (Horowitz et al. 1998).
Practical aspects of CHO ingestionduring exercise
Type of CHO
There appear to be relatively few, if any, differ-ences between glucose, sucrose and malto-dextrins in their effects on metabolism andperformance when ingested during exercise(Massicotte et al. 1989; Murray et al. 1989a;Hawley et al. 1992; Wagenmakers et al. 1993). Incontrast, fructose alone is not as readily oxidizedas other CHO sources (Massicotte et al. 1989) due
(a) (b) (c)
*
Hep
atic
glu
cose
pro
du
ctio
n
Mu
scle
glu
cose
up
take
(g)
Net
mu
scle
gly
cog
enu
tiliz
atio
n(m
mo
l. kg
–1)
120
100
80
60
40
20
0
*120
100
80
60
40
20
0
*
120
100
80
60
40
20
0
Fig. 8.2 (a) Total hepatic glucoseproduction, (b) muscle glucoseuptake, and (c) net muscleglycogen utilization during 2 h ofexercise at 70–74% V
.o 2peak with
( ) and without ( ) ingestion ofCHO. Values are means ± SEM(n = 6 – 7). *, difference from noingestion of CHO, P < 0.05. Datafrom Coyle et al. (1986) andMcConell et al. (1994).
to its slower rate of absorption, which may causegastrointestinal distress and impaired perfor-mance (Murray et al. 1989a). Interestingly, thecombination of fructose and glucose results inhigher rates of exogenous CHO oxidation thaningestion of either sugar alone (Adopo et al.1994). This may be a consequence of activation oftwo intestinal transport mechanisms, resulting ingreater appearance of ingested CHO from thegastrointestinal tract. Such a finding is consistentwith observations of greater fluid absorptionfrom rehydration beverages containing morethan one CHO (Shi et al. 1995). Whether theincreased exogenous CHO oxidation results inenhanced exercise performance has not beentested. Galactose is less available for oxidationwhen ingested during exercise (Leijssen et al.1995) and soluble corn starch is oxidized to agreater extent than insoluble starch during exer-cise due to its higher amylopectin/amylose ratio(Saris et al. 1993). The physical form of theingested CHO does not exert a major influencesince liquid and solid CHO supplements elicitsimilar metabolic responses during exercise(Lugo et al. 1993; Mason et al. 1993).
Amount of CHO
There is no clear dose–response relationshipbetween the amount of CHO ingested duringexercise and subsequent exercise performance(Mitchell et al. 1989; Murray et al. 1989b, 1991).Ingestion of CHO at a rate of 13g · h–1 is insuf-ficient to alter the glucoregulatory hormoneresponse to prolonged exercise or time to fatigue(Burgess et al. 1991). The addition of a smallamount of CHO to a rehydration beverage wasshown to increase exercise time to fatigue, com-pared with water alone, and to be more effectivethan a larger amount of CHO (Maughan et al.1996). This may be the result of better rehydra-tion, due to the stimulatory effect of a hypotonicglucose solution on intestinal fluid absorption,and subsequent maintenance of a higher plasmavolume, rather than a metabolic effect of theingested CHO. Ingestion of CHO at a rate of 26and 78 g ·h–1 increased 4.8-km cycle performanceto a similar extent, following 2 h of exercise at
65–75% V.o 2peak (Murray et al. 1991). No differ-
ences in physiological responses to exercise wereobserved between ingestion of 6%, 8% and 10%sucrose solutions, but performance was onlyenhanced with 6% (Murray et al. 1989b). There islikely to be little benefit in ingesting CHO solu-tions more concentrated than 6–8% because thisdoes not result in increased rates of exogenousglucose oxidation (Wagenmakers et al. 1993) andincreases the risk of impaired gastrointestinalfunction and reduced fluid delivery. The absorp-tion of ingested CHO could potentially limitexogenous CHO oxidation which is observed topeak at 1–1.3 g · min–1 (Hawley et al. 1992). Suchvalues are similar to those reported for gastricemptying and intestinal absorption of glucosefrom a 6% glucose–electrolyte solution underresting conditions (Duchman et al. 1997). Obvi-ously, the important goal of CHO replacement isto provide sufficient CHO to maintain bloodglucose and CHO oxidation without causingimpaired fluid delivery. Ingesting CHO at a rateof 30–60g ·h–1 has been repeatedly shown toimprove exercise performance. This CHO intakecan be achieved by ingesting commercially avail-able sports drinks, at a rate of 600–1200 ml ·h–1,with the added benefit of providing fluid andreducing the negative effects of dehydration(Coyle & Montain 1992; American College ofSports Medicine Position Stand 1996).
Timing of CHO ingestion
The beneficial effects of CHO ingestion are likelyto be most evident during the latter stages of pro-longed exercise when endogenous CHO reservesare depleted. Indeed, ingestion of CHO late inexercise, approximately 30 min prior to the pointof fatigue, produced increases in exercise time tofatigue similar in magnitude to those seen withingestion of CHO early or throughout exercise orwith intravenous infusion of glucose at the pointof fatigue (Coggan & Coyle 1989; Coggan et al.1991; Tsintzas et al. 1996b). In contrast, ingestionof CHO at the point of fatigue is not as effective inenhancing endurance capacity (Coggan & Coyle1987, 1991); however, delaying CHO intake untillate in exercise, despite increasing blood glucose
carbohydrate replacement during exercise 115

availability and CHO oxidation, does not alwaysenhance exercise performance (McConell et al.1996). From a practical perspective, because ath-letes are unable to assess the level of their carbo-hydrate reserves and their likely point of fatigue,CHO (and fluid) replacement should commenceearly and continue throughout exercise.
Conclusion
In view of the importance of CHO for contractingskeletal muscle during strenuous exercise, CHOshould be ingested to maintain CHO availabilityand high rates of CHO oxidation. Such a strategyresults in enhanced endurance performance.There appear to be few differences betweenglucose, sucrose and maltodextrins, as sources ofCHO, in their effects on exercise metabolism andperformance, while fructose alone is not an effec-tive CHO supplement. Enough CHO should beingested to supply CHO to contracting muscle atabout 30–60g ·h–1, without negative effects onfluid bioavailability.
References
Adopo, E., Péronnet, F., Massicotte, D., Brisson, G.R. &Hillaire-Marcel, C. (1994) Respective oxidation ofexogenous glucose and fructose given in the samedrink during exercise. Journal of Applied Physiology76, 1014–1019.
Ahlborg, G. & Felig, P. (1976) Influence of glucoseingestion on fuel–hormone response during pro-longed exercise. Journal of Applied Physiology 41,683–688.
American College of Sports Medicine Position Stand(1996) Exercise and fluid replacement. Medicine andScience in Sports and Exercise 28, i–vii.
Anantaraman, R., Carmines, A.A., Gaesser, G.A. &Weltman, A. (1995) Effects of carbohydrate supple-mentation on performance during 1 hour of high-intensity exercise. International Journal of SportsMedicine 16, 461–465.
Ball, T.C., Headley, S.A., Vanderburgh, P.M. & Smith,J.C. (1995) Periodic carbohydrate replacementduring 50 min of high-intensity cycling improvessubsequent sprint performance. International Journalof Sport Nutrition 5, 151–158.
Below, P.R., Mora-Rodríguez, R., González-Alonso, J. &Coyle, E.F. (1995) Fluid and carbohydrate ingestionindependently improve performance during 1 h of
116 nutrition and exercise
intense exercise. Medicine and Science in Sports andExercise 27, 200–210.
Bergström, J. & Hultman, E. (1967) A study of the glyco-gen metabolism during exercise in man. ScandinavianJournal of Clinical and Laboratory Investigation 19,218–228.
Björkman, O., Sahlin, K., Hagenfeldt, L. & Wahren, J.(1984) Influence of glucose and fructose ingestion onthe capacity for long-term exercise in well-trainedmen. Clinical Physiology 4, 483–494.
Bosch, A.N., Dennis, S.C. & Noakes, T.D. (1994) Influ-ence of carbohydrate ingestion on fuel substrateturnover and oxidation during prolonged exercise.Journal of Applied Physiology 76, 2364–2372.
Bosch, A.N., Weltan, S.M., Dennis, S.C. & Noakes, T.D.(1996) Fuel substrate turnover and oxidation andglycogen sparing with carbohydrate ingestion innon-carbohydrate loaded cyclists. Pflügers Archives432, 1003–1010.
Burgess, W.A., Davis, J.M., Bartoli, W.P. & Woods, J.A.(1991) Failure of low dose carbohydrate feeding to attenuate glucoregulatory hormone responses and improve endurance performance. InternationalJournal of Sport Nutrition 1, 338–352.
Coggan, A.R. & Coyle, E.F. (1987) Reversal of fatigueduring prolonged exercise by carbohydrate infusionor ingestion. Journal of Applied Physiology 63, 2388–2395.
Coggan, A.R. & Coyle, E.F. (1988) Effect of carbohy-drate feedings during high-intensity exercise. Journalof Applied Physiology 65, 1703–1709.
Coggan, A.R. & Coyle, E.F. (1989) Metabolism and per-formance following carbohydrate ingestion late inexercise. Medicine and Science in Sports and Exercise 21,59–65.
Coggan, A.R. & Coyle, E.F. (1991) Carbohydrate inges-tion during prolonged exercise: effects on metabo-lism and performance. Exercise and Sports SciencesReviews 19, 1–40.
Coggan, A.R., Spina, R.J., Kohrt, W.M., Bier, D.M. &Holloszy, J.O. (1991) Plasma glucose kinetics in awell-trained cyclist fed glucose throughout exercise.International Journal of Sport Nutrition 1, 279–288.
Coyle, E.F. & Montain, S.J. (1992) Benefits of fluidreplacement with carbohydrate during exercise.Medicine and Science in Sports and Exercise 24, S324–S330.
Coyle, E.F., Hagberg, J.M., Hurley, B.F., Martin, W.H.,Ehsani, A.A. & Holloszy, J.O. (1983) Carbohydratefeeding during prolonged strenuous exercise candelay fatigue. Journal of Applied Physiology 55,230–235.
Coyle, E.F., Coggan, A.R., Hemmert, M.K. & Ivy, J.L.(1986) Muscle glycogen utilization during prolongedstrenuous exercise when fed carbohydrate. Journal ofApplied Physiology 61, 165–172.
Coyle, E.F., Hamilton, M.T., González-Alonso, J.,Montain, S.J. & Ivy, J.L. (1991) Carbohydrate metabo-lism during intense exercise when hyperglycemic.Journal of Applied Physiology 70, 834–840.
Davis, J.M., Bailey, S.P., Woods, J.A., Galiano, F.J.,Hamilton, M.T. & Bartoli, W.P. (1992) Effects of carbo-hydrate feedings on plasma free tryptophan andbranched-chain amino acids during prolongedcycling. European Journal of Applied Physiology 65,513–519.
Davis, J.M., Jackson, D.A., Broadwell, M.S., Queary, J.L.& Lambert, C.L. (1997) Carbohydrate drinks delayfatigue during intermittent, high-intensity cycling inactive men and women. International Journal of SportNutrition 7, 261–273.
De Glisezinski, I., Harant, I., Crampes, F., Trudeau, F.,Felez, A., Cottet-Emard, J.M., Garrigues, M. &Riviere, D. (1998) Effect of carbohydrate ingestion onadipose tissue lipolysis during long-lasting exercisein trained men. Journal of Applied Physiology 84,1627–1632.
Duchman, S.M., Ryan, A.J., Schedl, H.P., Summers,R.W., Bleiler, T.L. & Gisolfi, C.V. (1997) Upper limitfor intestinal absorption of a dilute glucose solutionin men at rest. Medicine and Science in Sports and Exer-cise 29, 482–488.
Erikson, M.A., Schwarzkopf, R.J. & McKenzie, R.D.(1987) Effects of caffeine, fructose, and glucose inges-tion on muscle glycogen utilization during exercise.Medicine and Science in Sports and Exercise 19, 579–583.
Fielding, R.A., Costill, D.L., Fink, W.J., King, D.S., Hargreaves, M. & Kovaleski, J.E. (1985) Effect of carbohydrate feeding frequencies and dosage onmuscle glycogen use during exercise. Medicine andScience in Sports and Exercise 17, 472–476.
Flynn, M.G., Costill, D.L., Hawley, J.A., Fink, W.J.,Neufer, P.D., Fielding, R.A. & Sleeper, M.D. (1987)Influence of selected carbohydrate drinks on cyclingperformance and glycogen use. Medicine and Sciencein Sports and Exercise 19, 37–40.
Gordon, B., Kohn, L.A., Levine, S.A., de Matton, M.M.,Scriver, W. & Whiting, W.B. (1925) Sugar content ofthe blood in runners following a marathon race. Withespecial reference to the prevention of hypogly-caemia: further observations. Journal of the AmericanMedical Association 85, 508–509.
Hargreaves, M. & Briggs, C.A. (1988) Effect of carbohy-drate ingestion on exercise metabolism. Journal ofApplied Physiology 65, 1553–1555.
Hargreaves, M., Costill, D.L., Coggan, A., Fink, W.J. &Nishibata, I. (1984) Effect of carbohydrate feedingson muscle glycogen utilization and exercise perfor-mance. Medicine and Science in Sports and Exercise 16,219–222.
Hargreaves, M., McConell, G.K. & Proietto, J. (1995)
Influence of muscle glycogen on glycogenolysis andglucose uptake during exercise. Journal of AppliedPhysiology 78, 288–292.
Hawley, J.A., Dennis, S.C. & Noakes, T.D. (1992) Oxida-tion of carbohydrate ingested during prolongedendurance exercise. Sports Medicine 14, 27–42.
Hawley, J.A., Bosch, A.N., Weltan, S.M., Dennis, S.C. &Noakes, T.D. (1994) Glucose kinetics during pro-longed exercise in euglycemic and hyperglycemicsubjects. Pflügers Archives 426, 378–386.
Hermansen, L., Hultman, E. & Saltin, B. (1967) Muscleglycogen during prolonged severe exercise. ActaPhysiologica Scandinavica 71, 129–139.
Horowitz, J.F., Mora-Rodríguez, R., Byerley, L.O. &Coyle, E.F. (1998) Carbohydrate ingestion duringexercise reduces fat oxidation when glucose uptakeincreases. FASEB Journal 10, A143.
Howlett, K., Angus, D., Proietto, J. & Hargreaves, M.(1998) Effect of increased blood glucose availabilityon glucose kinetics during exercise. Journal of AppliedPhysiology 84, 1413–1417.
Jeukendrup, A., Saris, W.H.M., Brouns, F. & Kester,A.D.M. (1996) A new validated endurance perfor-mance test. Medicine and Science in Sports and Exercise28, 266–270.
Jeukendrup, A., Brouns, F., Wagenmakers, A.J.M. &Saris, W.H.M. (1997) Carbohydrate-electrolyte feed-ings improve 1h time trial cycling performance.International Journal of Sports Medicine 18, 125–129.
Jeukendrup, A., Raben, A., Gijsen, A., Stegen, J.H.C.H.,Brouns, F., Saris, W.H.M. & Wagenmakers, A.J.M.(1999) Glucose kinetics during prolonged exercise inhighly trained subjects: effect of glucose ingestion.Journal of Physiology 515, 579–589.
Kuipers, H., Keizer, H.A., Brouns, F. & Saris, W.H.M.(1987) Carbohydrate feeding and glycogen synthesisduring exercise in man. Pflügers Archives 410, 652–656.
Leijssen, D.P.C., Saris, W.H.M., Jeukendrup, A.E. &Wagenamakers, A.J.M. (1995) Oxidation of exoge-nous [13C]galactose and [13C]glucose during exer-cise. Journal of Applied Physiology 79, 720–725.
Lugo, M., Sherman, W.M., Wimer, G.S. & Garleb, K.(1993) Metabolic responses when different forms ofcarbohydrate energy are consumed during cycling.International Journal of Sport Nutrition 3, 398–407.
McConell, G.K., Fabris, S., Proietto, J. & Hargreaves, M.(1994) Effect of carbohydrate ingestion on glucosekinetics during exercise. Journal of Applied Physiology77, 1537–1541.
McConell, G., Kloot, K. & Hargreaves, M. (1996) Effectof timing of carbohydrate ingestion on enduranceexercise performance. Medicine and Science in Sportsand Exercise 28, 1300–1304.
Mason, W.L., McConell, G. & Hargreaves, M. (1993)Carbohydrate ingestion during exercise: liquid
carbohydrate replacement during exercise 117

vs. solid feedings. Medicine and Science in Sports andExercise 25, 966–969.
Massicotte, D., Péronnet, F., Brisson, G., Bakkouch, K.& Hillaire-Marcel, C. (1989) Oxidation of a glucosepolymer during exercise: comparison with glucoseand fructose. Journal of Applied Physiology 66,179–183.
Maughan, R.J., Bethell, L.R. & Leiper, J.B. (1996) Effectsof ingested fluids on exercise capacity and on cardio-vascular and metabolic responses to prolonged exer-cise in man. Experimental Physiology 81, 847–859.
Mitchell, J.B., Costill, D.L., Houmard, J.A., Fink, W.J.,Pascoe, D.D. & Pearson, D.R. (1989) Influence of carbohydrate dosage on exercise performance andglycogen metabolism. Journal of Applied Physiology67, 1843–1849.
Murray, R., Paul, G.L., Seifert, J.G., Eddy, D.E. &Halaby, G.A. (1989a) The effects of glucose, fructose,and sucrose ingestion during exercise. Medicine andScience in Sports and Exercise 21, 275–282.
Murray, R., Seifert, J.G., Eddy, D.E., Paul, G.L. &Halaby, G.A. (1989b) Carbohydrate feeding andexercise: effect of beverage carbohydrate content.European Journal of Applied Physiology 59, 152–158.
Murray, R., Paul, G.L., Seifert, J.G. & Eddy, D.E. (1991)Responses to varying rates of carbohydrate ingestionduring exercise. Medicine and Science in Sports andExercise 23, 713–718.
Neufer, P.D., Costill, D.L., Flynn, M.G., Kirwan, J.P.,Mitchell, J.B. & Houmard, J. (1987) Improvements inexercise performance: effects of carbohydrate feed-ings and diet. Journal of Applied Physiology 62,983–988.
Nicholas, C.W., Williams, C., Lakomy, H.K.A., Phillips,G. & Nowitz, A. (1995) Influence of ingesting a carbo-hydrate-electrolyte solution on endurance capacityduring intermittent, high intensity shuttle running.Journal of Sports Sciences 13, 283–290.
Norman, B., Sollevi, A., Kaijser, L. & Jansson, E. (1987)ATP breakdown products in human skeletal muscleduring prolonged exercise to exhaustion. ClinicalPhysiology 7, 503–509.
Palmer, G.S., Clancy, M.C., Hawley, J.A., Rodger, I.M.,Burke, L.M. & Noakes, T.D. (1998) Carbohydrateingestion immediately before exercise does notimprove 20 km time trial performance in well trainedcyclists. International Journal of Sports Medicine 19,415–418.
Sahlin, K., Katz, A. & Broberg, S. (1990) Tricarboxylicacid cycle intermediates in human muscle duringprolonged exercise. American Journal of Physiology259, C834–C841.
Saris, W.H.M., Goodpaster, B.H., Jeukendrup, A.E.,Brouns, F., Halliday, D. & Wagenmakers, A.J.M.
118 nutrition and exercise
(1993) Exogenous carbohydrate oxidation from dif-ferent carbohydrate sources during exercise. Journalof Applied Physiology 75, 2168–2172.
Sasaki, H., Maeda, J., Usui, S. & Ishiko, T. (1987) Effectof sucrose and caffeine ingestion on performance ofprolonged strenuous running. International Journal ofSports Medicine 8, 261–265.
Shi, X., Summers, R.W., Schedl, H.P., Flanagan, S.W.,Chang, R. & Gisolfi, C.V. (1995) Effects of carbohy-drate type and concentration and solution osmolal-ity on water absorption. Medicine and Science in Sportsand Exercise 27, 1607–1615.
Spencer, M.K., Yan, Z. & Katz, A. (1991) Carbohydratesupplementation attenuates IMP accumulation inhuman muscle during prolonged exercise. AmericanJournal of Physiology 261, C71–C76.
Tsintzas, O.K., Liu, R., Williams, C., Campbell, I. & Gaitanos, G. (1993) The effect of carbohydrate inges-tion on performance during a 30-km race. Interna-tional Journal of Sport Nutrition 3, 127–139.
Tsintzas, O.K., Williams, C., Boobis, L. & Greenhaff, P.(1995) Carbohydrate ingestion and glycogen utiliza-tion in different muscle fibre types in man. Journal ofPhysiology 489, 242–250.
Tsintzas, O.K., Williams, C., Boobis, L. & Greenhaff, P.(1996a) Carbohydrate ingestion and single musclefibre glycogen metabolism during prolongedrunning in men. Journal of Applied Physiology 81,801–809.
Tsintzas, O.-K., Williams, C., Wilson, W. & Burrin, J.(1996b) Influence of carbohydrate supplementationearly in exercise in endurance running capacity. Med-icine and Science in Sports and Exercise 28, 1373–1379.
Wagenmakers, A.J.M., Brouns, F., Saris, W.H.M. & Halliday, D. (1993) Oxidation rates of orally ingestedcarbohydrates during prolonged exercise in men.Journal of Applied Physiology 75, 2774–2780.
Widrick, J.J., Costill, D.L., Fink, W.J., Hickey, M.S.,McConell, G.K. & Tanaka, H. (1993) Carbohydratefeedings and exercise performance: effect of initialmuscle glycogen concentration. Journal of AppliedPhysiology 74, 2998–3005.
Wilber, R.L. & Moffatt, R.J. (1992) Influence of carbohy-drate ingestion on blood glucose and performance inrunners. International Journal of Sport Nutrition 2,317–327.
Williams, C., Nute, M.G., Broadbank, L. & Vinall, S.(1990) Influence of fluid intake on endurancerunning performance. European Journal of AppliedPhysiology 60, 112–119.
Yaspelkis, B.B., Patterson, J.G., Anderla, P.A., Ding, Z.& Ivy, J.L. (1993) Carbohydrate supplementationspares muscle glycogen during variable-intensityexercise. Journal of Applied Physiology 75, 1477–1485.

Introduction
The body of a 70-kg man contains about 12kg ofprotein (amino acid polymers) and 200–220 g offree amino acids. There is a continuous exchangeof amino acids between these pools as proteinsare constantly being synthesized and simultane-ously being degraded (protein turnover). Skele-tal muscle accounts for some 40–45% of totalbody mass and contains some 7 kg of protein, pri-marily in the form of the contractile (myofibril-lar) proteins. About 120g of the free amino acidsare present intracellularly in skeletal muscle,while only 5g of free amino acids are present in the circulation. In the 1840s the German phy-siologist Von Liebig hypothesized that muscleprotein was the main fuel used to achieve muscu-lar contraction. After this view had been invali-dated around 1870 by experimental data, manyexercise physiologists took the opposite standand disregarded the amino acid pool in muscleas playing any role of significance in exercise andenergy metabolism. For over a century the aminoacid pool in skeletal muscle has been consideredas an inert reservoir from which the buildingblocks are obtained for the synthesis of contrac-tile proteins and enzymes. A review is given hereto show that resting skeletal muscle actively par-ticipates in the handling of amino acids in theovernight fasted state and following ingestion of a protein-containing meal and that muscleactively collaborates with other tissues in thesesituations. Major and rapid changes occur in themuscle free amino acid pool during exercise. Evi-
dence will be presented indicating that changesin the size of the muscle pool of some aminoacids and in amino acid metabolism play animportant role in the establishment and main-tenance of a high concentration of tricarboxy-lic acid (TCA)-cycle intermediates and via thismechanism in the maintenance of a high aerobiccapacity during prolonged exercise. Amino acidsalso seem to play a role in the failure to maintainhigh concentrations of TCA-cycle intermediatesduring prolonged exercise, an event whichpotentially plays a role in the development offatigue in glycogen-depleted muscles. The con-clusion therefore of this chapter will be thatmuscle amino acid metabolism occupies acentral place in energy metabolism during exer-cise not as a direct fuel competing with fattyacids, blood glucose and glycogen, but as a pre-cursor for the synthesis of TCA-cyle intermedi-ates and glutamine.
Muscle amino acid metabolism at rest
As an introduction to the changes that occurduring exercise, we will first have a look at theresting state. In contrast to the liver, which is able to oxidize most of the 20 amino acids that are present in proteins, rat and human skele-tal muscle when incubated in vitro can oxidizeonly six amino acids (Chang & Goldberg 1978a,1978b; Wagenmakers et al. 1985). These are thebranched-chain amino acids (BCAA — leucine,isoleucine and valine), glutamate, aspartate andasparagine (Fig. 9.1).
Chapter 9
Amino Acid Metabolism in Exercise
ANTON J.M. WAGENMAKERS
119

In vitro muscle amino acid metabolism
Rat muscles incubated in vitro are in net proteinbreakdown (protein synthesis < protein degra-dation) and release amounts of glutamine andalanine in excess by far of the relative occurrenceof these amino acids in muscle protein. This sug-gests that de novo synthesis of these amino acidsoccurs (Chang & Goldberg 1978b). Rudermanand Lund (1972) were the first to observe thataddition of BCAA to the perfusion medium of rathindquarters increased the release of alanine andglutamine. The relationship between the metabo-lism of BCAA on the one hand and the release ofalanine and glutamine has since been the subjectof many studies (for reviews, see Goldberg &Chang 1978; Wagenmakers & Soeters 1995). Mostof this relationship today has been firmly estab-lished. In the BCAA aminotransferase reaction,the amino group is donated to a-ketoglutarate toform glutamate and a branched-chain a-ketoacid (Fig. 9.1). In the reaction catalysed by gluta-mine synthase, glutamate reacts with ammoniato form glutamine. Alternatively, glutamate may
120 nutrition and exercise
donate the amino group to pyruvate to formalanine and regenerate a-ketoglutarate. Thesereactions provide a mechanism for the elimina-tion of amino groups from muscle in the form ofthe non-toxic nitrogen carriers alanine and gluta-mine (Fig. 9.1).
Arteriovenous difference studies inpostabsorptive man
Muscle amino acid metabolism has also beeninvestigated in man in vivo in the resting stateand during exercise by measuring the exchangeof amino acids across a forearm or a leg (arteri-ovenous difference multiplied by blood flowgives the net exchange of amino acids; e.g. Felig& Wahren 1971; Marliss et al. 1971; Wahren et al.1976; Eriksson et al. 1985; Van Hall et al. 1995b;Van Hall 1996). As muscle is the largest and mostactive tissue in the limbs, the assumption thatlimb exchange primarily reflects muscle metabo-lism seems reasonable. After overnight fastingthere is net breakdown of muscle proteins asprotein synthesis is slightly lower than protein
Tricarboxylic acidcycle
α-ketoglutarate
Succinyl-CoA
Valine
α-KIV
Isoleucine α-KMV
α-KG Glu
AspartateNH3
Asparagine Leucine
α-KIC
Acetyl-CoA
α-KG
Glu
Isoleucine
α-KMV
Alanine
Pyruvate
Glycogenor glucose
Glutamate
Glutamine
NH3
Source?
Oxaloacetate
Fig. 9.1 Amino acid metabolism inmuscle. a-KG, a-ketoglutarate;a- KIC, a-ketoisocaproate; a-KIV, a-ketoisovalerate; a-KMV, a-keto-b-methylvalerate; CoA, coenzymeA.

degradation (Rennie et al. 1982; Cheng et al. 1987;Pacy et al. 1994). This implies that those aminoacids that are not metabolized in muscle will bereleased in proportion to their relative occur-rence in muscle protein, while a discrepancy willbe found when amino acids are transaminated,oxidized or synthesized. Human limbs releasemuch more glutamine (48% of total amino acidrelease) and alanine (32%) than would be antici-pated from the relative occurrence in muscleprotein (glutamine 7% and alanine 9%; Clowes et al. 1980). This implies that glutamine with twoN-atoms per molecule is dominant for the aminoacid N-release from human muscle. The BCAA(19% relative occurrence in muscle protein), glu-tamate (7%), aspartate and asparagine (together,9%), on the other hand, are not released or inlower amounts than their relative ocurrence.Glutamate, in fact, is constantly taken up fromthe circulation by skeletal muscle. This suggeststhat the BCAA, glutamate, aspartate andasparagine originating from net breakdown ofmuscle proteins and glutamate taken up from thecirculation are metabolized in muscle and usedfor de novo synthesis of glutamine and alanineafter overnight starvation. All other amino acidsare released in proportion to their relative ocur-rence in muscle protein, implying that little or nometabolism occurs in muscle.
Source of alanine and glutamine carbon and nitrogen
The next issue to address is whether the carbonand nitrogen atoms from the six amino acids thatcan be degraded in muscle (Fig. 9.1) can be usedfor complete synthesis of both glutamine andalanine or whether other precursors help toprovide some of the required building blocks.Studies with [15N]-leucine have shown that theamino group of the BCAA is indeed incorporatedin humans in vivo in the a-amino nitrogen ofalanine (Haymond & Miles 1982) and of gluta-mine (Darmaun & Déchelotte 1991). As gluta-mate is central in all aminotransferase reactionsin muscle (Fig. 9.1), this implies that the aminogroup of all six amino acids is interchangeable
and can be incorporated in the a-amino nitro-gen of alanine and of glutamine. The source ofammonia in glutamine synthesis (incorporatedin the amide nitrogen) forms one of the puzzlesin muscle amino acid metabolism remainingtoday. A small part is derived from the uptake ofammonia from the circulation. The positivefemoral arteriovenous difference for ammonia inman is between 5% and 10% of the glutaminerelease in postabsorptive subjects at rest (Eriks-son et al. 1985; Van Hall et al. 1995b). Two intracel-lular enzymatic reactions are main candidates for the production of the remainder of the re-quired ammonia. The adenosine monophos-phate (AMP)-deaminase reaction is not onlyinvolved in the breakdown of adeninenucleotides to inosine monophosphate (IMP),but, as proposed by Lowenstein and colleagues,also in the deamination of aspartate via the reac-tions of the purine nucleotide cycle (Lowenstein& Goodman 1978). A second possible source ofammonia production in muscle is the reactioncatalysed by glutamate dehydrogenase:
glutamate + NAD+ ´a-ketoglutarate+ NH4+
+NADH
The BCAA indirectly can also be deaminated bythese reactions after transfer via transaminationof the amino group to glutamate and aspartate.However, both AMP deaminase and glutamatedehydrogenase have been suggested to havevery low activities in muscle both in vivo andin vitro (Lowenstein & Goodman 1978). Esti-mates of limb production rates in the fed andfasted state nevertheless indicate that between 10and 25g of glutamine is synthesized in the com-bined human skeletal muscles per 24 h, muchmore than any other amino acid. This alsoimplies that there must be a corresponding rateof ammonia production in muscle.
In vitro muscle incubations and perfusionswith [U-14C]-amino acids have led to the generalconsensus that the carbon skeletons of the sixindicated amino acids (Fig. 9.1) are used for denovo synthesis of glutamine (Chang & Goldberg1978b; Wagenmakers et al. 1985; Lee & Davis1986). This has been confirmed more recently in
amino acid metabolism in exercise 121

rats in vivo by Yoshida et al. (1991), who showedthat leucine C-2 was incorporated into glutamineafter giving l-[1,2-13C]leucine. No, or very little,radioactivity was found in lactate, pyruvate andalanine during incubation of rat diaphragms(Wagenmakers et al. 1985) and perfusion of rathindquarters (Lee & Davis 1986) with [U-14C]valine. This implies that there is no activepathway in muscle for conversion of TCA-cycleintermediates into pyruvate. It also implies thatthe carbon skeleton of the five amino acids thatare converted to TCA-cycle intermediates (Fig.9.1) cannot be used for complete oxidation(which is only possible when carbon enters theTCA-cycle as a 2-carbon acetyl group linked tocoenzyme A (acetyl-CoA) as is the case forleucine and for part of the isoleucine molecule)or for pyruvate and alanine synthesis. Therefore,
122 nutrition and exercise
the only fate of these carbon skeletons is synthe-sis of TCA-cycle intermediates and glutamine(Fig. 9.1). The question then is what is the sourceof the carbon atoms of alanine? The remainingsources are muscle glycogen and blood glucoseconverted by glycolysis into pyruvate (Fig. 9.1).In agreement with this conclusion Chang andGoldberg (1978a) reported that over 97% of thecarbons of the alanine, pyruvate and lactatereleased by incubated diaphragms were derivedfrom exogenous glucose.
Glucose–alanine cycle revisited
The conclusion of the above section slightlychanges the concept of the glucose–alanine cycle(Fig. 9.2) (Felig et al. 1970) which by now hasbecome generally accepted textbook knowledge.
Muscle
Glucose
Glycogen
Pyruvate
Alanine
Protein
–NH2
Glutamine
LeuIleValAspAsn C-skeleton
Ammonia
Non-metabolizedamino acids
Blood
Glucose
Alanine
Glutamine
Amino acids
Glucose
Glucose
Glutamine
Glutamine
UreaAlanine
Glucose
Liver
Kidney
Ammonia
Fuel for gut and immune system Precursor DNA/RNA
Fig. 9.2 Interorgan relationship in the handling of amino acids. Dashed arrow, prolonged starvation only.

According to the original formulation of theglucose–alanine cycle, the pyruvate used foralanine production in muscle either was derivedfrom glycolysis of blood glucose or from pyru-vate derived from metabolism of other muscleprotein-derived amino acids. The alanine is thenreleased to the blood and converted to glucosevia gluconeogenesis in the liver. Carbon derivedfrom muscle protein in this way was suggested tohelp maintain blood glucose concentrations afterovernight fasting and during prolonged starva-tion. The implication, however, of the above con-clusions is that all pyruvate is either derivedfrom glycolysis of blood glucose or from break-down of muscle glycogen followed by glycolysis.In a recent tracer study in man (Perriello et al.1995), 42% of the alanine released by muscle wasreported to originate from blood glucose. Thisimplies that more than half of the alaninereleased by muscle is formed from pyruvatederived from muscle glycogen. This route pro-vides a mechanism to slowly mobilize the sittingmuscle glycogen stores during starvation, suchthat these stores can be used to help and maintainthe blood glucose concentrations (Fig. 9.2) andfunction as fuel in tissues that critically dependon glucose such as brain, red blood cells andkidney cortex. The amino acids liberated duringstarvation by increased net rates of proteindegradation (Rennie et al. 1982; Cheng et al. 1987;Pacy et al. 1994) are instead converted to gluta-mine, which also is a precursor for gluconeogen-esis in the liver in the postabsorptive state (Rosset al. 1967). Glutamine also is a precursor for glu-coneogenesis in the kidney (Wirthensohn &Guder 1986), but renal gluconeogenesis onlystarts to be significant (>10% of total glucoseoutput) in man after 60 h starvation (Björkman etal. 1980) and is at its highest rate after prolonged(4–6 weeks) starvation (Owen et al. 1969).Protein-derived amino acids metabolized inmuscle thus still can help maintain blood glucoseconcentration during starvation but by a differ-ent route from that suggested in the original for-mulation of the glucose alanine cycle. Recenttracer studies in man also suggest that glutamineis more important than alanine as a gluco-
neogenic precursor after overnight starvation(Nurjhan et al. 1995), and that glutamine is moreimportant than alanine as a vehicle for transportof muscle protein-derived carbon and nitrogenthrough plasma to the sites of gluconeogenesis orfurther metabolism (Perriello et al. 1995).
Effect of ingestion of protein or a mixed meal
Following ingestion of a mixed protein-containing meal, small amounts of most aminoacids are taken up by muscle and most othertissues as there is net protein deposition in thefed state (protein synthesis > protein degrada-tion), which compensates for the net losses in theovernight fasting period (Rennie et al. 1982;Cheng et al. 1987; Pacy et al. 1994). An excessivelylarge uptake of BCAA and glutamate is seen inthe 4-h period after ingestion of a mixed meal(Elia et al. 1989) and after ingestion of a largesteak (Elia & Livesey 1983). BCAA and glutamatethen together cover more than 90% of the muscleamino acid uptake. The BCAA originate fromdietary protein. After digestion of dietary proteinmost of the resulting BCAA escape from uptakeand metabolism in gut and liver due to the lowBCAA aminotransferase activity in these tissues(Wagenmakers & Soeters 1995; Hoerr et al. 1991).The source of the glutamate is not clear today.The diet only seems to deliver a minor propor-tion as both a [15N] and [13C] glutamate tracerwere almost quantitatively removed in the firstpass through the splanchnic area (gut and liver;Matthews et al. 1993; Batezzati et al. 1995).Marliss et al. (1971) showed that the splanchnicarea (gut and liver) in man constantly producesglutamate both after overnight and after pro-longed starvation. After ingestion of a large steakthe muscle release of glutamine more thandoubles, while the alanine release is reduced to10% of the overnight fasted value. In the 4-hperiod after ingestion of a mixed meal (Elia et al.1989), the dominance of glutamine in carryingnitrogen out of skeletal muscle was even moreclear than after overnight fasting. Glutaminethen accounted for 71% of the amino acid releaseand 82% of the N-release from muscle. In
amino acid metabolism in exercise 123

summary, these data suggest that after consump-tion of protein-containing meals, BCAA and glu-tamate are taken up by muscle and their carbonskeletons are used for de novo synthesis of glutamine.
Function of muscle glutamine synthesis and release
In the previous sections it has become clear thatglutamine is the main end product of muscleamino acid metabolism both in the overnightfasted state and during feeding. Alanine onlyserves to export part of the amino groups. Gluta-mine is the most abundant amino acid in humanplasma (600–700mm) and in the muscle freeamino acid pool (20mm; 60% of the intramuscu-lar pool excluding the nonprotein amino acidtaurine). The synthesis rate of glutamine inmuscle is higher than that of any other aminoacid. Extrapolations of limb production rates inthe fed and fasted state suggest that between 10and 25g of glutamine is synthesized in the com-bined human skeletal muscles per day. Tracerdilution studies even indicate that 80 g of gluta-mine is produced per day (Darmaun et al. 1986),but this may be a methodological overestimationdue to slow mixing of the glutamine tracer withthe large endogenous glutamine pool in muscle(Van Acker et al. 1998). Furthermore, althoughmuscle is the main glutamine-producing tissue,other tissues (e.g. adipose tissue, liver and brain)may also contribute to the rate of appearance ofglutamine in the plasma pool that is measured bytracer dilution techniques.
The reason for this high rate of glutamine pro-duction in muscle probably is that glutamineplays an important role in human metabolism inother organs. Sir Hans Krebs (1975) has alreadywritten:
Maybe the significance of glutamine synthesisis to be sought in the role of glutamine in otherorgans, as a precursor of urinary ammonia andas a participant in the biosynthesis of purines,NAD+, amino sugars and proteins. Glutamineis an important blood constituent, present inhigher concentrations than any other amino
124 nutrition and exercise
acid, presumably to serve these various func-tions. Muscle may play a role in maintainingthe high plasma concentration of glutamine.Glutamine has been shown to be an important
fuel for cells of the immune system (Ardawi &Newsholme 1983) and for mucosal cells of theintestine (Windmueller & Spaeth 1974; Souba1991). Low muscle and plasma glutamine con-centrations are observed in patients with sepsisand trauma (Vinnars et al. 1975; Rennie et al. 1986;Lacey & Wilmore 1990), conditions that also areattended by mucosal atrophy, loss of the gutbarrier function (bacterial translocation) and aweakened immune response. Although the linkbetween the reduced glutamine concentrationsand these functional losses has not been fullyunderpinned by experimental evidence, the pos-sibility should seriously be considered that it is acausal relationship. Due to its numerous meta-bolic key functions and a potential shortage inpatients with sepsis and trauma, glutamine hasrecently been proposed to be a conditionallyessential amino acid (Lacey & Wilmore 1990),which should especially be added to the nutri-tion of long-term hospitalized critically ill anddepleted patients. These patients have a reducedmuscle mass due to continuous muscle wastingand therefore probably also a reduced capacityfor glutamine production.
Glutamine–glutamate cycle
The existence of the glutamine–glutamate cyclewas first demonstrated by Marliss et al. (1971). Inmuscle there is a continuous glutamate uptakeand glutamine release with the glutamate uptakeaccounting for about half of the glutaminerelease. Most of the glutamine produced bymuscle is extracted by the splanchnic bed, mostprobably partly by the gut (Souba 1991) andpartly by the liver (Ross et al. 1967). This gluta-mine is converted to glutamate and ammonia byglutaminase. When generated in the gut, theammonia is transported via the portal vein to theliver and disposed of as urea; the same holds forammonia generated in the liver. About half of theglutamate is retained in the splanchnic area and
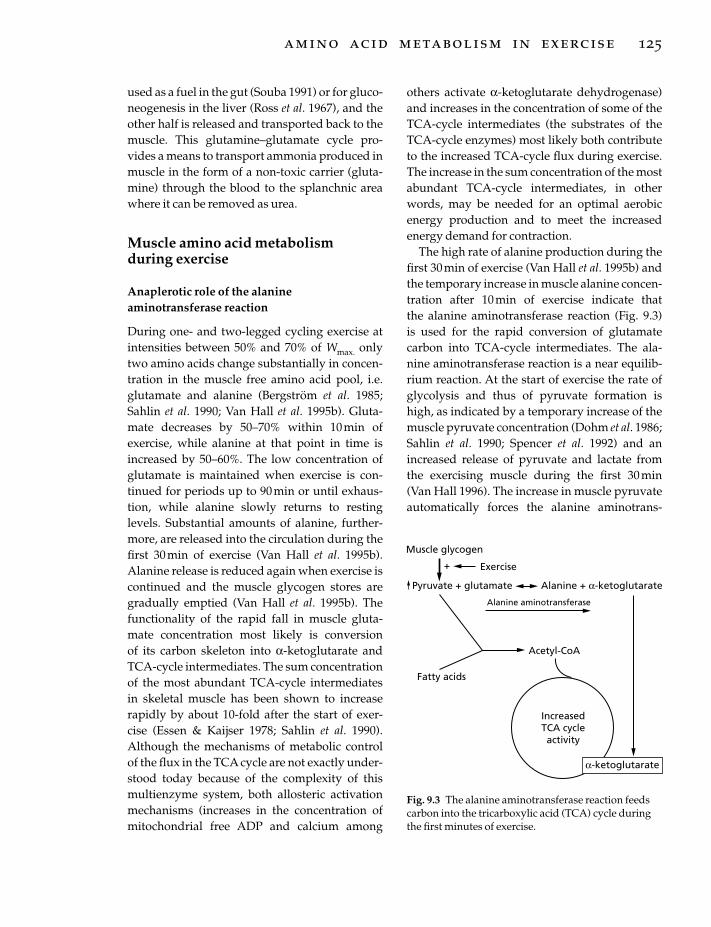
used as a fuel in the gut (Souba 1991) or for gluco-neogenesis in the liver (Ross et al. 1967), and theother half is released and transported back to themuscle. This glutamine–glutamate cycle pro-vides a means to transport ammonia produced inmuscle in the form of a non-toxic carrier (gluta-mine) through the blood to the splanchnic areawhere it can be removed as urea.
Muscle amino acid metabolism during exercise
Anaplerotic role of the alanineaminotransferase reaction
During one- and two-legged cycling exercise atintensities between 50% and 70% of Wmax. onlytwo amino acids change substantially in concen-tration in the muscle free amino acid pool, i.e.glutamate and alanine (Bergström et al. 1985;Sahlin et al. 1990; Van Hall et al. 1995b). Gluta-mate decreases by 50–70% within 10min of exercise, while alanine at that point in time isincreased by 50–60%. The low concentration ofglutamate is maintained when exercise is con-tinued for periods up to 90min or until exhaus-tion, while alanine slowly returns to restinglevels. Substantial amounts of alanine, further-more, are released into the circulation during thefirst 30 min of exercise (Van Hall et al. 1995b).Alanine release is reduced again when exercise iscontinued and the muscle glycogen stores aregradually emptied (Van Hall et al. 1995b). Thefunctionality of the rapid fall in muscle gluta-mate concentration most likely is conversion of its carbon skeleton into a-ketoglutarate andTCA-cycle intermediates. The sum concentrationof the most abundant TCA-cycle intermediates in skeletal muscle has been shown to increaserapidly by about 10-fold after the start of exer-cise (Essen & Kaijser 1978; Sahlin et al. 1990).Although the mechanisms of metabolic controlof the flux in the TCA cycle are not exactly under-stood today because of the complexity of thismultienzyme system, both allosteric activationmechanisms (increases in the concentration ofmitochondrial free ADP and calcium among
others activate a-ketoglutarate dehydrogenase)and increases in the concentration of some of theTCA-cycle intermediates (the substrates of theTCA-cycle enzymes) most likely both contributeto the increased TCA-cycle flux during exercise.The increase in the sum concentration of the mostabundant TCA-cycle intermediates, in otherwords, may be needed for an optimal aerobicenergy production and to meet the increasedenergy demand for contraction.
The high rate of alanine production during thefirst 30 min of exercise (Van Hall et al. 1995b) andthe temporary increase in muscle alanine concen-tration after 10min of exercise indicate that the alanine aminotransferase reaction (Fig. 9.3) is used for the rapid conversion of glutamatecarbon into TCA-cycle intermediates. The ala-nine aminotransferase reaction is a near equilib-rium reaction. At the start of exercise the rate ofglycolysis and thus of pyruvate formation ishigh, as indicated by a temporary increase of themuscle pyruvate concentration (Dohm et al. 1986;Sahlin et al. 1990; Spencer et al. 1992) and anincreased release of pyruvate and lactate fromthe exercising muscle during the first 30 min (Van Hall 1996). The increase in muscle pyruvateautomatically forces the alanine aminotrans-
amino acid metabolism in exercise 125
IncreasedTCA cycleactivity
Fatty acids
Acetyl-CoA
α-ketoglutarate
Pyruvate + glutamate Alanine + α-ketoglutarate
Alanine aminotransferase
Exercise+
Muscle glycogen
Fig. 9.3 The alanine aminotransferase reaction feedscarbon into the tricarboxylic acid (TCA) cycle duringthe first minutes of exercise.
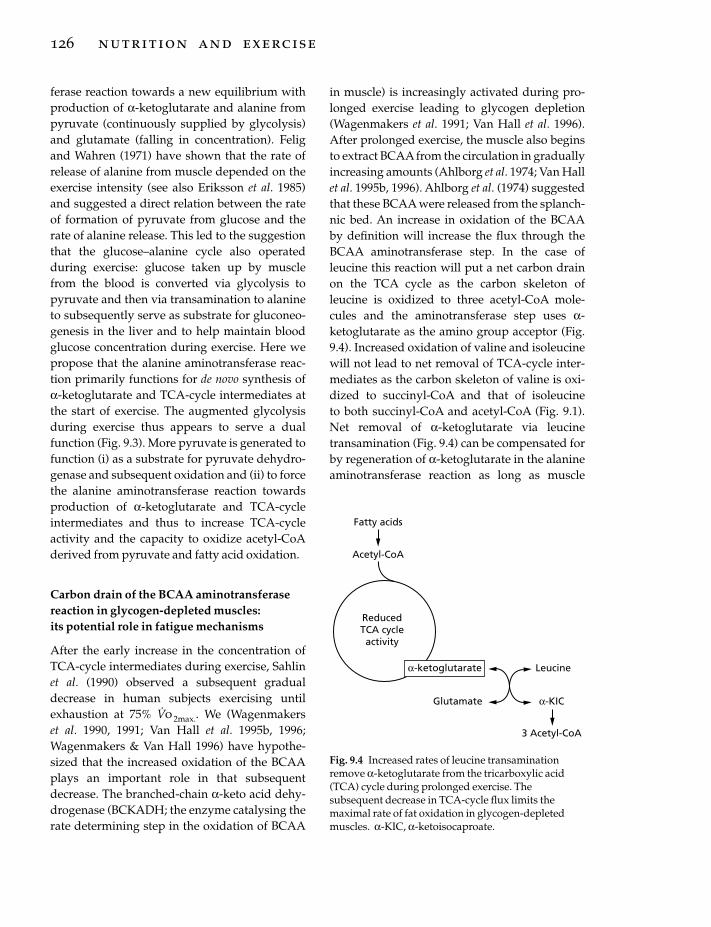
ferase reaction towards a new equilibrium withproduction of a-ketoglutarate and alanine frompyruvate (continuously supplied by glycolysis)and glutamate (falling in concentration). Feligand Wahren (1971) have shown that the rate ofrelease of alanine from muscle depended on theexercise intensity (see also Eriksson et al. 1985)and suggested a direct relation between the rateof formation of pyruvate from glucose and therate of alanine release. This led to the suggestionthat the glucose–alanine cycle also operatedduring exercise: glucose taken up by musclefrom the blood is converted via glycolysis topyruvate and then via transamination to alanineto subsequently serve as substrate for gluconeo-genesis in the liver and to help maintain bloodglucose concentration during exercise. Here wepropose that the alanine aminotransferase reac-tion primarily functions for de novo synthesis ofa-ketoglutarate and TCA-cycle intermediates atthe start of exercise. The augmented glycolysisduring exercise thus appears to serve a dualfunction (Fig. 9.3). More pyruvate is generated tofunction (i) as a substrate for pyruvate dehydro-genase and subsequent oxidation and (ii) to forcethe alanine aminotransferase reaction towardsproduction of a-ketoglutarate and TCA-cycleintermediates and thus to increase TCA-cycleactivity and the capacity to oxidize acetyl-CoAderived from pyruvate and fatty acid oxidation.
Carbon drain of the BCAA aminotransferasereaction in glycogen-depleted muscles: its potential role in fatigue mechanisms
After the early increase in the concentration ofTCA-cycle intermediates during exercise, Sahlinet al. (1990) observed a subsequent gradualdecrease in human subjects exercising untilexhaustion at 75% V
.o 2max.. We (Wagenmakers
et al. 1990, 1991; Van Hall et al. 1995b, 1996;Wagenmakers & Van Hall 1996) have hypothe-sized that the increased oxidation of the BCAAplays an important role in that subsequentdecrease. The branched-chain a-keto acid dehy-drogenase (BCKADH; the enzyme catalysing therate determining step in the oxidation of BCAA
126 nutrition and exercise
in muscle) is increasingly activated during pro-longed exercise leading to glycogen depletion(Wagenmakers et al. 1991; Van Hall et al. 1996).After prolonged exercise, the muscle also beginsto extract BCAA from the circulation in graduallyincreasing amounts (Ahlborg et al. 1974; Van Hallet al. 1995b, 1996). Ahlborg et al. (1974) suggestedthat these BCAA were released from the splanch-nic bed. An increase in oxidation of the BCAAby definition will increase the flux through theBCAA aminotransferase step. In the case ofleucine this reaction will put a net carbon drainon the TCA cycle as the carbon skeleton ofleucine is oxidized to three acetyl-CoA mole-cules and the aminotransferase step uses a-ketoglutarate as the amino group acceptor (Fig.9.4). Increased oxidation of valine and isoleucinewill not lead to net removal of TCA-cycle inter-mediates as the carbon skeleton of valine is oxi-dized to succinyl-CoA and that of isoleucine to both succinyl-CoA and acetyl-CoA (Fig. 9.1).Net removal of a-ketoglutarate via leucinetransamination (Fig. 9.4) can be compensated forby regeneration of a-ketoglutarate in the alanineaminotransferase reaction as long as muscle
Fatty acids
Acetyl-CoA
ReducedTCA cycleactivity
Glutamate
Leucine
α-KIC
3 Acetyl-CoA
α-ketoglutarate
Fig. 9.4 Increased rates of leucine transaminationremove a-ketoglutarate from the tricarboxylic acid(TCA) cycle during prolonged exercise. Thesubsequent decrease in TCA-cycle flux limits themaximal rate of fat oxidation in glycogen-depletedmuscles. a-KIC, a-ketoisocaproate.

glycogen is available and the muscle pyruvateconcentration is kept high (Fig. 9.3). However, asactivation of the BCKADH complex is highest inglycogen-depleted muscle (Van Hall et al. 1996),this mechanism eventually is expected to lead toa decrease in the concentration of TCA-cycleintermediates. This again may lead to a reductionof the TCA-cycle activity, inadequate adenosinetriphosphate turnover rates and, via increases inthe known cellular mediators, to muscle fatigue(Fitts 1994).
BCAA supplementation and performance
After oral ingestion, BCAA escape from hepaticuptake and are rapidly extracted by the legmuscles (Aoki et al. 1981; MacLean et al. 1996; VanHall et al. 1996) and this is accompanied by activation of the BCKADH complex at rest andincreased activation during exercise (Van Hall et al. 1996). This could imply that the indicatedcarbon drain on the TCA cycle is larger afterBCAA ingestion and that BCAA ingestion by thismechanism leads to premature fatigue duringprolonged exercise, leading to glycogen deple-tion. Evidence in support of this hypothesis has been obtained (Wagenmakers et al. 1990) inpatients with McArdle’s disease, who have noaccess to muscle glycogen due to glycogen phosphorylase deficiency and therefore can be regarded as an ‘experiment of nature’ fromwhich we can learn what happens during exercise with glycogen-depleted muscles. BCAAsupplementation increased heart rate and led topremature fatigue during incremental exercise in these patients. This may contain the messagethat BCAA supplementation has a negative effecton performance by the proposed mechanism in healthy subjects in conditions where the glycogen stores have been completely emptiedby highly demanding endurance exercise.However, with coingestion of carbohydrate,BCAA ingestion did not change time to exhaus-tion in healthy subjects (Blomstrand et al. 1995;Van Hall et al. 1995a; Madsen et al. 1996). AsBCAA ingestion increases ammonia productionby the muscle and plasma ammonia concentra-
tion during exercise (Wagenmakers 1992; VanHall et al. 1995a, 1996; MacLean et al. 1996;Madsen et al. 1996), and as ammonia has beensuggested to lead to central fatigue and loss ofmotor coordination (Banister & Cameron 1990),great care seems to be indicated with the use ofBCAA supplements during exercise, especiallyin sports that critically depend on motor coordi-nation. The hypothesis of Newsholme and col-leagues (see Chapter 11 for details) (Blomstrandet al. 1991) that BCAA supplements improveendurance performance via a reduction ofcentral fatigue by serotoninergic mechanismshas not been confirmed in recent controlledstudies (Blomstrand et al. 1995; Van Hall et al.1995a; Madsen et al. 1996).
Importance of TCA-cycle anaplerosis for the maximal rate of substrate oxidation during exercise
Muscle glycogen is the primary fuel during pro-longed high-intensity exercise such as practisedby elite marathon runners. High running speeds(≥20 km· h–1) are maintained by these athletes forperiods of 2 h. However, they have to reduce thepace when the muscle glycogen concentration isfalling and glycolytic rates cannot be maintained.This either indicates that there is a limit in themaximal rate at which fatty acids can be mobi-lized from adipose tissue and intramuscularstores and oxidized or that there is a limitation inthe maximal rate of the TCA cycle when gly-colytic rates are falling as a consequence of glycogen depletion. It is proposed here that the decrease in muscle pyruvate concentrationwhich occurs when the glycogen stores arereduced leads to a decrease of the anapleroticcapacity of the alanine aminotransferase reactionand thus leads to a decrease in the concentrationof TCA-cycle intermediates (due to insufficientcounterbalance of the carbon-draining effect ofthe BCAA aminotransferase reaction). This againwill lead to a reduction of TCA-cycle activity andthe need to reduce the pace (fatigue). The follow-ing observation seems to support this hypo-thesis. Patients with McArdle’s disease cannot
amino acid metabolism in exercise 127
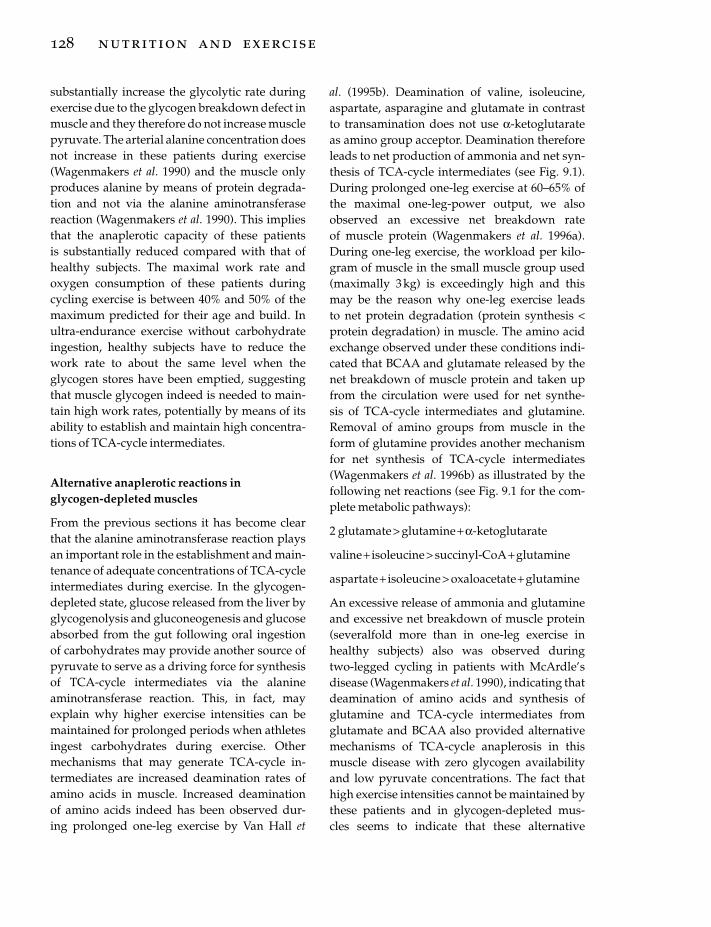
substantially increase the glycolytic rate duringexercise due to the glycogen breakdown defect inmuscle and they therefore do not increase musclepyruvate. The arterial alanine concentration doesnot increase in these patients during exercise(Wagenmakers et al. 1990) and the muscle onlyproduces alanine by means of protein degrada-tion and not via the alanine aminotransferasereaction (Wagenmakers et al. 1990). This impliesthat the anaplerotic capacity of these patients is substantially reduced compared with that ofhealthy subjects. The maximal work rate andoxygen consumption of these patients duringcycling exercise is between 40% and 50% of themaximum predicted for their age and build. Inultra-endurance exercise without carbohydrateingestion, healthy subjects have to reduce thework rate to about the same level when theglycogen stores have been emptied, suggestingthat muscle glycogen indeed is needed to main-tain high work rates, potentially by means of itsability to establish and maintain high concentra-tions of TCA-cycle intermediates.
Alternative anaplerotic reactions in glycogen-depleted muscles
From the previous sections it has become clearthat the alanine aminotransferase reaction playsan important role in the establishment and main-tenance of adequate concentrations of TCA-cycleintermediates during exercise. In the glycogen-depleted state, glucose released from the liver byglycogenolysis and gluconeogenesis and glucoseabsorbed from the gut following oral ingestion of carbohydrates may provide another source ofpyruvate to serve as a driving force for synthesisof TCA-cycle intermediates via the alanineaminotransferase reaction. This, in fact, mayexplain why higher exercise intensities can bemaintained for prolonged periods when athletesingest carbohydrates during exercise. Othermechanisms that may generate TCA-cycle in-termediates are increased deamination rates ofamino acids in muscle. Increased deamination of amino acids indeed has been observed dur-ing prolonged one-leg exercise by Van Hall et
128 nutrition and exercise
al. (1995b). Deamination of valine, isoleucine,aspartate, asparagine and glutamate in contrastto transamination does not use a-ketoglutarateas amino group acceptor. Deamination thereforeleads to net production of ammonia and net syn-thesis of TCA-cycle intermediates (see Fig. 9.1).During prolonged one-leg exercise at 60–65% ofthe maximal one-leg-power output, we alsoobserved an excessive net breakdown rate of muscle protein (Wagenmakers et al. 1996a).During one-leg exercise, the workload per kilo-gram of muscle in the small muscle group used(maximally 3kg) is exceedingly high and thismay be the reason why one-leg exercise leads to net protein degradation (protein synthesis <protein degradation) in muscle. The amino acidexchange observed under these conditions indi-cated that BCAA and glutamate released by thenet breakdown of muscle protein and taken upfrom the circulation were used for net synthe-sis of TCA-cycle intermediates and glutamine.Removal of amino groups from muscle in theform of glutamine provides another mechanismfor net synthesis of TCA-cycle intermediates(Wagenmakers et al. 1996b) as illustrated by thefollowing net reactions (see Fig. 9.1 for the com-plete metabolic pathways):
2 glutamate> glutamine+a-ketoglutarate
valine + isoleucine > succinyl-CoA+ glutamine
aspartate+ isoleucine> oxaloacetate+ glutamine
An excessive release of ammonia and glutamineand excessive net breakdown of muscle protein(severalfold more than in one-leg exercise inhealthy subjects) also was observed during two-legged cycling in patients with McArdle’sdisease (Wagenmakers et al. 1990), indicating thatdeamination of amino acids and synthesis of glutamine and TCA-cycle intermediates fromglutamate and BCAA also provided alternativemechanisms of TCA-cycle anaplerosis in thismuscle disease with zero glycogen availabilityand low pyruvate concentrations. The fact thathigh exercise intensities cannot be maintained bythese patients and in glycogen-depleted mus-cles seems to indicate that these alternative

anaplerotic reactions are not as effective as thealanine aminotransferase reaction and onlyallow muscular work at 40–50% of Wmax..
It is far from clear whether dynamic whole-body exercise as practised by athletes duringcompetition (cycling or running) leads to netprotein breakdown in muscle and helps toprovide carbon skeletons for synthesis of TCA-cycle intermediates. Different stable isotopetracers used to measure protein synthesis anddegradation in laboratory conditions give differ-ent answers (for reviews, see Chapter 10 andRennie 1996). Whole-body measurements withl-[1-13C] leucine suggest that there is net pro-tein breakdown during exercise, but is not clearwhether this occurs in muscle or in the gut. Fur-thermore, carbohydrate ingestion during exer-cise as practised by endurance athletes duringcompetition reduces net protein breakdown andamino acid oxidation.
Conclusion
Six amino acids are metabolized in restingmuscle: leucine, isoleucine, valine, asparagine,aspartate and glutamate. These amino acidsprovide the aminogroups and probably theammonia required for synthesis of glutamineand alanine, which are released in excessiveamounts in the postabsorptive state and duringingestion of a protein-containing meal. Onlyleucine and part of the isoleucine molecule canbe oxidized in muscle as they are converted toacetyl-CoA. The other carbon skeletons are usedsolely for de novo synthesis of TCA-cycle interme-diates and glutamine. The carbon atoms of thereleased alanine originate primarily from glycol-ysis of blood glucose and of muscle glycogen(about half each in resting conditions). After con-sumption of a protein-containing meal, BCAAand glutamate are taken up by muscle and theircarbon skeletons are used for de novo synthesis ofglutamine. About half of the glutamine releasefrom muscle originates from glutamate taken upfrom the blood both after overnight starvation,prolonged starvation and after consumption of amixed meal. Glutamine produced by muscle is
an important fuel and regulator of DNA andRNA synthesis in mucosal cells and immunesystem cells and fulfils several other importantfunctions in human metabolism.
The alanine aminotransferase reaction func-tions to establish and maintain high concen-trations of TCA-cycle intermediates in muscleduring the first 10min of exercise. The increase inconcentration of TCA-cycle intermediates prob-ably is needed to increase the rate of the TCA-cycle and meet the increased energy demand ofexercise. A gradual increase in leucine oxidationsubsequently leads to a carbon drain on the TCAcycle in glycogen-depleted muscles and maythus reduce the maximal flux in the TCA cycleand lead to fatigue. Deamination of amino acidsand glutamine synthesis present alternativeanaplerotic mechanisms in glycogen-depletedmuscles but only allow exercise at 40–50% ofWmax.. One-leg exercise leads to net breakdownof muscle protein. The liberated amino acids areused for synthesis of TCA-cycle intermediatesand glutamine. Today it is not clear whether andhow important this process is in endurance exer-cise in the field (running or cycling) in athleteswho ingest carbohydrates. It is proposed that themaximal flux in the TCA cycle is reduced inglycogen-depleted muscles due to insufficientTCA-cycle anaplerosis and that this presents alimitation for the maximal rate of fatty acid oxi-dation. Interactions between the amino acid pooland the TCA cycle are suggested to play a centralrole in the energy metabolism of the exercisingmuscle.
References
Ahlborg, G., Felig, P., Hagenfeldt, L., Hendler, R. &Wahren, J. (1974) Substrate turnover during pro-longed exercise in man: splanchnic and leg metabo-lism of glucose, free fatty acids, and amino acids.Journal of Clinical Investigation 53, 1080–1090.
Aoki, T.T., Brennan, M.F., Fitzpatrick, G.F. & Knight,D.C. (1981) Leucine meal increases glutamine andtotal nitrogen release from forearm muscle. Journal ofClinical Investigation 68, 1522–1528.
Ardawi, M.S.M. & Newsholme, E.A. (1983) Glutaminemetabolism in lymphocytes of the rat. BiochemicalJournal 212, 835–842.
amino acid metabolism in exercise 129
Banister, E.W. & Cameron, B.J. (1990) Exercise-inducedhyperammonemia: peripheral and central effects.International Journal of Sports Medicine 11, S129–142.
Battezzati, A., Brillon, D.J. & Matthews, D.E. (1995)Oxidation of glutamic acid by the splanchnic bed in humans. American Journal of Physiology 269,E269–E276.
Bergström, J., Fürst, P. & Hultman, E. (1985) Free aminoacids in muscle tissue and plasma during exercise inman. Clinical Physiology 5, 155–160.
Björkman, O., Felig, P. & Wahren, J. (1980) The contrast-ing responses of splanchnic and renal glucose outputto gluconeogenic substrates and to hypoglucagon-emia in 60 h fasted humans. Diabetes 29, 610–616.
Blomstrand, E., Hassmén, P., Ekblom, B. & Newsholme, E.A. (1991) Administration ofbranched-chain amino acids during sustained exer-cise-effects on performance and on plasma concen-tration of some amino acids. European Journal ofApplied Physiology 63, 83–88.
Blomstrand, E., Andersson, S., Hassmén, P., Ekblom, B.& Newsholme, E.A. (1995) Effect of branched-chainamino acid and carbohydrate supplementation onthe exercise induced change in plasma and muscleconcentration of amino acids in human subjects. ActaPhysiologica Scandinavica 153, 87–96.
Chang, T.W. & Goldberg, A.L. (1978a) The origin ofalanine produced in skeletal muscle. Journal of Biolog-ical Chemistry 253, 3677–3684.
Chang, T.W. & Goldberg, A.L. (1978b) The metabolicfates of amino acids and the formation of glutaminein skeletal muscle. Journal of Biological Chemistry 253,3685–3695.
Cheng, K.N., Pacy, P.J., Dworzak, F., Ford, G.C. & Halliday, D. (1987) Influence of fasting on leucineand muscle protein metabolism across the humanforearm determined using L-[1–13C, 15N]leucine asthe tracer. Clinical Science 73, 241–246.
Clowes, G.H.A., Randall, H.T. & Cha, C.-J. (1980)Amino acid and energy metabolism in septic andtraumatized patients. Journal of Parenteral and EnteralNutrition 4, 195–205.
Darmaun, D. & Déchelotte, P. (1991) Role of leucine as a precursor of glutamine a-amino nitrogen invivo in humans. American Journal of Physiology 260,E326–E329.
Darmaun, D., Matthews, D. & Bier, D. (1986) Glutamineand glutamate kinetics in humans. American Journalof Physiology 251, E117–E126.
Dohm, G.L., Patel, V. & Kasperek, G.J. (1986) Regula-tion of muscle pyruvate metabolism during exercise.Biochemical Medicine and Metabolic Biology 35, 26–266.
Elia, M. & Livesey, G. (1983) Effects of ingested steakand infused leucine on forearm metabolism in manand the fate of amino acids in healthy subjects. Clini-cal Science 64, 517–526.
130 nutrition and exercise
Elia, M., Schlatmann, A., Goren, A. & Austin, S. (1989)Amino acid metabolism in muscle and in the wholebody of man before and after ingestion of a singlemixed meal. American Journal of Clinical Nutrition 49,1203–1210.
Eriksson, L.S., Broberg, S., Björkman, O. & Wahren, J.(1985) Ammonia metabolism during exercise in man.Clinical Physiology 5, 325–336.
Essen, B. & Kaijser, L. (1978) Regulation of glycolysis inintermittent exercise in man. Journal of Physiology 281,499–511.
Felig, P. & Wahren, J. (1971) Amino acid metabolism inexercising man. Journal of Clinical Investigation 50,2703–2714.
Felig, P., Pozefsky, T., Marliss, E. & Cahill, G.F. (1970)Alanine: a key role in gluconeogenesis. Science 167,1003–1004.
Fitts, R.H. (1994) Cellular mechanisms of musclefatigue. Physiological Reviews 74, 49–94.
Goldberg, A.L. & Chang, T.W. (1978) Regulation andsignificance of amino acid metabolism in skeletalmuscle. Federation Proceedings 37, 2301–2307.
Haymond, M.W. & Miles, J.M. (1982) Branched-chainamino acids as a major source of alanine nitrogen inman. Diabetes 31, 86–89.
Hoerr, R.A., Matthews, D.E., Bier, D.M. & Young, V.R.(1991) Leucine kinetics from [2H3]- and [13C]leucineinfused simultaneously by gut and vein. AmericanJournal of Physiology 260, E111–E117.
Krebs, H.A. (1975) The role of chemical equilibria inorgan function. Advances in Enzyme Regulation 15,449–472.
Lacey, J.M. & Wilmore, D.W. (1990) Is glutamine a con-ditionally essential amino acid? Nutrition Reviews 48,297–309.
Lee, S.-H.C. & Davis, E.J. (1986) Amino acid catabolismby perfused rat hindquarter: the metabolic fates ofvaline. Biochemical Journal 233, 621–630.
Lowenstein, J.M. & Goodman, M.N. (1978) The purinenucleotide cycle in skeletal muscle. Federation Pro-ceedings 37, 2308–2312.
MacLean, D.A., Graham, T.E. & Saltin, B. (1996) Stimu-lation of muscle ammonia production during exercise following branched-chain amino acid sup-plementation in humans. Journal of Physiology 493,909–922.
Madsen, K., MacLean, D.A., Kiens, B. & Christensen, D.(1996) Effects of glucose, glucose plus branched-chain amino acids or placebo on bike performanceover 100 km. Journal of Applied Physiology 81,2644–2650.
Marliss, E.B., Aoki, T.T., Pozefsky, T., Most, A.S. &Cahill, G.F. (1971) Muscle and splanchnic glutamineand glutamate metabolism in postabsorptive andstarved man. Journal of Clinical Investigation 50,814–817.

Matthews, D.E., Marano, M.A. & Campbell, R.G. (1993)Splanchnic bed utilization of glutamine and glu-tamic acid in humans. American Journal of Physiology264, E848–E854.
Nurjhan, N., Bucci, A., Perriello, G., Stumvoll, N.,Dailey, G., Bier, D.M., Toft, I., Jenssen, T.G. & Gerich,J.E. (1995) Glutamine: a major gluconeogenic precur-sor and vehicle for interorgan carbon transport inman. Journal of Clinical Investigation 95, 272–277.
Owen, O.E., Felig, P., Morgan, A.P., Wahren, J. & Cahill,G.F. (1969) Liver and kidney metabolism during pro-longed starvation. Journal of Clinical Investigation 48,574–583.
Pacy, P.J., Price, G.M., Halliday, D., Quevedo, M.R. &Millward, D.J. (1994) Nitrogen homeostasis in man:the diurnal responses of protein synthesis and de-gradation and amino acid oxidation to diets withincreasing protein intakes. Clinical Science 86,103–118.
Perriello, G., Jorde, R., Nurjhan, N. et al. (1995) Estima-tion of glucose–alanine–lactate–glutamine cycles inpostabsorptive humans: role of skeletal muscle.American Journal of Physiology 269, E443–E450.
Rennie, M.J. (1996) Influence of exercise on protein andamino acid metabolism. In Handbook of Physiology.Section 12, Exercise: Regulation and Integration of Mul-tiple Systems (ed. L.B. Rowell & J.T. Shepherd), pp.995–1035. Oxford University Press, Oxford.
Rennie, M.J., Edwards, R.H.T., Halliday, D., Matthews,D.E., Wolman, S.L. & Millward, D.J. (1982) Muscleprotein synthesis measured by stable isotope tech-niques in man: the effects of feeding and fasting.Clinical Science 63, 519–523.
Rennie, M.J., Babij, P., Taylor, P.M. et al. (1986) Charac-teristics of a glutamine carrier in skeletal musclehave important consequences for nitrogen loss ininjury, infection and chronic disease. Lancet 2,1008–1012.
Ross, B.D., Hems, R. & Krebs, H.A. (1967) The rates ofgluconeogenesis from various precursors in the per-fused rat liver. Biochemical Journal 102, 942–951.
Ruderman, N.B. & Lund, P. (1972) Amino acid metabo-lism in skeletal muscle: regulation of glutamine andalanine release in the perfused rat hindquarter. IsraelJournal Medical Sciences 8, 295–302.
Sahlin, K., Katz, A. & Broberg, S. (1990) Tricarboxylicacid cycle intermediates in human muscle duringprolonged exercise. American Journal of Physiology259, C834–C841.
Spencer, M.K., Yan, Z. & Katz, A. (1992) Effect of glyco-gen on carbohydrate and energy metabolism inhuman muscle during exercise. American Journal ofPhysiology 262, C975–C979.
Souba, W.W. (1991) Glutamine: a key substrate for thesplanchnic bed. Annual Reviews of Nutrition 11,285–308.
Van Acker, B.A.C., Hulsewé, K.W.E., Wagenmakers,A.J.M. et al. (1998) Absence of glutamine isotopicsteady state: implications for studies on glutaminemetabolism. Clinical Science 95, 339–346.
Van Hall, G. (1996) Amino acids, ammonia and exercise inman. Thesis, Maastricht University, The Netherlands.
Van Hall, G., Raaymakers, J.S.H., Saris, W.H.M. &Wagenmakers, A.J.M. (1995a) Ingestion of branched-chain amino acids and tryptophan during sustainedexercise: failure to affect performance. Journal ofPhysiology 486, 789–794.
Van Hall, G., Saltin, B., van der Vusse, G.J., Söderlund,K. & Wagenmakers, A.J.M. (1995b) Deamination ofamino acids as a source for ammonia production inhuman skeletal muscle during prolonged exercise.Journal of Physiology 489, 251–261.
Van Hall, G., MacLean, D.A., Saltin, B. & Wagenmakers, A.J.M. (1996) Mechanisms of activa-tion of muscle branched-chain a-keto acid dehydro-genase during exercise in man. Journal of Physiology494, 899–905.
Vinnars, E., Bergström, J. & Fürst, P. (1975) Influence of the postoperative state on the intracellular freeamino acids in human muscle tissue. Annals ofSurgery 182, 665–671.
Wagenmakers, A.J.M. (1992) Role of amino acids and ammonia in mechanisms of fatigue. In MuscleFatigue Mechanisms in Exercise and Training, Medicineand Sport Science, Vol. 34 (ed. P. Marconnet, P.V. Komi,B. Saltin & O.M. Sejersted), pp. 69–86. Karger, Basel,Switzerland.
Wagenmakers, A.J.M. & Soeters, P.B. (1995) Metabo-lism of branched-chain amino acids. In Amino AcidMetabolism and Therapy in Health and NutritionalDisease (ed. L.A. Cynober), pp. 67–83. CRC Press,New York.
Wagenmakers, A.J.M. & Van Hall, G. (1996) Branched-chain amino acids: nutrition and metabolism in exer-cise. In Biochemistry of Exercise IX (ed. R.J. Maughan& S.M. Shirreffs), pp. 431–443. Human Kinetics,Champaign, IL.
Wagenmakers, A.J.M., Salden, H.J.M. & Veerkamp, J.H.(1985) The metabolic fate of branched-chain aminoacids and 2-oxo acids in rat muscle homogenates anddiaphragms. International Journal of Biochemistry 17,957–965.
Wagenmakers, A.J.M., Coakley, J.H. & Edwards, R.H.T.(1990) Metabolism of branched-chain amino acidsand ammonia during exercise: clues from McArdle’sdisease. International Journal of Sports Medicine 11,S101–S113.
Wagenmakers, A.J.M., Beckers, E.J., Brouns, F., Kuipers,H., Soeters, P.B., van der Vusse, G.J. & Saris, W.H.M.(1991) Carbohydrate supplementation, glycogendepletion, and amino acid metabolism during exer-cise. American Journal of Physiology 260, E883–E890.
amino acid metabolism in exercise 131

Wagenmakers, A.J.M., Van Hall, G. & Saltin, B. (1996a)Excessive muscle proteolysis during one leg exerciseis exclusively attended by increased de novo synthe-sis of glutamine, not of alanine. Clinical Nutrition 15(Suppl. 1), 1.
Wagenmakers, A.J.M., Van Hall, G. & Saltin, B. (1996b)High conversion rates of glutamate and branched-chain amino acids to glutamine during prolongedone leg exercise: an alternative mechanism for syn-thesis of tricarboxylic acid cycle intermediates. ThePhysiologist 39, A-73.
Wahren, J., Felig, P. & Hagenfeldt, L. (1976) Effect of
132 nutrition and exercise
protein ingestion on splanchnic and leg metabolismin normal man and patients with Diabetes Mellitus.Journal of Clinical Investigation 57, 987–999.
Windmueller, H.G. & Spaeth, A.E. (1974) Uptake and metabolism of plasma glutamine by the smallintestine. Journal of Biological Chemistry 249, 5070–5079.
Wirthensohn, G. & Guder, W. (1986) Renal substratemetabolism. Physiological Reviews 66, 469–497.
Yoshida, S., Lanza-Jacoby, S. & Stein, T.P. (1991) Leucineand glutamine metabolism in septic rats. BiochemicalJournal 276, 405–409.

Introduction
For at least 150 years, scientists have studied fueluse during various types of physical exercise.Over this time, there has been considerabledebate relative to the importance of dietaryprotein for individuals who exercise regularly. In fact, the understanding of protein’s role inexercise metabolism has changed dramaticallyseveral times since the middle of the 19thcentury. In the mid-1800s it was thought thatprotein was the major fuel for muscle contraction(von Liebig 1842) and, consequently, it is under-standable that large amounts of protein wereconsumed by the athletes of that time. However,a number of studies completed later in the 19thcentury and during the first part of the 20thcentury (reviewed in Cathcart 1925) indicatedthat protein played a much smaller role in termsof exercise fuel (contributing less than 10% of theenergy expended during exercise). As a result, at least in the scientific community, the beliefregarding the importance of protein in exercisemetabolism was essentially totally reversed(going from the major contributor to virtually no contribution). Based on these data, it wasbelieved that exercise did not increase one’s need for dietary protein. It is unknown why theobserved protein contribution was consideredunimportant, but likely it was an over-reaction to the new information which was so vastly different from the prevailing view of the time orperhaps simply the belief that the amount ofprotein typically consumed was sufficient to
cover this small increased need. In any event, theunderstanding that dietary protein needs wereunaffected by physical exercise became so domi-nant that the vast majority of the exercise meta-bolic work throughout the first three-quarters ofthe 20th century concentrated on carbohydrateand fat and, as a result, almost totally ignored therole of protein (Åstrand & Rodahl 1977).
Beginning in the 1970s, first sporadically (Felig& Wahren 1971; Poortmans 1975; Haralambie &Berg 1976; Dohm et al. 1977; Lemon & Mullin1980; Lemon & Nagle 1981; White & Brooks 1981;Lemon et al. 1982), but recently more regularly(for review, see Lemon 1997), studies began toappear which suggested that protein intakes in excess of sedentary recommendations may be beneficial for those who regularly engage instrenuous physical exercise. However, the issueof exercise effects on protein need is extremelycomplex and still there is no absolute consensus(Lemon 1987, 1991, 1996; Butterfield 1991; Evans1993; Millward et al. 1994; Rennie et al. 1994;Wagenmakers & van Hall 1996). Further com-plicating this issue is the fact that the currentdietary recommendations for protein in severalcountries do not adequately address this topicbecause they are based primarily on studies ofsubjects who were essentially sedentary. More-over, some recommendations have not been kept up to date. For example, not only were thecurrent recommendations in the United Statespublished a number of years ago but, in addition,they do not contain a single reference relating to the possible influence of chronic exercise on
Chapter 10
Effects of Exercise on Protein Metabolism
PETER W.R. LEMON
133
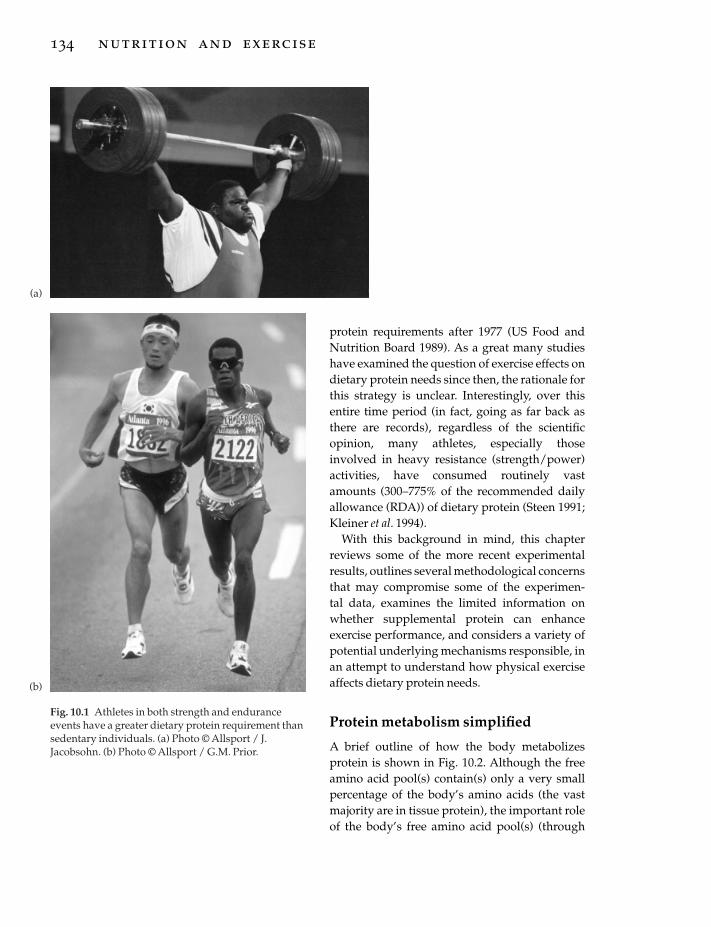
134 nutrition and exercise
protein requirements after 1977 (US Food andNutrition Board 1989). As a great many studieshave examined the question of exercise effects ondietary protein needs since then, the rationale forthis strategy is unclear. Interestingly, over thisentire time period (in fact, going as far back asthere are records), regardless of the scientificopinion, many athletes, especially thoseinvolved in heavy resistance (strength/power)activities, have consumed routinely vastamounts (300–775% of the recommended dailyallowance (RDA)) of dietary protein (Steen 1991;Kleiner et al. 1994).
With this background in mind, this chapterreviews some of the more recent experimentalresults, outlines several methodological concernsthat may compromise some of the experimen-tal data, examines the limited information onwhether supplemental protein can enhance exercise performance, and considers a variety ofpotential underlying mechanisms responsible, inan attempt to understand how physical exerciseaffects dietary protein needs.
Protein metabolism simplified
A brief outline of how the body metabolizesprotein is shown in Fig. 10.2. Although the freeamino acid pool(s) contain(s) only a very smallpercentage of the body’s amino acids (the vastmajority are in tissue protein), the important roleof the body’s free amino acid pool(s) (through
Fig. 10.1 Athletes in both strength and enduranceevents have a greater dietary protein requirement thansedentary individuals. (a) Photo © Allsport / J.Jacobsohn. (b) Photo © Allsport / G.M. Prior.
(a)
(b)

which all amino acids must pass) is indicated bythe size and central location of its sphere in Fig.10.2. Physiologically, there are only three waysamino acids can enter the free pool(s) (fromdietary protein during digestion, from tissueprotein breakdown, or as dispensable — that is,non-essential — amino acids formed in the bodyfrom NH3 and a carbon source; numbers 1, 2 and3, respectively, in Fig. 10.2). Of course, some con-sumed amino acids are never absorbed (lost infaeces) and a fourth method of input is possible,at least in the laboratory (via intravenous infu-sion of amino acids). When studying indispen-sible (essential) amino acids, route 3 iseliminated, as these amino acids cannot beformed in the body. Once in the free pool(s), thereare also four ways amino acids can leave (secre-tion into the gut, incorporation into tissueprotein, oxidation — amino acid nitrogen lost inurine or sweat; carbon in breath — or incorpora-tion into carbohydrate or fat for storage energy —amino nitrogen lost in urine; letters a, b, c and d,respectively, in Fig. 10.2). During exercise, routesa (due to blood redistribution) and d (due to theoverall catabolic stimulus) are considered unim-portant. Over time, following constant infusionor repeated ingestion of a labelled representativeindicator amino acid (tracer), an isotopic equilib-rium can be obtained, i.e. input into the freepool(s) equals output, and movement of thetracer amino acid through the system (turnover
or flux) can be measured. This requires onlyminimal invasiveness because tissue values(enrichment) can be estimated from blood (recip-rocal pool model; Matthews et al. 1982; Horber et al. 1989) or urine samples (assumption is thatthe urinary enrichment is representative of theend product of protein breakdown). By combin-ing these data with dietary intake (and infusionrate, if applicable), and/or measures of oxidation(requires breath sampling), it is possible to estimate whole-body protein degradation rates(Picou & Taylor-Roberts 1969):
turnover (or flux)– intake+ infusion=degradation
or whole-body protein synthetic rates (i.e. non-oxidative loss):
turnover–oxidation or urinary excretion= synthesis
Traditionally, whole-body nitrogen status hasbeen evaluated by a technique known as nitro-gen balance. This involves measuring duplicatemeals to those consumed by the experimentalsubjects in order to accurately quantify nitrogenintake (protein intake is estimated by assumingthat the average nitrogen content of food proteinis 16%, i.e. multiplying the nitrogen intake by6.25), all routes of nitrogen excretion (typicallyonly urine and faeces are measured and miscella-neous losses, including through the skin, are
effects of exercise on protein metabolism 135
Dietaryprotein(aminoacids)
Infusion(amino acids)
CHO or fat C +NH3
C oxidizedto CO2
Tissueprotein
C converted toCHO or fatSweat (N)Urine (N)
Faeces(C and N)
Gut
14 3
21
a
c,d cd
bc
Synthesis
Degradation
Free aminoacid pool(s)
Fig. 10.2 Simplified diagram ofprotein metabolism. Amino acidentry into the free pool is shown bynumbers and exit from the freepool by letters. Nitrogen status(balance) measures involvequantifying the difference betweenall nitrogen intake and excretionwhile protein turnover measuresallow estimates of the componentprocess involved, i.e. whole-bodyprotein synthesis and degradation.Adapted from Lemon (1996).
estimated), and then calculating the differencebetween the two. Estimating the miscellaneousnitrogen losses is usually appropriate because insedentary individuals they are small, quite con-sistent and extremely difficult to measure com-pletely. However, with exercise, dermal nitrogenloss via sweating should be quantified, as it canbe substantial (Consolazio et al. 1963; Lemon &Mullin 1980). When intake of nitrogen exceedsthe total excreted, one is in positive nitrogenbalance (negative nitrogen balance if excretionexceeds intake). This latter situation cannot con-tinue for very long without losses of essentialbody components because, unlike carbohydrateand fat, the body does not contain an energyreserve as protein (all body protein has a struc-tural or functional role). Although ‘negative’ and‘positive’ as descriptors of balance are common-place in the literature, it is recommended that‘status’ be used instead of ‘balance’, to avoid theterms ‘positive balance’ or ‘negative balance’,which seem nonsensical.
Nitrogen balance (status) is a classic techniquewhich has been used in the vast majority ofstudies considered by the expert committees inmany countries when determining the recom-mended dietary allowance for protein (US Foodand Nutrition Board 1989). However, it shouldbe understood that this method has a number oflimitations (inconvenient for the subjects, labourintensive for the investigators, tends to over-estimate the nitrogen that is actually retained, i.e. generally overestimates intake and under-estimates excretion), and due to its ‘black box’nature cannot provide specific information aboutthe various component parts of protein metabo-lism (Lemon et al. 1992; Fuller & Garlick 1994).Also, nitrogen status (balance) is affected byenergy balance (Munro 1951), which can con-found the data, especially in exercise studieswhere this is not always tightly controlled.Further, a number of potential confounders fre-quently exist, including: inadequate adaptationtime to changing experimental diets (Scrimshawet al. 1972), exercise-induced changes in the timecourse and/or relative importance of the various
136 nutrition and exercise
routes of nitrogen excretion (Austin et al. 1921;Lemon & Mullin 1980; Dolan et al. 1987), techni-cal problems making complete collections ofnitrogen excretion difficult (Lutwak & Burton1964; Bingham & Cummings 1983; Lemon et al.1986; Dolny & Lemon 1988), and the inappropri-ate use of linear regression to estimate proteinneed with either very high or very low proteindiets, i.e. when the response is curvilinear(Rennie et al. 1994). As a result, the literaturemust be examined very critically.
More recently, investigators have utilized themetabolic tracer technique, where the compo-nent parts of the protein metabolism ‘black box’can be investigated (Waterlow 1995). As alludedto above, this means one can estimate whole-body protein synthetic rates, if oxidation rates orurinary excretion are measured, and whole-bodyprotein degradation rates, if dietary/infusionrates are measured. Although this technique hasgreat promise to help elucidate how exercise af-fects protein metabolism, it too has several limi-tations, including expense, invasiveness and thevalidity of its various assumptions (Young et al.1989; Wolfe 1992; Garlick et al. 1994; Rennie et al.1994; Tessari et al. 1996). Although technicallymore difficult, muscle protein synthesis, whichrepresents about 25–30% of whole-body proteinsynthesis, can also be measured by quantifyingisotope enrichment in muscle samples obtainedvia the needle biopsy technique (Nair et al. 1988;Chesley et al. 1992; Biolo et al. 1995; MacDougallet al. 1995).
Evidence that protein needs areincreased with physical exercise
In recent years, a variety of experimental datawhich suggest that exercise has dramatic effectson protein metabolism have begun to accu-mulate. For example, several investigators havemeasured losses in rodent muscle (Varrik et al.1992) and/or liver protein (Dohm et al. 1978;Kasperek et al. 1980) following exercise, espe-cially with prolonged endurance exercise (Fig.10.3). Consistent with these observations, we

have measured a 113% increase in the activemuscle urea nitrogen content (268± 68 to 570± 89mg ·g–1 muscle wet mass) of rodents immediatelyfollowing 1h of running exercise at 25m· min–1
(unpublished data). Moreover, increased rates of muscle protein degradation (Kasperek &Snider 1989) and significant muscle damage(Armstrong et al. 1983; Newman et al. 1983;Friden et al. 1988; Evans & Cannon 1991; Kuipers1994) with exercise are well documented inseveral mammalian species (including humans),especially when the exercise has a significanteccentric component. Lysosomal proteases, i.e.cathepsins, have been implicated in this exercisecatabolic response (Seene & Viru 1982; Tapscott etal. 1982; Salminen et al. 1983; Salminen & Vihko1984) but some believe (Kasperek & Snider 1989)these do not play a major role. Recently it hasbeen suggested (Belcastro et al. 1996) that non-lysosomal proteases, perhaps a calcium-activated neutral protease (calpain), stimulatedby an exercise-induced increased intracellularcalcium may be primarily responsible for theinitial damage which occurs immediately afterexercise. Evidence for this comes not only fromthe observation that isozymes of calpain increase22–30% with exercise (Belcastro 1993) but alsobecause the pattern of exercise-induced myofib-rillar damage is similar to that induced bycalpain (Goll et al. 1992). Lysosomal protease
activity may play an more important role in themuscle damage that is seen later (several days)following exercise (Evans & Cannon 1991; MacIntyre et al. 1995). Whether increased proteinintake can reduce this damage or speed the subsequent repair processes are interesting questions.
Together, the large efflux of the amino acidsalanine (Felig & Wahren 1971) and glutamine(Ruderman & Berger 1974) from active muscle, aswell as the frequently observed accumulation/excretion of protein metabolism end products,urea (Refsum & Stromme 1974; Haralambie &Berg 1976; Lemon & Mullin 1980; Dohm et al.1982) and ammonia (Czarnowski & Gorski 1991;Graham & MacLean 1992; Graham et al. 1995)provide strong indirect evidence that significantincreases in branched-chain amino acid (BCAA)metabolism occur with endurance exercise (Fig.10.4). Further, this has been confirmed usingdirect oxidation measures (Fig. 10.5) by a numberof independent investigations (White & Brooks1981; Hagg et al. 1982; Lemon et al. 1982; Babij et al. 1983; Meredith et al. 1989; Phillips et al.1993). This is likely the result of an exercise inten-sity-dependent activation of the limiting enzyme(branched-chain oxoacid dehydrogenase) in theoxidation pathway of the BCAA (Kasperek &Snider 1987). This response is apparently directlyproportional to BCAA availability (Knapik et al.
effects of exercise on protein metabolism 137
Prot
ein
conc
entr
atio
n (m
g.10
0 g–1
)
24
10
22
16
Sedentarycontrols
0
Time after exercise (h)
20
18
14
12
2 6 24 48
*
Fig. 10.3 Effect of prolongedendurance exercise (10 hswimming in rodents) on proteinconcentration in the red portion ofthe quadriceps muscle. Note thedecrease immediately followingthe exercise bout. *, P < 0.05.Adapted from Varrik et al. (1992).

1991; Layman et al. 1994) and inversely propor-tional to glycogen availability (Lemon & Mullin1980; Wagenmakers et al. 1991), although otherfactors may also be important (Jackman et al.1997). This suggests that dietary protein, dietarycarbohydrate, prior exercise and time since theprevious meal are probably all important deter-minants of BCAA oxidation during exercise.
The magnitude of this increased BCAA oxida-tion could be important relative to daily BCAArequirements because a single bout of moderateexercise (2 h at 55% V
.o2max.) can produce an oxi-
dation rate equivalent to almost 90% of the dailyrequirement for at least one of the BCAA (Evanset al. 1983). In addition, it is possible that this oxi-dation rate could be even higher in endurance-trained individuals because at least two studies
138 nutrition and exercise
with rodents have shown that the endurancetraining process results in further increases in BCAA oxidation both at rest and duringendurance exercise (Dohm et al. 1977; Hendersonet al. 1985). With endurance exercise, this increaseis proportional to exercise intensity (Babij et al.1983) but, despite the extremely intense nature ofstrength exercise, BCAA oxidation appears to belargely unaffected by this exercise stimulus (Fig.10.6) (Tarnopolsky et al. 1991). This is likely dueto the fact that strength exercise is so intense that a major portion of the necessary energy must bederived via anaerobic metabolism, i.e. storedphosphagens and muscle glycogen, rather thanvia oxidative pathways.
Interesting data are also available from severalelegant nitrogen status (balance) experiments
Branched-chainamino acids
BCAAAT
Branched chainoxoacids
BCOADH
Oxidation (CO2)Glutamine
(released from muscle)Urea formation
(liver)
Pyruvate
AAT
Alanine (releasedfrom muscle)
Urea formation (liver)2-oxoglutarate
GDH
Glutamate
GS NH+4
100
80
60
40
20
010 20 30 40 50 60 70 80 90 100
Exercise intensity (%VO2max).
Wh
ole
-bo
dy
leu
cin
e fl
ux
oxi
diz
ed (
%)
Fig. 10.4 Overview of branched-chain amino acid metabolismshowing the production of alanineand glutamine in muscle, as wellas the formation of urea in theliver. AAT, alanine aminotransferase; BCAAAT, branched-chain amino acid aminotransferase; BCOADH, branched-chain oxoacid dehydrogenase;GDH, glutamate dehydrogense;GS, glutamine synthetase; NH4
+,ammonium.
Fig. 10.5 Effect of enduranceexercise intensity (V
.o2max.) on the
oxidation of one of the branched-chain amino acids (leucine) infour human subjects. Note thelinear increase in oxidation withincreasing exercise intensity. r =0.93; y = 0.71x + 8.44. Adaptedfrom Babij et al. (1983).

suggesting that dietary protein needs are ele-vated with both endurance and strength exercise.The data of Gontzea et al. (1974) suggest thatdietary protein needs are elevated with anaerobic exercise programme (Fig. 10.7) but subse-quent work by the same group (Gontzea et al.1975) indicates that this might be true only transiently during the first few weeks of an endurance exercise programme (Fig. 10.8).
However, the data in this second investigationmay have been confounded by an exercise train-ing effect because the exercise stimulus remainedconstant over the 3-week period when nitrogenstatus was assessed. In other words, the im-proved endurance capacity (V
.o2max.) likely expe-
rienced as the study progressed by thesepreviously untrained subjects would mean thatthe same absolute exercise bout represented a
effects of exercise on protein metabolism 139
Pre-exerciseStrengthexercise Recovery
–50 0 50 100 150 200
120
100
80
60
40
20
0
Time (min)
Wh
ole
-bo
dy
leu
cin
e o
xid
atio
n(µ
mo
l. kg
–1. h
–1)
Nit
rog
en b
alan
ce (
g. d
ay–1
)
4
2
0
–2
–42 4 6 8 10 12 14
Time (days)
Exercise SedentarySedentary
Fig. 10.7 Effect of an acute endurance exercise bout on nitrogen status (balance) while consuming differing proteinintake in humans. Note that the overall pattern of nitrogen status with exercise is similar with both protein intakesand that with the lower protein intake (125% of the recommended dietary intake for protein) nitrogen statusbecomes negative with the exercise programme, suggesting that this amount of dietary protein, while adequate forthe sedentary individual, is inadequate for exercise. �, 1 g protein · kg–1 body mass · day–1; �, 1.5 g protein · kg–1
body mass · day–1. Adapted from Gontzea et al. (1974).
Fig. 10.6 Effect of a strenuous,whole-body heavy resistanceexercise bout on oxidation of thebranched-chain amino acidleucine in humans. Note thatdespite the vigorous nature of thetraining session, there is littleeffect on leucine oxidation eitherduring the exercise or during 2 h ofrecovery. Adapted fromTarnopolsky et al. (1991).
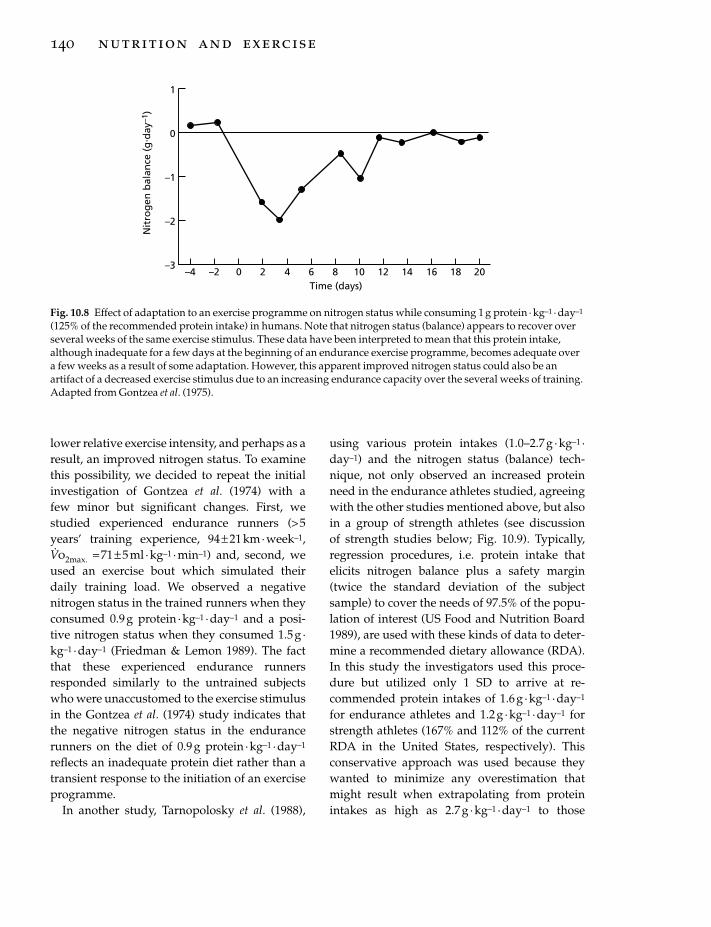
lower relative exercise intensity, and perhaps as aresult, an improved nitrogen status. To examinethis possibility, we decided to repeat the initialinvestigation of Gontzea et al. (1974) with a few minor but significant changes. First, westudied experienced endurance runners (> 5years’ training experience, 94± 21km ·week–1,V.o2max. = 71± 5 ml · kg–1 ·min–1) and, second, we
used an exercise bout which simulated theirdaily training load. We observed a negativenitrogen status in the trained runners when theyconsumed 0.9 g protein · kg–1 ·day–1 and a posi-tive nitrogen status when they consumed 1.5g ·kg–1 ·day–1 (Friedman & Lemon 1989). The factthat these experienced endurance runnersresponded similarly to the untrained subjectswho were unaccustomed to the exercise stimulusin the Gontzea et al. (1974) study indicates thatthe negative nitrogen status in the endurancerunners on the diet of 0.9g protein ·kg–1 · day–1
reflects an inadequate protein diet rather than atransient response to the initiation of an exerciseprogramme.
In another study, Tarnopolosky et al. (1988),
140 nutrition and exercise
using various protein intakes (1.0–2.7g · kg–1 ·day–1) and the nitrogen status (balance) tech-nique, not only observed an increased proteinneed in the endurance athletes studied, agreeingwith the other studies mentioned above, but alsoin a group of strength athletes (see discussion of strength studies below; Fig. 10.9). Typically,regression procedures, i.e. protein intake thatelicits nitrogen balance plus a safety margin(twice the standard deviation of the subjectsample) to cover the needs of 97.5% of the popu-lation of interest (US Food and Nutrition Board1989), are used with these kinds of data to deter-mine a recommended dietary allowance (RDA).In this study the investigators used this proce-dure but utilized only 1 SD to arrive at re-commended protein intakes of 1.6 g ·kg–1 · day–1
for endurance athletes and 1.2g ·kg–1 · day–1 forstrength athletes (167% and 112% of the currentRDA in the United States, respectively). This conservative approach was used because theywanted to minimize any overestimation thatmight result when extrapolating from proteinintakes as high as 2.7 g · kg–1 ·day–1 to those
Nit
rog
en b
alan
ce (
g. d
ay–1
)
1
0
–1
–2
–3–4 –2 0 2 4 6 8 10 12 14 16 18 20
Time (days)
Fig. 10.8 Effect of adaptation to an exercise programme on nitrogen status while consuming 1 g protein · kg–1 · day–1
(125% of the recommended protein intake) in humans. Note that nitrogen status (balance) appears to recover overseveral weeks of the same exercise stimulus. These data have been interpreted to mean that this protein intake,although inadequate for a few days at the beginning of an endurance exercise programme, becomes adequate overa few weeks as a result of some adaptation. However, this apparent improved nitrogen status could also be anartifact of a decreased exercise stimulus due to an increasing endurance capacity over the several weeks of training.Adapted from Gontzea et al. (1975).

required for nitrogen balance. Finally, inclusionof the sedentary group in this study is note-worthy because any methodological errorswould be similar across all three groups andtherefore the differences in protein intake neces-sary to elicit nitrogen balance (0.73, 0.82 and 1.37g · kg–1 ·day–1 for sedentary, strength athleteand endurance athlete groups, respectively)should reflect true differences in the dietaryprotein need of these groups.
Shortly thereafter, Meredith et al. (1989) usedboth the traditional nitrogen status (balance)technique and protein turnover measures (oraldoses of 15N-glycine every 3h for 60h) to assessdietary protein needs in young (26.8±1.2 years)and middle-aged (52.0± 1.9 years) endurance-trained men (>11 years’ training). These nitrogenstatus data indicate that protein needs were elevated similarly in both age groups (by 37%)relative to the data of a previously publishedstudy on sedentary individuals from the samelaboratory. When these data were used to calcu-late a recommended dietary allowance forprotein based on regression procedures (asdescribed above; except here, twice the sampleSD was added because the protein intakes usedwere near the requirement, i.e. 0.61, 0.91 and 1.21g protein ·kg–1 · day–1) the obtained valuewas 1.26g protein ·kg–1 · day–1 (157% of thecurrent RDA in the United States). In addition,
further support for the advantage of the higherprotein intake was found in the protein turnoverdata which showed that the protein syntheticrate was higher in both age groups when 1.21 vs.0.61g protein ·kg–1 ·day–1 was consumed.
The subsequent data of Phillips et al. (1993),who found a negative nitrogen status (balance)in endurance runners (>5 years’ training experi-ence, 43–50km ·week–1, V
.o2max. =66–68 ml ·kg–1
fat free mass · min–1), adapted to a protein intakeof 0.8–0.94 g · kg–1 ·day–1 provide further supportthat protein needs are elevated in trainedendurance athletes. In addition, a greater nega-tive nitrogen status (balance) in the male vs. thefemale subjects was noted in this study and thisapparent gender difference in protein use wasconfirmed by greater leucine oxidation rates (Fig.10.10) in the men both at rest and during exercise(Phillips et al. 1993). Apparently, this gender dif-ference is related to reduced glycogen and/orenhanced fat use in women, perhaps as a result ofdiffering hormonal responses (Tarnopolsky et al.1995). These observations, if confirmed with sub-sequent work, provide another example wheredata derived on male subjects may not be directlyapplicable to women.
At least two groups (Lemon et al. 1992;Tarnopolsky et al. 1992) have observed evenhigher protein needs in strength athletes (Fig.10.11) and based on nitrogen balance data have
effects of exercise on protein metabolism 141
3.2
2.8
2.4
2.0
1.6
1.2
0.8
0.4
0.0
Pro
tein
inta
ke (
g. k
g–1
. day
–1)
Nitrogen balance (g.day–1)
–2 0 2 4 6 8 10 12 14 16 18 20
Runners
Body builders
Sedentary
Fig. 10.9 Estimated dietaryrequirements (protein intakenecessary to elicit nitrogenbalance) in endurance athletes(�), strength athletes (�) andsedentary men (�). Note thatboth athlete groups have proteinrequirements (y intercepts)greater than those of theirsedentary counterparts. Adaptedfrom Tarnopolsky et al. (1988).

142 nutrition and exercise
recommended intakes of 1.7 and 1.8 g protein ·kg–1 ·day–1, respectively. Moreover, Fern et al.(1991) found a greater gain in mass over 4 weeksof training in body builders who consumed 3.3vs. 1.3g protein ·kg–1 ·day–1. This study is fasci-nating because it supports the age-old (butpoorly documented) belief of strength athletesthat very large amounts of dietary protein (andthe resulting highly positive nitrogen balance) in combination with the anabolic stimulus ofstrength exercise may be able to stimulate musclegrowth (Lemon 1991). However, amino acid oxi-dation also increased by 150% in this study, sug-gesting that the optimum protein intake waslikely exceeded. Subsequently, Tarnopolsky et al.(1992) observed an increase in whole-bodyprotein synthesis (Fig. 10.12) when athletes participating in a strength training programmeincreased their protein intake from 0.9 to 1.4g · kg–1 ·day–1. Interestingly, there was noadditional increase when they consumed a diet
Leuc
ine
oxid
atio
n (µ
mol
. kg–1
. g–1
)
Rest Exercise
*
*
70
**60
50
40
30
20
10
0
4
3
2
1
0
Pro
tein
inta
ke (
g. k
g–1
. day
–1)
–10 –5 0 5 10 15
Nitrogen balance (g.day–1)
Fig. 10.10 Effect of gender on oxidation of the aminoacid leucine both at rest and during an enduranceexercise bout in humans. Note that exercise increasesleucine oxidation (*, P < 0.01, exercise vs. rest) and thatboth at rest and during exercise the leucine oxidationrate is greater in the men (**, P < 0.01, men vs. women).� , men; , women. Adapted from Phillips et al.(1993).
Fig. 10.11 Estimated dietary requirements (protein intake necessary to elicit nitrogen balance) in novice body-building men. Note that while consuming 0.99 g protein · kg–1 body mass · day–1 (125% of the recommended dietaryintake for protein) (�), all subjects had a negative nitrogen status and a strong linear relationship between proteinintake and nitrogen status (r = 0.82, P < 0.01, y = 0.13x + 1.43). Using these data, the estimated dietary requirement forprotein (y intercept) is 1.43 g protein · kg–1 · day–1. Typically, recommendations for protein are equal to this value (yintercept) plus a safety buffer equal to 2 SD of the sample mean (in order to account for the variability in thepopulation relative to the sample studied). Here, the recommendation would be 1.63 g protein · kg–1 · day–1 (204% ofthe current recommendation). The linear relationship between protein intake and nitrogen status is lost at the highprotein intake studied (2.62 g protein · kg–1 · day–1) (�) and the nitrogen status was highly positive indicating thatthis intake exceeded protein need (r = 0.11; P < 0.05; y = – 0.93x + 2.76). For both treatments combined, r = 0.86;P < 0.01; y = – 0.11x + 1.53. Adapted from Lemon et al. (1992).
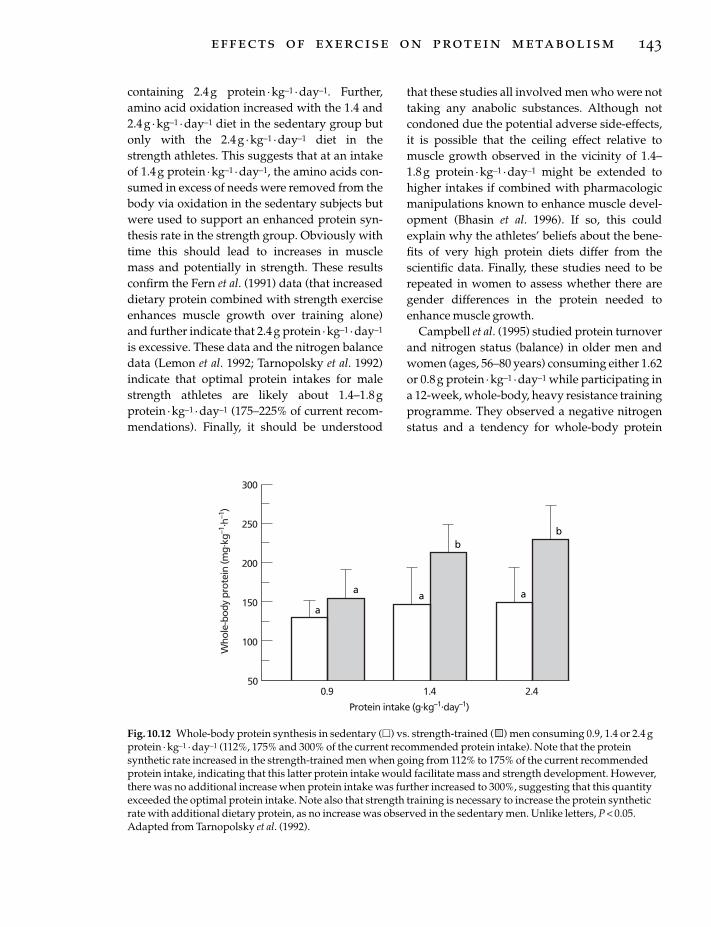
containing 2.4g protein ·kg–1 · day–1. Further,amino acid oxidation increased with the 1.4 and2.4g · kg–1 ·day–1 diet in the sedentary group butonly with the 2.4g · kg–1 · day–1 diet in thestrength athletes. This suggests that at an intakeof 1.4g protein ·kg–1 · day–1, the amino acids con-sumed in excess of needs were removed from thebody via oxidation in the sedentary subjects butwere used to support an enhanced protein syn-thesis rate in the strength group. Obviously withtime this should lead to increases in muscle mass and potentially in strength. These resultsconfirm the Fern et al. (1991) data (that increaseddietary protein combined with strength exerciseenhances muscle growth over training alone)and further indicate that 2.4 g protein ·kg–1 · day–1
is excessive. These data and the nitrogen balancedata (Lemon et al. 1992; Tarnopolsky et al. 1992)indicate that optimal protein intakes for malestrength athletes are likely about 1.4–1.8gprotein · kg–1 ·day–1 (175–225% of current recom-mendations). Finally, it should be understood
that these studies all involved men who were nottaking any anabolic substances. Although notcondoned due the potential adverse side-effects,it is possible that the ceiling effect relative tomuscle growth observed in the vicinity of 1.4–1.8g protein · kg–1 ·day–1 might be extended tohigher intakes if combined with pharmacologicmanipulations known to enhance muscle devel-opment (Bhasin et al. 1996). If so, this couldexplain why the athletes’ beliefs about the bene-fits of very high protein diets differ from the scientific data. Finally, these studies need to berepeated in women to assess whether there aregender differences in the protein needed toenhance muscle growth.
Campbell et al. (1995) studied protein turnoverand nitrogen status (balance) in older men andwomen (ages, 56–80 years) consuming either 1.62or 0.8g protein ·kg–1 ·day–1 while participating ina 12-week, whole-body, heavy resistance trainingprogramme. They observed a negative nitrogenstatus and a tendency for whole-body protein
effects of exercise on protein metabolism 143
Who
le-b
ody
prot
ein
(mg.
kg–1
. h–1
)
300
50
250
100
200
150
0.9 2.41.4
Protein intake (g.kg–1.day–1)
a
aa a
bb
Fig. 10.12 Whole-body protein synthesis in sedentary (�) vs. strength-trained ( ) men consuming 0.9, 1.4 or 2.4 gprotein · kg–1 · day–1 (112%, 175% and 300% of the current recommended protein intake). Note that the proteinsynthetic rate increased in the strength-trained men when going from 112% to 175% of the current recommendedprotein intake, indicating that this latter protein intake would facilitate mass and strength development. However,there was no additional increase when protein intake was further increased to 300%, suggesting that this quantityexceeded the optimal protein intake. Note also that strength training is necessary to increase the protein syntheticrate with additional dietary protein, as no increase was observed in the sedentary men. Unlike letters, P < 0.05.Adapted from Tarnopolsky et al. (1992).

plus mineral mass to decrease (–3.5%) on thelower protein diet. In contrast, subjects (nogender difference was apparent) on the higherprotein diet had a greater protein synthetic rateand a tendency to increase whole-body proteinplus mineral mass (+1.9%). These data agreewith the findings in younger subjects (discussedabove) and further suggest that higher pro-tein diets are beneficial for older individuals whostrength train. This is especially importantbecause as the benefits of strength training forseniors become more apparent (Fiatarone et al.1990; Fiatarone et al. 1994), the number of olderindividuals adding this type of exercise trainingto their fitness/wellness programmes is growingsignificantly.
There is other supportive evidence for the sug-gestion that physically active individuals needadditional dietary protein (Consolazio et al. 1963,1975; Celejowa & Homa 1970; Laritcheva et al.1978; Marable et al. 1979; Dragan et al. 1985;Meredith et al. 1992) and, taking these togetherwith the recent nitrogen balance and proteinturnover results, it is difficult to deny that proteinintakes in excess of the current recommendations(0.8 g ·kg–1 · day–1 in most countries) are benefi-cial for those who are physically active. Itappears that the optimal protein intake forstrength athletes may be as high as 1.7–1.8 g ·kg–1 ·day–1 and for endurance athletes slightlyless, perhaps 1.2–1.4g protein ·kg–1 · day–1.However, as mentioned, these data have beencollected primarily on men. The limited dataavailable on female endurance athletes suggestthat dietary protein needs for women may besomewhat less but this is not well documented.Moreover, there are almost no data on femalebody builders. Consequently, these nitrogenbalance and tracer studies need to be repeatedwith female subjects to confirm the apparentgender differences with endurance exercise andto establish protein intake recommendations forfemale strength athletes.
Currently, despite anecdotal claims to the contrary, there is little good evidence that highprotein intakes (>1.3–1.4 g protein · kg–1 ·day–1)
144 nutrition and exercise
actually enhance muscle performance (Dragan et al. 1985; Brouns et al. 1989; Vukovich et al. 1992;Fry et al. 1993). Moreover, we did not observe an enhanced endurance running performancewith supplemental protein in rodents undergo-ing endurance training (Cortright et al. 1993) norcould we document greater muscle strength ormass gains in strength athletes with supplemen-tal protein (2.6g · kg–1 ·day–1) despite improvednitrogen status (Lemon et al. 1992). Further, ourstudies with differing protein types (soy, casein,whey) and strength training have not revealedany obvious performance advantage of any particular type of protein (Appicelli et al. 1995).However, our studies have only investigated theinitial response (4–8 weeks) to training and it ispossible that over longer time periods an advan-tage could become apparent. Given the fantasticclaims and the obvious potential monetary bene-fits in the athletic arena, it is somewhat surpris-ing that this area has received such little attentionamong scientists.
Are these moderately high proteinrecommendations healthy?
Many believe high protein diets are hazardousbut it is difficult to document an adverse effectexcept in patients with impaired kidney function(Brenner et al. 1982). Clearly, high dietary proteinincreases the work of the kidneys because of theadditional nitrogen load that must be excreted,but this does not seem to be a problem forhealthy individuals. In addition, serious adverseeffects have not been observed in rodents thatconsumed extremely high protein diets (80% ofenergy intake) for more than half their lifespan(Zaragoza et al. 1987). These data are particularlyinteresting not only because of their longitudinalnature but also because this diet represents atleast three times the protein percentage observedin the highest protein diets of athletes. Finally,the absence of reports of kidney problems inmiddle-aged weight lifters/body builders sug-gests that the dangers of high protein diets inhealthy individuals have probably been over-

estimated because many of these athletes haveconsumed high protein diets regularly for 20–30years or more.
Similarly, the association between high proteindiets and atherogenesis is likely overstated. Forexample, it appears that the well-documentedpositive relationship between animal proteinand plasma cholesterol observed in animalsdoesn’t apply to humans (West & Beynen 1985)and, as a result, the association between dietaryfat and blood fats is much weaker than oncethought (McNamara et al. 1987; Clifton & Nestel1996). Furthermore, even if these relationshipsare strong in sedentary individuals, the fate ofingested fat may be substantially different in physically active individuals (used as a fuelrather than stored in blood vessel walls oradipose tissue; Muoio et al. 1994; Leddy et al.1997).
At one time it appeared that high protein dietsresulted in an obligatory loss of calcium in theurine (Allen et al. 1979) and, if so, this could be problematic, especially for women, because of the potential to accelerate the development of osteoporosis. However, this appears to be aconcern only with purified protein supplementsbecause the phosphate content of protein foodapparently negates this accelerated calcium loss(Flynn 1985).
There are, however, at least two areas ofconcern with high protein diets. First, the addi-tional water excretion associated with the nitro-gen loss via the kidneys could be detrimental in physically active individuals (especiallyendurance athletes) because of their alreadyincreased fluid losses as sweat. The resultingdehydration could adversely affect exercise per-formance (Armstrong et al. 1985) and, if severeenough, even threaten health (Adolph 1947;Bauman 1995). For this reason, it is critical thatrehydration be adequate in athletes who ingesthigh protein diets. The best way to do this is byregularly monitoring changes in body mass. Dra-matic acute weight changes in athletes consum-ing high protein diets indicate that additionalrehydration is required. Second, the intake of
megadoses of individual amino acids (which hasonly become possible in recent years with thewidespread commercial development of indi-vidual amino acid supplements) could poten-tially be detrimental. The ergogenic benefits ofthese food supplements are promoted to athletesvery successfully because of the intense desire of most athletes to excell. Although many of the theoretical benefits sound convincing (espe-cially to the non-scientist), few are documented,despite considerable investigation (Brodan et al.1974; Kasai et al. 1978; Isidori et al. 1981; Maughan& Sadler 1983; Segura & Ventura 1988; Wessen et al. 1988; Bucci et al. 1990; Blomstrand et al. 1991; Kreider et al. 1992, 1996; Fogelholm et al.1993; Lambert et al. 1993; Newsholme & Parry-Billings 1994; Bigard et al. 1996; Wagenmakers &van Hall 1996; Suminski et al. 1997), and substan-tial potential complications exist (Harper et al.1970; Benevenga & Steele 1984; Yokogoshi et al.1987; Tenman & Hainline 1991). As a result, it is recommended that these supplements beavoided until such time as their safety as well astheir ergogenic benefits are proven.
Protein supplementation: is it necessary?
Protein supplementation is probably not neces-sary for the vast majority of physically activeindividuals because the amounts of proteinfound to be necessary (1.2–1.8 g ·kg–1 · day–1) canbe obtained in one’s diet assuming total energyintake is adequate. For example, a sedentaryindividual consuming about 10.5MJ · day–1
(2500 kcal · day–1), of which 10% is protein, wouldbe consuming about 63g protein daily. Assuminga body mass of 70 kg, this would be about 0.9 gprotein · kg–1 ·day–1 or about 112% of the currentprotein RDA in most countries. Should this indi-vidual begin an exercise programme and, conse-quently, double his/her energy intake to 21 MJ(5000 kcal) while maintaining 10% proteinintake, the resulting protein intake would alsodouble to 1.8 g · kg–1 ·day–1. This would be suffi-cient to cover the increased needs of all the
effects of exercise on protein metabolism 145

studies mentioned in this review. Moreover,despite the emphasis on carbohydrate in the dietof most athletes, maintaining 10% (2100 kJ or 500kcal) of energy intake as protein should notpose a problem because, if fat intake was 30% (6300 kJ or 1500 kcal), 12.6 MJ (3000 kcal)would remain, enabling this hypothetical athlete to consume about 750 g of carbohydrate(10.7 g ·kg–1). This quantity of carbohydrate iscertainly more than sufficient for any carbohy-drate loading programme.
Inadequate protein intake in active individualsis most likely to occur in those who have otherpre-existing conditions that interact with theexercise effect to increase the quantity of dietaryprotein required — for example, during periodsof rapid growth, e.g. in adolescents, children,women who are pregnant, etc.; in situationswhere total energy intake is inadequate, e.g.dieters, those in body mass-restricted activities,etc.; or in those who do not consume a diet from awide variety of food sources, e.g. many adoles-cents, vegetarians, women, seniors, etc. For someathletes, insufficient energy intake occurs (andtherefore perhaps protein, as well) because of thesheer bulk of food and fluids required to main-tain energy and fluid balance. In such situations,the use of a liquid meal replacement formulamay be advantageous.
If dietary inadequacies are suspected it is bestto complete a diet analysis (typically a 3–7-dayfood record is analysed with commercially avail-able software) in order to verify that there is in fact a problem. Unfortunately, in free livinghumans these analyses can be grossly inadequatenot only because the subjects are sometimesgiven poor instructions but also because somesubjects modify their diet in an attempt to pleasethe investigator. In addition, use of inadequatemethods to accurately quantify serving size is acommon problem (weigh scales must be used),as is simply forgetting to record all food con-sumed. Finally, 3 days may not be representativeof one’s true diet especially if weekends areexcluded (food intake may differ substantiallybetween week and weekend days) and 7-dayrecords are not always better because less-
146 nutrition and exercise
motivated subjects can become bored with the process and, consequently, fail to report accu-rately. For all these reasons, extreme care must be used in the interpretation of this kind of information.
Assuming that care has been taken to obtain anaccurate representation of an individual’s dietand an insufficient protein intake is found, onecan usually correct the problem with a few minoradjustments in the individual’s food selections.This means that, despite the fact that regular participation in an exercise programme (eitherstrength or endurance) will apparently increaseprotein requirements, special protein supple-ments (which are considerably more expensivethan food protein per kilogram of protein mass)are rarely necessary. Further, if it is determinedthat it is not possible to consume sufficientprotein in food and a decision is made to use a supplement, one of the best and most cost-effective approaches would be to fortify one’sfood with a high-quality, low-cost protein such asskim milk powder. Finally, there is even lesssupport for the commonly used practice of individual amino acid supplementation. Until such time as it is clear that one or a few individ-ual amino acids in high dosages are both benefi-cial and safe, this latter strategy is definitelycontraindicated.
Conclusion
After reviewing the literature, it is possible tomake a case that protein needs are elevated in physically active individuals, apparently to agreater extent with those actively engaged inregular strength exercise than with enduranceexercise. The limited available information sug-gests that the exercise effect on protein needsmay be greater in men than in women. In addi-tion, the increased protein need is likely greatestin situations where other factors compound theexercise effect. However, there is still consider-able debate regarding the magnitude of this exer-cise effect on protein requirements. This debatecentres on a variety of methodological concernswhich compromise a significant amount of the

experimental data that have been collected. As aresult, it is likely that a definite answer to thequestion of the optimal quantities of protein nec-essary for athletes must await the arrival of more definitive measures to assess proteinrequirements. Until that time, it appears that theincreased protein needs (perhaps 50–125% of the current recommended intakes in many coun-tries) can be met via appropriate food selectionswithout consuming expensive protein supple-ments. Finally, few data exist to support the fan-tastic performance effects frequently attributedto extremely high protein diets and this is an areathat needs much more attention.
Acknowledgements
The ongoing support of the author’s laboratoryby the Joe Weider Foundation is gratefullyacknowledged.
References
Adolf, E.F. (ed.) (1947) Physiology of Man in the Desert.Interscience, New York.
Allen, L.H., Oddoye, E.A. & Margen, S. (1979) Protein-induced hypercalciuria: a longer term study. American Journal of Clinical Nutrition 32, 741–749.
Armstrong, R.B., Ogilivie, R.W. & Schwane, J.A. (1983)Eccentric exercise-induced injury in rat skeletalmuscle. Journal of Applied Physiology 54, 80–93.
Åstrand, P.-O. & Rodahl, K. (1977) Textbook of WorkPhysiology. McGraw-Hill, New York.
Austin, J.H., Stillman, E. & Van Slyke, D.D. (1921)Factors governing the excretion of urea. Journal ofBiological Chemistry 46, 91–112.
Babij, P., Matthews, S.M. & Rennie, M.J. (1983) Changesin blood ammonia, lactate and amino acids in rela-tion to workload during bicycle ergometer exercisein man. European Journal of Applied Physiology 50,405–411.
Bauman, A. (1995) The epidemiology of heat stroke and associated thermoregulatory disorders. In Exercise and Thermoregulation (ed. J.R. Sutton, M.W.Thompson and M.E. Torode), pp. 203–208. The University of Sydney, Sydney.
Belcastro, A.N. (1993) Skeletal muscle calcium-activated neutral protease (calpain) with exercise.Journal of Applied Physiology 74, 1381–1386.
Belcastro, A.N., Albisser, T.A. & Littlejohn, B. (1996)Role of calcium-activated neutral protease (calpain)
with diet and exercise. Canadian Journal of AppliedPhysiology 21, 328–346.
Benevenga, N.J. & Steele, R.D. (1984) Adverse effects ofexcessive consumption of amino acids. AnnualReview of Nutrition 4, 157–181.
Bhasin, S., Storer, T.W., Berman, N. et al. (1996) Theeffects of supraphysiologic doses of testosterone onmuscle size and strength in normal men. NewEngland Journal of Medicine 335, 1–7.
Bigard, A.X., Laviet, P., Ullmann, L., Legrand, H.,Douce, P. & Guezennec, C.Y. (1996) Branched-chain amino acid supplementation during repeatedprolonged skiing exercises at altitude. InternationalJournal of Sports Nutrition 6, 295–306.
Bingham, S. & Cummings, J.H. (1983) The use of 4-aminobenzoic acid as a marker to validate com-pleteness of 24 h urine collections in man. ClinicalScience 64, 629–635.
Biolo, G., Maggi, S.P., Williams, B.D., Tipton, K.D. &Wolfe, R.R. (1995) Increased rates of muscle proteinturnover and amino acid transport after resistanceexercise in humans. American Journal of Physiology268, E514–E520.
Blomstrand, E., Hackmen, P., Kebob, B. & Newsholme,E.A. (1991) Administration of branched-chain aminoacids during prolonged exercise effects on perfor-mance and on plasma concentration of some aminoacids. European Journal of Applied Physiology 63, 83–88.
Brenner, B.M., Meter, T.W. & Hosteler, D. (1982) Proteinintake and the progressive nature of kidney disease:the role of hemodynamically mediated glomerularsclerosis in aging, renal ablation, and intrinsic renaldisease. New England Journal of Medicine 307, 652–657.
Brodan, V., Kuhn, E., Pechar, J., Placer, Z. & Slabochova,Z. (1974) Effects of sodium glutamate infusion onammonia formation during intense physical exer-cise. Nutrition Reports International 9, 223–232.
Brouns, F., Saris, W.H.M., Beckers, E. et al. (1989)Metabolic changes induced by sustained exhaustivecycling and diet manipulation. International Journal ofSports Medicine 10 (Suppl. 1), S49–S62.
Bucci, L.R., Hickson, J.F., Pivarnik, J.M., Wolinsky, I.,McMahon, J.S. & Turner, S.D. (1990) Ornithine inges-tion and growth hormone release in bodybuilders.Nutrition Research 10, 239–245.
Butterfield, G.E. (1991) Amino acids and high proteindiets. In Perspectives in Exercise Science and SportsMedicine. Vol. 4. Ergogenics: The Enhancement of Exercise and Sport Performance (ed. M. William & D.Lamb), pp. 87–122. Benchmark Press, Indianapolis,IN.
Campbell, W.W., Crim, M.C., Young, V.R., Joseph, L.J. &Evans, W.J. (1995) Effects of resistance training and dietary protein intake on protein metabolism
effects of exercise on protein metabolism 147

in older adults. American Journal of Physiology 268,E1143–E1153.
Cathcart, E.P. (1925) Influence of muscle work onprotein metabolism. Physiological Reviews 5, 225–243.
Celejowa, I. & Homa, M. (1970) Food intake, nitrogenand energy balance in Polish weightlifters during a training camp. Nutrition and Metabolism 12, 259–274.
Chesley, A., MacDougall, J.D., Tarnopolsky, M.A.,Atkinson, S.A. & Smith, K. (1992) Changes in humanmuscle protein synthesis following resistance exer-cise. Journal of Applied Physiology 73, 1383–1388.
Clifton, P.M. & Nestel, P.J. (1996) Effect of dietary cho-lesterol on postprandial lipoproteins in three pheno-typic groups. American Journal of Clinical Nutrition 64,361–367.
Consolazio, C.F., Nelson, R.A., Matoush, L.O.,Harding, R.S. & Canham, J.E. (1963) Nitrogen excre-tion is sweat and its relation to nitrogen balanceexperiments. Journal Nutrition 79, 399–406.
Consolazio, C.F., Johnson, H.L., Nelson, R.A., Dramise,J.G. & Skala, J.H. (1975) Protein metabolism duringintensive physical training in the young adult. American Journal of Clinical Nutrition 28, 29–35.
Cortright, R.N., Rogers, M.E. & Lemon, P.W.R. (1993)Does protein intake during endurance training affectgrowth, nitrogen balance, or exercise performance?Canadian Journal of Applied Physiology 18, 403.
Czarnowski, D. & Gorski, J. (1991) Sweat ammoniaexcretion during submaximal cycling exercise.Journal of Applied Physiology 70, 371–374.
Dohm, G.L., Hecker, A.L., Brown, W.E. et al. (1977)Adaptation of protein metabolism to endurancetraining. Biochemical Journal 164, 705–708.
Dohm, G.L., Puente, F.R., Smith, C.P. & Edge, A. (1978)Changes in tissue protein levels as a result of exer-cise. Life Science 23, 845–850.
Dohm, G.L., William, R.T., Kasperek, G.J. & van Rij,A.M. (1982) Increased urea and Nt-methylhistidineby rats and humans after a bout of exercise. Journal ofApplied Physiology 52, 27–33.
Dolan, P.L., Hackney, A.C. & Lemon, PW.R. (1987)Improved exercise protein utilization estimates byforced hydration. Medicine and Science in Sports andExercise 19, S33.
Dolny, D.G. & Lemon, P.W.R. (1988) Effect of ambienttemperature on protein breakdown during pro-longed exercise. Journal of Applied Physiology 64,550–555.
Dragan, G.I., Vasiliu, A. & Georgescu, E. (1985) Effect ofincreased supply of protein on elite weight lifters. InMilk Proteins ’84 (ed. T.E. Galesloot & B.J. Tinbergen),pp. 99–103. Pudoc, Wageningen.
Evans, W.J. (1993) Exercise and protein metabolism. InNutrition and Fitness for Athletes (ed. A.P. Simopoulos
148 nutrition and exercise
& K.N. Pavlou), pp. 21–33. World Review of Nutrition and Dietetics, Karger, Basel.
Evans, W.J. & Cannon, J.G. (1991) The metabolic effectsof exercise-induced muscle damage. In Exercise andSport Science Reviews, Vol. 19 (ed. J.O. Holloszy), pp. 99–125. William & Wilkins, Baltimore, MD.
Evans, W.C., Fisher, E.C., Hoerr, R.A. & Young, V.R.(1983) Protein metabolism and endurance exercise.Physician and Sportsmedicine 11, 63–72.
Felig, P. & Wahren, J. (1971) Amino acid metabolism in exercising man. Journal of Clinical Investigation 50,2703–2714.
Fern, E.B., Bielinski, R.N. & Schutz, Y. (1991) Effects ofexaggerated amino acid and protein supply in man.Experientia 47, 168–172.
Fiatarone, M.A., Marks, E.C., Ryan, N.D., Meredith,C.N., Lipstiz, L.A. & Evans, W.J. (1990) High inten-sity strength training in nonagenarians: effects onskeletal muscle. Journal of the American Medical Asso-ciation 263, 3029–3034.
Fiatarone, M.A., O’Neill, E.F., Ryan, N.D. et al. (1994)Exercise training and nutritional supplementationfor physical frailty in very elderly people. NewEngland Journal of Medicine 330, 1769–1775.
Flynn, A. (1985) Milk proteins in the diets of those of intermediate years. In Milk Proteins ’84 (ed.T.E. Galesloot & B.J. Tinbergen), pp. 154–157. Pudoc,Wageningen.
Fogelholm, G.M., Naveri, H.K., Kiilavuori, K.T.K. &Harkonen, M.H.K. (1993) Low dose amino acid supplementation: no effects on serum growthhormone and insulin in male weightlifters. Interna-tional Journal of Sport Nutrition 3, 290–297.
Friden, J., Sfakianos, P.N., Hargens, A.R. & Akeson,W.H. (1988) Residual swelling after repetitive eccentric contractions. Journal of Orthopaedic Research6, 493–498.
Friedman, J.E. & Lemon, P.W.R. (1989) Effect of chronicendurance exercise on retention of dietary protein.International Journal of Sports Medicine 10, 118–123.
Fry, A.C., Kraemer, W.J., Stone, M.H. et al. (1993)Endocrine and performance responses to highvolume training and amino acid supplementation inelite junior weightlifters. International Journal of SportNutrition 3, 306–322.
Fuller, M.F. & Garlick, P.J. (1994) Human amino acidrequirements: can the controversy be resolved?Annual Review of Nutrition 14, 217–241.
Garlick, P.J., McNurlan, M.A., Essen, P. & Wernerman,J. (1994) Measurement of tissue protein synthesisrates in vivo: critical analysis of contrasting methods.American Journal of Physiology 266, E287–E297.
Goll, D.E., Thompson, V.F., Talyor, R.G. & Zalewska, T.(1992) Is calpain activity regulated by membranesand autolysis or by calcium and capastatin? Bioessays14, 549–556.
Gontzea, I., Sutzescu, P. & Dumitrache, S. (1974) Theinfluence of muscular activity on the nitrogenbalance and on the need of man for proteins. Nutrition Reports International 10, 35–43.
Gontzea, I., Sutzescu, P. & Dumitrache, S. (1975) Theinfluence of adaptation of physical effort on nitrogenbalance in man. Nutrition Reports International 11,231–234.
Graham, T.E. & MacLean, D.A. (1992) Ammonia andamino acid metabolism in human skeletal muscleduring exercise. Canadian Journal of Physiology andPharmacology 70, 132–141.
Graham, T.E., Turcotte, L.P., Kiens, B. & Richter, E.A.(1995) Training and muscle ammonia amino acidmetabolism in humans during prolonged exercise.Journal of Applied Physiology 78, 725–735.
Hagg, S.A., Morse, E.L. & Adibi, S.A. (1982) Effect ofexercise on rates of oxidation, turnover, and plasmaclearance of leucine in human subjects. AmericanJournal of Physiology 242, E407–E410.
Haralambie, G. & Berg, A. (1976) Serum urea andamino nitrogen changes with exercise duration.European Journal of Applied Physiology 36, 39–48.
Harper, A.E., Benevenga, N.J. & Wohleuter, R.M. (1970)Effects of ingestion of disproportionate amounts ofamino acids. Physiological Reviews 50, 428–557.
Henderson, S.A., Black, A.L. & Brooks, G.A. (1985)Leucine turnover in trained rats during exercise.American Journal of Physiology 249, E137–E144.
Horber, F.F., Harber-Feyder, C.M., Krayer, S., Schwenk,W.F. & Haymond, M.W. (1989) Plasma reciprocalpool specific activity predicts that of intracellularfree leucine for protein synthesis. American Journal ofPhysiology 257, E385–E399.
Isidori, A., Lo Monaco, A. & Cappa, M. (1981) A studyof growth hormone release in man after oral admin-istration of amino acids. Current Medical ResearchOpinion 7, 475–481.
Jackman, M.L., Gibala, M.J., Hultman, E. & Graham,T.E. (1997) Nutritional status affects branched-chainoxoacid dehydrogenase activity during exercise in humans. American Journal of Physiology 272,E233–E238.
Kasai, K., Kobayashi, M. & Shimoda, S. (1978) Stimula-tory effect of glycine on human growth hormonesecretion. Metabolism 27, 201–208.
Kasperek, G.J. & Snider, R.D. (1987) Effect of ex-ercise intensity and starvation on the activation ofbranched-chain keto acid dehydrogenase by exer-cise. American Journal of Physiology 252, E33–E37.
Kasperek, G.J. & Snider, R.D. (1989) Total andmyofibrillar protein degradation in isolated soleusmuscles after exercise. American Journal of Physiology257, E1–5.
Kasperek, G.J., Dohm, G.L., Tapscott, E.B. & Powell, T.(1980) Effect of exercise on liver protein loss and lyso-
somal enzyme levels in fed and fasted rats. Proceed-ings of the Society of Biological Medicine 164, 430–434.
Kleiner, S.M., Bazzarre, T.L. & Ainsworth, B.E. (1994)Nutritional status of nationally ranked elite body-builders. International Journal of Sport Nutrition 4,54–69.
Knapik, J., Meredith, C., Jones, B., Fielding, R., Young,V. & Evans, W. (1991) Leucine metabolism duringfasting and exercise. Journal of Applied Physiology 70,43–47.
Kreider, R.B., Miller, G.W., Mitchell, M. et al. (1992)Effects of amino acid supplementation on ultraen-durance triathlon performance. In Proceedings of the First World Congress on Sports Nutrition (ed. A.Mariné, M. Rivero & R. Segura), pp. 490–536. Enero,Barcelona.
Kreider, R.B., Klesges, R., Harmon, K. et al. (1996)Effects of ingesting supplements designed topromote lean tissue accretion on body compositionduring resistance training. International Journal ofSports Nutrition 6, 234–246.
Kuipers, H. (1994) Exercise-induced muscle damage.International Journal of Sports Medicine 15, 132–135.
Lambert, M.I., Hefer, J.A., Millar, R.P. & Macfarlane,P.W. (1993) Failure of commercial oral amino acidsupplements to increase serum growth hormoneconcentrations in male body-builders. InternationalJournal of Sport Nutrition 3, 298–305.
Laritcheva, K.A., Yalavaya, N.I., Shubin, V.I. &Smornov, P.V. (1978) Study of energy expenditureand protein needs of top weight lifters. In Nutrition,Physical Fitness and Health (ed. J. Parizkova & V.A.Rogozkin), pp. 155–163. University Park Press, Baltimore, MD.
Layman, D.K., Paul, G.L. & Olken, M.H. (1994) Aminoacid metabolism during exercise. In Nutrition in Exercise and Sport, 2nd edn (ed. I. Wolinsky & J.F.Hickson), pp. 123–137. CRC Press, Boca Raton, LA.
Leddy, J., Horvath, P., Rowland, J. & Pendergast, D.(1997) Effect of a high or low fat diet on cardiovascu-lar risk factors in male and female runners. Medicineand Science in Sports and Exercise 29, 17–25.
Lemon, P.W.R. (1987) Protein and exercise: update1987. Medicine and Science in Sports and Exercise 19(No. 5, Suppl.): S179–S190.
Lemon, P.W.R. (1991) Protein and amino acid needs of the strength athlete. International Journal of SportNutrition 1, 127–145.
Lemon, P.W.R. (1996) Is increased dietary protein nec-essary or beneficial for individuals with a physicallyactive lifestyle? Nutrition Reviews 54 (4, part II),S169–S175.
Lemon, P.W.R. (1997) Dietary protein requirements inathletes. Nutritional Biochemistry 8, 52–60.
Lemon, P.W.R. & Mullin, J.P. (1980) Effect of initial
effects of exercise on protein metabolism 149

muscle glycogen levels on protein catabolism duringexercise. Journal of Applied Physiology 48, 624–629.
Lemon, P.W.R. & Nagle, F.J. (1981) Effects of exercise onprotein and amino acid metabolism. Medicine andScience in Sports and Exercise 13, 141–149.
Lemon, P.W.R., Nagle, F.J., Mullin, J.P. & Benevenga,N.J. (1982) In vivo leucine oxidation at rest andduring two intensities of exercise. Journal of AppliedPhysiology 53, 947–954.
Lemon, P.W.R., Yarasheski, K.E. & Dolny, D.G. (1986)Validity/reliability of sweat analysis by whole bodywashdown vs. regional collections. Journal of AppliedPhysiology 61, 1967–1971.
Lemon, P.W.R., Tarnopolsky, M.A., MacDougall, J.D. &Atkinson, S.A. (1992) Protein requirements andmuscle mass/strength changes during intensivetraining in novice bodybuilders. Journal of AppliedPhysiology 73, 767–775.
Lutwak, L. & Burton, B.T. (1964) Fecal dye markers inmetabolic balance studies: the use of brilliant blueand methylcellulose for accurate separation of stoolperiods. American Journal of Clinical Nutrition 14,109–111.
MacDougall, J.D., Gibala, M.J., Tarnopolosky, M.A.,MacDonald, J.R., Interisano. & Yarasheski, K.E.(1995) The time course of elevated muscle proteinsynthesis following heavy resistance exercise. Canadian Journal of Applied Physiology 20, 480–486.
MacIntyre, D.L., Reid, W.D. & Mackenzie, D.C. (1995)Delayed muscle soreness: the inflammatoryresponse to muscle injury and its clinical implica-tions. Sports Medicine 20, 24–40.
McNamara, D.J., Kolb, P., Parker, T.S. et al. (1987)Heterogeneity of cholesterol homeostasis in man:response to changes in dietary fat quality and choles-terol quantity. Journal of Clinical Investigation 79,1729–1739.
Marable, N.L., Hickson, J.F., Korslund, M.K., Herbert,W.G., Desjardins, R.F. & Thye, F.W. (1979) Urinarynitrogen excretion as influenced by a muscle-building exercise program and protein intake variation. Nutritional Reports International 19,795–805.
Matthews, D.E., Schwarz, H.P., Yang, R.D., Motil, K.J. &Young, V.R. (1982) Relationship of plasma leucineand alpha-ketoisocaproate during L[1-13C] leu-cine infusion in man: a method for measuring human intracellular tracer enrichment. Metabolism31, 1105–1112.
Maughan, R.J. & Sadler, D.J.M. (1983) The effects of oraladministration of salts of aspartic acid on the meta-bolic response to prolonged exhausting exercise in man. International Journal of Sports Medicine 4,119–123.
Meredith, C.N., Frontera, W.R., O’Reilly, K.P. & Evans,
150 nutrition and exercise
W.J. (1992) Body composition in elderly men: effectof dietary modification during strength training.Journal of the American Geriatrics Society 40, 155–162.
Meredith, C.N., Zackin, M.J., Frontera, W.R. & Evans,W.J. (1989) Dietary protein requirements and proteinmetabolism in endurance-trained men. Journal ofApplied Physiology 66, 2850–2856.
Millward, D.J., Bowtell, J.L., Pacy, P. & Rennie, M.J.(1994) Physical activity, protein metabolism andprotein requirements. Proceedings of the NutritionSociety 53, 223–240.
Munro, H.N. (1951) Carbohydrate and fat as factors inprotein utilization and metabolism. PhysiologicalReviews 31, 449–488.
Muoio, D.M., Leddy, J.J., Horvath, P.J., Awad, A.B. &Pendergast, D.R. (1994) Effect of dietary fat on meta-bolic adjustments to maximal VO2 and endurance inrunners. Medicine and Science in Sports and Exercise 26,81–88.
Nair, K.S., Halliday, D. & Griggs, R.C. (1988) Leucineincorporation into mixed skeletal muscle protein in humans. American Journal of Physiology 254,E208–E213 .
Newman, D.J., McPhail, G., Mills, K.R. & Edwards,R.H.T. (1983) Ultrastructural changes after concen-tric and eccentric contractions of human muscle.Journal of Neurological Sciences 61, 109–122.
Newsholme, E.A. & Parry-Billings, M. (1994) Effects ofexercise on the immune system. In Physical Activity,Fitness, and Health (ed. C. Bouchard, R.J. Shephard & T. Stephens), pp. 451–455. Human Kinetics, Champaign, IL.
Phillips, S.M., Atkinson, S.A., Tarnopolsky, M.A. &MacDougall, J.D. (1993) Gender differences inleucine kinetics and nitrogen balance in enduranceathletes. Journal of Applied Physiology 75, 2134–2141.
Picou, D. & Taylor-Roberts, T. (1969) The measurementof total protein synthesis and catabolism and nitro-gen turnover in infants in different nutritional statesand receiving different amounts of dietary protein.Clinical Science London 36, 283–301.
Poortmans, J.R. (1975) Effect of long lasting physicalexercise and training on protein metabolism. InMetabolic Adaptations to Prolonged Physical Exercise(ed. H.H. Howald & J.R. Poortmans), pp. 212–228.Birkhäuser, Basel.
Refsum, H.E. & Stromme, S.B. (1974) Urea and creati-nine production and excretion in urine during andfollowing prolonged heavy exercise. ScandinavianJournal of Clinical Laboratory Investigation 33, 247–254.
Rennie, M.J., Bowtell, J.L. & Millward, D.J. (1994a)Physical activity and protein metabolism. In PhysicalActivity, Fitness, and Health (ed. C. Bouchard, R.J.

Shephard & T. Stephens), pp. 432–450. Human Kinetics, Champaign, IL.
Rennie, M.J., Smith, K. & Watt, P.W. (1994b) Measure-ment of human protein synthesis: an optimalapproach. American Journal of Physiology 266,E298–E307.
Ruderman, N.B. & Berger, M. (1974) The formation ofglutamine and alanine in skeletal muscle. Journal ofBiological Chemistry 249, 5500–5506.
Salminen, A. & Vihko, V. (1984) Autophagic response tostrenuous exercise in mouse skeletal muscle fibers.Virchows Archives [Cell Pathology] 45, 97–106.
Salminen, A., Komulainen, J., Ahomaki, E., Kainulainen, H., Takala, T. & Vihko, V. (1983) Effectof endurance training on alkaline protease activitiesin rat skeletal muscles. Acta Physiologica Scandinavica119, 261–265.
Scrimshaw, N.S., Hussein, M.A., Murray, E., Rand,W.M. & Young, V.R. (1972) Protein requirements ofman: variations in obligatory and fecal nitrogenlosses in young men. Journal of Nutrition 102,1595–1604.
Seene, T. & Viru, A. (1982) The catabolic effect of gluco-corticoids on different types of skeletal muscle fibersand its dependence upon muscle activity and inter-action with anabolic steroids. Journal of Steroid Biochemistry 16, 349–352.
Segura, R. & Ventura, J. (1988) Effect of L-tryptophansupplementation on exercise performance. Interna-tional Journal of Sports Medicine 9, 301–305.
Steen, S.N. (1991) Precontest strategies of a male bodybuilder. International Journal of Sports Nutrition1, 69–78.
Suminski, R.R., Robertson, R.J., Goss, F.L. et al. (1997)Acute effect of amino acid ingestion and resistanceexercise on plasma growth hormone concentrationin young men. Journal of Sport Nutrition 7, 48–60.
Tapscott, E.B., Kasperek, G.J. & Dohm, G.L. (1982)Effect of training on muscle protein turnover in maleand female rats. Biochemical Medicine 27, 254–259.
Tarnopolsky, M.A., MacDougall, J.D. & Atkinson, S.A.(1988) Influence of protein intake and training statuson nitrogen balance and lean body mass. Journal ofApplied Physiology 64, 187–193.
Tarnopolsky, M.A., Atkinson, S.A., MacDougall, J.D.,Senor, B.B., Lemon, P.W.R. & Schwarcz, H. (1991)Whole body leucine metabolism during and afterresistance exercise in fed humans. Medicine andScience in Sports and Exercise 23, 326–333.
Tarnopolsky, M.A., Atkinson, S.A., MacDougall, J.D.,Chesley, A., Phillips, S. & Schwarcz, H. (1992) Evaluation of protein requirements for trainedstrength athletes. Journal of Applied Physiology 73,1986–1995.
Tarnopolsky, M.A., Atkinson, S.A., Phillips, S.M. &
MacDougall, J.D. (1995) Carbohydrate loading andmetabolism during exercise in men and women.Journal of Applied Physiology 78, 1360–1368.
Tenman, A.J. & Hainline, B. (1991) Eosinophilia–myalgia syndrome. Physician and Sportsmedicine 19,81–86.
Tessari, P., Barazzoni, R., Zanetti, M. et al. (1996) Proteindegradation and synthesis measured with multipleamino acid tracers in vivo. American Journal of Physiology 271, E733–E741.
US Food and Nutrition Board (1989) RecommendedDietary Allowances. National Academy Press, Washington, DC.
Varrik, E., Viru, A., Ööpik, V. & Viru, M. (1992) Exercise-induced catabolic responses in various muscle fibers.Canadian Journal of Sport Sciences 17, 125–128.
von Liebig, J. (1842) Animal Chemistry or Organic Chemistry in Its Application to Physiology (transl. G.Gregory). Taylor & Walton, London.
Vukovich, M.D., Sharp, R.L., King, D.S. & Kershishnik,K. (1992) The effect of protein supplementation on lactate accumulation during submaximal andmaximal exercise. International Journal of Sport Nutri-tion 2, 307–316.
Wagenmakers, A.J.M. & van Hall, G. (1996) Branched-chain amino acids: nutrition and metabolism in exercise. In Biochemistry of Exercise Vol. IX (ed. R.J.Maughan & S.M. Shirreffs), pp. 431–443. HumanKinetics, Champaign, IL.
Wagenmakers, A.J.M., Beckers, E.J., Brouns, F. et al(1991) Carbohydrate supplementation, glycogendepletion, and amino acid metabolism during exercise. American Journal of Physiology 260, E883–E890.
Waterlow, J.C. (1995) Whole-body protein turnover inhumans: past, present, and future. Annual Review ofNutrition 15, 57–92.
Wessen, M., McNaughton, L., Davies, P. & Tristram, S. (1988) Effects of oral administration of aspartic acidsalts on the endurance capacity of trained athletes.Research Quarterly in Exercise and Sport 59, 234–239.
West, C.E. & Beynen, A.C. (1985) Milk protein in con-trast to plant protein: effects on plasma cholesterol.In Milk Proteins ’84 (ed. T.E. Galesloot & B.J. Tinbergen), pp. 80–87. Pudoc, Wageningen.
White, T.P. & Brooks, G.A. (1981) [U-14C] glucose, -alanine, -leucine oxidation in rats at rest and duringtwo intensities of running. American Journal of Physiology 240, E155–E165.
Wolfe, R.R. (1992) Radioactive and Stable Isotope Tracers inBiomedicine: Principles and Practice of Kinetic Analysis.Wiley-Liss, New York.
Yokogoshi, H., Iwata, T., Ishida, K. & Yoshida, A. (1987)Effect of amino acid supplementation to low proteindiet on brain and plasma levels of tryptophan and
effects of exercise on protein metabolism 151
brain 5-hydroxyinodoles in rats. Journal of Nutrition117, 42–47.
Young, V.R., Bier, D.M. & Pellet, P.L. (1989) A theoreticalbasis for increasing current estimates of the aminoacid requirements in adult man with experimentalsupport. American Journal of Clinical Nutrition 50,80–92.
152 nutrition and exercise
Zaragoza, R., Renau-Piqueras, J., Portoles, M., Hernandez-Yago, J., Jorda, A. & Grisolia, G.S. (1987)Rats fed prolonged high protein diets show anincrease in nitrogen metabolism and liver megamito-chondria. Archives of Biochemistry and Biophysics 258,426–435.

Introduction
Amino acids and the athlete
This chapter discusses the importance of someamino acids in relation to exercise, in par-ticular to prolonged, exhaustive exercise. Proteinmetabolism and the protein requirements of the athlete have already been discussed inChapter 10. Nevertheless, it is worth mentioninghere that consideration of daily protein require-ments is complicated by the fact that not all proteins in the diet have the same nutritionalvalue, since they contain different amounts ofessential amino acids. First-class proteins (e.g. ineggs, milk and meat) contain enough of eachessential amino acid to allow protein synthesis tooccur without the need to eat extra protein (Fig.11.1).
By contrast, proteins of plant origin are termed‘second class’ because they are deficient in thesame amino acids. Adequate amounts of each ofthe essential amino acids can be obtained from avegetarian diet by eating a wide range of plantfoods, e.g. cereals and legumes. This does mean,however, that the extra protein consumed takesthe place in the diet of the all-important carbohy-drate. The athlete must therefore seek a balance:too much protein and the diet is distorted; toolittle and recovery after intensive training mightbe slowed. This problem leads to a considerationof supplementation of the diet with essentialamino acids, especially during peak training.Furthermore, from studies on individual cells
in vitro, knowledge is becoming available of theindividual nutritional requirements of particularcells and how these change under different con-ditions. Transfer of this knowledge to clinical situations has occurred over the past 10 yearswith considerable success. Consequently, it isnow possible to provide nutrients designed todeliver fuels to particular cells, tissues andorgans that are involved in the response to injuryor illness, and this will enhance the naturalhealing process.
This information can be extended to includethe athlete. Furthermore, a specific response toexercise, and to physical and mental fatigue, canprovide information that could be applied in theclinic. In addition, it is possible to suggest someamino acids with which athletes might considersupplementing their diet (Table 11.1). Some ofthe acquired non-dispensable amino acids thatmight be of benefit to athletes if taken as a supplement have been discussed elsewhere (Newsholme et al. 1994). In this chapter discus-sion will centre on glutamine and the branchedchain amino acids, for which evidence of benefitin the athletic field is available.
Fatigue in physical activity
Fatigue in physical activity can be considered atphysiological or biochemical levels. Potentialmechanisms for fatigue at a physiological levelare as follows (see Fitts 1994).1 Central fatigue:
(a) excitatory input to higher motor centres;
Chapter 11
Amino Acids, Fatigue and Immunodepression in Exercise
ERIC A. NEWSHOLME AND LINDA M. CASTELL
153

(b) excitatory drive to lower motor neurones;(c) motor neurone excitability.
In these three mechanisms there is a decrease inneural drive. This can be detected by showingthat fatiguing muscle can still maintain poweroutput if the nerve is stimulated artificially or thebrain is stimulated.2 Peripheral fatigue:
(a) neuromuscular transmission;(b) sarcolemma excitability;(c) excitation–contraction coupling.Biochemical mechanisms for fatigue can also
be put forward:• depletion of phosphocreatine in muscle;• accumulation of protons in muscle;
154 nutrition and exercise
• accumulation of phosphate in muscle;• depletion of glycogen in muscle;• hypoglycaemia;• changes in the concentrations of key aminoacids in the blood leading to changes in the con-centrations of neurotransmitters in the brain.
Some of these mechanisms have been dis-cussed elsewhere (Newsholme et al. 1994). Thefirst four are explanations for peripheral fatigueand the last two are explanations of centralfatigue. The advantage of proposing a biochemi-cal mechanism is that, from this knowledge,ideas can be put forward for manipulations todelay fatigue. A hypothesis is suggested thatlinks all of the latter three biochemical mecha-
AlanineGlutamine andasparagine
Cysteine
Proline
Proline
Glycine
Tryrosine
Tryrosine
Serine
Serine
Arginine
Aspartic acid
Glutamic acid
Valine
Valine
Tryptophan
Tryptophan
Histidine
Methionine
Phenylalanine
Threonine
Isoleucine
Leucine
Lysine
Arginine
Aspartate
Cysteine
Glutamate
Glutamine
Glycine
Hisitidine
Lysine
Methionine
CreatineNitric oxide
Pyrimidines
Taurine
γ-Aminobutyrate
Amino sugarsPurinesPyrimidines
CreatinePurinesTetrapyrroles
Histamine
Carnitine
CreatineMethyl derivatives
CholineEthanolamineSphingosine
OrnithinePutrescine
CatecholaminesMelaninThyroxine
5-HydroxytryptamineNicotinic acid
Pantothenic acid
+Peptides (e.g. carnosine, glutathione)
Non-essential
Essential
Fig. 11.1 The amino acid composition of myosin, one of the two major proteins in muscle — and, therefore, in leanmeat — and the biosynthetic role of some of these amino acids. From Newsholme et al. (1994), with permission.

nisms into one mechanism involving the centralserotoninergic pathway in central fatigue.
There is considerable evidence that depletionof muscle glycogen results in fatigue. In middle-distance events, aerobic and anaerobic metabo-lism both contribute to adenosine triphosphate(ATP) generation. The athlete can use the aerobicsystem towards its maximum capacity, i.e. thatwhich is limited by oxygen supply to the musclebut, in addition, further ATP can be producedfrom the conversion of glycogen to lactate. Sowhat causes fatigue in this situation? It is suggested that it is either depletion of glycogenor the accumulation of protons in the muscle;whichever occurs will depend upon the distanceof the event, the class of the athlete and his/herfitness. If the rate of conversion of glycogen tolactate is greater than the capacity to lose protonsfrom the muscle, protons will eventually accu-mulate sufficiently to cause fatigue (Newsholmeet al. 1994). However, it is also possible thatdepletion of glycogen before the end of the eventcan result in fatigue. As glycogen levels fall, fatty
acid mobilization will occur and increase theplasma fatty acid level. In a prolonged event suchas the marathon, fatty acids must be mobilizedsince there is not enough glycogen to provide theenergy required for the whole event. For anoptimum performance, the marathon runnermust oxidize both glycogen and fat simultane-ously, but the rate of utilization of the lattershould be such as to allow glycogen to be usedfor the whole of the distance — and for depletionto occur at the finishing post. Consequently, precision in control of the rates of utilization ofthe two fuels, fat and glycogen, is extremelyimportant.
An interesting question is why glycogendepletion should result in fatigue. If, as is alreadyknown, it were possible to switch to the enor-mous store of fat as a fuel, this would delayfatigue dramatically: theoretically, the runnershould then be able to maintain a good pace for aconsiderable period of time — possibly severaldays. At least two explanations have been putforward to account for the fact that this does not
amino acids, fatigue and immunodepression 155
Table 11.1 A ‘contemporary’ view of dispensable and non-dispensable amino acids.
Category Amino acid
Totally non-dispensable Lysine, threonine
Oxoacid non-dispensable* Branched-chain amino acids†,methionine, phenylalanine,tryptophan
Conditionally non-dispensable‡ Cysteine, tyrosine
Acquired non-dispensable§ Arginine, cysteine, glutamine, glycine, histidine, serine
Dispensable¶ Alanine, asparagine, aspartate, glutamate
*The carbon skeleton of these amino acids cannot be synthesized by the body. However, if the oxo(keto) acids areprovided, the amino acids can be synthesized from the oxoacids via the process of transamination. The oxoacidscan be provided artificially.† The branched-chain amino acids may play a role in fatigue but, to place them in context, it is important to outlinevarious explanations for fatigue (see text).‡ These are produced from other amino acids —cysteine from methionine and tyrosine from phenylalanine —provided that these amino acids are present in excess.§ The demand for these amino acids can increase markedly under some conditions, e.g. infection, severe trauma,burns and in some premature babies.¶ It is assumed that all these amino acids can be synthesized at sufficient rates in the body to satisfy all require-ments. It is now beginning to be appreciated that this may not always be the case for glutamine.

occur. First, there is a limitation in the rate of fattyacid oxidation so that a high rate of ATP genera-tion cannot be supported by fatty acid oxidationalone so that, once fat becomes the dominantfuel, the pace must slow. Secondly, and these arenot mutually exclusive, fatty acids must be mobi-lized from adipose tissue to be oxidized andmobilization of fatty acids can result in centralfatigue. A mechanism for this is described below.
Plasma levels of tryptophan, branched-chainamino acids and the 5-HT hypothesis forcentral fatigue
The branched-chain amino acids (leucine,isoleucine and valine), unlike other amino acids,are taken up largely by muscle and adiposetissue. Like most amino acids, tryptophan istaken up and metabolized by the liver. However,a small amount of tryptophan is taken up by thebrain, where it is converted to the neurotransmit-ter 5-hydroxytryptamine (5-HT). Once this neu-rotransmitter is released in the synapses of someneurones, it can influence a variety of behav-iours, including tiredness, sleep, mood and pos-sibly mental fatigue. It is suggested that anincrease in 5-HT level in these neurones makes itharder mentally to maintain the same pace ofrunning, cycling, etc.
The basic tenets of the hypothesis are asfollows.1 Both branched-chain amino acids and trypto-phan (and other aromatic amino acids) enter thebrain upon the same amino acid carrier so thatthere is competition between the two groups ofamino acids for entry (for review, see Fernstrom1990).2 Tryptophan is converted via two enzymes inthe brain to 5-HT. However, an increased level ofbrain tryptophan can increase the rate of forma-tion and hence the level of 5-HT in some areas ofthe brain (Blomstrand et al. 1989).3 A high 5-HT level could result in increasedamount of this neurotransmitter being releasedinto the synaptic cleft during neuronal firing,therefore leading to a greater postsynaptic stimu-lation in some 5-HT neurones.
156 nutrition and exercise
4 It is proposed that some of these neurones areinvolved in fatigue.5 Tryptophan is unique amongst the aminoacids in that it is bound to albumin, so that it exists in the plasma and interstitial space in bound and free forms, which are in equi-librium. This equilibrium changes in favour of free tryptophan as the plasma fatty acid level increases, since the latter also binds toalbumin and this decreases the affinity for tryptophan.6 It is considered that the plasma concentrationof free tryptophan governs, in competition withbranched chain amino acids, the rate of entry oftryptophan into the brain, the level of tryptophanin the brain and hence that of 5-HT (Fernstrom1990).
As a consequence of these basic tenets, it is proposed that either an increase in the plasmafatty acid level and/or a decrease in that ofbranched-chain amino acids would increase theplasma concentration ratio of free tryptophan tobranched chain amino acids. This would thenfavour the entry of tryptophan into the brain,and increase the level of 5-HT which would leadto a decrease in motor drive and a fall in poweroutput. Hence a marked increase in the plasmafatty acid level could lead, via changes in theplasma level of free tryptophan, to fatigue. This could occur in both the middle-distance ormarathon runner as the muscle and liver glyco-gen stores are depleted and the fatty acid is mobi-lized from adipose tissue.
Importance of precision in the mobilizationand oxidation of fatty acids
The precise balance between the use of the two fuels, glycogen and fatty acids, may beextremely important for the athlete, since toohigh or too low a rate of fatty acid mobi-lization/oxidation could cause problems (Newsholme et al. 1994). After 20–30 min of exer-cise, mobilization of fatty acids from adiposetissue increases, probably as a result of sympa-thetic stimulation. However, despite increasedrates of mobilization, the plasma concentration

of fatty acids may be only slightly increased: thisis because the rates of fatty acid uptake and oxi-dation by the active muscle are increased(Winder 1996).
It is possible that the plasma fatty acid concen-tration and therefore the free tryptophan levelincreases markedly in exercise only in some conditions:• when the muscle (and liver) glycogen store aretotally depleted;• in unfit subjects, when control of fatty acidmobilization may not be precisely regulated inrelation to demand and control of oxidationwithin the muscle;• when the rate of fatty acid oxidation by muscleis somewhat restricted by the intermittent natureof the exercise that occurs, in games such assoccer, rugby, tennis, or squash;• in obese individuals, in whom precision ofrelease may be restricted by the amount ofadipose tissue.
If the rate of fatty acid mobilization fromadipose tissue is higher than that of oxidation bymuscle, the plasma concentration of fatty acidswill increase, increasing the free tryptophan levelin the plasma, which will result in central fatigueas described above. If the rate of fatty acid oxida-tion is too low (e.g. if the rate of mobilization is too low), the rate of glycogen oxidation will be high, and the athlete may deplete glycogenstores before the end of the race, resulting in avery poor performance. Thus, the enduranceathlete appears to have to run on a metabolictightrope of fatty acid mobilization/oxidationduring the race, and the precise rate of mobiliza-tion/oxidation for each athlete must be learnt bytraining.
A summary of experimental findings whichsupport the hypothesis is as follows.1 The plasma concentration ratio of free trypto-phan/branched-chain amino acids is increasedin humans after prolonged exhaustive exerciseand, in the rat, the brain levels of tryptophan and5-HT are increased (Blomstrand et al. 1989,1991a).2 Administration of a 5-HT agonist impairsrunning performance, whereas a 5-HT antago-
nist improved running performance in rats(Bailey et al. 1992).3 Administration of a 5-HT re-uptake blocker to human subjects decreased physical perfor-mance — exercise time to exhaustion during stan-dardized exercise was decreased in comparisonwith a control condition (Wilson & Maughan1992).4 The secretion of prolactin from the hypothala-mus is controlled, in part, by 5-HT neurones, and5-HT stimulates the rate of secretion. Duringexercise, there is a correlation between theplasma levels of prolactin and free tryptophan,supporting the view that increased free trypto-phan level in the blood can influence the 5-HTlevel in the hypothalamus (Fischer et al. 1991).5 The blood prolactin level increased to a muchsmaller extent in well-trained endurance ath-letes, compared with controls, in response to anagent that increased 5-HT levels in the hypotha-lamus (e.g. fenfluramine). This could be causedby down-regulation of 5-HT receptors as a resultof chronic elevation of the 5-HT level in this partof the brain (Jakeman et al. 1994).
In the past few years, supplementary feedingwith branched-chain amino acids has producedsome results supporting the hypothesis andsome which show no effect. The latter aredescribed in more detail by Davis in Chapter 12.Table 11.2 gives a brief comparison of the resultsfrom supplementation studies in exercise ofwhich the authors are aware. In one of the mostrecent studies, a laboratory-based, cross-overstudy, seven endurance cyclists were monitoredfor perceived effort and mental fatigue (using theBorg scale), with and without branched-chainamino acid supplementation. When subjectsreceived the branched-chain amino acids, com-pared with the placebo, there was a lower per-ception of effort required to sustain the level of exercise required (Blomstrand et al. 1997).Mittleman et al. (1998) have reported a positiveeffect of branched-chain amino acids on perfor-mance in moderate exercise during heat stress inmen and women.
In rats, injection of branched-chain aminoacids not only increased the time to fatigue of
amino acids, fatigue and immunodepression 157

158n
ut
rit
ion
an
de
xe
rc
ise
Table 11.2 A comparison of studies on branched-chain amino acid (BCAA) supplementation in humans during endurance exercise.
Amount Effect Effect on performanceNo. of V
·o2max. of BCAA on
subjects Exercise (%) Duration (min) ingested p[BCAA] NH3 Mental Physical Reference
13 Cycling 40 c. 137–153 12.8g 1250mm None None Improveda Mittleman et al. (1998)10 Cycling 70–75 c. 122 23.4g 2400 mm Rise N/M Noneb van Hall et al. (1995)
Cycling 70–75 7.8g 950mm Rise N/M Noneb van Hall et al. (1995)193c Marathond N/M c. >210 16g 1250mm N/M Improved Improvede Blomstrand et al. (1991a)
25c 30-km rund
5 Cycling 75 60–80 6.3g·l-1 1000 mm N/M N/M None Blomstrand et al. (1995)10 Cycling 72.7 50–60 16g·day-1g N/M N/M N/M Improved Hefler et al. (1995)7 Cycling 65–75 c. 30 30g 3000 mm Rise N/M None Wagenmakers (1992)6 Soccerd N/M 10gf 1200 mm N/M Improved N/M Blomstrand et al. (1991b)
52 30-km rund N/M 145 5.3gh 650 mm N/M Improved N/M Hassmen et al. (1994)10 Cycling 70 c. 230 0.74g·l-1f 420 mm N/M N/M None Galiano et al. (1991)7 Cycling 70 60 6–9g 1050mm None Improved Improved Blomstrand et al. (1997)9 Cyclingi 63.1 c. 159 18gj 1026 mm Rise N/M None Madsen et al. (1996)
10 Cycling N/M c. 125–212 21g c.1250 mm Rise Improved None Struder et al. (1998)
N/M, not measured; p[BCAA], the peak plasma concentration of branched-chain amino acids observed in each study.a Subjects experienced heat stress. b Very high day-to-day intraindividual variation in time to fatigue for some subjects.c Not all subjects gave blood samples.d Field study.e In subset of slower runners.f 6% carbohydrate added.g 14-day study.h 7% carbohydrate added.i 100-km trials.j 5% carbohydrate added.

exercising rats but also prevented the normalincrease in brain tryptophan level caused byexhaustive exercise (T. Yamamoto, personal communication). Calders et al. (1997) observedan increase in the time to fatigue, as well as an increase in plasma ammonia, in fasting ratsinjected with 30mg of branched-chain aminoacids 5min before exercise, compared to thoseinjected with placebo.
The data in Table 11.2 indicate that admini-stration of branched-chain amino acids aloneappears to have a more beneficial effect thanwhen added to carbohydrate. It also seems thatthe higher the dose of branched-chain aminoacids, the more likely it is that plasma ammonialevels will be elevated. This suggests that lowerdoses are more likely to be beneficial. In themajority of studies, the branched-chain aminoacids have been administered before exercise. Itmay be that administration during exercise wasthe reason that Blomstrand et al. (1997) and Mittleman et al. (1998) failed to observe a changein plasma ammonia. Whether a bolus dose isgiven or whether separate doses are givenduring exercise could be important for therelease of ammonia from muscle.
In conclusion, beneficial effects of branched-chain amino acids have been seen on aspects ofboth mental and physical fatigue in exhaustiveexercise. Most studies have not investigatedeffects on mental fatigue. However, the mentalexertion necessary to maintain a given poweroutput is an integral feature of central fatigue.
Cellular nutrition in the immune system
For many years, it was thought that both lymphocytes and macrophages obtained most of their energy from the oxidation of glucose.However, it has now been shown that these cellsalso use glutamine and that its rate of utilizationis either similar to or greater than that of glucose.There are clear lines of evidence which supportthe view that glutamine is used at a very highrate by lymphocytes and by macrophages in vivo.1 The maximal catalytic activity of glutaminase,
the key enzyme in the glutamine utilizationpathway, is high in freshly isolated resting lymphocytes and macrophages (Ardawi & Newsholme 1983, 1985).2 The rates of utilization of glutamine are high: (i) in freshly isolated lymphocytes andmacrophages (Ardawi & Newsholme 1983, 1985) and (ii) in cultured lymphocytes andmacrophages, and in T- and B-lymphocyte-derived cell lines (Ardawi & Newsholme 1983,1985; Newsholme et al. 1988).3 A high rate of glutamine utilization by lym-phocytes in vitro maintains unusually high intra-cellular concentrations of glutamine, glutamate,aspartate and lactate. Very similar levels of theseintermediates are seen in intact lymph nodesremoved from anaesthetized rats and frozenrapidly prior to extraction of the tissues (T. Pivaand E.A. Newsholme, unpublished data).
In addition, although various lymphocytesubsets have not been studied, the available evidence suggests that B- and T-lymphocytesutilize glutamine at similar rates (Ardawi &Newsholme 1983, 1985; Newsholme et al. 1988).
Surprisingly, little of the carbon of glucose (< 10%) and only some of that of glutamine(10–30%) is oxidized completely by these cells:glucose is converted almost totally into lactate,glutamine into glutamate, aspartate, alanine and CO2. The partial oxidation of these fuels isknown as glycolysis and glutaminolysis, respec-tively. From these simple metabolic characteris-tics several questions arise.1 What is the significance of these high rates?2 Why is the oxidation only partial?3 What are the consequences for the wholeorganism?4 Does the plasma glutamine level ever decreasesufficiently to decrease the rate of such utiliza-tion by these cells, and hence decrease theirability to respond to an immune challenge?
High rates of glycolysis and glutaminolysiswill provide energy for these cells. In addition,glutamine provides nitrogen for synthesis ofseveral important compounds, e.g. purine andpyrimidine nucleotides, which are needed forthe synthesis of new DNA and RNA during pro-
amino acids, fatigue and immunodepression 159

liferation of lymphocytes and for mRNA synthe-sis and DNA repair in macrophages. This willalso be important for the production of these and other cells in the bone marrow, especiallywhen stimulated to increase their productionduring trauma, infection, burns and if white cellsare damaged, for example, during exercise.However, when it has been quantitativelystudied — so far, only in lymphocytes — the rate ofglutaminolysis is very markedly in excess of therates of synthesis of these compounds. Forexample, the rate of utilization of glutamine bylymphocytes is very much greater than the measured rate of synthesis of uridine nucleotides and much higher than the maximum activity ofthe rate limiting enzyme, carbamoyl phosphatesynthase II (Newsholme & Leech 1999).
A theory has been proposed which accountsboth for these high rates of glutamine utilizationand the fact that its oxidation is partial. The syn-thetic pathways for de novo nucleotide synthesisrequire specific and precise increases in the rateof synthesis of these nucleotides during the proliferative process. This theory is known asbranched point sensitivity and has been discussedin detail elsewhere (Newsholme et al. 1985). Theimportant point to emerge from this is that gluta-mine (and glucose) must be used at a high rate bysome of the cells of the immune system evenwhen they are quiescent, since an immune chal-lenge can occur at any time so that cells must be‘primed’ to respond whenever there is an inva-sion by a foreign organism. This requires gluta-mine to be available in the bloodstream at a fairlyconstant level. Furthermore, if pyruvate pro-duced from glutamine were fully oxidized viathe Krebs cycle, the cells might produce toomuch ATP, and this could lead to inhibition of therates of glutaminolysis and branched-point sensitivity would be lost. Consistent with thebranched-point sensitivity theory, it has beenshown that a decrease in the glutamine concen-tration in culture medium below that normallypresent in plasma decreases the maximum rate ofproliferation and slows the response to a mito-genic signal in both human and rat lymphocytes,even though they are provided with all other
160 nutrition and exercise
nutrients and growth factors in excess (Parry-Billings et al. 1990b). In addition, a decrease in glutamine concentration also decreased phago-cytosis and the rate of cytokine production bymacrophages.
Several tissues, including liver, muscle,adipose and lung, can synthesize and release glu-tamine into the bloodstream. This is important,since 50–60% of the glutamine that enters thebody via protein in the diet is utilized by theintestine. Thus, the glutamine required by othertissues, including the immune system, must besynthesized within the body. Quantitatively, themost important tissue for synthesis, storage andrelease of glutamine is thought to be skeletalmuscle. As much glutamine is stored in muscleas glycogen is stored in liver, and the rate ofrelease across the plasma membrane, whichoccurs via a specific transporter, appears to becontrolled by various hormones (Newsholme &Parry-Billings 1990). Because of the importanceof glutamine for cells of the immune system, it issuggested that immune cells may communicatewith skeletal muscle to regulate the rate of gluta-mine release. This may also involve somecytokines and glucocorticoids.
The plasma concentration of glutamine isdecreased in conditions such as major surgery(Powell et al. 1994); burns (Stinnett et al. 1982;Parry-Billings et al. 1990b); starvation (Marliss et al. 1971); sepsis (Clowes et al. 1980; Roth et al.1982). There is also evidence that the immunesystem is suppressed in clinical trauma (Baker etal. 1980; Green & Faist 1988). The requirement forglutamine, synthesized within muscle and othercells, will therefore be increased in these condi-tions, since there will be increased activity of theimmune system, and an increased number ofcells involved in proliferation and repair. Simi-larly, damage caused to muscle by prolonged,exhaustive exercise will also lead to a greaterdemand for glutamine. Although the plasmaglutamine concentration is increased in athletesundertaking short-term exercise (Decombaz et al.1979), it is decreased in prolonged, exhaustiveexercise (Poortmans et al. 1974; Castell et al. 1996)and in overtraining (Parry-Billings 1989; Parry-
Billings et al. 1990a; Rowbottom et al. 1996; seealso Budgett et al. 1998).
In a study on athletes with the overtrainingsyndrome (Parry-Billings 1989), the plasma con-centrations of alanine and branched-chain aminoacids were similar in trained and overtrainedathletes. However, the plasma concentration of glutamine was lower in overtrained athletescompared with that in trained athletes and the concentration in trained subjects was lower than in recreational runners (Parry-Billings etal. 1990a). Moreover, after a 6-week recoveryperiod, despite a significant improvement in the exercise performance of these subjects, the plasma glutamine concentration remainedbelow control values. This suggests thatimmunodepression due to overtraining maypersist for longer periods than indicated by thedecrease in physical performance.
Exercise-induced immunodepression has been demonstrated in a large number of differenttypes of athletes, including runners, swimmers,skiers (Noakes 1992) and ballet dancers (Sun et al.1988). It is therefore suggested that intense, pro-longed exercise, particularly if it is undertakenregularly, can cause a marked decrease in theplasma glutamine level, and that this mightresult in immunodepression. Can muscle, to-gether with other tissues, always respond suffi-ciently to release enough glutamine to maintainthe normal blood concentration? This may be aparticularly relevant question if muscle isdamaged due to excessive exercise. However, thereason for the decrease in the plasma glutamineconcentration in longer term, strenuous exerciseis not understood.
Enzymes which are normally localized inmuscle fibres appear in the blood and areassumed to be evidence of disruption or in-creased permeability of the muscle cell mem-branes (Altland & Highman 1961; Newham et al.1983). The occurrence of muscle damage afterprolonged exercise has been reported by Appellet al. (1992), who observed increased levels of circulating complement anaphylotoxin, which is a likely result of tissue damage. Tiidus andIanuzzo (1983) observed that the extent of injury
is proportional to the intensity of exercise.Muscle injuries have been found to be wide-spread in military personnel during strenuoustraining (Greenberg & Arneson 1967; Armstrong1986).
Although it might be hypothesized that themarked decrease in plasma glutamine after pro-longed exhaustive exercise could be due to aninhibition of the glutamine release mechanism, itseems unlikely, since increased non-specific per-meability of muscle cell membranes would beexpected to lead to greater release of glutaminefrom muscle. The possibility arises that muscledamage caused by prolonged exercise presentsan area of tissue which is larger than normal, towhich immune cells might migrate (see Galun et al. 1987; Pabst & Binns 1989, 1992). As thenumbers of these cells increase, activity increasesand/or proliferation of some cells may resultwhich, in turn, increases the local demand forglutamine. It is suggested that failure of muscleto provide enough glutamine could result in animpairment of the function of the immunesystem via lack of precision for the regulation of,for example, the rates of purine and pyrimidinenucleotide synthesis for DNA and RNA forma-tion in lymphocytes (Newsholme 1994). It can bespeculated that excessive damage could produceresistance to the proposed stimulatory effect ofcytokines and glucocorticoids on glutaminerelease, e.g. by a reduction in the number ofcytokine receptors and/or glucocorticoid recep-tors on muscle.
Glutamine feeding in clinical situations
Over many years, there has been considerablephysiological interest in the phenomenon ofhypoglycaemia, since this can cause abnormalfunction of the brain, which is normally depen-dent upon glucose as a fuel. Similar considera-tions should be applied to the maintenance of the plasma glutamine level, which can be consid-ered to be as important a plasma fuel as that ofglucose, but for different cells. Furthermore, therequirement for glutamine, synthesized withinmuscle and other cells, will increase after pro-
amino acids, fatigue and immunodepression 161

longed exhaustive exercise, since there will beincreased activity of the immune system, and anincreased number of cells involved in pro-liferation to carry out the necessary repair. Thequestion therefore arises as to whether extra glut-amine should be provided after exhaustive exercise.
Evidence that both parenteral and enteral glut-amine feeding can have beneficial effects comesfrom several clinical studies: of particular rele-vance to this chapter is the evidence that gluta-mine has a beneficial effect upon some cells of the
162 nutrition and exercise
immune system in the patients investigated(Table 11.3).
Exercise, infections andimmunodepression
Strenuous exercise and upper respiratory tract infections
Upper respiratory tract infections (URTI) occurfrequently in athletes after prolonged, exhaus-tive exercise compared with the normal seden-
Table 11.3 Some beneficial effects of glutamine feeding upon the immune system.
Recipients Clinical situation Method of feeding Beneficial effects Reference
Humans Bone marrow TPN (l-glutamine) Decreased number of positive Ziegler et al. 1992, 1998transplant microbial cultures
Decreased number of clinical infections
Enhanced recovery of circulating lymphocytes,total T-lymphocytes, CD4 helper, CD8 suppressor
Humans Colorectal cancer TPN (glycyl- Enhanced postoperative O’Riordain et al. 1994glutamine dipeptide) T-lymphocyte DNA synthesis
Humans Severe, acute TPN (glycyl- Enhanced T-cell response, O’Riordain et al. 1996pancreatitis glutamine dipeptide) decreased interleukin 8
production
Rats Healthy, suppressed TPN (l-glutamine) Increased biliary concentration Burke et al. 1989biliary of immunoglobulin Aimmunoglobulin A normally suppressed by TPN
Rats Tumour-bearing TPN (alanyl- Increased phagocytic activity Kweon et al. 1991glutamine dipeptide) of alveolar macrophages
Rats Tumour-bearing Oral Increased mitogenic response Shewchuk et al. 1997in splenocytes, increased NK cell numbers in spleen but not activity
Rats Sepsis TPN (alanyl- Increased rate of lymphocyte Yoshida et al. 1992glutamine dipeptide) proliferation and increased
number of lymphocytes
Rats Chemotherapy Oral Decreased sepsis defined as Klimberg et al. 1992decreased white blood cell count plus decreased positive blood cultures
TPN, total parenteral nutrition.
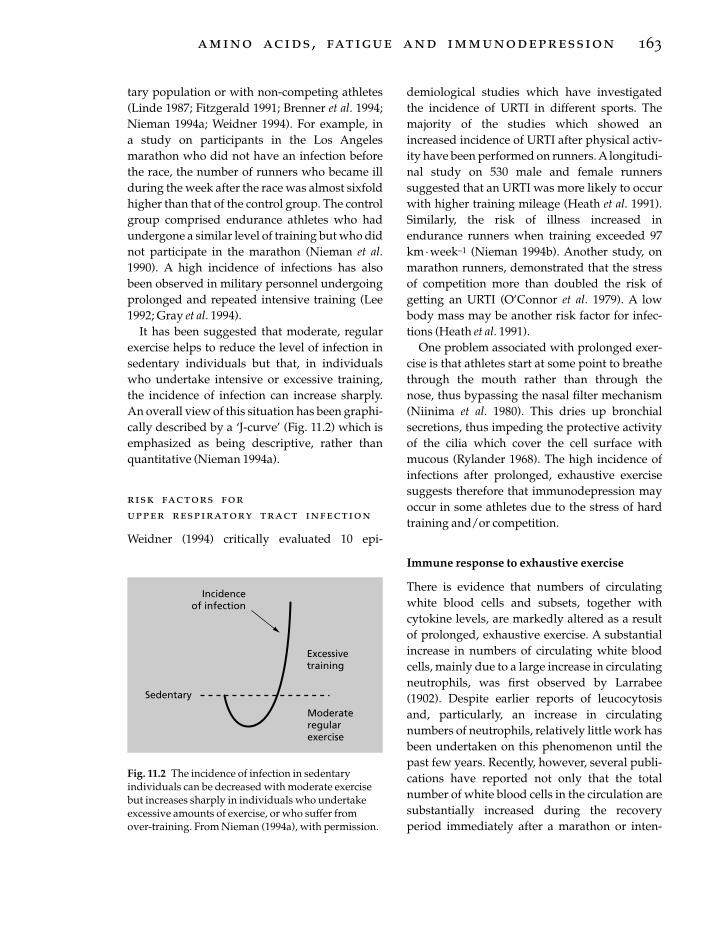
tary population or with non-competing athletes(Linde 1987; Fitzgerald 1991; Brenner et al. 1994;Nieman 1994a; Weidner 1994). For example, in a study on participants in the Los Angelesmarathon who did not have an infection beforethe race, the number of runners who became illduring the week after the race was almost sixfoldhigher than that of the control group. The controlgroup comprised endurance athletes who hadundergone a similar level of training but who didnot participate in the marathon (Nieman et al.1990). A high incidence of infections has alsobeen observed in military personnel undergoingprolonged and repeated intensive training (Lee1992; Gray et al. 1994).
It has been suggested that moderate, regularexercise helps to reduce the level of infection insedentary individuals but that, in individualswho undertake intensive or excessive training,the incidence of infection can increase sharply.An overall view of this situation has been graphi-cally described by a ‘J-curve’ (Fig. 11.2) which isemphasized as being descriptive, rather thanquantitative (Nieman 1994a).
risk factors forupper respiratory tract infection
Weidner (1994) critically evaluated 10 epi-
demiological studies which have investigatedthe incidence of URTI in different sports. Themajority of the studies which showed anincreased incidence of URTI after physical activ-ity have been performed on runners. A longitudi-nal study on 530 male and female runnerssuggested that an URTI was more likely to occurwith higher training mileage (Heath et al. 1991).Similarly, the risk of illness increased inendurance runners when training exceeded 97km· week–1 (Nieman 1994b). Another study, onmarathon runners, demonstrated that the stressof competition more than doubled the risk ofgetting an URTI (O’Connor et al. 1979). A lowbody mass may be another risk factor for infec-tions (Heath et al. 1991).
One problem associated with prolonged exer-cise is that athletes start at some point to breathethrough the mouth rather than through the nose, thus bypassing the nasal filter mechanism(Niinima et al. 1980). This dries up bronchialsecretions, thus impeding the protective activityof the cilia which cover the cell surface withmucous (Rylander 1968). The high incidence ofinfections after prolonged, exhaustive exercisesuggests therefore that immunodepression mayoccur in some athletes due to the stress of hardtraining and/or competition.
Immune response to exhaustive exercise
There is evidence that numbers of circulatingwhite blood cells and subsets, together withcytokine levels, are markedly altered as a resultof prolonged, exhaustive exercise. A substantialincrease in numbers of circulating white bloodcells, mainly due to a large increase in circulatingneutrophils, was first observed by Larrabee(1902). Despite earlier reports of leucocytosisand, particularly, an increase in circulatingnumbers of neutrophils, relatively little work hasbeen undertaken on this phenomenon until thepast few years. Recently, however, several publi-cations have reported not only that the totalnumber of white blood cells in the circulation aresubstantially increased during the recoveryperiod immediately after a marathon or inten-
amino acids, fatigue and immunodepression 163
Incidenceof infection
Excessivetraining
Moderateregularexercise
Sedentary
Fig. 11.2 The incidence of infection in sedentaryindividuals can be decreased with moderate exercisebut increases sharply in individuals who undertakeexcessive amounts of exercise, or who suffer fromover-training. From Nieman (1994a), with permission.

sive training session but that numbers of lym-phocytes in the circulation decrease below pre-exercise levels during the recovery period andlymphocyte proliferation is impaired (see Fry etal. 1992; Haq et al. 1993; Nieman 1994a, 1994b;Castell & Newsholme 1998). There is now alsoconsiderable evidence that prolonged, exhaus-tive exercise is associated with adverse effects onimmune function (for reviews, see Brenner et al.1994; Shinkai et al. 1994; Nieman 1997; Pedersenet al. 1998).
These effects include:• decreased cytolytic activity of natural killercells;• lower circulating numbers of T-lymphocytesfor 3–4h after exercise;• a decrease in the proliferative ability of lymphocytes;• impaired antibody synthesis;• decreased immunoglobulin levels in bloodand saliva;• a decreased ratio of CD4 to CD8 cells.
In contrast, it has been suggested that low-intensity exercise is beneficial for the immunesystem (Fitzgerald 1988; Nieman 1994a, 1994b).Nehlsen-Cannarella et al. (1991) reported a 20% increase in serum immunoglobulins and adecrease in circulating T-cell numbers in mildlyobese women after 6 weeks of brisk walking.Natural killer cell activity is enhanced by moder-ate exercise (Pedersen & Ullum 1994).
Hack et al. (1997) reported a correlationbetween a decreased plasma glutamine concen-tration and circulating levels of CD4 cells after 8weeks of anaerobic training. Rohde et al. (1996),in in vitro studies on T-cell derived cytokines,found that glutamine influenced the productionof the cytokines interleukin 2 and g-interferon. Ina study on triathletes, they also found that a timecourse of changes in serum glutamine correlatedwith changes in lymphokine-activated killer cellactivities.
If, as indicated above, glutamine is importantfor the immune system, then provision of gluta-mine might be beneficial for athletes at particulartimes during their training.
164 nutrition and exercise
glutamine feeding afterprolonged exhaustive exercise
Since the plasma concentration of glutamine isdecreased by approximately 25% in endurancerunners after a marathon as well as in clinicalconditions, a series of studies was undertaken inwhich glutamine was administered. The firststudy established a suitable glutamine dose andtiming in resting, normal subjects (Castell &Newsholme 1997). The results showed that glutamine (at concentrations of 0.1 g · kg–1 bodyweight and 5g per subject), given as a drink, sig-nificantly increased the plasma glutamine con-centration within 30min in healthy humans. Thislevel returned to close to baseline levels afterapproximately 2h.
The effect of giving glutamine or a placeboafter exercise was subsequently investigated infull and ultramarathon runners. Glutamine (5gl-glutamine (GlutaminOx5, Oxford NutritionLtd) in 330 ml mineral water) or placebo (mal-todextrin) was given to athletes on a double-blind basis after prolonged, exhaustive exercise.Athletes were asked to take two drinks (gluta-mine/placebo), the first drink immediately afterexercise and the second drink 1 or 2h after exer-cise. This timing was chosen as a result of infor-mation obtained from the glutamine feedingstudies in normal subjects. Blood samples werealso taken after exercise, before and after a gluta-mine or placebo drink. In addition to meas-urement of plasma glutamine and cytokineconcentrations and acute phase markers,numbers of leucocytes and lymphocytes (fordetails, see Castell et al. 1996) were measuredbefore and after the drinks, as well as CD4 and CD8 cells (Castell & Newsholme 1997). The plasma concentrations of glutamine andbranched-chain amino acids were decreased(23% and 26%, respectively) 1 h after themarathon but had returned to normal the nextmorning (Castell et al. 1997). The number of leu-cocytes tripled in the blood samples taken fromrunners immediately after the marathon. Thisleucocytosis, due mainly to a substantial increase

in numbers of neutrophils, was sustained in thesample taken at 1 h postexercise. A substantialdecrease, to below baseline, was observed innumbers of circulating T-cells 1h after exhaus-tive exercise. However, there was a 30% decreasein total lymphocytes at the same time point.There was no significant difference in leucocyteor lymphocyte numbers between the glutamineand the placebo group. The provision of glu-tamine appeared to have a beneficial effect upon the ratio of CD4 to CD8 T-cells (Castell &Newsholme 1997). A decrease in this ratio hasbeen suggested as being a possible cause andindicator of immunosuppression in athletes(Nash 1986; Keast et al. 1988; Shepherd et al.1991).
Questionnaires were given during the studiesto establish the incidence of infection for 7 daysafter exercise (for details, see Castell et al. 1996).Completed questionnaires on the incidence ofinfection were received from more than 200 individuals in 14 studies, who participated inrowing, or endurance or middle-distancerunning. The levels of infection were lowest inmiddle-distance runners, and were highest inrunners after a full or ultramarathon and in eliterowers after a period of intensive training (Table11.4). The majority of the infections reportedwere URTIs. Athletes who consumed two drinks,containing either glutamine or a placebo, imme-diately after and 2 h after a marathon, also com-pleted 7-day questionnaires (n =151). Overall,the level of infections reported by the glutaminegroup was considerably less than that reported
by the placebo group (Table 11.5). Asimple expla-nation for the effects of glutamine observed inthese studies may be the fact that its provisionafter prolonged exercise might make more gluta-mine available for key cells of the immunesystem at a critical time for induction of infection.
This series of studies provide more evidencefor the fact that prolonged, exhaustive exercisesuch as a marathon produces a response which isanalogous to some aspects of the acute phaseresponse. Increases were demonstrated in acutephase response markers, such as C-reactiveprotein, interleukin 6 and complement C5a inblood samples taken after a marathon race(Castell et al. 1997). An increase in the activationof complement indicates enhanced macrophageactivity which may be involved in clearance offragments from damaged muscle tissue. Thefourfold increase in the plasma concentration ofC-reactive protein, observed 16h after the race, isconsistent with damage to muscle after pro-longed, exhaustive exercise.
The studies also confirm observations made by others (for reviews, see Brenner et al. 1994;Nieman 1994a; Shinkai et al. 1994), viz. that, aftermarathon running, decreases occurred in thenumbers of some circulating immune cells whichwere sustained until at least the next day (Castellet al. 1997). In one glutamine feeding study in thisseries, the numbers of circulating lymphocytes,
amino acids, fatigue and immunodepression 165
Table 11.4 Incidence of infections in athletes during 7 days after different types of exercise (meanvalues ± SEM). After Castell et al. (1996a), withpermission.
No. of No. of InfectionsEvent studies participants (%)
Marathon 5 88 46.8 ± 4.8Ultramarathon 2 40 43.3 ± 4.8Mid-distance race 3 41 24.7 ± 4.0Rowing 4 45 54.5 ± 7.8
Table 11.5 Overall incidence of infections during 7 days for athletes given either glutamine or placeboafter running a marathon (mean values ± SEM). AfterCastell et al. (1996a), with permission.
No. of Participantsparticipants with no with no reported
No. of reported infectionsparticipants infections (%)
Glutamine 72 57 80.8 ± 4.2*
Placebo 79 31 48.8 ± 7.4
*Statistical significance between glutamine andplacebo groups (P < 0.001).

which decreased 1 h after a marathon, wererestored next morning to baseline levels in theglutamine group, compared with the placebogroup (Castell et al. 1997). In another of thesestudies, white blood cells and neutrophils wereelevated after a marathon, but were closer tobaseline levels (P <0.05 and <0.001, respectively)the next morning in the glutamine group com-pared with the placebo group. For future studies,it would be of interest to take samples at dailyintervals after a marathon in order to monitorimmune cell function, since the effect of a viralattack should be manifest within 2–3 days ofrunning a marathon.
No increase in the plasma concentration ofglutamine was observed in samples from thosemarathon runners who received glutaminedrinks after the race. However, for logisticalreasons, blood samples were not taken until an hour after glutamine feeding, whereas thepeak concentration of plasma glutamine after abolus dose at rest occurred at 30min (Castell & Newsholme 1997). Glutamine supplementa-tion in the doses used, and at the times ingestedafter this series of marathon studies, appeared to modify the incidence of URTI and to effect two or three changes in concentrations of acutephase response markers or in circulating cellpopulations.
An important issue is whether measurementsof the numbers and activities of leucocytes in theblood properly reflect the performance of theimmune system in the whole body. In humanstudies, it is the only measurable link we havewith the much larger number of cells in thewhole immune system but the authors are aware of the dangers of overinterpretation ofthese data. The safety and efficacy of glutaminefeeding have been discussed by Ziegler et al.(1990).There are now more than 120 publishedreports on glutamine feeding studies: no prob-lems of toxicity have been reported. It is suggested that, in situations where plasma gluta-mine levels in individuals are low, provision ofexogenous glutamine is a safe and simplemethod of restoring physiological levels. Thismight enhance the functional ability of cells of
166 nutrition and exercise
the immune system, as well as improving thedigestive and defence mechanisms of the intes-tine, both for the patient and the athlete.
Conclusion
In summary, the picture which emerges fromthese studies is that infection levels are higher inathletes undergoing exhaustive exercise of longduration than in those undertaking shorter ormore moderate exercise. Glutamine concentra-tion in the blood is decreased more by prolonged,exhaustive exercise than by anaerobic/aerobic ormoderate exercise. More marked leucocytosisand subsequent decrease in lymphocytes occursas a result of prolonged, exhaustive exercise than anaerobic/aerobic or moderate exercise.The decreases tend to occur at similar times andwithin 3–4h after prolonged, exhaustive exer-cise: this creates an opportunity for apparentimmunosuppression to occur, which may coin-cide with exposure to viral or bacterial agents.The net result is an increase in the number ofinfections, which appears to be modified by glutamine feeding.
Much more work needs to be done, preferablyin well-controlled field studies, to obtain a moreaccurate picture of precisely how glutaminemight be affecting the levels of infection per-ceived in athletes after prolonged, exhaustiveexercise.
Acknowledgements
The authors are indebted to the subjects for theirwilling participation in the studies, and to Pro-fessor Jacques Poortmans for his helpful com-ments on this chapter.
References
Altland, P.D. & Highman, B. (1961) Effects of exerciseon serum enzyme values and tissues of rats.American Journal of Physiology 201, 393–395.
Appell, H.J., Soares, J.M.C. & Duarte, J.A.R. (1992)Exercise, muscle damage and fatigue. Sports Medicine13, 108–115.
Ardawi, M.S.M. & Newsholme, E.A. (1983) Glutamine

metabolism in lymphocytes of the rat. BiochemicalJournal 212, 835–842.
Ardawi, M.S.M. & Newsholme, E.A. (1985) Metabo-lism in lymphocytes and its importance in theimmune response. Essays in Biochemistry 21, 1–44.
Armstrong, R.B. (1986) Muscle damage and enduranceevents. Sports Medicine 3, 370–381.
Bailey, S.P., Davis, J.M. & Ahlborn, E.N. (1992) Effect ofincreased brain serotonergic activity on enduranceperformance in the rat. Acta Physiologica Scandinavica145, 75–76.
Baker, C.C., Oppenheimer, L., Stephens, B., Lewis, F.R.& Trunkey, D.D. (1980) Epidemiology of traumadeaths. American Journal of Surgery 140, 144–150.
Blomstrand, E., Perrett, D., Parry-Billings, M. & Newsholme, E.A. (1989) Effect of sustained exerciseon plasma amino acid concentrations and on 5-hydroxytryptamine metabolism in six different brainregions in the rat. Acta Physiologica Scandinavica 136,473–481.
Blomstrand, E., Hassmen, P. & Newsholme, E.A.(1991a) Administration of branched-chain aminoacids during sustained exercise: effects on perfor-mance and on the plasma concentration of someamino acids. European Journal of Applied Physiology 63,83–88.
Blomstrand, E., Hassmen, P. & Newsholme, E.A.(1991b) Effects of branched-chain amino acid supple-mentation on mental performance. Acta PhysiologicaScandinavica 143, 225–226.
Blomstrand, E., Andersson, S., Hassmen, P., Ekblom, B.& Newsholme, E.A. (1995) Effect of branched-chainamino acid and carbohydrate supplementation onthe exercise-induced change in plasma and muscleconcentration of amino acids in human subjects. ActaPhysiologica Scandinavica 153, 87–96.
Blomstrand, E., Hassmen, P., Ek, S., Ekblom, B. & Newsholme, E.A. (1997) Influence of ingesting asolution of branched-chain amino acids on perceivedexertion during exercise. Acta Physiologica Scandinav-ica 159, 41–49.
Brenner, I.K.M., Shek, P.N. & Shephard, R.J. (1994)Infection in athletes. Sports Medicine 17, 86–107.
Budgett, R., Castell, L.M. & Newsholme, E.A. (1998)The overtraining syndrome. In Oxford Textbook forSports Medicine (ed. M. Harries), pp. 367–377. OxfordUniversity Press, Oxford.
Burke, D.J., Alverdy, J.A., Aoys, E. & Moss, G.S. (1989)Glutamine-supplemented total parenteral nutritionimproves gut immune function. Archives of Surgery124, 1396–1399.
Calders, P., Pannier, J.-L., Matthys, D.M. & Lacroix,E.M. (1997) Pre-exercise branched-chain amino acidadministration increases endurance performance inrats. Medicine and Science in Sports and Exercise 29,1182–1186.
Castell, L.M. & Newsholme, E.A. (1997) The effects oforal glutamine supplementation upon athletes after prolonged, exhaustive exercise. Nutrition 13,738–742.
Castell, L.M. & Newsholme, E.A. (1998) Glutamine andthe effects of exhaustive exercise upon the immuneresponse. Canaclian Journal of Physiology and Pharma-cology 76, 524–532.
Castell, L.M., Poortmans, J. & Newsholme, E.A. (1996)Does glutamine have a role in reducing infections inathletes? European Journal of Applied Physiology 73,488–491.
Castell, L.M., Poortmans, J.R., Leclercq, R., Brasseur,M., Duchateau, J. & Newsholme, E.A. (1997) Someaspects of the acute phase response after a marathonrace, and the effects of glutamine supplementation.European Journal of Applied Physiology 75, 47–53.
Clowes, G.A., Heiderman, M., Lundberg, B. et al. (1980)Effects of parenteral alimentation on amino acidmetabolism in septic patients. Surgery 88, 531–543.
Decombaz, J., Reinhardt, P., Anantharaman, K., vonGlutz, G. & Poortmans, J.R. (1979) Biochemicalchanges in a 100 km run: free amino acids, urea andcreatinine. European Journal of Applied Physiology 41,61–72.
Fernstrom, J.D. (1990) Aromatic amino acids and monamine synthesis in the CNS: influence of thediet. Journal of Nutrition and Biochemistry 1, 508–517.
Fischer, H.G., Hollman, W. & De Meirleir, K. (1991)Exercise changes in plasma tryptophan fractions andrelationship with prolactin. International Journal ofSports Medicine 12, 487–489.
Fitts, R.H. (1994) Cellular mechanisms of musclefatigue. Physiological Reviews 74, 49–94.
Fitzgerald, L. (1988) Exercise and the immune system.Immunology Today 9, 337–339.
Fitzgerald, L. (1991) Overtraining increases the suscep-tibility to infection. International Journal of Sports Medicine 12, 55–58.
Fry, R.W., Morton, A.R., Crawford, G.P.M. & Keast, D.(1992) Cell numbers and in vitro responses of leuco-cytes and lymphocyte subpopulations followingmaximal exercise and interval training sessions ofdifferent intensities. European Journal of Applied Physi-ology 64, 218–227.
Galiano, F.J., Davis, J.M., Bailey, S.P., Woods, J.A. &Hamilton, M. (1991) Physiologic, endocrine and per-formance effects of adding branch chain amino acidsto a 6% carbohydrate-electrolyte beverage duringprolonged cycling. Medicine and Science in Sports andExercise 23, S14.
Galun, E., Burstein, R. & Assia, E. (1987) Changes ofwhite blood cell count during prolonged exercise.International Journal of Sports Medicine 8, 253–255.
Gray, G.C., Mitchell, B.S., Tueller, J.E. et al. (1994) Adultpneumonia hospitalizations in the US Navy: rates
amino acids, fatigue and immunodepression 167
and risk factors for 6522 admissions, 1981–91.American Journal of Epidemiology 139, 793–802.
Green, D.R. & Faist, E. (1988) Trauma and the immuneresponse. Immunology Today 9, 253–255.
Greenberg, J. & Arneson, L. (1967) Exertional rhab-domyolosis with myoglobinuria in a large group ofmilitary trainees. Neurology 17, 216–222.
Hack, V., Weiss, C., Friedmann, B. et al. (1997)Decreased plasma glutamine level and CD4
+ T cellnumber in response to 8wk of anaerobic training.American Journal of Physiology 272, E788–E795.
Haq, A., Al-Hussein, K., Lee, J. & Al-Sedairy, S. (1993)Changes in peripheral blood lymphocyte subsetsassociated with marathon running. Medicine andScience in Sports and Exercise 25, 186–190.
Hassmen, P., Blomstrand, E., Ekblom, B. & Newsholme, E.A. (1994) Branched-chain amino acidsupplementation during 30-km competitive run:mood and cognitive performance. Nutrition 10, 405–410.
Heath, G.W., Ford, E.S., Craven, T.E., Macera, C.A.,Jackson, K.L. & Pate, R.R. (1991) Exercise and theincidence of upper respiratory tract infections. Medi-cine and Science in Sports and Exercise 23, 152–157.
Hefler, S.K., Wideman, L., Gaesser, G.A. & Weltman, A.(1995) Branched-chain amino acid supplementationimproves endurance performance in competitivecyclists. Medicine and Science in Sports and Exercise 27(Suppl.), S5.
Jakeman, P.M., Hawthorne, J.E., Maxwell, S.R.,Kendall, M.J. & Holder, G. (1994) Evidence for down-regulation of hypothalamic 5-hydroxytryptaminereceptor function in endurance-trained athletes.Experimental Physiology 79, 461–464.
Keast, D., Cameron, K. & Morton, A.R. (1988) Exerciseand immune response. Sports Medicine 5, 248–267.
Klimberg, V.S., Nwokedi, E., Hutchins, L.F. et al. (1992)Glutamine facilitates chemotherapy while reducingtoxicity. Journal of Parenteral and Enteral Nutrition 16,83–87S.
Kweon, M.N., Moriguchi, S., Mukai, K. & Kishino, Y.(1991) Effect of alanylglutamine-enriched infusionon tumor growth and cellular immune function inrats. Amino Acids 1, 7–16.
Larrabee, R.C. (1902) Leucocytosis after violent exer-cise. Journal of Medicine Research 2, 76–82.
Lee, D.J. (1992) Immune responsiveness and risk ofillness in US Air Force Academy recruits during basic recruit training. Aviation Space and Environmen-tal Medicine 63, 517–523.
Linde, F. (1987) Running and upper respiratory tractinfections. Scandinavian Journal of Sports Science 9,21–23.
Madsen, K., MacLean, D.A., Kiens, B. & Christensen, D.(1996) Effects of glucose, glucose plus branched-chain amino acids, or placebo on bike performance
168 nutrition and exercise
over 100 km. Journal of Applied Physiology 81,2644–2650.
Marliss, E.B., Aoki, T.T., Pozefsky, T., Most, A.S. &Cahill, G.F. (1971) Muscle and splanchnic glutaminemetabolism in postabsorptive and starved men.Journal of Clinical Investigation 50, 814–817.
Mittleman, K.D., Ricci, M.R. & Bailey, S.P. (1998)Branched-chain amino acids prolong exercise duringheat stress in men and women. Medicine and Sciencein Sports and Exercise 30, 83–91.
Nash, H.L. (1986) Can exercise make us immune todisease? Physician and Sportsmedicine 14, 251–253.
Nehlsen-Cannarella, S.L., Nieman, D., Balk-Lamberton, A.J. et al. (1991) The effects of moderateexercise training on immune response. Medicine andScience in Sports and Exercise 23, 64–70.
Newham, D.H., Jones, D.A. & Edwards, R.H.T. (1983)Large delayed plasma creatine kinase changes afterstepping exercise. Muscle and Nerve 6, 380–385.
Newsholme, E.A. (1994) Biochemical mechanisms toexplain immunosuppression. International Journal ofSports Medicine 15, S142–S147.
Newsholme, E.A. & Leech, A.R. (1999) Biochemistry forthe Medical Sciences. John Wiley & Sons, Chichester(in press).
Newsholme, E.A. & Parry-Billings, M. (1990) Proper-ties of glutamine release from muscle and its impor-tance for the immune system. Journal of Parenteral andEnteral Nutrition 14, 63–67S.
Newsholme, E.A., Crabtree, B. & Ardawi, M.S.M.(1985) Glutamine metabolism in lymphocytes: itsbiochemical, physiological and clinical importance.Quarterly Journal of Experimental Physiology 70, 473–489.
Newsholme, E.A., Newsholme, P., Curi, R. et al. (1988)A role for muscle in the immune system and itsimportance in surgery, trauma, sepsis and burns.Nutrition 4, 261–268.
Newsholme, E.A., Leech, A.R. & Duester, G. (1994) Keepon Running. Wiley, Chichester.
Nieman, D. (1994a) Exercise, infection, and immunity.International Journal of Sports Medicine 15, S131–141.
Nieman, D. (1994b) Exercise, upper respiratory tractinfection and the immune system. Medicine andScience in Sports and Exercise 26, 128–139.
Nieman, D. (1997) Immune response to heavy exertion.Journal of Applied Physiology 82, 1385–1394.
Nieman, D., Johanssen, L.M., Lee, J.W. & Arabatzis, K.(1990) Infectious episodes before and after the LosAngeles marathon. Journal of Sports Medicine andPhysical Fitness 30, 289–296.
Niinima, V., Cole, P., Mintz, S. & Shephard, R.J. (1980)The switching point from nasal to oronasal breath-ing. Respiration Physiology 42, 61–71.
Noakes, T.D. (1992) The Lore of Running, 2nd edn.Oxford University Press, Oxford.
O’Connor, S.A., Jones, D.P., Collins, J.V., Heath, R.B.,Campbell, M.J. & Leighton, M.H. (1979) Changes inpulmonary function after naturally acquired respira-tory infection in normal persons. American Review ofRespiratory Disease 120, 1087–1093.
O’Riordain, M.G., Fearon, K.C.H., Ross, J.A. et al. (1994)Glutamine-supplemented total parenteral nutritionenhances T-lymphocyte response in surgical patientsundergoing colorectal resection. Annals of Surgery220, 212–221.
O’Riordain, M.G., De Beaux, A. & Fearon, K. (1996)Effect of glutamine on immune function in the surgi-cal patient. Nutrition 12, S82–S84.
Pabst, R. & Binns, R.M. (1989) Heterogeneity of lym-phocyte homing physiology: several mechanismsoperate in the control of migration to lymphoid andnon-lymphoid organs in vivo. Immunological Reviews108, 83–109.
Pabst, R. & Binns, R.M. (1992) Lymphocyte trafficking.In Encyclopaedia of Immunology (ed. I. Roitt & P.S.Delves), Vol. 2, pp. 1003–1005. Academic Press,London.
Parry-Billings, M. (1989) Studies of glutamine release fromskeletal muscle. D.Phil. thesis, University of Oxford.
Parry-Billings, M., Blomstrand, E., McAndrew, N. &Newsholme, E.A. (1990a) A communicational linkbetween skeletal muscle, brain, and cells of theimmune system. International Journal of Sports Medi-cine 11, S122.
Parry-Billings, M., Evans, J., Calder, P.C. & Newsholme, E.A. (1990b) Does glutamine contributeto immunosuppression? Lancet 336, 523–525.
Pedersen, B.K. & Ullum, H. (1994) NK cell response tophysical activity: possible mechanisms of action.Medicine and Science in Sports and Exercise 26, 140–146.
Pedersen, B.K., Rohde, T. & Ostrowski, K. (1998) Recov-ery of the immune system after exercise. Acta Physio-logica Scandinavica 162, 325–332.
Poortmans, J.R., Siest, G., Galteau, M.M. & Houot, O.(1974) Distribution of plasma amino acids in humansduring submaximal prolonged exercise. EuropeanJournal of Applied Physiology 32, 143–147.
Powell, H., Castell, L.M., Parry-Billings, M. et al. (1994)Growth hormone suppression and glutamine fluxassociated with cardiac surgery. Clinical Physiology14, 569–590.
Rohde, T., MacLean, D.A., Hartkopp, A. & Pedersen,B.K. (1996) The immune system and serum gluta-mine during a triathlon. European Journal of AppliedPhysiology 74, 428–434.
Roth, E., Karner, J., Ollenschlager, G. et al. (1982) Meta-bolic disorders in severe abdominal sepsis: gluta-mine deficiency in skeletal muscle. Clinical Nutrition1, 25–41.
Rowbottom, D.G., Keast, D. & Morton, A.R. (1996) The emerging role of glutamine as an indicator of
exercise stress and overtraining. Sports Medicine21, 80–97.
Rylander, R. (1968) Pulmonary defence mechanism toairborne bacteria. Acta Physiologica Scandinavica 72(Suppl. 306), 6–85.
Shepherd, R.J., Verde, T.J., Thomas, S.G. & Shek, P.(1991) Physical activity and the immune system.Canadian Journal of Sports Science 16, 163–185.
Shewchuk, L.D., Baracos, V.E. & Field, C.J. (1997)Dietary l-glutamine supplementation reduces thegrowth of the Morris Hepatoma 7777 in exercise-trained and sedentary rats. Journal of Nutrition 127,158–166.
Shinkai, S., Shore, S., Shek, P.N. & Shepherd, R.J. (1994)Acute exercise and immune function. InternationalJournal of Sports Medicine 13, 452–461.
Soppi, E., Varjo, P., Eskola, J. et al. (1982) Effect of strenuous physical stress on circulating lymphocytenumber and function before and after training.Journal of Clinical and Laboratory Immunology 8, 43–46.
Stinnet, J.D., Alexander, J.W., Watanabe, C. et al. (1982)Plasma and skeletal muscle amino acids followingsevere burn injury in patients and experimentalanimals. Annals of Surgery 195, 75–89.
Struder, H.K., Hollman, W.K., Platen, P., Donike, M.,Gotzmann, A. & Weber, K. (1998) Influence of parox-etine, branched-chain amino acids and tyrosine onneuroendocrine system responses and fatigue inhumans. Hormone and Metabolic Research 30, 188–194.
Sun, X., Xu, Y., Zhu, R. & Li, S. (1988) Preliminary studyon immunity in ballet dancers. Canadian Journal ofSports Science 13, 33.
Tiidus, P.M. & Ianuzzo, C.D. (1983) Effects of intensityand duration of muscular exercise on delayed sore-ness and serum enzyme activities. Medicine andScience in Sports and Exercise 15, 461–465.
Van Hall, G., Raaymakers, J.S.H., Saris, W.H.M. &Wagenmakers, A.J.M. (1995) Ingestion of branched-chain amino acids and tryptophan during sustainedexercise in man: failure to affect performance. Journalof Physiology 486, 789–794.
Wagenmakers, A.J.M. (1992) Role of amino acids andammonia in mechanisms of fatigue. Medicine andSport Science 34, 69.
Weidner, T.G. (1994) Literature review: upper respira-tory tract illness and sport and exercise. InternationalJournal of Sports Medicine 15, 1–9.
Wilson, W.M. & Maughan, R.J. (1992) Evidence for apossible role of 5-hydroxytryptamine in the genesisof fatigue in man: administration of paroxetine, a 5-HT re-uptake inhibitor, reduces the capacity toperform prolonged exercise. Experimental Physiology77, 921–924.
Winder, W.W. (1996) Malonyl CoA as a metabolic regu-lator. In Biochemistry of Exercise (ed. R.J. Maughan &
amino acids, fatigue and immunodepression 169

S.M. Sherriffs), Vol. 9, pp. 173–184. Human Kinetics:Champaign, IL.
Yoshida, S., Hikida, S., Tanaka, Y. et al. (1992) Effect ofglutamine supplementation on lymphocyte functionin septic rats. Journal of Parenteral and Enteral Nutri-tion 16 (Suppl. 1).
Ziegler, T.R., Benfell, K., Smith, R.J. et al. (1990) Safetyand metabolic effects of l-glutamine administrationin humans. Journal of Parenteral and Enteral Nutrition14, S137–146.
170 nutrition and exercise
Ziegler, T.R., Young, L.S., Benfell, K. et al. (1992) Clinicaland metabolic efficacy of glutamine supplementedparenteral nutrition after bone marrow transplanta-tion. Annals of Internal Medicine 116, 821–828.
Ziegler, T.R., Bye, R.L., Persinger, R.L., Young, L.S.,Antin, J.H. & Wilmore, D.W. (1998) Effects of gluta-mine supplementation on circulating lymphocytesafter bone marrow transplantation: a pilot study.American Journal of Medical Sciences 315, 4–10.

Introduction
Physical, and perhaps mental, training, alongwith adequate nutrition, is generally thought todecrease fatigue and optimize physical per-formance. However, the specific mechanisms ofsuch strategies are not fully understood becausenot much is known about the specific causes offatigue. The problem is complex because fatiguecan be caused by peripheral muscle weakness(peripheral fatigue) or by a failure to initiate orsustain voluntary drive to the muscle by thecentral nervous system (CNS fatigue). It mayalso vary with the type, duration and intensity ofthe work, the individual level of fitness andnumerous environmental factors (Davis & Fitts1998). Even the specific definition of fatigue isoften debated. For the purpose of this review,fatigue is defined as the loss of force or poweroutput in response to voluntary effort that leadsto reduced performance of a given task. CNSfatigue is the progressive reduction in voluntarydrive to motor neurones during exercise,whereas peripheral fatigue is the loss of force andpower that occurs independent of neural drive.
Peripheral mechanisms of fatigue could in-clude impaired electrical transmission via thesarcolemma and T-tubule, disruption of calciumrelease and uptake within the sarcoplasmic retic-ulum, substrate depletion and other metabolicevents that impair energy provision and musclecontraction (Davis & Fitts 1998). Much less isknown about CNS mechanisms, even though it iswell known that ‘mental factors’ can affect physi-
cal performance. In fact, inadequate CNS drive tothe working muscles is the most likely explana-tion of fatigue in most people during normalactivities. Most people stop exercising becausethe exercise starts to feel too hard (i.e. there isincreased perceived effort) which almost alwaysprecedes an inability of the muscle to produceforce. Therefore, CNS fatigue may include neuro-biological mechanisms of altered subjectiveeffort, motivation, mood and pain tolerance, aswell as those that directly inhibit central motordrive in the upper most regions of the brain(Gandevia 1998).
Evidence for specific inhibition of motor drivewithin the brain during fatiguing exercise hasonly recently appeared in the scientific literature.The best evidence comes from recent studies inhumans using a new technique called transcra-nial magnetic stimulation (TMS). This techniquehas been used to assess the magnitude of themotor responses elicited in the muscle by mag-netic stimulation of neurones in the motor cortex.Recent reports show that the electrical stimulusreaching the muscle following magnetic stimula-tion of the motor cortex (motor-evoked potential)is suppressed following fatiguing exercise(Brasil-Neto et al. 1993; Samii et al. 1996). Gande-via and colleagues (Gandevia et al. 1996; Taylor etal. 1996) also showed that fatigue was accompa-nied by a prolonged silent period in response toTMS that likely results from inadequate neuraldrive by the motor cortex. These data suggeststrongly that specific mechanisms within thebrain are involved in fatigue during exercise.
Chapter 12
Nutrition, Neurotransmitters andCentral Nervous System Fatigue
J. MARK DAVIS
171

CNS fatigue is also thought to be the mostlikely explanation of fatigue that accompaniesviral or bacterial infections, recovery from injuryor surgery, chronic fatigue syndrome, depres-sion, ‘jet lag’ and meal-induced sleepiness andfatigue (Davis & Bailey 1997). However, a fullunderstanding of the causes of fatigue in thesesituations will await future studies designed toprovide plausible neurobiological mechanismsto explain the fatigue.
Progress in this area is minimal, but muchrecent interest has focused on hypotheses involv-ing exercise-induced alterations in neurotrans-mitter function as possible explanations forcentral fatigue. Alterations in serotonin (5-hydroxytryptamine, 5-HT), noradrenaline,dopamine and acetylcholine (ACh) have all been implicated as possible mediators of cen-tral fatigue during stressful situations, includingstrenuous physical exercise. These neurotrans-mitters are known to play a role in arousal, motivation, mood, sleepiness and other behaviours/perceptions that, if adversely af-fected, could impair physical and mental perfor-mance. These neurotransmitter hypotheses alsoprovide the basis of new intriguing nutritionalstrategies designed to improve performance byoffsetting exercise-induced alterations in theseneurotransmitters. This chapter will brieflyreview the evidence for a possible role of 5-HT,noradrenaline, dopamine and ACh in centralfatigue and then provide a more detailed discus-sion of possible nutritional strategies that maylimit CNS fatigue.
Brain 5-HT and CNS fatigue
The neurotransmitter serotonin (5-HT) hasreceived the most attention with respect to CNSfatigue during prolonged exercise. Eric Newsholme et al. (1987) were the first to hypothe-size such a role for brain 5-HT, and present someof their findings in Chapter 11. It was argued thatregional increases in brain 5-HT activity couldcause central fatigue because of its well-knownrole in sensory perception, arousal, lethargy,sleepiness and mood. This hypothesis was of
172 nutrition and exercise
particular interest because both exercise andnutrition could influence brain 5-HT metabolismby affecting the uptake of tryptophan from theblood into the brain. Subsequent studies haveconfirmed certain aspects of this hypothesis, aswell as to test the potential role of carbohydrate(CHO) and/or branched-chain amino acid(BCAA) feedings as a way to limit CNS fatigueinvolving 5-HT.
Increased brain 5-HT synthesis and metabo-lism typically occurs in response to an increase inthe delivery of blood-borne tryptophan (TRP) to the brain because the enzyme tryptophanhydroxylase (rate limiting enzyme in 5-HT syn-thesis) is largely unsaturated under physiologi-cal conditions. Most of the TRP in blood plasmacirculates loosely bound to albumin, but it is theunbound or free tryptophan (f-TRP) that is trans-ported across the blood–brain barrier. This trans-port occurs via a specific mechanism that TRPshares with other large neutral amino acids, most notably the BCAAs leucine, isoleucine andvaline. Thus, brain 5-HT synthesis will increasewhen there is an increase in the ratio of f-TRP toBCAAs in blood plasma (i.e. when f-TRP/BCAArises; Chaouloff et al. 1986a). There are two pri-mary reasons for this increase during exercise.Note that clear differences in this mechanismmay exist at rest, during periods of stress and in various clinical conditions (Curzon 1996).During exercise, large increases in plasma freefatty acids (FFAs) cause a parallel increase inplasma f-TRP because FFAs displace TRP fromits usual binding sites on albumin. Smalldecreases in plasma BCAAs also occur as theyare taken up into working muscle and oxidizedfor energy (Fig. 12.1).
Studies in both rats and humans provide goodevidence that brain 5-HT metabolism increasesduring prolonged exercise and that this is as-sociated with fatigue (Davis & Bailey 1996).Chaouloff’s initial work in rats demonstratedthat prolonged treadmill running increases theplasma f-TRP/BCAA ratio, and brain and cere-brospinal fluid levels of tryptophan, 5-HT and 5-hydroxyindole acetic acid (primary metabolite of 5-HT, 5-HIAA) (Chaouloff et al. 1985, 1986a,

1986b). Bailey et al. (1992, 1993a) further estab-lished the relationship between fatigue andincreased concentrations of 5-HT and 5-HIAAin various brain regions during treadmillrunning. These data, however, cannot differenti-ate between intra- and extracellular concentra-tions of these substances and therefore are notsufficient to conclude that fatigue is necessarilyassociated with increased release of 5-HT fromserotonergic neurones. Techniques involvingmicrodialysis are necessary for this purpose(Meeusen & De Meirleir 1995). Good evidenceusing microdialysis is now available to show that5-HT release from serotonergic nerve terminalsdoes increase during treadmill running and thatthis is increased further by tryptophan adminis-tration (Meussen et al. 1996, 1997). However, nosuch studies have been done during exercise tofatigue.
Other studies have addressed the potential
functional role of altered brain 5-HT activity onexercise fatigue. Bailey et al. (1992, 1993a, 1993b)did a series of experiments involving drug-induced alterations in brain 5-HT activity duringexercise to fatigue in rats. It was hypothesizedthat administration of drugs known to specifi-cally increase brain 5-HT activity (5-HT agonists)would result in early fatigue, whereas drugs thatdecrease brain 5-HT activity (5-HT antagonists)would delay it. The results show that run time tofatigue was decreased following administrationof the 5-HT receptor agonists m-chlorophenylpiperazine and quipazine dimaleate, whereasrun time was increased with a 5-HT receptorantagonist (LY-53857). The supposition that thesedrug-induced effects resulted from altered neu-rotransmitter function in the brain is supportedby the observation that fatigue could not beexplained by alterations in body temperature,blood glucose, muscle and liver glycogen, or
nutrition, neurotransmitters and cns fatigue 173
TRP
TRP
TRP
TRPTRP TRP
5-HT
5-HT
5-HT5-HT
5-HT
TRP TRPTRP
A
A
A
FFA
FFA FFA FFA
FFA FFA
BCAA
f-TRPBCAA
FFA
Brain
Capillary
TRP
TRP
TRP
TRP
5-HT
5-HT
5-HT
TRP
A
A
A
FFA
FFA
BCAABCAA
BCAA
TRP
f-TRPBCAA
FFA
Brain
Capillary
(a)
(b)
Fig. 12.1 The primary components of thecentral fatigue hypothesis. (a) At rest,plasma concentration of BCAA, FFA andTRP (bound and unbound to albumin (A))and their proposed effects on transport ofTRP across the blood–brain barrier for thesynthesis of serotonin (5-HT) inserotonergic neurones. (b) Reflects theincreases in FFA, f-TRP and f-TRP/BCAAthat occur during prolonged exercise. Theresulting increase in brain 5-HT synthesiscan cause central fatigue.
various stress hormones. Similar results werealso found in human subjects in which brain 5-HT activity was increased by the administrationof paroxetine (Paxil; Wilson & Maughan 1992) orfluoxetine (Prozac; Davis et al. 1993) prior torunning or cycling. These results clearly supportthe hypothesized relationship between increasedbrain 5-HT activity and central fatigue. However,as with all pharmacological experiments, it is notpossible to rule out possible crossover effects ofthe drug on other neurotransmitter systems orother side-effects.
Nutritional effects on brain 5-HT and CNS fatigue
An interesting aspect of the neurotransmitterhypotheses of CNS fatigue is the fact that nutri-tion can alter brain neurochemistry in ways thatmight offset CNS fatigue. With respect to brain 5-HT and fatigue, the focus has been on two mainnutritional strategies. These strategies involvefeedings of BCAA and/or CHO during exercise.Intake of BCAA would lower plasma f-TRP/BCAA (by increasing plasma BCAA concentra-tion) and presumably 5-HT due to decreased f-TRP transport across the blood–brain barrier(mechanisms explained earlier in this chapter).The postulated benefits of CHO feedings is basedprimarily on the premise that the normally largeexercise-induced increase in circulating FFAswould be attenuated by the maintenance ofblood glucose and slightly elevated insulin(Davis et al. 1992). Since FFAs have a higher affin-ity for albumin than the loosely bound TRP, thiswould attenuate the normally large increase in f-TRP and therefore f-TRP/BCAA would remainlower (Fig. 12.2). This is unlike the situation atrest, in which a high CHO meal would elicit alarge increase in plasma insulin and a corre-spondingly large decrease in BCAA levels thathave been linked to meal-induced sleepiness andfatigue (Fernstrom 1994). The insulin response issubstantially blunted during exercise to theextent that little or no decrease in plasma BCAAoccurs (Davis et al. 1992).
Blomstrand et al. (1991) focused primarily on
174 nutrition and exercise
administration of BCAAs to delay central fatigueduring activities such as marathon racing and 30-km running. Upon administration of 7.5–16g BCAAs prior to and during exercise, smallimprovements were reported in both physicaland mental performance in some subjects.However, it should be noted that while fieldstudies such as these are designed to mimic thereal world situation in which athletes find them-selves, they are often limited in scientific value.This is because the subject groups are often not appropriately matched for performance or‘blinded’ to the treatment they are receiving, andthere is little or no control over important variables such as exercise intensity, food andwater intake, and environmental conditions.This increases the likelihood that a potentialnutritional benefit may have actually resultedfrom inherent differences in the groups of sub-jects, subject bias and/or uncontrolled variables.
This is perhaps illustrated by the fact that well-controlled laboratory experiments have gener-ally not confirmed the benefit of BCAA onexercise performance. Varnier et al. (1994) foundno differences in performance of a graded incre-mental exercise test to fatigue following infusionof approximately 20g BCAA or saline over 70min prior to exercise using a double-blinded,cross-over design. Verger et al. (1994) alsoreported in rats that feeding relatively largeamounts of BCAAs actually caused early fatigueduring prolonged treadmill running as com-pared to rats fed glucose.
Recent well-controlled laboratory studiesinvolving endurance cycling in humans also failto confirm a performance benefit of BCAAadministration. Blomstrand et al. (1995) studiedfive endurance trained male cyclists during aride to fatigue at 75% V
.o 2max., which was pre-
ceded by a muscle glycogen-depleting regimen,presumably to increase the likelihood that aneffect would occur. All subjects were given inrandom order one of the following drinks duringthe ride: a 6% CHO solution, a 6% CHO solutioncontaining 7g · l–1 BCAA, or a flavoured waterplacebo. Increases in performance were seen inboth CHO and CHO + BCAA treatments when

compared with the placebo. However, there wasno added benefit of BCAA despite increases inplasma (120%) and muscle (35%) concentrationsof BCAA. Van Hall et al. (1995) used more sub-jects (n= 10) and tested a low (6g · l–1) and high(18 g · l–1) dose of BCAAs added to a 6% CHOsolution on cycling time to fatigue at 70–75% ofmaximal power output. Despite large changes inplasma concentrations of BCAA, exercise time toexhaustion (ª 122min) was again not differentfrom the control treatment (6% CHO). This studyalso included a treatment condition in whichtryptophan (3g · l–1) was added to the 6% CHOsolution. However, this also failed to affectfatigue. The authors concluded that these nutri-tional manipulations either had no additional
effect upon brain 5-HT activity or that the changein 5-HT did not contribute significantly to mech-anisms of fatigue. It is also possible that theeffects were lessened by the fact that they weregiven in a solution with CHO. The CHO wouldhave suppressed the normally large increase incirculating levels of stress hormones that isknown to alter TRP transport kinetics.
This brings up the fundamental question ofwhether CHO or BCAA supplementation actu-ally produces the hypothesized effects on brain5-HT during exercise. This, of course, cannot beanswered in human subjects during exercise. Werecently completed a preliminary study whichpartially addressed this issue (Welsh et al. 1997).Solutions containing BCAA, CHO or pure water
nutrition, neurotransmitters and cns fatigue 175
TRP
TRP
TRP
TRP
TRP
5-HT
5-HT
5-HT
TRP
A
A
A
FFA
FFA
BCAA
BCAA BCAA
BCAA
BCAA f-TRPBCAA
FFA
Brain
Capillary
TRP
TRP
TRP
TRP
TRP
5-HT5-HT
5-HT
5-HT
TRPTRP
A
A
A
FFA
FFA
CHO
CHO
CHO
CHO
CHO
BCAA
BCAA
TRP
f-TRPBCAA
FFA
CHO
Brain
Capillary
(a)
(b) CHO+
BCAA
Fig. 12.2 The proposed nutritional effectson the central fatigue hypothesis duringprolonged exercise. (a) The proposedeffects of CHO ingestion on themechanisms of central fatigue with regardto the attenuation of FFA and f-TRP duringprolonged exercise. (b) The proposedeffects of CHO and BCAA ingestion on themechanisms of central fatigue with regardto the larger decrease in the plasma f-TRP/BCAA ratio during prolongedexercise. A, albumin.

were infused into the stomach of rats at regularintervals during treadmill running. Subgroups ofrats in each group were killed at 60, 90 and 120min of exercise for determination of 5-HTand 5-HIAA in the brainstem and striatumregions of the brain. The results showed thatneither BCAA nor CHO feedings affected brain5-HT or 5-HIAA at 60 and 90min of exercise.However, at 120 min, both BCAA and CHO feed-ings lowered 5-HT and 5-HIAA in the brainstemand CHO lowered 5-HT in the striatum. There-fore, at least in this preliminary study, BCAA andCHO feedings were able to influence brain 5-HTmetabolism in a presumably positive directionduring exercise. However, since exercise time tofatigue was not measured in this study, the ques-tion of whether a direct link exists between thesenutritional strategies, lower brain 5-HT metabo-lism and fatigue during exercise remains to befirmly established.
Even if BCAA supplementation is found toalter brain 5-HT during exercise, there is still aquestion of potential negative side-effects. ForBCAA to be physiologically effective in reducingbrain 5-HT metabolism, relatively large doses arelikely to be required and this increases the likeli-hood that plasma ammonia will result (van Hallet al. 1995). Ammonia is known to be toxic to thebrain and may also impair muscle metabolism.The buffering of ammonia could cause fatigue in working muscles by depleting glycolyticallyderived carbon skeletons (pyruvate) and bydraining intermediates of the Krebs cycle that are coupled to glutamine production by transa-mination reactions (Wagenmakers et al. 1990).Elevated plasma ammonia can also increasebrain TRP uptake and 5-HT metabolism invarious brain regions (Mans et al. 1987). Otherpotential side-effects include slower waterabsorption across the gut, gastrointestinal dis-turbances and decreased drink palatability. Itshould be noted, however, that when thesepotential side-effects were minimized by provid-ing a small, more palatable, dose of BCAA in asports drink (0.5 g ·h–1 consumed in a CHO–electrolyte drink), no benefits were found
176 nutrition and exercise
during cycling to fatigue at 70% V.o 2max. in
trained cyclists. No measurable side-effects werereported, but ride time to fatigue, perceived exer-tion and various cardiovascular, metabolic andendocrine responses were similar in the BCAAand placebo groups (Galiano et al. 1991). In fact,to the author’s knowledge there is only onerecent controlled laboratory study that shows aperformance benefit of BCAA supplementation(Mittleman et al. 1998). In this study, BCAA weregiven during a 2-h pre-exercise exposure to highheat that was followed by a ride to fatigue at 40%V.o 2peak. As expected, the f-TRP/BCAA ratio was
significantly lower during the 2-h period prior to exercise and during exercise when subjectsreceived the BCAA supplement. However, in thiscase fatigue was apparently delayed by the supplement. It is possible that administration ofBCAA during the rest period in the heat prior toexercise may have provided a beneficial effectthat would otherwise not occur, or be offset byother negative side-effects, if the supplementsare given only during exercise. However,support for this hypothesis from other physio-logical and psychological data in this paper wereequivocal.
This led us to consider another, perhaps morereasonable nutritional approach involving CHOfeedings alone to offset the increase in 5-HT andCNS fatigue. The literature is consistent inshowing that CHO feedings can delay fatigue in a variety of exercise protocols, which is not surprising given the well-known benefit of CHO feedings in maintaining blood glucose andmuscle glycogen as important sources of energyfor the working muscle (Coyle 1998). However, itnow appears possible that CHO feedings mayalso delay CNS fatigue as well as peripheralfatigue (Davis et al. 1992).
This effect is based on the premise that CHOfeedings suppress normally large rises in FFAand therefore f-TRP and f-TRP/BCAA duringexercise without the potential negative conse-quences of administering large doses of BCAA.This hypothesis was tested in a double-blinded,placebo-controlled laboratory study in which

subjects drank 5 ml ·kg–l ·h–1 of either a waterplacebo, a 6% CHO drink or a 12% CHO drinkduring prolonged cycling at 70% V
.o 2max. to
fatigue (Davis et al. 1992). When subjects consumed the water placebo, plasma f-TRPincreased dramatically (in direct proportion toplasma FFAs), while total TRP and BCAAchanged very little during the ride. When sub-jects consumed either the 6% or 12% CHO solu-tion, the increases in plasma f-TRP were greatlyreduced and fatigue was delayed by approxi-mately 1h. The CHO feedings caused a slightreduction in plasma BCAA (19% and 31% in the6% and 12% CHO groups, respectively), but thisdecrease was probably inconsequential withrespect to the very large attenuation (five- to sevenfold) of plasma f-TRP. Although it was notpossible to distinguish between the beneficialeffects of CHO feedings on central vs. peripheralmechanisms of fatigue in this study, it was inter-esting that the substantial delay in fatigue couldnot be explained by typical markers of peripheralmuscle fatigue involving cardiovascular, ther-moregulatory and metabolic function.
Brain catecholamines and CNS fatigue
The primary catecholamine neurotransmitters inthe brain are dopamine and noradrenaline. Bothneurotransmitters are formed from the aminoacid tyrosine in similar metabolic pathways, butthey are released from different neurones foundin different regions of the brain. The rate-limitingstep in their biosynthesis is the hydroxylation oftyrosine to dihydroxyphenylalanine (l-dopa)by the enzyme tyrosine hydroxylase. l -Dopa isthen decarboxylated to dopamine. In noradre-naline neurones, dopamine is then converted to noradrenaline by the enzyme dopamine b-hydroxylase.
Dopamine and noradrenaline neurones modu-late a wide variety of functions in the CNS.Dopaminergic neurones arise primarily from cellbodies in the ventral tegmental area (VTA) andpars compacta of the substantia nigra (CSN). TheVTA gives rise to neurones of the mesolimbic and
mesocortical pathways that project to many com-ponents of the limbic system. These neurones areinvolved in various emotions, memory and espe-cially behaviours related to motivation, reward,wakefulness and attention (Olds & Fobes 1981).The CSN gives rise to the nigrostriatal pathwaythat projects to the putamen and caudate nucleiof the striatum and is intimately involved inmotor behaviour. Noradrenaline neurones pri-marily arise in the locus coeruleus and lateralbrain stem tegmentum and project to variousareas of the limbic system, cortex, cerebellumand spinal cord. These neurones are involved incontrol of sympathetic nervous system activity,anxiety and arousal. Both neurotransmittersystems, along with 5-HT, have been implicatedin the aetiology of depression (Dunn & Dishman1991; Cabib & Puglisi-Allegra 1996).
Brain catecholamine metabolism is dramati-cally increased during periods of stress, includ-ing physical exercise (Meeusen & De Meirleir1995). This often leads to partial depletion of cat-echolamines in various brain regions of rodents.Although direct evidence of brain catecholaminedepletion is lacking in human subjects, it is generally believed that alterations in brain noradrenaline and dopamine are involved in theneurochemical manifestations of acute stress.These include behavioural deficits like fatigue,distress, helplessness, inattention and impairedmotor and cognitive performance. The militaryhas been very interested in these effects that havebeen attributed to deficits in physical and mentalperformance that occur in soldiers during thestress of battle (Owasoyo et al. 1992).
The possibility that depletion of these neuro-transmitters, especially dopamine, may specifi-cally relate to CNS fatigue during exercise hasalso been put forth by several investigators(Heyes et al. 1988; Chaouloff et al. 1989; Davis &Bailey 1997). Dopamine was probably the firstneurotransmitter to be linked to CNS fatigue dueto its well-known role in motor behaviour andmotivation. The specific mechanisms underlyingan effect of dopamine on CNS fatigue remains tobe elucidated. It is hypothesized that decreased
nutrition, neurotransmitters and cns fatigue 177
dopamine activity would lead to a reduction inmotivation, arousal and/or motor control thatwould contribute to CNS fatigue.
It is clear that drug-induced increases indopamine activity as well as electrical brain stim-ulation of the primary dopamine system in thebrain can motivate various exercise tasks in ratsand can delay fatigue during treadmill running.For example, pretreatment of rats with amp-hetamine, a dopamine releaser with powerful rewarding properties, or apomorphine, adopamine agonist, has been shown to delayfatigue (Gerald 1978; Heyes et al. 1988). There arealso numerous reports of amphetamine use tocontrol fatigue and improve performance in ath-letes and soldiers (Ivy 1983). Electrical stimula-tion of the VTA or other areas of the mesolimbicdopamine pathway mediate reinforcement andreward (Olds & Fobes 1981). It has recently beenshown to motivate rats to lift weights (Garner etal. 1991), run on a motorized treadmill (Burgess et al. 1991) and run in running wheels(Schwarzberg & Roth 1989). We did a series ofstudies in which activation of this dopaminergicreward system was used to motivate rats to runon a treadmill (Burgess et al. 1991, 1993a, 1993b).In one of the studies we compared run time tofatigue on a motorized treadmill in rats that ranfor rewarding VTA stimulation vs. those inwhich the fear of an electric shock grid placed at the back of the treadmill was used as motiva-tion. We found that rats ran significantly longer(25 m·min–1, 5% grade) while receiving VTAstimulation (63± 10min) that when they receivedthe electric shocks (42± 10min). We did notmeasure neurotransmitters in this study toconfirm a presumed role of elevated dopamine indelayed fatigue in this experiment, but in otherexperiments it was determined that this delay infatigue was not likely related to cardiovascularor metabolic function.
There is also good evidence that increaseddopamine metabolism occurs normally duringexercise. Regional brain analysis shows thatdopamine metabolism is enhanced during tread-mill exercise in the midbrain, hippocampus,striatum and hypothalamus (Chaouloff et al.
178 nutrition and exercise
1987; Bailey et al. 1993a). Increased dopaminemetabolism has been shown to be a good markerfor speed, direction and posture of movinganimals (Freed & Yamamoto 1985). Conversely,endurance performance was impaired followingdestruction of dopaminergic neurones by 6-hydroxydopamine, an effect diminished bygiving back a drug that increases dopamineactivity (i.e. apomorphine; Heyes et al. 1988).
Bailey et al. (1993a) demonstrated a relation-ship between decreased brain dopamine metabolism and fatigue during prolonged tread-mill running in rats. Fatigue was associated with specific decreases in dopamine in the brainstem and midbrain. These data, along with otherdata showing a phasic inhibitory control of 5-HTover dopamine-dependent forms of behaviour(Soubrie et al. 1984), led to the hypothesis thatelevated 5-HT, also associated with fatigue, mayinhibit dopamine activity (Davis & Bailey 1997).Further support for this comes from studies thatshow an inverse relationship between brain 5-HT and dopamine in association with fatigue fol-lowing administration of drugs that affect brain5-HT and dopamine systems. When a 5-HTagonist (quipizine dimalate) was administered torats prior to treadmill running, it appeared toblock the increase in dopamine at 1 h and fatigueoccurred early. Alternatively, a 5-HT antagonist(LY53857) partially blocked the decrease indopamine and fatigue was delayed. Also, whenamphetamine is given to rats in doses known to delay fatigue, brain 5-HT metabolism isdecreased (Chaouloff et al. 1987). These data addsupport to our hypothesis that central fatigueoccurs when dopamine is reduced in associationwith elevated 5-HT (Davis & Bailey 1997).
Nutrition, brain catecholamines and CNS fatigue
Tyrosine is a non-essential, large, neutral, aminoacid found in dietary proteins and is the pre-cursor of the neurotransmitters noradrenalineand dopamine. Researchers, especially thoseemployed by the US Army, have been interestedin the possibility that tyrosine supplementation

may protect against the adverse behaviouraleffects of prolonged periods of stress by prevent-ing the depletion of brain catecholamines thatmay counteract mood and performance degra-dation in soldiers (Owasoyo et al. 1992). Most ofthis work has focused on noradrenaline deple-tion, even though good evidence in animalsshow that both dopamine and noradrenalinesynthesis can be increased by tyrosine adminis-tration (see Owasoyo et al. 1992). It is thoughtthat noradrenaline neurones in the locuscoeruleus regulate, in part, behavioural func-tions like anxiety (tension), vigilance and atten-tion that are apparently improved followingadministration of tyrosine. However, it is alsopossible that some of the beneficial effects oftyrosine can be attributed to prevention ofdopamine depletion, especially in the case of motivation, wakefulness, motor control andoverall fatigue.
Unlike tryptophan, however, catecholaminer-gic neurones are not sensitive to the presence ofexcess tyrosine while at rest, but become sensi-tive when the neurones are activated by stress(Milner & Wurtman 1986). This theory is consis-tent with work from both human (Growden et al.1982) and animal research (Lehnert et al. 1984).
Research on the possible beneficial effects oftyrosine on adverse behavioural responses tostress in humans comes primarily from onegroup of investigators headed by H.R. Lieberman and associates at Massachusetts Institute of Technology and the US ArmyResearch Institute of Environmental Medicine.They initially showed that tyrosine decreasedsome of the adverse consequences of a 4.5-hexposure to cold and hypoxia (Banderet &Lieberman 1989). Tyrosine (100 mg· kg–1)returned mood, cognitive performance, vigi-lance and feelings of fatigue and sleepiness tobaseline levels in subjects who were mostaffected by the environmental stressors. Theyalso found that tyrosine increased tolerance tolower body negative pressure with an accompa-nying decrease in depression, tension andanxiety (Dollins et al. 1995) and lessened theimpairments of learning and memory during
severe hypoxia (Shukitt-Hale et al. 1996). There isalso one report from another group that showedthat tyrosine improved performance in percep-tual motor tasks during lower body negativepressure (Deijen & Orlebeke 1994).
There are no studies that specifically focus onthe possible effects of tyrosine as a means ofdelaying fatigue during exercise. This is unfortu-nate, since there is reasonable information tohypothesize a possible beneficial effect of tyro-sine in preventing a depletion of noradrenalineand dopamine that appears to be essential tooptimal physical performance. It is reasonable tosuspect that tyrosine could limit some of the negative behavioural consequences of prolongedstressful exercise including reductions in alertness, attention, motivation (drive), positivemood and motor control that would be expectedto limit optimal performance perhaps though aneffect on central fatigue. Special attention needsto be focused on the possible role of dopaminesince this has essentially not been addressed inthe literature to date.
Acetylcholine and CNS fatigue
Acetylcholine is the most abundant neurotrans-mitter in the body. It is essential for the genera-tion of muscular force at the neuromuscularjunction, and within the CNS is generally assoc-iated with memory, awareness, and temperatureregulation.
As with 5-HT and the catecholamines, the rateof synthesis of acetylcholine is determined by theavailability of its precursor, choline, which is nor-mally obtained from the diet. ACh is synthesizedin the cytoplasm from choline and acetyl coen-zyme A via the enzyme choline acetyltransferasethat is not saturated with choline at physiologicalconcentrations, and ACh does not ‘feed-back’ toinhibit its own synthesis. There is also some evidence in animals to suggest that depletion ofACh may contribute to fatigue during sustainedelectrical activity. However, no studies haveinvestigated the relationship between modifiedplasma choline levels and concentrations of AChin skeletal muscle, although synthesis of ACh
nutrition, neurotransmitters and cns fatigue 179

was found to be increased in electrically stimu-lated hemidiaphragm perfused with choline invitro (Bierkamper & Goldberg 1980).
Wurtman and colleagues hypothesized thatfatigue during prolonged exercise may be ini-tiated by a reduction in ACh activity subsequentto depletions in availability of choline (Conley etal. 1986; Sandage et al. 1992). This group recentlyshowed that plasma choline levels were reducedapproximately 40% in runners following com-pletion of the Boston Marathon (Conley et al.1986). They also reported that performance of a32-km run was improved when plasma cholinewas maintained or elevated by consumption of abeverage supplemented with choline citrate(Sandage et al. 1992). However, there is still noevidence that decreased plasma choline is associ-ated with ACh depletion at the neuromuscularjunction, or in the brain for that matter, and that this leads to fatigue. In addition, asdescribed earlier in this chapter, relativelyuncontrolled field studies such as these are oftenmisleading because it is difficult to know for surewhether the effect ascribed to choline was notdue to a number of other uncontrolled variables.
Results of the only well-controlled laboratorystudy of the effects of choline supplementationon exercise performance do not support a benefi-cial effect of choline supplementation (Spector etal. 1995). Neither low- nor high-intensity exerciseperformance was improved with choline supple-mentation. Choline was given (2.43 g, 1 h beforeexercise) prior to either a prolonged cycling boutto fatigue at 70% V
.o 2max. (ª73 min) or a shorter
term, high-intensity cycling bout at 150% ofV.o 2max. (ª2 min). In addition, serum choline
levels were not reduced by either of these exer-cise conditions. The authors did suggest that theduration of exercise protocols might have to beextended to allow for the hypothesized benefit ofcholine administration to be realized.
Conclusion
It is unfortunate that so little is known about themechanisms underlying a CNS effect on fatigue.This area of investigation has largely been
180 nutrition and exercise
ignored due in large part to difficulty in studyingbrain function in humans, a lack of good theoriesto explain such an occurrence, and a lack of good methodologies to directly measure centralfatigue. However, in recent years, new method-ologies and viable theories have sparkedrenewed interest in the development of hypothe-ses, which can be tested in a systematic fashion,that may help to explain the role of the CNS infatigue.
Nutritional interventions are a common aspectof recent studies on CNS fatigue. Nutritionalstrategies designed to alter brain 5-HT metabo-lism have received the most attention in thisregard. While 5-HT is almost certainly not theonly neurotransmitter involved in central fatigueduring prolonged exercise, review of the mecha-nisms involved in the control of brain serotoninsynthesis and turnover make it a particularlyattractive candidate. It is well known that in-creases in brain 5-HT can have important effectson arousal, lethargy, sleepiness and mood thatcould be linked to altered perception of effortand feelings of fatigue. Increases in 5-HT metab-olism appear to increase in several brain regionsdue to an increase in plasma f-TRP during pro-longed exercise and reach a peak at fatigue.Drugs that increase and decrease brain 5-HTactivity have predictable effects on run times tofatigue in the absence of any apparent peripheralmarkers of muscle fatigue.
The evidence for a benefit of nutrition oncentral fatigue during exercise is more tenuous.Studies involving BCAA supplementationusually show no performance benefit eventhough preliminary evidence in rats suggeststhat it may suppress brain 5-HT metabolismduring exercise. Perhaps negative effects ofammonia accumulation on muscle and brainfunction offset the potentially beneficial effect ofBCAA on brain 5-HT. CHO supplementation, onthe other hand, is associated with a large sup-pression of plasma f-TRP and f-TRP/BCAA anddecreased brain 5-HT metabolism, and fatigue isdelayed by this strategy. In this case, however, itis not possible to distinguish with certainty theeffects of CHO feedings on CNS fatigue mecha-
nisms and the well-established beneficial effectsof CHO supplementation on the contractingmuscle.
The potential role of tyrosine supplementationto increase or maintain noradrenaline and dopa-mine as a way to offset CNS fatigue is theoreti-cally feasible, but there is essentially no directevidence to support this hypothesis at this time.The potential role of choline supplementation to prevent ACh depletion and neuromusculartransmission failure is even more tenuous.
Future research on possible relationshipsamong nutrition, brain neurochemistry andfatigue is likely to lead to important discoveriesthat may enhance physical and mental perfor-mance during sports participation and, althoughnot addressed in any depth in this review, duringactivities of normal daily life. It may also help to understand and better treat the debilitatingfatigue that often occurs in patients with chronicfatigue syndrome, fibromyalgia, viral illness anddepression, among others.
References
Bailey, S.P., Davis, J.M. & Ahlborn, E.N. (1992) Effect ofincreased brain serotonergic (5-HT1C) activity onendurance performance in the rat. Acta PhysiologicaScandinavica 145, 75–76.
Bailey, S.P., Davis, J.M. & Ahlborn, E.N. (1993a) Neu-roendocrine and substrate responses to altered brain5-HT activity during prolonged exercise to fatigue.Journal of Applied Physiology 74, 3006–3012.
Bailey, S.P., Davis, J.M. & Ahlborn, E.N. (1993b) Brainserotonergic activity affects endurance performancein the rat. International Journal of Sports Medicine 6,330–333.
Banderet, L.B. & Lieberman, H.R. (1989) Treatmentwith tyrosine, a neurotransmitter precursor, reducesenvironmental stress in humans. Brain Research Bulletin 22, 759–762.
Bierkamper, G.G. & Goldberg, A.M. (1980) Release ofacetylcholine from the vascular perfused rat phrenicnerve hemidiaphragm. Brain Research 202, 234–237.
Blomstrand, E., Hassmen, P., Ekblom, B. & Newsholme, E.A. (1991) Administration ofbranched-chain amino acids during sustained exercise-effects on performance and on plasma con-centration of some amino acids. European Journal ofApplied Physiology 63, 83–88.
Blomstrand, E., Andersson, S., Hassmen, P., Ekblom, B.
& Newsholme, E.A. (1995) Effect of branched-chainamino acid and carbohydrate supplementation onthe exercise-induced change in plasma and muscleconcentration of amino acids in human subjects. ActaPhysiologica Scandinavica 153, 87–96.
Brasil-Neto, J.P., Pascual-Leone, A., Valls-Sole, J., Cammarota, A., Cohen, L.G. & Hallett, M. (1993)Post-exercise depression of motor evoked potentials:a measure of central nervous system fatigue. Experimental Brain Research 93, 181–184.
Burgess, M.L., Davis, J.M., Borg, T.K. & Buggy, J. (1991)Intracranial self-stimulation motivates treadmillrunning in rats. Journal of Applied Physiology 71 (4),1593–1597.
Burgess, M.L., Davis, J.M., Borg, T.K., Wilson, S.P.,Burgess, W.A. & Buggy, J. (1993a) Exercise trainingalters cardiovascular and hormonal responses tointracranial self-stimulation. Journal of Applied Physiology 75, 863–869.
Burgess, M.L., Davis, J.M., Wilson, S.P., Borg, T.K.,Burgess, W.A. & Buggy, J. (1993b) Effects of intracra-nial self-stimulation on selected physiological variables in rats. American Journal of Physiology 264,R149–R155.
Cabib, S. & Puglisi-Allegra, S. (1996) Stress, depressionand the mesolimbic dopamine system. Psychophar-macology 128, 331–342.
Chaouloff, F., Elghozi, J.L., Guezennec, Y. & Laude, D.(1985) Effects of conditioned running on plasma,liver and brain tryptophan and on brain 5-hydroxytryptamine metabolism of the rat. BritishJournal of Pharmacology 86, 33–41.
Chaouloff, F., Kennett, G.A., Serrurier, B., Merina, D. &Curson, G. (1986a) Amino acid analysis demon-strates that increased plasma free tryptophan causesthe increase of brain tryptophan during exercise inthe rat. Journal of Neurochemistry 46, 1647–1650.
Chaouloff, F., Laude, D., Guezennec, Y. & Elghozi, J.L.(1986b) Motor activity increases tryptophan, 5-hydroxyindoleacetic acid, and homovanillic acid inventricular cerebrospinal fluid of the conscious rat.Journal of Neurochemistry 46, 1313–1316.
Chaouloff, F., Laude, D., Merino, D., Serrurier, B.,Guezennec, Y. & Elghozi, J.L. (1987) Amphetamineand alpha-methyl-p-tyrosine affect the exerciseinduced imbalance between the availability of tryp-tophan and synthesis of serotonin in the brain of therat. Neuropharmacology 26, 1099–1106.
Chaouloff, F., Laude, D. & Elghozi, J.L. (1989) Physicalexercise: evidence for differential consequences oftryptophan on 5-HT synthesis and metabolism incentral serotonergic cell bodies and terminals.Journal of Neural Transactions 78, 121–130.
Coggan, A.R. & Coyle, E.F. (1991) Carbohydrate inges-tion during prolonged exercise: effects on metabo-lism and performance. In Exercise and Sports Sciences
nutrition, neurotransmitters and cns fatigue 181

Reviews (ed. J.O. Holloszy), pp. 1–40. Williams andWilkins, Baltimore.
Conley, L., Wurtman, R.J., Blusztain, J.K., Coviella, I.,Maher, T.J. & Evoniuk, G.E. (1986) Decreased plasmacholine concentration in marathon runners. NewEngland Journal of Medicine 175, 892.
Coyle, E.F. (1998) Fuels for sport performance. In Per-spectives in Exercise Science and Sports Medicine. Vol.10. Optimizing Sport Performance (eds D.R. Lamb & R.Murray), pp. 95–137. Cooper Publishing, Carmel, IN.
Curzon, G. (1996) Brain tryptophan: normal and disturbed control. In Recent Advances in TryptophanResearch (eds G.A. Filippini, C.V.L. Costa & A.Bertazzo), pp. 27–34. Plenum Press, New York.
Davis, J.M. & Bailey, S.P. (1997) Possible mechanisms of central nervous system fatigue during exercise.Medicine and Science in Sports and Exercise 29, 45–45.
Davis, J.M. & Fitts, R. (1998) mechanisms of muscularfatigue. In ACSM’s Resource Manual for Guidelines forExercise Testing and Prescription (ed. J.L. Roitman), pp.182–188. Williams & Wilkins, Baltimore, MD.
Davis, J.M., Bailey, S.P., Woods, J.A., Galiano, F.J.,Hamilton, M. & Bartoli, W.P. (1992) Effects of carbo-hydrate feedings on plasma free-tryptophan andbranched-chain amino acids during prolongedcycling. European Journal of Applied Physiology 65,513–519.
Davis, J.M., Bailey, S.P., Jackson, D.A., Strasner, A.B. &Morehouse, S.L. (1993) Effects of a serotonin (5-HT)agonist during prolonged exercise to fatigue inhumans. Medicine and Science in Sports and Exercise 25,S78.
Deijen, J.B. & Orlebeke, J.F. (1994) Effect of tyrosine oncognitive function and blood pressure under stress.Brain Research Bulletin 33, 319–323.
Dollins, A.B., Krock, J.L., Storm, W.F., Wurtman, R.J. &Lieberman, H.R. (1995) l-tyrosine ameliorates someof the effect of lower body negative pressure stress.Physiological Behavior 57, 223–230.
Dunn, A.L. & Dishman, R.K. (1991) Exercise and the neurobiology of depression. In Exercise and Sports Science Reviews (ed. J.D. Holloszy), pp. 41–98.Williams and Wilkins, Baltimore, MD.
Fernstrom, J.D. (1994) Dietary amino acids and brainfunction. Journal of the American Dietetic Association94, 71–77.
Freed, C.R. & Yamamoto, B.K. (1985) Regional braindopamine metabolism: a marker for speed, direction,and posture of moving animals. Science 229, 62–65.
Galiano, F.J., Davis, J.M., Bailey, S.P., Woods, J.A. &Hamilton, M. (1991) Physiologic, endocrine and per-formance effects of adding branch chain amino acidsto a 6% carbohydrate–electrolyte beverage duringprolonged cycling. Medicine and Science in Sports andExercise 23, S14.
Gandevia, S.C. (1998) Neural control in human muscle
182 nutrition and exercise
fatigue: changes in muscle afferents, motoneuronesand motor cortical drive. Acta Physiologica Scandi-navica 162, 275–284.
Gandevia, S., Gabrielle, M.A., Butler, J.E. & Taylor, J.L.(1996) Supraspinal factors in human muscle fatigue:evidence for suboptimal output from the motorcortex. Journal of Applied Physiology 490, 520–536.
Garner, R.P., Terracio, L., Borg, T.K. & Buggy, J. (1991)Cardiac hypertrophy after weight lifting exercisemotivated by intracranial self-stimulation. Journal ofApplied Physiology 71, 1672–1631.
Gerald, M.C. (1978) Effect of (+)-amphetamine on thetreadmill endurance performance of rats. Neurophar-macology 17, 703–704.
Growden, J.H., Melamed, E., Logue, M., Hefti, F. &Wurtman, R.J. (1982) Effects of oral l-tyrosineadministration on CSF tyrosine and homovanillicacid levels in patients with Parkinson’s Disease. LifeScience 30, 827–832.
Heyes, M.P., Garnett, E.S. & Coates, G. (1988) Nigrostriatal dopaminergic activity increasedduring exhaustive exercise stress in rats. Life Science42, 1537–1542.
Ivy, J.L. (1983) Amphetamines. In Ergogenic Aids inSport (ed. M.H. Williams), pp. 101–127. HumanKinetics, Champaign, IL.
Lehnert, H., Reinstein, D.K., Strowbridge, B.W. &Wurtman, R.J. (1984) Neurochemical and behavioural consequences of acute uncontrollablestress: effects of dietary tyrosine. Brain Research 303,215–219.
Mans, A.M., Beibuyck, J.F. & Hawkins, R.A. (1987)Brain tryptophan abnormalities in hyperammon-aemia and liver disease. In Progress in Tryptophan and Serotonin Research (ed. D.A. Bender, M.H. Joseph,W. Kochen & H. Steinhart), pp. 207–212. De Gruyter,Berlin.
Meeusen, R. & De Meirleir, K. (1995) Exercise and brainneurotransmission. Sports Medicine 20, 160–188.
Meussen, R., Thorre, K., Chaouloff, F. et al. (1996)Effects of tryptophan and/or acute running on extra-cellular 5-HT and 5-HIAA levels in the hippocampusof food deprived rats. Brain Research 740, 245–254.
Meussen, R., Smolders, I., Sarre, S. et al. (1997)Endurance training effects on neurotransmitterrelease in rat striatum: an in vivo microdialysisstudy. Acta Physiologica Scandinavica 159, 335–341.
Milner, J.D. & Wurtman, R.J. (1986) Commentary: Catecholamine synthesis: physiological coupling toprecursor supply. Biochemistry and Pharmacology35, 875–881.
Mittleman, K.D., Ricci, M.R. & Bailey, S.P. (1998)Branched-chain amino acids prolong exercise duringheat stress in men and women. Medicine and Sciencein Sports and Exercise 30, 83–91.
Newsholme, E.A., Acworth, I.N. & Blomstrand, E.

(1987) Amino acids, brain neurotransmitters and afunctional link between muscle and brain that isimportant in sustained exercise. In Advances inMyochemistry (ed. G. Benzi), pp. 127–133. JohnLibbey Eurotext, London.
Olds, M.E. & Fobes, J.L. (1981) The central basis of moti-vation: intracranial self-stimulation studies. AnnualReviews of Psychology 32, 23–74.
Owasoyo, J.O., Neri, D. & Lamberth, J.G. (1992) Tyrosine and its potential use as a contermeasure toperformance decrement in military sustained opera-tions. Aviation and Space Environmental Medicine 63,364–369.
Samii, A., Wasserman, E.M., Ikoma, K., Mercuri, B. &Hallett, M. (1996) Characterization of postexercisefacilitation and depression of motor evoked poten-tials to transcranial magnetic stimulation. Neurology46, 1376–1382.
Sandage, B.W., Sabounjian, L., White, R. & Wurtman,R.J. (1992) Choline citrate may enhance athletic per-formance. Physiologist 35, 236.
Schwarzberg, H. & Roth, N. (1989) Increased locomotoractivity of rats by self-stimulation in a runningwheel. Physiological Behavior 46, 767–769.
Shukitt-Hale, B., Stillman, M.J. & Leiberman, H.R.(1996) Tyrosine administration prevents hypoxia-induced decrements in learning and memory. Physiological Behavior 59, 867–871.
Soubrie, P., Reisine, T.D. & Glowinski, J. (1984) Func-tional aspects of serotonin transmission in the basal ganglia: a review and an in vivo approachusing push-pull cannula technique. Neuroscience 13,605–625.
Spector, S.A., Jackman, M.R., Sabounjian, L.A., Sakkas,C., Landers, D.M. & Willis, W.T. (1995) Effect ofcholine supplementation on fatigue in trained
cyclists. Medicine and Science in Sports and Exercise 27,668–673.
Taylor, J.L., Butler, J.E., Allen, G.M. & Gandevia, S.(1996) Changes in motor cortical excitability duringhuman muscle fatigue. Journal of Applied Physiology490, 519–528.
van Hall, G., Raaymakers, J.S.H., Saris, W.H.M. &Wagenmakers, A.J.M. (1995) Ingestion of branched-chain amino acids and tryptophan during sustainedexercise-failure to affect performance. Journal ofApplied Physiology 486, 789–794.
Varnier, M., Sarto, P. & Martines, D. (1994) Effect ofinfusing branched-chain amino acid during incremental exercise with reduced muscle glycogencontent. European Journal of Applied Physiology 69,26–31.
Verger, P.H., Aymard, P., Cynobert, L., Anton, G. &Luigi, R. (1994) Effects of administration ofbranched-chain amino acids vs. glucose during acuteexercise in the rat. Physiological Behavior 55, 523–526.
Wagenmakers, A.J.M., Coakley, J.H. & Edwards, R.H.T.(1990) Metabolism of branched-chain amino acidsand ammonia during exercise: clues from McArdle’sdisease. International Journal of Sports Medicine 11,S101–S113.
Welsh, R.S., Waskovich, M., Alderson, N.L. & Davis,J.M. (1997) Carbohydrate and branched-chain aminoacid feedings suppress brain 5-HT during prolongedexercise. Medicine and Science in Sports and Exercise 29,S192.
Wilson, W.M. & Maughan, R.J. (1992) Evidence for apossible role of 5-hydroxytryptamine in the genesisof fatigue in man: administration of paroxetine, a 5-HT re-uptake inhibitor, reduces the capacity toperform prolonged exercise. Experimental Physiology77, 921–924.
nutrition, neurotransmitters and cns fatigue 183

Introduction
In the search for strategies to improve athleticperformance, recent interest has focused onseveral nutritional procedures which may, theoretically, promote fatty acid (FA) oxidation,attenuate the rate of muscle glycogen utilizationand improve exercise capacity (for reviews, seeChapter 14 and Lambert et al. 1997; Hawley et al.1998). The aim of this chapter is to provide thereader with a general overview of the role ofendogenous fat as an energy source for muscularcontraction, to discuss the effects of exerciseintensity and duration on the regulation of fatmetabolism, and to give a synopsis of some of thefactors which may potentially limit FA mobiliza-tion, uptake and oxidation by human skeletalmuscle during exercise.
Fat as an energy source for physical activity
The human body utilizes carbohydrate (CHO),fat and, to a lesser, extent protein as fuel for mus-cular work. Fat as an energy source has severaladvantages over CHO: the energy density of fat is higher (37.5 kJ · g–1 (9 kcal ·g–1) for stearicacid vs. 16.9kJ · g–1 (4 kcal · g–1) for glucose), there-fore the relative weight as stored energy is lower.FAs provide more adenosine triphosphate (ATP)per molecule than glucose (147 vs. 38 ATP).However, in order to produce the equivalentamount of ATP, the complete oxidation of FArequires more oxygen than the oxidation of CHO
(6 vs. 26molecules of oxygen per molecule ofsubstrate for the complete oxidation of glucoseand stearic acid, respectively). Using CHO as afuel, 21kJ (5kcal) of energy are available for each litre of oxygen used, whereas only 19.7 kJ(4.7 kcal) per litre of oxgyen are available whenfat is the sole fuel oxidized: this may be impor-tant when the oxygen supply is limited.
On the other hand, for every gram of CHOstored as glycogen, approximately 2 g of waterare stored (Holloszy 1990). Consequently, theamount of glycogen stored in muscle and liver islimited to about 450 g in an average-sized adult.Of interest is that although skeletal muscle com-prises up to 40% of body mass in well-trainedindividuals, CHO utilization by muscle in theresting or postabsorptive state is minimal,accounting for less than 10% of total glucoseturnover (Felig & Wahren 1975).
Fat can be stored in much greater amounts. In ahealthy, untrained male, up to 20 kg of fat can bestored, mainly in adipose tissue: in the obeseindividual, the fat store may exceed 100kg. Evenin highly trained athletes with much lower levelsof adipose tissue, endogenous fat stores still farexceed the requirements of all athletic pursuits.
Both FA stored in adipose tissue and fat enter-ing the circulation after a meal can serve aspotential energy sources for the muscle cell (Fig.13.1). For humans ingesting a typical Westerndiet (approximately 35% of energy from fat), FAsare comprised of approximately 40% oleate, 25%palmitate, 15% stearate and 10% linoleate. Theremainder is thought to be a mixture of both
Chapter 13
Fat Metabolism during Exercise
JOHN A. HAWLEY, ASKER E. JEUKENDRUP AND FRED BROUNS
184

saturated and unsaturated FAs with chainlengths of 12–20 carbon atoms (Havel et al. 1964).
Small but physiologically important amountsof FA are also stored as triacylglycerols (TG)inside the muscle cells: the total muscle massmay contain up to 300g of fat of which the majorpart is stored within the myocyte as small lipiddroplets (Björkman 1986). FAs liberated from TGstored in adipocytes are released to blood, wherethey are bound to albumin. The albumin concen-tration of blood is about 6 mm, while the concen-tration of FA is about 0.2–1.0mm. As albumin canbind up to eight FAs, the albumin transportcapacity is far in excess of the amount of FAsbound under physiological circumstances andtherefore cannot be the limiting factor for FA oxi-dation by muscle.
FA can also be derived from the triacylglycerolcore of circulating chylomicrons and very lowdensity lipoproteins (VLDL), which are bothformed from dietary fat in the postabsorp-tive state. Chylomicrons are formed in theepithelial wall of the intestine and reach theblood stream after passage through the lym-phatic system. VLDLs are synthesized in theliver after which they are released directly intothe blood stream.
Effects of exercise intensity andduration of fat metabolism
More than 50 years ago, Christensen and Hansen(1939) provided evidence from respiratory gasexchange measurements that fat was a major fuel for exercise metabolism. Since that time, anumber of investigations have provided evi-dence that plasma FAs contribute a significantportion to the energy demands of mild-to-moderate exercise. However, until recently therates of whole-body lipolysis had only been mea-sured during very low-intensity exercise, and inuntrained or moderately active individuals.
Our understanding of the regulation ofendogenous fat and CHO metabolism in relationto exercise intensity and duration has beenadvanced considerably by modern-day studieswhich have used a combination of stable isotopetechniques in association with conventional indi-rect calorimetry (Romijn et al. 1993, 1995; Sidossis& Wolfe 1996; Siddossis et al. 1996, 1997). As thethree most abundant FAs are oxidized in propor-tion to their relative presence in the total plasmaFA pool (Havel et al. 1964), total plasma FA kinet-ics can be reliably estimated from stable isotopestudies using infusions of either palmitate oroleate (when the concentrations of total FAs and
fat metabolism during exercise 185
Adipose tissue Blood plasma Muscle
Triacylglycerol(210 000 kJ)
FFA
Glycerol
FFA
FFA
Albumin FFA Fatty acids
Intramuscular TG(12 600 kJ)
Glycogen(c. 8400 kJ)
MitochondriaAcetyl-CoA
TCA cycle andelectron transport
ATPEnergy
O2
Glucose(420 kJ)
Fig. 13.1 The storage andmobilization of peripheraladipose and intramusculartriacylglycerol (TG). TG fromperipheral adipose tissue can bebroken down to glycerol and freefatty acids (FFAs). FFAs can bemobilized by binding to plasmaalbumin for transport into thesystemic circulation to skeletalmuscle. Intramuscular TG canalso be broken down to glycerolplus fatty acids, which can enterthe mitochondria for oxidationduring exercise. TCA,tricarboxylic acid. From Coyle(1997), with permission.

palmitate and oleate are known). Palmitate is asaturated 16-C FA (CH3(CH2)14COOH) whosekinetics closely resemble those of most otherlong-chain FAs (Havel et al. 1964). As such, therate of appearance (Ra) of palmitate gives anindex of the release of FAs into the plasma. TheRa of glycerol, on the other hand, gives an indexof whole-body lipolysis. Rates of total fat andCHO oxidation are determined by indirectcalorimetry. The use of these methods hasallowed estimates to be made of the rates of lipidkinetics, including the contribution to energyexpenditure from peripheral lipolysis occurringin the adipocytes and from intramuscular lipolysis.
During low-intensity exercise (25% of maxi-mum oxygen uptake (V
.o2max.)), peripheral lipo-
lysis is strongly stimulated, with little lipolysis ofintramuscular TG (Fig. 13.2). Similarly, CHO oxi-dation appears to be met exclusively by bloodglucose with little or no muscle glycogen utiliza-tion. Ra of FA into the plasma and their oxidationare highest during exercise at 25% of V
.o2max., and
decline progressively as the exercise intensity
186 nutrition and exercise
increases. Conversely, although intramuscularTG (and glycogen) do not contribute signifi-cantly to energy production during low-intensitywork, fat oxidation is highest during exercise atabout 65% of V
.o2max. (Fig. 13.2). At this intensity,
lipolysis in both peripheral adipocytes and intra-muscular TG stores attains its highest rates, andthese two sources contribute about equally to therate of total fat oxidation. With an increase in exercise intensity to 85% of V
.o2max., total fat
oxidation falls. This is mainly due to a suppres-sion in the Ra of FA into the plasma, presumablycaused by the increases in circulating plasma catecholamines, which stimulate muscleglycogenolysis and glucose uptake. Lipolysis ofintramuscular TG does not increase substantiallywith an increase in exercise intensity from 65% to 85% of V
.o2max., indicating that lipolysis of
peripheral adipose tissue and lipolysis of intra-muscular TG are regulated differently. Furtherevidence for this hypothesis comes from studieswhich have increased FA delivery (by intra-venous infusion of lipid and heparin) duringintense (85% of V
.o2max.) exercise in well-trained
subjects (Romijn et al. 1995). These data revealthat even when plasma FA concentration is artifi-cially maintained above 1 mm, this only partlyrestores fat oxidation to those (higher) levels seenat more moderate intensity (65% of V
.o2max.) exer-
cise. Taken collectively, these observations indi-cate that factors other than FA availability playan important role in the regulation of FA oxida-tion during high-intensity exercise (see followingsections).
With regard to the effects of exercise durationon fat metabolism, there is little change in eitherthe rates of total fat or total CHO oxidation after 2h compared with the first 30 min of exercise at25% of V
.o2max.. However, at an intensity of 65% of
V.o2max., there is a progressive increase in the Ra
of FA into the plasma (and presumably their oxi-dation) and glucose availability over time. After2h of cycling at this intensity, there is no changein either the rates of total fat and total CHO oxi-dation compared with the situation after 30minof exercise. Thus, it is likely that the contributionof intramuscular substrates (TG and glycogen)
Ener
gy e
xpen
ditu
re (J
. kg–1
. min
–1)
25
Intensity (% VO2max)
65 85
1400
1200
1000
800
600
400
200
0
Muscle glycogen
Muscle triglyceride
Plasma FFA
Plasmaglucose
.
Fig. 13.2 The maximal contribution to energyexpenditure from endogenous fat and carbohydrate,expressed as a function of increasing exercise intensity.FFA, free fatty acids; V
.o2max., maximal oxygen uptake.
From Romijn et al. (1993), with permission from theAmerican Physiological Society.

to total energy expenditure decreases with in-creasing exercise duration during prolonged (> 90min) moderate-intensity (65% of V
.o2max.)
exercise.
Factors limiting fat oxidation by muscle
Factors limiting fatty acid uptake by muscle cells
As previously discussed, the metabolism of FAderived from adipose tissue lipolysis constitutesa major substrate for oxidative metabolism, espe-cially during prolonged, low-intensity exercise.The metabolism of long-chain FA is a complexand integrated process that involves a number ofevents: FA mobilization from peripheral adiposetissue, transport in the plasma, transport andpermeation across muscle cell membranes andinterstitium, cytoplasmic transport, and intracel-lular metabolism. The first stage in this process,the mobilization of lipids, plays a key role in thesubsequent regulation of FA utilization duringboth the resting state and exercise.
During perfusion of the muscle capillaries, FAbound to albumin or stored in the core of chy-lomicrons and VLDL have to be released prior totransport across the vascular membrane. In thecase of VLDL and chylomicrons, this is achievedby the action of the enzyme lipoprotein lipase(LPL). LPL is synthesized within the muscle cell and, after an activation process, is translo-cated to the vascular endothelial cell membranewhere it exerts its enzymatic action on TG. LPL also expresses phospholipase A2 activitywhich is necessary for the breakdown of thephospholipid surface layer of the chylomicronsand lipoproteins.
LPL activity is upregulated by caffeine, cate-cholamines and adrenocorticotrophic hormone(ACTH), and downregulated by insulin (forreview, see Jeukendrup 1997). After TG hydroly-sis, most of the FA will be taken up by muscle,whereas glycerol will be taken away via thebloodstream to the liver, where it may serve as a gluconeogenic precursor. During the postab-
sorptive state, the concentration of circulatingTG in plasma is usually higher than that of FA, incontrast to the fasting state when chylomicronsare practically absent from the circulation. Nevertheless, the quantitative contribution ofcirculating TG to FA oxidation by the exercisingmuscle cells in humans is somewhat uncertain.Due to technical limitations, no reliable data areavailable to determine whether FA derived fromthe TG core of VLDL or chylomicrons sub-stantially contribute to overall FA utilization.However, it is interesting to note that even asmall extraction ratio of the order of 2–3% ofFA/TG could potentially cover over up to 50% of total exogenous FA uptake and subsequentoxidation (Havel et al. 1967).
The arterial concentration of FA stronglyaffects FA uptake into muscle both at rest andduring low-intensity exercise (for review, seeBulow 1988). This implies an FA gradient fromblood to muscle in these conditions, which isachieved by a relatively rapid conversion of FA,taken up by the muscle cell, to fatty acyl-CoA.The rate of the latter reaction step is controlled byfatty acyl-CoA synthetase. During transport ofFA from blood to muscle, several barriers maylimit FA uptake, including the membranes of thevascular endothelial cell, the interstitial spacebetween endothelium and muscle cell, andfinally the muscle cell membrane (for review, seevan der Vusse & Reneman 1996).
Uptake by endothelial cells is most likelyprotein mediated. Both albumin-binding proteinand membrane-associated FA-binding proteins(FABP) may play a role. After uptake, most FAswill diffuse from the luminal to the abluminalmembrane of the endothelial cells as free mole-cules. Although small amounts of FABP arepresent at this site, their role in transmembraneFA transport is assumed to be unimportant. Oncein the interstitial space, albumin will bind theFAs for transport to the muscle cell membrane.Here the FAs are taken over by a fatty-acid-transporting protein, or will cross the membranedirectly because of their lipophilic nature. In thesarcoplasm, FABP, which is present in relativelyhigh concentrations, is crucial for FA transport to
fat metabolism during exercise 187

the mitochondria. This transport is assumed notto ultimately limit FA oxidation.
As indicated earlier, an alternative source ofFA are TGs present inside the skeletal musclecells. For the storage of FA, glycerol is obtainedfrom glycolysis (as glycerol-3-phosphate) whichreacts with fatty acyl-CoA, after which furthercondensation to and storage as TG take place insmall fat droplets, mainly located in the proxim-ity of the mitochondrial system. It has been suggested that adipocytes, positioned betweenmuscle cells may also supply FA for oxidation,although the physiological significance of thishas never been accurately quantified. Duringperiods of increased muscle contractile activity,muscle lipase is activated by hormonal actionswhich leads to the release of FA from the intra-muscular TG. Noradrenaline infusion has beenobserved to cause a significant reduction inmuscle TG, and insulin counteracts this effect.Apart from hormonal stimuli, there is also localmuscular control of lipase activity, shown by theobservation that electrical stimulation of muscleenhances TG breakdown.
Compared to fast twitch (type II) muscle fibres,slow twitch (type I) fibres have a high lipaseactivity (Gorski 1992) as well as TG content(Essen 1977). Interestingly, TG storage within themuscle cell can be increased by regularendurance training (Morgan et al. 1969; Howaldet al. 1985; Martin 1996). However, whereas somestudies report an increased utilization of intra-muscular triacylglycerol after endurance train-ing (Hurley et al. 1986; Martin et al. 1993),others (Kiens 1993) find no change. These conflicting results may simply be a reflection ofthe different type of exercise modes employed(cycling vs. dynamic knee-extension exercise),which result in marked differences in circulatingcatecholamine levels. On the other hand, aninability to detect exercise-induced perturba-tions in intramuscular TG content does notexclude the possibility that while FAs are beinghydrolysed from the intramuscular TG pool, TGis also being synthesized, with the net result thatthere is no change in concentration (Turcotte et al.
188 nutrition and exercise
1995). If indeed the intramuscular TG pool is in astate of constant turnover, a net decline in storeswould only be observed when the rate of utiliza-tion of intramuscular TG is greater than the rateof TG synthesis.
Factors limiting fatty acid oxidation by muscle cells
As previously discussed, a relatively high per-centage of the total energy production is derivedfrom FA oxidation at rest and during low-intensity exercise. However, with increasingexercise intensities, particularly above 70–80% ofV.o2max., there is a progressive shift from fat to
CHO (Gollnick 1985), indicating a limitation tothe rate of FA oxidation. Several explanations forthis shift from fat to CHO have been proposed,including an increase in circulating cate-cholamines, which stimulates glycogen break-down in both the muscle and liver. However, theincreased lactate formation (and accompanyinghydrogen ion accumulation) which occurs whenglycogen breakdown and glycolytic flux areincreased also suppresses lipolysis. The netresult will be a decrease in plasma FA concentra-tion and hence in the supply of FA to musclecells. As a consequence, enhanced CHO oxida-tion will most likely compensate for the reducedFA oxidation.
Another reason for this substrate shift is thelower ATP production rate per unit of time fromfat compared with that from CHO, combinedwith the fact that more oxygen is needed for theproduction of any given amount of ATP from fatthan from CHO, as previously noted. Finally,limitations in the FA flux from blood to mito-chondria might explain the shift from fat to CHO at higher exercise intensities. This flux isdependent on the concentration of FA in theblood, capillary density, transport capacityacross vascular and muscle cell membranes,mitochondrial density and mitochondrial capac-ity to take up and oxidize FA. The latter dependson the action of the carnitine transport systemacross the mitochondrial membrane which is

regulated by malonyl-CoA (Winder et al. 1989).During exercise, malonyl-CoA formation isreduced and therefore the capacity to transportFAs across the mitochondrial inner membrane isenhanced.
The rate of oxidation of FA is the result of threeprocesses:1 Lipolysis of TG in adipose tissue and circulat-ing TG and transport of FA from blood plasma tothe sarcoplasm.2 Availability and rate of hydrolysis of intramus-cular TG.3 Activation of the FA and transport across themitochondrial membrane.It is likely that the first two processes pose theultimate limitations to fat oxidation observedduring conditions of maximal FA flux. This ismost evident during both short-term intenseexercise or during the initial phase of a long-termexercise. In this condition, lipolysis in adiposetissue and in muscle TG is insufficiently upregu-lated to result in enhanced FA supply. The resultwill be that the rate of FA oxidation exceeds therate at which FAs are mobilized, leading to a fallin plasma FAs and intracellular FAs in muscle. Asa consequence, the use of CHO from glycogenmust be increased to cover the increased energydemand.
Direct evidence that the rate of FA oxidationcan be limited by a suppression of lipolysis, atleast during low-to-moderate intensity (44% ofV.o2max.) exercise, comes from a recent investiga-
tion by Horowitz et al. (1997). They showed thatCHO ingestion (0.8g · kg–1 body mass) beforeexercise, which resulted in a 10–30mU·ml–1
elevation in plasma insulin concentration, wasenough to reduce fat oxidation during exercise,primarily by a suppression of lipolysis. They alsoshowed that fat oxidation could be elevated (byabout 30%) when plasma FA concentration wasincreased via Intralipid and heparin infusion,even when CHO was ingested. However, theincrease in lipolysis was not sufficient to restorefat oxidation to those levels observed afterfasting. Taken collectively, these results suggestthat CHO ingestion (and the concomitant eleva-
tion in plasma insulin concentration) has another(additional) effect on reducing the rates of FAoxidation by exercising skeletal muscle.
Conclusion
In contrast to body CHO reserves, fat stores areabundant in humans and represent a vast sourceof fuel for exercising muscle. FAs stored both inperipheral adipose tissue and inside the musclecells serve as quantitatively important energysources for exercise metabolism. During low-intensity work (25% of V
.o2max.), plasma FA liber-
ated from adipose tissue represents the mainsource of fuel for contracting muscle, with littleor no contribution from intramuscular lipolysisto total energy metabolism. On the other hand,during moderate-intensity exercise (65% ofV.o2max.), fat metabolism is highest, with the con-
tribution of lipolysis from peripheral adipocytesand of intramuscular TG stores contributingabout equally to total fat oxidation. During high-intensity exercise (85% of V
.o2max.), there is a
marked reduction in the rate of entry of FA intothe plasma, but no further increase in intramus-cular TG utilization. At such workrates, muscleglycogenolysis and the accompanying increasedlactate concentration suppress the rates ofwhole-body lipolysis.
The major hormonal changes which promotelipolysis during exercise are an increase in cate-cholamine concentration and a decline in insulinlevels, both of which facilitate activation of LPL.The rate of FA oxidation is also regulated indi-rectly by the oxidative capacity of the workingmuscles and the intramuscular concentration of malonyl-CoA. The muscle tissue level ofmalonyl-CoA is dependent on the prevailingconcentrations of plasma glucose and insulin:elevated circulating levels of these two com-pounds is associated with elevated concentra-tions of malonyl-CoA. Any increase in glycolyticflux therefore may directly inhibit long-chain FAoxidation, possibly by inhibiting its transportinto the mitochondria (Sidossis & Wolfe 1996;Sidossis et al. 1996; Coyle et al. 1997).
fat metabolism during exercise 189

References
Björkman, O. (1986) Fuel utilization during exercise. In Biochemical Aspects of Physical Exercise (ed. O.Björkman), pp. 245–260. Elsevier, Amsterdam.
Bulow, J. (1988) Lipid mobilization and utilization. InPrinciples of Exercise Biochemistry: Medicine and SportsScience (ed. J.R. Poortmans), pp. 140–163. Karger,Basel.
Christensen, E.H. & Hansen, O. (1939) Respiratorischerquotient und O2-aufnahme (Respiratory quotientand O2 uptake). Scandinavian Archives of Physiology81, 180–189.
Coyle, E.F. (1997) Fuels for sport performance. In Per-spectives in Exercise Science and Sports Medicine. Vol.10. Optimizing Sport Performance (ed. D.R. Lamb & R.Murray), pp. 95–137. Cooper Publishing, Carmel, IN.
Coyle, E.F., Jeukendrup, A.E., Wagenmakers, A.J.M. &Saris, W.H.M. (1997) Fatty acid oxidation is directlyregulated by carbohydrate metabolism during exer-cise. American Journal of Physiology 273, E268–E275.
Essen, B. (1977) Intramuscular substrate utilizationduring prolonged exercise. In The Marathon: Physio-logical, Medical, Epidemiological, and PsychologicalStudies (ed. P. Milvy), pp. 30–44. New York Academyof Sciences, New York.
Felig, P. & Wahren, J. (1975) Fuel homeostasis in exer-cise. New England Journal of Medicine 293, 1078–1084.
Gollnick, P.D. (1985) Metabolism of substrates: energysubstrate metabolism during exercise and as modi-fied by training. Federation Proceedings 44, 353–357.
Gorski, J. (1992) Muscle triglyceride metabolismduring exercise. Canadian Journal of Physiology andPharmacology 70, 123–131.
Havel, R.J., Carlson, L.A., Ekelund, L.G. & Holmgren,A. (1964) Turnover rate and oxidation of differentfatty acids in man during exercise. Journal of AppliedPhysiology 19, 613–619.
Havel, R.J., Pernow, B. & Jones, N.L. (1967) Uptake andrelease of free fatty acids and other metabolites in thelegs of exercising men. Journal of Applied Physiology23, 90–99.
Hawley, J.A., Brouns, F. & Jeukendrup, A.E. (1998)Strategies to enhance fat utilisation during exercise.Sports Medicine 25, 241–257.
Holloszy, J.O. (1990) Utilization of fatty acids duringexercise. In Biochemistry of Exercise. Vol. VII (ed. A.W.Taylor, P.D. Gollnick & H.J. Green et al.), pp. 319–327.Human Kinetics, Champaign, IL.
Horowitz, J.F., Mora-Rodriguez, R., Byerley, L.O. &Coyle, E.F. (1997) Lipolytic suppression followingcarbohydrate ingestion limits fat oxidation duringexercise. American Journal of Physiology 273, E768–E775.
190 nutrition and exercise
Howald, H., Hoppeler, H. & Claassen, H. (1985) Influ-ences of endurance training on the ultrastructuralcomposition of the different muscle fiber types inhumans. Pflugers Archives 403, 369–376.
Hurley, B.F., Nemeth, P.M., Martin, W.H., Hagberg,J.M., Dalsky, G.P. & Holloszy, J.O. (1986) Muscletriglyceride utilization during exercise: effect oftraining. Journal of Applied Physiology 60, 562–567.
Jeukendrup, A.E. (1997) Fat metabolism during exer-cise, a review. In Aspects of Carbohydrate and FatMetabolism, pp. 21–71. De Vrieseborch: Haarlem.
Kiens, B., Essen-Gustavsson, B., Christensen, N.J. &Saltin, B. (1993) Skeletal muscle substrate utilisationduring submaximal exercise in man: effect ofendurance training. Journal of Physiology (London)469, 459–478.
Lambert, E.V., Hawley, J.A., Goedecke, J., Noakes, T.D.& Dennis, S.C. (1997) Nutritional strategies for promoting fat utilization and delaying the onset offatigue during prolonged exercise. Journal of SportsScience 15, 315–324.
Martin, W.H. (1996) Effects of acute and chronic exer-cise on fat metabolism. In Exercise and Sports ScienceReviews, Vol. 24 (ed. J.O. Holloszy), pp. 203–231.Williams & Wilkins, Baltimore.
Martin, W.H., Dalsky, G.P. & Hurley, B.F. (1993) Effectof endurance training on plasma free fatty acidturnover and oxidation during exercise. AmericanJournal of Physiology 265, E708–E714.
Morgan, T.E., Short, F.A. & Cobb, L.A. (1969) Effect oflong-term exercise on skeletal muscle lipid composi-tion. American Journal of Physiology 216, 82–86.
Romijn, J.A., Coyle, E.F., Sidossis, L.S. et al. (1993) Regu-lation of endogenous fat and carbohydrate metabo-lism in relation to exercise intensity and duration.American Journal of Physiology 265, E380–E391.
Romijn, J.A., Coyle, E.F., Sidossis, L.S., Zhang, X.J. &Wolfe, R.R. (1995) Relationship between fatty aciddelivery and fatty acid oxidation during strenuousexercise. Journal of Applied Physiology 79, 1939–1945.
Sidossis, L.S. & Wolfe, R.R. (1996) Glucose and insulin-induced inhibition of fatty acid oxidation: theglucose fatty-acid cycle reversed. American Journal ofPhysiology 270, E733–E738.
Sidossis, L.S., Stuart, C.A., Schulman, G.I., Lopaschuk,G.D. & Wolfe, R.R. (1996) Glucose plus insulin regu-late fat oxidation by controlling the rate of fatty acidentry into the mitochondria. Journal of Clinical Investi-gation 98, 2244–2250.
Sidossis, L.S., Gastaldelli, A., Klien, S. & Wolfe, R.R.(1997) Regulation of plasma free fatty acid oxidationduring low- and high-intensity exercise. AmericanJournal of Physiology 272, E1065–E1070.
Turcotte, L.P., Richter, E.A. & Kiens, B. (1995) Lipidmetabolism during exercise. In Exercise Metabolism
(ed. M. Hargreaves), pp. 99–130. Human Kinetics,Champaign, IL.
van der Vusse, G.J. & Reneman, R.S. (1996) Lipidmetabolism in muscle. In Handbook of Physiology.Section 12. Exercise: Regulation and integration of multi-ple systems (ed. L.B. Rowell & J.T. Shepherd), pp.
952–994. American Physiological Society, OxfordPress, New York.
Winder, W.W., Arogyasami, J., Barton, R.J., Elayan, I.M.& Vehrs, P.R. (1989) Muscle malonyl-CoA decreasesduring exercise. Journal of Applied Physiology 67,2230–2233.
fat metabolism during exercise 191
Historical perspective
It is known from practical experience, obtainedfrom the large number of polar expeditionsoccurring from the middle of the last century,that the dietary intake of indigenous people andtheir domestic animals (sledge dogs) had a veryhigh fat content. As early as 1908, August andMarie Krogh studied the metabolism of theGreenland Eskimo where food consumption wascalculated, based on observations made by theDanish explorer Rink in 1855 (Krogh & Krogh1913). Despite such a fat-rich diet, these indig-enous people and their dogs seemed to main-tain normal work capacity and normal bodyfunction.
In the laboratory, several groups of scientistsfrom the turn of the century have tried to eluci-date what substrate is oxidized in muscle duringexercise. Short-term dietary changes, mostly to fat-rich and carbohydrate-rich diets, wereapplied. Zuntz et al. (1901) demonstrated thatrespiratory quotient (RQ) values during mildexercise after a fat-rich diet were of a magnitudethat suggested an almost exclusive oxidation of fat. This was later supported by Krogh andLindhard (1920) and Marsh and Murlin (1928). In the studies by Krogh and Lindhard (1920), the subjects were asked to describe their foodintake and the perception of daily living choresand exercise sessions while eating a fat-rich or acarbohydrate-rich diet for 3–5 days. The subjectsalmost uniformly described that exercise wasperformed easily after consumption of the carbo-
hydrate diet, while exercise was performed withsevere difficulty after consumption of the fat diet.Krogh and Lindhard (1920) also demonstratedthat the muscular efficiency, measured on aKrogh bicycle ergometer positioned within aJaquet respiration chamber, was some 10–11%more effective while carbohydrates were oxi-dized than while fat was oxidized. These find-ings were later supported by Hill (1924) andMarsh and Murlin (1928).
The work by Christensen and Hansen (1939)revealed a lower respiratory exchange ratio(RER) during exercise and a shorter enduranceperformance time at a submaximal exerciseintensity after 3–5 days’ adaptation to a fat dietthan after 3–5 days’ adaptation to a carbohydratediet. Thus, interest in the influence of diet onwork capacity is not new, but during the last 50years, focus has mainly been on the role ofdietary carbohydrates for enhancing physicalperformance. However, because athletes todayparticipate in physically demanding events ofever-increasing duration, it has been speculatedwhether habitually eating a high-fat diet couldprovide some of the adaptations that are pro-duced by habitual physical exercise and thusimprove physical performance.
Endurance performance in rats
In animals, the effect of adaptation to a fat-richdiet on endurance performance has mostly beeninvestigated in rodents and less often in dogs andother animals. Studies in rats adapted to a
Chapter 14
Adaptations to a High Fat Diet
BENTE KIENS AND JØRN W. HELGE
192
fat-rich diet have shown a positive effect onendurance performance. However, in moststudies, fat-rich diets that are practically carbo-hydrate free have been used. For instance, in thestudy by Miller et al. (1984), endurance perfor-mance was evaluated after rats were exposed to adiet consisting of 78% of total energy intake (E%)as fat, 1 E% carbohydrate and 15 E% protein, or a diet containing 69 E% carbohydrate, 11 E% fat and 20 E% protein for 1 and 5 weeks. Theydemonstrated that rats ran for a longer time afteradaptation to the fat diet than on the normal dietalready after only 1 week’s adaptation to the diet(45 ±5 min vs. 42 ±4 min) and this difference waseven larger after 5 weeks’ adaptation (47±4 minvs. 35 ±3 min). These findings are in contrast to those of Conlee et al. (1990), who reportunchanged endurance performance time whenrats had been exposed for 4–5 weeks to either afat- or carbohydrate-rich diet, similar in compo-sition to those diets utilized in the study byMiller et al. (1984). In both of these studies, train-ing status of the rats was not altered during thedietary intervention period. However, if bothtraining and a fat diet induce adaptations thatincrease the fat oxidative capacity, then it mightbe reasoned that combining the two interven-tions could result in an additive effect and in turncould optimize endurance capacity. In the studyby Simi et al. (1991), where 12 weeks of training in combination with the intake of either a fat-rich diet (no carbohydrates included) or a carbohydrate-rich diet (no fat included), rats ranfor a longer time after adaptation to training andthe fat-rich diet than those on a carbohydrate-rich diet. Rats fed the carbohydrate diet were allexhausted before 7h of exercise, whereas half ofthe fat-fed rats had to be stopped after 7.5h ofrunning before becoming exhausted. However,in that study untrained rats fed the fat-rich dietalso ran longer (68±5 min) than those fed the car-bohydrate diet (42±4 min).
In the study by Lapachet et al. (1996), rats weretrained 5 days per week, for 2 h at a time on atreadmill for 8 weeks while fed either a fat diet(79 E% fat, 0 E% carbohydrates) or a carbohy-drate diet (69 E% carbohydrates, 10 E% fat). They
found a 31% longer endurance performance timein the fat-adapted rats than in the rats adapted tothe carbohydrate diet.
In summary, it appears that endurance perfor-mance time in rats is not shorter but mostlylonger in fat-fed than in carbohydrate-fed rats,both in rats adapted to training and in sedentaryrats. In these studies, the fat diets contained nocarbohydrates and a very high proportion of fat.In a recent study, however, findings demon-strated that after 4 weeks of training and ad-aptation to a fat-rich diet containing 15 E%carbohydrates, endurance performance was sim-ilarly enhanced compared with that of rats whichhad been exposed to a carbohydrate-rich diet(Helge et al. 1998). This study demonstrated noeffect of dietary composition on exercise time toexhaustion in either sedentary (mean runningtime to exhaustion, 50±3 min) or trained rats (153 ±8 min). In the study by Tollenar (1976),similar findings were obtained. In that study, ratswere initially fed a stock diet for 4 months, fol-lowed by 3 weeks on a 40 E% fat diet. Then therats were trained on a treadmill for 16 weekswhile fed ad libitum one of three different dietsconsisting of 20 E%, 40 E% or 70 E% of fat. Datarevealed that dietary fat content had no effect onrunning time to exhaustion. These findings leadto the conclusion that the relative proportion ofcarbohydrate–fat content in the diet is of signifi-cance in the adaptation to dietary fat and thus on running time to exhaustion in rats. Enhancedperformance is apparently only observed when the fat-rich diet is virtually free from carbohydrates.
An interesting idea to investigate is whetherprolonged exposure to a fat-rich diet followed bybrief exposure to a carbohydrate-rich diet per secould improve endurance performance further.The reasoning behind such a speculation is that aprolonged fat-diet regimen might induce a high-fat oxidative capacity. Then after switching to acarbohydrate-rich diet, muscle glycogen storesare maximized and thus the muscle is providedwith both a high-fat oxidative capacity and withlarge muscle glycogen stores. This approach wasfirst addressed by Conlee et al. (1990), who inves-
adaptations to a high fat diet 193

tigated whether animals adapted to a prolongedhigh-fat diet could tolerate a second bout of exer-cise following 3 days of recovery consuming acarbohydrate-rich diet compared with animalsadapted to a prolonged high-carbohydrate dietafter consuming a fat-rich diet. Even thoughConlee and co-workers (1990) found that fat-fedrats ran equally long as carbohydrate-fed rats,switching the diet for the last 3 days resulted inbetter endurance performance by fat-adaptedanimals switched to the carbohydrate diet for 3days than carbohydrate-fed animals continuedon the carbohydrate diet for 3 more days. Also, inthe study by Lapachet et al. (1996), when trainingwas combined with diet for 8 weeks, rats ranapproximately 40% longer when the rats, after fatadaptation, switched to the carbohydrate diet for3 days than when the rats were fed only a carbo-hydrate diet. Thus, in rats endurance perfor-mance time was increased after prolonged fatadaptation and a subsequent brief exposure to acarbohydrate-rich diet.
In rats the literature reveals a fairly uniformpositive effect of fat-rich, virtually carbohydrate-free diet on endurance performance in rats,whereas there is an apparent discrepancy regard-ing the effect of dietary fats on endurance perfor-mance in man.
Endurance performance in man
It is well known from the classic literature thatincreasing the dietary fat relative to carbohy-drates results in increased fat and decreased carbohydrate utilization during submaximalexercise (Christensen & Hansen 1939). Thus, ithas been hypothesized that increasing the avail-ability of fatty acids for oxidation might increasethe oxidation of fat and spare carbohydrate andfurthermore increase performance. Due to thishypothesis, acute dietary and pharmacologicalmethods have been used to enhance the avail-ability of fatty acids for oxidation. In the study byGriffiths et al. (1996), eight subjects consumedeither a fat-rich meal (65 E% fat, 28 E% carbohy-drate, 7 E% protein) or a carbohydrate meal (2E% fat, 80 E% carbohydrate, 18 E% protein) and
194 nutrition and exercise
were followed over the next 6h, while resting.Prior to the fat meal the plasma concentration offree fatty acids (FFAs) amounted to 400mmol · l–1.One hour after ingestion of the fat meal, theplasma concentration of FFA had decreased to200mmol · l–1, whereafter plasma FFA increasedcontinuously to 500mmol · l–1 at 4 h and approxi-mately 550mmol · l–1 at 6 h. Thus, the intake of 80g fat, as in this study, was not associated withany particular increase in circulating fatty acidsduring the following 6h. Studies have estab-lished that glucose feeding prior to exercise pro-duces hyperglycaemia, inducing stimulation ofinsulin secretion, which in turn depresses theexercise-induced lipolysis and increases RQ,indicating an increased participation of carbohy-drates in the total energy expenditure. The ques-tion is whether fat feeding prior to exercisewould enhance the oxidation of fat at theexpense of carbohydrate during exercise. Thisquestion was addressed in the study by Satabinet al. (1987). Nine trained male subjects eitherwere fasting or ingested a pre-exercise meal (1.7 MJ, 400kcal) 1 h prior to a submaximal exer-cise test (60% of V
.o2max.) to exhaustion. The meals
contained either medium-chain triacylglycerols,long-chain triacylglycerols or glucose. Duringexercise, plasma insulin concentrations weredecreased in all conditions. The FFA concentra-tions were increased similarly after the two lipidmeals and in the fasting situation and markedlyhigher than that in the glucose trial, and RQ was significantly lower in the lipid trials and inthe fasting condition than in the glucose trial.Despite the enhanced fat oxidation during ex-ercise, after the consumption of a fat meal, no differences in endurance time (approximately110 min) between any of the four dietary trialswere seen. Also, in studies in which intralipid-heparin was infused during exercise, the avail-ability of fatty acids was markedly increased. Inthe study by Hargreaves et al. (1991), a sparing ofmuscle glycogen during exercise was not seen,whereas a decreased rate of glycogen degrada-tion was found in another study (Dyck et al.1993). Endurance performance was, however,not measured in any of these studies. Also, the

ingestion of caffeine appears to stimulate therelease of fatty acids from the fat stores, at least inwell-trained athletes, thus increasing the plasmaconcentration of FFA. However, studies haveprovided a conflicting picture of the effect onendurance performance in man (Spriet 1995).
With regard to all these attempts to increasethe plasma concentration of fatty acids, one mustbear in mind that during submaximal exerciseonly a small percentage (7–15%) of the arterialplasma FFA concentration is extracted (Turcotteet al. 1992). Moreover, from the literature it seemsas if there is a fairly linear relationship betweenFFA availability and FFA uptake and oxidationuntil a FFA concentration of approximately 700mmol · l–1. Beyond this concentration, nofurther uptake and oxidation of FFA appears innon-trained subjects despite a further increase incirculating FFA availability (Turcotte et al. 1992;Kiens et al. 1993). It seems, however, that the con-centration at which saturation occurs is some-what higher in trained subjects (Fig. 14.1) (Kienset al. 1993). By using stable isotopes, Romijn et al.(1995) evaluated the relationship between fattyacid availability and oxidation in six endurance-trained cyclists. They were studied during 30min of exercise at 84% of V
.o2max., on two differ-
ent occasions: once during a control trial whenplasma FFA concentrations were normally low(0.2–0.3 mmol · l–1) and again when plasma FFAconcentration was maintained between 1 and 2mmol · l–1 by intravenous infusion of lipid-heparin. In the control trial, total fat oxidationamounted to 27±3 mmol · kg–1 ·min–1. Eventhough the availability of FFA in the lipid-heparin infusion trial was increased severalfold,the total fat oxidation only increased to anaverage of 34 ±4 mmol ·kg–1 ·min–1 (Fig. 14.2).Thus, the contribution of fat oxidation to energyexpenditure increased from approximately 27%during control to approximately 35% duringlipid-heparin infusion (P<0.05).
Summarizing these findings, it appears that inthose studies in which the plasma FFAconcentra-tion was succesfully elevated, no clear effects onendurance performance were demonstrated. Areason for this could be that the FFA uptake
plateaus around 700–1000mmol · l–1. Anotherexplanation might be that increasing the fattyacid oxidation at a given power output is not ofimportance for endurance.
In dietary intervention studies lasting 3–5days, the prevailing concept is that enduranceperformance after consuming a carbohydrate-
adaptations to a high fat diet 195
200
150
100
50
–19
–270 60 120
Exercise (min)
FFA
up
take
(µm
ol. m
in–1
)
(b)
*
**†
0 60 120
*
*
**
**
**
**
Del
iver
y o
f FF
A (
µmo
l. min
–1)
(a)
3
2
1
0
Fig. 14.1 (a) Delivery of free fatty acids (FFA) (fattyacid concentration times plasma flow), and (b) netuptake of FFA during 2 h of dynamic knee-extensorexercise with either the non-trained (�) or theendurance-trained (�) thigh. *, P < 0.05 compared withresting values; **, P < 0.05 compared with previousmeasurements; †, P < 0.05 between non-trained andtrained. Adapted from Kiens et al. (1993).

rich diet is superior to that when a fat-rich diet is consumed. Thus, in the classic study by Christensen and Hansen from 1939, three trainedsubjects consumed either a fat-rich diet (contain-ing only 5 E% carbohydrates) or a carbohydrate-rich diet (90 E% carbohydrates) for 3–5 days.Exercise to exhaustion at approximately 65–70%of maximal oxygen uptake revealed an averageendurance time on the carbohydrate diet of 210min, which was markedly longer than whenon the fat diet (90min). Also, when intermittentexercise (30 min running followed by 10 min rest)at 70% of maximal oxygen uptake was per-formed in trained men, endurance performancetime to exhaustion was significantly impairedafter consuming a fat diet, consisting of 76 E%fat, 13.5 E% protein, for 4 days (62± 6min) com-pared with when a carbohydrate-rich diet (77 E%carbohydrate, 13.5 E% protein) was consumedfor 4 days (106±5 min) (Galbo et al. 1979). Also,the short-term studies by Bergström et al. (1967)and Karlsson and Saltin (1971) suggested that3–7 days of fat diet were detrimental to exerciseperformance. Thus, it is evident from these briefdietary manipulations that ‘fat-loading’ impairsendurance performance. However, in theseshort-term dietary studies, the primary goal wasto determine the extent to which muscle glyco-gen content could be altered by varying thedietary regimen after depletion of the glycogen
196 nutrition and exercise
stores and subsequently to ascertain the relationbetween the individual muscle glycogen contentand the capacity for prolonged exercise. Thus,these short-term carbohydrate-restricted dietsprobably reflect rather acute responses tochanges in diet.
Longer-term adaptation to fat-rich diets may,on the other hand, induce skeletal muscle adap-tations, metabolic as well as morphological,which in turn could influence exercise perfor-mance. It has been known for a long time thatendurance training induces several adaptationsin skeletal muscle such as increased capillariza-tion, increased mitochondrial density, increasedactivity of several oxidative enzymes (Saltin &Gollnick 1983) and, furthermore, as recentlyshown, an increased content of fatty acid bindingprotein in the sarcolemma (FABPpm) (Kiens et al.1997), parameters that all are suggested to play asignificant role in enhancing lipid oxidation.
It might be speculated that a way to influencethe fat oxidative system further, is to increase thesubstrate flux of fatty acids through the systemby increasing the fat content of the diet. Thismight result in further adaptations in the fatoxidative capacity, providing possibilities for anincreased fat oxidation, a sparing of carbohy-drates and an increasing endurance perfor-mance. Thus, in the study by Muoio et al. (1994),five well-trained runners followed a dietary
2.5
0.0
2.0
1.5
1.0
Control
0.5
Plas
ma
FFA
con
cent
ratio
n (m
mol
. l–1)
Lipidheparin
40
0
30
20
10
Control
Fat o
xida
tion
(µm
ol. k
g–1. m
in–1
)
Lipidheparin
* *
(a) (b)
Fig. 14.2 (a) Plasma free fatty acid(FFA) concentrations, and (b) totalfat oxidation during a 20–30-minexercise period for six subjectsduring a control trial and duringintralipid infusion. Subjectsexercised for 30 min at 85% ofmaximal oxygen uptake. *, P < 0.05 compared with controltrial. Adapted from Romijn et al.(1995).
regimen lasting 7 days. The runners performedtwo different treadmill tests after consumingeither a normal diet, a mixed diet, a moderate fat diet (38 E% fat, 50 E% carbohydrates) or a carbohydrate-rich diet (73 E% carbohydrates, 15E% fat) assigned in this order. Running time, at85% of V
.o2max. for 30 min and then at 75–80% of
V.o2max. until exhaustion, was longer following
the fat diet (91± 10min) than after both thenormal, mixed (69± 7min) and the carbohydrate-rich diet (76±8 min). Although these findingssuggest that a 7-day fat diet improves enduranceperformance in trained males, several flaws inthe design of the study are obvious. For example,the diets were not administered randomly andthere was no separation between the differentdietary periods. The fat diet only contained 38E% fat and can therefore hardly be characterizedas a fat-rich diet. Besides, a dietary carbohydrateintake of 50 E% resulted in a daily intake of afairly high amount of carbohydrates (approxi-mately 430g · day–1). Furthermore, a maximalexercise test was performed before the submaxi-mal endurance test only separated by a shortbreak, and this inevitably confounds the inter-pretation of dietary effects on endurance perfor-mance. Moreover, during exercise the R-valueswere similar in all three diets and although theconcentration of plasma fatty acids was highestin the fat diet, plasma glycerol concentrationswere lower than in the two other diets. Thus, themetabolic responses during exercise do not givesupport to the concept that the longer runningtime was induced by the diet.
Lambert et al. (1994) extended the dietaryintervention period to 14 days. They studied fiveendurance-trained cyclists consuming, in arandom order, either a 74 E% carbohydrate diet(HC) or a 76 E% fat diet (HF), separated by 2weeks on ad libitum or normal diet, during whichthey continued their normal training. The studyrevealed that maximal power output (862±94 Wvs. 804±65 W for HF and HC, respectively) andhigh-intensity bicycle exercise to exhaustion atapproximately 90% of V
.o2max. (8.3 ±2 vs. 12.5 ±
4min for HF and HC, respectively) were notimpaired after the fat diet. Moreover, during a
subsequent prolonged submaximal exercise testat approximately 60% V
.o2max., endurance perfor-
mance was significantly enhanced on the fat dietcompared with when on the carbohydrate diet.This improvement in submaximal endurancecapacity occurred despite an initial muscle glyco-gen content twofold lower (32±6 mmol · kg–1 wetweight) than in the carbohydrate-adapted trial(78 ±5 mmol · kg–1 wet weight). However, thesubjects performed three consecutive tests on thesame day only separated by short rest intervalsand the submaximal endurance test to exhaus-tion was always performed as the last test. Thisdesign confounds the interpretation of dietaryeffects on endurance performance. In contrast, inthe study by Pruett (1970), relatively well-trainedsubjects performed intemittent exercise tests (45-min bouts followed each time by a 15-min restperiod) until exhaustion after consuming either astandard diet (31 E% fat, 59 E% carbohydrate, 10E% protein), a fat diet (64 E% fat, 26 E% carbohy-drate, 10 E% protein) or a carbohydrate diet (8E% fat, 82 E% carbohydrate, 9 E% protein) for atleast 14 days. Nine subjects participated in thestudy and each subject was placed on one of thethree different diets; four of the subjects con-sumed all three diets. The exercise experimentswere performed with 2-week intervals at poweroutputs equal to 50% and 70% of V
.o2max.. The
subjects maintained their training throughoutthe 2 months required to complete a series ofexperiments. It was reported that exercising at50% V
.o2max. time to exhaustion was not different
between the three diets. However, maximal pos-sible work time was 270 min and due to that,several of the subjects were stopped before theywere exhausted. At 70% V
.o2max., exercise time to
exhaustion was not different between the stan-dard (175± 15min) and the fat diet (164±19min),whereas a longer work time was observed whenon the carbohydrate diet (193± 12min) thanwhen on the fat diet (164±19 min).
An even longer period of adaptation to a fatdiet was studied by Phinney et al. (1983). Sub-maximal endurance performance was studied infive well-trained bicyclists fed a eucaloric bal-anced diet (EBD) for 1 week, providing 147–
adaptations to a high fat diet 197

210kJ ·kg–1 · day–1 (35–50 kcal · kg–1 ·day–1) , 1.75gprotein · kg–1 ·day–1 and the remainder of caloriesas two-thirds carbohydrates and one-third fat.This was followed by 4 weeks of a eucaloric keto-genic diet (EKD), isocaloric and isonitrogenouswith the EBD diet, but providing fewer than 20g carbohydrates daily. The subjects continuedtheir normal training throughout the study.Endurance time to exhaustion, at 60–65% V
.o2max.,
was longer in three subjects (57%, 30%, 2%) andshorter in two (36%, 28%) after 4 weeks’ adapta-tion to EKD, resulting in no statistical differencein the mean exercise time after the two dietarytrials (147± 13min for EBD vs. 151 ±25 min forEKD). However, the big variability in perfor-mance time of the subjects makes the results diffi-cult to interpret. A highly significant decrease inRQ values during the endurance test was foundand in agreement with this a threefold drop inglucose oxidation and a fourfold reduction inmuscle glycogen use were demonstrated.
To summarize, so far the literature has pro-vided a conflicting picture when the effect ofdietary fat on endurance performance is investi-gated in man. These disparate results could beexplained by the varied research designs used,making firm conclusions impossible. Moreover,dietary manipulations for only 4 weeks may notbe long enough to induce adaptations in skeletalmuscle of importance for endurance exercisecapacity. Also, one might speculate whethertraining status, as indicated by maximal oxygenuptake of the subjects, could be of any signifi-cance. In the study by Helge et al. (1998), theinteraction between training and diet was inves-tigated. Fifteen initially non-trained male sub-jects were randomly assigned to consume a fatdiet (62 E% fat, 21 E% carbohydrate, 17 E%protein) or a carbohydrate diet (20 E% fat, 65 E%carbohydrate, 15 E% protein) while following asupervised training programme for 4 weeks.Training was performed four times weekly andeach training session alternated between shortand long-lasting intervals at 60–85% of V
.o2max.,
lasting 60 min. After the 4-week interventionperiod, V
.o2max. was similarly increased by 9% in
both dietary groups (P <0.05). Endurance perfor-
198 nutrition and exercise
mance time to exhaustion, measured on a Kroghbicycle ergometer, at 72% of V
.o2max. (same
absolute power output as in the initial non-trained trial), was similarly and significantlyincreased in both dietary groups both after 2 and4 weeks of training and dieting (Table 14.1).Thus, comparing the trained subjects in the fatgroup with those in the carbohydrate group after4 weeks, exercising at the same relative workload(72% of V
.o2max.), no differences in exercise time to
exhaustion were found between the two dietarygroups (79 ±8 min in the fat group vs. 79±15 minin the carbohydrate group). Thus, it appears thatadaptation to a fat diet in combination with train-ing up to 4 weeks, exercising at a submaximalintensity (60–70% of V
.o2max.), does not impair
endurance performance (Phinney et al. 1983;Helge et al. 1998). However, in the study by Helgeet al. (1996), two groups of non-trained male sub-jects underwent a 7-week supervised trainingprogramme while consuming either a fat diet (62E% fat, 21 E% carbohydrate, 17 E% protein) or acarbohydrate diet (20 E% fat, 65 E% carbohy-drate, 15 E% protein). Maximal oxygen uptakeincreased similarly in the two groups by 11% (P<0.05). Time to exhaustion, exercising on a Kroghbicycle ergometer at 82% of pretraining V
.o2max.,
was significantly increased, from initial meanvalues for the two groups of 35±4 min to 65±7min in the fat group, but significantly more inthe carbohydrate group (102±5 min). Thus, com-bining these findings it is apparent that the
Table 14.1 Endurance performance (mean ± SE,measured in minutes) until exhaustion before and after2 weeks’ and after 4 weeks’ adaptation to training anda fat-rich or a carbohydrate-rich diet.
After After Before 2 weeks 4 weeks
Fat-rich diet 29.5 ± 4.3 47.8 ± 8.1* 78.5 ± 8.2*
Carbohydrate- 31.7 ± 4.3 59.5 ± 10.6* 79.3 ± 15.1*rich diet
From Helge et al. (1998).*P < 0.05 compared to before values.

training-induced increase in endurance perfor-mance is less when a major part of daily energyintake is covered by fat for a period longer than 4weeks than when carbohydrates made up themajor part of daily energy intake (Fig. 14.3). Fur-thermore, comparing the trained subjects, exer-cising at the same relative exercise intensity, timeto exhaustion is significantly shorter when a fatdiet has been consumed for a longer period thanwhen a carbohydrate diet has been consumed.Summarizing these studies, it appears that afurther increase in endurance performance willbe impaired when a fat diet is continued beyond4 weeks.
It is not clear why prolonged elevated dietary
fat intake attenuates the improvement inendurance performance in man. One aspect ofsignificance in the adaptation to dietary fat couldbe the capacity of enzymes involved in the fatoxidation as a strong correlation between b-hydroxy-acyl-CoA-dehydrogenase (HAD) activ-ity and fatty acid uptake and oxidation has beendemonstrated in man (Kiens 1997). In the studyby Helge and Kiens (1997), the activity of HADwas increased by 25% after 7 weeks’ adaptationto a fat-rich diet, irrespective of whether subjectswere trained or not. Furthermore, after 4 weeks’adaptation to a fat-rich diet, carnitine palmitoyltransferase (CPT I) activity was increased by 35%and hexokinase activity was decreased by 46%(Fisher et al. 1983). Putman et al. (1993) demon-strated that the PDHa activity, the active form ofpyruvate dehydrogenase (Reed & Yeaman 1987),was higher after 3 days’ adaptation to a high-fatdiet than after adaptation to a high-carbohydratediet. Preliminary data from our laboratory(unpublished data) also reveal that a fat-rich dietper se, consumed for 4 weeks, induces a signifi-cant increase in the FABPpm. Thus, allowing forthe complexity of this issue, it seems fair to con-clude that a fat-rich diet consumed for a longerperiod increases the capacity for fatty acid trans-port and oxidation. Despite this adaptation,training-induced increases in endurance perfor-mance are nevertheless impaired compared withwhen a carbohydrate diet is consumed duringtraining. Thus, the fat oxidative capacity does notby itself seem to be decisive for endurance. Otherexplanations have to be found. Possible mecha-nisms could be increasing sympathetic activitywith time when a fat-rich diet is consumed orchanges in phospholipid fatty acid membranecomposition induced by dietary fat intake over alonger time (Helge et al. 1996).
The relation between muscle glycogen contentand the capacity for prolonged submaximal exer-cise is evident in the brief dietary studies. Thequestion is whether content of muscle glycogenis of the same significance for endurance perfor-mance during prolonged dietary adaptations. In the study by Phinney et al. (1983), enduranceperformance, at 60–65% of V
.o2max., was similar
adaptations to a high fat diet 199
100
0
80
60
20
0
Time (weeks)
Tim
e to
exh
aust
ion
(min
)
2 4 7
40
*
*
**
Fig. 14.3 Endurance performance to exhaustionmeasured on a Krogh bicycle ergometer before andafter 2, 4 and 7 weeks of endurance training whenconsuming a fat-rich diet ( ) or a carbohydrate-richdiet (�). *, P < 0.05 compared with 0 week in both diets;**, P < 0.05 compared with the fat-rich diet after 7weeks. Adapted from Helge et al. (1996, 1998).

(averaging approximately 2.5 h) after consuminga fat or a balanced diet even though initial muscleglycogen levels amounted to only 76± 4mmol ·kg–1 wet weight on the fat diet vs. 143± 10mmol ·kg–1 wet weight on the balanced diet. In thestudy by Lambert et al. (1994), where theendurance test to exhaustion, at 60% of V
.o2max.,
was performed as the last of three consecutivetests, muscle glycogen stores on the carbohy-drate diet amounted to 77± 5mmol ·kg–1 wetweight prior to the endurance test, and exercisetime to exhaustion lasted only 43±9 min,whereas when on the fat diet, exercise time toexhaustion was 80±8 min, when muscle glyco-gen levels averaged 32±6 mmol · kg–1 wet weightprior to the test. In these studies, endurance timeto exhaustion after consumption of a fat diet wasnot impaired but in fact even improved despitean initial glycogen content fourfold and twofoldlower, respectively, than in the carbohydratetrials. Also, in the study by Helge et al. (1996),muscle glycogen levels prior to exercise were sig-nificantly different after 7 weeks’ adaptation tothe fat diet (128± 6mmol ·kg–1 wet weight) andthe carbohydrate diet (153±7 mmol · kg–1 wetweight). However, the rate of muscle glycogenbreakdown during exercise was similar in bothtrials and muscle glycogen stores were notdepleted in either group at exhaustion. This waseven more conspicuous after 8 weeks, when acarbohydrate diet had been consumed for 1 weekafter 7 weeks’ adaptation to a fat diet. In this casemuscle glycogen concentrations at exhaustionwere as high as resting values before initiatingthe dietary intervention period. These observa-tions indicate that content of muscle glycogenprior to an endurance test does not seem to beclosely correlated to submaximal performancetime when adaptation to a fat diet for more than14 days has been induced, whereas after acute ora few days’ dietary manipulation, exercise timeto exhaustion seems more closely related toinitial muscle glycogen content (Christensen &Hansen 1939; Bergström et al. 1967; Galbo et al.1979).
The hypothesis that manipulation of dietaryfat can improve endurance performance by
200 nutrition and exercise
increasing fat oxidation and decreasing carbohy-drate oxidation can probably be true for the rat.However, in man there are no scientific data tosupport this notion inasmuch as those few labo-ratory studies purporting to show a benefit sufferfrom serious methodological flaws. It has alsobeen hypothesized that if a combination of training and the intake of a fat-rich diet was performed, then a subsequent brief switch to acarbohydrate-rich diet should create optimalconditions for increased endurance because ahigh-fat oxidative capacity is combined withlarge glycogen stores. This hypothesis may arisefrom studies in rats which have demonstrated, asmentioned earlier, that endurance performancetime was increased after prolonged fat adapta-tion and a subsequent brief exposure to a carbo-hydrate-rich diet (Conlee et al. 1990; Lapachet etal. 1996). However, these findings are not sup-ported in man. In the study by Helge et al. (1996),trained subjects switched to a carbohydrate diet(65 E% CHO, 20 E% fat) for another week, after 7weeks’ adaptation to a fat diet, while continuingtheir supervised training programme (T-FAT/CHO group). Another group, also participatingin the same training programme, followed a car-bohydrate diet through all 8 weeks (T-CHOgroup). An endurance test to exhaustion per-formed after the 8th week revealed that exercisetime, at the same relative exercise intensity (70%V.o2max.) as at the 7-week endurance test was
modestly increased by 18%, from 65± 7min at 7weeks to 77± 9min in the T-FAT/CHO group.This exercise time was, however, 26% shorterthan endurance time to exhaustion in the T-CHOgroup (Fig. 14.4). It is of note that in the T-FAT/CHO group the muscle glycogen stores were sig-nificantly higher initially (738± 53mmol ·kg–1
dry weight) than in the T-CHO group (561±22mmol ·kg–1 dry weight). Moreover, bloodglucose concentrations were significantly higherduring exercise and at exhaustion in the T-FAT/CHO group than in the T-CHO group.Even so, endurance performance was stillshorter in the T-FAT/CHO group. These datagive no support to the belief that several weeks’adaptation to a fat diet followed by a few days on

a carbohydrate-rich diet is of benefit for theathlete before an event.
Conclusion
From the available literature, based on humanstudies, it seems fair to conclude the following.1 An acute increase in the availability of circulat-ing fatty acids does not result in any clear effectson endurance performance.2 Short-term ingestion of a fat-rich diet (3–5
days) leads to a deterioration of endurance per-formance when compared with ingestion of acarbohydrate-rich diet.3 Adaptation to a fat-rich diet, in combinationwith training, for a period of 1–4 weeks does notattenuate endurance performance comparedwith adaptation to a diet rich in carbohydrates,but when dieting and training are continued for 7 weeks, endurance performance is markedlybetter when a carbohydrate-rich diet is consumed.4 No benefit is obtained when switching to a car-bohydrate-rich diet after long-term adaptation toa fat-rich diet, compared with when a carbohy-drate-rich diet is consumed all along.
References
Bergström, J., Hermansen, L., Hultman, E. & Saltin, B.(1967) Diet, muscle glycogen and physical perfor-mance. Acta Physiologica Scandinavica 71, 140–150.
Christensen, E.H. & Hansen, O. (1939) Arbeitsfähigkeitund ernärung (Work capacity and diet). Skandinav-ishes Archiv für Physiologie 81, 160–171.
Conlee, R., Hammer, R., Winder, W., Bracken, M.,Nelson, A. & Barnett, D. (1990) Glycogen repletionand exercise endurance in rats adapted to a high fatdiet. Metabolism 39, 289–294.
Dyck, D.J., Putman, C.T., Heigenhauser, G.J.F.,Hultman, E. & Spriet, L.L. (1993) Regulation of fat-carbohydrate interaction in skeletal muscle duringintense aerobic cycling. American Journal of Physiology265, E852–E859.
Fisher, E.C., Evans, W.J., Phinney, S.D., Blackburn, G.L.,Bistrian, B.R. & Young, V.R. (1983) Changes in skele-tal muscle metabolism induced by a eucaloric keto-genic diet. In Biochemistry of Exercise, Vol. 13 (ed. H.G.Knuttgen, J.A. Vogel & J. Portman), pp. 497–501.Human Kinetics, Champaign, IL.
Galbo, H., Holst, J.J. & Christensen, N.J. (1979) The effect of different diets and of insulin on the hormonal response to prolonged exercise. ActaPhysiologica Scandinavica 107, 19–32.
Griffiths, J., Humphreys, S.M., Clark, M.L., Fielding,B.A. & Frayn, K.N. (1996) Immediate metabolicavailability of dietary fat in combination with carbo-hydrate. American Journal of Clinical Nutrition 59,53–59.
Hargreaves, M., Kiens, B. & Richter, E.A. (1991) Effectof increased plasma free fatty acid concentrations onmuscle metabolism in exercising men. Journal ofApplied Physiology 70, 194–201.
adaptations to a high fat diet 201
* *
100
0
80
60
20
Time (weeks)
Tim
e to
exh
aust
ion
(min
)
87
40
120
**
Fig. 14.4 Endurance performance to exhaustionmeasured on a Krogh bicycle ergometer after 7 weeks’training on a fat-rich diet ( ) or a carbohydrate-richdiet ( ) followed by an additional week of trainingduring which both groups consumed thecarbohydrate-rich diet. *, P < 0.05 compared with thefat-rich and combined diets, respectively; **, P < 0.05compared with the fat-rich diet. Adapted from Helge etal. (1996).

Helge, J.W. & Kiens, B. (1997) Muscle enzyme activityin man: role of substrate availability and training.American Journal of Physiology 272, R1620–R1624.
Helge, J.W., Richter, E.A. & Kiens, B. (1996) Interactionof training and diet on metabolism and enduranceduring exercise in man. Journal of Physiology (London)292, 293–306.
Helge, J.W., Wulff, B. & Kiens, B. (1998) Impact of a fat-rich diet on endurance in man: role of the dietaryperiod. Medicine and Science in Sports and Exercise 30,456–461.
Hill, A.V. (1924) Muscular activity and carbohydratemetabolism. Science 60, 505–514.
Karlsson, J. & Saltin, B. (1971) Diet, muscle glycogen,and endurance performance. Journal of Applied Physi-ology 31, 203–206.
Kiens, B. (1997) Effect of endurance training on fattyacid metabolism: local adaptations. Medicine inScience, Sports and Exercise 29, 640–645.
Kiens, B., Essen-Gustavsson, B., Christensen, N.J. &Saltin, B. (1993) Skeletal muscle substrate utilizationduring submaximal exercise in man: effect ofendurance training. Journal of Physiology (London)469, 459–478.
Kiens, B., Kristiansen, S., Jensen, P., Richter, E.A. & Turcotte, L.P. (1997) Membrane associated fatty acidbinding protein (FABPpm) in human skeletal muscleis increased by endurance training. Biochemical andBiophysical Research Communications 231, 463–465.
Krogh, A. & Krogh, M. (1913) A study of the diet andmetabolism of eskimos. Meddelelser om Grønland 51,3–52.
Krogh, A. & Lindhard, J. (1920) The relative value of fatand carbohydrate as sources of muscular energy. Biochemistry Journal 14, 290–363.
Lambert, E.V., Speechly, D.P., Dennis, S.C. & Noakes,T.D. (1994) Enhanced endurance in trained cyclistsduring moderate intensity exercise following 2weeks’ adaptation to a high fat diet. European Journalof Applied Physiology 69, 287–293.
Lapachet, R.A.B., Miller, W.C. & Arnall, D.A. (1996)Body fat and exercise endurance in trained ratsadapted to a high fat diet and/or a high carbohy-drate diet. Journal of Applied Physiology 80, 1173–1179.
Marsh, E. & Murlin, J.R. (1928) Muscular efficiency onhigh carbohydrate and high fat diets. Journal of Nutrition 1, 105–137.
Miller, W.C., Bryce, G.R. & Conlee, R.K. (1984) Adapta-tions to a high-fat diet that increase exerciseendurance in male rats. Journal of Applied Physiology56, 78–83.
202 nutrition and exercise
Muoio, D.M., Leddy, J.J., Horvath, P.J., Awad, A.B. & Pendergast, D.R. (1994) Effects of dietary fat onmetabolic adjustments to maximal VO2 andendurance in runners. Medicine and Science in Sportsand Exercise 26, 81–88.
Phinney, S.D., Bistrian, B.R., Evans, W.J., Gervino, E. &Blackburn, G.L. (1983) The human metabolicresponse to chronic ketosis without caloric restric-tion: preservation of submaximal exercise capabilitywith reduced carbohydrate oxidation. Metabolism 32,769–776.
Pruett, E.D.R. (1970) Glucose and insulin during pro-longed work stress in men living on different diets.Journal of Applied Physiology 2, 199–208.
Putman, C.T., Spriet, L.L., Hultman, E. et al. (1993)Pyruvate dehydrogenase activity and acetyl groupaccumulation during exercise after different diets.American Journal of Physiology 265, E752–E760.
Reed, L.J. & Yeaman, S.J. (1987) Pyruvate dehydroge-nase. In Enzymes (ed. P.D. Boyer & E.G. Krebs), pp.77–95. Academic Press, Toronto.
Romijn, J.A., Coyle, E.F., Sidossis, L.S., Zhang, X.J. &Wolfe, R.R. (1995) Relationship between fatty aciddelivery and fatty acid oxidation during strenuousexercise. Journal of Applied Physiology 79, 1939–1945.
Saltin, B. & Gollnick, P. (1983) Skeletal muscle adapt-ability: significance for metabolism and perfor-mance. In Handbook of Physiology, Section 10 (eds L.D.Peachy, R.H. Adrian & S.R. Geiger), pp. 555–631.American Physiological Society, Bethesda.
Satabin, P., Portero, P., Defer, G., Bricout, J. & Guezennec, C.Y. (1987) Metabolic and hormonalresponses to lipid and carbohydrate diets duringexercise in man. Medicine and Science in Sports and Exercise 19, 218–223.
Simi, B., Sempore, B., Mayet, M.-H. & Favier, R.J. (1991)Additive effects of training and high-fat diet onenergy metabolism during exercise. Journal of AppliedPhysiology 71, 197–203.
Spriet, L.L. (1995) Caffeine and performance. Interna-tional Journal of Sports Nutrition 5, S84–S99.
Tollenar, D. (1976) Dietary fat level as affecting runningperformance and other performance-related para-meters of rats restricted or nonrestricted in foodintake. Journal of Nutrition 106, 1539–1546.
Turcotte, L.P., Richter, E.A. & Kiens, B. (1992) Increasedplasma FFA uptake and oxidation during prolongedexercise in trained vs. untrained humans. AmericanJournal of Physiology 262, E791–E799.
Zuntz, N. (1901) Über die bedeutung der verschiede-nen nahrstoffe als erzeuger der muskelkraft. PflügersArchives 83, 557–571.

Introduction
Hard physical exercise poses a formidable chal-lenge to the body’s ability to maintain its internalenvironment within the range that allowsoptimum function. In sport, however, both intraining and competition, these homeostaticmechanisms are under constant threat, andfatigue is the result of a failure to stay within thezone of optimum functioning. It may be anexcess acidosis resulting from lactic acid forma-tion, a change in the extracellular potassium concentration causing a decrease in the muscleexcitability or a rise in the temperature of thetissues as a result of a high rate of metabolic heat production. Some increase in body tempera-ture is normally observed during exercise, andmay even have beneficial effects by increasingthe rate of key chemical reactions and alteringthe elastic modulus of tissues, but high tempera-tures are detrimental to exercise performanceand may be harmful to health. Sweating is thenormal physiological response invoked to limitthe rise in body temperature by increasing evaporative heat loss, but the loss of signifi-cant amounts of sweat results in dehydrationand electrolyte depletion if the losses are notreplaced. Some understanding of the regulatoryprocesses involved in the control of body tem-perature and of fluid and electrolyte balance istherefore fundamental to the design of drinksintended for use during exercise and to an under-standing of how and when these drinks shouldbe used.
Temperature regulation in exercise
The temperature of the skin can vary widely,depending on the environmental temperature,but the temperature of the deep tissues must bemaintained within only a few degrees of thenormal resting level of about 37°C. For this to bethe case, the rate of heat gain by the body must bebalanced by the rate of heat loss: any imbalancewill result in a change in body temperature. Allchemical reactions occurring in the body are rela-tively inefficient, resulting in a large part of thechemical energy involved appearing as heat. Therate of heat production is therefore directly pro-portional to the metabolic rate. The resting meta-bolic rate for a healthy adult with a body mass of70kg is about 60 W. In a warm climate, this is suf-ficient to balance the rate of heat loss, but in coldweather the insulative layer surrounding thebody must be increased to reduce the rate of heatloss. In other words, more or thicker clothes areworn when it is cold. Alternative strategies are toraise the ambient temperature (by turning up thethermostat on the heating system if indoors) or toincrease the metabolic rate, thus increasing therate of heat production.
The metabolic rate increases in proportion tothe rate of energy turnover during exercise: inactivities such as walking, running, swimmingor cycling at a constant speed, the energydemand is a function of the rate of movement. Inwalking or running, where the body mass ismoved against gravity at each step, body massand speed will together determine the energy
Chapter 15
Temperature Regulation and Fluid andElectrolyte Balance
RONALD J. MAUGHAN AND ETHAN R. NADEL
203

cost. Air resistance becomes a factor at the higherspeeds involved in cycling, and reducing theenergy needed to overcome air resistance is acrucial factor in improving performance. Inswimming, more so than in the other types ofactivity, technique is important in determiningthe energy cost of covering a fixed distance ormoving at a fixed speed. In most sporting situa-tions, as in most daily activities, the exerciseintensity is not constant, but consists of intermit-tent activity of varying intensity and duration.
Elite marathon runners can sustain speeds thatresult in rates of heat production in the order of1200W for a little over 2h, which is the time ittakes for the top performers to complete amarathon race (Maughan 1994a). In spite of this,however, the rise in body temperature that isobserved seldom exceeds 2–3°C, indicating thatthe rate of heat loss from the body has beenincreased to match the increased rate of heat pro-duction. In general, the rise in body temperatureduring exercise is proportional to the exerciseintensity, whether this is expressed in absoluteterms as a power output or in relative terms as aproportion of each individual’s aerobic capacity.This observation indicates that the balancebetween heat production and heat loss is notperfect, but the relationship is none the lessrather precise.
Heat exchange between the body surface andthe environment occurs by conduction, convec-tion and radiation (Fig. 15.1), and each of thesephysical processes can result in either heat gainor heat loss: in addition, evaporation can causeheat to be lost from the body (Leithead & Lind1964). Air has a low thermal conductivity, but thethermal conductivity of water is high, which iswhy an air temperature of, say, 28°C feels warmbut water at the same temperature feels cool oreven cold. The pool temperature is therefore ofcritical importance for swimmers. Convectionand radiation are effective methods of heat losswhen the temperature gradient between the skinand the environment is large and positive, i.e.when the skin temperature is much higher thanthe ambient temperature. Under such condi-tions, these two processes will account for a
204 nutrition and exercise
major part of the heat loss even during intenseexercise. As ambient temperature rises, however,the gradient from skin to environment falls, andabove about 35°C, the temperature gradient fromskin to environment is reversed so that heat isgained by the body. In these conditions, evapora-tion is therefore the only means of heat loss.
The heat balance equations are described byKenney (1998) and are usually described by thefollowing equation:
S =M±R ± K ±C – E±Wk
This indicates that the rate of body heat storage(S) is equal to the metabolic heat production (M)corrected for the net heat exchange by radiation(R), conduction (K), convection (C) and evapora-tion (E). A further correction must be applied toallow for work (Wk) done: this may be negativein the case of external work done, or positivewhen eccentric exercise is performed.
A high rate of evaporative heat loss is clearlyessential when the rate of metabolic heat produc-tion is high and when physical transfer is limitedor actually results in a net heat gain by the body.Evaporation of water from the skin surface willresult in the loss from the body of about 2.6 MJ(620 kcal) of heat energy for each litre of waterevaporated. If we again use our marathon runneras an example, and again assume a rate of heatproduction of 1200W, the effectiveness of evapo-ration is readily apparent. Assuming no othermechanisms of heat exchange, body temperaturewould rise rapidly and would reach an intoler-able level within only about 20min of exercise.
Evaporation of sweat at a rate of 1 l · h–1 wouldresult in heat loss by evaporation occurring at arate of 2.6MJ ·h–1 (620 kcal ·h–1), which is equiva-lent to 722 J · s–1 (172 cal · s–1), or 722W. The entiremetabolic heat load would therefore be balancedby the evaporation of about 1.7 l sweat ·h–1, andthis is well within the range of sweat rates nor-mally observed in various sports during exercise(Rehrer & Burke 1997).
Although the potential for heat loss by evapo-ration of water from the skin is high, this willonly be the case if the skin surface is kept wet byconstant replacement of the sweat that evapo-

rates or drips off the skin. Effective evaporationis also prevented if the vapour pressure gradientbetween the skin and the environment is low.This latter situation will arise if the skin tempera-ture is low or if the ambient water vapour pres-sure is high: clothing that restricts air flow willallow the air close to the skin to become saturatedwith water vapour and will therefore restrict theevaporation of water from the skin surface. Alarge body surface area and a high rate of airmovement over the body surface are also factors
that will have a major impact on evaporative heatloss, but these same factors may be a disadvan-tage in that they will promote heat gain from theenvironment by radiation and convection whenthe ambient temperature is higher than skin tem-perature (Leithead & Lind 1964). Smaller indi-viduals will have a high surface area relative totheir body mass, and may be at an advantage inhot conditions, but this will depend on the rela-tive rates of evaporative heat loss and heat gainby physical transfer.
thermoregulation and fluid balance 205
Air temperatureAir humidity
Skythermal
radiation
Solarradiation
Reflectedsolar
radiation
Groundthermalradiation
Running speed
Contractingmuscle
Metabolicstorage
Skin blood flowConvection
Radiation
WorkConduction
Convection
Respiratory
Sweat
Muscle
bloodflow
Convection
Fig. 15.1 Main avenues of heat gain or heat loss in the exercising individual.

The ability of athletes to complete events suchas the marathon, even in adverse climatic condi-tions, with relatively little change in body tem-perature, indicates that the thermoregulatorysystem is normally able to dissipate the associ-ated heat load (Sutton 1990). Nielsen (1996) cal-culated that a marathon runner competing in ahot climate would be seriously disadvantaged:her calculations suggested that a marathonrunner with a best time of 2 h 10 min, competingin conditions typical of the south-eastern UnitedStates at the time of the 1996 Summer OlympicGames, would not be able to run faster thanabout 3h 20min because of the limited heat lossthat would be possible. The winner of the men’srace at those Games actually finished in a time of2h 12min 36s compared with his previous besttime of 2 h 11min 46 s. This apparently minoreffect on performance was in part due to theenvironmental conditions being less severe thanexpected, but also indicated that the body isremarkably able to perform even in adverse environmental conditions. It is also worth notingthat many of the spectacular collapses that haveoccurred in the history of marathon runninghave occurred in hot weather. Famous examplesinclude those of Dorando Pietri at the 1908Olympic marathon in London, Jim Peters at the
206 nutrition and exercise
Fig. 15.2 Water may be lesseffective for dehydration buteffective for cooling. Photo © CorVos.
Fig. 15.3 Even in cool conditions temperatureregulation is a big factor in endurance events. Photocourtesy of Ron Maughan.

1954 Empire Games marathon in Vancouver, and Gabriella Andersen-Scheiss at the 1984 Los Angeles Olympics. Such problems are rarelyencountered in cooler conditions. None the less, high rates of evaporation require high rates of sweat secretion onto the skin surface, andthe price to be paid for the maintenance of core temperature is a progressive loss of waterand electrolytes in sweat. If not corrected, this dehydration will impair exercise perfor-mance (Chapter 16) and may itself become life-threatening.
Water balance
The body’s hydration status is determined by thebalance between water input and water lossesfrom the body. As with all nutrients, a regularintake of water is required for the body to main-tain health, and deficiency symptoms and over-dosage symptoms can both be observed. Water isthe largest single component of the normalhuman body, accounting for about 50–60% of thetotal body mass. Lean body tissues contain about75% water by mass, whereas adipose tissue consists mostly of fat, with little water content.The body composition, and specifically the fatcontent, therefore largely determines the normalbody water content. For a healthy lean youngmale with a body mass of 70kg, total body waterwill be about 42 l. Losses of only a few per cent oftotal body water will result in an impaired exer-cise tolerance and an increased risk of heat ill-ness, and yet the sweating rate can reach 2–3 l ·h–1
in extreme situations.Sweat losses for various sporting and occupa-
tional activities are well categorized, but the vari-ability is large because of the different factorsthat affect the sweating response (Rehrer &Burke 1996). Even at low ambient temperatures,high sweat rates are sometimes observed whenthe energy demand is high, as in marathon run-ning, so it cannot be concluded that dehydrationis a problem only when the ambient temperatureand humidity are high: marathon runners com-peting in cool temperatures (10–12°C) typicallylose between 1% and 5% of body mass during a
race (Maughan 1985). The sweat loss is, however,closely related to the environmental conditions,and large fluid deficits are much more commonin the summer months and in tropical climates.Body mass losses of 6 l or more have beenreported for marathon runners in warm weathercompetition (Costill 1977). This corresponds to awater deficit of about 8% of body mass, or about12–15% of total body water, and this is sufficientto give cause for concern.
It is well established that women tend to sweatless than men under standardized conditions,even after a period of acclimatization (Wyndhamet al. 1965). It is likely, however, that a large partof the apparent sex difference can be accountedfor by differences in training and acclimationstatus. There is a limited amount of informationon the effects of age on the sweating response,and again levels of fitness and acclimation areconfounding factors, but the sweating responseto a standardized challenge generally decreaseswith age (Kenney 1995). These observationsshould not, however, be interpreted as suggest-ing an inability of older people to exercise in theheat, nor should they be taken to indicate adecreased need for women or older individualsto pay attention to fluid intake during exposureto heat stress. Rather, because of the reduced sen-sitivity of the thirst mechanism in older individ-uals (Kenney 1995), there is a need for a greaterconscious effort to increase fluid intake. Thereare some differences between children andadults in the sweating response to exercise and insweat composition. The sweating capacity ofchildren is low, when expressed per unit surfacearea, and the sweat electrolyte content is low relative to that of adults (Meyer et al. 1992), butthe need for fluid and electrolyte replacement isno less important than in adults. Indeed, in viewof the evidence that core temperature increases to a greater extent in children than in adults at a given level of dehydration, the need for fluidreplacement may well be greater in children (Bar-Or 1989). There may also be a need to limitthe duration of children’s sports events, or toprovide for specified rest periods, when the tem-perature and humidity are high.
thermoregulation and fluid balance 207

Water losses
The turnover rate of water exceeds that of mostother body components: for the individual wholives in a temperate climate and takes no exer-cise, daily water losses are about 2–4 l, or 5–10%of the total body water content. Urine, faeces,sweat, expired air and through the skin are themajor avenues of water loss, and the approxi-mate size of these different routes of water lossare shown in Table 15.1. In spite of its relativeabundance, however, there is a need to maintainthe body water content within narrow limits, andthe body is much less able to cope with restric-tion of water intake than with restriction of foodintake. A few days of total fasting has relativelylittle impact on functional capacity, providedfluids are allowed, and even longer periods ofabstinence from food are well tolerated. In con-trast, cessation of water intake results in seriousdebilitation after times ranging from as little asan hour or two to a few days at most.
Environmental conditions will affect the basalwater requirement by altering the losses thatoccur by the various routes. Water requirementsfor sedentary individuals living in a hot climatemay be two- or threefold higher than the require-ment when living in a temperate climate, evenwhen this is not accompanied by obvious sweat-ing (Adolph & Associates 1947). Transcutaneousand respiratory losses will be markedly influ-enced by the humidity of the ambient air, and
208 nutrition and exercise
this may be a more important factor than theambient temperature. Respiratory water lossesare incurred because of the humidification of theinspired air. These losses are relatively small inthe resting individual in a warm, moist environ-ment (amounting to about 200 ml · day–1), butwill be increased approximately twofold inregions of low humidity, and may be as high as1500ml · day–1 during periods of hard work in thecold, dry air at altitude (Ladell 1965).
The nature of the diet has some effect on water requirements because of the requirementfor excretion of excess electrolytes and the prod-ucts of metabolism. An intake of electrolytes inexcess of the amounts lost in sweat and faecesmust be corrected by excretion in the urine, witha corresponding increase in the volume andosmolality of urine formed. The daily intake ofelectrolytes varies widely between individuals,and there are also regional variations. Dailydietary sodium chloride intakes for 95% of theyoung male UK population fall between 3.8 and14.3g, with a mean of 8.4g; the correspondingvalues for young women are 2.8–9.4 g, with amean value of 6.0 g (Gregory et al. 1990). A high-protein diet requires a greater urine output toallow excretion of water-soluble nitrogenouswaste (LeMagnen & Tallon 1967). Although thiseffect is relatively small compared with otherlosses, it can become meaningful when wateravailability is limited, and may be a factor to beconsidered in some athletes who habituallyconsume diets with a very high protein content.When a high-protein diet is used in combinationwith fluid restriction and dehydration practicesas part of the making-weight process in weightcategory sports, there are real dangers. The watercontent of the food ingested will also be influ-enced greatly by the nature of the diet, and waterassociated with food will make some contribu-tion to the total fluid intake.
Electrolyte losses in sweat
The sweat which is secreted onto the skin con-tains a wide variety of organic and inorganicsolutes, and significant losses of some of these
Table 15.1 Avenues of water loss from the body forsedentary adult men and women. From Bender &Bender (1997).
Water loss (ml · day-1)
Men Women
Urine 1400 1000Expired air 320 320Transcutaneous loss 530 280Sweat loss 650 420Faecal water 100 90
Total 3000 2100
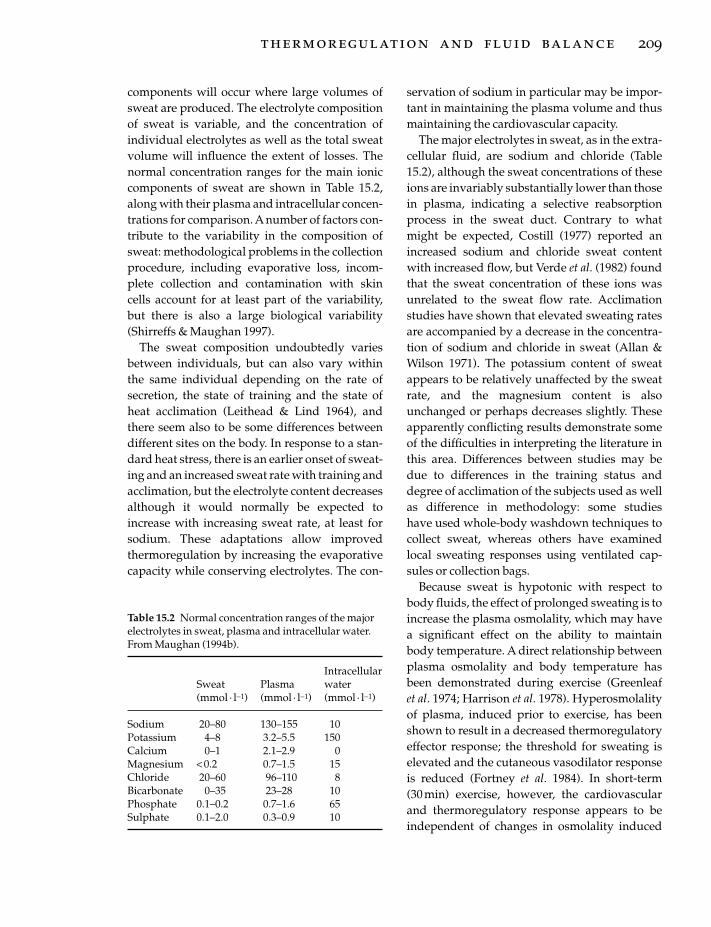
components will occur where large volumes ofsweat are produced. The electrolyte compositionof sweat is variable, and the concentration ofindividual electrolytes as well as the total sweatvolume will influence the extent of losses. Thenormal concentration ranges for the main ioniccomponents of sweat are shown in Table 15.2,along with their plasma and intracellular concen-trations for comparison. A number of factors con-tribute to the variability in the composition ofsweat: methodological problems in the collectionprocedure, including evaporative loss, incom-plete collection and contamination with skincells account for at least part of the variability, but there is also a large biological variability(Shirreffs & Maughan 1997).
The sweat composition undoubtedly variesbetween individuals, but can also vary withinthe same individual depending on the rate ofsecretion, the state of training and the state ofheat acclimation (Leithead & Lind 1964), andthere seem also to be some differences betweendifferent sites on the body. In response to a stan-dard heat stress, there is an earlier onset of sweat-ing and an increased sweat rate with training andacclimation, but the electrolyte content decreasesalthough it would normally be expected toincrease with increasing sweat rate, at least forsodium. These adaptations allow improved thermoregulation by increasing the evaporativecapacity while conserving electrolytes. The con-
servation of sodium in particular may be impor-tant in maintaining the plasma volume and thusmaintaining the cardiovascular capacity.
The major electrolytes in sweat, as in the extra-cellular fluid, are sodium and chloride (Table15.2), although the sweat concentrations of theseions are invariably substantially lower than thosein plasma, indicating a selective reabsorptionprocess in the sweat duct. Contrary to whatmight be expected, Costill (1977) reported anincreased sodium and chloride sweat contentwith increased flow, but Verde et al. (1982) foundthat the sweat concentration of these ions wasunrelated to the sweat flow rate. Acclimationstudies have shown that elevated sweating ratesare accompanied by a decrease in the concentra-tion of sodium and chloride in sweat (Allan &Wilson 1971). The potassium content of sweatappears to be relatively unaffected by the sweatrate, and the magnesium content is alsounchanged or perhaps decreases slightly. Theseapparently conflicting results demonstrate someof the difficulties in interpreting the literature inthis area. Differences between studies may bedue to differences in the training status anddegree of acclimation of the subjects used as wellas difference in methodology: some studies have used whole-body washdown techniques tocollect sweat, whereas others have examinedlocal sweating responses using ventilated cap-sules or collection bags.
Because sweat is hypotonic with respect tobody fluids, the effect of prolonged sweating is toincrease the plasma osmolality, which may havea significant effect on the ability to maintain body temperature. A direct relationship betweenplasma osmolality and body temperature hasbeen demonstrated during exercise (Greenleaf et al. 1974; Harrison et al. 1978). Hyperosmolalityof plasma, induced prior to exercise, has beenshown to result in a decreased thermoregulatoryeffector response; the threshold for sweating iselevated and the cutaneous vasodilator responseis reduced (Fortney et al. 1984). In short-term (30 min) exercise, however, the cardiovascularand thermoregulatory response appears to beindependent of changes in osmolality induced
thermoregulation and fluid balance 209
Table 15.2 Normal concentration ranges of the majorelectrolytes in sweat, plasma and intracellular water.From Maughan (1994b).
IntracellularSweat Plasma water (mmol · l-1) (mmol · l-1) (mmol · l-1)
Sodium 20–80 130–155 10Potassium 4–8 3.2–5.5 150Calcium 0–1 2.1–2.9 0Magnesium < 0.2 0.7–1.5 15Chloride 20–60 96–110 8Bicarbonate 0–35 23–28 10Phosphate 0.1–0.2 0.7–1.6 65Sulphate 0.1–2.0 0.3–0.9 10

during the exercise period (Fortney et al. 1988).The changes in the concentration of individualelectrolytes are more variable, but an increase inthe plasma sodium and chloride concentrationsis generally observed in response to bothrunning and cycling exercise. Exceptions to thisare rare and occur only when excessively largevolumes of drinks low in electrolytes are con-sumed over long periods; these situations arediscussed further below.
The plasma potassium concentration has beenreported to remain constant after marathonrunning (Meytes et al. 1969; Whiting et al. 1984),although others have reported small increases,irrespective of whether drinks containing largeamounts of potassium (Kavanagh & Shephard1975) or no electrolytes (Costill et al. 1976) weregiven. Much of the inconsistency in the literaturerelating to changes in the circulating potassiumconcentration can be explained by the variabletime taken to obtain blood samples after exerciseunder field conditions; the plasma potassiumconcentration rapidly returns to normal in thepostexercise period (Stansbie et al. 1982). Labora-tory studies where an indwelling catheter can beused to obtain blood samples during exercisecommonly show an increase in the circulatingpotassium concentration in the later stages ofprolonged exercise. The potassium concentra-tion of extracellular fluid (4–5 mmol · l–1) is small relative to the intracellular concentration(150–160 mmol · l–1), and release of potassiumfrom liver, muscle and red blood cells will tend toelevate plasma potassium levels during exercisein spite of the losses in sweat.
The plasma magnesium concentration is generally unchanged after moderate intensityexercise, and although a modest fall has beenreported after extreme exercise, it seems likelythat this reflects a redistribution of the availablemagnesium between body compartments ratherthan a net loss from the body (Maughan 1991). Alarger fall in the serum magnesium concentra-tion has, however, been observed during exercisein the heat than at neutral temperatures (Beller etal. 1972), supporting the idea that losses in sweatare responsible, and further studies with more
210 nutrition and exercise
reliable methodologies are required to clarify thisissue. Although the concentration of potassiumand magnesium in sweat is high relative to thatin the plasma, the plasma content of these ionsrepresents only a small fraction of the wholebody stores; Costill and Miller (1980) estimatedthat only about 1% of the body stores of theseelectrolytes was lost when individuals weredehydrated by 5.8% of body weight.
Control of water intake and water loss
The excretion of some of the waste products ofmetabolism and the regulation of the body’swater and electrolyte balance are the primaryfunctions of the kidneys. Excess water or solute isexcreted, and where there is a deficiency of wateror electrolytes, these are conserved until thebalance is restored. Under normal conditions, theosmolality of the extracellular fluid is main-tained within narrow limits; since this is stronglyinfluenced by the sodium concentration, sodiumand water balance are closely linked. At rest,approximately 15–20% of the renal plasma flowis continuously filtered out by the glomeruli,resulting in the production of about 170 l filtrate ·day–1. Most (99% or more) of this is reabsorbed in the tubular system, leaving about 1–1.5 l toappear as urine. The volume of urine produced is determined primarily by the action of anti-diuretic hormone (ADH) which regulates waterreabsorption by increasing the permeability ofthe distal tubule of the nephron and the collect-ing duct to water. ADH is released from the pos-terior lobe of the pituitary in response to signalsfrom the supraoptic nucleus of the hypothala-mus: the main stimuli for release of ADH, whichis normally present only in low concentrations,are an increased signal from the osmoreceptorslocated within the hypothalamus, a decrease inblood volume, which is detected by low-pressurereceptors in the atria, and by high-pressurebaroreceptors in the aortic arch and carotid sinus.An increased plasma angiotensin concentrationwill also stimulate ADH output.
The sodium concentration of the plasma is reg-ulated by the renal reabsorption of sodium from
the glomerular filtrate. Most of the reabsorptionoccurs in the proximal tubule, but active absorp-tion also occurs in the distal tubules and collect-ing ducts. A number of factors influence theextent to which reabsorption occurs, and amongthese is the action of aldosterone, which pro-motes sodium reabsorption in the distal tubulesand enhances the excretion of potassium andhydrogen ions. Aldosterone is released from thekidney in response to a fall in the circulatingsodium concentration or a rise in plasma potas-sium: aldosterone release is also stimulated byangiotensin which is produced by the renin-angiotensin system in response to a decrease inthe plasma sodium concentration. Angiotensinthus has a two-fold action, on the release ofaldosterone as well as ADH. Atrial natriureticfactor (ANF) is a peptide synthesized in andreleased from the atria of the heart in response toatrial distension. It increases the glomerular filtration rate and decreases sodium and waterreabsorption leading to an increased loss: thismay be important in the regulation of extracellu-lar volume, but it seems unlikely that ANF playsa significant role during exercise. Regulation ofthe body’s sodium balance has profound impli-cations for fluid balance, as sodium salts accountfor more than 90% of the osmotic pressure of theextracellular fluid.
Loss of hypotonic fluid as sweat during pro-longed exercise usually results in a fall in bloodvolume and an increased plasma osmolality:both these changes act as stimuli for the release ofADH (Castenfors 1977). The plasma ADH con-centration during exercise has been reported toincrease as a function of the exercise intensity(Wade & Claybaugh 1980). Renal blood flow isalso reduced in proportion to the exercise inten-sity and may be as low as 25% of the resting levelduring strenuous exercise (Poortmans 1984).These factors combine to result in a decreasedurine flow during, and usually for some timeafter, exercise (Poortmans 1984). It has beenpointed out, however, that the volume of waterconserved by this decreased urine flow duringexercise is small, probably amounting to no morethan 12–45ml ·h–1 (Zambraski 1990).
The effect of exercise is normally to decreasethe renal excretion of sodium and to increase theexcretion of potassium, although the effect on potassium excretion is rather variable (Zambraski 1990). These effects appear to belargely due to an increased rate of aldosteroneproduction during exercise (Poortmans 1984).Although the concentrations of sodium andmore especially of potassium in the urine aregenerally high relative to the concentrations inextracellular fluid, the extent of total urinarylosses in most exercise situations is small.
The daily water intake in the form of food anddrink is usually in excess of obligatory waterloss, with the kidneys being responsible forexcretion of any excess and the regulation ofbody water content. The kidneys can only func-tion effectively, however, if the fluid intake is inexcess of the requirement. Drinking is a complexbehaviour which is influenced by a number ofphysiological, psychological and social events.The sensation of thirst is only one of the factorsinvolved, and short-term studies suggest that itis a poor indicator of acute hydration status inman (Adolph et al. 1947). The overall stability ofthe total body water content, however, indicatesthat the desire to drink is a powerful regulatoryfactor over the long term (Ramsay 1989).
The urge to drink, which is perceived as thirst,may not be directly involved with a physiologi-cal need for water intake, but can be initiated byhabit, ritual, taste or desire for nutrients, stimu-lants, or a warm or cooling effect. A number ofthe sensations associated with thirst are learned,with signals such as dryness of the mouth orthroat inducing drinking, while distension of thestomach can stop ingestion before a fluid deficithas been restored. There are clearly changes inthe sensitivity of the thirst mechanism associatedwith the ageing process, with older individualsshowing a reduced response to mild levels ofdehydration (Kenney 1995).
Notwithstanding the various factors that modulate the subjective perception of thirst,there is an underlying physiological basis involv-ing both chemical and pressure sensors. The sensation of thirst is controlled separately by
thermoregulation and fluid balance 211

both the osmotic pressure of the body fluids andthe central venous volume. The same mecha-nisms are involved in water and solute reabsorp-tion in the kidneys and in the control of bloodpressure. The thirst control centres are located inthe hypothalamus and forebrain, and appear toplay a key role in the regulation of both thirst anddiuresis. Receptors in the thirst control centresrespond directly to changes in osmolality,volaemia and blood pressure, while others arestimulated by the fluid balance hormones whichalso regulate renal excretion (Phillips et al. 1985).These regions of the brain also receive afferentinput from systemic receptors monitoring osmo-lality and circulating sodium concentration, andfrom alterations in blood volume and pressure.There may also be a direct neural link from thethirst control centres to the kidneys which wouldallow a greater degree of integration between thecontrol of fluid intake and excretion. Changes inthe balance of neural activity in the thirst controlcentres regulated by the different monitoringinputs determine the relative sensations of thirstand satiety, and influence the degree of diuresis.Input from the higher centres of the brain,however, can override the basic biological needfor water to some extent and cause inappropriatedrinking responses.
A rise of between 2% and 3% in plasma osmo-lality is sufficient to evoke a profound sensationof thirst coupled with an increase in the circulat-ing concentration of ADH (Hubbard et al. 1990).The mechanisms that respond to changes inintravascular volume and pressure appear to beless sensitive than those that monitor plasmaosmolality, with hypovolaemic thirst beingevident only following a 10% decrease in bloodvolume (Fitzsimons 1990). As fairly large varia-tions in blood volume and pressure occur duringnormal daily activity, this lack of sensitivity presumably prevents excessive activity of thevolaemic control mechanisms. Prolonged exer-cise, especially in the heat, is associated with adecrease in plasma volume and a tendency for anincrease in plasma osmolality, but fluid intakeduring and immediately following exercise isoften less than that required to restore normal
212 nutrition and exercise
hydration status (Ramsay 1989). This appearsnot to be due to a lack of initiation of the drinkingresponse but rather to a premature terminationof the drinking response (Rolls et al. 1980).
When a water deficit is present and volunteersare allowed free access to fluids, the normaldrinking response involves an initial period ofavid drinking during which more than 50% ofthe total volume is consumed; this is followed bya longer period of intermittent consumption ofrelatively small volumes (Verbalis 1990). Theinitial alleviation of thirst occurs before sig-nificant amounts of the beverage have beenabsorbed and entered the body pools. Therefore,although decreasing osmolality and increasingextracellular volume promote a reduction in theperception of thirst, other preabsorptive factorsalso affect the volume of fluid ingested. Recep-tors in the mouth, oesophagus and stomach arethought to meter the volume of fluid ingested,while distension of the stomach tends to reducethe perception of thirst. These preabsorptivesignals appear to be behavioural, learnedresponses and may be subject to disruption in situations which are essentially novel to the indi-vidual. This may partly explain the inappropri-ate voluntary fluid intake in individuals exposedto an acute increase in environmental tempera-ture or to exercise-induced dehydration.
In addition to the water consumed in the formof drinks, some water is obtained from solidfoods, and water is also available as a result of theoxidation of nutrients. The amount of wateravailable from these sources will depend on theamount and type of food eaten and on the totalmetabolic rate. Oxidation of the components of amixed diet, with an energy content of 12.6MJ(3000 kcal) per day, will give about 400ml water ·day–1. The contribution of this water of oxidationto water requirements is appreciable when waterturnover is low, but becomes rather insignificantwhen water losses are high.
Role of the kidney
The excretion of some of the waste products ofmetabolism and the regulation of the body’s

water and electrolyte balance are the primaryfunctions of the kidneys. Excess water or solute isexcreted, and where there is a deficiency of wateror electrolytes an attempt is made to conservethese until the balance is restored. Blood volume,plasma osmolality and plasma sodium concen-tration seem to be the primary factors regulated.Under normal conditions, the osmolality of theextracellular fluid is maintained within narrowlimits. As the major ion of the extracellular spaceis sodium, which accounts for about 50% of thetotal osmolality, maintenance of osmotic balancerequires that both sodium and water intake andloss are closely coupled.
At rest, about 20% of the cardiac output goes tothe two kidneys, and approximately 15–20% ofthe renal plasma flow is continuously filtered outby the glomeruli, resulting in the production ofabout 170 l filtrate · day–1. Most (99% or more) ofthis is reabsorbed in the tubular system, leavingabout 1–1.5 l to appear as urine. The volume ofurine produced is determined primarily by theaction of ADH which regulates water reabsorp-tion by increasing the permeability of the distaltubule of the nephron and the collecting duct towater. ADH is released from the posterior lobe ofthe pituitary in response to signals from thesupraoptic nucleus of the hypothalamus: themain stimuli for release of ADH, which is nor-mally present only in low concentrations, are anincreased signal from the osmoreceptors locatedwithin the hypothalamus, a decrease in bloodvolume, which is detected by low-pressurereceptors in the atria, and by high-pressurebaroreceptors in the aortic arch and carotid sinus.An increased plasma angiotensin concentrationwill also stimulate ADH output.
The sodium concentration of the plasma is regulated by the reabsorption of sodium from theglomerular filtrate, with most of the reabsorptionoccurring in the proximal renal tubule. Severalfactors influence the extent to which reabsorp-tion occurs: of particular importance is the actionof aldosterone, which promotes sodium reab-sorption in the distal tubules and enhances theexcretion of potassium and hydrogen ions.Aldosterone is released from the kidney in
response to a fall in the circulating sodium con-centration or a rise in plasma potassium: aldos-terone release is also stimulated by angiotensinwhich is produced by the renin–angiotensinsystem in response to a decrease in the plasmasodium concentration. Angiotensin thus has atwofold action, on the release of aldosterone aswell as ADH. ANF is a peptide synthesized inand released from the heart in response to atrialdistension. It increases the glomerular filtrationrate and decreases sodium and water reabsorp-tion leading to an increased loss: this may beimportant in the regulation of extracellularvolume, but probably does not play a significantrole during exercise. Regulation of the body’ssodium balance has profound implications for fluid balance, as sodium salts account formore than 90% of the osmotic pressure of theextracellular fluid.
Loss of hypotonic fluid as sweat during pro-longed exercise usually results in a fall in bloodvolume and an increased plasma osmolality:these changes in turn act as stimuli for the releaseof ADH (Castenfors 1977). The plasma ADH con-centration during exercise has been reported toincrease as a function of the exercise intensity(Wade & Claybaugh 1980). Renal blood flow isalso reduced in proportion to the exercise inten-sity and may be as low as 25% of the resting levelduring strenuous exercise (Poortmans 1984).These factors combine to result in a decreasedurine flow during, and usually for some timeafter, exercise. The volume of water conserved by this decreased urine flow during exercise is small, probably amounting to no more than12–45ml · h–1 (Zambraski 1990): compared withwater losses in sweat, this volume is trivial.
Exercise normally results in a decrease in therenal excretion of sodium and an increased excre-tion of potassium, although the effect on potas-sium excretion is rather variable (Zambraski1990). These effects appear to be largely due to anincreased rate of aldosterone production duringexercise. Although the concentrations of sodium,and more especially of potassium, in the urineare generally high relative to the concentrationsin extracellular fluid, the extent of total urinary
thermoregulation and fluid balance 213

electrolyte losses in most exercise situations issmall.
References
Adolph, A. & Associates (1947) Physiology of Man in theDesert. Wiley, New York.
Allan, J.R. & Wilson, C.G. (1971) Influence of acclimati-zation on sweat sodium secretion. Journal of AppliedPhysiology 30, 708–712.
Bar-Or, O. (1989) Temperature regulation during exer-cise in children and adolescents. In Perspectives inExercise Science and Sports Medicine. Vol. 2. Youth,Exercise, and Sport (ed. C.V. Gisolfi & D.R. Lamb), pp.335–362. Benchmark Press, Indianapolis, IN.
Beller, G.A., Maher, J.T., Hartley, L.H., Bass, D.E. &Wacker, W.E.C. (1972) Serum Mg and K concentra-tions during exercise in thermoneutral and hot con-ditions. Physiologist 15, 94.
Castenfors, J. (1977) Renal function during prolongedexercise. Annals of the New York Academy of Sciences301, 151–159.
Costill, D.L. (1977) Sweating: its composition andeffects on body fluids. Annals of the New York Academyof Science 301, 160–174.
Costill, D.L. & Miller, J.M. (1980) Nutrition forendurance sport. International Journal of Sports Medicine 1, 2–14.
Costill, D.L., Branam, G., Fink, W. & Nelson, R. (1976)Exercise induced sodium conservation: changes inplasma renin and aldosterone. Medicine and Science inSports and Exercise 8, 209–213.
Fitzsimons, J.T. (1990) Evolution of physiological andbehavioural mechanisms in vertebrate body fluidhomeostasis. In Thirst: Physiological and PsychologicalAspects (ed. D.J. Ramsay & D.A. Booth), pp. 3–22.ILSI Human Nutrition Reviews. Springer-Verlag,London.
Fortney, S.M., Wenger, C.B., Bove, J.R. & Nadel, E.R.(1984) Effect of hyperosmolality on control of bloodflow and sweating. Journal of Applied Physiology 57,1688–1695.
Fortney, S.M., Vroman, N.B., Beckett, W.S., Permutt, S.& LaFrance, N.D. (1988) Effect of exercise hemo-concentration and hyperosmolality on exerciseresponses. Journal of Applied Physiology 65, 519–524.
Greenleaf, J.E., Castle, B.L. & Card, D.H. (1974) Bloodelectrolytes and temperature regulation during exer-cise in man. Acta Physiologica Polonica 25, 397–410.
Gregory, J., Foster, K., Tyler, H. & Wiseman, M. (1990)The Dietary and Nutritional Survey of British Adults.HMSO, London.
Harrison, M.H., Edwards, R.J. & Fennessy, P.A. (1978)Intravascular, volume and tonicity as factors in the
214 nutrition and exercise
regulation of body temperature. Journal of AppliedPhysiology 44, 69–75.
Hubbard, R.W., Szlyk, P.C. & Armstrong, L.E. (1990)Influence of thirst and fluid palatability on fluidingestion. In Perspectives in Exercise Science and SportsMedicine. Vol. 3. Fluid Homeostasis during Exercise (ed.C.V. Gisolfi & D.R. Lamb), pp. 39–95. BenchmarkPress, Indianapolis, IN.
Kavanagh, T. & Shephard, R.J. (1975) Maintenance ofhydration in ‘post-coronary’ marathon runners.British Journal of Sports Medicine 9, 130–135.
Kenney, W.L. (1995) Body fluid and temperature regu-lation as a function of age. In Perspectives in ExerciseScience and Sports Medicine. Vol. 8. Exercise in OlderAdults (ed. D.R. Lamb, C.V. Gisolfi & E.R. Nadel), pp.305–352. Benchmark Press, Indianapolis, IN.
Kenney, W.L. (1998) Heat flux and storage in hot envi-ronments. International Journal of Sports Medicine 19,S92–S95.
Ladell, W.S.S. (1965) Water and salt (sodium chloride)intakes. In The Physiology of Human Survival (ed. O.Edholm & A. Bacharach), pp. 235–299. AcademicPress, New York.
Leithead, C.S. & Lind, A.R. (1964) Heat Stress and HeatDisorders. Casell, London.
LeMagnen, J. & Tallon, S.A. (1967) Les determinantsquantitatif de la prise hydratique dans ses relationsavec la prise d’aliments chez le rat. Comptes RenduesSociety of Biology 161, 1243–1246.
Maughan, R.J. (1985) Thermoregulation and fluidbalance in marathon competition at low ambienttemperature. International Journal of Sports Medicine 6,15–19.
Maughan, R.J. (1991) Effects of CHO–electrolyte solu-tion on prolonged exercise. In Perspectives in ExerciseScience and Sports Medicine. Vol. 4. Ergogenics:Enhancement of Performance in Exercise and Sport (ed.D.R. Lamb & M.H. Williams), pp. 35–85. BenchmarkPress, Carmel, CA.
Maughan, R.J. (1994a) Physiology and nutrition formiddle distance and long distance running. In Per-spectives in Exercise Science and Sports Medicine. Vol. 7.Physiology and Nutrition in Competitive Sport (ed. D.R.Lamb, H.G. Knuttgen & R. Murray), pp. 329–371.Cooper, Carmel, CA.
Maughan, R.J. (1994b) Fluid and electrolyte loss andreplacement in exercise. In Oxford Textbook of SportsMedicine (ed. M. Harries, G. Williams, W.D. Stanish &L.L. Micheli), pp. 82–93. Oxford University Press,New York.
Meyer, F., Bar-Or, O., MacDougall, D. & Heigenhauser,G.J.F. (1992) Sweat electrolyte loss during exercise inthe heat: effects of gender and maturation. Medicineand Science in Sports and Exercise 24, 776–781.
Meytes, I., Shapira, Y., Magazanik, A., Meytes, D. &Seligsohn, U. (1969) Physiological and biochemical
changes during a marathon race. International Journalof Biometeorology 13, 317.
Nielsen, B. (1996) Olympics in Atlanta: a fight againstphysics. Medicine and Science in Sports and Exercise 28,665–668.
Phillips, P.A., Rolls, B.J., Ledingham, J.G.G., Forsling,M.L. & Morton, J.J. (1985) Osmotic thirst and vaso-pressin release in humans: a double-blind crossoverstudy. American Journal of Physiology 248, R645–R650.
Poortmans, J. (1984) Exercise and renal function. SportsMedicine 1, 125–153.
Ramsay, D.J. (1989) The importance of thirst in themaintenance of fluid balance. In Clinical Endocrinol-ogy and Metabolism. Vol. 3, No. 2. Water and Salt Homeostasis in Health and Disease, pp. 371–391. Bailliere Tindall, London.
Rehrer, N.J. & Burke, L.M. (1996) Sweat losses duringvarious sports. Australian Journal of Nutrition andDietetics 53 (Suppl. 4), S13–S16.
Rolls, B.J., Wood, R.J., Rolls, E.T., Lind, W. & Ledingham, J.G.G. (1980) Thirst following waterdeprivation in humans. American Journal of Physiol-ogy 239, R476–R482.
Shirreffs, S.M. & Maughan, R.J. (1997) Whole bodysweat collection in man: an improved method withsome preliminary data on electrolyte composition.Journal of Applied Physiology 82, 336–341.
Stansbie, D., Tomlinson, K., Potman, J.M. & Walters,E.G. (1982) Hypothermia, hypokalaemia and mara-thon running. Lancet ii, 1336.
Sutton, J.R. (1990) Clinical implications of fluid imbal-ance. In Perspectives in Exercise Science and Sports Medicine. Vol. 3. Fluid Homeostasis during Exercise (ed.C.V. Gisolfi & D.R. Lamb), pp. 425–448. BenchmarkPress, Indianapolis, IN.
Verbalis, J.G. (1990) Inhibitory controls of drinking:satiation of thirst. In Thirst: Physiological and Psycho-logical Aspects (ed. D.J. Ramsay & D.A. Booth), pp.313–334. ILSI Human Nutrition Reviews. Springer-Verlag, London,
Verde, T., Shephard, R.J., Corey, P. & Moore, R. (1982)Sweat composition in exercise and in heat. Journal ofApplied Physiology 53, 1540–1545.
Wade, C.E. & Claybaugh, J.R. (1980) Plasma renin activ-ity, vasopressin concentration and urinary excretoryresponses to exercise in men. Journal of Applied Physiology 49, 930–936.
Whiting, P.H., Maughan, R.J. & Miller, J.D.B. (1984)Dehydration and serum biochemical changes inrunners. European Journal of Applied Physiology 52,183–187.
Wyndham, C.H., Morrison, J.F. & Williams, C.G. (1965)Heat reactions of male and female Caucasians.Journal of Applied Physiology 20, 357–364.
Zambraski, E.J. (1990) Renal regulation of fluid homeostasis during exercise. In Perspectives in Exercise Science and Sports Medicine. Vol. 3. FluidHomeostasis during Exercise (ed. C.V. Gisolfi & C.V. Lamb), pp. 247–280. Benchmark Press, Carmel,CA.
thermoregulation and fluid balance 215

Introduction
Athletes encounter heat stress from climatic con-ditions (e.g. temperature, humidity, solar load)and body heat production. Depending on the climatic conditions, the relative contributions ofevaporative and dry (radiative and conductive)heat exchange to the total heat loss will vary. Thehotter the climate, the greater the dependence on evaporative heat loss and, thus, on sweating.Therefore, a substantial volume of body watermay be lost via sweating to enable evaporativecooling in hot environments. In addition, physi-cal exercise will elevate metabolic rate aboveresting levels, and thus increase the rate at whichheat must be dissipated to the environment tokeep core temperature from rising to dangerouslevels. Environmental heat stress and physicalexercise interact synergistically and may pushphysiological systems to their limits (Sawka et al.1996b).
Climatic heat stress and physical exercise willcause both fluid and electrolyte imbalances thatneed to be re-established (Marriott 1993, 1994;Convertino et al. 1996). Athletes performing exercise in the heat often incur body waterdeficits. Generally, athletes dehydrate duringexercise because of fluid non-availability or amismatch between thirst and body water
requirements (Greenleaf 1992). In theseinstances, the athlete starts exercise euhydrated,but incurs an exercise-heat-mediated dehydra-tion over a prolonged period. This scenario iscommon for many athletic and occupational set-tings; however, there are several sports (e.g.boxing, power lifting, wrestling) where athleteswill purposely achieve hypohydration prior to competition.
This chapter reviews fluid balance in the heatand the effects of hydration status on tempera-ture regulation and physical exercise perfor-mance. Throughout this chapter, euhydrationrefers to normal body water content, hypohydra-tion refers to body water deficit, and hyperhydra-tion refers to increased body water content.
Fluid and electrolyte balance
An athlete’s sweating rate is dependent upon theclimatic conditions, clothing worn and exerciseintensity (Molnar et al. 1946; Shapiro et al. 1982).Figure 16.1 provides a range of sweating ratesexpected from running in different climatic con-ditions (Sawka & Pandolf 1990). Athletes per-forming high-intensity exercise commonly havesweating rates of 1.0–2.5 l · h–1 while in the heat.These high sweating rates, however, are notmaintained continuously and are dependentupon the person’s need to dissipate body heat.Daily fluid requirements range (for sedentary toactive persons) from 2 to 4 l ·day–1 in temperateclimates and from 4 to 10 l ·day–1 in hot climates(Greenleaf 1994). Clearly, hot weather and
Chapter 16
Effects of Dehydration and Rehydration on Performance*
MICHAEL N. SAWKA, WILLIAM A. LATZKAAND SCOTT J. MONTAIN
216
*The views, opinions and/or findings contained in thischapter are those of the authors and should not be con-strued as an official Department of Army position ordecision, unless so designated by other official documentation.

intense training can greatly increase daily fluidrequirements.
Electrolytes, primarily sodium chloride and, toa lesser extent, potassium, calcium and magne-sium, are contained in sweat. Sweat sodium con-centration averages approximately 35 mmol · l–1
(range, 10–70mmol · l–1) and varies dependingupon diet, sweating rate, hydration and heatacclimation level (Allan & Wilson 1971; Brouns1991). Sweat glands reabsorb sodium by activetransport, and the ability to reabsorb sodiumdoes not increase with the sweating rate, so athigh sweating rates the concentration of sweatsodium increases. Heat acclimation improves theability to reabsorb sodium so acclimated personshave lower sweat sodium concentrations (> 50%reduction) for any sweating rate (Dill et al. 1933;Bass et al. 1955; Allan & Wilson 1971). Sweatpotassium concentration averages 5 mmol · l–1
(range, 3–15 mmol · l–1), calcium averages 1mmol · l–1 (range, 0.3–2 mmol · l–1) and mag-nesium averages 0.8 mmol · l–1 (range, 0.2–1.5mmol · l–1) (Brouns 1991). Electrolyte supple-mentation is not necessary, except occasionallyfor their first several days of heat exposure where
evidence indicates that this is warranted (Mar-riott 1994; Convertino et al. 1996), as normaldietary sodium intake will replenish sweat elec-trolyte losses (Marriott 1994; Convertino et al.1996).
During exercise in the heat, a principalproblem is to avoid hypohydration by matchingfluid consumption to sweat loss. This is a difficultproblem because thirst does not provide a goodindex of body water requirements (Adolph &Associates 1947; Hubbard et al. 1984; Engell et al.1987). Thirst is probably not perceived until anindividual has incurred a water deficit of approx-imately 2% body weight loss (BWL) (Adolph &Associates 1947; Hubbard et al. 1984; Armstronget al. 1985b). In addition, ad libitum water intakeduring exercise in the heat results in an incom-plete replacement of body water losses (Adolph& Associates 1947; Hubbard et al. 1984). Heat-acclimated persons will usually only replace lessthan one half of their fluid deficit when replacingfluid ad libitum (Adolph & Associates 1947). As a result, it is likely that unless forced hydration is stressed, some dehydration will occur duringexercise in the heat. Humans will usually fully
effects of dehydration and rehydration 217
3.0
2.5
2.0
1.5
1.0
0.5
0Sw
eati
ng
rat
e (l
. h–1
)
Hot and humid
Cool and dry
160 200 240 280 320
Running speed (m min–1)
16 15 14 13 12 11 910 8
Running speed (min km –1 run).
.Fig. 16.1 An approximation ofhourly sweating rates as afunction of climate and runningspeed. From Sawka and Pandolf(1990).

rehydrate at mealtime, when fluid consumptionis stimulated by consuming food (Adolph &Associates 1947; Marriott 1993). Therefore, activepersons need to stress drinking at mealtime inorder to avoid persistent hypohydration.
Persons will hypohydrate by 2–6% BWLduring situations of stress and prolonged highsweat loss. Water is the largest component of thehuman body, comprising 45–70% of body weight(Sawka 1988). The average male (75 kg) is com-posed of about 45 l of water, which correspondsto about 60% of body weight. Since adiposetissue is about 10% water and muscle tissue isabout 75% water, a person’s total body waterdepends upon their body composition. In addi-tion, muscle water and glycogen content paralleleach other probably because of the osmotic pres-sure exerted by glycogen granules within themuscle’s sarcoplasm (Neufer et al. 1991). As aresult, trained athletes have a relatively greatertotal body water than their sedentary counter-parts, by virtue of a smaller percentage body fatand perhaps a higher skeletal muscle glycogenconcentration.
The water contained in body tissues is distrib-uted between the intracellular and extracellularfluid spaces. Hypohydration mediated by sweat-ing will influence each fluid space as a con-sequence of free fluid exchange. Nose andcolleagues (1983) determined the distribution ofBWL among the fluid spaces as well as amongdifferent body organs. They thermally dehy-drated rats by 10% BWL, and after the animalsregained their normal core temperature, thebody water measurements were obtained. Thewater deficit was apportioned between the intra-cellular (41%) and extracellular (59%) spaces;and among the organs: 40% from muscle, 30%from skin, 14% from viscera and 14% from bone.Neither the brain nor liver lost significant watercontent. They concluded that hypohydrationresults in water redistribution largely from theintra- and extracellular spaces of muscle and skinin order to defend blood volume.
Sweat-induced hypohydration will decreaseplasma volume and increase plasma osmoticpressure in proportion to the level of fluid loss
218 nutrition and exercise
(Sawka et al. 1996a). Plasma volume decreasesbecause it provides the precursor fluid for sweat,and osmolality increases because sweat is ordi-narily hypotonic relative to plasma. Sodium andchloride are primarily responsible for the ele-vated plasma osmolality (Senay 1968; Kubica et al. 1983). It is the plasma hyperosmolalitywhich mobilizes fluid from the intracellular tothe extracellular space to enable plasma volumedefence in hypohydrated subjects. This conceptis demonstrated by heat-acclimated personswho, compared with unacclimated persons,have a smaller plasma volume reduction for agiven body water deficit (Sawka 1992). By virtueof having a more dilute sweat, heat-acclimatedpersons retain additional solutes within theextracellular space to exert an osmotic pressureand redistribute fluid from the intracellularspace (Mack & Nadel 1996).
Some persons use diuretics for medical pur-poses or to reduce their body weight. Diureticsincrease urine formation and often result in theloss of solutes. Commonly used diuretics includethiazide (e.g. Diuril), carbonic anhydraseinhibitors (e.g. Diamox) and furosemide (e.g.Lasix). Diuretic-induced hypohydration oftenresults in an iso-osmotic hypovolaemia, with amuch greater ratio of plasma loss to body waterloss than either exercise or heat-induced hypohy-dration. Relatively less intracellular fluid is lostafter diuretic administration, since there is not anextracellular solute excess to stimulate redistri-bution of body water.
Exercise performance and temperature regulation
Numerous studies have examined the influenceof hypohydration on maximal aerobic power andphysical exercise capacity. In temperate climates,a body water deficit of less than 3% BWL does notalter maximal aerobic power (Sawka et al. 1996a).Maximal aerobic power has been reported asbeing decreased (Buskirk et al. 1958; Caldwell etal. 1984; Webster et al. 1990) when hypohydrationequalled or exceeded 3% BWL. Therefore, a criti-cal water deficit (3% BWL) might exist before
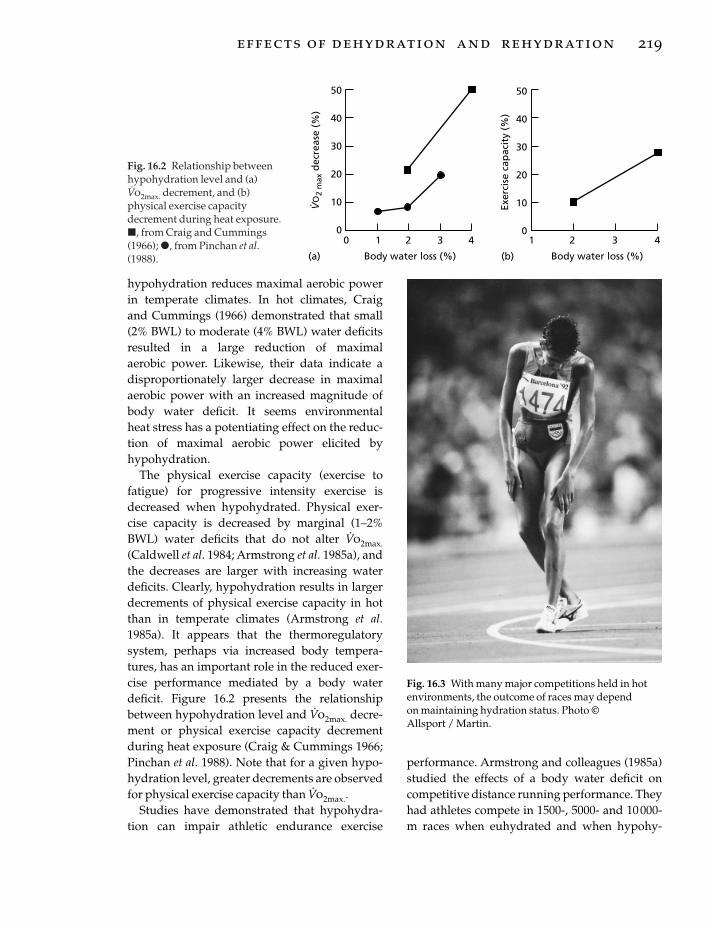
hypohydration reduces maximal aerobic powerin temperate climates. In hot climates, Craig and Cummings (1966) demonstrated that small(2% BWL) to moderate (4% BWL) water deficitsresulted in a large reduction of maximal aerobic power. Likewise, their data indicate adisproportionately larger decrease in maximalaerobic power with an increased magnitude ofbody water deficit. It seems environmental heat stress has a potentiating effect on the reduc-tion of maximal aerobic power elicited by hypohydration.
The physical exercise capacity (exercise tofatigue) for progressive intensity exercise isdecreased when hypohydrated. Physical exer-cise capacity is decreased by marginal (1–2%BWL) water deficits that do not alter V
.o2max.
(Caldwell et al. 1984; Armstrong et al. 1985a), andthe decreases are larger with increasing waterdeficits. Clearly, hypohydration results in largerdecrements of physical exercise capacity in hotthan in temperate climates (Armstrong et al.1985a). It appears that the thermoregulatorysystem, perhaps via increased body tempera-tures, has an important role in the reduced exer-cise performance mediated by a body waterdeficit. Figure 16.2 presents the relationshipbetween hypohydration level and V
.o2max. decre-
ment or physical exercise capacity decrementduring heat exposure (Craig & Cummings 1966;Pinchan et al. 1988). Note that for a given hypo-hydration level, greater decrements are observedfor physical exercise capacity than V
.o2max..
Studies have demonstrated that hypohydra-tion can impair athletic endurance exercise
performance. Armstrong and colleagues (1985a)studied the effects of a body water deficit oncompetitive distance running performance. Theyhad athletes compete in 1500-, 5000- and 10 000-m races when euhydrated and when hypohy-
effects of dehydration and rehydration 219
50
40
30
20
10
0
50
40
30
20
10
00 1 2 3 4 1 2 3 4
Body water loss (%) Body water loss (%)(a) (b)
VO
2 m
ax d
ecre
ase
(%)
. Exer
cise
cap
acit
y (%
)
Fig. 16.2 Relationship betweenhypohydration level and (a)V.o2max. decrement, and (b)
physical exercise capacitydecrement during heat exposure.�, from Craig and Cummings(1966); �, from Pinchan et al.(1988).
Fig. 16.3 With many major competitions held in hotenvironments, the outcome of races may depend on maintaining hydration status. Photo © Allsport / Martin.

drated. Hypohydration was achieved by diureticadministration (furosemide), which decreasedbody weight by 2% and plasma volume by 11%.Running performance was impaired at all racedistances, but to a greater extent in the longerraces (ª5% for the 5000 and 10 000 m) than theshorter race (3% for the 1500 m). Burge et al.(1993) recently examined whether hypohydra-tion (3% BWL) affected simulated 2000 m rowingperformance. They found that, on average, ittook 22s longer to complete the task when hypo-hydrated than when euhydrated. Average powerwas reduced by 5% in the hypohydrated state.
Two studies have examined the adverse effectsof hypohydration on moderate to intense cycleergometer performance. In both studies, high-intensity performance tests were conductedimmediately after 55–60min of cycling duringwhich volunteers either drank nothing or dranksufficient fluid to replace sweat losses. Walsh et al. (1994) reported that time to fatigue whencycling at 90% V
.o2max. was 51% longer (6.5 vs.
9.8min) when subjects drank sufficient fluids toprevent hypohydration. Below et al. (1995) foundthat cyclists completed a performance ride 6.5%faster if they drank fluids during exercise. Theresults of these studies clearly demonstrate thedetrimental effects of hypohydration in submax-imal exercise performance.
Investigators have documented the effects ofhypohydration on a person’s ability to tolerateheat strain during submaximal intensity exer-cise. These studies demonstrate that personswho drink can continue to exercise in the heat formany hours, whereas those who under-drinkdiscontinue because of exhaustion (Adolph &Associates 1947; Ladell & Shephard 1961; Sawkaet al. 1992). To address whether hypohydrationalters heat tolerance, Sawka and colleagues(1992) had subjects walk to voluntary exhaustionwhen either euhydrated or hypohydrated (by 8% of total body water). The experiments were designed so that the combined environ-ment (Ta, 49°C; rh, 20%) and exercise intensity (47% V
.o2max.) would not allow thermal equilib-
rium and heat exhaustion would eventuallyoccur. Hypohydration reduced tolerance time
220 nutrition and exercise
(121–55 min), but more important, hypohydra-tion reduced the core temperature that a personcould tolerate. Heat exhaustion occurred at acore temperature approximately 0.4°C lowerwhen hypohydrated than when euhydrated.These findings indicate that hypohydration notonly impairs exercise performance, but alsoreduces tolerance to heat strain.
Hypohydration increases core temperatureresponses during exercise in temperate (Grandeet al. 1959; Cadarette et al. 1984) and hot (Sawka et al. 1983, 1985) climates. A critical water deficitof 1% body weight elevates core temperatureduring exercise (Ekblom et al. 1970). As the mag-nitude of water deficit increases, there is a con-comitant graded elevation of core temperatureduring exercise heat stress (Sawka et al. 1985;Montain & Coyle 1992). Figure 16.4 illustratesrelationships between BWL and core tempera-ture elevations reported by studies (Adolph &Associates 1947; Strydom & Holdsworth 1968;Sawka et al. 1985; Montain & Coyle 1992) whichexamined several hypohydration levels (Sawkaet al. 1996a). The magnitude of core temperatureelevation ranges from 0.1 to 0.23°C for every per-centage body weight lost. Hypohydration not
A
B
C
D
0 1 2 3 4 5 6 7
Body water loss (%)
1.6
1.4
1.2
1.0
0.8
0.6
0.4
0.2
0
Incr
ease
in c
ore
tem
per
atu
re (
C)
Fig. 16.4 Relationship between the elevation in coretemperature (above euhydration) at a givenhypohydration level during exercise with heat stress,according to different studies: A, 65% V
.o2max., 33°C db
(Montain & Coyle 1992); B, marching in the desert(Adolph & Associates 1947); C, 25% V
.o2max., 49°C db
(Sawka et al. 1985); D, 45 W, 34°C db (Strydom &Holdsworth 1968). From Sawka et al. (1996a).

only elevates core temperature responses, but it negates the core temperature advantages con-ferred by high aerobic fitness and heat acclima-tion (Buskirk et al. 1958; Sawka et al. 1983;Cadarette et al. 1984).
Hypohydration impairs both dry and evapo-rative heat loss (or, if the air is warmer than theskin, dehydration aggravates dry heat gain)(Sawka et al. 1985, 1989; Kenney et al. 1990;Montain et al. 1995). Figure 16.5 presents localsweating responses (Sawka et al. 1989) and skinblood flow responses (Kenney et al. 1990) tohypohydration (5% BWL) during exercise in theheat. This figure indicates that hypohydrationreduced both effector heat loss responses for agiven core temperature level (Sawka 1992).Hypohydration is usually associated with eitherreduced or unchanged whole-body sweatingrates at a given metabolic rate in the heat (Sawkaet al. 1984). However, even when hypohydrationis associated with no change in sweating rate,core temperature is usually elevated, so thatsweating rate for a given core temperature islower when hypohydrated.
Hyperhydration
Hyperhydration, increased total body water, hasbeen suggested to improve thermoregulation
during exercise-heat stress above euhydrationlevels (Sawka et al. 1996a). The concept thathyperhydration might be beneficial for exerciseperformance arose from the adverse conse-quences of hypohydration. Studies examiningthermoregulatory effects of hyperhydrationduring exercise-heat stress have reported dis-parate results. Some investigators report lowercore temperatures during exercise after hyperhy-dration (Moroff & Bass 1965; Nielsen et al. 1971;Gisolfi & Copping 1974; Nielsen 1974; Grucza et al. 1987), while other studies do not (Greenleaf& Castle 1971; Nadel et al. 1980; Candas et al.1988). Also, several studies (Moroff & Bass 1965;Nielsen 1974; Lyons et al. 1990) report highersweating rates with hyperhydration. In moststudies, heart rate was lower during exercisewith hyperhydration (Sawka et al. 1996a).
We believe that these conflicting results aredue to differences in experimental design andnot hyperhydration per se. For example, studies(Moroff & Bass 1965; Nielsen et al. 1971; Lyons et al. 1990) reporting that hyperhydrationreduces thermal strain have not had subjectsfully replace fluid lost during exercise; therefore,the differences reported may be due to dehydra-tion causing increased thermal strain during‘control’ conditions. Maintaining euhydrationduring exercise is essential to determine the effi-
effects of dehydration and rehydration 221
1.4
1.0
0.6
0.2
20
16
12
8
436 37 38 39 36 37 38 39
Core temperature ( C)(a) (b) Core temperature ( C)
Swea
tin
g r
ate
(l. h
–1)
Blo
od
flo
w (
ml. 1
00 m
l–1. m
in–1
)
Fig. 16.5 (a) Local sweating rate (Sawka et al. 1989), and (b) forearm skin blood flow (Kenney et al. 1990) responsesfor euhydrated (—) and hypohydrated (5% body water loss) (---) persons during exercise with heat stress. FromSawka (1992).

cacy of hyperhydration on thermoregulationduring exercise-heat stress. In addition, somestudies (Moroff & Bass 1965; Nielsen et al. 1971)report that overdrinking before exercise loweredbody core temperature prior to exercise. This waslikely due to the caloric cost of warming theingested fluid. Exercise per se did not exacerbatethe difference that existed prior to exercise.Hyperhydration in these studies therefore didnot improve heat dissipation during the exerciseperiod.
While many studies have attempted to inducehyperhydration by overdrinking water or water-electrolyte solutions, these approaches have pro-duced only transient expansions of body water.One problem often encountered is that much ofthe fluid overload is rapidly excreted (Freund et al. 1995). Some evidence has been accrued thatgreater fluid retention can be achieved by drink-ing an aqueous solution containing glycerolwhile resting in temperate conditions (Riedesel et al. 1987; Freund et al. 1995). Riedesel et al. (1987)first reported that following hyperhydrationwith a glycerol solution, rather than with wateralone, subjects excreted significantly less of thewater load. They found that subjects drinkingglycerol solutions achieved greater hyperhydra-tion than subjects drinking water while resting in temperate conditions. Freund et al. (1995)reported that glycerol increased fluid retentionby reducing free water clearance. Exercise andheat stress decrease renal blood flow and freewater clearance and therefore both stressorsmight reduce glycerol’s effectiveness as a hyper-hydrating agent.
Lyons et al. (1990) reported that glycerol/waterhyperhydration had dramatic effects on improv-ing a person’s ability to thermoregulate duringexercise-heat stress. Subjects completed threetrials in which they exercised in a hot (42°C)climate. For one trial, fluid ingestion wasrestricted to 5.4 ml ·kg–1 body weight, and in the other two trials subjects ingested water (21.4 ml ·kg–1) with or without a bolus of glycerol(1 g ·kg–1). Subjects began exercise 90 min afterthis hyperhydration period. Glycerol ingestionincreased fluid retention by 30% compared to
222 nutrition and exercise
drinking water alone. During exercise, glycerolhyperhydration produced a higher sweating rate(300–400 ml ·h–1) and substantially lower coretemperatures (0.7°C) than those produced incontrol conditions with water hyperhydration.These thermoregulatory benefits during exer-cise-heat stress have not been confirmed. Otherstudies report similar core temperatures andsweating rates between glycerol and waterhyperhydration fluids before exercise (Montneret al. 1996) in a temperate climate, or as rehydra-tion solutions during exercise in a warm climate(Murray et al. 1991).
Recently, Latzka and colleagues (1997) exam-ined the effects of hyperhydration on fluidbalance and thermoregulation during exercise-heat stress. Their approach was to determine ifpre-exercise hyperhydration with and withoutglycerol would improve sweating responses and reduce core temperature. The glycerol andwater dosages were similar to those employed byRiedesel et al. (1987) and Lyons et al. (1990).Latzka and colleagues (1997) found that duringexercise (45% V
.o2max.) in the heat (35°C, 45% rh),
there was no difference between hyperhydrationmethods for increasing total body water (ª1.5 l).In addition, unlike euhydration, hyperhydra-tion did not alter core temperature (rectal oreosophageal), skin temperature, local sweatingrate, sweating threshold, sweating sensitivity orheart rate responses. Likewise, no differenceswere found between water and glycerol hyper-hydration methods for these physiologicalresponses. Latzka and colleagues (1997) con-cluded that hyperhydration provides no ther-moregulatory advantage over the maintenanceof euhydration.
Conclusion
During exercise, sweat output often exceedswater intake, producing a body water deficit orhypohydration. The water deficit lowers bothintracellular and extracellular volume. It alsoresults in plasma hypertonicity and hypo-volaemia. Aerobic exercise tasks are likely to beadversely affected by hypohydration, with the

potential affect being greater in warm environ-ments. Hypohydration increases heat storageand reduces one’s ability to tolerate heat strain.The increased heat storage is mediated byreduced sweating rate and reduced skin bloodflow for a given core temperature. Hyperhydra-tion has been suggested to reduce thermal strainduring exercise in the heat; however, data sup-porting that notion are not robust.
References
Adolph, E.F. & Associates (1947) Physiology of Man inthe Desert. Intersciences, New York.
Allan, J.R. & Wilson, C.G. (1971) Influence of acclimati-zation on sweat sodium concentration. Journal ofApplied Physiology 30, 708–712.
Armstrong, L.E., Costill, D.L. & Fink, W.J (1985a) Influ-ence of diuretic-induced dehydration on competitiverunning performance. Medicine and Science in Sportsand Exercise 17, 456–461.
Armstrong, L.E., Hubbard, R.W., Szlyk, P.C., Matthew,W.T. & Sils, I.V. (1985b) Voluntary dehydration andelectrolyte losses during prolonged exercise in theheat. Aviation and Space Environmental Medicine 56,765–770.
Bass, D.E., Kleeman, C.R., Quinn, M., Henschel, A. &Hegnauer, A.H. (1955) Mechanisms of acclimatiza-tion to heat in man. Medicine 34, 323–380.
Below, P.R., Mora-Rodríguez, R., González-Alonso, J. &Coyle, E.F. (1995) Fluid and carbohydrate ingestionindependently improve performance during 1 h ofexercise. Medicine and Science in Sports and Exercise 27,200–210.
Brouns, F. (1991) Heat–sweat–dehydration–rehydration: a praxis oriented approach. Journal ofSports Science 9, 143–152.
Burge, C.M., Carey, M.F. & Payne, W.R. (1993) Rowingperformance, fluid balance, and metabolic functionfollowing dehydration and rehydration. Medicineand Science in Sports and Exercise 25, 1358–1364.
Buskirk, E.R., Iampietro, P.F. & Bass, D.E. (1958) Workperformance after dehydration: effects of physicalconditioning and heat acclimatization. Journal ofApplied Physiology 12, 189–194.
Cadarette, B.S., Sawka, M.N., Toner, M.M. & Pandolf,K.B. (1984) Aerobic fitness and the hypohydrationresponse to exercise-heat stress. Aviation and SpaceEnvironment Medicine 55, 507–512.
Caldwell, J.E., Ahonen, E. & Nousiainen, U. (1984) Differential effects of sauna-, diuretic-, and exercise-induced hypohydration. Journal of Applied Physiology57, 1018–1023.
Candas, V., Libert, J.P., Brandenberger, G., Sagot, J.C. &Kahn, J.M. (1988) Thermal and circulatory responsesduring prolonged exercise at different levels ofhydration. Journal of Physiology Paris 83, 11–18.
Convertino, V.A., Armstrong, L.E., Coyle, E.F. et al.(1996) American College of Sports Medicine PositionStand: exercise and fluid replacement. Medicine andScience in Sports and Exercise 28, i–vii.
Craig, F.N. & Cummings, E.G. (1966) Dehydration and muscular work. Journal of Applied Physiology 21, 670–674.
Dill, D.B., Jones, B.F., Edwards, H.T. & Oberg, S.A.(1933) Salt economy in extreme dry heat. Journal ofBiological Chemistry 100, 755–767.
Ekblom, B., Greenleaf, C.J., Greenleaf, J.E. & Hermansen, L. (1970) Temperature regulationduring exercise dehydration in man. Acta Physiolog-ica Scandinavica 79, 475–483.
Engell, D.B., Maller, O., Sawka, M.N., Francesconi, R.P.,Drolet, L.A. & Young, A.J (1987) Thirst and fluidintake following graded hypohydration levels inhumans. Physiology and Behaviour 40, 229–236.
Freund, B.J., Montain, S.J., Young, A.J. et al. (1995)Glycerol hyperhydration: hormonal, renal, and vascular fluid responses. Journal of Applied Physiology79, 2069–2077.
Gisolfi, C.V. & Copping, J.R. (1974) Thermal effects ofprolonged treadmill exercise in the heat. Medicine andScience in Sports 6, 108–113.
Grande, F., Monagle, J.E., Buskirk, E.R. & Taylor, H.L.(1959) Body temperature responses to exercise inman on restricted food and water intake. Journal ofApplied Physiology 14, 194–198.
Greenleaf, J.E. (1992) Problem: thirst, drinking behav-ior, and involuntary dehydration. Medicine andScience in Sports and Exercise 24, 645–656.
Greenleaf, J.E. (1994) Environmental issues that influ-ence intake of replacement beverages. In FluidReplacement and Heat Stress (ed. B.M. Marriott), pp.195–214. National Academy Press, Washington, DC.
Greenleaf, J.E. & Castle, B.L. (1971) Exercise tempera-ture regulation in man during hypohydration andhyperhydration. Journal of Applied Physiology 30,847–853.
Grucza, R., Szczypaczewska, M. & Kozlowski, S. (1987)Thermoregulation in hyperhydrated men duringphysical exercise. European Journal of Applied Physiol-ogy 56, 603–607.
Hubbard, R.W., Sandick, B.L., Matthew, W.T. et al.(1984) Voluntary dehydration and alliesthesia forwater. Journal of Applied Physiology 57, 868–875.
Kenney, W.L., Tankersley, C.G., Newswanger, D.L.,Hyde, D.E., Puhl, S.M. & Turnera, N.L. (1990) Ageand hypohydration independently influence theperipheral vascular response to heat stress. Journal ofApplied Physiology 8, 1902–1908.
effects of dehydration and rehydration 223

Kubica, R., Nielsen, B., Bonnesen, A., Rasmussen, I.B.,Stoklosa, J. & Wilk, B. (1983) Relationship betweenplasma volume reduction and plasma electrolytechanges after prolonged bicycle exercise, passiveheating and diuretic dehydration. Acta PhysiologicaPolonica 34, 569–579.
Ladell, W.S.S. & Shephard, R.J (1961) Aldosterone inhi-bition and acclimatization to heat. Journal of Physiol-ogy 160, 19–20.
Latzka, W.A., Sawka, M.N., Montain, S. et al. (1997)Hyperhydration: thermoregulatory effects duringcompensable exercise — heat stress. Journal of AppliedPhysiology 83, 860–866.
Lyons, T.P., Riedesel, M.L., Meuli, L.E. & Chick, T.W.(1990) Effects of glycerol-induced hyperhydrationprior to exercise in the heat on sweating and coretemperature. Medicine and Science in Sports and Exercise 22, 477–483.
Mack, G.W. & Nadel, E.R. (1996) Body fluid balanceduring heat stress in humans. In Environmental Physi-ology (ed. M.J. Fregly & C.M. Blatteis), pp. 187–214.Oxford University Press, New York.
Marriott, B.M. (1993) Nutritional Needs in Hot Environ-ments: Application for Military Personnel in Field Opera-tions. National Academy Press, Washington, DC.
Marriott, B.M. (1994) Fluid Replacement and Heat Stress.National Academy Press, Washington, DC.
Molnar, G.W., Towbin, E.J., Gosselin, R.E., Brown, A.H.& Adolph, E.F. (1946) A comparative study of water,salt and heat exchanges of men in tropical and desert environments. American Journal of Hygiene 44,411–433.
Montain, S.J. & Coyle, E.F. (1992) Influence of gradeddehydration on hyperthermia and cardiovasculardrift during exercise. Journal of Applied Physiology 73,1340–1350.
Montain, S.J., Latzka, W.A. & Sawka, M.N. (1995)Control of thermoregulatory sweating is altered byhydration level and exercise intensity. Journal ofApplied Physiology 79, 1434–1439.
Montner, P., Stark, D.M., Riedesel, M.L. et al. (1996)Pre-exercise glycerol hydration improves cyclingendurance time. International Journal of Sports Medi-cine 17, 27–33.
Moroff, S.V. & Bass, D.E. (1965) Effects of overhydra-tion on man’s physiological responses to work in theheat. Journal of Applied Physiology 20, 267–270.
Murray, R., Eddy, D.E., Paul, G.L., Seifert, J.G. &Halaby, G.A. (1991) Physiological responses to glyc-erol ingestion during exercise. Journal of Applied Phys-iology 71, 144–149.
Nadel, E.R., Fortney, S.M. & Wenger, C.B. (1980) Effectof hydration state on circulatory and thermal regula-tions. Journal of Applied Physiology 49, 715–721.
Neufer, P.D., Sawka, M.N., Young, A., Quigley, M.,Latzka, W.A. & Levine, L. (1991) Hypohydration
224 nutrition and exercise
does not impair skeletal muscle glycogen resynthesisafter exercise. Journal of Applied Physiology 70,1490–1494.
Nielsen, B. (1974) Effects of changes in plasma volumeand osmolarity on thermoregulation during exercise.Acta Physiologica Scandinavica 90, 725–730.
Nielsen, B., Hansen, G., Jorgensen, S.O. & Nielsen, E.(1971) Thermoregulation in exercising man duringdehydration and hyperhydration with water andsaline. International Journal of Biometeorology 15,195–200.
Nose, H., Morimoto, T. & Ogura, K. (1983) Distributionof water losses among fluid compartments of tissuesunder thermal dehydration in the rat. Journal of Phys-iology 33, 1019–1029.
Pinchan, G., Gauttam, R.K., Tomar, O.S. & Bajaj, A.C.(1988) Effects of primary hypohydration on physicalwork capacity. International Journal of Biometeorology32, 176–180.
Riedesel, M.L., Allen, D.Y., Peake, G.T. & Al-Qattan, K.(1987) Hyperhydration with glycerol solutions.Journal of Applied Physiology 63, 2262–2268.
Sawka, M.N. (1988) Body fluid responses and hypohy-dration during exercise-heat stress. In Human Perfor-mance Physiology and Environmental Medicine atTerrestrial Extremes (ed. K.B. Pandolf, M.N. Sawka & R.R. Gonzalez), pp. 227–266. Cooper Publishing,Indianapolis, IN.
Sawka, M.N. (1992) Physiological consequences ofhydration: exercise performance and thermoregula-tion. Medicine and Science in Sports and Exercise 24,657–670.
Sawka, M.N. & Pandolf, K.B. (1990) Effects of bodywater loss on physiological function and exerciseperformance. In Perspectives in Exercise Science andSports Medicine. Vol. 3. Fluid Homeostasis during Exer-cise (ed. C.V. Gisolfi & D.R. Lamb), pp. 1–38. Bench-mark Press, Carmel, IN.
Sawka, M.N., Toner, M.M., Francesconi, R.P. & Pandolf,K.B. (1983) Hypohydration and exercise: effects ofheat acclimation, gender, and environment. Journal ofApplied Physiology 55, 1147–1153.
Sawka, M.N., Francesconi, R.P., Young, A.J. & Pandolf,K.B. (1984) Influence of hydration level and bodyfluids on exercise performance in the heat. Journal ofthe American Medical Association 252, 1165–1169.
Sawka, M.N., Young, A.J., Francesconi, R.P., Muza, S.R.& Pandolf, K.B. (1985) Thermoregulatory and bloodresponses during exercise at graded hypohydrationlevels. Journal of Applied Physiology 59, 1394–1401.
Sawka, M.N., Gonzalez, R.R., Young, A.J., Dennis, R.C.,Valeri, C.R. & Pandolf, K.B. (1989) Control of ther-moregulatory sweating during exercise in the heat.American Journal of Physiology 257, R311–R316.
Sawka, M.N., Young, A.J., Latzka, W.A., Neufer, P.D.,Quigley, M.D. & Pandolf, K.B. (1992) Human toler-

ance to heat strain during exercise: influence ofhydration. Journal of Applied Physiology 73, 368–375.
Sawka, M.N., Montain, S.J. & Latzka, W.A. (1996a)Body fluid balance during exercise: heat exposure. InBody Fluid Balance: Exercise and Sport (ed. E.R. Buskirk& S.M. Puhl), pp. 143–161. CRC Press, Boca Raton,FL.
Sawka, M.N., Wenger, C.B. & Pandolf, K.B. (1996b)Thermoregulatory responses to acute exercise-heat stress and heat acclimation. In Handbook of Phys-iology. Section 4. Environmental Physiology (ed. M.JFregly & C.M. Blatteis), pp. 157–185. Oxford Univer-sity Press, New York.
Senay, L.C. (1968) Relationship of evaporative rates toserum [Na+], [K+], and osmolality in acute heat stress.Journal of Applied Physiology 25, 149–152.
Shapiro, Y., Pandolf, K.B. & Goldman, R.F. (1982) Pre-dicting sweat loss response to exercise, environmentand clothing. European Journal of Applied Physiology48, 83–96.
Strydom, N.B. & Holdsworth, D.L. (1968) The effects ofdifferent levels of water deficit on physiologicalresponses during heat stress. Internationale Zeitschriftfür Angewandte Physiologie 26, 95–102.
Walsh, R.M., Noakes, T.D., Hawley, J.A. & Dennis, S.C.(1994) Impaired high-intensity cycling performancetime at low levels of dehydration. InternationalJournal of Sports Medicine 15, 392–398.
Webster, S., Rutt, R. & Weltman, A. (1990) Physiologicaleffects of a weight loss regimen practiced by collegewrestlers. Medicine and Science in Sports and Exercise22, 229–234.
effects of dehydration and rehydration 225

Introduction
As described in the previous chapters, the sweat-ing mechanism is effective in limiting the rise inbody temperature that occurs during exercisebut, if the exercise is severe and prolonged andthe climatic conditions hot and humid, the de-hydration that results will inevitably have anadverse effect of exercise capacity. Sweat lossesequivalent to 2–5% of body mass are oftenincurred in the course of endurance events, and if these are not replaced, the dehydration thatensues may precipitate circulatory collapse andheat illness. Fluid replacement is thereforeimportant in situations where some degree ofsweating is unavoidable: prolonged hard exer-cise in extreme conditions may increase the totaldaily water requirement from about 2.5 l to some-thing in excess of 12–15 l. Even though thisamounts to about 25–30% of total body watercontent for the average individual, such condi-tions can be tolerated for prolonged periods provided that the sweat losses are replaced. The choice of rehydration beverage will vary,depending on the circumstances, and requires anawareness of the extent of water and electrolytelosses and of substrate utilization by the workingmuscles as well as some understanding of thepsychological and physiological factors thatinfluence the rehydration process.
Sweat losses in exercise
The physics of heat exchange between the
human body and the environment have beendescribed in several excellent reviews (e.g. Nadel1988). Sweating is an effective mechanism of heat loss when heat loss by physical transfercannot prevent a rise in core temperature. Theheat required to evaporate 1 kg of sweat from theskin surface is approximately 2.6 MJ (620 kcal),allowing high rates of heat loss from the body tobe achieved, provided only that sweat secretionis possible and that evaporation can occur.Although high temperature poses a threat to theathlete by adding to the heat load and reducingheat loss by physical transfer, high humidity,which prevents the evaporation of sweat, is more of a challenge: heat loss is limited, leadingto hyperthermia, and high sweat rates occurwithout effective heat loss, leading to dehydra-tion. The combination of hyperthermia andhypohydration will reduce exercise performanceand may lead to potentially fatal heat illness(Sutton 1990).
Several different factors will interact to deter-mine the sweat rate during exercise. The majordeterminants are the metabolic heat load and the environmental conditions of temperature,radiant heat load, humidity and wind speed, butthere is a large interindividual variability in thesweating response even in standardized condi-tions. Although the sweat loss incurred on adaily basis by an athlete during training will bedetermined largely by the training load (inten-sity, duration and frequency of training sessions)and weather conditions, there will also be aneffect of the amount and type of clothing worn, of
Chapter 17
Water and Electrolyte Loss and Replacement in Exercise
RONALD J. MAUGHAN
226
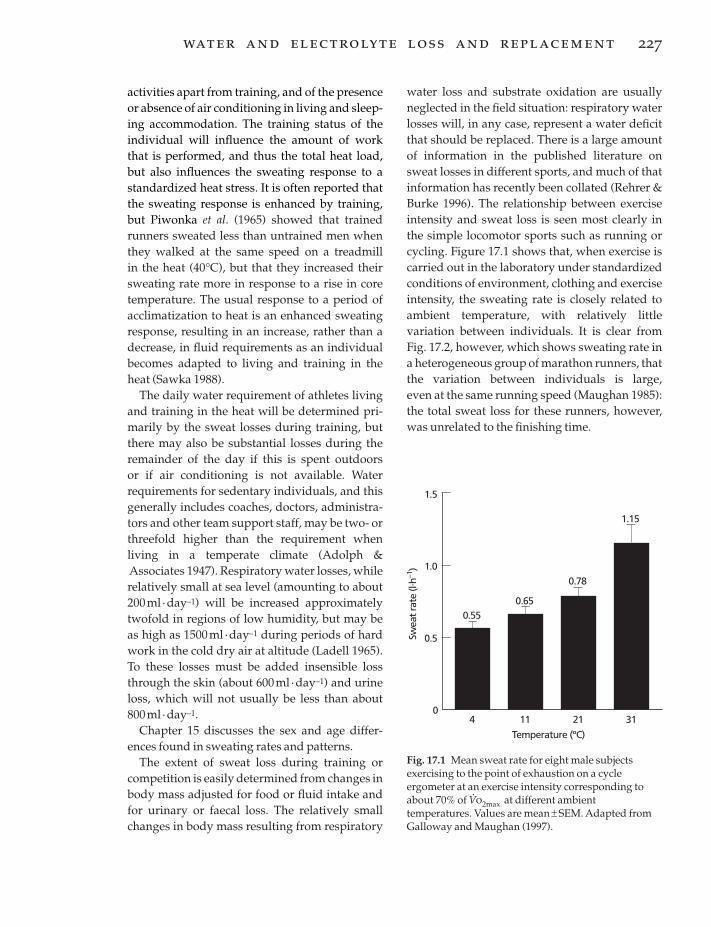
activities apart from training, and of the presenceor absence of air conditioning in living and sleep-ing accommodation. The training status of theindividual will influence the amount of workthat is performed, and thus the total heat load,but also influences the sweating response to astandardized heat stress. It is often reported thatthe sweating response is enhanced by training,but Piwonka et al. (1965) showed that trainedrunners sweated less than untrained men whenthey walked at the same speed on a treadmill in the heat (40°C), but that they increased theirsweating rate more in response to a rise in coretemperature. The usual response to a period ofacclimatization to heat is an enhanced sweatingresponse, resulting in an increase, rather than adecrease, in fluid requirements as an individualbecomes adapted to living and training in theheat (Sawka 1988).
The daily water requirement of athletes livingand training in the heat will be determined pri-marily by the sweat losses during training, butthere may also be substantial losses during theremainder of the day if this is spent outdoors or if air conditioning is not available. Waterrequirements for sedentary individuals, and thisgenerally includes coaches, doctors, administra-tors and other team support staff, may be two- orthreefold higher than the requirement whenliving in a temperate climate (Adolph &Associates 1947). Respiratory water losses, whilerelatively small at sea level (amounting to about200ml · day–1) will be increased approximatelytwofold in regions of low humidity, but may beas high as 1500 ml ·day–1 during periods of hardwork in the cold dry air at altitude (Ladell 1965).To these losses must be added insensible lossthrough the skin (about 600ml · day–1) and urineloss, which will not usually be less than about800ml · day–1.
Chapter 15 discusses the sex and age differ-ences found in sweating rates and patterns.
The extent of sweat loss during training orcompetition is easily determined from changes inbody mass adjusted for food or fluid intake andfor urinary or faecal loss. The relatively smallchanges in body mass resulting from respiratory
water loss and substrate oxidation are usuallyneglected in the field situation: respiratory waterlosses will, in any case, represent a water deficitthat should be replaced. There is a large amountof information in the published literature onsweat losses in different sports, and much of thatinformation has recently been collated (Rehrer &Burke 1996). The relationship between exerciseintensity and sweat loss is seen most clearly inthe simple locomotor sports such as running orcycling. Figure 17.1 shows that, when exercise iscarried out in the laboratory under standardizedconditions of environment, clothing and exerciseintensity, the sweating rate is closely related toambient temperature, with relatively little variation between individuals. It is clear fromFig. 17.2, however, which shows sweating rate ina heterogeneous group of marathon runners, thatthe variation between individuals is large, even at the same running speed (Maughan 1985):the total sweat loss for these runners, however,was unrelated to the finishing time.
water and electrolyte loss and replacement 227
0
0.5
Temperature (ºC)
Swea
t rat
e (l.
h–1)
3121
1.0
1.5
114
0.65
0.78
1.15
0.55
Fig. 17.1 Mean sweat rate for eight male subjectsexercising to the point of exhaustion on a cycleergometer at an exercise intensity corresponding toabout 70% of V
.o2max. at different ambient
temperatures. Values are mean ± SEM. Adapted fromGalloway and Maughan (1997).

Electrolyte composition of sweat:implications for electrolyte balance
Electrolyte losses in sweat are a function ofsweating rate and sweat composition, and bothof these vary over time as well as being substan-tially influenced by the exercise conditions andthe physiology of the individual. Added to thisvariability is the difficulty in obtaining a reliableestimate of sweat composition (Shirreffs &Maughan 1997): as well as problems of contami-nation of the sample and of ensuring complete-ness of collection, there are regional variations inelectrolyte content, so measurements made at asingle site may not reflect whole body losses.
In spite of the variability in the composition of sweat, it is invariably isotonic with respect to plasma, although the major electrolytes aresodium and chloride, as in the extracellular space(Table 17.1). It is usual to present the compositionin mmol · l–1, and the extent of the sodium lossesin relation to daily dietary intake, which isusually expressed in grams, is not widely appre-ciated. Loss of 1 litre of sweat with a sodiumcontent of 50 mmol · l–1 represents a loss of 2.9 g ofsodium chloride: the athlete who sweats 5 l in adaily training session will therefore lose almost15g of salt. Daily dietary intakes for the 95% ofthe young male UK population fall between 3.8
228 nutrition and exercise
and 14.3g with a mean of 8.4g: the correspond-ing values for young women are 2.8–9.4g, with a mean value of 6.0g (Gregory et al. 1990). For the same population, mean urinary sodiumlosses were reported to account for about 175mmol · day–1 (Gregory et al. 1990), which is equiv-alent to about 10.2 g of sodium chloride. Evenallowing for a decreased urinary output whensodium losses in sweat are large, it is clear thatthe salt balance of individuals exercising in theheat is likely to be precarious. The possible needfor supplementary salt intake in extreme condi-tions will be discussed below.
The potassium concentration of sweat is high
25
20
15
10
5
0150 180 210 240 270 300 330
Finishing time (min)
Swea
t ra
te (
g. m
in–1
)
Fig. 17.2 Sweat rates for subjectswho competed in a marathon raceheld in cool (about 12°C)conditions. The sweat rate wasclosely related to the runningspeed, but there was a largevariation between individuals, evenat the same speed. Total sweat losswas unrelated to finishing time. r = – 0.629; P < 0.001. FromMaughan (1985).
Table 17.1 Concentration (mmol · l-1) of the majorelectrolytes in sweat, plasma and intracellular water.Values are taken from a variety of sources identified inMaughan (1994).
Sweat Plasma Intracellular
Sodium 20–80 130–155 10Potassium 4–8 3.2–5.5 150Calcium 0–1 2.1–2.9 0Magnesium < 0.2 0.7–1.5 15Chloride 20–60 96–110 8Bicarbonate 0–35 23–28 10Phosphate 0.1–0.2 0.7–1.6 65Sulphate 0.1–2.0 0.3–0.9 10

relative to that in the extracellular fluid, and thisis often quoted to suggest that sweat losses willresult in the need for potassium supplementa-tion, but the sweat concentration is low relativeto the intracellular potassium concentration(Table 17.1). The potassium loss in sweat (about4–8mmol · l–1, or 0.15–0.3g · l–1) is small relative tothe typical daily intake of about 3.2g for men and 2.4 g for women (Gregory et al. 1990). In spiteof the relatively high concentration of potassiumin sweat, the normal response to exercise is forthe plasma potassium concentration to increasedue to efflux of potassium from the intracellularspace, primarily from muscles, liver and redblood cells (Maughan 1994).
There is generally little change in the plasmamagnesium concentration during exercise, but aslight fall may occur during prolonged exercise,and this has been attributed to the loss of magne-sium in sweat. Some support for the idea thatlosses in sweat may be responsible comes fromthe observation of a larger fall in the serum mag-nesium concentration during exercise in the heatthan at neutral temperatures (Beller et al. 1972),but a redistribution of the body’s labile magne-sium seems to be a more likely explanation forany fall in plasma magnesium concentrationduring exercise (Maughan 1994). Although theconcentration of magnesium in sweat is high relative to that in the plasma (Table 17.1), theplasma content represents only a small fractionof the whole body store; Costill and Miller (1980)estimated that only about 1% of the body storesof these electrolytes was lost when individualswere dehydrated by about 6% of body mass.
Magnesium loss in sweat is considered bysome athletes and coaches to be a potentiallyserious problem and to be a contributing factor to exercise-induced muscle cramp, resulting insuggestions that magnesium salts should beincluded in the formulation of drinks intendedfor consumption during exercise, but there islittle evidence to substantiate this belief. Addi-tion of magnesium to intravenous fluids admin-istered to athletes with cramp after a triathlonwas shown not to be effective in relieving the cramp (O’Toole et al. 1993). The causes of
exercise-induced muscle cramp are not wellunderstood, and descriptive studies measuringchanges in blood or plasma electrolyte concen-trations or sweat losses of electrolytes areunlikely to provide any answers.
The sweating response to exercise is influ-enced by the hydration status of the individual,and sweat rates and thus thermoregulatorycapacity, will fall if a fluid deficit is incurred(Sawka 1988). Less sweat is secreted for anygiven increase in core temperature. For reason-ably well hydrated individuals, however, drinking during exercise seems to have little(Cage et al. 1970) or no (Davis & Yousef 1987)effect on sweating rate and to have no effect onsweat composition, even when plain water or electrolyte-containing solutions are consumed.Senay and Christensen (1965), however, ob-served that fluid ingestion in dehydrated sub-jects exposed for prolonged periods to hot (43°C)dry (<40% rh) conditions stimulated a promptsweating response and increased skin bloodflow, suggesting that fluid ingestion may restorethermoregulatory capacity in dehydrated indi-viduals. It is clear that most of the benefits interms of physiological responses and perfor-mance capacity that accrue from a period ofacclimatization are lost if an individual becomesdehydrated (Sawka 1988).
Gastrointestinal function andavailability of ingested fluids
The available evidence suggests that most ath-letes do not ingest sufficient fluid to replacelosses (Murray 1996). In some situations, oppor-tunities for replacement are limited by the rulesof sport, with drinks being available only duringscheduled breaks in play, but even when there isunlimited access to fluids, intake is generally lessthan loss.
The first physical barrier to the availability ofingested fluids is the rate of gastric emptying,which controls the rate at which fluids are deliv-ered to the small intestine and the extent towhich they are influenced by the gastric secre-tions. The rate of emptying is determined by
water and electrolyte loss and replacement 229
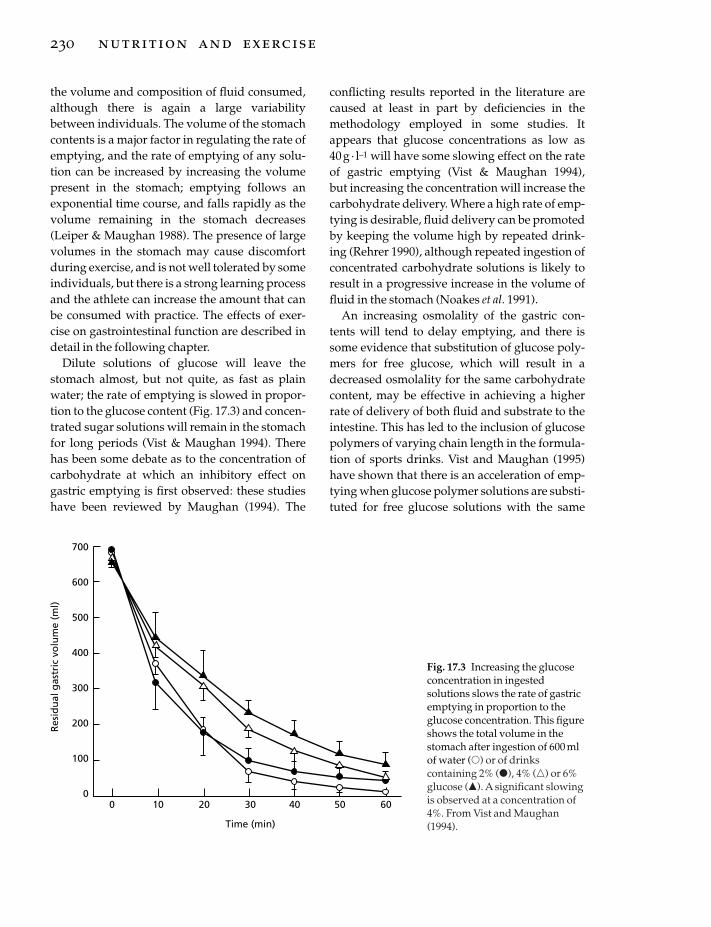
the volume and composition of fluid consumed,although there is again a large variabilitybetween individuals. The volume of the stomachcontents is a major factor in regulating the rate ofemptying, and the rate of emptying of any solu-tion can be increased by increasing the volumepresent in the stomach; emptying follows anexponential time course, and falls rapidly as thevolume remaining in the stomach decreases(Leiper & Maughan 1988). The presence of largevolumes in the stomach may cause discomfortduring exercise, and is not well tolerated by someindividuals, but there is a strong learning processand the athlete can increase the amount that canbe consumed with practice. The effects of exer-cise on gastrointestinal function are described indetail in the following chapter.
Dilute solutions of glucose will leave thestomach almost, but not quite, as fast as plainwater; the rate of emptying is slowed in propor-tion to the glucose content (Fig. 17.3) and concen-trated sugar solutions will remain in the stomachfor long periods (Vist & Maughan 1994). Therehas been some debate as to the concentration ofcarbohydrate at which an inhibitory effect ongastric emptying is first observed: these studieshave been reviewed by Maughan (1994). The
230 nutrition and exercise
conflicting results reported in the literature arecaused at least in part by deficiencies in themethodology employed in some studies. Itappears that glucose concentrations as low as 40g · l–1 will have some slowing effect on the rateof gastric emptying (Vist & Maughan 1994), but increasing the concentration will increase thecarbohydrate delivery. Where a high rate of emp-tying is desirable, fluid delivery can be promotedby keeping the volume high by repeated drink-ing (Rehrer 1990), although repeated ingestion ofconcentrated carbohydrate solutions is likely toresult in a progressive increase in the volume offluid in the stomach (Noakes et al. 1991).
An increasing osmolality of the gastric con-tents will tend to delay emptying, and there issome evidence that substitution of glucose poly-mers for free glucose, which will result in adecreased osmolality for the same carbohydratecontent, may be effective in achieving a higherrate of delivery of both fluid and substrate to theintestine. This has led to the inclusion of glucosepolymers of varying chain length in the formula-tion of sports drinks. Vist and Maughan (1995)have shown that there is an acceleration of emp-tying when glucose polymer solutions are substi-tuted for free glucose solutions with the same
700
600
500
400
300
200
100
00 10 20 30 40 50 60
Time (min)
Res
idu
al g
astr
ic v
olu
me
(ml)
Fig. 17.3 Increasing the glucoseconcentration in ingestedsolutions slows the rate of gastricemptying in proportion to theglucose concentration. This figureshows the total volume in thestomach after ingestion of 600 mlof water (�) or of drinkscontaining 2% (�), 4% (�) or 6%glucose (�). A significant slowingis observed at a concentration of4%. From Vist and Maughan(1994).

energy density: at low (about 4%) concentra-tions, this effect is small, but it becomes apprecia-ble at higher (18%) concentrations; where theosmolality is the same (as in the 4% glucose solu-tion and 18% polymer solution), the energydensity is shown to be of far greater significancein determining the rate of gastric emptying (Fig.17.4). This effect may therefore be importantwhen large amounts of energy must be replacedafter exercise, but is unlikely to be a major factorduring exercise where more dilute drinks aretaken. There may be benefits in including anumber of different carbohydrates, includingfree glucose, sucrose and maltodextrin: this hastaste implications, which may influence theamount consumed, and may maximize the rateof sugar and water absorption in the small intes-tine (Shi et al. 1995).
The temperature of ingested drinks has beenreported to have an influence on the rate of emp-
tying, and it has been recommended that drinksshould be chilled to promote gastric emptying(American College of Sports Medicine 1984). Thebalance of the available evidence, however, indi-cates that there is not a large effect of tempera-ture on the rate of gastric emptying of ingestedliquids (Maughan 1994). Lambert and Maughan(1992) used a deuterium tracer technique to showthat water ingested at high temperature (50°C)appears in the circulation slightly faster than ifthe drink is chilled (4°C) before ingestion. Thetemperature will, of course, affect palatability,and drinks that are chilled are likely to be preferred and therefore consumed in greatervolumes (Hubbard et al. 1990). Other factors,such as pH, may have a minor role to play.Although there is some evidence that emptyingis hastened if drinks are carbonated, more recentresults suggest that carbonation has no effect(Lambert et al. 1993): it is probable that light car-bonation as used in most sports drinks does notinfluence the gastric emptying rate, but a greaterdegree of carbonation, as used in many softdrinks, may promote emptying of the gastriccontents by raising the intragastric pressure.Zachwieja et al. (1992) have shown that carbon-ated and non-carbonated carbohydrate (10%)solutions were equally effective in improvingcycling performance relative to water adminis-tration: there was no effect of carbonation on therate of gastric emptying or on the reported preva-lence of gastrointestinal symptoms. Lambert et al. (1993) did report a greater sensation ofstomach fullness in exercising subjects drinkinga carbonated 6% carbohydrate solution relativeto the same drink without carbonation, but therewas no apparent effect on physiological function.
No net absorption of carbohydrate, water orelectrolytes occurs in the stomach, but rapidabsorption of glucose occurs in the small intes-tine, and is an active, energy-consuming processlinked to the transport of sodium. There is noactive transport mechanism for water, which willcross the intestinal mucosa in either directiondepending on the local osmotic gradients. Thefactors which govern sugar and water absorp-tion have been extensively reviewed (Schedl et al.
water and electrolyte loss and replacement 231
700
600
500
400
300
200
100
00 10 20 30 40 50 60
Time (min)
Res
idu
al g
astr
ic v
olu
me
(ml)
Fig. 17.4 Substituting glucose polymers for freeglucose reduces the inhibitory effect on gastricemptying. This figure shows the total volume in thestomach after ingestion of 600 ml of drinks containingglucose at concentrations of 4% (�) or 18.8% (�) or ofglucose polymer at concentrations of 4% (�) or 18.8%(�). The difference between isoenergetic solutions issmall at low concentrations but becomes meaningful athigh carbohydrate concentrations. Adapted from Vistand Maughan (1995).
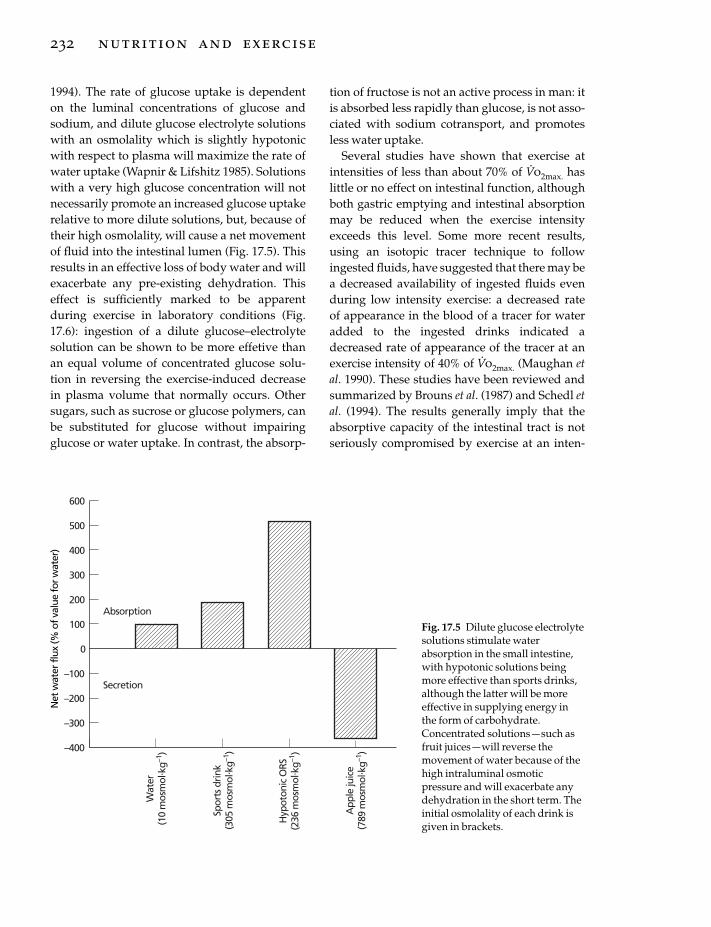
1994). The rate of glucose uptake is dependent on the luminal concentrations of glucose andsodium, and dilute glucose electrolyte solutionswith an osmolality which is slightly hypotonicwith respect to plasma will maximize the rate ofwater uptake (Wapnir & Lifshitz 1985). Solutionswith a very high glucose concentration will notnecessarily promote an increased glucose uptakerelative to more dilute solutions, but, because oftheir high osmolality, will cause a net movementof fluid into the intestinal lumen (Fig. 17.5). Thisresults in an effective loss of body water and willexacerbate any pre-existing dehydration. Thiseffect is sufficiently marked to be apparentduring exercise in laboratory conditions (Fig.17.6): ingestion of a dilute glucose–electrolytesolution can be shown to be more effetive than an equal volume of concentrated glucose solu-tion in reversing the exercise-induced decrease in plasma volume that normally occurs. Othersugars, such as sucrose or glucose polymers, canbe substituted for glucose without impairingglucose or water uptake. In contrast, the absorp-
232 nutrition and exercise
tion of fructose is not an active process in man: itis absorbed less rapidly than glucose, is not asso-ciated with sodium cotransport, and promotesless water uptake.
Several studies have shown that exercise atintensities of less than about 70% of V
.o2max. has
little or no effect on intestinal function, althoughboth gastric emptying and intestinal absorptionmay be reduced when the exercise intensityexceeds this level. Some more recent results,using an isotopic tracer technique to followingested fluids, have suggested that there may bea decreased availability of ingested fluids evenduring low intensity exercise: a decreased rate of appearance in the blood of a tracer for wateradded to the ingested drinks indicated adecreased rate of appearance of the tracer at anexercise intensity of 40% of V
.o2max. (Maughan et
al. 1990). These studies have been reviewed andsummarized by Brouns et al. (1987) and Schedl etal. (1994). The results generally imply that theabsorptive capacity of the intestinal tract is notseriously compromised by exercise at an inten-
600
–400
200
0
–300
Spor
ts d
rink
(305
mos
mol
. kg–1
)
–200
–100
100
300
400
500
Absorption
Secretion
Wat
er(1
0 m
osm
ol. k
g–1)
Hyp
oton
ic O
RS(2
36 m
osm
ol. k
g–1)
App
le ju
ice
(789
mos
mol
. kg–1
)
Net
wat
erflu
x(%
ofva
lue
forw
ater
)
Fig. 17.5 Dilute glucose electrolytesolutions stimulate waterabsorption in the small intestine,with hypotonic solutions beingmore effective than sports drinks,although the latter will be moreeffective in supplying energy inthe form of carbohydrate.Concentrated solutions — such asfruit juices — will reverse themovement of water because of thehigh intraluminal osmoticpressure and will exacerbate anydehydration in the short term. Theinitial osmolality of each drink isgiven in brackets.

sity that can be sustained for long enough (about40min or more) for fluid intake to be seriouslyconsidered.
Electrolyte replacement during exercise
Commercially available sports drinks intendedfor use by athletes in training and competitionare generally rather similar in their electrolytecontent, suggesting a consensus, at least amongthe manufacturers, as to the requirements forelectrolyte replacement (Table 17.2). It is clearthat the major requirement is for addition ofsodium, which is important in improving palat-ability and maintaining the drive to drink(Hubbard et al. 1990), for the absorption ofglucose and of water in the small intestine(Maughan 1994), and for the maintenance of theextracellular volume (Hubbard et al. 1990).
In spite of the need to replace sodium, the mainrequirement is for replacement after exercise (seeChapter 19). During exercise, the plasma sodiumconcentration normally rises as water is lost inexcess of sodium. When the exercise duration islikely to exceed 3–4 h, there may be advantages in adding sodium to drinks to avoid the dangerof hyponatraemia, which has been reported tooccur when excessively large volumes of drinkswith a low sodium content are taken (Noakes etal. 1990). This condition, however, is rather rare,and does not in itself justify the inclusion ofsodium in drinks intended for use in exercisewhere sweat losses do not exceed a few litres.The optimum sodium concentration for use insports drinks intended for consumption duringexercise has not been established, as this willvary depending on the conditions and on theindividual, but is likely to be between about 20and 40 mmol · l–1.
water and electrolyte loss and replacement 233
Exercise
0 15 30 45 60 75 90 105 120
Time (min)
10
5
0
–5
–10
–15
–20
Ch
ang
e in
pla
sma
volu
me
(%)
** *
*
*
***
*
Fig. 17.6 Because of the fastergastric emptying and fasterintestinal absorption of water,ingestion of dilute carbohydrate–electrolyte solutions (�) is moreeffective in restoring plasma volumeduring and after exercise comparedwith ingestion of an equal volume ofconcentrated glucose solution (�).Values are mean ± SEM; *, P < 0.05;**, P < 0.01. Adapted from Maughanet al. (1987).
Table 17.2 Composition of some of the most widely used commercial sports drinks.
Carbohydrate Sodium Potassium Osmolality(g · 100ml-1) (mmol · l-1) (mmol · l-1) (mosmol · kg-1)
Allsport 8.0 10 6Gatorade 6.0 18 3 330–340Isostar 6.5 17 5Lucozade Sport 6.9 23 5 260–280Powerade 8.0 10 4

Potassium is normally present in commercialsports drinks in concentrations similar to those in plasma and in sweat (see Tables 17.1, 17.2), butthere is little evidence to support its inclusion.Although there is some loss of potassium insweat, an increase in the circulating potassiumconcentration is the normal response to exercise:increasing this further by ingestion of potassiumdoes not seem useful. Compared with the totaldaily intake of potassium (about 80 mmol formen and 60 mmol for women; Gregory et al.1990), the amounts present in sports drinks aresmall. Replacement of losses will normally beachieved after exercise: 1 litre of orange juice willprovide about 30mmol of potassium, and tomatojuice contains about twice this amount. A similarsituation applies with magnesium replacement,and there seems to be no good reason for its addi-tion to drinks consumed during exercise.
Choice of rehydration fluids
The aim of ingesting drinks during exercise is toenhance performance, and the choice of drinkswill therefore be dictated by the need to addressthe potential causes of fatigue. Provision of sub-strate, usually in the form of carbohydrate, tosupplement the body’s endogenous stores, andreplacement of water lost in sweat are theprimary concerns. In some situations, replace-ment of the electrolytes lost in sweat alsobecomes important. Because of the interactionsamong the different components of a drink,however, it is difficult to analyse these require-ments separately. There are also many differentsituations in sport which will dictate the compo-sition of drinks to be taken. The final formulationmust also take account of the taste characteristicsand palatability of the drink: not only will thisinfluence the amount of fluid that the athlete con-sumes, but it will also have a major effect on howhe or she feels.
The duration and intensity of exercise will bethe main determinant of the extent of depletionof the body’s carbohydrate reserves, and thesame factors, together with the climatic condi-tions, will determine the extent of sweat loss.
234 nutrition and exercise
There will however, always be a large variabilitybetween individuals in their response and there-fore in their requirements. The requirements forrehydration and substrate provision will also beinfluenced by activity in the preceding hours anddays. In a tournament competition in soccer,hockey or rugby, which may involve more thanone game in a single day, or in a multistage cyclerace with events on successive days, there isunlikely to be complete recovery from the previ-ous round, and the requirements will be differentfrom those in a single event for which properpreparation has been possible.
These difficulties are immediately apparentwhen any of the published guidelines for fluidintake during exercise is examined. Guidelinesare generally formulated to include the needs ofmost individuals in most situations, with theresults that the outer limits become so wide as tobe, at best meaningless, and at worst positivelyharmful. The American College of Sports Medicine published a Position Statement in 1984on the prevention of heat illness in distancerunning: the recommendations for fluid replace-ment during running events were more specificthan an earlier (1975) version of these guidelines.It was suggested that marathon runners shouldaim for an intake of 100–200ml of fluid every 2–3km, giving a total intake of 1400–4200 ml at the extremes. For the elite runner, who takes onlya little over 2h to complete the distance, thiscould mean an intake of about 2 l · h–1, whichwould not be well tolerated; it is equally unlikelythat an intake of 300ml ·h–1 would be adequatefor the slowest competitors, except perhapswhen the ambient temperature was low. Thesesame guidelines also recommended that the bestfluid to drink during prolonged exercise is coolwater: in view of the accumulated evidence onthe performance-enhancing effects of addingglucose and electrolytes, this recommendationseems even less acceptable than it was in 1984.This has now been recognized and a furtherupdated version of the Guidelines (AmericanCollege of Sports Medicine 1996) is in accordwith the current mainstream thinking: for eventslasting more than 60 min, the use of drinks con-
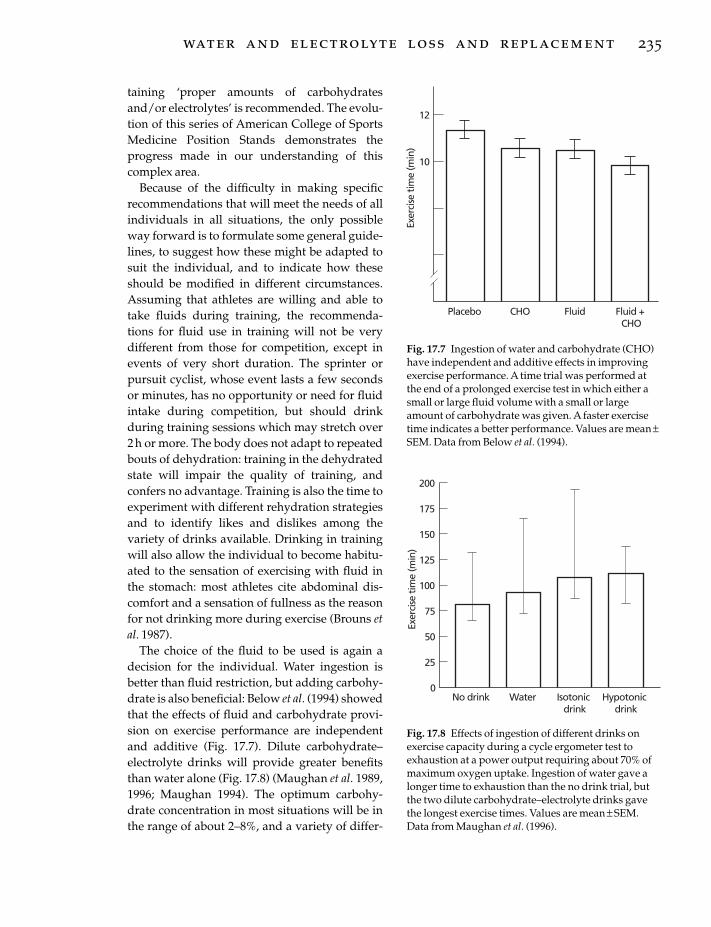
taining ‘proper amounts of carbohydratesand/or electrolytes’ is recommended. The evolu-tion of this series of American College of SportsMedicine Position Stands demonstrates theprogress made in our understanding of thiscomplex area.
Because of the difficulty in making specific recommendations that will meet the needs of allindividuals in all situations, the only possibleway forward is to formulate some general guide-lines, to suggest how these might be adapted tosuit the individual, and to indicate how theseshould be modified in different circumstances.Assuming that athletes are willing and able totake fluids during training, the recommenda-tions for fluid use in training will not be very different from those for competition, except inevents of very short duration. The sprinter orpursuit cyclist, whose event lasts a few secondsor minutes, has no opportunity or need for fluidintake during competition, but should drinkduring training sessions which may stretch over2h or more. The body does not adapt to repeatedbouts of dehydration: training in the dehydratedstate will impair the quality of training, andconfers no advantage. Training is also the time toexperiment with different rehydration strategiesand to identify likes and dislikes among thevariety of drinks available. Drinking in trainingwill also allow the individual to become habitu-ated to the sensation of exercising with fluid inthe stomach: most athletes cite abdominal dis-comfort and a sensation of fullness as the reasonfor not drinking more during exercise (Brouns etal. 1987).
The choice of the fluid to be used is again adecision for the individual. Water ingestion isbetter than fluid restriction, but adding carbohy-drate is also beneficial: Below et al. (1994) showedthat the effects of fluid and carbohydrate provi-sion on exercise performance are independentand additive (Fig. 17.7). Dilute carbohydrate–electrolyte drinks will provide greater benefitsthan water alone (Fig. 17.8) (Maughan et al. 1989,1996; Maughan 1994). The optimum carbohy-drate concentration in most situations will be inthe range of about 2–8%, and a variety of differ-
water and electrolyte loss and replacement 235
Exer
cise
tim
e (m
in)
10
12
Placebo CHO Fluid Fluid +CHO
Fig. 17.7 Ingestion of water and carbohydrate (CHO)have independent and additive effects in improvingexercise performance. A time trial was performed atthe end of a prolonged exercise test in which either asmall or large fluid volume with a small or largeamount of carbohydrate was given. A faster exercisetime indicates a better performance. Values are mean ±SEM. Data from Below et al. (1994).
75
Exer
cise
tim
e (m
in)
125
150
25
200
175
100
50
0No drink Water Isotonic
drinkHypotonic
drink
Fig. 17.8 Effects of ingestion of different drinks onexercise capacity during a cycle ergometer test toexhaustion at a power output requiring about 70% ofmaximum oxygen uptake. Ingestion of water gave alonger time to exhaustion than the no drink trial, butthe two dilute carbohydrate–electrolyte drinks gavethe longest exercise times. Values are mean ± SEM.Data from Maughan et al. (1996).

ent carbohydrates, either alone or in combina-tion, are effective. Glucose, sucrose, maltose andglucose oligomers are all likely to promoteimproved performance: addition of smallamounts of fructose to drinks containing othercarbohydrates seems to be acceptable, but highconcentrations of fructose alone are best avoidedbecause of a risk of gastrointestinal distress.Fructose is poorly absorbed, and an osmotic diarrhoea may occur after large doses. Somesodium should probably be present, with theoptimum concentration somewhere between 10and 60 mmol · l–1, but there is also a strong argu-ment that, in events of short duration, this maynot be necessary. Adding sodium will haveseveral consequences, the most important ofwhich are a stimulation of water absorption andthe maintenance of plasma volume. In events oflonger duration, replacement of sweat sodiumlosses and maintenance of plasma sodium con-centration and osmolality become importantconsiderations. Sodium chloride, in high concen-trations, may have a negative impact on taste,and home-made sports drinks generally scorebadly in this respect. There is little evidence tosuggest that small variations in the concentrationof these components of ingested fluids will sig-nificantly alter their efficacy. There is not atpresent any evidence to support the addition ofother components (potassium, magnesium,other minerals or vitamins) to drinks intended topromote or maintain hydration status.
In most situations, the volume of fluidingested is insufficient to match the sweat loss,and some degree of dehydration is incurred(Sawka & Pandolf 1990), and this suggests animportant role for palatability and other factorsthat encourage consumption. It also indicates theneed for an education programme to make ath-letes, coaches and officials aware of the need for an adequate fluid intake: a conscious effort isneeded to avoid dehydration. Noakes et al. (1993)reported that the voluntary fluid intake of athletes in endurance running events seldomexceeds about 0.5 l ·h–1, even though the sweatlosses are generally substantially higher thanthis. Even in relatively cool conditions and in
236 nutrition and exercise
sports that are less physically demanding thanmarathon running, sweat rates of more than 1 l ·h–1 are not uncommon (Rehrer & Burke 1996).
Pre-exercise hydration
Because of the need to minimize the impact ofsweat loss and volume depletion on exercise per-formance, it is important to ensure that exercisebegins with the individual fully hydrated. On thebasis that a further increase in the body watercontent may be beneficial, there have been manyattempts to induce overhydration prior to thecommencement of exercise, but these attemptshave usually been thwarted by the promptdiuretic response that ensues when the bodywater content is increased. Because this is largelya response to the dilution of blood sodium con-centration and plasma osmolality, attempts have been made to overcome this. Some degreeof temporary hyperhydration can be induced ifdrinks with sodium concentrations of 100 mmol ·l–1 or more are ingested, but this seems unlikelyto be beneficial for performance carried out in the heat, as a high plasma osmolality will ensuewith negative implications for thermoregulatorycapacity (Fortney et al. 1984).
An alternative strategy which has recentlybeen the subject of interest has attempted toinduce an expansion of the blood volume prior toexercise by the addition of glycerol to ingestedfluids. Glycerol in high concentrations has littlemetabolic effect, but exerts an osmotic actionwith the result that some of the water ingestedwith the glycerol will be retained rather thanbeing lost in the urine, although there must besome concern that the elevated osmolality of theextracellular space will result in some degree ofintracellular dehydration. The implications ofthis are at present unknown (Waldegger & Lang1998), but it might again be expected that theraised plasma osmolality will have negative consequences for thermoregulatory capacity. Theavailable evidence at the present time seems toindicate that this is not the case, but the results of studies investigating the effects on exerciseperformance of glycerol feeding before or during

exercise have shown mixed results (Miller et al.1983; Latzka et al. 1996). There have been somesuggestions of improved performance afteradministration of glycerol and water prior toprolonged exercise (Montner et al. 1996) but someearlier work clearly indicated that it did notimprove the capacity to perform prolonged exer-cise (Burge et al. 1993).
Postexercise rehydration
Rehydration and restoration of sweat electrolytelosses are both crucial parts of the recoveryprocess after exercise where significant sweatlosses have occurred, and these issues arecovered in detail in Chapter 19. In most sports,there is a need to recover as quickly and as com-pletely as possibly after training or competitionto begin preparation for the next event or train-ing session. The need for replacement will obvi-ously depend on the volume of sweat lost and onits electrolyte content, but will also be influencedby the amount of time available before the nextexercise bout. Rapid rehydration may also beimportant in events where competition is byweight category, including weightlifting and thecombat sports. It is common for competitors inthese events to undergo acute thermal and exer-cise-induced dehydration to make weight, withweight losses of 10% of body mass sometimesbeing achieved within a few days: the time inter-val between the weigh-in and competition is nor-mally about 3h, although it may be longer, and isnot sufficient for full recovery when significantamounts of weight have been lost, but somerecovery is possible. The practice of acute dehy-dration to make weight has led to a number offatalities in recent years, usually where exercisehas been performed in a hot environment whilewearing waterproof clothing to prevent theevaporation of sweat, and should be stronglydiscouraged, but it will persist and there is a needto maximize rehydration in the time available.
An awareness of the extent of volume and electrolyte loss during exercise will help plan therecovery strategy. Where speed of recovery isessential, a dilute glucose solution with added
sodium chloride is likely to be most effective inpromoting rapid recovery by maintaining a highrate of gastric emptying and promoting intestinalwater absorption: a hypotonic solution is likelyto be most effective (Maughan 1994). Completerestoration of volume losses requires that thetotal amount of fluid ingested in the recoveryperiod exceeds the total sweat loss: the recom-mendation often made that 1 litre of fluid shouldbe ingested for each kilogram of weight lostneglects to take account of the ongoing loss ofwater in urine, and it is recommended that thevolume of fluid ingested should be at least 50%more than the volume of sweat loss (Maughan &Shirreffs 1997).
It is more difficult, because of the wideinterindividual variability in the composition ofsweat, to make clear recommendations aboutelectrolyte replacement. It is clear, however, thatfailure to replace the electrolytes lost (principallysodium, but to some extent also potassium) willresult in a fall in the circulating sodium concen-tration and a fall in plasma osmolality, leading toa marked diuresis. The diuretic effect is observedeven when the individual may still be in negativefluid balance. If sufficient salt is ingestedtogether with an adequate volume of water, fluidbalance will be restored, and any excess solutewill be excreted by the kidneys (Maughan &Leiper 1995). A relatively high sodium content indrinks will also be effective in retaining a largeproportion of the ingested fluid in the extracellu-lar space, and maintenance of a high plasmavolume is important for maintenance of cardio-vascular function (Rowell 1986).
Conclusion
Water and electrolyte losses in sweat will resultin volume depletion and disturbances of elec-trolyte (especially sodium) balance. Sweat lossdepends on many factors, including especiallyenvironmental conditions, exercise intensity andduration, and the individual characteristics ofthe athlete. Replacement of losses will help main-tain exercise capacity and reduce the risk of heatillness. Replacement may be limited by the rates
water and electrolyte loss and replacement 237

of gastric emptying or of intestinal absorption,and dilute carbohydrate–electrolyte solutionscan optimize replacement. Electrolyte replace-ment is not a priority during exercise, but so-dium may be needed if sweat losses are verylarge and are replaced with plain water. Athletesshould ensure that, whenever possible, they are fully hydrated at the beginning of exercise.Rehydration after exercise requires that an ade-quate fluid volume is ingested and that elec-trolyte losses are replaced.
ReferencesAdolph, A. & Associates (1947) Physiology of Man in the
Desert. Wiley, New York.American College of Sports Medicine (1975) Position
statement on prevention of heat injuries during dis-tance running. Medicine and Science in Sports and Exer-cise 7, vii–ix.
American College of Sports Medicine (1984) Positionstand on prevention of thermal injuries during dis-tance running. Medicine and Science in Sports and Exer-cise 16, ix–xiv.
American College of Sports Medicine (1996) Exerciseand fluid replacement. Medicine and Science in Sportsand Exercise 28, i–vii.
Beller, G.A., Maher, J.T., Hartley, L.H. et al. (1972) SerumMg and K concentrations during exercise in ther-moneutral and hot conditions. The Physiologist 15,94.
Below, P., Mora-Rodriguez, R., Gonzalez-Alonso, J. &Coyle, E.F. (1994) Fluid and carbohydrate ingestionindependently improve performance during 1 h ofintense cycling. Medicine and Science in Sports andExercise 27, 200–210.
Brouns, F., Saris, W.H.M. & Rehrer, N.J. (1987) Abdomi-nal complaints and gastrointestinal function duringlong-lasting exercise. International Journal of SportsMedicine 8, 175–189.
Burge, C.M., Carey, M.F. & Payne, W.R. (1993) Rowingperformance, fluid balance and metabolic functionfollowing dehydration and rehydration. Medicineand Science in Sports and Exercise 25, 1358–1364.
Cage, G., Wolfe, S., Thompson, R. & Gordon, R. (1970)Effects of water intake on composition of thermalsweat in normal human volunteers. Journal of AppliedPhysiology 29, 687–690.
Costill, D.L. & Miller, J.M. (1980) Nutrition forendurance sport. International Journal of Sports Medicine 1, 2–14.
Davis, T.P. & Yousef, M.K. (1987) Sweat loss and volun-tary dehydration during work in humid heat. In
238 nutrition and exercise
Adaptive Physiology to Stressful Environments (ed. S.Samueloff & M.K. Yousef), pp. 103–110. CRC Press,Boca Raton, FL.
Fortney, S.M., Wenger, C.B., Bove, J.R. & Nadel, E.R.(1984) Effect of hyperosmolality on control of bloodflow and sweating. Journal of Applied Physiology 57,1688–1695.
Galloway, S.D.R. & Maughan, R.J. (1997) Effects ofambient temperature on the capacity to perform pro-longed cycle exercise in man. Medicine and Science inSports and Exercise 29, 1240–1249.
Gregory, J., Foster, K., Tyler, H. & Wiseman, M. (1990)The Dietary and Nutritional Survey of British Adults.HMSO, London.
Hubbard, R.W., Szlyk, P.C. & Armstrong, L.E. (1990)Influence of thirst and fluid palatability on fluid ingestion during exercise. In Perspectives inExercise Science and Sports Medicine. Vol. 3. FluidHomeostasis during Exercise (ed. C.V. Gisolfi & D.R.Lamb), pp. 103–110. Benchmark Press, Indianapolis,IN.
Ladell, W.S.S. (1965) Water and salt (sodium chloride)intakes. In The Physiology of Human Survival (ed. O.Edholm & A. Bacharach), pp. 235–299. AcademicPress, New York.
Lambert, C.P. & Maughan, R.J. (1992) Effect of tempera-ture of ingested beverages on the rate of accumula-tion in the blood of an added tracer for water uptake.Scandinavian Journal of Medicine and Science in Sports2, 76–78.
Lambert, G.P., Blieler, T.L., Chang, R.T. et al. (1993)Effects of carbonated and noncarbonated beveragesat specific intervals during treadmill running in theheat. International Journal of Sport Nutrition 2, 177–193.
Latzka, W.A., Sawka, M.N., Matott, R.P., Staab, J.E.,Montain, S.J. & Pandolf, K.B. (1996) Hyperhydration:Physiologic and Thermoregulatory Effects during Com-pensable and Uncompensable Exercise-heat Stress. USArmy Technical Report, T96-6.
Leiper, J.B. & Maughan, R.J. (1988) Experimentalmodels for the investigation of water and solutetransport in man: implications for oral rehydrationsolutions. Drugs 36 (Suppl. 4), 65–79.
Maughan, R.J. (1985) Thermoregulation and fluidbalance in marathon competition at low ambienttemperature. International Journal of Sports Medicine 6, 15–19.
Maughan, R.J. (1986) Exercise-induced muscle cramp:a prospective biochemical study in marathonrunners. Journal of Sports Science 4, 31–34.
Maughan, R.J. (1994) Fluid and electrolyte loss andreplacement in exercise. In Oxford Textbook of SportsMedicine (ed. M. Harries, C. Williams, W.D. Stanish & L.L. Micheli), pp. 82–93. Oxford University Press,New York.

Maughan, R.J. & Leiper, J.B. (1995) Effects of sodiumcontent of ingested fluids on post-exercise rehydra-tion in man. European Journal of Applied Physiology 71,311–319.
Maughan, R.J. & Shirreffs, S.M. (1997) Recovery fromprolonged exercise: restoration of water and elec-trolyte balance. Journal of Sports Science 15, 297–303.
Maughan, R.J., Fenn, C.E., Gleeson, M. & Leiper, J.B.(1987) Metabolic and circulatory responses to theingestion of glucose polymer and glucose/elec-trolyte solutions during exercise in man. EuropeanJournal of Applied Physiology 56, 365–362.
Maughan, R.J., Fenn, C.E. & Leiper, J.B. (1989) Effects of fluid, electrolyte and substrate ingestion onendurance capacity. European Journal of Applied Physi-ology 58, 481–486.
Maughan, R.J., Leiper, J.B. & McGaw, B.A. (1990)Effects of exercise intensity on absorption of in-gested fluids in man. Experimental Physiology 75,419–421.
Maughan, R.J., Bethell, L. & Leiper, J.B. (1996) Effects ofingested fluids on homeostasis and exercise per-formance in man. Experimental Physiology 81, 847–859.
Miller, J.M., Coyle, E.F., Sherman, W.M. et al. (1983)Effect of glycerol feeding on endurance and metabolism during prolonged exercise in man. Medicine and Science in Sports and Exercise 15, 237–242.
Montner, P., Stark, D.M., Riedesel, M.L. et al. (1996) Pre-exercise glycerol hydration improves cyclingendurance time. International Journal of Sports Medi-cine 17, 27–33.
Murray, R. (1996) Guidelines for fluid replacementduring exercise. Australian Journal of Nutrition andDiet 53 (Suppl. 4), S17–S21.
Nadel, E.R. (1988) Temperature regulation and pro-longed exercise. In Perspectives in Exercise Science andSports Medicine. Vol. 1. Prolonged Exercise (ed. D.R.Lamb & R. Murray), pp. 125–152. Benchmark, Indi-anapolis, IN.
Noakes, T.D. (1993) Fluid replacement during exercise.In Exercise and Sports Science Reviews. Vol. 21 (ed. J.O.Holloszy), pp. 297–330. Williams & Wilkins, Balti-more, MD.
Noakes, T.D., Norman, R.J., Buck, R.H., Godlonton, J.,Stevenson, K. & Pittaway, D. (1990) The incidence ofhyponatraemia during prolonged ultraenduranceexercise. Medicine and Science in Sports and Exercise 22,165–170.
Noakes, T.D., Rehrer, N.J. & Maughan, R.J. (1991) Theimportance of volume in regulating gastric empty-ing. Medicine and Science in Sports and Exercise 23,307–313.
O’Toole, M.L., Douglas, P.S., Lebrun, C.M. et al. (1993)
Magnesium in the treatment of exertional musclecramps. Medicine and Science in Sports and Exercise 25,S19.
Piwonka, R.W., Robinson, S., Gay, V.L. & Manalis, R.S.(1965) Preacclimatization of men to heat by training.Journal of Applied Physiology 20, 379–384.
Rehrer, N.J. (1990) Limits to Fluid Availability duringExercise. De Vrieseborsch: Haarlem.
Rehrer, N. & Burke, L.M. (1996) Sweat losses duringvarious sports. Australian Journal of Nutrition and Diet53, S13–S16.
Rowell, L.B. (1986) Human Circulation. Oxford Univer-sity Press, New York.
Sawka, M.N. (1988) Body fluid responses and hypohy-dration during exercise-heat stress. In Human Perfor-mance Physiology and Environmental Medicine atTerrestrial Extremes (ed. K.B. Pandolf, M.N. Sawka &R.R. Gonzalez), pp. 227–266. Benchmark, Indianapo-lis, IN.
Sawka, M. & Pandolf, K.B. (1990) Effects of body waterloss on physiological function and exercise perfor-mance. In Perspectives in Exercise Science and SportsMedicine. Vol. 3. Fluid Homeostasis during Exercise(ed. C.V. Gisolfi & D.R. Lamb), pp. 1–38. BenchmarkPress, Indianapolis, IN.
Schedl, H.P., Maughan, R.J. & Gisolfi, C.V. (1994)Intestinal absorption during rest and exercise: impli-cations for formulating oral rehydration beverages.Medicine and Science in Sports and Exercise 26, 267–280.
Senay, L.C. & Christensen, M.L. (1965) Cardiovascularand sweating responses to water ingestion duringdehydration. Journal of Applied Physiology 20, 975–979.
Shi, X., Summers, R.W., Schedl, H.P. et al. (1995) Effectof carbohydrate type and concentration and solutionosmolality on water absorption. Journal of AppliedPhysiology 27, 1607–1615.
Shirreffs, S.M. & Maughan, R.J. (1997) Whole bodysweat collection in man: an improved method withsome preliminary data on electrolyte composition.Journal of Applied Physiology 82, 336–341.
Sutton, J.R. (1990) Clinical implications of fluid imbal-ance. In Perspectives in Exercise Science and Sports Medicine. Vol. 3. Fluid Homeostasis during Exercise (ed.C.V. Gisolfi & D.R. Lamb), pp. 425–455. BenchmarkPress, Indianapolis, IN.
Vist, G.E. & Maughan, R.J. (1994) The effect of increas-ing glucose concentration on the rate of gastric emp-tying in man. Medicine and Science in Sports andExercise 26, 1269–1273.
Vist, G.E. & Maughan, R.J. (1995) The effect of osmolal-ity and carbohydrate content on the rate of gastricemptying of liquids in man. Journal of Physiology 486,523–531.
Waldegger, S. & Lang, F. (1998) Cell volume-regulated
water and electrolyte loss and replacement 239

gene transcription. Kidney and Blood Pressure Research21, 241–244.
Wapnir, R.A. & Lifshitz, F. (1985) Osmolality and soluteconcentration: their relationship with oral rehydra-tion solution effectiveness — an experimental assess-ment. Pediatric Research 19, 894–898.
240 nutrition and exercise
Zachwieja, J.J., Costill, D.L., Beard, G.C. et al. (1992) Theeffects of a carbonated carbohydrate drink on gastricemptying, gastrointestinal distress, and exercise per-formance. International Journal of Sport Nutrition 2,239–250.
Introduction
Investigations into the adaptations of the muscu-loskeletal and cardiovascular systems to exercisetraining have taken precedence in exercisescience research, with very few controlledstudies of the effects of exercise on gastrointesti-nal function. Nevertheless, there is a wealth ofknowledge of normal gastrointestinal functionwhich is pertinent to the design of an optimalnutritional plan for those actively engaged insport. There is also a growing body of knowledgeconcerning alterations in gastrointestinal func-tion as a result of exercise. The focus of thisreview is to highlight those aspects of gastroin-testinal function and dysfunction to give a basisfor nutritional supplementation regimens and togain an understanding of the causative factorsinvolved in the development of gastrointestinalsymptoms as a result of exercise.
Normal gastrointestinal function andthe effects of exercise
Oesophageal function
The tone of the lower oesophageal sphincter is of primary importance for the maintenance of aunidirectional flow of fluids and nutrientsthrough the digestive tract. Several studies haveexamined the effects of exercise on this sphincter.In one study by Worobetz and Gerrard (1986), 1 hof treadmill running at 50% of V
.o2max. resulted in
an increase of the lower sphincter pressure from
a baseline of 24mmHg to 32mmHg in asympto-matic, trained individuals. Oesophageal peris-talsis, however, remained unchanged. Anotherstudy, however, found a decrease in loweroesophageal sphincter pressure and an increasein disordered motility with intensive exercisecompared with rest (Peters et al. 1988). This is supported by a more recent study by Soffer et al. (1993), who demonstrated decreasingoesophageal peristalsis with increasing cyclingintensity from rest to 60% to 75% to 90% ofV.o2peak in trained subjects. The duration, ampli-
tude and frequency of oesophageal contractionsall declined with increasing intensity. Thenumber of gastro-oesophageal reflux episodesand the duration of acid exposure were signifi-cantly increased at 90% V
.o2peak. Another study
by the same authors (Soffer et al. 1994) demon-strated similar results with untrained subjects.Again, subjects cycled at graded intensities from 60% to 90% of V
.o2peak and a decrease in
oesophageal persitalsis with increasing intensitywas observed. Also, an increase in the numberand duration of reflux episodes and acid expo-sure was observed during cycling at 90% ofV.o2peak as with trained subjects.The discrepancy between the results obtained
by Worobetz and Gerrard (1986) and those of theothers may be explained by a differential effect ofexercise intensity. It may be that a relatively mildexercise bout, for those accustomed to training at a higher intensity, may decrease the loweroesophageal tone. Beyond a certain relativeintensity, an inverse effect may occur. This idea of
Chapter 18
Gastrointestinal Function and Exercise
NANCY J. REHRER AND DAVID F. GERRARD
241
a U-shaped relationship between exercise inten-sity and digestive processes is in line with earlyadvice, based on anecdotal evidence, to performmild exercise after a meal to facilitate digestion.There is some evidence to support the idea thatthis type of curvilinear relationship also existsbetween exercise intensity and gastric emptying.
Schoeman and coworkers (1995) also looked atthe effects of standardized meals and standard-ized exercise on lower oesophageal pressure andreflux. It was found that the timing of the mealhad a greater effect on the incidence of refluxthan did exercise. Sixty-six per cent (81 of 123) ofreflux episodes occurred within 3 h after foodintake, but only two episodes occurred duringexercise. A number of other factors, including fat, alcohol, coffee ingestion and smoking alsoreduce sphincter pressure.
Gastric emptying
Early observations of gastric function were madein which an inhibitory effect of emotional stresson gastric emptying rate was documented (Beaumont 1838). In another early study, Camp-bell et al. (1928) demonstrated that physical stressalso decreased gastric emptying. Costill andSaltin (1974) showed that 15 min of cycling above70% of V
.o2max. decreased gastric emptying of a
carbohydrate- and electrolyte-containing fluid,but that exercise at a lower intensity did notaffect the emptying rate. It is, however, only inthe last decade that a larger number of studieshave been conducted to assess the effects of exer-cise on gastric function. In contrast to most of theearly work, exercise intensity has been moreclosely controlled and clearly defined.
There is some disparity in results with regardto the effects of low- to moderate-intensity exer-cise on the gastric emptying rate. Neufer and colleagues (1989b) found an increased gastricemptying rate with exercise of a low to moderateintensity, with both walking (28%, 41% and 56%of V
.o2max.) and running (57% and 65% of V
.o2max.)
when compared with rest. They also showed adecrease in emptying with intensive exercise
242 nutrition and exercise
(75% of V.o2max.). Marzio et al. (1991) also exam-
ined the effects of mild (50% max HR) and stren-uous (70% max HR) treadmill exercise on gastricemptying. Their data support those of Neufer inthat the gastric emptying was accelerated withmild exercise but delayed with more strenuousexercise. Research by Sole and Noakes (1989) alsodemonstrated a decreased emptying of waterwith exercise at 75% of V
.o2max. compared with
rest, but there was no effect of exercise on theemptying of a 10% carbohydrate beverage. Sinceit is known that increasing carbohydrate concen-tration decreases the gastric emptying rate (Vist& Maughan 1994), one may speculate that thiseffect overshadowed any exercise-induced inhi-bition of gastric function. Other researchers havefailed to find a significant difference at moderateintensities (50% and 70% of V
.o2max.), although
trends towards slowing have been observed(Rehrer et al. 1989), while others have shown aconsistently increasing inhibition with moderatethrough to intensive (42%, 60% and 80% V
.o2max.)
exercise (Maughan et al. 1990).Some of the variance in results may be attrib-
uted to the testing protocol. In Neufer’s work,gastric emptying was measured at a single timepoint, after 15min of exercise, by aspirating theamount of beverage remaining. Marzio’s experi-mental design entailed 30min of exercise fol-lowed by ingestion of a beverage and thereafterfollowing emptying with ultrasonography andscintigraphy. Rehrer and coworkers (1989) used a repeated, dye-dilution, sampling technique inwhich comparisons were made at frequent inter-vals over a period of 1 h, representing the com-plete emptying curve of a beverage ingested atthe onset of exercise. Maughan and coworkers’research (1990) was also done with multiple measurement points over a complete emptyingcurve. They, however, measured blood accu-mulation of a deuterium tracer added to theingested drink, which represents the effects ofboth gastric emptying and intestinal absorption.Nevertheless, both methods in which measure-ments were made at multiple points, over alonger exercise time, with beverage ingestion
prior to exercise, show similar effects. It is tempt-ing to speculate that the 15-min time period is notsufficient to give a full picture of the gastric emp-tying rate of the total volume of fluid ingestedand that the chance of error would be greater.However, Costill and Saltin (1974) also onlylooked at 15min of exercise and found no sig-nificant effect of exercise up to around 70% ofV.o2max.. Furthermore, in the experiments in
which complete emptying curves were moni-tored, the 15-min measuring point also showedno significant effect.
The previously cited studies all examined theemptying of water or carbohydrate-containingliquids. One study also investigated the effect ofmild exercise (walking at speeds of 3.2km ·h–1
and 6.4 km· h–1) on the emptying of a solid meal(Moore et al. 1990). An increased emptying wasobserved during exercise as compared with rest, based upon half-emptying times of radio-labelled meals and gamma camera monitoring.Another fairly recent study, by Brown et al.(1994), demonstrated with ultrasound imagingthat the emptying of a semisolid meal wasdelayed with cycling at 85% of the predictedmaximum heart rate compared to rest. In thisstudy, postexercise contraction frequencies andantral areas were also monitored. Both were significantly decreased when compared withmeasurements made in experiments withoutexercise. Further, there was closure of the pylorusand a narrowing of the antrum. These changes ingastric function might explain the decreasedgastric emptying observed. Another study, per-formed with dogs, showed that with 2 h of exercise, at 60–70% of the maximum heart rate,the gastric emptying of a mixed (23.5% protein,3.5% fat, 66.5% carbohydrate) liquid meal wasdelayed and the migrating motor complexceased, again indicating that exercise inhibitsgastric motility. Gastric acid and pepsin secretionwere also inhibited during exercise.
In summary, there appear to be no clear effectson gastric emptying at moderate intensities.High-intensity exercise (> 70% of V
.o2max.) does
appear to increase emptying time. The few
studies that were done at very low intensities (< 42% of V
.o2max.), however, do indicate that
gastric emptying may be enhanced by mild exercise.
One may speculate that some of the disparityin results of different studies was due to the train-ing status of the subjects or the mode of exercise.However, when two groups, one trained andcompetitive in bicycling and the other untrainedfor all endurance activity, were compared, no difference in gastric emptying rate at rest orduring cycling was observed (Rehrer et al. 1989).Another study, however, was conducted inwhich emptying of a radio-labelled egg omelettewas compared in distance runners and sedentarysubjects (Carrio et al. 1989). The trained runnershad an accelerated gastric emptying of the mealat rest (runners, t1/2 =67.7 ±5.9 min; sedentaries,t1/2 =85.3± 4.5min, P <0.001).
Two studies have also compared gastric emp-tying rates of the same subjects cycling andrunning at similar relative intensities (Rehrer et al. 1990b; Houmard et al. 1991). No difference in gastric emptying rates was observed due tomode of exercise. These results are somewhatunexpected, since the magnitude of accelerationsof the body while running are more than doublethat experienced during bicycling; therefore one might expect that this would result in anincreased gastric emptying rate during running(Rehrer & Meijer 1991).
Other consequences of exercise can have anindirect effect on gastric function. Exercise cansometimes result in hypohydration and hyper-thermia. When hyperthermia and hypohydra-tion occur during exercise, the rate of gastricemptying is reduced (Neufer et al. 1989b; Rehreret al. 1990a). The emotional stress that competi-tion can cause may also delay gastric emptyingand thus some of the conclusions drawn fromdata collected in a standardized laboratorysetting may not always be applicable to an indi-vidual athlete during high-level competition.Further, a large variation in standardized gastricemptying rates between individuals exists(Foster & Thompson 1990; Brunner et al. 1991).
gastrointestinal function and exercise 243
The factors which influence gastric emptyingrate to a significant degree have, however, thesame relative effect among both ‘slow’ and ‘fastemptiers’. Beverage or meal size and composi-tion, including nutrient concentration, osmolal-ity and particle size, are all strong modulators ofgastric emptying. In particular, increasing carbo-hydrate concentration, osmolality and particlesize decrease the gastric emptying rate. For amore complete review of the factors which influ-ence gastric emptying, see Murray (1987), Costill(1990), Maughan (1991) or Rehrer et al. (1994).
Bearing in mind the individual differences andsituations, it is useful to look at the upper limitsto gastric emptying rates during continuousexercise and to compare these with sweat rateswhen one is attempting to balance fluid losses.Mitchell and Voss (1990) observed increasinggastric emptying rates with increasing gastricvolume up to approximately 1000ml. With inges-tion rates of around 1000ml ·h–1, dependingupon the composition of the beverage, thevolume emptied can reach about 90% of thatingested (Ryan et al. 1989; Mitchell & Voss 1990;Rehrer et al. 1990b). Similar high rates of gastricemptying have also been observed with intermit-tent exercise (1336 ml ·2 h–1 ingested; 1306± 76,1262± 82, 1288±75, 1278 ±77 ml ·2 h–1 emptied forwater, 5%, 6% and 7.5% carbohydrate, respec-tively; Beltz 1988). For a review on the effects ofvolume on gastric emptying, see Noakes et al.(1991).
Intestinal absorption
Net absorption of water and carbohydratesoccurs primarily in the small intestine (duo-denum and jejunum). To a lesser extent, waterabsorption also occurs in the large intestine(colon). A large body of research evidence existswhich describes the functioning of the intestinaltract and the factors which influence the absorp-tion of fluids and carbohydrates, at rest (Riklis & Quastel 1958; Curran 1960; Crane 1962; Schedl& Clifton 1963; Holdsworth & Dawson 1964;Fordtran 1975; Leiper & Maughan 1988; Gisolfi etal. 1990). Relatively little has been published
244 nutrition and exercise
regarding intestinal absorption during exercise.Herewith only research specifically designed tolook at the effects of exercise upon intestinalfunction will be discussed.
One of the first controlled studies directly mea-suring intestinal absorption during exercise wasconducted by Fordtran and Saltin (1967). Intesti-nal perfusion of the jejunum and ileum with atriple lumen catheter was done with subjects at rest and during treadmill running at 70% ofV.o2max.. A 30-min equilibration period was main-
tained prior to measurement in each condition.No effect of exercise on glucose absorptionwithin the jejunum or ileum was observed. Similarly, no consistent effect of exercise on netwater or electrolyte absorption or secretion wasobserved. It should be noted, however, that onlyfour or five subjects were used in the jejunal per-fusion experiments and only two to three in theileal perfusion experiments. Conflicting resultswere found in another jejunal perfusion study(Barclay & Turnberg 1988), in which cycling wasperformed at a constant, absolute exercise inten-sity (15 km· h–1, 40–50% above resting heart rate).A significant net decrease in net water and elec-trolytes was observed. One difference betweenthis study and that of Fordtran and Saltin (1967)is that in the earlier study, the perfusate con-tained glucose and in the latter study it did not. The stimulatory effect of glucose on waterabsorption may have masked any inhibitoryeffects of exercise. Further, the amount of glucosein the perfusate was not constant across subjects.This may have given added variability in resultsand with the small sample size may have pre-cluded finding a consistent effect.
A more recent study by Maughan et al. (1990)has been conducted using deuterium accumula-tion in the plasma after drinking a 2H2O-labelledbeverage to investigate the effects of exercise onabsorption. Subjects performed four separatetrials at rest and cycling at 42%, 61% and 80% ofV.o2max.. A consistent effect of exercise to reduce
the rate of plasma deuterium accumulation wasobserved. One must bear in mind that the rate ofdeuterium accumulation in the plasma is notsolely a consequence of the rate of intestinal

absorption but also is influenced by the gastricemptying rate. Thus it is impossible to concludeif it is decreased gastric emptying or intestinalabsorption which is responsible for the reductionin absorption. Further, deuterium accumulationin the plasma does not give information as to thenet absorption. Alterations in intestinal secretionare not represented by deuterium accumulation(Gisolfi et al. 1990). However, it is assumed thatthe osmolality of the intestinal contents, as afunction of beverage composition, is primarilyresponsible for changes in secretion. There is noevidence to suggest that exercise affects intesti-nal secretion. Thus, in the study by Maughan etal. (1990) in which the same beverage was admin-istered during exercise at various intensities, onemay expect that the secretion rate is constant.
One other problem with using a tracer to eval-uate the appearance of a substance is that onemeasures the concentration in the plasma whichis also influenced by the rate of disappearance,i.e. the rate at which the substance is taken upfrom the circulation by the tissues. During exer-cise the rate of mixture of the tracer with the totalbody water pool is nearly instantaneous and thedifferent body compartments may be treated asone pool (N.J. Rehrer and R.J. Maughan, unpub-lished observations). This mixing of the tracerinto the body water pool is delayed at rest.However, this could not account entirely for the difference in plasma deuterium accumula-tion during exercise in the study in question(Maughan et al. 1990), since during exercise the concentration of the label in the plasma con-tinued to rise throughout the exercise protocol,rather than peaking early and decreasing withexercise duration, as one would expect if adelayed rate of efflux accounted for the reducedrate of plasma accumulation of the deuterium.
In conclusion, no consistent clear picture of the effect of exercise upon intestinal absorption isevident. Beverage composition, in particular car-bohydrate concentration and osmolality, has agreater influence on net absorption.
A few studies have looked at intestinal perme-ability during or after exercise. Both Moses et al.(1991) and Oktedalen et al. (1992) have shown a
decreased functioning of the mucosal barrierwith running. More recently, Ryan et al. (1996)have shown that intestinal permeability isreduced to a greater degree when exercise andaspirin ingestion are combined than with aspiriningestion at rest. This apparent lack of mainte-nance of intestinal membrane integrity may berelated to alterations in blood flow to the intesti-nal region during strenuous exercise.
Splanchnic blood flow
Rowell et al. (1964) and others (Clausen 1977;Qamar & Read 1987; Rehrer et al. 1992a; Kenney& Ho 1995; Seto et al. 1995) have demonstrated adecrease in blood flow to the intestinal tract as a result of physical exercise. Early studies, withlimited exercise, indicated that splanchnic bloodflow could be altered with exercise. Bishop et al.(1957) showed a decrease in arteriovenous dif-ference in oxygen content over the liver, withsupine cycling ergometry. Wade et al. (1956)demonstrated reduced bromosulphalein clear-ance in patients recovering from pulmonaryinfections, undertaking ‘light’, supine exercise(7–8 min of leg lifts). Rowell et al. (1964) were thefirst to quantify this decrease during uprighttreadmill exercise, using indocyanine green(ICG) clearance as an indication of splanchnicflow. They showed decreases of up to 84% withexercise.
A number of the more recent studies havemade use of pulsed Doppler ultrasound tomeasure blood flow. In some cases the superiormesentery artery is measured and in others theportal vein. The measurements of the superiormesenteric artery (SMA) are typically done atrest prior to or after exercise as accurate measure-ments during exercise are made difficult due tothe increased force of contraction of the heartduring intensive exercise. This gives large fluctu-ations in the aortic flow which results in a super-imposed flow on top of the true mesentery flow.Nevertheless, the measurements that are takenshortly after exercise has stopped do show areduction in SMA flow. In one study, in whichsubjects walked at 5km· h–1 up a 20% incline for
gastrointestinal function and exercise 245

15min, a reduction in SMA flow of 43% wasobserved (Qamar & Read 1987).
In other studies, the venous portal flow wasmonitored by Doppler to give an indication ofsplanchnic blood flow. In one study in whichupright cycling was conducted at 70% V
.o2max.,
and environmental temperature was 26.8± 0.2°Cand humidity was 58± 2%, a reduction in portalflow after 60min of exercise of 80±7% wasobserved (Rehrer et al. 1992a). These results are inline with Rowell’s earlier work using ICG clear-ance with intensive upright exercise.
Kenney and Ho (1995) demonstrated a differ-ence in redistribution of blood flow with exercisebetween old and young subjects, even whenmatched for V
.o2max. and exercising at the same
intensity. Younger (26±2 years) subjects experi-enced a 45± 2% reduction in estimated splanch-nic flow (ICG clearance) during cycling at 60% ofV.o2peak at an ambient temperature of 36°C. Older
(mean, 64± 2 years) subjects only experienced a 33±3% decrease. A decrease in blood supplyand relative ischaemia to the splanchnic areadecreases the absorption of actively transportednutrients, e.g. glucose (Varro et al. 1965).However, a decrease in flow of less than 40% iscompensated for by an increase in oxygen extrac-tion, and absorptive capacity is not altered. Agreater decrease than this results in a reducedoxygen supply and reduced absorption. Thisleads one to wonder if the decreased splanchnicflow caused by exercise may inhibit normalabsorption of nutrients during exercise.
Relatively few studies have assessed the com-bined effects of exercise and nutrient ingestionon splanchnic blood flow. It has been known forsome time that ingestion and absorption of nutri-ents results in an increased blood flow to theintestinal tract at rest. The effect of exercise andnutrient ingestion/absorption has been littlestudied. One early study did look at the bloodflow within the SMA in dogs after a meal, at restand during exercise (Burns & Schenck 1969).Exercise consisted of treadmill running on anincline until panting began (after about 5–10min). An indwelling electromagnetic flowprobe, which was surgically placed several days
246 nutrition and exercise
prior to experiments, was used to measure flow.A 20% decrease in SMA flow with exercise wasobserved, and this was lessened (14% decrease)when the exercise was performed 3h afterfeeding. Another similar study with dogs wasperformed in which they were exercised on atreadmill for 4 min at 1.5km· h–1 (Fronek &Fronek 1970). Although no effect of exercise onSMA flow in the fasted state was observed, exer-cise immediately following meal ingestionresulted in a relatively reduced blood flow incontrast to that seen with feeding at rest.
Qamar and Read (1987) found that mild exer-cise (walking, 15min at 5km· h–1, 20% incline)reduced the increase in SMA blood flowobserved after a meal in man. The flow, however,was still greater than that observed at rest in the fasted state. Strenuous exercise of longerduration (70% of V
.o2max. for 60min) has been
observed to cause an attenuation of the increasedflow through the portal vein observed withglucose (100g · h–1) ingestion (Rehrer et al. 1993).Flow increased to 195±19% of the resting, fastedvalue after glucose ingestion and decreased to 61± 15% with glucose ingestion during exercise.Although this type and intensity of exercise with glucose ingestion did result in a significantdecrease in portal flow, it is of a lesser magnitudethan that observed with similar exercise in the fasted state (Rehrer et al. 1992a). Thus, whenglucose is ingested during exercise, the reduc-tion in flow is lessened to such a degree that one would not expect glucose absorption to beinhibited.
The redistribution in splanchnic blood flowobserved as a result of exercise and meal inges-tion is regulated by hormonal and neural stimuli,with the sympathetic nervous system playing acentral role. Several studies have demonstrated arelationship between sympathoadrenergic acti-vation and splanchnic blood flow alterationswith exercise (Chaudhuri et al. 1992; Iwao et al.1995; Kenney & Ho 1995). In particular, aninverse correlation between portal venous flowand plasma noradrenaline concentration hasbeen observed with measurements taken at restand during mild and intensive exercise in man

(r =–0.54, P< 0.01; Iwao et al. 1995). In this study,however, exercise was performed on a treadmill,but measurements were made after exerciseceased, with subjects in a supine position. Asimilar inverse correlation between portalvenous flow and plasma noradrenaline concen-tration in man was observed (r =– 0.65, P<0.01)when data were collected at rest and duringcycling exercise at 70% of V
.o2max. with and
without glucose ingestion, inhibitory and stimu-latory influences, respectively (Rehrer et al. 1993).Neuropeptide Y is also known to be releasedfrom nerve endings with sympathetic activationand has been observed to be increased duringexercise (Ahlborg et al. 1992). As it also is a vaso-constrictor in the blood vessels of the kidneysand splanchnic region, it may be implicated inthe redistribution of blood flow during exercise.
Other hormones implicated in the regulationof intestinal blood flow include cholecystekinin(CCK) and secretin, both having been observedto increase blood flow within the SMA (Fara &Madden 1975). Although these hormones are ofparticular relevance with respect to blood supplyto the digestive organs after the ingestion of ameal, it is doubtful that they play a role in theregulation of blood flow in response to exercise.Angiotensin II, however, is increased duringexercise and it causes vasoconstriction ofsplanchnic and renal blood vessels (Stebbins &Symons 1995). Similarly, endothelin-1 (ET-1)increases during exercise and an infusion of ET-1has been shown to decrease the splanchnic bloodflow to levels lower than those observed duringexercise without ET-1 infusion (Ahlborg et al.1995).
Gastrointestinal transit
Regular exercise has been observed to increasethe rate of gastrointestinal transit. Cordain et al.(1986) observed an increased transit as a result ofparticipation in a running training programme.It was thought that the mechanical jarring oc-curring during running may have caused theincreased transit. However, in another study,Koffler et al. (1992) have demonstrated that
strength training also increases gastrointestinaltransit in elderly and middle-aged men. Furtherin support of these findings is a study showingthat a brief period (2 weeks) of relative inactivitydecreases transit in elderly individuals (Liu et al. 1993). The mechanism responsible for thedecreased transit time with exercise is uncertain.Changes in hormones and/or parasympathetictone, an increased food intake and mechanicaleffects have been speculated upon.
A positive health effect may be related to thisadjustment in gastrointestinal transit timeobserved with regular exercise. A number ofstudies indicate an inverse relationship betweenphysical activity and colorectal cancer; amongthese, one of the most comprehensive is a cohortstudy of 104485 Norwegians (Thune & Lund1996). These authors speculate that it is theincrease in gastrointestinal transit, reducingexposure of the gut to potentially carcinogeniccomponents of the diet, which may account forthe decrease in colorectal cancer seen withincreased levels of exercise participation.
Exercise and gastrointestinal dysfunction
A number of gastrointestinal symptoms havelong been linked to various forms of moderateexercise (Larson & Fisher 1987; Green 1992;Brukner & Kahn 1993). Surveys of runners andmultisport athletes have confirmed the fre-quency with which prolonged physical exertionprecipitates significant digestive tract problemswhich may interrupt training and hinder perfor-mance (Moses 1990). Fortunately, such symp-toms are most often self-limiting rather thanlife-threatening, but it is increasingly morecommon for sports physicians to evaluate gas-trointestinal symptoms.
Common explanations for these clinical symp-toms include dehydration, altered gastrointesti-nal blood flow, changes in gut permeability,disturbed gastrointestinal tract motility, psycho-logical influences (‘stress’) and pharmacologicalagents (Table 18.1) (Brukner & Khan 1993). Ir-respective of the cause, exercise-induced al-
gastrointestinal function and exercise 247
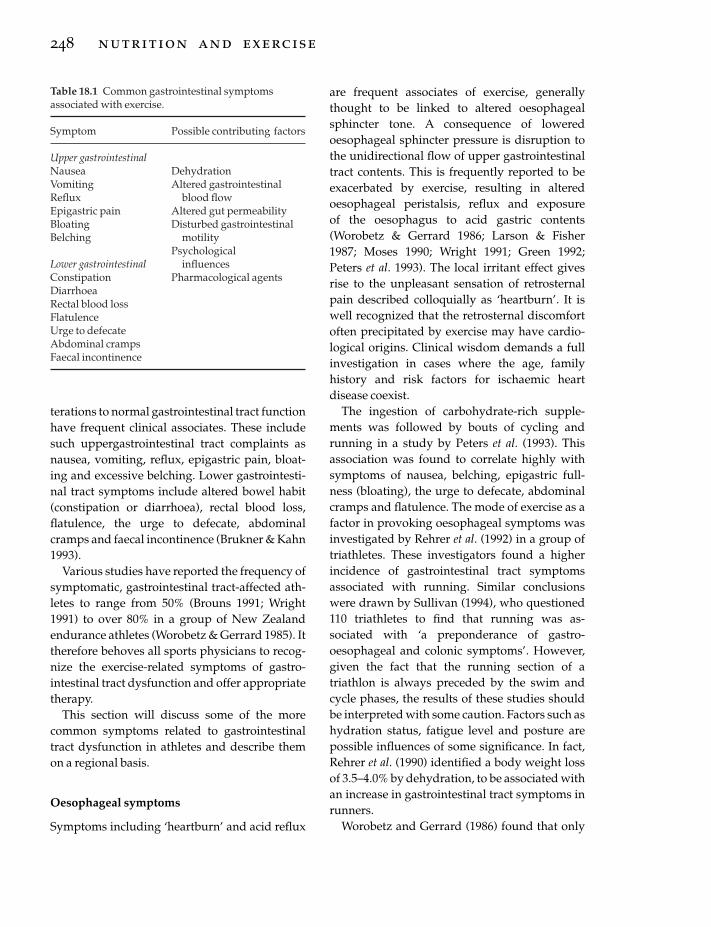
terations to normal gastrointestinal tract functionhave frequent clinical associates. These includesuch uppergastrointestinal tract complaints asnausea, vomiting, reflux, epigastric pain, bloat-ing and excessive belching. Lower gastrointesti-nal tract symptoms include altered bowel habit(constipation or diarrhoea), rectal blood loss, flatulence, the urge to defecate, abdominalcramps and faecal incontinence (Brukner & Kahn1993).
Various studies have reported the frequency ofsymptomatic, gastrointestinal tract-affected ath-letes to range from 50% (Brouns 1991; Wright1991) to over 80% in a group of New Zealandendurance athletes (Worobetz & Gerrard 1985). Ittherefore behoves all sports physicians to recog-nize the exercise-related symptoms of gastro-intestinal tract dysfunction and offer appropriatetherapy.
This section will discuss some of the morecommon symptoms related to gastrointestinaltract dysfunction in athletes and describe themon a regional basis.
Oesophageal symptoms
Symptoms including ‘heartburn’ and acid reflux
248 nutrition and exercise
are frequent associates of exercise, generallythought to be linked to altered oesophagealsphincter tone. A consequence of loweredoesophageal sphincter pressure is disruption tothe unidirectional flow of upper gastrointestinaltract contents. This is frequently reported to beexacerbated by exercise, resulting in alteredoesophageal peristalsis, reflux and exposure of the oesophagus to acid gastric contents (Worobetz & Gerrard 1986; Larson & Fisher 1987; Moses 1990; Wright 1991; Green 1992;Peters et al. 1993). The local irritant effect givesrise to the unpleasant sensation of retrosternalpain described colloquially as ‘heartburn’. It iswell recognized that the retrosternal discomfortoften precipitated by exercise may have cardio-logical origins. Clinical wisdom demands a fullinvestigation in cases where the age, familyhistory and risk factors for ischaemic heartdisease coexist.
The ingestion of carbohydrate-rich supple-ments was followed by bouts of cycling andrunning in a study by Peters et al. (1993). Thisassociation was found to correlate highly withsymptoms of nausea, belching, epigastric full-ness (bloating), the urge to defecate, abdominalcramps and flatulence. The mode of exercise as afactor in provoking oesophageal symptoms wasinvestigated by Rehrer et al. (1992) in a group oftriathletes. These investigators found a higherincidence of gastrointestinal tract symptomsassociated with running. Similar conclusionswere drawn by Sullivan (1994), who questioned110 triathletes to find that running was as-sociated with ‘a preponderance of gastro-oesophageal and colonic symptoms’. However,given the fact that the running section of atriathlon is always preceded by the swim andcycle phases, the results of these studies shouldbe interpreted with some caution. Factors such ashydration status, fatigue level and posture arepossible influences of some significance. In fact,Rehrer et al. (1990) identified a body weight lossof 3.5–4.0% by dehydration, to be associated withan increase in gastrointestinal tract symptoms inrunners.
Worobetz and Gerrard (1986) found that only
Table 18.1 Common gastrointestinal symptomsassociated with exercise.
Symptom Possible contributing factors
Upper gastrointestinalNausea DehydrationVomiting Altered gastrointestinalReflux blood flowEpigastric pain Altered gut permeabilityBloating Disturbed gastrointestinalBelching motility
Lower gastrointestinalPsychological
Constipationinfluences
DiarrhoeaPharmacological agents
Rectal blood lossFlatulenceUrge to defecateAbdominal crampsFaecal incontinence

moderate amounts of exercise were associatedwith altered lower oesophageal sphincter pres-sure, which was measured using a smallmanometer placed at the gastro-oesophagealjunction. Other studies link symptoms of dis-ordered oesophageal motility to factors whichinclude exercise intensity, the timing of foodintake, specific foods such as alcohol and coffeeand the influence of smoking (Schoeman et al.1995). However, the latter is an unlikely habitualassociate of the athlete.
Measures which reduce the volume of thestomach contents during exercise are likely toreduce the possibility of symptoms associatedwith reflux. In the same way, the composition ofthe prerace meal has been found to influencesymptoms such as flatulence and side ache.Peters et al. (1993) tested different carbohydratesupplements in 32 male triathletes to determinethe prevalence, duration and seriousness of gas-trointestinal symptoms. Their results suggestedpossible mechanisms including duration of exer-cise, altered gastrointestinal tract blood supply,carbohydrate ‘spill over’ and the postural (verti-cal) effect of running.
The symptomatic relief of ‘heartburn’ can beachieved through the use of simple antacids suchas aluminium hydroxide, sodium bicarbonate,magnesium carbonate or alignic acid. If suchagents alone are insufficient to relieve symptomsthen the use of H2-receptor antagonists is indi-cated. Examples of these agents include cimeti-dine and ranitidine. Their action is to inhibit boththe stimulated basal secretion of gastric acid and to reduce pepsin output by histamine H2-receptor antagonism. Additional therapy mayinclude the use of muscarinic M1-antagonists,prostaglandin analogues or proton pumpinhibitors such as omeprazole. Metaclopramidemay also provide short-term relief by improvingthe contractility of the lower oesophageal sphinc-ter tone.
Reports of upper gastrointestinal tract bleed-ing associated with physical exertion have beenwell documented, and recently correlated withdigestive complaints and clinically demonstra-ble iron-deficient states (Brouns 1991; Wright
1991; Moses 1993; Rudzki et al. 1995). The causesof such blood losses can include a Mallory–Weisstear from the mechanical trauma of repetitivevomiting to bleeding from a peptic ulcer. Anyunaccountable blood loss from the gastrointesti-nal tract deserves full clinical investigation.
Gastric symptoms
The commonly reported effects of gastric dys-function in athletes include nausea, bloating, epigastric pain and belching. In addition, haem-orrhagic gastritis is reported as a common causeof gastrointestinal tract bleeding but is mostoften transient and usually localized to thefundus (Brukner & Kahn 1993). The use of salicy-lates and non-steroidal anti-inflammatory drugs(NSAIDs) in the athletic population is also recog-nized as having a potential for gastrointestinaltract irritation leading to gastritis and ulceration.However, in two studies the use of these drugswas not correlated with an increase in upper gastrointestinal tract bleeding (McMahon et al.1984; Baska et al. 1990). An additional problemwith NSAID ingestion linked with theirantiprostaglandin effect is a reduction of renalblood flow, which is considered to be a potentialfactor in the genesis of renal failure in athletes(Walker et al. 1994).
Documented influences upon the rate ofgastric emptying in athletes include the tempera-ture, energy content and osmolality of the gastriccontents, environmental temperature and exer-cise conditions (Costill & Saltin 1974; Murray1987; Neufer 1989a; Moses 1990; Rehrer et al.1990b; Green 1992). Hyperosmolar solutionshave been found to empty more slowly from thestomach during exercise and therefore should beavoided. While light exercise is considered a posi-tive stimulus to the gastric emptying of fluids, thepassage of solid foods is delayed by vigorousactivity (Moses 1990). The clinical significance ofthis information is the timing and composition ofprecompetition meals, and advice for those ath-letes whose choice of event demands that they‘top up’ during a race or on long training runs.Gastric retention has been suggested as causing
gastrointestinal function and exercise 249

nausea and vomiting after exercise, or the causeof disabling cramps during running (Olivares1988 cited in Moses 1990). It would seem from theliterature that gastric stasis may be avoided bychoosing low-volume, isotonic, liquid mealswhich are low in fat, protein and dietary fibre.
In addition, there appear to be a number ofanecdotal references to athletes in whom gastricclearance has been influenced by the psychologi-cal stresses of competition (Larson & Fisher1987). References to the link between psychologi-cal stress and gastric function were made over 60 years ago. A delay in gastric emptying wasnoted by Campbell et al. (1928) and revisited byBeaumont 10 years later. These influences, whichare often more difficult to quantify but are no lessimportant to the athlete, represent an area of con-siderable research potential that can be exploredwith the aid of contemporary instruments ofmeasurement including radio isotope-labelledmeals, gamma cameras and ultrasound.
Intestinal symptoms
Reported lower gastrointestinal tract symptomsduring exercise (particularly running) includeabdominal cramps, urgency of bowel movement,diarrhoea, rectal bleeding, flatulence and post-exercise anorexia.
A model for factors associated with gastroin-testinal tract symptoms during exercise has beenproposed by Peters et al. (1995). There is a strongrecognition of the interrelationship betweenseveral factors:• Hydration status.• Mechanical trauma.• Neuroendocrine alterations.• Psychological stress.• Reduced gastrointestinal tract blood supply.• Altered gut motility.• Influence of medication.
Gastrointestinal tract bleeding
Exercise-associated gastrointestinal bleeding hasbeen reported by several authors (Porter 1983;McMahon et al. 1984; Stewart et al. 1984; Scobie
250 nutrition and exercise
1985; Robertson et al. 1987; Baska et al. 1990;Moses 1990; Schwartz et al. 1990; Green 1992).Haemorrhage from the gastrointestinal tract isalways of concern to the athlete. The presentationmay be very dramatic and, irrespective of thesource, it is important to evaluate the frequencyand significance of the blood loss given thatoccult blood loss has been frequently reported inendurance athletes (Green 1992). It has becomemore evident through contemporary methods ofendoscopic examination that the intensity ofexercise rather than mechanical influences arecausative in the loss of blood from the gastroin-testinal tract. A proposed mechanism of directtrauma to the gut through running was the basisfor the syndrome of ‘caecal slap’ reported byPorter in 1982. It was postulated that the me-chanical effect of running was physically insult-ing on the ileocaecal junction and produced alocalized contusion. However, since then thestudy of other athletes, including cyclists (Dobbset al. 1988 cited in Green 1992), suggests that anyendurance athletes, and not just runners, maysuffer significant occult gastrointestinal bloodloss and that the mechanism for this is likely to bethe result of endocrine and vascular insults andfactors related to hydration status.
The athlete presenting with frank gastroin-testinal tract bleeding deserves a full clinicalevaluation. Local anorectal causes such as haem-orrhoids and fissures are easily ruled out byphysical examination, but inflammatory boweldisease and more sinister causes of bleedingincluding carcinoma will require more extensiveendoscopic investigations. In many cases theathlete may present with haematological evi-dence of anaemia which is often nutritional, ordue to the expanded plasma volume of exercise(an apparent or athletes’ pseudoanaemia), butmight also signal insidious blood loss from anundetermined site. Endoscopic examinations ofboth upper and lower gastrointestinal tract aremandatory investigations particularly where theage of the athlete, their medical history and theconcurrent use of NSAIDs are reported.
Although the aetiology of gastrointestinalbleeding is likely to be multifactorial, the litera-

ture frequently implicates two factors. These aredehydration and reduced splanchnic blood flow.The former factor has been associated with generalized hypovolaemia, particularly inendurance athletes, but intestinal ischaemia isthe factor most frequently linked with lower gas-trointestinal bleeding. The diversion of bloodfrom the splanchnic bed to supply exercisingmuscles is a well-recognized physiological phe-nomenon. This is reported to deplete local vis-ceral blood flow by up to 75% and establish thebasis of localized ischaemia reported to result in symptoms such as abdominal cramping anddiarrhoea (Schwartz et al. 1990). Both the upperand lower portions of the gastrointestinal tractmay be affected by diminished blood supplywith the gastric mucosa appearing to be particu-larly susceptible to insult. Denied the protectiveinfluence of its mucosal layer, the gastric fundusis reported to be the most frequently reported site of gastrointestinal bleeding (Brukner & Kahn 1993). No small bowel sites of haemor-rhage appear to have been reported, but bleedingfrom the colon has been frequently reported inassociation with exercise (Fogoros 1980). Docu-mented cases have included ischaemic colitis(Porter 1982; Pruett et al. 1985; Schaub et al. 1985;Heer et al. 1986; Moses et al. 1988). It has also beenproposed that these cases of gut ischaemia repre-sent a more accurate pathogenesis of the earlierreport of ‘caecal slap’.
Symptoms of altered gastrointestinal transit
As with the pathogenesis of other exercise-related gastrointestinal symptoms, it is likelythat the causes of altered transit, in particulardiarrhoea, are several. These include the athlete’sdiet (including fluid intake), the use of medica-tion, the influence of psychological stresses, theintensity and mechanical effect of exercise, hor-monal influences and the relative ischaemia ofthe gut during exercise.
The term ‘runner’s trots’ was coined byFogoros in 1980. It has been widely consideredthat the exercise-induced bloody diarrhoea withantecedent abdominal cramps is the single most
debilitating symptom of gastrointestinal tractdisturbance to the athlete. There are many anec-dotal references to this in both lay and profes-sional publications. The full syndrome includeslower abdominal cramping, the urge to defecate,rectal bleeding, an increased frequency of bowelmovements with exercise, and frank diarrhoea(Swain 1994). Clinicians must rule out abnormal-ities such as irritable bowel syndrome, lactoseintolerance, coeliac disease, ulcerative colitis andinfective causes of diarrhoea before attributingthese symptoms simply to exercise. Such medica-tions as laxatives, H2-antagonists, iron supple-ments and antibiotics may also induce diarrhoea,and less common causes, including pancreaticdisease, exercise-induced anaphylaxis, anddiverticular disease are also frequently associ-ated with chronic recurrent symptoms of diarrhoea.
Of greater importance to the symptomaticathlete is the clinical management of this debili-tating problem. Clearly the clinician’s firstresponsibility is to eliminate any significantpathology and by so doing reassure the athlete.The pharmacological management of chronicdiarrhoea in the athlete may employ antidiar-rhoeal agents such as loperamide, or antispas-modics to reduce gastrointestinal motility andthereby enhance absorption. The common anti-spasmodics include agents from the anticholin-ergic group of drugs: as these drugs also inhibitsweating, their use must be balanced against an increased risk of heat intolerance. Non-pharmacological interventions include attentionto adequate hydration before and during exer-cise, the avoidance of caffeine because of itsdiuretic and cathartic effects, and a low-residuemeal taken several hours before running. Someauthorities also favour the establishment of apredetermined daily ritual of bowel evacuation.
In summary, however, the management ofexercise-induced lower gastrointestinal tractsymptoms involves the established protocol ofaccurate history taking, physical examination,diagnosis by exclusion and the initial use of non-pharmacological agents. The use of simpleantidiarrhoeal medication is widely accepted on
gastrointestinal function and exercise 251

an infrequent basis and must be in accordancewith the permitted list of IOC substances.
Conclusion
For the active athlete, the clinical consequencesof disturbed gastrointestinal tract function maylimit successful participation in athletic perfor-mance. Furthermore, while attention to fluid andcarbohydrate ingestion is shown to enhanceexercise performance, gastrointestinal dysfunc-tion can significantly limit the assimilation ofessential nutrients. An understanding of gas-trointestinal function and the aetiology of gas-trointestinal symptoms associated with exerciseis necessary for the design of appropriate supple-mentation regimens. Athletes thereby benefitfrom maximum rates of delivery of nutrientswith less risk of gastrointestinal distress.
References
Ahlborg, G., Weitzberg, E., Sollevi, A. & Lundberg, J.M.(1992) Splanchnic and rental vasoconstrictor andmetabolic responses to neuropeptide Y in resting andexercising man. Acta Physiologica Scandinavica 145,139–149.
Ahlborg, G., Weitzberg, E. & Lundberg, J. (1995) Meta-bolic and vascular effects of circulating endothelin-1during moderately heavy prolonged exercise. Journalof Applied Physiology 78, 2294–2300.
Barclay, G.R. & Turnberg, L.A. (1988) Effect of moder-ate exercise on salt and water transport in the humanjejunum. Gut 29, 816–820.
Baska, R.S., Moses, F.M. & Deuster, P.A. (1990) Cimeti-dine reduces running-associated gastrointestinalbleeding: a prospective observation. Digestive Dis-eases and Sciences 35, 956–960.
Beaumont, W. (1838, rpt 1983) Experiments and Observa-tions on the Gastric Juice and the Physiology of Digestion.Andrew Combe, Edinburgh.
Beltz, J.D. (1988) Effects of carbohydrate ingestion ongastric emptying and exercise performance. Medicineand Science in Sports and Exercise 20, 110–115.
Bishop, J.M., Donald, K.W., Taylor, S.H. & Wormald,P.N. (1957) Changes in arterial-hepatic venousoxygen content difference during and after supineleg exercise. Journal of Physiology 137, 309–317.
Brouns, F. (1991) Etiology of gastrointestinal distur-bances during endurance events. ScandinavianJournal of Medicine and Science in Sports 1, 66–77.
252 nutrition and exercise
Brown, B.P., Ketelaar, M.A., Schulze-Delrieu, K., Abu-Yousef, M.M. & Brown, C.K. (1994) Strenuous exer-cise decreases motility and cross-sectional area ofhuman gastric antrum: a study using ultrasound.Digestive Diseases and Sciences 39, 940–945.
Brukner, P. & Khan, K. (1993) Clinical Sports Medicine.McGraw-Hill, Roseville, NSW.
Brunner, J., Barezat, G.O. & Häcki, W.H. (1991) Diemagentleerung verschiedener oraler rehydrationslo-sungen gemessen mit dem ultraschall (Gastric emptying differences of oral rehydration solutionsmeasured by ultrasound). Schweizerische Medizinis-che Wochenschrift 121, 881–883.
Burns, G.P. & Schenk, W.G. (1969) Effect of digestionand exercise on intestinal blood flow and cardiacoutput. Archives of Surgery 98, 790–794.
Campbell, J.M.H., Mitchell, M.D. & Powell, A.T.W.(1928) The influence of exercise on digestion. Guy’sHospital Reports 78, 279–293.
Carrio, I., Estorch, M., Serra-Grima, R. et al. (1989)Gastric emptying in marathon runners. Gut 30,152–155.
Chaudhuri, K.R., Thomaides, T. & Mathias, C.J. (1992)Abnormality of superior mesenteric artery bloodflow responses in human sympathetic failure. Journalof Physiology 457, 477–489.
Clausen, J.P. (1977) Effect of physical training on car-diovascular adjustments to exercise in man. Physio-logical Reviews 57, 779–815.
Cordain, L., Latin, R.W. & Behnke, M.S. (1986) Theeffects of an aerobic running program on boweltransit time. Journal of Sports Medicine 26, 101–104.
Costill, D.L. (1990) Gastric emptying of fluids duringexercise during exercise. In Fluid Homeostasis duringExercise (ed. C.V. Gisolfi & D.R. Lamb), pp. 97–127.Benchmark Press, Carmel, IN.
Costill, D.L. & Saltin, B. (1974) Factors limiting gastricemptying. Journal of Applied Physiology 37, 679–683.
Crane, R.K. (1962) Hypothesis for mechanism ofintestinal active transport of sugars. Federation Pro-ceedings 21, 891–895.
Curran, P.F. (1960) Na, Cl and water transport by ratileum in vitro. Journal of General Physiology 43,1137–1148.
Dobbs, T.W., Atkins, M., Ratliff, R. & Eichner, E.R.(1988) Gastrointestinal bleeding in competitivecyclists. Medicine and Science in Sports and Exercise 20,S178.
Fara, J.W. & Madden, K.S. (1975) Effect of secretin andcholecystokinin on small intestinal blood flow di-stribution. American Journal of Physiology 229, 1365–1370.
Fogoros, R.N. (1980) ‘Runners trots’: gastrointestinaldisturbances in runners. Journal of the AmericanMedical Association 243, 1743–1744.
Fordtran, J.S. (1975) Stimulation of active and passive

absorption by sugars in the human jejunum. Journalof Clinical Investigation 55, 728–737.
Fordtran, J.S. & Saltin, B. (1967) Gastric emptying andintestinal absorption during prolonged severe exer-cise. Journal of Applied Physiology 23, 331–335.
Foster, C. & Thompson, N.N. (1990) Serial gastric emp-tying studies: effect of preceding drinks. Medicine andScience in Sports and Exercise 22, 484–487.
Fronek, K. & Fronek, A. (1970) Combined effect of exer-cise and digestion on hemodynamics in consciousdogs. American Journal of Physiology 218, 555–559.
Gisolfi, C.V., Summers, R.W., Schedl, H.P., Bleiler, T.L.& Oppliger, R.A. (1990) Human intestinal waterabsorption: direct vs. indirect measurements. American Journal of Physiology 258, G216–G222.
Green, G. (1992) Gastrointestinal disorders in theathlete. Clinics in Sports Medicine 11, 453–470.
Heer, M., Repond, F., Hany, A. & Sulser, H. (1986) Hem-orrhagic colitis, gastritis, hematuria and rhabdomy-olysis: manifestations of multisystemic ischemia?Schweizerische Rundschau für Medizin Praxis 75,1538–1430.
Holdsworth, C.D. & Dawson, A.M. (1964) The absorp-tion of mono saccharides in man. Clinical Science 27,371–379.
Houmard, J.A., Egan, P.C., Johns, R.A., Neufer, P.D.,Chenierm, T.C. & Israel, R.G. (1991) Gastric empty-ing during 1 h of cycling and running at 75% V
.o2max..
Medicine and Science in Sports and Exercise 23, 320–325.Iwao, T., Toyonaga, A., Ikegami, M. et al. (1995) Effects
of exercise-induced sympathoadrenergic activationon portal blood flow. Digestive Diseases and Sciences40, 48–51.
Kenney, W.L. & Ho, C. (1995) Age alters regional distri-bution of blood flow during moderate-intensityexercise. Journal of Applied Physiology 79, 1112–1119.
Koffler, K.H., Menkes, R.A., Redmond, R.A., Whitehead, W.E., Prattley, R.E. & Hurley, B.F. (1992) Strength training accelerates gastrointestinaltransit in middle-aged and older men. Medicine andScience in Sports and Exercise 24, 415–419.
Larson, D.C. & Fisher, R. (1987) Management of exer-cise-induced gastrointestinal problems. The Physicianand Sports Medicine 15, 112–126.
Leiper, J.B. & Maughan, R.J. (1988) Experimentalmodels for the investigation of water and solutetransport in man: implications for oral rehydrationsolutions. Drugs 36 (Suppl. 4), 65–79.
Liu, F., Kondo, T. & Toda, Y. (1993) Brief physical inac-tivity prolongs colonic transit time in elderly activemen. International Journal of Sports Medicine 14,465–467.
McMahon, L.F., Ryan, M.J., Larson, D. & Fisher, R.L.(1984) Occult gastrointestinal blood loss associatedwith running a marathon. Annals of Internal Medicine100, 836–837.
Marzio, L., Formica, P., Fabiani, F., LaPenna, D., Vecchiett, L. & Cuccurullo, F. (1991) Influence ofphysical activity on gastric emptying of liquids in normal human subjects. American Journal of Gastroenterology 86, 1433–1436.
Maughan, R.J. (1991) Fluid and electrolyte loss andreplacement in exercise. Journal of Sports Sciences 9,117–142.
Maughan, R.J., Leiper, J.B. & McGaw, B.A. (1990)Effects of exercise intensity on absorption of ingestedfluids in man. Experimental Physiology 75, 419–421.
Mitchell, J.B. & Voss, K.W. (1991) The influence ofvolume on gastric emptying and fluid balanceduring prolonged exercise. Medicine and Science inSports and Exercise 23, 314–319.
Moore, J.G., Datz, F.L. & Christian, P.E. (1990) Exerciseincrease solid meal gastric emptying rates in men.Digestive Diseases and Sciences 35, 428–432.
Moses, F.M. (1988) Running-associated proximal hem-orrhagic colitis. Annals of Internal Medicine 108,385–386.
Moses, F.M. (1990) The effect of exercise on the gas-trointestinal tract. Sports Medicine 9, 159–172.
Moses, F.M. (1993) Gastrointestinal bleeding and theathlete. American Journal of Gastroenterology 88,1157–1159.
Moses, F., Singh, A., Smoak, B., Hollander, D. &Deuster, P. (1991) Alterations in intestinal permeabil-ity during prolonged high intensity running. Gas-troenterology 100, 472.
Murray, R. (1987) The effects of consuming carbohy-drate-electrolyte beverages on gastric emptying andfluid absorption during and following exercise.Sports Medicine 5, 322–351.
Neufer, P.D., Young, A.J. & Sawka, M.N. (1989a) Gastricemptying during exercise: effects of heat stress andhypohydration. European Journal of Applied Physiologyand Occupational Physiology 58, 433–439.
Neufer, P.D., Young, A.J. & Sawka, M.N. (1989b) Gastricemptying during walking and running: effects ofvaried exercise intensity. European Journal of AppliedPhysiology and Occupational Physiology 58, 440–445.
Noakes, T.D. (1991) The importance of volume in regu-lating gastric emptying. Medicine and Science in Sportsand Exercise 23, 307–313.
Oktedalen, O., Lunde, O.C., Aabakken, P.K. &Kvernebo, K.K. (1992) Changes in the gastrointesti-nal mucosa after long-distance running. ScandinavianJournal of Gastroenterology 27, 270–274.
Olivares, C.J. (1988) Toughest ironman ever. Triathlete52, 33–42.
Peters, H.P., Van Schelven, F.W., Verstappen, P.A., DeBoer, R.W., Bol, E. & De Vries, W.R. (1993) Gastro-intestinal problems as a function of carbohydratesupplements and mode of exercise. Medicine andScience in Sports and Exercise 25, 1211–1224.
gastrointestinal function and exercise 253

Peters, H.P., Akkermans, L.M., Bol, E. & Mosterd, W.L.(1995) Gastrointestinal symptoms during exercise.Sports Medicine 20, 65–76.
Peters, O., Peters, P., Clarys, J.P., DeMeirleir, K. & Devis,G. (1988) Esophageal motility and exercise. Gastroen-terology 94, a351.
Porter, A.M.W. (1982) Marathon running and the cecalslap syndrome. British Journal of Medicine 16, 178.
Porter, A.M.W. (1983) Do some marathon runners bleedinto the gut? British Journal of Medicine 287, 1427.
Pruett, T.L., Wilkins, M.E. & Gamble, W.G. (1985) Cecalvolvulus: a different twist for the serious runner. NewEngland Journal of Medicine 312, 1262–1263.
Qamar, M.I. & Read, A.E. (1987) Effects of exercise onmesenteric blood flow in man. Gut 28, 583–587.
Rehrer, N.J. & Maughan, R.J. (1991) The importance ofvolume in regulating gastric emptying. Medicine andScience in Sports and Exercise 23, 314–319.
Rehrer, N.J. & Meijer, G.A. (1991) Biomechanical vibra-tion of the abdominal region during running andbicycling. Journal of Sports Medicine 31, 231–234.
Rehrer, N.J., Beckers, E., Brouns, F., ten Hoor, F. & Saris,W.H. (1989) Exercise and training effects on gastricemptying of carbohydrate beverages. Medicine andScience in Sports and Exercise 21, 540–549.
Rehrer, N.J., Beckers, E.J., Brouns, F., ten Hoor, F. &Saris, W.H. (1990a) Effects of dehydration on gastricemptying and gastrointestinal distress whilerunning. Medicine and Science in Sports and Exercise22, 790–795.
Rehrer, N.J., Brouns, F., Beckers, E.J., ten Hoor, F. &Saris, W.H. (1990b) Gastric emptying with repeateddrinking during running and bicycling. InternationalJournal of Sports Medicine 11, 238–243.
Rehrer, N.J., Smets, A., Reynaert, H., Goes, E. &DeMeirleir, K. (1992a) Direct measurement ofsplanchnic blood flow during exercise in man. Medi-cine and Science in Sports and Exercise 24, s165.
Rehrer, N.J., van Kemenade, M., Meester, W., Brouns, F.& Saris, W.H.M. (1992b) Gastrointestinal complaintsin relation to dietary intake in triathletes. Interna-tional Journal of Sport Nutrition 2, 48–59.
Rehrer, N.J., Goes, E., DuGgardeyn, C., Reynaert, H. &DeMeirleir, K. (1993) Effects of carbohydrate andfluid ingestion on splanchnic blood flow at rest and during exercise. Medicine and Science in Sportsand Exercise 25, s84.
Rehrer, N.J., Brouns, F., Beckers, E.J. & Saris, W.H.M.(1994) The influence of beverage composition andgastrointestinal function on fluid and nutrient avail-ability during exercise. Scandinavian Journal of Medi-cine and Science in Sports 4, 159–172.
Riklis, E. & Quastel, J.H. (1958) Effects of cations onsugar absorption by isolated surviving guinea pigintestine. Canadian Journal of Biochemistry and Physiol-ogy 36, 347–363.
254 nutrition and exercise
Robertson, J.D., Maughan, R.J. & Davidson, R.J. (1987)Faecal blood loss in response to exercise. BritishJournal of Medicine 295, 303–305.
Rowell, L.B., Blackmon, J.R. & Bruce, R.A. (1964) Indo-cyanine green clearance and estimated hepatic bloodflow during mild to maximal exercise in uprightman. Journal of Clinical Investigation 43, 1677–1690.
Rudzki, S.J., Hazard, H. & Collinson, D. (1995) Gas-trointestinal blood loss in triathletes: its etiology andrelationship to sports anaemia. Australian Journal ofScience and Medicine in Sport 27, 3–8.
Ryan, A.J., Bleiler, T.L., Carter, J.E. & Gisolfi, C.V. (1989)Gastric emptying during prolonged cycling exercisein the heat. Medicine and Science in Sports and Exercise21, 51–58.
Ryan, A.J., Chang, R.T. & Gisolfi, C.V. (1996) Gastroin-testinal permeability following aspirin intake andprolonged running. Medicine and Science in Sports andExercise 28, 698–705.
Schaub, N., Spichtin, H.P. & Stalder, G.A. (1985)Ischamische kolitis als ursche einer darmblutung beimarathonlauf? (Is ischaemic colitis responsible forintestinal bleeding during marathon running?)Schweizerische Medizinische Wochenschrift 115, 454–457.
Schedl, H.P. & Clifton, J.A. (1963) Solute and waterabsorption by human small intestine. Nature 199,1264–1267.
Schoeman, M.N., Tippett, M.D., Akkermans, L.M.,Dent, J. & Holloway, R.H. (1995) Mechanisms of gas-troesophageal reflux in ambulant healthy humansubjects. Gastroenterology 108, 83–91.
Schwartz, A.E., Vanagunas, A. & Kamel, P.L. (1990)Endoscopy to evaluate gastrointestinal bleeding inmarathon runners. Annals of Internal Medicine 113,632–633.
Scobie, B.A. (1985) Recurrent gut bleeding in five long-distance runners. New Zealand Medical Journal 98,966.
Seto, H., Kageyama, M., Nomura, K. et al. (1995) Wholebody 201TI scintigraphy during one-leg exercise andat rest in normal subjects: estimation of regionalblood flow changes. Nuclear Medicine Communica-tions 16, 661–666.
Soffer, E.E., Merchant, R.K., Duethman, G., Launspach,J., Gisolfi, C. & Adrian, T.E. (1993) Effect of gradedexercise on esophageal motility and gastro-esophageal reflux in trained athletes. Digestive Dis-eases and Sciences 38, 220–224.
Soffer, E.E., Wilson, J., Duethman, G., Launspach, J. &Adrian, T.E. (1994) Effect of graded exercise onoesophageal motility and gastroesphageal reflux innontrained subjects. Digestive Diseases and Sciences39, 193–198.
Sole, C.C. & Noakes, T.D. (1989) Faster gastric empty-ing for glucose-polymer and fructose solutions than

for glucose in humans. European Journal of AppliedPhysiology and Occupational Physiology 58, 605–612.
Stebbins, C.L. & Symons, J.D. (1995) Role ofangiotensin II in hemodynamic responses todynamic exercise in miniswine. Journal of AppliedPhysiology 78, 185–190.
Stewart, J.G., Ahlquist, D.A., McGill, D.B., Ilstrup,D.M., Schwartz, S. & Owen, R.A. (1984) Gastro-intestinal blood loss and anemia in runners. Annalsof Internal Medicine 100, 843–845.
Sullivan, S.N. (1994) Functional abdominal bloating.Journal of Clinical Gastroenterology 19, 23–27.
Swain, R.A. (1994) Exercise-induced diarrhea: when towonder. Medicine and Science in Sports and Exercise 26,523–526.
Thune, I. & Lund, E. (1996) Physical activity and risk ofcolorectal cancer in men and women. British Journalof Cancer 73, 1134–1140.
Varr, V., Blah, G., Csernay, L., Jung, I. & Szarvas, F.(1965) Effect of decreased local circulation on theabsorptive capacity of a small-intestine loop in thedog. American Journal of Digestive Diseases 10, 2.
Vist, G.E. & Maughan, R.J. (1994) Gastric emptying of
ingested solutions in man: effect of beverage glucoseconcentration. Medicine and Science in Sports Exercise26, 1269–1273.
Wade, O.L., Combes, B., Childs, A.W., Wheeler, H.O.,Cournand, A. & Bradley, S.E. (1956) The effect ofexercise on the splanchnic blood flow and splanchnicblood volume in normal man. Clinical Science 15,457–463.
Walker, R.J., Fawcett, J.P., Flannery, E.M. & Gerrard,D.F. (1994) Indomethacin potentiates exercise-induced reduction in renal hemodynamics in ath-letes. Medicine and Science in Sports and Exercise 26,1302–1306.
Worobetz, L.J. & Gerrard, D.F. (1985) Gastrointestinalsymptoms during exercise in enduro athletes: preva-lence and speculations on the aetiology. New ZealandMedical Journal 98, 644–646.
Worobetz, L.J. & Gerrard, D.F. (1986) Effect of moderateexercise on esophageal function in asymptomaticathletes. American Journal of Gastroenterology 81,1048–1051.
Wright, J.P. (1991) Exercise and the gastro-intestinaltract. South African Medical Journal 83, 50–52.
gastrointestinal function and exercise 255

Introduction
Exercise can lead to a depletion of the body’sglycogen stores, particularly those of the liverand in the exercising muscle, and to the devel-opment of a body water deficit. This chapter concerns itself with recovery after exercise: car-bohydrate replacement during exercise is dis-cussed in Chapter 8, and fluid replacementduring exercise is described in detail in Chapter17.
Glycogen depletion results from the mobili-zation of the stores to provide energy for the muscular contraction of the exercise, and is amajor factor contributing to fatigue. This hasbeen discussed in detail in Chapter 6. Dependingon the intensity, frequency and duration of theexercise sessions, an almost complete emptyingof the glycogen stores in the exercising muscle ispossible.
Dehydration during exercise results largelyfrom activation of the body’s temperature-regulating mechanisms, and a state of hypohy-dration will be incurred if fluid is not ingested tomatch the seat loss. In an attempt to dissipate theheat produced due to the mechanical inefficiencyof exercise, the sweating mechanism may be acti-vated and the subsequent evaporation of thewater secreted onto the skin surface removeswith it latent heat of evaporation. This has beendiscussed in more detail in Chapters 15 and 17.Water loss from the respiratory tract, from thegastrointestinal tract and from urine productionall will add to the body’s water loss. Each of these
routes may result in substantial water losses insome situations, but for most individuals and inmost exercise situations, sweat production willbe the greatest single factor responsible for creat-ing a situation of hypohydration (Chapter 17).Sweat production, however, is not a situation ofpure water being secreted onto the skin, butrather a variety of electrolytes and other sub-stances are included in the sweat that is secreted.A general description of the composition ofsweat with regard to its electrolyte content isgiven in Chapter 17.
Effects of muscle glycogen depletionand hypohydration
Muscle glycogen depletion
If exercise is undertaken when the muscles aredepleted of their glycogen stores, performancewill be poorer than when the muscle glycogenstores are optimal. This has been shown to betrue for prolonged exercise of 1–2 h duration(Costill et al. 1988), for high-intensity exerciselasting only a few minutes (Maughan & Poole1981), and will also result in a reduction in theamount of running done by games players(Jacobs et al. 1982; Bangsbo 1994). In most of thesesituations, performance will be closely related tothe size of the glycogen stores at the beginning ofexercise. This has been discussed in detail inChapters 5–8.
Chapter 19
Rehydration and Recovery after Exercise
SUSAN M. SHIRREFFS
256

Hypohydration
Exercise undertaken by individuals who beginexercise in a hypohydrated state has been shownto be impaired relative to that possible whenfully hydrated at the beginning of exercise (seeChapter 16). However, in addition to theseadverse effects on performance, hypohydrationincreases the likelihood of heat illness, and exer-cise in this state is only likely to accelerate andexacerbate these effects (Sutton 1990).
Postexercise carbohydratereplacement
Many of the issues relating to carbohydratereplacement during exercise are relevant to carbohydrate replacement after exercise and afull discussion of this topic can be found inChapter 8.
The primary aim of carbohydrate ingestionfollowing exercise is to promote glycogen resyn-thesis and restoration of the muscle and liverglycogen utilized during exercise. This is of particular importance when a further bout of exercise is to be undertaken and therefore is ofsignificance to all athletes in training and in com-petition where more than one game or round isinvolved. Several factors will influence the rate atwhich glycogen resynthesis occurs after exercise.The most important factor is undoubtedly theamount of carbohydrate consumed: the type ofcarbohydrate and the time of ingestion are lessimportant, but also have an effect.
Amount of carbohydrate to be ingested
The general pattern for glycogen synthesis afterexercise is one of an increasing rate with increas-ing amount of carbohydrate consumed up to acertain rate of resynthesis after which there is nofurther increase with increasing quantities of carbohydrate ingestion. This has been demon-strated in studies where subjects were fed differ-ent amounts of glucose or maltodextrins every 2h after exercise (Blom et al. 1987; Ivy et al. 1988a).The results showed that muscle glycogen synthe-
sis occurred at a rate of 2mmol ·kg–1 · h–1 when25g of carbohydrate was ingested every 2 h, andthat the replenishment rate increased to 6mmol ·kg–1 ·h–1 when 50 g was ingested every 2 h.However, muscle glycogen synthesis didincrease to more than about 5–6mmol · kg–1 ·h–1
even when very large amounts (up to 225 g) ofcarbohydrate were ingested every 2 h.
Further, with intravenous glucose infusion of100g every 2h, a muscle glycogen synthesis of about 7–8mmol ·kg–1 ·h–1 has been reported(Reed et al. 1989). This is not significantly greaterthan the rates achieved with oral intake, and suggests that the failure to keep increasing gly-cogen synthesis with increasing carbohydrateconsumption is not caused by a limitation in substrate availability imposed by the gastroin-testinal tract. Also, increasing the amount of carbohydrate ingested will increase the rate ofdelivery to the intestine for absorption (seeChapter 18).
Therefore, it seems that the maximum rate ofmuscle glycogen synthesis after exercise is in theregion of 5–8mmol ·kg–1 ·h–1, provided that atleast 50 g of glucose is ingested every 2 h afterexercise.
Carbohydrate type and form of ingestion
Glucose and sucrose ingestion both give rise tosimilar glycogen synthesis rates when consumedafter exercise. Fructose alone, however, seemsonly to be able to promote glycogen synthesisafter exercise at a much lower rate of approxi-mately 3mmol · kg–1 · h–1 (Jenkins et al. 1984; Blomet al. 1987). This is likely to be because of the rela-tively slow rate with which the liver convertsfructose to blood glucose, and even when fruc-tose is consumed in large amounts, the entry ofglucose into the blood does not reach a rate of 50g every 2 h. Although the use of fructose as acarbohydrate source is often promoted for ath-letes, it is poorly absorbed in the small intestinerelative to many other sugars, and ingestion oflarge amounts is likely to result in diarrhoea(Maughan et al. 1989).
There is some evidence that carbohydrates
rehydration and recovery after exercise 257
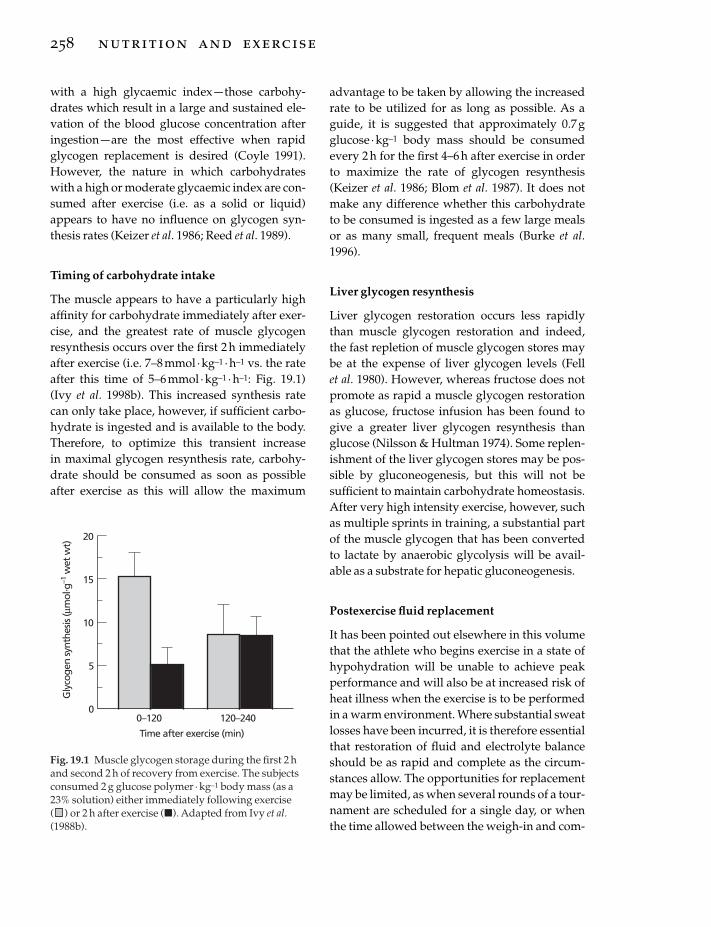
with a high glycaemic index — those carbohy-drates which result in a large and sustained ele-vation of the blood glucose concentration afteringestion — are the most effective when rapidglycogen replacement is desired (Coyle 1991).However, the nature in which carbohydrateswith a high or moderate glycaemic index are con-sumed after exercise (i.e. as a solid or liquid)appears to have no influence on glycogen syn-thesis rates (Keizer et al. 1986; Reed et al. 1989).
Timing of carbohydrate intake
The muscle appears to have a particularly highaffinity for carbohydrate immediately after exer-cise, and the greatest rate of muscle glycogenresynthesis occurs over the first 2 h immediatelyafter exercise (i.e. 7–8mmol · kg–1 ·h–1 vs. the rateafter this time of 5–6 mmol ·kg–1 · h–1: Fig. 19.1)(Ivy et al. 1998b). This increased synthesis ratecan only take place, however, if sufficient carbo-hydrate is ingested and is available to the body.Therefore, to optimize this transient increase in maximal glycogen resynthesis rate, carbohy-drate should be consumed as soon as possibleafter exercise as this will allow the maximum
258 nutrition and exercise
advantage to be taken by allowing the increasedrate to be utilized for as long as possible. As aguide, it is suggested that approximately 0.7gglucose ·kg–1 body mass should be consumedevery 2h for the first 4–6 h after exercise in orderto maximize the rate of glycogen resynthesis(Keizer et al. 1986; Blom et al. 1987). It does notmake any difference whether this carbohydrateto be consumed is ingested as a few large mealsor as many small, frequent meals (Burke et al.1996).
Liver glycogen resynthesis
Liver glycogen restoration occurs less rapidlythan muscle glycogen restoration and indeed,the fast repletion of muscle glycogen stores maybe at the expense of liver glycogen levels (Fell et al. 1980). However, whereas fructose does notpromote as rapid a muscle glycogen restorationas glucose, fructose infusion has been found togive a greater liver glycogen resynthesis thanglucose (Nilsson & Hultman 1974). Some replen-ishment of the liver glycogen stores may be pos-sible by gluconeogenesis, but this will not besufficient to maintain carbohydrate homeostasis.After very high intensity exercise, however, suchas multiple sprints in training, a substantial partof the muscle glycogen that has been convertedto lactate by anaerobic glycolysis will be avail-able as a substrate for hepatic gluconeogenesis.
Postexercise fluid replacement
It has been pointed out elsewhere in this volumethat the athlete who begins exercise in a state ofhypohydration will be unable to achieve peakperformance and will also be at increased risk ofheat illness when the exercise is to be performedin a warm environment. Where substantial sweatlosses have been incurred, it is therefore essentialthat restoration of fluid and electrolyte balanceshould be as rapid and complete as the circum-stances allow. The opportunities for replacementmay be limited, as when several rounds of a tour-nament are scheduled for a single day, or whenthe time allowed between the weigh-in and com-
Gly
coge
n sy
nthe
sis (µ
mol
. g–1
wet
wt)
20
0
15
10
0–120
5
120–240
Time after exercise (min)
Fig. 19.1 Muscle glycogen storage during the first 2 hand second 2 h of recovery from exercise. The subjectsconsumed 2 g glucose polymer · kg–1 body mass (as a23% solution) either immediately following exercise( ) or 2 h after exercise (�). Adapted from Ivy et al.(1988b).

petition is short in weight category sports wheresweating and fluid restriction have been used toachieve an artificially low body mass.
The primary factors influencing the postexer-cise rehydration process are the volume andcomposition of the fluid consumed. The volumeconsumed will be influenced by many factors,including the palatability of the drink and itseffects on the thirst mechanism, and many differ-ent formulation options are open. The ingestionof solid food, and the composition of that food,will also be an important factor, but there aremany situations where solid food is avoidedbetween exercise sessions or immediately afterexercise.
Beverage composition
It is well established that plain water consumedafter exercise is not the ideal rehydration bever-age when rapid and complete restoration of fluidbalance is necessary and where all intake is inliquid form. Costill and Sparks (1973) demon-strated that ingestion of plain water after exercise-induced dehydration caused a large fallin serum osmolality with a subsequent diuresis:the result of this stimulation of urinary water losswas a failure to achieve positive fluid balance bythe end of the 4-h study period. However, whenan electrolyte-containing solution (106g · l–1 car-bohydrate, 22 mmol · l–1 Na+, 2.6 mmol · l–1 K+,17.2mmol · l–1 Cl–) was ingested after exercisewhich caused a loss of 4% of body mass, the urineoutput was less and net water balance was closerto the pre-exercise level. Nielsen et al. (1986)showed differences in the rate and extent ofchanges in the plasma volume with recoveryfrom exercise-induced dehydration when differ-ent carbohydrate-electrolyte solutions were con-sumed: the plasma volume increase was greaterafter drinks with sodium as the only electrolyte(at concentrations of 43 and 128mmol · l–1) wereconsumed than when drinks containing addi-tional potassium (at a concentration of 51 mmol ·l–1) or less electrolytes and more carbohydratewere consumed. González-Alonso et al. (1992)have also confirmed that a dilute carbohydrate-
electrolyte solution (60 g · l–1 carbohydrate,20mmol · l–1 Na+, 3 mmol · l–1 K+, 20 mmol · l–1 Cl–)is more effective in promoting postexercise rehy-dration than either plain water or a low-electrolyte diet cola: the difference in rehydrationeffectiveness between the drinks was a result ofdifferences in the volume of urine produced. Innone of these studies, however, could the mecha-nism of the action be identified, as the drinksused were different from each other in a numberof respects. They did, however, establish that,because of the high urine flow that ensued, evendrinking large volumes of electrolyte-free drinksdid not allow subjects to remain in positive fluid balance for more than a very short time.They also established that the plasma volumewas better maintained when electrolytes werepresent in the fluid ingested, and it seemed likelythat this effect was due primarily to the presenceof sodium in the drinks.
The first studies to investigate the mechanismsthat might be involved showed that the ingestionof large volumes of plain water after exercise-induced dehydration results in a rapid fall inplasma osmolality and in the plasma sodiumconcentration (Nose et al. 1988a, 1988b, 1988c),and both of these effects will stimulate urineoutput. In these studies, subjects exercised at lowintensity in the heat for 90–110min, inducing amean level of dehydration equivalent to 2.3% ofthe pre-exercise body mass, and then rested for 1h before beginning to drink. Plasma volumewas not restored until after 60min when plainwater was ingested together with placebo(sucrose) capsules. In contrast, when sodiumchloride capsules were ingested with water togive a saline solution with an effective concentra-tion of 0.45% (77mmol · l–1), restoration of plasmavolume was complete within 20min. In the NaCltrial, voluntary fluid intake was higher and urineoutput was less; 29% of the water intake was lostas urine within 3h compared with 49% in theplain water trial. The delayed rehydration in thewater trial was a result of a loss of water as urinecaused by a rapid return to control levels ofplasma renin activity and aldosterone levels.
Therefore, the addition of sodium to rehydra-
rehydration and recovery after exercise 259

tion beverages can be justified on two accounts.Firstly, sodium stimulates glucose absorption inthe small intestine (Olsen & Ingelfinger 1968):water absorption from the intestinal lumen is apurely passive process that is determined largelyby local osmotic gradients (Parsons & Wingate1961). The active cotransport of glucose andsodium creates an osmotic gradient that acts topromote net water absorption (Sladen 1972), and the rate of rehydration is therefore greaterwhen glucose–sodium chloride solutions areconsumed than when plain water is ingested.This was discussed in detail in Chapter 18. Sec-ondly, replacement of sweat losses with plainwater will, if the volume ingested is sufficientlylarge, lead to haemodilution: the fall in plasmaosmolality and sodium concentration that occursin this situation will reduce the drive to drinkand will stimulate urine output (Nose et al.1988b) and has potentially more serious conse-quences such as hyponatraemia (Noakes et al.1985).
It has been proposed that drinks used for post-exercise rehydration should have a sodium con-centration similar to that of sweat (Maughan1991), but as the electrolyte content of sweat itselfshows considerable variation between individu-als and over time (see Chapter 17), it would seemimpossible to prescribe a single formulation forevery individual or every situation. However, astudy to investigate the relation between whole-body sweat sodium losses and the rehydrationeffectiveness of beverages with different sodiumconcentrations seems to confirm that optimumrehydration is achieved with a drink with asodium concentration similar to that of sweat(Shirreffs & Maughan 1997b).
Sodium is the major ion in the extracellularfluid but potassium is the major ion in the intra-cellular fluid (see Table 17.1). It has been sug-gested therefore that potassium may also be tosome degree important in achieving rehydrationby aiding the retention of water in the intracellu-lar space. Yawata (1990) undertook experimentalwork on rats subjected to thermal dehydration ofapproximately 9% of body mass and then givenfree access to either tap water, a 150 mmol · l–1
260 nutrition and exercise
NaCl solution or a 154mmol · l–1 KCl solution.The results indicated that despite ingestion of asmaller volume of the KCl solution compared to the NaCl solution, there was a tendency for a greater restoration of the intracellular fluid space in the KCl group than in the NaCl group.Maughan et al. (1994) undertook a study in which men were dehydrated by approxima-tely 2% of body mass by exercising in the heat, and then ingested a glucose beverage (90 mmol · l–1), a sodium-containing beverage(NaCl 60 mmol · l–1), a potassium-containing beverage (KCl 25 mmol · l–1) or a beverage con-sisting of the addition of all three. A smallervolume of urine was excreted following rehydra-tion when the electrolyte-containing beverageswere ingested than when the electrolyte-freebeverage was consumed (Fig. 19.2). An esti-mated plasma volume decrease of 4.4% wasobserved with dehydration over all trials but therate of recovery was slowest when the KCl bever-age was consumed. Although there were differ-ences in the total amount of electrolyte replacedas well as differences in the type of electrolytespresent in the drinks, there was no difference inthe fraction of ingested fluid retained 6 h afterfinishing drinking the drinks which containedelectrolytes. This may be because the beveragevolume consumed was equivalent to the volumeof sweat lost and subjects were dehydrated,because of the ongoing urine losses, throughoutthe entire study, even following the drinkingperiod. The volumes of urine excreted were closeto basal levels and significant further reductionsin output may not have been possible when bothsodium and potassium were ingested, over andabove the reductions already induced when thesodium and potassium were ingested separately.The importance of potassium in enhancing rehy-dration by aiding intracellular rehydration overand above that with sodium seems therefore tobe realistic but further investigation is requiredto provide conclusive evidence.
Drink volume
Obligatory urine losses persist even in the dehy-

drated state, acting as a vehicle for the elimina-tion of metabolic waste products. It is clear therefore that the total fluid intake after exercise-induced or thermal sweating must amount to avolume greater than the volume of sweat that hasbeen lost if an effective rehydration is to beachieved. Shirreffs et al. (1996) investigated theinfluence of drink volume on rehydration effec-tiveness following exercise-induced dehydrationequivalent to approximately 2% of body mass.Drink volumes equivalent to 50%, 100%, 150%and 200% of the sweat loss were consumed afterexercise. To investigate the possible interactionbetween beverage volume and its sodiumcontent, a relatively low sodium drink (23 mmol ·l–1) and a moderately high sodium drink (61mmol · l–1) were compared.
With both beverages, the urine volume pro-duced was, not surprisingly, related to the bever-age volume consumed; the smallest volumeswere produced when 50% of the loss was con-sumed and the greatest when 200% of the losswas consumed. Subjects did not restore theirhydration status when they consumed a volumeequivalent to, or only half, their sweat loss irre-spective of the drink composition. When a drinkvolume equal to 150% of the sweat loss was con-sumed, subjects were slightly hypohydrated 6hafter drinking when the test drink had a lowsodium concentration, and they were in a similar
condition when they drank the same beverage ina volume of twice their sweat loss. With the high-sodium drink, enough fluid was retained to keepthe subjects in a state of hyperhydration 6h afterdrink ingestion when they consumed either150% or 200% of their sweat loss. The excesswould eventually be lost by urine production orby further sweat loss if the individual resumedexercise or moved to a warm environment. Cal-culated plasma volume changes indicated adecrease of approximately 5.3% with dehydra-tion. At the end of the study period, the generalpattern was for the increases in plasma volume tobe a direct function of the volume of fluid con-sumed: additionally, the increase tended to begreater for those individuals who ingested thehigh sodium drink.
Food and fluid consumption
In some situations, there may be opportunities toconsume solid food between exercise bouts, andin most situations it should be encouraged unlessit is likely to result in gastrointestinal distur-bances. In a study to investigate the role of foodintake in promoting rehydration from a hypo-hydration of approximately 2% of body mass,induced by exercising in the heat, a solid mealplus flavoured water or a commercially availablesports drink were consumed (Maughan et al.
rehydration and recovery after exercise 261
800
700
600
500
400
300
200
100
00 1 2 3 4 5 6
Morn
ing
Time after rehydration (h)C
um
ula
tive
uri
ne
volu
me
(ml)
Fig. 19.2 Cumulative urineoutput over time afterrehydration. After exercise-induced dehydration byapproximately 2% of body mass,different rehydration drinks in avolume equivalent to the sweatloss were consumed, and all theurine produced was collected. �,glucose 90mmol · l-1; �, KCl25mmol · l-1; �, NaCl 60mmol ·l-1; �, mixture of three drinks. Seetext for full explanation. Adaptedfrom Maughan et al. (1994).

1996). The volume of fluid contained within themeal plus water was the same as the volume ofsports drink consumed, but the volume of urineproduced following food and water ingestionwas less than that when the sports drink wasconsumed (Table 19.1). Although the amount ofwater consumed with both rehydration methodswas the same, the meal had a greater sodium andpotassium content and it seems most likely thatthe greater efficacy of the meal plus water treat-ment in restoring whole body water balance wasa consequence of the greater total cation content.
Alcohol consumption
Because of the well-known diuretic properties ofalcohol and caffeine, it is usual to advise againstthe consumption of drinks containing these sub-stances when fluid replacement is a priority.However, many people enjoy consuming thesebeverages, and where large volumes of fluidmust be consumed in a relatively short time, awide choice of drinks will help to stimulate consumption. In many sports, particularly teamsports, alcohol intake is a part of the culture ofthe sport, and athletes are resistant to sugges-tions that they should abstain completely (seeChapter 30). However, it is now apparent that thediuretic effect expected from alcohol, over andabove an alcohol-free beverage having otherwisethe same composition, is blunted when con-sumed by individuals who are moderately hypo-hydrated from exercise in a warm environment(Shirreffs & Maughan 1997a).
After exercise, subjects consumed beer shandy
262 nutrition and exercise
(a peculiarly British drink produced by mixingbeer with lemonade) containing 0%, 1%, 2% or4% alcohol. The volume of urine excreted for the6h following drink ingestion was related to thequantity of alcohol consumed, but despite a ten-dency for the urinary output to increase withincreasing alcohol intake, only with the 4% bev-erage did the increased value approach signifi-cance. The calculated decrease in plasma volumewith dehydration was approximately 7.6%across all trials. With rehydration, the plasmavolume increased, but the rate of increaseseemed to be related to the quantity of alcoholconsumed; 6 h after finishing drinking, theincrease in plasma volume relative to the dehy-drated value was approximately 8% with 0%alcohol, 7% with 1%, 6% with 2% and 5% with4%. It may be worth noting that the high sugarcontent of lemonade (10%) means that beershandy has a carbohydrate content of about 5%,and this carbohydrate may play an importantrole in the restoration of muscle and liver glyco-gen stores after exercise.
Voluntary fluid intake
The information from the work described abovewas obtained from studies in which a fixedvolume of fluid was consumed. In practice,however, intake will be determined by the interaction of physiological and psychologicalfactors. A second consequence of ingestion ofplain water is to remove the drive to drink bycausing plasma osmolality and sodium concen-tration to fall (Nose et al. 1988b). Where a fixed
Table 19.1 Fluid consumed, quantities of major electrolytes ingested and volume of urine produced. Values inbrackets are mean (SEM) or median (range) as appropriate.
Meal + water Sports drink
Fluid volume (ml) 2076 (131) 2042 (132)
Electrolytes ingested (mmol)Na+ 63 (4) 43 (3)K+ 21 (1) 7 (1)
6h urine volume (ml) 665 (396–1190) 934 (550–1403)

volume of fluid is given, this is not important,but it will tend to prevent complete rehydrationwhen fluid intake is on a volitional basis(Maughan & Leiper 1993).
Conclusion
Complete restoration of fluid balance after exer-cise is an important part of the recovery process,and becomes even more important in hot, humidconditions. If a second bout of exercise has to beperformed after a relatively short interval, thespeed of rehydration accomplishment becomesof crucial importance. Rehydration after exerciserequires not only replacement of volume losses,but also replacement of the electrolytes, primar-ily sodium, lost in the sweat. The electrolyte com-position of sweat is highly variable betweenindividuals and although the optimum drinkmay be achieved by matching electrolyte losswith equal quantities from the drink, this is virtu-ally impossible in a practical situation. Sweatcomposition not only varies between individu-als, but also varies with time during exercise andis further influenced by the state of acclimation(Taylor 1986). Typical values for sodium andpotassium concentrations are about 50 mmol · l–1
and 5mmol · l–1, respectively. Drinks intendedspecifically for rehydration should thereforeprobably have higher electrolyte content thandrinks formulated for consumption during exer-cise, especially where opportunities for ingestionof solid food are restricted.
Where sweat losses are large, the total sodiumloss will be high: 10 l of sweat at a sodium con-centration of 50mmol · l–1 amounts to about 29gof sodium chloride. However, a moderate excessof salt intake would appear to be beneficial as faras hydration status is concerned without anydetrimental effects on health provided that fluidintake is in excess of sweat loss and that renalfunction is not impaired.
The Oral Rehydration Solution recommendedby the World Health Organization for the treat-ment of acute diarrhoea has a sodium content of60–90mmol · l–1 (Farthing 1994), reflecting thehigh sodium losses which may occur in some
types of diarrhoea. In contrast, the sodiumcontent of most sports drinks is in the range of10–30mmol · l–1 (see Table 17.2) and in some casesis even lower. Most commonly consumed softdrinks contain virtually no sodium and thesedrinks are therefore unsuitable when the needfor rehydration is crucial. The problem with ahigh sodium concentration in drinks is that somepeople find the taste undesirable, resulting inreduced consumption. However, drinks with alow sodium content are ineffective at rehydra-tion, and they will also reduce the stimulus todrink.
Addition of an energy source is not necessaryfor rehydration, although a small amount of car-bohydrate may improve the rate of intestinaluptake of sodium and water, and will improvepalatability. Where sweat losses are high, rehy-dration with carbohydrate solutions has implica-tions for energy balance: 10 l of soft drinks willprovide approximately 1000 g of carbohydrate,equivalent to about 16.8 MJ (4000 kcal). Thevolume of beverage consumed should be greaterthan the volume of sweat lost in order to make aprovision for the ongoing obligatory urinelosses, and palatability of the beverage is a majorissue when large volumes of fluid have to be consumed.
Although water alone is adequate for rehydra-tion, when food is also consumed this replacesthe electrolytes lost in sweat. However, there aremany situations where intake of solid food isavoided. This is particularly true in weight cate-gory sports where the interval between theweigh-in and competition is short, but is also thecase in events where only a few hours intervenebetween succeeding rounds of the competition. Itis in these situations that electrolytes must bepresent in the drinks consumed.
If a body water deficit is incurred during exer-cise, it is important that this is rectified in the postexercise period if a decrement in perfor-mance during a subsequent exercise bout is to beavoided. If no further exercise is planned, theremay be no urgency for fluid replacement and thewater will generally be replaced over the follow-ing day or so by a combination of eating and
rehydration and recovery after exercise 263

drinking. If, however, a second bout of exercise isto be undertaken and a decrement in perfor-mance is to be avoided, the water lost must bereplaced as completely as possible before theexercise commences and further sweat produc-tion occurs.
Prioritizing rehydration and recoveryafter exercise: carbohydrate vs. water replacement
Drinks consumed during or after exercise aregenerally intended to replace the water and elec-trolyte losses incurred as a result of sweat secre-tion, and also to provide carbohydrate tosupplement or replenish the glycogen stores inthe liver and the working muscles. The relativeimportance of providing water or substrate isinfluenced by many factors. However, distur-bances in body fluid balance and temperaturenot only can impair exercise performance but arepotentially life-threatening (Åstrand & Rodahl1986). In comparison, the depletion of carbohy-drate stores in the liver and working muscles willresult in fatigue and a reduction in exercise inten-sity, but on the whole presents no great risk tohealth. Therefore, except in situations wheredepletion of body water has not occurred, thefirst aim of postexercise recovery should be torestore any fluid deficit incurred, followed byrepletion of liver and muscle glycogen stores.
It must, of course, be recognized that theseaims need not be mutually exclusive. Selection ofsuitable food and drinks should provide both the carbohydrate necessary for optimization ofmuscle and liver glycogen resynthesis and thewater and electrolytes necessary for replacementof sweat losses and restoration of fluid balance.
References
Åstrand, P.-O. & Rodahl, K. (1986) Textbook of WorkPhysiology: Physiological Bases of Exercise, 3rd edn.McGraw-Hill, Singapore.
Bangsbo, J. (1994) Physiological demands. In Football(ed. B. Ekblom), pp. 43–58. Blackwell Scientific Publi-cations, Oxford.
Blom, P.C.S., Høstmark, A.T., Vaage, O., Kardel, K.R. &
264 nutrition and exercise
Mæhlum, S. (1987) Effect of different post-exercisesugar diets on the rate of muscle glycogen synthesis.Medicine and Science in Sports and Exercise 19, 491–496.
Burke, L.M., Collier, G.R., Davis, P.G., Fricker, P.A.,Sanigorski, A.J. & Hargreaves, M. (1996) Muscleglycogen storage after prolonged exercise: effect ofthe frequency of carbohydrate feedings. AmericanJournal of Clinical Nutrition 64, 115–119.
Costill, D.L. & Sparks, K.E. (1973) Rapid fluid replace-ment following thermal dehydration. Journal ofApplied Physiology 34, 299–303.
Costill, D.L., Sherman, W.M., Fink, W.J., Maresh, C.,Witten, M. & Miller, J.M. (1988) Effects of repeateddays of intensified training on muscle glycogen andswimming performance. Medicine and Science inSports and Exercise 20, 249–254.
Coyle, E.F. (1991) Timing and method of increased car-bohydrate intake to cope with heavy training, com-petition and recovery. Journal of Sports Science 9(Special Issue), 29–52.
Farthing, M.J.G. (1994) Oral rehydration therapy. Phar-macological Therapeutics 64, 477–492.
Fell, R.D., McLane, J.A., Winder, W.W. & Holloszy, J.O.(1980) Preferential resynthesis of muscle glycogen infasting rats after exhaustive exercise. AmericanJournal of Physiology 238, R328–R332.
González-Alonso, J., Heaps, C.L. & Coyle, E.F. (1992)Rehydration after exercise with common beveragesand water. International Journal of Sports Medicine 13,399–406.
Ivy, J.L., Lee, M.C., Brozinick, J.T. & Reed, M.J. (1988a)Muscle glycogen storage after different amounts ofcarbohydrate ingestion. Journal of Applied Physiology65, 2018–2023.
Ivy, J.L., Katz, A.L., Cutler, C.L., Sherman, W.M. &Coyle, E.F. (1988b) Muscle glycogen synthesis afterexercise: effect of time of carbohydrate ingestion.Journal of Applied Physiology 64, 1480–1485.
Jacobs, I., Westlin, N., Karlsson, J., Rasmusson, M. &Houghton, B. (1982) Muscle glycogen and diet inelite soccer players. European Journal of Applied Physi-ology 48, 297–302.
Jenkins, D.J.A., Wolever, T.M.S., Jenkins, A.L., Josse,R.G. & Wong, G.S. (1984) The glycaemic response tocarbohydrate foods. Lancet 18, 388–391.
Keizer, H.A., Kuipers, H., van Kranenburg, G. &Geurten, P. (1986) Influence of liquid and solid meals on muscle glycogen resynthesis, plasma fuelhormone response, and maximal physical workingcapacity. International Journal of Sports Medicine 8,99–104.
Maughan, R.J. (1991) Carbohydrate-electrolyte solu-tions during prolonged exercise. In Perspectives inExercise Science and Sports Science. Vol. 4. Ergogenics:The Enhancement of Sport Performance (ed. D.R. Lamb

& M.H. Williams), pp. 35–85. Benchmark Press,Carmel, CA.
Maughan, R.J. & Leiper, J.B. (1993) Post-exercise rehy-dration in man: effects of voluntary intake of fourdifferent beverages. Medicine and Science in Sports andExercise 25 (Suppl.), S2.
Maughan, R.J. & Poole, D.C. (1981) The effects of aglycogen loading regimen on the capacity to performanaerobic exercise. European Journal of Applied Physi-ology 46, 211–219.
Maughan, R.J., Fenn, C.E. & Leiper, J.B. (1989) Effects of fluid, electrolyte and substrate ingestion onendurance capacity. European Journal of Applied Physi-ology 58, 481–486.
Maughan, R.J., Owen, J.H., Shirreffs, S.M. & Leiper, J.B.(1994) Post-exercise rehydration in man: effects ofelectrolyte addition to ingested fluids. EuropeanJournal of Applied Physiology 69, 209–215.
Maughan, R.J., Leiper, J.B. & Shirreffs, S.M. (1996)Restoration of fluid balance after exercise-induceddehydration: effects of food and fluid intake. Euro-pean Journal of Applied Physiology 73, 317–325.
Nielsen, B., Sjogaard, G., Ugelvig, J., Knudsen, B. &Dohlmann, B. (1986) Fluid balance in exercise dehy-dration and rehydration with different glucose-electrolyte drinks. European Journal of Applied Physiol-ogy 55, 318–325.
Nilsson, L.H. & Hultman, E. (1974) Liver and muscleglycogen in man after glucose and fructose infusion.Scandinavian Journal of Clinical and Laboratory Investi-gation 33, 5–10.
Noakes, T.D., Goodwin, N., Rayner, B.L., Branken, T. &Taylor, R.K.N. (1985) Water intoxication: a possiblecomplication during endurance exercise. Medicineand Science in Sports and Exercise 17, 370–375.
Nose, H., Mack, G.W., Shi, X. & Nadel, E.R. (1988a)Shift in body fluid compartments after dehydrationin humans. Journal of Applied Physiology 65, 318–324.
Nose, H., Mack, G.W., Shi, X. & Nadel, E.R. (1988b)Role of osmolality and plasma volume during rehy-dration in humans. Journal of Applied Physiology 65,325–331.
Nose, H., Mack, G.W., Shi, X. & Nadel, E.R. (1988c)Involvement of sodium retention hormones duringrehydration in humans. Journal of Applied Physiology65, 332–336.
Olsen, W.A. & Ingelfinger, F.J. (1968) The role of sodiumin intestinal glucose absorption in man. Journal ofClinical Investigation 47, 1133–1142.
Parsons, D.S. & Wingate, D.L. (1961) The effect ofosmotic gradients on fluid transfer across rat intes-tine in vitro. Biochemica Biophysica Acta 46, 170–183.
Reed, M.J., Brozlnick, J.T. Jr, Lee, M.C. & Ivy, J.L. (1989)Muscle glycogen storage post exercise: effect onmode of carbohydrate administration. Journal ofApplied Physiology 66, 720–726.
Shirreffs, S.M. & Maughan, R.J. (1997a) Restoration offluid balance after exercise-induced dehydration:effects of alcohol consumption. Journal of AppliedPhysiology 83, 1152–1158.
Shirreffs, S.M. & Maughan, R.J. (1997b) Whole bodysweat collection in humans: an improved methodwith preliminary data on electrolyte content. Journalof Applied Physiology 82, 336–341.
Shirreffs, S.M., Taylor, A.J., Leiper, J.B. & Maughan, R.J.(1996) Post-exercise rehydration in man: effects of volume consumed and drink sodium content.Medicine and Science in Sports and Exercise 28,1260–1271.
Sladen, G.E.G. (1972) A review of water and electrolyteabsorption in man. In Transport across the Intestine(ed. W.L. Burland & P.K. Sammuel), pp. 14–34.Churchill Livingstone, London.
Sutton, J.R. (1990) Clinical implications of fluid imbal-ance. In Perspectives in Exercise Science and SportsScience. Vol. 3. Fluid Homeostasis during Exercise (ed.C.V. Gisolfi & D.R. Lamb), pp. 425–448. BenchmarkPress, Carmel, CA.
Taylor, N.A.S. (1986) Eccrine sweat glands. Adapta-tions to physical training and heat acclimation.Sports Medicine 3, 387–397.
Yawata, T. (1990) Effect of potassium solution on rehy-dration in rats: comparison with sodium solutionand water. Japanese Journal of Physiology 40, 369–381.
rehydration and recovery after exercise 265

Introduction
Vitamins in sports
Vitamin supplements, including especiallyvitamin C, but also the B-complex vitamins andvitamin E, are frequently used by athletes (Sobal& Marquart 1994). The common motivation forvitamin supplementation is to improve sportsperformance and enhance recovery (Williams1986). Reversing the view, many athletes andcoaches fear that a normal diet will eventuallylead to marginal vitamin supply and to a deterio-ration in sports performance.
As regards vitamins and optimal physical per-formance, there are two questions with substan-tial practical importance. First, if vitamin supplyis marginal, would an athlete’s functional capac-ity be less than optimal? Second, if vitamins are given in excess of daily needs, would this improve functional capacity? This chapterreviews the basic metabolic functions of differentvitamins (Table 20.1) and aims at giving answersto the two above-mentioned questions. Thevitamin requirements of physically active peopleare reviewed in Chapter 21, and antioxidantfunctions in Chapter 22.
What are vitamins?
Vitamins are organic compounds required invery small amounts (from a few micrograms to afew milligrams on a daily basis) to prevent devel-opment of clinical deficiency and deterioration in
health, growth and reproduction (McCormick1986). A distinct feature of vitamins is that thehuman body is not able to synthesize them. Clas-sification of vitamins is based on their relativesolubility (McCormick 1986): fat-soluble vita-mins (A, D, E and K) are more soluble in organicsolvents, and water-soluble vitamins (B-complexand C) in water.
Ubiquinone and ‘vitamin B15’ are examples of compounds announced as ‘vitamins’ and asergogenic substances for athletes. Ubiquinone,an electron carrier in the mitochondrial respira-tory chain, is indeed needed for normal bodyfunction and health, and it is found in a Westernmixed diet (Greenberg & Frishman 1988). Nevertheless, because the body can synthesizeubiquinone, the name ‘vitamin Q’ is misleadingand should not be used.
‘Vitamin B15’, in contrast to ubiquinone, cannotbe synthesized by the human body. However, it is not a vitamin, because there are no specificdiseases or signs associated with depletion. Infact, ‘vitamin B15’ in products with ergogenicclaims does not even have a well-defined chemical identity (Williams 1986). There is noevidence that supplementation with ubiqui-none or ‘vitamin B15’ would increase athletic performance (Williams 1986; Laaksonen et al.1995).
Vitamin supply and functional capacity
Adequate nutritional status means a sufficiencyof the host nutriture to permit cells, tissues,
Chapter 20
Vitamins: Metabolic Functions
MIKAEL FOGELHOLM
266

organs, anatomical systems or the host him/herself to perform optimally the intentioned,nutrient-dependent function (Solomons & Allen1983). Vitamins — like all micronutrients — areneeded directly or indirectly (because of activityon structural integrity) for innumerable func-tions. Metabolic functions may be viewed froman isolated, molecular viewpoint (i.e. a singlebiochemical reaction in a single metabolic path-way), or from a perspective of the entire humanbody.
The metabolic functions of vitamins requiredin sports are mainly those needed for productionof energy and for neuromuscular functions(skills). Physical performance involve severalmetabolic pathways, all including several bio-chemical reactions. The relation between vitaminsupply and functional capacity is S-shaped or‘bell-shaped’, depending on whether the exami-nation is extended to megadoses (Fig. 20.1)(Brubacher 1989). The core in the above rela-tion is that the output (functional capacity) is not improved after the ‘minimal requirement for maximal output’ is reached (Brubacher 1989).
In contrast, overvitaminosis may in some cases reduce the output below the maximal level.
Different body functions (single biochem-ical reactions, metabolic pathways, function ofanatomical systems, and function of the hosthim/herself) reach their maximal output at different levels of supply. In other words, the supply needed for optimal function of ananatomical system (e.g. the muscle) may be quitedifferent from the supply needed to maximizethe activity of a single enzyme (Solomons &Allen 1983).
Short-term inadequacy of vitamin intake ischaracterized by lowering of vitamin concentra-tions in different tissues and lowering of certainenzyme activities (Fig. 20.2) (Piertzik 1986).However, functional disturbances (such asdecreased physical performance capacity)appear later (Solomons & Allen 1983; Fogelholm1995). In the opposite case, very large vitaminintakes increase the body pool and activity ofsome enzymes, but do not necessarily improvefunctional capacity (Fogelholm 1995).
vitamins: metabolic functions 267
Table 20.1 Summary of the most important effects of vitamins on body functions related to athletic performance.
Cofactorsfor energy Nervous Haemoglobin Immune Antioxidant Bonemetabolism function synthesis function function metabolism
Water-soluble vitamins
Thiamin X XRiboflavin X X (X)Vitamin B6 X X X XFolic acid X XVitamin B12 X XNiacin X XPantothenic X
acidBiotin XVitamin C (X) X X
Fat-solublevitamins
Vitamin A X XVitamin D XVitamin E X X
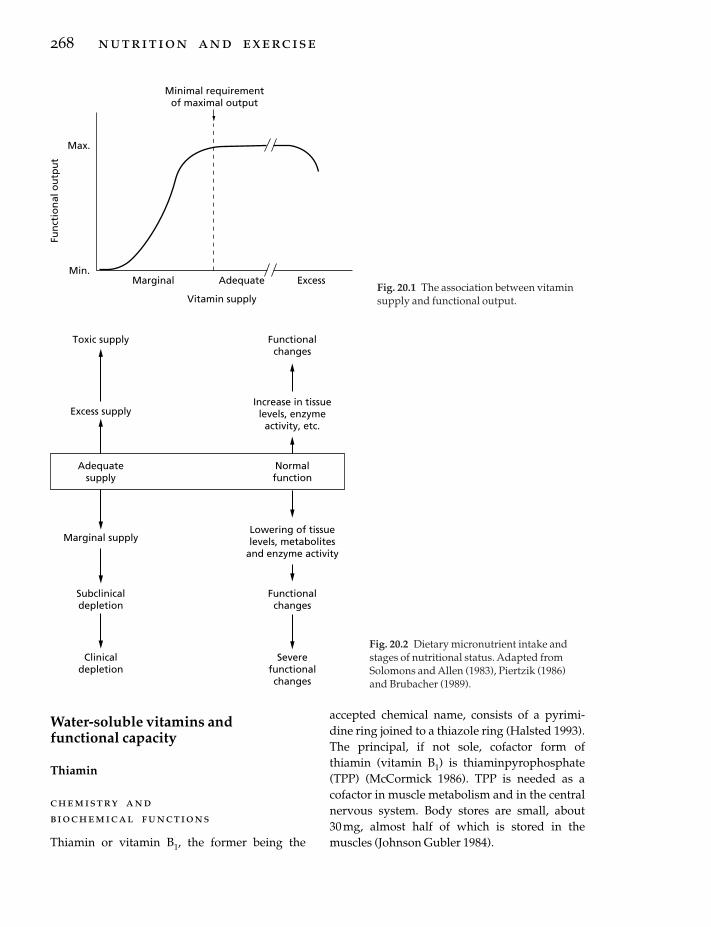
Water-soluble vitamins and functional capacity
Thiamin
chemistry andbiochemical functions
Thiamin or vitamin B1, the former being the
268 nutrition and exercise
accepted chemical name, consists of a pyrimi-dine ring joined to a thiazole ring (Halsted 1993).The principal, if not sole, cofactor form ofthiamin (vitamin B1) is thiaminpyrophosphate(TPP) (McCormick 1986). TPP is needed as acofactor in muscle metabolism and in the centralnervous system. Body stores are small, about 30mg, almost half of which is stored in themuscles (Johnson Gubler 1984).
Adequate ExcessMarginal
Max.
Min.
Fun
ctio
nal
ou
tpu
t
Minimal requirementof maximal output
Vitamin supplyFig. 20.1 The association between vitaminsupply and functional output.
Toxic supply Functionalchanges
Excess supplyIncrease in tissuelevels, enzyme
activity, etc.
Adequatesupply
Normalfunction
Marginal supplyLowering of tissuelevels, metabolites
and enzyme activity
Subclinicaldepletion
Functionalchanges
Clinicaldepletion
Severefunctionalchanges
Fig. 20.2 Dietary micronutrient intake andstages of nutritional status. Adapted fromSolomons and Allen (1983), Piertzik (1986)and Brubacher (1989).

Two important enzyme complexes of glycoly-sis and the citric acid cycle require TPP as a cofac-tor, namely, pyruvate dehydrogenase (formationof acetyl-coenzyme A from pyruvate) and a-ketoglutarate dehydrogenase (formation of succinyl-coenzyme A from a-ketoglutarate)(Johnson Gubler 1984). If the decarboxylation ofpyruvate is inadequate to match the increasedspeed of glycolysis, pyruvate will accumulate inthe tissue (Sauberlich 1967). The accumulation ofpyruvate will eventually lead to increased lacticacid production (Johnson Gubler 1984), which is lowered after thiamin supplementation(Sauberlich 1967). By interfering with the citricacid cycle, improper function of a-ketoglutaratedehydrogenase would affect aerobic energy pro-duction, and through feedback reactions, also theoverall rate of glycolysis.
Although the muscle tissue contains morethan 40% of the total body thiamin, the vitaminconcentration is much higher in the liver, kidneyand brain (Johnson Gubler 1984). Also, thenerves contain a constant and significant amountof TPP (Johnson Gubler 1984), and thiamin isindeed very important for the function of thebrain and the nervous system (McCormick 1986;Halsted 1993).
In addition to the two above-mentionedenzyme complexes, thiamin is also needed in thepentose phosphate pathway (PPP) as a cofactorfor transketolase (Johnson Gubler 1984). PPP isimportant for production of pentoses for RNAand DNA synthesis, and nicotinamide adeninedinucleotide phosphate (NADPH) for biosyn-thesis of fatty acids. The role of PPP in energyproduction is minor (Johnson Gubler 1984).However, the interesting feature about trans-ketolase is that the activity of erythrocyte trans-ketolase, with and without in vitro added TPP, is widely used as an indicator of thiamin status(Bayomi & Rosalki 1976). Several papers havebeen published on erythrocyte transketolaseactivity in athletes (for a review, see Fogelholm1995).
supply and metabolic functions
In subclinical thiamin deficiency, the exercise-
induced blood lactate concentrations are ele-vated, especially after a pre-exercise glucose load (Sauberlich 1967). The deterioration ofphysical capacity in marginal deficiency is less evident. Wood et al. (1980) did not finddecreased working capacity, neurophysiologi-cal changes or adverse psychological reactions in male students, despite a 5-week thiamin-depleted diet. However, the erythrocyte trans-ketolase activity decreased, showing that theactivity of this enzyme is affected faster than the activity of the enzymes of glycolysis and the citric acid cycle.
A combined depletion of thiamin, riboflavin,vitamin B6 and ascorbic acid has been found toaffect both erythrocyte transketolase activity andaerobic working capacity (van der Beek et al.1988). However, because of the multiple deple-tion, the independent role of thiamin could notbe demonstrated. The uncertainty of the inde-pendent role of thiamin was a concern also instudies showing improved shooting accuracy(Bonke & Nickel 1989) or neuromuscular irritability (van Dam 1978) after combinedthiamin, riboflavin, vitamin B6 or vitamin B12supplementation.
A 1–3-month vitamin B-complex supplemen-tation (>7.5 mg· day–1) usually improves theactivity of erythrocyte transketolase (van Dam1978; Guilland et al. 1989; Fogelholm et al. 1993b).Nevertheless, despite improved erythrocytetransketolase activity or increased blood thiaminconcentration, several studies have shown thatvitamin supplementation did not improve func-tional capacity in athletes (Telford et al. 1992a,1992b), young adults (Singh et al. 1992a, 1992b;Fogelholm et al. 1993b) or in elderly subjects(Suboticanec et al. 1989).
safety of elevated thiamin intake
Adverse reactions of chronic, elevated oraladministration of thiamin are virtually unknown(Marks 1989). Hypersensitivity reactions maysometimes occur after very high oral loads (5–10g), or following much lower doses (5–10mg)by parenteral administration (Marks 1989). Forchronic oral use, the safe dose is at least 50–100
vitamins: metabolic functions 269

times the recommended daily intake; that is,above 100 mg daily.
Riboflavin
chemistry and biochemical functions
Riboflavin (correct chemical name) or vitamin B2is composed of an isoalloxazine ring linked to aribityl side chain (Halsted 1993). Modification ofthe side chain yields flavin mononucleotide(FMN). When linked to adenine monophos-phate, FMN forms flavin adenine dinucleotide(FAD). FMN and FAD function as coenzymes innumerous oxidation-reduction reactions in gly-colysis and the respiratory chain (Cooperman &Lopez 1984). Enzymes requiring FAD are, e.g.pyruvate dehydrogenase complex (glycolysis),a-ketoglutarate dehydrogenase complex andsuccinate dehydrogenase (citric acid cycle). FADis also needed in fatty acid oxidation, whereasFMN is necessary for the synthesis of fatty acidsfrom acetate (Cooperman & Lopez 1984).
Riboflavin has also indirect effects on body functions by affecting iron utilization (Fairweather-Tait et al. 1992). The mechanism isstill unknown in humans, but some results indi-cate that correction of riboflavin deficiency alsoraises low blood haemoglobin concentrations(Cooperman & Lopez 1984; Fairweather-Tait et al. 1992). Severe riboflavin deficiency can alsoaffect the status of other B-complex vitamins,mainly by decreased conversion of vitamin B6 toits active coenzyme and of tryptophan to niacin(Cooperman & Lopez 1984).
Like thiamin, the activity of an enzyme iso-lated from the erythrocytes is widely used as anindicator of riboflavin status (Bayomi & Rosalki1976; Cooperman & Lopez 1984). The enzyme,glutathione reductase, catalyses the reduction ofoxidized glutathione with simultaneous oxida-tion of NADPH. The enzyme activity in vitro isrelated to activity after saturation by FAD. Thebetter the vitamin status, the smaller the increasein activity after added FAD (Bayomi & Rosalki1976).
270 nutrition and exercise
supply and metabolic functions
Changes in riboflavin supply have been postu-lated to affect both muscle metabolism and neuromuscular function. Data on the effects ofmarginal riboflavin supply are, however, scarce.In three studies (Belko et al. 1984, 1985; TreblerWinters et al. 1992), a 4–5-week period with mar-ginal riboflavin intake resulted in lowering of theerythrocyte glutathione reductase activity, but norelation with aerobic capacity was found. Simi-larly, Soares et al. (1993) did not find changes inmuscular efficiency during moderate-intensityexercise after a 7-week period of riboflavin-restricted diet.
In contrast to the above studies, van der Beek et al. (1988) reported impaired maximal oxygenuptake and increased blood lactate appearanceafter a 10-week period with marginal thiamin,riboflavin and vitamin B6 intake. The indepen-dent role of riboflavin was, however, uncertain.
Decreased urinary riboflavin excretion mightbe one mechanism in preventing changes inriboflavin-dependent body functions duringmarginal depletion (Belko et al. 1984, 1985; Soareset al. 1993). More severe riboflavin deficiency isobviously likely to affect both maximal and sub-maximal aerobic work capacity, as well as neuro-muscular function (Cooperman & Lopez 1984).
A 1–3-month vitamin B-complex supplemen-tation improves the activity of erythrocyte glutathione reductase (van Dam 1978; Weight et al. 1988b; Guilland et al. 1989; Fogelholm et al.1993b) in athletes or trained students, evenwithout indications of impaired vitamin status(Weight et al. 1988b). Two studies have suggestedthat supplementation and improvement inriboflavin status (judged by changes in erythro-cyte glutathione reductase activity) were related to improved neuromuscular function(Haralambie 1976; Bamji et al. 1982).
Riboflavin supplementation, in combinationwith one or more water-soluble vitamins, hasbeen shown to affect both erythrocyte enzymeactivity and maximal oxygen uptake (Buzina et al. 1982; Suboticanec-Buzina et al. 1984) orwork efficiency (Powers et al. 1985) in children

with known nutritional deficiencies. In contrast,several other studies did not find an associa-tion between increased erythrocyte glutathionereductase activity and maximal oxygen uptake(Suboticanec-Buzina et al. 1984; Weight et al.1988a, 1988b; Suboticanec et al. 1990; Singh et al.1992a, 1992b), exercise-induced lactate appear-ance in the blood (Weight et al. 1988a, 1988b;Fogelholm et al. 1993b), work efficiency (Powerset al. 1987) or grip strength (Suboticanec et al.1989).
safety of elevatedriboflavin intake
As with thiamin, there is no evidence of anyharmful effects even with oral doses exceeding100 times the recommended daily intake (Marks1989). Riboflavin in large doses may cause ayellow discoloration of the urine which mightobviously cause concern in people not aware ofthe origin of the colour (Alhadeff et al. 1984).
Vitamin B6
chemistry andbiochemical functions
Vitamin B6 is a common name for pyridoxine,pyridoxamine and pyridoxal (McCormick 1986).Pyridoxine hydrochloride is the synthetic phar-maceutical form of vitamin B6 (Halsted 1993). Allthree chemical forms of vitamin B6 are metaboli-cally active after phosphorylation. The mostcommon cofactor in human body is pyridoxalphosphate (PLP) (Driskell 1984). It is a prostheticgroup of transaminases, transferases, decarboxy-lases and cleavage enzymes needed in manyreactions involving for instance protein break-down (Manore 1994). PLP is also an essentialstructural component of glycogen phosphory-lase, the first enzyme in glycogen breakdownpathway (Allgood & Cidlowski 1991). In fact,muscle-bound PLP represents 80% of the approx-imately 4-g body pool of vitamin B6 (Coburn et al.1988).
In addition to energy metabolism, vitamin B6
is needed for synthesis and metabolism of manyneurotransmitters (e.g. serotonin), and in thedevelopment and maintenance of a competentimmune system (Allgood & Cidlowski 1991).PLP-dependent enzymes are involved in syn-thesis of catecholamines (Driskell 1984), andperhaps in regulation of steroid hormone action(Allgood & Cidlowski 1991). Vitamin B6 is alsoneeded for the synthesis of aminolevulic acid, anintermediate compound in the formation of theporphyrin ring in haemoglobin (Manore 1994).
From a physiological viewpoint, vitamin B6depletion could decrease glycogen breakdownand impair capacity for glycolysis and anaerobicenergy production. Because glycogen phos-phorylase is not a rate-limiting enzyme inglycogenolysis, small changes in its activitywould, however, not affect glycogen me-tabolism. Severe depletion would also affecthaemoglobin synthesis, and impair oxygentransport in the blood. The contribution of aminoacids in total energy expenditure is not likely toexceed 10%, even in a glycogen depleted state.Therefore, it is unclear how an impairment inamino acid breakdown would affect physicalperformance.
The activity of two enzymes involved in ery-throcytic protein metabolism, namely aspartateaminotransferase (ASAT) and alanine amino-transferase (ALAT), are used as indicators ofvitamin B6 status (Bayomi & Rosalki 1976;Driskell 1984). The principle of the assay, withand without in vitro saturation, is similar to thatexplained earlier for thiamin (transketolase) andriboflavin (glutathione reductase) (Bayomi &Rosalki 1976).
supply and metabolic functions
In male wrestlers and judo-athletes, a decrease inthe erythrocyte ASAT activity indicated deterio-ration in vitamin B6 supply during a 3-weekweight-loss regimen (Fogelholm et al. 1993a).Maximal anaerobic capacity, speed or strengthwere, however, not affected. Coburn et al. (1991)showed that the muscle tissue is, in fact, quiteresistant to a 6-week vitamin B6 depletion.
vitamins: metabolic functions 271
Marginal vitamin B6 supply has been related toimpaired aerobic functions only in combinationwith a simultaneous thiamin and riboflavindepletion (van der Beek et al. 1988).
In an interesting study, indices of vitamin B6status were examined during a 3-month sub-marine patrol (Reynolds et al. 1988). The resultsindicated deterioration in status and marginalvitamin B6 supply at the end of the patrol. Psy-chological tests indicated pronounced depres-sion after submergence and at the midpatrolpoint. However, the depression measures wereneither correlated with indicators of vitamin B6status nor affected by vitamin supplementation.
Chronic supplementation of vitamin B6increases the erythrocyte ASAT activity (vanDam 1978; Guilland et al. 1989; Fogelholm et al.1993b) and plasma PLP-concentration (Weight et al. 1988a; Coburn et al. 1991) even in healthysubjects. However, an increase in the above indi-cators of vitamin B6 status is not necessarily asso-ciated with a marked increase in intramuscularvitamin B6 content (Coburn et al. 1991).
It appears that vitamin B6, either as an infusion(Moretti et al. 1982) or given orally as a 20mg ·day–1 supplement (Dunton et al. 1993), has a stimulating effect on exercise-induced growthhormone production. The hypothetical mecha-nism behind this effect is that PLP acts as thecoenzyme for dopa decarboxylase, and high concentrations might promote the conversion ofL-dopa to dopamine (Manore 1994). The physio-logical significance of the above effect is notknown (Manore 1994). Moreover, the effects ofchronic vitamin B6 administration on the 24-hgrowth hormone concentration of plasma havenot been studied.
Supplementation of vitamin B6, alone (Suboticanec et al. 1990) or in combination withother B-complex vitamins (van Dam 1978; Bonke& Nickel 1989), has improved maximal oxygenuptake in undernourished children (Suboticanecet al. 1990), and shooting performance (Bonke &Nickel 1989) and muscle irritability (van Dam1978) in male athletes. In contrast, a number ofother studies did not find any associationbetween improved indicators of vitamin B6
272 nutrition and exercise
status and maximal oxygen uptake (Suboticanec-Buzina et al. 1984; Weight et al. 1988a, 1988b),exercise-induced lactate appearance in blood(Manore & Leklem 1988; Weight et al. 1988a,1988b; Fogelholm et al. 1993b), grip strength(Suboticanec et al. 1989) or other tests of physicalperformance (Telford et al. 1992a, 1992b).
safety of elevatedvitamin b6 intake
In contrast to thiamin and riboflavin, megadosesof vitamin B6 may have important toxic effects.The most common disorder is sensory neuropa-thy, sometimes combined with epidermal vesi-cular dermatosis (Bässler 1989). The safe dose for chronic oral administration of vitamin B6appears to be around 300–500mg daily (Bässler1989). However, it is recommended that long-term supplementation should not exceed200mg ·day–1 — that is, 100 times the recom-mended dietary allowance (Marks 1989).
Folic acid and vitamin B12
chemistry andbiochemical functions
Folate and folic acid are generic terms for com-pounds related to pteroic acid. The body pool is5–10mg (Herbert 1987), and liver folate is a majorpart of the total. Folate coenzymes are needed in transportation of single carbon units in, forinstance, thymidylate, methionine and purinesynthesis (Fairbanks & Klee 1986).
Deficiency of folate results in impaired celldivision and alterations in protein synthesis. The effects are most significant in rapidlygrowing tissues (Herbert 1987). A typical deficiency symptom is megaloblastic anaemia(lowered blood haemoglobin concentration, with increased mean corpuscular volume;Halsted 1993). Decreased oxygen transportcapacity would affect submaximal and eventu-ally also maximal aerobic performance. If irondeficiency exists simultaneously with folate defi-ciency, red cell morphology does not necessarily

deviate from reference values (Fairbanks & Klee1986). Folate is also needed in the nervoussystem, and depletion during pregnancy mightcause lethal neural tube defects (Reynolds 1994).
Vitamin B12 and cobalamin refer to a largergroup of physiologically active cobalamins (Fairbanks & Klee 1986). Cyanocobalamin is theprincipal commercial and therapeutic product(Halsted 1993). Cobalamin is a cofactor for tworeactions: the synthesis of methionine and theconversion of methylmalonic acid to succinicacid (Halsted 1993). Through these reactions,cobalamin is needed in normal red blood cellsynthesis and neuronal metabolism (Fairbanks &Klee 1986).
Cobalamin deficiency leads to megaloblasticanaemia and to neurological disorders. As inanaemia caused by folate deficiency, erythrocytevolume is usually increased, in contrast to frankiron-deficiency anaemia (Fairbanks & Klee 1986).Compared with the daily requirements, the 2–3mg body pool of cobalamin is very large. Evenwith no dietary cobalamin, the body pool wouldsuffice for about 3–5 years (Fairbanks & Klee1986).
supply and metabolic functions
There are only a few studies linking folic acid orvitamin B12 supply to sports-related functionalcapacity. Folate supplementation and increasedserum folate concentration did not affectmaximal oxygen uptake (Matter et al. 1987),anaerobic threshold (Matter et al. 1987), gripstrength (Suboticanec et al. 1989) or other measures of physical performance (Telford et al.1992a, 1992b). Together with thiamin andvitamin B6 supplementation, elevated intake ofvitamin B12 was, however, associated withimproved shooting performance (Bonke &Nickel 1989).
safety of elevated folic acid andvitamin b12 intake
The effects of high doses of folic acid have notbeen studied very much, but some results indi-
cate a possible interference with zinc metabolism(Marks 1989; Reynolds 1994). The current esti-mate of the safety dose is between 50 and 100times the daily recommended intake (Marks1989). The safety margin for vitamin B12 appearsto be much larger, because even doses as high as30mg ·day–1 (that is, 10000 times the recom-mended intake) have been used without notice-able toxic effects (Marks 1989).
Other vitamins of the B-group
niacin
Niacin is used as a name for nicotinic acid as wellas for its derivatives nicotinamide and nicotinicacid amide (McCormick 1986). About 67% ofniacin required by an adult can be convertedfrom the amino acid tryptophan; 60mg of trypto-phan is needed for the formation of 1mg niacin.
Nicotinamide, as a part of nicotinamideadenine dinucleotide (NAD) and NADPH, participates in hundreds of oxidation-reductionreactions (McCormick 1986; Halsted 1993). NADis needed as an electron acceptor in glycolysis(enzyme: glyceraldehyde-3-phosphate dehydro-genase) and the citric acid cycle (pyruvate dehydrogenase, isocitrate dehydrogenase, a-ketoglutarate dehydrogenase and malate dehy-drogenase), and the reduced form of NADPH asan electron donor in fatty acid synthesis.
Because of its important role in mitochondrialmetabolism, niacin deficiency has the potentialto affect both muscular and nervous function.Unfortunately, there are no direct studies on theeffects of niacin deficiency on physical perfor-mance. In contrast, high-dose supplementation(e.g. intravenous administration) of niacin blocksthe release of free fatty acids from the adip-ose tissue, and impairs long-term submaximalendurance (Pernow & Saltin 1971).
Acute oral intake of at least 100mg of nicotinicacid per day (i.e. at least five times the recom-mended daily allowance) causes vasodilatationand flushing, which is a rather harmless effect(Marks 1989). Very large, chronic supplementa-tion of niacin has been reported to cause hepato-
vitamins: metabolic functions 273

toxicity, cholestatic jaundice, an increased serumconcentration of uric acid, cardiac dysrhythmiasand various dermatologic problems (Alhadeff et al. 1984). The safe chronic dose appears to be at least 50 times the recommended allowance, i.e. 1g ·day–1 (Marks 1989).
biotin
The main function of biotin is as cofactor inenzymes catalysing transport of carboxyl units (McCormick 1986). In the cytosol, a biotin-dependent enzyme, acetyl-coenzyme Acarboxylase, catalyses the formation of malonyl-coenzyme A from acetyl-coenzyme A. Malonyl-coenzyme A is used for fatty acid synthesis. Inthe mitochondria, biotin is an integral part ofpyruvate carboxylase. This enzyme catalyses theconversion of pyruvate to oxaloacetate, which isan intermediate in gluconeogenesis and the citricacid cycle.
Through the function of pyruvate carboxylase,biotin has a critical role in maintaining the levelof citric acid cycle intermediates. Although it islikely that aerobic performance would beimpaired by biotin deficiency, the physical per-formance of biotin deficient patients has neverbeen investigated. Moreover, excluding individ-uals with an excessive intake of raw egg-white(which contains avidin, a biotin-binding glycoprotein), dietary biotin deficiency is almostimpossible in practice (McCormick 1986).
There are no reported toxic effects of biotinintake up to 10 mg ·day–1 (> 100 times the recom-mended allowance) (Marks 1989; Halsted 1993).
pantothenic acid
Pantothenic acid functions as a cofactor in coenzyme A, which, as acetyl-coenzyme A, is in acentral position for both energy production and fatty acid synthesis (McCormick 1986). Pantothenic acid is also needed in the 4¢-phosphopantetheine moiety of acyl carrierprotein of fatty acid synthetase.
Pantothenic acid deficiency due to dietaryreasons has never been reported. Deficiency
274 nutrition and exercise
symptoms have been induced with a semisyn-thetic diet practically free of pantothenate.Symptoms include general fatigue and increasedheart rate during exertion (McCormick 1986).Relations between pantothenic acid status andphysical performance capacity have not beeninvestigated.
Pantothenic acid has not been reported tocause any toxic affects even at doses up to 10 gdaily, i.e. 1000 times the recommended intakelevel (Alhadeff et al. 1984; Marks 1989).
Vitamin C
chemistry andbiochemical functions
Vitamin C or ascorbic acid is a strong reducingagent, which is reversibly oxidized to dehy-droascorbic acid in numerous biochemical reactions (Padh 1991). By its reducing capacity,ascorbic acid stimulates enzymes involved in, forinstance, biosynthesis of collagen, carnitine,pyrimidine and noradrenaline (McCormick1986; Padh 1991).
In addition to the above biosynthetic path-ways, ascorbic acid has a very important role asan extracellular antioxidant against many typesof free radical compounds (see Chapter 22). Inthe gastrointestinal tract, ascorbic acid enhancesiron absorption by keeping iron in a reducedferrous state (Gershoff 1993). In contrast, highdoses of ascorbic acid may suppress copperabsorption by reducing copper to a lessabsorbable monovalent state (Finley &Cerklewski 1983).
supply and metabolic functions
Ascorbic acid is needed in carnitine synthesis,and therefore indirectly for transfer of long-chainfatty acids across the inner mitochondrial membrane. A substantial decrease in muscle car-nitine would theoretically decrease submaximalendurance capacity by increasing the de-pendence on glycogen instead of fatty acids(Wagenmakers 1991). In one study (van der Beek
et al. 1990), a vitamin C restricted diet was fol-lowed by reduced whole blood ascorbic acid con-centration. The marginal vitamin C supply didnot produce any significant effects on maximalaerobic capacity or lactate threshold in healthyvolunteers. Carnitine, or any other metabolitesrelated to vitamin C status, was not measured.
Vitamin C supplementation has been associ-ated with increased maximal aerobic capacity(Buzina et al. 1982; Suboticanec-Buzina et al. 1984)and work efficiency (Powers et al. 1985) in mal-nourished children. However, the above positiveeffects were seen simultaneously with supple-mentation of one or more vitamins of the B-complex group. Hence, the independent role ofascorbic acid was not shown. The majority ofother studies have not shown any measurableeffects of vitamin C supplementation on maxi-mal oxygen uptake, lactate threshold or exercise-induced heart-rate in well-nourished subjects(Gerster 1989).
Due to its function as an antioxidant in phago-cytic leucocytes, supplementary vitamin C mayslightly decrease the duration of common coldepisodes (Hemilä 1992). The study of Peters et al.(1993) provided evidence that 600 mg vitamin Cdaily reduced the incidence (33% vs. 68%) andduration (4.2 vs. 5.6 days) of upper-respiratory-tract infection in runners after a 90-km ultra-marathon race. It is not known, however,whether the potential effect of vitamin C supple-mentation on the common cold in athletes hasany significant long-term effects on performance.
In a large epidemiological survey in the US,dietary vitamin C intake was weakly but positively associated with pulmonary function(forced expiratory volume in 1s) in healthy sub-jects, but a stronger relationship was found inasthmatic patients (Schwartz & Weiss 1994). Theauthors postulated that the antioxidant effects ofvitamin C have a protective role on pulmonaryfunction. Finally, earlier results suggest thatvitamin C supplementation (≥250mg daily)might reduce heat strain in unacclimatized indi-viduals (Kotze et al. 1977) which could theoreti-cally enhance physical performance in certaincircumstances.
safety of elevatedvitamin c intake
There are reports suggesting that very high (>1gdaily), chronic doses of vitamin C might lead toformation of oxalate stones, increased uric acidexcretion, diarrhoea, vitamin B12 destruction andiron overload, and induce a dependency state(Alhadeff et al. 1984). However, excluding diar-rhoea, the risk for the above toxic effects is likelyto be very low in healthy individuals, even withintake of several grams daily (Marks 1989; Rivers1989).
Fat-soluble vitamins
Vitamin E
chemistry andbiochemical functions
Vitamin E consists of a trimethylhydroquinonehead and a diterpenoid side chain (Jenkins 1993).The most active biological form of vitamin E is a-tocopherol. It is stored in many tissues, with thelargest amount in the liver. Vitamin E is trans-ported mainly in very low density lipoproteins.
Vitamin E is one of the most important antioxi-dants in cellular membranes (see Chapter 22),and it stabilizes the structural integrity of mem-branes by breaking the chain reaction of lipidperoxidation (Jenkins 1993). Vitamin E is alsoessential for normal function of the immunesystem (Meydani 1995).
supply and metabolic functions
It has been hypothesized that free radicaldamage to mitochondrial membranes in vitaminE depletion would impair the reactions of oxida-tive phosphorylation, and hence physical workcapacity. Vitamin E deficiency is, however, veryrare, and the relationship between decreasedvitamin E supply and physical capacity has notbeen investigated (Jenkins 1993).
Supplementation of vitamin E has well-established and rather consistent effects on some
vitamins: metabolic functions 275

metabolic functions even in well-nourishedhumans: after chronic vitamin E supplementa-tion (typical dose, > 100mg ·day–1), indices ofexercise-induced lipid peroxidation, mainlyserum malondialdehyde concentration andbreath pentane exhalation, are reduced (Jenkins1993; Rokitzki et al. 1994; Kanter & Williams 1995;Tiidus & Houston 1995). There are some interpre-tation problems, however, mainly because of thelack of specificity and/or reliability of most indi-cators of lipid peroxidation (Kanter & Williams1995).
In one study (Simon-Schnass & Pabst 1988),vitamin E supplementation helped to maintainaerobic working capacity at very high altitude (> 5000m). Other studies have not conclusivelyproven that vitamin E intake exceeding daily rec-ommendations would have any beneficial effectson athletic performance (Rokitzki et al. 1994;Kanter & Williams 1995; Tiidus & Houston 1995).
safety of elevatedvitamin e intake
Vitamin E, in contrast to two other fat-soluble vitamins (A and D), is apparently not toxic forhealthy individuals (Machlin 1989). The safetyfactor for long-term administration is at least 100times the recommended daily intake — that is, atleast 1g daily in oral use (Marks 1989). Over-doses of vitamin E are contraindicated only inindividuals receiving vitamin K antagonists(Machlin 1989).
Other fat-soluble vitamins
vitamin a
The two natural forms of vitamin A are retinoland 3-dehydroretinol, of which retinol is themore abundant in the human body (Bates 1995).All higher animals can convert plant-derivedcarotenes and cryptoxanthin to retinol. The mostcommon and effective provitamin in the humandiet is b-carotene. Retinol is transported in chylomicrons from the gut, and later bound to aprotein (retinol-binding protein, RBP). Several
276 nutrition and exercise
hundred milligrams of retinol are stored in theliver (McCormick 1986).
The best known function of retinol is as anessential component in vision. In vitamin A defi-ciency, worsening of night vision is an early clini-cal sign (McLaren et al. 1993). Both retinol andb-carotene are capable of scavenging singletoxygens and hence act as antioxidants (Bates1995). Vitamin A is also important for immunity.The literature provides no evident data on relations between vitamin A status and physicalperformance.
Chronic toxicity of retinol will cause joint orbone pain, hair loss, anorexia and liver damage.The safety level for chronic use is estimated to be10 times the recommended daily intake — that is,10mg retinol daily (Marks 1989). Because of anincreased risk for spontaneous abortions andbirth defects (Underwood 1989), the safe levelduring pregnancy might be only four to fivetimes the daily recommendation (Marks 1989). b-carotene, in contrast to retinol, is not toxic. Thisprovitamin is stored under the skin and it is con-verted to retinol only when needed.
vitamin d
In the diet, vitamin D occurs mainly as cholecal-ciferol (D3), which can also be synthesized in skinafter ultraviolet irradiation (Fraser 1995). In theliver, D3 is hydroxylated to 25-hydroxycholecal-ciferol (25-OH-D3), and further in the kidneys to 1,25-dihydroxycholecalciferol (1,25-(OH)2-D3,active form) or to 24,25-dihydroxycholecalciferol(24,25-(OH)2-D3, inactive form). Vitamin D isstored in several parts in the body, e.g. in the liverand under the skin.
Vitamin D stimulates calcium absorption inthe small intestine and increases calcium reab-sorption by the distal renal tubules. Deficiencyresults in bone demineralization (rickets andosteomalacia), and this may eventually increasethe risk for stress fractures (Fraser 1995).
Vitamin D is potentially toxic, especially for young children, causing hypercalcaemia,hypercalciuria, soft-tissue calcification, anorexiaand constipation, and eventually irreversible
renal and cardiovascular damage (Davies 1989).Intakes of 10 times the recommendation shouldnot be exceeded (Marks 1989). High calciumintakes may enhance the toxicity of vitamin D.
vitamin k
Vitamin K is the general name of com-pounds containing a 2-methyl-1,4-naptho-quinone moiety. Vitamin K is needed for formation of prothrombin in the blood, anddefective blood coagulation is the only majorsign of deficiency (McCormick 1986). No evidentassociations between vitamin K and exercisemetabolism are to be found. Further, very little isknown about the safety of orally administeredvitamin K (Marks 1989).
Conclusion
Vitamins are extremely important for the func-tional capacity of the human body (see Table20.1). Many B vitamins participate as enzymecofactors in pathways of energy metabolism andin neuromuscular functions. Folic acid and vita-mins B12 and B6 are needed for haemoglobin syn-thesis, and consequently for optimal oxygentransport from the lungs to the working tissues.Some vitamins (e.g. vitamins A, B6 and C) arerequired for normal immune function. Finally,vitamins A, C and E have important antioxidantproperties.
Studies have clearly shown that the output ofmany vitamin-dependent functions both in vivo(e.g. breath pentane exhalation) and in vitro (e.g.erythrocyte enzymes) may increase after supple-mentation above normal dietary intake. Simi-larly, the output of many functions is decreasedat marginal vitamin supply. However, the outputof the entire human body (e.g. athletic perfor-mance) was only rarely related to marginalvitamin supply or to supplementation.
The dietary intake of vitamins is not highenough to ensure maximal output of many iso-lated functions. However, it appears that thevitamin intake, at least in developed countries, isabove the minimal requirement for maximal
output of the human body. Consequently, theevidence that vitamin supplementation wouldincrease athletic performance is not very encour-aging. On the other hand, the risk for toxic intakealso seems to be marginal.
The above conclusions are made with somereservations. First, the results on marginalsupply and physical function were mostlyextrapolated from nonathletic subjects. More-over, there were hardly any data on athletes fromdeveloping countries. Finally, many studies hada very low statistical power, that is, there weretoo few subjects to detect anything else than sub-stantial effects.
References
Alhadeff, L., Gualtieri, T. & Lipton, M. (1984) Toxiceffects of water-soluble vitamins. Nutrition Reviews42, 33–40.
Allgood, V.E. & Cidlowski, J.A. (1991) Novel role forvitamin B6 in steroid hormone action: a link betweennutrition and the endocrine system. Journal of Nutri-tional Biochemistry 2, 523–534.
Bamji, M.S., Arya, S., Sarma, K.V.R. & Radhaiah, G.(1982) Impact of long term, low dose B-complexvitamin supplements on vitamin status and psy-chomotor performance of rural school boys. Nutri-tion Research 2, 147–153.
Bässler, K.-H. (1989) Use and abuse of high dosages ofvitamin B6. In Elevated Dosages of Vitamins (ed. P.Walter, H. Stähelin & G. Brubacher), pp. 120–126.Hans Huber Publishers, Stuttgart.
Bates, C.J. (1995) Vitamin A. Lancet 345, 31–35.Bayomi, R.A. & Rosalki, S.B. (1976) Evaluation of
methods of coenzyme activation of erythrocyteenzymes for detection of deficiency of vitamins B-1,B-2, and B-6. Clinical Chemistry 22, 327–335.
Belko, A.Z., Obarzanec, E., Roach, R. et al. (1984) Effectsof aerobic exercise and weight loss on riboflavinrequirements of moderately obese marginally deficient young women. American Journal of ClinicalNutrition 40, 553–561.
Belko, A.Z., Meredith, M.P., Kalkwarf, H.J. et al. (1985)Effects of exercise on riboflavin requirements: biological validation in weight reducing women.American Journal of Clinical Nutrition 41, 270–277.
Bonke, D. & Nickel, B. (1989) Improvement of finemotoric movement control by elevated dosages ofvitamin B1, B6, and B12 in target shooting. In ElevatedDosages of Vitamins (ed. P. Walter, H. Stähelin & G.Brubacher), pp. 198–204. Hans Huber Publishers,Stuttgart.
vitamins: metabolic functions 277

Brubacher, G.B. (1989) Scientific basis for the estimationof the daily requirements for vitamins. In ElevatedDosages of Vitamins (ed. P. Walter, H. Stähelin & G.Brubacher), pp. 3–11. Hans Huber Publishers,Stuttgart.
Buzina, R., Grgic, Z., Jusic, M., Sapunar, J., Milanovic,N. & Brubacher, G. (1982) Nutritional status andphysical working capacity. Human Nutrition: ClinicalNutrition 36C, 429–438.
Coburn, S.P., Lewis, D.L.N., Fink, W.J., Mahuren, J.D.,Schaltenbrand, W.E. & Costill, D.L. (1988) Humanvitamin B-6 pools estimated through muscle biop-sies. American Journal of Clinical Nutrition 48, 291–294.
Coburn, S.P., Ziegler, P.Z., Costill, D.L. et al. (1991)Reponse of vitamin B-6 content of muscle to changesin vitamin B-6 intake in men. American Journal of Clinical Nutrition 53, 1436–1442.
Cooperman, J.M. & Lopez, R. (1984) Riboflavin. InHandbook of Vitamins. Nutritional, Biochemical, andClinical Aspects (ed. L.J. Machlin), pp. 299–327.Marcel Dekker, New York.
Davies, M. (1989) High-dose vitamin D therapy: indica-tions, benefits and hazards. In Elevated Dosages of Vit-amins (ed. P. Walter, H. Stähelin & G. Brubacher), pp.81–86. Hans Huber Publishers, Stuttgart.
Driskell, J.A. (1984) Vitamin B6. In Handbook of Vitamins:Nutritional, Biochemical, and Clinical Aspects (ed. L.J.Machlin), pp. 379–401. Marcel Dekker, New York.
Dunton, N., Virk, R., Young, J. & Leklem, J. (1993) Theinfluence of vitamin B6 supplementation and exer-cise on vitamin B6 metabolism and growth hormone.FASEB Journal 7, A727 (abstract).
Fairbanks, V.F. & Klee, G.G. (1986) Biochemical aspectsof hematology. In Textbook of Clinical Chemistry (ed.N.W. Tietz), pp. 1495–1588. W.B. Saunders, Philadel-phia.
Fairweather-Tait, S.J., Powers, H.J., Minski, M.J.,Whitehead, J. & Downes, R. (1992) Riboflavin defi-ciency and iron absorption in adult Gambian men.Annals of Nutrition and Metabolism 36, 34–40.
Finley, E.B. & Cerklewski, F.L. (1983) Influence of ascor-bic acid supplementation on copper status in youngadult men. American Journal of Clinical Nutrition 37,553–556.
Fogelholm, M. (1995) Indicators of vitamin and mineralstatus in athletes’ blood: a review. InternationalJournal of Sport Nutrition 5, 267–286.
Fogelholm, M., Koskinen, R., Laakso, J., Rankinen, T. &Ruokonen, I. (1993a) Gradual and rapid weight loss:effects on nutrition and performance in male ath-letes. Medicine and Science in Sports and Exercise 25,371–377.
Fogelholm, M., Ruokonen, I., Laakso, J., Vuorimaa, T. &Himberg, J.-J. (1993b) Lack of association betweenindices of vitamin B1, B2 and B6 status and exercise-
278 nutrition and exercise
induced blood lactate in young adults. InternationalJournal of Sport Nutrition 3, 165–176.
Fraser, D.R. (1995) Vitamin D. Lancet 345, 104–107.Gershoff, S.N. (1993) Vitamin C (Ascorbic acid): new
roles, new requirements? Nutrition Reviews 51, 313–326.
Gerster, H. (1989) The role of vitamin C in athletic per-formance. Journal of the American College of Nutrition8, 636–643.
Greenberg, S.M. & Frishman, W.H. (1988) CoenzymeQ10: a new drug for myocardial ischemia? MedicalClinics of North America 72, 243–258.
Guilland, J.-C., Penaranda, T., Gallet, C., Boggio, V.,Fuchs, F. & Klepping, J. (1989) Vitamin status ofyoung athletes including the effects of supplementa-tion. Medicine and Science in Sports and Exercise 21,441–449.
Halsted, C.H. (1993) Water-soluble vitamins. In HumanNutrition and Dietetics (ed. J.S. Garrow & W.P.T.James), pp. 239–263. Churchill Livingstone, Edin-burgh.
Haralambie, G. (1976) Vitamin B2 status in athletes andthe influence of riboflavin administration on neuro-muscular irritability. Nutrition and Metabolism 20,1–8.
Hemilä, H. (1992) Vitamin C and the common cold.British Journal of Nutrition 67, 3–16.
Herbert, V. (1987) Recommended dietary intakes (RDI)of folate in humans. American Journal of Clinical Nutri-tion 45, 661–670.
Jenkins, R.R. (1993) Exercise, oxidative stress, andantioxidants: a review. International Journal of SportNutrition 3, 356–375.
Johnson Gubler, C. (1984) Thiamin. In Handbook of Vita-mins: Nutritional, Biochemical, and Clinical Aspects (ed.L.J. Machlin), pp. 245–295. Marcel Dekker, New York.
Kanter, M.M. & Williams, M.H. (1995) Antioxidants,carnitine, and choline as putative ergogenic aids.International Journal of Sport Nutrition 5, S120–S131.
Kotze, H.F., van der Walt, W.H., Rogers, G.G. &Strydom, N.B. (1977) Effects of plasma ascorbic acidlevels on heat acclimatization in man. Journal ofApplied Physiology 42, 711–716.
Laaksonen, R., Fogelholm, M., Himberg, J.-J., Laakso, J.& Salorinne, Y. (1995) Ubiquinone supplementationand exercise capacity in trained young and oldermen. European Journal of Applied Physiology 72,95–100.
McCormick, D.B. (1986) Vitamins. In Textbook of ClinicalChemistry (ed. N.W. Tietz), pp. 927–964. W.B. Saunders, Philadelphia.
Machlin, L.J. (1989) Use and safety of elevated dosagesof vitamin E in adults. In Elevated Dosages of Vitamins(ed. P. Walter, H. Stähelin & G. Brubacher), pp. 56–68.Hans Huber Publishers, Stuttgart.
McLaren, D.S., Loveridge, N., Duthie, G. &

Bolton-Smith, C. (1993) Fat-soluble vitamins. InHuman Nutrition and Dietetics (ed. J.S. Garrow &W.P.T. James), pp. 298–238. Churchill Livingstone,Edinburgh.
Manore, M. (1994) Vitamin B6 and exercise. Interna-tional Journal of Sport Nutrition 4, 89–103.
Manore, M. & Leklem, J.E. (1988) Effects of carbohy-drate and vitamin B6 on fuel substrates during exer-cise in women. Medicine and Science in Sports andExercise 20, 233–241.
Marks, J. (1989) The safety of the vitamins: an overview.In Elevated Dosages of Vitamins (ed. P. Walter, H. Stähelin & G. Brubacher), pp. 12–20. Hans HuberPublishers, Stuttgart.
Matter, M., Stittfall, T., Graves, J. et al. (1987) The effectof iron and folate therapy on maximal exercise per-formance in female marathon runners with iron andfolate deficiency. Clinical Science 72, 415–422.
Meydani, M. (1995) Vitamin E. Lancet 345, 170–175.Moretti, C., Fabbri, A., Gnessi, L., Bonifacio, V., Fraiolo,
F. & Isidori, A. (1982) Pyridoxine (B6) suppresses the rise in prolactin and increases the rise in growthhormone induced by exercise. New England Journal ofMedicine 307, 444–445.
Padh, H. (1991) Vitamin C: newer insights into its bio-chemical functions. Nutrition Reviews 49, 65–80.
Pernow, B. & Saltin, B. (1971) Availability of substratesand capacity for prolonged heavy exercise in man.Journal of Applied Physiology 31, 416–422.
Peters, E.M., Goetzsche, J.M., Grobbelaar, B. & Noakes,T.D. (1993) Vitamin C supplementation reduces theincidence of postrace symptoms of upper-respira-tory-tract infection in ultramarathon runners. Ameri-can Journal of Clinical Nutrition 57, 170–174.
Piertzik, K. (1986) Vitamin deficiency: aetiology andterminology. In B Vitamins in Medicine: Proceedings ofa Symposium held in Helsinki, October 1985 (ed. J.-J.Himberg, W. Tackman, D. Bonke & H. Karppanen),pp. 31–43. Friedr. Wieweg & Sohn, Wiesbaden.
Powers, H.J., Bates, C.J., Lamb, W.H., Singh, J., Gelman,W. & Webb, E. (1985) Effects of multivitamin and ironsupplement on running performance in Gambianchildren. Human Nutrition: Clinical Nutrition 39C,427–437.
Powers, H.J., Bates, C.J., Eccles, M., Brown, H. &George, E. (1987) Bicycling performance in Gambianchildren: effects of supplements of riboflavin andascorbic acid. Human Nutrition: Clinical Nutrition41C, 59–69.
Reynolds, R.D. (1994) Vitamin supplements: currentcontroversies. Journal of the American College of Nutri-tion 13, 118–126.
Reynolds, R.D., Styer, D.J. & Schlichting, C.L. (1988)Decreased vitamin B-6 status of submariners duringprolonged patrol. American Journal of Clinical Nutri-tion 47, 463–469.
Rivers, J.M. (1989) Safety of high-level vitamin C inges-tion. In Elevated Dosages of Vitamins (ed. P. Walter, H.Stähelin & G. Brubacher), pp. 95–102. Hans HuberPublishers, Stuttgart.
Rokitzki, L., Logemann, E., Huber, G., Keck, E. & Keul,J. (1994) a-Tocopherol supplementation in racingcyclists during extreme endurance training. Interna-tional Journal of Sports Nutrition 4, 253–264.
Sauberlich, H.E. (1967) Biochemical alterations in thiamine deficiency: their interpretation. AmericanJournal of Clinical Nutrition 20, 528–542.
Schwartz, J. & Weiss, S.T. (1994) Relationship betweendietary vitamin C intake and pulmonary function inthe First National Health and Nutrition ExaminationSurvey (NHANES I). American Journal of ClinicalNutrition 59, 110–114.
Simon-Schnass, I. & Pabst, H. (1988) Influence ofvitamin E on physical performance. InternationalJournal of Vitamin and Nutrition Research 58, 49–54.
Singh, A., Moses, F.M. & Deuster, P.A. (1992a) Chronicmultivitamin-mineral supplementation does notenhance physical performance. Medicine and Sciencein Sports and Exercise 24, 726–732.
Singh, A., Moses, F.M. & Deuster, P.A. (1992b) Vitaminand mineral status in physically active men: effects ofhigh-potency supplement. American Journal of Clini-cal Nutrition 55, 1–7.
Soares, M.J., Satyanaryana, K., Bamji, M.S., Jacob, C.M.,Venkata Ramana, Y. & Sudhakar Rao, S. (1993) Theeffects of exercise on riboflavin status of adult men.British Journal of Nutrition 69, 541–551.
Sobal, J. & Marquart, L.F. (1994) Vitamin/mineral sup-plement use among athletes: a review of the litera-ture. International Journal of Sport Nutrition 4, 320–334.
Solomons, N.W. & Allen, L.H. (1983) The functionalassessment of nutritional status: principles, practiseand potential. Nutrition Reviews 41, 33–50.
Suboticanec, K., Stavljenic, A., Bilic-Pesic, L. et al. (1989)Nutritional status, grip strength, and immune func-tion in institutionalized elderly. International Journalof Vitamin and Nutrition Research 59, 20–28.
Suboticanec, K., Stavljenic, A., Schalch, W. & Buzina, R.(1990) Effects of pyridoxine and riboflavin supple-mentation on physical fitness in young adolescents.International Journal of Vitamin and Nutrition Research60, 81–88.
Suboticanec-Buzina, K., Buzina, R., Brubacher, G.,Sapunar, J. & Christeller, S. (1984) Vitamin C statusand physical working capasity in adolescents. Inter-national Journal of Vitamin and Nutrition Research 54,55–60.
Telford, R.D., Catchpole, E.A., Deakin, V., Hahn, A.G. &Plank, A.W. (1992a) The effects of 7–8 months ofvitamin/mineral supplementation on the vitaminand mineral status of athletes. International Journal ofSport Nutrition 2, 123–134.
vitamins: metabolic functions 279

Telford, R.D., Catchpole, E.A., Deakin, V., Hahn, A.G. &Plank, A.W. (1992b) The effects of 7–8 months ofvitamin/mineral supplementation on athletic per-formance. International Journal of Sport Nutrition 2,135–153.
Tiidus, P.M. & Houston, M.E. (1995) Vitamin E statusand response to exercise training. Sports Medicine 20,12–23.
Trebler Winters, L.R., Yoon, J.-S., Kalkwarf, H.J. et al.(1992) Riboflavin requirements and exercise adapta-tion in older women. American Journal of ClinicalNutrition 56, 526–532.
Underwood, B.A. (1989) Teratogenicity of vitamin A. InElevated Dosages of Vitamins (ed. P. Walter, H. Stähelin& G. Brubacher), pp. 42–55. Hans Huber Publishers,Stuttgart.
van Dam, B. (1978) Vitamins and sport. British Journal ofSports Medicine 12, 74–79.
van der Beek, E.J., van Dokkum, W., Schriver, J.,Wesstra, A., Kistemaker, C. & Hermus, R.J.J. (1990)Controlled vitamin C restriction and physical perfor-mance in volunteers. Journal of the American College ofNutrition 9, 332–339.
van der Beek, E.J., van Dokkum, W., Schrijver, J. et al.
280 nutrition and exercise
(1988) Thiamin, riboflavin, and vitamins B-6 and C:impact of combined restricted intake on functionalperformance in man. American Journal of ClinicalNutrition 48, 1451–1462.
Wagenmakers, A.J.M. (1991) L-Carnitine supplementa-tion and performance in man. In Advances in Nutri-tion and Top Sport. Medicine and Sport Science, Vol. 32(ed. F. Brouns), pp. 110–127. Karger, Basel.
Weight, L.M., Myburgh, K.H. & Noakes, T.D. (1988a)Vitamin and mineral supplementation: effect on therunning performance of trained athletes. AmericanJournal of Clinical Nutrition 47, 192–195.
Weight, L.M., Noakes, T.D., Labadarios, D., Graves, J.,Jacobs, P. & Berman, P.A. (1988b) Vitamin andmineral status of trained athletes including theeffects of supplementation. American Journal of Clini-cal Nutrition 47, 186–191.
Williams, M.H. (1986) Nutritional Aspects of HumanPhysical and Athletic Performance. Charles C. Thomas,Springfield, IL.
Wood, B., Gijsbers, A., Goode, A., Davis, S., Mulhol-land, J. & Breen, K. (1980) A study of partial thiaminrestriction in human volunteers. American Journal ofClinical Nutrition 33, 848–861.

Introduction
Vitamins are a group of organic compoundsrequired in tiny amounts in the diet of humansfor proper biological functioning and mainte-nance of health. Vitamins do not supply energy,but act mainly as regulators of the numerous anddiverse physiological processes in the humanbody including vision, skin integrity, bone ossification, DNA formation, metabolism of carbohydrate, fat, and proteins, mitochondrialmetabolism, utilization of oxygen in the cells, redblood cell (RBC) formation and other functionswhich are closely related to energy productionand resultant physical performance (see Chapter20). The human body is not able to synthesize themajority of the vitamins or the amount synthe-sized in the body cannot meet the needs. It isclear that a certain amount of each of the vita-mins is essential in the diet and that lack of a specific vitamin can cause a specific deficiencydisease (Williams 1985; Daniel 1991; Chen & Wu1996). Due to the many and varied roles of vita-mins, they are probably the most widespreadnutrients taken as supplements by both thegeneral and athletic population. Furthermore,vitamins meet with great interest in the world ofsports because of their supposed role in enhanc-ing physical performance (Williams 1989; vander Beek 1991, 1994; Singh et al. 1992b; Weight etal. 1998a, 1998b).
Exercise enhances energy metabolism andincreases the total energy expenditure whichgives rise to a number of concerns:
• Does exercise training result in increasedneeds or deficiencies of vitamins?• Is the vitamin status of athletes normal?• Is it necessary for athletes to take vitamin supplements?The answers to these questions have variedthrough the years and the balance of opinioncontinues to change as new evidence appears(Clarkson 1991, 1995; van der Beek 1991; Fogelholm 1994; Armstrong & Maresh 1996). Thefocal points of the concerns for vitamin nutritionof athletes are the assumption that athletes need an increased vitamin intake, the optimumrecommended dietary allowance (RDA) for ath-letes under different conditions, and the trueeffects of vitamin supplementation on physicalperformance.
It is accepted that the prevalence of vitamindeficiency diseases is low in the general popula-tion in industrialized societies. Theoretically, theathlete may have an increased requirement fordietary intake of vitamins induced by decreasedabsorption in the gastrointestinal tract, increasedexcretion in sweat, urine and faeces, increasedturnover, as well as the adaptation for the initialstage of vigorous training and/or acute physicalexercise which may enhance energy metabolism(van der Beek 1991, 1994). It is generally agreedthat moderate physical activity per se does notadversely affect vitamin status when recom-mended amounts of vitamins are consumed inthe diet (Clarkson 1991). Marginal vitamin defi-ciencies have been observed in athletes, butmany of the published reports of vitamin defi-
Chapter 21
Vitamins: Effects of Exercise on Requirements
JIDI CHEN
281

ciencies in athletes are invalid for methodologi-cal reasons: a shortfall in recommended intakerelative to published recommended intakes isnot indicative of a deficiency (van der Beek 1991,1994; Chen & Wu 1996). Athletes with a balanceddiet should receive the RDA provided energyintake is sufficient to balance expenditure(Shoorland 1988; Rokitzki et al. 1994a), althoughit must be recognized that not all athletes have ahigh energy intake, and not all eat a varied diet.Unfortunately, there are limited and conflictingdata with regard to the micronutrient status ofphysically active individuals (van der Beek 1985;Belko 1987; Fogelholm 1992). Methods for theassessment of vitamin status are often inade-quate, as outlined in the preceding chapter.Dietary surveys and food records have been usedto assess the vitamin status of athletes, but tablesof vitamin content are inherently unreliable, andthe vitamin loss attributed to vitamin availabil-ity, processing, storage, and preparation of thefoods is often not taken into account. Blood orother tissue levels of vitamins are affected byseveral factors including acute exercise and theymay not be entirely accurate as measures of thenutritional status of athletes; caution shouldtherefore be taken in interpreting the results (see Chapter 20). Furthermore, the RDAs aredesigned primarily to avoid nutritional deficien-cies and do not focus on exercise or stressfulenvironments. The RDA is determined byvarious professional bodies to designate the levelof intake of a micronutrient that will meet theknown nutritional needs of practically allhealthy persons (Armstrong & Maresh 1996),and is based on an average-sized person with anaverage amount of physical activity and anaverage physiological requirement. This is thenadjusted by a variable factor to compensate forincomplete utilization by the body, the variationin requirements among individuals and thebioavailability of the nutrients from differentfood sources (US National Research Council1989). The definition of RDA is not identical forall nations and organizations (van der Beek1991).
282 nutrition and exercise
It is not clear that the RDA established for the general population may apply to athletes,labourers, or soldiers in heavy training (Shoorland 1988). There have been few reportson the setting of separate RDAs for athletes(Yakovlev 1957; Sports Science Committee ofJapanese Association 1977; Grandjean 1989;Chen et al. 1992). The majority of dietary surveysconducted on athletic population clearly indi-cated that the vitamin intakes of all but a smallminority of athletes exceed the RDA levels if awell-balanced diet is typically consumed (Sobal& Marquart 1994). Although vitamin intakes ofless than the RDA do not indicate vitamin defi-ciencies per se, the further the intake falls belowthe RDA, the greater is the risk of developing adeficiency state.
Athletes have been targeted as a significantgroup for vitamin supplements, and dietarysurveys and questionnaires of athletes confirmthe widespread use of the vitamin supplements.Questionnaires completed by 2977 college andhigh school athletes have found that 44% of thosesurveyed took one or more vitamin supplements(Parr et al. 1984). In other, smaller surveys, 31% of80 Australian athletes and 29% of 347 non-eliterunners (Nieman et al. 1989) and 42–43% of foot-ball players, gymnasts and runners (Sobal &Marquart 1994) took vitamin supplements. Somestudies have documented even higher percent-ages of athletes taking supplements, including71% of female runners (Clark et al. 1988) and100% of female bodybuilders (Lamar-Hildebrand et al. 1989). Supplementation is pur-ported to enhance performance, delay fatigue,and speed up recovery by some ill-definedergogenic mechanism. Despite the lack of evi-dence that large intakes of vitamin have positiveeffects on performance, many athletes are stilltaking vitamin supplements, because of a lack ofnutritional knowledge and lack of familiaritywith the dietary guidelines, and quite a numbertake very large doses. The concern is that notonly the amounts of supplementation can befinancially costly because of the large doses of upto 5000 times the recommended levels, but there

is also the possibility that these excessiveamounts may be harmful to health (see Chapter20).
In the following sections, for each of thevitamin, there will be a brief description of exercise-induced changes in vitamin status andrequirements, the effects of vitamin supple-ments, harmful effects of overdoses of vitaminintakes and the main food resources of vitamins(see Chapter 20). Vitamins are commonly classi-fied into two groups, the fat soluble and thewater soluble. Vitamins A, D, E and K are fatsoluble. Vitamin C and members of the vitamin Bcomplex are water soluble. Fat-soluble vitaminscan be stored in appreciable amounts in the body,and their function is largely independent ofenergy metabolism. Water-soluble vitamins arenot stored in large quantities in the body andmust be ingested on a regular basis. Clinicalsymptoms can be developed in individuals witha diet deficient in B vitamins. Vitamin B12 can bestored in the liver for a year or longer.
Thiamin (vitamin B1)
Vitamin B1 as thiaminpyrophosphate (TPP,cocarboxylase), plays an important role in theoxidative decarboxylation of pyruvate to acetyl-coenzyme A (CoA) for entry into the Krebs cycleand subsequent oxidation to provide for adeno-sine triphosphate resynthesis. Thus, there is apossibility that the increased demand for acetyl-CoA during exercise would not be met in athleteswith a thiamin deficiency. If this occurred, morepyruvate would be accumulated and convertedto lactate, with the possibility that fatigue woulddevelop more rapidly and aerobic performancecould be impaired. Thiamin deficiency couldalso result in a reduced availability of succinate, a coingredient of haeme, leading to inadequatehaemoglobin formation, another factor thatcould influence aerobic exercise capacity. How-ever, little evidence has shown that ingestion of a vitamin B1 supplement by athletes con-suming a well-balanced diet has any effect onperformance.
It has been noted that there is a good linearrelationship between thiamin intake and energyintake (van der Beek 1994). It is generallyaccepted that the vitamin B1 requirement isdependent on the total energy expenditure and isinfluenced by carbohydrate intake becausevitamin B1 is essential for the intermediarymetabolism of carbohydrate. The vitamin B1 nec-essary to meet the body’s requirement intakemay vary according to energy intake (Clarkson1991), and 0.5 mg thiamin · 4.2MJ–1 (1000 kcal–1) isrecommended for adults in most countries (USNational Research Council 1989). Any increasedrequirement induced by exercise should be metby increased energy intake and well-balanceddiet. However, reports from the Soviet Union in the early days indicated that the output ofurinary vitamin B1 of athletes decreased as thetraining load increased; it was reported thatblood pyruvate levels increased by 30–40% ascompared with sedentary individuals whenvitamin B1 intake was 2–3mg· day–1 (Yakovlev1957). In order to keep pyruvate at normal levels,it was recommended that the vitamin B1 intakeshould be 3–5 mg·day–1 in the general popula-tion and 5–10 mg·day–1 for athletes undergoingendurance training (Yakovlev 1957). Vytchikova(1958) indicated that the usual content of thiamin1.5–2.0mg ·day–1 in food rations of athletes isconsidered insufficient and that medical obser-vation recommend approximately 10–20mgdaily supplementation.
Athletes do not have a lower intake of vitaminB1 than the RDA and only very few have anysigns of a biochemical deficiency (Fogelholm 1992), but athletes who are on energy-restricteddiets for weight control are likely to have a lessthan adequate intake, and athletes who take a high percentage of their energy from low nutrient-density food such as candy, soda, etc.may be at risk (Clarkson 1991). Nutrition surveysin Chinese elite athletes indicated that about halfof the athletes investigated had vitamin B1intakes that were lower than the RDA. Theaverage dietary intakes of vitamin B1 of the athletes undergoing vigorous training was 0.37–
vitamins: effects of exercise on requirements 283
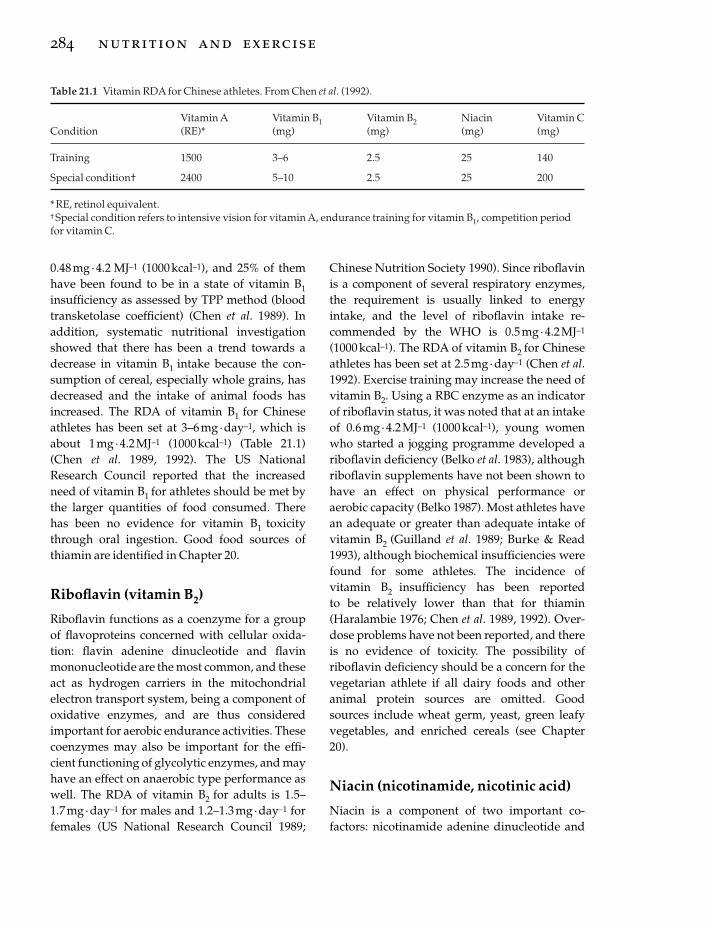
0.48mg ·4.2 MJ–1 (1000 kcal–1), and 25% of themhave been found to be in a state of vitamin B1insufficiency as assessed by TPP method (bloodtransketolase coefficient) (Chen et al. 1989). Inaddition, systematic nutritional investigationshowed that there has been a trend towards adecrease in vitamin B1 intake because the con-sumption of cereal, especially whole grains, hasdecreased and the intake of animal foods hasincreased. The RDA of vitamin B1 for Chineseathletes has been set at 3–6 mg· day–1, which isabout 1mg· 4.2MJ–1 (1000 kcal–1) (Table 21.1)(Chen et al. 1989, 1992). The US NationalResearch Council reported that the increasedneed of vitamin B1 for athletes should be met bythe larger quantities of food consumed. Therehas been no evidence for vitamin B1 toxicitythrough oral ingestion. Good food sources ofthiamin are identified in Chapter 20.
Riboflavin (vitamin B2)
Riboflavin functions as a coenzyme for a groupof flavoproteins concerned with cellular oxida-tion: flavin adenine dinucleotide and flavinmononucleotide are the most common, and theseact as hydrogen carriers in the mitochondrialelectron transport system, being a component ofoxidative enzymes, and are thus consideredimportant for aerobic endurance activities. Thesecoenzymes may also be important for the effi-cient functioning of glycolytic enzymes, and mayhave an effect on anaerobic type performance aswell. The RDA of vitamin B2 for adults is 1.5–1.7mg ·day–1 for males and 1.2–1.3 mg·day–1 forfemales (US National Research Council 1989;
284 nutrition and exercise
Chinese Nutrition Society 1990). Since riboflavinis a component of several respiratory enzymes,the requirement is usually linked to energyintake, and the level of riboflavin intake re-commended by the WHO is 0.5mg· 4.2MJ–1
(1000 kcal–1). The RDA of vitamin B2 for Chineseathletes has been set at 2.5 mg· day–1 (Chen et al.1992). Exercise training may increase the need ofvitamin B2. Using a RBC enzyme as an indicatorof riboflavin status, it was noted that at an intakeof 0.6 mg·4.2 MJ–1 (1000 kcal–1), young womenwho started a jogging programme developed ariboflavin deficiency (Belko et al. 1983), althoughriboflavin supplements have not been shown tohave an effect on physical performance oraerobic capacity (Belko 1987). Most athletes havean adequate or greater than adequate intake ofvitamin B2 (Guilland et al. 1989; Burke & Read1993), although biochemical insufficiencies werefound for some athletes. The incidence ofvitamin B2 insufficiency has been reported to be relatively lower than that for thiamin (Haralambie 1976; Chen et al. 1989, 1992). Over-dose problems have not been reported, and thereis no evidence of toxicity. The possibility ofriboflavin deficiency should be a concern for thevegetarian athlete if all dairy foods and otheranimal protein sources are omitted. Goodsources include wheat germ, yeast, green leafyvegetables, and enriched cereals (see Chapter20).
Niacin (nicotinamide, nicotinic acid)
Niacin is a component of two important co-factors: nicotinamide adenine dinucleotide and
Table 21.1 Vitamin RDA for Chinese athletes. From Chen et al. (1992).
Vitamin A Vitamin B1 Vitamin B2 Niacin Vitamin CCondition (RE)* (mg) (mg) (mg) (mg)
Training 1500 3–6 2.5 25 140
Special condition† 2400 5–10 2.5 25 200
*RE, retinol equivalent.† Special condition refers to intensive vision for vitamin A, endurance training for vitamin B1, competition periodfor vitamin C.
nicotinamide adenine dinucleotide phosphatewhich serve as hydrogen acceptors and donorsin glycolysis, fatty acid oxidation, and in the elec-tron transport system. Niacin deficiency maypossibly impair glycolysis and/or the oxidationprocesses of the citric acid cycle, so both anaero-bic and aerobic type performances may beaffected adversely. On the contrary, niacin sup-plementation in high doses may suppress freefatty acid release through decreased lipolysiswhich would result in a decreased availability ofa major fuel source, forcing the muscle to relymore on its glycogen stores, and this may alsoadversely affect prolonged exercise performance(Williams 1985; Clarkson 1991).
The RDA for niacin is expressed as niacinequivalent because niacin may be synthesized in the body from tryptophan (1mg of niacin isequivalent to 60mg of dietary tryptophan). Therequirement for niacin also usually is linked toenergy intake which means that athletes whohave a large energy intake need a proportionallyhigher niacin intake. The RDA for niacin in thegeneral population has been set at 6.6mg ·4.2MJ–1 (1000 kcal–1) or about 14–19mg· day–1 foradults. The RDA for niacin for Chinese athleteshas been set at 10 times that for riboflavin: 25mg ·day–1. Since niacin is widely distributed in plantand animal food sources, most athletes show noevidence of niacin deficiency except those whohave a chronically reduced dietary intake forweight control. Niacin deficiency symptoms mayeasily be solved by a well-balanced diet withoutrecourse to specific supplementation. Goodsources of niacin include poultry, meats, grainproducts, peanuts, yeast, fish, etc. (see Chapter20).
Pyridoxine (vitamin B6)
Vitamin B6 exists in five forms: pyridoxine, pyridoxal, pyridoxamine, pyridoxal phosphate(coenzyme form), and pyridoxamine phosphate(coenzyme form). The pyridines function inprotein and amino acid metabolism, gluconeo-genesis, and in formation of haemoglobin, myo-globin, and cytochromes, and are also a
component of glycogen phosphorylase whichplays a key role in glycogenolysis. Because exercise stresses metabolic pathways that usevitamin B6, it has been suggested that therequirement for this vitamin is increased in athletes and active individuals (Manore 1994).Vitamin B6 is essential in coenzymes related tonitrogen metabolism, and the requirement forvitamin B6 is closely related to dietary proteinintake. Currently the RDA for vitamin B6 is2.0mg ·day–1 for men and 1.6 mg· day–1 forwomen. If the dietary protein is more than 100g ·day–1, then the intake of vitamin B6 should bemore than 2mg· day–1 (US National ResearchCouncil 1989; Manore 1994). Although therequirement for vitamin B6 appears to increasewhen a high protein diet is consumed, vitamin B6is found in meats and other animal foods, andsufficient may be provided if these foods are themajor source of protein in the diet. The incidenceof acute toxicity of vitamin B6 is low. Intakes of117 mg of vitamin B6 for more than 6 months canresult in neurological impairment (US NationalResearch Council 1989). Chronic ingestion of 2–6g pyridoxine ·day–1 has been shown to result insensory neuropathy (Clarkson 1991). Somestudies reported that athletes have low or mar-ginal dietary intakes of vitamin B6 (Hickson et al.1987; Weight et al. 1988b; Guilland et al. 1989),whereas others reported mean intakes at orabove the RDA (Faber et al. 1991; Singh et al.1992a, 1992b, 1993). Young female athletes andthose participating in sport training emphasizinglow body weights need to be monitored regu-larly. Deficiencies should be corrected by a well-balanced diet, and if necessary, small amount ofsupplements within the RDA (Rokitzki et al.1994a). There is no evidence suggesting that sup-plementation enhances athletic performance, sothe use of vitamin B6 as an ergogenic aid is con-traindicated. Good food sources include meat,poultry, fish, whole grain, peanuts, soybeans,seeds, yeast and eggs (see Chapter 20).
Cobalamin (vitamin B12)
Vitamin B12 is involved in a variety of metabolic
vitamins: effects of exercise on requirements 285
processes. It is an essential component in the for-mation and function of red blood cells. Becauseof this role, it is sometimes thought by athletesand their coaches that vitamin B12 supplementshould enhance the oxygen-carrying capacity ofthe blood and improve performance in thoseevents where oxidative metabolism is important.In practice, however, vitamin B12 supplementa-tion will only help in cases of pernicious anaemiaor macrocytic anaemia, and will not show bene-fits for the athlete with iron deficiency anaemiaor for athletes whose iron stores are replete. Inspite of this, vitamin B12 injection is a commonpractice in sport, and it has been noted that someathletes have been receiving 1000 mg about 1 hbefore competition (Ryan 1977). The RDA forvitamin B12 for the general adult population is 2mg · day–1, and the average diet contains about5–15mg · day–1, so deficiency is rare. As for thegeneral population, deficiency in athletes is rare,except for those who are complete vegetarians.This group may be susceptible to vitamin B12deficiency as the vitamin is found only in animalprotein including meat, poultry, fish, egg, milkand milk products, and some fermented soybeanproducts (see Chapter 20). Most vegetarians,however, are well aware of the need to ensure anadequate intake.
Pantothenic acid
Pantothenic acid is a part of CoA, thus mak-ing it important in metabolism involving the Krebs cycle. The RDA for pantothenic acid is 4–7mg ·day–1 (Williams 1985). Inadequate intakesof pantothenic acid are rare for the individualwho has a normal diet, because it is widely dis-tributed in foods including animal and plantfoods such as eggs, yeast, whole grains, etc. It isnot known if exercise increases the requirementfor pantothenic acid. Results of studies on theeffect of pantothenic acid supplementation onperformance are equivocal (Nice et al. 1984; Litoffet al. 1985; Clarkson 1991). Nice et al. reportedthat supplementation with 1 g pantothenic acid ·day–1 (10 000% RDA) for 2 weeks had no effect ona treadmill run to exhaustion, pulse rate, blood
286 nutrition and exercise
glucose levels, or several other blood measures in highly trained distance runners; it was con-cluded that pantothenic acid in pharmacologicaldosages has no significant effect on human exer-cise capacity (Nice et al. 1984).
Folic acid (folate)
Folic acid acts as an coenzyme functioning inDNA synthesis for red blood cell formation, andis also important for nucleotide and amino acidmetabolism. A deficiency state may causeanaemia, and at least in theory, a deficiency mayaffect aerobic endurance performance. The RDAhas been set at 400mg · day–1 for non-trained adultmales (US National Research Council 1989). TheRDA set by the FAO/WHO is 200mg ·day–1. Nostudy is known to have been performed on theeffects of folic acid supplements on physical per-formance. Since folate is present in largeamounts in vegetables, fruits, and animal foods,a balanced diet would appear to provide ade-quate amounts of this vitamin (see Chapter 20).
Vitamin B complex
Because of the close association of the vitamins inthe B complex, the effects of deprivation of orsupplementation with various combinations ofthe B vitamins have been studied. Results ofsome of the early studies showed that a defi-ciency of the B complex vitamins over a period oftime, a few weeks at the most, could create a defi-nite decrease in endurance capacity (Berryman et al. 1947). It is extremely unlikely that athleteson a well-balanced diet will encounter this levelof deficiency. However, the effects of vitamin Bcomplex supplements remain contradictory andfurther study is needed to determine the useful-ness of vitamin B complex supplemention forathletes (Read & McGuffin 1983; Clarkson 1991).
Ascorbic acid (vitamin C)
Vitamin C functions in the biosynthesis of colla-gen, catecholamines, serotonin and carnitine. It isalso a powerful antioxidant which may aid intra-

cellular oxidation-reduction reactions. Vitamin Calso helps non-haem iron absorption, transportand storage. The deemed benefits of the effects ofvitamin C supplements include stimulation ofimmune function and resistance to infection(Chen 1988) and a reduction in fatigue andmuscle soreness, enhancing performance capac-ity and protecting cells from free radical damage(Kanter 1994), and thus it is perhaps the mostwidely used and studied of the vitamins.
The US RDA for vitamin C is 60 mg· day–1 (USNational Research Council 1989), but recom-mended intakes vary widely between countries.In some countries, specific recommendationshave been made for athletes, and the RDA forvitamin C has been set at 140 mg·day–1 duringtraining and 200mg·day–1 during competitionperiods for Chinese athletes on the basis of main-taining vitamin C in a saturation status as shownby urinary output (Chen et al. 1962, 1963, 1992).Most athlete groups studied have been reportedto exceed the RDA for vitamin C, but a small per-centage of athletes, particularly young gymnasts,have been found to have a less than adequateintake of vitamin C (Loosli et al. 1986; Chen et al.1989). Megadoses of vitamin C can cause ironloading, may affect the availability of vitamin B12from food, and may also promote the formationof urinary stones, yet high intakes of vitamin Care relatively harmless (Clarkson 1991). A singlebout of exercise may increase blood levels ofascorbic acid but decrease the ascorbic acidcontent of other tissues (Chen et al. 1965; Gleesonet al. 1987). Increases in plasma ascorbic acidlevels correlate significantly with the increase inplasma cortisol, suggesting that exercise maycause ascorbic acid to be released from theadrenal gland or other organs into the circulationalong with the release of cortisol. The effect ofvitamin C supplementation on physical perfor-mance has been investigated intermittently overthe past 50 years, but the results of these studieshave been contradictory. The possible benefits ofvitamin C supplementation on exercise-inducedmuscle damage remain doubtful and needfurther study.
Vitamin C is present in fresh fruits and vegeta-
bles, primarily the citrus fruits such as oranges,grapefruit, lemons and limes. Other goodsources are broccoli, green peppers and greens.There is little doubt that a severe deficiency ofvitamin C would have an adverse effect on workperformance: the feelings of weakness and lassi-tude and the possibility of iron deficiencyanaemia would certainly not be beneficial(Hodges 1980). Exercise may increase moder-ately the body’s need for vitamin C, but to whatextent exercise training will change an athlete’srequirement for vitamin C is still not entirelyclear. However, the inclusion of additional fruitsand vegetables in the athletes’ diet is advised.
Vitamin A (retinol)
Vitamin A designates several compounds includ-ing retinol, retinaldehyde and retinoic acid.Vitamin A plays a major role in maintenance ofproper vision and epithelial tissues, and is alsoinvolved in the development of bones and teethas well as playing an important function in thebody’s immune response. b-carotene, the majorcarotenoid precursor of vitamin A, plays a role asan antioxidant. The need for vitamin A can bemet by intake of carotenoid precursors com-monly found in plants. The RDA for vitamin A isexpressed in retinol equivalents (RE); one RE equals 1mg retinol or 6mg b-carotene. TheRDA for vitamin A is 1000 RE (1000mg retinol or6000mg b-carotene) for adult males and 800 RE(800 mg retinol or 4800mg b-carotene) for adultfemales (US National Research Council 1989).Russian research suggested that extra vitamin Ais needed in athletes requiring good visual acuityand alertness and during periods of stress(Williams 1985). The RDA for vitamin A forChinese athletes was set at 1500 RE ·day–1 (Chenet al. 1992).
The vitamin A intake of elite athletes has gen-erally been found to be adequate, although it hasbeen reported that 10–25% of the athletes investi-gated were ingesting less vitamin A than theRDA (Clarkson 1991). Studies that have assessedthe vitamin A, C and E status of athletes havefound that most had adequate blood levels of
vitamins: effects of exercise on requirements 287

these vitamins (Weight et al. 1988b; Guilland et al.1989; Fogelholm et al. 1992). Serum vitamin Alevels of 5% of 182 athletes investigated had avalue of less than 30mg ·dl–1 (Chen et al. 1992).There has been no evidence of serious biochemi-cal deficiencies of vitamin A existing in athletes.It is unlikely that vitamin Asupplementation willenhance performance. Vitamin A supplementa-tion is not necessary for athletes on an adequatediet (Williams 1985; Clarkson 1991). Whether theantioxidant role of b-carotene can reduce exercisedamage due to free radical activity remains to bestudied.
Vitamin A is one of the fat-soluble vitaminsand hence may be stored in the body for consid-erable periods of time, unlike water-soluble vita-mins. Overdosage over a period of time maycause a condition known as hypervitaminosis,characterized by anorexia, hair loss, hypercal-caemia, and kidney and liver damage (Aronson1986). Sustained daily intakes exceeding 15 000mg ·day–1 of retinol can produce signs of toxicity(US National Research Council 1989). However,high doses of b-carotene are not generally con-sidered to be toxic (US National ResearchCouncil 1989; Clarkson 1995). Bodily stores areavailable for short-term deficiency periods, andthus, no significant decrements would berevealed during short periods of reduced dietaryintake of vitamin A. Good sources of vitamin A inthe diet include liver, fish liver oils, butter, wholemilk, cheese and egg yolk. Rich sources of thecarotenoid are dark-green leafy vegetables, theyellow or orange fruits and vegetables (seeChapter 20).
Vitamin D
Vitamin D represents any one of several sterolcompounds in the body; vitamin D2 (ergocalcif-erol) is the result of the irradiation of ergosterol.D3 (cholecalciferol) is the naturally occurringcompound in the skin, formed by exposure to thesunlight. The major function of vitamin D is itshormone-like action in the process of mineraliza-tion of bones and teeth and the regulation ofcalcium metabolism. It promotes absorption of
288 nutrition and exercise
calcium from the intestine and helps to preventcalcium deficiency. The RDA for vitamin D is 5mg · day–1 for adults (US National ResearchCouncil 1989), and no separate recommenda-tions appear to have been made for athletes.Overdoses of vitamin D are potentially toxic andresult in hypercalcaemia and hypercalciuria (USNational Research Council 1989). Levels of fivetimes the RDA are considered dangerous; intakesof 50mg ·day–1 (2000 IU ·day–1) for a prolongedtime may pose considerable risk. Hypervita-minosis D leads to loss of weight, vomiting,nausea, lethargy and loss of muscle tone; calciumreleased from the bones may deposit in the softtissues, in the walls of the blood vessels and inthe kidneys.
Vitamin D deficiencies are rare in athletes withadequate intake of dairy products and exposureto sunlight, but those who have inadequate milkconsumption and lack of sunshine may be atsome risk for inadequate vitamin D nutriture. Noknown controlled research has been conductedon the role of vitamin D in physical performance(Van der Beek 1991). The role of vitamin D in pro-viding calcium for newly forming muscle tissueis not clear and needs further investigation(Clarkson 1991). Vitamin D is present in fish liveroil and milk fortified with vitamin D (seeChapter 20).
Vitamin E
Vitamin E is a fat-soluble vitamin. Its activity isderived from a number of tocopherols, the mostactive one of which is a-tocopherol. Vitamin Efunctions as an antioxidant of polyunsaturatedfatty acids in cellular and subcellular mem-branes, and thus it serves as a free radical scav-enger to protect cell membranes from lipidperoxidation. The RDA for vitamin E is 8–10mgof a-tocopherol ·day–1. Vitamin E is relativelynon-toxic up to 800mg ·day–1 (US NationalResearch Council 1989). Dietary records showedthat between one third and one half of the ath-letes investigated consumed less than two thirdsof the RDA (Loosli et al. 1986; Guilland et al.1989). Guilland reported that the mean vitamin E

intake of athletes was 77% of the RDA. However,vitamin E deficiencies are rare in athletes with a well-balanced diet. Although megadoses ofvitamin E are relatively harmless, some individ-uals experience gastric disturbances and weak-ness when taking supplements ranging from 200to 1000 IU (Clarkson 1991). Acute exercise hasbeen shown to result in an increase of plasmalevels of tocopherol, and the author suggestedthat tocopherol was mobilized from adiposetissue into the blood to be distributed to exercis-ing muscles; however, this study did not correctfor haemoconcentration and the small increase inplasma tocopherol was back to baseline after 10min rest (Pincemail et al. 1988). This responseto exercise has not been reported in anotherstudy (Duthie et al. 1990). It is not clear if the dis-parate findings are due to different exerciseloads, different testing methods or to otherfactors.
Many studies have reported a significant effectof vitamin E supplementation on exercise perfor-mance, but the actual benefits are doubtful sincemany of these experiments were not well con-trolled. Those studies that have been well con-trolled have generally shown that vitamin Esupplementation has no effect on performance(Shephard et al. 1974; Watt et al. 1974; Lawrence et al. 1975). On the contrary, supplements ofvitamin E showed a beneficial effect onmaximum oxygen uptake and a partially protec-tive effect on cell membranes at high altitude; itwas reported that mountain climbers with avitamin E supplement working at an altitude of5000m exhaled lower levels of pentane, a markerof lipid peroxidation, and exhibited a higheranaerobic threshold than controls (Simon-Schnass & Pabst 1990). Another study alsoshowed that the impairment of blood flow parameters was attenuated by vitamin E supplementation in mountaineers at altitude (Simon-Schnass & Korniszewski 1990). The posi-tive effect may be due to the antioxidant proper-ties of vitamin E. At high altitudes, vitamin Emay counteract the effect of the increased lipidperoxidation of red blood cell membranescaused by the decreased availability of oxygen
(Williams 1989). Vitamin E may also play a role inreducing muscle damage and oxidative stress, asshown by a reduction in muscle-specific enzymelevels in serum after strenuous exercise (Rokitzkiet al. 1994b). However, results are equivocal as towhether muscle damage can be reduced byvitamin E supplementation (see Chapter 20).
In short, there has been much debate on thevitamin requirements of athletes, yet carefullycontrolled studies are limited.
Conclusion
The following is a summary of the main viewpoints.1 Vitamin deficiencies may result in decreasedexercise performance, and it has been demon-strated that vitamin supplements improve per-formance in persons with pre-existing vitamindeficiencies.2 Vitamin supplements are generally unneces-sary in athletes consuming well-balanced diets.3 Athletes participating in strenuous trainingmay need monitoring of vitamin status even ifconsuming the RDA levels of vitamins.4 Vitamin supplements should be suggested forathletes in special conditions including thosewho are on a weight loss diet, or have eating dis-orders, or low energy intakes. Supplementationis only warranted when there is reasonable evidence to suggest that a deficiency may bepresent.5 Excessive vitamin intake, especially of the fat-soluble vitamins, can be accumulated to a levelthat may be toxic. Prolonged excessive intake ofwater-soluble vitamins also may be harmful andcause nutritional imbalances. Attention to foodchoices, rather than specific supplementation, isthe preferred option.
References
Armstrong, L.E. & Maresh, C.M. (1996) Vitamin andmineral supplements as nutritional aids to exerciseperformance and health. Nutrition Reviews 54, S149–S158.
Aroson, V. (1986) Vitamins and minerals as ergogenicaids. Physician and Sports Medicine 14, 209–212.
vitamins: effects of exercise on requirements 289

Belko, A.Z. (1987) Vitamins and exercise: an update.Medicine and Science in Sports and Exercise 19,S191–S196.
Belko, A.Z., Obarzenek, E., Karwalf, H.J. et al. (1983)Effect of exercise on riboflavin requirements ofyoung women. American Journal of Clinical Nutrition37, 507–517.
Berryman, G., Henderson, C.R., Wheeler, N.C. et al.(1947) Effects in young men consuming restrictedquantities of B-complex vitamines and proteins, andchanges associated with supplementation. AmericanJournal of Physiology 148, 618–647.
Burke, L.M. & Read, R.S.D. (1993) Dietary supplementsin sport. Sports Medicine 15, 43–46.
Chen, J.D. (1988) Some sports nutrition researches inChina. In China’s Sports Medicine (ed. M.Y. Qu & C.L.Yu), pp. 94–113. Medicine and Sport Science, Vol. 28.Karger, Basel.
Chen, J.D. & Wu, L. (1996) Nutrition of vitamins andsports. In Practical Sports Medicine (ed. M.Y. Qu), pp.244–246. Beijing Science and Technology PublishingHouse, Beijing.
Chen, J.D., Yu, X.X. & Nie, F.E. (1962) The study ofvitamin C status and requirement of the gymnastsand middle-long distance runners. Journal of ChineseMedicine 7, 454–457.
Chen, J.D., Liao, G.Z. & Yu, C.Y. (1963) Primaryapproach of the vitamin C requirement of athletesduring competition period from the excretion ofurinary vitamin C. Journal of Chinese Medicine 49,256–260.
Chen, J.D., Liao, G.Z. & Yu, C.Y. (1965) The vitamin Cmetabolism of organism in sports. Journal of theBeijing Medical College 1, 1–72.
Chen, J.D., Wang, J.F., Li, K.J., Wang, S.W., Jiao, Y. &Hou, X.Y. (1989) Nutritional problems and measuresin elite and amateur athletes. American Journal ofClinical Nutrition 49 (Suppl.), 1084–1089.
Chen, J.D., Wang, J.F., Wang, S.W., Li, K.J. & Chen, Z.M.(1992) Recommended dietary allowances forChinese athletes. In Integration of Medical and SportsSciences (ed. Y. Sato, J. Poortmans, I. Hashimoto & Y.Oshida), pp. 336–341. Medicine and Sport Science,Vol. 37. Basel, Karger.
Chinese Nutrition Society (1990) Document of theChinese Nutrition Society: illustration of the recom-mended dietary allowances of the Chinese. ActaNutrimenta Sinica 12, 1–10.
Clark, N., Nelson, M. & Evans, W. (1988) Nutrition edu-cation for elite female runners. Physician and SportsMedicine 16, 124–136.
Clarkson, P.M. (1991) Vitamins and trace element. InErgogenics. Vol. 4. Enhancement of Performance in Exer-cise and Sport (ed. D.R. Lamb & M.H. Williams), pp.123–182. W.C. Brown, USA.
Clarkson, P.M. (1995) Micronutrients and exercise: anti-
290 nutrition and exercise
oxidants and minerals. Journal of Sports Sciences 13,S11–S24.
Daniel, L.J. (1991) Vitamins. In The Encyclopedia Ameri-cana (international edn). Vol. 30, pp. 183–191. Grolier,Danbury, CO.
Duthie, G.G., Robertson, J.D., Maughan, R.J. & Morrice,P.C. (1990) Blood antioxidant status and erythrocytelipid peroxidation following distance running.Archives of Biochemistry and Biophysics 282, 78–83.
Faber, M. & Spinnler Benade, A.-J. (1991) Mineral andvitamin intake in field athletes (discus-hammer,javelin-throwers and shot-putters). InternationalJournal of Sports Medicine 12, 324–327.
Fogelholm, M. (1992) Vitamin and mineral status inphysically active people. In Physical Activity andNutritional Status: a Theoretical Basis for Balance inVitamin and Mineral Status in Physically Active People(ed. M. Fogelholm), pp. 3–19. Publications of theSocial Insurance Institution, Turku, Finland.
Fogelholm, M. (1994) Vitamins, minerals and supple-mentation in soccer. Journal of Sports Sciences 12,S23–S27.
Fogelholm, M., Rehunen, S., Gref., C.-G. et al. (1992)Dietary intake and thiamin, iron, and zinc status in elite nordic skiers during different trainingperiods. International Journal of Sport Nutrition 2,351–365.
Gleeson, M., Robertson, J.D. & Maughan, R.J. (1987)Influence of exercise on ascorbic acid status in man.Clinical Science 73, 501–505.
Grandjean, A.C. (1989) Macronutrient intake of US ath-letes compared with the general population and rec-ommendation made for athletes. American Journal ofClinical Nutrition (Suppl.) 49, 1070–1076.
Guilland, J.-C., Penaranda, T., Gallet, C., Boggio, V.,Fuchs, F. & Klepping, J. (1989) Vitamin status ofyoung athletes including the effects of supplementa-tion. Medicine and Science in Sports and Exercise 21,441–449.
Haralambie, G. (1976) Vitamin B2 status in athletes andthe influence of riboflavin administration on neuro-muscular irritability. Nutrition and Metabolism 20,1–8.
Hickson, J.F., Duke, M.A., Risser, W.L., Johnson, C.W.,Palmer, R. & Stockton, J.E. (1987) Nutritional intakefrom food sources of high school football athletes.Journal of the American Dietetic Association 87,1656–1659.
Hodges, R.E. (1980) Ascorbic acid. In Modern Nutritionin Health and Disease (ed. R.S. Goodhart & M.E. Shils),pp. 259–273. Lea and Febiger, Philadelphia, PA.
Kanter, M.M. (1994) Free radicals, exercise, and antioxi-dant supplementation. International Journal of Sportand Nutrition 4, 205–220.
Lamar-Hilderbrand, N., Saldanha, L. & Endres, J.(1989) Dietary and exercise practices of college-aged

female bodybuilders. Journal of the American DieteticAssociation 89, 1308–1310.
Lawrence, J.D., Bower, R.C., Riehl, W.P. & Smith, J.L. (1975) Effects of Alpha-tocopherol acetate on the swimming endurance of trained swimmers.American Journal of Clinical Nutrition 28, 205–208.
Litoff, D., Scherzer, H. & Harrison, J. (1985) Effects ofpantothenic acid supplementation on human exer-cise (abstract). Medicine and Science in Sports and Exer-cise 17, 287.
Loosli, A.R., Benson, J., Gillien, D.M. & Bourdet, K.(1986) Nutrition habits and knowledge in competi-tive adolescent female gymnasts. Physician and SportsMedicine 14, 118–130.
Manore, M.M. (1994) Vitamin B6 and exercise. Interna-tional Journal of Sport and Nutrition 4, 89–103.
Nice, C., Reeves, A.G., Brinck-Johnsen, T. & Noll, W.(1984) The effects of pantothenic acid on human exer-cise capacity. Journal of Sports Medicine and PhysicalFitness 24, 26–29.
Nieman, D.C., Gates, J.V., Butler, L.M., Pollett, S.J., Dietrich, S.J. & Lutz, R.D. (1989) Supplementationpatterns in marathon runners. Journal of the AmericanDietetic Association 89, 1615–1619.
Parr, R.B., Porter, M.A. & Hodgson, S.C. (1984) Nutri-tion knowledge and practices of coaches, trainers,and athletes. Physician and Sports Medicine 12, 126–138.
Pincemail, J., Deby, C., Camus, G. et al. (1988) Toco-pherol mobilization during intensive exercise. Euro-pean Journal of Applied Physiology 57, 189–191.
Read, M.H. & McGuffin, S.L. (1983) The effect of B-complex supplementation on endurance perfor-mance. Journal of Sports Medicine and Physical Fitness23, 178–184.
Rokitzki, L., Sagredos, A.N., Reub, F., Büchner, M. &Keul, J. (1994a) Acute changes in vitamin B6 status in endurance athletes before and after a marathon.International Journal of Sport and Nutrition 4, 154–165.
Rokitzki, L., Logemann, E., Huber, G., Keck, E. & Keul,J. (1994b) Alpha-tocopherol supplementation inracing cyclists during extreme endurance training.International Journal of Sport and Nutrition 4, 253–264.
Ryan, A. (1977) Nutritional practices in athletes abroad.Physician and Sports Medicine 5, 33–41.
Shephard, R.J., Campbell, R., Pimm, P., Stuart, D. &Wright, G.R. (1974) Vitamin E, exercise, and therecovery from physical activity. European Journal ofApplied Physiology 33, 119–126.
Shoorland, F.B. (1988) Is our knowledge of humannutrition soundly based? World Review of Nutritionand Diet 57, 126–213.
Simon-Schnass, I. & Pabst, H. (1988) Influence ofvitamin E on physical performance. InternationalJournal of Vitamin and Nutrition Research 58, 49–54.
Simon-Schnass, I. & Korniszewski, L. (1990) The influ-
ence of vitamin E on rheological parameters in highaltitude mountaineers. International Journal of Vita-min and Nutrition Research 60, 26–34.
Singh, A., Moses, F.M. & Deuester, P.A. (1992a) Chronicmultivitamin-mineral supplementation does notenhance physical performance. Medicine and Sciencein Sports and Exercise 24, 726–732.
Singh, A., Moses, F.M. & Deuester, P.A. (1992b) Vitaminand mineral status in physically active men: effects ofhigh-potency supplement. American Journal of Clini-cal Nutrition 55, 1–7.
Singh, A., Evans, P., Gallagher, K.L. & Deuster, P.A.(1993) Dietary intakes and biochemical profiles ofnutritional status of ultramarathoners. Medicine andScience in Sports and Exercise 25, 328–334.
Sobal, J. & Marquart, L.F. (1994) Vitamin/mineral sup-plement use among athletes: a review of the litera-ture. International Journal of Sport and Nutrition 4,320–334.
US National Research Council Food and NutritionBoard (1989) Recommended Dietary Allowances, 10thedn. National Academy Press, Washington, DC.
Van der Beek, E.J. (1985) Vitamins and endurance train-ing. Food for running or faddish claims? Sports Medi-cine 2, 175–197.
Van der Beek, E.J. (1991) Vitamin supplementation andphysical exercise performance. Journal of SportsScience 9, 79–89.
Van der Beek, E.J. (1994) Vitamin supplementation andphysical exercise performance. In Foods, Nutritionand Sports Performance (ed. C. Williams & J.T. Delvin),pp. 95–107. E & FN Spon, London.
Vytchikova, M. (1958) Increasing the vitamin B1content in the rations of athletes. Chemistry Abstracts52, 147–187.
Watt, T., Romet, T.T., McFarlane, I., McGuey, D., Allen,C. & Goode, R.C. (1974) Vitamin E and oxygen con-sumption (abstract). Lancet 2, 354–355.
Weight, L.M., Myburgh, K.H. & Noakes, T.D. (1988a)Vitamin and mineral supplementation: effect on therunning performance of trained athletes. AmericanJournal of Clinical Nutrition 47, 186–191.
Weight, L.M., Noakes, T.D., Labadarios, D., Graves, J.,Jacobs, P. & Bermen, P.A. (1988b) Vitamin andmineral status of trained athletes including theeffects of supplementation. American Journal of Clini-cal Nutrition 47, 192–195.
Williams, M.H. (1985) The role of vitamins in physicalactivity. In Nutrition Aspects of Human Physical andAthletic Performance, 2nd edn (ed. M.H. Williams),pp. 147–185. Charles C. Thomas, Springfield, IL.
Williams, M.H. (1989) Vitamin supplementation andathletic performance, an overview. InternationalJournal of Vitamins and Nutrition Research 30, 161–191.
Yakovlev, N.N. (1957) Sports nutrition. Nutrition Prob-lems (in Russian) 16, 58–59.
vitamins: effects of exercise on requirements 291

Introduction
‘Diradical’ molecular oxygen has a strong affin-ity for four more electrons. Under normal restingconditions, approximately 95% of all oxygenconsumed by the mammalian cells is reduced viathe mitochondrial cytochrome oxidase to yieldtwo molecules of water and energy. The remain-ing 3–5% of oxygen consumed at rest can be utilized in an alternative univalent pathway forthe reduction of oxygen, and reactive oxygenspecies (ROS) are thus produced (Singal & Kirshenbaum 1990). Formation of superoxidesand hydrogen peroxide can be regulated byeither enzymatic or non-enzymatic mechanisms,whereas no enzymes are required for the forma-tion of hydroxyl radical. Hydroxyl radical ishighly reactive and may be formed eitherthrough a iron-catalysed Fenton reaction (Fe2+ +H2O2 Æ Fe3+ + OH– +HO•) or through theHaber–Weiss reaction (O2
•– +H2O2 +Fe2+ Æ O2 +OH– + HO• +Fe3+).
Partial reduction of oxygen, an event primarilyunderlying the generation of ROS, has beenshown to be catalysed by a number of enzymesof rat liver. Some of the enzymes responsible forthe generation of hydrogen peroxide or superox-ide anion radical are listed in Table 22.1. Boveriset al. (1972) have shown that mitochondria,microsomes, peroxisomes and cytosolic enzymesare effective H2O2 generators, contributing in therat liver, respectively, 15%, 45%, 35% and 5% tothe cytosolic H2O2 at a Po2 of 158 mmHg whenfully supplemented by their substrates. Bio-
transformation of xenobiotics (e.g. pollutantsand drugs), especially via cytochrome P450-dependent mechanisms, may also contribute to the generation of reactive oxygen species(Archakov & Bachmanova 1990; Roy & Hanninen 1993).
Oxidative stress is now known to be impli-cated in the pathogenesis of a wide variety ofhealth disorders, including coronary heart dis-eases, cerebrovascular diseases, emphysema,bronchitis, chronic obstructive lung disease,some forms of cancer, diabetes, skeletal musculardystrophy, infertility, cataractogenesis, dermati-tis, rheumatoid arthritis, AIDS-related dysfunc-tions, and Alzheimer’s and Parkinson’s diseases(Sen & Hanninen 1994; Davies & Ursini 1995). Inaddition, reactive oxygen species are thought tocritically contribute to ageing and age-relateddisorders (Levine & Stadtman 1996). A late-breaking aspect of ROS action that has drawn theattention of current biomedical research is theability of these reactive species to modulate anumber of intracellular signal transductionprocesses that are critically linked to widespreadpathologies such as cancer, human immuno-deficiency virus replication and atherosclerosis.ROS, at a concentration much below thatrequired to cause oxidative damage to biologicalstructures, can act on highly specific molecularloci inside the cell (Sen & Packer 1996).
Exercise-induced oxidative stress
In exercise physiology, a common approach to
Chapter 22
Exercise-induced Oxidative Stress and Antioxidant Nutrients
CHANDAN K. SEN, SASHWATI ROY AND LESTER PACKER
292

measure physical fitness is based on the ability ofan individual to utilize atmospheric oxygen in agiven interval of time per kilogram of bodyweight, i.e. the aerobic capacity. Therefore, ath-letes aim to boost their aerobic capacity to thehighest possible limit. Supply of more and moreoxygen to active tissues fuels oxidative metabo-lism that produces higher amounts, comparedwith anaerobic metabolism, of energy-rich phos-phates and avoids the formation of lactate duringthe energy supply process. Physical exercise maybe associated with a 10–20-fold increase in wholebody oxygen uptake (Åstrand & Rodahl 1986).Oxygen flux in the active peripheral skeletalmuscle fibres may increase by as much as100–200-fold during exercise (Keul et al. 1972).Does this markedly enhanced consumption ofoxygen by the tissue at exercise contribute tooxidative stress? This question was firstaddressed in 1978 when it was observed thatstrenuous physical exercise indeed inducedoxidative damage to lipids in various tissues(Dillard et al. 1978). One of the early studieswhich kindled a strong motivation for furtherresearch in the area of exercise and oxygen toxic-ity was reported by Davies et al. (1982). Using theelectron paramagnetic or spin resonance (EPR orESR) spectroscopy for the direct detection of freeradical species in tissues, it was shown thatexhaustive exercise results in a two- to threefold
increase in free radical concentrations of themuscle and liver of rats exercised on a treadmill.Since then, a considerable body of research hasaccumulated showing that strenuous physicalexercise may be associated with oxidative stress(Sen et al. 1994c).
Possible mechanisms
During exercise, several mechanisms may con-tribute to the generation of excess ROS. Some ofthe possibilities are listed below.
Electron transport chain
Boveris et al. (1972) showed that mitochondriacan generate H2O2. Exercise training increaseselectron flux capacity of skeletal muscle mito-chondria, and this effect is known to be a mecha-nism by which aerobic capacity of trainedmuscles is increased (Robinson et al. 1994). It islikely that the exercise-associated increased elec-tron flux in the mitochondria may result inenhanced ‘leak’ of partially reduced forms ofoxygen centred radicals.
Ischaemia reperfusion
During exercise, blood is shunted away fromseveral organs and tissues (e.g. kidneys, splanch-
oxidative stress and antioxidant nutrients 293
Table 22.1 Rat liver enzymes that may contribute to the generation of reactive oxygen species. From Sies (1974).
Enzyme EC Localization
Glycolate oxidase 1.1.3.1 Peroxisomel-a-hydroxyacid oxidase 1.1.3a Peroxisomel-gulonolactone oxidase 1.1.3.8 CytosolAldehyde oxidase 1.2.3.1 CytosolXanthine oxidase 1.2.3.2 Cytosold-amino-acid oxidase 1.4.3.3 PeroxisomeMonoamine oxidase 1.4.3.4 Mitochondrial outer membranePyridoxamine oxidase 1.4.3.5 Endoplasmic reticulumDiamine oxidase 1.4.3.6 Endoplasmic reticulumNADPH-cytochrome c reductase 1.6.99.1 Endoplasmic reticulumNADPH-cytochrome c reductase 1.6.99.3 Peroxisome coreUrate oxidase 1.7.3.3 Peroxisome coreSuperoxide dismutase 1.15.1.1 Cytosol and mitochondrial matrix

nic reserves) and fed to active working muscles.As a result, some of these organs or tissues mayexperience transient hypoxia. In addition, duringexercise at or above V
.o 2max., and perhaps at
lower intensities, fibres within the workingmuscle may experience hypoxia. During theexercise recovery phase, these tissues, that weresubject to transient hypoxia during exercise, arereoxygenated, resulting in the well-known burstof ROS production that is characteristic ofischaemia-reperfusion (Kellogg & Fridovich1975; Wolbarsht & Fridovich 1989).
Catecholamine auto-oxidation
During exercise, catecholamine levels in the cir-culation may increase severalfold (Singh 1992).Auto-oxidation of these catecholamines may represent a significant source of ROS duringexercise.
Xanthine oxidase activity
Mainly located in the vessel walls of most tissues,including cardiac and skeletal muscle, theenzyme xanthine dehydrogenase (XDH) cataly-ses the oxidation of hypoxanthine to xanthine,and xanthine to uric acid. While in its nativeform, XDH uses NAD+ as an electron acceptor.Under certain conditions, e.g. ischaemia–reperfusion and extreme hypotension as inhaemorrhagic shock, XDH may either reversiblyor irreversibly be transformed to xanthineoxidase. In contrast to the native dehydrogenaseform, xanthine oxidase utilizes O2 as the electronacceptor and produces superoxides as a resultwhile catalysing the oxidation of hypoxanthineto uric acid (Hellsten 1994).
Neutrophil oxidative burst
As weapons for pathogen destruction andimmunoprotection, ROS have been put to gooduse by phagocytes. Nicotinamide adenine dinu-cleotide phosphate (NADPH) oxidase located inthe plasma membrane of neutrophils producessuperoxides on purpose. Following spontaneous
294 nutrition and exercise
dismutation, superoxides generated in this waycontribute to H2O2 formation. When activated byimmune-challenge or such other stimuli, neu-trophils release myeloperoxidase into the extra-cellular medium. Myeloperoxidase, released assuch, complexes with H2O2 to form anenzyme–substrate complex with an oxidizingpotential. The complex oxidizes chloride (Cl–) toproduce hypochlorous acid (HOCl). O2
•–, H2O2and HOCl may be considered as broad spectrumphysiological ‘antibiotics’ that eliminate patho-genic infection. Unfortunately, for this, the hostcell has to pay a price in the form of inflammation(Edmonds & Blake 1994). Oxidative burst in leucocytes marginated to skeletal muscle duringexercise may cause tissue damage (Weiss 1989;Ward 1991).
Nitric oxide synthesis
Nitric oxide (NO) has one unpaired electron andis therefore a radical by definition. Cells likemacrophages which are capable of producingboth NO and superoxides are the likely host of apowerful ROS, the peroxynitrite anion (ONOO–).Formed by the reaction of NO with superoxide,the peroxynitrite anion is a relatively long-livedROS. In this way, NO may magnify superoxidetoxicity. Human skeletal muscle expresses twodifferent constitutive isoforms of NO synthase indifferent cellular compartments (Frandsen et al.1996). Activity of skeletal muscle is known to beassociated with a marked increase of NO produc-tion and release by the tissue (Balon & Nadler1994). Increased end product of NO metabolismhas been observed in the postexercise plasma ofboth athletes and non-athletes (Jungersten et al.1997).
Metal ions
Conditions, e.g. lowering of plasma pH to lessthan 6.0, haemolysis, ischaemia-reperfusion, thatlead to the release of transition metal ions, e.g.iron and copper, may amplify ROS toxicity(Jenkins & Halliwell 1994).
Other conditions that may contribute to oxida-

tive stress are cigarette smoking, alcoholism andhigh altitude (Moller et al. 1996). Each puff of acigarette is estimated to contain approximately1014 free radicals in the tar phase and approxi-mately 1015 in the gas phase (Duthie & Arthur1994). The metabolism of ethanol producesacetaldehyde that is known to consume the keyphysiological antioxidant, glutathione (GSH)(Videla & Valenzuela 1982). Ingestion of ethanolis associated with enhanced lipid peroxidation(Nadiger et al. 1988). Increased levels of lipid peroxidation by-products were observed in thealcohol-administered rat cerebral cortex, cerebel-lum and brain stem (Nadiger et al. 1986). Severalfactors, including hypoxia, altered mitochon-drial respiration and exposure to UV radiation,are known contribute to oxidative stress at highaltitude (Simon-Schnass 1994; Moller et al. 1996).It is also evident that exercise can induce changesin biochemical parameters that are indicative ofoxidative stress in the fit horse and that this isexacerbated during exercise at high temperatureand humidity (Mills et al. 1996).
Evidence
Multiple unsaturation points in polyunsaturatedfatty acids (PUFA) make them highly susceptibleto ROS attack and oxidative damage. Uncon-trolled and autocatalytic oxidative destruction ofPUFA, commonly referred to as lipid peroxida-tion, is initiated when a ROS having sufficientenergy to abstract a H-atom of a methylene (-CH2) group (of the PUFA backbone) reacts witha PUFA (Alessio 1994). Peroxyl radicals thusformed are particularly dangerous because theyare capable of propagating oxidative damage.These ROS are carried by the blood to distanttargets where fresh oxidative damage may be initiated. Membrane lipid peroxidation may alterfluidity and permeability, and compromise theintegrity of the barrier. Hence, the study of lipidperoxidation to estimate oxidative stress is apopular practice. In 1978, Dillard et al. firstreported that in humans physical exercise at 75%V.o 2max. increased the level of pentane, a possible
by-product of oxidative lipid damage or lipid
peroxidation, by 1.8-fold in the expired air com-pared with resting subjects. Since then, consider-able evidence has accumulated showing thatphysical exercise may trigger lipid peroxidationin several tissues including skeletal muscles,heart, liver, erythrocytes and plasma (Sen 1995).In a human study, serum lipid peroxidation wasmeasured by three different methods duringphysical exercise of different duration with theaim of uncovering the significance of eachmethod in measuring oxidative stress after physical exercise (Vasankari et al. 1995).
Oxidative protein damage is widespreadwithin the body at rest. It has been estimatedthat, at rest, 0.9% of the total oxygen consumedby a cell contributes to protein oxidation (Floyd1995). Most of this damage is irreparable, and by-products of such damage are either stored ordegraded. Proteins that have been damaged byreactive oxygen are highly susceptible to prote-olytic cleavage. The amount of oxidized proteinin various tissues increases with age (Levine &Stadtman 1996). Certain components of proteinsuch as tyrosine, methionine, tryptophan, histi-dine, and sulfhydryl residues are highly suscep-tible to oxidative damage. Following reactiveoxygen attack, amino acid residues are convertedto carbonyl derivatives. Alternatively, reducingsugars linked with the e amino group of Lysresidues can be oxidized. As a result, protein carbonyl formation is widely used as an index ofoxidative protein damage. Other specificmarkers of oxidative amino acid modification aredityrosine crosslinking and formation of disul-phide bridges (-S-S-) and mixed disulphides incysteine residues. For example, in dystrophicmuscle the protein disulphide to sulphydryl(SS/SH) ratio has been observed to be increased,suggesting the possible involvement of oxidativedamage (Kondo & Itokawa 1994). Oxidativemodification of proteins may cause receptormodification, disturbance in intracellular ionichomeostasis, and altered signal transduction,and may also influence other fundamental cell-regulatory processes. Reznick et al. (1992) havereported that exhaustive exercise triggers skele-tal muscle protein oxidation in rats. In another
oxidative stress and antioxidant nutrients 295

study where rats were subjected to exhaustiveexercise, we (Sen et al. 1997a) observed consistenteffects of physical exercise on tissue protein oxi-dation. Protein carbonyl levels in the red gastroc-nemius muscle were roughly three time higher inexercised rats. In the vastus lateralis muscle,exercise increased the carbonyl content by 69%.Exhaustive exercise also increased protein oxida-tion in the liver, but the effect was much less pro-nounced than that in the muscles (Sen et al.1997a). In another study, 10–15min of swim exer-cise resulted in oxidation of rat erythrocyte membrane protein. Following exercise, skeletalmuscle microsomes contained decreased sul-phydryls and protein cross-linking was exten-sive (Rajguru et al. 1994). We observed that inskeletal muscle cells certain membrane K+ trans-port proteins are highly sensitive to oxidantexposure (Sen et al. 1995).
In humans, the number of oxidative hits to theDNA per cell per day has been estimated to be ashigh as 10000 (Ames et al. 1993). Oxidativelesions of DNA accumulate with age. A 2-year-old rat is estimated to have two million oxidativeDNA lesions per cell, which is about twice that ina young rat. In mammals, oxidative DNAdamage appears to be roughly related to themetabolic rate (Ames et al. 1993). Such a trend,suggesting a relationship between metabolic rateand oxidative DNA damage, makes it importantto study the effect of exercise on oxidative DNAmodifications. Information regarding exercise-induced oxidative DNA damage is limited,however. Ten hours after marathon running, theratio of urinary oxidized nucleosides per creati-nine increased 1.3-fold above rest (Alessio &Cutler 1990). Neutrophils represent 50–60% ofthe total circulating leucocytes, and Smith et al.(1990) have shown that a single bout of exercisemay remarkably increase ROS production by theneutrophils. We were therefore interested to seehow different intensities of exercise may affectleucocyte DNA in humans. Results obtained inour study (Sen et al. 1994d) indicate the possibil-ity that exercise-associated oxidative stress mayinitiate DNA damage in leucocytes. Out of the 36measurements carried out with nine subjects
296 nutrition and exercise
during four exercise tests, DNA damage was notdetected in 11 cases, however. In another study,no significant increase in the urinary level of theoxidized RNA adduct 8-hydroxyguanosine fol-lowing 90min of bicycle exercise by younghealthy men was observed (Viguie et al. 1993). Ina later study, the single-cell gel test or COMETassay was employed to detect exercise-inducedDNA damage in human white blood cells withincreased sensitivity. Incremental exercise on atreadmill performed by healthy non-smokingmen clearly caused DNA damage (Hartmann et al. 1995). Strenuous exercise for approximately10h · day–1 for 30 days also increased the rate ofoxidative DNA modification by 33% (95% confi-dence limits, 3–67%; P < 0.02) in 20 men. It wassuggested that oxidative DNA damage mayincrease the risk of the development of cancerand premature ageing in humans performingstrenuous exercise on a regular basis (Poulsen et al. 1996).
Another line of evidence that supports thehypothesis that physical exercise may induceoxidative stress is the lowering of tissue levels of antioxidants during exercise. In view of theabove-mentioned increases in tissue oxidativestress indices following exercise, such loweringof tissue antioxidant levels in response to physi-cal exercise is thought to be a result of increasedantioxidant consumption in oxidative stresschallenged tissues. Several studies have shownthat physical exercise decreases tissue levels ofvitamin E (Goldfarb & Sen 1994). It is thoughtthat exercise-induced mobilization of free fattyacids from the adipose tissues is accompanied bythe loss of tocopherols from the tissue. As aresult, tocopherol levels increased in humanblood following intense cycling. This elevation oftocopherol levels in the circulation is transientand the level returns to normal in the early phaseof recovery (Pincemail et al. 1988). Treadmillexercise-induced decrease in total antioxidantcapacity of blood has also been evident in maleclaudication patients (Khaira et al. 1995).
It has been consistently reported from severallaboratories (Gohil et al. 1988; Sen et al. 1994d;Tessier et al. 1995; Vina et al. 1995; Laaksonen et al.
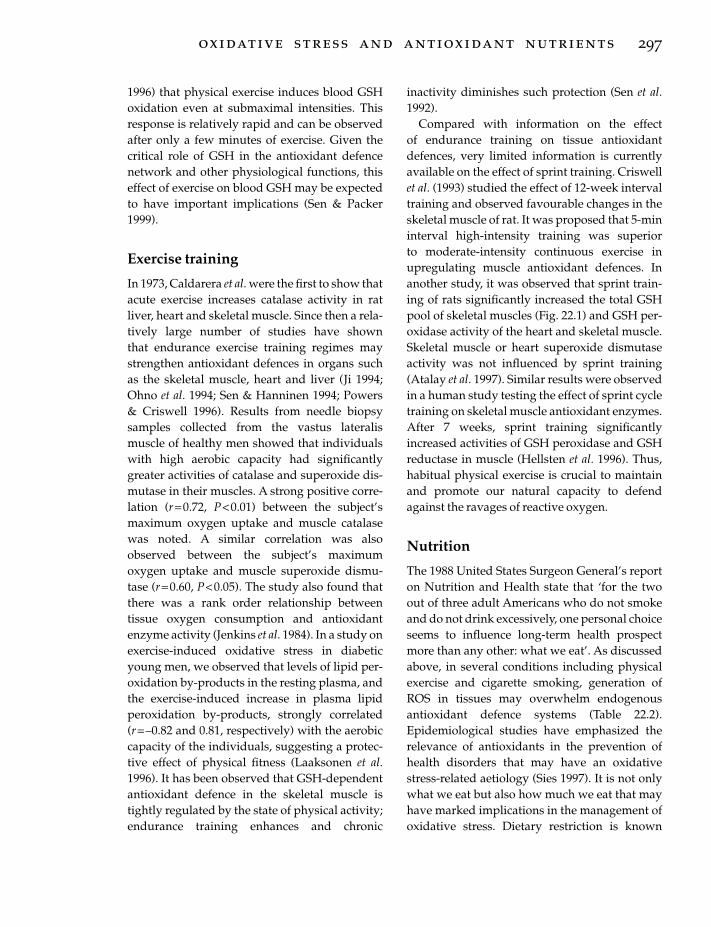
1996) that physical exercise induces blood GSHoxidation even at submaximal intensities. Thisresponse is relatively rapid and can be observedafter only a few minutes of exercise. Given thecritical role of GSH in the antioxidant defencenetwork and other physiological functions, thiseffect of exercise on blood GSH may be expectedto have important implications (Sen & Packer1999).
Exercise training
In 1973, Caldarera et al. were the first to show thatacute exercise increases catalase activity in ratliver, heart and skeletal muscle. Since then a rela-tively large number of studies have shown that endurance exercise training regimes maystrengthen antioxidant defences in organs suchas the skeletal muscle, heart and liver (Ji 1994;Ohno et al. 1994; Sen & Hanninen 1994; Powers & Criswell 1996). Results from needle biopsysamples collected from the vastus lateralismuscle of healthy men showed that individualswith high aerobic capacity had significantlygreater activities of catalase and superoxide dis-mutase in their muscles. A strong positive corre-lation (r= 0.72, P <0.01) between the subject’smaximum oxygen uptake and muscle catalasewas noted. A similar correlation was alsoobserved between the subject’s maximumoxygen uptake and muscle superoxide dismu-tase (r= 0.60, P <0.05). The study also found thatthere was a rank order relationship betweentissue oxygen consumption and antioxidantenzyme activity (Jenkins et al. 1984). In a study onexercise-induced oxidative stress in diabeticyoung men, we observed that levels of lipid per-oxidation by-products in the resting plasma, andthe exercise-induced increase in plasma lipidperoxidation by-products, strongly correlated (r =–0.82 and 0.81, respectively) with the aerobiccapacity of the individuals, suggesting a protec-tive effect of physical fitness (Laaksonen et al.1996). It has been observed that GSH-dependentantioxidant defence in the skeletal muscle istightly regulated by the state of physical activity;endurance training enhances and chronic
inactivity diminishes such protection (Sen et al.1992).
Compared with information on the effect of endurance training on tissue antioxidantdefences, very limited information is currentlyavailable on the effect of sprint training. Criswellet al. (1993) studied the effect of 12-week intervaltraining and observed favourable changes in theskeletal muscle of rat. It was proposed that 5-mininterval high-intensity training was superior to moderate-intensity continuous exercise inupregulating muscle antioxidant defences. Inanother study, it was observed that sprint train-ing of rats significantly increased the total GSHpool of skeletal muscles (Fig. 22.1) and GSH per-oxidase activity of the heart and skeletal muscle.Skeletal muscle or heart superoxide dismutaseactivity was not influenced by sprint training(Atalay et al. 1997). Similar results were observedin a human study testing the effect of sprint cycletraining on skeletal muscle antioxidant enzymes.After 7 weeks, sprint training significantlyincreased activities of GSH peroxidase and GSHreductase in muscle (Hellsten et al. 1996). Thus,habitual physical exercise is crucial to maintainand promote our natural capacity to defendagainst the ravages of reactive oxygen.
Nutrition
The 1988 United States Surgeon General’s reporton Nutrition and Health state that ‘for the twoout of three adult Americans who do not smokeand do not drink excessively, one personal choiceseems to influence long-term health prospectmore than any other: what we eat’. As discussedabove, in several conditions including physicalexercise and cigarette smoking, generation ofROS in tissues may overwhelm endogenousantioxidant defence systems (Table 22.2). Epidemiological studies have emphasized therelevance of antioxidants in the prevention ofhealth disorders that may have an oxidativestress-related aetiology (Sies 1997). It is not onlywhat we eat but also how much we eat that mayhave marked implications in the management ofoxidative stress. Dietary restriction is known
oxidative stress and antioxidant nutrients 297
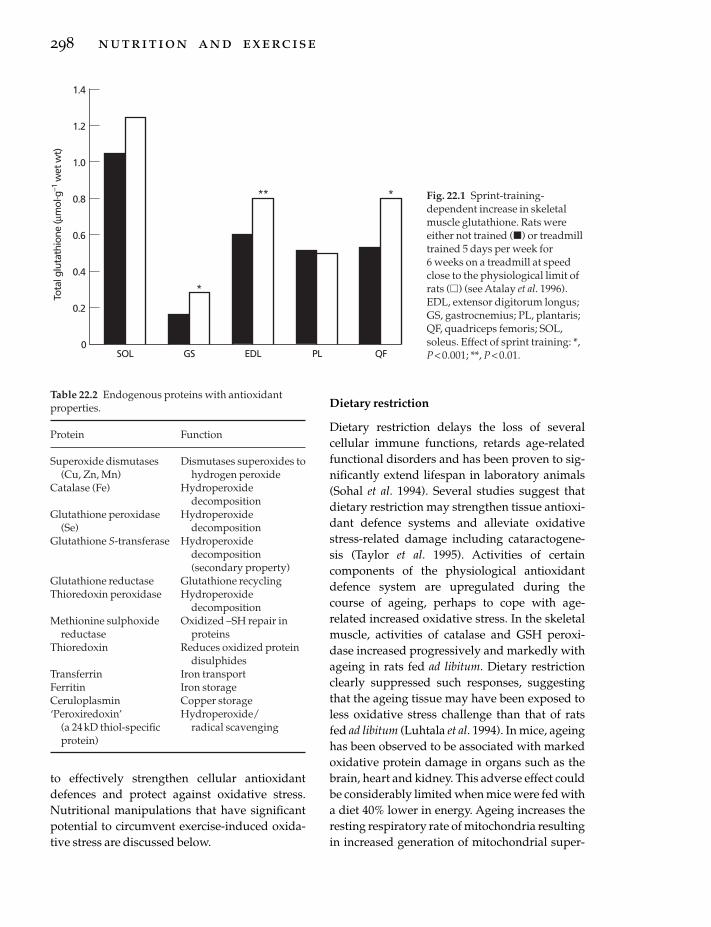
to effectively strengthen cellular antioxidantdefences and protect against oxidative stress.Nutritional manipulations that have significantpotential to circumvent exercise-induced oxida-tive stress are discussed below.
298 nutrition and exercise
Dietary restriction
Dietary restriction delays the loss of several cellular immune functions, retards age-relatedfunctional disorders and has been proven to sig-nificantly extend lifespan in laboratory animals(Sohal et al. 1994). Several studies suggest thatdietary restriction may strengthen tissue antioxi-dant defence systems and alleviate oxidativestress-related damage including cataractogene-sis (Taylor et al. 1995). Activities of certain components of the physiological antioxidantdefence system are upregulated during thecourse of ageing, perhaps to cope with age-related increased oxidative stress. In the skeletalmuscle, activities of catalase and GSH peroxi-dase increased progressively and markedly withageing in rats fed ad libitum. Dietary restrictionclearly suppressed such responses, suggestingthat the ageing tissue may have been exposed toless oxidative stress challenge than that of ratsfed ad libitum (Luhtala et al. 1994). In mice, ageinghas been observed to be associated with markedoxidative protein damage in organs such as thebrain, heart and kidney. This adverse effect couldbe considerably limited when mice were fed witha diet 40% lower in energy. Ageing increases theresting respiratory rate of mitochondria resultingin increased generation of mitochondrial super-
Tota
l glu
tath
ione
(µm
ol. g
–1 w
et w
t)
1.4
0
1.2
0.4
SOL
0.2
GS
1.0
0.8
0.6
EDL PL QF
*
** * Fig. 22.1 Sprint-training-dependent increase in skeletalmuscle glutathione. Rats wereeither not trained (�) or treadmilltrained 5 days per week for 6 weeks on a treadmill at speedclose to the physiological limit ofrats (�) (see Atalay et al. 1996).EDL, extensor digitorum longus;GS, gastrocnemius; PL, plantaris;QF, quadriceps femoris; SOL,soleus. Effect of sprint training: *,P < 0.001; **, P < 0.01.
Table 22.2 Endogenous proteins with antioxidantproperties.
Protein Function
Superoxide dismutases Dismutases superoxides to(Cu, Zn, Mn) hydrogen peroxide
Catalase (Fe) Hydroperoxide decomposition
Glutathione peroxidase Hydroperoxide (Se) decomposition
Glutathione S-transferase Hydroperoxide decomposition(secondary property)
Glutathione reductase Glutathione recyclingThioredoxin peroxidase Hydroperoxide
decompositionMethionine sulphoxide Oxidized –SH repair in
reductase proteinsThioredoxin Reduces oxidized protein
disulphidesTransferrin Iron transportFerritin Iron storageCeruloplasmin Copper storage‘Peroxiredoxin’ Hydroperoxide/
(a 24kD thiol-specific radical scavengingprotein)

oxides and hydrogen peroxide. A protectiveeffect of dietary restriction under such conditionshas been also evident (Sohal et al. 1994). In rats,dietary restriction has been shown to suppressROS generation in hepatic microsomes. Interest-ingly, a synergistic effect of dietary restrictionand exercise was observed to protect mito-chondrial membrane fluidity against oxidativedamage (Kim et al. 1996a). Another study investi-gated the effect of dietary restriction and physi-cally active lifestyle on lipid peroxidation andantioxidant defences of the rat heart. Dietrestricted rats were fed 60% of the ad libitum levelfor 18.5 months. Both dietary restriction and aphysically active lifestyle decreased lipid peroxi-dation damage in cardiac mitochondria. Dietaryrestriction significantly increased the activities ofcytosolic antioxidant enzymes such as superox-ide dismutase, selenium dependent GSH peroxi-dase and GSH S-transferase. It is thus evidentthat long-term dietary restriction and a physi-cally active life style may alleviate the extent offree radical damage in the heart by strengtheningendogenous antioxidant defences (Kim et al.1996b).
Food deprivation, on the other hand, mayadversely affect liver GSH reserves and whole-body GSH metabolism. Starvation is followed bylowered GSH levels in the plasma, lung andskeletal muscles (Cho et al. 1981; Lauterburg et al.1984). The influences of food deprivation andrefeeding on GSH status, antioxidant enzymeactivity and lipid peroxidation in response to anacute bout of exercise have been investigated inthe liver and skeletal muscles of male rats. Fooddeprivation depleted tissue GSH stores andcaused increased lipid peroxidation in the liverand skeletal muscles. Leeuwenburgh and Ji(1996) showed that both food deprivation–refeeding and exhaustive exercise influence liverand skeletal muscle GSH status and that thesechanges may be controlled by hepatic GSH syn-thesis and release due to hormonal stimulation.
Antioxidant nutrients
The chemical nature of any antioxidant deter-mines its solubility, and thus its localization in
biological tissues. For example, lipid-solubleantioxidants are localized in membranes andfunction to protect against oxidative damage ofmembranes. Water-soluble antioxidants, located,for example, in the cytosol, mitochondrial matrixor extracellular fluids, may not have access toROS generated in membranes. Vitamins E and A,coenzyme Q, carotenoids, flavonoids, and poly-phenols represent the most extensively studiednaturally occurring fat-soluble antioxidants.Vitamin C, GSH, uric acid and lipoic acid are themost commonly known water-soluble antioxi-dants. The antioxidants that have been tested inexercise studies are briefly introduced in the fol-lowing section.
Vitamin E
Vitamin E refers to all tocol and tocotrienolderivatives which exhibit the biological activityof a-tocopherol (Sheppard et al. 1993). The formof vitamin E that has most biological activity isRRR-a-tocopherol, previously known as d-a-tocopherol. Vitamin supplements are marketedas mixed tocopherols, a-tocopherol or esterifiedderivatives, e.g. a-tocopheryl-acetate, -nicotinateor -succinate. Edible vegetable oils are the richestnatural source of vitamin E. Unprocessed cerealgrains and nuts are also good sources of vitaminE. Animal sources of vitamin E include meat,especially fat. One of the most significant proper-ties of vitamin E is that it is an antioxidant.Vitamin E especially protects polyunsaturatedfatty acids within phospholipids of biologicalmembranes and in plasma lipoproteins (Burtonet al. 1983). The phenolic moiety of tocopherolreacts with peroxyl (ROO•, where R= alkylresidue) radicals to form the correspondingorganic hydroperoxide and the tocopheroxylradical (Fig. 22.2). In this radical form,vitamin Eis not an effective antioxidant, and when suffi-ciently accumulated may even have toxic pro-oxidant effects. The effect of vitamin E on theoxidation of various biological molecules, mem-branes and tissues have been extensivelystudied. Vitamin E suppresses the oxidativedamage of biological membranes, lipoproteinsand tissues. Tocopherols are unstable and are
oxidative stress and antioxidant nutrients 299

readily oxidized by air, especially in the presenceof iron and other transition metal ions. Theresulting tocopherylquinone has no biologicalactivity. To prevent this loss of biological potencyin nutritional supplements, vitamin E is pre-sented in the esterified form. In the gastrointesti-nal tract, the ester is enzymatically hydrolysedand free tocopherol is absorbed (Traber & Sies1996).
Carotenoids
Carotenoid designates a long-chain molecule
300 nutrition and exercise
with 40 carbon atoms and an extensive con-jugated system of double bonds. Plant andmicroorganism-derived carotenoids are efficientscavengers of several forms of ROS (Handelman1996). The major forms of carotenoids that havebeen studied for their antioxidant propertiesinclude a-, b- and g-carotene, lycopene, b-cryptoxanthin, lutein, zeaxanthin, astaxanthin,canthaxanthin, violaxanthin, and b-carotene-5,6-epoxide. Photosynthetic plant leaves are rich incarotenoids typical of the choloroplast, con-taining predominantly b-carotene, lutein, andepoxycarotenoids, e.g. violaxanthin. Storage
ROO + Chr-OH
Decay to non-radical products
ROOH + Chr-O
Chr-O + RO Products
Chr-O + ROO Products
Chr-O + Chr-O Products
Regeneration–recycling by vitamin C
Chr-O + ascorbic Chr-OH +semiascorbyl
radicalacid
10 Gauss
10 Gauss
ESRsignal
Formation
Fig. 22.2 Interaction of vitamin E and C during the course of the lipid peroxidation chain reaction termination.During termination of the lipid peroxidation reaction, vitamin E may be oxidized to its corresponding radicalconfiguration (Chr-O•) that has no antioxidant potency and may be even toxic. Vitamin C may regenerate Chr-O•
to Chr-OH and itself be oxidized to the semiascorbyl radical. Spontaneous radical–radical recombination may leadto the decay of some radicals to non-reactive products. Chr-OH, chromanol head with the phenolic OH intocopherol; ESR, electron spin resonance spectroscopy; ROO•, peroxyl radical; semiascorbyl radical, one electronoxidation product of vitamin C or ascorbic acid.

bodies such as carrot, papaya or squash con-tain mostly b-carotene, a-carotene and b-cryptoxanthin. Tomatoes are rich in lycopenebecause the b-carotene biosynthetic pathway ter-minates prior to the formation of the terminalrings. Chemically, carotenoids are highly unsta-ble and are susceptible to auto-oxidation (Han-delman et al. 1991). Although most reportsindicate that carotenoids do have effectiveantioxidant functions in biological systems,some studies show that carotenoids may alsoshow toxic pro-oxidant effects (Burton & Ingold1984; Andersen & Andersen 1993).
Ubiquinone
Coenzyme Q10, also called ubiquinone, is an inte-gral component of the mitochondrial electrontransport chain. Coenzyme Q10 is found in thephospholipid bilayer of plasma membranes, allintracellular membranes and also in low-densitylipoproteins. The actual mechanism of antioxi-dant action of ubiquinones is still conjectural.One possibility is that ubiquinols act indepen-dently as lipid peroxidation chain-breakingantioxidants. Alternatively, a redox interaction ofubiquinol with vitamin E has been suggested inwhich ubiquinol mainly acts by regeneratingvitamin E from its oxidized form (Kagan et al.1996).
Vitamin C
Vitamin C or ascorbate is an excellent water-soluble antioxidant. Although in most higherorganisms it is synthesized from abundantglucose precursors, other species, includinghumans, solely depend on nutritional supply.Because of its strong reducing properties, ascor-bate readily reduces Fe3+ and Cu2+ to Fe2+ andCu+, respectively. In this way, ascorbate can con-tribute to the redox cycling of these metals, gen-erating transition metal ions that can stimulatefree radical chemistry. Thus, ascorbate may havepro-oxidant effects in the presence of free metals(Aust et al. 1985; Buettner 1986). Apart fromdirect free radical scavenging activity, ascorbate
may also enhance the antioxidant action ofvitamin E. The phenol group of tocopherol,which is the basis of its antioxidant action,appears to be located at the water–membraneinterface of biological membranes. Such localiza-tion facilitates ascorbate–vitamin E interaction(see Fig. 22.2). Dehydroascorbate, the two-electron oxidation product of ascorbate, isreduced to ascorbate by reduced GSH. Thus,ascorbate plays a central role in the antioxidantnetwork.
Glutathione
Glutathione (l-g-glutamyl-l-cysteinylglycine)is implicated in the circumvention of cellularoxidative stress and maintenance of intracellularthiol redox status (Meister 1992a, 1992b, 1995;Sen & Hanninen 1994). GSH peroxidase is spe-cific for its hydrogen donor, reduced GSH, butmay use a wide range of substrates extendingfrom H2O2 to organic hydroperoxides. Thecytosolic and membrane-bound monomer GSH phospholipid hydroperoxide-GSH per-oxidase and the distinct tetramer plasma GSHperoxidase are able to reduce phospholipidhydroperoxides without the necessity of priorhydrolysis by phospholipase A2. The protectiveaction of phospholipid hydroperoxide-GSH peroxidase against membrane-damaging lipidperoxidation has been directly demonstrated(Thomas et al. 1990). Reduced GSH is a major cellular electrophile conjugator as well. GSH S-transferases catalyse the reaction between the -SH group of GSH and potential alkylatingagents, thereby neutralizing their electrophilicsites and rendering them more water-soluble.GSH S-transferases represent a major group ofphase II detoxification enzymes (Hayes &Pulford 1995).
Intracellular synthesis of GSH is a tightly regulated two-step process, both steps beingadenosine triphosphate dependent. g-Glutamylcysteine synthetase (also referred to asglutamate-cysteine ligase) catalyses the forma-tion of the dipeptide g-glutamylcysteine (DeLeve& Kaplowitz 1990) and subsequently the addi-
oxidative stress and antioxidant nutrients 301

tion of glycine is catalysed by GSH synthetase.Substrates for such synthesis are provided bothby direct amino acid transport and by g-glutamyltranspeptidase (also known as glutamyl trans-ferase) that couple the g-glutamyl moiety to asuitable amino acid acceptor for transport intothe cell. GSH is also generated intracellularlyfrom its oxidized form GSH disulphide (GSSG)by GSSG reductase activity in the presence ofNADPH. Under normal conditions, the rate-limiting factor in cellular GSH synthesis is theavailability of the constituent amino acid cys-teine. Thus, given that the GSH-synthesizingenzymes have normal activity, improving cys-teine delivery to cells is effective in increasingcell GSH. Cysteine per se is highly unstable in itsreduced form, and considerable research hasbeen focused on alternative strategies for cys-teine delivery (Sen & Packer 1999).
Administered GSH per se is not effectivelytransported into cells (Meister 1991) except in thesmall intestine (Vina et al. 1989; Hagen et al. 1990;Martensson et al. 1990; Aw et al. 1991); it is mostlydegraded in the extracellular compartment. Thedegradation products, i.e. the constituent aminoacids, may be used as substrates for GSH neosyn-thesis inside the cell. Two clinically relevant pro-GSH agents that have been extensively studiedso far are N-acetyl-l-cysteine (NAC; 2-mercapto-propionyl glycine) and a-lipoate (Borgstrom et al.1986; Issels et al. 1988; Aruoma et al. 1989;Holdiness 1991; Ferrari et al. 1995; Huupponen etal. 1995; Packer et al. 1995, 1997; van Zandwijk1995; Akerlund et al. 1996; Atalay et al. 1996; Senet al. 1997b, 1997c; Sen & Packer 1999). In addi-tion to its reactive oxygen detoxifying properties(Aruoma et al. 1989; Sen et al. 1994d), NAC isthought to function as a cysteine delivery com-pound (Issels et al. 1988; Sjödin et al. 1989). Afterfree NAC enters a cell, it is rapidly hydrolysed torelease cysteine. NAC, but not N-acetyl-d-cysteine or the oxidized disulphide form ofNAC, is deacetylated in several tissues to releasecysteine. NAC is safe for human use and it hasbeen used as a clinical mucolytic agent for manyyears.
302 nutrition and exercise
Lipoic acid
a-Lipoate is also known as thioctic acid, 1,2-dithiolane-3-pentanoic acid, 1,2-dithiolane-3-valeric acid or 6,8-thioctic acid. Biologically,lipoate exists as lipoamide in at least five pro-teins, where it is covalently linked to a lysylresidue (Packer et al. 1995, 1997; Sen et al. 1997b,1997c; Sen & Packer 1999). Lipoic acid has beendetected in the form of lipoyllysine in variousnatural sources. In the plant material studied,lipoyllysine content was highest in spinach (3.15mg ·g–1 dry weight; 92.51mg ·mg protein).When expressed as weight per dry weight oflyophilized vegetables, the abundance of natu-rally existing lipoate in spinach was over three-and fivefold higher than that in broccoli andtomato, respectively. Lower concentrations oflipoyllysine were also detected in garden peas,brussel sprouts and rice bran. Lipoyllysine con-centration was below detection limits in acetonepowders of banana, orange peel, soybean andhorseradish. In animal tissues, the abundance oflipoyllysine in bovine acetone powders can berepresented in the following order: kidney >heart > liver > spleen > brain > pancreas > lung.The concentration of lipoyllysine in bovinekidney and heart was 2.64±1.23 and 1.51±0.75mg ·g–1 dry weight, respectively (Lodge et al.1997).
Studies with human Jurkat T-cells have shownthat when added to the culture medium, lipoatereadily enters the cell where it is reduced to itsdithiol form, dihydrolipoate (DHLA). DHLAaccumulated in the cell pellet, and when moni-tored over a 2-h interval, the dithiol was releasedto the culture medium (Handelman et al. 1994).As a result of lipoate treatment to the Jurkat T-cells and human neonatal fibroblasts, accumu-lation of DHLA in the culture medium wasobserved. The redox potential of the lipoate–DHLAcouple is –320mV. Thus, DHLAis a strongreductant capable of chemically reducing GSSGto GSH. Following lipoate supplementation,extracellular DHLA reduces cystine outside thecell to cysteine. The cellular uptake mechanism

for cysteine by the ASC system is approximately10 times faster than that for cystine by the xc
–
system (Watanabe & Bannai 1987). Thus, DHLAmarkedly improves cysteine availability withinthe cell resulting in accelerated GSH synthesis(Han et al. 1997; Sen et al. 1997b). Both lipoate andDHLA have remarkable reactive oxygen detoxi-fying properties (Packer et al. 1995, 1997).
Selenium
Forty years ago, traces of dietary selenium wereobserved to prevent nutritional liver necrosis invitamin E-deficient rats (Schwarz & Foltz 1957).At present, selenium is widely used in agricul-ture to prevent a variety of selenium- andvitamin E-sensitive conditions in livestock andpoultry (Board on Agriculture 1983). In animaltissues, selenium is either present as selenocys-teine in selenoproteins such as GSH peroxidase,selenoprotein P or thioredoxin reductase. Alter-natively, selenium may present in animal tissuesas selenomethionine, which is incorporated inplace of methionine in a variety of proteins.Selenomethionine-containing proteins serve as areservoir of selenium that provides selenium tothe organism when the dietary supply of sele-nium is interrupted. Selenocysteine is the form ofselenium that accounts for its biological activity.Perhaps the most prominent biological activity of selenium is that it is an essential cofactor forthe critical hydroperoxide-metabolizing enzymeGSH peroxidase (Rotruck et al. 1973). It has beensuggested that selenium may also have directantioxidant effects in biological systems (Burk et al. 1980). The selenium content of food sourcesmay markedly vary depending on the seleniumcontent of the feed for animals, or seleniumcontent in the agricultural soil. Organ meats,seafoods and muscle meat are considerablesources of selenium. Dairy products, cereal andgrains may also provide significant amounts tomeet the RDA value of 70 and 55mg · day–1 calcu-lated for adult men and women, respectively(International Programme of Chemical Safety1987).
Antioxidant deficiency in exercise
The antioxidant deficiency model has been usedto test the significance of various antioxidants in exercise-induced oxidative stress. Severalstudies have consistently indicated that vitaminE deficiency can lead to enhanced free radicalformation resulting in compromised exerciseperformance and increased tissue lipid peroxida-tion (Dillard et al. 1978; Quintanilha et al. 1982;Quintanilha & Packer 1983; Salminen et al. 1984;Gohil et al. 1986; Jackson 1987; Amelink et al.1991). These studies suggest that inadequateamounts of dietary vitamin E may decreaseendurance performance by as much as 40% andlead to enhanced oxidative lipid damage ofseveral tissues (Dillard et al. 1977; Davies et al.1982; Gohil et al. 1984, 1986). Also, vitamin E defi-ciency was associated with increased fragility oflysosomal membranes and greater haemolysis of red blood cells (Davies et al. 1982; Gohil et al.1986). Vitamin E deficiency also decreased oxida-tive phosphorylation (Quintanilha et al. 1982;Gohil et al. 1984) in skeletal muscle, liver andadipose tissues. In female rats, however, vitaminE deficiency does not appear to influence theability to run nor does it enhance tissue lipid per-oxidation (Tiidus et al. 1993). It has been sug-gested that female rats may be less susceptible to free radical damage compared to male ratsbecause of higher levels of oestrogen, a potentialantioxidant, in the circulation (Davies et al. 1982;Salminen et al. 1984; Bar & Amelink 1997). Theeffects of an ascorbate-depleting diet on run timewere examined in guinea pigs, which do not synthesize vitamin C. Run time of ascorbate-depleted guinea pigs was significantly less thanascorbate-adequate animals (Packer et al. 1986).
Dietary selenium deficiency impairs tissueantioxidant defences by markedly downregulat-ing GSH peroxidase activity in tissues such as theliver and muscle. This effect on the antioxidantenzyme did not influence endurance to treadmillrun, however. This suggests that muscle GSHperoxidase activity is not a limiting factor inphysical performance (Lang et al. 1987). Sele-
oxidative stress and antioxidant nutrients 303

nium deficiency has also been found to enhancelipid peroxidation in skeletal muscle mitochon-dria of rats that were exercised for 1h (Ji et al.1988). Activity of antioxidant enzymes in bothliver and skeletal muscle have been observed to adapt in response to selenium deficiency, suggesting that the organs may have encoun-tered and responded to an enhanced oxidativechallenge. The role of endogenous GSH in the circumvention of exhaustive exercise-inducedoxidative stress has been investigated usingGSH-deficient rats. GSH synthesis was inhibitedby intraperitoneally administered l-buthionine-sulphoxamine (BSO) to produce GSH deficiency.The BSO treatment resulted in (i) approximately50% decrease in the total GSH pools of the liver,lung, blood and plasma, and (ii) 80–90% decreasein the total GSH pools of the skeletal muscle andheart. GSH-deficient rats had higher levels oftissue lipid peroxides than controls had, and theycould run for only about half the interval whencompared to the saline-injected controls. Thisobservation underscores the critical role of tissueGSH in the circumvention of exercise-inducedoxidative stress and as a determinant of exerciseperformance (Sen et al. 1994a). Increased suscep-tibility to oxidative stress was also observed inmuscle-derived cells pretreated with BSO (Sen et al. 1993).
Leeuwenburgh and Ji (1995) studied the effectof chronic in vivo GSH depletion by BSO on intra-cellular and interorgan GSH homeostasis in miceboth at rest and after an acute bout of exhaustiveswim exercise. BSO treatment for 12 daysdecreased concentrations of GSH in the liver,kidney, quadriceps muscle, and plasma to 28%,15%, 7% and 35%, respectively, compared withGSH-adequate mice. GSH depletion was associ-ated with adaptive changes in the activities ofseveral enzymes related to GSH metabolism.Exhaustive exercise in the GSH-adequate stateseverely depleted the GSH content of the liver(–55%) and kidney (–35%), whereas plasma andmuscle GSH levels remained constant. However,exercise in the GSH-depleted state exacerbatedthe GSH deficit in the liver (–57%), kidney(–33%), plasma (–65%), and muscle (–25%) in the
304 nutrition and exercise
absence of adequate reserves of liver GSH.Hepatic lipid peroxidation increased by 220%and 290%, respectively, after exhaustive exercisein the GSH-adequate and -depleted mice. It was concluded that GSH homeostasis is anessential component of the prooxidant-antioxidant balance during prolonged physicalexercise.
Antioxidant supplementation in exercise
Venditti and Di Meo (1996) observed that freeradical-induced damage in muscle could be oneof the factors terminating muscle effort. Theysuggested that greater antioxidant levels in thetissue should allow trained muscle to withstandoxidative processes more effectively, thus length-ening the time required so that the cell function issufficiently damaged as to make further exerciseimpossible. Whether oxidative stress is the singlemost important factor determining muscle per-formance is certainly a debatable issue. The con-tention that strengthened antioxidant defence ofthe muscle may protect against exercise-inducedoxidative-stress-dependent muscle damage ismuch more readily acceptable (Dekkers et al.1996). Animal experiments studying the effect of vitamin E have shown mixed results on theprevention of lipid peroxidation (Sen 1995), with the general trend that such supplementa-tion may diminish oxidative tissue damage.Brady and coworkers (Brady et al. 1979) exam-ined the effects of vitamin E supplementation (50 IU ·kg–1 diet) on lipid peroxidation in liverand skeletal muscle at rest and following exhaus-tive swim exercise. Vitamin E effectivelydecreased lipid peroxidation in liver indepen-dent of selenium supplementation, whereasskeletal muscle lipid peroxidation response wasunaffected by the supplementation. Goldfarb et al. (1994) observed that vitamin E supple-mentation can protect against run-induced lipidperoxidation in the skeletal muscle and blood.The effect in skeletal muscle was muscle fibretype dependent. The protective effect of vitamin E was more clearly evident when the

animals were exposed to an additional stressor, dehydroepiandrosterone.
Jackson et al. (1983) examined the effect of bothvitamin E deficiency and supplementation on thecontractile activity of muscle. Male rats andfemale mice were given either a standard diet, a vitamin E-deficient diet with 500mg ·kg–1 sel-enium or a diet supplemented with 240 mg a-tocopherol acetate per kilogram of diet. Theanimals were given this diet for 42–45 days.Vitamin E deficiency, in both mice and rats, wasassociated with increased susceptibility to con-tractile damage. Vitamin E supplementationclearly protected against such damage. Despitethe fact that vitamin E supplementation pro-tected the muscles from damage, as indicated by creatine kinase and lactate dehydrogenaseleakage, there was no apparent effect on musclelipid peroxidation. Kumar et al. (1992) noted thatvitamin E supplementation for 60 days in femaleadult albino rats completely abolished theincrease in free radical-mediated lipid peroxida-tion in the myocardium as a result of exhaustiveendurance exercise. They reported that exercise-induced lipid peroxidation in heart tissue in-creased in control rats but did not increase in thevitamin E-supplemented rats. Consistently, it has been also observed that vitamin E supplementation for 5 weeks attenuated exer-cise-induced increase in myocardial lipid peroxi-dation (Goldfarb et al. 1993, 1994, 1996).
Vitamin E-supplemented diet prevented dehy-droepiandrosterone-induced increase of peroxi-somal fatty acid oxidation and leakage of alanineaminotransferase and aspartate aminotrans-ferase into the plasma (McIntosh et al. 1993a,1993b). Exercised animals on a normal dietdemonstrated similar peroxisomal fatty acid oxidation profile and plasma enzyme levels asthe vitamin E-supplemented group. Novelli et al.(1990) examined the effects of intramuscularinjections of three spin-trappers and vitamin Eon endurance swimming to exhaustion in mice.Mice were injected on three successive days. Itwas observed that, compared to either thecontrol or placebo saline-injected animals, thespin-trap- and vitamin E-injected groups had
significantly increased swim endurance. In astudy reported by Quintanilha and Packer(1983), rats were given one of the following threediets and compared for liver mitochondrial res-piration and lipid peroxidation: a diet deficientin vitamin E, a diet with 40 IU vitamin E ·kg–1, ora diet with 400 IU vitamin E · kg–1. Hepatic mito-chondrial respiratory control ratios were highestin the group supplemented with 400 IU ·kg–1.Additionally, liver lipid peroxidation in nucleiand microsomes was lowest in the vitamin E-supplemented group, especially when NADPHwas present. Warren et al. (1992) studied theeffects of vitamin E supplementation, 10 000IU ·kg–1 diet, for 5 weeks, on muscle damage and freeradical damage to membranes as indicated byalterations in plasma enzymes. Susceptibility ofthe skeletal muscles to oxidative stress wasmarkedly decreased in response to vitamin Esupplementation but this did not attenuatemuscle injury triggered by eccentric contrac-tions. It was concluded that vitamin E supple-mentation may be beneficial in protectingagainst free radical damage, but that the injurycaused by eccentric exercise may not be ROS-mediated. The effect of dietary vitamin E on exercise-induced oxidative protein damage hasbeen investigated in the skeletal muscle of rats.For a period of 4 weeks, rats were fed with highvitamin E diet (10000 IU ·kg–1 diet), a a-tocopherol- and tocotrienol (7000mg tocotrienol ·kg–1 diet)-rich palm oil diet or control diet withbasal levels of a-tocopherol (30 IU ·kg–1 bodyweight). Uphill exhaustive treadmill exercisecaused oxidative protein damage in skeletalmuscles. A protective effect of vitamin E sup-plementation against exercise-induced protein oxidation in skeletal muscles was clearly evident(Reznick et al. 1992).
Fish oils have been shown to have a beneficialeffect on cardiovascular mortality based onnumerous epidemiological studies (Kromhout etal. 1985), presumably via effects on triglyceridelevels, membrane fluidity and platelet and leuco-cyte function (Schmidt & Dyerberg 1994). Not all studies show beneficial effects, however(Ascherio et al. 1995). Because the (n-3) fatty acids
oxidative stress and antioxidant nutrients 305

making up fish oil are highly polyunsaturated,concerns have been raised regarding increasedoxidative stress from fish oil intake (Hu et al.1989; Nalbone et al. 1989; Leibovitz et al. 1990;Demoz et al. 1992, 1994). Furthermore, fish oilsinduce peroxisomal b-oxidation, in which fatty-acyl oxidation yields hydrogen peroxide (H2O2)as a normal by-product, and upregulate theactivity of the H2O2 decomposing enzyme cata-lase (Aarsland et al. 1990; Demoz et al. 1992, 1994).Under normal conditions, up to 20% of cellularO2 consumption has in fact been estimated tooccur in the peroxisome (Chance et al. 1979). Thebeneficial effects of regular exercise on cardio-vascular and overall mortality (Paffenbarger etal. 1984) may be decreased by uncontrolled exer-cise-induced oxidative stress. This may be par-ticularly concerning in groups predisposed tooxidative stress, including that induced by fishoil (Hu et al. 1989; Nalbone et al. 1989; Leibovitz et al. 1990). Sen et al. (1997a) assessed the effect offish oil and vitamin E supplementation com-pared to placebo soy oil and vitamin E supple-mentation on physiological antioxidant defencesand resting and exercise-induced oxidative stressin rat liver, heart and skeletal muscle. The effectsof 8-week vitamin E and fish oil supplementationon resting and exercise-induced oxidative stresswas examined. Lipid peroxidation was 33%higher in fish oil fed rats than in the placebogroup in the liver, but oxidative protein damageremained similar in both liver and red gastro-cnemius muscle. Vitamin E supplementationmarkedly decreased liver and muscle lipid per-oxidation induced by fish oil diet. Vitamin E sup-plementation also markedly decreased oxidativeprotein damage in the liver and muscle. Exhaus-tive treadmill exercise increased liver and musclelipid peroxidation, and muscle oxidative pro-tein damage. Vitamin E effectively decreasedexercise-induced lipid peroxidation and proteinoxidation (Sen et al. 1997a).
A limited number of studies have examinedthe effect of vitamin E supplementation inhumans. Exercise performance and physicalfitness have multifactorial determinants andmay not serve as reasonable end points to test the
306 nutrition and exercise
efficacy of antioxidant supplementation. VitaminE supplementation (900 IU · day–1 for 6 months)in trained swimmers did not alter their swimperformance nor their lactate response in plasma(Lawrence et al. 1975). Neither did vitamin E supplementation (800 IU ·day–1 for 4 weeks) alterthe work load needed to run at 80% V
.o 2max. in
trained and untrained males (Goldfarb et al.1989). Volunteers given 400 IU vitamin E per dayfor 6 weeks showed no influence on cycle time,swim time, or step time (Sharman et al. 1976).Additionally no changes in V
.o 2max., a marker of
physical fitness, was noted in humans followingvitamin E supplementation (Watt et al. 1974;Goldfarb et al. 1989; Sumida et al. 1989). However,Cannon et al. (1990) reported that supplementa-tion of 400 IU vitamin E daily for 48 daysdecreased the amount of creatine kinase leakagefrom muscles during recovery from a downhillrun. Sumida et al. (1989) examined the effects of 4 weeks of vitamin E supplementation in 21 healthy college-aged males. The subjectsingested 300mg of vitamin E daily and bloodlevels of several enzymes and lipid peroxideswere determined before and for up to 3h aftercycling exercise to exhaustion. Exercise increasedthe level of lipid peroxidation by-products inplasma immediately after the cycling andreturned to normal at 1 and 3 hours of recovery.Vitamin E supplementation significantly de-creased the resting level of plasma lipid perox-ides. Meydani et al. (1993) reported that urinaryexcretion of lipid peroxidation by-productstended to be lower in vitamin E-supplementedindividuals (400-IU doses, twice daily, for 48days) than in the corresponding placebo group,but this effect was only significant 12 days afterdownhill running. The subjects ran at 16% down-hill inclination at 75% of their maximum heartrate for three 15-min periods. Muscle biopsieswere obtained from the vastus lateralis of youngsubjects. It was observed that exercise increasedthe level of lipid peroxidation by-products in the muscle of the placebo group, whereas in themuscle of the vitamin E-supplemented group, no such oxidative lipid damage was evident.Another study examined the effect of vitamin E
supplementation (800 IU daily for 4 weeks) andcompared that with a placebo treatment in thesame individuals at a specific exercise intensity(Goldfarb et al. 1989). Subjects were randomlyassigned to either a placebo or vitamin E treat-ment group in a counterbalanced design. Sub-jects were exercised for 30 min at 80% V
.o 2max. and
blood was collected before and after the run.Vitamin E treatment attenuated the level ofresting plasma lipid peroxidation by-productsand also protected against the exercise response.The effects of 5 months of a-tocopherol supple-mentation has been studied in 30 top-classcyclists. Although the supplementation did notimprove physical performance, it was evidentthat exercise-induced muscle damage was less in response to antioxidant supplementation(Rokitzki et al. 1994a).
In 1980, the United States daily allowance forvitamin E was reduced from 30 IU (recom-mended in 1968) to 15 IU. In the same year it wasestimated that in the United States, the amount ofvitamin E supplied by a ‘normal’ diet is about 11 IU (7.4mg). Packer and Reznick (1992) havediscussed that such dosages are insufficient foractive athletes and that dosages of up to 400 IUdaily may be reasonable recommendation foractive athletes engaged in moderate to heavyexercise. Vitamin E is proven to be safe at levelsof intake up to approximately 3000 mg for pro-longed periods of time (Bendich & Machlin1988). However, individuals taking anticoagu-lants should refrain from taking very high doses(> 4000IU) of vitamin E because vitamin E can actsynergistically with this class of drug (Corrigan1979).
Vitamin C supplements (3g · kg–1 diet) given torats who were placed on a vitamin E-deficientdiet did not alter the run time to exhaustion in thevitamin E-deficient animals (Gohil et al. 1986).Vitamin C was unable to counter the deleteriouseffects of vitamin E deficiency. In a preliminaryreport, the effect of vitamin C supplementationin humans was documented. A mild protectiveeffect of vitamin C supplementation, based onelevated total antioxidant capacity of the plasma,was observed (Alessio et al. 1993).
Other nutrients that have been ascribed to bebeneficial as antioxidants, such as selenium andb-carotene, have not been examined individuallybut have been assessed in conjunction with eithervitamin E deficiency or in combination withother antioxidants. The effects of selenium supplementation (0.5ppm diet) or deprivationhave been tested in liver, muscle and blood of swim-exercised rats (Brady et al. 1979). Some ratswere additionally supplemented with vitamin E (50 IU · kg–1). Selenium supplementationincreased the activity of the hydroperoxidemetabolizing enzyme GSH peroxidase in theliver. A tight regulation of tissue GSH peroxidaseactivity by dietary selenium was observedbecause a selenium-deficient diet markedlydownregulated the activity of the enzyme.Muscle GSH peroxidase activity demonstratedsimilar responses to selenium intervention com-pared with the liver. Increased tissue lipid perox-idation was evident when both selenium andvitamin E were deficient. However, seleniumdeficiency had little effect when vitamin E waspresent. Selenium appeared to have minimaleffects on swim-induced lipid peroxidation inthe liver or muscle. Dietary selenium supple-mentation in horses (0.15 ppm daily for 4 weeks)had minimal effects on exercise-induced lipidperoxidation as indicated by blood level of lipidperoxidation by-products (Brady et al. 1978). In adouble-blind human study, no effect of seleniumsupplementation on human physical perfor-mance was observed (Tessier et al. 1995). Sele-nium poisoning is rare in the United States, butthe case of a man who was poisoned by selenium-containing vitamin tablets has beendescribed (Clark et al. 1996).
A few studies have examined the effects ofcoenzyme Q10 to determine if additionalamounts of this factor in the electron transportchain would be beneficial in preventing freeradical damage (Zuliani et al. 1989; Shimomura etal. 1991; Snider et al. 1992). Dietary coenzyme Q10supplementation protected against leakage ofcreatine kinase and lactate dehydrogenase fromthe muscles to serum following downhill run(Shimomura et al. 1991). In two human studies,
oxidative stress and antioxidant nutrients 307
however, this beneficial effect of coenzyme Q10could not be observed (Zuliani et al. 1989; Snideret al. 1992). The effects of ubiquinone supplemen-tation (120mg· day–1 for 6 weeks) on aerobiccapacity and lipid peroxidation during exercisehas been investigated in 11 young (aged 22–38years) and 8 older (aged 60–74 years), trainedmen. This cross-over study was double-blindand placebo-controlled. Ubiquinone supplemen-tation effectively increased serum concentrationof the element in both age groups but did notinfluence maximal aerobic capacity. Consistentwith previous reports, oral ubiquinone supplementation was ineffective as an ergogenic aid in both the young and older, trained men(Laaksonen et al. 1995).
Two brief rodent studies have shown thatexogenous GSH may remarkably increaseendurance to physical exercise (Cazzulani et al.1991; Novelli et al. 1991). Compared withplacebo-treated controls, 0.5, 0.75 and 1g ·kg–1
intraperitoneal doses of GSH increasedendurance to swimming by a marked 102.4%,120% and 140.7%, respectively (Novelli et al.1991). At a dose 0.25 g ·kg–1, GSH did not affectendurance when injected once but such a dosecould significantly increase endurance wheninjected once a day for 7 consecutive days. In another study, oral GSH at dosages of 0.25–1 g · kg–1 caused a dose-dependent significantimprovement in swim endurance (Cazzulani et al. 1991). Both above-mentioned studiesemployed brief bursts of swimming as the exer-cise challenge and did not report any biochemi-cal data related to either GSH metabolism orother indices of oxidative stress. Sen et al. (1994a)sought to clarify the possible mechanism of suchbeneficial effect of GSH supplementation. Anextensive biochemical investigation was neces-sary before any hypothesis regarding the role ofexogenous GSH in endurance enhancementcould be formulated. Almost all the evidencesupporting the contention that a single bout ofexercise may induce oxidative stress have beenobtained from studies using exercise types thatwere long in duration, and mostly running orcycling in nature. Because we aimed to test the
308 nutrition and exercise
efficacy of exogenous GSH in controlling exer-cise-induced oxidative stress, an enduring (ª2 h)treadmill run protocol was used. Intraperitonealinjection of GSH solution (1 g ·kg–1 body weight)resulted in a rapid appearance of GSH in theplasma and was followed by a rapid clearance ofthe thiol. Following the injection excess plasmaGSH was rapidly oxidized. GSH injection did notinfluence GSH status of other tissues studied.Following the repeated administration of GSH,blood and kidney total GSH levels wereincreased. Plasma total GSH of GSH-supplemented animals was rapidly clearedduring exhaustive exercise. The GSH adminis-tration protocol, as used in this study, did notinfluence the endurance to exhaustive physicalexercise of rats. In a previous study, Sen et al.(1994b) observed that treadmill run to exhaus-tion is associated with a remarkable increase inimmunoreactive manganese superoxide dismu-tase (Mn-SOD, a mitochondrial protein) in theplasma. GSH supplementation (500mg ·kg–1
body weight) marginally suppressed suchrelease of the mitochondrial protein to theplasma (Sen et al. 1994b). The inability of exo-genous GSH to provide added antioxidant pro-tection to tissues may be largely attributed to thepoor availability of exogenous administeredGSH to the tissues. In another part of this study,Atalay et al. (1996) tested the effect of GSH sup-plementation on exercise-induced leucocytemargination and neutrophil oxidative burstactivity. Exercise-associated leucocyte margina-tion was prevented by GSH supplementation.Peripheral blood neutrophil counts were signifi-cantly higher in GSH-supplemented groups thanin the placebo control groups. Also, exercise-induced increase in peripheral blood neutrophiloxidative burst activity, as measured by luminol-enhanced chemiluminescence per volume ofblood, tended to be higher in the GSH-supplemented group and lower in the GSH-defi-cient rats, suggesting high plasma GSH mayhave augmented exercise-dependent neutrophilpriming. In these experiments, for the first time itwas shown that GSH supplementation caninduce neutrophil mobilization and decrease
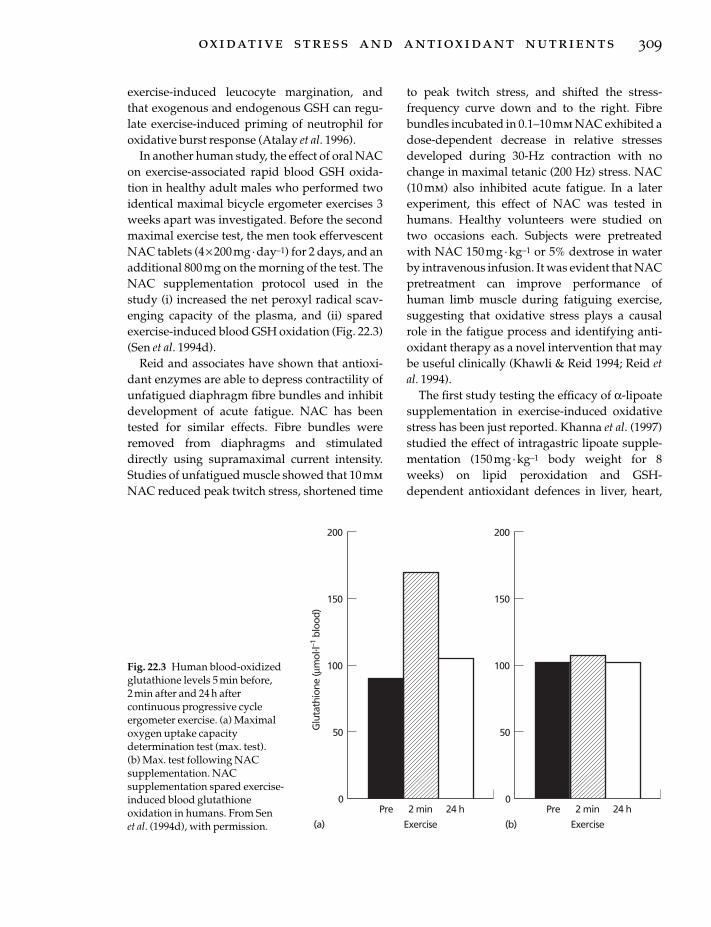
exercise-induced leucocyte margination, andthat exogenous and endogenous GSH can regu-late exercise-induced priming of neutrophil foroxidative burst response (Atalay et al. 1996).
In another human study, the effect of oral NACon exercise-associated rapid blood GSH oxida-tion in healthy adult males who performed twoidentical maximal bicycle ergometer exercises 3weeks apart was investigated. Before the secondmaximal exercise test, the men took effervescentNAC tablets (4¥ 200mg· day–1) for 2 days, and anadditional 800mg on the morning of the test. TheNAC supplementation protocol used in thestudy (i) increased the net peroxyl radical scav-enging capacity of the plasma, and (ii) sparedexercise-induced blood GSH oxidation (Fig. 22.3)(Sen et al. 1994d).
Reid and associates have shown that antioxi-dant enzymes are able to depress contractility ofunfatigued diaphragm fibre bundles and inhibitdevelopment of acute fatigue. NAC has beentested for similar effects. Fibre bundles wereremoved from diaphragms and stimulateddirectly using supramaximal current intensity.Studies of unfatigued muscle showed that 10mmNAC reduced peak twitch stress, shortened time
to peak twitch stress, and shifted the stress-frequency curve down and to the right. Fibrebundles incubated in 0.1–10mm NAC exhibited adose-dependent decrease in relative stressesdeveloped during 30-Hz contraction with nochange in maximal tetanic (200 Hz) stress. NAC(10 mm) also inhibited acute fatigue. In a laterexperiment, this effect of NAC was tested inhumans. Healthy volunteers were studied ontwo occasions each. Subjects were pretreatedwith NAC 150 mg· kg–1 or 5% dextrose in waterby intravenous infusion. It was evident that NACpretreatment can improve performance ofhuman limb muscle during fatiguing exercise,suggesting that oxidative stress plays a causalrole in the fatigue process and identifying anti-oxidant therapy as a novel intervention that maybe useful clinically (Khawli & Reid 1994; Reid etal. 1994).
The first study testing the efficacy of a-lipoatesupplementation in exercise-induced oxidativestress has been just reported. Khanna et al. (1997)studied the effect of intragastric lipoate supple-mentation (150mg· kg–1 body weight for 8weeks) on lipid peroxidation and GSH-dependent antioxidant defences in liver, heart,
oxidative stress and antioxidant nutrients 309
Glu
tath
ione
(µm
ol. l–1
blo
od)
200
0
150
100
50
Pre
Exercise
2 min 24 h
(a)
200
0
150
100
50
Pre
Exercise
2 min 24 h
(b)
Fig. 22.3 Human blood-oxidizedglutathione levels 5 min before, 2 min after and 24 h aftercontinuous progressive cycleergometer exercise. (a) Maximaloxygen uptake capacitydetermination test (max. test). (b) Max. test following NACsupplementation. NACsupplementation spared exercise-induced blood glutathioneoxidation in humans. From Sen et al. (1994d), with permission.
kidney and skeletal muscle of male Wistar rats.Lipoate supplementation significantly increasedtotal GSH levels in liver and blood. These resultsare consistent with those from previously dis-cussed cell experiments, and show that indeedlipoate supplementation may increase GSHlevels of certain tissues in vivo. Lipoate supple-mentation, however, did not affect the total GSHcontent of organs such as the kidney, heart andskeletal muscles. Lipoate supplementation-dependent increase in hepatic GSH pool wasassociated with increased resistance to lipid per-oxidation. This beneficial effect against oxidativelipid damage was also observed in the heart andred gastrocnemius skeletal muscle. Lower lipidperoxide levels in certain tissues of lipoate fedrats suggest strengthening of the antioxidantnetwork defence in these tissues (Khanna et al.1997).
From the biochemistry of antioxidant action itis evident that antioxidants function in a networkand interaction between several major antioxi-dants have been clearly evident. As a result,some studies have attempted to investigate theefficacy of a combination of several antioxidantsas supplements (Viguie et al. 1989; Kanter &Eddy 1992; Kanter et al. 1993). Supplementationof individuals with a vitamin mixture containing37.5mg b-carotene, 1250 mg vitamin C and 1000IU of vitamin E for 5 weeks decreased the level oflipid peroxidation by-products in the serum andbreath, both at rest and following exercise at both60% and 90% V
.o 2max. (Kanter et al. 1993). In con-
trast, a previous study, which used a similarmixture of antioxidants and exercised the sub-jects at 65% of maximal heart rate in a downhillrun, was unable to demonstrate any positiveeffects (Kanter & Eddy 1992). This inconsistencyin observation was explained by differences inthe nature and intensity of the exercise in the twostudies. The effects of an antioxidant mixture (10 mg b-carotene, 1000 mg vitamin C and 800IUof vitamin E) on human blood GSH system andmuscle damage has been determined (Viguie etal. 1989). A protective effect on the blood GSHsystem and muscle damage was evident. A ran-domized and placebo-controlled study has been
310 nutrition and exercise
carried out on 24 trained long-distance runnerswho were substituted with a-tocopherol (400 IU ·day–1) and ascorbic acid (200mg daily) for 4.5weeks before a marathon race. Serum content ofascorbic acid as well as a-tocopherol were ele-vated in supplemented individuals. In this studythe antioxidant supplementation protocol wasobserved to significantly protect against exercise-induced muscle damage as manifestedby the loss of creatine kinase from the muscle tothe serum (Rokitzki et al. 1994b).
Perspectives
Several lines of evidence consistently show thatphysical exercise may induce oxidative stress.The relationship between physical activity, physical fitness and total radical trapping antiox-idant potential was examined in the NorthernIreland Health and Activity Survey. This was alarge cross-sectional population study (n =1600)using a two-stage probability sample of the pop-ulation. A necessity for antioxidant supplemen-tation, especially in physically active and fitindividuals, was indicated (Sharpe et al. 1996).Depending on nutritional habits and genetic dis-position, susceptibility to oxidative stress mayvary from person to person. Determination oftissue antioxidant status of individuals is thusrecommended. Such information will be neces-sary to identify specific necessities and formulateeffective antioxidant therapy strategies. Nutri-tional antioxidant supplements are known to be bioavailable to tissues and may strengthendefence systems against the ravages of reactiveoxygen. Results from antioxidant supplementa-tion studies considerably vary depending on thestudy design and measures of outcome. Physicalperformance is regulated by multifactorialprocesses and may not serve as a good indicatorto test the effect of antioxidant supplementation.The general trend of results show no effect ofantioxidant supplementation on physical perfor-mance. However, in a large number of studies ithas been consistently evident that antioxidantsupplementation protects against exercise-induced tissue damage. The diet of laboratory
animals is often heavily enriched with antioxi-dant vitamins, particularly vitamin E. This maybe one reason why antioxidant supplementationto animals fed regular diets do not influenceseveral measures of outcome. At present there is a growing trend among people to cut out fat-containing diet. While this does markedlydecrease caloric intake, in many cases this mayalso contribute to marked decrease in the intakeof fat-soluble essential nutrients, including vita-mins. From available information, we know thatunder regular circumstances antioxidants suchas a-tocopherol, ascorbic acid and b-carotene arewell tolerated and free from toxicity, even whenconsumed at doses several-fold higher than therecommended dietary allowances (Garewal &Diplock 1995). In view of this and the tremen-dous potential of antioxidant therapy, consump-tion of a diet rich in a mixture of differentantioxidants may be expected to be a prudentcourse.
References
Aarsland, A., Lundquist, M., Borretsen, B. & Berge,R.K. (1990) On the effect of peroxisomal beta-oxida-tion and carnitine palmitoyltransferase activity byeicosapentaenoic acid in liver and heart from rats.Lipids 25, 546–548.
Akerlund, B., Jarstrand, C., Lindeke, B., Sonnerborg,A., Akerblad, A.C. & Rasool, O. (1996) Effect of N-acetylcysteine (NAC) treatment on HIV-1 infection: a double-blind placebo-controlled trial. EuropeanJournal of Clinical Pharmacology 50, 457–461.
Alessio, H.M. (1994) Lipid peroxidation processes inhealthy and diseased models. In Exercise and OxygenToxicity (ed. C.K. Sen, L. Packer & O. Hanninen), pp.269–295. Elsevier Science, Amsterdam.
Alessio, H.M. & Cutler, R.G. (1990) Evidence that DNAdamage and repair cycle activity increases followinga marathon race. Medicine and Science in Sports andExercise 25, 218–224.
Alessio, H.M., Goldfarb, A.H., Cao, G. & Cutler, R.G.(1993) Short and long term vit C supplementationexercise and oxygen radical absorption capacity(Abstract). Medicine and Science in Sports and Exercise25, S79.
Amelink, G.J., van der Wal, W.A., Wokke, J.H., vanAsbeck, B.S. & Bar, P.R. (1991) Exercise-inducedmuscle damage in the rat: the effect of vitamin E defi-ciency. Pflugers Archives 419, 304–309.
Ames, B.N., Shigenaga, M.K. & Hagen, T.M. (1993) Oxidants, antioxidants, and the degenerative dis-eases of aging. Proceedings of the National Academy ofScience, USA 90, 7915–7922.
Andersen, H.R. & Andersen, O. (1993) Effects of dietaryalpha-tocopherol and beta-carotene on lipid peroxi-dation induced by methyl mercuric chloride in mice.Pharmacology and Toxicology 73, 192–201.
Archakov, A.I. & Bachmanova, G.I. (eds) (1990)Cytochrome P-450 and Active Oxygen. Taylor andFrancis, London.
Aruoma, O.I., Halliwell, B., Hoey, B.M. & Butler, J.(1989) The antioxidant action of N-acetylcysteine: itsreaction with hydrogen peroxide, hydroxyl radical,superoxide, and hypochlorous acid. Free RadicalBiology and Medicine 6, 593–597.
Ascherio, A., Rimm, E.B., Stampfer, M.J., Giovannucci,E.L. & Willett, W.C. (1995) Dietary intake of marinen-3 fatty acids, fish intake, and the risk of coronarydisease among men [see comments]. New EnglandJournal of Medicine 332, 977–982.
Åstrand, P.-O. & Rodahl, K. (1986) Textbook of WorkPhysiology. McGraw Hill, New York.
Atalay, M., Marnila, P., Lilius, E.M., Hanninen, O. &Sen, C.K. (1996) Glutathione-dependent modulationof exhausting exercise-induced changes in neu-trophil function of rats. European Journal of AppliedPhysiology 74, 342–347.
Atalay, M., Laaksonen, D.E., Niskanen, L., Uusitupa,M., Hanninen, O. & Sen, C.K. (1997) Altered antioxi-dant enzyme defences in insulin-dependent diabeticmen with increased resting and exercise inducedoxidative stress. Acta Physiologica Scandinavica 161,195–201.
Aust, S.D., Morehouse, L.A. & Thomas, C.E. (1985) Roleof metals in oxygen radical reactions. Free RadicalBiology and Medicine 1, 3–25.
Aw, T.Y., Wierzbicka, G. & Jones, D.P. (1991) Oral glutathione increases tissue glutathione in vivo.Chemical and Biological Interactions 80, 89–97.
Balon, T.W. & Nadler, J.L. (1994) Nitric oxide release ispresent from incubated skeletal muscle preparations[see comments]. Journal of Applied Physiology 77,2519–2521.
Bar, P.R. & Amelink, G.J. (1997) Protection againstmuscle damage exerted by oestrogen: hormonal orantioxidant action. Biochemical Society Transactions 25,50–54.
Bendich, A. & Machlin, L.J. (1988) Safety of oral intakeof vitamin E. American Journal of Clinical Nutrition 48,612–619.
Board on Agriculture, Committee on Animal Nutrition(1983) Selenium in Nutrition, revised edn. NationalResearch Council, National Academy of Sciences,Washington, DC.
Borgstrom, L., Kagedal, B. & Paulsen, O. (1986) Phar-
oxidative stress and antioxidant nutrients 311

macokinetics of N-acetylcysteine in man. EuropeanJournal of Clinical Pharmacology 31, 217–222.
Boveris, A., Oshino, N. & Chance, B. (1972) The cellularproduction of hydrogen peroxide. Biochemical Journal128, 617–630.
Brady, P.S., Ku, P.K. & Ullrey, D.E. (1978) Lack of effectof selenium supplementation on the response of theequine erythrocyte glutathione system and plasmaenzymes to exercise. Journal of Animal Science 47,492–496.
Brady, P.S., Brady, L.J. & Ullrey, D.E. (1979) Selenium,vitamin E and the response to swimming stress in therat. Journal of Nutrition 109, 1103–1109.
Buettner, G.R. (1986) Ascorbate autoxidation in thepresence of iron and copper chelates. Free RadicalResearch Communications 1, 349–353.
Burk, R.F., Lawrence, R.A. & Lane, J.M. (1980) Livernecrosis and lipid peroxidation in the rat as the resultof paraquat and diquat administration. Effect of sele-nium deficiency. Journal of Clinical Investigation 65,1024–1031.
Burton, G.W. & Ingold, K.U. (1984) Beta-carotene: anunusual type of lipid antioxidant. Science 224,569–573.
Burton, G.W., Joyce, A. & Ingold, K.U. (1983) Is vitaminE the only lipid-soluble, chain breaking antioxidantin human blood plasma and erythrocyte mem-branes? Archives of Biochemistry and Biophysics 221,281–290.
Cannon, J.G., Orencole, S.F., Fielding, R.A. et al. (1990)Acute phase response in exercise: interaction of ageand vitamin E on neutrophils and muscle enzymerelease. American Journal of Physiology 259(6),R1214–1219.
Cazzulani, P., Cassin, M. & Ceserani, R. (1991)Increased endurance to physical exercise in micegiven oral reduced glutathione GSH. Medical ScienceResearch 19, 543–544.
Chance, B., Sies, H. & Boveris, A. (1979) Hydroperoxidemetabolism in mammalian organs. Physiology Review59, 527–605.
Cho, E.S., Sahyoun, N. & Stegink, L.D. (1981) Tissueglutathione as a cyst(e)ine reservoir during fastingand refeeding of rats. Journal of Nutrition 111,914–922.
Clark, R.F., Strukle, E., Williams, S.R. & Manoguerra,A.S. (1996) Selenium poisoning from a nutritionalsupplement [letter]. Journal of the American MedicalAssociation 275, 1087–1088.
Corrigan, J.J. Jr (1979) Coagulation problems relating tovitamin E. American Journal of Pediatric Hematologyand Oncology 1, 169–173.
Criswell, D., Powers, S., Dodd, S. et al. (1993) Highintensity training-induced changes in skeletalmuscle antioxidant enzyme activity. Medicine andScience in Sports and Exercise 25, 1135–1140.
312 nutrition and exercise
Davies, K.J.A. & Ursini, F. (eds) (1995) The OxygenParadox. CLEUP University Press, Padua.
Davies, K.J., Quintanilha, A.T., Brooks, G.A. & Packer,L. (1982) Free radicals and tissue damage producedby exercise. Biochemical and Biophysical Research Communications 107, 1198–1205.
Dekkers, J.C., van Doornen, L.J. & Kemper, H.C. (1996)The role of antioxidant vitamins and enzymes in theprevention of exercise-induced muscle damage.Sports Medicine 21, 213–238.
DeLeve, L.D. & Kaplowitz, N. (1990) Importance andregulation of hepatic glutathione. Seminars in LiverDisease 10, 251–266.
Demoz, A., Willumsen, N. & Berge, R.K. (1992) Eicos-apentaenoic acid at hypotriglyceridemic doseenhances the hepatic antioxidant defense in mice.Lipids 27, 968–971.
Demoz, A., Asiedu, D.K., Lie, O. & Berge, R.K. (1994)Modulation of plasma and hepatic oxidative statusand changes in plasma lipid profile by n-3 (EPA andDHA), n-6 (corn oil) and a 3-thia fatty acid in rats.Biochimica Biophysica Acta 1199, 238–244.
Dillard, C.J., Dumelin, E.E. & Tappel, A.L. (1977) Effectof dietary vitamin E on expiration of pentane andethane by the rat. Lipids 12, 109–114.
Dillard, C.J., Litov, R.E., Savin, W.M., Dumelin, E.E. &Tappel, A.L. (1978) Effects of exercise, vitamin E, andozone on pulmonary function and lipid peroxida-tion. Journal of Applied Physiology 45, 927–932.
Duthie, G.G. & Arthur, J.R. (1994) Cigarette smoking asan inducer of oxidative stress. In Exercise and OxygenToxicity (eds C.K. Sen, L. Packer & O. Hanninen), pp.297–317. Elsevier Science, Amsterdam.
Edmonds, S.E. & Blake, D.R. (1994) Hypoxia, oxidativestress, and exercise in rheumatoid arthritis. In Exer-cise and Oxygen Toxicity (eds C.K. Sen, L. Packer & O. Hanninen), pp. 398–422. Elsevier Science,Amsterdam.
Ferrari, G., Yan, C.Y. & Greene, L.A. (1995) N-acetylcysteine (D- and L-stereoisomers) preventsapoptotic death of neuronal cells. Journal of Neuro-science 15, 2857–2866.
Floyd, R.A. (1995) Measurement of oxidative stress invivo. In The Oxygen Paradox (ed. K.J.A. Davies & F.Ursini), pp. 89–103. CLEUP University Press, Padua.
Frandsen, U., Lopez-Figueroa, M. & Hellsten, Y. (1996)Localization of nitric oxide synthase in human skele-tal muscle. Biochemical and Biophysical Research Communications 227, 88–93.
Garewal, H.S. & Diplock, A.T. (1995) How ‘safe’ areantioxidant vitamins? Drug Safety 13, 8–14.
Gohil, K., Henderson, S., Terblanche, S.E., Brooks, G.A.& Packer, L. (1984) Effects of training and exhaustiveexercise on the mitochondrial oxidative capacity ofbrown adipose tissue. Bioscience Reports 4, 987–993.
Gohil, K., Packer, L., de Lumen, B., Brooks, G.A. &

Terblanche, S.E. (1986) Vitamin E deficiency andvitamin C supplements: exercise and mitochondrialoxidation. Journal of Applied Physiology 60, 1986–1991.
Gohil, K., Viguie, C., Stanley, W.C., Brooks, G.A. &Packer, L. (1988) Blood glutathione oxidation duringhuman exercise. Journal of Applied Physiology 64,115–119.
Goldfarb, A. & Sen, C.K. (1994) Antioxidant supple-mentation and the control of oxygen toxicity duringexercise. In Exercise and Oxygen Toxicity (ed. C.K. Sen,L. Packer & O. Hanninen), pp. 163–189. ElsevierScience, Amsterdam.
Goldfarb, A.H., Todd, M.K., Boyer, B.T., Alessio, H.M.& Cutler, R.G. (1989) Effect of vitamin E on lipid per-oxidation to 80% maximum oxygen consumption(Abstract). Medicine and Science in Sports and Exercise21, S16.
Goldfarb, A.H., McIntosh, M.K. & Boyer, B.T. (1993)Effects of vitamin E DHEA and exercise on heartoxidative stress. Medicine and Science in Sports andExercise 25, S129.
Goldfarb, A.H., McIntosh, M.K., Boyer, B.T. & Fatouros,J. (1994) Vitamin E effects on indexes of lipid peroxi-dation in muscle from DHEA-treated and exercisedrats. Journal of Applied Physiology 76, 1630–1635.
Goldfarb, A.H., McIntosh, M.K. & Boyer, B.T. (1996)Vitamin E attenuates myocardial oxidative stressinduced by DHEA in rested and exercised rats.Journal of Applied Physiology 80, 486–490.
Hagen, T.M., Wierzbicka, G.T., Bowman, B.B., Aw, T.Y.& Jones, D.P. (1990) Fate of dietary glutathione: dis-position in the gastrointestinal tract. American Journalof Physiology 259, G530–535.
Han, D., Handelman, G., Marcocci, L. et al. (1997)Lipoic acid increases de novo synthesis of cellularglutathione by improving cysteine utilization. Bio-factors 6, 321–338.
Handelman, G.J. (1996) Carotenoids as scavengers ofactive oxygen species. In Handbook of Antioxidants(ed. E. Cadenas & L. Packer), pp. 259–314. MarcelDekker, New York.
Handelman, G.J., van Kuijk, F.J., Chatterjee, A. &Krinsky, N.I. (1991) Characterization of productsformed during the autoxidation of beta-carotene.Free Radical Biology Medicine 10, 427–437.
Handelman, G.J., Han, D., Tritschler, H. & Packer, L.(1994) Alpha-lipoic acid reduction by mammaliancells to the dithiol form, and release into the culturemedium. Biochemical Pharmacology 47, 1725–1730.
Hartmann, A., Niess, A.M., Grunert-Fuchs, M., Poch, B.& Speit, G. (1995) Vitamin E prevents exercise-induced DNA damage. Mutation Research 346, 195–202.
Hayes, J.D. & Pulford, D.J. (1995) The glutathione S-transferase supergene family: regulation of GST andthe contribution of the isoenzymes to cancer chemo-
protection and drug resistance. Critical Reviews inBiochemical and Molecular Biology 30, 445–600.
Hellsten, Y. (1994) The role of xanthine oxidase in exer-cise. In Exercise and Oxygen Toxicity (ed. C.K. Sen, L. Packer & O. Hanninen), pp. 211–234. ElsevierScience, Amsterdam.
Hellsten, Y., Apple, F.S. & Sjodin, B. (1996) Effect ofsprint cycle training on activities of antioxidantenzymes in human skeletal muscle. Journal of AppliedPhysiology 81, 1484–1487.
Holdiness, M.R. (1991) Clinical pharmacokinetics of N-acetylcysteine. Clinical Pharmacokinetics 20, 123–134.
Hu, M.L., Frankel, E.N., Leibovitz, B.E. & Tappel, A.L.(1989) Effect of dietary lipids and vitamin E on invitro lipid peroxidation in rat liver and kidneyhomogenates. Journal of Nutrition 119, 1574–1582.
Huupponen, M.R., Makinen, L.H., Hyvonen, P.M., Sen,C.K., Rankinen, T., Vaisanen, S. & Rauramaa, R.(1995) The effect of N-acetylcysteine on exercise-induced priming of human neutrophils: a chemilu-minescence study. International Journal of SportsMedicine 16, 399–403.
International Programme of Chemical Safety (1987)Selenium. World Health Organization, Geneva.
Issels, R.D., Nagele, A., Eckert, K.G. & Wilmanns, W.(1988) Promotion of cystine uptake and its utilizationfor glutathione biosynthesis induced by cysteamineand N-acetylcysteine. Biochemical Pharmacology 37,881–888.
Jackson, M.J. (1987) Muscle damage during exercise:possible role of free radicals and protective effect ofvitamin E. Proceedings of the Nutrition Society 46,77–80.
Jackson, M.J., Jones, D.A. & Edwards, R.H.T. (1983)Biology of vitamin E. In Biology of Vitamin E: Proceed-ings of a Ciba Foundation Symposium (ed. R. Porter & J.Wheelan), pp. 224–239. Pitman Medical, London.
Jenkins, R.R. & Halliwell, B. (1994) Metal bindingagents: possible role in exercise. In Exercise andOxygen Toxicity (ed. C.K. Sen, L. Packer & O. Hanninen), pp. 59–76. Elsevier Science, Amster-dam.
Jenkins, R.R., Friedland, R. & Howald, H. (1984) Therelationship of oxygen uptake to superoxide dismu-tase and catalase activity in human skeletal muscle.International Journal of Sports Medicine 5, 11–14.
Ji, L.L. (1994) Exercise induced oxidative stress in heart.In Exercise and Oxygen Toxicity (ed. C.K. Sen, L.Packer & O. Hanninen), pp. 249–267. ElsevierScience, Amsterdam.
Ji, L.L., Stratman, F.W. & Lardy, H.A. (1988) Antioxi-dant enzyme systems in rat liver and skeletal muscle:influences of selenium deficiency, chronic training,and acute exercise. Archives of Biochemistry and Biophysics 263, 150–160.
Jungersten, L., Ambring, A., Wall, B. & Wennmalm, A.
oxidative stress and antioxidant nutrients 313

(1997) Both physical fitness and acute exercise regu-late nitric oxide formation in healthy humans.Journal of Applied Physiology 82, 760–764.
Kagan, V., Nohl, H. & Quinn, P.J. (1996) Coenzyme Q:its role in scavenging and generation of radicals inmembranes. In Handbook of Antioxidants (ed.C. Cadenas & L. Packer), pp. 157–201. MarcelDekker, New York.
Kanter, M.M. & Eddy, D.E. (1992) Effects of antioxidantsupplementation on serum markers of lipid peroxi-dation and skeletal muscle damage following eccen-tric exercise. Medicine and Science in Sports and Exercise 24, S17.
Kanter, M.M., Nolte, L.A. & Holloszy, J.O. (1993) Effectsof an antioxidant vitamin mixture on lipid peroxida-tion at rest and postexercise. Journal of Applied Physiology 74, 965–969.
Kellogg, E.W. III & Fridovich, I. (1975) Superoxide,hydrogen peroxide, and singlet oxygen in lipid per-oxidation by a xanthine oxidase system. Journal ofBiological Chemistry 250, 8812–8817.
Keul, J., Doll, E. & Koppler, D. (1972) Energy Metabolismand Human Muscle. S. Karger, Basel.
Khaira, H.S., Maxwell, S.R. & Shearman, C.P. (1995)Antioxidant consumption during exercise in inter-mittent claudication. British Journal of Surgery 82,1660–1662.
Khanna, S., Atalay, M., Laaksonen, D.E. et al. (1997)Tissue glutathione homeostasis in response tolipoate supplementation and exercise. Paper pre-sented at the Annual Meeting of the Oxygen Club ofCalifornia, Santa Barbara, CA, 27 February–1 March.
Khawli, F.A. & Reid, M.B. (1994) N-acetylcysteinedepresses contractile function and inhibits fatigue ofdiaphragm in vitro. Journal of Applied Physiology 77,317–324.
Kim, J.D., McCarter, R.J. & Yu, B.P. (1996a) Influence ofage, exercise, and dietary restriction on oxidativestress in rats. Aging (Milano) 8, 123–129.
Kim, J.D., Yu, B.P., McCarter, R.J., Lee, S.Y. & Herlihy,J.T. (1996b) Exercise and diet modulate cardiac lipidperoxidation and antioxidant defenses. Free RadicalBiological Medicine 20, 83–88.
Kondo, H. & Itokawa, Y. (1994) Oxidative stress in mus-cular atrophy. In Exercise and Oxygen Toxicity (ed.C.K. Sen, L. Packer & O. Hanninen), pp. 319–342.Elsevier Science, Amsterdam.
Kromhout, D., Bosschieter, E.B. & de Lezenne Coulander, C. (1985) The inverse relation betweenfish consumption and 20-year mortality from coro-nary heart disease. New England Journal of Medicine312, 1205–1209.
Kumar, C.T., Reddy, V.K., Prasad, M., Thyagaraju, K. &Reddanna, P. (1992) Dietary supplementation ofvitamin E protects heart tissue from exercise-induced oxidant stress. Molecular and Cellular Biochemistry 111, 109–115.
314 nutrition and exercise
Laaksonen, D.E., Atalay, M., Niskanen, L., Uusitupa,M., Hanninen, O. & Sen, C.K. (1996) Increasedresting and exercise-induced oxidative stress inyoung IDDM men. Diabetes Care 19, 569–574.
Laaksonen, R., Fogelholm, M., Himberg, J.J., Laakso, J.& Salorinne, Y. (1995) Ubiquinone supplementationand exercise capacity in trained young and oldermen. European Journal of Applied Physiology 72,95–100.
Lauterburg, B.H., Adams, J.D. & Mitchell, J.R. (1984)Hepatic glutathione homeostasis in the rat: effluxaccounts for glutathione turnover. Hepatology 4,586–590.
Lawrence, J.D., Bower, R.C., Riehl, W.P. & Smith, J.L.(1975) Effects of alpha-tocopherol acetate on theswimming endurance of trained swimmers. American Journal of Clinical Nutrition 28, 205–208.
Leeuwenburgh, C. & Ji, L.L. (1995) Glutathione deple-tion in rested and exercised mice: biochemical conse-quence and adaptation. Archives of Biochemistry andBiophysics 316, 941–949.
Leeuwenburgh, C. & Ji, L.L. (1996) Alteration of glu-tathione and antioxidant status with exercise inunfed and refed rats. Journal of Nutrition 126,1833–1843.
Leibovitz, B.E., Hu, M.L. & Tappel, A.L. (1990) Lipidperoxidation in rat tissue slices: effect of dietaryvitamin E, corn oil-lard and menhaden oil. Lipids 25,125–129.
Levine, R.L. & Stadtman, E.R. (1996) Protein modifica-tions with aging. In Handbook of the Biology of Aging(ed. E.L. Schneider & J.W. Rowe), pp. 184–197. Academic Press, San Diego.
Lodge, L., Handelman, G.J., Konishi, T., Matsugo, S.,Mathur, V.V. & Packer, L. (1997) Natural sources oflipoic acid: determination of lipoyllysine releasedfrom protease-digested tissues by high performaneliquid chromatography incorporating electrochemi-cal detection. Journal of Applied Nutrition 49, 3–11.
Luhtala, T.A., Roecker, E.B., Pugh, T., Feuers, R.J. &Weindruch, R. (1994) Dietary restriction attenuatesage-related increases in rat skeletal muscle antioxi-dant enzyme activities. Journal of Gerontology 49,B231–238.
McIntosh, M.K., Goldfarb, A.H., Cote, P.S. & Griffin, K.(1993a) Vitamin E reduces peroxisomal fatty acid oxidation and indicators of oxidative stress inuntrained exercised rats treated with dehy-droepiandrosterone DHEA. Journal of Nutritional Bio-chemistry 4, 298–303.
McIntosh, M.K., Goldfarb, A.H., Curtis, L.N. & Cote,P.S. (1993b) Vitamin E alters hepatic antioxidantenzymes in rats treated with dehydroepiandros-terone (DHEA). Journal of Nutrition 123, 216–224.
Martensson, J., Jain, A. & Meister, A. (1990) Glutathioneis required for intestinal function. Proceedings of theNational Academy of Science, USA 87, 1715–1719.

Meister, A. (1991) Glutathione deficiency produced byinhibition of its synthesis, and its reversal: applica-tions in research and therapy. Pharmacology Therapy51, 155–194.
Meister, A. (1992a) Biosynthesis and functions of glu-tathione, an essential biofactor. Journal of NutritionScience and Vitaminology (Tokyo), Special No., 1–6.
Meister, A. (1992b) On the antioxidant effects of ascor-bic acid and glutathione. Biochemical Pharmacology44, 1905–1915.
Meister, A. (1995) Glutathione metabolism. Methods inEnzymology 251, 3–7.
Meydani, M., Evans, W.J., Handelman, G. et al. (1993)Protective effect of vitamin E on exercise-inducedoxidative damage in young and older adults. American Journal of Physiology 264, R992–998.
Mills, P.C., Smith, N.C., Casas, I., Harris, P., Harris, R.C.& Marlin, D.J. (1996) Effects of exercise intensity andenvironmental stress on indices of oxidative stressand iron homeostasis during exercise in the horse.European Journal of Applied Physiology 74, 60–66.
Moller, P., Wallin, H. & Knudsen, L.E. (1996) Oxidativestress associated with exercise, psychological stressand life-style factors. Chemical and Biological Interac-tions 102, 17–36.
Nadiger, H.A., Marcus, S.R., Chandrakala, M.V. &Kulkarni, D.D. (1986) Malonyl dialdehyde levels indifferent organs of rats subjected to acute alcohol tox-icity. Indian Journal of Clinical Biochemistry 1, 133–136.
Nadiger, H.A., Marcus, S.R. & Chandrakala, M.V.(1988) Lipid peroxidation and ethanol toxicity in rat-brain: effect of viatmin E deficiency and supplemen-tation. Medical Science Research 16, 1273–1274.
Nalbone, G., Leonardi, J., Termine, E. et al. (1989) Effectsof fish oil, corn oil and lard diets on lipid peroxida-tion status and glutathione peroxidase activities inrat heart. Lipids 24, 179–186.
Novelli, G.P., Braccitiotti, G. & Falsini, S. (1990) Spin-trappers and vitamin E prolong endurance to musclefatigue in mice. Free Radical Biology and Medicine 8,9–13.
Novelli, G.P., Falsini, S. & Bracciotti, G. (1991) Exoge-nous glutathione increases endurance to muscleeffort in mice. Pharmacological Research 23, 149–156.
Ohno, H., Suzuki, K., Fujii, J. et al. (1994) Superoxidedismutases in exercise and disease. In Exercise and Oxygen Toxicity (ed. C.K. Sen, L. Packer & O. Hanninen), pp. 127–161. Elsevier Science, Amsterdam.
Packer, L. & Reznick, A.Z. (1992) Significance ofvitamin E for the athlete. In Vitamin E in Health andDisease (ed. J. Fuchs & L. Packer), pp. 465–471. MarcelDekker, New York.
Packer, L., Gohil, K., deLumen, B. & Terblanche, S.E.(1986) A comparative study on the effects of ascorbicacid deficiency and supplementation on enduranceand mitochondrial oxidative capacities in various
tissues of the guinea pig. Comparative Biochemistryand Physiology B 83, 235–240.
Packer, L., Witt, E.H. & Tritschler, H.J. (1995) alpha-Lipoic acid as a biological antioxidant. Free RadicalBiology and Medicine 19, 227–250.
Packer, L., Roy, S. & Sen, C.K. (1997) Alpha-lipoic acid:a metabolic antioxidant and potential redox modula-tor of transcription. Advances in Pharmacology 38,79–101.
Paffenbarger, R.S. Jr, Hyde, R.T., Wing, A.L. & Steinmetz, C.H. (1984) A natural history of athleti-cism and cardiovascular health. Journal of the Ameri-can Medical Association 252, 491–495.
Pincemail, J., Deby, C., Camus, G. et al. (1988)Tocopherol mobilization during intensive exercise.European Journal of Applied Physiology 57, 189–191.
Poulsen, H.E., Loft, S. & Vistisen, K. (1996) Extremeexercise and oxidative DNA modification. Journal ofSports Science 14, 343–346.
Powers, S.K. & Criswell, D. (1996) Adaptive strategiesof respiratory muscles in response to enduranceexercise. Medicine and Science in Sports and Exercise 28,1115–1122.
Quintanilha, A.T. & Packer, L. (1983) Vitamin E, physi-cal exercise and tissue oxidative damage. Ciba Foun-dation Symposia 101, 56–69.
Quintanilha, A.T., Packer, L., Davies, J.M., Racanelli,T.L. & Davies, K.J. (1982) Membrane effects ofvitamin E deficiency: bioenergetic and surfacecharge density studies of skeletal muscle and livermitochondria. Annals of the NY Academy of Science393, 32–47.
Rajguru, S.U., Yeargans, G.S. & Seidler, N.W. (1994)Exercise causes oxidative damage to rat skeletalmuscle microsomes while increasing cellularsulfhydryls. Life Sciences 54, 149–157.
Reid, M.B., Stokic, D.S., Koch, S.M., Khawli, F.A. & Leis,A.A. (1994) N-acetylcysteine inhibits muscle fatiguein humans. Journal of Clinical Investigations 94,2468–2474.
Reznick, A.Z., Witt, E., Matsumoto, M. & Packer, L.(1992) Vitamin E inhibits protein oxidation in skele-tal muscle of resting and exercised rats. Biochemicaland Biophysical Research Communications 189, 801–806.
Robinson, D.M., Ogilvie, R.W., Tullson, P.C. & Terjung,R.L. (1994) Increased peak oxygen consumption oftrained muscle requires increased electron fluxcapacity. Journal of Applied Physiology 77, 1941–1952.
Rokitzki, L., Logemann, E., Huber, G., Keck, E. & Keul,J. (1994a) alpha-Tocopherol supplementation inracing cyclists during extreme endurance training[see comments]. International Journal of Sport Nutri-tion 4, 253–264.
Rokitzki, L., Logemann, E., Sagredos, A.N., Murphy,M., Wetzel-Roth, W. & Keul, J. (1994b) Lipid peroxi-dation and antioxidative vitamins under extreme
oxidative stress and antioxidant nutrients 315

endurance stress. Acta Physiologica Scandinavica 151,149–158.
Rotruck, J.T., Pope, A.L., Ganther, H.E., Swanson, A.B.,Hafeman, D.G. & Hoekstra, W.G. (1973) Selenium:biochemical role as a component of glutathione per-oxidase. Science 179, 588–590.
Roy, S. & Hanninen, O. (1993) Biochemical monitoringof the aquatic environment: possibilities and limitations. In Ecotoxicology Monitoring (ed. M.Richardson), pp. 119–135. VCH Publishers, London.
Salminen, A., Kainulainen, H., Arstila, A.U. & Vihko, V.(1984) Vitamin E deficiency and the susceptibility tolipid peroxidation of mouse cardiac and skeletalmuscles. Acta Physiologica Scandinavica 122, 565–570.
Schmidt, E.B. & Dyerberg, J. (1994) Omega-3 fattyacids: current status in cardiovascular medicine.Drugs 47, 405–424.
Schwarz, K. & Foltz, C.M. (1957) Selenium as an inte-gral part of factor 3 against dietary necrotic liverdegeneration. Journal of the American Chemical Society79, 3292–3293.
Sen, C.K. (1995) Oxidants and antioxidants in exercise.Journal of Applied Physiology 79, 675–686.
Sen, C.K. & Hanninen, O. (1994) Physiological antioxi-dants. In Exercise and Oxygen Toxicity (ed. C.K. Sen, L.Packer & O. Hanninen), pp. 89–126. Elsevier Science,Amsterdam.
Sen, C.K. & Packer, L. (1996) Antioxidant and redoxregulation of gene transcription. Faseb Journal 10,709–720.
Sen, C.K. & Packer, L. (1999) Thiol homeostasis andsupplementation in physical exercise. AmericanJournal of Clinical Nutrition, in press.
Sen, C.K., Marin, E., Kretzschmar, M. & Hanninen, O.(1992) Skeletal muscle and liver glutathione home-ostasis in response to training, exercise, and immobi-lization. Journal of Applied Physiology 73, 1265–1272.
Sen, C.K., Rahkila, P. & Hanninen, O. (1993) Glutathione metabolism in skeletal muscle derivedcells of the L6 line. Acta Physiologica Scandinavica 148,21–26.
Sen, C.K., Atalay, M. & Hanninen, O. (1994a) Exercise-induced oxidative stress: glutathione supplementa-tion and deficiency. Journal of Applied Physiology 77,2177–2187.
Sen, C.K., Ookawara, T., Suzuki, K., Taniguchi, N.,Hanninen, O. & Ohno, H. (1994b) Immunoreactivityand activity of mitochondrial superoxide dismutasefollowing training and exercise. Pathophysiology 1,165–168.
Sen, C.K., Packer, L. & Hanninen, O. (eds) (1994c) Exercise and Oxygen Toxicity. Elsevier Science, Amsterdam.
Sen, C.K., Rankinen, T., Vaisanen, S. & Rauramaa, R.(1994d) Oxidative stress after human exercise: effectof N-acetylcysteine supplementation [published
316 nutrition and exercise
erratum appears in Journal of Applied Physiology 1994Nov; 77 (5): following table of contents and 1994 Dec;77 (6): following volume table of contents]. Journal ofApplied Physiology 76, 2570–2577.
Sen, C.K., Kolosova, I., Hanninen, O. & Orlov, S.N.(1995) Inward potassium transport systems in skele-tal muscle derived cells are highly sensitive tooxidant exposure. Free Radical Biology and Medicine18, 795–800.
Sen, C.K., Atalay, M., Agren, J., Laaksonen, D.E., Roy, S.& Hanninen, O. (1997a) Fish oil and vitamin E supplementation in oxidative stress at rest and afterphysical exercise. Journal of Applied Physiology 83,189–195.
Sen, C.K., Roy, S., Han, D. & Packer, L. (1997b) Regula-tion of cellular thiols in human lymphocytes byalpha-lipoic acid: a flow cytometric analysis. FreeRadical Biology and Medicine 22, 1241–1257.
Sen, C.K., Roy, S. & Packer, L. (1997c) Therapeuticpotential of the antioxidant and redox properties ofalpha-lipoic acid. In Oxidative Stress Cancer, AIDS andNeurodegenerative Diseases (ed. L. Montagnier, R. Olivier & C. Pasquier), pp. 251–267. MarcelDekker Inc., New York.
Sharman, I.M., Down, M.G. & Norgan, N.G. (1976) Theeffects of vitamin E on physiological function andathletic performance of trained swimmers. Journal ofSports Medicine and Physical Fitness 16, 215–225.
Sharpe, P.C., Duly, E.B., MacAuley, D. et al. (1996) Totalradical trapping antioxidant potential (TRAP) andexercise. Quarterly Journal of Medicine 89, 223–228.
Sheppard, A.J., Pennington, J.A.T. & Weihrauch, J.L.(1993) Analysis and distribution of vitamin E in veg-etable oils and foods. In Vitamin E in Health andDisease (ed. L. Packer & J. Fuchs), pp. 9–31. MarcelDekker, New York.
Shimomura, Y., Suzuki, M., Sugiyama, S., Hanaki, Y. &Ozawa, T. (1991) Protective effect of coenzyme Q10on exercise-induced muscular injury. Biochemical andBiophysical Research Communications 176, 349–355.
Sies, H. (1974) Biochemistry of the peroxisome in livercell. Angewandte Chemie (International Edition) 13,706–718.
Sies, H. (1997) Antioxidants in Disease Mechanisms andTherapeutic Strategies. Academic Press, San Diego,CA.
Simon-Schnass, I. (1994) Risk of oxidative stress duringexercise at high altitude. In Exercise and Oxygen Toxic-ity (ed. C.K. Sen, L. Packer & O. Hanninen), pp.191–210. Elsevier Science, Amsterdam.
Singal, P.K. & Kirshenbaum, L.A. (1990) A relativedeficit in antioxidant reserve may contribute in car-diac failure. Canadian Journal of Cardiology 6, 47–49.
Singh, V.N. (1992) A current perspective on nutritionand exercise. Journal of Nutrition 122, 760–765.
Sjödin, K., Nilsson, E., Hallberg, A. & Tunek, A. (1989)

Metabolism of N-acetyl-l-cysteine: some structuralrequirements for the deacetylation and conse-quences for the oral bioavailability. BiochemicalPharmacology 38, 3981–3985.
Smith, J.A., Telford, R.D., Mason, I.B. & Weidemann,M.J. (1990) Exercise training and neutrophil mcrobi-cidal activity. International Journal of Sports Medicine11, 179–187.
Snider, I.P., Bazzarre, T.L., Murdoch, S.D. & Goldfarb,A. (1992) Effects of coenzyme athletic performancesystem as an ergogenic aid on endurance perfor-mance to exhaustion. International Journal of SportNutrition 2, 272–286.
Sohal, R.S., Ku, H.H., Agarwal, S., Forster, M.J. & Lal,H. (1994) Oxidative damage, mitochondrial oxidantgeneration and antioxidant defenses during agingand in response to food restriction in the mouse.Mechanisms of Ageing and Development 74, 121–133.
Sumida, S., Tanaka, K., Kitao, H. & Nakadomo, F. (1989)Exercise-induced lipid peroxidation and leakage ofenzymes before and after vitamin E supplementa-tion. International Journal of Biochemistry 21, 835–838.
Taylor, A., Jahngen-Hodge, J., Smith, D.E. et al. (1995)Dietary restriction delays cataract and reduces ascor-bate levels in Emory mice. Experiments in Eye Research61, 55–62.
Tessier, F., Margaritis, I., Richard, M.J., Moynot, C. &Marconnet, P. (1995) Selenium and training effects onthe glutathione system and aerobic performance.Medicine and Science in Sports and Exercise 27, 390–396.
Thomas, J.P., Maiorino, M., Ursini, F. & Girotti, A.W.(1990) Protective action of phospholipid hydroper-oxide glutathione peroxidase against membrane-damaging lipid peroxidation: in situ reduction ofphospholipid and cholesterol hydroperoxides.Journal of Biological Chemistry 265, 454–461.
Tiidus, P.M., Behrens, W.A., Madere, R., Kim, J.J. &Houston, M.E. (1993) Effect of vitamin E status andexercise training on tissue lipid peroxidation basedon two methods of assessment. Nutritional Research13, 219–224.
Traber, M.G. & Sies, H. (1996) Vitamin E in humans:demand and delivery. Annual Review of Nutrition 16,321–347.
van Zandwijk, N. (1995) N-acetylcysteine (NAC) andglutathione (GSH): antioxidant and chemopreven-tive properties, with special reference to lung cancer.Journal of Cell Biochemistry 22 (Suppl.), 24–32.
Vasankari, T., Kujala, U., Heinonen, O., Kapanen, J. &Ahotupa, M. (1995) Measurement of serum lipid peroxidation during exercise using three differentmethods: diene conjugation, thiobarbituric acid reac-
tive material and fluorescent chromolipids. ClinicaChimica Acta 234, 63–69.
Venditti, P. & Di Meo, S. (1996) Antioxidants, tissuedamage, and endurance in trained and untrainedyoung male rats. Archives of Biochemical Biophysics331, 63–68.
Videla, L.A. & Valenzuela, A. (1982) Alcohol ingestion,liver glutathione and lipoperoxidation: metabolicinterrelations and pathological implications. LifeScience 31, 2395–2407.
Viguie, C.A., Packer, L. & Brooks, G.A. (1989) Antioxi-dant supplementation affects indices of muscletrauma and oxidant stress in human blood duringexercise. Medicine and Science in Sports and Exercise 21,S16.
Viguie, C.A., Frei, B., Shigenaga, M.K., Ames, B.N.,Packer, L. & Brooks, G.A. (1993) Antioxidant statusand indexes of oxidative stress during consecutivedays of exercise. Journal of Applied Physiology 75,566–572.
Vina, J., Perez, C., Furukawa, T., Palacin, M. & Vina, J.R.(1989) Effect of oral glutathione on hepatic glutathione levels in rats and mice. British Journal ofNutrition 62, 683–691.
Vina, J., Sastre, J., Asensi, M. & Packer, L. (1995) Assayof blood glutathione oxidation during physical exer-cise. Methods in Enzymology 251, 237–243.
Ward, P.A. (1991) Mechanisms of endothelial cellkilling by H2O2 or products of activated neutrophils.American Journal of Medicine 91, 89S–94S.
Warren, J.A., Jenkins, R.R., Packer, L., Witt, E.H. & Armstrong, R.B. (1992) Elevated muscle vitamin Edoes not attenuate eccentric exercise-induced muscleinjury. Journal of Applied Physiology 72, 2168–2175.
Watanabe, H. & Bannai, S. (1987) Induction of cystinetransport activity in mouse peritoneal macrophages.Journal of Experimental Medicine 165, 628–640.
Watt, T., Romet, T.T., McFarlane, I., McGuey, D., Allen,C. & Goode, R.C. (1974) Vitamin E and oxygen con-sumption (Letter). Lancet 2, 354–355.
Weiss, S.J. (1989) Tissue destruction by neutrophils [seecomments]. New England Journal of Medicine 320,365–376.
Wolbarsht, M.L. & Fridovich, I. (1989) Hyperoxiaduring reperfusion is a factor in reperfusion injury[see comments]. Free Radical Biology Medicine 6,61–62.
Zuliani, U., Bonetti, A., Campana, M., Cerioli, G.,Solito, F. & Novarini, A. (1989) The influence ofubiquinone (Co Q10) on the metabolic response towork. Journal of Sports Medicine and Physical Fitness29, 57–62.
oxidative stress and antioxidant nutrients 317

Introduction
Calcium is a micronutrient with great impor-tance to many cellular events in different tissuesin the body, as well as forming the major struc-tural component of bone. Athletes are often con-cerned that their normal diet will not providesufficient micronutrients, and the need for anadequate dietary intake of calcium is as much aconcern for athletes as it is for the general popu-lation. Augmentation of the diet with specificcalcium supplements and with calcium-enrichedfoods is common practice among athletes andnon-athletes alike, but there is limited informa-tion as to whether the need for calcium isincreased by physical activity, and whether suchsupplementation is warranted.
The US Surgeon General’s Report (1988) statesthat ‘inadequate dietary calcium consumption inthe first three to four decades of life may be asso-ciated with increased risk for osteoporosis inlater life due to a low peak bone mass’. Osteo-porosis is a chronic disease characterized by aprogressive loss of bone mass: it affects womenmore than men, partly because of the role playedby a falling oestrogen level after the menopause.Bone loss is widely accepted as a normal part ofthe ageing process, and occurs at a rate of about0.5–1.0% per annum after the age of 40 (Cohn et al. 1976): by age 90, one third of women andone sixth of men will have suffered hip fracturesas a consequence. However, a number of nutri-tional and lifestyle factors have a major impacton the rate of mineral loss from the skeleton:
these factors can be important in slowing this process, and thus in delaying the point atwhich the bone mineral density becomes so lowthat the fracture threshold is easily exceeded.Other important factors reported to be associatedwith the maintenance of bone health are an adequate level of physical activity and avoidanceor cessation of cigarette smoking and excessalcohol intake. However, while there is a clearrole for physical activity in maintaining bonemass, very high levels of exercise in women havebeen associated with some degree of bone loss(Drinkwater et al. 1990), so there are clearly anumber of issues of importance for women, and perhaps also to a lesser extent for men,involved in sports where high training loads areinvolved.
Roles of calcium in the body
Calcium is an essential nutrient and a major com-ponent of mineralized tissue and is the mineralfound in the largest quantity in the body, repre-senting about 1.5–2% of body mass in theaverage adult: for men, total body calciumcontent is about 1000–1100 g, and for women,about 800g (Cohn et al. 1976). Approximately99% of the total body calcium is located in thebones. The remaining 1% is accounted for by thecalcium found in the blood, muscle and nervoustissue where calcium is necessary for blood coag-ulation, muscle contraction and nerve conduc-tion: although the amounts are small, the role ofcalcium is crucial for normal functioning.
Chapter 23
Minerals: Calcium
KARIN PIEHL AULIN
318

Bone matrix is a mixture of tough fibres (madeof type I collagen), which resist pulling forces,and solid particles (calcium phosphate as hy-droxyapatite crystals), which resist compression.Bone is by no means a permanent and immutabletissue. There is a continuous turnover andremodelling of the matrix with a concomitantrelease and uptake of calcium: the cells involvedin bone breakdown are osteoclasts, while theosteoblasts are involved in bone formation. Theregulators of calcium metabolism in bone tissueare two hormones, parathyroid hormone (PTH)and calcitonin. Excess PTH results in a rise in theblood calcium with a corresponding fall in thecalcium content of the bones, and a loss ofcalcium from the body by increased excretion inthe urine. PTH, and exposure to sunlight, alsostimulates the formation of the active form ofvitamin D, which governs the absorption ofcalcium from the small intestine. The ability toregulate the uptake of calcium is important, anddifferences in bone mineral density can bedemonstrated in response to exercise, evenbetween groups with the same dietary calciumintake. Calcitonin is released when plasmacalcium increases and stimulates bone forma-tion. Calcium is excreted by the large intestineand, to a lesser extent, by the kidney and by thedermis.
In the overall function of skeletal muscle,calcium plays two essential regulatory roles.First, calcium is the link between excitation andcontraction. The concentration of free calcium inthe cytosol is low (about 10–8 m) in resting muscle(Martonosi & Beeler 1983), whereas its con-centration in the extracellular fluid and in theendoplasmic reticulum (ER) is high. Calcium isinvolved in a series of events which converts theelectrical signal of the action potential arriving atthe synaptic terminal into a chemical signal thattravels across the synapse where it is convertedback into an electrical signal in the postsynapticcell. Release of calcium from the terminal cister-nae of the sarcoplasmic reticulum in response tomembrane depolarization upon the arrival of anaction potential allows the actin and myosin fila-ments to interact. The plasma membrane and the
ER membrane have mechanisms to regulate thecalcium concentration gradient during restingconditions and to restore it after muscle andnerve cell stimulation (Alberts et al. 1994). Theactivation process involves the binding ofcalcium to troponin C, one of the regulatory pro-teins associated with the actin filaments, and thechange in shape of these proteins allows interac-tion between actin and myosin to occur. Calciumis then pumped back into the terminal cisternaeby an energy-dependent transporter in a processthat consumes adenosine triphosphate (ATP),allowing relaxation of the muscle to occur. Thereis good evidence that fatigue during high-intensity exercise may involve a disruption of the cell’s calcium-handling capability (Maughanet al. 1997). A number of substances, includingcaffeine, can alter the response of the muscle to asingle action potential, and the effects of some ofthese compounds on exercise capacity may bemediated by effects on calcium transport. Theseprocesses are described in detail by Jones andRound (1990).
A second key process requiring calcium is the activation of numerous cellular enzymesinvolved in energy production, and calcium isimportant to both glycogenolysis and the gly-colytic pathway in generating ATP (Tate et al.1991; Clarkson & Haymes 1995). It seems sen-sible that the same process that allows the muscleto do work is involved in the regulation of ATPprovision. The activity of phosphorylase, the keyenzyme involved in glycogen breakdown, isstimulated by increasing cytosolic calcium con-centration (Maughan et al. 1997) and this isimportant for the activation of the glycolyticpathway at the onset of exercise.
Calcium intake
An adequate calcium intake is needed to achieveoptimal peak bone mass in the first two or threedecades of life, to maintain bone mass through-out the middle years of life, and to minimizebone loss in the later years (Andersson 1996). Adaily calcium intake that is sufficient to meet therequirement may be achieved through diet alone,
minerals: calcium 319

if some attention is paid to the composition of thediet. Alternatively, calcium-fortified food orcalcium supplementation may be employed tomeet the need. The amount of calcium availablefrom the diet depends on the total dietarycalcium intake, the bioavailability, whichdepends in turn on the amount of calcium insolution and on the presence of other dietarycomponents, and on the activity of the intestinalcalcium transport systems. The bioavailability isinfluenced by the presence of anions that forminsoluble compounds that cannot be absorbed:these include oxalate (which is present inrhubarb and spinach) and polyphosphate.Vitamin D status will determine the activity ofthe calcium transporters in the intestine. All of these factors, in addition to the ongoing lossesof calcium from the body, will influence theamount of calcium that the diet must supply tomeet the individual’s requirement.
When body mass is taken into account,growing children require as much as two to fourtimes as much calcium as adults, and the UnitedStates recommended dietary allowance (RDA)for calcium is greatest during adolescence (11–18years) and early adulthood (19–24 years), beingin the order of 1200mg· day–1 (National ResearchCouncil 1989). Males and females of all ages havethe same calcium requirement except whenfemales are pregnant or lactating. The RDA forchildren (1–10 years) and adults 25 years andolder is 800mg ·day–1. The National Academy ofScience Food and Nutrition Board recently sug-gested new guidelines for calcium intake. Theyrecommend: during early childhood (1–3 years)500mg ·day–1, 800 mg·day–1 between 4 and 8years, 1300mg· day–1 during adolescence (9–18years) and 1000mg· day–1 between the ages of 18and 50 years.
In the general US population, it is estimatedthat the average dietary calcium intake of men isabout 115% of the 1989 RDA, but for women thefigure is only 78%: for children, it is estimatedthat the mean intake is about 105% of the RDA(US Surgeon General 1988). Correspondingfigures for the UK indicate rather similar values,with a daily mean intake of 940 mg for men and
320 nutrition and exercise
717mg for women (Gregory et al. 1990).However, as the RDA for calcium in the UK isonly 500mg for men and for women, the averageintake was well above the RDA. This discrepancybetween countries in recommendations fordietary intake reflects the uncertainty as torequirements: the dietary intake necessary tomaintain calcium balance has been reported to beanything between 200mg· day–1 and over 1000mg ·day–1 (Irwin & Kienholz 1973). The highvalue recommended for the American popula-tion greatly exceeds the desirable intake recom-mended by the WHO/FAO, and reflects the highdietary content of protein and phosphate in that country: both protein and phosphate arereported to increase calcium loss.
Surveys of dietary habits in female adolescentathletes (gymnasts, ballet dancers and distancerunners) show their average calcium intake to bewell below RDA and often related to their low-energy intake in order to maintain a low bodyweight (Carroll et al. 1983). Low energy intaketogether with a high weekly training load willlead to a decreased percentage of body fat, andinsufficient levels of circulating oestrogen, result-ing in menstrual dysfunctions such as oligomen-orrhea or amenorrhea (Drinkwater et al. 1984,1990). Several cross-sectional studies haveshown significant relationships between bodymass and bone mineral density and betweenbody mass and susceptibility to osteoporoticfracture (Sowers et al. 1991; Lindsay et al. 1992).Restriction of energy intake (which resulted in a5% reduction in dietary calcium intake) for aperiod as short as 6 months has been shown toresult in a significant reduction in bone mineraldensity in healthy young women, even thoughthere was only a moderate (3.4 kg) loss of bodymass in these subjects (Ramsdale & Bassey 1994).The combination of low body mass, low circulat-ing oestrogen levels and low dietary calciumintake clearly creates a high risk situation fordevelopment of early osteoporosis, and the pos-sibility of stress fractures due to overload of bonetissue will then increase. Resumption of mensesby regain in body weight may restore some of thelost bone tissue but not all is likely to be regained,

depending on the persistence of the amenor-rhoea (Drinkwater et al. 1986).
Foods rich in calcium include dairy products,some canned fish (especially if eaten with bones),some vegetables, including broccoli, spinach andcollard greens, tofu, and some calcium-enrichedgrain products. UK data for the general popula-tion indicate that milk and milk products pro-vided about one half of the total calcium intake,while cereal products provided about 25%: veg-etables contributed only about 7%, and the use ofsupplements was negligible (Gregory et al. 1990).Where energy intake is a concern, as in weightcategory sports, or when energy intake is other-wise restricted, the use of reduced-fat dairyproducts should be encouraged: a wide range oflow to moderate fat varieties can be used to addvariety to the diet.
Calcium has been reported to inhibit theabsorption of iron from the food and it is there-fore suggested that these two nutrients shouldnot be taken together in large amounts (Gleerupet al. 1995). When both iron status and calciumstatus are precarious, special attention must bepaid to the initiation of any supplementationregimen. This may be particularly relevant tofemale athletes, who may suffer from anaemiadue to both low energy intake and loss of ironthrough the menses.
Calcium balance
Whole body net calcium balance reflects the rela-tionship between the dietary calcium intake andall routes of calcium loss. Positive calciumbalance occurs when calcium intake exceedscalcium loss, and is necessary for bone growthand peak bone mass to be achieved. Negativecalcium balance will lead to a decrease in bonemass and density. Calcium loss is the sum of thefaecal, urinary, and dermal calcium losses. Faecalcalcium loss accounts for about 75–80% of thedietary calcium ingested (Schroeder et al. 1972),but about 20% of this is of endogenous origin(Melvin et al. 1970). As discussed further below,the urinary calcium loss may be influenced by anumber of factors, and the acidity of the urine,
which may in turn be influenced by the composi-tion of the diet, appears to be an important factor(Ball & Maughan 1997). The loss of calciumthrough the skin is often estimated at 60mg ·day–1, but this may substantially underestimatethe actual calcium loss of individuals whoengaged in strenuous training programmes(Matkovic 1991). Sweat calcium losses as high as57mg ·h–1 have been reported during exercise(Krebs et al. 1988). Sweat calcium concentration istypically about 1 mmol · l–1 (40 mg· l–1), so lossesmay be very much greater than this when sweatrates are high or when prolonged exercise is per-formed, especially in hot environments (Shirreffs& Maughan 1997).
Dietary factors other than calcium intake maybe of importance, and the association betweenhigh protein diets and an increased urinarycalcium loss is widely accepted (Lutz 1984; Kerstetter & Allen 1990); this effect appears to bea consequence of the acid load that results fromprotein metabolism. The effects of an acid load inincreasing urinary calcium output are well estab-lished, and the US Surgeon General’s Report onNutrition and Health (1988) concluded that‘increased acidity induces calcium loss byincreasing renal excretion directly as well as byincreasing the dissolution of mineral from theskeleton and impairing mineral deposition.’
A recent comparison of the dietary intake ofomnivorous women and a matched group ofvegetarians showed that the vegetarians had alower dietary protein intake and a lower 24-htotal urinary acid excretion than the omnivorouswomen (Ball & Maughan 1997). Although therewere no differences between these groups in theestimated (7-day weighed intake) dietarycalcium intake, the daily urinary calcium excre-tion of the omnivores was significantly higherthan that of the vegetarians. These results areconsistent with the suggestion that the acid/alkaline characteristics of the habitual diet haveimplications for calcium balance, and that thismay be amenable to manipulation by alterationof specific dietary components.
There have been numerous recent reviews ofthe current state of knowledge regarding nutri-
minerals: calcium 321

tion and bone metabolism and these have beensummarized in the US Surgeon General’s Reporton Nutrition and Health (1988) (see Chapter 7).
Exercise and calcium balance
Acute exercise results in a prompt increase inserum calcium, both in its ionized and non-ionized forms. This may be due in part to lacticacidosis rather than to changes in PTH and calci-tonin concentrations, and haemoconcentration isalso likely to be a significant factor (Vora et al.1983; Cunningham et al. 1985). Marathonrunning was found to be accompanied by a tran-sient decrease in urinary calcium and serumosteocalcin levels (Malm et al. 1992). Endurance
322 nutrition and exercise
training has been reported to be associated withincreased serum levels of the active form ofvitamin D, leading to increased calcium absorp-tion and a rise in total body calcium (Yeh & Aloia1990). A few studies have demonstrated exercise-related elevations in PTH (Ljunghall et al. 1985,1986; Salvesen et al. 1994), but this has not beenconfirmed in other studies (Aloia et al. 1985).
The influence of calcium intake and physicalactivity on peak bone mass has been the subjectof much attention (Kanders et al. 1988; Mazess &Barden 1991; Recker et al. 1992). There are bothcross-sectional and longitudinal studies thatfavour a beneficial effect of calcium on the adultskeleton and there are others that find no rela-tionship between dietary calcium and bone massand rate of bone loss. Peak bone mass is achievedduring the third decade of life. Apart fromcalcium intake, heredity is also an importantfactor determining peak bone mass. A study onidentical twins, where one twin in each pairreceived calcium supplementation and the othera placebo, suggested that extra calcium in thediet is beneficial to the achievement of peak bonemass prior to puberty (Johnston et al. 1992).
The role of physical activity in optimizingbone growth as well as maintaining bone mass iswell established (Torgerson et al. 1995): acutereductions in weight-bearing activity are associ-ated with a dramatic loss of calcium. Measure-ments of prolonged bed rest in healthyvolunteers and in patients, as well as in astro-nauts subjected to microgravity, have all shownan increased calcium loss and a reduced skeletalmass (Anonymous 1983). Increased physicalactivity, and in particular running, has beenshown to be associated with an increased bonedensity (Lane et al. 1986), and it seems clear thatthe physical stress imposed on the bone is animportant factor (Lanyon 1992; Wolman 1994).This is supported by a recent study showingincreases in bone area in adult male rats sub-jected to a resistance training programme (Westerlind et al. 1998). There is, however, littleinformation on the type, frequency, duration andintensity of exercise that will optimize bone massand minimize the age-related loss.
Fig. 23.1 Most forms of exercise are good for bonehealth and should be encouraged in youngsters. Onlya few athletes, most commonly young women insports where low body mass confers an advantage, arelikely to suffer accelerated bone mass. Photo ©Allsport / M. Powell.

Apart from the implications for the develop-ment of osteoporosis in later life, a low bonedensity may be detrimental in athletes. Myburghet al. (1990) found that athletes with lowerextremity stress fractures had significantly lowerfemoral and lumbar mineral densities thanmatched athletic control subjects. Athletes withstress fractures had significantly lower calciumintakes and had lower intakes of dairy products.Injured female athletes were more likely to haveirregular menstrual cycles and less likely to useoral contraceptives. This was not confirmedamong female ballet dancers but a great numberof dancers with stress fractures avoided dairyproducts (Frusztajer et al. 1990). A lifetimehistory of calcium intakes exceeding 800mg ·day–1 appears to reduce the risk for hip fracturesin older women compared with women withlower calcium intake (< 450mg· day–1) and thisalso seems to hold for men (Matkovic et al. 1979).Milk consumption during childhood and adoles-cence and as an adult was associated with agreater bone mass in postmenopausal women,but total calcium intake was not associated withbone mass (Sandler et al. 1985; Bauer et al. 1993).Exercise appears to be more important in pre-venting trabecular bone loss while calciumintake may be a more important influence on cor-tical bone loss.
Conclusion
Intake of sufficient amounts of energy to balancethe expenditure, maintenance of circulatinghormone levels, and regular participation insome form of weight-bearing exercise are ofgreatest importance to achieve and preserveskeletal health. This is important for the avoid-ance of stress fractures in young athletes and forthe preservation of bone health in later life. Anadequate dietary intake of calcium is also essen-tial, and this can be achieved by consumption ofdairy products (which may be reduced-fat vari-eties) and other foods rich in calcium. Exerciseper se does not seem to lead to an increasedrequirement for calcium by the body and there isgenerally no need for calcium supplementation
for athletes provided that the amount of energyconsumed is sufficient. The RDA for calcium inboth men and women is different in differentcountries, and is usually between 800 and 1200mg· day–1. The recommended intake is the samefor males and females of all ages, except whenfemales are pregnant or lactating. In post-menopausal women, adequate hormone supple-mentation, physical exercise and dietary calciumintake will prevent loss of bone tissue and delaythe development of osteoporosis.
References
Alberts, B., Bray, D., Lewis, J., Raff, M., Roberts, K. &Watson, J.D. (1994) Molecular Biology of the Cell.Garland Publishing, New York.
Aloia, J.F., Rasulo, P., Deftos, L., Vaswani, A. & Yeh, J.K.(1985) Exercise-induced hypercalcemia and the cal-ciotropic hormones. Journal of Laboratory and ClinicalMedicine 106, 229–232.
Anderson, J. (1996) Calcium, phosphorus and humanbone development. Journal of Nutrition 126, 1153S–1158S.
Anonymous (1983) Osteoporosis and activity. Lancet i,1365–1366.
Ball, D. & Maughan, R.J. (1997) Blood and urine acid-base status of pre-menopausal omnivorous and veg-etarian women. British Journal of Nutrition 78,683–693.
Bauer, D.C., Browner, W.S. & Cauley, J.A. (1993) Factorsassociated with appendicular bone mass in olderwomen. Annals of Internal Medicine 118, 657–665.
Carroll, M.D., Abraham, S. & Dresser, C.M. (1983)Dietary Source Intake Data: United States, 1976–1980(Publication (PHS) no. 83-i 68). Hyaffsville, MD, USDepartment of Human Services.
Clarkson, P.M. & Haymes, E.M. (1995) Exercise andmineral status of athletes: calcium, magnesium phos-phorus, and iron. Medicine and Science in Sports andExercise 6, 831–843.
Cohn, S.H., Vaswani, A., Zanzi, I., Aloia, F., Roginski,M.S. & Ellis K.J. (1976) Changes in body chemicalcomposition with age measured by total-bodyneutron activation. Metabolism 25, 85–95.
Cunningham, J., Segre, G.V., Slatopolsky, E. & Aviobi,L.V. (1985) Effect of heavy exercise on mineral me-tabolism and calcium regulating hormones inhumans. Calcified Tissue International 37, 598–601.
Drinkwater, B.L., Nilson, K. & Chesnut, C.H. (1984)Bone mineral content of amenorrheic and eumenor-rheic athletes. New England Journal of Medicine 311,277–281.
minerals: calcium 323

Drinkwater, B.L., Nilson, K. & Ott, S. (1986) Bonemineral density after resumption of menses in amen-orrheic athletes. Journal of the American Medical Asso-ciation 256, 380–382.
Drinkwater, B.L., Bruemner, B. & Chesnut, C.H. (1990)Menstrual history as determinant of current bonedensity in young athletes. Journal of the AmericanMedical Association 263, 545–548.
Frusztajer, N.T., Dhuper, S., Warren, M.P., Brooks-Gunn, J. & Fox, R.P. (1990) Nutrition and the inci-dence of stress fractures in ballet dancers. AmericanJournal of Clinical Nutrition 51, 779–783.
Gleerup, A., Rossander-Hulten, L., Gramatkovski, E. &Hallberg, L. (1995) Iron absorption from the wholediet: comparison of the effect of two different dis-tributions of daily calcium intake. American Journal of Clinical Nutrition 61, 97–104.
Gregory, J., Foster, K., Tyler, H. & Wiseman, M. (1990)The Dietary and Nutritional Survey of British Adults.HMSO, London.
Irwin, M.I. & Kienholz, E.W. (1973) A conspectus ofresearch on calcium requirements of man. Journal ofNutrition 103, 1019–1025.
Johnstone, C.C., Miller, J.Z., Slemdna, C.W., Reister,T.K., Christian, J.C. & Peacock, M. (1992) Calciumsupplementation and increase in bone mineraldensity in children. New England Journal of Medicine327, 82–87.
Jones, D.A. & Round, J.M. (1990) Skeletal Muscle inHealth and Disease. Manchester University Press,Manchester.
Kanders, B., Dempster, D.W. & Lindsay, R. (1988) Inter-action of calcium nutrition and physical activity onbone mass in young women. Journal of Bone andMineral Research 3, 145–149.
Kerstetter, J.E. & Allen, L.H. (1990) Dietary proteinincreases urinary calcium. Journal of Nutrition 120,134–135.
Krebs, J.V., Schneider, J., Smith, A., Leblanc, W., Thornton, J. & Leach, C. (1988) Sweat calcium lossduring running. FASEB J 2, Al099.
Lane, N.E., Bloch, D.A., Jones, H.H., Marshall, W.H.,Wood, P.D. & Fries, J.F. (1986) Long-distancerunning, bone density and osteoarthritis. Journal ofthe American Medical Association 255, 1147–1151.
Lanyon, L.E. (1992) Control of bone architecture byfunctional load bearing. Journal of Bone and MineralResearch 7 (Suppl. 2), S369–S375.
Lindsay, R., Cosman, F., Herrington, B.S. & Himmelstein, S. (1992) Bone mass and body compo-sition in normal women. Journal of Bone and MineralResearch 7, 55–63.
Ljunghall, S., Joborn, H., Lundin, I., Rastad, J., Wide, L.& Akerstrom, G. (1985) Regional and systemic effectsof short-term intense muscular work on plasma concentrations and content of total and ionised
324 nutrition and exercise
calcium. European Journal of Clinical Investigation 15,248–252.
Ljunghall, S., Joborn, H., Roxin, L.E., Rostad, J., Wide,L. & Akerstrom, G. (1986) Prolonged low intensityexercise raises the serum parathyroid hormonelevels. Clinical Endocrinology 25, 535–542.
Lutz, J. (1984) Calcium balance and acid-base status ofwomen as affected by increased protein intake andby sodium bicarbonate ingestion. American Journal ofClinical Nutrition 39, 281–288.
Malm, H.T., Ronni-Sivula, H.M., Viinikka, L.U. &Ylikorkala, O.R. (1992) Marathon running accompa-nied by transient decreases in urinary calcium andserum osteocalcin levels. Calcified Tissue International52, 209–211.
Martonosi, A.N. & Beeler, T.J. (1983) Mechanisms of Ca2+ uptake by sarcoplasmic reticulum. In Hand-book of Physiology. Section 10. Skeletal Muscle (ed. L.D.Peachey, R.H. Adrian & S.R. Geiger), pp. 417–485.American Physiological Society, Bethesda, MD.
Matkovic, V. (1991) Calcium metabolism and calciumrequirements during skeletal modeling and consoli-dation of bone mass. American Journal of ClinicalNutrition 54, 245S–260S.
Matkovic, V., Kostial, K., Simonovic, I., Buzina, R., Brodarec, A. & Nordin, B.E.C. (1979) Bone status and fracture rates in two regions of Yugoslavia.American Journal of Clinical Nutrition 32, 540–549.
Maughan, R.J., Gleeson, M. & Greenhaff, P.L. (1997)Biochemistry of Exercise and Training. Oxford Univer-sity Press, Oxford.
Mazess, R.B. & Barden, H.S. (1991) Bone density in pre-menstrual women: effects of age, dietary intake,physical activity, smoking and birth-control pills.American Journal of Clinical Nutrition 53, 132–142.
Melvin, K.E.W., Hepner, G.W., Bordier, P., Neale, G. &Joplin, G.F. (1970) Calcium metabolism and bonepathology in adult coeliac disease. Quarterly Journalof Medicine 39, 83–112.
Myburg, K.H., Hutchins, J., Fataar, A.B., Hough, S.F. &Noakes, T.D. (1990) Low bone density is an etiologi-cal factor for stress fractures in athletes. Annals ofInternal Medicine 113, 754–759.
National Research Council (1989) Recommended DietaryAllowances, 10th edn. National Academy Press,Washington, DC.
Ramsdale, S. & Bassey, E.J. (1994) Changes in bonemineral density associated with dietary-induced lossof body mass in young women. Clinical Science 87,343–348.
Recker, R.R., Davies, K.M., Hinders, S.M., Heaney, R.P.,Stegman, R.M. & Kimmel, D.B. (1992) Bone gain inyoung adult women. Journal of the American MedicalAssociation 268, 2403–2408.
Salvesen, H., Johansson, A., Foxdal, P., Wide, L., PiehlAulin, K. & Ljunghall, S. (1994) Intact serum para-
thyroid hormone levels increase during runningexercise in well-trained men. Calcified Tissue Interna-tional 54, 253–261.
Sandler, R.B., Slemenda, C.W. & Laporte, R.E. (1985)Postmenopausal bone density and milk consump-tion in childhood and adolescence. American Journalof Clinical Nutrition 42, 270–274.
Schroeder, H.A., Tipton, I.H. & Nason, A.P. (1972) Tracemetals in man: strontium and barium. Journal ofChronic Disease 25, 491–517.
Shirreffs, S.M. & Maughan, R.J. (1997) Whole bodysweat collection in man: an improved method withsome preliminary data on electrolyte composition.Journal of Applied Physiology 82, 336–341.
Sowers, M., Khirsagar, A., Crutchfield, M. & Updike, S.(1991) Body composition, age and femoral bone massof young adult women. Annals of Epidemiology 1,245–254.
Tate, C.H., Michael, F., Hyek, G. & Taffet, E. (1991) Therole of calcium in the energetics of contracting skele-tal muscle. Sports Medicine 12, 208–217.
Torgerson, D.J., Campbell, M.K. & Reid, D.M. (1995)Life-style, environmental and medical factors influ-
encing peak bone mass in women. British Journal ofRheumatology 34, 620–624.
US Surgeon General (1988) Report on Nutrition andHealth. DHHS (PHS) Publication no. 88–50210. USDept of Health and Human Services, WashingtonDC.
Vora, N.M., Kukreja, S.C., York, P.A.J., Bowser, E.N.,Hargis, G.K. & Williams, G.A. (1983) Effect of exer-cise on serum calcium and parathyroid hormone.Journal of Clinical and Endocrinology Metabolism 57,1067–1069.
Westerlind, K.C., Fluckey, J.D., Gordon, S.E., Kraemer,W.J., Farrell, P.A. & Turner, R.T. (1998) Effect of resis-tance exercise training on cortival and cancellousbone in mature male rats. Journal of Applied Physiology84, 459–464.
Wolman, R. (1994) Osteoporosis and exercise. BritishMedical Journal 309, 400–403.
Yeh, J.K. & Abia, J. (1990) Effect of physical activity oncalciotropic hormones and calcium balance in rats.American Journal of Physiology 285 (Endocrinol.Metab. 21), E263–E268.
minerals: calcium 325

Introduction
Nearly all living things need iron, the fourthmost abundant element on Earth. In humans, thenutritional need for iron centres on its role inenergy metabolism. Iron is necessary for the formation of haemoglobin and myoglobin, theoxygen carriers in red blood cells and muscles,respectively. Iron is also a constituent of severalenzymes — including catalase, peroxidase, andsuccinate dehydrogenase — and of the cyto-chromes, which enable electron transport in cel-lular respiration (and foster drug metabolism inthe liver). In other words, because it deliversoxygen to cells and facilitates the use of oxygenby cells, iron is essential for energy metabolism.Simply put, iron is as vital as oxygen in convert-ing chemical energy from food into metabolicenergy for life.
Because it is vital for energy metabolism, ironis critical in sports nutrition. Concerns include:(i) whether athletes need more iron than non-athletes; (ii) the prevalence of iron deficiencyamong athletes; (iii) the effect of iron deficiencyanaemia on athletic performance; (iv) whetherlow ferritin level in the absence of anaemiaimpairs performance; (v) how to ensure that ath-letes — vegetarian or not — get the iron they needfrom their diet; and (vi) the pros and cons of ironsupplementation for athletes.
Iron deficiency may be the most commonnutritional deficiency in the world. When it leadsto anaemia, the paramount problem for athletesis diminished exercise capacity. Iron deficiency
may also impair two other functions key to ath-letes — immunity and cognition (Dallman 1982;Cook & Lynch 1986; Bruner et al. 1996) — butbecause supporting evidence is limited andinconclusive, these areas will be omitted here.
The value of dietary iron has been known forcenturies. It is said the Persian physician Melam-pus in 4000 bc gave iron supplements to sailorswho bled in battle. Other accounts of iron astherapy date to ancient Egypt and Rome. In the16th and 17th centuries, poets, painters and play-wrights portrayed the ‘green sickness’, or chloro-sis, and attributed it to unrequited passion, or‘lovesickness.’ Shakespearean heroines andheroes, disappointed by love, were smitten bythe green sickness (Farley & Foland 1990). It wasThomas Sydenham in 1681 who first cured thegreen sickness with iron; he prescribed a syrupmade by steeping iron filings in cold Rhenishwine (London 1980).
The symptoms of the green sickness — dysp-noea, fatigue and palpitations — are recognizedtoday as those of anaemia. But the grave olivepallor that gave the condition its name is nolonger common because today anaemia is diag-nosed early, especially in athletes. Indeed, today‘anaemia’ is found so early among athletes — andvague ‘fatigue’ often ascribed to it — that irondeficiency is sometimes overdiagnosed andovertreated. Today, we have the Humpty-Dumpty problem.
Humpty Dumpty, when challenged by Aliceon word usage, said, ‘When I use a word, itmeans just what I choose it to mean, neither more
Chapter 24
Minerals: Iron
E. RANDY EICHNER
326

nor less. The question is, which is to be master?’So it goes today with ‘anaemia’ and ‘fatigue’ and‘iron deficiency’ in athletes. As I will cover, thesewords mean different things to different people.First, a description of normal iron balance is inorder.
Normal iron balance
Because iron — as the core of the oxygen-delivering haemoglobin molecule — is the mostprecious metal in the body, it is recycled. Recy-cling ensures a constant internal supply of iron —independent of external sources such as diet — tomaintain an optimal red cell mass. So the bulk ofthe iron needed for the daily synthesis of haemo-globin (20–30mg) comes from recycling the ironin senile red cells.
Senile red cells are destroyed by macrophagesin the spleen, releasing iron that is taken up bytransferrin (the iron-transporting protein inplasma), carried to the bone marrow, removed bydeveloping red cells (normoblasts), and incorpo-rated into haemoglobin of new-born red cells(reticulocytes).
Because of this avid recycling — a ‘closedsystem’ — little iron is lost from the body. Indeed,the body has no active mechanism to excreteunneeded iron. The average man loses only 1 mgiron · day–1; the average woman (because ofmenses), 2 mg. The small obligatory loss (otherthan menses) is in sweat and in epithelial cellsshed largely from skin, intestine and genitouri-nary tract.
Because obligatory loss of iron is small, onlysmall amounts must be absorbed. The normalUSA diet provides 10–20 mg of iron daily; each1000 calories in food is usually associated with5–6mg of iron. To maintain iron balance, theaverage man absorbs 1mg ·day–1; the averagewoman, 2mg. During times of increased ironneed — growth, pregnancy, bleeding — the intes-tine increases its absorption of iron, up to 4 or 5mg ·day–1. When the need declines, absorptionreturns to baseline.
The average total body iron of an adult man is4000mg. Up to three quarters of this iron is in the
‘functional compartment,’ mainly haemoglobinand myoglobin, and about one quarter, or 1000mg, is in storage, a bountiful buffer againstdeprivation of dietary iron. In contrast, ironstores are typically lower in adult women(300–500 mg), marginal to absent in college-agedwomen, and absent in young children and manyadolescents. Unlike most adult male athletes,then, female and adolescent athletes need asteady dietary supply of iron to maintain ironbalance and avoid anaemia.
Body iron is stored in parenchymal cells of theliver and macrophages of the liver, spleen andbone marrow. The main storage protein is fer-ritin. Soluble ferritin is released from cells (intoplasma) in direct proportion to cellular ferritincontent. So in general, the level of ferritin in theplasma parallels the level of storage iron in thebody (Finch & Huebers 1982; Baynes 1996).Unfortunately, as will be covered below, the useof serum ferritin level to gauge ‘iron deficiency’among athletes is fraught with problems, not theleast of which is that one can have low ferritinlevel (low iron stores) yet still be absorbingenough iron from the diet to avoid anaemia. Putanother way, iron deficiency evolves throughpredictable stages of severity, in which depletionof storage iron, the first stage, precedes anaemia.The development of iron deficiency anaemiagoes through the following stages.1 Absent marrow iron stores; serum ferritin lessthan 12mg · l–1.2 Low serum iron; high iron-binding capa-city; increase in level of free erythrocyte protoporphyrin.3 Normocytic, normochromic anaemia withabnormal red cell distribution width.4 Microcytic, hypochromic anaemia.
Effect of training and competition
Training, especially endurance training, andcompetition, especially ultramarathons or eventsspanning several days or weeks, affect haemo-globin concentration and iron profile in waysboth physiological and pathophysiological. Mis-interpretations of these perturbations, notably
minerals: iron 327
the training-induced declines in haemoglobinconcentration and serum ferritin concentration,have created confusion and controversy about‘anaemia’ and ‘iron deficiency’ in athletes.
‘Sports anaemia’
A prime ‘Humpty-Dumpty problem’ has beenthe failure of some authors to understand orpoint out that a ‘low’ or ‘subnormal’ haematocritor haemoglobin concentration in a givenathlete — especially an endurance athlete — is notnecessarily ‘anaemia.’ Anaemia is best defined asa subnormal number or mass of red blood cells for agiven individual. In this sense, most enduranceathletes (particularly male athletes) with ‘sub-normal’ haematocrit or haemoglobin concentra-tion have not anaemia, but pseudoanaemia.
It is true that athletes, notably endurance ath-letes, tend to have lower haemoglobin concentra-tions than non-athletes. This has been called‘sports anaemia’. Sports anaemia, however, is aHumpty-Dumpty misnomer because the mostcommon cause of a low haemoglobin level in anendurance athlete is a false anaemia. This falseanaemia accrues from regular aerobic exercise,which expands the baseline plasma volume,diluting the red blood cells and haemoglobinconcentration. In other words, the naturallylower haemoglobin level of the enduranceathlete is a dilutional pseudoanaemia.
The increase in baseline plasma volume thatcauses athlete’s pseudoanaemia is an adaptationto the acute loss of plasma volume during eachworkout. Vigorous exercise acutely reducesplasma volume by up to 10–20% in three ways.First, the exercise-induced rise in systolic bloodpressure and the muscular compression ofvenules increase capillary hydrostatic pressure.Second, the generation of lactic acid and othermetabolites in working muscle increases tissueosmotic pressure. These two forces, in concert,drive an ultrafiltrate of plasma from blood totissues. Third, some plasma volume is lost insweat.
To compensate for these bouts of exercise-induced haemoconcentration, the body releases
328 nutrition and exercise
renin, aldosterone and vasopressin, which con-serve water and salt. Also, more albumin isadded to the blood. The net result is an increasein baseline plasma volume (Convertino 1991).
So baseline plasma volume waxes and wanesaccording to physical activity. For example, if non-athletic men begin cycling vigorously 2h · day–1, in less than a week, baseline plasmavolume will expand by 400–500 ml. If they thenquit cycling, plasma volume will decline as fastas it once expanded. Baseline plasma volume canincrease by 10% 1 day after a half-marathon(Robertson et al. 1990) and by 17% 1 day after afull marathon (Davidson et al. 1987). Even asingle brief session of intense exercise canexpand the baseline plasma volume by the nextday. For example, when six athletic men per-formed eight brief bouts at 85% of V
.o2max. on
a cycle ergometer, baseline plasma volumedecreased by 15% during the exercise session,but was expanded by 10% 1 day later (Gillen et al.1991). In short, the endurance athletes who trainthe hardest have the highest plasma volumesand the lowest haemoglobin levels. This ispseudoanaemia, a facet of aerobic fitness(Eichner 1992).
Training and iron profile
Training, especially endurance training, tends todecrease the serum ferritin level. For example,after pilot research found iron deficient profilesin adolescent female runners during seasons ofcross-country running, Nickerson et al. (1985)reported the first controlled trial of iron supple-ments for such runners. Eight (40%) of 20 adoles-cent female runners given placebo (vs. only oneof 20 given iron supplements) developed ‘irondeficiency’ (serum ferritin < 20mg · l–1) after 5 or10 weeks of the cross-country running season.No runner developed iron deficiency anaemia.
Adolescent male runners, with higher ironstores, are less apt to develop iron deficient pro-files. Nickerson et al. (1989) found that 34% offemale but only 8% of male runners ‘developediron deficiency’ (ferritin <12 mg · l–1 and transfer-rin saturation < 16%) during a season. Two girls

but no boys developed iron deficiency anaemia.But at the outset, 29% of the female runners hadferritins of less than 12mg · l–1, so this study,without non-athletic controls, exaggerates thecontribution of training to the iron deficient pro-files. Instead, it describes the typically low ironstores of adolescent females — athletic or not —with a small superimposed effect (fall in ferritinlevel) from training.
Rowland et al. (1987) found the same trend inadolescent runners. At the start of a season, eightof 20 females but only one of 30 males was irondeficient (ferritin < 12mg · l–1). By the end of theseason, one additional female and four addi-tional males had become ‘iron deficient’ by thesame definition. No runner developed iron defi-ciency anaemia.
Besides running, many other types of traininghave been shown to decrease ferritin level. Whenyoung men and women underwent a 7-week (8 h ·day–1) military-type basic training pro-gramme, ferritin levels fell an average of 50% andhaemoglobin levels fell more than 5% (Maga-zanik et al. 1988). When untrained men cycled 2h · day–1 four to five times a week for 11 weeks,mean serum ferritin fell 73%, from 67 to 18mg · l–1
(Shoemaker et al. 1996). Rowland and Kelleher(1989) found no significant fall in serum ferritinduring 10 weeks of swim training in adolescents,but nearly half of the female swimmers studiedbegan with ferritin levels under 12mg · l–1 (so therewas little room to fall). In contrast, Roberts andSmith (1990) reported a decrease in ferritin over 2years in female synchronized swimmers.
Even strength training decreases ferritin, asshown by the 35% fall in ferritin in 12 untrainedmen who underwent a 6-week strength-trainingprogramme (Schobersberger et al. 1990). Amodest fall in ferritin was seen when youngwomen underwent a 13-week programme ofmodest aerobic calisthenics (Blum et al. 1986).Training also can decrease ferritin level in cross-country skiers (Candau et al. 1992), female bas-ketball players (Jacobsen et al. 1993) and in speedskaters and field hockey players (Cook 1994).
So athletic training can decrease the ferritinlevel. This decrease, however, is not necessarily
pathophysiologic; it may reflect only a shift ofiron from stores to functional compartment(haemoglobin and myoglobin). Also, any‘anaemia’ that develops in the same athlete maybe only pseudoanaemia, not necessarily irondeficiency anaemia.
Competition and iron profile
In contrast to prudent training, all-out competi-tion, especially a prolonged or muscle-damagingevent, clouds interpretation of iron status byevoking the acute phase response (Eichner 1986).The acute phase response is an innate, general-ized host defense against infection or inflam-matory injury. In athletes, this may begin asdamaged muscle activates complement, whichrecruits and activates neutrophils and monocytes(and fibroblasts), which release cytokines (e.g.interleukins 1 and 6, tumour necrosis factor). Thecytokines trigger muscle proteolysis and thehepatic synthesis of proteins (e.g. C-reactiveprotein, ceruloplasmin, haptoglobin, fibrinogenand ferritin) that may contribute to host defense.The interleukins also activate lymphocytes,cause mild fever and sleepiness, and decreaseserum iron level. So in the acute phase response,as during a US Army Ranger training pro-gramme (weeks of intense physical activity,stress and sleep deprivation) serum iron falls(and later rebounds), yet serum ferritin rises(Moore et al. 1993).
In light of recent research on bench-steppingexercise (Gleeson et al. 1995), it seems likely thatany exercise bout that evokes delayed onsetmuscle soreness and damages muscle (sharplyincreases serum creatine kinase level) can spuran acute phase response that alters the markersof iron balance. Indeed, an integration of diversefield studies of athletes confirms this.
For example, during marathons and ultrama-rathons (Dickson et al. 1982; Strachan et al. 1984;Lampe et al. 1986a; Schmidt et al. 1989), multidayfoot races (Dressendorfer et al. 1982; Seiler et al.1989), triathlons (Rogers et al. 1986; Taylor et al.1987) and distance ski races (Pattini et al. 1990),serial sampling and analysis of blood markers
minerals: iron 329
suggests the following sequence of events andmechanisms.1 An early (first day or two) decline in plasmahaptoglobin level and rise in serum iron level,likely from exertional or ‘footstrike’ haemolysis;along with an increase in plasma volume and fallin haematocrit (i.e. dilutional pseudoanaemia)that can not be prevented by iron supplementa-tion (Dressendorfer et al. 1991).2 A later (next few days) fall in serum iron andincrease in serum ferritin, likely from the acutephase response.3 A late (e.g. later stages of a 20-day foot race)return of serum iron and ferritin toward baseline, asthe body seems to adapt to the stress of racingand the acute phase response abates.
The above perturbations — some physiologi-cal, some pathophysiological — make it difficultto gauge iron balance in a given athlete who maybe resting, training or racing. For example, an‘anaemia’ may reflect dilution or iron deficiency;the serum iron may be normal, high, or lowdepending on the stage of the race; and serumferritin falls with training yet rises if muscledamage evokes the acute phase response.Bearing these confounders in mind, practicalissues of iron balance in athletes are coverednext.
Iron status of fit athletes
Because training decreases ferritin level (ironstores), one might expect highly trained athletesto be iron deficient compared with non-athletes.Indeed, beginning two decades ago, a spate ofcross-sectional surveys suggested that certainathletes, especially distance runners, tended tobe iron deficient. This area of inquiry began inpart with concern that iron intake was insuffi-cient in young Canadian women, and thathaemoglobin levels of Canada’s 1976 Olympicathletes were ‘suboptimal’ (meaning lower thanthose of the 1968 Australian Olympic Team). Thisled to a survey of 52 collegiate distance runnersin Canada (Clement & Asmundson 1982), con-cluding that 29% of male and 82% of female
330 nutrition and exercise
runners were ‘at risk for iron deficiency’ (hadserum ferritin of less than 25mg · l–1).
Corroborating surveys followed. Low bonemarrow iron stores were seen in competitive dis-tance runners in Sweden and Israel (Ehn et al.1980; Wishnitzer et al. 1983). In a second studyfrom Sweden (Magnusson et al. 1984), 43 elitemale distance runners had lower ferritin levelsand marrow iron scores than 100 non-athleticcontrols. ‘Systemic iron deficiency’ (low satura-tion of transferrin) was found in 56% of 113joggers and runners in Denmark (Hunding et al.1981). Competitive distance runners in Germanyhad lower ferritin levels than elite rowers or pro-fessional cyclists (Dufaux et al. 1981). From SouthAfrica came reports that 14% of male ultra-marathoners (but just 2% of controls) had lowferritin levels, as did 16% of female marathonrunners (Dickson et al. 1982; Matter et al. 1987).From the USA came a report that one third ofwomen — and 7% of men — at a marathon fitnessexposition had low ferritins (Lampe et al. 1986b).Other reports followed suit, as reviewed by Cook(1994).
These surveys are limited, however, by smallsample size, no or few non-athletic controls, andwidely different definitions of ‘iron deficiency’(Humpty Dumpty redux). The most reliablestudies are those based on ferritin assay, butthese used different ferritin ‘cut points’ for diag-nosing iron deficiency (e.g. 12, 20, 25 or 40mg · l–1).The median ferritin value for young women inthe USA is 25–30mg · l–1 (Cook et al. 1986). A cutpoint of 40mg · l–1 (Matter et al. 1987) classifiesmost young women — athletic or not — as irondeficient. Even 25mg · l–1 (Clement & Asmundson1982) is too high; experts say that less than 12mg ·l–1 is the proper ferritin cut point for diagnosingiron deficiency (Cook 1994).
Other surveys question whether athletes differfrom non-athletes in iron balance, but thesesurveys too have problems. In one study, 19 top-level soccer players had ferritins similar to 20controls (Resina et al. 1991). Likewise, ferritinwas similar in 72 elite runners vs. 48 non-runners(Balaban et al. 1989). In this survey, however, one

third of the male and two thirds of the femalerunners (but few controls) were taking iron sup-plements, and when those taking iron wereexcluded, sample sizes were small. When 100female collegiate athletes were compared with 66non-athletic controls, differences in iron balancewere minor (Risser et al. 1988), but only 8% of theathletic women were distance runners.
Despite these problems, it seems likely thatamong athletes, distance runners at least havesome reduction in iron stores compared to non-athletes. So concluded a comprehensive surveyin South Carolina of 111 adult female runners vs.65 inactive controls (Pate et al. 1993). The meanferritin of the runners was lower than that of thecontrols (25mg · l–1 vs. 36 mg · l–1), and twice asmany runners as nonrunners (50% vs. 22%) hadferritin levels of less than 20mg · l–1. Anaemia,however, was rare (3%) in both groups.
So distance runners — especially femalerunners — tend to have lower iron stores thannon-athletes and seem prone to iron deficiencyanaemia. But frank iron deficiency (ferritin <12 mg · l–1) among athletes, even among femalerunners, is not as common as once thought, andanaemia is not clearly more common in athletesthan non-athletes. Then, too, most ultraen-durance athletes studied — especially males —have adequate iron stores (Burke & Read 1987;Singh et al. 1993). Most iron studies are onrunners; we need studies of women in ‘low-bodyweight’ sports such as ballet, gymnastics,diving and ice skating. But future studies of ironstatus are apt to be biased by the increasing use ofiron supplements by athletes.
Causes of low ferritin level in athletes
We have established that athletic training tendsto decrease serum ferritin level (i.e. iron stores)and that some athletes, particularly female dis-tance runners, may be prone to iron deficiencyanaemia. Now the question becomes: How doestraining deplete iron stores? In theory, trainingcan reduce serum ferritin level in at least eightways, not all pathophysiological:
• haemodilution;• increase in myoglobin mass;• increase in red cell mass;• inadequate iron intake;• gastrointestinal bleeding;• iron loss in sweat;• iron loss in urine;• shift of iron to liver.
Haemodilution
As reviewed above, training — especiallyendurance training — can expand baselineplasma volume by as much as 10–20%, and if thetraining is regular, this expansion is maintained.This adaptation to exercise dilutes haemoglobin(pseudoanaemia). It seems likely, if not yetdemonstrated, that the expansion of plasmavolume in a highly fit athlete dilutes serum fer-ritin concentration by 10% or more.
Increase in myoglobin mass
When adolescent boys undergo a growth spurt,stored iron is shifted into the increased mass ofmyoglobin, lowering ferritin. This must alsooccur in athletes who develop muscles by train-ing, and surely accounts for much of the fall inferritin with strength training (Schobersberger et al. 1990). This likely shifting of iron from storesto functional compartment (myoglobin) has notbeen quantified in athletes, but seems evident. To paraphrase Yogi Berra, you can observe a lotby just looking.
Increase in red cell mass
Because cross-sectional studies show anexpanded red cell mass in athletes — men andwomen — compared to non-athletes (Dill et al.1974; Brotherhood et al. 1975; Weight et al. 1991),it seems likely that training can increase red cellmass. Yet longitudinal studies are inconclusive.Restricting it to studies that employ radiola-belled red cells, the best way to gauge red cellmass, two studies are positive and two ‘nega-
minerals: iron 331

tive’. Remes (1979) found that 6 months of mili-tary training increased red cell mass by 4%.Young et al. (1993) found a 4% increase after 8weeks of regular cycling, but the unusual proto-col (cycling immersed to the neck in water) pre-vented the expected increase in plasma volume.Ray et al. (1990) found that regular, uprightcycling for 8 weeks increased red cell mass about220ml, but this increase was not significant.Shoemaker et al. (1996) found no increase in redcell mass when untrained men cycled regularlyfor 11 weeks, but it seems possible that blood-drawing for testing offset an increase in red cellmass.
If training does increase the red cell mass, alikely mechanism would be via erythropoietin.But whether training — or competing — increasesserum erythropoietin level is also unclear;studies finding an exercise-induced increase areslightly exceeded by studies finding no change(Weight et al. 1991; Klausen et al. 1993; Shoemakeret al. 1996). All told, it seems likely that strenuous,long-term athletic training (at sea level) canincrease red cell mass, but this is by no meansproven, and the mechanism for any increaseremains unclear. We need more research here.
Inadequate iron intake
If dietary iron is inadequate for physiologicalneeds, ferritin will decline. Insufficient dietaryiron can be a problem for female athletes who aredieting, who have eating disorders, or who arevegetarians. It is rarely a problem in men. Nogood evidence exists for impaired absorption ofiron in athletes; the one such report (in male dis-tance runners) seems flawed by abnormally highiron-absorption in the non-athletic controls,blood donors who may have been iron deficient(Ehn et al. 1980).
Gastrointestinal bleeding
Gastrointestinal bleeding in athletes has beenwidely studied and reviewed (Eichner 1989,1996). It occurs most often in distance runnersand ranges from occult and trivial to overt and
332 nutrition and exercise
grave. If all reports are lumped, about 2% ofrecreational marathoners and triathletes haveseen blood in their stool after running and about20% have occult faecal blood after distance races.In general, the longer the event and/or thegreater the effort, the greater the likelihood ofbleeding. In a recent study of 20 male triathleteswho provided stool samples during training,taper and competition, 80% of the men hadoccult faecal blood on one or more of the tests(Rudzki et al. 1995).
The source of gastrointestinal bleeding varies.Anorectal disorders (e.g. fissures, haemorrhoids)can be the source. Gastro-oesophageal refluxcommonly occurs in runners, but no reports haveidentified an oesophageal source of bleeding. Insome athletes, no source is found depite endo-scopies. The most common source is likely thestomach, as verified by endoscopy studies ofrunners after distance races (Schwartz et al. 1990).Usually, this is a mild gastritis with superficialerosions that heal quickly. Rarely, however, anathlete bleeds massively from a peptic ulcerduring or just after running (Eichner 1996).Aspirin or other analgesics can increase the riskof gastrointestinal bleeding, as shown in a fieldstudy of marathoners (Robertson et al. 1987). In arecent study, aspirin sharply increased gastroin-testinal permeability when volunteers ran 1h ona treadmill (Ryan et al. 1996).
The second most common source seems to bethe colon, usually from a segmental haemor-rhagic colitis, presumably ischaemic. Duringstrenuous exercise, splanchnic blood flow maydecrease by as much as 80%, as blood diverts toworking muscles. Normally, the gut toleratesthis, but occasionally the colonic mucosabecomes ischaemic, in line with level of effort,unfitness, sympathetic response and dehydra-tion. The result is superficial haemorrhage anderosions. Most cases are mild and soon revers-ible, but rare cases require subtotal colectomy(Eichner 1996).
Repeated bouts of ischaemic colitis in femalerunners could contribute to iron deficiencyanaemia. In a recent German study, seven of 45elite male distance runners had ferritins of less
than 20mg · l–1 (vs. only one of 112 controls). Ineight of the runners, faecal iron (gastrointestinalblood) loss was gauged by radiolabelling haemiron and testing stool samples. When the runnerswere not training, average gastrointestinal bloodloss was 1–2ml ·day–1. With training or racing,average loss increased to 5–6ml · day–1. Ingeneral, gastrointestinal blood loss correlatedwith intensity of running, not distance (Nachtigall et al. 1996).
Iron loss in sweat
Controversy continues on whether athletes canlose enough iron in sweat to cause iron deficiency(Haymes & LaManca 1989). The most meticulousstudy in resting subjects, one that minimized ironloss in desquamated cells and iron contamina-tion of skin, found a very low sweat iron loss,averaging 23mg · l–1, compared with much highervalues in previous studies. The authors con-cluded that variations in sweating have onlymarginal effects on body iron loss (Brune et al.1986).
The most recent study in athletes also suggeststhat sweat iron loss is modest (Waller & Haymes1996). It shows that sweat iron level drops overtime, at least during the first hour of exercise. Itfinds that exercising men have about twice thesweat iron loss as women, because of highersweat rates in men and likely also because ofgreater iron stores in men. The authors estimatethat 6–11% of the iron typically absorbed per dayis lost in sweat during 1 h of exercise. They con-clude that sweat iron losses would likely notdeplete iron stores in men but might do so infemale athletes whose diets are low in iron.
Iron loss in urine
Some iron is lost in urine (Haymes & Lamanca1989), but the amounts are negligible (Nachtigallet al. 1996). Athletes can develop haematuriafrom diverse causes, but not enough haematuriato drain iron stores (Eichner 1990a, 1990b). Exer-tional haemolytis rarely depletes haptoglobinand so does not increase urinary iron loss
(Eichner 1985; O’Toole et al. 1988). Urinary ironloss in athletes is negligible.
Shift of iron to liver
The ‘liver shift’ hypothesis sought to explainwhy some runners had low ferritins (and lowbone marrow iron scores) yet seemed not irondeficient by other criteria (Magnusson et al.1984). The notion was that ‘footstrike haemo-lysis’ shifted iron from normal storage sites(macrophages) to hepatocytes, and that iron inhepatocytes was not readily available for reuseand not registered by the serum ferritin. Thishypothesis lacked experimental support andshould be put to rest by the finding in elite dis-tance runners that when ferritin is low, hepaticiron is also low (Nachtigall et al. 1996).
Iron status and athletic performance
Anaemia and athleticism
It is well known that anaemia, even mildanaemia, impairs all-out athletic performance(Dallman 1982; Cook 1994); this needs no review.In my experience with runners, even a 1–2 g ·dl–1
decrement in haemoglobin from baseline slowsrace performance. Coaches, trainers and sportsmedicine physicians, then, need to be alert formild anaemia in athletes. When anaemia is mildand serum ferritin is marginal, it is difficult todistinguish pseudoanaemia from iron deficiencyanaemia; indeed, they may coexist. When indoubt, a therapeutic trial of oral iron is wise; arise in haemoglobin of 1–2g · dl–1 is the ‘goldstandard’ for diagnosing iron deficiency anaemia(Eichner 1990a).
Low ferritin without anaemia
About two decades ago, a myth arose that lowferritin alone, without anaemia, impairs athleticperformance. This led to monitoring ferritin as amarker of performance potential. When runnerswithout anaemia were told that their ferritin was30mg · l–1 and ‘should be much higher’, they
minerals: iron 333
immediately felt tired. When, on iron pills, theirserum ferritin rose to 90mg · l–1, they felt threetimes stronger (despite no rise in haemoglobin).Alas, later, off iron pills, when their ferritin fellagain to 30mg · l–1, they felt weak again.
This myth is a Hydra; it keeps growing newheads. It stems from misinterpreting research onrodents — research probing the extent to which,in the face of iron deficiency, exercise capacity islimited by impaired oxygen delivery (anaemia)vs. impaired oxygen use (impaired oxidativemetabolism in muscle). This model is not rele-vant to athletes because it first creates severe irondeficiency anaemia and muscle iron deficiency inweanling rats (deprived of dietary iron) andthen, by blood transfusion, reverses only theanaemia. When this is done, the rats cannot runmaximally because, although they are no longeranaemic, their muscles are still iron deficient(Dallman 1982).
This research was misread on two counts. One,it is a model of severe, ‘lifelong,’ bodywide irondeficiency with severe anaemia. As such, it is atthe opposite end of the spectrum (of iron defi-ciency) from the athlete who has low ferritin butno anaemia yet. Two, as the rats grew ever moredeficient in iron, there was a parallel decrease inall haem proteins measured (haemoglobin,cytochrome c, myoglobin). In other words, whenhaemoglobin was still normal, muscle myoglo-bin and iron-containing enzymes were also stillnormal. These rats developed ‘iron deficientmuscles’ as they got anaemic. Rats — andathletes — with low ferritin but no anaemia havenormal muscles.
Fortunately, accumulating studies may kill theHydra. In one study (Celsing et al. 1986), mildiron deficiency anaemia was induced by vene-section of nine healthy men. When the anaemia(but not the iron deficiency) was obviated bytransfusion, the subjects’ exercise capacity wasunchanged from baseline. Also, the activity ofiron-containing muscle enzymes remainednormal. Three studies now show that when non-anaemic women with ferritin of less than 20mg ·l–1 or less than 25mg · l–1 are randomized to irontherapy vs. placebo for 8 weeks, neither group
334 nutrition and exercise
improves in work performance or endurancecapacity (Newhouse et al. 1989; Fogelholm et al.1992; Klingshirn et al. 1992). In two other studiesin which mildly anaemic women were random-ized to iron vs. placebo, performance improvedonly as anaemia was reversed (Schoene et al.1983; LaManca & Haymes 1993). Finally, a recentstudy analyses the 10 most relevant articles inthis field and concludes that low serum ferritin inthe absence of frank anaemia is not associatedwith reduced endurance performance (Garza etal. 1997). It adds that ferritin can be used to detect‘prelatent anaemias,’ but not as an independentmarker for performance in athletes. Amen.
Increasing iron supply
The pre-eminent cause of iron deficiency inwomen in sports (as in all women) is inadequatedietary iron. Athletic women, notably ‘low-bodyweight’ athletes, are notorious for consum-ing too few calories. The recommended dietaryallowance (RDA) for iron is 10mg· day–1 for chil-dren to age 10 and males 15 and above (some say18 and above), 12mg·day–1 for boys 11–15 years,and 15 mg· day–1 for females 11–50 years (Clarkson & Haymes 1995). Yet many elite fe-male athletes consume no more than 8400 kJ(2000 kcal) daily, for a total of 12 mg of iron.
Also, because some female athletes are modi-fied vegetarians, much of their dietary iron is nothighly bioavailable. Meats are an excellentsource of iron because they contain haem iron,which is easily absorbed. In contrast, cereals,legumes, whole grain or enriched breads anddeep green leafy vegetables contain non-haemiron, which is not so easily absorbed. Fourstudies agree that some active or athletic womenget too little iron. In one study, female recre-ational runners who were modified vegetarianshad low ferritin levels, only one third those ofcounterparts who ate red meat (Snyder et al.1989). In another study of distance runners, themen met the RDA for iron but the women did not(Weight et al. 1992b). In a study of active womenin a university community, ferritins were highestin those who consumed red meat (Worthington-

Roberts et al. 1988). Finally, in the South Carolinastudy of female runners and non-runners, therunners (who had lower ferritins than the non-runners) consumed less meat, more carbohy-drate, more fibre and more coffee or tea (Pate et al. 1993).
Iron supply can be increased by:1 eating more lean red meat;2 not consuming tea or coffee with meals3 drinking orange juice with breakfast;4 cooking in cast-iron cookware;5 frequently eating mixed meals;6 the wise use of iron supplements.
The best way is to consume some red meat —say, 80 g of lean beef three to four times a week.Poultry and fish also contain haem iron, but lessthan red meat. Meat, fish, poultry and ascorbicacid enhance non-haem iron absorption. Con-versely, inhibitors include tea (tannins), coffee(polyphenols), eggs and cow’s milk (calcium andphosphoproteins), wheat bran (phytate), soyproducts and fibre. The threat of inhibitors,however, seems overblown. For example, anyinhibition of fibre on non-haem iron absorptionis modest (Cook et al. 1983), and with a variedWestern diet, the net effect of inhibitors (orenhancers) is small, because no given inhibitor(or enhancer) is contained within enough mealsto shape iron balance (Cook et al. 1991a, 1991b).
Avoiding tea or coffee with breakfast (they canbe drunk 1–2 h before or after) and taking asource of vitamin C (orange juice) can triple theamount of iron absorbed from the meal(Rossander et al. 1979). Cooking occasionally incast-iron (vs. stainless steel) skillets and pots,especially when simmering acidic foods like vegetable soup or tomato sauce, can leachabsorbable iron into the food. Eating mixedmeals is key, because meat, fish and poultrycontain enhancers, so when meat and vegetablesare eaten together, more non-haem iron isabsorbed from the vegetables than if the vegeta-bles had been eaten alone.
It is preferable for female athletes to meet theiriron need by consuming iron-rich foods, but forsuch women who repeatedly develop iron defi-ciency anaemia and are unable to follow dietary
advice, one can prescribe supplementary iron(e.g. ferrous sulphate, 325 mg three times aweek). As for other common supplements,women who take calcium supplements shouldavoid them with meals (because they inhibit non-haem iron absorption), whereas women whotake vitamin C supplements should take themwith meals to enhance iron absorption (Cook &Monsen 1977; Cook et al. 1991a, 1991b).
Vegetarians need to heed their supply of iron(and zinc) because plants are paltry providers. Sovegetarians should eat iron-rich foods such asdried fruit (apricots, prunes, dates), beans, peas,tofu, kale, spinach (a recent report claims spinachhas only one tenth the iron as formerly thought),collard greens, and blackstrap molasses. Vegetar-ians should also consider taking a multivitaminand mineral supplement that provides the RDAfor iron (and zinc).
Finally, among male athletes especially, injudi-cious use of iron supplements is a potentialhazard. In the USA at least, one person in 200 isgenetically programmed to develop hereditaryhaemochromatosis; over the years, he or shebecomes iron-overloaded because daily absorp-tion of dietary iron is about twice normal. In men,who have no physiological means to excreteexcess iron (i.e. no menses), problems from ironoverload in hereditary haemochromatosisdevelop earlier in life (than in women). In suchmen, iron supplements accelerate haemochro-matosis. As a concluding rule of thumb, if manyfemale athletes need more iron than they get,many male athletes get more iron than they need.
References
Balaban, E.P., Cox, J.V., Snell, P., Vaughan, R.H. &Frenkel, E.P. (1989) The frequency of anemia and irondeficiency in the runner. Medicine and Science inSports and Exercise 21, 643–648.
Baynes, R.D. (1996) Refining the assessment of bodyiron status. American Journal of Clinical Nutrition 64,793–794.
Blum, S.M., Sherman, A.R. & Boileau, R.A. (1986) Theeffects of fitness-type exercise on iron status in adultwomen. American Journal of Clinical Nutrition 43,456–463.
Brotherhood, J., Brozovic, B. & Pugh, L.G.C. (1975)
minerals: iron 335
Haematological status of middle- and long-distancerunners. Clinical Science and Molecular Medicine 48,139–145.
Brune, M., Magnusson, B., Persson, H. & Hallberg, L.(1986) Iron losses in sweat. American Journal of Clinical Nutrition 43, 438–443.
Bruner, A.B., Joffe, A., Duggan, A.K., Casella, J.F. &Brandt, J. (1996) Randomized study of cognitiveeffects of iron supplementation in non-anaemic iron-deficient adolescent girls. Lancet 348, 992–996.
Burke, L. & Read, R.S.D. (1987) Diet patterns of elite Australian male triathletes. Physician and Sportsmedicine 15, 140–155.
Candau, R., Busson, T. & Lacour, J.R. (1992) Effects oftraining on iron status in cross-country skiers. Euro-pean Journal of Applied Physiology 64, 497–502.
Celsing, F., Blomstrand, E., Werner, B., Pihlstedt, P. &Ekblom, B. (1986) Effects of iron deficiency onendurance and muscle enyzme activity in man. Medicine and Science in Sports and Exercise 18, 156–161.
Clarkson, P. & Haymes, E.M. (1995) Exercise andmineral status of athletes: calcium, magnesium,phosphorus, and iron. Medicine and Science in Sportsand Exercise 27, 831–843.
Clement, D.B. & Asmundson, R.C. (1982) Nutritionalintake and hematological parameters in endurancerunners. Physician and Sportsmedicine 10, 37–43.
Convertino, V.A. (1991) Blood volume: its adaptation toendurance training. Medicine and Science in Sports andExercise 23, 1338–1348.
Cook, J.D. (1994) The effect of endurance training oniron metabolism. Seminars in Hematology 31, 146–154.
Cook, J.D. & Lynch, S. (1986) The liabilities of iron defi-ciency. Blood 68, 803–809.
Cook, J.D. & Monsen, E.R. (1977) Vitamin C, thecommon cold, and iron absorption. American Journalof Clinical Nutrition 30, 235–241.
Cook, J.D., Noble, N.L., Morck, T.A., Lynch, S.R. &Petersburg, S.J. (1983) Effect of fiber on nonheme ironabsorption. Gastroenterology 85, 1354–1358.
Cook, J.D., Skikne, B.S., Lynch, S.R. & Rausser, M.E.(1986) Estimates of iron sufficiency in the US popula-tion. Blood 68, 726–731.
Cook, J.D., Dassenko, S.A. & Lynch, S.R. (1991a)Assessment of the role of nonheme-iron availabilityin iron balance. American Journal of Clinical Nutrition54, 717–722.
Cook, J.D., Dassenko, S.A. & Whittaker, P. (1991b)Calcium supplementation: effect on iron absorption.American Journal of Clinical Nutrition 53, 106–111.
Dallman, P.R. (1982) Manifestations of iron deficiency.Seminars in Hematology 19, 19–30.
Davidson, R.J.L., Robertson, J.D., Galea, G. &Maughan, R.J. (1987) Hematological changes associ-ated with marathon running. International Journal ofSports Medicine 8, 19–25.
Dickson, D.N., Wilkinson, R.L. & Noakes, T.D. (1982)
336 nutrition and exercise
Effects of ultra-marathon training and racing onhematologic parameters and serum ferritin levels inwell-trained athletes. International Journal of SportsMedicine 3, 111–117.
Dill, D.B., Braithwaite, K., Adams, W.C. & Beernauer,E.M. (1974) Blood volume of middle-distancerunners: effect of 2,300-m altitude and comparisonwith non-athletes. Medicine and Science in Sports andExercise 6, 1–7.
Dressendorfer, R.H., Wade, C.E., Keen, C.L. & Scaff,J.H. (1982) Plasma mineral levels in marathonrunners during a 20-day road race. Physician andSportsmedicine 10, 113–118.
Dressendorfer, R.H., Keen, C.L., Wade, C.E., Claybaugh, J.R. & Timmis, G.C. (1991) Developmentof runner’s anemia during a 20-day road race: effectof iron supplements. International Journal of SportsMedicine 12, 332–336.
Dufaux, B., Hoederath, A., Streitberger, I., Hollmann,W. & Assmann, G. (1981) Serum ferritin, transferrin,haptoglobin, and iron in middle- and long-distancerunners, elite rowers, and professional racingcyclists. International Journal of Sports Medicine 2,43–46.
Ehn, L., Carlmark, B. & Hoglund, S. (1980) Iron statusin athletes involved in intense physical activity. Medicine and Science in Sports and Exercise 12, 61–64.
Eichner, E.R. (1985) Runner’s macrocytosis: a clue tofootstrike hemolysis. American Journal of Medicine 78,321–325.
Eichner, E.R. (1986) The marathon: is more less? Physi-cian and Sportsmedicine 14, 183–187.
Eichner, E.R. (1989) Gastrointestinal bleeding in ath-letes. Physician and Sportsmedicine 17, 128–140.
Eichner, E.R. (1990a) Facts and myths about anemia inactive women. Your Patient and Fitness 5, 12–16.
Eichner, E.R. (1990b) Hematuria: a diagnostic chal-lenge. Physician and Sportsmedicine 18, 53–63.
Eichner, E.R. (1992) Sports anemia, iron supplements,and blood doping. Medicine and Science in Sports andExercise 24, S315–S318.
Eichner, E.R. (1996) Gastrointestinal disorders in activepeople. Your Patient and Fitness 10, 13–19.
Farley, P.C. & Foland, J. (1990) Iron deficiency anemia.Postgraduate Medicine 87, 89–101.
Finch, C.A. & Huebers, H. (1982) Perspectives in ironmetabolism. New England Journal of Medicine 306,1520–1528.
Fogelholm, M., Jaakkola, L. & Lampisjarvi, T. (1992)Effects of iron supplementation in female athleteswith low serum ferritin concentration. InternationalJournal of Sports Medicine 13, 158–162.
Garza, D., Shrier, I., Kohl, H.W., Ford, P., Brown, M. &Matheson, G.O. (1997) The clinical value of serumferritin tests in endurance athletes. Clinical Journal ofSport Medicine 7, 46–53.
Gillen, C.M., Lee, R., Mack, G.W., Tomaselli, C.M.,

Nishiyasu, T. & Nadel, E.R. (1991) Plasma volumeexpansion in humans after a single intense exerciseprotocol. Journal of Applied Physiology 71, 1914–1920.
Gleeson, M., Almey, J., Brooks, S., Cave, R., Lewis, A. &Griffiths, H. (1995) Haematological and acute-phaseresponses associated with delayed-onset musclesoreness in humans. European Journal of Applied Phys-iology 71, 137–142.
Haymes, E.M. & LaManca, J.J. (1989) Iron loss inrunners during exercise. Sports Medicine 7, 277–285.
Hunding, A., Jordal, R. & Paulev, P.E. (1981) Runner’sanemia and iron deficiency. Acta Medica Scandinavica209, 315–318.
Jacobsen, D.J., Crouse, S.F., Rohack, J.J., Lowe, R.C. &Pronk, N.P. (1993) Hematological status of femalebasketball players. Clinical Journal of Sports Medicine3, 82–85.
Klausen, T., Breum, L., Fogh-Andersen, N., Bennett, P.& Hippe, H. (1993) The effect of short and long dura-tion exercise on serum erythropoietin concentra-tions. European Journal of Applied Physiology 67,213–217.
Klingshirn, L.A., Pate, R.R., Bourque, S.P., Davis, J.M. &Sargent, R.G. (1992) Effect of iron supplements onendurance capacity in iron-depleted female runners.Medicine and Science in Sports and Exercise 24, 819–824.
LaManca, J.J. & Haymes, E.M. (1993) Effects of ironrepletion on VO2 max, endurance, and blood lactatein women. Medicine and Science in Sports and Exercise12, 1386–1392.
Lampe, J.W., Slavin, J.L. & Apple, F.S. (1986a) Elevatedserum ferritin concentrations in master runners aftera marathon race. International Journal of Vitamin andNutrition Research 56, 395–398.
Lampe, J.W., Slavin, J.L. & Apple, F.S. (1986b) Effects ofmoderate iron supplementation on the iron status ofrunners with low serum ferritin. Nutrition ReportsInternational 34, 959–966.
London, I.M. (1980) Iron and heme: crucial carriers andcatalysts. In Blood, Pure and Eloquent. McGraw-Hill,New York.
Magazanik, A., Weinstein, Y., Dlin, R.A., Derin, M.,Schwartzman, S. & Allalouf, D. (1988) Iron deficiencycaused by 7 weeks of intensive physical exercise.European Journal of Applied Physiology 57, 198–202.
Magnusson, B., Hallberg, L., Rossander, L. & Swolin, B.(1984) Iron metabolism and ‘sports anemia.’ ActaMedica Scandinavica 216, 157–164.
Matter, M., Stittfall, T., Graves, J., Myburgh, K., Adams,B., Jacobs, P. & Noakes, T.D. (1987) The effect of ironand folate therapy on maximal exercise performancein female marathon runners with iron and folatedeficiency. Clinical Science 72, 415–422.
Moore, R.J., Friedl, K.E., Tulley, R.T. & Askew, E.W.(1993) Maintenance of iron status in healthy menduring an extended period of stress and physical
activity. American Journal of Clinical Nutrition 58,923–927.
Nachtigall, D., Nielsen, P., Fischer, R., Engelhardt, R. &Gabbe, E.E. (1996) Iron deficiency in distancerunners: a reinvestigation using 59Fe-labelling andnon-invasive liver iron quantification. InternationalJournal of Sports Medicine 17, 473–479.
Newhouse, I.J., Clement, D.B., Taunton, J.E. & McKensie, D.C. (1989) The effects of prelatent/latentiron deficiency on physical work capacity. Medicineand Science in Sports and Exercise 21, 263–268.
Nickerson, H.J., Holubets, M., Tripp, A.D. & Pierce,W.E. (1985) Decreased iron stores in high schoolfemale runners. American Journal of the Diseases ofChildhood 139, 1115–1119.
Nickerson, H.J., Holubets, M.C., Weiler, B.R., Haas,R.G., Schwartz, S. & Ellefson, M.E. (1989) Causes ofiron deficiency in adolescent athletes. Journal of Pedi-atrics 114, 657–663.
O’Toole, M.L., Hiller, W.D.B., Roalstad, M.S. &Douglas, P.S. (1988) Hemolysis during triathlonraces: its relation to race distance. Medicine andScience in Sports and Exercise 20, 272–275.
Pate, R.R., Miller, B.J., Davis, J.M., Slentz, C.A. & Klingshirn, L.A. (1993) Iron status of female runners.International Journal of Sport Nutrition 3, 222–231.
Pattini, A., Schena, F. & Guidi, G.C. (1990) Serum ferritin and serum iron changes after cross-countryand roler ski endurance races. European Journal ofApplied Physiology 61, 55–60.
Ray, C.A., Cureton, K.J. & Ouzts, H.G. (1990) Posturalspecificity of cardiovascular adaptations to exercisetraining. Journal of Applied Physiology 69, 2202–2208.
Remes, K. (1979) Effect of long-term physical trainingon total red cell volume. Scandinavian Journal of Clini-cal and Laboratory Investigation 39, 311–319.
Resina, A., Gatteschi, L., Giamgerardino, M.A., Imreh,F., Rubenni, M.G. & Vecchiet, L. (1991) Hematologi-cal comparison of iron status in trained top-levelsoccer players and control subjects. InternationalJournal of Sports Medicine 12, 453–456.
Risser, W.L., Lee, E.J., Poindexter, H.B.W., West, M.S.,Pivarnik, J.M., Risser, J.M.H. & Hickson, J.F. (1988)Iron deficiency in female athletes: its prevalence andimpact on performance. Medicine and Science in Sportsand Exercise 20, 116–121.
Roberts, D. & Smith, D. (1990) Serum ferritin values inelite speed and synchronized swimmers and speedskaters. Journal of Laboratory and Clinical Medicine 116,661–665.
Robertson, J.D., Maughan, R.J. & Davidson, R.J.L.(1987) Faecal blood loss in response to exercise.British Medical Journal 295, 303–305.
Robertson, J.D., Maughan, R.J., Walker, K.A. & Davidson, R.J.L. (1990) Plasma viscosity and thehaemodilution following distance running. ClinicalHemorheology 10, 51–57.
minerals: iron 337

Rogers, G., Goodman, C., Mitchell, D. & Hattingh, J.(1986) The response of runners to arduous triathloncompetition. European Journal of Applied Physiology55, 405–409.
Rossander, L., Halberg, L. & Bjorn-Rasmussen, E.(1979) Absorption of iron from breakfast meals.American Journal of Clinical Nutrition 32, 2484–2489.
Rowland, T.W. & Kelleher, J.F. (1989) Iron deficiency inathletes. American Journal of the Diseases of Childhood143, 197–200.
Rowland, T.W., Black, S.A. & Kelleher, J.F. (1987) Irondeficiency in adolescent endurance athletes. Journalof Adolescent Health Care 8, 322–326.
Rudzki, S.J., Hazard, H. & Collinson, D. (1995) Gas-trointestinal blood loss in triathletes: its etiology andrelationship to sports anaemia. Australian Journal ofScience and Medicine 27, 3–8.
Ryan, A.J., Chang, R.T. & Gisolfi, C.V. (1996) Gastroin-testinal permeability following aspirin intake andprolonged running. Medicine and Science in Sports andExercise 28, 698–705.
Schmidt, W., Maassen, N., Tegtbur, U. & Braumann,K.M. (1989) Changes in plasma volume and red cellformation after a marathon competition. EuropeanJournal of Applied Physiology 58, 453–458.
Schobersberger, W., Tschann, M., Hasibeder, W. et al.(1990) European Journal of Applied Physiology 60,163–168.
Schoene, R.B., Escourrou, P., Robertson, H.T., Nilson,K.L., Parsons, J.R. & Smith, N.J. (1983) Iron repletiondecreases maximal exercise lactate concentrations in female athletes with minimal iron-deficiencyanemia. Journal of Laboratory and Clinical Medicine102, 306–312.
Schwartz, A.V., Vanagunas, A. & Kamel, P.L. (1990)Endoscopy to evaluate gastrointestinal bleeding inmarathon runners. Annals of Internal Medicine 113,632–633.
Seiler, D., Nagel, D., Franz, H., Hellstern, P., Leitzmann,C. & Jung, K. (1989) Effects of long-distance runn-ing on iron metabolism and hematological par-ameters. International Journal of Sports Medicine 10,357–362.
Shoemaker, J.K., Green, H.J., Coates, J., Ali, M. & Grant,S. (1996) Failure of prolonged exercise training to
338 nutrition and exercise
increase red cell mass in humans. American Journal ofPhysiology 270, H121-H126.
Singh, A., Evans, P., Gallagher, K.L. & Deuster, P.A.(1993) Dietary intakes and biochemical profiles ofnutritional status of ultramarathoners. Medicine andScience in Sports and Exercise 25, 328–334.
Synder, A.C., Dvorak, L.L. & Roepke, J.B. (1989) Influ-ence of dietary iron source on measures of iron statusamong female runners. Medicine and Science in Sportsand Exercise 21, 7–10.
Strachan, A.F., Noakes, T.D., Kotzenberg, G., Nel, A.E.& DeBeer, F.C. (1984) C reactive protein concentra-tions during long distance running. British MedicalJournal 289, 1249–1251.
Taylor, C., Rogers, G., Goodman, C., Baynes, R.D.,Bothwell, T.H., Bezwoda, W.R., Kramer, F. & Hattingh, J. (1987) Hematolotic, iron-related, andacute-phase protein responses to sustained strenu-ous exercise. Journal of Applied Physiology 62, 464–469.
Waller, M.F. & Haymes, E.M. (1996) The effects of heatand exercise on sweat iron loss. Medicine and Sciencein Sports and Exercise 28, 197–203.
Weight, L.M., Darge, B.L. & Jacobs, P. (1991) Athletes’pseudoanaemia. European Journal of Applied Physiol-ogy 62, 358–362.
Weight, L.M., Alexander, D., Elliot, T. & Jacobs, P.(1992a) Erythropoietic adaptations to endurancetraining. European Journal of Applied Physiology 64,444–448.
Weight, L.M., Jacobs, P. & Noakes, T.D. (1992b) Dietaryiron deficiency and sports anaemia. British Journal ofNutrition 68, 253–260.
Wishnitzer, R., Vorst, E. & Berrebi, A. (1983) Bonemarrow iron depression in competitive distancerunners. International Journal of Sports Medicine 4,27–30.
Worthington-Roberts, B.S., Breskin, M.W. & Monsen,E.R. (1988) Iron status of premenopausal women in a university community and its relationship tohabitual dietary sources of protein. American Journalof Clinical Nutrition 47, 275–279.
Young, A.J., Sawka, M.N., Quigley, M.D. et al. (1993)Role of thermal factors on aerobic capacity improve-ments with endurance training. Journal of AppliedPhysiology 75, 49–54.

Introduction
Trace minerals are required by the body in very small quantities, generally less than 20mg ·day–1 for healthy adults. Fourteen essential trace minerals have been identified, but only six are related to exercise, and these are iron, zinc, copper, selenium, chromium and vanadium. Vanadium is known to be essential for animals and is likely essential forhumans, although not enough information exists to establish a requirement. Boron has been associated with bone health and exercise,but it is not yet considered an essential traceelement.
The reason these minerals have received atten-tion in the sports medicine arena is that some, like zinc, serve as components of enzymesinvolved in energy production, and others, likeselenium and copper, work with enzymes and proteins that function as antioxidants.Chromium and vanadium have been purportedto increase muscle mass because they areinvolved in either amino acid uptake or growth.Moreover, there is concern that many athletesmay not ingest sufficient quantities of certaintrace minerals to meet possible losses in sweatand urine induced by exercise.
This paper will discuss physiological function,dietary intake and status of athletes, changesinduced by exercise and training, and effects ofsupplementation for each trace mineral men-tioned above (except iron, which is discussed inChapter 24).
Zinc
Zinc functions as a component of more than 200 enzymes which affect many processes of life (Hunt & Groff 1990; Lukaski 1997). The rec-ommended dietary allowance (RDA) is set at 15mg ·day–1 and 12 mg·day–1 for males andfemales, respectively, 11 years and older (Foodand Nutrition Board 1989). Diets containingmeat generally provide sufficient amounts ofzinc to meet the RDA. Animal products, such asmeat, fish, poultry and especially oysters,contain the most zinc.
Most, but not all, male athletes and somefemale athletes ingest sufficient amounts of zinc(Lukaski et al. 1983, 1990; Peters et al. 1986; Singhet al. 1989; Fogelholm et al. 1991, 1992a, 1992b),but many female athletes do not (Deuster et al.1986, 1989; Nieman et al. 1989; Steen et al. 1995).Lower zinc intakes have been reported for femalecompared with male swimmers (Lukaski et al.1990, 1996b). Those athletes maintaining lowbody weights, such as wrestlers, dancers andgymnasts, do not appear to meet their require-ment for zinc (Benson et al. 1985; Loosli et al. 1986;Steen & McKinney 1986).
Zinc status and effects of exercise
Zinc status is most commonly assessed in serumor plasma samples, although this measurementcan be affected by stress, infection and oral con-traceptives (Hunt & Groff 1990). Several studiesreported that male athletes and some female ath-
Chapter 25
Trace Minerals
PRISCILLA M. CLARKSON
339

letes have adequate blood zinc levels (Weight etal. 1988; Fogelholm & Lahtinen 1991; Fogelholmet al. 1991, 1992a; Bazzarre et al. 1993; Lukaski1997). However, many endurance athletes werefound to have relatively low resting blood levels of zinc (Dressendorfer & Sockolov 1980;Haralambie 1981; Dressendorfer et al. 1982;Deuster et al. 1986; Couzy et al. 1990; Marrella etal. 1990; Singh et al. 1990), and Singh et al. (1989)reported low blood zinc levels in a significantnumber of Navy Seals.
Deuster et al. (1986) did not find a strong cor-relation between dietary zinc intake and serum zinc, although they did find a relationshipbetween zinc intake and red blood cell zinc.Relying on plasma or serum zinc as a measure ofstatus will probably not show impaired zincstatus when indeed it may occur. In a study ofinduced zinc deficiency, Prasad (1991) found that5mg zinc · day–1 did not result in a decrease inplasma zinc until 4–5 months. However, zincconcentration in lymphocytes, granulocytes andplatelets decreased within 8–12 weeks and may be a more sensitive indicator of mild zincdeficiency.
Exercise can result in a loss of zinc in the sweatas well as the urine (Anderson et al. 1984; Van Rijet al. 1986; Anderson & Guttman 1988). Couzy etal. (1990) found that serum zinc was significantlydecreased after 5 months of intensive training.Because the lower zinc values could not beexplained by changes in dietary habits, plasmaprotein concentration, hormonal changes, orinfection, they were considered to result from thestress of exercise. However, Manore et al. (1993)reported that after 6 weeks of an aerobic trainingprogramme, there was a significant decrease inplasma zinc but at 12 weeks the values were backto baseline, suggesting only a transient change.Also, subjects who were on a combination ofanaerobic and aerobic exercise programmes did not show a change in plasma zinc. Hübner-Woźniak et al. (1996) found that plasmazinc increased after 10 weeks of weight training,and Ohno et al. (1990) reported that 10 weeks oftraining resulted in an increase in erythrocytelevels of zinc, but no change in plasma zinc.Fogelholm (1992) suggested that the increase
340 nutrition and exercise
in erythrocyte zinc may reflect a high concentra-tion of zinc-dependent enzymes as a result oftraining.
Examination of changes in blood levels of zincafter an acute bout of exercise may prove helpfulin understanding the chronic effects of exercise.However, the results of these studies are equi-vocal (Dressendorfer et al. 1982; Anderson et al.1984; Ohno et al. 1985; Marrella et al. 1993). High-intensity exercise appears to produce an increasein plasma zinc while endurance activity eithershowed no change or a decrease (Bordin et al.1993; Lukaski 1997). Increases may be due to aredistribution of zinc. For example, zinc may bereleased from erythrocytes in response to exer-cise or may be released from muscle (Lukaski1997). Aruoma et al. (1988) suggested that adecrease in plasma zinc immediately after exer-cise may reflect an acute phase response to exer-cise stress. Postexercise changes in plasma zinclevels were found to be sensitive to the zincstatus of the individual, and this may affect thevariability in response (Lukaski et al. 1984). Thechanges that occur are temporary, returning tobaseline within a few hours to a day. Dressendorfer et al. (1982) found that over a 20-day road race, plasma zinc increased on the firstexercise day but thereafter returned to near base-line values.
From the above studies it appears that an acute bout of exercise induces an alteration inzinc distribution in the blood. Because zinc is an integral part of carbonic anhydrase in erythrocytes, erythrocytes may serve as a readilyexchangeable store zinc (Ohno et al. 1995).Further study of the process of redistribution ofzinc among body compartments is needed tounderstand how exercise can exert an effect onzinc status. When examining chronic changes inzinc status due to training, the activity level ofthe subjects must be carefully controlled prior totaking samples because of the variable responsesto an acute exercise bout.
Performance and supplementation
Few studies examined the relationship betweenzinc status and performance or the effects of

zinc supplementation. Lukaski et al. (1983)reported no correlation between blood zinclevels and V
.o 2max.. In a later report, however,
Lukaski (1995) presented evidence that zincintake was significantly related to swim times incollegiate swimmers. Another study reportedthat 50mg ·day–1 of zinc had no effect on physio-logical changes or time to exhaustion during a run at 70–75% V
.o 2max. (Singh et al. 1994).
Krotkiewski et al. (1982) examined the effect of135mg zinc · day–1 for 2 weeks on measures ofknee extension strength. The supplementresulted in a significant increase in isokineticstrength at fast angular velocities (180s–1) onlyand in isometric endurance, but no change indynamic endurance or isokinetic strength at 60 or 120s–1. However, no studies have sub-stantiated these findings regarding strengthimprovement.
The popularity of zinc supplements arisesfrom their purported effect of increasing musclemass. The reason for this belief may partiallystem from the Krotkiewski et al. (1982) study,since the increase in strength could be due toincreased muscle mass, although this was notassessed. Animal and human studies have found that zinc deficiency results in a stunting ofgrowth that can be reversed by zinc supplements(Prasad 1991). Also, a relationship between zinc deficiency and lower testosterone in patientswho were ill has been reported (Prasad et al.1981). However, zinc supplementation has notbeen found to have any positive effect on testos-terone or muscle growth in individuals with ade-quate or near adequate status.
Nishiyama et al. (1996) examined haematologi-cal factors in two groups of female endurancerunners, one with impaired zinc status and onewith normal status. The zinc-deficient group hada lower number of red blood cells, serum haemo-globin and iron. They were then given an iron or an iron-plus-zinc supplement. The subjectswho received the iron-plus-zinc showed agreater increase in haemoglobin and red bloodcells. The authors suggested that zinc plays a rolein haematopoiesis and can prevent anaemia.
The effect of zinc supplementation for 6 dayson exercise-induced changes in immune function
in male runners has been assessed (Singh et al.1994). By examining the respiratory burst activ-ity of neutrophils after exercise, it was found thatthe supplement compared to a placebo blockedthe increase in reactive oxygen species whichcause an increase in free radical damage. Freeradicals have an unpaired electron, making themhighly reactive and damaging to the cell. Thesedata suggest that supplemental zinc may serveas an antioxidant, but because the supplementsuppressed T-lymphocyte activity, it may alsoincrease susceptibility to infection.
Summary
Many athletes are not ingesting the recom-mended quantities of zinc, and zinc status maybe compromised. However, accurate assessmentof zinc status or balance in athletes is lacking.Studies that examined the effects of acute andchronic exercise on blood zinc levels are equivo-cal, and the disparate results are unexplained.Well-controlled studies are needed to examinethe changes in blood levels of zinc induced byvarious types of exercise and redistribution path-ways. Even though exercise may result in someloss of zinc in sweat and urine, it is not knownwhether the body will adapt to this loss byincreasing retention.
Zinc supplementation at levels in excess of theRDA may have negative consequences (Lukaski1997). Excessive zinc can inhibit copper absorp-tion, reduce high-density lipoprotein levels, andprevent an exercise-induced increase in high-density lipoproteins (Lukaski 1997). Female athletes and many male athletes, especially vege-tarians and those maintaining low body weights,should be concerned that they ingest foods richin zinc, or take a multivitamin-mineral supple-ment with micronutrient concentrations equal orless than the RDA.
Copper
Copper is a component of many metalloenzymesin several key reactions (Hunt & Groff 1990). The copper-containing protein, ceruloplasmin,serves as a multifaceted oxidative enzyme play-
trace minerals 341

ing a role as a scavenger of free radicals and amodulator of the inflammatory response as anacute phase protein. Copper is also part of super-oxide dismutase, the enzyme that converts theharmful superoxide radical into the less harmfulhydrogen peroxide. As part of cytochrome coxidase, copper functions in the electron trans-port chain of the mitochondria. Copper is alsoneeded for haemoglobin formation. A completereview of copper containing enzymes and pro-teins can be found elsewhere (Linder 1996).
There is not sufficient information to establishan RDA, so the Food and Nutrition Board recom-mended an estimated safe and adequate dailydietary intake (ESADDI) of between 1.5 and 3.0mg ·day–1. Copper is found in organ meats(especially liver), seafoods (especially oysters),nuts and seeds (Food and Nutrition Board 1989).Many diets in the general population contain lessthan 1.6mg· day–1 but this value may underesti-mate intake (Food and Nutrition Board 1989).Most studies reported that athletes ingest ade-quate amounts of copper (Deuster et al. 1986;Worme et al. 1990; Bazzarre et al. 1993; Singh et al.1993). However, in many of these studies, therewas a small fraction of athletes ingesting lessthan two thirds of the ESADDI for copper. Forexample, about 5% of Navy Seals did not ingesttwo thirds the ESADDI (Singh et al. 1989).
Copper status and effects of exercise
Blood levels of copper are most commonly usedto assess status. Several studies have found thatathletes had similar or higher levels than controls(Dressendorfer & Sockolov 1980; Olha et al. 1982;Lukaski et al. 1983, 1990; Weight et al. 1988; Singhet al. 1989; Bazzarre et al. 1993; Wang et al. 1995;Tuya et al. 1996). One study reported that maledistance runners had lower plasma copper levelsthan controls (Resina et al. 1990). However, theweight of the data suggests that copper defi-ciency, as assessed by blood copper levels, is rarein trained athletes.
Wang et al. (1995) reported that female orien-teers had higher serum copper concentrationsthan male orienteers, which they suggested may
342 nutrition and exercise
be due to the use of oestrogen-containing oralcontraceptives. Newhouse et al. (1993) found thatthe mean copper values for females on oral con-traceptives was 30.1mmol · l–1 vs. 18.8 mmol · l–1 forwomen not on oral contraceptives. The reasonfor high circulating copper in women on oralcontraceptives is not known but could be due tohigher plasma ceruloplasmin levels from alteredliver function and/or increased absorption ofdietary copper with no change in urine loss(Newhouse et al. 1993). This effect is related tooestrogen use because oestrogen replacementtherapy by postmenopausal women also signifi-cantly increased serum copper levels.
Results of training on blood copper levels areequivocal. Dressendorfer et al. (1982) reported anincrease in plasma copper over the first 8 days of a 20-day road race which remained elevatedthroughout the duration of the race. Theseauthors suggested that the elevation in plasmacopper may be due to an increase in the liver’sproduction of ceruloplasmin in response to exer-cise stress. In contrast, Hübner-Woźniak et al.(1996) found that bodybuilders who began astrength training programme for 10 weeksshowed no pre- to posttraining change in bloodcopper levels. Anderson et al. (1995) reported thatan acute bout of strenuous exercise increasedblood copper levels in both moderately trainedrunners and untrained men, demonstrating thatthe release of copper into the circulation wasindependent of the degree of training. However,Olha et al. (1982) found that trained runners had asignificantly greater increase in serum copperafter exercise than untrained subjects.
Several studies reported that an acute bout ofexercise results in an increase in plasma copperlevels immediately after exercise which returnedto baseline within a couple of hours (Olha et al.1982; Ohno et al. 1984). In contrast, Anderson et al. (1984) found no increase in serum copperimmediately or 2 h after a 9.6-km run, Marrella et al. (1990) found a slight but significant decreasein plasma copper after a 1-h cycling test, andBordin et al. (1993) found a decrease in plasmacopper after approximately 30 min of a run-to-exhaustion test. The reason for these discrepant

findings is unclear. Because most of plasmacopper is bound to ceruloplasmin, an increase incopper may be required for increased antioxi-dant capacity in response to muscle damage(Dressendorfer et al. 1982; Anderson & Guttman1988; Aruoma et al. 1988). Apparently, exerciseresults in a redistribution of copper, but how thisoccurs is not known, nor is how this might affectadaptation to training.
Copper status and performance
Little data exist regarding the effects of copperstatus and performance. Lukaski et al. (1996)reported that nutritional status and dietaryintake of several micronutrients includingcopper were useful predictors of 100-yard (91-m)freestyle swimming performance in collegiatemale swimmers. However, no significant correla-tion between V
.o 2max. and plasma copper levels in
trained athletes or untrained subjects was found(Lukaski et al. 1983). No studies have examinedthe effect of copper supplementation on perfor-mance. Although copper can be lost in sweat(Gutteridge et al. 1985), it is not likely that exer-cise and training will lead to a deficiency.
Summary
Most athletes appear to have adequate copperstatus. There is concern that some athletes, especially females, are not ingesting sufficientamounts of copper in their diet, but whether thebody adapts to slightly smaller dietary amountsthan the ESADDI needs to be determined.Results from studies examining changes in bloodcopper levels after acute and chronic exercise areequivocal. After acute exercise, there appears tobe a transient redistribution of copper amongbody compartments leading to copper changesin the blood, but how this occurs is not knownand requires further study (Marrella et al. 1993).Studies are needed to assess how copper status,the type of exercise and training, and the dura-tion and intensity of exercise affect acute andchronic changes in blood copper levels. There isno basis to recommend copper supplementation
for athletes, rather athletes should ingest foodsrich in copper. It should be noted that highamounts of vitamin C and high levels of dietaryzinc can reduce the absorption of copper andmay lead to reduced copper status (Reeves 1997).On the other hand, iron supplements do notaffect blood copper levels (Newhouse et al. 1993).
Selenium
Selenium has received recent attention in themedia because of an interesting randomized con-trolled trial where it was found that 200mg sele-nium ·day–1 for about 4 years resulted in asignificant reduction in total cancer mortalityand incidence of lung, colorectal and prostatecancers (Clark et al. 1996). Before selenium sup-plements are recommended, further studies are needed to confirm these findings and evalu-ate circumstances where selenium may haveadverse effects (Colditz 1996). The reason thatselenium may exert this positive effect on cancer occurrence is likely due to its role as anantioxidant.
Selenium functions as an antioxidant byserving as a cofactor for the enzyme glutathioneperoxidase (Levander & Burk 1996). Thisenzyme catalyses the reduction of organic perox-ides, including the tissue damaging hydrogenperoxide (H2O2) (Hunt & Groff 1990). The reduc-tion of peroxides renders them harmless. Glutathione (GSH) reacts with H2O2, thereby‘inactivating’ it to produce glutathione disulphide (GSSG; the oxidized form of glu-tathione). Also, glutathione reacts with organicperoxides formed by an increase in the hydroxylradical.
Exercise increases oxygen consumption whichcan lead to an increase in free radicals, such assuperoxide, by the incomplete reduction ofoxygen in the electron transport system. Super-oxide is converted to hydrogen peroxide by theenzyme superoxide dismutase (SOD) or canform the hydroxy radical. Thus, the increasedhydroxy radicals and hydrogen peroxide levelscan be rendered harmless by glutathione peroxi-dase and its essential cofactor selenium.
trace minerals 343
Because selenium serves as an antioxidant,adequate levels may reduce oxidative stressduring exercise and aid in recovery, therebyallowing athletes to train harder. For more infor-mation on selenium, oxidative stress and exer-cise, see Aruoma (1994), Clarkson (1995) andHalliwell (1996).
Selenium intake and status in athletes
The content of selenium in foods, especiallyplants, is highly variable because of the varia-tion in the soil content of selenium. Blood selenium values vary among countries; forexample, they are relatively high for adults in theUSA and Canada, but low for adults in Swedenand New Zealand, where soil content of sele-nium is low (Hunt & Groff 1990). Food sources of selenium are seafoods, liver, organ meats,muscle meats, cereals and grain (Levander &Burk 1996).
The RDA for selenium is 70 and 55mg for malesand females, respectively, 19 years and older(Food and Nutrition Board 1989). There is nocompletely acceptable measure of seleniumstatus (Gibson 1990). Whole blood or erythrocytemeasures are somewhat more accurate thanplasma or serum values that fluctuate from dayto day (Gibson 1990). However, published meansof serum selenium in adults are fairly consistentvarying from 0.53 to 2.4mmol · l–1 (Malvy et al.1993). The activity of glutathione peroxidase hasbeen used to assess selenium status, but normalvalues have not been well standardized (Gibson1990).
Little data exist on selenium intake or status ofathletes. Wrestlers were found to have intakes of selenium below 90% of the RDA in about halfof those competing while only one in eight ofnon-competing wrestlers had lower intakes thanthe RDA (Snook et al. 1995). Despite the lowerselenium intake, selenium status assessed byplasma and erythrocyte glutathione peroxidaseactivity indicated that all wrestlers had adequatestatus (Snook et al. 1995). Robertson et al. (1991)reported that sedentary subjects had lower bloodglutathione peroxidase activity and concentra-
344 nutrition and exercise
tion of selenium than trained runners. And, ofthe trained runners, those who trained 80–147km· week–1 had higher levels than those whotrained only 16–43km ·week–1 for at least 2 years.Athletes in countries where the food content ofselenium is adequate generally have adequatestatus (Fogelholm & Lahtinen 1991; Wang et al.1995). Wang et al. (1995) found that Swedish ori-enteers had lower serum selenium values thanFinnish orienteers. Since 1984, Finland has beenenriching fertilizer with selenium to increase theselenium content of cereal crops, which is not thecase in Sweden.
Changes due to exercise
Few studies have examined either exercisechanges in blood selenium or glutathione peroxi-dase. Duthie et al. (1990) reported no significantchange in erythrocyte glutathione peroxidase,catalase or SOD activity after a half marathonand up to 120 h postrace in trained subjects. Incontrast, sedentary subjects who exercised on acycle ergometer at 70% of maximal heart rate for1h showed decreases in erythrocyte enzymeactivities of superoxide dismutase, catalase andglutathione peroxidase at 5min after exerciseand remained low for up to 48 h (Toskulkao &Glinsukon 1996). This change was accompaniedby an increase in plasma malondialdehyde, an indirect indicator of increased lipid peroxidation.Thus, the large production of free radicals mayresult in a decrease in activity of the enzymes. In the Duthie et al. study (1990), trained subjectsmay be better able to handle the increase in freeradicals such that changes in these enzyme activities were not apparent.
Toskulkao and Glinsukon (1996) also exam-ined the changes in antioxidant enzyme activityin trained athletes but the results were inconsis-tent. Rokitzki et al. (1994) found that trained ath-letes did not show an increase in activity ofglutathione peroxidase in erythrocytes after amarathon. However, these authors suggestedthat the lack of change may be due to the inap-propriate use of erythrocytes rather than musclewhere the greater stress is taking place.

Selenium intake and plasma levels were exam-ined before and after a week of sustained physi-cal activity, psychological stress and lack of sleepin Navy Seals during ‘Hell Week’ (Singh et al.1991). Physical activity stress included simulatedcombat exercise and obstacle course trials; psychological stress included performanceanxiety, verbal confrontation and uncertainty ofevents. Selenium intake was substantially higherduring Hell Week, but plasma selenium values at the end of the week were lower. Lower serum selenium values may reflect a redistri-bution of selenium to other tissues requiringantioxidant protection (Singh et al. 1991). Theauthors suggested that the decrease in seleniumand other accompanying changes, such as adecrease in plasma zinc, iron and albumin, andan increase in ferritin, ceruloplasmin, whiteblood cell count and creatine kinase, were indica-tive of an acute-phase response to tissue damageand the inflammatory effect of prolonged physi-cal activity.
Fogelholm et al. (1991) examined serummicronutrient levels in a sailing crew during atransatlantic race and compared these values tothose of a control group. While there was no pre-to postrace difference in serum selenium values,the values for the sailors were lower than thecontrol values. Whether this indicates a slightlowering of serum selenium values with trainingis not known. It should be noted that the valuesfor the sailors were within the reference range.However, if exercise results in an increase inoxidative stress, the body may require greaterthan reference levels of selenium (and otherantioxidants) to keep pace (Duthie 1996). Thisdoes not necessarily mean that more seleniumshould be ingested, because the body maybecome more efficient in retention or action intrained individuals.
Selenium supplementation and lipid peroxidation
Two of the first studies to examine the effects ofselenium supplementation used a crossoverdesign, where the length of time of the washout
may not have been adequate. Drǎgan et al. (1990)examined the effect of an acute dose of 140mg ofselenium or placebo in trained Romanian swim-mers, where subjects repeated the treatment after1 week. In a second experiment, 100mg of sele-nium (or placebo) were administered for 14 daysand then the treatments were crossed for another14 days with no washout period in between.Before and after the treatments, subjects per-formed a 2-h endurance swimming exercise. Theacute dose resulted in no significant change inthe exercise-induced increase in lipid peroxides.However, after 14 days of supplementation, thegroup who received the selenium supplement onthe second bout showed a decrease in lipid per-oxides in response to the exercise. This was nottrue for the group who received the seleniumfirst.
A second study by the same laboratory(Drǎgan et al. 1991) found that 3 weeks of supple-menting with a mixture containing selenium,vitamin E, glutathione and cysteine (concentra-tions were unspecified) in trained Romaniancyclists resulted in a smaller change in lipid per-oxidation compared with the group ingesting aplacebo. After 1 week, the groups crossed over,but the group taking the placebo showed less ofan increase in lipid peroxides. It appeared thefirst leg of the crossover may have affected theresponse to the second leg of the crossover.
Tessier et al. (1995a, 1995b) administered 180mg · day–1 of selenium or a placebo for 10weeks during an endurance training programmeafter a 4-week deconditioning period. The sele-nium supplement resulted in an increase in theresting plasma levels of glutathione peroxidaseactivity. Amoderate correlation between erythro-cyte glutathione peroxidase activity and V
.o 2max.
was found in the supplemented group only(Tessier et al. 1995a), but the supplement did notaffect V
.o 2max.. In another report from the same
study (Tessier et al. 1995b), there was an increasein muscle glutathione peroxidase activity inresponse to an acute exercise bout in the supple-mented group only (Tessier et al. 1995b). Theseresults lend support for selenium supplementsenhancing antioxidant capacity.
trace minerals 345
Summary
Little is known about selenium intake and statusof athletes or changes in selenium status withtraining. A few studies suggested a benefit ofselenium supplementation in improving antioxi-dant capacity, but these studies require corrobo-ration. It is possible that selenium may be mosteffective in athletes who are ingesting insuffi-cient amounts, yet it is not known if marginallyinsufficient intake will compromise status orantioxidant capacity. Excessive amounts of sele-nium (> 200mg ·day–1) could have toxic effects(Levander & Burk 1996; Boylan & Spallholz1997).
Chromium
Chromium’s primary function is to potentiatethe effects of insulin in stimulating the uptake ofglucose, amino acids and triglycerides by cells(Hunt & Groff 1990; Stoecker 1996; Anding et al.1997). How chromium affects insulin action isnot fully known but chromium is thought to helpbind insulin to its receptor (Trent & Thieding-Cancel 1995). Release of insulin may stimulatethe release of chromium from body stores (Hunt & Groff 1990). The physiological role ofchromium was first identified when it wasshown that a substance containing chromiumwas necessary for maintaining normal glucosetolerance (Stoecker 1996; Anding et al. 1997). Thisorganic compound, referred to as the glucose tolerance factor, was found to be a complex ofchromium, nicotinic acid and glutathione (Hunt& Groff 1990).
In addition to insulin’s role in transport ofnutrients into muscle cells, it may act as a phys-iological antagonist to bone resorption andpromote collagen production by osetoblasts(McCarty 1995). At present there have been notrials to assess chromium’s effectiveness on bone health, but this may prove a fruitful area for research, especially in amenorrhoeic athletes.McCarty (1995) suggests that rather than relyingon mononutrient therapy with calcium, a
346 nutrition and exercise
micronutrient cocktail of several nutrients that affect bone, such as calcium, chromium,zinc, boron, copper and manganese and vitaminsD and K, be studied in the maintenance of bonemineral density.
The US Food and Nutrition Board was unableto establish an RDA for chromium due to insuffi-cient data. Instead, the ESADDI is set at 50–200mg · day–1 (Food and Nutrition Board 1989). Many people may not be ingesting the minimumESADDI (Anderson et al. 1991; Stoecker 1996). Adiet that would appear adequate for most nutri-ents can have less than 16mg of chromium per 4.2kJ (1000 cal), and high-fat diets may have lesschromium than isocaloric low-fat diets (Stoecker1996). Anderson and Kozlovsky (1985) analysedthe chromium content of 7-day self-selected dietsfor 10 men and 22 women and found that themean (and range) chromium content of the foodwas 33mg · day–1 (range, 22–48) for the men and 25mg · day–1 (range, 13–36) for the women. Evenindividuals with the largest content of chromiumin the diet had less than the minimum ESADDI.However, there is some concern that the ESADDImay be set too high because earlier studies usedless sophisticated equipment so that the require-ment determination may have been inaccuratelyhigh (Stoecker 1996).
Chromium ingestion has been related toseveral health benefits. Studies have found thatsubjects with impaired glucose tolerance whowere supplemented with chromium demon-strated improved glucose tolerance (Anderson1992). Chronic insufficient chromium ingestioncould predispose an individual to developingglucose intolerance and maturity-onset diab-etes (Anderson 1992). Chromium supplementsresulted in a lowering of blood lipids in subjectswith high values (Hermann et al. 1994), and onestudy found that blood lipids were lowered inbodybuilders taking chromium supplements(Lefavi et al. 1993).
Food sources rich in chromium are Brewer’syeast, mushrooms, prunes, nuts, asparagus,wine, beer and whole grains (Hunt & Groff 1990). Absorption of chromium is enhanced

when given in conjunction with vitamin C, andfoods prepared in stainless steel cookware canincrease the amount of chromium available dueto the leaching of chromium from the pans by the action of acidic foods (Stoecker 1996).Chromium supplements are available in threeforms: chromium picolinate, chromium nicoti-nate and chromium chloride.
Chromium status and effects of exercise and diet
Because many national nutrient databases do notinclude chromium, there is little information onchromium intake of athletes. Athletes who ingesthigh-calorie diets to meet their energy needs mayhave diets adequate in chromium. There may beconcern that athletes who restrict calories tomaintain low body weights do not ingest suffi-cient chromium. Kleiner et al. (1994) examinednutrient intake of male and female elite body-builders during 8–10 days prior to competition.The mean chromium intake for the males was143mg · day–1 and for the females was only 21mg · day–1. The low value for the females wasrelated to low caloric intake and food choices lowin chromium. Of interest, nine of the 11 femaleswere amenorrhoeic at contest time.
Exercise produces an increase of chromium inthe blood followed by an increase in the urine(Anderson et al. 1982, 1984; Gatteschi et al. 1995).Apparently there is a release of chromium fromthe body stores that cannot be re-uptaken bytissues or the kidney and is therefore lost into theurine (Anderson et al. 1984; Anding et al. 1997).Several studies from the same laboratory showedurinary chromium excretion is increased by exer-cise such that 24-h chromium losses were twiceas high on the exercise day as on the rest day(Anderson et al. 1982, 1984, 1991). Whether thisloss can result in a negative chromium balance isnot known. Resting urinary excretion ofchromium was lower in trained athletes thanuntrained individuals (Anderson et al. 1988),which suggests that the body may be able adaptto the increased loss by retaining more of the
ingested chromium. For more detailed reviewsof chromium and exercise, see Anding et al.(1997), Clarkson (1991), Clarkson and Haymes(1994) and Lefavi et al. (1992).
CHO content of the diet also influenceschromium loss. Although a high-CHO diet didnot produce an increased chromium excretion(Anderson et al. 1991), ingestion of glucose/fructose (simple sugar) drinks did (Anderson et al. 1990). Anderson et al. (1990) found that bev-erages resulting in the greatest increase in circu-lating insulin caused the most change in urinaryexcretion of chromium in subjects with a nor-mal insulin response. Those who ingest highamounts of simple sugars may have an enhancedloss of chromium.
Chromium supplementation and lean body mass
Chromium has been marketed as a supplementto increase lean body mass and decrease fat. Theincrease in lean body mass was thought to occur due to chromium’s facilitation of aminoacid transport into muscle cells. In 1989, Evansreported data from two studies showing that 200mg · day–1 of chromium increased lean bodyweight in untrained subjects and trained athletesduring 40 days of weight training. Supplementalchromium was then touted as the healthy alter-native to anabolic steroids. The Evans studies(1989) estimated lean body mass from skinfoldmeasurements which may not provide an accu-rate indication of fat or muscle mass.
Four studies then attempted to confirm theabove results but, for the most part, could not.Hasten et al. (1992) examined the effect of 200mg ·day–1 of chromium picolinate (or placebo) for 12weeks in male and female college studentsenrolled in a weight training class. Over the 12weeks there was only a slight increase in bodyweight for the males (placebo and supplementedgroups) and for the female placebo group, withno difference among the groups (range, 0.9–2.0%increase). However, the females taking the sup-plement demonstrated a 4.3% increase in body
trace minerals 347
weight. The chromium supplement did not affect the change in skinfolds, circumferences or strength. The authors suggested that thechromium supplement may affect the females toa greater extent because the dose per bodyweight was higher for the females or that femalesproduce more insulin than males and wouldtherefore be more sensitive to chromium. Thegreater effect for the females also could be due tothe fact that females may ingest less chromiumthan males and have insufficient status.However, this study did not assess chromiumingestion. The authors also suggested that therelatively large gains in muscle mass foruntrained subjects may have masked the effect ofthe supplement for the males.
Clancy et al. (1994) examined the effects ofchromium picolinate in football players whoingested 200mg · day–1 or a placebo for 9 weeksduring spring training that included a weight-lifting programme. This study improved uponthe prior studies in that hydrostatic weighingwas used to assess body composition andurinary chromium excretion was assessed. Theresults showed no significant difference in lean body mass or strength between groups.However, the subjects who ingested the supple-ment had an increased level of chromium in theurine at 4 and then 9 weeks of training. Whethersome of the chromium was retained is notknown, but the results suggest that a largeportion of the supplement was excreted, whichmay indicate that the body stores were close tooptimal prior to supplementation. A near dupli-cate study (Hallmark et al. 1996) to the Clancy et al. study also reported no effects of 200mgchromium picolinate on strength or lean bodymass after 12 weeks of resistance training, andchromium excretion was increased in the supple-mented group.
In the most well-controlled study of chromiumsupplementation, Lukaski et al. (1996a) matchedsubjects for specific physical and nutritionalcharacteristics and placed them into one of threegroups: placebo, chromium picolinate andchromium chloride. The groups were studied for 8 weeks while on a weight training pro-
348 nutrition and exercise
gramme. The two supplements similarlyincreased serum chromium levels and urinarychromium excretion. There was no differenceamong the groups in body composition assessedby dual X-ray absortiometry or in strength gain,suggesting that the chromium supplement wasineffective.
Chromium supplementation and weight loss
Although chromium supplements receivedinitial attention as a means to gain muscle mass,more recently they have been marketed as aweight loss product. Two studies investigatedthe effectiveness of chromium picolinate supple-ments on fat loss. Trent and Thieding-Cancel(1995) examined the effect of 16 weeks of 400mg chromium picolinate or a placebo in Navy personnel who exceeded the Navy percentagebody fat standards of 22% for men and 30% for women. During the 16 weeks, subjectsparticipated in a physical conditioning pro-gramme. Body fat was determined only frombody circumference measures and height. Nosignificant difference in total exercise time ordietary habits (a ratio of good to bad foodchoices) was observed between the placebo and chromium groups. The supplement wasfound to be ineffective as a weight loss agent. Theauthors stated that chromium picolinate was ‘nota quick cure for obesity and perhaps not aremedy at all’.
Kaats et al. (1996) had subjects ingest a placebo,200mg or 400mg chromium picolinate · day–1 for72 days. Subjects were free living. Body composi-tion was assessed by hydrostatic weighing and abody composition index (BCI) was calculated byadding the loss of body fat and gain in nonfatmass and subtracting fat gained and lean lost. Atthe end of the 72 days, both supplementedgroups had demonstrated high positive changesin BCIs compared to the placebo, with no differ-ence between groups taking the 200 or the 400mg.These authors concluded that chromium supple-mentation did improve body composition.However, further studies are needed to confirmthese results.

Negative effects of chromium supplementation
Because chromium has a low absorption rate, it is not considered to be toxic (Anding et al.1997). However, Stearns et al. (1995a) reportedthat chromium picolinate produced chromo-some damage in isolated cells in vitro. This studyreceived criticism due to its use of supraphysio-logical doses in cell cultures rather than oraldoses in animals or humans (McCarty 1996). In asecond report, Stearns et al. (1995b) employed apharmacokinetic model to predict how ingestedchromium could accumulate and be retained inhuman tissue. These authors cautioned againsttaking supplements with concentrations greaterthan the ESADDI and concluded that the normaldietary intake of chromium may be adequate tomaintain a positive chromium balance in mostpeople, even at levels of ingestion somewhatbelow the 50–200mg range.
Other anecdotal accounts, case histories andstudies suggest that chromium supplementsmay cause headaches, sleep disturbances, moodchanges, increased excretion of trace minerals,altered iron metabolism and changes in percep-tual processes (Lefavi et al. 1992; Trent & Thieding-Cancel 1995). Lukaski et al. (1996a)found that chromium supplementation for 8weeks resulted in a small decrease in trans-ferrin saturation which was greater for thechromium picolinate supplement than thechromium chloride supplement. This may bedue to the fact that chromium competes with ironfor binding on transferrin. Lukaski et al. (1996a)speculated that chromium supplementation maypredispose an individual to iron deficiency.However, it should be noted that the change intransferrin saturation was not statisticallysignificant, thus further studies are needed toconfirm this finding.
Summary
Exercise can increase urinary excretion, as caningestion of simple sugars; however, whetherthis will induce a chromium deficiency or
whether athletes are able to increase efficiency orretention of chromium is not known. Because the long-term safety of chromium is a concern(Anding et al. 1997), athletes should ingest foods rich in chromium. For added assurance, a multivitamin-mineral supplement containingbetween 50 and 200 mg of chromium would notbe harmful. Studies of the effects of chromiumsupplementation on lean body mass in athletesshow that it is not effective. Results of the twostudies to assess chromium’s efficacy as a weightloss agent are equivocal. Chromium may only beeffective in individuals with impaired status, butthis has not been assessed.
Vanadium
Vanadium, like chromium, is purported to havean insulin-like effect and promote the transportof amino acids into cells. Because this effect isthought to be anabolic, vanadium, in the form ofvanadyl sulphate, is widely marketed to body-builders. There is not sufficient information tostate that vanadium is an essential element forhumans (Food and Nutrition Board 1989). Datasuggesting that vanadium may be anabolic comefrom in vitro study of cells and pharmacologicalstudies of animals (Nielsen 1996). For example,growth rate is reduced in vanadium deficient rats(Nielsen 1996). The Food and Nutrition Board(1989) came to the conclusion that if nutritionalrequirements exist they are low and easily met bylevels naturally occurring in foods.
Fawcett et al. (1996) cite anecdotal evidencethat athletes are taking up to 60mg· day–1 for2–3 months to increase muscle mass. In the onlystudy to evaluate vanadium supplements,Fawcett et al. (1996) had subjects ingest 0.5mg ·kg–1 ·day–1 of vanadyl sulphate or placebo for 12weeks during a weight training programme. The results showed no beneficial effect of thesupplement on body composition as assessed byanthropometric measures or DEXA scans. Vanadium supplements could have detrimentaleffects when taken for a long period of time, butthis has not been adequately studied (Moore &Friedl 1992). There is no basis at this time to
trace minerals 349
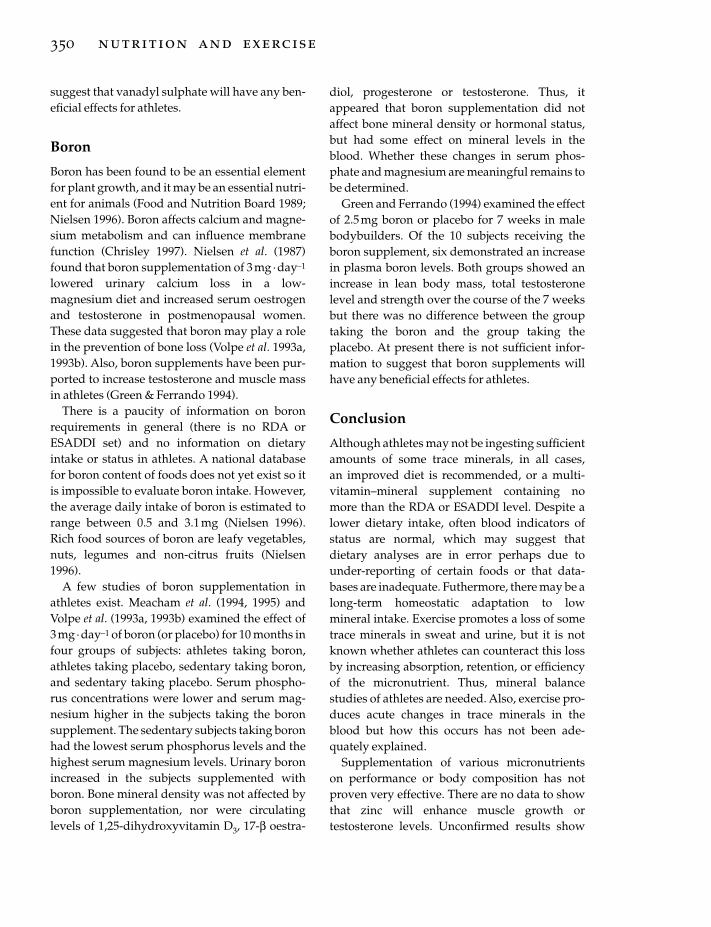
suggest that vanadyl sulphate will have any ben-eficial effects for athletes.
Boron
Boron has been found to be an essential elementfor plant growth, and it may be an essential nutri-ent for animals (Food and Nutrition Board 1989;Nielsen 1996). Boron affects calcium and magne-sium metabolism and can influence membranefunction (Chrisley 1997). Nielsen et al. (1987)found that boron supplementation of 3 mg· day–1
lowered urinary calcium loss in a low-magnesium diet and increased serum oestrogenand testosterone in postmenopausal women.These data suggested that boron may play a rolein the prevention of bone loss (Volpe et al. 1993a,1993b). Also, boron supplements have been pur-ported to increase testosterone and muscle massin athletes (Green & Ferrando 1994).
There is a paucity of information on boronrequirements in general (there is no RDA orESADDI set) and no information on dietaryintake or status in athletes. A national databasefor boron content of foods does not yet exist so itis impossible to evaluate boron intake. However,the average daily intake of boron is estimated torange between 0.5 and 3.1mg (Nielsen 1996).Rich food sources of boron are leafy vegetables,nuts, legumes and non-citrus fruits (Nielsen1996).
A few studies of boron supplementation inathletes exist. Meacham et al. (1994, 1995) andVolpe et al. (1993a, 1993b) examined the effect of 3mg ·day–1 of boron (or placebo) for 10 months infour groups of subjects: athletes taking boron,athletes taking placebo, sedentary taking boron,and sedentary taking placebo. Serum phospho-rus concentrations were lower and serum mag-nesium higher in the subjects taking the boronsupplement. The sedentary subjects taking boronhad the lowest serum phosphorus levels and thehighest serum magnesium levels. Urinary boronincreased in the subjects supplemented withboron. Bone mineral density was not affected byboron supplementation, nor were circulatinglevels of 1,25-dihydroxyvitamin D3, 17-b oestra-
350 nutrition and exercise
diol, progesterone or testosterone. Thus, itappeared that boron supplementation did notaffect bone mineral density or hormonal status,but had some effect on mineral levels in theblood. Whether these changes in serum phos-phate and magnesium are meaningful remains tobe determined.
Green and Ferrando (1994) examined the effectof 2.5 mg boron or placebo for 7 weeks in malebodybuilders. Of the 10 subjects receiving theboron supplement, six demonstrated an increasein plasma boron levels. Both groups showed anincrease in lean body mass, total testosteronelevel and strength over the course of the 7 weeksbut there was no difference between the grouptaking the boron and the group taking theplacebo. At present there is not sufficient infor-mation to suggest that boron supplements willhave any beneficial effects for athletes.
Conclusion
Although athletes may not be ingesting sufficientamounts of some trace minerals, in all cases, an improved diet is recommended, or a multi-vitamin–mineral supplement containing nomore than the RDA or ESADDI level. Despite alower dietary intake, often blood indicators ofstatus are normal, which may suggest thatdietary analyses are in error perhaps due tounder-reporting of certain foods or that data-bases are inadequate. Futhermore, there may be a long-term homeostatic adaptation to lowmineral intake. Exercise promotes a loss of sometrace minerals in sweat and urine, but it is notknown whether athletes can counteract this lossby increasing absorption, retention, or efficiencyof the micronutrient. Thus, mineral balancestudies of athletes are needed. Also, exercise pro-duces acute changes in trace minerals in theblood but how this occurs has not been ade-quately explained.
Supplementation of various micronutrients on performance or body composition has notproven very effective. There are no data to showthat zinc will enhance muscle growth or testosterone levels. Unconfirmed results show

that zinc supplements produced some strengthgains but the data are inconclusive. A few studieshave reported benefits of selenium supplementson antioxidant defense. The purported benefit ofchromium supplementation on increasing leanbody mass has not been proven. Limited data onchromium as a weight loss agent are equivocal.The only published study of vanadyl sulphatedid not show a change in body composition. Thefew studies on boron supplementation did notfind any beneficial effect on bone mass, musclemass, or testosterone levels. It is unlikely thatmicronutrient supplements will enhance perfor-mance or body composition in athletes who havesufficient status. Athletes should maintain ade-quate status by ingesting a variety of foods richin trace minerals.
References
Anderson, R.A. (1992) Chromium, glucose tolerance,and diabetes. Biological Trace Element Research 32,19–24.
Anderson, R.A. & Guttman, H.N. (1988) Trace mineralsand exercise. In Exercise, Nutrition, and EnergyMetabolism (ed. E.S. Horton & R.L. Terjung), pp.180–195. Macmillan, New York.
Anderson, R.A. & Kozlovsky, A.S. (1985) Chromiumintake, absorption and excretion of subjects consum-ing self-selected diets. American Journal of ClinicalNutrition 41, 1177–1183.
Anderson, R.A., Polansky, M.M., Bryden, N.A., Roginski, E.E., Patterson, K.Y. & Reamer, D.C. (1982)Effect of exercise (running) on serum glucose,insulin, glucagon, and chromium excretion. Diabetes31, 212–216.
Anderson, R.A., Polansky, M.M. & Bryden, N.A. (1984)Strenuous running: acute effects on chromium,copper, zinc, and selected clinical variables in urineand serum of male runners. Biological Trace ElementResearch 6, 327–336.
Anderson, R.A., Bryden, N.A., Polansky, M.M. &Deuster, P.A. (1988) Exercise effects on chromiumexcretion of trained and untrained men consuming aconstant diet. Journal of Applied Physiology 64,249–252.
Anderson, R.A., Bryden, N.A., Polansky, M.M. &Reiser, S. (1990) Urinary chromium excretion andinsulinogenic properties of carbohydrates. AmericanJournal of Clinical Nutrition 51, 864–868.
Anderson, R.A., Bryden, N.A., Polansky, M.M. &Thorp, J.W. (1991) Effects of carbohydrate loading
and underwater exercise on circulating cortisol,insulin and urinary losses of chromium and zinc.European Journal of Applied Physiology 63, 146–150.
Anderson, R.A., Bryden, N.A., Polansky, M.M. &Deuster, P.A. (1995) Acute exercise effects on urinarylosses and serum concentrations of copper and zincof moderately trained and untrained men consum-ing a controlled diet. Analyst 120, 867–870.
Anding, J.D., Wolinsky, I. & Klimis-Tavantzis, D.J.(1997) Chromium. In Sports Nutrition: Vitamin andTrace Elements (ed. I. Wolinsky & J.A. Driskell), pp.189–194. CRC Press, Boca Raton.
Aruoma, O.I. (1994) Free radicals and antioxidantstrategies in sports. Journal of Nutritional Biochemistry5, 370–381.
Aruoma, O.I., Reilly, T., MacLaren, D. & Halliwell, B.(1988) Iron, copper and zinc concentrations inhuman sweat and plasma: the effect of exercise.Clinica Chimica Acta 177, 81–88.
Bazzarre, T.L., Scarpino, A., Sigmon, R., Marquart, L.F.,Wu, S.L. & Izurieta, M. (1993) Vitamin-mineral sup-plement use and nutritional status of athletes. Journalof the American College of Nutrition 12, 162–169.
Benson, J., Gillien, D.M., Bourdet, K. & Loosli, A.R.(1985) Inadequate nutrition and chronic calorierestriction in adolescent ballerinas. Physician andSportsmedicine 13, 79–90.
Bordin, D., Sartorelli, L., Bonanni, G., Mastrogiacomo,I. & Scalco, E. (1993) High intensity physical exerciseinduced effects on plasma levels of copper and zinc.Biological Trace Element Research 36, 129–134.
Boylan, M. & Spallholz, J.E. (1997) Selenium. In SportsNutrition: Vitamin and Trace Elements (ed. I. Wolinsky& J.A. Driskell), pp. 195–204. CRC Press, Boca Raton.
Chrisley, B.Mc. (1997) Other substances in foods. InSports Nutrition: Vitamin and Trace Elements (ed.I. Wolinsky & J.A. Driskell), pp. 205–220. CRC Press,Boca Raton.
Clancy, S.P., Clarkson, P.M., DeCheke, M.E. et al. (1994)Effects of chromium picolinate supplementation onbody composition, strength, and urinary chromiumloss in football players. International Journal of SportNutrition 4, 142–153.
Clark, L.C., Combs, G.F., Turnbull, B.W. et al. for theNutritional Prevention of Cancer Study Group(1996) Effects of selenium supplementation forcancer prevention in patients with carcinoma of theskin: a randomized controlled trial. Journal of theAmerican Medical Association 276, 1957–1963.
Clarkson, P.M. (1991) Nutritional ergogenic aids:chromium, exercise, and muscle mass. InternationalJournal of Sport Nutrition 3, 289–293.
Clarkson, P.M. (1995) Antioxidants and physical per-formance. Critical Reviews in Food Science and Nutrition 35, 131–141.
Clarkson, P.M. & Haymes, E.M. (1994) Trace mineral
trace minerals 351

requirements for athletes. International Journal ofSport Nutrition 4, 104–119.
Colditz, G.A. (1996) Selenium and cancer protection:promising results indicate further trials required.Journal of the American Medical Association 276,1984–1985.
Couzy, F., Lafargue, P. & Guezennec, C.Y. (1990) Zincmetabolism in the athlete: influence of training,nutrition and other factors. International Journal ofSports Medicine 11, 263–266.
Deuster, P.A., Kyle, S.B., Moser, P.B., Vigersky, R.A.,Singh, A. & Schoomaker, E.B. (1986) Nutritionalsurvey of highly trained women runners. AmericanJournal of Clinical Nutrition 45, 954–962.
Deuster, P.A., Day, B.A., Singh, A., Douglass, L. &Moser-Veillon, P.B. (1989) Zinc status of highlytrained women runners and untrained women.American Journal of Clinical Nutrition 49, 1295–1301.
Drǎgan, I., Dinu, V., Mohora, M., Cristea, E.,Ploesteanu, E. & Stroescu, V. (1990) Studies regard-ing the antioxidant effects of selenium on top swim-mers. Revue Roumaine de Physiologie 27, 15–20.
Drǎgan, I., Dinu, V., Cristea, E., Mohora, M.,Ploesteanu, E. & Stroescu, V. (1991) Studies regard-ing the effects of an antioxidant compound in topathletes. Revue Roumaine de Physiologie 28, 105–108.
Dressendorfer, R.H. & Sockolov, R. (1980) Hypo-zincemia in runners. Physician and Sportsmedicine 8,97–100.
Dressendorfer, R.H., Wade, C.E., Keen, C.L. & Scaff,J.H. (1982) Plasma mineral levels in marathonrunners during a 20-day road race. Physician andSportsmedicine 10, 113–118.
Duthie, G.G. (1996) Adaptations of the antioxidantdefence systems to chromic exercises. In Human Mus-cular Function during Dynamic Exercise. Vol. 41. Medi-cine and Sport Science (ed. P. Marconnet, B. Saltin, P.Komi & J. Poortmans), pp. 95–101. Karger, Basel.
Duthie, G.G., Robertson, J.D., Maughan, R.J. & Morrice,P.C. (1990) Blood antioxidant status and erythro-cyte lipid peroxidation following distance running.Archive of Biochemistry and Biophysics 282, 78–83.
Evans, G.W. (1989) The effect of chromium picolinateon insulin controlled parameters in humans. Interna-tional Journal of Biosocial and Medical Research 11,163–180.
Fawcett, J.P., Farquhar, S.J., Walker, R.J., Thou, T., Lowe,G. & Goulding, A. (1996) The effect of oral vanadylsulfate on body composition and performance inweight-training athletes. International Journal of SportNutrition 6, 382–390.
Fogelholm, M. (1992) Micronutrient status in femalesduring a 24-week fitness-type exercise programme.Annals of Nutrition and Metabolism 36, 209–218.
Fogelholm, G.M. & Lahtinen, P.K. (1991) Nutritionalevaluation of a sailing crew during a transatlantic
352 nutrition and exercise
race. Scandinavian Journal of Medicine and Science inSports 1, 99–103.
Fogelholm, M., Laakso, J., Lehto, J. & Ruokonen, I.(1991) Dietary intake and indicators of magnesiumand zinc status in male athletes. Nutrition Research 11,1111–1118.
Fogelholm, G.M., Himberg, J., Alopaeus, K., Gref, C.,Laakso, J.T. & Mussalo-Rauhamaa, H. (1992a)Dietary and biochemical indices of nutritional statusin male athletes and controls. Journal of the AmericanCollege of Nutrition 11, 181–191.
Fogelholm, M., Rehunen, S., Gref, C.-G., Laasko, J.T.,Lehto, J.J., Ruokonen, I. & Himberg, J.-J. (1992b)Dietary intake and thiamin, iron and zinc status inelite skiers during different training periods. Interna-tional Journal of Sports Nutrition 2, 351–365.
Food and Nutrition Board (1989) Recommended DietaryAllowances, 10th edn, pp. 205–213, 217–224, 224–230,241–243, 267. National Academy Press, Washington,DC.
Gatteschi, L., Castellani, W., Galvan, P., Parise, G.,Resina, A. & Rubenni, M.G. (1995) Effects of aerobicexercise on plasma chromium concentrations. InSports Nutrition: Minerals and Electrolytes (ed.C.V. Kies & J.A. Driskell), pp. 199–204. CRC Press,Boca Raton.
Gibson, R.S. (1990) Principles of Nutritional Assessment,pp. 532–541. Oxford Press, New York.
Green, N.R. & Ferrando, A.A. (1994) Plasma boron andthe effects of boron supplementation in males. Envi-ronmental Health Perspectives 102, 73–77.
Gutteridge, J.M.C., Rowley, D.A., Halliwell, B., Cooper,D.F. & Heeley, D.M. (1985) Copper and iron com-plexes catalytic for oxygen radical reactions in sweat from human athletes. Clinica Chimica Acta 145,267–273.
Halliwell, B. (1996) Antioxidants. In Present Knowledgein Nutrition, 7th edn (ed. E.E. Ziegler & L.J. Filer), pp.596–603. International Life Sciences Institute, Washington, DC.
Hallmark, M.A., Reynolds, T.H., DeSouza, C.A.,Dotson, C.O., Anderson, R.A. & Roger, M.A. (1996)Effects of chromium and resistive training on musclestrength and body composition. Medicine and Sciencein Sports and Exercise 28, 139–144.
Haralambie, G. (1981) Serum zinc in athletes in train-ing. International Journal of Sports Medicine 2, 135–138.
Hasten, D.L., Rome, E.P., Franks, B.D. & Hegsted, M.(1992) Effects of chromium picolinate on beginningweight training students. International Journal of SportNutrition 2, 343–350.
Hermann, J., Arquitt, A. & Stoecker, B.J. (1994) Effect ofchromium supplementation on plasma lipids,apoproteins, and glucose in elderly subjects. Nutri-tion Research 14, 671–674.
Hübner-Woźniak, E., Lutoslawska, G., Sendecki, W.,

Dentkowski, A., Sawicka, T. & Drozd, J. (1996) Effectsof a 10 week-training on biochemical and hematolog-ical variables in recreational bodybuilders. Biology ofSport 13, 105–112.
Hunt, S.M. & Groff, J.L. (1990) Advanced Nutrition andHuman Metabolism, pp. 286–348. West Publishing, StPaul, MN.
Kaats, G.R., Blum, K., Fisher, J.A. & Adelman, J.A.(1996) Effects of chromium picolinate supple-mentation on body composition: a randomized,double-masked, placebo-controlled study. CurrentTherapeutic Research: Clinical and Experimental 57,747–756.
Kleiner, S.M., Bazzarre, T.L. & Ainsworth, B.E. (1994)Nutritional status of nationally ranked elite body-builders. International Journal of Sport Nutrition 4,54–69.
Krotkiewski, M., Gudmundsson, M., Backstrom, P. &Mandroukas, K. (1982) Zinc and muscle strength andendurance. Acta Physiologica Scandinavica 116,309–311.
Lefavi, R.G., Anderson, R.A., Keith, R.E., Wilson, G.D.,McMillan, J.L. & Stone, M.H. (1992) Efficacy ofchromium supplementation in athletes: emphasis ofanabolism. International Journal of Sport Nutrition 2,111–122.
Lefavi, R.G., Wilson, G.D., Keith, R.E., Anderson, R.A.,Blessing, D.L., Hames, C.G. & McMillan, J.L. (1993)Lipid-lowering effect of a dietary chromium(III)–nicotinic acid complex in male athletes. Nutri-tion Research 13, 239–249.
Levander, O.A. & Burk, R.F. (1996) Selenium. In PresentKnowledge in Nutrition, 7th edn (ed. E.E. Ziegler & L.J.Filer Jr), pp. 320–328. International Life SciencesInstitute, Washington, DC.
Linder, M.C. (1996) Copper. In Present Knowledge inNutrition, 7th edn (ed. E.E. Ziegler & L.J. Filer Jr), pp. 307–319. International Life Sciences Institute,Washington, DC.
Loosli, A.R., Benson, J., Gillien, D.M. & Bourdet, K.(1986) Nutrition habits and knowledge in competi-tive adolescent female gymnasts. Physician andSportsmedicine 14, 118–130.
Lukaski, H.C. (1995) Interactions among indices ofmineral element nutriture and physical performanceof swimmers. In Sports Nutrition: Minerals and Elec-trolytes (ed. C.V. Kies & J.A. Driskell), pp. 267–279.CRC Press, Boca Raton.
Lukaski, H.C. (1997) Zinc. In Sports Nutrition: Vitaminand Trace Elements (ed. I. Wolinsky & J.A. Driskell),pp. 157–175. CRC Press, Boca Raton.
Lukaski, H.C., Bolonchuk, W.W., Klevay, L.M., Milne,D.B. & Sandstead, H.H. (1983) Maximum oxygenconsumption as related to magnesium, copper, andzinc nutriture. American Journal of Clinical Nutrition37, 407–415.
Lukaski, H.C., Bolonchuk, W.W., Klevay, L.M., Milne,D.B. & Sandstead, H.H. (1984) Changes in plasmazinc content after exercise in men fed a low-zinc diet.American Journal of Physiology 247, E88–E93.
Lukaski, H.C., Hoverson, B.S., Gallagher, S.K. &Bolonchuk, W.W. (1990) Physical training andcopper, iron and zinc status of swimmers. AmericanJournal of Clinical Nutrition 51, 1093–1099.
Lukaski, H.C., Bolonchuk, W.W., Siders, W.A. & Milne,D.B. (1996a) Chromium supplementation and resis-tance training: effects of body composition, strength,and trace element status of men. American Journal ofClinical Nutrition 63, 954–965.
Lukaski, H.C., Siders, W.A., Hoverson, B.S. & Gallagher, S.K. (1996b) Iron, copper, magnesium,and zinc status as predictors of swimming perfor-mance. International Journal of Sports Medicine 17,535–540.
McCarty, M.F. (1995) Anabolic effects of insulin on bonesuggest a role for chromium picolinate in preserva-tion of bone density. Medical Hypotheses 45, 241–246.
McCarty, M.F. (1996) Chromium (III) picolinate(Letter). FASEB Journal 10, 365–367.
Malvy, D.J.-M., Arnaud, J., Burtschy, B., Richard, M.-J.,Favier, A., Houot, O. & Amédée-Manesme, O. (1993)Reference values for serum zinc and selenium ofFrench healthy children. European Journal of Epidemiology 9, 155–161.
Manore, M.M., Helleksen, J.M., Merkel, J. & Skinner,J.S. (1993) Longitudinal changes in zinc status inuntrained men: effect of two different 12 week exer-cise training programs and zinc supplementation.Journal of the American Dietetic Association 93,1165–1168.
Marrella, M., Guerrini, F., Tregnaghi, P.L., Nocini, S.,Velo, G.P. & Milanino, R. (1990) Effect on exercise oncopper, zinc and ceruloplasmin levels in blood ofathletes. Metal Ions in Biology and Medicine: Proceed-ings of the 1st International Symposium, 16–19 May, pp.111–113.
Marrella, M., Guerrini, F., Solero, P.L., Tregnaghi, P.L.,Schena, F. & Velo, G.P. (1993) Blood copper and zincchanges in runners after a marathon. Journal of TraceElements Electrolytes and Health Disorders 7, 248–250.
Meacham, S.L., Taper, L.J. & Volpe, S.L. (1994) Effects ofboron supplementation on bone mineral density anddietary, blood, and urinary calcium, phosphorus,magnesium, and boron in female athletes. Environ-mental Health Perspectives 102, 79–82.
Meacham, S.L., Taper, L.J. & Volpe, S.L. (1995) Effect ofboron supplementation on blood and urinarycalcium, magnesium, and phosphorus, and urinaryboron in athletic and sedentary women. AmericanJournal of Clinical Nutrition 61, 341–345.
Moore, R.J. & Friedl, K.E. (1992) Physiology of nutri-tional supplements: chromium picolinate and
trace minerals 353

vanadyl sulfate. National Strength and ConditioningAssociation Journal 14, 47–51.
Newhouse, I.J., Clement, D.B. & Lai, C. (1993) Effects ofiron supplementation and discontinuation on serumcopper, zinc, calcium, and magnesium levels inwomen. Medicine and Science in Sports and Exercise 25,562–571.
Nielsen, F.H. (1996) Other trace elements. In PresentKnowledge in Nutrition, 7th edn (ed. E.E. Ziegler & L.J. Filer Jr), pp. 353–377. International Life SciencesInstitute, Washington, DC.
Nielsen, F.H., Hunt, C.D., Mullen, L.M. & Hunt, J.R.(1987) Effect of dietary boron on mineral, estrogen,and testosterone metabolism in postmenopausalwomen. FASEB Journal 1, 394–397.
Nieman, D.C., Butler, J.V., Pollett, L.M., Dietrich, S.J. &Lutz, R.D. (1989) Nutrient intake of marathonrunners. Journal of the American Dietetic Association 89,1273–1278.
Nishiyama, S., Inomoto, T., Nakamura, T., Higashi, A.& Matsuda, I. (1996) Zinc status related to hemato-logical deficits in women endurance runners. American College of Nutrition 4, 359–363.
Ohno, H., Yahata, T., Hirata, F. et al. (1984) Changes indopamine-Beta-hydroxylase, and copper, and cate-cholamine concentrations in human plasma withphysical exercise. Journal of Sports Medicine 24,315–320.
Ohno, H., Yamashita, K., Doi, R., Yamamura, K.,Kondo, T. & Taniguchi, N. (1985) Exercise-inducedchanges in blood zinc and related proteins inhumans. Journal of Applied Physiology 58, 1453–1458.
Ohno, H., Sato, Y., Ishikawa, M. et al. (1990) Trainingeffects on blood zinc levels in humans. Journal ofSports Medicine and Physical Fitness 30, 247–253.
Ohno, H., Sato, Y., Kizaki, T., Yarnashita, H., Ookawara,T. & Ohira, Y. (1995) Physical exercise and zincmetabolism. In Sports Nutrition: Minerals and Elec-trolytes (ed. C.V. Kies & J.A. Driskell), pp. 129–138.CRC Press, Boca Raton.
Olha, A.E., Klissouras, V., Sullivan, J.D. & Skoryna, S.C.(1982) Effect of exercise on concentration of elementsin the serum. International Journal of Sports Medicine22, 414–425.
Peters, A.J., Dressendorfer, R.H., Rimar, J. & Keen, C.L.(1986) Diet of endurance runners competing in a 20-day road race. Physician and Sportsmedicine 14,63–70.
Prasad, A.S. (1991) Discovery of human zinc deficiencyand studies in an experimental human model. American Journal of Clinical Nutrition 53, 403–412.
Prasad, A.S., Abbasi, A.A., Rabbani, P. & DuMouchelle,E. (1981) Effect of zinc supplementation on serumtestosterone level in adult male sickle cell anemiasubjects. American Journal of Hematology 19, 119–127.
Reeves, P.G. (1997) Copper. In Sports Nutrition: Vitamins
354 nutrition and exercise
and Trace Elements (ed. I. Wolinsky & J.A. Driskell),pp. 175–187. CRC Press, Boca Raton.
Resina, A., Fedi, S., Gatteschi, L. et al. (1990) Compari-son of some serum copper parameters in trainedrunners and control subjects. International Journal ofSports Medicine 11, 58–60.
Robertson, J.D., Maughan, R.J., Duthie, G.G. & Morrice,P.C. (1991) Increased blood antioxidant systems ofrunners in response to training load. Clinical Science80, 611–618.
Rokitzki, L., Logemann, E., Sagredos, A.N., Murphy,M., Wetzel-Roth, W. & Keul, J. (1994) Lipid peroxi-dation and antioxidative vitamins under extremeendurance stress. Acta Physiologica Scandinavica 151,149–158.
Singh, A., Day, B.A., Debolt, J.E., Trostmann, U.H.,Bernier, L.L. & Deuster, P.A. (1989) Magnesium, zinc,and copper status of US Navy SEAL trainees. American Journal of Clinical Nutrition 49, 695–700.
Singh, A., Deuster, P.A. & Moser, P.B. (1990) Zinc andcopper status in women by physical activity andmenstrual status. Journal of Sports Medicine and Physi-cal Fitness 30, 29–36.
Singh, A., Smoak, B.L., Patterson, K.Y., LeMay, L.G.,Veillon, C. & Deuster, P.A. (1991) Biochemical indicesof selected trace minerals in men: effect of stress.American Journal of Clinical Nutrition 53, 126–131.
Singh, A., Evans, P., Gallagher, K.L. & Deuster, P.A.(1993) Dietary intakes and biochemical profiles ofnutritional status of ultramarathoners. Medicine andScience in Sports and Exercise 25, 328–334.
Singh, A., Failla, M.I. & Deuster, P.A. (1994) Exercise-induced changes in immune function: effects of zincsupplementation. Journal of Applied Physiology 76,2298–2303.
Snook, J.T., Cummin, D., Good, P.R. & Grayzar, J. (1995)Mineral and energy status of groups of male andfemale athletes participating in events believed toresult in adverse nutritional status. In Sports Nutri-tion: Minerals and Electrolytes (ed. C.V. Kies & J.A.Driskell), pp. 293–304. CRC Press, Boca Raton.
Stearns, D.M., Belbruno, J.J. & Wetterhahn, K.E. (1995a)A prediction of chromium (III) accumulation inhumans from chromium dietary supplements.FASEB Journal 9, 1650–1657.
Stearns, D.M., Wise, J.P. Sr, Patierno, S.R. & Wetterhahn,K.E. (1995b) Chromium (III) picolinate produceschromosome damage in Chinese hamster ovarycells. FASEB Journal 9, 1643–1649.
Steen, S.N. & McKinney, S. (1986) Nutritional assess-ment of college wrestlers. Physician and Sportsmedi-cine 14, 101–116.
Steen, S.N., Mayer, K., Brownell, K.D. & Wadden, T.A.(1995) Dietary intake of female collegiate heavy-weight rowers. International Journal of Sport Nutrition5, 225–231.

Stoecker, B.J. (1996) Chromium. In Present Knowledge in Nutrition, 7th edn (ed. E.E. Ziegler & L.J. Filer Jr),pp. 344–353. International Life Sciences Institute,Washington, DC.
Tessier, F., Hida, H., Favier, A. & Marconnet, P. (1995a)Muscle GSH-Px activity after prolonged exercisetraining and selenium supplementation. BiologicalTrace Element Research 47, 279–285.
Tessier, F., Margaritis, I., Richard, M., Moynot, C. &Marconnet, P. (1995b) Selenium and training effectsof the glutathione system and aerobic performance.Medicine and Science in Sports and Exercise 27, 390–396.
Toskulkao, C. & Glinsukon, T. (1996) Endurance exer-cise and muscle damage: relationship to lipid peroxi-dation and scavenging enzymes in short and longdistance runners. Japanese Journal of Physical Fitnessand Sports Medicine 45, 63–70.
Trent, L.K. & Thieding-Cancel, D. (1995) Effects ofchromium picolinate on body composition. Journal ofSports Medicine and Physical Fitness 35, 273–280.
Tuya, I.R., Gil, E.P., Marino, M.M., Carra, R.M.G. &Misiego, A.S. (1996) Evaluation of the influence ofphysical activity on the plasma concentrations ofseveral trace metals. European Journal of Applied Physiology 73, 299–303.
Van Rij, A.M., Hall, M.T., Dohm, G.L., Bray, J. & Pories,W.J. (1986) Changes in zinc metabolism followingexercise in human subjects. Biological Trace ElementResearch 10, 99–106.
Volpe, S.L., Taper, L.J. & Meacham, S. (1993a) The rela-tionship between boron and magnesium status andbone mineral density in the human: a review. Magne-sium Research 6, 291–296.
Volpe, S.L., Taper, L.J. & Meacham, S. (1993b) The effectof boron supplementation on bone mineral densityand hormonal status in college female athletes. Medi-cine, Exercise, Nutrition, and Health 2, 323–330.
Wang, W., Heinonen, O., Mäkelä, A., Mäkelä, P. &Näntö, V. (1995) Serum selenium, zinc and copper inSwedish and Finnish orienteers: a comparativestudy. Analyst 120, 837–840.
Weight, L.M., Noakes, T.D., Labadarios, D., Graves, J.,Jacobs, P. & Berman, P.A. (1988) Vitamin and mineralstatus of trained athletes including the effects of sup-plementation. American Journal of Clinical Nutrition47, 186–191.
Worme, J.D., Doubt, T.J., Singh, A., Ryan, C.J., Moses,F.M. & Deuster, P.A. (1990) Dietary patterns, gas-trointestinal complaints, and nutrition knowledge ofrecreational triathletes. American Journal of ClinicalNutrition 51, 690–697.
trace minerals 355

Introduction
The optimal production, control and efficiency ofhuman energy is the key composite determinantof all muscular power for movement in sport. Ingeneral, as noted in previous chapters, sport sci-entists recognize three major human muscleenergy systems important for the generation ofadenosine triphosphate (ATP) for muscle con-traction and subsequent power production. The ATP–phosphocreatine (ATP–PCr) energysystem, which uses adenosine triphosphate andcreatine phosphate as its fuel sources, generatesmaximal anaerobic power for very short periodsof time, such as 10s for a 100-m dash. The lacticacid energy system, which utilizes carbohydratevia anaerobic glycolysis, is capable of sustaininghigh anaerobic power production, such as 45sfor a 400-m run. The oxidative energy system,which uses carbohydrates via aerobic glycolysisand fats via b-oxidation, can sustain aerobicpower for prolonged endurance events, such as130min for a 42.2-km marathon.
The three human muscle energy systemsdepend on various dietary nutrients for optimalfunctioning. Dietary carbohydrates and fats, twoof the macronutrients, provide the main sourcesof energy. Protein, another macronutrient, mayalso serve as an energy source, but as the amino
acids released by protein degradation are eitherreutilized or oxidized, the amount of protein oxi-dized per day must be replenished by dietaryintake. Protein is utilized primarily to synthesizemuscle tissue that serves as the structural basis for energy production, and to synthesizeenzymes, hormones, and other physiologicalsubstances that, along with vitamins and miner-als (micronutrients), help regulate the myriad of neural, hormonal and metabolic processesinvolved in the release of energy from carbohy-drates and fats for use during sport-related exer-cise tasks.
Most sport nutritionists recommend that ath-letes consume a balanced diet of macronutrientsand micronutrients to provide adequate energy,regulate metabolic processes properly, and main-tain an optimal body mass specific to their sport.In general, dietary guidelines for healthy eatingdeveloped for the average population are alsoapplicable to athletes. However, considerableresearch effort has been expended to determinewhether or not dietary manipulation may be ableto enhance sport performance, and much of this research has focused on the identificationand development of specific nutritionalergogenic aids.
Nutritional ergogenic aids are purported toenhance sport performance beyond that associ-ated with the typical balanced diet. The majorcategories targeted to physically active individu-als include: megadoses of essential nutrients,such as 1000 mg of vitamin C; engineered meta-bolic byproducts of essential nutrients, such as b-
Chapter 26
Nutritional Ergogenic Aids*
MELVIN H. WILLIAMS AND BRIAN C. LEUTHOLTZ
356
*Small segments of this chapter have been extractedfrom Melvin H. Williams, The Ergogenics Edge: Pushingthe Limits of Sports Performance, Human Kinetics Pub-lishers, Champaign, IL, 1998.

hydroxy-b-methylbutyrate (HMB) from leucine;nutraceuticals or phytochemicals, non-drug substances found in plants that are purported toaffect metabolism, such as ginseng; non-essentialnutrients, such as creatine; and drug nutrients,legal drugs found naturally in foods or bever-ages consumed by humans, such as alcohol andcaffeine. Examples of these nutritional ergogenicaids can be categorized as follows.1 Megadoses of essential nutrients:
(a) amino acids: arginine, ornithine, lysine and tryptophan;(b) vitamins: vitamin B12, vitamin C andvitamin E;(c) minerals: boron, chromium and phosphates.
2 Engineered metabolic by-products of essentialnutrients:
(a) HMB (b-hydroxy-b-methylbutyrate);(b) DHAP (dihydroxyacetone plus pyruvate);(c) FDP (fructose diphosphate).
3 Non-essential nutrients:(a) carnitine;(b) choline;(c) glycerol;(d) inosine.
4 Plant extracts (phytochemicals):(a) gamma oryzanol;(b) ginseng;(c) wheat germ oil;(d) yohimbine.
5 Drug nutrients:(a) alcohol;(b) caffeine.Nutritional ergogenic aids may be used in
attempts to increase sport performance invarious ways, such as: increased energy supplyin the muscle (e.g. creatine supplements);increased energy-releasing metabolic processesin the muscle (e.g. l-carnitine supplements);enhanced oxygen delivery to the muscle (e.g.iron supplements); increased oxygen utilizationin the muscle (e.g. coenzyme Q10 supplements);decreased production or accumulation offatigue-causing metabolites in the muscle (e.g. sodium bicarbonate supplements); andimproved neural control of muscle contraction
(e.g. choline supplements). Because all nutrientsmay be involved in energy production or controlin one way or another, every nutrient may bepotentially ergogenic for specific sport tasks. Thepotential capacity of many specific essential and non-essential nutrients to enhance the threehuman energy systems is detailed in other chap-ters of this volume, including the role of creatinesupplementation to enhance the ATP–PCrenergy system, the ingestion of sodium bicarbon-ate to improve performance in sport events asso-ciated with the lactic acid energy system, anddietary carbohydrate regimens to increaseaerobic endurance capacity associated with theoxygen energy system.
This brief review will focus on several nutri-tional ergogenics commonly marketed to ath-letes as dietary supplements with allegedergogenic properties to improve performance in(i) strength/power sport tasks, and (ii) aerobicendurance sport tasks.
Strength/power sport tasks
Arginine, ornithine and lysine
theory
Human growth hormone (hGH), a polypeptide,is released from the pituitary gland into thebloodstream and affects all body tissues. Supple-mentation with various amino acids, particularlyarginine, ornithine and lysine, has been used in attempts to stimulate the release of hGH.Increased serum levels of hGH in turn maystimulate production and release of insulin-likegrowth factor-1 that may lead to increases inmuscle mass and strength. Additionally, aminoacid supplementation is theorized to stimulatethe release of insulin, another anabolic hormone.
efficacy
In early research, Elam (1989) reported that inconjunction with a weight-training programme,supplementation with arginine (1g ·day–1) andornithine (1g ·day–1) reduced body fat, increased
nutritional ergogenic aids 357
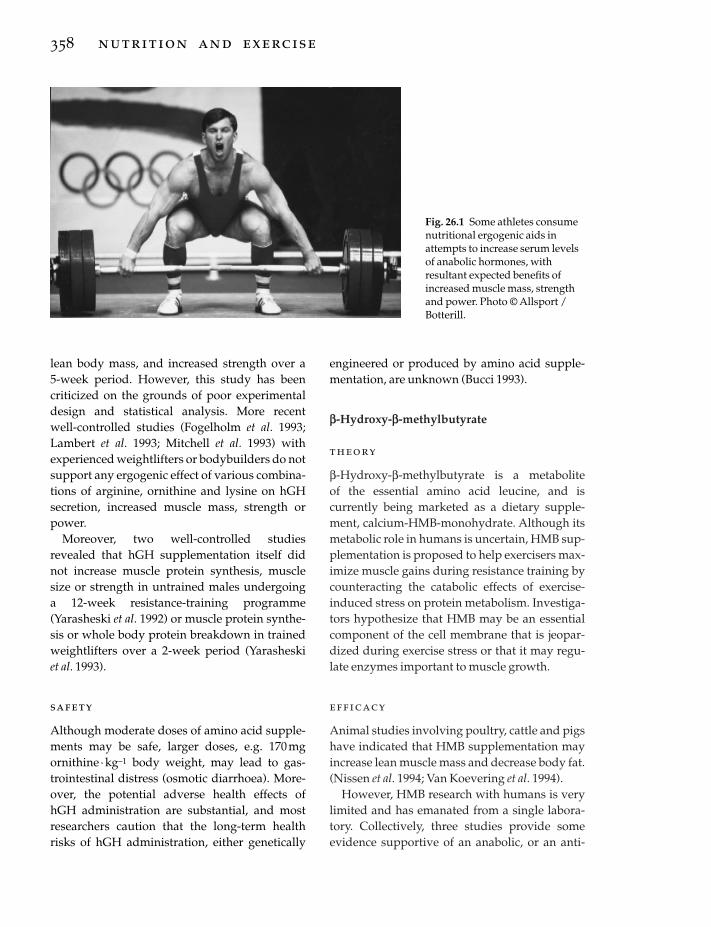
lean body mass, and increased strength over a 5-week period. However, this study has beencriticized on the grounds of poor experimentaldesign and statistical analysis. More recent well-controlled studies (Fogelholm et al. 1993;Lambert et al. 1993; Mitchell et al. 1993) withexperienced weightlifters or bodybuilders do notsupport any ergogenic effect of various combina-tions of arginine, ornithine and lysine on hGHsecretion, increased muscle mass, strength orpower.
Moreover, two well-controlled studiesrevealed that hGH supplementation itself didnot increase muscle protein synthesis, musclesize or strength in untrained males undergoing a 12-week resistance-training programme (Yarasheski et al. 1992) or muscle protein synthe-sis or whole body protein breakdown in trainedweightlifters over a 2-week period (Yarasheski et al. 1993).
safety
Although moderate doses of amino acid supple-ments may be safe, larger doses, e.g. 170mgornithine · kg–1 body weight, may lead to gas-trointestinal distress (osmotic diarrhoea). More-over, the potential adverse health effects of hGH administration are substantial, and mostresearchers caution that the long-term healthrisks of hGH administration, either genetically
358 nutrition and exercise
engineered or produced by amino acid supple-mentation, are unknown (Bucci 1993).
b-Hydroxy-b-methylbutyrate
theory
b-Hydroxy-b-methylbutyrate is a metabolite of the essential amino acid leucine, and is currently being marketed as a dietary supple-ment, calcium-HMB-monohydrate. Although itsmetabolic role in humans is uncertain, HMB sup-plementation is proposed to help exercisers max-imize muscle gains during resistance training bycounteracting the catabolic effects of exercise-induced stress on protein metabolism. Investiga-tors hypothesize that HMB may be an essentialcomponent of the cell membrane that is jeopar-dized during exercise stress or that it may regu-late enzymes important to muscle growth.
efficacy
Animal studies involving poultry, cattle and pigshave indicated that HMB supplementation mayincrease lean muscle mass and decrease body fat.(Nissen et al. 1994; Van Koevering et al. 1994).
However, HMB research with humans is verylimited and has emanated from a single labora-tory. Collectively, three studies provide some evidence supportive of an anabolic, or an anti-
Fig. 26.1 Some athletes consumenutritional ergogenic aids inattempts to increase serum levelsof anabolic hormones, withresultant expected benefits ofincreased muscle mass, strengthand power. Photo © Allsport /Botterill.

catabolic, effect of HMB supplementation. In onestudy, HMB supplementation (1.5 or 3.0 g ·day–1), in a dose–response manner, induced sig-nificant improvements in lean body mass andmuscle strength in untrained men over a 3-weekperiod (Nissen et al. 1996b). In two other studies,HMB supplementation (3 g · day–1) increasedstrength in physically active males in the 1-repetition maximal bench press (Nissen et al.1996b) and decreased body fat and increasedlean body mass and bench press strength in bothtrained and untrained subjects over a 4-weekperiod of resistance training (Nissen et al. 1996a).
Although these preliminary findings areimpressive, replication from other laboratories is needed. Additionally, each study includedseveral threats to internal validity, including theuse of unorthodox measures of muscle strengthor absence of a true placebo, and in tests of multi-ple dependent variables, such as multiple meas-ures of strength, HMB benefited performance insome tests, but not all.
safety
Studies in humans at doses of 1.5–3.0 g ·day–1 forseveral weeks have reported no acute adverseeffects. Chronic supplementation has not evi-denced adverse effects in animals, but no dataappear to be available for humans.
Herbal products
theory
Numerous herbal products have been marketedas potential ergogenics for physically active indi-viduals. Three such products have been mar-keted as bodybuilding supplements as a meansto enhance muscle size and strength: g-oryzanol,a ferulic acid ester derived from rice bran oil; yohimbine (yohimbe), a nitrogen-containingalkaloid from the bark of the yohimbe tree; andsmilax, an extract of phytosterols from the driedroots of Smilax officinalis or various forms of sar-saparilla. Advertisers theorize that these herbalproducts contain the male hormone testosterone
or stimulate its endogenous production, thusinducing increases in muscle size and strength.
efficacy
Ascientific literature review revealed no researchto validate the claims made by the manufacturersthat g-oryzanol, smilax or yohimbine either raise serum testosterone levels or induce gains inmuscle size or strength, confirming the findingsof previous scientific reviews (Wheeler & Garleb1991; Grunewald & Bailey 1993). Wheeler and Garleb (1991) speculated that g-oryzanol mightactually decrease serum testosterone. Well-controlled research with these herbal products,and other plant-derived purported ergogenicssuch as dehydroepiandrosterone (DHEA), islimited, but that which is available does not sub-stantiate advertising claims. For example, Fryand others (1997) recently reported that g-oryzanol supplementation (500mg ·day–1 for 9weeks), in comparison to a placebo condition,did not increase circulating concentrations oftestosterone or improve 1-repetition maximummuscular strength in the bench press or squatexercise.
safety
Although herbal dietary supplements may besafe, most lack appropriate safety data. Somepreparations have been reported to causevarious health problems, including anaphylacticreactions.
Aerobic endurance sport tasks
Phosphorus (phosphates)
theory
Dietary phosphates, the source of the essentialnutrient phosphorus, are incorporated intomany compounds in the body that are involvedin energy metabolism, such as ATP as an energysubstrate, thiamin pyrophosphate as a vitamincofactor, sodium phosphate as a buffer, and 2,3-diphosphoglycerate (2,3-DPG) for red blood cell
nutritional ergogenic aids 359
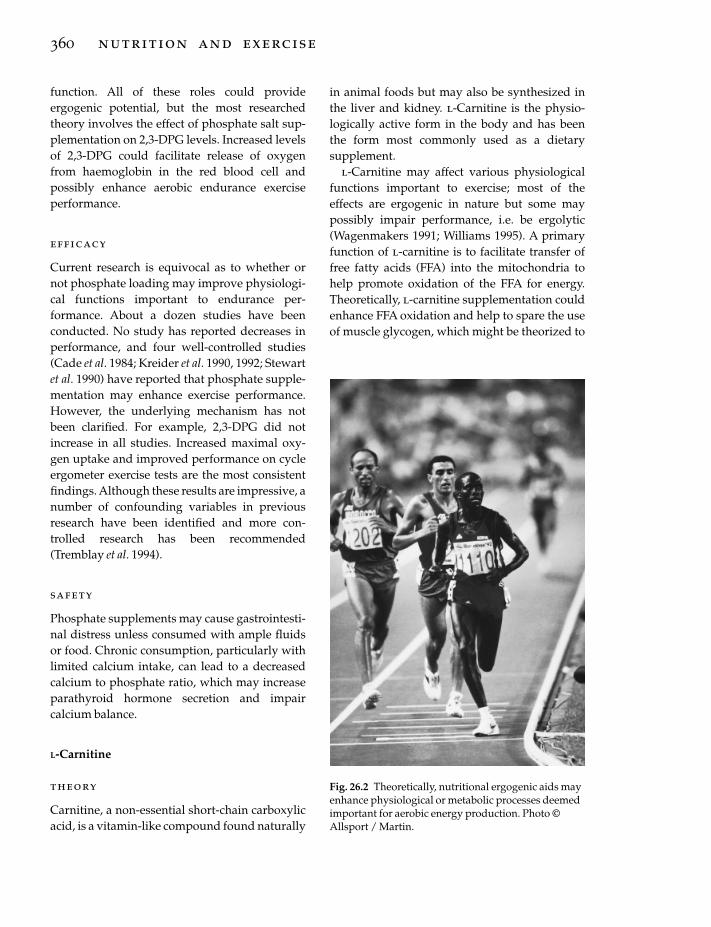
function. All of these roles could provideergogenic potential, but the most researchedtheory involves the effect of phosphate salt sup-plementation on 2,3-DPG levels. Increased levelsof 2,3-DPG could facilitate release of oxygenfrom haemoglobin in the red blood cell and possibly enhance aerobic endurance exerciseperformance.
efficacy
Current research is equivocal as to whether ornot phosphate loading may improve physiologi-cal functions important to endurance per-formance. About a dozen studies have beenconducted. No study has reported decreases inperformance, and four well-controlled studies(Cade et al. 1984; Kreider et al. 1990, 1992; Stewartet al. 1990) have reported that phosphate supple-mentation may enhance exercise performance.However, the underlying mechanism has notbeen clarified. For example, 2,3-DPG did notincrease in all studies. Increased maximal oxy-gen uptake and improved performance on cycleergometer exercise tests are the most consistentfindings. Although these results are impressive, anumber of confounding variables in previousresearch have been identified and more con-trolled research has been recommended (Tremblay et al. 1994).
safety
Phosphate supplements may cause gastrointesti-nal distress unless consumed with ample fluidsor food. Chronic consumption, particularly withlimited calcium intake, can lead to a decreasedcalcium to phosphate ratio, which may increaseparathyroid hormone secretion and impaircalcium balance.
L-Carnitine
theory
Carnitine, a non-essential short-chain carboxylicacid, is a vitamin-like compound found naturally
360 nutrition and exercise
in animal foods but may also be synthesized inthe liver and kidney. l-Carnitine is the physio-logically active form in the body and has been the form most commonly used as a dietary supplement.
l-Carnitine may affect various physiologicalfunctions important to exercise; most of theeffects are ergogenic in nature but some may possibly impair performance, i.e. be ergolytic(Wagenmakers 1991; Williams 1995). A primaryfunction of l-carnitine is to facilitate transfer offree fatty acids (FFA) into the mitochondria tohelp promote oxidation of the FFA for energy.Theoretically, l-carnitine supplementation couldenhance FFA oxidation and help to spare the useof muscle glycogen, which might be theorized to
Fig. 26.2 Theoretically, nutritional ergogenic aids mayenhance physiological or metabolic processes deemedimportant for aerobic energy production. Photo ©Allsport / Martin.

improve prolonged aerobic endurance capacity.Additionally, by decreasing the ratio of acetyl-coenzyme A (CoA) to CoA and hence stimulatingthe activity of pyruvate dehydrogenase, l-carnitine supplementation may be theorized tofacilitate the oxidation of pyruvate. Such aneffect could reduce lactic acid accumulation andimprove anaerobic endurance exercise perfor-mance (Wagenmakers 1991). On the other hand,the increased oxidation of glucose could lead toan earlier depletion of muscle glycogen andimpair performance, an ergolytic effect (Wagenmakers 1991).
efficacy
Although l-carnitine supplementation willincrease plasma levels of carnitine, it has notbeen shown to consistently increase muscle car-nitine levels, the site of its action relative to theuse of FFA for energy production during exercise(Wagenmakers 1991; Williams 1995). The dataare equivocal relative to the effects of l-carnitinesupplementation on the use of FFA during exer-cise and V
.o2max., with some studies providing
evidence of enhanced FFA utilization andincreased V
.o2max. and other studies showing no
effect on energy metabolism (Kanter & Williams1995; Williams 1995; Heinonen 1996). On theother hand, research data clearly indicate that l-carnitine supplementation does not affect lacticacid accumulation in a fashion that may be con-sidered to be ergogenic (Kanter & Williams 1995;Williams 1995). Also, in general, in those studiesthat included physical performance measures, l-carnitine supplementation has not been shownto enhance either aerobic or anaerobic exerciseperformance (Kanter & Williams 1995; Williams1995). However, research is needed to investigatethe potential ergogenic effects of chronic l-carnitine supplementation on prolonged aerobicendurance exercise tasks, such as marathonrunning, to test the possibility of muscle glyco-gen sparing and subsequent improved perfor-mance. Colambani and others (1996) found thatacute supplementation of l-carnitine (2g · 2h–1
before the events) had no significant effect on
performance in either a marathon or a 20-km run,but this dose may have been insufficient com-pared to chronic supplementation protocols.
safety
l-Carnitine appears to be safe in dosages utilizedin these studies, although large doses may causediarrhoea. Individuals should not use supple-ments containing d-carnitine. The d-carnitineisomer may impair the synthesis of l-carnitinein the body leading to symptoms of l-carnitinedeficiency, including myopathy and muscularweakness.
Coenzyme Q10
theory
Coenzyme Q10 (CoQ10), a non-essential nutrient,is a lipid with characteristics common to vita-mins. It is located primarily in the mitochondriaof the cells, such as heart and muscle cells, and isinvolved in the processing of oxygen for the pro-duction of cellular energy. Increased processingof oxygen could increase sport performance in aerobic endurance events. CoQ10 is also an antioxidant. CoQ10 is also referred to asubiquinone, or ubiquinone-10.
efficacy
Bucci (1993) cites six studies showing beneficialeffects of CoQ10 supplementation to varioussubject populations, but these studies appearedin the proceedings of a conference and do notappear to have been published in peer-reviewedjournals. Moreover, each study suffered one ormore experimental design flaws, e.g. no controlgroup (Williams 1999).
A recent review of six well-controlled scientificstudies involving CoQ10 supplementation (ª70–150mg ·day–1 for 4–8 weeks) either adminis-tered separately or in combination with otherputative ergogenic nutrients, indicated thatalthough blood levels of CoQ10 may be increased,there was no effect on lipid peroxidation, sub-
nutritional ergogenic aids 361

strate utilization, serum lactate levels, oxygenuptake, cardiac function or anaerobic thresholdduring submaximal exercise or serum lactatelevels and oxygen uptake during maximal exer-cise. Additionally, there was no effect on time toexhaustion on a cycle ergometer in two studies(Williams 1999).
safety
Bucci (1993) indicates that the long-term safety of CoQ10 has been thoroughly documented,although others indicate that it may actuallyserve as a pro-oxidant and generate free radicals(Demopoulous et al. 1986). In a recent study,Malm and others (1996) reported evidence ofmuscle tissue damage in exercising subjects whowere supplemented with 120mg CoQ10 · day–1
for 20 days.
Choline
theory
Choline, a non-essential nutrient, is an aminewidely distributed in foods and may also be syn-thesized in the body. Its primary metabolic rolein humans is to serve as a precursor for the formation of phosphatidylcholine (lecithin) andother essential components of cell membranesand for the formation of acetylcholine, the neuro-transmitter at the myoneural junction that initiates electrical events in muscle contraction.Conlay et al. (1992) reported significantly lower plasma choline levels following a 42.2-kmmarathon, suggestive as an aetiologic factor inthe development of fatigue because of the possi-bility of decreased acetylcholine production and resultant impaired muscular contractility.Theoretically, choline supplementation willenhance acetylcholine synthesis and preventacetylcholine depletion and subsequent fatiguein endurance events.
efficacy
Von Allwörden et al. (1993) noted that lecithin
362 nutrition and exercise
supplementation helped prevent a decrease in serum choline in triathletes and adolescentrunners following long-term hard physicalstress, but they did not evaluate the effects onperformance. No studies of choline supplemen-tation and physical performance were presentedin a recent review (Kanter & Williams 1995). Sub-sequent to this review, a double-blind, placebo-controlled, crossover study with trained malecyclists, using a single dosage of 2.43 g cholinebitartrate, reported that although there was a sig-nificant increase in serum choline, comparedwith the placebo there were no significant effectson time to exhaustion in either a high intensity(150% V
.o2max.) or a prolonged (70% V
.o2max.) cycle
exercise test (Spector et al. 1995). At the presenttime, there are no data to support choline supple-mentation as an effective ergogenic, but confirm-ing research is desirable.
safety
Choline is a natural dietary component andsmall supplemental doses are not consideredunsafe.
Inosine
theory
Inosine, a non-essential nutrient, is a nucleoside.Some in vitro research has led to the theory thatinosine supplementation increases the amount of 2,3-DPG in the red blood cell. Theoretically,increased levels of 2,3-DPG may facilitate therelease of oxygen from the red blood cells to themuscle and enhance aerobic endurance exercise.
efficacy
Only two well-controlled studies have evaluatedthe purported ergogenic effect of inosine supple-mentation. Two days of inosine supplementation(6000 mg· day–1) exerted no significant effect onheart rate, ventilation, oxygen consumption, orlactic acid production in highly trained runnersduring both submaximal and maximal exercise,

nor was there any effect on performance in a 4.8-km treadmill run for time (Williams et al. 1990).Five days of inosine supplementation (5000 mg ·day–1) did not influence peak power, end power,a fatigue index, total work, or post-test lactate incompetitive male cyclists undertaking severalcycle ergometer exercise tasks (Starling et al.1996). In both studies, inosine supplementationactually impaired performance in some of thetests, including run time to exhaustion in a peakoxygen uptake test (Williams et al. 1990) and time to fatigue in a supramaximal cycling sprint(Starling et al. 1996).
safety
Inosine supplementation appears to be relativelysafe, but may increase production of uric acidwhich could lead to complications in thoseafflicted with gout.
Glycerol
theory
Glycerol is an alcohol derived from triglycerides.Investigators theorize that a combination of glycerol–water supplementation may be a moreeffective hyperhydration technique than waterhyperhydration alone. Increasing body waterstores may be theorized to enhance aerobicendurance performance, either by increasingblood volume or by increasing resistance todehydration while exercising under heat-stressenvironmental conditions.
efficacy
Glycerol-induced hyperhydration (ª1g glycerol ·kg–1 body weight with 20–25 ml water · g–1 glyc-erol), when compared with water hyperhy-dration alone, has been shown to increase totalbody water, including blood volume, to a greaterextent (DeLuca et al. 1993; Freund et al. 1993;Sawka et al. 1993). Several studies have shownthat glycerol-induced hyperhydration improvescardiovascular responses, temperature regula-
tion, and cycling exercise performance underwarm/hot environmental conditions (Lyons et al. 1990; Montner et al. 1992). However, Lamband others (1997) reported that glycerol-inducedhyperhydration exerted no significant effect ontemperature regulation, physiological or meta-bolic responses to exercise, or prolonged cyclingperformance. Additional research is needed tohelp resolve these contradictory findings,particularly so in sports in which the extra bodymass needs to be moved, such as distancerunning.
safety
Although the dosages used in these studiesappear to be safe, larger doses may lead to abnor-mal pressures in tissue spaces.
Ginseng
theory
Ginseng, a plant extract, is a generic term encom-passing a wide variety of compounds derivedfrom the family Araliaceae. The ergogenic effectof ginseng is attributed to specific glycosides,also referred to as ginseng saponins or gin-senosides. The specific physiological effects ofginseng extracts depend on the plant species, thevarious forms including Chinese or Koreanginseng (Panax ginseng), American ginseng (P.quinquefolium), Japanese ginseng (P. japonicum)and Russian/Siberian ginseng (Eleutherococcussenticosus). Although the mechanism underlyingthe alleged ergogenicity of ginseng on physicalperformance has not been defined, theoriesinclude stimulation of the hypothalamic–pituitary–adrenal cortex axis and increased resistance to the stress of exercise, enhancedmyocardial metabolism, increased haemoglobinlevels, vasodilation, increased oxygen extractionby muscles, and improved mitochondrial metab-olism in the muscle, all of which theoreticallycould enhance aerobic exercise performance(Dowling et al. 1996).
nutritional ergogenic aids 363

efficacy
There are very few well-controlled studies sup-porting an ergogenic effect of ginseng supple-mentation. In their major recent review of the ergogenic properties of ginseng, Bahrke andMorgan (1994) indicated that because of method-ological and statistical shortcomings, there is nocompelling evidence to indicate ginseng supple-mentation consistently enhances human physi-cal performance and there remains a need forwell-designed research to address this issue. Onerecent well-designed study (Pieralisi et al. 1991)did find an ergogenic effect of Geriatric Phar-maton (a preparation including ginseng G115and other elements, including dimethyl-aminoethanol) on various physiologic variables,including V
.o2max., and performance during the
Bruce treadmill protocol. However, the investi-gators noted that the ergogenic effect is attrib-uted to the total preparation used, i.e. GeriatricPharmaton, and not to the standardized ginsengG115, because some research has supported a beneficial effect of dimethylaminoethanol bitartrate, possibly by affecting favourably the choline–acetylcholine complex. However,several recent studies with appropriate designshave not reported any benefits to endurance per-formance. For example, no significant ergogeniceffects were associated with 6 weeks of Eleuthero-coccus senticosus Maxim L (ESML) supplemen-tation in highly trained runners on anymetabolic, psychological or performance para-meters measured in both a submaximal andmaximal aerobic exercise task, including heartrate, V
.o2, V
.E, V
.E/V
.o2, and respiratory exchange
ratio during both exercise and recovery, ratingsof perceived exertion during exercise, serum(lactate) following exercise, and run time toexhaustion in a maximal test (Dowling et al.1996). Additionally, Morris and others (1996), in adouble-blind, placebo-controlled study, reportedno effect of a standardized ginseng extract (8 or16mg ·kg–1 body mass for 7 days) on ratings ofperceived exertion or time to exhaustion on acycle ergometer test.
Nevertheless, quality research evidence
364 nutrition and exercise
regarding the effect of ginseng supplementationon exercise performance is limited and more con-trolled research is needed with varying types,dosages, and physical performance parameters.
safety
Animal studies indicate that extracts of ginsenghave a low acute or chronic toxicity and the dosesnormally used with humans are regarded as safe. However, Beltz and Doring (1993) noted aginseng-abuse syndrome has been reported,with such symptoms as hypertension, nervous-ness, sleeplessness and oedema.
Conclusion
Nutritional ergogenics have been used since timeimmemorial, and will continue to be used as longas athletes believe they may gain a competitiveadvantage. However, before using such supple-ments for their purported ergogenic effects, oneshould address the following questions.
Is it effective? If the supplement has not beenshown to be effective, either by appropriatelydesigned research or repeated personal experi-ences, there is no reason to buy it.
Is it safe? Most nutrient and dietary supple-ments are presumed to be safe if consumed inrecommended dosages. However, athletes oftenbelieve that if one is good, 10 is better, and maytake amounts in excess of normal needs (Burke &Read 1993). Excess amounts of various nutrientsand dietary supplements may pose health risksto some individuals.
Is it legal? Most nutritional ergogenics are con-sidered legal because they are regulated as foodor dietary supplements, not drugs. However, thesame dietary supplements may contain drugs,such as caffeine and ephedrine, which may leadto a positive doping test.
Athletes should be allowed to utilize any effec-tive, safe and legal nutritional supplement inattempts to enhance sport performance, just asthey should be able to use the most effective andlegal equipment specific to their sport whichmay provide a mechanical edge.

References
Bahrke, M. & Morgan, W. (1994) Evaluation of theergogenic properties of ginseng. Sports Medicine 18,229–248.
Beltz, S. & Doering, P. (1993) Efficacy of nutritional sup-plements used by athletes. Clinical Pharmacy 12,900–908.
Bucci, L. (1993) Nutrients as Ergogenic Aids for Sports andExercise. CRC Press, Boca Raton, FL.
Burke, L. & Read, R. (1993) Dietary supplements insport. Sports Medicine 15, 43–65.
Cade, R., Conte, M., Zauner, C. et al. (1984) Effects ofphosphate loading on 2,3-diphosphoglycerate andmaximal oxygen uptake. Medicine and Science inSports and Exercise 16, 263–68.
Colombani, P., Wenk, C., Kunz, I. et al. (1996) Effects ofL-carnitine supplementation on physical perfor-mance and energy metabolism of endurance-trainedathletes: a double-blind crossover field study. Euro-pean Journal of Applied Physiology 73, 434–439.
Conlay, L., Sabounjian, L. & Wurtman, R. (1992) Exer-cise and neuromodulators: choline and acetylcholinein marathon runners. International Journal of SportsMedicine 13, S141–42.
DeLuca, J., Freund, B., Montain, S., Latzka, W. &Sawka, M. (1993) Hormonal responses to hyperhy-dration with glycerol vs. water alone (Abstract).Medicine and Science in Sports and Exercise 25, S36.
Demopoulous, H., Santomier, J., Seligman, M., Hogan,P. & Pietronigro, D. (1986) Free radical pathology:rationale and toxicology of antioxidants and othersupplements in sports medicine and exercise science.In Sport, Health and Nutrition (ed. F. Katch), pp.139–189. Human Kinetics, Champaign, IL.
Dowling, E., Redondo, D., Branch, J., Jones, S.,McNabb, G. & Williams, M. (1996) Effect of Eleuthero-coccus senticosus on submaximal and maximal exer-cise performance. Medicine and Science in Sports andExercise 28, 482–489.
Elam, R. (1989) Effects of arginine and ornithine onstrength, lean body mass and urinary hydroxypro-line in adult males. Journal of Sports Medicine andPhysical Fitness 29, 52–56.
Fogelholm, M., Nagueri, H., Kiilavuori, K. & Haarkaonen, M. (1993) No effects on serum humangrowth hormone and insulin in male weightlifters.International Journal of Sport Nutrition 3, 290–297.
Freund, B., Montain, S., McKay, J., Laird, J., Young, A. &Sawka, M. (1993) Renal responses to hyperhydrationusing aqueous glycerol vs. water alone provideinsight to the mechanism for glycerol’s effectiveness(Abstract). Medicine and Science in Sports and Exercise25, S35.
Fry, A., Bonner, E., Lewis, D., Johnson, R., Stone, M. &
Kraemer, W. (1997) The effects of gamma-oryzanolsupplementation during resistance exercise training.International Journal of Sport Nutrition 7, 318–329.
Grunewald, K. & Bailey, R. (1993) Commercially mar-keted supplements for bodybuilding athletes. SportsMedicine 15, 90–103.
Heinonen, O. (1996) Carnitine and physical exercise.Sports Medicine 22, 109–132.
Kanter, M. & Williams, M. (1995) Antioxidants, carni-tine and choline as putative ergogenic aids. Interna-tional Journal of Sport Nutrition 5, S120–131.
Kreider, R., Miller, G., Williams, M., Somma, C. &Nassar, T. (1990) Effects of phosphate loading onoxygen uptake, ventilatory anaerobic threshold, andrun performance. Medicine and Science in Sports andExercise 22, 250–56.
Kreider, R., Miller, G., Schenck, D. et al. (1992) Effects of phosphate loading on metabolic and myocardialresponses to maximal and endurance exercise. Inter-national Journal of Sport Nutrition 2, 20–47.
Lamb, D., Lightfoot, W. & Myhal, M. (1997) Prehydra-tion with glycerol does not improve cycling perfor-mance vs. 6% CHO-electrolyte drink (Abstract).Medicine and Science in Sports and Exercise 29, S249.
Lambert, M., Hefer, J., Millar, R. & Macfarlane, P. (1993)Failure of commercial oral amino acid supplementsto increase serum growth hormone concentrations inmale bodybuilders. International Journal of SportNutrition 3, 298–305.
Lyons, T., Riedesel, M., Meuli, L. & Chick, T. (1990)Effects of glycerol-induced hyperhydration prior toexercise in the heat on sweating and core tempera-ture. Medicine and Science in Sports and Exercise 22,477–483.
Malm, C., Svensson, M., Sjoberg, B., Ekblom, B. &Sjodin, B. (1996) Supplementation with ubiquinone-10 causes cellular damage during intense exercise.Acta Physiologica Scandinavica 157, 511–512.
Mitchell, M., Dimeff, R. & Burns, B. (1993) Effects ofsupplementation with arginine and lysine on bodycomposition, strength and growth hormone levels inweightlifters (Abstract). Medicine and Science in Sportsand Exercise 25, S25.
Montner, P., Chick, T., Riedesel, M., Timms, M., Stark,D. & Murata, G. (1992) Glycerol hyperhydration andendurance exercise (Abstract). Medicine and Science inSports and Exercise 24, S157.
Morris, A., Jacobs, I., McLellan, T., Klugerman, A.,Wang, L. & Zamecnik, J. (1996) No ergogenic effect ofginseng ingestion. International Journal of Sport Nutrition 6, 263–271.
Nissen, S., Faidley, T., Zimmerman, D., Izard, R. &Fisher, C. (1994) Colostral milk fat percentage andpig performance are enhanced by feeding the leucinemetabolite b-hydroxy-b-methyl butyrate to sows.Journal of Animal Science 72, 2331–2337.
nutritional ergogenic aids 365
Nissen, S., Panton, L., Wilhelm, R. & Fuller, J. (1996a)Effect of b-hydroxy-b-methylbutyrate (HMB) sup-plementation on strength and body composition oftrained and untrained males undergoing intenseresistance training (Abstract). FASEB Journal(Suppl.), A287.
Nissen, S., Sharp, R., Ray, M. et al. (1996b) Effect ofleucine metabolite b-hydroxy-b-methylbutyrate onmuscle metabolism during resistance-exercise train-ing. Journal of Applied Physiology 81, 2095–2104.
Pieralisi, G., Ripari, P. & Vecchiet, L. (1991) Effects of astandardized ginseng extract combined withdimethylaminoethanol bitartrate, vitamins, miner-als, and trace elements on physical performanceduring exercise. Clinical Therapeutics 13, 373–382.
Sawka, M., Freund, B., Roberts, D., O’Brien, C., Dennis,R. & Valen, C. (1993) Total body water (TBW), extra-cellular fluid (ECF) and plasma responses to hyper-hydration with aqueous glycerol (Abstract). Medicineand Science in Sports and Exercise 25, S35.
Spector, S., Jackman, M., Sabounjian, L., Sakkas, C.,Landers, D. & Willis, W. (1995) Effect of choline sup-plementation on fatigue in trained cyclists. Medicineand Science in Sport and Exercise 27, 668–673.
Starling, R., Trappe, T., Short, K. et al. (1996) The effectof inosine supplementation on aerobic and anaerobiccycling performance. Medicine and Science in Sportsand Exercise 28, 1193–1198.
Stewart, I., McNaughton, L., Davies, P. & Tristram, S.(1990) Phosphate loading and the effects on VO2maxin trained cyclists. Research Quarterly for Exercise andSport 61, 80–84.
Tremblay, M., Galloway, S. & Sexsmith, J. (1994)Ergogenic effects of phosphate loading: physiologi-cal fact or methodological fiction? Canadian Journal ofApplied Physiology 19, 1–11.
366 nutrition and exercise
Van Koevering, M., Dolezal, H., Gill, D. et al. (1994)Effects of b-hydroxy-b-methyl butyrate on perfor-mance and carcass quality of feedlot steers. Journal ofAnimal Science 72, 1927–1935.
von Allwörden, H., Horn, S., Kahl, J. & Feldheim, W.(1993) The influence of lecithin on plasma cholineconcentrations in triathletes and adolescent runnersduring exercise. European Journal of Applied Physiol-ogy 67, 87–91.
Wagenmakers, A. (1991) L-carnitine supplementationand performance in man. Medicine and Sport Science32, 110–127.
Wheeler, K. & Garleb, K. (1991) Gamma oryzanol-plantsterol supplementation: metabolic, endocrine, andphysiologic effects. International Journal of SportNutrition 1, 170–77.
Williams, M. (1995) Nutritional ergogenics in athletics.Journal of Sports Sciences 13, S63-S74.
Williams, M. (1999) Nutrition for Health, Fitness andSport. WCB/McGraw-Hill, Boston.
Williams, M., Kreider, R., Hunter, D. et al. (1990) Effectof inosine supplementation on 3-mile treadmill per-formance and Vo2peak. Medicine and Science in Sportsand Exercise 22, 517–22.
Yarasheski, K., Campbell, J., Smith, K., Rennie, M., Holloszy, J. & Bier, D. (1992) Effect of growthhormone and resistance exercise on muscle growthin young men. American Journal of Physiology 262,E261–E267.
Yarasheski, K., Zachwieja, J., Angelopoulos, T. & Bier,D. (1993) Short-term growth hormone treatmentdoes not increase muscle protein synthesis in experi-enced weight lifters. Journal of Applied Physiology 74,3073–3076.

Distribution and biosynthesis
Creatine, or methyl guanidine-acetic acid, is anaturally occurring compound found in abun-dance in skeletal muscle. It is also found in smallquantities in brain, liver, kidney and testes. In a70-kg man, the total body creatine pool amountsto approximately 120g, of which 95% is situatedin muscle (Myers & Fine 1915; Hunter 1922).
In the early part of this century there wasalready literature pointing to an important function for creatine in muscle contraction. Theknowledge of its fairly specific distribution andits absence from normal urine led to the reali-zation that it is not merely a waste product of metabolism. This realization was confirmedwhen Chanutin (1926) observed that creatineadministration resulted in a major portion of thecompound being retained by the body.
Creatine synthesis has been shown to proceedvia two successive reactions involving twoenzymes (Fig. 27.1). The first reaction is catalysedby glycine transamidinase, and results in anamidine group being reversibly transferred from arginine to glycine, forming guanidino-acetic acid. The second reaction involves irreversible transfer of a methyl group from S-adenosylmethionine catalysed by guanidino-acetate methyltransferase, resulting in themethylation of guanidinoacetate and the forma-tion of creatine (Fitch 1977; Walker 1979). The dis-tribution of the two enzymes differs betweentissues across mammalian species. In the case ofhumans, however, it is generally accepted that
the majority of de novo creatine synthesis occursin the liver. As little creatine is found in the majorsites of synthesis, it is logical to assume thattransport of creatine from sites of synthesis tostorage must occur, thus allowing a separation ofbiosynthesis from utilization.
Two mechanisms have been proposed toexplain the very high creatine concentrationwithin skeletal muscle. The first involves thetransport of creatine into muscle by a specific sat-urable entry process, and the second entails thetrapping of creatine within muscle (Fitch &Shields 1966; Fitch et al. 1968; Fitch 1977). Earlystudies demonstrated that creatine entry intomuscle occurs actively against a concentrationgradient, possibly involving creatine interactingwith a specific membrane site which recognizesthe amidine group (Fitch & Shields 1966; Fitch etal. 1968; Fitch 1977). Recently, a specific sodium-dependent creatine transporter has been identi-fied in skeletal muscle, heart and brain (Schloss etal. 1994). It has been suggested that some skeletalmuscles do not demonstrate a saturable uptakeprocess, thereby supporting the idea of intracel-lular entrapment of creatine (Fitch 1977). About60% of muscle total creatine exists in the form of phosphocreatine, which is therefore unable topass through membranes because of its polarity,thus trapping creatine. This entrapment willresult in the generation of a concentration gradi-ent, but phosphorylation alone cannot be the sole mechanism of cellular retention of creatine.Other mechanisms that have been proposedinclude binding to intracellular components and
Chapter 27
Creatine
PAUL L. GREENHAFF
367
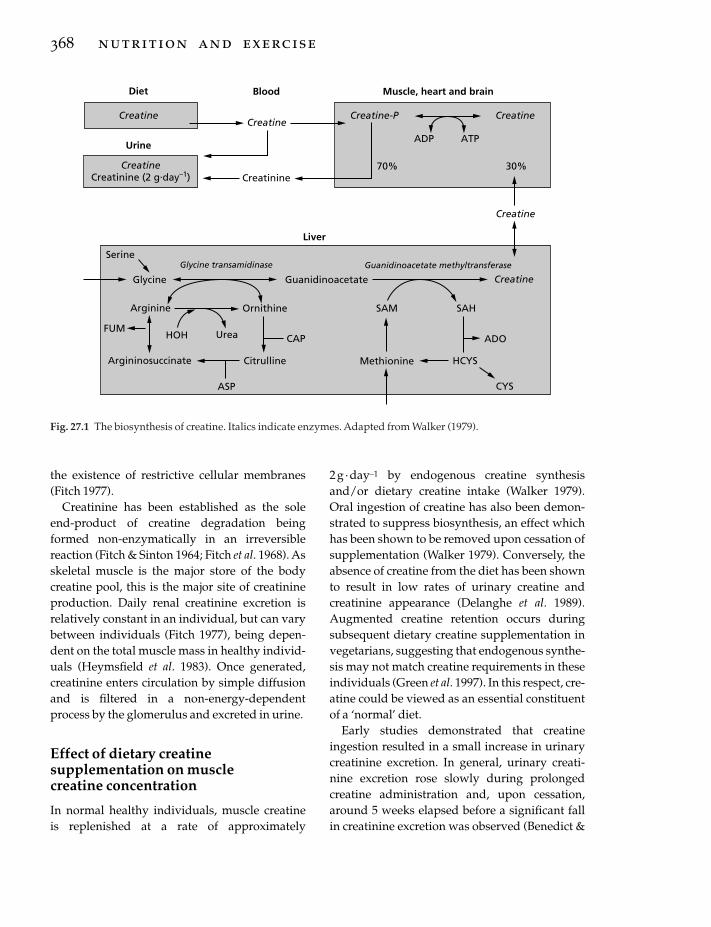
the existence of restrictive cellular membranes(Fitch 1977).
Creatinine has been established as the soleend-product of creatine degradation beingformed non-enzymatically in an irreversiblereaction (Fitch & Sinton 1964; Fitch et al. 1968). Asskeletal muscle is the major store of the body creatine pool, this is the major site of creatinineproduction. Daily renal creatinine excretion isrelatively constant in an individual, but can varybetween individuals (Fitch 1977), being depen-dent on the total muscle mass in healthy individ-uals (Heymsfield et al. 1983). Once generated,creatinine enters circulation by simple diffusionand is filtered in a non-energy-dependentprocess by the glomerulus and excreted in urine.
Effect of dietary creatinesupplementation on muscle creatine concentration
In normal healthy individuals, muscle creatine is replenished at a rate of approximately
368 nutrition and exercise
2g · day–1 by endogenous creatine synthesisand/or dietary creatine intake (Walker 1979).Oral ingestion of creatine has also been demon-strated to suppress biosynthesis, an effect whichhas been shown to be removed upon cessation ofsupplementation (Walker 1979). Conversely, theabsence of creatine from the diet has been shownto result in low rates of urinary creatine and creatinine appearance (Delanghe et al. 1989).Augmented creatine retention occurs duringsubsequent dietary creatine supplementation invegetarians, suggesting that endogenous synthe-sis may not match creatine requirements in theseindividuals (Green et al. 1997). In this respect, cre-atine could be viewed as an essential constituentof a ‘normal’ diet.
Early studies demonstrated that creatineingestion resulted in a small increase in urinarycreatinine excretion. In general, urinary creati-nine excretion rose slowly during prolonged creatine administration and, upon cessation,around 5 weeks elapsed before a significant fallin creatinine excretion was observed (Benedict &
Diet Blood Muscle, heart and brain
CreatineCreatine
Creatine-P Creatine
Creatine
Creatine
CreatinineCreatine
Creatinine (2 g.day–1)
ADP ATP
70% 30%
Urine
Liver
SerineGlycine transamidinase Guanidinoacetate methyltransferase
GuanidinoacetateGlycine
Ornithine SAM SAH
ADO
HCYS
CYS
Methionine
Arginine
FUMHOH Urea CAP
Argininosuccinate Citrulline
ASP
Fig. 27.1 The biosynthesis of creatine. Italics indicate enzymes. Adapted from Walker (1979).

Osterberg 1923; Chanutin 1926). From these earlystudies, creatine retention in the body pool wasthought to be much greater during the initialstages of administration. These early studies alsodemonstrated that there was no increase in crea-tinine excretion until a significant amount of the administered creatine had been retained(Benedict & Osterberg 1923; Chanutin 1926).
These early studies invariably involvedchronic periods of creatine ingestion. With theapplication of the muscle biopsy technique,however, it has now become clear that the inges-tion of 20g of creatine each day for 5 days byhealthy volunteers can lead to, on average, morethan a 20% increase in muscle total creatine con-centration, of which approximately 20% is in theform of phosphocreatine (PCr) (Fig. 27.2) (Harriset al. 1992). It is important to note that moststudies to date have involved 5 g of creatinebeing ingested in a warm solution on fourequally spaced occasions per day. This procedurewas adopted principally because it results in a rapid (within 20min), marked (ª 1000mmol · l–1
increase) and sustained (ª 3h) increase in plasmacreatine (Harris et al. 1992), to a concentrationabove the Km reported for creatine transport inisolated rat skeletal muscle (Fitch et al. 1968). Awarm liquid was used because this has been
shown to facilitate the dissolving of creatine. Inagreement with earlier work, it has also beendemonstrated that the majority of tissue creatineuptake occurs during the initial days of supple-mentation, with close to 30% of the administereddose being retained during the initial 2 days ofsupplementation, compared with 15% from days2–4 (Harris et al. 1992). It was also shown byHarris et al. (1992) that the initial presupplemen-tation muscle total creatine concentration is animportant determinant of creatine accumulationduring supplementation in healthy volunteers(Fig. 27.2). Furthermore, when submaximal exer-cise was performed by healthy subjects duringthe period of supplementation, muscle uptakewas increased by a further 10% (Harris et al.1992). With the exception of vegetarians andsome disease states, it is not yet clear what deter-mines whether a person has a high or low musclecreatine store. Interestingly, normal healthyfemales, for reasons as yet unknown, appear tohave a slightly higher muscle creatine concentra-tion than males (Forsberg et al. 1991). This may be a consequence of their muscle mass, andtherefore their creatine distribution space, beingsmaller.
Based on more recently published experimen-tal findings (Hultman et al. 1996), it would
creatine 369
160
150
140
130
120
110
10
4.54.5
21/2 21/2
721/2
3
5
7
21/2
73
5
3
57
7
KS EH RH HL HH IS JS JV OO SL ES AL
Subjects
Tota
l cre
atin
e (m
mo
l. kg
–1 d
.m.)
4.5
Fig. 27.2 Total muscle creatineconcentration before and afterdifferent durations (3–21 days) ofcreatine ingestion at rates of 20 g ·day–1 (subjects KS, EH, RH, IS, SLand ES) and 30 g · day–1 (subjectsHL, HH, JS, JV, OO and AL). 21/2indicates creatine was ingestedevery other day for a duration of21 days. Adapted from Harris et al.(1992).

appear that, as might be expected, a 2–3-weekperiod of lower dose creatine supplementation (3 g ·day–1) increases tissue creatine content at aslower rate than a 6-day regimen of 20g · day–1.However, following 4 weeks of supplementa-tion, no difference in muscle creatine stores isevident when comparing the two dosage regi-mens. The same study clearly demonstrated thatmuscle creatine stores can be maintained at anelevated concentration when the 6-day supple-mentation dose of 20 g ·day–1 is immediately fol-lowed by a lower dose of 2g ·day–1 (Fig. 27.3).This lower dose was aimed at sustaining dietarycreatine intake at a slightly higher level thandegradation of muscle creatine to creatinine. Thenatural time-course of muscle creatine declinefollowing supplementation was also investi-gated by Hultman et al. (1996), where it wasfound to take at least 4 weeks for muscle creatine‘wash-out’ to occur following 6 days of creatineingestion at the rate of 20 g ·day–1. This fits with earlier studies which investigated the time-course of creatinine excretion following creatineingestion (Benedict & Osterberg 1923; Chanutin1926), and with the suggestion of Fitch (1977)that creatine is ‘trapped’ within skeletal muscleonce taken up. Thus, it would appear that a rapid
370 nutrition and exercise
way to ‘load’ and then maintain muscle creatinestores is to ingest 20 g · day–1 for 5–6 days fol-lowed by 2 g · day–1 thereafter.
It is also clear from the literature that there isconsiderable variation between subjects in theextent of muscle creatine accumulation duringsupplementation (Harris et al. 1992; Greenhaff etal. 1994). A concentration of 160mmol · kg–1 drymuscle (d.m.) appears to be the maximal total creatine concentration achievable as a result ofcreatine supplementation, and occurs in about20% of subjects. Conversely, about 20–30% ofsubjects do not respond to creatine ingestion, i.e.they demonstrate less than 10 mmol ·kg–1 d.m.increase in muscle total creatine as a result ofsupplementation. Of particular importance,recent work has revealed that muscle total crea-tine accumulation can be increased by a further60% when creatine is ingested in solution (5 daysof creatine at 20g · day–1) in combination withsimple carbohydrates (370g carbohydrate · day–1;Green et al. 1996a, 1996b), elevating muscle crea-tine concentration in all subjects closer to theupper limit of 160 mmol · kg–1 d.m. As might beexpected, urinary creatine excretion and plasmacreatine concentration were reduced in parallelwith the increase in muscle total creatine (Greenet al. 1996a, 1996b).
The mean and individual increases in muscletotal creatine concentration from the study ofGreen et al. (1996b) are shown in Fig. 27.4. Thisfigure highlights the major difference betweeningesting creatine in combination with carbohy-drate compared with ingesting creatine alone. Ascan be seen, 50% of the subjects who ingested cre-atine alone (4¥5g · day–1 for 5 days) experiencedan increase in muscle total creatine concentrationof less than 20 mmol · kg–1 d.m. (Fig. 27.4a). Thiscontrasts with the subjects who ingested creatinein combination with carbohydrate, all of whomexperienced an increase of more than 20 mmol ·kg–1 d.m. (Fig. 27.4b). In agreement with thework of Harris et al. (1992), there was a significantinverse relationship between the initial muscletotal creatine concentration and the magnitudeof accumulation seen following creatine supplementation alone (r= –0.579, n =12; P<
150
100
140
130
120
Day 0
110
Tota
l cre
atin
e (m
mol
. kg–1
d.m
.)
Day 7 Day 21 Day 35
Fig. 27.3 Total muscle creatine concentration beforeand after 34 days of creatine ingestion. Creatine wasingested at a rate of 20 g · day–1 for the initial 6 days andat a rate of 2 g · day–1 thereafter.
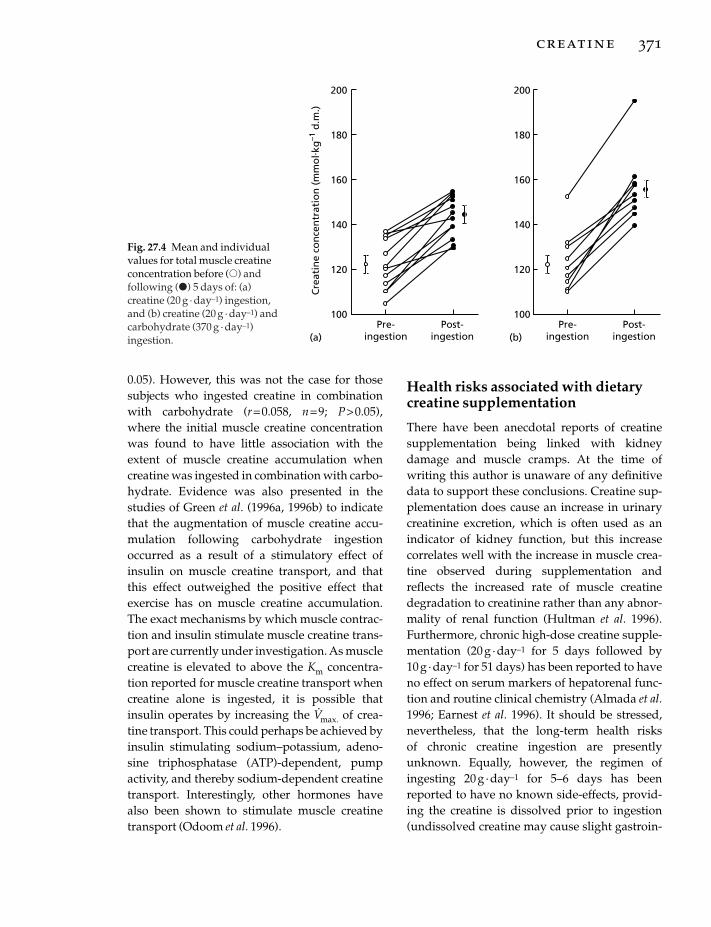
0.05). However, this was not the case for thosesubjects who ingested creatine in combinationwith carbohydrate (r= 0.058, n =9; P>0.05),where the initial muscle creatine concentrationwas found to have little association with theextent of muscle creatine accumulation whencreatine was ingested in combination with carbo-hydrate. Evidence was also presented in thestudies of Green et al. (1996a, 1996b) to indicatethat the augmentation of muscle creatine accu-mulation following carbohydrate ingestionoccurred as a result of a stimulatory effect ofinsulin on muscle creatine transport, and thatthis effect outweighed the positive effect thatexercise has on muscle creatine accumulation.The exact mechanisms by which muscle contrac-tion and insulin stimulate muscle creatine trans-port are currently under investigation. As musclecreatine is elevated to above the Km concentra-tion reported for muscle creatine transport whencreatine alone is ingested, it is possible thatinsulin operates by increasing the V
.max. of crea-
tine transport. This could perhaps be achieved byinsulin stimulating sodium–potassium, adeno-sine triphosphatase (ATP)-dependent, pumpactivity, and thereby sodium-dependent creatinetransport. Interestingly, other hormones havealso been shown to stimulate muscle creatinetransport (Odoom et al. 1996).
Health risks associated with dietarycreatine supplementation
There have been anecdotal reports of creatinesupplementation being linked with kidneydamage and muscle cramps. At the time ofwriting this author is unaware of any definitivedata to support these conclusions. Creatine sup-plementation does cause an increase in urinarycreatinine excretion, which is often used as anindicator of kidney function, but this increasecorrelates well with the increase in muscle crea-tine observed during supplementation andreflects the increased rate of muscle creatinedegradation to creatinine rather than any abnor-mality of renal function (Hultman et al. 1996).Furthermore, chronic high-dose creatine supple-mentation (20 g · day–1 for 5 days followed by 10g · day–1 for 51 days) has been reported to haveno effect on serum markers of hepatorenal func-tion and routine clinical chemistry (Almada et al.1996; Earnest et al. 1996). It should be stressed,nevertheless, that the long-term health risks of chronic creatine ingestion are presentlyunknown. Equally, however, the regimen ofingesting 20g ·day–1 for 5–6 days has beenreported to have no known side-effects, provid-ing the creatine is dissolved prior to ingestion(undissolved creatine may cause slight gastroin-
creatine 371
200
180
160
140
120
100
200
180
160
140
120
100C
reat
ine
con
cen
trat
ion
(m
mo
l. kg
–1 d
.m.)
(a) (b)Pre-
ingestionPost-
ingestionPre-
ingestionPost-
ingestion
Fig. 27.4 Mean and individualvalues for total muscle creatineconcentration before (�) andfollowing (�) 5 days of: (a)creatine (20 g · day–1) ingestion,and (b) creatine (20 g · day–1) andcarbohydrate (370 g · day–1)ingestion.

testinal discomfort). Furthermore, the 2g · day–1
‘maintenance dose’ of creatine ingestion cur-rently advocated to maintain muscle creatineconcentration during chronic periods of creatinesupplementation (Hultman et al. 1996) is onlyslightly greater than the quantity of creatinefound in a meat eater’s diet.
Effect of dietary creatinesupplementation on exercise performance
In human skeletal muscle, creatine is present at aconcentration of about 125 mmol ·kg–1 d.m., ofwhich approximately 60% is in the form of PCr atrest. A reversible equilibrium exists between cre-atine and PCr:
and together they function to maintain intracel-lular ATP availability, modulate metabolism andbuffer hydrogen ion accumulation during con-traction. The availability of PCr is generallyaccepted to be one of the most likely limitationsto muscle performance during intense, fatiguing,short-lasting contractions, its depletion resultingin an increase in cellular adenosine diphosphate(ADP) concentration and, thereby, the develop-ment of fatigue via an inhibition of muscle cross-bridge formation. This conclusion has been drawn from human studies involving short bouts of maximal electrically evoked con-traction (Hultman et al. 1991) and voluntary exercise (Katz et al. 1986), and from animalstudies in which the muscle creatine store has been depleted, prior to maximal electricalstimulation, using the creatine analogue b-guanidinopropionate (Fitch et al. 1975; Meyer et al. 1986). Recent studies from this laboratory(Casey et al. 1996a) and from others (Bogdanis etal. 1996) have demonstrated that the extent ofPCr resynthesis during recovery following asingle bout of maximal exercise is positively cor-related with exercise performance during a sub-sequent bout of exercise. For example, in thestudy of Casey et al. (1996a), eight subjects per-formed two bouts of maximal exercise, each
PCr ADP H ATP creatine+ + ´ +( )+
372 nutrition and exercise
lasting 30s, which were separated by 4min ofrecovery. Rapid PCr resynthesis occurred duringthis recovery period, but was incomplete, reach-ing on average 88% of the pre-exercise concentra-tion. However, the extent of PCr resynthesisduring recovery was positively correlated withperformance during the second bout of exercise(r =0.80, P< 0.05). More detailed analysis alsorevealed that whilst the magnitude of PCr degra-dation in the second bout of exercise was lessthan that in the first, this fall in PCr utilizationwas restricted solely to the fast twitch musclefibres (Fig. 27.5), and was probably attributableto incomplete PCr resynthesis in this fibre typeduring recovery following the initial bout ofexercise (Casey et al. 1996a). Creatine in its freeand phosphorylated forms appears therefore tooccupy a pivotal role in the regulation andhomeostasis of skeletal muscle energy metabo-lism and fatigue. This being the case, it is perti-nent to suggest that any mechanism capable ofincreasing muscle creatine availability might beexpected to delay PCr depletion and the rate ofADP accumulation during maximal exerciseand/or stimulate PCr resynthesis during recovery.
In 1934, Boothby (see Chaikelis 1940) reportedthat the development of fatigue in humans couldbe delayed by the addition of large amounts of
80
30
70
50
40
Phos
phoc
reat
ine
degr
adat
ion
(mm
ol. k
g–1 d
.m.)
Exercise
60
Bout 1
*
Bout 2
**
Fig. 27.5 Changes in phosphocreatine in slow (type I,) and fast (type II, �) muscle fibres during two bouts
of 30 s maximal intensity, isokinetic cycling exercise in humans. Each bout of exercise was performed at 80pedal rev · min–1 and separated by 4 min of passiverecovery. *, P < 0.05 between fibre types; **, P < 0.01from exercise bout 1 in type II fibres.

the creatine precursor glycine to the diet, whichhe attributed to an effect on muscle creatine con-centration. Later, Ray and co-workers (Ray et al.1939) concluded that the ingestion of 60g gelatin ·day–1 for several weeks could also postpone thedevelopment of fatigue in humans. The authorsreasoned that because glycine constitutes 25% of gelatin by weight, the increased ingestion ofgelatin would result in an increased muscle crea-tine concentration and thereby an increase inmuscle function. Maison (1940), however, couldnot reproduce these findings and concluded thatgelatin, and therefore glycine, had no effect onwork capacity during repeated bouts of fatiguingmuscle contractions. Shortly after this, however,Chaikelis (1940) reported that the ingestion of 6g glycine · day–1 in tablet form for 10 weeksmarkedly improved performance (ª20%) in anumber of different muscle groups and reducedcreatinine excretion by 30%. In the discussion ofresults, the author implicated a change in themuscle creatine pool as being responsible for theobservations made.
Other than these initial reports, which do notrelate to creatine ingestion per se, little has beenpublished concerning creatine ingestion andexercise performance until recently. Sipila et al.(1981) reported that in a group of patients receiv-ing 1g creatine · day–1 as a treatment for gyrateatrophy (a condition in which creatine biosyn-thesis is impaired), there was a comment fromsome of a sensation of strength gain following a1-year period of supplementation. Indeed, crea-tine ingestion was shown to reverse the type IImuscle fibre atrophy associated with this diseaseand one athlete in the group of patientsimproved his personal best record for the 100 mby 2s. Muscle creatine availability has beenimplicated in the control of muscle protein syn-thesis (Bessman & Savabi 1990), and the pathol-ogy of muscle-wasting diseases (Fitch & Sinton1964; Fitch 1977) and in-born errors of metabo-lism (Stockler et al. 1994) have been related toabnormalities of creatine metabolism.
Based on published results from placebo-controlled laboratory experiments, it wouldappear that the ingestion of 4¥ 5g creatine · day–1
for 5 days can significantly increase the amountof work which can be performed by healthynormal volunteers during repeated bouts ofmaximal knee-extensor exercise (Greenhaff et al.1993), maximal dynamic exercise (Balsom et al.1993a) and maximal isokinetic cycling exercise(Birch et al. 1994). In addition, it has been demon-strated that creatine supplementation can facili-tate muscle PCr resynthesis during recoveryfrom maximal intensity exercise in individualswho demonstrate an increase of 20mmol ·kg–1
d.m. or more in muscle creatine as a consequenceof supplementation (Greenhaff et al. 1994). Theauthor is also aware of published work demon-strating that creatine ingestion has no effect onmaximal exercise performance (Cooke et al.1995). Undoubtedly, one reason for the lack ofagreement between studies will be the large vari-ation between subjects in the extent of creatineretention during supplementation with creatine,which will be discussed in more detail later.However, the most prevalent finding from pub-lished performance studies seems to be that crea-tine ingestion can significantly increase exerciseperformance by sustaining force or work outputduring exercise. For example, in the study ofGreenhaff et al. (1993), two groups of subjects (n =6) performed five bouts of 30 maximal voluntaryunilateral knee extensions at a constant angularvelocity of 180° · s–1 before and after placebo orcreatine ingestion (4¥ 5g creatine ·day–1 for 5days). No difference was seen when comparingmuscle torque production during exercise beforeand after placebo ingestion. However, follow-ing creatine ingestion, torque production wasincreased by 5–7% in all subjects during the final10 contractions of exercise bout 1 and throughoutthe whole of exercise bouts 2–4. In the study ofBirch et al. (1994), two groups of seven healthymale subjects performed three bouts of maximalisokinetic cycling exercise at 80 rev ·min–1 beforeand after creatine or placebo ingestion (4¥5 g cre-atine ·day–1 for 5 days). Each exercise bout lastedfor 30s and was interspersed by 4min rest. Thetotal amount of work performed during bouts 1–3 were similar when comparing valuesobtained before and after placebo ingestion (< 2%
creatine 373
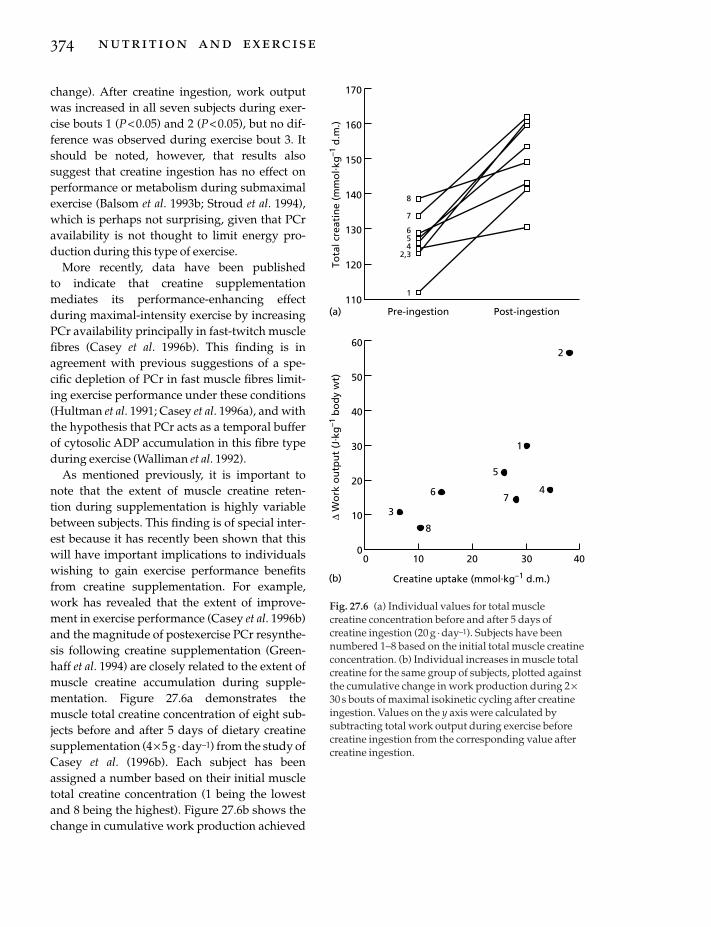
change). After creatine ingestion, work outputwas increased in all seven subjects during exer-cise bouts 1 (P<0.05) and 2 (P< 0.05), but no dif-ference was observed during exercise bout 3. Itshould be noted, however, that results alsosuggest that creatine ingestion has no effect onperformance or metabolism during submaximalexercise (Balsom et al. 1993b; Stroud et al. 1994),which is perhaps not surprising, given that PCravailability is not thought to limit energy pro-duction during this type of exercise.
More recently, data have been published to indicate that creatine supplementation mediates its performance-enhancing effectduring maximal-intensity exercise by increasingPCr availability principally in fast-twitch musclefibres (Casey et al. 1996b). This finding is in agreement with previous suggestions of a spe-cific depletion of PCr in fast muscle fibres limit-ing exercise performance under these conditions(Hultman et al. 1991; Casey et al. 1996a), and withthe hypothesis that PCr acts as a temporal bufferof cytosolic ADP accumulation in this fibre typeduring exercise (Walliman et al. 1992).
As mentioned previously, it is important tonote that the extent of muscle creatine reten-tion during supplementation is highly variablebetween subjects. This finding is of special inter-est because it has recently been shown that thiswill have important implications to individualswishing to gain exercise performance benefitsfrom creatine supplementation. For example,work has revealed that the extent of improve-ment in exercise performance (Casey et al. 1996b)and the magnitude of postexercise PCr resynthe-sis following creatine supplementation (Green-haff et al. 1994) are closely related to the extent ofmuscle creatine accumulation during supple-mentation. Figure 27.6a demonstrates the muscle total creatine concentration of eight sub-jects before and after 5 days of dietary creatinesupplementation (4¥5 g ·day–1) from the study ofCasey et al. (1996b). Each subject has beenassigned a number based on their initial muscletotal creatine concentration (1 being the lowestand 8 being the highest). Figure 27.6b shows thechange in cumulative work production achieved
374 nutrition and exercise
170
160
150
140
130
120
110Pre-ingestion Post-ingestion(a)
8
7
654
2,3
1
60
50
40
30
20
10
00 10 20 30 40
Creatine uptake (mmol.kg–1 d.m.)
2
1
4
5
73
8
6
(b)
∆ W
ork
ou
tpu
t (J
. kg
–1 b
od
y w
t)To
tal c
reat
ine
(mm
ol. k
g–1
d.m
.)
Fig. 27.6 (a) Individual values for total muscle creatine concentration before and after 5 days ofcreatine ingestion (20 g · day–1). Subjects have beennumbered 1–8 based on the initial total muscle creatineconcentration. (b) Individual increases in muscle totalcreatine for the same group of subjects, plotted againstthe cumulative change in work production during 2 ¥30 s bouts of maximal isokinetic cycling after creatineingestion. Values on the y axis were calculated bysubtracting total work output during exercise beforecreatine ingestion from the corresponding value aftercreatine ingestion.

during two bouts of maximal exercise (eachlasting 30s) following creatine ingestion plottedagainst the increase in muscle total creatine as aresult of supplementation in the same eight sub-jects. The positive relationship found (r =0.71, P<0.05) led to the conclusion that it may be neces-sary to increase muscle total creatine concentra-tion by close to or more than 20 mmol · kg–1 d.m.to obtain substantial improvements in exerciseperformance as a result of creatine supplementa-tion. These findings may provide some insight tothose studies which have reported no improve-ment in exercise performance following creatinesupplementation. In this context, the combina-tion of results from several recent studies under-taken in the author’s laboratory has revealed thatapproximately 20–30% of individuals ‘do notrespond’ to creatine supplementation, i.e. theydemonstrate an increase of less than 10mmol ·kg–1 d.m. (8%) in muscle total creatine following 5 days of 20 g · day–1 oral creatine supplementa-tion (4¥ 5g doses dissolved in ª250 ml). Thus, assuggested previously, to gain ‘optimal’ func-tional and metabolic benefits from creatine sup-plementation, recent data indicate that it isimportant to consume creatine in combinationwith a carbohydrate solution (Green et al. 1996a,1996b).
Mechanism of action of dietarycreatine supplementation on exercise performance
As previously stated, the literature indicates thatif the muscle creatine concentration can beincreased by close to or more than 20 mmol ·kg–1
d.m. as a result of acute creatine ingestion, thenperformance during single and repeated bouts ofmaximal short-duration exercise will be signifi-cantly improved. However, the exact mechanismby which this improvement in exercise perfor-mance is achieved is not yet clear. The availabledata indicate that it may be related to the stimula-tory effect that creatine ingestion has upon pre-exercise PCr availability, particularly infast-twitch muscle fibres (Casey et al. 1996b). Forexample, in the study of Casey et al. (1996b), the
increase in resting type II muscle fibre PCr con-centration as a consequence of creatine supple-mentation in a group of eight male subjects waspositively correlated with the increase in PCrdegradation measured during exercise in thisfibre type (r =0.78, P<0.01) and with the increasein total work production observed during exercise following supplementation (r =0.66, P<0.05). No such associations were found in thetype I fibres (r= 0.22 and r =0.32, respectively).Given that PCr availability in type II fibres is gen-erally accepted to limit exercise capacity duringmaximal exercise (Hultman et al. 1991; Casey etal. 1996a), the increase in type II muscle fibre PCrconcentration as a consequence of creatine sup-plementation may have improved contractilefunction during exercise by maintaining ATPturnover in this fibre type. This suggestion issupported by reports showing that the accumu-lation of plasma ammonia and hypoxanthine arereduced during maximal exercise following crea-tine ingestion (both metabolites are acceptedplasma markers of the disruption of muscle ATPresynthesis), despite a higher work output being achieved (Balsom et al. 1993a; Greenhaff etal. 1993). Furthermore, more direct supportiveevidence comes from a recent study showing thatcreatine supplementation reduced the decline inmuscle ATP by approximately 30% duringmaximal isokinetic cycling exercise, while, at thesame time, increasing work output (Casey et al.1996b).
It should be recognized, however, that the positive effects of creatine supplementation onmuscle energy metabolism and function are alsolikely to be the result of the stimulatory effectthat an increase in cytoplasmic free creatine willhave on mitochondrial mediated PCr resynthesis(Greenhaff et al. 1994), which will be particularlyimportant during repeated bouts of maximalexercise. This suggestion is supported by in vitrostudies showing that an increase in the creatineconcentration of an incubation medium canaccelerate the rate of respiration in isolated skele-tal muscle mitochondria (Bessman & Fonyo1966) and skinned cardiac fibres (Field et al.1994), and by in vivo human studies showing that
creatine 375

the increase in muscle total creatine concentra-tion following creatine supplementation is prin-cipally in the form of free creatine (Harris et al.1992; Greenhaff et al. 1994).
Of further interest, it has recently been demon-strated that caffeine (5mg ·kg–1 body mass ·day–1, single dose) ingested in combination withcreatine (0.5g · kg–1 body mass · day–1, eight equaldoses per day) can counteract the positive effectof creatine supplementation on performanceduring repeated bouts of high intensity exercise(Vandenberghe et al. 1996). The authors hypothe-sized that caffeine ingestion would augmentmuscle creatine accumulation via a direct andindirect (catacholamine-mediated) stimulationof sodium-dependent muscle creatine transportand thereby may enhance exercise performancefurther. However, caffeine appeared to have nostimulatory effect on muscle creatine accumula-tion as the authors demonstrated a 4–6% increasein resting muscle PCr concentration, irrespectiveof whether caffeine was ingested or not (muscletotal creatine was not assessed directly but PCrwas determined using phosphorous magneticresonance spectroscopy). Surprisingly, therefore,the ergolytic effect of caffeine ingestion was not attributable to caffeine inhibiting muscle creatine accumulation during supplementation.The authors offered no clear alternative explana-tion for their performance findings, but did pointout that it was unlikely to be attributable to aneffect of caffeine on ‘muscle energetics’ as thefinal caffeine dose preceded the postsupplemen-tation exercise test by at least 20 h, which is easilysufficient time for caffeine elimination to haveoccurred.
In conclusion, information relating to theeffects of dietary creatine ingestion on musclefunction and metabolism during exercise inhealthy normal individuals and in disease statesis relatively limited. Based on recent findings, itwould appear that it is important to optimizetissue creatine uptake in order to maximize per-formance benefits, and therefore further work isrequired to elucidate the principal factors regu-lating tissue creatine uptake in humans. Moreinformation is needed about the exact mecha-
376 nutrition and exercise
nisms by which creatine achieves its ergogeniceffect and on the long term effects of creatine sup-plementation. With respect to this last point, itshould be made clear that the health risks asso-ciated with prolonged periods of high-dose creatine supplementation are unknown; equally,however, research to date clearly shows it is notnecessary to consume large amounts of creatineto load skeletal muscle. Creatine supplementa-tion may be viewed as a method for producingimmediate improvements to athletes involved inexplosive sports. In the long run, creatine mayalso allow athletes to benefit from being able totrain without fatigue at an intensity higher thanthat to which they are normally accustomed. Forthese reasons alone, creatine supplementationcould be viewed as a significant development insports related nutrition.
Acknowledgements
The author wishes to acknowledge the WellcomeTrust, Smithkline Beecham and the DefenceResearch Agency for their support of the experi-ments described in this chapter and his past and present collaborators for their greatly valuedcontributions.
References
Almada, A., Mitchell, T. & Earnest, C. (1996) Impact ofchronic creatine supplementation on serum enzymeconcentrations. FASEB Journal 10, 4567.
Balsom, P.D., Ekblom, B., Soderlund, K., Sjodin, B. &Hultman, E. (1993a) Creatine supplementation anddynamic high-intensity intermittent exercise. Scandi-navian Journal of Medicine in Science and Sports 3,143–149.
Balsom, P.D., Harridge, S.D.R., Soderlund, K., Sjodin,B. & Ekblom, B. (1993b) Creatine supplementationper se does not enhance endurance exercise per-formance. Acta Physiologica Scandinavica 149, 521–523.
Benedict, S.R. & Osterberg, E. (1923) The metabolism ofcreatine. Journal of Biological Chemistry 56, 229–230.
Bessman, S.P. & Fonyo, A. (1966) The possible role of mitochondrial bound creatine kinase in regulationof mitochondrial respiration. Biochemistry and Biophysics Research Communications 22, 597–602.
Bessman, S.P. & Savabi, F. (1990) The role of the phos-

phocreatine energy shuttle in exercise and musclehypertrophy. In Biochemistry of Exercise VII (ed. A.W.Taylor, P.D. Gollnick, H.J. Green, C.D. Ianuzzo, E.G.Noble, G. Metivier & J.R. Sutton), pp. 167–178.Human Kinetics Publishers, Champaign, IL.
Birch, R., Noble, D. & Greenhaff, P.L. (1994) The influ-ence of dietary creatine supplementation on perfor-mance during repeated bouts of maximal isokineticcycling in man. European Journal of Applied Physiology69, 268–270.
Bogdanis, G.C., Nevill, M.E., Boobis, L.H. & Lakomy,H.K.A. (1996) Contribution of phosphocreatine andaerobic metabolism to energy supply duringrepeated sprint exercise. Journal of Applied Physiology80, 876–884.
Casey, A., Constantin-Teodosiu, D., Howell, S.,Hultman, E. & Greenhaff, P.L. (1996a) The metabolicresponse of type I and II muscle fibres duringrepeated bouts of maximal exercise in humans.American Journal of Physiology 271, E38–E43.
Casey, A., Constantin-Teodosiu, D., Howell, S.,Hultman, E. & Greenhaff, P.L. (1996b) Creatine sup-plementation favourably affects performance andmuscle metabolism during maximal intensity exer-cise in humans. American Journal of Physiology 271,E31–E37.
Chaikelis, A.S. (1940) The effect of glycocoll (glycine)ingestion upon the growth, strength and creatinine-creatine excretion in man. American Journal of Physiol-ogy 133, 578–587.
Chanutin, A. (1926) The fate of creatine when adminis-tered to man. Journal of Biological Chemistry 67, 29–37.
Cooke, W.H., Grandjean, P.W. & Barnes, W.S. (1995)Effect of oral creatine supplementation on poweroutput and fatigue during bicycle ergometry. Journalof Applied Physiology 78, 670–673.
Delanghe, J., De Slypere, J.-P., Debuyzere, M., Rob-brecht, J., Wieme, R. & Vermeulen, A. (1989) Normalreference values for creatine, creatinine and carnitineare lower in vegetarians. Cinical Chemistry 35,1802–1803.
Earnest, C., Almada, A. & Mitchell, T. (1996) Influenceof chronic creatine supplementation on hepatorenalfunction. FASEB Journal 10, 4588.
Field, M.L., Clark, J.F., Henderson, C., Seymour, A.M.-L. & Radda, G. (1994) Alterations in the myocardialcreatine kinase system during chronic anaemichypoxia. Cardiovascular Research 28, 86–91.
Fitch, C.D. (1977) Significance of abnormalities of crea-tine metabolism. In Pathogenesis of Human MuscularDystrophies (ed. L.P. Rowland), pp. 328–340. ExcerptaMedica, Amsterdam.
Fitch, C.D. & Shields, R.P. (1966) Creatine metabolismin skeletal muscle. I. Creatine movement acrossmuscle membranes. Journal of Biological Chemistry241, 3610–3614.
Fitch, C.D. & Sinton, D.W. (1964) A study of creatinemetabolism in diseases causing muscle wasting.Journal of Clinical Investigation 43, 444–452.
Fitch, C.D., Lucy, D.D., Bornhofen, J.H. & Dalrymple,M. (1968) Creatine metabolism in skeletal muscle.Neurology 18, 32–39.
Fitch, C.D., Jellinek, M., Fitts, R.H., Baldwin, K.M. & Holloszy, J.O. (1975) Phosphorylated b-guanidinopropionate as a substitute for phosphocre-atine in rat muscle. American Journal of Physiology 288,1123–1125.
Forsberg, A.M., Nilsson, E., Werneman, J., Bergstrom, J.& Hultman, E. (1991) Muscle composition in relationto age and sex. Clinical Science 81, 249–256.
Green, A.L., Hultman, E., Macdonald, I.A., Sewell, D.A.& Greenhaff, P.L. (1996a) Carbohydrate ingestionaugments skeletal muscle creatine accumulationduring creatine supplementation in man. AmericanJournal of Physiology 271, E812–E826.
Green, A.L., Simpson, E.J., Littlewood, J.J., Macdonald,I.A. & Greenhaff, P.L. (1996b) Carbohydrate inges-tion augments creatine retention during creatinefeeding in man. Acta Physiologica Scandinavica 158,195–202.
Green, A.L., Macdonald, I.A. & Greenhaff, P.L. (1997)The effects of creatine and carbohydrate on whole-body creatine retention in vegetarians. Proceedings ofthe Nutrition Society 56, 81A.
Greenhaff, P.L., Casey, A., Short, A.H., Harris, R.C.,Soderlund, K. & Hultman, E. (1993) Influence of oralcreatine supplementation on muscle torque duringrepeated bouts of maximal voluntary exercise inman. Clinical Science 84, 565–571.
Greenhaff, P.L., Bodin, K., Soderlund, K. & Hultman, E.(1994) The effect of oral creatine supplementation on skeletal muscle phosphocreatine resynthesis.American Journal of Physiology 266, E725–E730.
Harris, R.C., Soderlund, K. & Hultman, E. (1992) Eleva-tion of creatine in resting and exercised muscle ofnormal subjects by creatine supplementation. Clinical Science 83, 367–374.
Heymsfield, S.B., Arteaga, C., McManus, C., Smith, J. &Moffitt, S. (1983) Measurement of muscle mass inhumans: validity of the 24-hour urinary creatininemethod. American Journal of Clinical Nutrition 36,478–494.
Hultman, E., Greenhaff, P.L., Ren, J.-M. & Soderlund,K. (1991) Energy metabolism and fatigue duringintense muscle contraction. Biochemical Society Transactions 19, 347–353.
Hultman, E., Soderlund, K., Timmons, J., Cederblad, G.& Greenhaff, P.L. (1996) Muscle creatine loading inman. Journal of Applied Physiology 81, 232–237.
Hunter, A. (1922) The physiology of creatine and creati-nine. Physiological Reviews 2, 586–599.
Katz, A., Sahlin, K. & Henriksson, J. (1986) Muscle ATP
creatine 377

turnover rate during isometric contractions inhumans. Journal of Applied Physiology 60, 1839–1842.
Maison, G.L. (1940) Failure of gelatin or amino-acetic acid to increase the work ability. Journal of theAmerican Medical Association 115, 1439–1441.
Meyer, R.A., Brown, T.R., Krilowicz, B.L. & Kushmerick, M.J. (1986) Phosphagen and intracellu-lar pH changes during contraction of creatine-depleted rat muscle. American Journal of Physiology250, C264–C274.
Myers, V.C. & Fine, M.S. (1915) The metabolism of crea-tine and creatinine. VII. The fate of creatine whenadministered to man. Journal of Biological Chemistry21, 377–383.
Odoom, J.E., Kemp, G.J. & Radda, G.K. (1996) Theregulation of total creatine content in a myoblast cellline. Molecular and Cellular Biochemistry 158, 179–188.
Ray, G.B., Johnson, J.R. & Taylor, M.M. (1939) Effect ofgelatin on muscular fatigue. Proceedings of the Societyfor Experimental Biology and Medicine 40, 157–161.
Schloss, P., Mayser, W. & Betz, H. (1994) The putativerat choline transporter chot1 transports creatine andis highly expressed in neural and muscle-rich tissues.Biochemistry and Biophysics Research Communications198, 637–645.
Sipila, I., Rapola, J., Simell, O. & Vannas, A. (1981)
378 nutrition and exercise
Supplementary creatine as a treatment for gyrateatrophy of the choroid and retina. New EnglandJournal of Medicine 304, 867–870.
Stockler, S., Holzbach, U., Hanefeld, F. et al. (1994) Crea-tine deficiency in the brain: a new, treatable inbornerror of metabolism. Pediatric Research 36, 409–413.
Stroud, M.A., Holliman, D., Bell, D., Green, A., Macdonald, I.A. & Greenhaff, P.L. (1994) Effect of oral creatine supplementation on respiratory gas exchange and blood lactate accumulation during steady-state incremental treadmill exerciseand recovery. Clinical Science 87, 707–710.
Vandenberghe, K., Gills, N., Van Leemputte, M., VanHecke, P., Vanstapel, F. & Hespel, P. (1996) Caffeinecounteracts the ergogenic action of muscle creatineloading. Journal of Applied Physiology 80, 452–457.
Walker, J.B. (1979) Creatine: biosynthesis, regulationand function. Advances in Enzymology and RelatedAreas of Molecular Medicine 50, 177–242.
Walliman, T., Wyss, M., Brdiczka, D., Nicolay, K. &Eppenberger, H.M. (1992) Intracellular compartmen-tation, structure and function of creatine kinaseisoenzymes in tissues with high and fluctuatingenergy demands: the ‘phosphocreatine circuit’ forcellular energy homeostasis. Biochemical Journal 281,21–40.
Introduction
Caffeine is a socially acceptable drug that iswidely consumed throughout the world. It isalso commonly used by athletes in their dailylives and in preparation for athletic training and competitions. Caffeine is a ‘controlled orrestricted drug’ in the athletic world. Urinarycaffeine levels greater than 12mg ·ml–1 fol-lowing competitions are considered illegal by the International Olympic Committee (IOC).However, most athletes who consume caf-feine beverages prior to exercise would notapproach the illegal limit following a com-petition. Therefore, if caffeine ingestion enhances sports performance, it occupies aunique position in the sports world. It is anaccepted component of the diet of many athletes,although it has no nutritional value and wouldbe a ‘legal’ drug and ergogenic aid in these situations.
Review articles in the early 1990s concludedthat the effects of caffeine ingestion on exerciseperformance and metabolism were inconsistent(Wilcox 1990; Conlee 1991). The authors statedthat many experiments had not been well controlled and Conlee (1991) summarized thefactors which appeared to confound the caffeineresults: the exercise modality, exercise poweroutput, caffeine dose used in the experimentaldesign; the nutritional status, training status,previous caffeine use of the subjects; and individ-ual variation. An additional factor is the ability toreliably measure exercise performance, which
improves with increased training frequency andintensity.
Recent research has attempted to control thesefactors and has demonstrated an ergogenic effectof caffeine during prolonged endurance exercise(> 40 min). Investigations examining the effectsof caffeine on exercise performance duringintense exercise lasting approximately 20 minand shorter durations (ª4–7 min) and sprinting(< 90s) have also appeared. At this point it is diffi-cult to conclude whether caffeine is ergogenicduring exercise lasting less than 20min (forreview, see Spriet 1997).
Caffeine appears to be taken up by all tissuesof the body, making it difficult to independentlystudy its effects on the central nervous system (CNS) and the peripheral tissues (skeletalmuscle, liver and adipose tissue) in the exercis-ing human. It is also likely that multiple and/ordifferent mechanisms may be responsible forperformance enhancement in different types ofexercise.
This chapter provides a brief but comprehen-sive review of the issues surrounding caffeine’sability to enhance exercise performance inhumans and the mechanisms which may explainthe ergogenic effects. The chapter does notcontain a complete list of citations but highlightscurrent thinking in the caffeine area and indi-cates where information is lacking.
Chapter 28
Caffeine
LAWRENCE L. SPRIET AND RICHARD A. HOWLETT
379
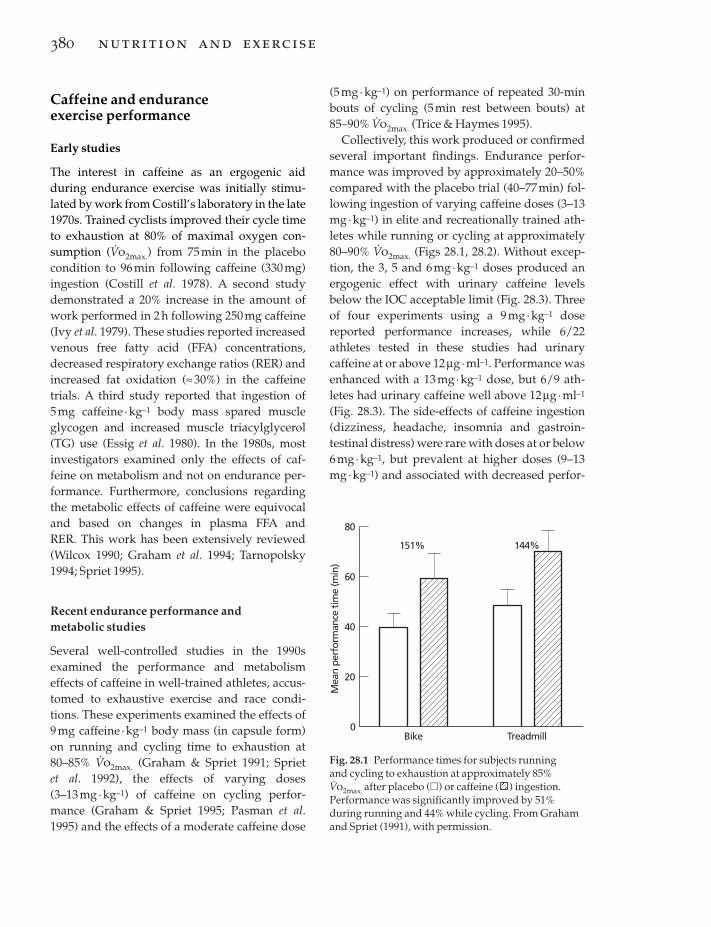
Caffeine and endurance exercise performance
Early studies
The interest in caffeine as an ergogenic aidduring endurance exercise was initially stimu-lated by work from Costill’s laboratory in the late1970s. Trained cyclists improved their cycle timeto exhaustion at 80% of maximal oxygen con-sumption (V
.o2max.) from 75min in the placebo
condition to 96 min following caffeine (330mg)ingestion (Costill et al. 1978). A second studydemonstrated a 20% increase in the amount ofwork performed in 2 h following 250 mg caffeine(Ivy et al. 1979). These studies reported increasedvenous free fatty acid (FFA) concentrations,decreased respiratory exchange ratios (RER) andincreased fat oxidation (ª30%) in the caffeinetrials. A third study reported that ingestion of 5mg caffeine ·kg–1 body mass spared muscleglycogen and increased muscle triacylglycerol(TG) use (Essig et al. 1980). In the 1980s, mostinvestigators examined only the effects of caf-feine on metabolism and not on endurance per-formance. Furthermore, conclusions regardingthe metabolic effects of caffeine were equivocaland based on changes in plasma FFA and RER. This work has been extensively reviewed(Wilcox 1990; Graham et al. 1994; Tarnopolsky1994; Spriet 1995).
Recent endurance performance and metabolic studies
Several well-controlled studies in the 1990sexamined the performance and metabolismeffects of caffeine in well-trained athletes, accus-tomed to exhaustive exercise and race condi-tions. These experiments examined the effects of9mg caffeine ·kg–1 body mass (in capsule form)on running and cycling time to exhaustion at80–85% V
.o2max. (Graham & Spriet 1991; Spriet
et al. 1992), the effects of varying doses (3–13 mg· kg–1) of caffeine on cycling perfor-mance (Graham & Spriet 1995; Pasman et al.1995) and the effects of a moderate caffeine dose
380 nutrition and exercise
(5 mg· kg–1) on performance of repeated 30-minbouts of cycling (5min rest between bouts) at85–90% V
.o2max. (Trice & Haymes 1995).
Collectively, this work produced or confirmedseveral important findings. Endurance perfor-mance was improved by approximately 20–50%compared with the placebo trial (40–77min) fol-lowing ingestion of varying caffeine doses (3–13mg· kg–1) in elite and recreationally trained ath-letes while running or cycling at approximately80–90% V
.o2max. (Figs 28.1, 28.2). Without excep-
tion, the 3, 5 and 6mg· kg–1 doses produced anergogenic effect with urinary caffeine levelsbelow the IOC acceptable limit (Fig. 28.3). Threeof four experiments using a 9 mg·kg–1 dosereported performance increases, while 6/22 athletes tested in these studies had urinary caffeine at or above 12mg ·ml–1. Performance wasenhanced with a 13 mg ·kg–1 dose, but 6/9 ath-letes had urinary caffeine well above 12mg · ml–1
(Fig. 28.3). The side-effects of caffeine ingestion(dizziness, headache, insomnia and gastroin-testinal distress) were rare with doses at or below6mg·kg–1, but prevalent at higher doses (9–13mg· kg–1) and associated with decreased perfor-
80
0
60
40
Bike
20
Mea
n pe
rfor
man
ce ti
me
(min
)
Treadmill
151% 144%
Fig. 28.1 Performance times for subjects running and cycling to exhaustion at approximately 85%V.o2max. after placebo (�) or caffeine ( ) ingestion.
Performance was significantly improved by 51%during running and 44% while cycling. From Grahamand Spriet (1991), with permission.

mance in some athletes at 9mg·kg–1 (Graham &Spriet 1995).
Caffeine generally produced no change invenous plasma noradrenaline (norepinephrine)concentration at rest or exercise, a twofoldincrease in plasma adrenaline (epinephrine) con-centration at rest and exercise and increasedplasma FFA concentration at rest. The elevatedFFA concentration at the onset of exercise withcaffeine was no longer present after 15–20 min ofexercise. At the lowest caffeine dose (3mg· kg–1),performance was increased without a significantincrease in plasma venous adrenaline and FFA. Muscle glycogen utilization was reducedfollowing caffeine ingestion, but the ‘sparing’was limited to the initial 15 min of exercise atapproximately 80% V
.o2max..
Caffeine and short-term exercise performance
There has been recent interest in the effects of caf-feine ingestion on performance of short-termexercise lasting between 30s and 20–40min. Ifcaffeine has an ergogenic effect during short-term exercise, the mechanism will not be related
caffeine 381
70
0
60
40
0
20
Tim
e (m
in)
6
50
30
10
Dose (mg.kg–1 body wt)3 9
Fig. 28.2 Performance times during running toexhaustion at 85% V
.o2max. following placebo or
caffeine ingestion (3, 6 or 9 mg · kg–1 body weight) 1 hprior to exercise. All caffeine conditions weresignificantly different from placebo. From Graham andSpriet (1995), with permission.
30
25
20
15
10
5
05 9 13
Caffeine (mg.kg–1 body wt)
Uri
nar
y ca
ffei
ne
(µg
. ml–1
)
Fig. 28.3 Individual urine caffeine concentrations in 15 men following exhaustive cycling at approximately80% V
.o2max. and the ingestion of 5, 9 or 13 mg caffeine ·
kg–1 body weight. The horizontal line depicts theacceptable level of less than 12 mg caffeine · ml–1 urine,as outlined by the International Olympic Committee.From Pasman et al. (1995), with permission.
80
70
60
50
40
30
20
10
0–60 0 5 15 Exh.
Time (min)
Caf
fein
e (µ
M)
9 mg
6 mg
3 mg
Placebo
Fig. 28.4 Plasma caffeine concentrations duringexhaustive (Exh.) cycling at 80% V
.o2max. following
the ingestion of placebo or 3, 6 and 9 mg caffeine · kg–1
body mass 1 h prior to exercise. Exhaustion occurredbetween 50 and 62 min in all trials. From Graham andSpriet (1995), with permission.

to increased fat oxidation and decreased carbo-hydrate (CHO) oxidation, as CHO availabilitydoes not limit performance in this type of exercise.
Graded exercise tests: 8–20 min
Several studies reported no effect of moderatedoses of caffeine on time to exhaustion andV.o2max. during graded exercise protocols lasting
8–20min (Dodd et al. 1993). However, twostudies reported prolonged exercise times whendoses of 10–15mg caffeine ·kg–1 were given(McNaughton 1987; Flinn et al. 1990). Unfortu-nately, no mechanistic information presentlyexists to explain how these high caffeine dosesprolong exercise time during a graded test,although it might be predicted that central effectswould be the most likely cause.
Intense aerobic exercise: ª20–40 min
Competitive races lasting approximately 20–40min require athletes to exercise at power outputsof approximately 80–95% V
.o2max.. Caffeine
(6 mg· kg–1) significantly reduced 1500-m swimtrial time, from 21:22 (±38 s) to 20:59 (±36 s)(min:s), in trained distance swimmers (MacIn-tosh & Wright 1995). The authors reported lowerpre-exercise venous plasma [K+] and higher post-exercise venous blood glucose concentrationwith caffeine and suggested that electrolytebalance and exogenous glucose availability maybe related to caffeine’s ergogenic effect. A secondstudy reported no ergogenic effect of caffeine inmildly trained military recruits when cycling toexhaustion (26–27min) at approximately 80%V.o2max. at sea level (Fulco et al. 1994). However,
cycle time was improved upon acute (35 vs. 23min) and chronic (39 vs. 31 min) exposure to altitude.
Intense aerobic exercise: ª4–7 min
Exercise events at high power outputs (ª100–110% V
.o2max.) that last for approximately 4–7min
require near-maximal or maximal rates of energy
382 nutrition and exercise
provision from both aerobic and anaerobicsources.
Collomp et al. (1991) reported that moderatecaffeine doses increased cycle time to exhaustionat 100% V
.o2max., from 5:20 with placebo to 5:49 in
one group and 5:40 in a second group, althoughthe increases were not statistically significant.Wiles et al. (1992) reported that coffee ingestion (ª150–200mg caffeine) improved 1500-m race timeon a treadmill by 4.2 s over placebo (4:46.0 vs.4:50.2). The runners in this study were well-trained, but clearly not elite. In a second experi-ment, subjects consumed coffee or placebo andthen ran for 1100m at a predetermined pace, fol-lowed by a final 400 m where they ran as fast aspossible. The time to complete the final 400mwas 61.25s with coffee and 62.88s without. Fol-lowing coffee, all subjects ran faster and themean V
.o2max. during the final 400 m was higher.
To document such small changes, the averageresponse to three trials in the caffeine andplacebo conditions was determined in bothexperiments.
Jackman et al. (1996) examined the effects ofcaffeine ingestion (6mg ·kg–1) on the perfor-mance and metabolic responses to three bouts ofcycling at 100% V
.o2max.. Bouts 1 and 2 lasted 2
min and bout 3 was to exhaustion, with restperiods of 6min between bouts. Time to exhaus-tion in bout 3 was improved with caffeine (4.93±0.60min vs. placebo, 4.12±0.36min; n =14).Muscle and blood lactate measurements sug-gested a higher production of lactate in the caffeine trial, even in bouts 1 and 2, when poweroutput was fixed. The glycogenolytic rate wasnot different during bouts 1 and 2 and less than50% of the muscle glycogen store was used ineither trial during the protocol. The authors concluded that the ergogenic effect of caffeineduring short-term intense exercise was not asso-ciated with glycogen sparing and may be causedby either a direct action on the muscle or alteredCNS function.
Sprint exercise
Sprinting is defined as exercise or sporting

events at power outputs corresponding to150–300% V
.o2max. lasting less than 90 s. The
amount of energy derived from anaerobicprocesses would be approximately 75–80% of thetotal in the first 30 s, approximately 65–70% over60s and approximately 55–60% of the totalenergy over 90 s.
Williams et al. (1988) reported that caffeineingestion had no effect on maximal poweroutput or muscular endurance during short,maximal bouts of cycling. Collomp et al. (1992)reported that 5 mg caffeine ·kg–1 did not increasepeak power or total work during a 30-s Wingatetest, but the same group later reported that 250mg caffeine produced a 7% improvement in themaximal power output generated during a seriesof 6-s sprints at varying force–velocity relation-ships (Anselme et al. 1992). The authors alsoexamined the effects of 4.3 mg caffeine ·kg–1 ontwo 100-m freestyle swims, separated by 20 min(Collomp et al. 1990). In well-trained swimmers,caffeine increased swim velocity by 2% and 4% inthe two sprints, but performance times were notreported. Caffeine had no effect on sprint perfor-mance in untrained swimmers.
Therefore, given the present information, it isnot possible to conclude whether caffeine has anergogenic effect on sprint performance. The briefand intense nature of sprint exercise makes it difficult to study and demonstrate significantdifferences.
Field studies
Exercise performance in most laboratory studiesis measured as the time taken to reach exhaustionat a given power output or the amount of workthat can be performed in a given amount of time.However, in the field, performance is usuallymeasured as the time taken to complete a certaindistance. Consequently, extrapolations from the laboratory to field settings may not be valid.Occasionally, laboratory studies simulate raceconditions and other studies measure perfor-mance in the field (track, swimming pool) in timetrial settings without actual race conditions.However, these studies still do not simulate real
competitions. In field studies that do simulaterace conditions, it is often impossible to em-ploy the controls required to generate conclusiveresults. For example, Berglund and Hemmings-son (1982) reported that caffeine increased cross-country ski performance by 1–2.5min with acontrol race lasting 1–1.5h. This improvementoccurred at altitude but not at sea level. Unfortu-nately, the weather and snow conditions werevariable in both locations, requiring normali-zation of the performance times in order tocompare results. A recent field study reportedthat ingesting 0, 5 or 9 mg caffeine ·kg–1 had noeffect on 21-km road-race performance in hotand humid environments (Cohen et al. 1996).While subjects acted as their own controls, nosubjects received the placebo treatment in allthree races to assess whether between race envi-ronmental differences affected race performance,independent of caffeine.
The problems associated with field trials raise questions about the validity of the resultsand indicate how difficult it is to perform well-controlled and meaningful field trials.However, there is clearly a need for more fieldstudies.
Theories of ergogenicity
The mechanisms that may contribute to theergogenic effects of caffeine are categorized into three general theories. The first theory is the classic or ‘metabolic’ explanation for theergogenic effects of caffeine during enduranceexercise involving an increase in fat oxidationand reduction in CHO oxidation. The metaboliccategory also includes factors which may affectmuscle metabolism and performance in a directmanner, including inhibition of phosphodi-esterase, leading to an elevated cyclic adenosinemonophosphate (AMP) concentration, anddirect effects on key enzymes such as glycogenphosphorylase (PHOS). The second theory pro-poses a direct effect of caffeine on skeletal muscleperformance via ion handling, including Na+–K+-ATPase activity and Ca2+ kinetics. The thirdtheory suggests that caffeine exerts a direct effect
caffeine 383
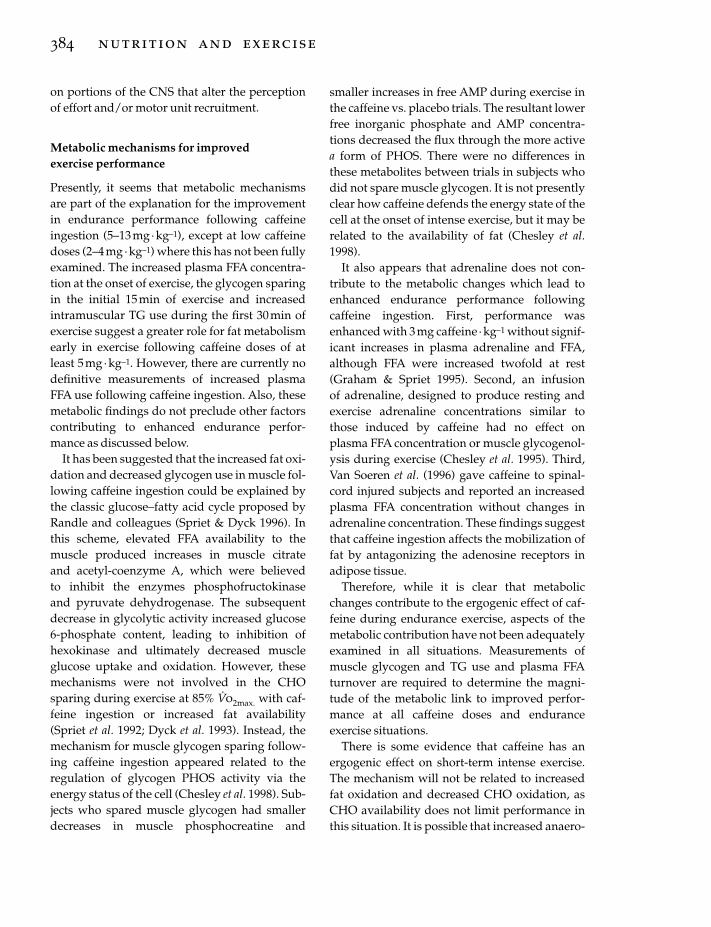
on portions of the CNS that alter the perceptionof effort and/or motor unit recruitment.
Metabolic mechanisms for improved exercise performance
Presently, it seems that metabolic mechanismsare part of the explanation for the improvementin endurance performance following caffeineingestion (5–13 mg·kg–1), except at low caffeinedoses (2–4mg ·kg–1) where this has not been fullyexamined. The increased plasma FFA concentra-tion at the onset of exercise, the glycogen sparingin the initial 15 min of exercise and increasedintramuscular TG use during the first 30min ofexercise suggest a greater role for fat metabolismearly in exercise following caffeine doses of atleast 5 mg·kg–1. However, there are currently nodefinitive measurements of increased plasmaFFA use following caffeine ingestion. Also, thesemetabolic findings do not preclude other factorscontributing to enhanced endurance perfor-mance as discussed below.
It has been suggested that the increased fat oxi-dation and decreased glycogen use in muscle fol-lowing caffeine ingestion could be explained bythe classic glucose–fatty acid cycle proposed byRandle and colleagues (Spriet & Dyck 1996). Inthis scheme, elevated FFA availability to themuscle produced increases in muscle citrate and acetyl-coenzyme A, which were believed to inhibit the enzymes phosphofructokinase and pyruvate dehydrogenase. The subsequentdecrease in glycolytic activity increased glucose6-phosphate content, leading to inhibition ofhexokinase and ultimately decreased muscleglucose uptake and oxidation. However, thesemechanisms were not involved in the CHOsparing during exercise at 85% V
.o2max. with caf-
feine ingestion or increased fat availability(Spriet et al. 1992; Dyck et al. 1993). Instead, themechanism for muscle glycogen sparing follow-ing caffeine ingestion appeared related to theregulation of glycogen PHOS activity via theenergy status of the cell (Chesley et al. 1998). Sub-jects who spared muscle glycogen had smallerdecreases in muscle phosphocreatine and
384 nutrition and exercise
smaller increases in free AMP during exercise inthe caffeine vs. placebo trials. The resultant lowerfree inorganic phosphate and AMP concentra-tions decreased the flux through the more activea form of PHOS. There were no differences inthese metabolites between trials in subjects whodid not spare muscle glycogen. It is not presentlyclear how caffeine defends the energy state of thecell at the onset of intense exercise, but it may berelated to the availability of fat (Chesley et al.1998).
It also appears that adrenaline does not con-tribute to the metabolic changes which lead toenhanced endurance performance following caffeine ingestion. First, performance wasenhanced with 3 mg caffeine ·kg–1 without signif-icant increases in plasma adrenaline and FFA,although FFA were increased twofold at rest(Graham & Spriet 1995). Second, an infusion of adrenaline, designed to produce resting andexercise adrenaline concentrations similar tothose induced by caffeine had no effect onplasma FFA concentration or muscle glycogenol-ysis during exercise (Chesley et al. 1995). Third,Van Soeren et al. (1996) gave caffeine to spinal-cord injured subjects and reported an increasedplasma FFA concentration without changes inadrenaline concentration. These findings suggestthat caffeine ingestion affects the mobilization offat by antagonizing the adenosine receptors inadipose tissue.
Therefore, while it is clear that metabolicchanges contribute to the ergogenic effect of caf-feine during endurance exercise, aspects of themetabolic contribution have not been adequatelyexamined in all situations. Measurements ofmuscle glycogen and TG use and plasma FFAturnover are required to determine the magni-tude of the metabolic link to improved perfor-mance at all caffeine doses and enduranceexercise situations.
There is some evidence that caffeine has anergogenic effect on short-term intense exercise.The mechanism will not be related to increasedfat oxidation and decreased CHO oxidation, asCHO availability does not limit performance inthis situation. It is possible that increased anaero-

bic energy provision from glycogen breakdownand the glycolytic pathway may contribute to theimprovement in performance during repeatedbouts of intense exercise (100% V
.o2max.) lasting
2–5min (Jackman et al. 1996). If this occurred, itwould likely be the result of a direct effect of caf-feine or a caffeine metabolite.
A few additional metabolic mechanisms havebeen suggested to contribute to the ergogeniceffects of caffeine. It is commonly stated that caf-feine inhibits phosphodiesterase, leading to anincrease in cyclic AMP concentration and muscle glycogen PHOS activation. However, thesupport for these conclusions is from in vitro or‘test tube’ studies that used pharmacological caf-feine levels and it is now generally accepted thatthese effects would not be present at physiolog-ical caffeine concentrations (for review, seeTarnopolsky 1994; Spriet 1995). Vergauwen et al.(1994) recently reported that adenosine receptorsmediate the stimulation of glucose uptake andtransport by insulin and contractions in rat skele-tal muscle. Caffeine, as an adenosine receptorantagonist and at a physiological level (77mm),decreased glucose uptake during contractions.This may be an additional mechanism wherebyCHO use is spared following caffeine inges-tion and replaced by increased fat oxidation.However, there have been no definitive reportsdemonstrating that adenosine receptors exist inhuman skeletal muscle.
Ion handling in skeletal muscle
Caffeine may alter the handling of ions in skele-tal muscle and contribute to an ergogenic effectduring exercise. Most of the supporting evidencehas come from in vitro experiments using phar-macological doses of methylxanthines. The can-didates that have been suggested to contribute toan ergogenic effect in a physiological environ-ment are increased Ca2+ release during the latterstages of exercise and increased Na+–K+-ATPaseactivity, which may help maintain the membranepotential during exercise. These are the mostlikely candidates since the lowest methylxan-thine concentration used to show these effects in
the in vitro experiments approached the actualmethylxanthine concentrations that have beenshown to be ergogenic in vivo (Lindinger et al.1993; Tarnopolsky 1994).
It has been demonstrated in vitro that pharma-cological levels of methylxanthine affect severalsteps in skeletal muscle excitation–contractioncoupling:1 increasing the release of Ca2+ from the sar-coplasmic reticulum;2 enhancing troponin/myosin Ca2+ sensitivity;and3 decreasing the reuptake of Ca2+ by the sar-coplasmic reticulum (Tarnopolsky 1994).
Methylxanthines also stimulate Na+–K+-ATPase activity in inactive skeletal muscleleading to increased rates of K+ uptake and Na+
efflux. This attenuates the rise in plasma [K+]with exercise, which may help maintain themembrane potential in contracting muscle andcontribute to caffeine’s ergogenic effect duringexercise (Lindinger et al. 1993, 1996). Any of thesechanges could produce increases in skeletalmuscle force production. However, at the presenttime, it is not clear if these potential ion-handlingeffects of caffeine contribute to an ergogeniceffect, given the physiological or in vivomethylxanthine concentration normally found inhumans.
Central effects of caffeine
While it is almost universally accepted that someof the ergogenic effects of caffeine are manifestedthrough effects on the CNS, it is almost impossi-ble to quantify how much of caffeine’s ability to delay fatigue is due to central or peripheraleffects. Complicating the problem is the fact thatit is not clear how caffeine exerts its actions on the CNS. Caffeine is certainly a CNS stimulant,causing increased wakefulness and vigilance(Van Handel 1983; Nehlig et al. 1992; Daly 1993).Some have attributed the increased performancederived from caffeine simply to this increasedalertness or improved mood (Nehlig & Debry1994). However, the ability of caffeine to delayfatigue points to more complex mechanisms than
caffeine 385

simply heightened arousal. Because they are alsorelated to peripheral metabolic effects, the fol-lowing topics are of special interest in a discus-sion of caffeine’s central effects: adenosinereceptor antagonism, lowered perceived exer-tion and the central fatigue hypothesis.
Adenosine receptor antagonism
Since caffeine can freely pass through theblood–brain barrier (Nehlig et al. 1992), its con-centration in the brain and CNS increases rapidlyfollowing ingestion, in concert with changes in other body tissues (Daly 1993). Caffeineincreases brain neurotransmitter concentration,causing increases in spontaneous locomotoractivity and neuronal firing in animals (Nehlig etal. 1992). It is generally accepted that the mecha-nism for neurotransmitter increases is adenosinereceptor antagonism and high adenosine recep-tor levels in the brain support this hypothesis(Fernstrom & Fernstrom 1984; Snyder 1984; Daly1993; Fredholm 1995).
Adenosine is both a neurotransmitter and neu-romodulator, capable of affecting the release ofother neurotransmitters (Fernstrom & Fernstrom1984). Adenosine and adenosine analogues gen-erally cause lowered motor activity, decreasedwakefulness and vigilance, and decreases inother neurotransmitter concentrations. Caffeineand adenosine receptor antagonists have theopposite effect by blocking the adenosine recep-tors. It is generally believed that the inhibition(adenosine) or stimulation (caffeine) of neuro-transmitter release is presynaptic (Snyder 1984;Fredholm 1995). It has been demonstrated thatcaffeine increases the concentration, synthesisand/or turnover of all major neurotransmitters,including serotonin, dopamine, acetylcholine,noradrenaline and glutamate. These neurotrans-mitters are all inhibited by adenosine. The exactconsequences of these changes in neurotransmit-ters with regards to performance is currently not known. Both dopamine and serotonin levelshave been implicated in the central effects of caf-feine on fatigue and behaviour (Fernstrom &Fernstrom 1984; Daly 1993), and in the develop-
386 nutrition and exercise
ment of central fatigue exclusive of caffeineingestion (Davis & Bailey 1997). It has been sug-gested that an increase in excitatory neurotrans-mitters could lead to decreases in motorneuronethreshold, resulting in greater motor unit recruit-ment (Waldeck 1973) and subsequently lowerperceived exertion for a given power output(Nehlig & Debry 1994; Cole et al. 1996). However,this theory has not been demonstrated duringexercise, although it continues to be cited as apotential mechanism (Nehlig & Debry 1994; Coleet al. 1996).
Complicating the effects of caffeine on adeno-sine antagonism is the existence of two mainclasses of adenosine receptors, A1 and A2 (Snyder1984; Graham et al. 1994), each having differingaffinities for endogenous adenosine and xan-thines, and affecting the release of different neu-rotransmitters (Daly 1993) Likewise, antagonismof these receptors is dependent on the caffeineconcentration, which will either inhibit (A1) orstimulate (A2) adenylate cyclase, leading to differential effects and possibly explaining thebiphasic response to caffeine. Increasing caffeinedoses are stimulatory, but very high physiologi-cal doses are depressant (Snyder 1984). As well,some adenosine antagonists display the sameaffinity as xanthines for adenosine receptors, butdo not cause the same effects (Snyder 1984; Daly1993). Finally, the binding of caffeine to benzo-diazepine receptors and the relationship togamma-aminobutyric acid (GABA) and excita-tory amino acids is currently being explored(Nehlig et al. 1992; Daly 1993). Some authorsassert that adenosine receptor antagonism, whilelikely the primary mechanism, cannot accountfor all of caffeine’s actions on the CNS (Graham et al. 1994).
Ratings of perceived exertion
One quantifiable aspect of caffeine’s centraleffects is a lower rating of perceived exertion(RPE) during exercise. Several studies havedemonstrated that (i) RPE at a standard poweroutput was lower in subjects following caffeineingestion than in controls (Costill et al. 1978), and

(ii) subjects accomplished a greater amount ofwork following caffeine ingestion than controlswhen RPE was held constant (Ivy et al. 1979; Coleet al. 1996). This significant decline in experimen-tal RPE is certainly supported by anecdotal evi-dence. It has been speculated that the loweredRPE with caffeine is due to a decrease in thefiring threshold of motorneurones (Nehlig &Debry 1994; Cole et al. 1996) or changes in musclecontraction force (Tarnopolsky 1994). Bothmechanisms would result in lowered afferentfeedback from the working muscle and alowered RPE, the first mechanism because moremotor units would be recruited for a given taskand the second because the force for a given stim-ulus would be greater. However, the ability ofphysiological caffeine concentration to alter con-tractile function is equivocal as discussed earlier(Graham et al. 1994; Tarnopolsky 1994). Anotherhypothesis is that caffeine directly affects therelease of b-endorphins and other hormones thatmodulate the feelings of discomfort and painassociated with exhaustive exercise (Nehlig et al.1992). A final explanation for the reduced RPEmay involve the central fatigue hypothesis(Tarnopolsky 1994).
central fatigue hypothesis
Given that caffeine affects the CNS, it is appeal-ing to link it to one proposed mechanism offatigue currently being investigated, the centralfatigue hypothesis (see Chapter 12). Briefly, thishypothesis argues that the central component offatigue caused by exhaustive exercise is medi-ated by elevated levels of serotonin (5-HT) in thebrain, caused by an increase in its precursor,tryptophan (TRP) (Blomstrand & Newsholme1996). Tryptophan is the only amino acid that istransported in plasma bound to albumin and itcompetes for transport into the brain withbranched-chain amino acids (BCAA). Evidencefor the central fatigue theory includes increasedlevels of brain 5-HT at fatigue, increased plasmafree TRP at fatigue caused by high FFAs, anddecreased fatigue with BCAA supplementation(Blomstrand & Newsholme 1996). If caffeine
delayed the onset of CNS fatigue via serotoninlevels, then it must lower 5-HT levels or inhibitthe rise in 5-HT. However, the effects of caffeineon the CNS and peripheral metabolism appear tocounter this process for two reasons. First, acutecaffeine ingestion has been shown to signifi-cantly increase brain 5-HT levels, most likely dueto increases in brain free TRP levels (Fernstrom &Fernstrom 1984; Nehlig et al. 1992). Second, caf-feine ingestion prior to exercise elevates plasmaFFA concentration at the onset of exercise, whichshould increase free TRP, due to competition foralbumin binding, and hasten fatigue. It is possi-ble that the rise in 5-HT at the onset of exercise is overridden by other factors, such as increased sympathetic drive, or favourable meta-bolic factors. Similarly, since it has been postu-lated that the ratio of 5-HT to dopamine is alarger determinant in fatigue than the [5-HT]alone (Davis & Bailey 1997), the caffeine-inducedrise in both neurotransmitters could offset eachother.
In summary, the caffeine-induced mecha-nism(s) that may delay central fatigue are stillundiscovered, but the link between caffeine and the central fatigue hypothesis remainsintriguing.
Complications of studying caffeine,exercise performance and metabolism
It is important to note in a discussion of the per-formance, metabolic and central effects of caf-feine ingestion that the mechanism(s) of actionmay not be entirely due to the primary effects ofcaffeine. Caffeine is a trimethylxanthine com-pound, which is rapidly metabolized in the liverto three dimethylxanthines, paraxanthine, theo-phylline and theobromine. These are releasedinto the plasma as the caffeine concentrationdeclines and remain in the circulation longer.While the plasma dimethylxanthine concen-trations are not large, paraxanthine and theo-phylline are potential adenosine antagonists andmetabolic stimuli. Therefore, as caffeine and itsmetabolites are often present at the same time, itis difficult to resolve which tissues are directly or
caffeine 387
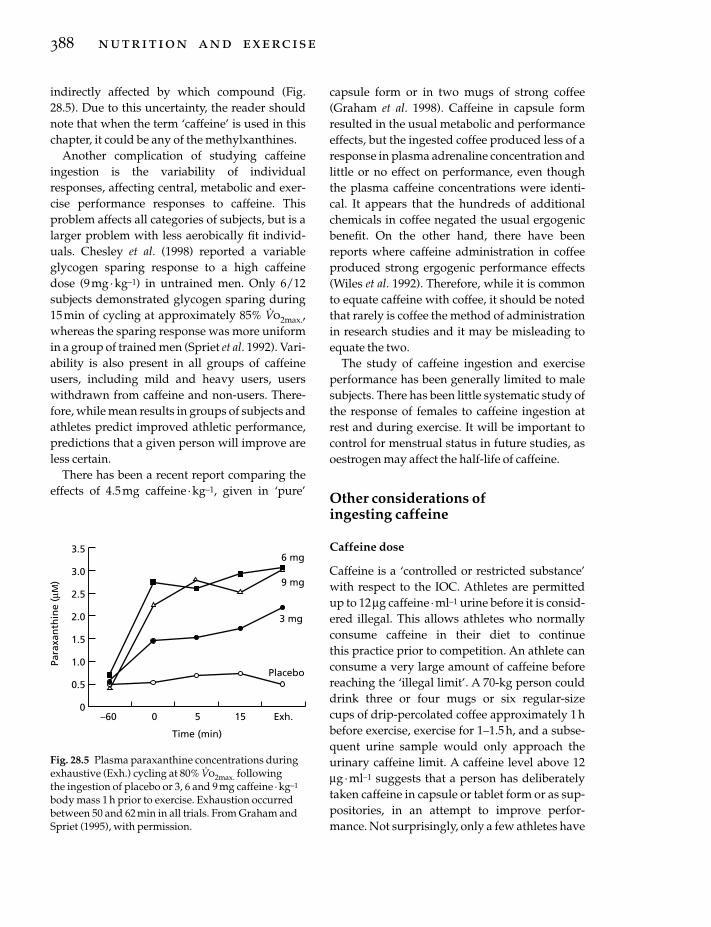
indirectly affected by which compound (Fig.28.5). Due to this uncertainty, the reader shouldnote that when the term ‘caffeine’ is used in thischapter, it could be any of the methylxanthines.
Another complication of studying caffeineingestion is the variability of individualresponses, affecting central, metabolic and exer-cise performance responses to caffeine. Thisproblem affects all categories of subjects, but is alarger problem with less aerobically fit individ-uals. Chesley et al. (1998) reported a variableglycogen sparing response to a high caffeinedose (9mg· kg–1) in untrained men. Only 6/12subjects demonstrated glycogen sparing during15min of cycling at approximately 85% V
.o2max.,
whereas the sparing response was more uniformin a group of trained men (Spriet et al. 1992). Vari-ability is also present in all groups of caffeineusers, including mild and heavy users, userswithdrawn from caffeine and non-users. There-fore, while mean results in groups of subjects andathletes predict improved athletic performance,predictions that a given person will improve areless certain.
There has been a recent report comparing theeffects of 4.5 mg caffeine · kg–1, given in ‘pure’
388 nutrition and exercise
capsule form or in two mugs of strong coffee(Graham et al. 1998). Caffeine in capsule formresulted in the usual metabolic and performanceeffects, but the ingested coffee produced less of aresponse in plasma adrenaline concentration andlittle or no effect on performance, even thoughthe plasma caffeine concentrations were identi-cal. It appears that the hundreds of additionalchemicals in coffee negated the usual ergogenicbenefit. On the other hand, there have beenreports where caffeine administration in coffeeproduced strong ergogenic performance effects(Wiles et al. 1992). Therefore, while it is commonto equate caffeine with coffee, it should be notedthat rarely is coffee the method of administrationin research studies and it may be misleading toequate the two.
The study of caffeine ingestion and exerciseperformance has been generally limited to malesubjects. There has been little systematic study ofthe response of females to caffeine ingestion atrest and during exercise. It will be important tocontrol for menstrual status in future studies, asoestrogen may affect the half-life of caffeine.
Other considerations of ingesting caffeine
Caffeine dose
Caffeine is a ‘controlled or restricted substance’with respect to the IOC. Athletes are permittedup to 12mg caffeine · ml–1 urine before it is consid-ered illegal. This allows athletes who normallyconsume caffeine in their diet to continue this practice prior to competition. An athlete canconsume a very large amount of caffeine beforereaching the ‘illegal limit’. A 70-kg person coulddrink three or four mugs or six regular-size cups of drip-percolated coffee approximately 1hbefore exercise, exercise for 1–1.5 h, and a subse-quent urine sample would only approach theurinary caffeine limit. A caffeine level above 12mg ·ml–1 suggests that a person has deliberatelytaken caffeine in capsule or tablet form or as sup-positories, in an attempt to improve perfor-mance. Not surprisingly, only a few athletes have
3.5
3.0
2.5
2.0
1.5
1.0
0.5
0–60 0 5 15 Exh.
Time (min)
Para
xan
thin
e (µ
M)
6 mg
9 mg
3 mg
Placebo
Fig. 28.5 Plasma paraxanthine concentrations duringexhaustive (Exh.) cycling at 80% V
.o2max. following
the ingestion of placebo or 3, 6 and 9 mg caffeine · kg–1
body mass 1 h prior to exercise. Exhaustion occurredbetween 50 and 62 min in all trials. From Graham andSpriet (1995), with permission.

been caught with illegal levels during competi-tions, although formal reports of the frequency ofcaffeine abuse are rare. One study reported that26/775 cyclists had illegal urinary caffeine levelswhen tested following competition (Delbecke &Debachere 1984).
Urinary caffeine and doping
The use of urinary caffeine levels to determinecaffeine abuse in sport has been criticized(Duthel et al. 1991). Only 0.5–3% of orallyingested caffeine actually reaches the urine as themajority is metabolized in the liver. The excretedcaffeine by-products are not measured in dopingtests. Other factors also affect the amount of caf-feine that reaches the urine, including bodyweight, gender and hydration status of theathlete. The time elapsed between caffeine inges-tion and urine collection is also important andaffected by the exercise duration and environ-mental conditions. Sport governing bodies maynot regard these concerns as problems since mostpeople caught with illegal levels of caffeine will have used the drug in a doping manner.However, it is possible that someone who metab-olizes caffeine slowly or who excretes 3% of theingested dose rather than 0.5% could have illegalurine levels following a moderate dose.
Habitual caffeine consumption
An athlete’s normal caffeine intake habits mayaffect whether acute caffeine ingestion improvesperformance. Many investigators ask users torefrain from caffeine consumption for 2–3 daysprior to experiments. Caffeine metabolism is notincreased by use, but the effects of caffeine maybe altered by habitual use via alterations inadenosine receptor populations. As reviewed byGraham et al. (1994), several studies suggest thatchronic caffeine use dampens the adrenalineresponse to exercise and caffeine, but does notaffect plasma FFA concentration or exercise RER (Bangsbo et al. 1992; Van Soeren et al. 1993). However, these changes do not appear todampen the ergogenic effect of 9 mg caffeine ·
kg–1. Endurance performance increased in allsubjects when both caffeine users and non-userswere examined and users abstained from caf-feine for 48–72h prior to experiments (Graham &Spriet 1991; Spriet et al. 1992). However, the per-formance results were more variable in a subse-quent study with more non-users (Graham &Spriet 1995). In addition, Van Soeren andGraham (1998) reported no effect of up to 4 daysof caffeine withdrawal on exercise hormonal and metabolic responses to doses of 6 or 9 mg caffeine ·kg–1 in recreational cyclists. Time toexhaustion at 80–85% V
.o2max. improved with
caffeine and was unaffected by 0–4 days of withdrawal.
Caffeine and high carbohydrate diets
An early investigation suggested that a highCHO diet and a prerace CHO meal negated theexpected increase in plasma FFA concentrationfollowing caffeine ingestion during 2h of exer-cise at approximately 75% V
.o2max. (Weir et al.
1987). These results implied that high CHO diets negated the ergogenic effects of caffeine,although performance was not measured.However, a high CHO diet and a pretrial CHOmeal did not prevent caffeine-induced increasesin performance in a number of recent studiesusing well-trained/recreational runners andcyclists (Spriet 1995).
Diuretic effect of caffeine
Because caffeine is a diuretic, it has been sug-gested that caffeine ingestion may lead to poorhydration status prior to and during exercise.However, no changes in core temperature, sweatloss or plasma volume were reported duringexercise following caffeine ingestion (Gordon et al. 1982; Falk et al. 1990). It has also beendemonstrated that urine flow rate, decreases inplasma volume, sweat rate and heart rate wereunaffected by caffeine (ª 600mg), ingested in aCHO electrolyte drink (ª 2.5 l) during 1h at restand 3 h of cycling at 60% V
.o2max. (Wemple et al.
1997).
caffeine 389

Conclusion
Caffeine ingestion (3–13 mg· kg–1 body mass)prior to exercise increases performance duringprolonged endurance cycling and running in thelaboratory. Caffeine doses below 9 mg· kg–1 gen-erally produce urine caffeine levels below theIOC allowable limit of 12mg ·ml–1. Moderate caffeine doses (5–6 mg· kg–1) may also increaseshort-term intense cycling performance (ª 4–7min) in the laboratory and decrease 1500-m swim time (ª20 min). These results are generallyreported in well-trained or recreational athletes,but field studies are lacking to confirm theergogenic effects of caffeine in the athletic world.The mechanisms for the improved endurancehave not been clearly established. Caffeine inges-tion generally increases resting venous plasmaFFA concentration and reduces muscle glycogenuse and increases muscle TG use early duringendurance exercise, suggesting greater fat oxida-tion and reduced CHO oxidation in the workingmuscles. However, a single metabolic explana-tion for the ergogenic effect of caffeine is unlikely,especially at low caffeine doses that do not causemajor metabolic changes. All human perfor-mance studies have been unable to separate thecentral effects of caffeine from peripheral effects.Therefore, a central contribution to the enhance-ment of endurance exercise performance follow-ing caffeine ingestion is a strong possibility.Potential mechanisms for improved perfor-mance during short-term intense exerciseinclude direct caffeine effects on the CNS and/orion handling in skeletal muscle and increasedanaerobic energy provision in muscle. Definitiveresearch into the mechanisms of the ergogeniceffects of caffeine in exercising humans is ham-pered by the ability of this drug and its by-products to affect both central and peripheralprocesses.
References
Anselme, F., Collomp, K., Mercier, B., Ahmaidi, S. &Prefaut, C. (1992) Caffeine increases maximal anaer-obic power and blood lactate concentration. Euro-pean Journal of Applied Physiology 65, 188–191.
390 nutrition and exercise
Bangsbo, J., Jacobsen, K., Nordberg, N., Christensen,N.J. & Graham, T. (1992) Acute and habitual caffeineingestion and metabolic responses to steady-stateexercise. Journal of Applied Physiology 72, 1297–1303.
Berglund, B. & Hemmingsson, P. (1982) Effects of caf-feine ingestion on exercise performance at low andhigh altitudes in cross country skiers. InternationalJournal of Sports Medicine 3, 234–236.
Blomstrand, E.E. & Newsholme, E.A. (1996) Glucose-fatty acid cycle and fatigue involving 5-hydroxytryptamine. In Biochemistry of Exercise IX (ed.R.J. Maughan & S.M. Shirreffs), pp. 185–195. HumanKinetics, Champaign, IL.
Chesley, A., Hultman, E. & Spriet, L.L. (1995) Effects ofepinephrine infusion on muscle glycogenolysisduring intense aerobic exercise. American Journal of Physiology 268 (Endocrinology Metabolism),E127–E134.
Chesley, A., Howlett, R.A., Heigenhauser, G.J.F.,Hultman, E. & Spriet, L.L. (1998) Regulation ofmuscle glycogenolytic flux during intense aerobicexercise after caffeine ingestion. American Journal ofPhysiology 275, R596–603.
Cohen, B.S., Nelson, A.G., Prevost, M.C., Thompson,G.D., Marx, B.D. & Morris, G.S. (1996) Effects of caf-feine ingestion on endurance racing in heat andhumidity. European Journal of Applied Physiology 73,358–363.
Cole, K.J., Costill, D.L., Starling, R.D., Goodpaster,B.H., Trappe, S.W. & Fink, W.J. (1996) Effect of caf-feine ingestion on perception of effort and subse-quent work production. International Journal of SportNutrition 6, 14–23.
Collomp, K., Caillaud, C., Audran, M., Chanal, J.-L. &Prefaut, C. (1990) Influence of acute and chronicbouts of caffeine on performance and cate-cholamines in the course of maximal exercise.Comptes Rendues des Seances de la Societe de Biologie184, 87–92.
Collomp., K., Ahmaidi, S., Audran, M., Chanal, J.-L. &Prefaut, C. (1991) Effects of caffeine ingestion on per-formance and anaerobic metabolism during theWingate test. International Journal of Sports Medicine12, 439–443.
Collomp, K., Ahmaidi, S., Chatard, J.C., Audran, M. &Prefaut, C. (1992) Benefits of caffeine ingestion onsprint performance in trained and untrained swim-mers. European Journal of Applied Physiology 64,377–380.
Conlee, R.K. (1991) Amphetamine, caffeine andcocaine. In Ergogenics: Enhancement of Performance inExercise and Sport (ed. D.R. Lamb & M.H. Williams),pp. 285–330. Brown and Benchmark, Indianapolis,IN.
Costill, D.L., Dalsky, G.P. & Fink, W.J. (1978) Effects ofcaffeine on metabolism and exercise performance.Medicine and Science in Sports 10, 155–158.
Daly, J.W. (1993) Mechanism of action of caffeine. InCaffeine, Coffee, and Health (ed. S. Garatttini), pp.97–150. Raven Press, New York.
Davis, J.M. & Bailey, S.P. (1997) Possible mechanisms ofcentral nervous system fatigue during exercise.Medicine and Science in Sports and Exercise 29, 45–57.
Delbecke, F.T. & Debachere, M. (1984) Caffeine: use andabuse in sports. International Journal of Sports Medi-cine 5, 179–182.
Dodd, S.L., Herb, R.A. & Powers, S.K. (1993) Caffeineand exercise performance: an update. Sports Medicine15, 14–23.
Duthel, J.M., Vallon, J.J., Martin, G., Ferret, J.M.,Mathieu, R. & Videman, R. (1991) Caffeine and sport:role of physical exercise upon elimination. Medicineand Science in Sports and Exercise 23, 980–985.
Dyck, D.J., Putman, C.T., Heigenhauser, G.J.F.,Hultman, E. & Spriet, L.L. (1993) Regulation offat–carbohydrate interaction in skeletal muscleduring intense aerobic cycling. American Journal ofPhysiology 265, E852–859.
Essig, D., Costill, D.L. & VanHandel, P.J. (1980) Effectsof caffeine ingestion on utilization of muscle glyco-gen and lipid during leg ergometer cycling. Interna-tional Journal of Sports Medicine 1, 86–90.
Falk, B., Burstein, R., Rosenblum, J., Shapiro, Y., Zylber-Katz, E. & Bashan, N. (1990) Effects of caf-feine ingestion on body fluid balance and thermoreg-ulation during exercise. Canadian Journal ofPhysiology and Pharmacology 68, 889–892.
Fernstrom, J.D. & Fernstrom, M.H. (1984) Effects of caf-feine on monamine neurotransmitters in the centraland peripheral nervous system. In Caffeine (ed. P.B.Dews), pp. 107–118. Springer-Verlag, Berlin.
Flinn, S., Gregory, J., McNaughton, L.R., Tristram, S. &Davies, P. (1990) Caffeine ingestion prior to incre-mental cycling to exhaustion in recreational cyclists.International Journal of Sports Medicine 11, 188–193.
Fredholm, B.B. (1995) Adenosine, adenosine receptorsand the actions of caffeine. Pharmacology and Toxicology 76, 93–101.
Fulco, C.S., Rock, P.B., Trad, L.A. et al. (1994) Effect ofcaffeine on submaximal exercise performance at alti-tude. Aviation Space and Environmental Medicine 65,539–545.
Gordon, N.F., Myburgh, J.L., Kruger, P.E. et al. (1982)Effects of caffeine on thermoregulatory and myocar-dial function during endurance performance. SouthAfrican Medical Journal 62, 644–647.
Graham, T.E. & Spriet, L.L. (1991) Performance andmetabolic responses to a high caffeine dose duringprolonged exercise. Journal of Applied Physiology 71,2292–2298.
Graham, T.E. & Spriet, L.L. (1995) Metabolic, cate-cholamine and exercise performance responses to varying doses of caffeine. Journal of Applied Physiology 78, 867–874.
Graham, T.E., Rush, J.W.E. & van Soeren, M.H. (1994)Caffeine and exercise: metabolism and performance.Canadian Journal of Applied Physiology 19, 111–138.
Graham, T.E., Hibbert, E. & Sathasivam, P. (1998) Metabolic and exercise endurance effects of coffeeand caffeine ingestion. Journal of Applied Physiology85, 883–889.
Ivy, J.L., Costill, D.L., Fink, W.J. & Lower, R.W. (1979)Influence of caffeine and carbohydrate feedings onendurance performance. Medicine and Science inSports 11, 6–11.
Jackman, M., Wendling, P., Friars, D. & Graham, T.E.(1996) Metabolic, catecholamine and enduranceresponses to caffeine during intense exercise. Journalof Applied Physiology 81, 1658–1663.
Lindinger, M.I., Graham, T.E. & Spriet, L.L. (1993) Caffeine attenuates the exercise-induced increase inplasma [K+] in humans. Journal of Applied Physiology74, 1149–1155.
Lindinger, M.I., Willmets, R.G. & Hawke, T.J. (1996)Stimulation of Na+, K+-pump activity in skeletalmuscle by methylxanthines: evidence and proposedmechanisms. Acta Physiologica Scandinavica 156,347–353.
MacIntosh, B.R. & Wright, B.M. (1995) Caffeine inges-tion and performance of a 1500-metre swim. Cana-dian Journal of Applied Physiology 20, 168–177.
McNaughton, L. (1987) Two levels of caffeine ingestionon blood lactate and free fatty acid responses duringincremental exercise. Research Quarterly of Exerciseand Sport 58, 255–259.
Nehlig, A. & Debry, G. (1994) Caffeine and sports activity: a review. International Journal of Sports Medicine 15, 215–223.
Nehlig, A., Daval, J.-L. & Debry, G. (1992) Caffeine andthe central nervous system: mechanisms of action,biochemical, metabolic, and psychostimulant effects.Brain Research Reviews 17, 139–170.
Pasman, W.J., VanBaak, M.A., Jeukendrup, A.E. &DeHaan, A. (1995) The effect of different dosages ofcaffeine on endurance performance time. Interna-tional Journal of Sports Medicine 16, 225–230.
Snyder, S.H. (1984) Adenosine as a mediator of thebehavioral effects of xanthines. In Caffeine (ed. P.B.Dews), pp. 129–141. Springer-Verlag, Berlin.
Spriet, L.L. (1995) Caffeine and performance. Interna-tional Journal of Sports Nutrition 5, S84–S99.
Spriet, L.L. (1997) Ergogenic aids: recent advances andretreats. In Recent Advances in the Science and Medicineof Sport, Vol. 10 (ed. D.R. Lamb & R. Murray), pp.186–238. Cooper Publishing, Carmel.
Spriet, L.L. & Dyck, D.J. (1996) The glucose-fatty acidcycle in skeletal muscle at rest and during exercise. InBiochemistry of Exercise IX (ed. R.J. Maughan & S.M. Shirreffs), pp. 127–155. Human Kinetics, Champaign, IL.
Spriet, L.L., MacLean, D.A., Dyck, D.J., Hultman, E.,
caffeine 391

Cederblad, G. & Graham, T.E. (1992) Caffeine inges-tion and muscle metabolism during prolonged exer-cise in humans. American Journal of Physiology 262(Endocrinology Metabolism), E891–E898.
Tarnopolsky, M.A. (1994) Caffeine and endurance per-formance. Sports Medicine 18, 109–125.
Trice, I. & Haymes, E.M. (1995) Effects of caffeine ingestion on exercise-induced changes during high-intensity, intermittent exercise. International Journal of Sports Nutrition 5, 37–44.
Van Handel, P. (1983) Caffeine. In Ergogenic Aids inSport (ed. M.H. Williams), pp. 128–163. HumanKinetics, Champaign, IL.
Van Soeren, M.H. & Graham, T.E. (1998) Effect of caf-feine on metabolism, exercise endurance, and cate-cholamine responses after withdrawal. Journal ofApplied Physiology 85, 1493–1501.
Van Soeren, M.H., Sathasivam, P., Spriet, L.L. &Graham, T.E. (1993) Caffeine metabolism and epi-nephrine responses during exercise in users andnon-users. Journal of Applied Physiology 75, 805–812.
Van Soeren, M.H., Mohr, T., Kjaer, M. & Graham, T.E.(1996) Acute effects of caffeine ingestion at rest inhumans with impaired epinephrine responses.Journal of Applied Physiology 80, 999–1005.
Vergauwen, L., Hespel, P. & Richter, E.A. (1994) Adeno-
392 nutrition and exercise
sine receptors mediate synergistic stimulation ofglucose uptake and transport by insulin and by contractions in rat skeletal muscle. Journal of ClinicalInvestigation 93, 974–981.
Waldeck, B. (1973) Sensitization by caffeine of centralcatecholamine receptors. Journal of Neural Transmission 34, 61–72.
Weir, J., Noakes, T.D., Myburgh, K. & Adams, B. (1987)Ahigh carbohydrate diet negates the metabolic effectof caffeine during exercise. Medicine and Science inSports Exercise 19, 100–105.
Wemple, R.D., Lamb, D.R. & McKeever, K.H. (1997)Caffeine vs. caffeine-free sports drinks: effects onurine production at rest and during prolonged exer-cise. International Journal of Sports Medicine 18, 40–46.
Wilcox, A.R. (1990) Caffeine and endurance perfor-mance. In Sports Science Exchange, pp. 1–5. GatoradeSports Science Institute, Barrington, IL.
Wiles, J.D., Bird, S.R., Hopkins, J. & Riley, M. (1992)Effect of caffeinated coffee on running speed, respi-ratory factors, blood lactate and perceived exertionduring 1500-m treadmill running. British Journal ofSports Medicine 26, 116–120.
Williams, J.H., Signoille, J.F., Barnes, W.S. & Henrich,T.W. (1988) Caffeine, maximal power output andfatigue. British Journal of Sports Medicine 229, 132–134.

Introduction
The ability to resist fatigue is an important aspectof many types of sporting activity, whether it beshort-term, high-intensity anaerobic type work,or longer, high-intensity endurance activity. Ath-letes who fatigue early do not perform as well asthose who fatigue more slowly, so, in order to maximize performance, it is important thatfatigue is minimized wherever possible.
Fatigue is generally defined as the failure tomaintain an expected or required force or poweroutput (Edwards 1981). The causes of fatigue aremultifaceted (see Green 1990 and Hultman et al.1990 for reviews) and can be roughly dividedinto either physiological or psychological. In thephysiological realm, fatigue can be described aseither central or peripheral (Green et al. 1987). Inthe latter case, there is a myriad of factors which can interact to decrease power output andhinder performance. During high-intensity workof short duration, potential contributors tofatigue could be related to muscle energy pro-duction (for example, a decline in muscle adeno-sine triphosphate, ATP) or they could be relatedto impaired electrochemical events of musclecontraction/relaxation production. Alterna-tively, fatigue could be related to the accumula-tion of metabolites — for example lactate,hydrogen ions and ammonia. During prolongedsubmaximal effort, energy substrate depletion is generally regarded as the major cause offatigue, but a number of other factors such ashyperthermia, dehydration and oxygen trans-
port problems may also contribute in differingamounts.
Athletes and their coaches have always soughtways to improve performance and overcome thefatigue process. In doing so, they have targeted a number of different areas, including trainingmethodology, nutritional practices, medicalinterventions and the use of both legal and illegal drugs — for a review of ergogenic aids, seeChapter 26. With a ‘win at all costs’ mentality,many athletes have ingested substances whichare claimed to have an ergogenic effect by over-coming the fatigue process. Over the last decadeor so, the use of sodium bicarbonate and sodiumcitrate have become popular to offset fatigueduring short-term, high-intensity exercise. It isclaimed that these substances improve perfor-mance by buffering the acids which are pro-duced during exercise.
The aim of this chapter is to discuss the currentknowledge with respect to metabolic acidosisduring both short-term, high-intensity andendurance exercise and the effects of sodiumbicarbonate and sodium citrate ingestion onthese types of performance.
Basics of acid–base balance
Substances that release H+ when they dissociatein solution are called acids, whereas substancesthat accept H+ ions and form hydroxide ions(OH-) are called bases. In the body there must be abalance between the formation of hydrogen ionsand the removal of hydrogen ions for homeosta-
Chapter 29
Bicarbonate and Citrate
LARS R. MCNAUGHTON
393
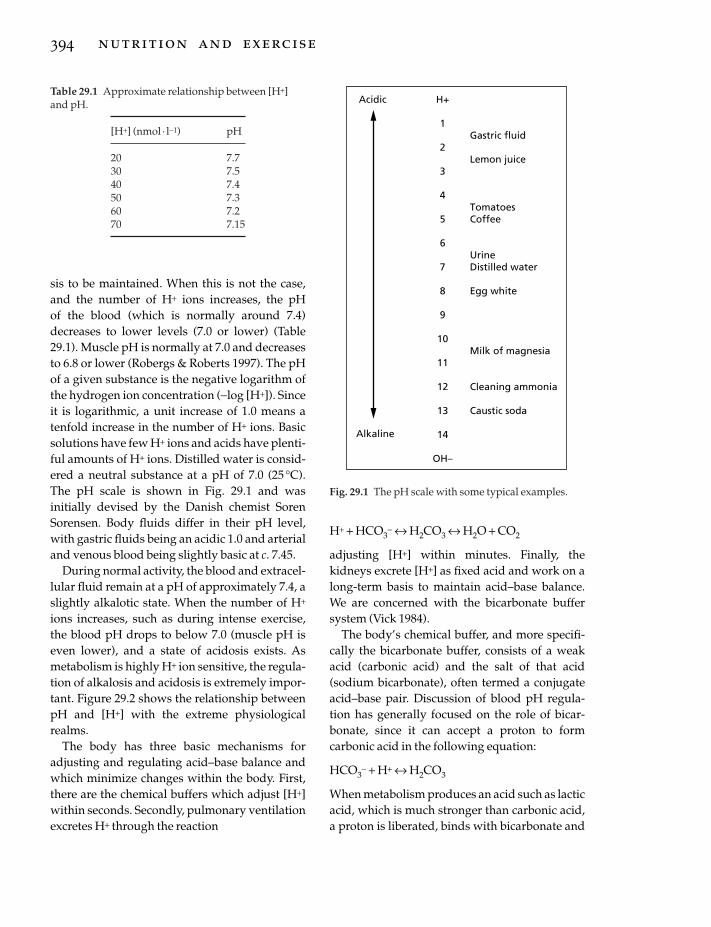
sis to be maintained. When this is not the case,and the number of H+ ions increases, the pH of the blood (which is normally around 7.4)decreases to lower levels (7.0 or lower) (Table29.1). Muscle pH is normally at 7.0 and decreasesto 6.8 or lower (Robergs & Roberts 1997). The pHof a given substance is the negative logarithm ofthe hydrogen ion concentration (-log [H+]). Sinceit is logarithmic, a unit increase of 1.0 means atenfold increase in the number of H+ ions. Basicsolutions have few H+ ions and acids have plenti-ful amounts of H+ ions. Distilled water is consid-ered a neutral substance at a pH of 7.0 (25 °C).The pH scale is shown in Fig. 29.1 and was initially devised by the Danish chemist SorenSorensen. Body fluids differ in their pH level,with gastric fluids being an acidic 1.0 and arterialand venous blood being slightly basic at c. 7.45.
During normal activity, the blood and extracel-lular fluid remain at a pH of approximately 7.4, aslightly alkalotic state. When the number of H+
ions increases, such as during intense exercise,the blood pH drops to below 7.0 (muscle pH iseven lower), and a state of acidosis exists. Asmetabolism is highly H+ ion sensitive, the regula-tion of alkalosis and acidosis is extremely impor-tant. Figure 29.2 shows the relationship betweenpH and [H+] with the extreme physiologicalrealms.
The body has three basic mechanisms foradjusting and regulating acid–base balance andwhich minimize changes within the body. First,there are the chemical buffers which adjust [H+]within seconds. Secondly, pulmonary ventilationexcretes H+ through the reaction
394 nutrition and exercise
H+ + HCO3- ´ H2CO3 ´ H2O + CO2
adjusting [H+] within minutes. Finally, thekidneys excrete [H+] as fixed acid and work on along-term basis to maintain acid–base balance.We are concerned with the bicarbonate buffersystem (Vick 1984).
The body’s chemical buffer, and more specifi-cally the bicarbonate buffer, consists of a weakacid (carbonic acid) and the salt of that acid(sodium bicarbonate), often termed a conjugateacid–base pair. Discussion of blood pH regula-tion has generally focused on the role of bicar-bonate, since it can accept a proton to formcarbonic acid in the following equation:
HCO3- + H+ ´ H2CO3
When metabolism produces an acid such as lacticacid, which is much stronger than carbonic acid,a proton is liberated, binds with bicarbonate and
Table 29.1 Approximate relationship between [H+]and pH.
[H+] (nmol · l-1) pH
20 7.730 7.540 7.450 7.360 7.270 7.15
H+
1
2
3
4
5
6
7
8
9
10
11
12
13
14
OH–
Gastric fluid
Lemon juice
TomatoesCoffee
UrineDistilled water
Egg white
Milk of magnesia
Cleaning ammonia
Caustic soda
Acidic
Alkaline
Fig. 29.1 The pH scale with some typical examples.

forms sodium lactate and carbonic acid. Eventu-ally this forms added carbon dioxide and water.
Effects of sodium bicarbonate andcitrate on performance
High-intensity exercise can be maintained foronly short periods of time (Parry-Billings &MacLaren 1986). Energy for this type of activitycomes predominantly from the anaerobicglycolysis system. In this process, energy is pro-vided in the absence of oxygen as shown in thefollowing equation:
Glycogen + 3 ADP + 3 Pi ´ 3 ATP + 2 lactic acid + 2H2O
The energy for the muscle contractions thencomes from the ATP molecules which are pro-duced. The above equation indicates that thebreakdown of glucose anaerobically results inthe formation of lactic acid, which dissociatesalmost immediately at a normal physiologicalpH to a lactate anion and a proton [H+] (Brooks1985), which in turn would decrease intramuscu-lar pH (Fletcher & Hopkins 1907; Hermansen &Osnes 1972; Osnes & Hermansen 1972; Sahlin et al. 1978) if the H+ was not buffered. High rates
of glycolysis decreases pH even further, whicheventually shuts down the contractile process(Fuchs et al. 1970; Donaldson & Hermansen 1978;Bryant-Chase & Kushmerick 1988). Force gen-eration in isolated muscle (Mainwood &Cechetto 1980) has also been shown to be pH sen-sitive. More specifically, the myofibrillar proteintroponin does not bind as efficiently to calciumwhen pH decreases, and this impairs the forma-tion of the actomyosin complex (Fuchs et al.1970). This reaction is reversible, so that whenpH is reversed, bringing it towards a normallevel, recovery of force generation takes place(Bryant-Chase & Kushmerick 1988). Changes inpH have also been shown to have an effect onenergy production (Hill & Lupton 1923; Hill1955; Krebs 1964). When muscle intracellular pH reaches 6.3, the process of glycolysis is inhib-ited by an impairment of the activity of the gly-colytic enzyme phosphofructokinase (Trivedi &Danforth 1966). In order to reduce or delay these fatigue-producing processes, the ingestionof sodium bicarbonate has been used both ex-perimentally and practically.
Research into acid–base balance during exer-cise commenced many decades ago. Dennig et al.(1931) used acid salts to make runners more
bicarbonate and citrate 395
Normal
AlkalosisAcidosis
7.0 7.1 7.2 7.3 7.4 7.5 7.6 7.7
pH
[H+
](m
ol. l
–1)
1 x 10⁻⁷
6 x 10⁻⁸
8 x 10⁻⁸
4 x 10⁻⁸
2 x 10⁻⁸
7.8Fig. 29.2 The relationshipbetween [H+] and pH within theextreme physiological range.

acidic and established that this regimen madethem less able to use oxygen efficiently. In turn,this led the researchers to infer that induced alka-losis could have an opposite effect. Dill et al.(1932) demonstrated that runners could have a1% decrease in running times when alkalotic.While it has been shown previously the musclecell membranes are impervious to HCO3
- (Katzet al. 1984; Costill et al. 1988), an increase in extracellular HCO3
- increases the pH gradientbetween the intracellular and extracellular envi-ronment. The effect of this increased pH gradientis to facilitate the efflux of intracellular lactateand H+, thus reducing the fall in intracellular pH(Katz et al. 1984; Costill et al. 1988). Both lactateand H+ have been shown to follow a favourablepH gradient (Roth & Brooks 1990). The timecourse for the production of lactate has beenshown to vary from 5s (Pernow & Wahren 1968;Saltin et al. 1971; Jacobs et al. 1983) to severalminutes (Wilkes et al. 1983). In an early, well-conducted study, Osnes and Hermansen (1972)measured postexercise blood lactate levels insubjects who ran distances from 100 to 5000 m.Lactate concentrations increased with increasingdistance up to 1500m, after which there was nofurther increase: pH and blood bicarbonate con-centrations were lowest after the 1500-m run.This would seem to suggest that acid–basebalance shifts occur most dramatically after exer-cise lasting 4–5min. It is reasonable to assume,therefore, that if sodium bicarbonate were to beeffective as an ergogenic aid, it would be so overa similar time span, since these time periods aredependent upon high rates of energy productionfrom anaerobic glycolysis.
There has been some suggestion that the mech-anisms whereby sodium bicabonate loading iseffective lie not with the bicarbonate ion but arepossibly due to the sodium load (Saltin 1964;Kozak-Collins et al. 1994). Sodium could changeintravascular volume, which in turn could alterperformance. Kozak-Collins et al. (1994) testedthis hypothesis with the ingestion of eitherNaHCO3 or NaCl, which both provided equimo-lar amounts of sodium given prior to repeated
396 nutrition and exercise
bouts of 1-min exercise. Performance was notenhanced in either condition but haematocritmeasures suggested that intravascular fluidstatus remained similar. pH was significantlyraised in the bicarbonate trial when comparedwith that in the NaCl trial. Further studies arerequired to determine whether intravas-cular volume is responsible for the increased performance.
A greater understanding of acid–base balanceduring rest and exercise can be gained by readingJackson (1990), Jones (1990), Lindinger andHeigenhauser (1990) and Heigenhauser et al.(1990).
The work of Jervell (1928), Dennig et al. (1931)and Dill et al. (1932) was, by and large, forgottenby the coaching and scientific communities. Themodern era of the study of acid–base balanceduring exercise performance essentially began inthe 1970s, with publication of the work of Jones etal. (1977). These workers studied five men whoacted as their own controls, through treatmentsconsisting of either a placebo (calcium carbon-ate), 0.3g ammonium chloride (acidic) per kilo-gram of body mass, or sodium bicarbonate in the same dosage. All doses were taken after anovernight fast and over a 3-h time period. Theexercise consisted of cycle ergometry utilizingthree different protocols: 20 min at both 33% and66% of previously determined maximum oxygenuptake (V
.o2max.), followed by exercise to exhaus-
tion at 95% V.o2max., without rest in between. Time
to exhaustion at the 95% V.o2max. power output
level was approximately 4min for the controlcondition. In the bicarbonate treatment, exhaus-tion time was approximately twice that of thecontrol, whilst in the acidic condition, it wasabout half the control time. Blood lactate concen-tration in the bicarbonate treatment was signifi-cantly greater (P < 0.01) than the control at boththe 66% power output level and at exhaustion. Inthe ammonium chloride condition, blood lactatelevels were significantly lower in these two workperiods. Blood pH was consistently higher in the bicarbonate treatment group and lower in the ammonium chloride treatment than in the

control during the dosing phase and throughoutthe exercise. At the start of the final exercisephase, pH in the bicarbonate treatment groupwas about 7.41, while the control was 7.34 andthe acidic treatment was 7.19. At exhaustion, thepH was 7.34, 7.26 and 7.14, respectively.
A number of studies in the early 1980s sug-gested that ingestion of sodium bicarbonatecould be effective in performance enhancement.Wilkes et al. (1983), conducting a field type study,examined six well-trained competitive 800-mrunners and compared the effects of sodiumbicarbonate, placebo (calcium carbonate) andcontrol treatments. The substances were bothgiven over a 2-h period in a dose of 300 mg·kg-1
body mass and water was taken ad libitum(average intake was 504ml). Each subject com-pleted their normal 30-min warm-up prior to therace. Each runner completed all three protocols,thus acting as his own control. In the bicarbonatecondition, runners were 2.9 s faster, on average,than in the control condition (P < 0.05), while thecontrol and placebo results were not significantlydifferent. Control, placebo and bicarbonate meantimes (min : s) were, respectively, 2 : 05.8, 2 : 05.1and 2 :02.9. While not particularly fast, the difference between control and bicarbonate (2.9 s) might mean the difference between firstand last place within a race.
In work from our own laboratory, Goldfinch etal. (1988) saw improvements in 400-m race per-formance due to ingestion of sodium bicarbonatein six competitive, trained runners. The experi-mental design was similar to that of Wilkes et al.(1983), but with a major difference: the bicarbon-ate dose was 400mg ·kg-1 body mass. This wasdone deliberately in order to eliminate ambigui-ties around dose size. The control, the calciumcarbonate placebo or the experimental treatmentwere given over a 1-h period in a low-energydrink to try to disguise the taste. Each of the sub-jects ran as part of a two-man competitive race tosimulate, as closely as possible, real competition.The mean time of the bicarbonate ingestiongroup was 56.94s, and was significantly better by1.25s (P < 0.005) than the control and placebo,
which were not different from each other. Thetime difference was equivalent to approximatelya 10-m distance at the finish, again enough towarrant a first or last place finish.
A number of studies have also shownNaHCO3 loading to be ineffective in delayingfatigue or improving performance. Katz et al.(1984) exercised eight trained men at 125% oftheir predetermined V
.o2max. in either a bicarbon-
ate or control condition. Bicarbonate was givenin a dose of 200 mg· kg-1 body mass, while theplacebo consisted of NaCl. No significant differ-ence between the two conditions was noticed. Inthe bicarbonate condition, subjects cycled for100.6s, while with the placebo, the time toexhaustion was 98.6 s. These results are of inter-est, since even though pH and base excess (whichis the measure of extra base above normal, princi-pally bicarbonate ions) after correction forhaemoglobin content (Guyton & Hall 1981) weresignificantly elevated following ingestion ofsodium bicarbonate, no improvement in perfor-mance was seen. In other words, the bicarbonateincreased the amount of buffer available to thebody, but this was not used. The pH values seenafter exercise in this experiment were lower inthe control condition, possibly suggesting thesubjects could have worked harder in the experi-mental condition, thus utilizing the extra bufferavailable. In another study from the same labora-tory, Horswill and colleagues (1988) found nodifference in performance when subjects per-formed four bouts of intense, 2-min sprint exer-cise. Again, the levels of blood bicarbonate weresignificantly elevated in two of the conditionstested prior to the performance tests, as was pH, but again this increased buffering capacitydid not result in improved performance by thesubjects.
A number of practical problems have arisen inthe study of sodium bicarbonate loading due tothe nature of the experimental paradigms used.That is, there is no single method employed byresearchers in order to detect any benefit. Whilethis is a natural process in research, from a practi-cal sporting point of view it is a hindrance, as ath-
bicarbonate and citrate 397

letes are unable to make concrete choices about,for example, how much sodium bicarbonate/citrate should be used or over what time periodsit is effective.
Several authors (Wijnen et al. 1984; McKenzieet al. 1986; Parry-Billings & MacLaren 1986) haveused a research paradigm involving multipleexercise bouts interspersed with rest/recovery.The exercise periods have varied, but have beenbetween 30 and 60s with rest/recovery periodsfrom 60s (Wijnen et al. 1984; McKenzie et al. 1986)to 6min (Parry-Billings & MacLaren 1986). Theresults of this work have generally been incon-clusive. Wijnen et al. (1984) infused bicarbonateintravenously in one of two doses (180 or 360mg·kg-1 body mass) while subjects rode a cycleergometer for 60 s with a rest period of 60 s, andrepeated this a further three times. Both dosagesof NaHCO3 significantly raised pH (P < 0.01)above the control condition in a manner whichwas dependent upon the dosage. However, ashas been shown in some studies previously, theincreased pH did not lead to an increase in per-formance in all subjects. McKenzie et al. (1986)used a protocol similar to that of Wijnen et al.(1984), but used dosages of either 150 or 300mg ·kg-1 body mass. Blood pH and blood bicarbonatelevels increased in both experimental conditionswhen compared with the control treatment.When time to fatigue and the amount of workdone were compared, the two experimental con-ditions both increased these parameters but withno difference between the two dose levels. Inanother interval type paradigm, Parry-Billingsand MacLaren (1986) again found that a dose of300mg ·kg-1 body mass had no effect on 30 s ofexercise when interspersed with 6-min recoveryperiods. Again, this was despite an increase inblood bicarbonate levels of approximately 8mmol · l-1 above control levels.
Bicarbonate dose and exercise
Various studies have suggested, either directly orindirectly, that there is a minimum level ofsodium bicarbonate ingestion needed to improveperformance. Katz et al. (1984) found no differ-
398 nutrition and exercise
ences in performance time on a cycle ergometertest at 125% V
.o2max. after subjects ingested 200mg
NaHCO3 · kg-1 body mass despite significant (P <0.001) rises in pH prior to exercise. Blood bicarbonate and base excess also significantlyincreased and the hydrogen ion to lactate ratio(nmol/mmol) was significantly lower in theexperimental trial than in the control trial, all ofwhich suggest that buffering was available butfor some reason was not effective. Horswill et al.(1988) also found no improvement in exerciseperformance with dosages between 100 and 200mg ·kg-1. In this interesting experiment, theauthors (Horswill et al. 1988) had subjects under-take four 2-min sprint tests after they had con-sumed either a placebo or one of three doses of sodium bicarbonate (100, 150 or 200 mg· kg-1).Pretest plasma bicarbonate levels were not dif-ferent, nor were they different between theplacebo and 100mg ·kg-1 groups 1h after the test, but they were significantly increased in the 150 and 200 mg·kg-1 conditions. Eventhough plasma bicarbonate levels increased withthe latter dosages, subjects were still unable touse the increased buffer capacity given by theNaHCO3.
In a study from our laboratory (McNaughton1992a), we attempted to extend the work of Horswill et al. (1988) to determine which dosagewas most efficacious. We also decided to use anexercise bout of 60 s, since previous experiencehad led us to believe this would elicit high bloodlactate levels and low levels of blood pH. Each ofthe subjects undertook a total of seven tests: onecontrol, one placebo and one of five doses ofNaHCO3 (100, 200, 300, 400 and 500 mg· kg-1)(Fig. 29.3). These were undertaken in a randomfashion, after the control test, which was alwaysfirst. The ingestion of sodium bicarbonate as adose of 100mg ·kg-1 did not increase blood bicar-bonate levels, in agreement with the work ofHorswill et al. (1988). Larger doses had the effectof significantly increasing the levels of bloodbicarbonate.
Unlike Horswill et al. (1988), this author founda significant increase in performance with a doseof 200mg ·kg-1 and this improvement increased
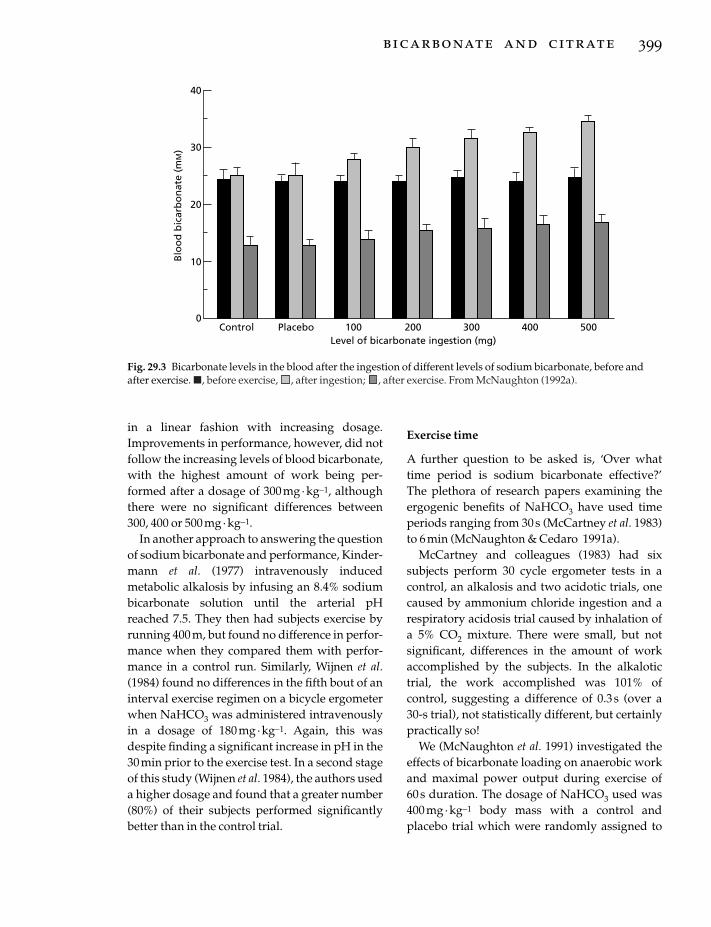
in a linear fashion with increasing dosage.Improvements in performance, however, did notfollow the increasing levels of blood bicarbonate,with the highest amount of work being per-formed after a dosage of 300mg· kg-1, althoughthere were no significant differences between300, 400 or 500mg· kg-1.
In another approach to answering the questionof sodium bicarbonate and performance, Kinder-mann et al. (1977) intravenously induced metabolic alkalosis by infusing an 8.4% sodiumbicarbonate solution until the arterial pHreached 7.5. They then had subjects exercise byrunning 400 m, but found no difference in perfor-mance when they compared them with perfor-mance in a control run. Similarly, Wijnen et al.(1984) found no differences in the fifth bout of aninterval exercise regimen on a bicycle ergometerwhen NaHCO3 was administered intravenouslyin a dosage of 180 mg ·kg-1. Again, this wasdespite finding a significant increase in pH in the30min prior to the exercise test. In a second stageof this study (Wijnen et al. 1984), the authors useda higher dosage and found that a greater number(80%) of their subjects performed significantlybetter than in the control trial.
Exercise time
A further question to be asked is, ‘Over whattime period is sodium bicarbonate effective?’ The plethora of research papers examining theergogenic benefits of NaHCO3 have used timeperiods ranging from 30s (McCartney et al. 1983)to 6min (McNaughton & Cedaro 1991a).
McCartney and colleagues (1983) had six subjects perform 30 cycle ergometer tests in acontrol, an alkalosis and two acidotic trials, onecaused by ammonium chloride ingestion and arespiratory acidosis trial caused by inhalation ofa 5% CO2 mixture. There were small, but not significant, differences in the amount of workaccomplished by the subjects. In the alkalotictrial, the work accomplished was 101% ofcontrol, suggesting a difference of 0.3s (over a 30-s trial), not statistically different, but certainlypractically so!
We (McNaughton et al. 1991) investigated theeffects of bicarbonate loading on anaerobic workand maximal power output during exercise of 60s duration. The dosage of NaHCO3 used was400mg ·kg-1 body mass with a control andplacebo trial which were randomly assigned to
bicarbonate and citrate 399
40
Control Placebo 100 200 300 400 500Level of bicarbonate ingestion (mg)
Blo
od
bic
arb
on
ate
(mM
) 30
20
10
0
Fig. 29.3 Bicarbonate levels in the blood after the ingestion of different levels of sodium bicarbonate, before andafter exercise. �, before exercise, , after ingestion; , after exercise. From McNaughton (1992a).

each of the eight subjects. The work outputincreased significantly (P < 0.01) in the experi-mental condition when compared with thecontrol or placebo condition (9940, 9263 and 9288J, respectively). In the NaHCO3 trial, pretestblood bicarbonate levels increased significantlyabove either the resting or control/placebopretest levels. An interesting finding in this studywas that the peak power, as measured in watts,achieved by the subjects, also increased signifi-cantly (P < 0.05) in the experimental conditionwhen compared with that in the control orplacebo conditions.
In order to examine more closely the timeperiods over which sodium bicarbonate can beused as an ergogenic aid, McNaughton (1992b)studied four different time periods (10, 30, 120and 240 s) with a dosage of 300mg ·kg-1 bodymass. Subjects ingested sodium bicarbonate or aplacebo and undertook a control test. There wereeight male subjects in each time group, and eachsubject undertook three test sessions. As is usualwith a dosage of this size (300mg ·kg-1), theblood bicarbonate levels were increased in theexperimental trial when compared with those ineither the control or placebo trials. This was alsotrue for the base excess and pH measurements.However, the work and power data collectedduring the cycle ergometer tests over the fourtime periods were only significantly different inthe latter two time periods (120 and 240 s), eventhough the blood lactate levels in both the 10-and 30-s trial were significantly higher after exer-cise than the pre-exercise levels.
This work is in agreement with several otherstudies suggesting that NaHCO3 loading is not effective for short-term anaerobic work(McCartney et al. 1983; Katz et al. 1984) but that itis effective for longer-term work (Wilkes et al.1983; McKenzie et al. 1986; Goldfinch et al. 1988).McNaughton and Cedaro (1991) found the samedosage of sodium bicarbonate to be effective inrowing performance of 6 min duration using eliterowers.
400 nutrition and exercise
Sodium citrate
A number of authors (Simmons & Hardt 1973;Parry-Billings & MacLaren 1986; McNaughton1990; McNaughton & Cedaro 1991b) have usedsodium citrate as an alkalizing agent rather thansodium bicarbonate. The results of work fromour laboratory (McNaughton 1990) wouldsuggest that sodium citrate is an effectiveergogenic substance when given in dosagesbetween 300 and 500 mg ·kg-1 body mass, withanaerobic capacity increasing in a linear fashionin relation to these doses (McNaughton 1990). Inrelation to duration of exercise, the high dosageof sodium citrate appears to be effective in timeperiods of between 2 and 4min (McNaughton &Cedaro 1991b). Sodium citrate does not appear tobe an effective ergogen when used with short-term (30s) maximal exercise (Parry-Billings &MacLaren 1986; McNaughton & Cedaro 1991b).A recent article (Potteiger et al. 1996) has also sug-gested that large doses (500 mg· kg-1 body mass)of sodium citrate may improve 30-km cyclingperformance. These competitive cyclists com-pleted the placebo 30-km trial in 3562.3 ± 108.5s,while in the citrate trial they completed the samedistance in 3459.6 ± 97.4s. More work needs to beundertaken to determine if this regimen can beapplied to other endurance activities.
Some subjects have reported short-term gas-trointestinal distress as a side-effect of sodiumbicarbonate/citrate use (Wilkes et al. 1983;Goldfinch et al. 1988; McNaughton & Cedaro1991b). Other possible side-effects have beennoted including gastric rupture (Downs & Stonebridge 1989; Reynolds 1989), musclespasms and cardiac arrhythmias (Reynolds 1989;Heigenhauser & Jones 1991).
Although detection of sodium bicarbonate andcitrate is difficult, several authors (Wilkes et al.1983; Gledhill 1984; McKenzie 1988) have sug-gested it is possible to detect, and thereforecontrol, using existing procedures (urine sample,post-exercise). The work of McKenzie (1988) ismost detailed, with subjects providing a post-exercise urine sample. Of the 65 subjects, no sub-jects who had ingested NaHCO3 had a urinary

pH of less than 6.8, whereas in the placebo group,none was greater than a pH of 7.0. McKenzie(1988) suggested using a pH of 7.0 as a baseline,which would have captured 92% of the subjectsusing NaHCO3 in his study. Even though thiswas the case in the McKenzie (1988) study, otherfactors, such as vomiting, a high-carbohydratediet (results in metabolic alkalosis) (Greenhaff etal. 1987a, 1987b, 1988a, 1988b), a high-proteindiet (results in metabolic acidosis; Maughan &Greenhaff 1991), a vegetarian diet and a lowglomerular filtration rate (Kiil 1990), can changethe alkalinity of the urine which normally rangesfrom 4.5 to 8.2, thus giving a false positive result(for a review, see Charney & Feldman 1989). Itwould be virtually impossible to detect confi-dently those who had used a buffering agent toimprove performance.
Conclusion
Several reviews on the use of substances toinduce metabolic alkalosis in order to improveshort-term maximal performance have beenwritten (Gledhill 1984; Heigenhauser & Jones1991; Linderman & Fahey 1991; Maughan &Greenhaff 1991; Williams 1992; McNaughton etal. 1993; Linderman & Gosselink 1994). Althoughno firm conclusions can be drawn from theplethora of research conducted, there doesappear to be some general agreement on anumber of factors. Firstly, both sodium bicarbon-ate and sodium citrate are effective bufferingagents. Second, there is a minimum level ofNaHCO3 or sodium citrate ingestion belowwhich no improvement in performance takesplace and this is approximately 200 mg·kg-1
body mass; the optimum dosage would appearto be only slightly higher, at 300mg· kg-1 bodymass. Dosages higher than 300mg· kg body massdo not appear to have any greater benefit to per-formance. Higher dosages of sodium citrate maybe more effective than sodium bicarbonate, butthis has not yet been confirmed. Thirdly, thesebuffering agents have no effect on performanceof less than 30 s but do enhance performancebetween 1 and 10 min. Finally, these substances
may be effective in enhancing high-intensityendurance performance but more work needs tobe conducted.
Practical implications
Many substances used by athletes to improveperformance have been banned by such bodiesas the International Olympic Committee (IOC).Presently, no ban exists for the use of sodiumbicarbonate or sodium citrate and they are hardto detect. However, their use may be considereda violation of the IOC Doping Rule which states,at least in part, that athletes shall not use anyphysiological substance taken in an attempt toartificially enhance performance. An athlete mayattempt to legitimize the use of these substances,however, by likening it to the use of carbohy-drate loading. If athletes decide to use thesebuffering agents, then they should do so forshort-term, high-intensity exercise only andshould use dosages of approximately 300mg ·kg-1 body mass dose. The substances should betaken in or with fluid, preferably water, and inlarge quantities (0.5 l or greater). Subjects shouldbe made familiar with possible side-effects priorto usage.
References
Brooks, G.A. (1985) Anaerobic threshold: review of theconcept and directions for future research. Medicineand Science in Sports and Exercise 17, 22–31.
Bryant-Chase, P. & Kushmerick, M.J. (1988) Effects ofpH on contraction of rabbit fast and slow skeletalmuscle fibres. Biophysics Journal 53, 935–946.
Charney, A.N. & Feldman, F. (1989) Internal exchangesof hydrogen ions: gastrointestinal tract. In The Regu-lation of Acid-Base Balance (ed. D.W. Seldin & G.Giebisch), pp. 89–105. Raven Press, New York.
Costill, D.L., Flynn, M.G. & Kirwan, J.P. (1988) Effects ofrepeated days of intensified training on muscleglycogen and swimming performance. Medicine andScience in Sports and Exercise 20, 249–254.
Dennig, H., Talbot, J.H., Edwards, H.T. & Dill, B. (1931)Effects of acidosis and alkalosis upon the capacity forwork. Journal of Clinical Investigation 9, 601–613.
Dill, D.B., Edwards, H.T. & Talbot, J.H. (1932) Alkalosisand the capacity for work. Journal of Biological Chemistry 97, 58–59.
bicarbonate and citrate 401

Donaldson, S.K.B. & Hermansen, L. (1978) Differentialdirect effects of H+ and Ca2+-activated force ofskinned fibres from the soleus, cardiac, adductormagnus muscle of rabbits. Pflügers Archive 376,55–65.
Downs, N. & Stonebridge, P. (1989) Gastric rupture dueto excessive sodium bicarbonate ingestion. ScottishMedical Journal 34, 534–535.
Edwards, R.H.T. (1981) Human muscle function andfatigue. In Human Muscle Fatigue: Physiological Mech-anisms (ed. R. Porter & J. Whelan), Ciba FoundationSymposium No. 82, pp. 1–18. Pitman Medical,London.
Fletcher, W.W. & Hopkins, F.G. (1907) Lactic acid inmammalian muscle. Journal of Physiology 35, 247–303.
Fuchs, F., Reddy, Y. & Briggs, F.N. (1970) The interac-tion of cations with the calcium binding site of tro-ponin. Biochimica Biophysica Acta 221, 407–409.
Gledhill, N. (1984) Bicarbonate ingestion and anaerobicperformance. Sports Medicine 1, 177–180.
Goldfinch, J., McNaughton, L.R. & Davies, P. (1988)Bicarbonate ingestion and its effects upon 400-mracing time. European Journal of Applied Physiology 57,45–48.
Green, H.J. (1990) Manifestations and sites of neuro-muscular fatigue. In Biochemistry of Exercise. Vol. 7(ed. A.W. Taylor, P.D. Gollnick, H.J. Green et al.), pp.13–35. Human Kinetics, Champaign, IL.
Green, H.J., Jones, S. & Mills, D. (1987) Interactiveeffects of post-tetanic potentiation on low frequencyfatigue in human muscle. Federation Proceedings 46,640–644.
Greenhaff, P.L., Gleeson, M. & Maughan, R.J. (1987a)The effects of dietary manipulation on blood acidbase status and performance of high intensity exercise. European Journal of Applied Physiology 56,331–337.
Greenhaff, P.L., Gleeson, M., Whiting, P.H. & Maughan,R.J. (1987b) Dietary composition and acid-basestatus: limiting factors in performance of maximalexercise in man? European Journal of Applied Physiology 56, 444–450.
Greenhaff, P.L., Gleeson, M. & Maughan, R.J. (1988a)Diet induced metabolic acidosis and the perfor-mance of high intensity exercise in man. EuropeanJournal of Applied Physiology 57, 583–590.
Greenhaff, P.L., Gleeson, M. & Maughan, R.J. (1988b)The effect of a glycogen-loading regimen on acidbase status and blood lactate concentrations beforeand after a fixed period of high intensity exercise in man. European Journal of Applied Physiology 57,254–259.
Guyton, A.C. & Hall, J.E. (1996) Textbook of MedicalPhysiology, 9th edn. W.B. Saunders, Philadelphia, PA.
Heigenhauser, G.J.F. & Jones, N.L. (1991) Bicarbonate
402 nutrition and exercise
loading. In Perspectives in Exercise Science and SportsMedicine. Vol. 4. Ergogenics Enhancement of Perfor-mance in Exercise and Sport (ed. D.R. Lamb & M.H.Williams), pp. 183–212. Wm C. Brown, Dubuque, IA.
Heigenhauser, G.J.F., Jones, N.L., Kowalchuk, J.M. &Lindinger, M.I. (1990) The role of the physiochemicalsystems in plasma in acid base control in exercise. InBiochemistry of Exercise. Vol. 7 (ed. A.W. Taylor, P.D.Gollnick, H.J. Green et al.), pp. 359–374. HumanKinetics, Champaign, IL.
Hermansen, L. & Osnes, J. (1972) Blood and muscle pH after maximal exercise in man. Journal of AppliedPhysiology 32, 304–308.
Hill, A.V. (1955) The influence of the external mediumon the internal pH of the muscle. Proceedings of theRoyal Society of London 144, 1–22.
Hill, A.V. & Lupton, H. (1923) Muscular exercise, lacticacid and the supply and utilization of oxygen. Quarterly Journal of Medicine 16, 135–171.
Horswill, C.A., Costill, D.L., Fink, W.J. et al. (1988)Influence of sodium bicarbonate on sprint perfor-mance, relationship to dosage. Medicine and Science inSports and Exercise 20, 566–569.
Hultman, E., Bergstrom, M., Spriet, L.L. & Soderlund,K. (1990) Energy metabolism and fatigue. In Biochem-istry of Exercise. Vol. 7 (ed. A.W. Taylor, P.D. Gollnick,H.J. Green et al.), pp. 73–92. Human Kinetics, Champaign, IL.
Jackson, D.C. (1990) Ion regulation in exercise: lessonsfrom comparative physiology. In Biochemistry of Exer-cise. Vol. 7. (ed. A.W. Taylor, P.D. Gollnick, H.J. Greenet al.), pp. 375–386. Human Kinetics, Champaign, IL.
Jacobs, I., Tesch, P.A., Bar-Or, O., Karlsson, J. & Dotan,R. (1983) Lactate in human skeletal muscle after 10and 30s of supramaximal exercise. Journal of AppliedPhysiology 55, 365–367.
Jervell, O. (1928) Investigation of the concentration of lactic acid in blood and urine. Acta Medica Scandinavica 24 (Suppl.), 1–135.
Jones, N.L. (1990) [H+] control in exercise: concepts andcontroversies. In Biochemistry of Exercise. Vol. 7 (ed.A.W. Taylor, P.D. Gollnick, H.J. Green et al.), pp.333–339. Human Kinetics, Champaign, IL.
Jones, N., Sutton, J.R., Taylor, R. & Toews, C.J. (1977)Effect of pH on cardiorespiratory and metabolicresponses to exercise. Journal of Applied Physiology 43,959–964.
Katz, A., Costill, D.L., King, D.S., Hargreaves, M. &Fink, W.J. (1984) Maximal exercise tolerance afterinduced alkalosis. International Journal of Sports Medi-cine 5, 107–110.
Kiil, F. (1990) The paradox of renal bicarbonate reab-sorption. News in Physiology and Science 5, 13–17.

Kindermann, W., Keul, J. & Huber, G. (1977) Physicalexercise after induced alkalosis (bicarbonate and tris-buffer). European Journal of Applied Physiology 37,197–204.
Kozak-Collins, K., Burke, E. & Schoene, R.B. (1994)Sodium bicarbonate ingestion does not improvecycling performance in women cyclists. Medicine andScience in Sports and Exercise 26, 1510–1515.
Krebs, H. (1964) Gluconeogenesis. Proceedings of theRoyal Society of London (Series B) 159, 545–564.
Linderman, J. & Fahey, T.D. (1991) Sodium bicabonateingestion and exercise performance: an update.Sports Medicine 11, 71–77.
Linderman, J.K. & Gosselink, K.L. (1994) The effects ofsodium bicabonate ingestion on exercise perfor-mance. Sports Medicine 18, 75–80.
Lindinger, M.I. & Heigenhauser, G.J.F. (1990) Acid basesystems in skeletal muscle and their response toexercise. In Biochemistry of Exercise. Vol. 7 (ed. A.W.Taylor, P.D. Gollnick, H.J. Green et al.), pp. 341–357.Human Kinetics, Champaign, IL.
McCartney, N., Heigenhauser, G.F.C. & Jones, N.L.(1983) Effects of pH on maximal power output andfatigue during short term dynamic exercise. Journalof Applied Physiology 55, 225–229.
McKenzie, D.C. (1988) Changes in urinary pH follow-ing bicarbonate loading. Canadian Journal of SportsScience 13, 254–256.
McKenzie, D.C., Coutts, K.D., Stirling, D.R., Hoeben,H.H. & Kuzara, G. (1986) Maximal work productionfollowing two levels of artificially induced metabolicalkalosis. Journal of Sports Science 4, 35–38.
McNaughton, L.R. (1990) Sodium citrate and anaerobicperformance: implications of dosage. EuropeanJournal of Applied Physiology 61, 392–397.
McNaughton, L.R. (1992a) Bicarbonate ingestion:effects of dosage on 60s cycle ergometry. Journal ofSports Science 10, 415–423.
McNaughton, L.R. (1992b) Sodium bicarbonate inges-tion and its effects on anaerobic exercise of differingdurations. Journal of Sports Science 10, 425–435.
McNaughton, L.R. & Cedaro, R. (1991a) The effect ofsodium bicarbonate on rowing ergometer perfor-mance in elite rowers. Australian Journal of Science andMedicine in Sport 23, 66–69.
McNaughton, L.R. & Cedaro, R. (1991b) Sodium citrateingestion and its effects on maximal anaerobic exer-cise of different durations. European Journal of AppliedPhysiology 64, 36–41.
McNaughton, L.R., Curtin, R., Goodman, G., Perry, D.,Turner, B. & Showell, C. (1991) Anaerobic work andpower output during cycle ergometer exercise:Effects of bicarbonate loading. Journal of SportsScience 9, 151–160.
Mainwood, G.W. & Cechetto, D. (1980) The effct of
bicarbonate concentration on fatigue and recovery inisolated rat diaphragm. Canadian Journal of Physiologyand Pharmacology 58, 624–632.
Maughan, R.J. & Greenhaff, P.L. (1991) High intesnityexercise performance and acid-base balance: theinfluence of diet and induced metabolic alkalosis. InAdvances in Nutrition and Top Sport (ed. F. Brouns), pp.147–165. Karger, Basel.
Osnes, J.B. & Hermansen, L. (1972) Acid-base balanceafter maximal exercise of short duration. Journal ofApplied Physiology 32, 59–63.
Parry-Billings, M. & MacLaren, D.P.M. (1986) The effectof sodium bicarbonate and sodium citrate ingestionon anaerobic power during intermittent exercise.European Journal of Applied Physiology 55, 224–229.
Pernow, B. & Wahren, J. (1968) Lactate and pyruvateformation and oxygen utilization in the humanforearm muscle during work of high intensity andvarying duration. Acta Physiologica Scandinavica 56,267–285.
Potteiger, J.A., Nickel, G.L., Webster, M.J., Haub, M.D.& Palmer, R.J. (1996) Sodium citrate ingestionenhances 30 km cycling performance. InternationalJournal of Sports Medicine 17, 7–11.
Reynolds, J. (1989) The Extra Pharmacopoeia. Pharma-ceutical Press, London.
Robergs, R.A. & Roberts, S.O. (1997) Exercise PhysiologyExercise, Performance and Clinical Applications. Mosby,St Louis, MO.
Roth, D.A. & Brooks, G.A. (1990) Lactate and pyruvatetransport is dominated by a pH gradient-sensitivecarrier in rat skeletal muscle sarcolemmal vesicles.Archives in Biochemistry and Biophysics 279, 386–394.
Sahlin, K., Alvestrand, A., Brandt, R. & Hultman, E.(1978) Acid-base balance in blood during exhaustivebicycle exercise and the following recovery period,Acta Physiologica Scandinavica 104, 370–372.
Saltin, B., Gollnick, P.D., Eriksson, B.O. & Piehl, K.(1971) Metabolic and circulatory adjustments atonset of maximal work. In Onset of Exercise (ed. A.Gilbert & P. Guile), pp. 63–76. University of ToulousePress, Toulouse.
Saltin, G. (1964) Aerobic and anaerobic work capacityafter dehydration. Journal of Applied Physiology 19,114–118.
Simmons, R.W.F. & Hardt, A.B. (1973) The effect ofalkali ingestion on the performance of trained swim-mers. Journal of Sports Medicine 13, 159–163.
Trivedi, B. & Danforth, W.H. (1966) Effect of pH on thekinetics of frog muscle phosphofructokinase. Journalof Biological Chemistry 241, 4110–4114.
Vick, R.L. (1984) Contemporary Medical Physiology.Addison Wesley, Menlo Park, CA.
Wijnen, S., Verstappen, F. & Kuipers, H. (1984) The
bicarbonate and citrate 403

influence of intravenous NaHCO3- administration
on interval exercise: acid-base balance andendurance. International Journal of Sports Medicine 5,130–132.
Wilkes, D., Gledhill, N. & Smyth, R. (1983) Effect of
404 nutrition and exercise
acute induced metabolic alkalosis on 800-m racingtime. Medicine and Science in Sports and Exercise 15,277–280.
Williams, M.H. (1992) Bicarbonate loading. GatoradeSports Science Exchange 4(36), 1–6.

Introduction
Ancient civilizations dating back to thousands ofyears bc recorded the intake of drinks containingalcohol (or, more correctly, ethanol) as part ofsocial rituals. One practice which has persisted,even throughout the last decades, is the intake ofalcohol before or during sport in the belief that it might improve performance (for review, see Williams 1991). Today, the major strong linkbetween sport and alcohol is through spon-sorship and advertising, with many sportingorganizations, leagues, teams and events beingfinanced by beer and liquor brewing companies.While a small number of athletes may stillconsume alcohol specifically to attempt toimprove their sports performance, the overwhelming majority of athletes who drinkalcohol, do so for social reasons. However, this isoften in the context of rituals that are part of theculture of their sport. The aim of this chapter is tooverview the effect of alcohol on sports per-formance, particularly related to the typical pat-terns of consumption by athletes, and to providesome guidelines for sensible use of alcohol bysports people.
Alcohol use by athletes
Typically, alcohol intake provides less than 5% ofthe total energy intake of adults, although recentUK data suggest that alcohol accounted onaverage for 6.9% of the total energy intake of menaged between 18 and 64 years (Gregory et al.
1990); the corresponding value for women was2.8%. Since the contribution to total energyintake is regarded as minor, it is often excludedfrom the results of dietary surveys of athletes.Furthermore, while the general limitations ofdietary survey methodology are acknowledged,it is likely that self-reported data on alcoholintake are particularly flawed. For example,people are unlikely to report accurately and reli-ably about their consumption of a nutrient orfood that is regarded so emotively; there is poten-tial for both significant under-reporting andover-reporting. These factors help to explain thelack of reliable data on the alcohol intakes anddrinking practices of athletes. It is also importantto note that, because many people abstain com-pletely from alcohol, the data are skewed, andmean values may be misleading: in the survey ofGregory et al. (1990) quoted above, for example,men and women who were alcohol drinkersobtained an average of 8.7% and 4.3%, respec-tively, of total energy from alcohol.
There are clearly gender-related differences inconsumption patterns, but age, socio-economicbackground, and geographical location alsoinfluence drinking habits. It is not clear whetherthe consumption patterns of athletes are greatlydifferent from those of the non-athletic popula-tion. In general, though, dietary surveys of athletes which include alcohol suggest that itcontributes 0–5% of total energy intake in theeveryday diet. However, there is evidence thatthis provides a misleading view of the alcoholintakes of athletes. For example, in a dietary
Chapter 30
Alcohol in Sport
LOUISE M. BURKE AND RONALD J. MAUGHAN
405
survey of 45 professional football players fromthe leading team in the national Australian RulesFootball League, mean daily alcohol intake wasestimated to be 20g, accounting for 3.5% of totalenergy intake (Burke & Read 1988). However,these players rarely drank alcohol during thetraining week, in accordance with the club policy,and instead confined their intake to weekends,particularly after the weekly football match.Closer examination of the football data revealedthat the mean intake of alcohol immediately afterthe match was 120g (range, 27–368g), withalcohol providing a mean contribution of 19% oftotal energy intake on match day (range, 3–43%of total energy intake).
Such ‘binge’ drinking practices were con-firmed in a separate study in these same subjects.Blood samples were taken from 41 players who attended a 9.00 a.m. training session on themorning following a weekend match. Fourteenof these players still registered a positive blood alcohol content (BAC) from their previousevening’s intake, with levels ranging from 0.001to 0.113 g · 100ml–1. Blood alcohol content in fourplayers exceeded the legal limit for driving amotor vehicle (0.05g · 100ml–1). The lay pressprovides ample anecdotal evidence of bingedrinking patterns of some athletes, particularlyin the immediate celebration or commiserationof their competition performances, or in the off-season. In some cases these episodes are romanti-cized and the drinking prowess of the athletes isadmired.
Whether total alcohol intake, or the prevalenceof episodes of heavy alcohol intake, by athletes is different from that of the general populationremains unclear. Surveys which have examinedthis issue report conflicting results. Varioushypotheses have been proposed to explain likelyassociations between sport and alcohol use. Ithas been suggested that athletes might have alower intake due to increased self-esteem, a morerigid lifestyle and greater interest in their healthand performance. Equally, alcohol has been asso-ciated with the rituals of relaxation and celebra-tion in sport, and it has been suggested thatathletes might be socialized into certain behav-
406 nutrition and exercise
iours and attitudes to drinking as a result of theirsports participation.
Several dietary surveys comparing differentgroups of athletes have reported that the meandaily alcohol intakes of team sport athletes are significantly greater than those of athletesinvolved in endurance and strength sports (vanErp-Baart et al. 1989; Burke et al. 1991). Whilethese studies were not specifically designed tocollect data on alcohol intake, the findings aresupported by data collected in some populationsurveys on alcohol use. Watten (1995), in anational survey of Norwegian adults, reportedthat men and women involved in team sportsreported a higher intake of alcohol, particularlybeer and liquor, than those involved in individ-ual sports or those with no sports involvement.However, some of these differences wereexplained by the age and educational back-grounds of subjects. O’Brien (1993) reported dif-ference between sports in alcohol use by eliteIrish athletes, but the overall intake of this groupwas exceptionally low, at an average of 0.5% oftotal energy intake.
Clearly, while there is anecdotal evidence tosuggest that some athletes may consume alcoholin excessive amounts, on at least some occasions,further studies are needed to fully determine thealcohol intake and patterns of use by athletes.Information on the attitudes and beliefs of athletes about alcohol is also desirable, since it would allow education about current drink-ing practices which are detrimental to theathlete’s performance or health to be specificallytargeted.
Metabolism of alcohol
The metabolism of ethanol occurs primarily inthe liver, where it is oxidized, first to acetalde-hyde, and then to acetate. The first step is catalysed by a number of hepatic enzymes, themost important of which is the nicotinamideadenine dinucleotide (NAD)-dependent alcoholdehydrogenase:
CH3CH2OH + NAD+ Æ CH3CHO + NADH + H+

Aldehyde dehydrogenase catalyses the furtheroxidation of acetaldehyde to acetate:
CH3CHO + NADH+ +H2O Æ CH3COO–
+ NADH +2H+
The NADH which is formed in these reactionsmust be reoxidized within the mitochondria, buttransfer of the hydrogen atoms into the mito-chondria might be a limiting process leading toan alteration in the redox potential of the cell.This can interfere with the conversion of lactateto pyruvate, and explains the increased bloodlactate concentration that may be observed afterhigh alcohol intakes.
Acetaldehyde is metabolized within the liver,and the acetaldehyde concentration in the blood remains low, but it is acetaldehyde that is thought to be responsible for many of theadverse effects of ethanol. The rate of hepaticgluconeogenesis is markedly suppressed by themetabolism of ethanol as a result of the alteredNAD/NADH ratio and the reduced availabilityof pyruvate (Krebs et al. 1969). If the liver glyco-gen stores are low because of a combination ofexercise and a low carbohydrate intake, the liverwill be unable to maintain the circulating glucoseconcentration, leading to hypoglycaemia. Therate at which ethanol is cleared by the liver varieswidely between individuals, and the response of the individual will depend on the amount ofethanol consumed in relation to the habitualintake. It is not altogether clear whether the rateof metabolism of alcohol is increased by exercise,and there are conflicting data in the literature(Januszewski & Klimek 1974). Table 30.1 indi-cates the amount of alcohol contained in somestandard measures.
Effects of acute alcohol ingestion on exercise
The variety of effects of alcohol on different bodytissues, and the variability of subject responses to alcohol, make it difficult to study the directeffects on sports performance. Generally, theergogenic benefits of alcohol intake immediatelybefore and during exercise are psychologically
driven. Alcohol has been used to decrease sen-sitivity to pain, improve confidence, and toremove other psychological barriers to perfor-mance. However, it may also be used to stimulatethe cardiovascular system, or to lessen the tremorand stress-induced emotional arousal in finemotor control sports. Although it is no longer onthe general doping list of the IOC, it is still con-sidered a banned substance in some sports, suchas shooting and fencing. In some sports, such asdarts and billiards, it is still popularly used as a(proposed) performance aid, but it remains to beseen whether this simply reflects the culture ofsports that are widely played in a hotel environ-ment (for review, see Williams 1991).
Exercise metabolism and performance
The American College of Sports Medicine (1982),and a more recent review by Williams (1991),have summarized the acute effects of alcoholingestion on metabolism and performance ofexercise. Alcohol does not contribute signifi-cantly to energy stores used for exercise, but insituations of prolonged exercise it may increasethe risk of hypoglycaemia due to a suppressionof hepatic gluconeogenesis. Increased heat lossmay be associated with this hypoglycaemia aswell as the cutaneous vasodilation caused byexercise, causing an impairment of temperatureregulation in cold environments. Studies of theeffects of alcohol on cardiovascular, respiratoryand muscular function have provided conflictingresults, but ingestion of small amounts of alcohol
alcohol in sport 407
Table 30.1 A standard drink contains approximately10g of alcohol.
Drink Amount (ml)
Standard beer (4% alcohol) 250Low alcohol beer (2% alcohol) 500Cider, wine coolers, alcoholic soft 250
drinksWine 100Champagne 100Fortified wines, sherry, port 60Spirits 30

has been reported not to significantly alter thecardiorespiratory and metabolic responses tosubmaximal exercise (Bond et al. 1983; Mangumet al. 1986). Dose–response relationships, inter-and intrasubject variability, and difficulty withproviding a suitable placebo may all help toexplain the difficulty of conducting and inter-preting alcohol studies. In general it has beenconcluded that the acute ingestion of alcohol hasno beneficial effects on aspects of muscle func-tion and performance tasks: because it may actually produce detrimental responses, it is bestavoided.
The few studies of acute alcohol ingestion andactual sports performance show variability inresults and responses. For example, Houmardand others (1987) reported that the ingestion ofsmall amounts of alcohol (keeping BAC below0.05g · 100ml–1) did not have a significant effecton the performance of a 8-km treadmill time trial, although there was a trend towards perfor-mance deterioration at higher blood alcohollevels. Meanwhile, McNaughton and Preece(1986) tested the performance of runners overvarious distances ranging from 100 to 1500 m, at four different levels of alcohol consumption(BAC estimated at 0–0.1g ·100 ml–1). Alcoholintake did not affect performance of 100-m timesin sprinters, but reduced performance over 200and 400 m as alcohol intake increased. Middle-distance runners showed impaired performancein 800 and 1500m run times, with these effectsalso being dose-related. An earlier study byHebbelinck (1963) showed no effect of alcohol(0.6 ml of 94% ethanol ·kg–1 body mass) on iso-metric strength, but a 6% reduction in verticaljump height and a 10% decrease in performancein an 80-m sprint.
Motor control and skill performance
There is a limited amount of information avail-able on the effects of acute ingestion of alcohol on motor control and the performance of skilledtasks. It is, however, clear from the controlledstudies that have been conducted that alcoholhas an adverse effect on tasks where concen-
408 nutrition and exercise
tration, visual perception, reaction time, and co-ordination are involved (Williams 1995). In manyof the earlier studies that showed a detrimentaleffect of even small doses of alcohol on compo-nents of athletic performance, the performancemeasures were not well standardized and the results are difficult to interpret. Hebbelinck(1963), however, showed that posture controldeteriorated after alcohol ingestion, with boththe extent and frequency of sway beingmarkedly increased: this represents a mildversion of the unsteadiness and ataxia that isapparent after higher levels of alcohol intake.
In 1982, the American College of Sports Medi-cine published a Position Statement on the use ofalcohol in sports, and this included a review ofthe research to date on the effects of alcohol onperformance: this literature was also reviewedby Williams (1985). The available evidenceshowed a detrimental effect of small to moderateamounts of alcohol on reaction time, hand–eyeco-ordination, accuracy, balance and complexskilled tasks, with no evidence cited to supportthe purported beneficial effects of reducedtremor. It has, however, been proposed that theingestion of small amounts of alcohol may resultin a greater feeling of self-confidence in athletes(Shephard 1972), and this may, in turn, improveperformance in some situations. The interferenceof alcohol with the judgement and skill involvedin the fine motor skills required for drivingaccounts for the legislation to prevent indivi-duals who have been drinking from drivingautomobiles.
Effects of acute alcohol ingestion onpostexercise recovery
There is evidence that the postcompetition situa-tion is often associated with alcohol intake andbinge drinking, and it is likely that social ritualsafter training or practice sessions in some sports(particularly in lower level competitions) mayalso involve moderate to heavy intake of alcohol.Given that athletes may be dehydrated and have eaten little on the day of competition, it islikely that alcohol consumed after exercise is
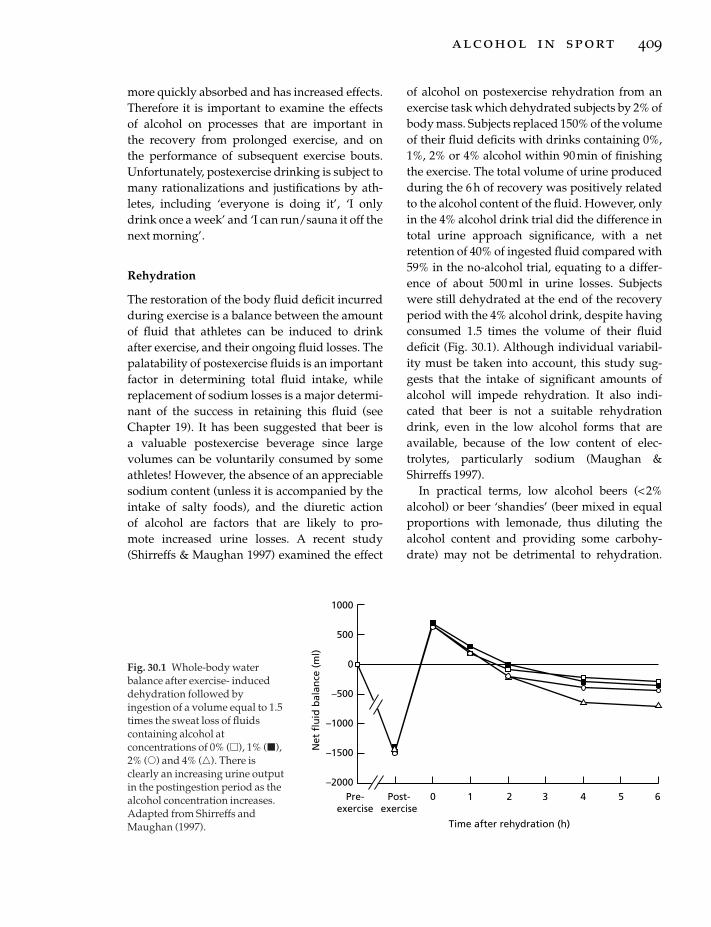
more quickly absorbed and has increased effects.Therefore it is important to examine the effects of alcohol on processes that are important in the recovery from prolonged exercise, and on the performance of subsequent exercise bouts.Unfortunately, postexercise drinking is subject tomany rationalizations and justifications by ath-letes, including ‘everyone is doing it’, ‘I onlydrink once a week’ and ‘I can run/sauna it off thenext morning’.
Rehydration
The restoration of the body fluid deficit incurredduring exercise is a balance between the amountof fluid that athletes can be induced to drink after exercise, and their ongoing fluid losses. Thepalatability of postexercise fluids is an importantfactor in determining total fluid intake, whilereplacement of sodium losses is a major determi-nant of the success in retaining this fluid (seeChapter 19). It has been suggested that beer is a valuable postexercise beverage since largevolumes can be voluntarily consumed by someathletes! However, the absence of an appreciablesodium content (unless it is accompanied by theintake of salty foods), and the diuretic action of alcohol are factors that are likely to pro-mote increased urine losses. A recent study(Shirreffs & Maughan 1997) examined the effect
of alcohol on postexercise rehydration from anexercise task which dehydrated subjects by 2% ofbody mass. Subjects replaced 150% of the volumeof their fluid deficits with drinks containing 0%,1%, 2% or 4% alcohol within 90 min of finishingthe exercise. The total volume of urine producedduring the 6h of recovery was positively relatedto the alcohol content of the fluid. However, onlyin the 4% alcohol drink trial did the difference intotal urine approach significance, with a netretention of 40% of ingested fluid compared with59% in the no-alcohol trial, equating to a differ-ence of about 500 ml in urine losses. Subjectswere still dehydrated at the end of the recoveryperiod with the 4% alcohol drink, despite havingconsumed 1.5 times the volume of their fluiddeficit (Fig. 30.1). Although individual variabil-ity must be taken into account, this study sug-gests that the intake of significant amounts ofalcohol will impede rehydration. It also indi-cated that beer is not a suitable rehydrationdrink, even in the low alcohol forms that areavailable, because of the low content of elec-trolytes, particularly sodium (Maughan &Shirreffs 1997).
In practical terms, low alcohol beers (< 2%alcohol) or beer ‘shandies’ (beer mixed in equalproportions with lemonade, thus diluting thealcohol content and providing some carbohy-drate) may not be detrimental to rehydration.
alcohol in sport 409
1000
500
0
–500
–1000
–1500
–2000Pre-
exercisePost-
exercise0 1 2 3 4 5 6
Time after rehydration (h)
Net
flu
id b
alan
ce (
ml)
Fig. 30.1 Whole-body waterbalance after exercise- induceddehydration followed byingestion of a volume equal to 1.5times the sweat loss of fluidscontaining alcohol atconcentrations of 0% (�), 1% (�),2% (�) and 4% (�). There isclearly an increasing urine outputin the postingestion period as thealcohol concentration increases.Adapted from Shirreffs andMaughan (1997).

Furthermore, notwithstanding other effects ofsmall to moderate amounts of alcohol, thesedrinks might be useful in encouraging large fluidintakes in dehydrated athletes. However, drinkswith more a concentrated alcohol content are notadvised, since the combination of a smaller fluidvolume and a greater alcohol intake will reducethe rate of effective fluid replacement. Neverthe-less, when aggressive rehydration is required,the planned intake of fluids containing sodium,or fluid intake in conjunction with sodium-rich foods, provides a more reliable strategy toreplace fluid losses (see Chapter 19).
Glycogen storage
Since alcohol has a number of effects on the inter-mediary metabolism of carbohydrate, it is possi-ble that postexercise intake might impair therestoration of depleted glycogen stores. In theabsence of carbohydrate intake, alcohol intake isknown to impair the carbohydrate status of theliver by inhibiting hepatic gluconeogenesis andincreasing liver glycogenolysis. Alcohol intakehas been reported to impair muscle glycogenstorage in rats following depletion by fasting orexercise (for review, see Palmer et al. 1991). Theeffect of alcohol intake on muscle glycogenstorage in humans was recently studied by Burkeand co-workers (in press), who undertook twoseparate studies to examine refuelling over 8 hand 24 h of recovery from a prolonged cyclingbout.
In these studies, athletes undertook three dif-ferent diets following their glycogen-deletingexercise: a control (high carbohydrate) diet, analcohol displacement diet (kept isoenergetic withthe control diet by reducing the carbohydrateintake) and an alcohol+ carbohydrate diet(alcohol added to the control diet). In the twodiets containing alcohol, the athletes wererequired to consume 1.5 g alcohol · kg–1 bodymass of alcohol in the 3h immediately after exer-cise (e.g. ª 100g alcohol or 10 standard drinks).Muscle glycogen storage was significantlyreduced on the alcohol displacement diets inboth the 8h and 24h study compared with the
410 nutrition and exercise
high carbohydrate diets. There was a trendtowards a reduction in glycogen storage over 8hof recovery with alcohol+carbohydrate diet;however, glycogen storage on the alcohol+ car-bohydrate diet on the 24-h study was identical tothe control diet. Therefore, there was no clear evi-dence of a direct impairment of muscle glycogenstorage by alcohol when adequate substrate wasprovided to the muscle; however, this may havebeen masked by intersubject variability.
The results of these studies suggest that themajor effect of alcohol intake on postexerciserefuelling is indirect, that high intakes of alcoholare likely to prevent the athlete from consum-ing adequate carbohydrate intake to optimizemuscle glycogen storage. In general, athleteswho participate in alcoholic binges are unlikelyto eat adequate food or make suitable high-carbohydrate food choices. Furthermore, foodintake over the next day may also be affected asthe athletes ‘sleep off their hangover’. Furtherstudies are needed to determine the direct effectof alcohol on muscle glycogen storage.
Other effects
Alcohol is known to exert other effects whichmay impede postexercise recovery. Many sport-ing activities are associated with muscle damageand soft tissue injuries, either as a direct conse-quence of the exercise, as a result of accidents, ordue to the tackling and collisions involved incontact sports. Standard medical practice is totreat soft tissue injuries with vasoconstrictivetechniques (e.g. rest, ice, compression, elevation).Since alcohol is a potent vasodilator of cutaneousblood vessels, it has been suggested that theintake of large amounts of alcohol might cause or increase undesirable swelling around dam-aged sites, and might impede repair processes.Although this effect has not been systematicallystudied, there are case histories that report thesefindings. Until such studies are undertaken, itseems prudent that players who have sufferedconsiderable muscle damage and soft tissueinjuries should avoid alcohol in the immediaterecovery phase (e.g. for 24 h after the event).
Another likely effect of cutaneous vasodilationfollowing alcohol intake is an increase in heatloss from the skin. This may be exacerbated byhypoglycaemia, which results from the com-bined effects of carbohydrate depletion andimpaired liver gluconeogenesis. Therefore, ath-letes who consume large quantities of alcohol in cold environments may incur problems with thermoregulation. An increased risk ofhypothermia may be found in sports or rec-reational activities undertaken in cold weather,particularly hiking or skiing, where alcoholintake is an integral part of après-ski activities.
As in the case of postexercise refuelling, it islikely that the major effect of excessive alcoholintake comes from the athlete’s failure to followguidelines for optimal recovery. The intoxicatedathlete may fail to undertake sensible injurymanagement practices or to report for treatment;they may fail to seek suitable clothing or shelterin cold conditions or to notice early signs ofhypothermia. While studies which measure thedirect effect of alcohol on thermoregulation andsoft tissue damage are encouraged, these effectsare likely to be minor or at least additive to thefailure to undertake recommended recoverypractices.
Accidents and high-risk behaviour
The most important effect of alcohol is theimpairment of judgement. Coupled with areduced inhibition, it is easy to see how intoxi-cated athletes might undertake high-risk behav-iour and suffer an increased risk of accidents.Alcohol consumption is highly correlated withaccidents of drowning, spinal injury and otherproblems in recreational water activities (seeO’Brien 1993), and is a major factor in road acci-dents. The lay press frequently contains reportsof well-known athletes being caught drivingwhile severely intoxicated, or being involved inbrawls or other situations of domestic or publicviolence. There have been a disturbing numberof deaths of elite athletes in motor car accidentsfollowing excess alcohol intake. Clearly, athletesare not immune to the social and behavioural
problems following excess alcohol intake; thereis some discussion that certain athletes may bemore predisposed (see O’Brien 1993). Furtherstudies are required before it can be determinedwhether athletes, or some groups of athletes, are more likely to drink excessively or suffer agreater risk of alcohol-related problems. How-ever, it appears that athletes should at least beincluded in population education programmesrelated to drink-driving and other high-riskbehaviour.
Effect of previous day’s intake (i.e. ‘hangover’)on performance
Some athletes will be required to train (or evencompete again) on the day after a competitionand its postevent drinking binge. In some cases,athletes may choose to drink heavily the nightbefore a competition, as a general part of theirsocial activities, or in the belief that this will helpto ‘relax’ them prior to the event. The effect of an‘alcohol hangover’ on performance is widely dis-cussed by athletes, but has not been well studied.Karvinen and coworkers (1962) used a crossoverdesign to examine ‘next day’ performance fol-lowing the consumption of large amounts ofalcohol (approximately eight standard drinks),and reported that a hangover did not impairpower or strength, but impaired the ability to undertake a bout of high-intensity cycling.O’Brien (1993) undertook ‘aerobic’ and ‘anaero-bic’ testing of a team of Rugby Union players on aFriday night, and then requested them to returnfor repeat testing the next day after consumingtheir ‘typical Friday night’s alcohol intake’. Astandardized sleep time and breakfast were fol-lowed. He reported that V
.O2max. was significantly
reduced the following day, and that any level ofalcohol intake appeared to impair this measureof aerobic capacity. However, since no controltrial was undertaken, it is hard to dissociate theeffects of alcohol from the effects and variabilityof repeated testing. Meanwhile it is interesting tonote that the mean alcohol intake reported byplayers as typical of their prematch activities wasapproximately 130g (range, 1–38 units).
alcohol in sport 411

Research in other areas of industrial work (e.g.machine handling and flying) suggests thatimpairment of psychomotor skills may continueduring the hangover phase. Clearly this will be ofdetriment in team sports and court sports whichdemand tactical play and a high skill level.
Effects of chronic alcohol intake onissues of sports performance
Athletes who chronically consume largeamounts of alcohol are liable to the large num-ber of health and social problems associated with problem drinking. Early problems to haveimpact on sports performance include inade-quate nutrition and generally poor lifestyle (e.g.inadequate rest). Since alcohol is an energy-dense nutrient (providing 27 kJ ·g–1), frequentepisodes of heavy alcohol intake are generallyaccompanied by weight gain. Weekend bingedrinkers tend to maintain their food consump-tion, since alcohol does not seem to regulate totalenergy intake in the short term. However, erraticeating patterns and choice of high fat foods canlead to excess energy consumption. A commonissue, particularly in team sports, is the signifi-cant gain in body fat during the off-season due to increased alcohol intake coupled with reduced exercise expenditure. Many playersneed to devote a significant part of their pre-season (and even early season) conditioning toreversing the effects of their off-season activities.Clearly this is a disadvantage to performanceand to the longevity of a sports career.
Guidelines for sensible use of alcoholby athletes
The following guidelines are suggested topromote sensible use of alcohol by athletes.
1 Alcohol is not an essential component of adiet. It is a personal choice of the athlete whetherto consume alcohol at all. However, there is noevidence of impairments to health and perfor-mance when alcohol is used sensibly.
2 The athlete should be guided by communityguidelines which suggest general intakes of
412 nutrition and exercise
alcohol that are ‘safe and healthy’. This variesfrom country to country, but in general, it is sug-gested that mean daily alcohol intake should be less than 40–50g (perhaps 20–30g ·day–1 forfemales), and that ‘binge’ drinking is discour-aged. Since individual tolerance to alcohol isvariable, it is difficult to set a precise definition of‘heavy’ intake or an alcohol ‘binge’. However,intakes of about 80–100 g at a single sitting arelikely to constitute a heavy intake for mostpeople.
3 Alcohol is a high-energy (and nutrient-poor)food and should be restricted when the athlete isattempting to reduce body fat.
4 The athlete should avoid heavy intake ofalcohol on the night before competition. Itappears unlikely that the intake of one or twostandard drinks will have negative effects inmost people.
5 The intake of alcohol immediately before orduring exercise does not enhance performanceand in fact may impair performance in manypeople. Psychomotor performance and judge-ment are most affected. Therefore the athleteshould not consume alcohol deliberately to aidperformance, and should be wary of exercise thatis conducted in conjunction with the social intakeof alcohol.
6 Heavy alcohol intake is likely to have a major impact on postexercise recovery. It mayhave direct physiological effects on rehydration,glycogen recovery and repair of soft tissuedamage. More importantly, the athlete isunlikely to remember or undertake strategies foroptimal recovery when they are intoxicated.Therefore, the athlete should attend to thesestrategies first before any alcohol is consumed.No alcohol should be consumed for 24h in thecase of an athlete who has suffered a major soft-tissue injury.
7 The athlete should rehydrate with appropri-ate fluids in volumes that are greater than theirexisting fluid deficit. Suitable fluid choicesinclude sports drinks, fruit juices, soft drinks (allcontaining carbohydrate) and water (when refu-elling is not a major issue). However, sodiumreplacement via sports drinks, oral rehydration

solutions or salt-containing foods is also impor-tant to encourage the retention of these rehydra-tion fluids. Low alcohol beers and beer–softdrink mixes may be suitable and seem to encour-age large volume intakes. However, drinks containing greater than 2% alcohol are not rec-ommended as ideal rehydration drinks.
8 Before consuming any alcohol after exercise,the athlete should consume a high carbohydratemeal or snack to aid muscle glycogen recovery.Food intake will also help to reduce the rate ofalcohol absorption and thus reduce the rate ofintoxication.
9 Once postexercise recovery priorities havebeen addressed, the athlete who chooses to drinkis encouraged to do so ‘in moderation’. Drink-driving education messages in various countriesmay provide a guide to sensible and well-paceddrinking.10 Athletes who drink heavily after competition,or at other times, should take care to avoiddriving and other hazardous activities.11 It appears likely that it will be difficult tochange the attitudes and behaviours of athleteswith regard to alcohol. However, coaches, man-agers and sports medicine staff can encourageguidelines such as these, and specifically targetthe old wives tales and rationalizations thatsupport binge drinking practices. Importantly,they should reinforce these guidelines with aninfrastructure which promotes sensible drinkingpractices. For example, alcohol might be bannedfrom locker rooms and fluids and foods appro-priate to postexercise recovery provided instead.In many cases, athletes drink in a peer-group situation and it may be easier to change the envi-ronment in which this occurs than the immediateattitudes of the athletes.
Conclusion
Alcohol is strongly linked with modern sport.The alcohol intakes and drinking patterns of ath-letes are not well studied; however, it appearsthat some athletes undertake binge drinkingpractices, often associated with postcompetitionsocializing. There is no evidence that alcohol
improves sports performance; in fact there is evi-dence that intake during or immediately beforeexercise, or that large amounts consumed thenight before exercise may actually impair perfor-mance. There are considerable differences in theindividual responses to alcohol intake. It is likelythat recovery after exercise is also impaired; but particularly by the failure of the intoxicatedathlete to follow guidelines for optimum recov-ery. Athletes are not immune to alcohol-relatedproblems, including the greatly increased risk ofmotor vehicle accidents following excess alcoholintake. Not only should athletes be targeted foreducation about sensible drinking practices, butthey might be used as spokespeople for commu-nity education messages. Athletes are admired inthe community and may be effective educators inthis area. Alcohol is consumed by the vast major-ity of adults around the world, and merits edu-cation messages about how it might be used toenhance lifestyle rather than detract from healthand performance.
References
American College of Sports Medicine (1982) Positionstatement on the use of alcohol in sports. Medicineand Science in Sports and Exercise 14, ix–x.
Bond, V., Franks, B.D. & Howley, E.T. (1983) Effects ofsmall and moderate doses of alcohol on submaximalcardiorespiratory function, perceived exertion andendurance performance in abstainers and moderatedrinkers. Journal of Sports Medicine 23, 221–228.
Burke, L.M. & Read, R.S.D. (1988) A study of dietarypatterns of elite Australian football players. CanadianJournal of Sports Science 13, 15–19.
Burke, L.M., Gollan, R.A. & Read, R.S.D. (1991) Dietaryintakes and food use of groups of elite Australianmale athletes. International Journal of Sport Nutrition 1,378–394.
Burke, L.M., Collier, G.R., Broad, E.M. et al. (submittedfor publication) The effect of alcohol intake onmuscle glycogen storage following prolonged exercise.
Gregory, J., Foster, K., Tyler, H. & Wiseman, M. (1990)The Dietary and Nutritional Survey of British Adults.HMSO, London.
Hebbelinck, M. (1963) The effects of a small dose ofethyl alcohol on certain basic components of humanphysical performance. Archives in Pharmacodynamics143, 247–257.
alcohol in sport 413

Houmard, J.A., Langenfeld, M.E., Wiley, R.L. & Siefert,J. (1987) Effects of the acute ingestion of smallamounts of alcohol upon 5-mile run times. Journal ofSports Medicine 27, 253–257.
Januszewski, J. & Klimek, A. (1974) The effect of physi-cal exercise at varying loads on the elimination ofblood alcohol. Acta Physiologica Polonica 25, 541–545.
Karvinin, E.A., Miettinen, A. & Ahlman, K. (1962)Physical performance during hangover. QuarterlyJournal of Studies of Alcohol 23, 208–215.
Krebs, H.A., Freedland, R.A., Hems, R. & Stubbs,M.(1969) Inhibition of hepatic gluconeogenesis byethanol. Biochemistry Journal 112, 117–124.
McNaughton, L. & Preece, D. (1986) Alcohol and itseffects on sprint and middle distance running. BritishJournal of Sports Medicine 20, 56–59.
Mangum, M., Gatch, W., Cocke, T.B. & Brooks, E. (1986)The effects of beer consumption on the physiologicalresponses to submaximal exercise. Journal of SportsMedicine 26, 301–305.
Maughan, R.J. & Shirreffs, S.M. (1997) Recovery fromprolonged exercise, restoration of water and elec-trolyte balance. Journal of Sports Science 15, 297–303.
O’Brien, C.P. (1993) Alcohol and sport: impact of socialdrinking on recreational and competitive sports per-formance. Sports Medicine 15, 71–77.
Palmer, T.N., Cook, E.B. & Drake, P.G. (1991) Alcohol
414 nutrition and exercise
abuse and fuel homeostasis. In Alcoholism: A Molecu-lar Perspective (ed. T.N. Palmer), pp. 223–235. PlenumPress, New York.
Shephard, R. (1972) Alive Man: The Physiology of PhysicalActivity. CC Thomas, Springfield, IL.
Shirreffs, S.M. & Maughan, R.J. (1997) Restoration offluid balance after exercise-induced dehydration,effects of alcohol consumption. Journal of AppliedPhysiology 83, 1152–1158.
Van Erp-Baart, A.M.J., Saris, W.H.M., Binkhorst, R.A.,Vos, J.A. & Elvers, J.W.H. (1989) Nationwide surveyon nutritional habits in elite athletes. Part 1. Energy,carbohydrate, protein and fat intake. InternationalJournal of Sports Medicine 10 (Suppl.), S3–S10.
Watten, R.G. (1995) Sports, physical exercise and use ofalcohol. Scandinavian Journal of Sports Medicine 5,364–368.
Williams, M.H. (1985) Nutritional Aspects of HumanPhysical and Athletic Performance. CC Thomas,Springfield, IL.
Williams, M.H. (1991) Alcohol, marijuana and betablockers. In: Perspectives in Exercise Science and SportsMedicine. Vol. 4. Erogenics: Enhancement of Performancein Exercise and Sport (ed. D.R. Lamb & M.H.Williams), pp. 331–372. Cooper Publishing Group,Carmel, CA.
Williams, M.H. (1995) Nutrition for Fitness and Sport.Brown & Benchmark, Madison.

PART 2
SPECIAL CONSIDERATIONS


Introduction
As increasing numbers of women participate in sport and exercise, recommendations for their dietary intake to enhance general healthand performance become important. Unfortu-nately, physical and metabolic differencesbetween men and women generally have not been considered in the development ofcurrent dietary guidelines, except for calciumand iron. However, gender differences exist that could potentially affect a woman’s energyand nutrient needs: upper body muscle mass and strength (Miller et al. 1993), endurancecapacity in isometric and dynamic exercise at relatively low intensities (Maughan et al.1986), resting metabolic rate (Arciero et al. 1993)and heart rate measured during different exercise modalities (Kravitz et al. 1997). Ratherthan deriving recommendations from researchinvolving mixed-gender or female populations,dietary guidelines for protein (Lemon 1995) and carbohydrate (CHO) (Williams 1989) in-takes have been developed from studies us-ing male subjects. In consideration of dietary guidelines for the female athlete, this chapterwill address limitations of the use of current recommendations for athletes, present evidencefor gender differences related to lipid and sub-strate metabolism and provide discussionregarding macro- and micronutrient recommen-dations. A brief clarification of terms used todefine nutrient needs and recommendations for intake to meet these needs in populations
and in individuals will precede these topics ofdiscussion.
Clarification of dietary guideline nomenclature
Terms that reflect estimates of nutrient require-ments vary among countries. In the UnitedKingdom, nomenclature consists of dietary refer-ence values (DRV), estimated average requirement(EAR), lower reference nutrient intake (LRNI) andreference nutrient intake (RNI) (Department ofHealth 1991). The term recommended dietaryallowance (RDA) (National Research Council1989) has traditionally been used in the UnitedStates, but is expected to change in the nextedition of guidelines to terminology similar tothat currently used in the UK. In Canada, recom-mended intakes of energy and certain nutrientsare called recommended nutrient intakes (RNI)(Health and Welfare Canada 1983). To simplifyreading, dietary guideline will be used in thischapter when referring to RNI, RDA or termsused by other countries.
Limitations of the use of currentdietary guidelines for athletes
Dietary guidelines used in the US are expressedas quantities of a nutrient for a reference individ-ual per day, a term that should be interpreted asan average intake over time (National ResearchCouncil 1989). For dietary assessments of ath-letes, food intake should be recorded for a
Chapter 31
The Female Athlete
KATHE A. GABEL
417

minimum of 3 days. Dietary guidelines of mostnutrients are intended to be intakes averagedover at least 3 days and over several months forthose nutrients stored by the body, e.g. vitaminA.
Physical activity levels, climate and otherfactors can change dietary requirements. Anyonewho exercises and/or is exposed to cold or hot environments may require different levels ofsome nutrients as compared to levels listed incurrent guidelines. As the reader evaluatesdietary assessments of physically active popula-tions, these limitations of the dietary guidelinesshould be considered.
Requirement for energy
Energy needs are related to body mass. In theUK, median weights and heights of the popul-ation, recorded in 1980, are used to calculateenergy needs (MJ ·day–1). Total energy expendi-ture (TEE) is expressed as a multiple of the basalmetabolic rate (BMR) and is affected by the physical activity level. Examples of TEE calcula-tions for men and women can be found in the UKReport on Dietary Reference Values (Department ofHealth 1991). Current US energy calculations arebased on median heights and weights found in the second National Health and NutritionExamination Survey with empirically derived
418 special considerations
equations developed by the World Health Organization (WHO 1985) specifically used toestimate resting energy expenditure (REE). Toestimate total energy expenditure (TEE), REE ismultiplied by a factor that represents an activitylevel which needs to be recorded over a suffi-ciently long time accounting for weekdays and weekends to increase validity of the estimateof energy expenditure. Examples of this calcula-tion can be found in the US reference (NationalResearch Council 1989).
Agreement regarding which equation to usefor TEE estimation does not exist. As publishedin the WHO’s Report on Energy and ProteinRequirements, BMR forms the basis of the factorialmethod to estimate TEE (WHO 1985). However,examination of the calculations indicates that theequations overestimate BMR of some populationgroups (Piers et al. 1997). Carpenter et al. (1995),in a meta-analysis of 13 studies that utilizeddoubly labelled water technique as the methodto measure TEE in free-living humans, con-cluded that there are insufficient published data to permit development of practical modelsto predict TEE in adults.
Acknowledgement of potential limitations ofTEE calculations and of the derivation of energyrecommendations is necessary to prevent inap-propriate energy-related conclusions made insports nutrition research or recommendations
Fig. 31.1 Performances of elitefemale athletes have improvedrapidly with increasedopportunities for participationand increased training loads.Photo © Allsport / John Gichigi.

given to athletes. It is also expected that mostfemale athletes will have a different weight/height ratio as compared to the women in the UKor US surveys. This difference is illustrated bycomparing estimates of body fat and weights fornational-level competitive female rhythmic gym-nasts to controls of the same age and height.Female gymnasts averaged 10% body fat (range,6–17%) as compared to controls, whose meanpercentage body fat was 19% (range, 14–27%).An average weight of the gymnasts was reportedto be 42 kg as opposed to 54 kg average weightfor the controls (Sundgot-Borgen 1996).
Depending upon desired level for accuracy ofenergy estimates and in spite of the identifiedlimitations, TEE equations may still be useful tocalculate an estimate of energy expenditure forthe female athlete. Additional research is neededto better predict TEE for athletic populations andunderstand the influence of exercise on TEE, par-ticularly in relation to the female athlete. Genderdifferences in substrate metabolism as discussedin the next section also support this need.
Substrate metabolism
Levels of triacylglycerol, total cholesterol (TC),high-density lipoprotein cholesterol (HDL-C)and low-density lipoprotein (LDL-C) can beaffected by the presence of oestrogen. Major proteins for HDL and LDL are apo A-1 and apo B, respectively, and were investigated in 25female runners and 36 age-matched non-exercising women (controls) (Lamon-Fava et al.1989). Lower concentrations of TC, apo B, triacyl-glycerol and higher apo A-1 to apo B ratios wereobserved in the eumenorrhoeic female runners(n = 16) as compared with nonexercising controls.All blood parameters in the amenorrhoeicrunners (n= 9) were similar to levels in the con-trols, except that apo B-values were 20% lower.Except for the effect on apo B levels, the positiveeffects of exercise on serum lipids were negatedin those females with decreased oestrogen, i.e.amenorrhoeic runners.
In considering oestrogen’s effect on lipidmetabolism, one may ask whether there is a
difference between men and women in the substrates used for energy during exercise.Tarnopolsky et al. (1990) matched subjects formaximal oxygen consumption, training status,and competition histories; tested females duringthe midfollicular phase of their menstrual cycles;and controlled the macronutrient content of thediet to prevent confounding effects of thesefactors on results. Subjects ran 15.5km on a tread-mill at a velocity requiring oxygen consumptionof about 65% of maximal. Glycogen utilizationwas estimated from muscle biopsies, with respi-ratory exchange ratio (RER) used to determinesubstrate utilization during the exercise. Femalesdemonstrated greater lipid utilization based onRER values, less muscle glycogen use and lessurea nitrogen excretion than males during moderate-intensity, long-duration exercise.Given that a female athlete could oxidize greaterfat stores while preserving CHO and protein,females would have an advantage in enduranceand ultra-endurance events in which fat oxida-tion becomes metabolically more important.However, one may also argue that controlling fortraining level and substrate availability betweengenders is unlikely. This presents researcherswith a challenging task in answering the ques-tion of gender-related substrate use.
Hormonal status of the female may need con-sideration by the researcher and sport nutrition-ist when evaluating energy intake of the femaleathlete. Barr et al. (1995) provide evidence thatenergy intakes of normally ovulating women arehigher during the luteal phase of their menstrualcycles. While it is possible to ignore differenceswhen conducting cross-sectional studies, itwould be necessary to consider these energyintake differences in longitudinal studies.Whether a dietary assessment is taken over timeor for 1 day, inquiry about the athlete’s menstrualcycle may provide useful information related toenergy intake, as well as nutritional and healthstatus.
Carbohydrate recommendations
Recommended percentages of energy from CHO
the female athlete 419

in the total diet have been listed as 55–70% forthose engaged in exercise and training (Williams1995). The percentage of energy (E%) derivedfrom CHO may be helpful in comparison ofdietary intakes, but has limited value for coun-selling athletes and, if used alone, can be mis-leading. For example, an endurance cyclist couldconsume a diet of 63% energy from CHO whichwould normally be considered less than the recommended level of 70% for the intake of anathlete engaged in endurance-type exercise. Yet,when the actual daily intake of approximately 18g CHO · kg–1 body weight (BW) is considered(Gabel et al. 1995), intake of the athlete cycling14–16h · day–1 is greater than current recommen-dations. To obtain a greater understanding of an athlete’s food intake, the optimal analysiswould include values for g CHO · kg–1 BW, E%from CHO and total amount of CHO.
Reports of dietary intakes for female athletesillustrate a lower than expected energy and CHOintake in relation to current dietary recommen-dations for those engaged in exercise and training. Review of CHO and energy intake infemale athletes (Walberg-Rankin 1995) revealedconsumption of 3.2–5.4 g CHO ·kg–1 BW· day–1
and energy intakes of 6.4–9.6 MJ · day-1
(1540–2300 kcal ·day-1) for female athletesinvolved in anaerobic sports (bodybuilding,gymnastics, basketball). Ranges of 4.4–6.2g CHO· kg–1 BW·day–1 and 7–10 MJ ·day-1 (1660–2400kcal) were reported for those parti-cipating in aerobic sports (running, cycling,triathlons). In preparation for a 90-km ultrama-rathon, 23 South African female runners con-sumed an average of 49.5% of their energy intake(7.5 MJ) from CHO or 4 g CHO ·kg–1 BW· day–1 aspart of their training diet (Peters & Goetzsche1997). The female athletes reported running anaverage of 73.4 (±12.1) km ·week–1. Dietaryassessments included two 24-h food recordsobtained 4 weeks prior to the race and no associa-tions were found among energy, macro- andmicronutrient intake and performance in theevent. The use of 24-h records limits interpreta-tion of these results.
420 special considerations
Steen et al. (1995) reported average energy andCHO intakes of female heavyweight collegiaterowers below those expected for athletesengaged in training for 12h and 2 h of weighttraining per week. Average intakes of 11MJ (2630 kcal; range, 2025–3858kcal) and 51% ofenergy from CHO (4.9 g ·kg–1 BW) were esti-mated from 5-day food records (3 weekdays and 2 weekend days). Simonsen et al. (1991)investigated energy needs of 24 collegiate rowers during 4 weeks of twice daily training 6 days per week. A high-CHO diet providing 10gCHO· kg–1 BW promoted greater muscle glyco-gen content and greater power output than a diet containing 5 g CHO · kg–1 BW. However, themoderate-CHO diet provided a constant level of muscle glycogen (119mmol · kg–1) and did not lead to glycogen depletion or performanceimpairment.
Dietary recommendations for CHO intake donot differentiate for gender nor are the currentCHO dietary recommendations derived fromfemale athletic populations. Current recommen-dations include a minimum CHO intake of 5g ·kg–1 ·day–1 that has been suggested for a recre-ational athlete (Clark 1990) and increased levelsfor a more competitive athlete. For counsellingwomen who participate in endurance and ultra-endurance events, sports nutritionists areencouraged to use recommendations of morethan 6g CHO ·kg–1 BW currently suggested toathletes involved in endurance sports and aminimum of 5g CHO ·kg–1 BW for other femaleathletes. Researchers are encouraged to pursuethe question of macro-nutrient needs of femaleathletes at all levels of exercise intensity andrelated performance.
It is worth repeating the advice for analysingthe female athlete’s food intake using values of gCHO· kg–1 BW, E% from CHO and total amountof CHO. The findings from Simonsen et al. (1991)suggested that 10g CHO·kg–1 BW will pro-mote greater muscle glycogen content andpower output. If this CHO recommendation wasused for a female rower who weighed 60 kg, consider the ramifications.

If perchance the athlete consumed a total of10.9MJ ·day-1 (2600 kcal · day-1) (Steen et al.1995), only 840 kJ (200kcal) would remain forprotein and fat needs. This yields an impossibletask not only in providing adequate levels ofprotein and fat, but in a practical sense as well.Another CHO recommendation comes in theform of total amount of CHO per day. The cur-rently used 500–600 g CHO · day–1 recommenda-tion was derived from four trained male runnerswhose average weight was 80kg (Costill et al.1981). As illustrated and reflected in currentintakes of females, these higher recommendedlevels of CHO are not practical for the typicallylower weight female athlete.
Protein recommendations
When compared with CHO and fat, protein is anutrient with greater biological diversity in thebody, greater methodological challenges in itsstudy and with corresponding controversy in thefindings. The reader can find in-depth reviews of amino acid metabolism in Chapter 9 and ofprotein requirements in Chapter 10.
Recognized as important for the athlete,protein is an energy nutrient that has a dietaryguideline of about 0.75 g ·kg–1 · day–1 in the UK(Department of Health 1991) and US (NationalResearch Council 1989). As previously men-tioned, these recommendations are not set withconsideration for the effects of physical activityor climate. Rationale for using the recommendedlevel of protein for both sexes stems from limitedevidence found during a nitrogen balance studyof six young women that requirement values,when expressed per kilogram of body weight,are not substantially different from those foryoung adult men. Calloway and Kurzer (1982)also noted in their study the importance of hor-monal influences on the gain and loss of nitrogenand cautioned others that failure to consider the
10 60 60016 710
g CHO kg BW kg BW g CHOkJ or g CHO
MJ or
¥ =¥ ( )= ( )
. 4 kcal 2400 kcal
effect of the menstrual cycle could lead to inaccu-rate estimates of nitrogen/protein requirements.
Endurance athletes have greater proteinrequirements than those of sedentary persons(Tarnopolsky et al. 1988; Meredith et al. 1989).Phillips et al. (1993) considered protein needs forindividuals engaged in habitual physical exer-cise and concluded that 0.86 g ·kg–1 · day–1 wasinadequate for endurance athletes. Females inthe study were eumenorrhoeic, not taking oralcontraceptives and matched to training levels ofmales with the use of training and performancehistories. Male athletes exhibited higher absoluteleucine oxidation than females, yet an increase inoxidation with exercise was proportionallygreater in the females. This was not explained by the authors. In respect to methodology, a 15N-glycine isotope revealed a higher proteinturnover in elderly women (n =6) after they con-sumed 20% of their total energy as protein thanafter a 10% protein diet and no difference wasobserved when a [1-13C] leucine method wasused (Pannemans et al. 1997). Care must there-fore be taken in choosing the stable isotope tracerto measure protein turnover. The age of thesesubjects and small sample size limit the applica-tion of this research to female athletes, yet maypose questions for researchers who investigateprotein utilizing leucine as a tracer.
While investigations of the most appropriateisotope tracer may redirect protein research, themore traditional nitrogen balance studies stillsupport increased protein needs for active indi-viduals. Without support for a specific proteinrequirement for the female athlete, reliance on athorough dietary assessment of protein qualityand energy intake followed with the provision of current recommendations for protein is sug-gested. Lemon (1995) suggests that enduranceathletes consume protein levels of 1.2–1.4g · kg–1 ·day–1 and increased amounts for the strengthathlete, 1.4–1.8g protein ·kg–1 · day–1. Unfortu-nately, these recommendations are based on dataderived from male subjects aged 20–40 years. Inconsideration of recent data suggesting genderdifferences in substrate utilization, the protein
the female athlete 421
levels may be excessive for the female; however,Lemon (1995) suggests that any adverse effect ofexcessive protein intake is minimal for individu-als with normal kidney function.
Concern regarding protein intake for thefemale athlete stems from whether or not theindividual consumes a low-energy intake or astrict vegetarian diet. Negative nitrogen balancecan result in situations when energy intake isinsufficient or consumed protein is of lesser biological quality. In these situations, heightenedattention to the protein quality and adequateenergy levels is warranted in the dietary assessment.
Fat
Dietary fat guidelines promoted by differentcountries and agencies (James et al. 1988; Com-mittee on Diet and Health 1989) vary from 20 to35 E%. Developed for the general public, theselevels stem from research that associates high fatintake with a variety of chronic diseases. Somehave proposed the use of high-fat diets or fatloading to improve endurance capability of athletes. In their review of studies testing the fat-loading hypothesis, Sherman and Leenders(1995) concluded that the use of high-fat diets toimprove endurance is not supported by a suffi-cient number of valid, credible and replicatedstudies. See Chapter 14 for more support of thisconclusion.
Concern for a lower weight and percentage ofbody fat, as indicated by a score on the EatingAttitudes Test, motivates amenorrhoeic femaleathletes to consume less fat (11 E%) than eumen-orrhoeic athletes (17 E%) (Perry et al. 1996), whileother female athletes could benefit from coun-selling to reduce fat content in their diets (Steen etal. 1995). Consideration for the female athlete’sweight history, appropriate goals for body composition and weight, current eating habitsand serum lipid chemistries, family history ofdisease, and factors that influence energy and fatintake is important in the development of appro-priate recommendations for fat intake. For thesport nutritionist, a thorough dietary and health
422 special considerations
assessment will provide the best basis for anyrecommendation that can be made for fat intakeby female athletes.
Vitamins
It is generally supported that vitamin supple-mentation is not needed for those athletes consuming a variety of foods and that vitaminsupplementation in athletes with an adequatevitamin status has no effect on performance (vander Beek 1991). For further discussion of vita-mins, see Chapters 20 and 21. For the femaleathlete, research on vitamin B6 and the antioxi-dant vitamins requires further discussion in thischapter.
Vitamin B6
Energy metabolism during exercise relies onseveral biological functions of vitamin B6. The sixbiologically active forms of vitamin B6 may func-tion as a cofactor for enzymes used in metabolictransformation of amino acids, in gluconeogene-sis and glycogenolysis. Other functions related toexercise include serotonin formation and synthe-sis of haemoglobin and carnitine. With the pos-sibility of an increased need for this vitamin inyoung women, it may be beneficial to considervitamin B6 intake of the female athlete.
Female athletes tend to report vitamin B6intakes that are less than two thirds of the dietaryguideline. However, it is important to note the possible influences of underreporting, lowenergy intakes or inadequate vitamin B6 data indietary computer software programs as possiblecontributors to the reported lower than expectedintakes of vitamin B6.
Manore (1994) summarized post-1985 studiesreporting average dietary intakes of vitamin B6 for female athletes. With the majority ofresearchers using a 3-day record to recordintakes, 10–60% of the subjects reported con-sumption of less than two thirds of the dietaryguideline for vitamin B6. However, levels of thevitamin expressed as milligrams of vitamin B6per gram of protein were not below the currently

recommended level of 0.016. The results of astudy by Huang et al. (1998) provide recent evi-dence that the level of 0.016 mg vitamin B6 ·g–1
protein is inadequate for young women. Theirstudy of eight women residing in a metabolicunit for 92 days suggests that 0.019mg vitamin B6 · g–1 protein is needed to normalize vitamin B6 measures to controlled baseline values. Ifvitamin B6 needs are indeed higher than currentguidelines for young women, more attention toan adequate intake of this vitamin is needed forfemale athletes.
It is advisable for those working with athleteswho typically report low energy intakes, i.e.gymnasts, figure skaters, and runners, to appro-priately assess food intakes while noting com-pleteness of the nutrient data bank used toestimate vitamin B6 intake. Based on a thoroughassessment, one may potentially proceed to rec-ommend consumption of additional vitamin B6-rich foods.
Antioxidant vitamins
Exercise-induced oxidative stress may be aconcern for an athlete. Oxidative stress occurs at submaximal levels of exercise (Leaf et al.1997), and at peak V
.o2max. (Viguie et al. 1990). The
human body constantly forms free radicals andother oxygen-derived species that can damageDNA, lipids and proteins. When exposed to mild oxidative stress, the body can respond byincreasing its defensive antioxidant enzymesand proteins; however, severe damage may leadto cell transformation and the increased oxida-tive damage has been associated with humandisease, specifically cardiovascular disease andcancer (Halliwell 1994).
To diminish the effect of naturally occurringoxidative damage, it has been suggested thatantioxidant nutrients should be added to the diet(Jacob & Burri 1996). Carotenoids, ascorbic acid,a-tocopherol, flavonoids, and other plant pheno-lics are a few of those suggested as important inprotecting against oxidative damage. In otherwords, inclusion of fruits and vegetables in theathlete’s diet can partially provide a solution to
the concern for increased oxidative stress fromexercise.
Some reports suggest that supplementationwith antioxidant nutrients, such as vitamin E,can attenuate the exercise-induced lipid perox-idation (Sumida et al. 1989). A daily combinationof 294mg vitamin E, 1000mg ascorbic acid and60mg ubiquinone was found to be effective inpreventing LDL oxidation in male enduranceathletes; however, 4 weeks’ supplementationwith the antioxidant nutrients did not reduceLDL oxidation products, i.e. conjugated dienes(Vasankari et al. 1997). Limited data specificallyon female athletes are again noted in the area ofantioxidant research.
For possible increased antioxidant vitaminrequirements for those who exercise, the recom-mendation for an increased fruit and vegetableintake is worthy of emphasis. Dietary guidelinesfrom several US organizations recommend fiveor more daily servings of fruits and vegetables tohelp reduce the risk of heart disease and certainkinds of cancer (Jacob & Burri 1996). For thefemale athlete, increased intake of fruits and veg-etables can provide additional CHO and severalessential nutrients. For those athletes limitingenergy intake to reduce body fat, these foods willprovide a higher nutrient to calorie ratio knownto be beneficial for consuming a more nutrientadequate food intake.
Minerals
Macrominerals: calcium
A nutrient worthy of consideration for supple-mentation to the female athlete’s diet is calcium.For detailed discussion of this mineral’s roles inthe body, calcium intake and its relationship toexercise, refer to Chapter 23. Discussion sup-porting the concern for adequate intake of thismineral and of practical ways to increase calciumintake in female athletes follows.
Peak bone mass development depends uponadequate calcium intake during skeletal growth(Matkovic 1991; Johnston et al. 1992) as well as forgain in bone mass until the third decade of life
the female athlete 423

(Recker et al. 1992). The combination of subopti-mal calcium intakes by female athletes (Chen et al. 1989; Steen et al. 1995; Peters & Goetzsche1997) and differences of opinion regarding rec-ommended dietary guidelines for this mineral(Health and Welfare Canada 1983; NationalResearch Council 1989; Department of Health1991) prompts some concern and questionsamong those who care for, work with or feedfemale athletes.
Why should one have concern? Since physicalactivity, particularly high impact, is associatedwith greater bone density (Dook et al. 1997), onemight expect that female athletes need not worryabout the possibility of bone loss. However, iden-tification of a syndrome of disordered eating,amenorrhoea and reduced bone density (Loucks1987) overshadows this positive aspect of physi-cal activity and may contribute to a greater con-sideration for adequate calcium intakes in femaleathletes.
The important questions regarding calciumare:1 What is an optimal calcium intake to promoteand support adequate bone density in a femaleathlete?2 How can suboptimal calcium intakes beimproved?
The answer to the first question is currentlyunknown. Differences of opinion regardingoptimal calcium intakes for adults exist amongcountries, agencies and researchers. Even thoughphysical activity has been identified as a positivefactor in promoting greater bone density, no onehas identified either the optimal level of exerciseor calcium intake to support adequate bonedensity in the female athlete. To recommend anappropriate level of calcium intake, one needs torely on a thorough nutritional, exercise andmedical history of the athlete. Answers to ques-tions about the following will provide addedperspective on whether to recommend thedietary guideline for calcium or potentially ahigher level.• Family history of osteoporosis• Typical intake of calcium, fluoride, other bone-related minerals, protein and energy• Training intensity and type of sport
424 special considerations
• Menstrual history and current status• Supplement and/or drug use and any malab-sorption conditions
For the athlete who avoids calcium-rich foodsor is restricting energy intake to lose weight, discussion of low-fat calcium-rich foods, foodchoices not normally recognized as calcium-richor those that are fortified with calcium, e.g.calcium-fortified orange juice, is recommended.Consumption of a mineral water that has a highcalcium content may also be appropriate for apossible source of dietary calcium (Couzy et al.1995).
The second choice would be that for supple-mentation of the female athlete’s diet withcalcium tablets. Determination of the typicalcalcium intake from food will help determine theappropriate level of supplement to recommend.However, supplementation with minerals is not without potential adverse effects. Wood andZheng (1997) report that high dietary calciumintakes during a 36-day study reduced zincabsorption in healthy postmenopausal women.Limitations of the study include that activitylevel was not reported for the subjects and that differences will exist in nutrient absorptionbetween a postmenopausal female and a youngfemale. Cook et al. (1991) reported calcium sup-plements could inhibit the absorption of ferroussulphate when consumed with food, althoughReddy and Cook (1997) found no significantinfluence of calcium intake on non-haem ironabsorption when varying levels of calcium(280–1281 mg· day–1) were consumed as part ofthe diet.
In general, most experts agree that a calcium-rich diet is the most appropriate dietary prescrip-tion to promote and support optimal bonedensity. If this is not possible, consideration forlow to moderate levels of a calcium supplementin addition to the dietary calcium intake to meetoptimal levels is reserved for an alternativeaction.
The relationship between the macromineralsand microminerals warrants more attention asathletes look to supplementation as solutions totheir possible dietary inadequacies. Lukaski(1995) has expressed concern for the adverse

effects of trace mineral supplementation, par-ticularly magnesium, zinc, and copper; whileClarkson and Haymes (1994) recommend a multivitamin/mineral supplement containingno more than the dietary guideline to athleteswhose diets may be less than optimal.
Microminerals: iron
Iron is another mineral worthy of considerationfor supplementation. Deficiency of this mineralhas the distinction of being common in femaleathletes and is frequently reported in physicallyactive populations. In a comparison of 111 adultfemale habitual runners with 65 inactive femalesof comparable age, Pate et al. (1993) found serum ferritin levels, indicative of iron status,28% lower in the runners than controls.However, frank iron deficiency indicated by sub-optimal haemoglobin levels was rare in bothgroups. Dr Eichner provides insight into thereasons for iron depletion and expanded discus-sion of the effect of exercise on this mineral (seeChapter 24).
Challenges in maintaining adequate ironstores in the female athlete include the complex-ity of the mineral’s absorption, lower intakes ofenergy by females, low levels of iron in food,avoidance of meat products, and monthly men-strual losses. More challenge is added to under-standing this issue when one needs to decidewhich haematological assessment to use for ironstatus determination. Lack of standardization ofthe blood parameters and values used to classifythe stages of iron depletion lends to the variabil-ity reported for the incidence of iron depletion inathletic populations.
However, most agree that iron supplementsare appropriately given to those athletes who are diagnosed with iron deficiency anaemia(Haymes 1987). This is related to reports by someresearchers that aerobic capacity in female athletes with mild anaemia can be improvedwith iron supplementation (Fogelholm 1995).
Supplement use by athletes
Sobal and Marquart (1994) reviewed 51 studies
in which 10 274 athletes were investigatedregarding the prevalence, patterns and expla-nations for their vitamin/mineral supplementuse. Mean percentage of supplement use amongfemale athletes was 57% (33 study groups).Several reasons were noted by the athletes fortheir supplement use: performance enhance-ment, prevention of illness, substitute for inade-quate diet, provision of additional energy, andthe meeting of specific nutrient demands forexercise. It was also noted that vitamin andmineral supplements were more frequently usedby female athletes consuming low energy diets.Small sample sizes (< 50 athletes) of most of thereviewed studies (56%) and the minor focus onsupplements in the studies limits our under-standing of supplement use by athletes. Theauthors recommended that those who studydietary intake of athletes consider vitamin/mineral supplement use as an important part of their study designs and sport nutritionistsinclude a vitamin/mineral supplement historyas part of their dietary assessment.
If the female athlete consumes adequateamounts of a variety of foods, she does notrequire vitamin/mineral supplementation to herfood intake. However, for those athletes whoconsistently restrict energy intake, a one-a-daymultiple vitamin/mineral supplement canprovide some insurance in meeting nutrientneeds for overall good health and exercise.
Fluid intake and recommendations
Due to the wide variation in individual fluidlosses during exercise, it is not reasonable to dif-ferentiate hydration recommendations for thefemale athlete. In spite of the physical, phy-siological and hormonal differences betweenmales and females, individual variations in fluid balance surpass any gender differences (R.J.Maughan, personal communication).
Conclusion
Dietary guidelines based on data from sedentaryor male populations pose challenges, as well asopportunities, for the sports nutritionist and
the female athlete 425
researcher who are interested in the nutritionalneeds of the female athlete. Since macronutrientdietary guidelines for athletes have been based on male subjects and micronutrient needsderived from non-athletic populations, theresearcher has the opportunity to explore theseneeds of the female athlete, while faced with the challenge of understanding and controllingfor the hormonal influences on metabolism. Thesports nutritionist is presented with opportuni-ties to systematically collect food intakes andsupplementation information from female ath-letes, yet challenged with the lack of dietaryguidelines specifically designed for the femaleathlete.
Presently, information obtained from a thor-ough diet, supplement and health history, 3–5-day food record, and training schedule; esti-mation of energy expenditure during exercise;plus anthropometric and biochemical data canprovide a good basis for providing appropriatenutritional advice. Observation of the femaleathlete while training and competing, as well asduring meal times, can also help to understandbetter the energy and nutrient requirements ofthe individual.
References
Arciero, P.J., Goran, M.I. & Poehlman, E.T. (1993)Resting metabolic rate is lower in women than inmen. Journal of Applied Physiology 75, 2514–2520.
Barr, S.I., Janelle, K.C. & Prior, J.C. (1995) Energyintakes are higher during the luteal phase of ovula-tory menstrual cycles. American Journal of ClinicalNutrition 61, 39–43.
Calloway, D.H. & Kurzer, M.S. (1982) Menstrual cycleand protein requirements of women. Journal of Nutrition 112, 356–366.
Carpenter, W.H., Poehlman, E.T., O’Connell, M. &Goran, M.I. (1995) Influence of body compositionand resting metabolic rate on variation in totalenergy expenditure: a meta-analysis. AmericanJournal of Clinical Nutrition 61, 4–10.
Chen, J.D., Wang, J.F., Li, K.J. et al. (1989) Nutritionalproblems and measures in elite and amateurathletes. American Journal of Clinical Nutrition 49,1084–1089.
Clark, N. (1990) Sport Nutrition Guide: Eating to FuelYour Lifestyle. Leisure Press, Champaign, IL.
426 special considerations
Clarkson, P.M. & Haymes, E.M. (1994) Trace mineralrequirements for athletes. International Journal ofSport Nutrition 4, 104–119.
Committee on Diet and Health, National ResearchCouncil (1989) Diet and Health: Implications for Reduc-ing Chronic Disease Risk. National Academy Press,Washington, DC.
Cook, J.D., Dassenko, S.A. & Whittaker, P. (1991)Calcium supplementation: effect on iron absorp-tion. American Journal of Clinical Nutrition 53, 106–111.
Costill, D.L., Sherman, W.M., Fink, W.J., Maresh, C.,Witten, M. & Miller, J.M. (1981) The role of dietarycarbohydrates in muscle glycogen resynthesis afterstrenuous running. American Journal of Clinical Nutri-tion 34, 1831–1836.
Couzy, F., Kastenmayer, P., Vigo, M., Clough, J.,Munoz-Box, R. & Barclay, D.V. (1995) Calciumbioavailability from a calcium- and sulfate-richmineral water, compared with milk, in young adultwomen. American Journal of Clinical Nutrition 62,1239–1244.
Department of Health (1991) Dietary Reference Values forFood Energy and Nutrients for the United Kingdom.HMSO, London.
Dook, J.E., James, C., Henderson, N.K. & Price, R.I.(1997) Exercise and bone mineral density in maturefemale athletes. Medicine and Science in Sports andExercise 29, 291–296.
Fogelholm, M. (1995) Indicators of vitamin and mineralstatus in athletes’ blood: a review. InternationalJournal of Sport Nutrition 5, 267–284.
Gabel, K., Aldous, A. & Edgington, C. (1995) Dietaryintake of two elite male cyclists during 10-day, 2,050-mile ride. International Journal of Sport Nutrition 5,56–61.
Halliwell, B. (1994) Free radicals, antioxidants, andhuman disease: curiosity, cause, or consequence?Lancet 334, 721–724.
Haymes, E.M. (1987) Nutritional concerns: need foriron. Medicine and Science in Sports and Exercise 19,S197–S200.
Health and Welfare Canada (1983) Recommended Nutri-ent Intakes for Canadians. Bureau of Nutritional Sciences, Health Protection Branch, Health andWelfare, Ottawa.
Huang, Y.-C., Chen, W., Evans, M.A., Mitchell, M.E. &Shultz, T.D. (1998) Vitamin B-6 requirement andstatus assessment of young women fed a high-protein diet with various levels of vitamin B-6.American Journal of Clinical Nutrition 67, 208–220.
Jacob, R.A. & Burri, B.J. (1996) Oxidative damage anddefense. American Journal of Clinical Nutrition 63,985S–990S.
James, W.P.T., Ferro-Luzzi, A., Isaksson, B. & Szostak,W.B. (1988) Healthy Nutrition: Preventing Nutrition-

Related Diseases in Europe. WHO Regular Publication,European Series, no. 24, WHO, Copenhagen.
Johnston, C.C., Miller, J.Z., Slemenda, C.W. et al. (1992)Calcium supplementation and increases in bonemineral density in children. New England Journal ofMedicine 327, 82–87.
Kravitz, L., Robergs, R.A., Heyward, V.H., Wagner,D.R. & Powers, K. (1997) Exercise mode and gendercomparisons of energy expenditure at self-selectedintensities. Medicine and Science in Sports and Exercise29, 1028–1035.
Lamon-Fava, S., Fisher, E.C., Nelson, M.E., Evans, W.J.,Millar, J.S., Ordovas, J.M. & Schaefer, E.J. (1989)Effect of exercise and menstrual cycle status onplasma lipids, low density lipoprotein particle size,and apolipoproteins. Journal of Clinical Endocrinologyand Metabolism 68, 17–21.
Leaf, D.A., Kleinman, M.T., Hamilton, M. & Barstow,T.J. (1997) The effect of exercise intensity on lipid per-oxidation. Medicine and Science in Sports and Exercise29, 1036–1039.
Lemon, P.W.R. (1995) Do athletes need more dietaryprotein and amino acids? International Journal of SportNutrition 5, S39–S61.
Loucks, A.B. (1987) Skeletal demineralisation in theamenorrheic athlete. In Exercise: Benefits, Limits and Adaptations (ed. D. Macleod, R. Maughan, M.Nimmo, T. Reilly & C. Williams), pp. 255–269. E. &F.M. Spon, London.
Lukaski, H.C. (1995) Micronutrients (magnesium, zinc,and copper): are mineral supplements needed forathletes? International Journal of Sport Nutrition 5,S74–S83.
Manore, M.M. (1994) Vitamin B6 and exercise. Interna-tional Journal of Sport Nutrition 4, 89–103.
Matkovic, V. (1991) Calcium metabolism, and calciumrequirements during skeletal modeling and consoli-dation of bone mass. American Journal of ClinicalNutrition 54, 245S–260S.
Maughan, R.J., Harmon, M., Leiper, J.B., Sale, D. &Delman, A. (1986) Endurance capacity of untrainedmales and females in isometric and dynamic muscu-lar contractions. European Journal of Applied Physiol-ogy 55, 395–400.
Meredith, C.N., Zackin, M.J., Frontera, W.R. & Evans,W.J. (1989) Dietary protein requirements and bodyprotein metabolism in endurance-trained men.Journal of Applied Physiology 66, 2850–2856.
Miller, A.E.J., MacDougall, J.D., Tarnopolsky, M.A. &Sale, D.G. (1993) Gender differences in strength andmuscle fiber characteristics. European Journal ofApplied Physiology 66, 254–262.
National Research Council (1989) Recommended DietaryAllowances, 10th edn. National Academy of Science,Washington, DC.
Pannemans, D.L.E., Wagenmakers, A.J.M., Westerterp,
K.R., Schaafsma, G. & Halliday, D. (1997) The effectof an increase of protein intake on whole-bodyprotein turnover in elderly women is tracer depen-dent. Journal of Nutrition 127, 1788–1794.
Pate, R.R., Miller, B.J., Davis, J.M., Slentz, C.A. & Kling-shirn, L.A. (1993) Iron status of female runners. Inter-national Journal of Sport Nutrition 3, 222–231.
Perry, A.C., Crane, L.S., Applegate, B., Marquez-Sterling, S., Signorile, J.F. & Miller, P.C. (1996) Nutri-ent intake and psychological and physiologicalassessment in eumenorrheic and amenorrheicfemale athletes: a preliminary study. InternationalJournal of Sport Nutrition 6, 3–13.
Peters, E.M. & Goetzsche, J.M. (1997) Dietary practicesof South African ultradistance runners. InternationalJournal of Sport Nutrition 7, 90–103.
Phillips, S.M., Atkinson, S.A., Tarnopolsky, M.A. &MacDougall, J.D. (1993) Gender differences inleucine kinetics and nitrogen balance in enduranceathletes. Journal of Applied Physiology 75, 2134–2141.
Piers, L.S., Diffey, B., Soares, M.J., Frandsen, S.L.,McCormack, L.M., Lutschini, M.J. & O’Dea, K. (1997)The validity of predicting the basal metabolic rate ofyoung Australian men and women. European Journalof Clinical Nutrition 51, 333–337.
Recker, R.R., Davies, K.M., Hinders, S.M., Heaney, R.P.,Stegman, M.R. & Kimmel, D.B. (1992) Bone gain inyoung adult women. Journal of the American MedicalAssociation 268, 2403–2408.
Reddy, M.B. & Cook, J.D. (1997) Effect of calcium intakeon nonheme-iron absorption from a complete diet.American Journal of Clinical Nutrition 65, 1820–1825.
Sherman, W.M. & Leenders, N. (1995) Fat loading: thenext magic bullet? International Journal of Sport Nutri-tion 5, S1–S12.
Simonsen, J.C., Sherman, W.M., Lamb, D.R., Dernbach,A.R., Doyle, J.A. & Strauss, R. (1991) Dietary carbo-hydrate, muscle glycogen, and power output duringrowing training. Journal of Applied Physiology 70,1500–1505.
Sobal, J. & Marquart, L.F. (1994) Vitamin/mineral sup-plement use among athletes: a review of the litera-ture. International Journal of Sport Nutrition 4, 320–334.
Steen, S.N., Mayer, K., Brownell, K.D. & Wadden, T.A.(1995) Dietary intake of female collegiate heavy-weight rowers. International Journal of Sport Nutrition5, 225–231.
Sumida, S., Tanaka, K., Kitao, H. & Nakadomo, F. (1989)Exercise-induced lipid peroxidation and leakage ofenzymes, before and after vitamin E supplementa-tion. International Journal of Biochemistry 21, 835–838.
Sundgot-Borgen, J. (1996) Eating disorders, energyintake, training volume, and menstrual function inhigh-level modern rhythmic gymnasts. InternationalJournal of Sport Nutrition 6, 100–109.
the female athlete 427

Tarnopolsky, L.J., MacDougall, J.D., Atkinson, S.A.,Tarnopolsky, M.A. & Sutton, J.R. (1990) Gender dif-ferences in substrate for endurance exercise. Journalof Applied Physiology 68, 302–308.
Tarnopolsky, M.A., MacDougall, J.D. & Atkinson, S.A.(1988) Influence of protein intake and training statuson nitrogen balance and lean body mass. Journal ofApplied Physiology 64, 187–193.
van der Beek, E.J. (1991) Vitamin supplementation andphysical exercise performance. Journal of SportsScience 9, 77–89.
Vasankari, T.J., Kujala, U.M., Vasankari, T.M., Vuorimaa, T. & Ahotupa, M. (1997) Increased serumand low-density lipoprotein antioxidant potentialafter antioxidant supplementation in endurance ath-letes. American Journal of Clinical Nutrition 65,1052–1056.
Viguie, C.A., Frei, B., Shigenanga, M.K., Ames, B.N.,Packer, L. & Brooks, G.A. (1990) Oxidant stress in
428 special considerations
human beings during consecutive days of exercise(Abstract). Medicine and Science in Sports and Exercise22, 86S.
Walberg-Rankin, J. (1995) Dietary carbohydrate as anergogenic aid for prolonged and brief competitionsin sport. International Journal of Sport Nutrition 5,S13–S28.
WHO (1985) Energy and Protein Requirements: Report of a Joint FAO/WHO/UNU Expert Consultation. Tech-nical Report Series 724, World Health Organization,Geneva.
Williams, C. (1989) Diet and endurance fitness.American Journal of Clinical Nutrition 49, 1077–1083.
Williams, M. (1995) Nutrition Related to Fitness andSport. Brown and Benchmark, Dubuque, IA.
Wood, R.J. & Zheng, J.J. (1997) High dietary calciumintakes reduce zinc absorption and balance inhumans. American Journal of Clinical Nutrition 65,1803–1809.

Introduction
Unlike most adults, children naturally engage inspontaneous, vigorous physical activity. It is postulated that this phenomenon representsmore than mere play; rather, it is an essential bio-logical process that likely plays a key role in thechild’s growth and development (Cooper 1995).Adequate food intake is essential for a growingchild, perhaps more so for one engaged in physi-cal training for several hours a day. Research intothe nutritional needs of the young athlete there-fore needs to be addressed in the wider context ofnot just the effects diet may have on perfor-mance, but also the interactions between nutri-tional intake, exercise and physiological growth.In the past, there was a preoccupation withmeeting a child’s nutrient needs, but, there isnow a significant shift in thinking to address con-cerns with regard to nutritional behaviourduring childhood and its impact on health out-comes in later life (Lucas 1997).
Although the nutritional requirements andnutritional habits of top-level adult sport per-formers have been extensively researched (Burke& Deakin 1994), there is little information withregard to the young athlete. This limitation is notjust in the area of youth sport; our knowledge of the dietary requirements of normal healthychildren is also still very limited. As is the case forthe nutritional needs of the young athlete, recom-mendations for a child’s nutritional intake arebased mainly on adult requirements. The nutri-tional preparation of the elite young athlete,
however, raises special problems for the nutri-tionist and dietician. These physically giftedyoungsters are often highly motivated, andundergo prolonged strenuous exercise in train-ing on a daily basis. This period of exercise stressoften coincides with a period of rapid growth, sothere are some real difficulties in making simpleextrapolations from adult data.
Organized sport for youth is characterizedtoday by increasing rates of participation, atever-decreasing initial ages. In Western societies,youngsters (particularly girls) in their early teensare likely to have undergone intensive train-ing and high-level international competition forseveral years and this highlights the ‘catch themyoung’ philosophy (Rowley 1987). There is awidely held, although unsubstantiated, beliefthat in order to achieve performance success atsenior level, training and competition shouldbegin before puberty.
As already outlined, the issue of adequatenutrition with regard to sports performancemust be viewed in light of the physiologi-cal changes occurring during childhood whichrequire increased amounts of energy for growth(Tanner 1989). The challenge for those workingwith young athletes is to integrate sports nutri-tion into the child’s training regimen and toensure that the nutritional needs for growth anddevelopment are met (Nelson Steen 1996). Aswell as being highly motivated, young athletesare often easily impressed by their heroes andwill seek to emulate not only their training programmes but also their dietary habits. This
Chapter 32
The Young Athlete
VISWANATH B. UNNITHAN AND ADAM D.G. BAXTER-JONES
429
can lead to extreme behaviour. A recent study ofAmerican adolescent athletes found that over athird were taking vitamin/mineral supplementsand that over two thirds believed that such supplementation was improving their athleticperformance (Sobal & Marquart 1994). This isdespite the consensus in the nutrition litera-ture that supplements do not help performance(Haymes 1991). Such findings suggest that im-proved education and dietary counselling arenecessary to clarify such issues.
The first part of this review discusses the inter-actions between nutrition and a child’s normalgrowth and the effects that training may have ongrowth. The second part concentrates on nutri-tional requirements for performance.
Nutritional requirements of thegrowing child
From birth to approximately 10 years of age, chil-dren are highly dependent on their elders fortheir nutritional requirements and dietary habits.Studies of the nutritional requirements for thisage group have been relatively neglected, apartfrom infant nutrition. Healthy boys and girls are expected to gain around 30cm in height and12kg in weight between 5 and 10 years of age(Tanner 1989). Whilst percentage body fatremains fairly constant in boys during thisperiod, it usually increases slowly in girls(Forbes 1987). At this age there is a consider-able need for energy and essential nutrients forgrowth. In girls, sexual maturation beginsaround 8 years of age and this also affects nutri-tional requirements. For most essential nutrients,requirements for schoolchildren have been esti-mated by interpolating between infant and adultdata, which raises concerns with regard to thevalidity of these estimated requirements.
The next stage of childhood growth is adolescence (10–19 years). Adolescence includespuberty, which consists of characteristic devel-opment of biological age, which differs in boysand girls, and leads to ‘final’ adult height, shape,body composition, and physical and sexual function. This hormonally driven development
430 special considerations
involves a linear growth spurt which commencesabout 2 years earlier in girls (around 12 years ofage) than boys, acceleration of growth of musclein boys and adipose tissue in girls, the emergenceof secondary sexual characteristics and finally, ingirls, menarche, or the onset of periods (Tanner1989). Once menarche is attained, girls lose blood(on average 44 ml) approximately every 4 weeks.This loss of blood is equivalent to a loss of 12.5mmol iron ·day–1. However, there is widevariation in blood loss among girls, with the 95thcentile estimated at 118 ml ·period–1, or 34mmoliron · day–1 (Hallberg et al. 1966). Consequently,the iron requirement for postmenarcheal girls ishigher than for boys, and much higher than theprepubertal requirement.
In boys, the linear growth spurt is greater thanin girls and is accompanied by acceleratedmuscle growth. Boys’ nutritional requirementstherefore rapidly diverge from those of girls.During this time, bone density increases quicklyby the incorporation of calcium and phosphate.It is estimated that 25% of peak bone mass isacquired during adolescence. Studies haveshown positive effects of increasing the intake ofdairy products on bone-density development(Lee et al. 1996). Although there is clear evidencethat calcium intake during growth influencesbone mineral density (Barr 1995), debate stillexists as to the levels of calcium intake required.It also appears that physical activity is at least asimportant an influence on the increase in bonedensity in adolescence (Welten et al. 1994).
Adolescent dieting behaviour
Adolescence is the peak period for dietarychange, from self-imposed dietary restraint toveganism and beyond. In girls, dieting to reduceweight, whether needed or not, is common, par-ticularly in some sporting events. While adoles-cent boys tend to exercise as much or more thanpreviously and eat as dictated by appetite, girlstoday tend to eat towards a thin body ideal, andexercise less than previously.
The complex and ill-understood illnesses,anorexia nervosa and bulimia nervosa, almost

always commence with ‘simple’ dieting. In acomprehensive review of eating disorders inyoung athletes, Wilmore (1995) concluded thatathletes are at an increased risk of eating disorders, particularly female athletes inendurance sports or appearance sports. Dietingis also likely to contribute to suboptimal peakbone mass in early adulthood and early osteo-porosis in the long term (Bailey et al. 1996).Dieting and vegetarian diets nearly always con-tribute to iron deficiency. Iron deficiency is amajor problem in adolescence, occurring in boysas well as girls (Kurz 1996). This is likely to con-tribute to reduced physical activity and hencereduced peak bone mass, reduced immunityand, though not proven, reduced cognitive function.
Although, in contrast to their non-athleticpeers, adolescent athletes are concerned withregard to their nutrition, studies have shown thattheir dietary intake may be less than adequate(Perron & Endres 1985; Lindholm et al. 1995).Martinez et al. (1993) found in a group of malehigh school American football players that themajority consumed inadequate food energy, ironand calcium, when compared to recommendeddietary allowances (RDA), and consumed toomuch salt. However, as no measures of body
mass were recorded, it was not possible to deter-mine whether this shortfall in RDAs resulted inprogressive weight loss. What is suggested isthat these male athletes did not have any better or worse dietary habits than other maleteenagers (Martinez et al. 1993). Studies of adolescent female athletes have also found thatenergy intakes are significantly lower than esti-mated energy needs (Perron & Endres 1985;Lindholm et al. 1995). A Swedish study comparedthe nutritional intake of 22 elite female gymnasts(age range, 13.5–16.6 years) and 22 healthy girls(age range, 14.1–15.9 years). This study foundthat both groups had energy intakes below theirestimated energy needs, but this did not seem to influence their health status (Lindholm et al.1995). One criticism of this type of study relatesto the interpretation of recommended RDAs.How valid are RDAs for children? Can standardrecommendations for a child of average weightat a given chronological age be used for com-parison with an elite young gymnast, especiallygiven the fact that elite gymnasts are known to besmall for their chronological age, due in part totheir late sexual development (Baxter-Jones &Helms 1996)? It is therefore suggested that agymnast’s recommended RDA would be lowerthan the average child’s.
the young athlete 431
Fig. 32.1 Adolescents excel insome sports: gymnastics,especially women’s gymnastics,has traditionally been dominatedby young performers. Smallstature and low body fat contentare also characteristic of eliteperformers. Photo © Allsport.

Influence of exercise and diet on a child’s growth and development
Some authors (Martinez et al. 1993; Lindholm etal. 1995) suggest that, in the long term, if chil-dren’s energy intake is insufficient in relation totheir energy needs, this could affect their growthand sexual development. It is well recognizedthat young female gymnasts are shorter andlighter than sedentary girls of the same age: theyalso show signs of late maturation, as evidencedby late menarche (Baxter-Jones et al. 1994; Lind-holm et al. 1994; Malina 1994). Hence, althoughthere is clear evidence of an effect of intensivetraining on the hormones of the hypothalamic–pituitary axis, it is not clear whether this effectaccounts for what appears to be a loss of growthpotential in some elite young athletes (Theintz et al. 1993). What is known is that malnutritiondelays growth. Children subjected to episodes ofacute starvation recover more or less completely,provided the adverse conditions are not toosevere and do not last too long, and will reachtheir predicted adult height. Chronic malnutri-tion, on the other hand, causes individuals togrow to be smaller adults than they should(Tanner 1989), but there is no evidence to suggestthat young athletes are malnourished.
432 special considerations
The elite young athlete
It has been demonstrated that, althoughrestricted energy intake can delay maturationand sexual development, the late developmentwhich is observed in some sports is more relatedto inherited characteristics than to the effects of intensive training and/or nutritional inad-equacy. Several studies have compared the phys-ical characteristics of elite junior performers indifferent sports with those of non-elite competi-tors and non-athletic children (McMiken 1975;Buckler & Brodie 1977; Bloomfield et al. 1990).Data from a longitudinal study of young femaleBritish athletes indicated differences in staturebetween three sporting groups and UK growthstandards (Fig. 32.2). At all ages, swimmers andtennis players were above average height onBritish growth standard charts (Tanner 1989). Incontrast, gymnasts were below average height,particularly from 12 to 16 years of age. How-ever, at 17 years of age, the gymnasts’ height wasagain similar to the average height seen on thestandard charts, indicating that what was beingobserved was a late attainment of the adolescentgrowth spurt. The parents of these gymnastswere also of less than average height (Baxter-Jones 1995), in accord with other data (Theintz
175
170
165
160
155
150
145
140
135
130
125
120
1158 9 10 11 12 13 14 15 16 17 18 19 20
97th
50th
3rd
Age (years)
Stat
ure
(cm
)
Fig. 32.2 Development of staturein British female athletescompared with standard growthpercentiles (dotted lines). Meansand standard errors are shown at each age. Standard growth dataare taken from height percentilesof British children (Tanner 1989).�, swimming; �, tennis; �,gymnastics. From Baxter-Jonesand Helms (1996), withpermission (based on data fromTanner 1989).

et al. 1989), suggesting that the short stature ofthe elite gymnast is determined largely bygenetic rather than training and nutritionalfactors. Although Theintz et al. (1989) found noevidence that the predicted adult height for agroup of elite young female gymnasts, who hadalready been training intensively for a period of 5years, was less than the target height, their subse-quent work suggested otherwise (Theintz et al.1993). However, for this question to be resolved,both groups of athletes (Theintz et al. 1993;Baxter-Jones 1995) need to be reassessed to ascer-tain their actual adult height.
The biological maturity status of athletes hasalso been studied extensively, especially age atmenarche (Malina 1994; Beunen & Malina 1996).When considering the influence of nutrition on the biological development of the elite youngathlete, it is important to remember that thisanalysis is beset with a number of difficulties.Firstly, the definition of what constitutes an eliteyoung athlete is vague, and secondly, as alreadydiscussed, it is likely that young athletes self-selected themselves for their sport due to theirappropriate size and physique (Baxter-Jones &Helms 1996). A girl’s menarcheal age is closelyrelated to her mother’s menarcheal age and thisappears to be due mainly to a genetic influenceon hormonal changes (Tanner 1989). Potentialenvironmental influences include physical activ-ity and nutrition (Malina 1983). In abnormal cir-cumstances, nutrition may play an importantrole in the attainment of menarche, although thisclearly relates to the malnourished child. It hasbeen hypothesized that young athletes undertak-ing intensive training have delayed menarchedue to the effects of training at an early age. In theBritish longitudinal study (Baxter-Jones & Helms1996), all the sports (gymnastics, swimming andtennis) had later mean ages of menarche (14.3,13.3 and 13.2 years, respectively) than the previ-ously reported UK reference value of 13.0 years(Fig. 32.3). A positive correlation was foundbetween menarcheal age in mothers and daugh-ters (n =201, r= 0.27, P <0.01; Baxter-Jones et al.1994). Analysis of covariance, using maternalmenarcheal age, socio-economic group, duration
of training and type of sport confirmed thatmaternal menarcheal age and type of sport havea significant influence on the subject’s age ofmenarche. As maternal menarcheal age andsport were the best predictors of menarcheal agein the athletes studied, it would appear thatmenarche was intrinsically late rather thandelayed (Baxter-Jones et al. 1994); this suggeststhat some form of sport-specific selection hadoccurred.
Nutrition and performance
The remainder of this review will be limited tonutritional factors that could affect performancein the young athlete. Performance will be delim-ited to three major sporting areas: strength andflexibility-based sports (gymnastics), endurancesports (running/cycling) and high-intensityintermittent sports (soccer, rugby, basketball).
Carbohydrate and fat
The major substrates used by the muscles during
the young athlete 433
15
12
14
13
Gymnastics
Age
of m
enar
che
(yea
rs)
Swimming
UKmedianage
Tennis
Fig. 32.3 Mean age of menarche and associatedstandard errors for British mothers (�) and daughterathletes ( ) in different sports, with reference to theUK median age (Tanner 1989). Significant differenceswere found between mothers’ and daughters’ age ofmenarche in gymnastics and tennis (P < 0.05). FromBaxter-Jones et al. (1994), with permission of Taylor &Francis.

exercise are carbohydrate derived from muscleglycogen or blood glucose from hepatic glycogenstores, and fatty acids which may come from theadipose triglyceride via plasma free fatty acids(FFA) or from the intramuscular triglyceridestores. The relative contributions of these fuelsduring exercise is intensity dependent, with the contribution of carbohydrate increasing asexercise intensity increases. As documented byRowland (1985), effective aerobic training for thechild athlete requires a relatively high volume ofexercise at high intensity, thus placing largedemands on the body’s limited carbohydratestores (Coyle 1992).
In order to appreciate the nutritional conse-quences of carbohydrate and fat manipulation in the diet of the young athlete, it is necessary to understand the underpinning physiologicalbases of the child athlete. Erikksson et al. (1973),Keul (1982) and Kindermann et al. (1978) have alldemonstrated lower levels of muscle phospho-fructokinase activity and a reduced glycolyticpotential in children aged 11–13 years than inadults. Conversely, Haralambie (1979) demon-strated higher tricarboxylic-acid cycle enzymeactivity and increased lactate dehydrogenaseactivity in 11–14-year-old girls than in adultwomen and men.
Children performing prolonged exercise indi-cate a preference for fat rather than carbohydratemetabolism (Bar-Or & Unnithan 1994). Berg et al.(1980) and Macek and Vavra (1981) demon-strated significant increases in glycerol levels inblood with prolonged (30–120 min) activity inchildren. In addition, Martinez and Haymes(1992) concluded that prepubertal girls reliedmore on fat than on carbohydrate utilizationduring exercise of moderate to heavy intensity.Not only have higher glycerol (0.425 vs. 0.407mmol · l–1) and FFA levels (1.97 vs. 1.82mmol · l–1)been noted in young children (10–12 years) vs.adolescents (15–17 years) during exercise, but theincrease in glycerol (five times resting values)occurred at an earlier time than seen in adults(Berg et al. 1980). FFA uptake expressed perminute per litre of O2 uptake has been found tobe greater in children than in adults during pro-
434 special considerations
longed submaximal exercise. It is theorized that a large immediate increase in noradrenaline and a greater utilization of FFA is used by chil-dren to offset hypoglycaemia during prolongedexercise at the same relative exercise intensity(Delamarche et al. 1992). A confounding factor inthe interpretation of the above observations isthe fact that it is assumed that a true maximaloxygen uptake has been achieved by the individ-uals under investigation. However, it has beenshown that only a minority of children and ado-lescents attain a true maximal oxygen uptake(Armstrong & Welsman 1994).
Respiratory exchange ratio (RER) data alsosuggest a preference for fat utilization in chil-dren. Asano and Hirakoba (1984), Macek andVavra (1981) and Martinez and Haymes (1992)demonstrated lower RER values for childrenthan for adults during prolonged exercise.Again, interpretation of these results is con-founded by the fact that a failure to achieve a truemaximal oxygen uptake will result in over-estimated submaximal work loads in children.Therefore, comparisons between children’s andadults’ data may not be appropriate. Macek andVavra (1981) demonstrated significant reduc-tions in RER over 60min of submaximal exercise,in conjunction with increases in glycerol levels inblood. Magnetic resonance spectroscopy workby Zanconato et al. (1993) also demonstrated thatchildren were less able than adults to effectadenosine triphosphate rephosphorylation byanaerobic metabolic pathways during high-intensity exercise. In conclusion, muscle enzyme,RER and magnetic resonance spectroscopy datasuggest that children, as compared with adults,seem better suited for aerobic than anaerobicenergy metabolism (Bar-Or & Unnithan 1994).
While it is acknowledged that children mayuse fat rather than carbohydrate as the major fuelduring exercise, the ability to sustain this exerciseover a number of months and in high-intensityexercise bouts would still depend upon adequate carbohydrate stores being present.Hence, appropriate knowledge and guidanceregarding carbohydrate intake are critical. Loosliand Benson (1990) showed that in the absence of

directed eating from the child’s parent orguardian, inherent nutritional knowledge withrespect to carbohydrate was poor. In a survey of97 competitive female gymnasts (11–17 years),77% rated protein as their favourite energysource; 53% were unaware of what a complexcarbohydrate was and 36% chose nutrient-poorfoods such as doughnuts and soft drinks as theirfavourite energy food (Loosli & Benson 1990).
Whilst the lower levels of glycolytic andhigher levels of citrate-cycle enzyme activity ofthe child would imply that increased dietary fatwould produce the best responses during pro-longed exercise, it is clear that certain reserva-tions apply to this procedure. Firstly, it would bemedically unsound, as the risk of developingcoronary heart disease, stroke and certain can-cers has been associated with eating a chronichigh fat diet; and secondly, following the hypoth-esis of central fatigue, increased FFA levels maypromote fatigue by enhancing free tryptophanlevels, leading to raised levels of serotonin in thebrain (Davis et al. 1992). However, it has alsobeen shown that increased FFA in the presence ofheprin increases endurance (see Chapter 13).Serotonin (5-hydroxytrytamine or 5-HT) isresponsible for causing a state of tiredness inboth man and experimental animals (Young1991). Hence, an elevation of serotonin may exacerbate the sensation of fatigue.
Protein intake
There is no evidence that protein metabolismdiffers between adults and children (Lemon1992). Hence, the increased need for proteinintake by active adolescents is purely the productof the extra demand imposed by exercise andgrowth, and not the result of any inadequacies of the child’s metabolism of protein. The RDAvalues for the adult population vary widelybetween countries (0.8–1.2g · kg–1 ·day–1): whereseparate values are established for adolescents,they are generally in the region of 1 g ·kg–1 · day–1
(Lemon 1992). Bar-Or and Unnithan (1994)suggest an increase, in non-athletic children,from the adult value of 0.8 g · kg–1 · day–1 to 1.2g ·
kg–1 ·day–1 for boys and girls between 7 and 10years, and a value of 1.0g · kg–1 · day–1 for 11–14years. These figures are based upon tables gen-erated by the American Academy of Paediatrics(1991): after this age, recommendations are inline with adult figures.
O’Connor (1994) demonstrated that youngpeople (age range, 7–19 years) achieve a meandietary intake of 1.6g · kg–1 · day–1, even in thosesports where energy intake is restricted (e.g.gymnastics). In contrast, Martinez et al. (1993),assessing the diet of adolescent American foot-ballers, via the use of dietary recall, found that in87 subjects 95% consumed less than the RDA(16.8 MJ ·day–1 or 4000kcal · day–1) (Pipes 1989)for the adolescent male athlete. These results par-allel the findings for adolescents not engaged insports training and therefore it would appearthat those engaged in sports do not practice anybetter nutritional habits than those who are not.Concern was noted with regard to protein intake:the mean protein intake was almost twice theRDA and accounted for 16% of total energy con-sumed (Martinez et al. 1993). Even taking intoaccount the validity of the RDAs, the resultantexcess protein in the blood could be harmful toliver function. Although, the sports practitioner(coach) and parent should be made aware of apossible increased protein requirement duringperiods of rapid growth and intensive train-ing, protein supplementation, as seen in adults,should also be discouraged. Finally, it still has tobe ascertained whether protein requirementsdiffer depending upon the sport selected and thelevel of competition undertaken.
Fluid intake and composition
In order to understand the significance of fluidintake and drink composition for the childathlete, it is necessary to review briefly theunderpinning thermoregulatory physiology ofthe child compared to that of the adult.
Primarily as a result of their greater surfacearea to body mass ratio, children and adolescentsabsorb heat quicker at high ambient tempera-tures and lose heat faster at low ambient tem-
the young athlete 435

peratures during activities such as walking andrunning (MacDougall et al. 1983). In an attemptto control for differences in stature betweenadults and children, sweating rate is normalizedto body surface area, but, even after this adjust-ment, children demonstrate a lower sweatingrate than adults (Bar-Or 1980; Falk et al. 1992).This decrease exists in spite of the fact that chil-dren have a greater number of heat-activatedsweat glands per unit skin area (Falk et al. 1992).The sweating threshold is considerably higher inchildren than in adults (Araki et al. 1979). Meyeret al. (1992) demonstrated that adults have el-evated sodium (Na) and chloride (Cl) concentra-tions in sweat. It has also been shown that bodycore temperature increases at a higher rate forany given level of hypohydration in childrenthan in adults (Bar-Or et al. 1980). Despite themultitude of differences in the physiologicalresponses of the child, the critical question iswhether these characteristics will limit perfor-mance in children. There is no definite answer,but it is clear that in a hot environment, childrenare at a disadvantage compared with adults. Inadult studies, it has been found that there is aclear effect of temperature on exercise capacitywhich appears to follow an inverted-U relation-ship. Galloway and Maughan (1997) foundunder their study conditions that exercise dura-tion was longest at 11°C: below this temperature(at 4°C) and above this temperature (at 21°and 31°C), a reduction in exercise capacity wasobserved.
Bar-Or et al. (1992) identified that children, likeadults, do not drink enough when offered fluidsad libitum during exercise in the heat, a conditionknown as voluntary dehydration. The phy-siological consequences for the child athlete areserious; at any given level of hypohydration,children’s core temperature rises faster than thatof adults, and it is therefore critically importantto reduce voluntary dehydration (Bar-Or et al.1992). The general guidelines that should beissued to children exercising in the heat are todrink until the child does not feel thirsty, andthen to drink an additional half a glass (100–125ml); for adolescents, a full glass extra is recom-
436 special considerations
mended. However, in order to implement theseguidelines for sporting competitions under cli-matic heat stress conditions, competition regula-tions need to be altered for the child athlete.Suggestions include allowing the child to leavethe field of play periodically, or, as in the 1994soccer World Cup, the positioning of drinkingbottles on the perimeter of the field to allow forfluid intake during natural stoppages in play.
In order to encourage the child to take onboard sufficient fluid to offset voluntary dehy-dration, the fluid of choice has to be palatableand should stimulate further thirst. Thirst per-ception is influenced by drink flavour and drinkcomposition. Meyer et al. (1994) demonstrated in prepubertal children, at rest after a maximalaerobic test and for rehydration purposes afterprolonged exercise in the heat, that grapeflavouring was preferred to apple, orange and unflavoured water. Wilk and Bar-Or (1996)attempted to determine which of the two factorsplayed the more important role. Trials wereundertaken using flavoured water and an identi-cally flavoured carbohydrate (6%)–electrolyte(NaCl) drink. It was shown that the flavouredwater (grape) maintained euhydration over a 90-min exercise period under heat stress condi-tions. The carbohydrate–electrolyte drink pro-duced a slight overhydration over the same timeperiod. These studies suggest that voluntarydehydration could be reduced by drinkingflavoured water and prevented by drinking acarbohydrate–electrolyte drink (Fig. 32.4).
The concentration of sodium ions in the extracellular fluid is critical to the rate of replenishment of body fluids. Nose et al. (1988)demonstrated that the ingestion of 0.45 g NaClin capsule form per 100 ml of water enhancedvolume restoration after dehydration relative towater alone. Wilk and Bar-Or (1996) demon-strated that there was a 45% increase in drinkingvolume in favour of the grape flavoured water,and an additional 47% increase in voluntarydrinking on the addition of carbohydrate andNaCl (Fig. 32.5). Their study design did not allowthe partitioning out of the carbohydrate andNaCl effects, but previous studies (Nose et al.

1988; Bar-Or et al. 1992) suggest that most of thebenefit was obtained through the addition ofNaCl. A limitation to these findings is that thepopulation was pre- and early pubertal only;further research is necessary in older childrenand adolescents.
Micronutrients
In recent times there has been much concern over the adequacy of specific micronutrients inthe diets of young athletes. Vitamins, iron and calcium are most commonly considered,
although zinc, sodium, potassium and magne-sium have also received attention (Shephard1982). Supplementation of the diet with vitaminsor minerals is not generally warranted in ath-letes, irrespective of age: additional demand forthese nutrients imposed by training should bemet if the energy intake is sufficient to meet theadditional energy expenditure incurred in train-ing and competition, and if a varied diet is con-sumed. One of the major sources of inadequate(defined as less than the required RDA) micronu-trient intake is the actual methodology used tocollect the information. Dietary recall procedures
the young athlete 437
1.0
0.5
0
–0.5
–1.00 20 45 65 90 110 135 155 180
Time (min)B
od
y w
eig
ht
(%)
* *†* *†
Fig. 32.4 Net body weightchanges throughout chambersessions in unflavoured water(W), flavoured water (FW) andcarbohydrate–electrolyte (CNa) trials. Vertical lines denote SEvalues; tinted areas show exerciseperiods. �, swimming; �, tennis;�, gymnastics; n = 12; *, P < 0.05(CNa–W); †, P < 0.05 (CNa–FW).From Wilk and Bar-Or (1996), withpermission.
0 20 45 65 90 110 135 155 180
Time (min)
*
*†
*
*
*
1500
1200
900
600
300
0
Dri
nk
inta
ke (
g)
Fig. 32.5 Cumulative drink intakethroughout chamber sessions inunflavoured water (W; �),flavoured water (FW; �), andcarbohydrate–electrolyte (CNa;�) trials. Vertical lines denote SEvalues; tinted areas show exerciseperiods. n = 12 subjects. *, P < 0.05(CNa–W); †, P < 0.05 (CNa–FW).From Wilk and Bar-Or (1996), withpermission.

are susceptible to under-reporting of nutritionalinformation and for the absence of selectedmicronutrients from the food tables. Hence, thereported intake may not be true.
Few studies have been published on thevitamin status of young athletes. Those studiesthat are available suggest inadequate vitaminconsumption resulting from diets of excessiveconsumption of confectionery, soft drinks andother low nutrient-density foods (O’Connor1994). This is contrary to the American DieteticAssociation’s (1980) stance that athletes whoconsume adequate amounts of energy do notpresent with vitamin deficiencies and thereforedo not require supplements. It is therefore sug-gested that while indiscriminate use of vitaminsupplements in young athletes should be dis-couraged, their use may be appropriate in ath-letes who restrict their food intake (O’Connor1994).
Iron deficiency in the absence of anaemia is common in adolescent distance runners.However, whether non-anaemic iron deficiencyaffects athletic performance is unclear (Rowland& Kelleher 1989). The effect of iron deficiency isassociated with incorporation of iron intohaemoglobin and other processes requiring ironsuch as enzyme cofactors. However, evidence ofsuch deficiencies is limited; Pate et al. (1979),Rowland et al. (1987) and Rowland and Kelleher(1989) all demonstrated limited evidence ofanaemia in athletic children and adolescents. Inaddition, Nickerson et al. (1989) demonstratedlimited evidence of gastrointestinal bleeding incross-country runners with iron deficiency. It isunlikely that non-anaemic iron deficiency willhave a significant effect upon athletic perfor-mance. Performance may possibly be impairedin females (see Chapter 24) with low ferritinlevels and borderline haemoglobin (12 g · dl–1).If decrements in performance are noted, thenserum ferritin and haemoglobin are worth as-sessing. General guidelines for the child athletewould be to encourage eating poultry, lean redmeat, iron-enriched breakfast cereals and greenvegetables.
Calcium requirements are highest during
438 special considerations
childhood and adolescence, aside from duringpregnancy and lactation. Concern has centred onthose athletic populations whose total food, andhence calcium, intake is likely to be low — forexample, gymnasts and dancers (O’Connor1994). A combination of inadequate calciumintake and amenorrhoea in these athletes hasraised serious concerns because of its associationwith osteoporosis (Bailey et al. 1996). Althoughthe effectiveness of calcium supplementation inchildhood is still unclear (Welten et al. 1994),every effort should be made to educate youngathletes about the importance of adequatedietary calcium.
Nutritional knowledge
As already discussed, one of the major factorsthat influences the nutrition of the young athleteis a sound basis of nutritional knowledge. Workby Richbell (1996) demonstrated in élite juniorswimmers, track and field athletes and soccerplayers that whilst the three groups followed therecommended ratio of 55 : 30 : 15 for carbohy-drate, fat and protein intake, the nutritionalknowledge in all three disciplines was poor. Thistype of pattern was also demonstrated by Perronand Endres (1985), who assessed the dietaryintake of female volleyball players (13–17 years)and showed that no significant correlationexisted between nutritional knowledge and atti-tudes and dietary intake. These findings seemedto indicate that at this age other factors such asweight concerns and dependence on others forfood selection are significant. As previously men-tioned by Loosli and Benson (1990), competitivefemale gymnasts had poor nutritional knowl-edge. Swedish gymnasts have been shown tohave energy intakes insufficient in relation totheir high energy needs; it is suggested that, if leftunchecked, this could affect their pubertal devel-opment and menstrual patterns (Lindholm et al.1995). However, although the gymnasts in thisstudy (Lindholm et al. 1995) had body weights atleast 1SD below the normal weight for Swedishchildren of similar chronological age, they alsohad late sexual development. Therefore, inter-
pretation of the data with normal growth chartsis confounded by the effects of biological age(BA): you would expect individuals with thesame chronological age but lower BA to havelower body weights. The above observations do,however, suggest that young athletes needsupervision of their diet not only as an aid to per-formance but, more importantly, for their generalhealth.
Challenges for future research
1 Longitudinal studies of non-athletic and athletic children are required to elucidate therelationship between nutritional intake, growthand development and intensive training duringchildhood and adolescence. It is recommendedthat a mixed-longitudinal study design is chosenso that information can be collected over ashorter period (Baxter-Jones & Helms 1996).2 Care is advised in the interpretation of data,especially when comparing athletic and non-athletic groups; they must be matched for bothchronological and biological age. When compar-ing submaximal exercise data from adults andchildren, it is essential that the failure of childrento reach a true maximal oxygen uptake be takeninto account.3 Further work is needed to identify the relation-ship between the intensity of exercise and appro-priate dietary intervention. In one of the fewstudies that investigated the role of exerciseintensity, Rankinen et al. (1993) established thatmicronutrient intake of 12–13-year-old Finnishice-hockey players increased with an increase intraining intensity.4 There is a need to understand more about themuscle metabolism of children, possibly throughmagnetic resonance spectroscopy, thereby allow-ing us to understand more fully whether dietarydeficiencies impinge upon the functioning of thecellular functioning of the muscle.5 Optimization of pre- and postcompetition dietis an area that warrants further investigation inthe child athlete.6 Sport specificity (contact vs. non-contact,strength/power vs. endurance) and the level of
competition that the child undertakes may welldetermine the level of protein requirement.Further research is needed in this area.7 The results for dietary intake are usually com-pared with RDA, but the validity of the currentage-related RDAs is questioned. Further work isnecessary to find out if these standards, devel-oped for the average child, are relevant for theyoung athlete of the same age.
References
American Academy of Paediatrics (1991) Nutrition andthe athlete. In Sport Medicine: Health Care for YoungAthletes, pp. 99–109, American Academy of Paediatrics, Evanston, IL.
American Dietetic Association (1980) Nutrition andphysical fitness. Journal of the American Dietetic Association 76, 437–443.
Araki, T., Toda, Y., Matsushita, K. & Tsujino, A. (1979)Age differences in sweating during muscular exer-cise. Japanese Journal of Physical Fitness and SportsMedicine 28, 239–248.
Armstong, N. & Welsman, J.R. (1994) Assessment andinterpretation of aerobic fitness in children and adolescents. Exercise and Sports Sciences Reviews 22,435–476.
Asano, K. & Hirakoba, K. (1984) Respiratory and circu-latory adaptation during prolonged exercise in10–12-year-old children and in adults. In Children andSport (eds J. Ilmarinen & I. Valimaki), pp. 119–28.Springer-Verlag, Berlin.
Bailey, D.A., Faulkner, R.A. & McKay, H.A. (1996)Growth, physical activity, and bone mineral acquisi-tion. Exercise and Sport Sciences Reviews 24, 233–266.
Bar-Or, O. (1980) Climate and the exercising child.International Journal of Sports Medicine 1, 53–65.
Bar-Or, O. & Unnithan, V.B. (1994) Nutritional require-ments of young soccer players. Journal of Sports Sciences 12, S39–42.
Bar-Or, O., Blimkie, C.J.R., Hay, J.A., MacDougall, J.D.,Ward, D.S. & Wilson, W.M. (1992) Voluntary dehy-dration and heat intolerance in patients with cysticfibrosis. Lancet 339, 696–699.
Barr, S.I. (1995) Nutritional factors in bone growth anddevelopment. In New Horizons in Pediatric ExerciseScience (eds C.J.R. Blimkie & O. Bar-Or), pp. 109–20.Human Kinetics, Champaign, IL.
Baxter-Jones, A.D.G. (1995) Physical effects of trainingduring puberty and adolescence. PhD thesis, Universityof Aberdeen, Aberdeen, UK.
Baxter-Jones, A.D.G. & Helms, P.J. (1996) Effects oftraining at a young age: a review of the training of
the young athlete 439

young athletes (TOYA) study. Pediatric ExerciseScience 8, 310–327.
Baxter-Jones, A.D.G., Helms, P., Baines Preece, J. &Preece, M. (1994) Menarche in intensively trainedgymnasts, swimmers and tennis players. Annals ofHuman Biology 21, 407–415.
Berg, A., Keul, J. & Huber, G. (1980) Biochemische aktuveranderungen bei ausdauerbelastungen imkindesund jugendalter. Monatsschrift Kinderheilk 128,590–595.
Beunen, G. & Malina, R.M. (1996) Growth and matura-tion: relevance to athletic performance. In The Childand Adolescent Athlete (ed. O. Bar-Or), pp. 3–24. Black-well Science, Oxford.
Bloomfield, J., Blanksby, B.A. & Ackland, T.R. (1990)Morphological and physiological growth of com-petitive swimmers and non-competitors throughadolescence. Australian Journal of Science and Medicinein Sport 22, 4–12.
Buckler, J.M.H. & Brodie, D.A. (1977) Growth andmaturity characteristics of schoolboy gymnastics.Annals of Human Biology 4, 455–463.
Burke, L.M. & Deakin, V. (1994) Clinical Sports Nutri-tion. McGraw-Hill, Sydney.
Cooper, D.M. (1995) New horizons in pediatric exerciseresearch. In New Horizons in Pediatric Exercise Science(ed. C.J.R Blimkie & O. Bar-Or), pp. 1–24. HumanKinetics, Champaign, IL.
Coyle, E.F. (1992) Timing and method of increasing car-bohydrate intake to cope with heavy training, com-petition and recovery. Journal of Sports Sciences 9(Special Issue), 29–52.
Davis, J.M., Bailey, S.P., Galiano, F.J., Deacon, W.S.,Merril, T.L., Bynoe, R.P. & Pettigrew, C. (1992)Increased free fatty acid and glucose availability andfatigue during prolonged exercise in man. Medicineand Science in Sports and Exercise 24 (Supplement),S71.
Delamarche, P., Monnier, M., Gratas-Delamarche, A.,Koubi, H.E., Mayet, M.H. & Favier, R. (1992) Glucoseand free fatty acid utilisation during prolonged exer-cise in pre-pubertal boys in relation to catecholamineresponses. European Journal of Applied Physiology 65,66–72.
Erikkson, B.O., Gollnick, P.D. & Saltin, B. (1973) Musclemetabolism and enzyme activities after training inboys 11–13 years old. Acta Physiologica Scandinavica87, 485–497.
Falk, B., Bar-Or, O. & MacDougall, J.D. (1992) Ther-moregulatory responses of pre-, mid- and late-pubertal boys. Medicine and Science in Sports andExercise 24, 688–694.
Forbes, G.B. (1987) Body composition in infancy, child-hood and adolescence. In Human Body Composition(ed. G.B. Forbes), pp. 125–68. Springer Verlag, NewYork.
440 special considerations
Galloway, S.D.R. & Maughan, R.J. (1997) Effects ofambient temperature on the capacity to perform pro-longed cycle exercise in man. Medicine and Science inSports and Exercise 29, 1240–1249.
Hallberg, L., Hogdahl, A.M., Nilsson, L. & Rybo, G.(1966) Menstrual blood loss: a population study.Variation at different ages and attempts to definenormality. Acta Obstetrica et Gynecologica Scandinavica45, 320–351.
Haralambie, G. (1979) Skeletal muscle enzyme activi-ties in female subjects of various ages. Bulletin ofEuropean Physiopathology and Respiration 15, 259–267.
Haymes, E.M. (1991) Vitamin and mineral supplemen-tation to athletes. International Journal of Sport Nutri-tion 1(2), 146–169.
Keul, J. (1982) Zur belastbarkeit des kinlichen organis-mus aus biochemischer sicht. In Kinder im Leis-tungsport (ed. H. Howald & E. Hatin), pp. 31–49.Birkhauser Verlag, Basel.
Kindermann, W., Keul, J., Simon, G. & Reindell, H.(1978) Anpassungerscheinungen durch Schul-undLeistungssport im Kindesalter. Sportwissenschaft 8,222–234.
Kurz, K.M. (1996) Adolescent nutritional status indeveloping countries. Proceedings of the NutritionSociety 55, 321–331.
Lee, W.T.K., Leung, S.S.F., Leung, D.M.Y. & Cheng,J.C.Y. (1996) A follow-up study on the effects ofcalcium-supplement withdrawal and puberty onbone acquisition of children. American Journal of Clinical Nutrition 64, 71–77.
Lemon, P. (1992) Effect of exercise on protein require-ments. Journal of Sports Sciences 9 (Special Issue),53–70.
Lindholm, C., Hagenfeldt, K. & Ringertz, B.M. (1994)Pubertal development in elite juvenile gymnasts:effects of physical training. Acta Obstetrica Gynecolog-ica Scandinavica 73, 269–273.
Lindholm, C., Hagenfeldt, K. & Hagman, U. (1995) Anutrition study in juvenile elite gymnasts. Acta Paedi-atrica 84, 273–277.
Loosli, A.R. & Benson, J. (1990) Nutritional intake ofadolescent athletes. Pediatric Clinics of North America37, 1143–1152.
Lucas, A. (1997) Paediatric nutrition as a new subspe-cialty: is the time right? Archives of Disease in Child-hood 76, 3–5.
MacDougall, J.D., Roche, P.D., Bar-Or, O. & Moroz, J.R.(1983) Maximal aerobic capacity of Canadian schoolchildren: predicted based on age-related oxygen costof running. International Journal of Sports Medicine 4,194–198.
Macek, M. & Vavra, J. (1981) Prolonged exercise in 14-year-old girls. International Journal of Sports Medicine2, 228–30.
McMiken, D.F. (1975) Maximum aerobic power and

physical dimensions of children. Annals of HumanBiology 3, 141–147.
Malina, R.M. (1983) Menarche in athletes: a synthesisand hypothesis. Annals of Human Biology 10, 1–24.
Malina, R. (1994) Physical growth and biological matu-ration of young athletes. Exercise and Sports ScienceReviews 22, 389–434.
Martinez, J., Lowenstein, M.K., Montague, A. &Munios, W. (1993) Nutrition and substance use in the adolescent male football player. InternationalPaediatrics 8, 435–439.
Martinez, L.R. & Haymes, E.M. (1992) Substrate utilisa-tion during treadmill running in prepubertal girlsand women. Medicine and Science in Sports and Exercise 24, 975–83.
Meyer, F., Bar-Or, O., MacDougall, J.D. & Heigen-hauser, J.F. (1992) Sweat electrolyte loss during exer-cise in the heat: effects of gender and maturation.Medicine and Science in Sports and Exercise 24, 776–81.
Meyer, F., Bar-Or, O., Salsberg, A. & Passe, D. (1994)Hypohydration during exercise in children: effect ofthirst, drink preferences and rehydration. Interna-tional Journal of Sports Nutrition 4, 22–35.
Nelson Steen, S. (1996) Nutrition for the school-agedchild athlete. In The Child and Adolescent Athlete (ed.O. Bar-Or), pp. 260–273. Blackwell Science, Oxford.
Nickerson, H.J., Holubets, M.C., Weiler, B.R., Haas,R.G., Schwartz, S. & Ellerfson, M.E. (1989) Causes of iron deficiency in adolescent athletes. Journal ofPaediatrics 114, 657–663.
Nose, H., Mack, G.W., Shi, X. & Nadel, E.R. (1988) Roleof plasma osmolality and plasma volume duringrehydration in humans. Journal of Applied Physiology65, 325–231.
O’Connor, H. (1994) Special needs: children and adolescents in sport. In Clinical Sports Nutrition (ed.L.M. Burke & V. Deakin), pp. 390–414. McGraw Hill,Sydney.
Pate, R.R., Maguire, M. & Van Wyke, J. (1979) Dietaryiron supplementation in women athletes. Physicianand Sportsmedicine 7, 81–89.
Perron, M. & Endres, J. (1985) Knowledge, attitudes,and dietary practices of female athletes. Journal of theAmerican Dietetic Association 85, 573–576.
Pipes, P.L. (1989) Nutrition in Infancy and Childhood, 4thedn. Mosby, St Louis, MO.
Rankinen, T., Fogelholm, M., Isokaanta, M. & Hartikka,K. (1993) Nutritional status of exercising and controlchildren. International Journal of Sports Medicine 14,293–297.
Richbell, M. (1996) Nutritional habits of junior elite athletes. Dissertation, University of Liverpool.
Rowland, T.W. (1985) Aerobic response to endurancetraining in pre-pubescent children: a critical analysis.Medicine and Science in Sports and Exercise 17, 493–497.
Rowland, T.W. & Kelleher, J.F. (1989) Iron deficiency in athletes: insights from high school swimmers.American Journal of Diseases in Childhood 143, 197–200.
Rowland, T.W., Black, S.A. & Kelleher, J.F. (1987) Irondeficiency in adolescent endurance athletes. Journalof Adolescent Health Care 8, 322–326.
Rowley, S. (1987) Psychological effects of intensivetraining in young athletes. Journal of Childhood Psychology and Psychiatry 28, 371–377.
Shephard, R.J. (1982) Physiology and Biochemistry ofExercise. Praeger, New York.
Sobal, J. & Marquart, L.M. (1994) Vitamin/mineral sup-plement use among high school athletes. Adolescent29, 835–843.
Tanner, J.M. (1989) Foetus into Man: Physical Growth fromConception to Maturity, 2nd edn. Castlemead Publica-tions, Ware, UK.
Theintz, G., Howald, H., Allemann, Y. & Sizonenko,P.C. (1989) Growth and pubertal development ofyoung female gymnasts and swimmers: a correlationwith parental data. International Journal of Sports Medicine 10, 87–91.
Theintz, G.E., Howald, H., Weiss, U. & Sizonenko, P.C.(1993) Evidence for a reduction of growth potentialin adolescent female gymnasts. Journal of Pediatrics122, 306–313.
Welten, D., Kemper, H.C.G., Post, G.B. et al. (1994)Weight-bearing activity during youth is a moreimportant factor for peak bone mass than calciumintake. Journal of Bone Mineral Research 9, 1089–1096.
Wilk, B. & Bar-Or, O. (1996) Effect of drink flavour andNaCl on voluntary drinking and hydration in boysexercising in the heat. Journal of Applied Physiology 80,1112–1117.
Wilmore, J.H. (1995) Disordered eating in the youngathlete. In New Horizons in Pediatric Exercise Science(ed. C.J.R. Blimkie & O. Bar-Or), pp. 161–178. HumanKinetics, Champaign, IL.
Young, S.J. (1991) The clinical psychopharmacology of tryptophan. In Nutrition and the Brain (ed. R.J.Wurtman & J.J. Wurtman), pp. 49–88. Raven Press,NY.
Zanconato, S., Buchtal, S., Barstow, T.J. & Cooper, D.M.(1993) 31P-magnetic resonance spectroscopy of legmuscle metabolism during exercise in children andadults. Journal of Applied Physiology 74, 2214–2218.
the young athlete 441

Introduction
All athletes at some time in their career look at alternative ways of eating to reach their ath-letic potential. While some athletes take pills,powders or potions in the belief that these willenhance their performance, others have changedtheir eating styles to a vegetarian diet to gainadvantages in training and performance. Unfor-tunately, after many years of research, the effectsof elimination of animal products from the dieton athletic performance are still unclear. Somedata do exist on elite athletes who consume a vegetarian diet, but studies that includeOlympic-calibre athletes are limited. In addition,most of the research on vegetarianism in the pastdecade has been focused on the health aspects ofa vegetarian diet, rather than on human perfor-mance issues. There is certainly a lack of informa-tion regarding vegetarianism and its relationshipto athletic performance. However, an athletewho consumes a poorly planned vegetarian dietmay be at risk of multiple nutritional deficienciesas well as poor physical performance.
Early meat eaters
It well known that ancient Greek athletes con-sumed large amounts of meats and many of thembelieved that their performances were depen-dent upon animal protein. As an example, Miloof Croton, the legendary Greek wrestler, con-sumed huge amounts of animal protein andtrained by carrying animals across his shoulders.
As the animals grew, so did his strength. WhileMilo’s diet would be viewed today as containingexcessive amounts of protein, he was neverbrought to his knees in the course of the fiveOlympiads in which he competed (Ryan 1981;Whorton 1982). This concept of the need for largeamounts of animal protein was promoted in theearly 1800s by Liebig, the pre-eminent physio-logical chemist of the time (Whorton 1982). Hebelieved that protein was the main substrate forthe exercising muscle. While Liebig’s hypothesiswas disproved by Atwater in the mid-1800s, his philosophy of consuming large amounts ofprotein continues to have influence even into themodern day. Today, many athletes still believethat, by consuming large amounts of protein,they will become stronger and gain lean bodymass (Berning et al. 1991).
Early vegetarians
While many ancient Greeks were consuminglarge amounts of animal protein for athleticprowess, the founder of the philosophical vege-tarian movement was also Greek. Pythagoras,the Greek mathematician, is the father of vegetarianism, and until the middle of the 19thcentury, vegetarians referred to themselves as‘Pythagoreans’ (Dombrowski 1984).
Many of the vegetarians in the mid- to late1800s were determined to prove that their dietwas superior to that of meat eaters. As a result,the London Vegetarian Society formed an ath-letic and cycling club in the late 1800s to compete
Chapter 33
The Vegetarian Athlete
JACQUELINE R. BERNING
442

against their carnivorous counterparts and inmost cases outperformed them in athletic com-petition (Nieman 1988). Due to their success,many other vegetarian athletes joined the move-ment. One such competition was the 1893 racefrom Berlin to Vienna, a 599-km course in whichthe first two competitors to finish were vegetar-ian (Whorton 1982). Over the next 10–20 yearsmany other vegetarian athletes performed wellin endurance performances around Europe.
Because of the success of vegetarian athletes, a few researchers in the early part of the 20thcentury were interested in measuring their phys-ical capabilities, and Fischer (1907) conductedexperiments on Yale student athletes. The sub-jects were exposed to a wide variety of foodsincluding meat and meatless choices and per-formed a variety of endurance tests. Those ath-letes who gravitated toward the meatless dietwere classified as vegetarians and were com-pared with athletes who ate meat. Each subjectwas tested to determine the maximum length oftime that they could hold their arms out horizon-tally and the number of maximum deep kneebends and leg raises they could perform. Fischernoted that the vegetarians scored better thantheir meat-eating counterparts.
Wishart (1934) reported on a 48-year-oldOlympic cyclist who had been a vegetarian for 23 years. The subject was submitted to four dif-ferent meatless meals with different levels ofprotein during the 4-week experimental period.The exercise protocol involved riding a cycleergometer for 8.5h on four occasions after stabi-lizing on a different level of dietary protein.During the ride, measurements were made ofexternal work and total energy expenditure.Higher speeds were recorded on the cycleergometer after consuming the diets with ahigher protein content, especially after 4 h ofriding. The improved performance was attrib-uted to an increased supply of energy comingfrom the meatless protein foods. While theenergy content of each of the four different meat-less meals varied by about 840kJ (200kcal), theamount of carbohydrate was not calculated andthe increase in protein content for each of the
four experimental diets came from dairy pro-ducts which contain a significant amount of carbohydrates.
Modern-day vegetarian athletes
The recent literature contains few publicationsdealing with vegetarianism and athletic perfor-mance. However, Cotes et al. (1970) studied theeffect of a vegan diet on physiological responsesto submaximal exercise in 14 females who hadconsumed a vegetarian diet for an average ofmore than 11 years. They compared the vegetar-ians with two different controls, one thatincluded 66 females of comparable social back-ground and a second group of 20 office cleanerswho had a comparable level of activity to that ofthe vegetarians. All subjects performed a sub-maximal test on a cycle ergometer in which theycycled for 3 min at 30 and 60 W. Ventilation andcardiac frequency were obtained as well as widthof the muscles in the thigh. Their results showedthat the sedentary controls had a significantlyhigher cardiac frequency while having a signifi-cantly lower grade of activity (P> 0.02). No statis-tical differences exist between the groups forthigh circumference or anterior skinfold thick-ness. The authors concluded that the data do notsupport the hypothesis that a low dietary intakeof animal protein impairs the physiologicalresponse to submaximal exercise.
Few data exist on the relationship betweenathleticism and vegetarian diets even today, inspite of the popular belief that a vegetarian dietmay be beneficial to some athletes. However,anecdotal reports abound. The Tarahumara, aUte-Aztecan tribe inhabiting the Sierra MadreOccidental Mountains in the north central stateof Chihuahua, Mexico, have been reported to becapable of extraordinary physical fitness andendurance as long-distance runners (Balke &Snow 1965), while consuming a vegetarian diet.Their diet contains very little food from animalsources and they have reportedly run distancesup to 320km in ‘kickball’ races which often lastseveral days (Balka & Snow 1965). Cerqueira andassociates (1979) investigated the Tarahumaras’
the vegetarian athlete 443

food intake and nutrient composition andreported that most of their daily energy andnutrients come from corn, beans and squash.About 94% of their daily protein intake is fromvegetable sources and only 6% from animalsources. Since most of the fat in their diet (9–12%)was derived from corn, beans and squash, theirdiets are rich in linoleic acid and plant sterols.The Tarahumara diet is extremely low in choles-terol (71 mg· day–1) since their primary source ofcholesterol is eggs, of which they consume abouttwo or three per week. Other sources of fat andcholesterol in the Tarahumara diet come fromsmall, infrequent servings of meat, fish, poultryand dairy products and lard. Even though thediet of the Tarahumara Indians is a simple oneconsisting mainly of plant foods, it is of highnutritional quality and is nutritionally sound,resulting in little chronic deficiencies and nowidespread undernutrition (Cerqueira et al.1979).
Hanne et al. (1986) investigated various fitnessparameters of vegetarian athletes and comparedthem with non-vegetarians. Forty-nine athletes(29 men and 20 women) who had been eitherlacto-ovo- or lactovegetarian for at least 2 yearswere compared with 49 controls (29 men and 20women). Subject ages ranged from 17 to 60 yearsof age, with the majority of the subjects in the age range of 17–35 years. Fitness parametersincluded anthropometric measurements, pul-monary function, aerobic and anaerobic capacityand blood chemistries. The authors found no sig-nificant differences in body mass between thetwo groups, although the female vegetarians hada significantly (P> 0.01) high percentage body fat than their non-vegetarian counterparts. Nodifferences were found in pulmonary function,heart rate, blood pressure or in the electrocardio-gram. No differences were found between thetwo groups of subjects in aerobic capacity oranaerobic capacity as determined from a sub-maximal test and a Wingate test, respectively.Results from the blood examination found thatnon-vegetarian controls had lower uric acidlevels than the vegetarian males, but the non-vegetarian group were within the normal range.
444 special considerations
Vegetarian women had lower haematocrit valuesthan controls, but haemoglobin, total protein,and glucose were similar in both groups. Whileno differences were found between the twogroups, it is always difficult to find significantdifferences, because vegetarianism does notembrace a single, well-defined diet, and theinfluence of other lifestyle factors, includinghabitual physical activity levels, may obscurepossible effects of the diet itself. Herein may liepart of the problem, as past research on vegetari-anism and athletic performance did not clearlydefine the type of diet being followed by groupsof individuals studied. Many athletes may callthemselves vegetarian when in fact they simplyeliminate from their diet a food group or a certainclass of foods. Information on the diet of vegetar-ian athletes would be helpful in defining limitingor beneficial factors.
Classifications of vegetarian diets
Vegetarian diets range from the vegan diet,which excludes all animal proteins, to the semi-vegetarian diet, which may include some animalproteins (Table 33.1).
Whatever the term an individual uses, itappears that vegetarianism is a continuum ofeating styles, which range from the sole con-sumption of plant foods to a diet restric-ting certain kinds of animal proteins or limitingthe frequency of animal protein consumption(Ratzin 1995). Because of the variety of vegetar-ian eating styles among practitioners, it is diffi-cult to define the variables that will influencehuman performance, but relationships have beenfound between vegetarianism and a reduction inspecific health risks.
Health implications of vegetarian diets
There is increasing tendency among researchersto conclude that the reduced disease riskobserved among vegetarians is not explained somuch by the absence of meat from the diet, butby the fact that they eat more plant foods. Results

of epidemiological research are traditionallyexpressed in terms of relative risk, a difficultconcept for the athletic and consumer populationto grasp. In a recent re-examination of data fromthe Adventist Health Study (Fraser et al. 1995),novel statistical calculations show how certaineffects may delay or advance the first expressionof disease. The Adventist Health Study is acohort investigation of approximately 34000 Cal-ifornian, non-Hispanic, white subjects living inSeventh Day Adventist households who werefollowed for 6 years. Some of the findings fromthis study are as follows.1 Non-vegetarians develop coronary disease1.77 years earlier than vegetarians.2 Among males, non-vegetarians have a remain-ing lifetime risk of developing coronary dis-ease that is 11.9% higher (P< 0.05) than that ofvegetarians.3 Non-vegetarian females have a remaining life-time risk of developing coronary disease that is0.26 percentage points lower than that of femalevegetarians.4 Those who rarely consume nuts develop coro-nary disease 2.6 years earlier and have a remain-ing lifetime risk 11.9 percentage points greater
(P <0.05) than persons who eat nuts at least five times per week.
While Seventh Day Adventists show a reducedrisk of several chronic diseases, many of themalso abstain from smoking and alcohol, and theyare more physically active than non-vegetarians,which also affects the prevalence of chronic dis-eases. To date, no one has followed a vegetarianathletic population to see if they show the samehealth benefits.
Nutritional adequacy of vegetarian diets
Protein quality
A nutritionally sound vegetarian diet is possibleif adequate amounts of a wide variety of foodsare consumed (Grandjean 1989; Harding et al.1996), but there are certain nutrients that vegetar-ians must be aware of and plan for to ensure the presence of adequate amounts in their diets.The most obvious nutrient of concern is protein. Lacto-ovovegetarians and ovovegetari-ans receive high-quality complete proteins andare unlikely to incur protein deficiencies. Vege-
the vegetarian athlete 445
Table 33.1 Classifications of various types of vegetarian diets. From Rudd (1989), with permission.
Diet Description
Semivegetarian Some but not all groups of animal-derived products, such as meat, poultry, fish, seafood, eggs, milk and milk products may be included in this diet
New vegetarian Plant-food diet supplemented with some groups of animal products, but emphasis isplaced on foods that are ‘organic, natural and unprocessed or unrefined’
Pescovegetarian Excludes red meats, but consumes fish as well as plant foods
Lacto-ovovegetarian Milk and milk products and eggs included in this diet, but meat, poultry, fish, seafood and eggs excluded
Ovovegetarians Eggs are included in this diet, but milk and milk products, meat, poultry, fish and seafood are excluded
Strict vegetarian/vegan All animal-derived foods, including meat, poultry, fish, seafood, eggs, milk and milk products are excluded from this diet
Macrobiotic Avoids all animal foods. Uses only unprocessed, unrefined, natural and organic foods.In some types there is fluid restriction. Tamari, miso and various seaweeds are used
Fruitarian This diet consists of raw or dried fruits, nuts, seeds, honey and vegetable oil

tarians who consume only plant proteins couldbecome protein deficient unless they balancetheir amino acids. Plant proteins are incompleteand lack one or more essential amino acid. Whileit was once thought that all the amino acids mustbe consumed in one meal, it is now agreed thattiming of the amino acid intake is less critical andthat amino acid intake must be balanced overdays rather than hours. Research now shows thatthe liver monitors the amino acid composition ofproteins consumed in a meal: if the meal is low inan essential amino acid, the liver can break downits own proteins to supply it. When the aminoacid is once again plentiful, the liver will replen-ish its protein source.
Because individual plant foods do not containall the essential amino acids, it is recommendedthat vegetarians complement their proteins. Forexample, cereals are very low in the essentialamino acid lysine, while legumes are slightlydeficient in the sulphur-containing amino acids.By combining these two groups of foods (i.e.refried beans and corn tortillas), a vegetariancould provide a mixture of amino acids similar tothat of a complete or high-quality protein food.Figure 33.1 illustrates different combinations ofincomplete proteins to make a complete proteinas well as demonstrating the fact that when ananimal protein is combined with an incomplete
446 special considerations
protein, the result is a complete, high-qualityprotein.
Protein requirements for vegetarian athletes
A major concern for vegetarian athletes is tomake sure that they have consumed enough foodso that their protein requirement will be met. Thetotal protein intake of athletes consuming a vege-tarian diet may have to be increased slightly totake account of the lower digestibility, lowerenergy density and lower protein quality of plantfoods consumed. This may lead to problems withthe volume of food to be consumed, because ath-letes with high energy requirements may find itdifficult to consume sufficient volume of foods tomaintain energy balance on a purely vegetariandiet. Generally, if vegetarian athletes consumebetween 0.8 and 1.7g protein · kg–1 body mass ·day–1 and maintain energy balance, they shouldmeet their protein requirement for exercise andhealth.
Vitamin B12
Another nutrient that may be low in a vegetariandiet is vitamin B12, especially for those individu-als on a strict plant-based diet (vegans). Rauma etal. (1995) studied the vitamin B12 status of long-
GrainsRice with sesame seeds Nuts
andseeds
Milk in legume soupsMilkproducts
Legumes
Peanut butter sandwich
Rice and bean casserole
Sun
flow
erseed
and
pean
uts
Mac
aro
nia
nd
chee
sece
real
wit
hm
ilk
Fig. 33.1 The concept of mutualsupplementation, which is the strategy ofcombining two incomplete sources ofprotein so that the amino acids in each foodmake up for those lacking in other foods.Such protein combinations are sometimescalled complementary proteins.

term adherents to a strict uncooked vegan dietcalled the ‘living food diet’ (LFD). Most fooditems in this diet are fermented or sprouted.Serum B12 concentrations and the dietary intakesof 21 long-term adherents of the LFD were com-pared with those of 21 omnivorous controls. In alongitudinal study, the LFD diet resulted in adecrease in serum vitamin B12 in six of nine sub-jects. The cross-sectional study revealed signifi-cantly lower serum vitamin B12 in the LFDadherents than in their matched omnivorouscontrols. Those following the LFD who con-sumed nori or chinerilla seaweeds had some-what better B12 status than those who did not, butB12 levels fell over time in all but one subject.While lower levels of vitamin B12 have beenfound in strict vegans, few cases of clinical defi-ciency have been found. Helman and Darnton-Hill (1987) found the mean serum vitamin B12levels of vegetarians to be significantly lower(350 pg · ml–1) than those of omnivores (490pg ·ml–1), while 16% of the vegetarians had valuesless than 200 pg · ml–1. Vitamin B12 deficiency israre among lacto-ovovegetarians because milkand eggs contain sufficient quantities of thisnutrient. Vegans should be encouraged to usesoybean milk fortified with vitamin B12 or avitamin B12 supplement. Analogues of thevitamin found in algae, spirulina, nori or fer-mented soy products do not have vitamin activ-ity for humans.
Individuals with low serum B12 may manifestparaesthesia (numbness and tingling in thehands and legs), weakness, fatigue, loss of vibration and position sense, and a range of psychiatric disorders including disorientation,depression and memory loss. The use of alcohol,tobacco and drugs such as antacids, neomycin,colchicine and aminosalicylic acid may con-tribute to the problem by causing B12 malabsorp-tion in both omnivores and vegetarians.
Iron availability in vegetarian diets
While both vegetarian and non-vegetarians mayhave difficulty in meeting the dietary require-ments for iron, athletes who eat red meat are at
less risk of iron deficiency anaemia. In absoluteamounts, red meat contains only an averageamount of iron, but the bioavailabilty of ironfrom red meat is superior to that derived fromplant sources. There are two forms of iron in the diet: haem iron and non-haem iron. Haemiron found in meats, fish and poultry is betterabsorbed than non-haem iron, which is found ingrains, vegetables and fruits. The fractionalabsorption of haem and non-haem iron variesbetween 3% and 35%, depending on the presenceof dietary enhancing factors such as ascorbicacid, consumption of sources of haem iron andon the body stores of iron. Table 33.2 lists theranges of intestinal absorption of iron from haemand non-haem food sources which is dependentupon body stores of iron.
Iron is classified as an essential nutrient and isrequired for the formation of haemoglobin andmyoglobin, as well as the cytochromes, whichare components of the electron transport chain inthe mitochondria. Iron is also a cofactor for anumber of enzymatic reactions, including thoseinvolved in the synthesis of collagen and ofvarious neurotransmitters. In addition, iron isneeded for proper immune function and plays arole in the drug detoxification pathways(Wardlaw & Insel 1995).
Since iron plays a critical role in oxidativeenergy metabolism, it is essential for athletes tohave adequate iron stores. There are some differ-ences of opinion about the prevalence of irondeficiency among athletes. A number of studieshave used serum ferritin as a measure of irondeficiency anaemia, while other studies haveused haemoglobin and haematocrit as determi-nants of iron deficiency anaemia. The number
the vegetarian athlete 447
Table 33.2 Absorption rate (as % of intake) of haemand non-haem iron in relation to body stores of iron.
Haem Non-haem(%) (%)
Low stores of iron 35 20
Normal stores of iron 15 2–3

of athletes suffering from true iron defi-ciency anaemia is therefore difficult to establish(Eichner 1988). Further debates have beensparked by the fact that many athletes with lowiron stores eat little haem iron and yet have no performance decrements (Dallongeville et al.1989; Snyder et al. 1989; Lyle et al. 1992; Pate et al.1993; Williford et al. 1993). It is, however, impor-tant to monitor iron status among athletes, espe-cially female athletes. The Sports Medicine andScience Division of the United States OlympicCommittee recommend screening for haemoglo-bin and haematocrit twice yearly. Other tests of iron stores are recommended based on men-struation records.
Snyder et al. (1989) investigated the iron intakeand iron stores in female athletes who eitherwere consuming a mixed diet or were classifiedas a modified vegetarian. The subjects werematched for age, body mass, aerobic capacity,training load and number of pregnancies. Themodified vegetarians (n =9) consumed less than100g of red meat per week while the subjects onthe mixed diet (n =9) included red meat in theirdiet. Both groups consumed the same amount ofiron (14mg ·day–1), but serum ferritin and totaliron-binding capacity were significantly lower inthe modified vegetarian group (P< 0.05). Theauthors also found that the bioavailability of theiron consumed by the two groups was different.Iron consumed by the modified vegetariangroup was significantly less available than theiron consumed by the mixed-diet group. Thesedata suggest that in female runners non-haemiron may not be as readily available as haem iron.These findings have also been confirmed in thenon-athletic population. In 1995 Shaw et al.(1995) investigated the iron status of youngChinese Buddhist vegetarians (23 men and 32women) and compared them with non-vegetar-ian students (20 men and 39 women). Dietaryassessment of iron intake and haematologicalmeasurements of biochemical indices, includinghaemoglobin, plasma iron, transferrin saturationand plasma ferritin, were made. A characteristicof the vegetarian diets was that most of theprotein was coming from soybean products,
448 special considerations
which have limited bioavailable iron. Daily ironintake was similar in both vegetarian and non-vegetarian men, but iron intake was significantlyhigher in female vegetarians than non-vegetarians. Results from the haematologicalmeasurements showed that for both sexes, themedian plasma ferritin concentration of the veg-etarians was about half that of the non-vegetarians. There was also a greater prevalenceof low ferritin levels and anaemia in the vegetar-ian group, especially among the vegetarianwomen.
food strategies for increasingiron in a vegetarian diet
Because animal foods are the best and mostabsorbable source of iron, this presents a poten-tial problem to the vegetarian who eats no redmeat. Lacto-ovovegetarians also have a problemconsuming enough iron, as milk and dairy products are poor sources of iron. Vegetarianscan incorporate leafy green vegetables such asspinach and legumes as well as fortified andenriched whole grains into their diets. Dried fruitcan also provide iron in the vegetarian diet.Dietary iron may also be derived from ironcooking utensils. When acidic foods are cookedin iron cookware, some of the iron is taken upwith the food.
Zinc status among athletes
Since the best food sources of zinc are meats,dairy products and seafood (especially oysters),zinc nutriture is of concern for vegetarians.Whole-grain cereals and cereal products are theprimary sources of zinc in many vegetarian diets,but the phytate and fibre content of these prod-ucts reduces the bioavailability of zinc (Reinholdet al. 1976). Zinc is found in almost every tissue inthe body and is a cofactor for over 100 enzymes,of which several are important in the pathwaysfor energy metabolism. Zinc is also needed for protein synthesis and is a part of the insulinmolecule.
Several studies have demonstrated that

exercise increases zinc loss from the body(Dressendorfer & Socklov 1980; Haralambie1981; Singh et al. 1990; Clarkson & Haymes 1994)and that levels may be low in athletes. Possibleexplanations for the reduced level of zinc storesinclude inadequate intake of zinc, low bioavail-ability, increased zinc loss during exercise, dilu-tion of zinc by expansion of plasma volume, andredistribution of zinc in the body.
Contrary to these reports, Lukaski (1989;Lukaski et al. 1990) has found that zinc status isnot affected by physical training as long asdietary intakes of zinc are adequate. Lukaski et al.(1990) studied 16 female and 13 male swimmersand 13 female and 15 male non-swimming controls. Plasma zinc values were within thenormal range for all subjects and did not changethroughout the swimming season. In addition toLukaski’s studies, Duester et al. (1989) investi-gated the effects of endurance training on zincstatus in 13 highly trained women and comparedthem with 10 untrained controls. Three-daydietary records were evaluated for zinc intakewhile blood and 24 h urine samples were takenbefore and after a 25-mg oral zinc load. Meandaily zinc intakes did not differ and were belowthe recommended dietary allowance set for zincfor both groups. The authors reported no differ-ences between fasting concentrations of plasmazinc, serum albumin, a-2-macroglobulin, anderythrocyte zinc content among the two groups.However, the trained women had significantly (P <0.05) higher urinary zinc excretion andreduced responses to the oral zinc load than didthe untrained women. The authors concludedthat the increase in zinc excretion in the highlytrained women may reflect higher rates of skele-tal muscle turnover.
zinc and the vegetarian
In addition to these studies of athletes, severalstudies confirm lower zinc status among vegetarians (Freeland-Graves et al. 1980; Gibson1994; Kadrabova et al. 1995).
Janelle and Barr (1995) recently reported a study comparing nutrient intakes between
female vegetarians and non-vegetarians withsimilar health practices and found that vegansand lactovegetarians had lower zinc intakes (8.5 and 8.2mg ·day–1, respectively) than the recommended dietary allowance of 15 mg· day–1.Similar results were found in a study conductedby Donovan and Gibson (1995), who found that33% of semivegetarians, 24% of lacto-ovovege-tarians and 18% of omnivores had serum zinclevels below 10.7 nmol · l–1. They also reportedthat the phytate to zinc ratio in the diet was nega-tively associated with the serum zinc concentra-tion (P<0.05). The authors concluded that thesuboptimal zinc status was the result of lowintakes of poorly available zinc in all dietarygroups.
food strategies for increasingzinc in a vegetarian diet
Foods for the vegetarian that have the highestzinc content are oysters, crab, shrimp, wheatgerm and legumes. Incorporating other goodsources of zinc into a vegetarian diet will alsohelp meet the dietary recommendations: nuts,beans and whole grains can all contribute. Zinc isnot part of the enrichment process, so refinedflours are not a good source.
Calcium requirements of vegetarians
The diets of strict vegetarians or vegans tend tobe low in calcium unless adequate amounts ofmilk and dairy products or dark leafy greens are consumed daily. As with iron and zinc, theabsorption of calcium may be reduced by phy-tates, oxalates, fibre and tannins (James et al.1978; Weaver et al. 1996). Phytic acid is found inoatmeal and other whole-grain cereals, whileoxalates are commonly found in beets, spinachand leafy greens. These binders seem to depressabsorption of calcium present in some calcium-containing foods but not in others. That is whystrict vegans who obtain most of their dietarycalcium from leafy greens and whole-grain prod-ucts are at a greater risk of an inadequate calciumavailability than milk-drinking vegetarians. A
the vegetarian athlete 449
purely vegan diet may also be low in vitamin D,which will further impair calcium absorptionand utilization.
In an interesting anthropological study of prehispanic burials from the Canary Islands,Gonzalez-Reimers and Arnay-de-la-Rosa (1992)found a high prevalance of osteoporosis amongthe 117 skeletons analysed for trace elements.Bone trace element analysis showed that lowconcentrations of iron, zinc and copper werefound in skeletons with a reduced trabecularbone mass. The authors state that during this pre-hispanic period many of the residents of theCanary Islands existed in a relative protein-energy malnutrition state which consistedmainly of a vegetarian diet which may have pre-disposed these individuals to osteoporosis.
It has been suggested that vegetarians whorestrict their intake of dairy products shouldprovide calcium-rich foods or supplements byconsuming calcium-fortified soy products aswell as consuming dark leafy green vegetableson a daily basis.
food strategies for increasingcalcium in a vegetarian diet
Foods with the highest nutrient density forcalcium are leafy greens, such as spinach andbroccoli, non-fat milk, romano cheese, swisscheese, sardines and canned salmon. Thecalcium found in some leafy greens is not wellabsorbed because of the presence of oxalic acid,but this effect is not as strong for kale, collard,turnip, and mustard greens. Overall, non-fat milk is the most nutrient-dense source ofcalcium because of its high bioavailability andlow energy value. The new calcium-fortifiedorange juices and other beverages offer an alter-native to the individual who is a strict vegetar-ian; other calcium-fortified foods include bread,breakfast cereal, breakfast bars, and snacks.Another good source for the vegetarian issoybean curd (tofu) if it is made with calcium car-bonate (check the food label).
While there are concerns about the potentiallack of some nutrients in a vegetarian diet, many
450 special considerations
of these concerns can be overcome by using awide variety of foods and planning meals so thatthey complement proteins and include nutrient-dense foods. Table 33.3 summarizes the nutrientsthat may be lacking in a vegetarian diet and gives some examples of foods that could be in-cluded in a vegetarian diet to overcome these inadequacies.
Hormonal alterations as a result of a vegetarian diet
There is evidence that nutritional status and dietcan affect the reproductive system. Hill et al.(1984) found that Caucasian women (n= 16), whonormally ate meat had a significantly (P<0.01)shorter follicular phase of their second menstrualcycle when they ate a vegetarian diet for twocycles. The vegetarian diet decreased (P<0.01)the pituitary response to releasing luteinizinghormone and decreased (P <0.05) the episodicrelease of luteinizing hormone. The experimentalso included supplementing nine vegetarianBlack South African women with daily meatproduct: an increased length of the follicularphase was observed (P <0.01). The authors concluded that a lower episodic release ofgonadotrophins and a shorter duration of the follicular phase, when omnivorous women ateno animal protein, implies that a vegetarian dietplays a role in the control of ovulation throughthe hypothalamic axis of the central nervoussystem. In a similar study, Pirke et al. (1986)investigated the influence of a vegetarian diet on the menstrual cycles of 18 healthy normalweight women aged 17–27 years. Plasma levelsof oestradiol, progesterone and luteinizinghormone were measured on Monday, Wednes-day and Friday throughout the 6-week dietperiod. Nine women followed a vegetarian dietwhile nine followed an omnivorous diet. Bothgroups lost weight during the experimentalperiod (1kg body weight · week–1). Seven of thenine vegetarian women became anovulatory andhad significantly decreased luteinizing hormoneduring the mid-cycle and luteal phase. Oestro-gen and progesterone levels were also signifi-

cantly decreased in the vegetarian group. In com-parison, seven of nine women in the omnivorousgroup maintained ovulatory cycles and had nochange in cycle length or in the length of the fol-licular phase. In both of these studies a vegetar-ian diet appears to be involved in the incidence of menstrual irregularities, but the underlyingpathophysiology remains unclear.
Vegetarian diets and oestrogen levels
Adlercreutz et al. (1986a, 1986b, 1995) have pro-vided some possible reasons why a vegetariandiet may play a role in menstrual-cycle regular-ity. Dietary constituents such as fibre and a vege-
tarian eating pattern have been shown to alteroestrogen levels in humans by influencingoestrogen synthesis, availability, excretionmetabolism and action. Currently there is a greatdeal of interest in plant-derived lignans andisoflavonic phyto-oestrogens, as they have beenfound in human urine and appear to exhibit,both in vitro and in vivo, weak oestrogenic andsometimes anti-oestrogenic activities. Plantlignans and isoflavonoids, glycosides fromsoybean products as well as whole grains, seedsand nuts are converted by intestinal microflora tohormone-like compounds. These compoundsbind, with low affinity, to oestrogen receptors,and preliminary results suggest that they may
the vegetarian athlete 451
Table 33.3 Nutrients that are of concern in a vegetarian diet and strategies to lower nutritional deficiencies. FromRudd (1990).
Nutrient RDA Physiological function Vegetarian food sources
Protein 0.8g ◊kg-1 BW Build and repair tissues; major Eggs, fish, legumes, peanut butter,component of antibodies, enzymes, milk, brown rice, peanuts,hormones; responsible for soybeanstransport of nutrients and fluidbalance
Vitamin B12 2.0mg ◊day-1 Promotes growth; cofactor for Eggs, dairy products, clams,several enzymes; maintains the oysters, some seafoodsheath around nerve fibres; helpsfolate in preventing anaemia
Iron Males, 10mg ◊day-1; Constituent of haemoglobin and Clams, whole grains, enrichedfemales, 15mg ◊day-1 myoglobin; carrier of O2 and CO2 cereals, green leafy vegetables,
dried fruits, tofu, legumes
Calcium Teens, 1200mg ◊day-1; Major component of Dairy products, leafy greenadults, 800mg ◊day-1 hydroxyapatite for bones and teeth; vegetables, fish and shellfish, tofu,
regulation of muscle contraction, legumesheart beat, clotting of blood, andtransmission of nerve impulses; blood pressure
Zinc Males, 15mg ◊day-1; Part of over 100 enzymes; Fish, oysters, dairy products,females, 12mg ◊day-1 associated with insulin; involved in black beans, kidney beans, tofu,
making DNA and RNA; involved beets, peas, whole-grain breads,with the immune system; transport bran flakesof vitamin A; wound healing andnormal development of the fetus
Vitamin D 400IU ◊day-1 Promotes normal bone and teeth Fortified dairy products, egg yolk,formation; aids body’s absorption, shrimp, sunlighttransportation and deposition ofcalcium and phosphorus
induce production of sex hormone-binding globulin in the liver and in this way influence sex hormone metabolism and biological effects.Indeed, Gorbach and Goldin (1987) measuredurinary, faecal and plasma levels of oestrogens inpre- and postmenopausal women eating differ-ent diets. Premenopausal US women consuminga ‘Western’ diet composed of 40% fat and lowfibre were compared with age-matched vegetari-ans eating 30% of their energy intake as fat and a high-fibre diet. The researchers found that the vegetarian women excreted threefold moreoestrogen in their faeces, had lower urinaryoestrogen excretion, and had 15–20% lowerplasma oestrogen than the omnivorous women.When pre- and postmenopausal women eating aWestern diet were compared with Asian immi-grants eating a very low fat diet (20–25% of totalenergy from fat), similar results were found,except that the plasma oestrogen levels were 30%lower among the Orientals than in the Westernomnivore group. Correlation analysis of dietarycomponents and plasma oestrogen showed thatplasma oestrogen was positively associated withfat intake and negatively associated with dietaryfibre. The authors concluded that diets high infibre, like a vegetarian diet, can alter the route ofexcretion of oestrogen by influencing the entero-hepatic circulation and thus influence plasmalevels of oestrogen. In a similar study, Pedersen etal. (1991) examined the effect of different nutri-tional patterns on menstrual regularity in pre-menopausal women. Forty-one non-vegetarianand 34 vegetarian women were recruited andcompleted a questionnaire regarding menstrualhistory and a 3-day dietary record. The reportedincidence of menstrual irregularity was 4.9%among the non-vegetarians and 26.5% amongthe vegetarians. The vegetarian group consumedsignificantly more polyunsaturated fatty acids,carbohydrates, vitamin B6 and dietary fibre,whereas the non-vegetarians consumed signifi-cantly more caffeine, cholesterol, saturated fattyacids and alcohol. Logistic regression analysisshowed that the probability of menstrual regu-larity among all subjects was positively corre-lated with increasing protein and cholesterol
452 special considerations
intakes. The probability of developing menstrualirregularities was negatively correlated withincreasing dietary fibre and increasing amountsof magnesium in the diet. This study is consistentwith the notion that premenopausal vegetarianwomen as a group have decreased circulatingoestrogen concentrations.
Additional data from Adlercreutz et al. (1986a)have also found that vegetarians may be excret-ing more oestrogen than omnivores: they investi-gated the possible effects of variations in dietaryfibre intake on oestrogen metabolism in youngFinnish women through one winter and onesummer. Eleven of the subjects were lactovege-tarians, while 12 were omnivorous. Within thegroups there was a seasonal variation in fibreintake. The vegetarian group consumed morefibre (P< 0.02), more grains (P< 0.02) and morevegetables (P< 0.02) during the winter thanduring the summer. The excretion of oestrogenswas remarkably constant in the omnivorousgroup, while the vegetarian group had a signifi-cant seasonal variation of total and individualcatecho-oestrogens and estrone (P<0.05–0.005).There were no differences between the groups inexcretion of total or individual urinary oestro-gens in any season or between mean values forboth seasons, but a significant negative correla-tion was found between dietary intake of totalgrain fibre per kilogram of body weight and theexcretion of individual oestrogens were found.These studies are consistent with the notion thatmenstrual regularity can be influenced by spe-cific dietary nutrients that may have a directeffect on oestrogen.
Hormonal responses of a vegetarian lifestyleon males
Most of the data collected on diet and hormonerelationships among vegetarians is on women,and information on males is sparse. Howie andShultz (1985) studied the relationship betweendietary nutrients and plama testosterone, 5-a-dihydrotestosterone, oestradiol-17-b, luteinizinghormone, and prolactin levels in 12 Seventh DayAdventist vegetarian, 10 Seventh Day Adventist

non-vegetarian and 8 non-Seventh Day Adven-tist, non-vegetarian males. Fasting bloodsamples and 3-day dietary intakes were obtainedfrom all subjects. The Seventh Day Adventistvegetarians consumed significantly more crudeand dietary fibre than the other non-vegetariansubjects. Plasma levels of testosterone andoestradiol-17-b were significantly lower in theSeventh Day Adventist vegetarians than in theominvores. Additionally, plasma levels of testos-terone and oestradiol-17-b of all subjects werenegatively correlated with dietary fibre intake.The authors concluded that a vegetarian eatingstyle may lead to decreased plasma concentra-tions of androgens and oestrogens in men. Incontrast, Naik and Snyder (1997) examined theindependent effects of diet and endurance train-ing on basal serum testosterone concentration bycomparing endurance-trained cyclists with vege-tarian individuals who had abstained fromeating red meat and poultry for 1 year. Theaerobic ability of the endurance athletes was sig-nificantly greater than that of the sedentary vege-tarians. Nutrient intake, however, was similar in both groups, except for dietary fibre intake,which was higher in the vegetarian group.Serum total and free testosterone concentrationswere not different for either main effect (i.e. dietand exercise). Perhaps the lack of difference insex hormones could be attributed to the fact thatthe diets were very similar in both groups.
Implications of vegetarian diets for athletes
Vegetarian diets have been associated with a lowincidence of cancers of the breast, endometriumand prostate. However, lowered plasma levelsand increased urinary excretion of oestrogen canlead to menstrual abnormalities which may inturn lead to irregular menstrual cycles and com-promised bone health in vegetarians. Brooks et al. (1984) noted that most female athletes withamenorrhoea were vegetarian. They comparedthe diets of amenorrhoeic runners (82% vegetar-ian) with regularly menstruating runners (13%vegetarian) and found that the runners with
regular menstrual cycles ate five times moremeat and significantly (P< 0.05) more fat thanamenorrhoeic runners. Kaiserauer et al. (1989)also found that amenorrhoeic runners consumedsignificantly less fat, red meat and total energythan did regularly menstruating runners. Slavinet al. (1984) found that there was a high incidenceof vegetarianism among amenorrhoeic athletesand speculated that trace elements or plant hormones may affect menstruation. While itappears that vegetarianism may influence men-strual function, the real importance of menstrualirregularities in female athletes is related to bonehealth.
In a landmark study on bone health and athletic amenorrhoea, Drinkwater et al. (1984)studied 28 female athletes, 14 of whom wereamenorrhoeic. When compared with the regu-larly menstruating runners, the amenorrhoeicrunners had significantly lower lumbar vertebralbone mineral densities. The mean age of theamenorrhoeic athletes was 25 years, but theiraverage bone mineral density was equivalent tothat of a 51-year-old. While there is a clear rela-tionship between athletic amenorrhoea and bonehealth, there is a limited amount of informationon the possible effects of a vegetarian lifestyle.Hunt et al. (1989) investigated the relationship of bone mineral content/bone width in elderly,independently living Methodist omnivores andSeventh Day Adventist vegetarians. Bone masswas measured by single photon absorptiometryand dietary intakes were assessed by 24-hdietary recall and food frequency methods. Bonemineral/bone width was not different in omni-vores compared to vegetarians and no significantrelationships were found to exist betweencurrent or early dietary intakes and bonemineral/bone width. Lloyd et al. (1991) alsofound no significant differences in bone densitybetween vegetarian and non-vegetarian womendespite a significantly higher prevalence of men-strual irregularities among the vegetarian sub-jects. These studies support the concept that,despite the differences in dietary practices, vege-tarian and non-vegetarian women do not appearto differ in bone health. Caution must be taken,
the vegetarian athlete 453

however, when dealing with an athlete who is avegetarian. Bone mineral densitiy should bemeasured and adequate amounts of calciumshould be consumed to ward off the potentialharmful effects of low oestrogen on bone.
While vegetarianism is not a risk factor for theFemale Athlete Triad, it may become a factor if anathlete is amenorrhoeic due to her vegetarianeating pattern.
Conclusions and recommendations
Currently most information on vegetarianismrelates to nutritional adequacy and the implica-tions for lifestyle diseases such as heart diseaseand cancer. Little is known about the relation-ship between vegetarianism and athletic perfor-mance. What is clearly understood is that thevegetarian athlete must plan his or her diet care-fully to avoid the risk of nutritional deficienciesand an adverse effect on performance. There areadvantages to the athlete of consuming a vege-tarian diet. Vegetarian athletes usually consumea higher proportion of energy in the form of car-bohydrates. It is well documented that athletes,especially endurance athletes, should be con-suming a higher proportion of carbohydrates intheir diets to maximize muscle glycogen concen-tration. Prolonged strenuous exercise can depletemost of the glycogen stored in the muscles and the athlete can become chronically fatigued.Increasing dietary carbohydrates will be benefi-cial to the athlete involved in heavy training.More research is needed to answer some of thecurrent concerns of vegetarian athletes, espe-cially with regard to hormonal alterations andtheir impact on bone health as well as the ques-tions on protein-energy requirements for strictvegetarians who consume no animal protein.
If athletes adopt a vegetarian lifestyle, theymust become aware of the limitations of the diet and make sure that their nutritional require-ments are met so as not to influence performance.Vegan diets should not be attempted by anyathlete without previous experience or withoutconsultation with a dietitian or health careprovider. Young growing athletes should be dis-
454 special considerations
couraged from such a strict diet due to its pos-sible limitations on growth and performance.Vegan diets should only be considered if anathlete is willing to devote time and effort tounderstanding the proper combinations andamounts of foods necessary to achieve a nutri-tionally balanced diet.
In planning vegetarian diets of any type, ath-letes should choose a wide variety of foods andensure that the energy intake is adequate to meettheir needs. Additionally, the American DieteticAssociation (1993) gives the following recom-mendations for individuals who are vegetarianor thinking of becoming vegetarian.• Keep the intake of foods with a low nutrientdensity, such as sweets and fatty foods, to aminimum.• Choose whole or unrefined grain products,instead of refined products, whenever possible,or use fortified or enriched cereal products.• Use a variety of fruits and vegetables, includ-ing a good food source of vitamin C.• If milk or dairy products are consumed, uselow-fat or non-fat varieties.• Limit egg intake to three or four per week.• Vegans should have a reliable source ofvitamin B12, such as some fortified commercialbreakfast cereals, fortified soy beverage or acyanocobalamin supplement. As long as theathlete is outdoors in the sun for part of the day,supplemental vitamin D may not be needed.• Vegetarian and non-vegetarian infants whoare solely breastfed beyond 4–6 months of ageshould receive supplements of iron and vitaminD if exposure to the sun is limited.
These recommendations, of course, were for-mulated for the non-athlete, and may need to bemodified. When energy intake is very high, forexample, there is room in the diet for foods with low nutrient density without compromis-ing nutritional status.
References
Adlercreutz, H., Fotsis, T., Bannwart, C., Hamalainen,E., Bloigu, S. & Ollus, A. (1986a) Urinary estrogenprofile determination in young Finnish vegetarian
and omnivorous women. Journal of Steroid Biochem-istry 24, 289–296.
Adlercreutz, H., Fotsis, T., Bannwart, C. et al. (1986b)Determination of urinary lignans and phytoestrogenmetabolites, potential antiestrogens and anticarcino-gens, in urine of women on various habitual diets.Journal of Steroid Biochemistry 25, 791–797.
Adlercreutz, H., Goldin, B.R., Gorbach, S.L. et al. (1995)Soybean phytoestrogen intake and cancer risk.Journal of Nutrition 125 (Suppl.), S757–770.
American Dietetic Association (1993) Position of the American dietetic association: vegetarian diets.Journal of the American Dietetic Association 93,1317–1319.
Balke, B. & Snow, C. (1965) Anthropological and physi-ological observations on Tarahumara endurancerunners. American Journal of Physical Anthropology 23,293–302.
Berning, J.R., Troup, J.P., VanHandel, P.J., Daniels, J. &Daniels, N. (1991). The nutritional habits of youngadolescent swimmers. International Journal of SportNutrition 1, 240–248.
Brooks, S.M., Sanborn, C.F., Albrecht, B.H. & Wagner,W.W. (1984) Diet in athletic amenorrhoea (letter).Lancet i, 559–660.
Cerqueira, M.T., Fry, M.M. & Connor, W.E. (1979) Thefood and nutrient intakes of the Tarahumara Indiansof Mexico. American Journal of Clinical Nutrition 32,905–915.
Clarkson, P.M. & Haymes, E.M. (1994) Trace mineralrequirements for athletes. International Journal ofSport Nutrition 4, 104–119.
Cotes, J.E., Dabbs, J.M., Hall, A.M. et al. (1970) Possibleeffect of a vegan diet upon lung function and the cardiorespiratory response to submaximal exercisein healthy women. Journal of Physiology 209, 30P–32P.
Dallongeville, J., Ledoux, M. & Brisson, G. (1989) Irondeficiency among active men. Journal of the AmericanCollege of Nutrition 8, 195–202.
Dombrowski, D.A. (1984) The Philosophy of Vegetarian-ism. University of Massachusetts Press, Amherst,MA.
Donovan, U.M. & Gibson, R.S. (1995) Iron and zincstatus of young women aged 14–19 years consumingvegetarian and omnivore diets. Journal of the Ameri-can College of Nutrition 14, 463–472.
Dressendorfer, R.H. & Sockolov, R. (1980) Hypo-zincemia in runners. Physician and Sports Medicine 8,97–100.
Drinkwater, B.L., Nilson, K., Chesnut, C.H. et al. (1984)Bone mineral content of amenorrheic and eumenor-rheic athletes. New England Journal of Medicine 311,277–281.
Duester, P.A., Day, G.A., Singh, A., Douglass, L. &Moser-Vellon, P.B. (1989) Zinc status of highly
trained women runners and untrained women.American Journal of Clinical Nutrition 49, 1295–1301.
Eichner, R.E. (1988) Sports anemia: poor terminologyfor a real phenomenon. Sports Science Exchange 1 (6),1–6.
Fisher, I. (1907) The effect of diet on endurance: basedon an experiment, in thorough mastication, withnine healthy students at Yale University, January toJune 1906. Transactions of the Connecticut Academy ofArts and Science 13, 1–46.
Fraser, G.E., Lindsted, K.D. & Beeson, W.L. (1995) Effectof risk factor values on lifetime risk of and age at firstcoronary event: The Adventist Health Study.American Journal of Epidemiology 142, 746–758.
Freeland-Graves, J.H., Ebangit, M.L. & Hendrikson, P.J.(1980) Alterations in zinc absorption and salivarysediment zinc after a lacto-ovo-vegetarian diet.American Journal of Clinical Nutrition 33, 1757–1766.
Gibson, R.S. (1994) Content and bioavailability of traceelements in vegetarian diets. American Journal of Clin-ical Nutrition 59 (Suppl.), 1223s–1232s.
Gonzalez-Reimers, E. & Arnay-de-la-Rosa, M. (1992)Ancient skeletal remains of the Canary Islands: bonehistology and chemical analysis. AnthropologischerAnzeiger 50, 201–215.
Gorbach, S. & Goldin, B.R. (1987) Diet and the excretionof enterohepatic cycling of estrogens. Preventive Medicine 16, 525–531.
Grandjean, A.C. (1989) Macronutrient intake of U.S.athletes compared with the general population andrecommendations made for athletes. AmericanJournal of Clinical Nutrition 49, 1070–1076.
Hanne, N., Dlin, R. & Rotstein, A. (1986) Physicalfitness, anthropometric and metabolic parameters invegetarian athletes. Journal of Sports Medicine 26,180–185.
Haralambie, G. (1981) Serum zinc in athletes in train-ing. International Journal of Sports Medicine 2, 136–138.
Harding, M.G., Crooks, H. & Stare, F.J. (1996) Nutri-tional studies of vegetarians. Journal of the AmericanDietetic Association 48, 25–28.
Helman, A.D. & Darnton-Hill, I. (1987) Vitamin andiron status in new vegetarians. American Journal ofClinical Nutrition 45, 785–789.
Hill, P., Garbaczewski, L., Haley, L. & Wynder, E.L.(1984) Diet and follicular development. AmericanJournal of Clinical Nutrition 39, 771–777.
Howie, B.J. & Shultz, T.D. (1985) Dietary and hormonalinterrelationships among vegetarian Seventh-DayAdventists and nonvegetarian men. American Journalof Clinical Nutrition 42, 127–134.
Hunt, I.F., Murphy, N.J., Henderson, C. et al. (1989)Bone mineral content in postmenopausal women;comparison of omnivores and vegetarians. AmericanJournal of Clinical Nutrition 50, 517–523.
the vegetarian athlete 455

James, W.P.T., Branch, W.J. & Southgate, D.A.T. (1978)Calcium binding by dietary fibre. Lancet i, 638.
Janelle, K.C. & Barr, S.I. (1995) Nutrient intakes andeating behavior scores of vegetarian and nonvegetar-ian women. Journal of the American Dietetic Association2, 180–186.
Kadrabova, J., Madaric, A., Kovacikova, Z. & Ginter, E.(1995) Selenium status, plasma zinc, copper andmagnesium in vegetarians. Biological Trace ElementResearch Journal 50, 13–24.
Kaiserauer, S., Snyder, A.C., Sleeper, M. & Zierath, J.(1989) Nutritional, physiological, and menstrualstatus of distance runners. Medicine and Science inSports and Exercise 21, 120–125.
Lloyd, T., Shaeffer, J.M., Walker, M.A. & Demers, L.M.(1991) Urinary hormonal concentrations and spinalbone densities of premenopausal vegetarian andnonvegetarian women. American Journal of ClinicalNutrition 54, 1005–1010.
Lukaski, H.C. (1989) Effects of exercise training onhuman copper and zinc nutrition. Advances in Experi-mental Medicine and Biology 258 (2), 163–170.
Lukaski, H.C., Hoverson, B.S., Gallagher, S.K. &Bolonchuk, W.W. (1990) Physical training andcopper, iron, and zinc status of swimmers. AmericanJournal of Clinical Nutrition 51, 1093–1099.
Lyle, R.M., Weaver, C.M., Sedlock, D.A., Rajaram, S.,Martin, B. & Melby, C.L. (1992) Iron status in exer-cising women: the effect of oral iron therapy vsincreased consumption of muscle foods. AmericanJournal of Clinical Nutrition 56, 1049–1055.
Naik, J. & Snyder, A.C. (1997) The inter-relationshipamong endurance training, consumption of a vege-tarian diet and serum testosterone concentration.Medicine and Science in Sports and Exercise 29, S295.
Nieman, D.C. (1988) Vegetarian dietary practices andendurance performance. American Journal of ClinicalNutrition 48, 754–761.
Pate, R.R., Miller, B.J., Davis, J.M., Slentz, C.A. & Kling-shirn, L.A. (1993) Iron status of female athletes.International Journal of Sport Nutrition 3, 222–231.
Pedersen, A.B., Bartholomew, M.J., Dolence, L.A.,Aljadir, L.P., Netteburg, K.L. & Lloyd, T. (1991) Menstrual differences due to vegetarian and nonveg-etarian diets. American Journal of Clinical Nutrition 53,879–885.
Pirke, K.M., Schweiger, U., Laessle, R., Dickhaut, B.,Schweiger, M. & Waechtler, N. (1986) Dieting influ-ences the menstrual cycle: vegetarian versus nonveg-etarian diet. Fertility Sterility 46, 1083–1088.
456 special considerations
Ratzin, R.A. (1995) Nutritional concerns for the vege-tarian recreational athlete. In Nutrition for the Recrea-tional Athlete (ed. C.G.R. Jackson). CRC Press, BocaRaton, FL.
Rauma, A.L., Torronen, R., Hanninen, O. & Mykkanen,H. (1995) Vitamin B-12 status of long-term adherentsof a strict uncooked vegan diet (‘living food diet’) iscompromised [see comments]. Journal of Nutrition125, 2511–2515.
Reinhold, J.G., Faradji, B., Abadi, P. & Ismail-Beigi, F.(1976) Decreased absorption of calcium, magnesium,zinc and phosphorus by humans due to increasedfiber and phsophorus consumption as wheat bread.Journal of Nutrition 106, 493–503.
Rudd, J. (1989) Vegetarianism: Implications for Athletes.US Olympic Committee, Sports Medicine andScience Division and International Center for SportsNutrition, Omaha, NB.
Ryan, A.J. (1981) Anabolic steroids are fool’s gold. Fed-eration Proceedings 40, 2682–2685.
Shaw, N.S., Chin, C.J. & Pan, W.H. (1995) A vegetariandiet rich in soybean products compromises ironstatus in young students. Journal of Nutrition 125,212–219.
Singh, A., Deuster, P.A. & Moser, P.B. (1990) Zinc andcopper status in women by physical activity andmenstrual status. Journal of Sports Medicine and Physi-cal Fitness 30, 29–36.
Slavin, J., Lutter, J. & Cushman, S. (1984) Amenorrhoeain vegetarian athletes (Letter). Lancet 1, 1474–1475.
Snyder, A.C., Dvorak, L.L. & Roepke, J.B. (1989) Influ-ence of dietary iron source on measures of iron statusamong female runners. Medicine and Science in Sportsand Exercise 21, 7–10.
Wardlaw, G.M. & Insel, P.M. (1995) Perspectives in Nutri-tion, 3rd edn. Mosby Year Book, St Louis, MO.
Weaver, C.M., Heaney, R.P., Teegarden, D. & Hinders,S.M. (1996) Wheat bran abolishes the inverse rela-tionship between calcium load size and absorptionfraction in women. Journal of Nutrition 126, 303–307.
Whorton, J.C. (1982) Crusaders for Fitness. PrincetonUniversity Press, Princeton, NJ.
Williford, H.N., Olson, M.S., Keith, R.E. et al. (1993) Ironstatus in women aerobic dance instructors. Interna-tional Journal of Sport Nutrition 3, 387–397.
Wishart, G.M. (1934) The efficiency and performance ofa vegetarian racing cyclist under different dietaryconditions. Journal of Physiology 82, 189–199.

Introduction
Diabetes mellitus is a disease of abnormal regula-tion of glucose metabolism, resulting in an elevated blood glucose concentration which may arise for different reasons. Consequently,the treatments of the disease are varied. Exercisetraining for people with diabetes mellitus mustalso be viewed in the light of the aetiology of thedisease, as the physiological response to exercisecan differ. In one form of diabetes mellitus, train-ing is regarded as a cornerstone in the treatmentof the disease, whereas training is a challenge inthe other form of diabetes.
Diabetes mellitus is classified into two distincttypes:1 Insulin-dependent diabetes mellitus (IDDM,or type I or juvenile diabetes), which requiresinsulin replacement on a daily basis becauseinsulin secretion is almost totally lacking.2 Non-insulin-dependent diabetes mellitus(NIDDM, or type II), in which the earlypathological lesion is a decreased sensitivity ofskeletal muscle and liver to insulin (insulin resis-tance). The initial period of insulin resistance isassociated with increased circulating concentra-tions of insulin, but the blood glucose concentra-tion remains normal. NIDDM develops when thepancreatic b-cell is no longer able to secrete theappropriate amount of insulin to maintain ad-equate blood glucose concentrations and hyper-glycaemia is the direct consequence.
The incidence of diabetes mellitus has in-creased during recent decades. In particular, the
incidence of NIDDM has increased dramaticallyand up to 10–20% of people over 65 years oldsuffer from NIDDM in many countries. NIDDMis associated with an increased risk for many dis-eases such as coronary heart disease, neuropathy,renal failure, and blindness (Kahn 1998). InNIDDM, the management of blood glucose con-centration with prescribed pharmaceutical drugsis poor and diet and regular physical exercise areimportant therapeutic treatments for the disease.
Only a small portion of diabetics (about 10%)are IDDM, but this group requires particularlyclose monitoring because IDDM develops earlyin life. Exercise training and physical activity are natural things for children to do and theopportunity to participate in sports is importantfor social development. IDDM is treated withinsulin and the combination of exercise trainingand insulin injection may cause too high a stimu-lation of peripheral glucose uptake, resulting inhypoglycaemia. The requirement of insulin isinfluenced by exercise and the dose of insulinmust therefore be varied with the intensity andduration of exercise. Thus, in people with IDDMphysical exercise must be regarded as a chal-lenge, but, with education and management,people with IDDM can participate in exercisetraining together with non-diabetics, and canachieve the same health benefits.
Regulation of carbohydrate and fat metabolism during exercise
In working skeletal muscle, the demand for for-
Chapter 34
The Diabetic Athlete
JØRGEN JENSEN AND BRENDAN LEIGHTON
457

mation of adenosine triphosphate, which fuelsmuscle contraction, increases enormously (New-sholme & Leech 1983). The formation of adeno-sine triphosphate is driven by increased fluxthrough glycolysis and the tricarboxylic cycle.Exercise mobilizes intramuscular fuels in theform of glycogen and triacylglycerol to supplyglucose moieties and fatty acids, respectively.Exogenous fuels, in the form of glucose and non-esterified fatty acids (NEFA), are also taken upfrom the blood and oxidized together with intra-muscular fuels.
The glucose concentration in the blood,however, remains relatively stable because therate of peripheral glucose uptake is matched bythe rate of release of glucose into the circulation.Regulation of blood glucose concentration iscomplex and, in addition to exercise, several hor-mones participate in this regulation. Insulin isthe major hormone regulating the removal ofglucose from the blood. Glucose entering the circulation may be absorbed from the intestine(from food or glucose drinks) but most of thetime glucose is released from the liver as a resultof glycogen breakdown or glucose synthesizedvia gluconeogenesis. During exercise, the con-centrations of glucagon, catecholamines, cortisoland growth hormone all increase and these hormones stimulate glucose release from theliver and ensure that blood glucose concentra-tion remains relatively constant (Cryer & Gerich1985). The hormones that stimulate glucoserelease into the blood (and inhibit glucoseuptake) are often called counter-regulatory hormones.
The rate of glucose uptake is elevated in skele-tal muscle during exercise, although the insulinconcentration decreases during exercise. Severalstudies have shown that glucose uptake is stimu-lated by exercise, even in the absence of insulin(Richter 1996) and the reduction of insulin con-centration during exercise may be important foravoiding hypoglycaemia (Cryer & Gerich 1985).Insulin is a strong inhibitor of lipolysis in fat cellsand of glucose release from the liver. A fall in theinsulin concentration is important to optimizethe supply of NEFA to the contracting muscles.
458 special considerations
The decrease in basal insulin concentration aids the release of NEFA from adipose tissue andglucose from the liver.
During prolonged exercise, the concentrationof glycogen in skeletal muscles decreases andglucose uptake from the blood becomes gradu-ally more important. When skeletal muscles are depleted of glycogen, glucose uptake mayaccount for nearly all carbohydrate oxidation(Wahren et al. 1971). When the liver is depleted ofglycogen, glucose is released at much lower ratesand the blood glucose concentration decreases. Adecrease in blood glucose concentration is wellrecognized as a major factor in the fatigue that accompanies endurance exercise, and thereduced supply of carbohydrate to the centralnervous system and to the muscle may both befactors in the fatigue process (Costill & Harg-reaves 1992).
The intensity of exercise is also an importantdeterminant of the rate of carbohydrate utiliza-tion. During exercise of an intensity of about 50%of V
.o2max., the energy comes equally from fat and
carbohydrate metabolism and, as the intensity of the exercise increases, the percentage contri-bution from carbohydrates rises. At intensities of exercise above 80% V
.o2max., carbohydrates
become the major metabolic fuel. At this inten-sity of exercise, glucose uptake is also muchhigher, and depletion of liver glycogen will occurin 1–2 h followed by a decrease in concentrationof blood glucose. During exercise of short dura-tion and high intensity, on the other hand, thehepatic glucose output can exceed the rate ofglucose uptake and lead to hyperglycaemia.
Regulation of carbohydrate and fat metabolism after exercise
The ability to convert chemical energy to fuelskeletal muscle contraction is essential forhuman movement. Skeletal muscles have,however, also an important role for regulation ofthe blood glucose concentration, as most of theglucose disposal stimulated by insulin occurs inskeletal muscle (Shulman et al. 1990).
After a carbohydrate-rich meal, the increased

concentration of glucose in the blood causes arelease of insulin from the b-cells in the pancreas.Insulin binds to its receptor and stimulatesglucose transport and metabolism, particularlyin heart, skeletal muscle and adipose tissue. Thesignalling pathway for insulin has been studiedextensively and during the last decade themechanism of action of insulin has become muchclearer (Kahn 1998).
Glucose is transported into cells by proteinscalled glucose transporters. There are differentisoforms of the glucose transporters and theirexpression is tissue specific (Holman & Kasuga1997). GLUT-4 is expressed in tissue where in-sulin stimulates glucose uptake (skeletal muscle,heart and adipose tissue) and GLUT-4 is namedthe insulin-regulated glucose transporter. Insulinstimulates glucose uptake by recruitment ofGLUT-4 from intracellular sites to the sarcolem-mal membrane (Fig. 34.1). GLUT-4 is normallylocated in vesicles in the cells, but during insulinstimulation, GLUT-4 is translocated to the cellmembrane by exocytosis (Holman & Kasuga1997). When GLUT-4 transporter proteins are inthe sarcolemmal membrane, they will transportglucose into the cells, and the amount of GLUT-4in the sarcolemmal membrane is regarded as theregulatory step for glucose uptake. GLUT-4 willbe internalized when the insulin stimulation is
removed and glucose transport will decrease tobasal level again.
Skeletal muscle makes up 30–40% of the bodyweight and the 70–90% of the insulin-stimulatedglucose uptake occurs in this tissue (Shulman et al. 1990). Therefore, it is evident that skeletalmuscles play a central role in regulation ofglucose metabolism. Glucose taken up in skeletalmuscle during insulin stimulation is incorpo-rated into glycogen (Shulman et al. 1990), butskeletal muscles are unable to release glucoseinto the bloodstream to maintain blood glucoseconcentration. Skeletal muscle glycogen can,however, be broken down to lactate and releasedfrom skeletal muscle for conversion to glucose inthe liver via gluconeogenesis. Skeletal muscleglycogen is therefore indirectly a carbohydratesource for maintaining blood glucose.
Exercise recruits GLUT-4 to the sarcolemmalmembrane in a manner similar to the effects ofinsulin. Although both exercise and insulin stim-ulate glucose uptake by translocation of GLUT-4to the sarcolemmal membrane, this processseems to occur via different signalling pathways(Richter 1996) and exercise stimulates glucoseuptake even in insulin resistant muscles (Etgen etal. 1996). Another effect of exercise is that insulinsensitivity increases in skeletal muscle after exer-cise (Richter 1996). This means that lower insulin
the diabetic athlete 459
Glucosetransport
Fusion
VesicleFission
GLUT-4
+
Cellmembrane
Insu
li
Fig. 34.1 Schematic illustration showing regulation of glucose transport in skeletal muscle. When insulin binds tothe insulin receptor, GLUT-4-containing vesicles are translocated to the sarcolemmal membrane. GLUT-4transports glucose into the cell when they are located in the sarcolemmal membrane. In insulin-resistant muscles,translocation is reduced in response to insulin.

concentrations are required to remove glucose,and in line with this, highly trained people have lower circulating insulin levels and a re-duced insulin response to a glucose challenge.However, the increased insulin sensitivityduring and after exercise increases the risk forhypoglycaemia in insulin-treated diabetics.
Insulin-dependent diabetes mellitus
In people with IDDM, insulin secretion is lackingor insufficient because of an almost total destruc-tion of the insulin secreting b-cells in the pan-creas. The b-cells are destroyed by the diabetic’sown immune system (autoimmune destruction).IDDM is treated with life-long insulin therapy byinsulin injection several times each day. Insulin isproduced as long-acting (elevates blood insulinconcentration for many hours) and rapid-acting(elevates blood insulin for a much shorter periodof time) forms and most patients take a mixtureof both forms. In the evening (and some timesmorning), long-acting insulin is injected to main-tain the basal insulin concentration. Before each meal, rapid-acting insulin is injected to stimulateremoval of the absorbed glucose. The insulindose required depends on the individual and it isimportant to measure glucose concentrationoften to establish the correct dose.
Exercise training for IDDM
IDDM normally develops at a young age andexercise is a natural activity for children. It is par-ticularly important for their social developmentthat they get the opportunity to participate ingroup exercises with other children. Althoughsome children with IDDM develop fear ofparticipation in sports, exercise is regarded assafe if children with IDDM are educated to adjusttheir dose of insulin to the intensity of exercise.Many people with IDDM participate in sport andthere are several examples of athletes at the top oftheir sports.
These athletes clearly show that it is possiblefor diabetic athletes to achieve a high perfor-mance level. In non-diabetics, exercise training
460 special considerations
causes adaptations in skeletal muscle and circu-latory system which is the background to theincreased performance (Holloszy & Booth 1976).People with IDDM seem, however, to respond totraining in a similar way and there are thereforeno physiological reasons for not participating insport (Wallberg-Henriksson 1992).
Exercise training for people with IDDM is,however, not without problems. The insulin con-centration is important for control of the glucoseconcentration and too high a concentration ofinsulin in combination with exercise may causehypoglycaemia. Too low a concentration of insu-lin, on the other hand, may cause elevation inblood glucose and ketoacidosis. The greatestproblem is the development of hypoglycaemiabecause of the inability to regulate prevailingblood insulin concentrations. In people withIDDM the insulin concentration in blood willdepend on the amount of insulin administeredand the rate of release of insulin from the site ofinjection. The normal decrease in insulin levelduring exercise will therefore not occur in peoplewith IDDM and, as exercise increases insulin sen-sitivity, glucose uptake in skeletal muscles maybe too high. To mimic the reduction in concentra-tion of insulin that occurs in normal subjectsduring exercise, insulin injections have to beavoided immediately prior to exercise in peoplewith IDDM.
Before exercise, it is important that the glucoseand insulin concentrations are neither too highnor too low (Horton 1988). The concentration ofglucose should be measured to give informationabout the insulin level. If the blood glucose con-centration is below 5mm, it may be a result of toohigh a concentration of insulin and there is a highrisk for hypoglycaemia if exercise is performed.It is therefore not advised to participate in exer-cise, and glucose should be taken to raise theblood glucose concentration before exercise isperformed. Furthermore, it is important that athletes with IDDM should be able to recognizethe symptoms of hypoglycaemia and respondaccordingly.
Exercise is not recommended when the bloodglucose concentration is above 16mm (Wallberg-

Henriksson 1992). Too high a glucose concentra-tion may be a result of a low concentration ofinsulin. Exercise in under-insulinated diabeticsmay result in a further increase in blood glucoseconcentration as the normal inhibition of glucoserelease from the liver is lacking (Wallberg-Henriksson 1992). Low insulin concentrationwill also cause elevated lipolysis and the highconcentration of NEFA may increase productionof ketone bodies, resulting in ketoacidosis (Wall-berg-Henriksson 1992). In case of high glucoseconcentration, it is recommended that ketonebody levels should be checked in urine (Horton1988). However, if a large meal has been eatenshortly before exercise and minimal rapid-actinginsulin is taken, exercise will decrease glucoseconcentration to a normal level (Sane et al. 1988).
Although exercise decreases blood glucoseconcentration and increases insulin sensitivity inskeletal muscle, exercise may not be regarded asa treatment for IDDM (Kemmer & Berger 1986;Horton 1988; Wallberg-Henriksson 1992). In contrast to NIDDM, training does not seem toimprove glycaemic control in IDDM (Wallberg-Henriksson et al. 1984; Wallberg-Henriksson1992; Ebeling et al. 1995). Elite athletes require a higher amount of carbohydrates in the diet,which makes the regulation of blood glucosemore difficult. Furthermore, participation in elitesport is often accompanied with travelling andother changes in their daily routine which alsomake administration of insulin more difficult.For elite athletes it is therefore important that theblood glucose is monitored carefully and athletesmust learn to correct the insulin requirements tothe exercise performed. In learning this, it is recommended that the athletes write down theblood glucose concentration before and afterexercise of different type, intensity, and durationand relate it to ingestion of carbohydrates andinjection of insulin.
Dietary considerations
An important part of treatment of IDDM is edu-cation. Today it is normal to have a small bloodglucose analyser at home to monitor glucose
concentration on a regular basis. The dose ofinsulin needed differs between individuals andthe requirement for insulin to handle a mealvaries even within the same individual since, forexample, exercise increases insulin sensitivityand decreases the requirement for insulin.Ideally, IDDM subjects will want to achieve anormal pattern of food consumption. However,some foods with a high glycaemic index will beabsorbed rapidly (e.g. glucose in a soft drink)and this may cause some metabolic problems.Importantly, the amount of insulin taken before ameal should be matched with the anticipateddietary glucose uptake. This means that if theblood glucose concentration is high after a meal,the insulin dose is increased and vice versa.
If postprandial exercise is planned, precau-tions can be taken to improve glucose regulation.To avoid hypoglycaemia, Horton (1988) suggestseating a large meal 1–3 h before planned exerciseand to reduce insulin injection before this meal.Although it is difficult to give a standard recom-mendation, a reduction of 30–50% in rapid-acting insulin may be a starting point foradjustment of the dose to endurance exercise.Reduction of the insulin dose before strengthtraining and ball games may be smaller.However, it is important to measure bloodglucose concentration frequently, particularlywhen a new type of exercise is performed orwhen intensity or duration is changed. The doseof insulin before meals must be optimized to thenew and unfamiliar exercises.
If the duration of the exercise is more than 30min, extra glucose should be supplied. This glucose ingestion has two effects in IDDM; avoiding dangerous hypoglycaemia andimprovement of performance. As in non-diabet-ics, glucose ingestion increases performance inprolonged endurance sport. In IDDM, glucoseingestion should also prevent hypoglycaemia.Severe hypoglycaemia causes coma and hypo-glycaemic coma is potentially fatal for the dia-betic (Cryer & Gerich 1985). The only energysubstrate for the brain is glucose and severe braindamage will occur within minutes at very lowglucose concentrations (Cryer & Gerich 1985). It
the diabetic athlete 461
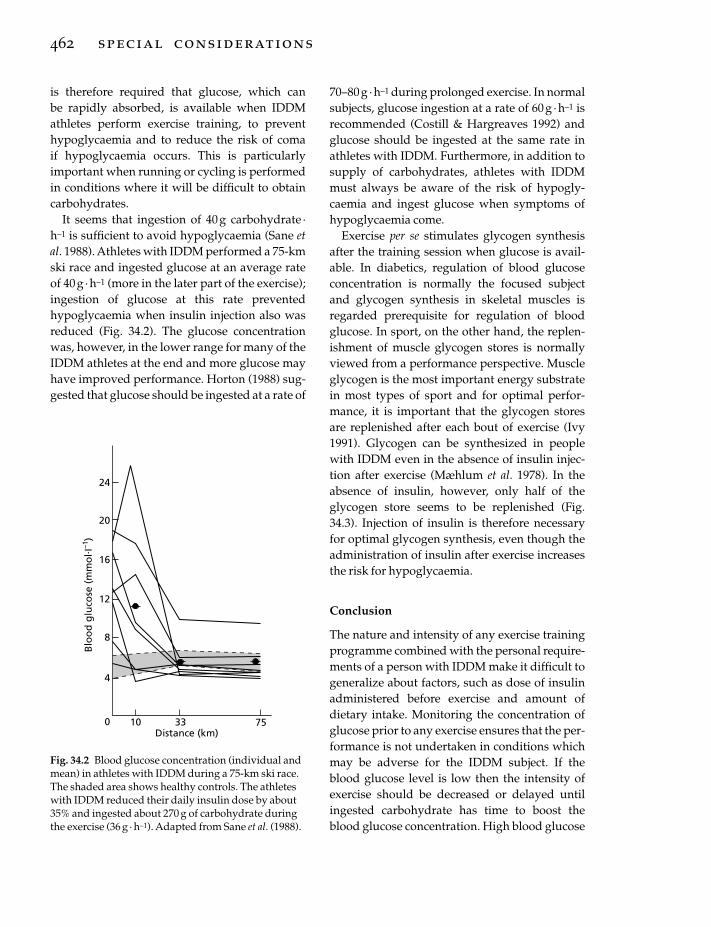
is therefore required that glucose, which can be rapidly absorbed, is available when IDDMathletes perform exercise training, to preventhypoglycaemia and to reduce the risk of coma if hypoglycaemia occurs. This is particularlyimportant when running or cycling is performedin conditions where it will be difficult to obtaincarbohydrates.
It seems that ingestion of 40g carbohydrate ·h–1 is sufficient to avoid hypoglycaemia (Sane etal. 1988). Athletes with IDDM performed a 75-kmski race and ingested glucose at an average rateof 40g ·h–1 (more in the later part of the exercise);ingestion of glucose at this rate prevented hypoglycaemia when insulin injection also wasreduced (Fig. 34.2). The glucose concentrationwas, however, in the lower range for many of theIDDM athletes at the end and more glucose mayhave improved performance. Horton (1988) sug-gested that glucose should be ingested at a rate of
462 special considerations
70–80g · h–1 during prolonged exercise. In normalsubjects, glucose ingestion at a rate of 60 g · h–1 isrecommended (Costill & Hargreaves 1992) andglucose should be ingested at the same rate inathletes with IDDM. Furthermore, in addition tosupply of carbohydrates, athletes with IDDMmust always be aware of the risk of hypogly-caemia and ingest glucose when symptoms ofhypoglycaemia come.
Exercise per se stimulates glycogen synthesisafter the training session when glucose is avail-able. In diabetics, regulation of blood glucoseconcentration is normally the focused subjectand glycogen synthesis in skeletal muscles isregarded prerequisite for regulation of bloodglucose. In sport, on the other hand, the replen-ishment of muscle glycogen stores is normallyviewed from a performance perspective. Muscleglycogen is the most important energy substratein most types of sport and for optimal perfor-mance, it is important that the glycogen storesare replenished after each bout of exercise (Ivy1991). Glycogen can be synthesized in peoplewith IDDM even in the absence of insulin injec-tion after exercise (Mæhlum et al. 1978). In theabsence of insulin, however, only half of theglycogen store seems to be replenished (Fig.34.3). Injection of insulin is therefore necessaryfor optimal glycogen synthesis, even though theadministration of insulin after exercise increasesthe risk for hypoglycaemia.
Conclusion
The nature and intensity of any exercise trainingprogramme combined with the personal require-ments of a person with IDDM make it difficult togeneralize about factors, such as dose of insulinadministered before exercise and amount ofdietary intake. Monitoring the concentration ofglucose prior to any exercise ensures that the per-formance is not undertaken in conditions whichmay be adverse for the IDDM subject. If theblood glucose level is low then the intensity ofexercise should be decreased or delayed untilingested carbohydrate has time to boost theblood glucose concentration. High blood glucose
10 33 75
Blo
od
glu
cose
(mm
ol. I
–1)
24
20
16
12
8
4
0Distance (km)
Fig. 34.2 Blood glucose concentration (individual andmean) in athletes with IDDM during a 75-km ski race.The shaded area shows healthy controls. The athleteswith IDDM reduced their daily insulin dose by about35% and ingested about 270 g of carbohydrate duringthe exercise (36 g · h–1). Adapted from Sane et al. (1988).

concentration should lead to the postponementof exercise for the reasons given above. The doseof insulin administered before any exerciseshould be scaled down to reflect the degree ofintensity and duration of exercise. However,individual IDDM subjects may have to reach theoptimum pre-exercise insulin dose by monitor-ing post-exercise glucose levels.
Non-insulin-dependentdiabetes mellitus
NIDDM is a world health problem and thedisease is often regarded as a disease of abnor-mal lifestyle. About 90% of all diabetics areNIDDM and the disease develops gradually andis normally associated with obesity and hyper-tension. Initially, the skeletal muscles and liverbecomes insulin resistant, but the body respondsby producing more insulin and glucose con-centration remains normal. However, as theinsulin resistance increases, the pancreasbecomes unable to produce enough insulin toregulate the metabolism of blood glucose con-centration and hyperglycaemia occurs.
The pharmacological treatment of NIDDM ispoor. As the muscles are insulin resistant, insulintherapy is not a satisfactory treatment of thedisease. There are some other drugs prescribed,such as sulphonylureas and metformin. NIDDMis in most case initially treated with dietarymanipulation and exercise. This treatment is sufficient for many people with NIDDM if the
disease has not progressed too far. Exercise ofmoderate intensity in people with NIDDM isusually associated with a decrease in bloodglucose towards the normal range. A furtherbenefit of regular exercise is that it increases thesensitivity of skeletal muscle to insulin, whichwill have the beneficial effect of lowering therequirement for circulating insulin concentra-tion. It is important to recognize that exercise alsolowers the risk factors for cardiovascular diseasein people with NIDDM.
Exercise training for NIDDM
NIDDM is normally associated with obesity anda low exercise capacity. NIDDM develops later inlife than IDDM and the majority of patients areover 50 years old. The aims of exercise trainingfor people with NIDDM are therefore often dif-ferent from those of young people with IDDM.People with NIDDM are often untrained and animproved level of physical fitness is normally themain goal. As for untrained people in general,there are large opportunities for improvementand training studies have shown that endurancetraining increases maximum oxygen uptake andoxidative capacity in skeletal muscle (Wallberg-Henriksson 1992).
Obesity may hinder training and a high bodymass increases the risk of injury to joints andtendons. In people with NIDDM, it is also impor-tant to be aware of the risk for foot problems, par-ticularly in diabetics with peripheral neuropathy,
the diabetic athlete 463
Exercise Recovery
0 2 4 6 8 10 12
(mm
ol. k
g–1
wet
wt)
Mu
scle
gly
cog
enco
nte
nt
80
60
40
20
0
Time (h)
Fig. 34.3 Glycogen synthesis inIDDM subjects after exercise in thepresence (�) or absence (�) ofinsulin. Subjects exercised at 75% ofV.o2max. until exhaustion and
received a carbohydrate-rich dietand their normal insulin injection inthe control experiment. On theother experimental day, insulin wasnot injected. Adapted fromMæhlum et al. (1978).

and good shoes and attention to hygiene must bestressed. In previously untrained NIDDM, thetraining must start slowly, as with all sedentaryindividuals who embark on an exercise pro-gramme. However, although a larger percentageof energy comes from fat at lower intensityendurance training, it is important to achieve a progressive increase in intensity to obtain the largest improvement in glucose tolerance.Endurance training at higher intensities is proba-bly the most effective way to reduce body weightand increase insulin sensitivity (Koivisto et al.1986; Kang et al. 1996).
In people with NIDDM, insulin-stimulatedglucose uptake is reduced in skeletal muscles(Shulman et al. 1990). Much research is directedat finding the reason for this reduced insulin sensitivity. The amount of GLUT-4 is normal ininsulin-resistant muscle but insulin is unable totranslocate GLUT-4 to the cell membrane (Etgenet al. 1996). Exercise training, however, stimulatesglucose uptake in skeletal muscle and increasesinsulin sensitivity in insulin-resistant muscles(Koivisto et al. 1986; Etgen et al. 1997). Insulinresistance in skeletal muscle develops prior to NIDDM and endurance training seems toprevent the development of insulin resistance.Furthermore, endurance training increasesinsulin sensitivity in people with NIDDM and improves the regulation of blood glucoseconcentration.
Strength training is normally not regarded tobe as effective as endurance training in increas-ing insulin sensitivity (Koivisto et al. 1986).However, most people with NIDDM are older,untrained people and with increasing age theskeletal muscle atrophies. Reduction in the massof muscle available to remove glucose from the blood during insulin stimulation decreasesglucose tolerance. Strength training whichincreases muscle mass in older, untrained peoplewith NIDDM may be more effective thanendurance training to increase glucose tolerance.Strength training may, however, cause vascularside-effects and precautions should be taken(Wallberg-Henriksson 1992).
464 special considerations
Dietary considerations for NIDDM
NIDDM is often associated with obesity, hyper-tension and hyperlipidaemia (Koivisto et al.1986). Obesity is a risk factor for NIDDM andweight reduction improves insulin sensitivity inskeletal muscles. Weight reduction is therefore,together with training, central in the treatment ofmost people with NIDDM. For the reduction ofbody mass, energy intake must be lower thanenergy utilization and food intake must nor-mally be reduced. Furthermore, a high-fat dietcauses insulin resistance in skeletal muscles.People with NIDDM are therefore recommendedto reduce their fat intake. Furthermore, in con-trast to IDDM, insulin treatment is unable tostimulate glucose disposal after a large meal inNIDDM. Large meals will therefore cause an ele-vation in blood glucose. It is therefore advisedthat people with NIDDM eat smaller meals andthat the content of complex carbohydrates ishigh.
Hypoglycaemia during and after exercise isnot a major problem in NIDDM when thetherapy is changed diet and increased exercisetraining. Pharmacological treatments of NIDDMwith insulin, sulphonylureas or metformin mayincrease the risk of hypoglycaemia. However, therisk for development of hypoglycaemia in phar-macologically treated diabetics with NIDDM is still much lower than in people with IDDM.During exercise, carbohydrate supply is nor-mally not necessary in people with NIDDM andwater should be drunk to replace fluid.
Replenishment of glycogen stores is importantfor performance (Ivy 1991). However, in mostpeople with NIDDM, improved regulation of theblood glucose concentration is more importantthan improved performance. Most of the glucosetaken up during insulin stimulation is incor-porated into glycogen and a high glycogen concentration in skeletal muscle reduces insulin-stimulated glucose uptake (Jensen et al. 1997).Normal regulation of blood glucose metabolismrequires that glucose can be incorporated intoglycogen in skeletal muscles and a high glycogen

content impedes this. The reduced glycogen con-centration after exercise in people with NIDDMis important for improved glucose metabolismand reduced glycogen stores will aid the disposalof blood glucose.
Conclusion
NIDDM is often associated with obesity andreduction of body mass is important to improveglucose metabolism. Exercise increases energyconsumption and has an important role is anyweight-loss programme. Exercise increases alsoinsulin sensitivity in skeletal muscle, leading toan improved regulation of the blood glucose concentration. Exercise therefore has a centralposition in the management of most people with NIDDM. However, as most of the peoplewith NIDDM are overweight, it is important tofind types of exercise that can be performed.Endurance training such as running may causejoint and tendon problems because of the highbody mass. Cycling or swimming may be goodalternatives. Furthermore, strength training maybe effective to increase glucose tolerance in olderpeople. Most of the glucose is taken up by skele-tal muscles during insulin stimulation and anincreased muscle mass will improve removal ofglucose from the blood.
References
Costill, D.L. & Hargreaves, M. (1992) Carbohydratenutrition and fatigue. Sports Medicine 13, 86–92.
Cryer, P.E. & Gerich, J.E. (1985) Glucose counterregula-tion, hypoglycemia, and intensive insulin therapy indiabetes mellitus. New England Journal of Medicine313, 232–241.
Ebeling, P., Tuominen, J.A., Bourey, R., Koranyi, L. &Koivisto, V.A. (1995) Athletes with IDDM exhibitimpaired metabolic control and increased lipid utilization with no increase in insulin sensitivity. Diabetes 44, 471–477.
Etgen, G.J., Wilson, C.M., Jensen, J., Cushman, S.W. &Ivy, J.L. (1996) Glucose transport and cell surfaceGLUT-4 protein in skeletal muscle of the obeseZucker rat. American Journal of Physiology 271,E294–E301.
Etgen, G.J., Jensen, J., Wilson, C.M., Hunt, D.G.,Cushman, S.W. & Ivy, J.L. (1997) Exercise trainingreverses insulin resistance in muscle by enhancedrecruitment of GLUT-4 to the cell surface. AmericanJournal of Physiology 272, E864–E869.
Holloszy, J.O. & Booth, F.W. (1976) Biochemical adapta-tions to endurance exercise in muscle. Annual Reviewof Physiology 38, 273–291.
Holman, G.D. & Kasuga, M. (1997) From receptor totransporter: insulin signalling to glucose transport.Diabetologia 40, 991–1003.
Horton, E.D. (1988) Role and management of exercisein diabetes mellitus. Diabetes Care 11, 201–211.
Ivy, J.L. (1991) Muscle glycogen synthesis before andafter exercise. Sports Medicine 11, 6–19.
Jensen, J., Aslesen, R., Ivy, J.L. & Brørs, O. (1997) Role ofglycogen concentration and epinephrine on glucoseuptake in rat epitrochlearis muscle. American Journalof Physiology 272, E649–E655.
Kahn, B.B. (1998) Type 2 diabetes: when insulin secre-tion fails to compensate for insulin resistance. Cell 92,593–596.
Kang, J., Robertson, R.J., Hagberg, J.M. et al. (1996)Effect of exercise intensity on glucose and insulinmetabolism in obese individuals and obese NIDDMpatients. Diabetes Care 19, 341–349.
Kemmer, F.W. & Berger, M. (1986) Therapy and betterquality of life: the dichotomous role of exercise in diabetes mellitus. Diabetes/Metabolism Reviews 2,53–68.
Koivisto, V.A., Yki-Järvinen, H. & DeFronzo, R.A.(1986) Physical training and insulin sensitivity. Diabetes/Metabolism Reviews 1, 445–481.
Mæhlum, S., Høstmark, A.T. & Hermansen, L. (1978)Synthesis of muscle glycogen during recovery afterprolonged severe exercise in diabetic subjects. Effectof insulin deprivation. Scandinavian Journal of Clinicaland Laboratory Investigations 38, 35–39.
Newsholme, E.A. & Leech, A.R. (1983) Biochemistry forthe Medical Sciences. John Wiley & Sons, Chichester.
Richter, E.A. (1996) Glucose utilization. In Handbook ofPhysiology. Section 12. Exercise: Regulation and Integra-tion of Multiple Systems (ed. L.B. Rowell & J.T. Shepherd), pp. 912–951. Oxford University Press,Oxford.
Sane, T., Helve, E., Pelkonen, R. & Koivisto, V.A. (1988)The adjustment of diet and insulin dose during long-term endurance exercise in type 1 (insulin-dependent) diabetic men. Diabetologia 31, 35–40.
Shulman, G.I., Rothman, D.L., Jue, T., Stein, P.,DeFronzo, R.A. & Shulman, R.G. (1990) Quantifica-tion of muscle glycogen synthesis in normal subjectsand subjects with non-insulin-dependent diabetesby 13C nuclear magnetic resonance spectroscopy.New England Journal of Medicine 322, 223–228.
the diabetic athlete 465

Wahren, J., Felig, P., Ahlborg, G. & Jorfeldt, L. (1971)Glucose metabolism during leg exercise in man.Journal of Clinical Investigation 50, 2715–2725.
Wallberg-Henriksson, H. (1992)) Exercise and diabetesmellitus. Exercise and Sport Sciences Reviews 20,339–368.
466 special considerations
Wallberg-Henriksson, H., Gunnarsson, R., Henriksson,J., Östman, J. & Wahren, J. (1984) Influence of physi-cal training on formation of muscle capillaries intype I diabetes. Diabetes 33, 351–357.

PART 3
PRACTICAL ISSUES


Introduction
For the sport medicine team, the overweightathlete can present numerous challenges. First,the type of athlete who wants or needs to loseweight can vary dramatically, from a smallfemale participating in a lean build sport (gym-nastics, track and field, figure skating) to a largemale participating in a strength or power sport(weightlifting, heavy weight wrestling). Some ofthese athletes may also participate in sports thatrequire ‘making weight,’ which adds a uniquechallenge to any health professional guidingthem through the weight-loss process. These ath-letes may not be ‘overfat or overweight’ accord-ing to normal criteria, but may be consideredheavy for their sport or for the weight category inwhich they must compete. To further complicatethe weight-loss process, some athletes partici-pate in sports in which they are judged on bothperformance and appearance. This can add pres-sure to reduce body weight lower than optimalfor good health and performance. Second, theweight-loss programme needs to provide ad-equate energy so that exercise training can stilloccur. The diet cannot be too restrictive in energywithout the athlete running the risk of injury, lossof fat-free mass (FFM), poor performance, feel-ings of deprivation, and eventual failure. Thus,adequate time needs to be allotted for weight lossto occur. Aerobic and strength training may alsoneed to be added if they are not already a part ofthe athlete’s normal training programme.Finally, the weight-loss programme needs to
provide a strong educational component. Theathlete needs to be taught good nutritional, exer-cise and behavioural techniques for long-termweight maintenance. Without an educationalcomponent, the athlete is susceptible to the manyfad diets, diet products, and weight-loss drugsthat frequently hit the consumer market. Withthe emphasis placed on physical appearance inWestern society, dieting can become obsessive.The athlete is not immune to this pressure. Infact, they are pressured on two fronts: their sportand society. This pressure can lead to desperatemeans of weight loss and an eventual eating disorder.
This review will briefly outline the principlesand components of energy balance that need tobe considered before placing an athlete on aweight-loss programme. Specific methods fordetermining energy balance in an athlete willalso be reviewed. Finally, practical applicationsand guidelines for determining the weight-lossgoal and approaches to gradual weight loss willbe given. For individuals working with athletesin weight-category sports, the effects of rapidweight loss on health and performance has beenaddressed elsewhere (Steen & Brownell 1990;Horswill 1992, 1993; Fogelholm 1994). Otherexcellent reviews are available on the effect ofweight loss on sport performance (Wilmore1992a), the techniques used in different sports(Fogelholm 1994; Burke 1995), the effect ofweight loss on health and metabolism (Brownellet al. 1987), and the role of dieting in eating disor-ders (Wilmore 1991; Sundgot-Borgen 1993, 1994;
Chapter 35
The Overweight Athlete
MELINDA M. MANORE
469

Beals & Manore 1994) and menstrual dysfunc-tion (Dueck et al. 1996). Part 4 of this book givesmore specific information about the weight andnutrition concerns of different sports, particu-larly weight-category sports.
Energy and nutrient balance
The classic energy balance equation states that ifenergy intake equals energy expenditure thenweight is maintained; however, this equationdoes not allow for changes in body compositionand energy stores (Ravussin & Swinburn 1993).The maintenance of body weight and composi-tion over time requires that energy intake equalsenergy expenditure, and that dietary intakes ofprotein, carbohydrate, fat and alcohol equal theiroxidation rates (Flatt 1992; Swinburn & Ravussin1993). If this occurs, an individual is consideredto be in energy balance and body weight andcomposition will be maintained.
This approach to energy balance is dynamicand allows for the effect of changing energystores on energy expenditure over time. Forexample, after a short period of positive energybalance, the extra energy would cause weightgain (of both fat and lean tissues). However, the larger body size would cause an increase in energy expenditure that would eventuallybalance the extra energy consumed. Thus,weight gain can be the consequence of an initialpositive energy balance, but can also be a mecha-nism whereby energy balance is eventuallyrestored. Conversely, weight loss must reversethis process. If body fat is to be lost, energy intakemust be less than expenditure, and fat oxidationmust exceed fat intake (Westerterp 1993).
Nutrient balance
The alteration of energy intake and expenditureis just one part of the energy balance picture.Changes in the type and amount of nutrientsconsumed (i.e. protein, fat, carbohydrate andalcohol) and the oxidation of these nutrientswithin the body must also be considered. Undernormal physiological conditions, carbohydrate,
470 practical issues
protein and alcohol are not easily converted to body fat (Abbott et al. 1988; Swinburn &Ravussin 1993). Thus, increases in the intake ofnon-fat nutrients stimulate their oxidation ratesproportionally. Conversely, an increase in fatintake does not immediately stimulate fat oxida-tion, hence increasing the probability that dietaryfat will be stored as adipose tissue (Abbott et al.1988; Westerterp 1993). Therefore, the type offood consumed plays a role in the amount ofenergy consumed and expended each day(Acheson et al. 1984; Swinburn & Ravussin 1993).Successful weight loss requires that an energydeficit be produced (either through increasedenergy expenditure and/or decreased energyintake) and diet composition and oxidation bealtered (decreased fat intake and/or increased fatoxidation through exercise) (Hill et al. 1993).
Carbohydrate balance
Carbohydrate balance is proposed to be preciselyregulated (Flatt 1992), with the ingestion of car-bohydrate stimulating both glycogen storageand glucose oxidation, and inhibiting fat oxida-tion (Fig. 35.1). Glucose not stored as glycogen isthought to be oxidized directly in almost equalbalance to that consumed (Schutz et al. 1989;Thomas et al. 1992). Thus, the conversion ofexcess dietary carbohydrate to triglycerides doesnot appear to occur to any large extent in humansunder normal physiological conditions (Achesonet al. 1988; Hellerstein et al. 1991).
Protein balance
Like carbohydrate, the body alters protein oxida-tion rates to match protein intakes (Thomas et al.1992). Once anabolic needs are met, the carbonskeletons of excess amino acids can be used forenergy. The adequacy of both energy and carbo-hydrate intake dramatically affects this process.Inadequate energy or carbohydrate intakes willresult in negative protein balance, while excessintake of energy or carbohydrate will spareprotein (Krempf et al. 1993). Any excess dietaryprotein or that made available through protein

sparing may contribute indirectly to fat storageby sparing dietary fat.
Fat balance
Fat balance is not as precisely regulated as eitherprotein or carbohydrate balance (Flatt 1992).
Figure 35.2 shows that as fat intake increases, theoxidation of fat does not increase proportion-ately (Thomas et al. 1992). Thus, acute increasesin fat intake have little influence on fat oxidation.For example, Jebb et al. (1996) overfed three leanmen by 33% of energy requirements for 12 days.They found that carbohydrate and protein intake
the overweight athlete 471
200
150
100
50
0
1000
800
600
400
200
0
200
150
100
50
0
–500 50 100 150 200
0 50 100 150 200
0 200 400 600 800 1000
Protein intake (g.day–1)
CHO intake (g.day–1)
Fat intake (g.day–1)
(a)
(b)
(c)
Pro
tein
oxi
dat
ion
(g. d
ay–1
)C
HO
oxi
dat
ion
(g. d
ay–1
)Fa
t o
xid
atio
n(g
. day
–1)
Fig. 35.1 High-carbohydrate diet: the relationshipbetween intake and oxidation of (a) protein, (b)carbohydrate (CHO), and (c) fat for all subjects on day7 of a high carbohydrate feeding period. — , regressionline for all 21 subjects; - - - , regression line for leansubjects (�); · · · ·, regression line for obese subjects (�).(a) Lean subjects: r = 0.79, P < 0.01; obese subjects: r = 0.59, n.s. (b) Lean subjects: r = 0.74, P < 0.01; obesesubjects: r = 0.79, P < 0.01. (c) Lean subjects: r = 0.06,n.s.; obese subjects: r = –0.08, n.s. From Thomas et al.(1992), with permission.
500
400
300
200
100
0
300
200
100
0
200
150
100
50
00 50 100 150 200
0 100 200 300
0 100 200 300 400 500
Protein intake (g.day–1)
CHO intake (g.day–1)
Fat intake (g.day–1)
(a)
(b)
(c)
Pro
tein
oxi
dat
ion
(g. d
ay–1
)C
HO
oxi
dat
ion
(g. d
ay–1
)Fa
t o
xid
atio
n(g
. day
–1)
Fig. 35.2 High-fat diet: the relationship between intakeand oxidation of (a) protein, (b) carbohydrate (CHO),and (c) fat for all subjects on day 7 of a high fat feedingperiod. — , regression line for all 21 subjects; - - - ,regression line for lean subjects (�); · · · ·, regressionline for obese subjects (�). (a) Lean subjects: r = 0.78,P < 0.01; obese subjects: r = 0.74, P < 0.02. (b) Leansubjects: r = 0.32, n.s.; obese subjects: r = 0.14, n.s. (c) Lean subjects: r = 0.78, P < 0.01; obese subjects: r = 0.02, n.s. From Thomas et al. (1992), withpermission.

(grams per day) matched their oxidation rates,while fat oxidation rates did not change signifi-cantly even though fat intake increased (fatintake was 150g · day–1 while fat oxidation wasonly 59g ·day–1). The result was a 2.9-kg weightgain in 12 days. Thus, excess energy eaten asdietary fat is stored as triglycerides in adiposetissue with little loss of energy (Acheson et al.1984; Swinburn & Ravussin 1993).
Alcohol balance
When athletes ingest alcohol, it becomes a prior-ity fuel, with a rapid rise in alcohol oxidationoccurring until all the alcohol is cleared from thebody. Alcohol also suppresses the oxidation of fatand, to a lesser degree, that of protein and carbo-hydrate (Shelmet et al. 1988). Alcohol is notstored as fat nor can it contribute to the formationof muscle or liver glycogen. It may, however,indirectly divert fat to storage by providing analternative and preferred energy source for the body (Sonko et al. 1994). Thus, alcohol, at 29.4kJ ·g–1 (7 kcal · g–1), can contribute signifi-cantly to total energy intake. Athletes whoconsume alcohol must reduce their intake ofenergy from other sources to maintain energybalance.
Energy balance
Determination of energy balance requires themeasurement or estimation of both energy intakeand energy expenditure. Energy balance is thenestimated by subtracting energy expenditurefrom energy intake. This section will brieflyreview the various components of energy intakeand expenditure, how these components aremeasured, and the many factors that may influ-ence them.
Components of energy expenditure
The components of total daily energy expendi-ture (TDEE) are generally divided into threemain categories: (i) resting metabolic rate (RMR),(ii) the thermic effect of food (TEF), and (iii) the
472 practical issues
thermic effect of activity (TEA) (Fig. 35.3). RMR isthe energy required to maintain the systems ofthe body and to regulate body temperature atrest. In most sedentary healthy adults, RMRaccounts for approximately 60–80% of TDEE(Bogardus et al. 1986; Ravussin et al. 1986).However, in an active individual this percentagecan vary greatly. It is not unusual for some athletes to expend 4.2–8.4 MJ (1000–2000 kcal)per day in sport-related activities. For example,Thompson et al. (1993) determined energybalance in 24 elite male endurance athletes over a3–7-day period and found that RMR representedonly 38–47% of TDEE. Similar results arereported in female runners (Beidleman et al.1995).
The TEF is the increase in energy expenditureabove RMR that results from the consumption offood throughout the day. It includes the energycost of food digestion, absorption, transport,metabolism and storage within the body, and the energy expended due to sympatheticnervous system activity brought about by seeing,smelling and eating food. TEF is usuallyexpressed as a percentage of the energy contentof the foods consumed and accounts for 6–10% of TDEE, with women usually having a lowervalue (approximately 6–7%) (Poehlman 1989).However, this value will vary depending on theenergy density and size of the meal and types offoods consumed. In addition, if the absoluteamount of energy intake is decreased, then itfollows that the absolute amount of energyexpended in TEF will decrease.
TEA is the most variable component of energyexpenditure in humans. It includes the energycost of daily activities above RMR and TEF, suchas purposeful activities of daily living (makingdinner, dressing, cleaning house) and plannedexercise (running, weight training, cycling). Italso includes the energy cost of involuntary mus-cular activity such as shivering and fidgeting.This type of movement is called spontaneousphysical activity. TEA may be only 10–15% ofTDEE in sedentary individuals, but may be ashigh as 50% in active individuals. The addition ofRMR, TEF and TEA should account for 100% of

TDEE. However, there are a variety of factorsthat may increase energy expenditure abovenormal, such as cold, fear, stress, and variousmedications or drugs. These factors are referredto as adaptive thermogenesis and represent a tem-porary increase in thermogenesis that may lastfor hours or days, depending on the durationand magnitude of the stimulus. For example, aserious injury, the stress associated with competi-tion, going to high altitudes, or the use of certaindrugs may all increase RMR.
Factors that influence RMR
It is well documented that RMR is influenced bygender, age and body size, including the amountof FFM and fat mass. These four variables gener-ally explain about 80% of the variability in RMR
(Bogardus et al. 1986). Since FFM has a high rate of metabolic activity, any change in FFMwould dramatically influence RMR. In general,males have higher RMRs than females becausethey usually weigh more and have more FFM.However, Ferraro et al. (1992) found that femaleshave a lower RMR than males (approximately100kcal less per day) even after differences inFFM, fat mass and age are controlled. Age isanother variable known to influence RMR. It isestimated that the decline in RMR is less than1–2% per decade from the second to the seventhdecade of life (Keys et al. 1983).
It is now known that RMR also has a geneticcomponent. This means that within a familymembers may have similar RMRs. Two studiesillustrate this phenomenon. Bogardus et al. (1986)found that family membership could explain
the overweight athlete 473
% o
f dai
ly e
nerg
y ex
pend
iture
100
25
75
50
Amount/compositionof food (hormones/SNS)
SMR
–
BMR
Arousal
Thermic effectof food
SPA
Unrestrictedactivity
–
–
–
–
–
–
–
–
–
–
Determinants
Intensity
Duration
Body weight
Genetics/SNS?
Fat-free device
Fat mass
Age
Sex
Genetics
Hormones/SNS
Methods
Vent
ilate
d ho
od
Resp
irato
ry c
ham
ber
Dou
bly
labe
lled
wat
er
0
Fig. 35.3 Components of daily energy expenditure in humans. Daily energy expenditure can be divided into threemajor components: (i) the basal metabolic rate (BMR) (the sum of the sleeping metabolic rate (SMR) and the energycost of arousal), which represents 50–70% of daily energy expenditure; (ii) the thermic effect of food, whichrepresents approximately 10% of daily energy expenditure; and (iii) the energy cost of physical activity (the sum ofspontaneous physical activity (SPA) and unrestricted/voluntary physical activity), which represents 20–40% ofdaily energy expenditure. The major determinants of the different components of daily energy expenditure, as wellas the methods to measure them, are presented. SNS, sympathetic nervous system. From Ravussin and Swinburn(1993).

11% of the variability in RMR (P <0.0001) inAmerican Indians from 54 families. Similarly,Bouchard et al. (1989) found that in twins andparent–child pairs, heritability explainedapproximately 40% of the variability in RMRafter adjusting for age, gender and FFM.
Research now indicates that RMR may fluctu-ate over the phases of the menstrual cycle, withRMR values lowest during the follicular phaseand highest during the luteal phase (Solomon et al. 1982; Bisdee et al. 1989). The difference inRMR between these two phases is approximately420–1260kJ ·day–1 (100–300 kcal ·day–1). It alsoappears that adaptations in energy intake mimicthe changes in RMR. Barr et al. (1995) found thatfemales consume approximately 1260 kJ · day–1
(300 kcal ·day–1) more during the luteal phase ofthe menstrual cycle than during the follicularphase. Thus, the increased energy expenditure,due to a higher RMR during the luteal phase, iscompensated by an increase in energy intakeduring this period. However, if an athlete isamenorrhoeic, these changes in RMR will notoccur. Data are not available for anovulatoryfemales who may be menstruating but havedepressed hormonal profiles. Although there is substantial research to suggest that RMRchanges over the menstrual cycle, not all researchis supportive of these findings. Weststrate (1993)showed no effect of menstrual cycle on RMR, andPiers et al. (1995) showed no effect of menstrualcycle phase on RMR or energy intake.
effect of exercise on rmr
For the athlete participating in an intense train-ing programme, exercise may affect RMR bothdirectly and indirectly. First, exercise can directlyincrease RMR if it increases FFM (Bogardus et al.1986). Second, intense exercise training can temporarily increase resting energy expenditureabove the typical RMR long after the exercisebout has ended. This short-term increase inenergy expenditure is termed excess postexerciseoxygen consumption (EPOC) and is the amountof energy expended above the typical RMR. Theextent of EPOC after an exercise bout and the
474 practical issues
effect it has on TDEE appears to depend on the exercise intensity and/or the duration (Bahr1992). For example, Bahr et al. (1987) found thataerobic exercise (70% V
.o2max.) lasting 80min pro-
duced a 15% increase in EPOC lasting for 12 hafter exercise. Similarly, 2 min of exercise at 108%V.o2max., repeated three times, produced a signifi-
cant increase in EPOC for 4 h after exercise (Bahret al. 1992). Although most research has exam-ined the effect of aerobic exercise on EPOC,Melby et al. (1993) found a significant increase inEPOC after 90min of weightlifting. Oxygen con-sumption was elevated by 5–10% over baselinethe following morning.
Finally, it appears that energy flux can alsoalter RMR. Energy flux is defined as the amountof energy expended in exercise compared withthe amount of energy consumed each day. Anathlete who is exercising intensely and eatingadequate energy would be in high energy flux,while an athlete who is exercising intensely, butrestricting energy intake would be in negativeenergy flux. Bullough et al. (1995) examined theeffect of energy flux on RMR in trained male athletes. They measured RMR after 3 days ofhigh-intensity exercise (90min of cycling at 75%V.o2max., while eating adequate energy) and after
3 days of exercise when energy intake wasreduced (energy intake matching that requiredon a no-exercise day). They found that RMR was significantly higher during high energy thanduring negative energy flux. Thus, two athletesmay be doing similar workouts, but have dra-matically different energy expenditures if one isrestricting energy intake and the other is not.
Factors that influence TEF
A number of factors can influence how athletes’bodies respond metabolically to the food theyconsume. Some of these factors are associatedwith the physiological characteristics of an indi-vidual such as genetic background, age, level ofphysical fitness, sensitivity to insulin, or level ofbody fat. Other factors are associated with themeal, such as meal size, composition, palatabilityand timing.

effect of food composition,meal size and exercise
The TEF can last for several hours after a mealand will depend on the amount of energy con-sumed and the composition of the meal. Ingeneral, the thermic effect of a mixed meal is esti-mated to be 6–10% of total daily energy intake;however, the total TEF will also depend on the macronutrient composition of the diet. Forexample, the thermogenic effect of glucose is5–10%, fat is 3–5% and protein is 20–30% (Flatt1992). Carbohydrate and fat have a lowerthermic effect than protein because less energy isrequired to process, transport and convert carbo-hydrate and fat into their respective storageforms. Conversely, protein synthesis and metab-olism are more energy demanding. Thus, dietshigher in fat will have a lower TEF than diets thatcontain more carbohydrate or protein. In addi-tion, a diet high in energy will have a higher TEFthan a diet lower in energy because there is morefood to be digested, transported and stored. Forexample, the TEF of an individual who consumes12.6MJ (3000 kcal) daily would be approximately756–1260kJ ·day–1 (180–300 kcal · day–1), while anindividual consuming only 6.3MJ (1500 kcal)daily would have a TEF of 378–630 kJ · day–1
(90–150 kcal ·day–1). The total TEF for a day doesnot appear to be influenced by meal size ornumber, as long as the same amount of energy isconsumed throughout the day (Belko & Barbieri1987). Thus, the TEF will depend both on theamount of energy consumed each day and thecomposition of this energy.
Although exercise may influence the TEF,there are few data available on the effect of exer-cise before and after a meal in trained athletes.One study in trained swimmers reported that 45min of swimming significantly increased themetabolic response to a meal when the meal preceded the exercise (104.2 kJ · h–1, 24.8 kcal · h–1)compared with no exercise (84.8 kJ ·h–1, 20.2 kcal ·h–1) (Nichols et al. 1988). However, this differenceis so small that its long-term significance onenergy regulation is negligible, especially con-sidering the high variability in the termic effect of
a meal (TEM) measurement between individu-als. Similar results are reported by Bahr (1992),who exercised physically active males for 80minat 75% V
.o2max. and measured oxygen consump-
tion after exercise. In the treatment conditionsubjects were fed a meal 2 h after exercise, whilesubjects fasted in the control condition. Theyfound only a 42-kJ (10-kcal) difference betweenthe two conditions over a 5-h postexerciseperiod.
Measurement of energy expenditure
Energy expenditure can be measured in the lab-oratory or estimated using prediction equations.Since access to a laboratory for the measurementof energy expenditure (calorimetry or doublylabelled water) may be limited, this review willfocus on the prediction methods used to estimateenergy expenditure.
predicting energy expenditure
One of the most commonly used methods forestimating TDEE is to predict RMR using a pre-diction equation and then multiply RMR by anappropriate activity factor (Food and NutritionBoard 1989; Montoye et al. 1996). A number ofprediction equations have been developed toestimate RMR, but most have been developedusing sedentary populations. To date, no equa-tion has been developed to predict the RMR ofathletes who may spend hours in training eachweek. Some of the commonly used RMR predic-tion equations and the population from whichthese equations were derived are discussedbelow. To determine which of these equationswork best for athletes, Thompson and Manore(1996) compared the measured RMR values fromindirect calorimetry with predicted RMR valuesusing the following equations. In all these equa-tions, weight (wt) was measured in kilograms,height (ht) in centimetres and age in years; LBMstands for lean body mass.• Harris and Benedict (1919); based on 239 subjects, 136 men (mean age, 27± 9 years; meanweight, 64± 10kg) and 103 women (mean age,
the overweight athlete 475

33± 14 years; mean weight, 56.5± 11.5 kg), includ-ing trained male athletes. Harris and Benedictderived different equations for both men andwomen:
Males: RMR= 66.47 +13.75 (wt)– 5 (ht)– 6.76 (age)
Females: RMR= 655.19.56 (wt)+ 1.85 (ht)– 4.68 (age)
• Owen et al. (1986); based on 44 lean and obesewomen, eight of whom were trained athletes(age range, 18–65 years; weight range, 48–143kg), none of whom were menstruatingduring the study, and all of whom were weightstable for at least 1 month:
Active females: RMR= 50.4+ 21.1 (wt)
Inactive females: RMR= 795 +7.18 (wt)
• Owen et al. (1987); based on 60 lean and obesemen (age range, 18–82 years; weight range,60–171kg), none of whom were athletes, and allof whom were weight stable for at least 1 month:
Males: RMR= 290 +22.3 (LBM)
Males: RMR= 879 +10.2 (wt)
• Mifflin et al. (1990); based on 498 healthy leanand obese subjects, 247 females and 251 males(age range, 18–78 years; weight range, 46–120 kgfor women and 58–143kg for men); no mentionwas made of physical activity level:
RMR= 9.99 (wt) +6.25 (ht)– 4.92 (age)+166 (sex; male=1, female= 0) –161
• Cunningham (1980); based on 223 subjects, 120males and 103 females, from the Harris andBenedict data base. Cunningham eliminated 16males who were identified as trained athletes. Inthis study, LBM accounted for 70% of the vari-ability of RMR. LBM was not calculated in theHarris–Benedict equation, so Cunningham esti-mated LBM based on body mass and age:
RMR=500 +22 (LBM)
Thompson and Manore (1996) found that forboth male and female athletes the Cunning-
476 practical issues
ham equation best predicted RMR, with theHarris–Benedict equation being the next bestpredictor. Because the Cunningham equa-tion requires the measurement of FFM, theHarris–Benedict equation will be easier to use insettings where FFM cannot be measured.
Once RMR has been estimated, TDEE can thenbe estimated by a variety of different factorialmethods. These methods vary in how labourintensive they are to use and the level of respon-dent burden. A detailed description of thesemethods is given elsewhere (Food and NutritionBoard 1989; Schutz & Jequier 1994; Montoye et al.1996). The easiest method multiplies RMR by anappropriate activity factor, with the resultingvalue representing TDEE (Food and NutritionBoard 1989). Another method estimates a generalactivity factor (GAF) and a specific activity factor(SAF). The GAF represents the energy expendedin doing everyday activities such as walking,standing, driving, and watching television. TheSAF is the amount of activity expended in specific exercises (e.g. running, swimming orweight training) for a designated intensity andamount of time. The SAF is calculated by multi-plying the amount of time spent in an activity byits energy requirement (Berning & Steen 1991;Montoye et al. 1996). The GAF and SAF are then added together to get the total amount ofenergy expended per day in activity. This value isadded to the estimated RMR value, then an addi-tional 6–10% is added to represent the TEF. Thefinal number then represents the TDEE. Thismethod is relatively easy to use with athleteswho have specific training or exercise pro-grammes and who already keep training logs.TDEE can also be estimated by recording allactivities over a 24-h period and then calculatingthe energy expended in each of these activities(kJ ·kg–1 · min–1). The amount of energy expendedin each activity is then added and representsTDEE. Many computer programs calculateenergy expenditure in this way. Regardless of themethod used, keep in mind that all values areestimates. The accuracy of these values willdepend on a number of factors: the accuracy ofthe activity records, the accuracy of the data base

used, and the accuracy with which the calcula-tions are done.
Energy intake
Since energy intake is one part of the energybalance equation, knowing total energy intakewill give some indication of TDEE if body weightis stable. The assessment of dietary records is oneof the most frequently used procedures for moni-toring the energy and nutrient intakes of athletes.The goal of assessing dietary intake is to achievethe most accurate description of the athlete’stypical food intake. This information is then usedto assess mean energy intake and composition ofthe diet, make recommendations for improvingfood habits and adjusting energy intake, anddetermine the need for micronutrient supple-ments while dieting.
methods for collecting energyand nutrient intake data
For the athlete with limited time and skills forrecording food intake, retrospective methods,such as 24-h diet recalls, food frequency ques-tionnaires or diet histories, can be used. If more specific energy or nutrient intake data areneeded, food records or weighed food recordsshould be used. Deciding which method to usewill depend on the capabilities and dedication of the athlete, and the detail and specificity of the data required by the sports medicine team(Dwyer 1999).
The diet record is probably the most frequentlyused method for assessing the energy and nutri-ent intake of athletes. A diet record is a list of allfood consumed over a specified time, such as 3–7days. To more accurately predict energy andnutrient intakes, it is best if foods consumed canbe weighed or measured, labels of conveniencefoods saved, and all supplements recorded fromthe label. This method also allows for the gather-ing of more in-depth information such as thetime, place, feelings, and behaviours associatedwith eating. The dietitian working with theathlete can review the diet record to ensure its
accuracy. A primary drawback of this method isthe tendency for individuals to change their‘typical eating habits’ on days they record foodintake. This method is also more time consumingthan a 24-h recall; thus, the accuracy of the dietrecord depends on the individual’s cooperationand skill in recording foods properly.
How many days must be recorded to give anaccurate picture of an athlete’s diet? Diet recordslasting from 3 to 14 days will provide good esti-mates of energy and nutrient intakes (Schlundt1988). Within this range, reliability and accuracyappear to increase with each additional day up to7 days. Thus, a 7-day diet record can give accu-rate data for energy and most nutrients. Oneadvantage of the 7-day diet record is that itencompasses all the days of the week, includingthe dietary changes that frequently occur onweekends and the athlete’s weekly trainingroutine. The disadvantage of this method is thatas the number of days increases, so does therespondent burden. If only 3–4-day diet recordsare used, care should be taken in choosing whichdays will be recorded.
Practical guidelines for achieving acompetitive body weight
For the overweight athlete, any weight lossattempt should be aimed at achieving a competi-tive body weight and composition that is optimalfor performance and health. What is an optimalbody weight for performance? How is thisnumber determined? Who determines this goal?These are difficult questions that need to beaddressed by the athlete in consultation with thesports medicine team before a weight loss pro-gramme can begin. If the athlete is young andstill growing, these questions are even harder.Table 35.1 gives ranges of relative body fat levelsfor elite athletes in various sports; Berning andSteen (1998) also give body fat and V
.o2max. data
for athletes of varying ages. These ranges,however, do not take into account individualvariability regarding body fat and performance.In addition, some athletes will perform at theirbest outside of these ranges. Remember that a
the overweight athlete 477

certain amount of body fat is essential for goodhealth. Finally, the inherent error of body compo-sition assessment, 1–3% under ideal conditions,must be considered (Wilmore 1992a).
Weight loss goals
The following outline offers some criteria andquestions that may be helpful in determining anathlete’s optimal body weight.1 Put emphasis on personal health and wellbeing, and fitness and performance goals — notonly weight.
• Set realistic weight goals. (What is yourcurrent weight goal? Is body weight reductionnecessary? Is there any indication that weightloss will improve performance? Have you evermaintained your goal weight without dieting?When was the last time you were at your goalweight? At what weight or body-fat level doyou perform well, do you feel good and areyou injury free? What was the last weight youcould maintain without constantly dieting?)• Place less focus on the scale and more onchanges in body composition and lifestyle,such as stress management and making goodfood choices.• Pick the appropriate weight loss techniquethat works with your training schedule.Weight loss should be gradual, at approxi-mately 0.5–1.0kg · week-1.• Mark progress by measuring changes infitness level and performance levels (personalrecord times, level of fatigue at the end of aworkout, level of energy at the end of the day,strength and power changes), and generaloverall well-being.
2 Make changes in diet and eating behaviour.• Do not starve yourself or restrict energy tooseverely. Do not go below 5–6.4 MJ (1200–1500kcal) daily for women and 6.4–7.6MJ(1500–1800 kcal) daily for men.• Do not constantly deprive yourself offavourite foods or set unrealistic dietary rules.• Make basic dietary changes that moderatelyreduce energy intake, that fit into yourlifestyle, and that you know you can achieve.
478 practical issues
• Reduce fat intake but remember, a lower fatdiet will not guarantee weight loss if a nega-tive energy balance is not achieved.• Eat more whole grains, cereals, fruits, andvegetables, and get adequate fibre (>25 g ·day-1).• Do not skip meals and do not let yourself gettoo hungry. Eat something for breakfast. Thiswill prevent you from being too hungry andovereating later in the day.• Reduce or eliminate late night eating.• Plan ahead and be prepared for when youmight get hungry. Carry healthy snacks withyou. Always eat high carbohydrate foods im-mediately after strenuous exercise.• Identify your dietary weaknesses; plan astrategy for dealing with these difficult times.Are you eating when you are bored,depressed, upset? Do you overeat when youare around food or eat out?• Do not go into a training session or competi-tion without eating adequately. Be sure you arewell fed both before and after you exercise.
3 Make changes in exercise behaviour.• If you do not already do aerobic exercise andstrength training, start and maintain an exer-cise programme that includes both of thesecomponents. This is an absolute requirementfor burning fat and the maintenance of ahealthy competitive body weight. Strengthtraining will help maintain FFM while you areworking to lose body fat.• Plan regular exercise into your day (outsideyour training sessions) and add additionalexercise by walking instead of driving, orusing the stairs instead of the elevator.(Adapted from Burke 1995; Manore 1996.)Optimal body weight should be a weight that
promotes both good health and performance,and is ‘reasonable’ to achieve and maintain. If anathlete has never been able to achieve or main-tain his or her goal weight, then this may be anunrealistic weight that places them under unnec-essary psychological stress. Determination of anathlete’s optimal weight must also consider thegenetic background, age, gender, sport, healthand past weight history. For the female athlete,

knowing menstrual history will also be impor-tant in setting weight loss and dietary goals(Dueck et al. 1996).
Body composition should be measured andweight loss goals centred on the loss of body fatinstead of just weight. This way the goal isshifted to changes in body composition insteadof weight (Table 35.1). Knowing body composi-tion also helps prevent the athlete from losing toomuch weight or setting an unachievable goal.This information can then be used to determinean optimal body weight and to set fat loss goals.For the athlete who is already lean, yet wants todiet, this process can help convince him or her
that weight loss is not necessary. Weight loss in alean athlete is not possible without seriouslycompromising performance because of theinevitable loss of FFM. These athletes will benefitmore from establishing good dietary practicesthan from weight loss. These guidelines can alsobe used with the young athlete who does notwant to gain weight even though growth andweight gain should be occurring.
Role of diet
If the athlete does need to lose weight (body fat),a weight loss plan needs to be developed early in the athlete’s training programme to avoidpotentially harmful dieting practices and weightcycling. Weight loss is not recommended duringperiods of intense endurance training; athletescannot be expected to train intensely andimprove performance on low energy intakes.Thus, weight loss goals should be set at approxi-mately 0.5–1kg · week–1, depending on body sizeand gender, and focus on decreases in body fat,while maintaining or increasing FFM (Wilmore1992b; Fogelholm 1994). The degree of energyrestriction will depend on body size, typicalenergy intake and expenditure, and the periodallotted for weight loss. In general, reducingenergy intake by 10–25% (approximately1680–3360kJ or 400–800kcal daily) may be allthat is necessary. If the weight loss is occurring inthe off season, then both the restriction of energyintake and increased energy expenditure need tooccur.
Severe energy restriction or fasting should notbe used with athletes. This approach to weightloss only decreases carbohydrate and proteinintake and, thus, the ability to replace muscleglycogen (Bogardus et al. 1981) and repair andbuild muscle tissue after exercise. These types ofdiets also increase the risk of injury and the feel-ings of fatigue after routine workouts, which inturn can dramatically undermine self-confidenceand performance. Finally, these diets increaseFFM losses and decrease RMR (Donnelly et al.1994; Thompson et al. 1996). These factors, combined with the feelings of deprivation that
the overweight athlete 479
Table 35.1 Ranges of relative body fat for men andwomen athletes in various sports. From Wilmore(1992b), with permission.
Sport Men Women
Baseball, softball 8–14 12–18Basketball 6–12 10–16Body building 5–8 6–12Canoeing and kayaking 6–12 10–16Cycling 5–11 8–15Fencing 8–12 10–16Football 6–18 —Golf 10–16 12–20Gymnastics 5–12 8–16Horse racing 6–12 10–16Ice and field hockey 8–16 12–18Orienteering 5–12 8–16Pentathlon — 8–15Racketball 6–14 10–18Rowing 6–14 8–16Rugby 6–16 —Skating 5–12 8–16Ski jumping 7–15 10–18Skiing 7–15 10–18Soccer 6–14 10–18Swimming 6–12 10–18Synchronized swimming — 10–18Tennis 6–14 10–20Track and field
Field events 8–18 12–20Running events 5–12 8–15
Triathlon 5–12 8–15Volleyball 7–15 10–18Weightlifting 5–12 10–18Wrestling 5–16 —
accompany severe dieting, usually result in dietfailure or relapse.
If energy intake decreases below 7.6–8 MJ ·day–1 (1800–1900 kcal ·day–1), nutrient intakescan be severely compromised (Beals & Manore1994, 1998; Manore 1996). This level of energyintake is not adequate to replace muscle glyco-gen and fuel the athlete during intense trainingperiods. Athletes have higher protein and car-bohydrate requirements than their sedentarycounterparts (Coyle 1995; Lemon 1995). Whendieting, carbohydrate intake should remain ashigh as possible (60–70% of energy) and proteinintake at 1.2–1.8g · kg–1 body weight (Lemon1995), while fat intake is reduced to 15–25% ofenergy. Prolonged energy restriction also placesthat athlete at risk for low dietary intakes ofcalcium, iron, magnesium, zinc and B complexvitamins (Manore 1996; Beals & Manore, 1998).Thus, it may be necessary for athletes to usevitamin and mineral supplements during longperiods of energy restriction (>3–4 weeks). Thismay be especially true if the athlete makes poorfood choices, eats primarily processed or conve-nience foods, or eliminates various food groupsfrom the diet.
Any weight loss plan for an athlete shouldmoderately reduce energy intake while teachinggood food choices. It is much easier to teach ath-letes how to eliminate or reduce high fat andenergy dense foods from their diet than to countkilocalories. They also need to become aware ofthe situations and emotions that trigger overeat-ing or binge eating. Athletes need to learn thenutrient composition of the foods they eat andwhy they eat them. This knowledge is useful indeveloping a diet plan around better foodchoices, training schedules, budgets and periodswhen overeating is most likely to occur.
Role of exercise
Exercise is necessary for both weight loss andweight maintenance. Unlike the general popula-tion, most athletes participate in hard physicalactivity. However, which activities are best for fatloss? It is well documented that aerobic activity
480 practical issues
oxidizes fat; however, recent evidence indicatesthat high-intensity anaerobic activity added to an aerobic exercise programme may be better atreducing body fat than aerobic-only exercise(Trembly et al. 1994). Weight training can alsohelp preserve FFM and strength while dieting if energy restriction is not too severe (Donnelly et al. 1994). Thus, the type of exercise added to a weight-loss programme will depend on thecurrent training practices of the athlete.
Behaviour modification and weight maintenance
In order for weight loss to be maintained,changes in diet and exercise habits need tobecome part of the athlete’s lifestyle. Foreyt andGoodrick (1993) and Klem et al. (1996) found thatindividuals who are successful at losing andmaintaining weight loss have the following characteristics in common: they modify diet,especially energy intake from fat; they exerciseregularly and monitor their weight; and theyhave high levels of social support from familyand friends. These changes can be achieved byfirst identifying the eating or exercise behaviourthat needs to be changed, then setting specificand realistic goals for changing this behaviour.Changes in behaviour should be made slowlyand modified as necessary. Finally, successfulbehaviour is rewarded. This approach to weightloss and maintenance will take time and mayrequire continuous social and professionalsupport (Foreyt & Goodrick 1991).
Conclusion
Successfully guiding the overweight athletethrough the weight loss process is a challenge forboth the athlete and the sports medicine team.Identifying the appropriate weight loss goal andmethod is imperative for a successful outcome.These basic considerations need to be re-membered before beginning any weight loss programme:• Both energy intake and expenditure are impor-tant. If energy intake is less than energy expendi-

ture, weight will be lost. Increases in energyexpenditure and moderate decreases in energyintake may help preserve FFM and musclestrength while dieting.• Rate of weight loss is important. Do not usesevere energy restriction or fasting as a means ofweight loss. For most athletes, a weight loss of0.5–1kg · week–1 is the maximum recommended.• Composition of the diet is important, espe-cially for weight maintenance. Carbohydrate,protein and alcohol oxidation appear to matchtheir energy intake, while fat oxidation does not.• The protein/energy intake ratio is impor-tant. When energy intake is low, a higherprotein/energy ratio is required. In addition,athletes have higher protein requirement thansedentary individuals.• Micronutrients are important. If dieting islonger than 3–4 weeks, micronutrient supple-mentation may be required to meet the recom-mended intakes.
References
Abbott, W.G.H., Howard, B.V., Christin, L. et al. (1988)Short-term energy balance: relationship withprotein, carbohydrate, and fat balances. AmericanJournal of Physiology 255, E332–E337.
Acheson, K.J., Schutz, Y., Bessard, T., Ravussin, E.,Jequier, E. & Flatt, J.P. (1984) Nutritional influenceson lipogenesis and thermogenesis after a carbohy-drate meal. American Journal of Physiology 246,E62–70.
Acheson, K.J., Schutz, Y., Bessard, T., Anantharaman,K., Flatt, J.P. & Jequier, E. (1988) Glycogen storagecapacity and de novo lipogenesis during massivecarbohydrate overfeeding in man. American Journalof Clinical Nutrition 48, 240–247.
Bahr, R. (1992) Excess postexercise oxygen consump-tion: magnitude, mechanisms and practical implica-tions. Acta Physiologica Scandinavica 144 (Suppl.),1–70.
Bahr, R., Ingnes, I., Vaage, O., Sejersted, O.M. & New-sholme, E.A. (1987) Effect of duration of exercise on excess postexercise O2 consumption. Journal ofApplied Physiology 62, 485–490.
Bahr, R., Gronnerod, O. & Sejersted, O.M. (1992) Effectof supramaximal exercise on excess postexercise O2consumption Medicine and Science in Sports and Exercise 24, 66–71.
Barr, S.I., Janelle, K.C. & Prior, J.C. (1995) Energy
intakes are higher during the luteal phase of ovula-tory menstrual cycles. American Journal of ClinicalNutrition 61, 39–43.
Beals, K.A. & Manore, M.M. (1994) The prevalence and consequences of subclinical eating disorders infemale athletes. International Journal of Sport Nutrition4, 175–195.
Beals, K.A. & Manore, M.M. (1998) Nutritional status offemale athletes with subclinical eating disorders.Journal of the American Dietetic Association 98, 419–425.
Beidleman, B.A., Pahl, J.L. & De Souza, M.J. (1995)Energy balance in female distance runners. AmericanJournal of Clinical Nutrition 61, 303–311.
Belko, A.Z. & Barbieri, T.F. (1987) Effect of meal sizeand frequency on the thermic effect of food. NutritionResearch 7, 237–242.
Berning, J.R. & Steen, S.N. (1998) Nutrition for Sport andExercise, 2nd edn. Aspen Publishers, Gaithersburg,MD.
Bisdee, J.T., James, W.P.T. & Shaw, M.A. (1989) Changesin energy expenditure during the menstrual cycle.British Journal of Nutrition 61, 187–199.
Bogardus, C., LaGrange, B.M., Horton, E.S. & Sims,E.A.H. (1981) Comparison of carbohydrate-containing and carbohydrate restricted hypocaloricdiets in the treatment of obesity. Journal of ClinicalInvestigation 68, 399–404.
Bogardus, C., Lillioja, S. & Ravussin, E. et al. (1986)Familial dependence of the resting metabolic rate.New England Journal of Medicine 315, 96–100.
Bouchard, C., Tremblay, A., Nadeau, A. et al. (1989)Genetic effect in resting and exercise metabolic rates.Metabolism 38, 364–370.
Brownell, K.D., Steen, S.N. & Wilmore, J.H. (1987)Weight regulation practices in athletes: analysis ofmetabolic and health effects. Medicine and Science inSports and Exercise 19, 546–556.
Bullough, R.C., Gillette, C.A., Harris, M.A. & Melby,C.L. (1995) Interaction of acute changes in exerciseenergy expenditure and energy intake on restingmetabolic rate. American Journal of Clinical Nutrition61, 473–481.
Burke, L. (1995) The Complete Guide to Food for SportsPerformance: Peak Nutrition for Your Sport, 2nd edn.Allen & Unwin, St Leonards, NSW.
Coyle, E.F. (1995) Substrate utilization during exercisein active people. American Journal of Clinical Nutrition61 (Suppl.), 968S–979S.
Cunningham, J.J. (1980) A reanalysis of the factorsinfluencing basal metabolic rate in normal adults.American Journal of Clinical Nutrition 33, 2372–2374.
Donnelly, J.E., Jacobsen, D.J., Jakieic, J.M. & Whately,J.E. (1994) Very low calorie diet with concurrent vs.delayed and sequential exercise. International Journalof Obesity 18, 469–475.
Dueck, C.A., Manore, M.M. & Matt, K.S. (1996) Role of
the overweight athlete 481

energy balance in athletic menstrual dysfunction.International Journal of Sport Nutrition 6, 165–190.
Dwyer, J.T. (1999) Dietary assessment. In Modern Nutri-tion in Health and Disease, 9th edn (ed. M.E. Shils, J.A.Olson, M. Shike & A.C. Ross), pp. 937–959. Lea &Febiger, Baltimore, MD.
Ferraro, R., Lillioja, S., Fontvieille, A.M., Rising, R.,Bodgarus, C. & Ravussin, E. (1992) Lower sedentarymetabolic rate in women compared to men. Journal ofClinical Investigation 90, 780–784.
Flatt, J.P. (1992) The biochemistry of energy expendi-ture. In Obesity (ed. P. Bjorntrop & B.N. Brodoff), pp.100–116. J.B. Lippincott, New York.
Fogelholm, M. (1994) Effects of bodyweight reductionon sports performance. Sports Medicine 18, 249–267.
Food and Nutrition Board (1989) Recommended DietaryAllowances, 10th edn. National Research Council,National Academy Press, Washington, DC.
Foreyt, J.P. & Goodrick, G.K. (1991) Factors common tosuccessful therapy for the obese patient. Medicine andScience in Sports and Exercise 23, 292–297.
Foreyt, J.P. & Goodrick, G.K. (1993) Weight manage-ment without dieting. Nutrition Today March/April,4–9.
Harris, J.A. & Benedict, F.G. (1919) A Biometric Study ofBasal Metabolism in Man (Carnegie Institute, Wash-ington publication no. 279). F.B. Lippincott, Philadel-phia, PA.
Hellerstein, M.K., Christiansen, M., Kaempfer, S. et al.(1991) Measurement of de novo hepatic lipogenesisin humans using stable isotopes. Journal of ClinicalInvestigation 87, 1841–1852.
Hill, J.O., Drougas, H. & Peters, J.C. (1993) Obesitytreatment: can diet composition play a role? Annals ofInternal Medicine 119 (7 part 2), 694–697.
Horswill, C.A. (1992) Applied physiology of amateurwrestling. Sports Medicine 14, 114–143.
Horswill, C.A. (1993) Weight loss and weight cycling inamateur wrestlers: implications for performance andresting metabolic rate. International Journal of SportNutrition 3, 245–260.
Jebb, S.A., Prentice, A.M., Goldberg, G.R., Murgatroyd,P.R., Black, A.E. & Coward, W.A. (1996) Changes inmacronutrient balance during over- and under-feeding assessed by 12-d continuous whole-bodycalorimetry. American Journal of Clinical Nutrition 64,259–266.
Keys, A., Taylor, H.L. & Grande, F. (1983) Basal metabo-lism and age of adult man. Metabolism 22, 579–587.
Klem, M.L., McGuire, T.M., Wing, R.R., Seagle, H. &Hill, J.O. (1996) The national weight control registry:the diet and exercise behaviors of individuals highlysuccessful at long-term maintenance of weight loss.International Journal of Obesity 4 (Suppl. 1), 7S.
Krempf, M., Hoerr, R.A., Pelletier, V.A., Marks, L.A.,Gleason, R. & Young, V.R. (1993) An isotopic study of
482 practical issues
the effect of dietary carbohydrate on the metabolicfate of dietary leucine and phenylalanine. AmericanJournal of Clinical Nutrition 57, 161–169.
Lemon, P.R.W. (1995) Do athletes need more proteinand amino acids? International Journal of Sport Nutri-tion 5, S39–S61.
Manore, M.M. (1996) Chronic dieting in active women:what are the health consequences? Women’s HealthIssues 6, 332–341.
Melby, C., Scholl, C., Edwards, G. & Bullough, R. (1993)Effect of acute resistance exercise on post-exerciseenergy expenditure and resting metabolic rate.Journal of Applied Physiology 75, 1847–1853.
Mifflin, M.D., St Jeor, S., Hill, L.A., Scott, B.J., Daugh-erty, S.A. & Koh, Y.O. (1990) A new predictive equa-tion for resting energy expenditure in healthyindividuals. American Journal of Clinical Nutrition 51,241–247.
Montoye, H.J., Kemper, H.C.G., Saris, W.H.M. & Wash-burn, R.A. (1996) Measuring Physical Activity andEnergy Expenditure. Human Kinetics, Champaign, IL.
Nichols, J., Ross, S. & Patterson, P. (1988) Thermic effectof food at rest and following swim exercise in trainedcollege men and women. Annals of Nutrition andMetabolism 32, 215–219.
Owen, O.E., Kavle, E., Owen, R.S. et al. (1986) A reap-praisal of caloric requirements in healthy women.American Journal of Clinical Nutrition 44, 1–19.
Owen, O.E., Holup, J.L., D’Alessio, D.A. et al. (1987) Areappraisal of the caloric requirements of men. American Journal of Clinical Nutrition 46, 875–885.
Piers, L.S., Diggavi, S.N., Rijskamp, J., van Raaij,J.M.A., Shetty, P.S., & Hautvast, J.G.A.J. (1995)Resting metabolic rate and thermic effect of a meal inthe follicular and luteal phases of the menstrual cyclein well-nourished Indian women. American Journal ofClinical Nutrition 61, 296–302.
Poehlman, E.T. (1989) A review: exercise and its influ-ence on resting energy metabolism in man. Medicineand Science in Sports and Exercise 21, 515–525.
Ravussin, E. & Swinburn, B.A. (1993) Energy Metabo-lism. In Obesity: Theory and Therapy, 2nd edn (ed. A.J.Stunkard & T.A. Wadden), pp. 97–123. Raven Press,New York.
Ravussin, E., Lillioja, S., Anderson, T.E., Christin, L. &Bogardus, C. (1986) Determinants of 24-hour energyexpenditure in man: methods and results using a res-piratory chamber. Journal of Clinical Investigation 78,1568–1578.
Schlundt, D.G. (1988) Accuracy and reliability of nutrient intake estimates. Journal of Nutrition 118,1432–1435.
Schutz, Y. & Jequier, E. (1994) Energy needs: assessmentand requirements. In Modern Nutrition in Health andDisease, 8th edn (ed. M.E. Shils, J.A. Olson & M.Shike), pp. 101–111. Lea & Febiger, Baltimore, MD.

Schutz, Y., Flatt, J.P. & Jequier, E. (1989) Failure ofdietary fat intake to promote fat oxidation: a factorfavoring the development of obesity. AmericanJournal of Clinical Nutrition 50, 307–314.
Shelmet, J.J., Reichard, G.A., Skutches, C.L., Hoeldtke,R.D., Owen, O.E. & Boden, G. (1988) Ethanol causesacute inhibition of carbohydrate, fat, and protein oxidation and insulin resistance. Journal of ClinicalInvestigation 81, 1137–1145.
Solomon, S.J., Kurzer, M.S. & Calloway, D.H. (1982)Menstrual cycle and basal metabolic rate in women.American Journal of Clinical Nutrition 36, 611–616.
Sonko, B.J., Prentice, A.M., Murgatroyd, P.R., Goldberg,G.R., van de Ven, M.L.H.M. & Coward, W.A. (1994)Effect of alcohol on postmeal fat storage. AmericanJournal of Clinical Nutrition 59, 619–625.
Steen, S.N. & Brownell, K.D. (1990) Patterns of weightloss and regain in wrestlers: has the traditionchanged? Medicine and Science in Sports and Exercise22, 762–768.
Sundgot-Borgen, J. (1993) Prevalence of eating dis-orders in elite female athletes. International Journal ofSport Nutrition 3, 29–40.
Sundgot-Borgen, J. (1994) Risk and trigger factors forthe development of eating disorders in female eliteathletes. Medicine and Science in Sports and Exercise.26, 414–419.
Swinburn, B. & Ravussin, E. (1993) Energy balance orfat balance? American Journal of Clinical Nutrition 57(Suppl.), 766S–771S.
Thomas, C.D., Peters, J.C., Reed, W.G., Abumrad, N.N.,Sun, M. & Hill, J.O. (1992) Nutrient balance and energy expenditure during ad libitum feed-ing of high-fat and high-carbohydrate diets in humans. American Journal of Clinical Nutrition 55,934–942.
Thompson, J.L. & Manore, M.M. (1996) Predicted andmeasured resting metabolic rate of male and femaleendurance athletes. Journal of the American DieteticAssociation 96, 30–34.
Thompson, J., Manore, M.M. & Skinner, J.S. (1993)Resting metabolic rate and thermic effect of a meal inlow- and adequate-energy intake male enduranceathletes. International Journal of Sport Nutrition 3,194–206.
Thompson, J.L., Manore, M.M. & Thomas, J.R. (1996)Effects of diet and diet-plus-exercise programs onresting metabolic rate: a meta-analysis. InternationalJournal of Sport Nutrition 6, 41–61.
Trembly, A., Simoneau, J. & Bouchard, C. (1994) Impactof exercise intensity on body fatness and skeletalmuscle metabolism. Metabolism 43, 814–818.
Westerterp, K.R. (1993) Food quotient, respiratory quo-tient, and energy balance. American Journal of ClinicalNutrition 57 (Suppl.), 759S–765S.
Weststrate, J.A. (1993) Resting metabolic rate and diet-induced thermogenesis: a methodological reappraisal. American Journal of Clinical Nutrition 58,592–601.
Wilmore, J.H. (1991) Eating and weight disorders in thefemale athlete. International Journal of Sport Nutrition1, 104–117.
Wilmore, J.H. (1992a) Body weight and body composi-tion. In Eating, Body Weight and Performance in Ath-letes: Disorders of Modern Society (ed. K.D. Brownell, J.Robin & J. H. Wilmore), pp. 77–93. Lea & Febiger,Philadelphia, PA.
Wilmore, J.H. (1992b) Body weight standards and ath-letic performance. In Eating, Body Weight and Perfor-mance in Athletes: Disorders of Modern Society (ed. K.D.Brownell, J. Robin & J. H. Wilmore), pp. 315–329. Lea& Febiger, Philadelphia, PA.
the overweight athlete 483

Introduction
Spectators perceive the life of the internationalathlete as glamorous and exciting, but the travelinvolved in training and competition can have adevastating effect on performance. Many profes-sional and elite athletes travel long distances on aregular basis to train and compete. Top Americanbasketball players are away from home for alarge part of the year, and travel is so much partof the routine that it has become a way of life. Inmany sports, travel must be accommodated in arigorous training and competition schedule: jetlag and travel fatigue are not accepted as excuseswhen there is a high expectation of success. Agood example is the US Women’s Olympic bas-ketball team, who travelled more than 161 000km in 14 months prior to the games to promotewomen’s basketball and to win the gold medal inAtlanta (Wolff 1996).
Whether flying for 12 h or longer to anothercontinent or jumping on a bus to compete in aneighbouring town, travel can cause a major disruption to an athlete’s training programme.Major events may require extended periods oftravel: the Sydney Olympics, for example, willrequire competitors from Europe to travel for at least 24h to reach their accommodation or pre-Games holding camps. Successful athletesshould have an established training programmethat includes a workout schedule, proper nutri-tion, adequate sleep and stress management,although in reality this is often not the case.When something happens to interfere with this
schedule, the break in routine can be physiologi-cally and psychologically damaging. Diet is oneof the major factors that may lead to disruption ofan athlete’s training programme away fromhome. Food intake often depends on local restau-rant facilities, concession stands, or vendors,which means access to familiar foods may belimited. Consumption of unfamiliar foods andbeverages, especially in large amounts, can resultin severe gastrointestinal symptoms: even minordiscomfort from gas, diarrhoea, or constipationmay be enough to adversely affect performance.Potentially more serious, and even fatal, illnesscontracted from eating contaminated foodstuffsis as great a risk for the athlete as it is for all inter-national travellers. Even where familiar foodsare available, interrupting the athlete’s normaleating and training schedule can negativelyaffect performance.
There seems to have been no serious attempt toquantify the effect of eating disturbances result-ing from travel on sports performance, and thereis little published information in this area. Muchof the information in this chapter is based on theauthors’ professional experience and on experi-ences reported by athletes, coaches and teamphysicians. Inevitably, most of these reports areanecdotal, and even individual case reports areseldom available. To broaden the range of experi-ences, we surveyed sports nutritionists fromeach of the continents to glean information fromtheir experiences and to provide the reader withpractical suggestions. Interestingly, two prob-lems were reported by all respondents: food
Chapter 36
The Travelling Athlete
ANN C. GRANDJEAN AND JAIME S. RUUD
484

availability and food safety. Jet-lag, risk of dehy-dration, body mass changes and food allergieswere also identified as challenges for the travel-ling athlete.
Food availability
Without hesitation, athletes, coaches, trainersand sports nutritionists list ‘not having the foodwe need available’ as the number one nutritionalproblem when travelling to a training camp or competition. While this can be a hurdle for all athletes, it is particularly difficult for thosewhose nutritional plan involves frequent smallmeals throughout the day: some athletes, espe-cially those engaged in hard training, eat seven to eight meals or snacks each day. Local andregional events present fewer problems, as ath-letes can bring their own food, either on an indi-vidual or team basis, or can ensure that localrestaurants or hotels have the appropriate foodavailable. However, the greater the distance to betravelled and the longer the time to be spentaway from home, the more important it is to planwell in advance if athletes are to be able to followtheir nutritional plan. On long trips or trainingcamps, it is not possible to be self-sufficient. Oneproblem in such situations is the short menucycle in many training camps: restaurant or hoteldining may be even worse, with no change ofmenu. A menu or self-service buffet that appearsvaried for the first day can become extremelymonotonous after only a few days.
For high-altitude training, Finnish athletestrain in countries such as Switzerland or Austriaand often stay in small villages: the accommoda-tion is usually in private hotels run by familieswhere the food is plentiful but not always thehigh-carbohydrate foods that many athletesprefer, and again with little variety. At these loca-tions, travel to training venues is usually by bus,and low-carbohydrate, high-fat foods purchasedat fuel stations may be the only food available.Similar situations are reported from athletes inmany other countries. Here, as in all situations,athletes require some nutritional knowledge toallow them to make the best food choices. Some-
times special arrangements can be made withhotel owners to ensure a menu that will meet theathletes’ needs, and to provide meals that can betaken to the training venue, but such arrange-ments may not be possible. Many athletes usesports drinks and high-carbohydrate snacks tomaintain carbohydrate intake, but this can leadto an unbalanced diet: while this may not beimportant in the short term, athletes may spendweeks or even months at some training camps.Chinese athletes, when travelling in the West,prefer to bring their own foods such as noodles,canned porridge, salted vegetables (such as hotpickled mustard tuber) and chocolate. Whilethere is no single solution to all travel problems,as all athletes, coaches, team physicians andnutritionists know, planning ahead is essential ifthe athletes’ needs are to be met.
Athletes or teams preferring to take food forthe trip need to consider not only the perishabil-ity of food, but also airline restrictions on theweight and number of pieces of luggage. A USboxing team travelling abroad for a month oftraining and competition augmented their dietby taking canned tuna, peanut butter, crackersand chocolate bars. These items provided a sig-nificant amount of energy and nutrients whilenot adding significantly to the weight of theluggage. International travel is likely to imposelimitations on the type of foods that can be taken.Many countries, including the US, have customslaws that prohibit the importation of fresh fruit,vegetables and meat products: such restric-tions almost invariably apply to intercontinentaltravel. The penalties for contravening importregulations may be severe, apart from the confis-cation of the team’s food supply, and all teammembers must be aware of the restrictions thatapply. Advance planning should prevent this sit-uation from arising.
Some travelling athletes choose to take onlyenough food to serve as a backup, and expect torely on local food sources for the majority of theirneeds. Common ‘travel food’ for US athletesinclude dried pasta, canned or powered sauces,cookies, canned meat and fish, peanut butter,soups, nuts, chocolate bars, crackers and sports
the travelling athlete 485

bars. Other athletes travel with sufficient food tomeet all of their needs and with cooking equip-ment which makes it possible to prepare foodunder a variety of travel and living conditions.Electrical current and plug adapters are an essen-tial, but sometimes forgotten, part of this equip-ment. Distributing supplies and equipmentthroughout the baggage will help to ensure thatit will reach the desired destination, and reducethe possibility of the entire supply being lost.
Body mass changes
Another common concern related to travel anddiet is body mass (weight) change. Athletesreport that prevention of unwanted body massloss or gain may be a major challenge while trav-elling. Body mass loss is likely to occur if athletesdo not have access to an adequate supply ofappropriate food and beverages, but it may alsooccur in the midst of dietary abundance. It is not uncommon, especially for athletes travellingabroad for the first time, for local foods to beavoided, perhaps because of a dislike of the unfa-miliar, an uncertainty over the content or a fear ofan adverse reaction. This is likely to lead to areduction in energy intake and a loss of bodymass. Athletes experienced at travelling willusually learn to eat in spite of taste preference orwill ensure their own supply of food becausethey recognize that an inadequate intake leads to less than optimal performance. Even for the experienced traveller, however, some disrup-tion is likely until a new routine is established.This involves identifying the location of diningfacilities, restaurants, etc., as well as recover-ing for the effects of jet lag and travel fatigue, and it is during this period that a supply ofsnacks brought from home may be particularlyvaluable.
On the other hand, there are times when thelocal cuisine is so appetizing, that the athlete willovereat. This is typical in a dining hall settingwhere there is a variety of food choices andportion sizes are generous or where there is aself-service facility. Boredom, increased eatingopportunities and the provision of food free of
486 practical issues
charge in a training camp are also factors thatwill lead some athletes to eat more than theywould at home. This may be particularly the caseat major championship events: the dining faci-lities at the Olympic Village, for example,provide a wide range of high-quality food free ofcharge 24 h · day–1. For the athlete in a weight-cat-egory event whose first competition is not untilnear the end of the programme, 2 or 3 weeksspent in the Village, with a reduced training loadand little to occupy the time, provides a severechallenge to self-restraint. This is a particularchallenge for athletes from countries or fromsocial backgrounds where such food is seldomavailable.
In both of these extreme situations, there maybe advantages in regular monitoring of bodymass as a guide to the adequacy of the dietaryintake. This is not, however, as straightforwardas might at first appear. A fall in body mass maybe the result of an inadequate energy intake, butmay also reflect some degree of hypohydration,particularly in warm weather. Athletes mayexperience some loss of body mass during atraining camp if the training load is increasedabove the normal level, and this may be desirableor not, depending on whether there is a need forthe athlete to reduce the body fat content andwhether the mass loss does indeed reflect a lossof body fat. Ekblom and Bergh (Chapter 51) havereported that the daily energy requirement ofelite cross-country skiers during normal trainingis about 20–25MJ (4780–5970kcal) and that thismay increase by 4–8 MJ (950–1910 kcal) duringtraining camps. An increased body mass mayindicate overeating, but is also a normal responseto a reduced training load in the days prior tocompetition. Changes in the diet may induceconstipation, leading to a small increase in bodymass.
Dehydration
Travel increases the athlete’s risk of dehydration.An adequate intake of fluids is essential, espe-cially on long-range flights as the low watervapour pressure in aircraft cabins leads to an

increased loss of water from the respiratory tractand through skin. Drinking fluids before, duringand after travel is essential. Carrying bottledwater can provide fluid, while sport drinks, juicepacks and soft drinks provide both carbohydrateand fluid. On transcontinental flights, most air-lines are aware of the risks of dehydration andfrequently offer water, juice or soft drinks. If thisservice is not sufficient, ring the flight attendantcall button and request fluids on a routine (e.g.hourly) basis. Ask for a whole bottle or can, oreven two, rather than a small glass. When a largeteam is travelling together, the airline might be warned in advance that demand for fluids is likely to be high and an extra provisionrequested. In any case, it is unwise to rely on
an adequate amount being available and eachathlete should be self-sufficient for the durationof the flight. Particularly when travelling to hotclimates, sufficient fluid should be taken to allowfor delays at immigration and customs uponarrival.
Jet lag
Jet lag is a common problem for athletes whotravel through different time zones (Reilly et al.1997a). It results from a disruption of the body’srhythms and sleep–wake cycle. Fatigue, distur-bances of sleeping patterns, poor concentration,digestive problems and irritability are usualsymptoms of jet lag. Studies have shown that the‘competitive edge’ can be lost after crossing asfew as one or two time zones (US Olympic Com-mittee 1988). Symptoms of jet lag are generallymore severe when travelling from west to eastrather than in the opposite direction (Reilly et al.1997b). Although athletes generally suffer lessthan sedentary individuals, in terms of generalsymptoms (Reilly et al. 1997a), the implicationsfor performance are perhaps more serious for the athlete who may have to recover quickly and compete soon after arrival. A rough rule ofthumb is that one day is required at the new destination for each time zone crossed, but it isclear that there is a large variability between individuals in the speed of adjustment.
Both the type of food consumed and timing ofmeals are important considerations in helpingthe body adapt to time zone shifts. Although thelight–dark cycle is perhaps the most importantsignal involved in setting the body’s internalclock, the timing of meals and of exercise are alsoimportant signals. The composition of meals andthe amount of food eaten may also have someimpact. High-protein foods (meats, cheese, fish,poultry and tofu) are reported to stimulate theadrenaline pathway and increase alertness.High-carbohydrate foods (pasta, rice, bread,fruit) increase insulin secretion, which facilitatesthe uptake of tryptophan, an essential aminoacid which is then converted to serotonin, andingestion of meals with a high carbohydrate
the travelling athlete 487
Fig. 36.1 In many sports, elite performers travel longdistances on a regular basis. This adds many problemswhen there is little time for recovery betweencompetitions. Photo © Allsport / A. Bello.

content may be followed by a feeling of drowsi-ness. Thus, what and when an athlete eats mayinfluence the severity and duration of jet-lagsymptoms, and it has been suggested that high-protein foods should be eaten at breakfast timeand high-carbohydrate meals taken at night(Reilly et al. 1997b). Central nervous system stimulants, such as the caffeine in tea and coffee,may be beneficial when taken in the mornings on arrival at the new destination, but are bestavoided in the later part of the day. Drinking anadequate amount of fluids is also recommended,as dehydration can aggravate the symptoms offatigue and jet lag. This implies a need for care inthe use of caffeine-containing beverages andalcohol because of the possible diuretic effects.
Where a single major event involving long-distance travel is scheduled, there may be advan-tages for some individuals in preparing beforedeparture. If this is to be attempted, it might besuggested that, 3 days before travel, athletesshould begin training, sleeping, eating anddrinking according to the time of their destina-tion. It should be recognized, however, thatattempts at preadjustment by changes in lifestylehave generally been found to be ineffectivebecause of the difficulty in controlling all thefactors involved.
In recent years, melatonin has been used bysome athletes to avoid jet lag (Grafius 1996).Melatonin is a hormone derived from the pinealgland that affects the body’s sleep–wake cycle.Research has shown that low doses of melatonintaken in the evening can help induce sleep(Zhdanova et al. 1995). Oral doses of melatonin(0.5–3 mg) taken 1 h before bedtime appears to besafe and effective (Grafius 1996). However, aswith any substance, melatonin may be tolerateddifferently by each athlete. Morning grogginessand vivid dreams have been reported with use of melatonin. For the athlete who wants to trymelatonin, experimenting with it prior to travelor competition is recommended. Melatonin isnot included on the list of prohibited substances.The purity of commercial preparations is uncer-tain, and melatonin content of some preparationsmay be less than the stated dose.
488 practical issues
Traveller’s diarrhoea and other infections
Once an athlete arrives in a new country, one ofthe greatest fears is becoming ill just prior to or during competition. Although there is littlerecent information, one report suggests that up to 60% of athletes travelling abroad may beaffected by some form of gastroenteritis(Grantham 1983). Food-borne illnesses and gastrointestinal distresses of other aetiology canprohibit participation or diminish performance.Traveller’s diarrhoea is a concern to athletes irre-spective of the country of origin or destination.
Traveller’s diarrhoea can be caused by food orwater that contains bacteria, viruses or parasites.It is estimated that bacterial enteropathogenscause at least 80% of traveller’s diarrhoea withEscherichia coli and Shigella being the two mostcommon agents (DuPont & Ericsson 1993). Clinical features of traveller’s diarrhoea includefrequent loose stools and abdominal cramps,sometimes accompanied by nausea, vomiting orthe passage of bloody stools. Since contaminatedfood and water can cause traveller’s diarrhoea,athletes need to be cautious of what they eat and drink and to apply stringent food hygienerules. Prevention of the problem involves selecting eating establishments that are wellknown or recommended by coaches or otherindividuals who have been to the area before andwho are aware of the food safety issues. Contact-ing your country’s embassy in the country ofyour destination to identify in advance potentialproblems can also be of value. Information onimmunization requirements and recommendedprophylactic precautions should also be estab-lished well in advance of travel, and this advice isreadily available from travel agents, airlines andembassies.
Foods such as fruits that can be peeled andvegetables that have been thoroughly washedwith boiling water are generally safe foodchoices. For the most part, athletes should drinkonly bottled water, juices or soft drinks fromsealed containers. The following list providesguidance for foods and beverages generally con-

sidered safe. However, when in doubt, remem-ber the phrase, ‘Boil it, cook it, peel it or forget it’(Mayo Clinic Health Letter 1997).
Table 36.1 lists foods and beverages generallyconsidered to be safe and those which are poten-tially dangerous.
Foods and beverages are not the only source of pathogens. If the level of water purity isunknown, athletes should use bottled water tobrush their teeth and should not swallow waterwhen bathing. Athletes participating in watersports, such as rowing or canoeing, need to avoidswallowing lake or river water.
Oral prophylactic drugs that have been used toprevent traveller’s diarrhoea in adults includedoxycycline, trimethoprim-sulfamethoxazole,norfloxacin, ciprofloxacin and bismuth subsali-cylate. These drugs are generally taken on thefirst day of arrival and continued for one or twodays after departure (DuPont & Ericsson 1993).However, the disadvantages of prophylaxis may outweigh the benefits. When used for anextended period of time, potential side-effectscan occur, depending on the oral agent selected,such as blackening of the tongue and faeces, skinrashes and reactions to the sun. Prophylacticdrugs may also give a false sense of security to anathlete who would otherwise exercise caution
when choosing food and beverages. Certain pro-biotic organisms, such as lactobacillus GG, havebeen shown to be effective in stimulating anti-body production against rotavirus (Kaila et al.1992, 1995), and to reduce the duration of diar-rhoea (Isolauri et al. 1991). It would, however, beunwise to rely on these.
If diarrhoea develops, the athlete should seekmedical attention as soon as possible. Becausedehydration is likely to result, it is important toconsume plenty of fluids: bottled beverages,broth, soup and tea made from bottled water.Sports drinks, which have a composition similarto that of oral rehydration solutions recom-mended for the treatment of childhood diar-rhoea, are an effective remedy in this situation(Maughan 1994). If diarrhoea is a possibleoutcome, a supply of one of the commerciallyavailable oral rehydration solutions must beavailable: this may not be easily available locallyand should be brought from home. These drinkscontain higher electrolyte levels than sportsdrinks and will help maintain fluid balance andspeed recovery: if a powdered or tablet formula-tion is used, bottled water must be used in thepreparation. If a large fluid loss is incurred andthe athlete has difficulty in taking oral fluids,intravenous rehydration may be warranted.
A variety of other medical problems, includingupper respiratory infection, abscessed tooth andgeneral infections, are known to impair perfor-mance and may even prevent an athlete fromcompeting. Adequate sleep and rest, mainte-nance of hydration status and a nutritionallyadequate diet can help ward off infections. Adaily multiple vitamin/mineral supplement canalso help ensure adequate vitamin and mineralintakes. In addition, the importance of frequentand careful hand washing with soap cannot beoveremphasized.
Food allergies and food intolerance
The athlete with food allergies has an additionalchallenge when travelling. A food allergy is anyadverse reaction to an otherwise harmless foodor food component that involves the body’s
the travelling athlete 489
Table 36.1 Foods and beverages generally consideredto be safe or potentially unsafe.
Safe Unsafe
Steaming hot food Moist foods at room Dry food (e.g. breads) temperature (e.g. High sugar-content sauces, salads and
foods (e.g. jellies and buffet dishes)syrups) Raw or undercooked
Fruit which can be meats, fish and peeled (e.g. bananas, shellfishoranges and melons) Unpeelable raw
Bottled drinks in their vegetables andoriginal containers (e.g. fruit (e.g. grapes carbonated water, soda and berries)and sports drinks) All dairy products
Coffee and tea, if Tap watersteaming hot Ice cubes

immune system. A food allergen is the part of thefood that stimulates the immune system of afood-allergic individual and a single food cancontain multiple food allergens. Proteins in foodsare most commonly the cause of an allergicresponse. It is estimated that less than 2% of thepopulation has a true allergy to food.
Travel guides and books for people with aller-gies are available. Foreign sources of informationhave been published by the Food AllergyNetwork and the Information Centre for FoodHypersensitivity (LIVO). Translation of com-monly used allergy terms, food labelling laws,emergency medical services, travel tips and a listof non-profit organizations working with foodallergies can be obtained.*
A food intolerance is different from a foodallergy: it occurs when people react adversely to food but without the involvement of theimmune system. Food intolerances can occur fora number of reasons. The most common of these involve enzyme deficiencies, such aslactose intolerance, which results from a lactasedeficiency.
Developing an eating strategy
It is important that the nutritional needs of thetravelling athlete are not left to chance. A clearlyidentified strategy is an essential part of thepreparation process. For team sports, thereshould be an overall team plan, but an individu-alized programme should also be developed foreach team member to take account of individualneeds and preferences. The key elements of thestrategy are as follows.
Recommendations for a nutritional survivalplan include:• think through your nutritional needs;
490 practical issues
• have a plan and a back-up plan;• contact hotels and restaurants at your traveldestination and make appropriate arrangements;• be assertive in making plans and when order-ing in restaurants;• before flights, order special airplane meals ifnecessary;• request extra potatotes, bread, rice, pasta orother carbohydrate-rich foods;• take food and drink with you.
Food appropriate for short trips includes:• breads, biscuits, bagels;• muffins, cookies, pretzels;• canned vegetables;• bottled, canned or boxed fruit juices;• canned fruit, dried fruits;• bottled water;• sports drinks;• canned meal replacement;• nuts, trail mix.
Where there are special nutritional require-ments, particular care in planning ahead is neces-sary. Favourite foods or drinks that are used intraining or that make up the pregame meal maynot be available. Vegetarian athletes may experi-ence difficulty in some countries where theirneeds may not be catered for.
Conclusion
Athletes are often expected to produce their bestperformance in unfamiliar surroundings farfrom home. Long-distance travel brings with it amultitude of challenges and opportunities. Inideal situations, a member of the sports staffassumes responsibility for travel arrangements,visa requirements, accommodation, equipment,money, itinerary and nutritional needs. It isimportant, however, that nutritional issues arenot left to chance. While veteran travellers mostoften think of nutrition, the novice traveller maybe more likely to forget. A clear eating strategy,well rehearsed in minor competitions closer tohome, should be developed. The input of appro-priately qualified and experienced staff to thedevelopment of this strategy is essential.
*These can be obtained from: The Food AllergyNetwork, 10400 Eaton Place, Fairfax, VA 22030–220,USA; Tel.: 703-691-3179; Fax: 703-691-2713; or TheInformation Centre for Food Hypersensitivity (LIVO),PO Box 84185, 2508 AD, The Hague, The Netherlands;Tel.: 703510893; Fax: 703547343.

Acknowledgements
The authors would like to thank Drs Louis Burke,JiDi Chen, Mikael Fogelholm, Michael Hamm,Jon Vanderhoof, Robert Voy and Ron Maughanfor content contributions and Dr Kathy Kolasafor valuable editorial assistance.
References
DuPont, H.L. & Ericsson, C.D. (1993) Prevention andtreatment of traveler’s diarrhea. New England Journalof Medicine 328, 1821–1827.
Grafuis, S. (1996) Melatonin: a trusty travel com-panion? Physician and Sportsmedicine 24, 19–20.
Grantham, P. (1983) Traveller’s diarrhea in athletes.Physician and Sportsmedicine 11, 65–70.
Isolauri, E., Juntunen, M., Rautanen, T., Sillanaukee, P.& Koivula, T. (1991) A human Lactobacillus strain(Lactobacillus casei sp. strain GG) promotes recoveryfrom acute diarrhea in children. Pediatrics 88, 90–97.
Kaila, M., Isolauri, E., Soppi, E., Virtanen, E., Laine, S. &Arvilommi, H. (1992) Enhancement of the circulatingantibody secreting cell response in human diarrhea
by a human Lactobacillus strain. Pediatric Research32, 141–144.
Kaila, M., Isolauri, E., Saxelin, M., Arvilommi, H. &Vesikari, T. (1995) Viable vs. inactivated Lactobacil-lus strain GG in acute rotavirus diarrhea. Archives ofDisease in Childhood 72, 51–53.
Maughan, R.J. (1994) Fluid and electrolyte loss andreplacement in exercise. In Oxford Textbook of SportsMedicine (ed. M. Harries, C. Williams, W.D. Stanish &L.L. Micheli), pp. 82–93. Oxford University Press,New York.
Mayo Clinic Health Letter (1997) Traveler’s diarrhea.Mayo Clinic Health Letter 6 January.
Reilly, T., Atkinson, G. & Waterhouse, J. (1997a) Biologi-cal Rhythms and Exercise. Oxford University Press,Oxford.
Reilly, T., Atkinson, G. & Waterhouse, J. (1997b) Travelfatigue and jet-lag. Journal of Sports Science 15,365–369.
United States Olympic Committee (1988) From the US toSeoul: How to Beat Jet Lag. USOC, Colorado Springs.
Wolff, A. (1996) Road show. Sports Illustrated, 94–97, 22July.
Zhdanova, I.V., Wurtman, R.J., Lynch, H.J. et al. (1995)Sleep-inducing effects of low doses of melatoniningested in the evening. Clinical and PharmacologicalTherapy 57, 552–558.
the travelling athlete 491

Introduction
The primary goal of athletic training is toenhance performance and to peak at the rightmoment. To push the performance capacity to itsupper limit, relatively high amounts of intensiveexercise are assumed to be necessary. Conse-quently, athletes are often balancing on the edgebetween training and overtraining. One of themost difficult parts of the training process is tofind the optimal balance between training andrecovery. A correct balance between training andrecovery is of utmost importance, since the dif-ference between winning and losing is small.Snyder and Foster (1994) reported that in the1988 Olympic speedskating event in Calgary, thedifference in average velocity between all goldand silver medal performances was 0.3%, whilethe mean difference between all the gold medal-ists and the fourth places was 1.3%. Similar dif-ferences can be found in other sports.
Unfortunately, few scientific data exist aboutthe optimal amount of training for peak per-formance. The relatively scarce data availableindicates that there appears to be an inverted U-shaped relationship between training volumeand increase in performance. It is assumed thatthere is an optimal amount of training which willyield optimal performances (Fig. 37.1). However,this optimal amount of training is poorlydefined, and passing this ‘gray’ area may lead toovertraining. Proper nutrition, consisting of ade-quate carbohydrate intake, may enhance recov-ery, and consequently may play a significant role
to optimize the training process by increasing thetraining loads that can be sustained.
The actual adaptation concludes the recoveryphase and, therefore, recovery is one of the mostimportant components of the training process.Too many athletes and coaches lay too muchemphasis on the training but pay too little atten-tion to recovery. Although little is known aboutrecovery, it appears that the time required for the recovery phase is not always the same anddepends among other things on several factors,such as: the volume of training, individualfactors, and nutrition. It has been shown thatafter exercise, glycogen synthesis can be opti-mized by starting to consume easily absorbablecarbohydrates immediately after exercise in anamount of 1–2g · kg–1 body weight. Althoughdirect evidence is still lacking, carbohydrateintake may indirectly also enhance other com-ponents of the recovery process. Carbohydrateingestion stimulates insulin secretion, which is apowerful stimulator of protein synthesis, one ofthe key processes for recovery and adaptation.
When exercise and the concomitant distur-bance in homeostasis are not matched by ade-quate recovery, an athlete is actually overdoingor overtraining, and may become overloaded orovertrained. In order to obtain optimal results insports, it is important to detect too much trainingor incomplete recovery as soon as possible.Although overtraining is a general term, it mayinclude different entities. Based on the pathogen-esis and affected organ systems, three differenttypes of overtraining can be distinguished:
Chapter 37
Overtraining: Nutritional Intervention
HARM KUIPERS
492

1 Mechanical overtraining.2 Metabolic overtraining or overreaching.3 Overtraining syndrome or staleness.
Mechanical overtraining
Mechanical overload involves the locomotorsystem. An imbalance between exercise andrecovery is usually local and is generallyexpressed as an overuse injury. Although littleinformation is available about the role of nutri-tion in these injuries, there is some indicationthat a low calcium intake increases the risk for stress injuries to the skeleton. Another type of mechanical overtraining is exercise-inducedmuscle damage. Muscle damage is associatedwith inflammatory changes, which are followedby regeneration. There is some evidence that adeficit in vitamin E intake may increase the sus-ceptibility to this type of mechanical damage.However, athletes who consume a normal mixeddiet are unlikely to have a vitamin E deficiency.Therefore, supplementation of vitamin E in theseathletes does not provide any protection againstexercise-induced muscle soreness.
Metabolic overtraining or overreaching
Nowadays athletic training includes a highvolume of intensive exercise. Intensive exerciserelies on carbohydrate supply, resulting in a
rapid depletion of glycogen stores. When high-intensity exercise is done in association with lowglycogen levels, this may lead to an imbalancebetween the rates of adenosine triphosphate(ATP) splitting and ATP generation. This in turn will lead to an accumulation of adenosinediphosphate (ADP). In order to restore theADP/ATP ratio, 2 ADP form 1 ATP and 1 adeno-sine monophosphate (AMP), which is furtherbroken down to inosine monophosphate andeventually to uric acid (Fig. 37.2), while ammoniais also formed (Sahlin & Katz 1993). When insuf-ficient time for recovery is allowed, this may leadto a decline of the energy-rich phosphate pool.The metabolic type of overtraining is probablyassociated with overreaching.
Data suggest that insufficient carbohydrateintake may enhance the susceptibility for devel-oping overreaching. Therefore, adequate carbo-hydrate intake and quick restoration of glycogenstores may decrease the risk of developing meta-bolic overtraining. Studies have shown that ahigh carbohydrate intake, starting immediatelyafter exercise, may restore glycogen stores within24h. However, although insufficient carbohy-drate intake may increase the susceptibility formetabolic overtraining, a high intake of carbohy-drate may decrease the risk, but cannot preventmetabolic overtraining. Therefore, in addition toproper nutrition, adequate rest and recovery areof paramount importance.
overtraining: nutritional intervention 493
Overreaching
Training load
Overtraining syndrome
Optimal training
Undertraining
Perf
orm
ance
Fig. 37.1 The relationship between training volumeand increase in performance capacity. Courtesy of C. Foster.
2 ADP 1 ATP +1 AMP
NH3
IMP
Uric acid
Fig. 37.2 Metabolic pathway indicating thebreakdown of ADP to uric acid, under the formation ofammonia. IMP, inosine monophosphate.

Overtraining syndrome or staleness
When the central nervous system cannot copeany more with the total amount of stress, a dys-function of the neuroendocrine system andchanges in behaviour may be encountered(Barron et al. 1985). This generalized form ofoverstress in athletes is generally referred to asovertraining syndrome or staleness (Kuipers &Keizer 1988). The overtraining syndrome is char-acterized by premature fatigue during exercise,decline in performance, mood swings, emotionalinstability, and decreased motivation (Stone et al.1991). In addition, overtraining and stalenessmay be associated with changes in immune func-tion (Fry et al. 1992). The proneness for infectionshas been attributed to changes in glutaminemetabolism by Newsholme and associates(1991). They suggested that intensive exercisemay cause a decrease in plasma glutamine. Since glutamine is considered to be essential forimmune cell functioning, decreased plasma glut-amine levels may lead to decreased immunefunction. Further research is needed to deter-mine whether supplementation of glutamine candecrease the risk of overtraining or can amelio-rate the intensity of the symptoms.
Training alone is seldom the primary cause ofovertraining syndrome or staleness. It is ratherthe total amount of stress exceeding the capacityof the organism to cope. Contributing factors foran overtraining syndrome include: too manycompetitions, too much training, infectious diseases, allergic reactions, mental stress, nutri-tional deficiencies, and jet lag. Nutritional defi-ciencies refer specifically to a low carbohydrateintake. Several studies have shown that evenelite athletes may consume a suboptimal diet,containing too little carbohydrate and too muchfat. Newsholme et al. (1991) attributed the over-training syndrome to an increased uptake ofbranched-chain amino acids by muscle tissueduring exhaustive exercise, leading to changedbalance of the ratio of aromatic to branched-chain amino acids. This, in turn, would lead to anincreased uptake of tryptophan in the brain andan increased formation of the neurotransmitter
494 practical issues
5-hydroxytryptamine. This is supposed to beassociated with central fatigue and symptoms ofovertraining syndrome. However, recent studiesdo not provide scientific evidence in support ofthis hypothesis (Rowbottom et al. 1995; Tanaka et al. 1997). In a recent study by van Hall et al.(1995), in which the ratio between branched-chain amino acids and aromatic amino acids wasrestored by nutritional intervention, no changesin performance and perception of fatigue werefound.
The German literature distinguishes betweentwo forms of overtraining: the sympathetic andthe parasympathetic (Israel 1958). The sympa-thetic, or Basedowian, form is characterized byincreased sympathetic tone in the resting state,while in the parasympathetic, or Addisonoid,form the parasympathetic tone dominates in theresting state as well as during exercise. The maincharacteristics of the sympathetic form of over-training are:• increased resting heart rate;• slow recovery after exercise;• poor appetite, weight loss;• mental instability, mood swings and irritability;• increased blood pressure in the resting state;• menstrual irregularities, oligomenorrhoea oramenorrhoea in females;• disturbed sleep: difficulties in falling asleepand early wakening;• increased resting diastolic and systolic bloodpressure.
The main characteristics of the parasympa-thetic form of overtraining are:• low or normal resting pulse rate;• relatively low exercise heart rate;• fast recovery of heart rate after exercise;• hypoglycaemia during exercise, goodappetite;• normal sleep, lethargy, depression;• low resting blood pressure;• low plasma lactates during submaximal andmaximal exercise (lactate paradox).
The sympathetic form of overtraining syn-drome is most often observed in team sports andsprint events, while the parasympathetic form is
preferentially observed in endurance athletes(Lehmann et al. 1993). The characteristics of theparasympathetic form of the overtraining syn-drome are misleading to the athletes and thecoach, because the symptoms are suggestive ofexcellent health. Although the pathophysiologi-cal mechanism of both forms of overtraining isnot clear yet, it is hypothesized that both formsreflect different stages of the overtraining syn-drome. The sympathetic form is supposed to bethe early stage of the overtraining syndrome,during which the sympathetic system is continu-ously activated. During advanced overtraining,the activity of the sympathetic system is inhib-ited, resulting in a dominance of the parasym-pathetic system. This would also explain theincreased proneness for hypoglycaemia duringexercise in the parasympathetic form, becauseglucose counter-regulation is mediated via thesympathetic system.
Because overtraining is difficult to diagnose, itis most important to prevent overtraining. Thefollowing rules and advice can be helpful toprevent overtraining.1 Develop a well-balanced, flexible and attrac-tive training programme, with individual adjust-ment when necessary.2 Have field or laboratory performance tests atregular intervals — for instance, during the easyweek during periodization.3 Emphasize proper diet, which supplies suffi-cient carbohydrate to meet the metabolic require-ments (4–8g · kg–1 body weight during normaltraining and up to 10 g ·kg–1 body weight duringheavy training) and also provides sufficientamounts of other nutrients.4 Have the athletes keep a training log in whichresting heart rate and body weight are registered.
Because behavioural signs seem to be the firstconsistent signs of overtraining, it can be helpfulto use the profile of mood states scale (POMSscale) as described by Morgan and coworkers(1987). The POMS scale yields information aboutthe global measure of mood, tension, depression,anger, vigour, fatigue and confusion. By monitor-ing the mood state on the POMS scale, overtrain-ing can be detected at an early stage.
In addition, or alternatively, the athletes can fillin a self-designed visual analogue scale question-naire, containing questions about fatiguability,recovery, motivation, irritability and sleep.
Recent research has shown that a balancedtraining programme results in an increase inplasma glutamine concentrations, whereas amismatch between training and recovery is asso-ciated with a decline in plasma glutamine con-centrations (Rowbottom et al. 1996). Therefore,monitoring plasma glutamine concentrationsduring the training process may be helpful todetect overtraining in its earliest stage. However,more studies are needed to provide clear andpractical guidelines about this possibility.
Treatment of overtraining
When symptoms of increased fatiguability occur,and no other symptoms are observed, overreach-ing or metabolic overtraining is most likely. Inthat case, the training should be adjusted, mainlyby decreasing the volume.
A decrease in volume is the most importantmeasure to be taken. Most emphasis should belaid on sufficient rest, recovery, and a diet that isrich in carbohydrates and contains sufficientamounts of trace elements, vitamins, and othernutrients (Kuipers & Keizer 1988). Usually meta-bolic overtraining is reversible within some days.
Systemic overtraining or overtraining syn-drome usually requires one to several weeks forrecovery. The contributing factors should beidentified and sometimes counselling is neces-sary. There are no specific drugs or treatmentsknown. Although proper nutrition is important,there is no evidence that specific nutritional sup-plements may be of any help to treat overtrainingor to enhance recovery.
References
Barron, G.L., Noakes, T.D., Levy, W., Smith, C. & Millar,R.P. (1985) Hypothalamic dysfunction in overtrainedathletes. Journal of Clinical Endocrinology and Metabo-lism 60, 803–806.
Fry, R.W., Morton, A.W., Garcia-Webb, P., Crawford,G.P.M. & Keast, D. (1992) Biological responses to
overtraining: nutritional intervention 495

overload training in endurance sports. EuropeanJournal of Applied Physiology 64, 335–344.
Israel, S. (1958) Die Erscheinungsformen des Ueber-trainings. Sportmedicine 9, 207–209.
Kuipers, H. & Keizer, H.A. (1988) Overtraining in eliteathletes: review, and directions for the future. SportsMedicine 6, 79–92.
Lehmann, M., Foster, C. & Keul, J. (1993) Overtrainingin endurance athletes: a brief review. Medicine andScience in Sport and Exercise 25, 854–862.
Morgan, W.P., Brown, D.R., Raglin, J.S., O’Connor, P.J.& Ellickson, K.A. (1987) Psychological monitoring ofovertraining and staleness. British Journal of SportsMedicine 21, 107–114.
Newsholme, E.A., Parry-Billings, M., McAndrew, N. & Budgett, R. (1991) A biochemical mechanism to explain some characteristics of overtraining. InAdvances in Nutrition and Top Sport (ed. F. Brouns), pp.79–93. Karger, Basel.
Rowbottom, D.G., Keast, D., Goodman, C. & Morton,A.R. (1995) The hematological, biochemical andimmunological profile of athletes suffering from theovertraining syndrome. European Journal of AppliedPhysiology 70, 502–509.
Rowbottom, D.G., Keast, D. & Morton, A.R. (1996) Theemerging role of glutamine as an indicator of exer-
496 practical issues
cise stress and overtraining. Sports Medicine 22,80–96.
Sahlin, K. & Katz, A. (1993) Adenine nucleotide metab-olism. In Principles of Exercise Biochemistry (ed. J.R.Poortmans), pp. 137–157. Karger, Basel.
Snyder, A.C. & Foster, C. (1994) Physiology and nutri-tion for skating. In Perspectives in Exercise Science andSports Medicine. Vol. 7. Physiology and Nutrition forCompetitive Sport (ed. D.R. Lamb, H.G. Knuttgen & R.Murray), pp. 181–219. Cooper Publishing, Carmel,IN.
Stone, M.H., Keith, R.E., Kearny, J.T., Fleck, S.J., Wilson,G.D. & Triplett, N.T. (1991) Overtraining: a review ofthe signs, symptoms and possible causes. Journal ofApplied Sport Science and Research 5, 35–50.
Tanaka, H., West, K.A., Duncan, G.E. & Bassett, D.R.(1997) Changes in plasma tryptophan/branchedchain amino acid ratio in responses to trainingvolume variation. International Journal of Sports Medi-cine 18(4), 270–275.
Van Hall, G., Raaymakers, W.H.M., Saris, J.S.H. &Wagenmakers, A.J.M (1995) Ingestion of branched-chain amino acids and tryptophane during sustainedexercise: failure to affect performance. Journal ofPhysiology 486, 789–794.

Introduction
The relationship between nutrition and exercisehas been a major scientific interest area for over150 years. With the popularization of the musclebiopsy technique, arteriovenous (a-v) balancemeasurements and, more recently, the use ofisotope tracers as metabolic probes during exer-cise, it has become possible to clearly investigatethe role of nutrition in exercise physiology andbiochemistry. Accordingly, growth in this areahas increased exponentially. Much of theresearch which has examined the interactionbetween nutrition and exercise has been con-ducted in comfortable ambient conditions. It isclear, however, that environmental temperatureis a major practical issue one must consider whenexamining nutrition and sport. In extremely low ambient temperatures, when the gradientbetween the skin and surrounding environmentis high, the rate of endogenous heat production,even during exercise, may be insufficient to offsetbody heat loss. In these circumstances, responsesare invoked to reduce heat loss and increase heatproduction. In contrast, when exercise is con-ducted in very high ambient temperatures, thegradient for heat dissipation is significantlyreduced, which results in changes to thermoreg-ulatory mechanisms designed to promote bodyheat loss. In both climatic extremes, these physio-logical adaptations ultimately impact upon hor-monal and metabolic responses to exercise whichact to alter substrate utilization. Hence, environ-mental temperature is an important factor to
consider when determining optimal nutritionalstrategies for exercise performance.
Exercise in a cold environment
Cold stress or attenuated exercise-induced hyperthermia?
Unlike heat, which can only serve to augment theexercise-induced increase in body temperature, acold environment may invoke varied physiologi-cal responses during exercise. These responsesdepend on whether the interaction between theenvironment and the exercising organism pro-motes excessive heat loss or attenuates thenormal rise in body core temperature associatedwith exercise. Most studies which have observedrelative hypothermia during exercise have doneso using swimming as the mode of exercise(Holmer & Bergh 1974; Galbo et al. 1979; Doubt & Hsieh 1991), since water is a much greaterthermal conductant than air. In contrast, whenexercise has been conducted in cold air environ-ments ranging from 3 to 9°C, an attenuated rise,rather than a fall in body core temperature, hasbeen observed (Jacobs et al. 1985; Febbraio et al.1996a, 1996b). The severity of the ‘cold stress’ isan important consideration when examiningnutritional requirements since a fall in body tem-perature will result in shivering thermogenesis(Webb 1992) and an enhanced sympathoadrenalresponse (Galbo et al. 1979), while an attenuatedrise in body temperature blunts the exercise-induced increase in adrenaline secretion
Chapter 38
Exercise at Climatic Extremes
MARK A. FEBBRAIO
497
(Febbraio et al. 1996b). Such responses are likelyto alter substrate utilization during exercise.
Substrate utilization during exercise in a cold environment
When the rise in body temperature is attenuatedduring prolonged exercise in a cold environ-ment, the rate of glycogen utilization in contract-ing muscle is reduced (Kozlowski et al. 1985;Febbraio et al. 1996b; Parkin et al. 1999) and exer-cise performance is increased (Hessemer et al.1984; Febbraio et al. 1996a; Parkin et al. 1999),which is not surprising, since fatigue during pro-longed exercise often coincides with glycogendepletion (Coggan & Coyle 1991). In many cir-cumstances, therefore, the cool environment maybe viewed as an ‘ergogenic aid’, since it results ina conservation of finite endogenous carbohy-drate stores within contracting muscles. It mustbe noted, however, that even in some circum-stances where measures have been taken toensure that body heat loss is eliminated, moreenergy is required to undertake many outdooractivities in a cold than in a temperate environ-ment. Brotherhood (1973, 1985) has demon-strated that walking over ice or snow-coveredterrain increases energy demand compared withwalking at a similar speed over dry ground. Inaddition, wearing heavy boots and clothing as a prevention against hypothermia increasesmetabolic demands and substrate utilization(Campbell 1981, 1982; Romet et al. 1986).
There are many athletic events, such as openwater swimming and mountaineering, whereextreme cold can lead to a fall in body tempera-ture. In these circumstances, thermoregulatorymechanisms are invoked to increase body heatproduction and consequent substrate utilization.These include shivering and non-shivering ther-mogenesis. Shivering, an involuntary rhythmiccontraction of skeletal muscle, is usually invokedin response to a 3–4°C fall in body temperature(Webb 1992). This increase in muscle contractionresults in an approximate 2.5-fold increase in total energy expenditure. More importantly,
498 practical issues
the carbohydrate oxidation rate increases almostsixfold, while the rise in lipid oxidation is modest(Vallerand & Jacobs 1989). The rise in carbohy-drate oxidation is accounted for by increases in plasma glucose turnover, glycolysis andglycogenolysis (Vallerand et al. 1995). We haverecently observed that when subjects exercised at3°C, their pulmonary respiratory exchange ratio(RER) was higher than during exercise at 20°Cdespite contracting muscle glycogenolysis andlactate accumulation being lower (Febbraio et al.1996b). This suggests that involuntary activityassociated with shivering in otherwise inactivemuscles contributes to an increase in total bodycarbohydrate oxidation during exercise in a coldenvironment. Hence, carbohydrate availability is a critical issue during exercise in climatic conditions where a shivering response may beinvoked.
Apart from the increase in carbohydrate uti-lization as a result of shivering, cold exposuremay also increase intramuscular carbohydrateutilization via an augmented sympathoadrenalresponse. Plasma catecholamines are elevatedduring exercise in response to cold stress (Galboet al. 1979; Young et al. 1986) and exogenousincreases in adrenaline often results in a con-comitant increase in muscle glycogenolysis(Jannson et al. 1986; Spriet et al. 1988; Febbraio etal. 1998) and liver glucose production (Kjær et al.1993). Shivering thermogenesis is not an absoluterequirement, therefore, for increases in carbohy-drate utilization during exercise in a cold environment.
Dietary modifications for exercise in a cold environment
In circumstances where exercise in a cold environment attenuates the exercise-inducedincrease in body temperature, guidelines fornutritional intake require little, if any, modifica-tion from that which is recommended for exer-cise in comfortable ambient conditions. It isgenerally accepted that a glucose/sucrose bever-age of 6–10% carbohydrate is appropriate for

ingestion during exercise (Costill & Hargreaves1992), since this would provide necessaryglucose while allowing for optimal gastric emp-tying and intestinal absorption (Mitchell et al.1989; Rehrer et al. 1989; Gisolfi et al. 1991). It hasbeen suggested, however, that increasing the carbohydrate content of a fluid beverage may bebeneficial during exercise in cooler conditionssince the requirement for optimal fluid deliverymay be less important, due to the reduction inthermoregulatory stress, while the necessity forsufficient circulating glucose levels is main-tained. We have recently tested this hypothesisand found that increasing the carbohydratecontent of a fluid beverage which is ingestedduring exercise in a cool environment is notadvantageous (Fig. 38.1). While such a practicedoes elevate blood glucose levels, it results inincreased gastrointestinal discomfort, a less thanefficient maintenance of plasma volume and areduction in exercise performance relative to theingestion of a 7% carbohydrate beverage (Feb-braio et al. 1996a). Therefore, when the endogen-ous heat produced by exercise in cool ambientconditions is sufficient to offset body heat loss,feeding strategies recommended during exercisein comfortable ambient temperatures should beadhered to.
During exercise in extremely cold environ-ments which results in a fall in body core temper-ature, any dietary modification which results inan increase in whole-body metabolic rate, whichwould generate warmer body temperatures andimprove cold tolerance, would be most benefi-cial. As a result, recent research has focused onadministration of many ergogenic aids designedto increase thermotolerance during cold stress.These ergogenic aids include hormones, phar-macological agents and nutrients. Administra-tion of the pharmacological agent dinitrophenol(Hall et al. 1948) and hormones such as thyroxin,catecholamines, cortisol and growth hormone(Sellers 1972; Le Blanc 1975) in cold exposedanimals results in a delay in the onset ofhypothermia. However, while these studiesprovide useful information regarding the mecha-nisms for the induction of thermogenesis, it isimpractical to suggest that they be taken byhumans as ergogenic aids during exercise andcold stress because of the obvious health risks.
It is possible, that ingestion of b-adrenergicagonists such as caffeine, ephedrine or theo-phylline may improve cold tolerance, althoughthe literature which has examined such a phe-nomenon has produced conflicting results.Ingesting the combination of ephedrine and caf-
exercise at climatic extremes 499
10
8
6
4
2
10
5
0
–5
–10
–15
250
200
150
100
50
0
Glu
cose
(m
mo
l. l–1
)
Ch
ang
e in
PV
(%
)
Tim
e (m
in)
0 50 100 150 200 250
Time (min) Time (min)
0 50 100 150 200 250 CON LCHO HCHO
Trial
*
*†
*
*†*†
*
*†
*†
†
†
†
†
(a) (b) (c)
Fig. 38.1 (a) Plasma glucose, (b) change in plasma volume (PV), and (c) time to exhaustion while consuming aplacebo (CON, �), 7% carbohydrate (LCHO, �) or 14% carbohydrate (HCHO, �), beverage during fatiguingexercise at 70% V
.o2max. in 5°C conditions. *, difference (P < 0.05) compared with CON; †, difference (P < 0.05)
compared with HCHO. Data expressed as means ± SE (n = 6). From Febbraio et al. (1996a).

feine (Vallerand et al. 1989) or ephedrine, caffeineand theophylline (Vallerand et al. 1993) results ina significant increase in heat production in cold-exposed humans, but the ingestion of caffeinealone produces no such effect (Graham et al.1991). Likewise, some researchers (Wang et al.1987) but not others (Vallerand et al. 1993) havedemonstrated that the ingestion of theophyllineduring cold exposure attenuates the fall in bodytemperature. It appears, therefore, that inges-tion of b-adrenergic agonists may provide somemeans of enhancing thermoregulatory thermo-genesis, although further work in this area isrequired to confirm this theory. In addition, sinceb-adrenergic agonists such as ephedrine and caf-feine are substances banned by the InternationalOlympic Committee, they may be impractical asa mechanism for overcoming cold stress duringathletic competition.
Since carbohydrate is the major substrate uti-lized in shivering thermogenesis, it has been sug-gested that low endogenous glycogen stores mayreduce cold tolerance. This is true of very leanindividuals (Martineau & Jacobs 1989) but not ofmoderately lean and fatter individuals (Young et al. 1989). Therefore, adequate carbohydratestores are not only important to fuel muscle con-traction during exercise, they possibly allow for abetter maintenance of body core temperature,especially in leaner athletes.
In summary, during exercise in a cold environ-ment, effort should be made to ensure that pre-exercise carbohydrate stores are adequate inorder to offset the potential increase in carbohy-drate oxidation associated with shivering andnon-shivering thermogenesis. This is especiallyimportant for those individuals who live andrepeatedly exercise in a cold environment. Theconcentration of carbohydrate within a fluid bev-erage should not be increased to more than 12%,despite the fact that fluid loss via sweating isminimized or abolished, because of potentialgastrointestinal distress. Finally, the ingestion ofb-adrenergic agonists such as caffeine and theo-phylline may provide some benefit against acutecold exposure, but further work examining thisphenomenon is required.
500 practical issues
Exercise in a hot environment
Substrate utilization during exercise in the heat
Although there is some conflict in the literature,it is generally accepted that exercise in a hot environment results in a substrate shift to-wards increased carbohydrate utilization.Muscle glycogenolysis (Fink et al. 1975; Febbraioet al. 1994a, 1994b), liver glucose production (Hargreaves et al. 1996a) and respiratoryexchange ratio (Febbraio et al. 1994a, 1994b; Hargreaves et al. 1996a) are higher during exer-cise in a hot environment. Furthermore, bothmuscle (Young et al. 1985; Febbraio et al. 1994a,1994b) and plasma (Rowell et al. 1968; Fink et al.1975; Powers et al. 1985; Young et al. 1985;Yaspelkis et al. 1993; Febbraio et al. 1994a) lactateaccumulation are increased in humans duringexercise in the heat compared with duringsimilar exercise in a cool environment. Theincrease in plasma lactate accumulation is likelyto reflect an increase in muscle lactate produc-tion, since hepatic lactate removal, althoughdecreased during exercise in the heat, does not account for the increase in plasma lactateaccumulation (Rowell et al. 1968) while musclelactate efflux is unaffected during exercise andheat stress (Nielsen et al. 1990). It must be noted,however, that not all studies have observed anincrease in intramuscular glycogen utilizationduring exercise in the heat (Nielsen et al. 1990;Yaspelkis et al. 1993; Young et al. 1996). It is likelythat the discrepancy in the literature is related tomethodological differences such as the use ofacclimatized subjects (Yaspelkis et al. 1993) or dif-ferences in pre-exercise glycogen concentrations(Nielsen et al. 1990; Young et al. 1996) when com-paring exercise in the heat with that in a coolerenvironment. These factors will influence rates ofglycogen utilization, since heat acclimationattenuated glycogenolysis during exercise in theheat (King et al. 1985) while pre-exercise glyco-gen concentration is directly related to rates ofutilization during submaximal exercise (Chesleyet al. 1995; Hargreaves et al. 1995). In general, the
literature suggests that exercise and heat stressresults in a shift towards increased carbohydratecatabolism.
The increase in carbohydrate oxidation indi-cates that lipid utilization is decreased duringexercise in the heat. Few studies, however, haveexamined the effect of exercise and heat stress onlipid catabolism. Plasma free-fatty acid concen-tration (Fink et al. 1975; Nielsen et al. 1990) anduptake (Nielsen et al. 1990) are similar when com-paring exercise in the heat with that in a coolerenvironment. These findings, however, do notdemonstrate unequivocally that lipid utilizationis unaffected by heat stress during exercise, sinceFink et al. (1975) also observed a decreased intra-muscular triglyceride utilization. These data,along with the consistent observation of anincreased RER during exercise and heat stress,suggest a substrate shift away from lipid.
Recently, Mittleman et al. (1998) have demon-strated that branched-chain amino acid (BCAA)supplementation increased endurance perfor-mance during exercise in the heat. This finding isin contrast with studies conducted during exer-cise in cooler environments (van Hall et al. 1995;Madsen et al. 1996). This discrepancy could arisebecause protein catabolism may be augmentedduring exercise in the heat. We have observed anincrease in ammonia (NH3) accumulation duringexercise and heat stress (Snow et al. 1993;Febbraio et al. 1994b). Although a major pathwayfor NH3 production during exercise is via thedeamination of adenosine 5¢-monophosphate toform NH3 and inosine 5¢-monophosphate (IMP),NH3 can also be formed in skeletal muscle via theoxidation of BCAA. Accordingly, BCAA supple-mentation augments muscle NH3 productionduring exercise (MacLean et al. 1996). During ourstudy (Febbraio et al. 1994b), the augmentedmuscle NH3 accumulation when comparingexercise in the heat with that in a cooler environ-ment was observed in the absence of any differ-ence in IMP accumulation, suggesting thatenhanced BCAA oxidation may have accountedfor the increase. It should be noted, however, thatothers (Dolny & Lemon 1988) have estimatedprotein degradation, as measured by urea excre-
tion, to be reduced during exercise in the heat.Further work examining the effect of exerciseand heat stress on protein catabolism is warranted.
Factors influencing fatigue during exercise inthe heat: substrate depletion vs. hyperthermia
During submaximal exercise in comfortableambient temperatures, the rate of energy utiliza-tion is closely matched by rates of energy pro-vision. It is well established that in thesecircumstances fatigue is often associated withglycogen depletion and/or hypoglycaemia(Coyle et al. 1986; Sahlin et al. 1990) andendurance can be increased by providing exoge-nous carbohydrate during exercise (Coyle et al.1986; Coggan & Coyle 1987). At fatigue themuscle is characterized by low glycogen levelsand a concomitant elevation in IMP accumula-tion (Sahlin et al. 1990; Spencer et al. 1991), sinceglycogen depletion may impair the tricarboxylicacid cycle and adenosine triphosphate must begenerated from alternative pathways such as theadenylate kinase reaction. Since carbohydrateutilization is augmented during exercise in theheat and fatigue often coincides with depletionof this substrate, it is somewhat paradoxical that fatigue during exercise in the heat is oftenrelated to factors other than substrate depletion.We (Parkin et al. 1999) and others (Nielsen et al.1990) have demonstrated that intramuscularglycogen content is approximately 300mmol ·kg–1 dry weight at fatigue when, during exercisein cooler environments, this figure is usually lessthan 150mmol ·kg–1 dry weight (Fig. 38.2). Thismay be because hyperthermia may lead tofatigue prior to carbohydrate stores being com-promised. This hypothesis is supported by theobservations that, when exercising in the heat toexhaustion, subjects will fatigue at the samebody core temperature even if interventions such as acclimatization (Nielsen et al. 1993) orfluid/carbohydrate ingestion (Febbraio et al.1996a) alter the duration of exercise. There maybe circumstances, however, where carbohydratemay be limiting during exercise in the heat. If the
exercise at climatic extremes 501

intensity of exercise is moderate, resulting in arelatively low rate of endogenous heat produc-tion, or the exercise is intermittent in natureallowing for effective heat dissipation, carbohy-drate may be limiting. Accordingly, carbohy-drate ingestion may (Murray et al. 1987; Davis etal. 1988b; Millard-Stafford et al. 1992) or may not(Davis et al. 1988a; Millard-Stafford et al. 1990;Febbraio et al. 1996a) increase exercise perfor-mance in the heat. The benefit of carbohydrateingestion during and following exercise in theheat may, however, be related to factors otherthan exercise performance. Immune function hasbeen demonstrated to be depressed by increasesin stress hormones such as catecholamines, corti-costeroids and growth hormone (Keast et al.1988). These hormones are elevated when com-paring exercise in the heat with that in a coolerenvironment (Febbraio et al. 1994a; Hargreaves et al. 1996a). There may be, therefore, a possiblerelationship between exercise in a hot environ-ment and immune suppression. Indeed, it hasbeen demonstrated that exercise and heat stressresults in a decrease in lymphocyte production(Cross et al. 1996). Carbohydrate feeding duringexercise in comfortable ambient conditionsresults in a decrease in circulating adrenaline
502 practical issues
(McConell et al. 1994), cortisol (Mitchell et al.1990) and growth hormone (Smith et al. 1996). Inaddition, plasma elastase, a marker of in vivoneutrophil activation, is reduced during exercisewith carbohydrate feedings (Smith et al. 1996). Itis possible, therefore, that carbohydrate inges-tion during and following exercise in the heatmay attenuate the rise in the counterregulatoryhormones which depress immune function, andwe are currently undertaking experiments toexamine this hypothesis.
As mentioned previously, glycogen contentwithin human skeletal muscle at the point offatigue during exercise in the heat is often ade-quate to maintain energy turnover via oxidativephosphorylation. It is somewhat surprising,therefore, that a marked increase in IMP accumu-lation at fatigue during exercise and heat stress isobserved despite glycogen concentration beingadequate to maintain the oxidative potential of the contracting skeletal muscle (Fig. 38.2) (Parkin et al. 1999).
These data suggest a disruption to mitochon-drial function during exercise and heat stress andsupport recent findings by Mills et al. (1996), whoobserved an increase in plasma concentrations of lipid hydroperoxides, a marker of oxidative
Gly
coge
n (m
mol
. kg–1
)
500
0
400
300
200
Rest Fatigue
100
IMP
(mm
ol. k
g–1)
1.25
0
1.0
0.75
0.5
Rest Fatigue
0.25
*
*
(a) (b)
Fig. 38.2 (a) Glycogen content and (b) inosine 5¢-monophosphate (IMP) concentration before (rest) and after(fatigue) submaximal exercise to exhaustion in different ambient temperatures: �, 40 °C; , 20 °C; �, 3 °C. Dataexpressed as mean ± SE (n = 8). From Parkin et al. (1999), with permission.
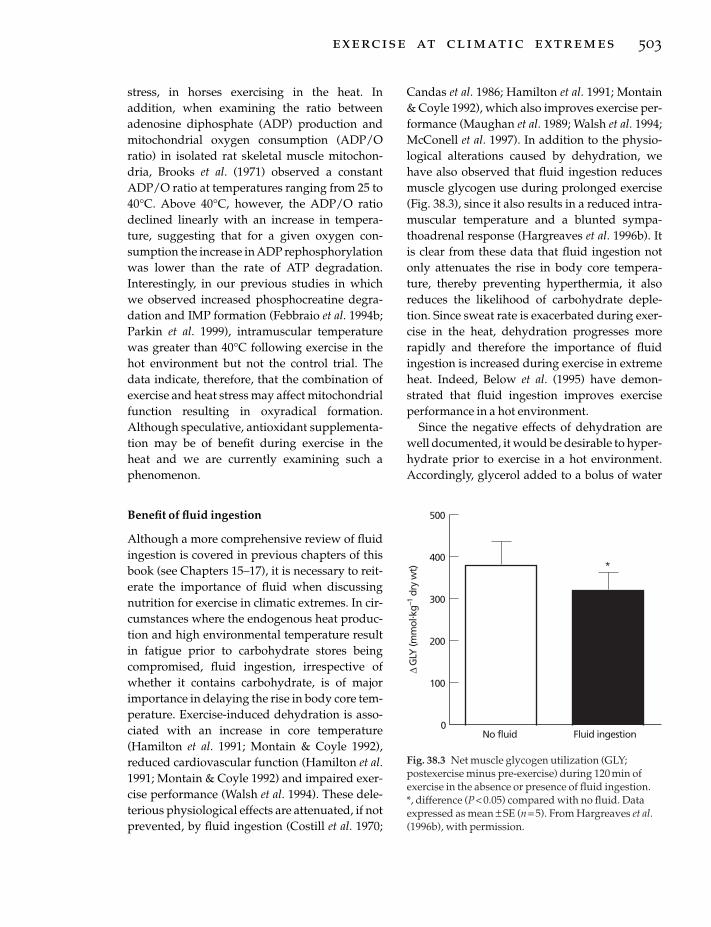
stress, in horses exercising in the heat. In addition, when examining the ratio betweenadenosine diphosphate (ADP) production andmitochondrial oxygen consumption (ADP/Oratio) in isolated rat skeletal muscle mitochon-dria, Brooks et al. (1971) observed a constantADP/O ratio at temperatures ranging from 25 to40°C. Above 40°C, however, the ADP/O ratiodeclined linearly with an increase in tempera-ture, suggesting that for a given oxygen con-sumption the increase in ADP rephosphorylationwas lower than the rate of ATP degradation.Interestingly, in our previous studies in whichwe observed increased phosphocreatine degra-dation and IMP formation (Febbraio et al. 1994b;Parkin et al. 1999), intramuscular temperaturewas greater than 40°C following exercise in thehot environment but not the control trial. Thedata indicate, therefore, that the combination ofexercise and heat stress may affect mitochondrialfunction resulting in oxyradical formation.Although speculative, antioxidant supplementa-tion may be of benefit during exercise in the heat and we are currently examining such a phenomenon.
Benefit of fluid ingestion
Although a more comprehensive review of fluidingestion is covered in previous chapters of thisbook (see Chapters 15–17), it is necessary to reit-erate the importance of fluid when discussingnutrition for exercise in climatic extremes. In cir-cumstances where the endogenous heat produc-tion and high environmental temperature resultin fatigue prior to carbohydrate stores beingcompromised, fluid ingestion, irrespective ofwhether it contains carbohydrate, is of majorimportance in delaying the rise in body core tem-perature. Exercise-induced dehydration is asso-ciated with an increase in core temperature(Hamilton et al. 1991; Montain & Coyle 1992),reduced cardiovascular function (Hamilton et al.1991; Montain & Coyle 1992) and impaired exer-cise performance (Walsh et al. 1994). These dele-terious physiological effects are attenuated, if notprevented, by fluid ingestion (Costill et al. 1970;
Candas et al. 1986; Hamilton et al. 1991; Montain& Coyle 1992), which also improves exercise per-formance (Maughan et al. 1989; Walsh et al. 1994;McConell et al. 1997). In addition to the physio-logical alterations caused by dehydration, wehave also observed that fluid ingestion reducesmuscle glycogen use during prolonged exercise(Fig. 38.3), since it also results in a reduced intra-muscular temperature and a blunted sympa-thoadrenal response (Hargreaves et al. 1996b). Itis clear from these data that fluid ingestion notonly attenuates the rise in body core tempera-ture, thereby preventing hyperthermia, it alsoreduces the likelihood of carbohydrate deple-tion. Since sweat rate is exacerbated during exer-cise in the heat, dehydration progresses morerapidly and therefore the importance of fluidingestion is increased during exercise in extremeheat. Indeed, Below et al. (1995) have demon-strated that fluid ingestion improves exerciseperformance in a hot environment.
Since the negative effects of dehydration arewell documented, it would be desirable to hyper-hydrate prior to exercise in a hot environment.Accordingly, glycerol added to a bolus of water
exercise at climatic extremes 503
∆G
LY (m
mol
. kg–1
dry
wt)
500
0
300
200
No fluid
100
Fluid ingestion
400*
Fig. 38.3 Net muscle glycogen utilization (GLY;postexercise minus pre-exercise) during 120 min ofexercise in the absence or presence of fluid ingestion. *, difference (P < 0.05) compared with no fluid. Dataexpressed as mean ± SE (n = 5). From Hargreaves et al.(1996b), with permission.

and ingested has been demonstrated by some(Lyons et al. 1990; Koenigsberg et al. 1991; Freundet al. 1995) but not others (Murray et al. 1991) toincrease fluid retention, reduce sweat rate andconsequently result in an enhanced thermoregu-latory capacity, especially during exercise in ahot environment (Lyons et al. 1990). Although notclearly understood, it appears that the effective-ness of glycerol may be related to an attenuatedrate of free water clearance, and/or an increase inthe kidney’s medullary concentration gradientresulting in increased glomerular reabsorption(Freund et al. 1995). On balance, the literaturesuggests that glycerol hyperhydration may beeffective prior to exercise in a hot environment.
As sweat rate increases during exercise in theheat, the potential for electrolyte loss, in particu-lar sodium, is increased. It has been suggestedthat sodium be included in rehydration bever-ages to replace sweat sodium losses, preventhyponatraemia, promote the maintenance ofplasma volume and enhance intestinal absorp-tion of glucose and fluid (for detailed review, seeChapter 17). Although the addition of sodium toa fluid beverage will maintain the drive fordrinking and minimize urinary fluid loss in recovery from exercise (Nose et al. 1988;Maughan & Leiper 1995), we have observed littleeffect of alterations in beverage sodium contenton glucose or fluid bioavailability during exer-cise (Hargreaves et al. 1994).
Guidelines for dietary intake when exercisingin the heat
In examining the literature, it is clear that bothcarbohydrate and fluid availability are veryimportant when making dietary recommenda-tions for those exercising in the heat. The intakeof carbohydrate should be increased withrepeated exercise bouts in the heat because eventhough acclimation reduces glycogenolytic rate(King et al. 1985), glycogen use is still higher in an acclimated individual exercising in the heatthan in an unacclimated individual exercising in cooler conditions (Febbraio et al. 1994a). Inaddition, those individuals who undergo daily
504 practical issues
exercise in hot conditions must pay careful atten-tion to fluid intake, since heat acclimatizationincreases sweat rate (Armstrong & Maresh 1991)and, hence, body fluid loss. It is important to note that while a high carbohydrate diet mayexaggerate the core temperature response in rats(Francesconi & Hubbard 1986), such a diet does not cause any deleterious thermoregula-tory responses during exercise in humans (Schwellnus et al. 1990).
When exercising, one should ingest a carbo-hydrate/fluid/electrolyte beverage frequently.Since the relative importance of fluid delivery isincreased during exercise in the heat, one may betempted to ingest water in these circumstances.This practice should be avoided, since the inges-tion of a carbohydrate/electrolyte/fluid bever-age empties from the gut at the same rate aswater (Francis 1979; Owen et al. 1986; Ryan et al.1989), while it can spare muscle glycogen(Yaspelkis & Ivy 1991), during exercise in theheat. In addition, the relative importance of elec-trolyte intake may be increased during exercisein the heat and thus rehydration beveragesshould include electrolytes. The amount of thecarbohydrate within a fluid beverage ingestedduring exercise in the heat appears to have littleeffect on fluid availability or exercise perfor-mance, provided the carbohydrate is not too con-centrated. The change in plasma volume andexercise performance in the heat is not differentwhen ingesting beverages containing 0%, 4.2%and 7% carbohydrate, respectively. Of note,however, when a 14% carbohydrate solution isingested during exercise in the heat, the mainte-nance of plasma volume is reduced while the risein rectal temperature tends to be augmented.Accordingly, exercise performance tends to fall(Fig. 38.4) (Febbraio et al. 1996a). It is important,therefore, to keep the concentration of carbohy-drate within a fluid beverage to approximately10% during exercise in the heat, even though car-bohydrate utilization is augmented in these cir-cumstances. In terms of volume and frequency, apractical recommendation might be 400ml every15min since the rate of fluid loss during exercisein the heat is approximately 1.6 l · h–1 (M.

Febbraio, unpublished observations). It is alsorecommended that the carbohydrate beverage be ingested into recovery to replenish intramus-cular glycogen stores and promote rehydration,especially important for those individualsrepeatedly exercising in a hot environment.
As previously discussed, there is some evi-dence to suggest that protein catabolism isincreased during exercise in the heat. One may betempted to recommend that protein intake beincreased prior to and during such exercise.However, it must be noted that there is a relativepaucity of research examining protein require-ments during exercise in the heat and more isrequired before definitive recommendations can be made. Likewise, there is some evidence to suggest that oxyradical generation may beincreased via the combination of exercise andheat stress and it may be of some benefit to sup-plement those undertaking repeated exercise in a hot environment with antioxidants such as a-tocopherol (vitamin E) and ascorbic acid(vitamin C). This recommendation is specula-tive, however, since the hypothesis that suchsupplementation is advantageous during exercise in the heat is yet to be experimentallyinvestigated.
The deleterious effects of dehydration duringexercise, especially that which is conducted in ahot environment, have been well documented.
It would be desirable to hyperhydrate beforeexercise and, as has been demonstrated, glycerolingestion may provide some benefit in achievinghyperhydration by attenuating urine output. Itappears that a regime consisting of 1g glycerol ·kg–1 body weight in approximately 2 l of fluidingested in the 120min prior to exercise providessome benefit during subsequent exercise (Lyonset al. 1990). Competitive athletes should, how-ever, experiment with this regime during train-ing, since not all individuals may respondfavourably to glycerol hyperhydration.
In summary, during exercise in the heat, abalance between preventing hyperthermia andmaintaining adequate fuel supply to fuel musclecontraction must be maintained. In order toachieve this, athletes need to closely moni-tor hydration levels and carbohydrate intakeleading up to exercise. Daily monitoring of bodyweight and ensuring that urine is pallid willprovide a guide to hydration status. During com-petition, a 4–8% carbohydrate/fluid/electrolytesolution should be ingested at approximately 400ml every 15min and such ingestion should bemaintained during recovery to ensure fluid andenergy replacement. Other dietary modificationssuch as increased protein intake, antioxidantsupplementation and glycerol hyperhydrationmay provide some benefit but further research in these areas is required before definitive
exercise at climatic extremes 505
5
0
–5
–10
–15
–20
39.5
39
38.5
38
37.5
37
36.5
120
100
80
60
40
20
00 20 40 60 80 100 120 0 20 40 60 80 100 120
Time (min) Time (min)
Ch
ang
e in
PV
(%
)
Rec
tal t
emp
erat
ure
( C
)
Exer
cise
tim
e (m
in)
CON 4.2%CHO
7%CHO
14%CHO(a) (b) (c)
*
Fig. 38.4 The change in (a) plasma volume (PV), (b) rectal temperature, and (c) time to exhaustion, whileconsuming a placebo (CON, �) or carbohydrate (CHO) beverage of differing concentrations: 4.2% CHO (�), 7%CHO (�) or 14% CHO (�) during fatiguing exercise at 70% V
.o2max. in 33°C conditions. *, difference (P < 0.05) from
other trials. Data expressed as mean ± SE. Data from Febbraio et al. (1996a).
recommendations can be made regarding theirefficacy.
References
Armstrong, L.E. & Maresh, C.M. (1991) The inductionand decay of heat acclimatisation in trained athletes.Sports Medicine 12, 302–312.
Below, P.R., Mora-Rodriguez, R., Gonzalez-Alonso, J. &Coyle, E.F. (1995) Fluid and carbohydrate ingestionindependently improve performance during 1 h ofintense exercise. Medicine and Science in Sports andExercise 27, 200–210.
Brooks, G.A., Hittleman, K.J., Faulkner, J.A. & Beyer,R.E. (1971) Temperature, skeletal muscle mitochon-drial functions, and oxygen debt. American Journal ofPhysiology 220, 1053–1059.
Brotherhood, J.R. (1973) Studies on energy expenditurein the Antarctic. In Polar Human Biology (ed. P.Edholm & L. Gunderson), pp. 182–192. Heinemann,London.
Brotherhood, J.R. (1985) Snow, cold and energy expen-diture: a basis for fatigue and skiing accidents. Australian Journal of Science and Medicine in Sports 17,3–7.
Campbell, I.T. (1981) Energy intakes on sledding expe-dition. British Journal of Nutrition 45, 89–94.
Campbell, I.T. (1982) Nutrition in adverse environ-ments. 2. Energy balance under polar conditions.Human Nutrition and Applied Nutrition 36, 165–178.
Candas, V., Libert, J.P., Brandenberger, G., Sagot, J.C.,Amaros, C. & Kahn, J.M. (1986) Hydration duringexercise: effects on thermal and cardiovascularadjustments. European Journal of Applied Physiology55, 113–122.
Chesley, A., Hultman, E. & Spriet, L.L. (1995) Effects ofepinephrine infusion on muscle glycogenolysisduring intense aerobic exercise. American Journal ofPhysiology 268, E127–E134.
Coggan, A.R. & Coyle, E.F. (1987) Reversal of fatigueduring prolonged exercise by carbohydrate infusionor ingestion. Journal of Applied Physiology 63,2388–2395.
Coggan, A.R. & Coyle, E.F. (1991) Carbohydrate inges-tion during prolonged exercise: effects on metabo-lism and performance. Exercise and Sport ScienceReviews 19, 1–40.
Costill, D.L. & Hargreaves, M. (1992) Carbohydratenutrition and fatigue. Sports Medicine 13, 86–92.
Costill, D.L., Krammer, W.F. & Fisher, A. (1970) Fluidingestion during distance running. Archives of Envi-ronmental Health 21, 520–525.
Coyle, E.F., Coggan, A.R., Hemmert, M.K. & Ivy, J.L.(1986) Muscle glycogen utilization during prolonged
506 practical issues
exercise when fed carbohydrate. Journal of AppliedPhysiology 61, 165–172.
Cross, M.C., Radomski, M.W., Vanhelder, W.P., Rhind,S.G. & Shepherd, R.J. (1996) Endurance exercise withand without a thermal clamp: effects on leukocytesand leukocyte subsets. Journal of Applied Physiology81, 822–829.
Davis, J.M., Burgess, W.A., Slentz, C.A., Bartoli, W.P. &Pate, R.R. (1988a) Effects of ingesting 6% and 12%glucose/electrolyte beverages during prolongedintermittent cycling in the heat. European Journal ofApplied Physiology 57, 563–569.
Davis, J.M., Lamb, D.R., Pate, R.R., Slentz, C.A.,Burgess, W.A. & Bartoli, W.P. (1988b) Carbohydrate-electrolyte drinks: effects on endurance cycling in the heat. American Journal of Clinical Nutrition 48,1023–1030.
Dolny, D.G. & Lemon, P.W.R. (1988) Effect of ambienttemperature on protein breakdown during pro-longed exercise. Journal of Applied Physiology 64,550–555.
Doubt, T.J. & Hsieh, S.S. (1991) Additive effects of caffeine and cold water during submaximal leg exercise. Medicine and Science in Sports and Exercise 23,435–442.
Febbraio, M.A., Snow, R.J., Hargreaves, M., Stathis,C.G., Martin, I.K. & Carey, M.F. (1994a) Musclemetabolism during exercise and heat stress intrained men: effect of acclimation. Journal of AppliedPhysiology 76, 589–597.
Febbraio, M.A., Snow, R.J., Stathis, C.G., Hargreaves,M. & Carey, M.F. (1994b) Effect of heat stress onmuscle energy metabolism during exercise. Journal ofApplied Physiology 77, 2827–2831.
Febbraio, M.A., Murton, P., Selig, S.E., Clark, S.A.,Lambert, D.L., Angus, D.J. & Carey, M.F. (1996a)Effect of CHO ingestion on exercise metabolism andperformance in different ambient temperatures.Medicine and Science in Sports and Exercise 28,1380–1387.
Febbraio, M.A., Snow, R.J., Stathis, C.G., Hargreaves,M. & Carey, M.F. (1996b) Blunting the rise in bodytemperature reduces muscle glycogenolysis duringexercise in humans. Experimental Physiology 81,685–693.
Febbraio, M.A., Lambert, D.L., Starkie, R.L., Proietto, J.& Hargreaves, M. (1998) Effect of epinephrine onmuscle glycogenolysis during exercise in trainedmen. Journal of Applied Physiology 84, 465–470.
Fink, W.J., Costill, D.L. & Van Handel, P.J. (1975) Legmuscle metabolism during exercise in the heat and cold. European Journal of Applied Physiology 34,183–190.
Francesconi, R.P. & Hubbard, R.W. (1986) Dietarymanipulation and exercise in the heat: thermoregula-

tory and metabolic effects in rats. Aviation, Space andEnvironmental Medicine 57, 31–35.
Francis, K.T. (1979) Effect of water and electrolytereplacement during exercise in the heat on biochemi-cal indices of stress and performance. Aviation, Spaceand Environmental Medicine 50, 115–119.
Freund, B.J., Montain, S.J., Young, A.J. et al. (1995) Glyc-erol hyperhydration: hormonal, renal and vascularfluid responses. Journal of Applied Physiology 79,2069–2077.
Galbo, H., Houston, M.E., Christensen, N.J. et al. (1979)The effect of water temperature on the hormonalresponse to prolonged swimming. Acta PhysiologicaScandinavica 105, 326–337.
Gisolfi, C.V., Spranger, K.J., Summers, W., Schedl, H.P.& Bleiler, T.L. (1991) Effects of cycle exercise onintestinal absorption in humans. Journal of AppliedPhysiology 71, 2518–2527.
Graham, T.E., Sathasivam, P. & McNaughton, K.W.(1991) Influence of cold, exercise, and caffeine on catecholamines and metabolism in men. Journal ofApplied Physiology 70, 2052–2058.
Hall, V.E., Attardo, F.P. & Perryman, J.H. (1948) Influ-ence of dinitrophenol on body temperature thresh-old for thermal polypnea. Proceedings of the Society ofExperimental Biology 69, 413–415.
Hamilton, M.T., Gonzalez-Alonso, J., Montain, S.J. &Coyle, E.F. (1991) Fluid replacement and glucoseinfusion during exercise prevent cardiovasculardrift. Journal of Applied Physiology 71, 871–877.
Hargreaves, M., Costill, D., Burke, L., McConell, G. &Febbraio, M. (1994) Influence of sodium on glucosebioavailability during exercise. Medicine and Sciencein Sports and Exercise 26, 365–368.
Hargreaves, M., McConell, G.K. & Proietto, J. (1995)Influence of muscle glycogen on glycogenolysis andglucose uptake during exercise. Journal of AppliedPhysiology 78, 288–292.
Hargreaves, M., Angus, D., Howlett, K., Marmy Conus,N. & Febbraio, M. (1996a) Effect of heat stress onglucose kinetics during exercise. Journal of AppliedPhysiology 81, 1594–1597.
Hargreaves, M., Dillo, P., Angus, D. & Febbraio, M.(1996b) Effect of fluid ingestion on muscle metabo-lism during prolonged exercise. Journal of AppliedPhysiology 80, 363–366.
Hessemer, V., Langush, D., Brük, K., Bodeker, R. & Breidenbach, T. (1984) Effects of slightly loweredbody temperatures on endurance performance inhumans. Journal of Applied Physiology 57, 1731–1737.
Holmer, I. & Bergh, U. (1974) Metabolic and thermalresponses to swimming in water at varying tempera-tures. Journal of Applied Physiology 37, 702–705.
Jacobs, I., Romet, T.T. & Kerrigan-Brown, D. (1985)Muscle glycogen depletion during exercise at 9°C
and 21°C. European Journal of Applied Physiology 54,35–39.
Jansson, E., Hjemdahl, P. & Kaijser, L. (1986) Epineph-rine induces changes in muscle carbohydrate me-tabolism during exercise in male subjects. Journal ofApplied Physiology 60, 1466–1470.
Keast, D., Cameron, K. & Morton, A.R. (1988) Exerciseand the immune response. Sports Medicine 5,248–267.
King, D.S., Costill, D.L., Fink, W.J., Hargreaves, M. &Fielding, R.A. (1985) Muscle metabolism duringexercise in the heat in unacclimatized and acclima-tized humans. Journal of Applied Physiology 59,1350–1354.
Kjær, M., Engfred, K., Fernandes, A., Secher, N.H. &Galbo, H. (1993) Regulation of hepatic glucose pro-duction during exercise in humans: role of sympa-thoadrenergic activity. American Journal of Physiology265, E275–E283.
Koeningsberg, P., Lyons, P.T., Nagy, R. & Riedesel, M.L.(1991) 40 hour glycerol-induced hyperhydration.FASEB Journal 5, A768 (abstract).
Kozlowski, S., Brzezinska, Z., Kruk, B., Kaciuba-Uscilko, H., Greenleaf, J.E. & Nazar, K. (1985) Exercise hyperthermia as a factor limiting physi-cal performance: temperature effect on muscle metabolism. Journal of Applied Physiology 59, 766–773.
Le Blanc, J. (1975) Man in the Cold. Charles C. Thomas,Springfield, IL.
Lyons, T.P., Riedesel, M.L., Meuli, L.E. & Chick, T.W.(1990) Effects of glycerol-induced hyperhydrationprior to exercise in the heat on sweating and coretemperature. Medicine and Science in Sports and Exercise 22, 477–483.
McConell, G.K., Fabris, S., Proietto, J. & Hargreaves, M.(1994) Effect of carbohydrate ingestion on glucosekinetics during exercise. Journal of Applied Physiology77, 1537–1541.
McConell, G.K., Burge, C.M., Skinner, S.L. & Hargreaves, M. (1997) Influence of ingested fluidvolume on physiological responses during pro-longed exercise. Acta Physiologica Scandinavica 160,149–156.
MacLean, D.A., Graham, T.E. & Saltin, B. (1996) Stimu-lation of muscle ammonia production during exercise following branched-chain amino acid sup-plements in human. Journal of Physiology 493,909–922.
Madsen, K., MacLean, D.A., Kiens, B. & Christensen, D.(1996) Effects of glucose, glucose plus branchedchain amino acids, or placebo on bike performanceover 100 km. Journal of Applied Physiology 81,2644–2650.
Martineau, L. & Jacobs, I. (1989) Muscle glycogen avail-
exercise at climatic extremes 507

ability and temperature regulation in humans.Journal of Applied Physiology 66, 72–78.
Maughan, R.J. & Leiper, J.B. (1995) Sodium intake andpost-exercise rehydration in man. European Journal ofApplied Physiology 71, 311–319.
Maughan, R.J., Fenn, C.E. & Leiper, J.B. (1989) Effects of fluid, electrolyte and substrate ingestion onendurance capacity. European Journal of Applied Physi-ology 58, 481–486.
Millard-Stafford, M., Sparling, P.B., Rosskopf, L.B.,Hinson, B.T. & Dicarlo, L.J. (1990) Carbohydrate-electrolyte replacement during a simulated triathlonin the heat. Medicine and Science in Sports and Exercise22, 621–628.
Millard-Stafford, M., Sparling, P.B., Rosskopf, L.B. &Dicarlo, L.J. (1992) Carbohydrate-electrolyte replace-ment improves distance running performance in theheat. Medicine and Science in Sports and Exercise 24,934–940.
Mills, P.C., Smith, N.C., Casa, I., Harris, P., Harris, R.C.& Marlin, D.J. (1996) Effects of exercise intensity andenvironmental stress on indices of oxidative stressand iron homeostasis during exercise in the horse.European Journal of Applied Physiology 74, 60–66.
Mitchell, J.B., Costill, D.L., Houmard, J.A., Fink, W.J.,Robergs, R.A. & Davis, J.A. (1989) Gastric emptying:influence of prolonged exercise and carbohydrateconcentration. Medicine and Science in Sports and Exercise 21, 269–274.
Mitchell, J.B., Costill, D.L., Houmard, J.A., Flynn, M.G.,Fink, W.J. & Belz, J.D. (1990) Influence of carbohy-drate ingestion on counterregulatory hormonesduring prolonged exercise. International Journal ofSports Medicine 11, 33–36.
Mittleman, K., Ricci, M. & Bailey, S.P. (1998) Branched-chain amino acids prolong exercise during heatstress in men and women. Medicine and Science inSports and Exercise 30, 83–91.
Montain, S.J. & Coyle, E.F. (1992) Influence of gradeddehydration on hyperthermia and cardiovasculardrift during exercise. Journal of Applied Physiology 73,1340–1350.
Murray, R., Eddy, D.E., Murray, T.W., Seifert, J.G., Paul,G.L. & Halaby, G.A. (1987) The effect of fluid and car-bohydrate feedings during intermittent cycling exer-cise. Medicine and Science in Sports and Exercise 19,597–604.
Nielsen, B., Savard, G., Richter, E.A., Hargreaves, M. &Saltin, B. (1990) Muscle blood flow and musclemetabolism during exercise and heat stress. Journal ofApplied Physiology 69, 1040–1046.
Nielsen, B., Hales, J.R.S., Strange, S., Juel Christensen,N., Warberg, J. & Saltin, B. (1993) Human circulatoryand thermoregulatory adaptations with heat accli-mation and exercise in a hot, dry environment.Journal of Physiology 460, 467–485.
508 practical issues
Nose, H., Mack, G.W., Shi, X. & Nadel, E.R. (1988) Roleof osmolality and plasma volume during rehydra-tion in humans. Journal of Applied Physiology 65,332–336.
Owen, M.D., Kregel, K.C., Wall, P.T. & Gisolfi, C.V.(1986) Effects of ingesting carbohydrate beveragesduring exercise in the heat. Medicine and Science inSports and Exercise 18, 568–575.
Parkin, J.M., Carey, M.F., Zhao, S. & Febbraio, M.A.(1999) Effect of ambient temperature on humanskeletal muscle metabolism during fatiguing sub-maximal exercise. Journal of Applied Physiology 86,902–908.
Powers, S.K., Howley, E.T. & Cox, R. (1985) A differen-tial catecholamine response during exercise andpassive heating. Medicine and Science in Sports andExercise 14, 435–439.
Rehrer, N.J., Beckers, E.J., Brouns, F., ten Hoor, F. & Saris, W.H.M. (1989) Exercise and training effectson gastric emptying of carbohydrate beverages. Medicine and Science in Sports and Exercise 21, 540–549.
Romet, T.T., Shephard, R.J. & Frim, J. (1986) The meta-bolic cost of exercising in cold air. Arctic MedicalResearch 44, 29–36.
Rowell, L.B., Brenglemann, G.L., Blackmon, J.R., Twiss,R.D. & Kusumi, F. (1968) Splanchnic blood flow andmetabolism in heat stressed man. Journal of AppliedPhysiology 24, 475–484.
Ryan, A.J., Bleiler, T.L., Carter, J.E. & Gisolfi, C.V. (1989)Gastric emptying during prolonged cycling exercisein the heat. Medicine and Science in Sports and Exercise21, 51–58.
Sahlin, K., Katz, A. & Broberg, S. (1990) Tricarboxylicacid cycle intermediates in humans during pro-longed exercise. American Journal of Physiology 259,C834–C841.
Schwellnus, M.P., Gordon, M.F., van Zyl, G.G. et al.(1990) Effect of a high carbohydrate diet on core tem-perature during prolonged exercise. British Journal ofSports Medicine 24, 99–102.
Sellers, E.A. (1972) Hormones in the regulation of bodytemperatures. In The Pharmacology of Thermoregula-tion (ed. E. Schönbaum & P. Lomax), pp. 57–71.Karger, Basel.
Smith, J.A., Gray, B., Pyne, D.B., Baker, M.S., Telford,R.D. & Weidemann, M.J. (1996) Moderate exercisetriggers both priming and activation of neutrophilsubpopulations. American Journal of Physiology 270,R838–R845.
Snow, R.J., Febbraio, M.A., Carey, M.F. & Hargreaves,M. (1993) Heat stress increases ammonia accumula-tion during exercise. Experimental Physiology 78,847–850.
Spencer, M.K., Yan, Z. & Katz, A. (1991) Carbohydratesupplementation attenuates IMP accumulation in

human muscle during prolonged exercise. AmericanJournal of Physiology 261, C71–C76.
Spriet, L.L., Ren, J.M. & Hultman, E. (1988) Epineph-rine infusion enhances muscle glycogenolysisduring prolonged electrical stimulation. Journal ofApplied Physiology 64, 1439–1444.
Vallerand, A.L. & Jacobs, I. (1989) Rates of energy substrates utilization during human cold expo-sure. European Journal of Applied Physiology 58, 873–878.
Vallerand, A.L., Jacobs, I. & Kavanagh, M.F. (1989)Mechanisms of advanced cold tolerance by anephedrine-caffeine mixture in humans. Journal ofApplied Physiology 67, 438–444.
Vallerand, A.L., Tikuisis, P., Ducharme, M.B. & Jacobs,I. (1993) Is energy substrate mobilization a limitingfactor for cold thermogenesis? European Journal ofApplied Physiology 67, 239–244.
Vallerand, A.L., Zamecnik, J. & Jacobs, I. (1995) Plasmaglucose turnover during cold stress in humans.Journal of Applied Physiology 78, 1296–1302.
van Hall, G., Raaymakers, J.S.H., Saris, W.H.M. &Wagenmakers, A.J.M. (1995) Ingestion of branched-chain amino acids and tryptophan during sustainedexercise in man: failure to affect performance. Journalof Physiology 486, 789–794.
Walsh, R.M., Noakes, T.D., Hawley, J.A. & Dennis, S.C.(1994) Impaired high-intensity cycling performancetime at low levels of dehydration. InternationalJournal of Sports Medicine 15, 392–398.
Wang, L.C.H., Man, S.F.P. & Belcastro, A.N. (1987)Metabolic and hormonal responses in theophylline-increased cold resistance in males. Journal of AppliedPhysiology 63, 589–596.
Webb, P. (1992) Temperature of skin, subcutaneoustissue, muscle and core in resting men in cold, comfortable and hot conditions. European Journal ofApplied Physiology 64, 471–476.
Yaspelkis, B.B. III & Ivy, J.L. (1991) Effect of carbohy-drate supplements and water on exercise metabo-lism in the heat. Journal of Applied Physiology 71,680–687.
Yaspelkis, B.B. III, Scroop, G.C., Wilmore, K.M. & Ivy,J.L. (1993) Carbohydrate metabolism during exercisein hot and thermoneutral environments. InternationalJournal of Sports Medicine 14, 13–19.
Young, A.J., Sawka, M.N., Levine, L., Cadarette, B.S. &Pandolf, K.B. (1985) Skeletal muscle metabolismduring exercise is influenced by heat acclimation.Journal of Applied Physiology 59, 1929–1935.
Young, A.J., Muza, S.R., Sawka, M.N., Gonzalez, R.R. & Pandolf, K.B. (1986) Human thermoregulatoryresponses to cold air are altered by repeated coldwater immersion. Journal of Applied Physiology 60,1542–1548.
Young, A.J., Sawka, M.N., Neufer, P.D., Muza, S.R.,Askew, E.W. & Pandolf, K.B. (1989) Thermoregula-tion during cold water immersion is unimpaired by low muscle glycogen levels. Journal of AppliedPhysiology 66, 1809–1816.
exercise at climatic extremes 509

Introduction
Athletes seem to be at increased risk of develop-ing eating disorders, and studies indicate thatspecific risk factors for the development of eatingdisorders occur in some sport settings.
The diagnosis of an eating disorder in athletescan easily be missed unless specifically searchedfor. Counselling on wise food choices and eatinghabits will be helpful for most athletes and therole of the sport nutritionist in working with ath-letes with eating disorders is crucial. Therefore,nutritionists should have good knowledge of the symptomatology of eating disorders, how toapproach the athlete and how to establish trustthat can lead to effective treatment.
If untreated, eating disorders can have long-lasting physiological and psychological effectsand may even be fatal. For a number of reasons,there is a strong pattern of denial, and a stan-dardized scale or a diagnostic interview specificfor athletes must be obtained.
This chapter reviews the characteristics ofeating disorders, their prevalence, and riskfactors for the development of eating disorders insport. Practical implications for the identificationand treatment of eating-disordered athletes andthe need for future research are also discussed.
Characteristics of eating disorders
As described in the Diagnostic and StatisticalManual of Mental Disorders (DSM), eating disor-ders are characterized by gross disturbances
in eating behaviour. They include anorexianervosa, bulimia nervosa and eating disorder nototherwise specified (American Psychiatric Asso-ciation 1987).
Anorexia nervosa is characterized in individ-uals by a refusal to maintain body weight over aminimal level considered normal for age andheight, a distorted body image, an intense fear offatness or weight gain while being underweight,and amenorrhoea (the absence of at least threeconsecutive menstrual cycles). Individuals withanorexia ‘feel fat’ while they are underweight(American Psychiatric Association 1987).
Bulimia nervosa is characterized by bingeeating (rapid consumption of a large amount offood in a discrete period of time) and purging.This typically involves consumption of calorie-dense food, usually eaten inconspicuously orsecretly. By relieving abdominal discomfortthrough vomiting, the individual can continue tobinge (American Psychiatric Association 1987).
The eating disorder not otherwise specifiedcategory is for disorders of eating that do notmeet the criteria for any specific eating disorder(American Psychiatric Association 1994).
Athletes constitute a unique population andspecial diagnostic considerations should beapplied when working with this group (Szmuck-ler et al. 1985; Sundgot-Borgen 1993; Thompson& Trattner-Sherman 1993). An attempt has beenmade to identify athletes who show significantsymptoms of eating disorders, but who do notmeet the DSM criteria for anorexia nervosa or bulimia nervosa. These athletes have been
Chapter 39
Eating Disorders in Athletes
JORUNN SUNDGOT-BORGEN
510

classified as having a subclinical eating disordertermed anorexia athletica (Sundgot-Borgen1994a).
It is assumed that many cases of anorexianervosa and bulimia nervosa begin as subclinicalvariants of these disorders. Early identificationand treatment may prevent development of thefull disorder (Bassoe 1990). Subclinical cases aremore prevalent than those meeting the formaldiagnostic criteria for anorexia nervosa andbulimia nervosa (Sundgot-Borgen 1994a).
Prevalence
Data on the prevalence of eating disorders in ath-letic populations are limited and equivocal. Most studies have looked at symptoms of eatingdisorders such as preoccupation with food andweight, disturbed body image, or the use of pathogenic weight control methods.
Female athletes
Estimates of the prevalence of the symptoms of eating disorders and true eating disordersamong female athletes range from less than 1% toas high as 75% (Gadpalle et al. 1987; Burckes-Miller & Black 1988; Warren et al. 1990; Sundgot-Borgen 1994a).
Methodological weaknesses such as smallsample size, lack of definition of the competitivelevel or type of sport(s) and lack of definition ofthe data collection method used characterizemost of the studies attempting to study theprevalence of eating disorders (Sundgot-Borgen1994b).
Only one study has used clinical evaluationand the DSM criteria applied across athletes andcontrols (Sundgot-Borgen 1994a). The preva-lence of anorexia nervosa (1.3%) seems to be within the same range as that reported in non-athletes (Andersen 1990), whereas bulimianervosa (8.2%) and subclinical eating disoders(8%) seem to be more prevalent among femaleathletes than non-athletes (Sundgot-Borgen1994a). The prevalence of eating disorders wassignificantly higher among athletes competing in aesthetic and weight-dependent sports thanamong other sport groups where leanness is con-sidered less important (Fig. 39.1).
Male athletes
Results from existing studies on male athletesindicate that the frequency of eating distur-bances and pathological dieting practices variesfrom none to 57%, depending on the definitionused and the population studied (Dummer et al.
eating disorders in athletes 511
50
40
30
20
10
0G1 G2 G3 G4 G5 G6
Sports groups Non-athletes
Sub
ject
s w
ith
eat
ing
dis
ord
er (
%)
*
Fig. 39.1 Prevalence of eatingdisorders in female elite athletesrepresenting: G1, technical sports(n = 98); G2, endurance sports (n = 119); G3, aesthetic sports (n = 64); G4, weight-dependentsports (n = 41); G5, ball games (n = 183); G6, power sports (n = 17); and non-athletes (n = 522). The data are shown asmean and 95% confidenceintervals. The shaded area is the95% confidence interval for thecontrol group of non-athletes.

1987; Burckes-Miller & Black 1988; Rosen &Hough 1988; Rucinski 1989).
Only one study on male athletes has used theDSM criteria to diagnose eating disturbances.The prevalence of clinically diagnosed eatingdisorders in Norwegian male elite athletes is 8%compared to 0.5% in matched controls (Torstveitet al. 1998).
In a study by Blouin and Goldfield (1995),bodybuilders reported significantly greater bodydissatisfaction, a high drive for bulk, a high drivefor thinness, increased bulimic tendencies andmore liberal attitudes towards using steroidsthan runners and martial artists.
Sykora et al. (1993) compared eating, weightand dieting disturbances in male and femalelightweight and heavyweight rowers. Femalesdisplayed more disturbed eating and weightcontrol methods than did males. Male rowerswere more affected by weight restriction thanwere female rowers, probably because theygained more during the off-season. Lightweightmales showed greater weight fluctuation duringthe season and gained more weight during theoff season than did lightweight females andheavyweight males and females. Despite themethodological weaknesses, existing studies are consistent in showing that symptoms ofeating disorders and pathogenic weight-controlmethods are more prevalent in athletes than non-athletes, and more prevalent in sports inwhich leanness or a specific weight are consid-ered important, than among athletes competingin sports where these factors are considered lessimportant (Hamilton et al. 1985, 1988; Rosen et al.1986; Dummer et al. 1987; Sundgot-Borgen &Corbin 1987; Rosen & Hough 1988; Wilmore1991; Sundgot-Borgen 1994b; O’Connor et al.1996).
Furthermore, the frequency of eating disorderproblems determined by questionnaire only ismuch higher than the frequency reported whenathletes have been clinically evaluated (Rosen & Hough 1988; Rucinski 1989; Sundgot-Borgen1994b).
512 practical issues
Self reports vs. clinical interview
Elite athletes underreport the use of purgingmethods such as laxatives, diuretics and vomit-ing and the presence of an eating disorder, andoverreport the use of binge eating when data areobtained in the questionnaire (Sundgot-Borgen1994a). Therefore, it is the author’s opinion thatto determine whether an athlete actually suffersfrom any of the eating disorders described, aninterview with a clinician is necessary to assessan athlete’s physical and emotional condition,and whether this interferes with everyday functioning.
Firm conclusions about the optimum methodsof assessment and the prevalence of disorderedeating at different competitive level cannot bedrawn without longitudinal studies with acareful classification and description of the com-petitive level of the athletes investigated.
Risk factors
Psychological, biological and social factors areimplicated in the development of eating disor-ders (Katz 1985; Garner et al. 1987). Athletesappear to be more vulnerable to eating disordersthan the general population, because of addi-tional stresses associated with the athletic environment (Hamilton et al. 1985; Szmuckler et al. 1985). It is assumed that some risk factors(e.g. intense pressure to be lean, increased training volume and perfectionism) are morepronounced in elite athletes.
Hamilton et al. (1988) found that less skilleddancers in the United States reported signifi-cantly more eating problems than the moreskilled dancers. On the other hand, Garner et al.(1987) found that dancers at the highest competi-tive level had a higher prevalence of eating disor-ders than dancers at lower competitive levels.
A biobehavioural model of activity-basedanorexia nervosa was proposed in a series ofstudies by Epling and Pierce (1988) and Epling etal. (1983) and there are some studies indicatingthat the increased training load may induce anenergy deficit in endurance athletes, which in
turn may elicit biological and social reinforce-ments leading to the development of eating disorders (Sundgot-Borgen 1994a). Thus, longi-tudinal studies with close monitoring of anumber of sport-specific factors such as volume,type and intensity of the training in athletes rep-resenting different sports are needed before thequestion regarding the role played by differentsports in the development of eating disorders canbe answered.
Also, starting sport-specific training at prepu-bertal age may prevent athletes from choosingthe sport most suitable for their adult body type.Athletes with eating disorders have been shownto start sport-specific training at an earlier agethan athletes who do not meet the criteria foreating disorders (Sundgot-Borgen 1994a).
In addition to the pressure to reduce weight,athletes are often pressed for time, and they mayhave to lose weight rapidly to make or stay onthe team. As a result, they often experience fre-quent periods of restrictive dieting or weightcycling (Sundgot-Borgen 1994a). Such periodshave been suggested as important risk or triggerfactors for the development of eating disorders in athletes (Brownell et al. 1987; Sundgot-Borgen1994a).
Pressure to reduce weight has been the generalexplanation for the increased prevalence ofeating-related problems among athletes. It is notnecessarily dieting per se, but the situation inwhich the athlete is told to lose weight, the wordsused, and whether the athlete receives guidanceor not, that are important.
The characteristics of a sport (e.g. emphasis onleanness or individual competition) may interactwith the personality traits of the athlete to start or perpetuate an eating disorder (Wilson &Eldredge 1992). Finally, athletes have reportedthat they developed eating disorders as a resultof an injury or illness that left them temporarilyunable to continue their normal level of exercise(Katz 1985; Sundgot-Borgen 1994a). An injurycan curtail the athlete’s exercise and traininghabits. As a result, the athlete may gain weightdue to the reduced energy expenditure, or theathlete may develop an irrational fear of weight
gain. In either case, the athlete may begin to dietas a means of compensating (Thompson & Trattner-Sherman 1993). Thus, the loss of a coachor unexpected illness or injury can probably beregarded as traumatic events similar to thosedescribed as trigger mechanisms for eating dis-orders in non-athletes (Bassoe 1990).
Most researchers agree that coaches do notcause eating disorders in athletes, although inap-propriate coaching may trigger the problem or exacerbate it in vulnerable individuals(Wilmore 1991). Therefore, in most cases the roleof coaches in the development of eating disor-ders in athletes should be seen as a part of acomplex interplay of factors.
Figure 39.2 illustrates an aetiological model forthe development of eating disorders in athletes.
Medical issues
Whereas most complications of anorexia nervosaoccur as a direct or indirect result of starvation,complications of bulimia nervosa occur as aresult of binge eating and purging (Thompson &Trattner-Sherman 1993). Hsu (1990), Johnson andConnor (1987) and Michell (1990) provide infor-mation on the medical problems encountered ineating-disordered patients.
Studies have reported mortality rates from less than 1% to as high as 18% in patients with anorexia nervosa in the general population(Thompson & Trattner-Sherman 1993).
Death is usually attributable to fluid and elec-trolyte abnormalities or to suicide (Brownell & Rodin 1992). Mortality in bulimia nervosa isless well studied, but deaths do occur, usually secondary to the complications of the binge–purging cycle or to suicide. Mortality rates from eating disorders among athletes are notknown.
For years, athletes have used and abuseddrugs to control weight. Some athletes usedieting, bingeing, vomiting, sweating and fluidrestriction for weight control. It is clear that manyof these behaviours exist on a continuum, andmay present health hazards for the athlete. Laxa-tives, diet pills and diuretics are probably the
eating disorders in athletes 513

type of drugs most commonly abused by athleteswhile eating-disordered dancers also report theuse of marijuana, cocaine, tranquillizers andamphetamines (Holderness et al. 1994). Eight percent of the Norwegian elite athletes sufferingfrom eating disorders reported a regular use ofdiuretics and a significantly higher numberreported the use of laxatives, vomiting, and dietpills (Sundgot-Borgen & Larsen 1993b). It shouldbe noted that diet pills often contain drugs in thestimulant class, and that both these and diureticsare banned by the IOC.
Identifying athletes with eating disorders
anorexia nervosa andanorexia athletica
Most individuals with anorexia athletica do notrealize that they have a problem, and thereforedo not seek treatment on their own. Only if theseathletes see that their performance level is level-ling off might they consider seeking help. Thefollowing physical and psychological character-istics may indicate the presence of anorexianervosa or anorexia athletica.
The physical symptoms of athletes withanorexia nervosa or anorexia athletica (Thomp-son & Trattner-Sherman 1993) include:
1 significant weight loss beyond that necessaryfor adequate sport performance;
2 amenorrhoea or menstrual dysfunction;
514 practical issues
3 dehydration;4 fatigue beyond that normally expected in
training or competition;5 gastrointestinal problems (i.e. constipation,
diarrhoea, bloating, postprandial distress);6 hyperactivity;7 hypothermia;8 bradycardia;9 lanugo;
10 muscle weakness;11 overuse injuries;12 reduce bone mineral density;13 stress fractures.
The psychological and behavioral charac-teristics of athletes with anorexia nervosa andanorexia athletica (Thompson & Trattner-Sherman 1993; Sundgot-Borgen 1994b) include:
1 anxiety, both related and unrelated to sportperformance;
2 avoidance of eating and eating situations;3 claims of ‘feeling fat’ despite being thin;4 resistance to weight gain or maintenance
recommended by sport support staff;5 unusual weighing behavior (i.e. excessive
weighing, refusal to weigh, negative reaction tobeing weighed);
6 compulsiveness and rigidity, especiallyregarding eating and exercise;
7 excessive or obligatory exercise beyond thatrequired for a particular sport;
8 exercising while injured despite prohibitionsby medical and training staff;
Restrictive eating
Weight loss andimproved performance
Positive feedback from'important others'
Athlete has feeling of total control
Intensified behaviour
Loss of control, reducedperformance
Eating disordersFig. 39.2 Aetiological model forthe development of eatingdisorders in athletes.

9 restlessness — relaxing is difficult or impossible;10 social withdrawal from teammates and sportsupport staff, as well as from people outsidesports;11 depression;12 insomnia.
bulimia nervosa
Most athletes suffering from bulimia nervosa are at or near normal weight. Bulimic athletesusually try to hide their disorder until they feelthat they are out of control, or when they realizethat the disorder negatively affects sport perfor-mance. Therefore, the team staff must be able torecognize the following physical symptoms andpsychological characteristics.
The physical symptoms of athletes withbulimia nervosa (Thompson & Trattner-Sherman1993) include:
1 callus or abrasion on back of hand frominducing vomiting;
2 dehydration, especially in the absence oftraining or competition;
3 dental and gum problems;4 Oedema, complaints of bloating, or both;5 electrolyte abnormalities;6 frequent and often extreme weight fluctua-
tions (i.e. mood worsens as weight goes up);7 gastrointestinal problems;8 low weight despite eating large volumes;9 menstrual irregularity;
10 muscle cramps, weakness, or both;11 swollen parotid glands.
The psychological and behavioural charac-teristics of athletes with bulimia nervosa(Thompson & Trattner-Sherman 1993) include:
1 binge eating;2 agitation when bingeing is interrupted;3 depression;4 dieting that is unnecessary for appearance,
health or sport performance;5 evidence of vomiting unrelated to illness;6 excessive exercise beyond that required for
the athlete’s sport;7 excessive use of the restroom;
8 going to the restroom or ‘disappearing’ aftereating;
9 self-critical, especially concerning body,weight and sport performance10 secretive eating;11 substance abuse — whether legal, illegal, pre-scribed, or over-the-counter drugs, medicationsor other substances;12 use of laxatives, diuretics (or both) that isunsanctioned by medical or training staff.
Laboratory investigations recommended forall eating-disordered patients, those indicatedfor particular patients and those of academicinterest with expected finding are discussed byBeumont et al. (1993).
Eating pattern and dietary intake inelite eating-disordered athletes
The eating-disordered athlete’s attitude to eatingand nutrition is often based on myths and mis-conceptions. Most eating-disordered athletesreport that the onset of their eating disorder was preceded by a period of dieting or weightcycling. Apart from the binge eating, most bulim-ics, as well as the anorexia athletica and anorexianervosa patients, show restrictive eating pattern.
In a study of female elite athletes, as many as29% of the anorexia nervosa, 14% of the anorexiaathletica and 60% of the bulimia nervosa, and13% of the healthy athletes reported having twoor fewer meals a day (Sundgot-Borgen & Larsen1993a). Bulimic athletes have fewer meals perday than athletes with anorectic symptoms. For anumber of eating-disordered athletes, the dura-tion between meals is 7–11h. Thus, it is not diffi-cult to understand why such a high number ofeating-disordered athletes binge and purge on a regular basis. In the same study, eating-disordered athletes reported that they had irreg-ular eating pattern even before the eating disor-der developed. Therefore, this may be anadapted and ‘normal’ eating pattern for theseyoung female athletes, and as such, a possiblerisk factor for the development of eating dis-orders. These results indicate the need for teach-ing young athletes and their parents about
eating disorders in athletes 515
the importance of meal planning and to make it possible to have the meals fitted into their schedule.
Eating-disordered athletes, except for thebulimic athletes, consume a diet that is too low inenergy and nutrients. The mean levels of energyand carbohydrate intake for anorexia athleticaare lower than recommended for active females,and a significant number of eating-disorderedathletes do not reach the protein level recom-mended for athletes. In addition, low intakes of several micronutrients are reported, mostnotably calcium, vitamin D and iron (Sundgot-Borgen & Larsen 1993a). The inadequacyreported, combined with the use of differentpurging methods, are of major concern since a number of eating-disordered athletes areyoung and still growing individuals. Again, the guidance of qualified nutritionists for the athletic population in general and specifically for the athlete at risk for eating disorder iscrucial.
Athletes representing sports emphasizingleanness such as the rhythmic gymnasts areexposed to nutrition and weight-control myths.The author has worked specifically with nationallevel rhythmic gymnasts and these athletesreported a number of nutritional myths thatpartly explain why such a high number of those athletes are suffering from eating dis-orders. These include: never eat after 5 p.m.; 3360kJ ·day–1 (800 kcal · day–1) is enough forrhythmic gymnasts; eat only cold food becauseyou spend more energy digesting cold food; donot eat meat, bread or potatoes; and drinkingduring training will destroy your practice.
Athletes, coaches, and in some sports also the parents, need to be educated about weightcontrol, sound nutrition, and ‘natural’ growthand development. The focus on leanness must bede-emphasized and the unwritten rules in somesports changed. Eating disorders are likely to bea special problem within those sports where thecompetitors are young (still growing) and lean-ness is considered important for top perfor-mance, unless limits are placed on age andpercentage fat for participants in sports.
516 practical issues
Effect of eating disorders on sport performance
The nature and the magnitude of the effect ofeating disorders on athletic performance areinfluenced by the severity and chronicity of theeating disorder and the physical and psychologi-cal demands of the sport. Loss of endurance dueto dehydration impairs exercise performance(Fogelholm 1994). Absolute maximal oxygenuptake (measured as litres per minute) isunchanged or decreased after rapid body weightloss, but maximal oxygen uptake expressed inrelation to body weight (millilitres per kilogrambody weight per minute) may increase aftergradual body weight reduction (Ingjer &Sundgot-Borgen 1991; Fogelholm 1994).
Anaerobic performance and muscle strengthare typically decreased after rapid weight reduc-tion even after 1–3h of rehydration. When testedafter 5–24h of rehydration, performance is maintained at euhydrated levels (Klinzing &Karpowicz 1986; Fogelholm et al. 1993). Loss ofcoordination due to dehydration is also reportedto impair exercise performance (Fogelholm1994).
Reduced plasma volume, impaired ther-moregulation and nutrient exchange, decreasedglycogen availability and decreased buffercapacity in the blood are plausible explanationsfor reduced performance in aerobic, anaerobicand muscle endurance work, especially afterrapid weight reduction (Fogelholm 1994).
Psychological effects
Studies on the psychological effect of dieting andweight cycling are lacking in female athletes, butit is reported that many young wrestlers experi-ence mood alterations (increased fatigue, anger,or anxiety) when attempting to lose body weightrapidly (Fogelholm et al. 1993).
Long-term health effects
The long-term effects of body-weight cycling andeating disorders in athletes are not clear. Biologi-

cal maturation and growth have been studied ingirl gymnasts before and during puberty: thereare sufficient data to conclude that young femalegymnasts are smaller and mature later thanfemales in sports which do not require extremeleanness, e.g. swimming (Mansfield & Emans1993; Theintz et al. 1993). It is, however, difficultto separate the effects of physical strain, energyrestriction and genetic predisposition to delayedpuberty.
Besides increasing the likelihood of stress frac-tures, early bone loss may prevent normal peakbone mass from being achieved. Thus, femaleathletes with frequent or longer periods of amenorrhoea may be at high risk of sustainingfractures.
More longitudinal data on fast and gradualbody-weight reduction and cycling in relation tohealth and performance parameters in differentgroups of athletes are clearly needed.
Treatment of eating disorders
Eating-disordered athletes usually are involvedin outpatient treatment and are likely to beincluded in several modes of treatment. Typi-cally, these include individual, group and familytherapy. Nutritional counselling is usually combined with cognitive therapy. For some athletes, pharmacotherapy may be included asan adjunct. The different types of treatmentstrategies have been described elsewhere(Thompson & Trattner-Sherman 1993). Nutritioncounselling is discussed in this chapter.
Since most athletes with eating disorders arefemales, the athlete/patient will be referred to asshe.
The formal treatment of athletes with eatingdisorders should be undertaken only by healthcare professionals. Ideally, these individualsshould also be familiar with the sport environ-ment. Treatment of eating-disordered athletesideally involves a team of a physician, physiolo-gist, nutritionist and, in some cases, a psycholo-gist. The dietitians should be trained andexperienced in working with individuals witheating disorders and understand the demands of
the specific sports. The nutritionist must under-stand how strongly the athlete identifies with thesport as well as what the athlete perceives asdemands from coaches and ‘important’ others.
Once the eating disorder is diagnosed, the goalis to modify the behavioural, cognitive and affec-tive components of the athlete’s eating disorderand to develop a rational approach for achievingself-management of healthy diet, optimal weightand integration of these in the training pro-gramme (Clark 1993).
Nutritional counselling
Individuals with eating disorders do not remem-ber what constitutes a balanced meal or ‘normal’eating. The major roles for the nutritionist seemsto be an evaluator, nutrition educator and coun-sellor, behaviour manager, and active member ofthe treatment team. The suggested nutritionalcounselling programme is the one developed byHsu (1990). This nutritional programme is basedon the assumption that eating disorders are initi-ated and maintained by semistarvation, and thatadequate nutrition knowledge will, in mostinstances, result in healthy eating behaviour,which in turn will eliminate the semistarvationand the binge–purge cycle. The aims of the nutri-tional counselling programme are: (i) to enablethe patient to understand principles of goodnutrition, her nutritional needs, and the relation-ships between dieting and overeating and (ii) toestablish and maintain a pattern of regular eatingthrough meal planning.
Nutritional status and body-weight history
Nutrition counselling can help the athlete over-come an eating disorder by clarifying misconcep-tions and focusing on the role of nutrition inpromoting health and athletic performance. Forathletes who have been suffering for years, readi-ness to listen should be assessed in conjunctionwith a mental health professional. Before nutri-tional counselling can begin, training volume,training intensity, body-weight history andnutritional status should be determined. Body-
eating disorders in athletes 517

weight history of the parents and siblings shouldbe obtained. The eating-disordered athlete’sweight and bodybuild expectations may bebeyond that which is genetically possible. Aftergaining the athlete’s trust, the dietitian shouldconduct body-fat measurements. It is crucial toobtain a measure of body fat in order to establishrealistic goals, which also depend on the athlete’ssport (Eisenman et al. 1990).
Laboratory tests
Blood and urine laboratory tests will provide differential diagnoses for observed symptoms.Such values as haemoglobin, haematocrit,albumin, ferritin, glucose, potassium, sodium,total and high-density lipoprotein cholesterol,and oestrogen (if applicable) should be obtainedinitially and monitored over time. These can be shared with the athlete during treatment toindicate restoration of health (Beumont et al.1993).
Self-esteem of eating-disordered athletes whohave suffered for a longer period tends to bequite low and this may be associated with anexperience of decreased performance level andoften unrealistic expectations. Therefore, oneimportant issue is to determine the athlete’smotivation for continuing competitive sport. Theauthor’s experience is that some athletes even tryto simulate an eating disorder to legalize the endof their career.
Treatment goals and expectations
The primary focuses of the nutrition counsellingare normalizing eating behaviours, body weightand exercise behaviour. Athletes have the samegeneral concerns as non-athletes about increas-ing their weight, but they also have concernsfrom a sport point of view. What they think is anideal competitive weight, one that they believehelps them be successful in their sport, may besignificantly lower than their treatment goalweight. As a result, athletes may have concernsabout their ability to perform in their sport fol-lowing treatment.
518 practical issues
Training and competition
Once an athlete has been found to be in need oftreatment, an important question is whether sheshould be allowed to continue to train andcompete while recovering from the disorder.
To continue competition and training, the following list represents what Thompson andTrattner-Sherman (1993) believe are the minimalcriteria in this regard.1 The athlete must agree to comply with all treat-ment strategies as best she can.2 She must genuinely want to compete.3 She must be closely monitored on an ongoingbasis by the medical and psychological healthcare professionals handling her treatment and bythe sport-related personnel who are workingwith her in her sport.4 The treatment must always take precedenceover sport.5 If any question arises at any time regardingwhether the athlete is meeting or is able to meetthe preceding criteria, competition is not to beconsidered a viable option while the athlete is intreatment (Clark 1993; Thompson & Trattner-Sherman 1993).
Some athletes should be allowed to competewhile in aftercare if not medically or psychologi-cally contraindicated. As mentioned previously,it is extremely important to examine whether theathlete really wants to go back to competitivesport. If so, she should be allowed to do so assoon as she feels ready for it when finishing treat-ment and if she is in good health.
Limited training and competition while in treatment
If the criteria mentioned above for competingcannot be met, or if competition rather thanphysical exertion is a problem, some athleteswho are not competing may still be allowed toengage in limited training. The same criteriaused to assess the safety of competition (i.e. diagnosis, problem severity, type of sport, competitive level and health maintenance) apply(Thompson & Trattner-Sherman 1993).
If the athlete is ready to get over her disorder,allowing her to continue with her sport withminimal risk when she really wants to continuecan enhance the motivation for and the effect oftreatment.
It is the author’s experience that a total suspen-sion is not a good solution. Therefore, if shewants to compete after treatment and no medicalcomplications are present, she should be allowedto train, but usually at a lower volume and at adecreased intensity.
The athlete’s family may be involved in theprocess of getting the athlete into treatment. One factor affecting this involvement is theathlete’s age — the younger the athlete, the morethe family’s involvement is recommended.
Health maintenance standards
If the athlete meets the criteria just mentioned,the ‘bottom-line standards’ regarding healthmaintenance must be imposed to protect theathlete. The treatment staff determine these and individually tailor them according to theathlete’s particular condition. These standardsmay vary between individual athletes or bysport.
According to Thomson and Trattner-Shermann (1993), athletes should maintain at aminimum a weight of no less than 90% of ‘ideal’weight. This is not sport-related, but health-related body weight. The athlete should eat atleast three balanced meals a day, consisting ofenough energy to sustain the pre-establishedweight standard the dietitian has proposed. Athletes who have been amenorrhoeic for 6months or more should undergo a gynaecologi-cal examination to consider hormone replace-ment therapy. In addition, bone-mineral densityshould be assessed and results should be withinthe normal range.
Prevention of eating disorders in athletes
Since the exact causes of eating disorders areunknown, it is difficult to draw up preventive
strategies. Coaches should realize that they canstrongly influence their athletes. Coaches orothers involved with young athletes should notcomment on an individual’s body size, or requireweight loss in young and still-growing athletes.Without offering further guidance, dieting mayresult in unhealthy eating behaviour or eatingdisorders in highly motivated and uninformedathletes (Eisenman et al. 1990). Early interventionis also important, since eating disorders are more difficult to treat the longer they progress.However, most important of all is the preventionof circumstances or factors which could lead toan eating disorder. Therefore, professionalsworking with athletes should be informed aboutthe possible risk factors for the development ofeating disorders, the early signs and symptoms,the medical, psychological and social conse-quences of these disorders, how to approach theproblem if it occurs, and what treatment optionsare available.
Weight-loss recommendation
A change in body composition and weight losscan be achieved safely if the weight goal is realis-tic and based on body composition rather thanweight-for-height standards.1 The weight-loss programme should start wellbefore the season begins. Athletes must consumeregular meals, sufficient energy and nutrients toavoid menstrual irregularities, loss of bone mass,loss of muscle tissue and the experience of com-promised performance.2 The health care personnel should set realisticgoals that address methods of dieting, rate ofweight change, and a reasonable target range ofweight and body fat.3 Change in body composition should be moni-tored on a regular basis to detect any continuedor unwarranted losses or weight fluctuations.4 Measurements of body composition should bedone in private to reduce the stress, anxiety, andembarrassment of public assessment.5 A registered dietitian who knows the demandsof the specific sport should be involved to plan individual nutritionally adequate diets.
eating disorders in athletes 519

Throughout this process, the role of overall goodnutrition practices in optimizing performanceshould be emphasized.6 If the athlete exhibits symptoms of an eatingdisorder, the athlete should be confronted withthe possible problem.7 Coaches should not try to diagnose or treateating disorders, but they should be specificabout their suspicions and talk with the athleteabout the fears or anxieties they may be havingabout food and performance. Medical evaluationshould be encouraged and appropriate supportgiven to the athlete.8 The coach should assist and support theathlete during treatment.
Conclusion
1 The prevalence of eating disorders is higheramong female athletes than non-athletes, but therelationship to performance or training level isunknown. Athletes competing in sports whereleanness or a specific weight are consideredimportant are more prone to eating disordersthan athletes competing in sports where thesefactors are considered less important. Thenumber of male athletes who meet the eating dis-order criteria is unknown and such prevalencestudies are needed.2 It is not known whether eating disorders aremore common among elite athletes than amongless successful athletes. Therefore, it is necessaryto examine anorexia nervosa, bulimia nervosa,and subclinical eating disorders and the range ofbehaviours and attitudes associated with eatingdisturbances in athletes representing differentsport and competitive level to learn how theseclinical and subclinical disorders are related.3 Clinical interviews seem to be superior to self-report methods for determining the pre-valence of eating disorders. However, because of methodological weaknesses in the existingstudies, including deficient description of thepopulations investigated and procedures fordata collection, the best instruments or interviewmethods are not known. Therefore, there is aneed to validate self-report and interview guides
520 practical issues
with athletes and identify the conditions underwhich self-reporting of eating disturbances ismost likely to be accurate.4 Interesting suggestions about possible sport-specific risk factors for the development of eatingdisorders in athletes exist, but large-scale longi-tudinal studies are needed to learn more aboutrisk factors and the aetiology of eating disordersin athletes at different competitive levels andwithin different sports.5 Once the eating disorder is diagnosed, the goal is to modify the behavioural, cognitive, and affective components of the athlete’s eatingdisorder. Treatment of athletes ideally involves a team of a physician, physiologist, nutritionistand, in some cases, a psychologist. The dietitiansshould be trained and experienced in workingwith individuals with eating disorders andunderstand the demands of different sports.6 More knowledge about the short- and long-term effects of weight cycling and eating disor-ders upon the health and performance of athletesis needed.
References
American Psychiatric Association (1987) Diagnosticand Statistical Manual of Mental Disorders, 3rd edn.American Psychiatric Association, Washington, DC.
American Psychiatric Association (1994) Diagnosticand Statistical Manual of Mental Disorders, 4th edn.American Psychiatric Association, Washington, DC.
Andersen, A.E. (1990) Diagnosis and treatment ofmales with eating disorders. In Males with Eating Disorders (ed. A.E. Andersen), pp. 133–162.Brunner/Mazel, New York.
Bassoe, H.H. (1990) Anorexia/Bulimia nervosa: thedevelopment of anorexia nervosa and of mentalsymptoms — treatment and the outcome of thedisease. Acta Psychiatrica Scandinavica 82, 7–13.
Beumont, P.J.V., Russell, J.D. & Touyz, S.W. (1993)Treatment of anorexia nervosa. Lancet 26, 1635–1640.
Blouin, A.G. & Goldfield, G.S. (1995) Body image andsteroid use in male body builders. InternationalJournal of Eating Disorders 2, 159–165.
Brownell, K.D. & Rodin, J. (1992) Prevalence of eatingdisorders in athletes. In Eating, Body Weight and Per-formance in Athletes: Disorders of Modern Society (ed.K.D. Brownell, J. Rodin & J.H. Wilmore), pp. 128–143.Lea and Febiger, Philadelphia.
Brownell, K.D., Steen, S.N. & Wilmore, J.H. (1987)Weight regulation practices in athletes: analysis ofmetabolic and health effects. Medicine and Science inSports and Exercise 6, 546–560.
Burckes-Miller, M.E. & Black, D.R. (1988) Male andfemale college athletes: prevalence of anorexianervosa and bulimia nervosa. Athletic Training 2,137–140.
Clark, N. (1993) How to help the athlete with bulimia:practical tips and case study. International Journal ofSport Nutrition 3, 450–460.
Dummer, G.M., Rosen, L.W. & Heusner, W.W. (1987)Pathogenic weight-control behaviors of young com-petitive swimmers. Physician and Sportsmedicine 5,75–86.
Eisenman, P.A., Johnson, S.C. & Benson, J.E. (1990)Coaches Guide to Nutrition and Weight Control, 2ndedn. Leisure Press, Champaign, IL.
Epling, W.F. & Pierce, W.D. (1988) Activity basedanorexia nervosa. International Journal of Eating Disor-ders 7, 475–485.
Epling, W.F., Pierce, W.D. & Stefan, L. (1983) A theory ofactivity based anorexia. International Journal of EatingDisorders 3, 27–46.
Fogelholm, M. (1994) Effects of bodyweight reductionon sports performance. Sports Medicine 4, 249–267.
Fogelholm, G.M., Koskinen, R. & Laakso, J. (1993)Gradual and rapid weight loss: effects on nutritionand performance in male athletes. Medicine andScience in Sports and Exercise 25, 371–377.
Gadpalle, W.J., Sandborn, C.F. & Wagner, W.W. (1987)Athletic amenorrhea, major affective disorders andeating disorders. American Journal of Psychiatry 144,939–943.
Garner, M.D., Garfinkel, P.E., Rockert, W. & Olmsted,M.P. (1987) A prospective study of eating distur-bances in the ballet. Psychotherapy and Psychosomatics48, 170–175.
Hamilton, L.H., Brocks-Gunn, J. & Warren, M.P. (1985)Sociocultural influences on eating disorders in pro-fessional female ballet dancers. International Journalof Eating Disorders 4, 465–477.
Hamilton, L.H., Brocks-Gunn, J., Warren, M.P. &Hamilton, W.G. (1988) The role of selectivity in thepathogenesis of eating problems in ballet dancers.Medicine and Science in Sports and Exercise 20, 560–565.
Holderness, C.C., Brooks-Gunn, J. & Warren, M.P.(1994) Eating disorders and substance use: a dancingvs. nondancing population. Medicine and Science inSports and Exercise 3, 297–302.
Hsu, L.K.G. (1990) Eating Disorders. Guilford Press,New York.
Ingjer, F. & Sundgot-Borgen, J. (1991) Influence of bodyweight reduction on maximal oxygen uptake infemale elite athletes. Scandinavian Journal of Medicineand Science in Sports 1, 141–146.
Johnson, C. & Connor, S.M. (1987) The Etiology andTreatment of Bulimia Nervosa. Basic Books, New York.
Katz, J.L. (1985) Some reflections on the nature of the eating disorders. International Journal of EatingDisorders 4, 617–626.
Klinzing, J.E. & Karpowicz, W. (1986) The effect ofrapid weight loss and rehydration on a wrestlingperformance test. Journal of Sports Medicine and Physi-cal Fitness 26, 149–156.
Mansfield, M.J. & Emans, S.J. (1993) Growth in femalegymnasts: should training decrease during puberty?Pediatrics 122, 237–240.
Mitchell, J.E. (1990) Bulimia Nervosa. University of Minnesota Press, Minneapolis.
O’Connor, P.J., Lewis, R.D. & Kirchner, E.M. (1996)Eating disorder symptoms in female college gym-nasts. Medicine and Science in Sports Exercise 4,550–555.
Rosen, L.W. & Hough, D.O. (1988) Pathogenic weight-control behaviors of female college gymnasts. Physi-cian and Sportsmedicine 9, 141–144.
Rosen, L.W., McKeag, D.B. & Hough, D.O. (1986) Path-ogenic weight-control behaviors in female athletes.Physician and Sportsmedicine 14, 79–86.
Rucinski, A. (1989) Relationship of body image anddietary intake of competitive ice skaters. Journal of theAmerican Dietetic Association 89, 98–100.
Sundgot-Borgen, J. (1993) Prevalence of eating disor-ders in female elite athletes. International Journal ofSport Nutrition 3, 29–40.
Sundgot-Borgen, J. (1994a) Risk and trigger factors forthe development of eating disorders in female eliteathletes. Medicine and Science in Sports and Exercise 4,414–419.
Sundgot-Borgen, J. (1994b) Eating disorders in femaleathletes. Sports Medicine 3, 176–188.
Sundgot-Borgen, J. & Corbin, C.B. (1987) Eating dis-orders among female athletes. Physician and Sports-medicine 15, 89–95.
Sundgot-Borgen, J. & Larsen, S. (1993a) Nutrient intakeand eating behavior of female elite athletes sufferingfrom anorexia nervosa, anorexia athletica andbulimia nervosa. International Journal of Sport Nutrition 3, 431–442.
Sundgot-Borgen, J. & Larsen, S. (1993b) Pathogenicweight-control methods and self-reported eating disorders in female elite athletes and controls.Scandinavian Journal of Medicine and Science in Sports3, 150–155.
Sykora, C., Grilo, C.M., Wilfly, D.E. & Brownell, K.D.(1993) Eating, weight and dieting disturbances inmale and female lightweight and heavyweightrowers. International Journal of Eating Disorders 2,203–211.
Szmuckler, G.I., Eisler, I., Gillies, C. & Hayward, M.E.(1985) The implications of anorexia nervosa in a
eating disorders in athletes 521
ballet school. Journal of Psychiatric Research 19,177–181.
Theintz, M.J., Howald, H. & Weiss, U. (1993) Evidenceof a reduction of growth potential in adolescentfemale gymnasts. Journal of Pediatrics 122, 306–313.
Thompson, R.A. & Trattner-Sherman, R. (1993) HelpingAthletes with Eating Disorders. Human Kinetics,Champaign, IL.
Torstveit, G., Rolland, C.G. & Sundgot-Borgen, J. (1998)Pathogenic weight control methods and self-reported eating disorders among elite athletes. Medicine and Science in Sports and Exercise 5 (Suppl.),181.
522 practical issues
Warren, B.J., Stanton, A.L. & Blessing, D.L. (1990) Dis-ordered eating patterns in competitive female athletes. International Journal of Eating Disorders 5,565–569.
Wilmore, J.H. (1991) Eating and weight disorders infemale athletes. International Journal of Sport Nutrition1, 104–117.
Wilson, T. & Eldredge, K.L. (1992) Pathology anddevelopment of eating disorders: implications forathletes. In Eating, Body Weight and Performance inAthletes: Disorders of Modern Society (ed. K.D.Brownell, J. Rodin & J.H. Wilmore), pp. 115–127. Leaand Febiger, Philadelphia.

Introduction
In the never-ending quest to improve perfor-mance, athletes and coaches are quick to embracealmost any notion that promises quick success.New ideas involving sports equipment, train-ing techniques and nutritional interventions areoften greeted enthusiastically, put into practicebefore ample testing has occurred, and toutedanecdotally as the latest and greatest idea to hitthe sporting world. While most scientists wouldadvise a more cautious approach to integratingnew ideas into an athlete’s training regimen, thefact of the matter is that coaches and athleteshave always been and will always be the initialarbiters of proposed innovations. More oftenthan not, in the time required for adequate scientific evaluation, the idea has already beensuperceded by the next ‘improvement’. This isparticularly so in the area of sports nutrition,where there has historically been a rapid andseemingly endless series of product introduc-tions, some of which make remarkable claims forsuperior performance.
Confronted with a constantly changing arrayof sports nutrition products, the claims for whichcan appear to bear convincing scientific support,it is not surprising that athletes and coaches havedifficulty determining which claims are valid.Considering that it often requires sports scien-tists considerable time in the laboratory to sepa-rate fact from fiction when it comes to claims forsports nutrition products, it is entirely under-standable that coaches and athletes find it impos-
sible to do the same. This confusion has resultedfrom the plethora of commercial products tar-geted at physically active people, from the in-ability of government agencies to adequatelyregulate the claims made for such products, fromthe rapid turnover of sports nutrition products in the marketplace, and from the confusion re-sulting from the misuse of scientific claims.Although there is little doubt that some sportsnutrition products provide demonstrable bene-fits when properly used, the claims for otherproducts and nutritional interventions are oftendubious, ill-founded, unproven, or abysmallydeficient of scientific merit.
For the purpose of this chapter, sports nutri-tion products and sports nutrition supplementswill be considered to be synonymous, as virtu-ally all sports nutrition supplements are avail-able as commercial products. Whereas it isrelatively easy to identify a sports nutritionproduct by virtue of the advertising claims madefor it, it is more difficult to gain agreement onwhat constitutes a sports nutrition supplement.
What is a sports nutritionsupplement?
There is no consensus opinion on the definitionof a sports nutrition supplement. In the strictestsense, sport nutritional supplements might bedefined as products that include only thosemacro- or micronutrients included in dietaryguidelines such as the US National ResearchCouncil’s recommended dietary allowances
Chapter 40
Sports Nutrition Products
ROBERT MURRAY
523

(National Research Council 1989). In otherwords, the composition of a sports nutrition sup-plement would be limited to water, carbohy-drate, fat, protein and amino acids, vitamins andminerals. This definition would exclude a widevariety of nutritional supplements already on themarket (e.g. creatine, carnitine, vanadyl sul-phate, lipoic acid, etc.). In this case, such a strictdefinition is both unwieldly and unrealistic.
In the broadest sense, sports nutrition supple-ments could include any food, beverage, tablet,gel, concentrate, powder or potion purported tobe of some value to physically active people.Both the value and the limitation of adopting abroad definition of what might constitute a sportnutrition supplement is that the definition is notexclusionary. In this context, everything fromaspirin to zinc could be considered a sport nutrition supplement. In addition, one is left towrestle with ticklish questions such as whetherthe effect of the ingested substance is nutritional,physiological or pharmacological.
In the United States, the Dietary SupplementHealth Education Act of 1994 established a defi-nition for dietary supplements that included thefollowing wording: ‘dietary supplement means aproduct . . . intended to supplement the diet that. . . contains one or more of the following dietaryingredients: a vitamin; a mineral; an herb orother botanical; an amino acid . . . a concentrate,metabolite, constituent, extract’. In the 1994 Act,it is estimated that 4000 such products are cur-rently marketed in the US. Although this de-scription includes many products positioned assports nutrition supplements, it excludes foodsand beverages formulated for use by physicallyactive people.
For the purpose of this chapter, it is necessaryto accept a broad definition, complete with itsattendant limitations, to allow for discussion ofthe wide range of products that are marketed foruse by physically active people. A sport nutritionproduct/supplement is any food, beverage, tablet, gel,concentrate, powder, capsule, gelcap, geltab or liquiddroplet purported to affect body structure, function ornutritional status in such a way as to be of value to physically active people. To narrow the scope of
524 practical issues
discussion, it is necessary to exclude alcohol,analgesics, caffeine, amphetamines, anabolicsteroids, hormones, b-blockers, diuretics andother pharmacological substances that may affectstructure and function but are not considerednutrients.
Objectives of nutritionalsupplementation
Abiding by the definition above, an efficacioussports nutrition product is one that provides astructural, functional and/or nutritional benefitthat is documented by scientific research. Forexample, an iron-deficient female runner whosupplements her diet with ferrous sulphatetablets realizes a functional and nutritionalbenefit that was not achieved by her usual diet. Abodybuilder who is able to gain lean body massby ingesting a product that provides energy andprotein enjoys a structural benefit afforded bythat supplement. The cyclist who ingests a high-carbohydrate beverage to help assure adequatecarbohydrate intake benefits from both struc-tural (restoration of muscle and liver glycogenstores) and functional (rapid recovery, increasedendurance) effects.
From a scientific standpoint, it is possible toexperimentally evaluate the ability of a productto affect human structure or function. In fact, themanufacturers of some sports nutrition productsrequire that rigorous scientific and legal stan-dards be met before a product claim can be made.Unfortunately, many manufacturers do not.
Evaluating product claims
One only has to page through an issue of anyhealth- and fitness-related magazine to finddozens of advertisements and articles on nutri-tional supplements. For example, the March 1997US edition of Muscle and Fitness (Weider Publica-tions, Inc.), a popular health and fitness maga-zine with international distribution, containsnine separate articles and nearly 50 advertise-ments on sports nutrition supplements. Productclaims are many and varied, including ‘helps

your body use oxygen more efficiently’, ‘helpsculpt a leaner, firmer body’, ‘contains powerfulcell volumizing and recovery nutrients’, ‘themost effective antioxidant nutrients’, ‘increasesmuscle protein synthesis while increasing cellhydration’, ‘promotes protein synthesis andglycogen storage, supports immune functionand cell volumizing, and limits catabolism bycortisol for optimal workout recovery’, ‘increaselevels of adenosine triphosphate’, ‘more lean-gained mass in less time’, ‘prevents muscle lossduring training and dieting’, ‘improve strengthand stamina during workouts’, ‘increases leanmuscle mass and promotes fat loss’, and‘increase peak power output, mean body mass,and muscular performance’. Each of theseproduct claims involves a structural or func-tional benefit that is directly testable through sci-entific experimentation. Although a few of theseadvertising claims were accompanied by a scien-tific reference, the vast majority were not. Thisobservation is similar to that of Grunewald andBailey (1993), who evaluated the advertisingclaims for 624 products targeted at bodybuilders.The products were associated with over 800 performance-related claims, the vast majority ofwhich were unsubstantiated by scientificresearch.
If the stated objective of a sports nutrition sup-plement is to provide a structural or functionalbenefit, validation of the claim can be accom-plished in two ways. The highest level of scien-tific validation for the efficacy of a nutritionsupplement is generated by research publishedin peer-reviewed scientific journals. In thiscontext, the strongest such support is developedwhen numerous laboratories report similar find-ings of product effectiveness. A case in point isthe scientific consensus that has been developedfor carbohydrate–electrolyte beverages on thebasis of more than 100 scientific studies pub-lished in peer-reviewed journals. The otheracceptable example of scientific credibility iswhen the efficacy of a nutrition supplement canbe established by face validity — that is, when theclaims made for the product are widely recog-nized as being both truthful and scientifically
valid. For example, if a product containing largeamounts of carbohydrate per serving is claimedto provide a supplemental source of dietary carbohydrate that helps in glycogen restoration,the product’s efficacy in that regard enjoys thebenefit of face validity. The product claim isaccepted as true on its face.
Butterfield (1996) and other authors (Burke1992; Rangachari & Mierson 1995; Sherman &Lamb 1995; Coleman & Nelson Steen 1996) havesuggested guidelines for evaluating researchresults and product claims. Sherman and Lamb(1995) identified 10 essential characteristics thatshould be present in an acceptable experimentaldesign. These include:
1 use of an appropriate subject population;2 adequate control of diet and exercise;3 use of a double-blind design with placebo;4 random assignment of subjects to treatment
groups;5 repeated measures or cross-over designs to
reduce the impact of individual differences;6 inclusion of appropriate familiarization
trials;7 adequate control of possible mitigating
factors such as environmental conditions andhydration status;
8 measurement of variables related to thepotential mechanism of effect;
9 an acceptable number of subjects to assureample statistical power; and10 proper statistical analyses.
A critical evaluation of research data requires a trained and experienced eye. Even the mostsceptical layperson is unprepared to undertake athorough review of product claims and relatedliterature. As a result, it is the responsibility of thetrained sports health professional to be proactivein providing the public with clear and accurateguidance regarding the efficacy of products thatclaim to provide structural or functional benefits.
The advertisements for some sports nutritionproducts rely solely upon claims of nutrientcontent rather than structural or functionalclaims. The product’s label and advertisingmerely make a statement regarding the product’snutritional content. Examples of such claims
sports nutrition products 525

include ‘contains calcium’, ‘delivers 2200 low-fatcalories per serving’, ‘contains di- and tripep-tides’, and ‘provides nine important vitaminsand minerals’. Provided that these claimsconform to the product’s actual content, they arenothing more than statements of fact.
Ethical considerations regardingsports nutrition products
The International Olympic Committee’s list ofbanned drugs provides a relatively clear-cut, butby no means uncontroversial, way of identifyinga substance ‘which because of its nature, dosage,or application is able to boost the athlete’s perfor-mance in competition in an artificial and unfairmanner’ (International Olympic Committee1995). The IOC regulations also state that ‘dopingis the administration of or the use by a competingathlete of any substance foreign to the body or ofany physiological substance taken in abnormalquantity or by an abnormal route of entry intothe body, with the intention of increasing in anartificial and unfair manner his performance incompetition’. The wording of this sentence maybe instructive in the evaluation of the ethical con-siderations surrounding the use of some nutri-tional supplements. However, as with the IOC’srestrictions against doping, a clear understand-ing of the ethical issues regarding nutritionalsupplementation can be hard to come by. Forexample, the ingestion of a glucose–electrolytesolution during exercise involves a normal routeof administration of a normal quantity of nutri-ents and consequently presents little in the wayof ethical concerns. On the other hand, if a cyclistwere to receive the same nutrients intravenouslywhile riding in competition, such administrationwould surely be considered abnormal and ethically questionable. Yet, it is quite common for athletes to receive intravenous glucose–electrolyte solutions following training and com-petition under the guise of medical necessitywhen the actual intent is to hasten recovery.
In discussing the ethical considerations ofusing nutritional ergogenic aids, Williams (1994)noted that some nutrients given in high doses
526 practical issues
can exert pharmacological effects, responses thatwould appear to be at odds with the language ofthe IOC doping regulations. One such example isniacin (vitamin B3), high doses of which are com-monly prescribed to reduce serum cholesterol(DiPalma & Thayer 1991), an effect that is clearlypharmacological. If similarly large doses of avitamin improved performance, would this beconsidered a pharmacological or nutritionaleffect? Similarly, as also noted by Williams(1994), if research confirms the ergogenic effect ofcreatine loading, what are the attendant ethicalconsiderations? Does the fact that the body nor-mally synthesizes creatine preclude it from beingconsidered a nutrient? Are the effects of creatinefeeding pharmacological or physiological, ratherthan nutritional? Does it matter? These samequestions can surely be applied to any nutrientingested in amounts far exceeding the estab-lished values of normal nutritional requirements.Regardless of the murky nature of some issuesinvolving sports nutrition supplements, thereality is that thousands of such products aremarketed around the world.
Categories of sports nutrition products
A variety of authors and organizations haveattempted to categorize sports nutrition prod-ucts to establish a framework by which the efficacy of the products can be more easily evaluated. Three such attempts at categorizationare briefly described below. As with all systemsof categorization, each has its own merits andlimitations.
Burke and Read (1993) suggested a simpletwo-category approach that classifies sportsnutrition supplements as either dietary supple-ments or nutritional ergogenic aids. According tothe authors, dietary supplements provide a con-venient and practical means of consuming nutri-ents to meet the special dietary needs of athletes.In this regard, the supplement itself does notdirectly improve performance, but simply meetsa dietary need. Examples include sports drinks,high-carbohydrate supplements, liquid meal

supplements, and vitamin and mineral supple-ments. For example, ferrous sulphate tablets consumed by an iron-deficient female athlete or a concentrated carbohydrate beverage ingestedfollowing training would be considered dietarysupplements.
Nutritional ergogenic aids encompass thoseproducts whose ingestion is purported todirectly and immediately provoke an improve-ment in performance. Burke (1992) suggests thatthese supplements are better labelled as ‘pro-posed ergogenic aids’ because there is scant sci-entific support for their effectiveness. Bee pollen,ginseng, vanadium, inosine, molybdenum, car-nitine and countless other pills, potions andpowders appear to fall neatly into this category.Upon further examination, however, the distinc-tion between dietary supplements and nutri-tional ergogenic aids can become blurred. Whencarbohydrate is ingested during exercise, is itmeeting a special dietary need or provoking animmediate improvement in performance? Somewould argue that it does both.
Butterfield (1996) suggested that sports nutri-tion products could be categorized into fourareas:1 Metabolic fuels such as carbohydrate, fat andmetabolic intermediates including pyruvate,lactate and components of the Krebs cycle.2 Limited cellular components such as creatine,carnitine, vitamins and free amino acids.3 Substances with purported anabolic effectssuch as energy, protein, chromium and vanadium.4 Nutrients which enhance recovery, includingfluid, carbohydrate and electrolytes.
This categorization system allows for pigeon-holing supplements on the basis of functionality,although some nutrients serve multiple func-tions. For example, carbohydrate could fitequally well in all four categories: as a metabolicfuel, as a limited cellular component (during thelatter stages of prolonged exercise), as a nutrientthat provokes anabolic effects (via insulin) and asan aid to recovery.
Kanter and Williams (1995) suggested that thepurpose of most nutritional ergogenic aids is to
enhance energy production during exercise byeither (i) providing an additional energy source(as in the case of carbohydrate and fat) or (ii) bybenefiting the metabolic processes that produceenergy (a catch-all category for protein, aminoacids, vitamins, minerals and sundry other sub-stances touted to improve performance). Thistwo-tiered approach to categorizing sports nutri-tion supplements served the authors well in theirreview of antioxidants, carnitine and choline(Kanter & Williams 1995), but falls short of pro-viding a niche for supplements with a proposedeffect on processes other than energy metabo-lism (e.g. amino acids, chromium, choline, g-oryzanol).
In the not too distant future, it is likely thatgovernment agencies will attempt to establishregulatory control over the nutritional supple-ment industry, including what might be broadlyclassified as sports foods. In fact, such regula-tions have either been proposed or enacted in theUnited States, Australia, Japan and within theEuropean Community. The likely result of eachattempt will be the creation of a less than perfectway to define and categorize a group of foods,beverages and supplements that by their verydiversity defy a simple manner of categorization.
None the less, faced with the challenge ofaddressing the role of sports nutrition supple-ments, the following section provides an admit-tedly arbitrary attempt at organizing the widearray of sports nutrition supplements into cate-gories that allow for some degree of generaliza-tion regarding their proven or purported effects.
Role of sports nutrition products
The reader wishing a comprehensive review ofthe science underlying sports nutrition productsis referred to the other chapters in this book andto the many review articles and books previouslywritten on this topic.
Fluid replacement beverages (i.e. sports drinks)
Sports drinks are the most comprehensively
sports nutrition products 527

researched of all sports nutrition products. For-mulated to rapidly replace fluid lost as sweatduring physical activity, sports drinks com-monly contain a mixture of mono-, di- andoligosaccharides (as maltodextrins), minerals(most often sodium, potassium and chloride),along with assorted flavourings. The carbohy-drate concentration of most commercially avail-able sports drinks ranges from 5% to 8%carbohydrate (i.e. 50–80g carbohydrate per litre).The physiological effectiveness of sports drinkingestion has been well documented (Lamb &Brodowicz 1986; Murray 1987; Maughan 1991;Maughan et al. 1995) and the plethora of relateddata provided part of the foundation for the posi-tion stand on exercise and fluid replacementpublished by the American College of SportsMedicine (ACSM 1996). Chapters 15–19 of this text provide an excellent review of issuesregarding fluid and electrolyte homeostasis andChapter 8 addresses the topic of carbohydratefeeding during exercise.
Carbohydrate-rich beverages
The value of ingesting a diet high in carbohy-drate content has been well established, asdetailed in Chapters 5–8. Any food or beveragehigh in carbohydrate content could conceivablybe termed a carbohydrate-loading supplement,although this designation is usually applied tocommercial products, most often beverages.Whether purchased in liquid form or recon-stituted from a powder mix, these beveragesshould contain a carbohydrate concentration inexcess of regular soft drinks (10–14% carbohy-drate) and common fruit juices (12–16% carbohy-drate). It is accepted at face validity that theingestion of adequate amounts of such productswill help athletes meet their goals for dietary carbohydrate intake, the result of which will beeffective restoration of glycogen stores in liverand muscle.
Complete-nutrition/energy beverages
These beverages, usually in the form of milk-
528 practical issues
shake type drinks, contain varying combinationsof carbohydrate, protein, fat, vitamins and min-erals. Some of these products contain an array ofother nutrients and metabolites. It is accepted atface validity that the ingestion of these supple-ments will provide the energy and nutrientsincluded in them, the inference being that intakeof the nutrients will help athletes meet their dailynutritional needs. Additional claims of productbenefits to structure or function (e.g. ‘adds leanbody mass’, ‘boosts fat metabolism by 43%’)would require direct substantiation by accept-able scientific research.
Energy bars
This category of supplements includes solidfoods in bar form. Most bars provide 140–250kcal (588–1050kJ) of energy and contain varyingproportions of carbohydrate, protein, fat andmicronutrients. Most of these products are asso-ciated with statements of nutritional content (e.g.‘contains ginseng’), although a few make struc-ture or function claims (e.g. ‘burn more bodyfat’). In the latter case, the manufacturers must be held accountable for providing acceptable scientific support.
Carbohydrate gels
These products are often small packets of carbohydrate syrup (20–30 g) positioned for useduring prolonged exercise as an alternativemeans of carbohydrate intake. The claims madefor these products are most often statements ofnutritional content. Most products advise theuser to ingest the gel with ample amounts offluid to help assure rapid gastric emptying.
Vitamin supplements
Vitamins are sold as single nutrients (e.g. vitaminC), in combination with other vitamins (e.g. Bcomplex vitamins), or as vitamin–mineral tabletsthat contain assorted nutrients. Some manufac-turers employ a use-specific positioning for theirproducts that imply particular benefits (e.g. ‘an
antistress formula’). In most cases, however, theclaims for vitamin products are limited to state-ments of nutrient content (e.g. ‘provides 100% ofthe RDA for seven important vitamins’).
The benefits of vitamin supplementation incases of borderline or frank vitamin deficiencyare well accepted (Clarkson 1991). Under thesecircumstances, health status and performanceare improved when the deficiency is corrected.Whether ingestion of vitamins in amounts farexceeding the recommended dietary allowancesconfer benefits to physically active peopleremains a topic of much discussion and interest(see Chapters 20–22). Future research willundoubtedly determine if vitamin supplementa-tion provides specific benefits to human struc-ture and function, or serves merely as a way forphysically active people to assure adequatemicronutrient intake. Additional information onvitamin supplementation can be found in Chap-ters 20–22 of this text and in review articles byArmstrong and Maresh (1996), Clarkson (1991),Haymes (1991), Rosenbloom et al. (1992), Sobaland Marquart (1994) and Williams (1984).
Mineral supplements
As with vitamins, minerals are also sold singly(e.g. chromium) or in combination (multimineraltablets). Chapters 23–25 provide a detailedreview of mineral requirements in physicallyactive people, as do review articles by Armstrongand Maresh (1996), Clarkson (1991) and Haymes(1991). Acute or chronic deficiencies of mineralssuch as sodium, calcium and iron can occur as aresult of physical activity and inadequate dietaryintake. Advertising claims for the benefits ofminerals such as boron, chromium, molybde-num, selenium and zinc have not been borne outby scientific research (Clarkson 1991; Haymes1991). Armstrong and Maresh (1996) identified anumber of flaws in the experimental designs ofsupplementation studies that can render the datasuspect or useless. Among these are the inabilityto control for mineral status of the subjects, theabsence of placebo groups, and the choice ofinappropriate assessment criteria. Some of the
studies that report positive structural or func-tional effects of mineral supplementation sufferfrom one or more of the design flaws noted byArmstrong and Maresh (1996).
Protein and amino-acid supplements
The advertising for protein and amino-acid supplements is often based upon the notion thatphysically active people, particularly body-builders and power lifters, require large amountsof dietary protein. Claims for these products toutbenefits such as, ‘promotes anticatabolic activ-ity’, ‘pack on some solid, rock-hard mass’, and‘increases lean muscle mass and promotes fatloss’. There is little in the way of scientific evi-dence to indicate that ingesting protein supple-ments will fulfil these promises. As indicated inChapters 9 and 10, although physical activityincreases the dietary requirement for protein, theincrease is easily met by consuming a normaldiet. In brief, protein and amino-acid supple-ments are expensive substitutes for protein-richfoods that are readily available in the diet(Lemon 1995).
In recent years, attention has been paid to theeffects of ingesting individual amino acids suchas glycine and glutamine or combinations ofamino acids such as the branched-chain aminoacids (leucine, isoleucine and valine) for pur-poses ranging from stimulating growth hormonerelease to altering serotonin production in thebrain. Although future research may generateevidence of benefits associated with the inges-tion of amino acids, the current data are not com-pelling. In addition, the ingestion of amino-acidsupplements is not without risk (Butterfield1991; Beltz & Doering 1993).
Putative promoters of muscle growth
A number of other substances have been adver-tised as being able to promote the growth of muscle tissue. Dibencozide, g-oryzanol,yohimbe, phosphatidylserine and vanadyl sul-phate are among the ingredients that can befound in current products promoted as having
sports nutrition products 529

growth-enhancing properties. Additional sub-stances are reviewed in Chapter 26. Again, thereis an absence of scientific research confirmingsuch effects (Rosenbloom et al. 1992; Grunewald& Bailey 1993; Coleman & Nelson-Steen 1996).
Putative enhancers of energy metabolism
In theory, performance should be enhanced if a product ingredient increased the ability ofmuscle to resynthesize adenosine triphosphate.The most obvious candidates for such a rolewould be metabolic intermediates such aslactate, pyruvate, citrate and other tricarboxylicacid intermediates, enzyme-system componentssuch as lipoic acid, alternative fuel sources suchas medium-chain triglycerides, mediators in fueloxidation such as carnitine, and components ofthe high-energy phosphate pool such as inosineand creatine. Of these, creatine ingestion appearsto have the most promise as an ergogenic aid(Greenhaff 1995). As indicated in Chapter 27, cre-atine ingestion is associated with an increase in muscle creatine content, a response that maybe associated with increased performance invery high intensity, short-duration activities.However, as promising as creatine appears to beas an ergogenic aid, and notwithstanding thenumerous products containing creatine as aningredient, it may still be premature to draw adefinitive conclusion regarding its efficacy.While some laboratories have reported im-proved sprint performance associated with crea-tine feeding (e.g. Casey et al. 1996), others havefailed to find an effect (e.g. Barnett et al. 1996).Although the disparate results may merely be anartefact of differences in experimental design,feeding protocols, subject selection, and choice ofperformance critieria, more research is needed toconfirm if this is indeed the case.
Conclusion
Efficacious sports nutrition products will continue to play an important role in helping athletes achieve and maintain a nutritional status that positively influences body structure
530 practical issues
and function. The benefits of remaining wellhydrated during exercise, the advantages ofingesting a diet high in carbohydrate content, the importance of sodium in stimulating rapidand complete rehydration, and the indispensiblenature of consuming adequate energy are exam-ples of well-documented nutritional applicationsaround which many sports nutrition productsare based. There are, however, many productsthat are associated with claims that lack scien-tific substantiation. Sports health professionalsinvolved in public-education programmes havean obligation to help provide consumers withup-to-date and accurate information regardingthe veracity of product claims.
References
American College of Sports Medicine (1996) positionstand on exercise and fluid replacement. Medicineand Science in Sports and Exercise 28, i–vii.
Armstrong, L. & Maresh, C. (1996) Vitamin and mineralsupplements as nutritional aids to exercise per-formance and health. Nutrition Reviews 54, S149–S158.
Barnett, C., Hinds, M. & Jenkins, D. (1996) Effects oforal creatine supplementation on multiple sprintcycle performance. Australian Journal of Science andMedicine in Sport 28, 35–39.
Beltz, S. & Doering, P. (1993) Efficacy of nutritional sup-plements used by athletes. Clinical Pharmacology 12,900–908.
Burke, L. (1992) The Complete Guide to Food for SportsPerformance. Allen and Unwin, Sydney.
Burke, L. & Read, R. (1993) Dietary supplements insport. Sports Medicine 15, 43–65.
Butterfield, G. (1991) Amino acids and high proteindiets. In Perspectives in Exercise Science and SportsMedicine. Vol. 4. Ergogenics: Enhancement of Perfor-mance in Exercise and Sport (ed. D. Lamb & M.Williams), pp. 87–122. Brown and Benchmark, Indi-anapolis, IN.
Butterfield, G. (1996) Ergogenic aids: evaluating sportnutrition products. International Journal of SportsNutrition 6, 191–197.
Casey, A., Constantin-Teodosiu, C., Howell, S.,Hultman, E. & Greenhaff, P. (1996) Creatine ingestionfavorably affects performance and muscle metabo-lism during maximal exercise in humans. AmericanJournal of Physiology 271, E31–E37.
Clarkson, P. (1991) Vitamins and trace minerals. In Per-spectives in Exercise Science and Sports Medicine. Vol. 4.

Ergogenics: Enhancement of Performance in Exercise andSport (ed. D. Lamb & M. Williams), pp. 123–182.Brown and Benchmark, Indianapolis, IN.
Coleman, E. & Nelson Steen, S. (1996) The UltimateSports Nutrition Handbook. Bull Publishing, Palo Alto,CA.
DiPalma, J. & Thayer, S. (1991) Use of niacin as a drug.Annual Review of Nutrition 11, 169–187.
Greenhaff, P. (1995) Creatine and its application as anergogenic aid. International Journal of Sports Nutrition5 (Suppl.), S100–S110.
Grunewald, K. & Bailey, R. (1993) Commercially mar-keted supplements for body building athletes. SportsMedicine 15, 90–103.
Haymes, E. (1991) Vitamin and mineral supplement-ation to athletes. International Journal of Sports Nutrition 1, 146–169.
International Olympic Committee (1995) Medical Code.International Olympic Committee, Lausanne.
Kanter, M. & Williams, M. (1995) Antioxidants, carni-tine, choline as putative ergogenic aids. InternationalJournal of Sports Nutrition 5 (Suppl.), S120–S131.
Lamb, D. & Brodowicz, G. (1986) Optimal use of fluidsof varying formulations to minimise exercise-induced disturbances in homeostasis. Sports Medi-cine 3, 247–274.
Lemon, P. (1995) Do athletes need more dietary proteinand amino acids? International Journal of Sports Nutri-tion 5 (Suppl.), S39–S61.
Maughan, R. (1991) Carbohydrate–electrolyte solu-tions during prolonged exercise. In Perspectives inExercise Science and Sports Medicine. Vol. 4. Ergogenics:
Enhancement of Performance in Exercise and Sport (ed.D. Lamb & M. Williams), pp. 35–86. Brown andBenchmark, Indianapolis, IN.
Maughan, R., Shirreffs, S., Galloway, D. & Leiper, J.(1995) Dehydration and fluid replacement in sportand exercise. Sports, Exercise, and Injury 1, 148–153.
Murray, R. (1987) The effects of consuming carbohy-drate–electrolyte beverages on gastric emptying andfluid absorption during and following exercise.Sports Medicine 4, 322–351.
National Research Council (1989) Recommended DietaryAllowances, 10th edn. National Academy Press,Washington, DC.
Rangachari, P. & Mierson, S. (1995) A checklist to helpstudents analyze published articles in basic medicalsciences. American Journal of Physiology 268, 13.
Rosenbloom, C., Millard-Stafford, M. & Lathrop, J.(1992) Contemporary ergogenic aids used bystrength/power athletes. Journal of the AmericanDietetic Association 92, 1264–1266.
Sherman, W. & Lamb, D. (1995) Introduction. Interna-tional Journal of Sports Nutrition 5 (Suppl.), Siii–Siv.
Sobal, J. & Marquart, L. (1994) Vitamin/mineral sup-plement use among athletes: a review of the litera-ture. International Journal of Sports Nutrition 4,320–334.
Williams, M. (1984) Vitamin and mineral supplementsto athletes: do they help? Clinics in Sports Medicine 3,623–637.
Williams, M. (1994) The use of nutritional ergogenicaids in sports: is it an ethical issue? InternationalJournal of Sports Nutrition 4, 120–131.
sports nutrition products 531

PART 4
SPORT-SPECIFIC NUTRITION


Introduction
Of all sports, sprinting is the simplest. All that isrequired to run the race is a start and finish line,and an accepted method of starting the race. Thewinner is the first person to cross the finish line.Sprinting over short distances is one of man’searliest athletic pursuits. The pioneering event in the ancient Olympic Games was the ‘stade’,which was equivalent to the length of thestadium — 192 m — at Atlis, the theatre of thegames (Quercetani 1964). Later, a second race,the diaulos, equivalent to two stades (384 m), wasincluded as a foot race (Durant 1961).
The earliest records of the Olympic Gamescredit the winner of the sprint event in theancient Olympics of 776 bc at Olympia to Core-obus, a cook from the nearby city of Elis. Theancient tradition of honouring the fastest personon the day still holds today in major champi-onships, with the awarding of medals. The intro-duction of accurate and reliable time-keeping hasalso led to the establishment of world records.This has allowed athletes to compete against theclock on tracks around the world and far fromthe record holder (current world sprint recordsare shown in Table 41.1).
In comparison with the encyclopaedic litera-ture on endurance running, there is little infor-mation on sprinting. ‘Sprinting’ is also a genericterm used to describe brief maximum effortduring a wide range of activities, includingrunning, cycling, swimming, canoeing, rowing,field hockey, soccer and rugby. Under these cir-
cumstances, the duration of the activity is oftendifferent from track sprinting. Therefore, for thepurpose of this chapter, sprinting is consideredas brief maximal exercise, of less than 60s dura-tion. The intensity of exercise is well in excess ofthat required to elicit maximum oxygen uptake(V
.o2max.), and there is no distribution of effort.Setting aside the influence of natural talent
and appropriate training, correct nutritionduring training and competition is one of themost important components in the formula forsuccess in sprinting. Athletes are notoriouslyvulnerable to advertisements for nutritional sup-plements which make claims about enhancingperformance. Before reviewing the pertinent lit-erature on nutrition and sprinting, this chapterwill provide a brief overview of physiologicaland metabolic responses to sprinting, and theonset of fatigue, both on the track and in the labo-ratory, and adaptations to sprint training.
Metabolic responses to sprinting
Only a few studies have examined the metabolicresponses to 100-m and 400-m track sprinting(Hirvonen et al. 1987, 1992; Lacour et al. 1990;Hautier et al. 1994; Locatelli & Arsac 1995).
Hirvonen et al. (1987) measured the muscleadenosine triphosphate (ATP), phosphocreatine(PCr) and lactate concentrations in seven malesprinters before and after running 40, 60, 80 and100m at maximum speed. The fastest sprintersutilized the greatest amount of PCr in the first 40,60 and 80 m of the run (Fig. 41.2). Most of the PCr
Chapter 41
Sprinting
CERI W. NICHOLAS
535

was used during the first 5–6s of the race. Thedecrease in running speed over the 100m com-menced when the high-energy phosphate storeswere markedly reduced and glycolysis was thepredominant energy provider. Lactate did not
536 sport-specific nutrition
accumulate to a level which could have inhibitedglycolysis and is unlikely to have been the princi-pal cause of fatigue. These results show that therate of PCr utilization is critical to running speed.In agreement with these results, Locatelli andArsac (1995) showed that anaerobic glycolysisprovided approximately 65–70% of the meta-bolic energy production during a 100-m race intheir study of four male and four female nationalsprinters analysed during the 1994 Italian championships.
The validity of postexercise lactate concentra-tion as an indicator of the rate of anaerobic gly-colysis was investigated in 400-m sprinting byLacour et al. (1990), and in 100-m and 200-msprinting by Hautier et al. (1994). In the study byLacour et al. (1990), blood samples were taken
Table 41.1 Current world sprint records (as at January 1999).
Men Women
Distance (m) Time (s) Sprinter Time (s) Sprinter
100 9.84 D. Bailey 10.49 F. Griffith-Joiner
200 19.32 M. Johnson 21.34 F. Griffith-Joiner
400 43.29 H. Reynolds 47.6 M. Koch
Fig. 41.1 Sprinters and hurdlers in training completeprolonged sessions with many short efforts, eventhough competitions may involve only a single sprint.Photo courtesy of Ron Maughan.
50
40
30
20
100 20 40 60 80 100 120
10
7.5
5.0
2.5
0
Distance (m)
Pho
sph
ocr
eati
ne
(mm
ol. k
g–1
wt)
Spee
d (
m. s
–1)
Fig. 41.2 Speed (�) and muscle phosphocreatineconcentration (�) during a simulated 100-m tracksprint (Hirvonen et al. 1987).
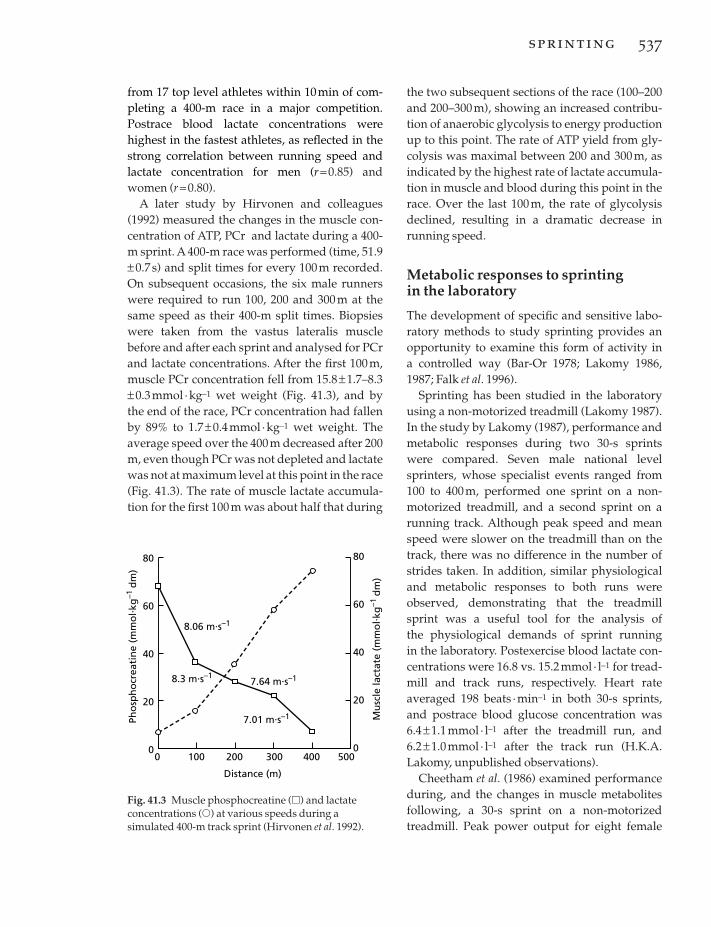
from 17 top level athletes within 10min of com-pleting a 400-m race in a major competition. Postrace blood lactate concentrations werehighest in the fastest athletes, as reflected in thestrong correlation between running speed andlactate concentration for men (r =0.85) andwomen (r =0.80).
A later study by Hirvonen and colleagues(1992) measured the changes in the muscle con-centration of ATP, PCr and lactate during a 400-m sprint. A 400-m race was performed (time, 51.9±0.7 s) and split times for every 100m recorded.On subsequent occasions, the six male runnerswere required to run 100, 200 and 300 m at thesame speed as their 400-m split times. Biopsieswere taken from the vastus lateralis musclebefore and after each sprint and analysed for PCrand lactate concentrations. After the first 100m,muscle PCr concentration fell from 15.8± 1.7–8.3±0.3 mmol · kg–1 wet weight (Fig. 41.3), and by the end of the race, PCr concentration had fallenby 89% to 1.7± 0.4mmol ·kg–1 wet weight. Theaverage speed over the 400m decreased after 200m, even though PCr was not depleted and lactatewas not at maximum level at this point in the race(Fig. 41.3). The rate of muscle lactate accumula-tion for the first 100 m was about half that during
the two subsequent sections of the race (100–200and 200–300m), showing an increased contribu-tion of anaerobic glycolysis to energy productionup to this point. The rate of ATP yield from gly-colysis was maximal between 200 and 300 m, asindicated by the highest rate of lactate accumula-tion in muscle and blood during this point in therace. Over the last 100 m, the rate of glycolysisdeclined, resulting in a dramatic decrease inrunning speed.
Metabolic responses to sprinting in the laboratory
The development of specific and sensitive labo-ratory methods to study sprinting provides anopportunity to examine this form of activity in a controlled way (Bar-Or 1978; Lakomy 1986,1987; Falk et al. 1996).
Sprinting has been studied in the laboratoryusing a non-motorized treadmill (Lakomy 1987).In the study by Lakomy (1987), performance andmetabolic responses during two 30-s sprintswere compared. Seven male national levelsprinters, whose specialist events ranged from100 to 400m, performed one sprint on a non-motorized treadmill, and a second sprint on arunning track. Although peak speed and meanspeed were slower on the treadmill than on thetrack, there was no difference in the number ofstrides taken. In addition, similar physiologicaland metabolic responses to both runs wereobserved, demonstrating that the treadmillsprint was a useful tool for the analysis of the physiological demands of sprint running in the laboratory. Postexercise blood lactate con-centrations were 16.8 vs. 15.2 mmol · l–1 for tread-mill and track runs, respectively. Heart rateaveraged 198 beats ·min–1 in both 30-s sprints,and postrace blood glucose concentration was6.4± 1.1mmol · l–1 after the treadmill run, and 6.2± 1.0mmol · l–1 after the track run (H.K.A.Lakomy, unpublished observations).
Cheetham et al. (1986) examined performanceduring, and the changes in muscle metabolitesfollowing, a 30-s sprint on a non-motorizedtreadmill. Peak power output for eight female
sprinting 537
Fig. 41.3 Muscle phosphocreatine (�) and lactateconcentrations (�) at various speeds during asimulated 400-m track sprint (Hirvonen et al. 1992).
80
60
40
20
0
80
60
40
20
00 100 200 300 400 500
Distance (m)
Pho
sph
ocr
eati
ne
(mm
ol. k
g–1
dm
)
Mu
scle
lact
ate
(mm
ol. k
g–1
dm
)
8.06 m.s–1
8.3 m.s–17.64 m.s–1
7.01 m.s–1

subjects was 534±85 W and was 50% of its peakvalue at the end of the sprint. Biopsy sampleswere taken from the vastus lateralis musclebefore and after the sprint. Muscle glycogen, PCrand ATP declined from resting values by 25%,64% and 37%, respectively. Three minutes afterexercise, muscle and blood lactate increased to 78± 26mmol · l–1 and 13 mmol · l–1, respectively.Similar intramuscular lactate concentrations of73.9± 16.1mmol ·kg–1 dry matter were observedfor males by Jacobs et al. (1983) after 30s ofmaximal cycling using the Wingate anaerobictest (WAnT) protocol. Blood pH decreased by0.24 units to 7.16± 0.07 3min after the sprint, andheart rate increased over the 30-s sprint, reachingits maximum of approximately 182 beats · min–1
over the last few seconds of the sprint (Cheethamet al. 1986). Anaerobic glycogenolysis supplied64% of the ATP required during the 30-s sprint,calculated from the changes in muscle glycogen,lactate, pyruvate and PCr concentrations. Similarmetabolic responses to sprinting were observedin a later study from the same laboratory (Nevillet al. 1989).
Costill et al. (1983) examined muscle and bloodpH along with blood lactate concentration andpH after sprint running. Four male subjects werebiopsied from the gastrocnemius muscle beforeand after a treadmill sprint run at 125% V
.o2max.
and a 400-m timed run on a track. After the 400-msprint, muscle pH in four of the subjects averaged 6.63±0.03 and blood pH and lactateconcentration were 7.10± 0.03 and 12.3mmol · l–1,respectively, highlighting the extensive meta-bolic challenge of this event.
Thirty seconds of treadmill sprinting also pro-vokes a marked increase in endocrine response.Plasma noradrenaline and adrenaline increasedfrom resting values by six- and sevenfold, respec-tively, and the plasma concentration of b-endorphin doubled following 30 s of treadmillsprinting. (Brooks et al. 1988). Plasma growthhormone is elevated to more than eight times itsresting value following a 30-s treadmill sprint(Nevill et al. 1996). The concentration peakedafter 30 min recovery and remained significantlyelevated above baseline for the 60 min. A greaterendocrine response is observed when maximal
538 sport-specific nutrition
sprints are repeated after a short recovery(Brooks et al. 1990). In one study, nine men andnine women performed 10 6-s sprints on a non-motorized treadmill, with 30 s separating eachsprint. Peak plasma adrenaline was 9.2±7.3 forthe men and 3.7± 2.4nmol · l–1 for the women,and was recorded after only five sprints (Brookset al. 1990).
Most studies reporting the metabolicresponses to sprinting have analysed musclesamples which contain a mixture of fibre types.However, studies which have been carried out invitro have suggested that maximal power outputand its decline are related to fibre type (Faulkneret al. 1986). Energy metabolism in single musclefibres was measured in a study by Greenhaff andcolleagues (1994). Muscle biopsies were takenfrom the vastus lateralis muscle before and after30s of maximal treadmill sprinting and the type Iand type II fibres analysed for concentrations ofATP, PCr and glycogen (Fig. 41.4). Prior to thesprint, PCr and glycogen concentrations werehighest in the type II fibres and a greater declinewas observed in these fibres after the 30-s sprint.Peak power output declined by 65± 3% duringexercise. Phosphocreatine was almost depletedafter the sprint, but those subjects with the highertype II fibre PCr content showed a smallerdecline in power output during the sprint (r =–0.93; P< 0.01). The decline in ATP during thesprint was similar in both fibre populations. Thisillustrates the importance of the contribution of PCr to energy production during maximal exercise.
Fatigue during sprinting
Elite male sprinters can maintain maximal speedfor 20–30 m, whereas females can maintain topspeed for only 15–20m. The explanation, even inelite sprinters, may be due to both mechanicaland metabolic factors.
The mechanical limitations to sprintinginclude failure of neuromuscular coordination(Murase et al. 1976), the change in body positionrelative to the foot striking the ground, anddeceleration caused by the grounding foot(Mann & Sprague 1983; Mann 1985). At such
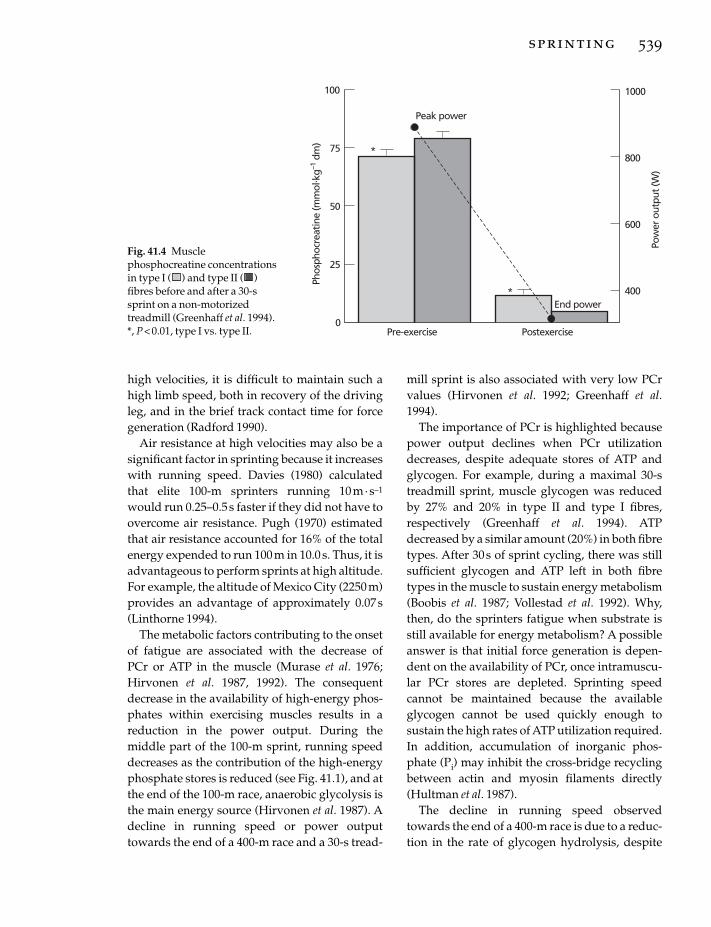
high velocities, it is difficult to maintain such ahigh limb speed, both in recovery of the drivingleg, and in the brief track contact time for forcegeneration (Radford 1990).
Air resistance at high velocities may also be asignificant factor in sprinting because it increaseswith running speed. Davies (1980) calculatedthat elite 100-m sprinters running 10 m·s–1
would run 0.25–0.5 s faster if they did not have toovercome air resistance. Pugh (1970) estimatedthat air resistance accounted for 16% of the totalenergy expended to run 100 m in 10.0 s. Thus, it isadvantageous to perform sprints at high altitude.For example, the altitude of Mexico City (2250 m)provides an advantage of approximately 0.07s(Linthorne 1994).
The metabolic factors contributing to the onsetof fatigue are associated with the decrease of PCr or ATP in the muscle (Murase et al. 1976;Hirvonen et al. 1987, 1992). The consequentdecrease in the availability of high-energy phos-phates within exercising muscles results in areduction in the power output. During themiddle part of the 100-m sprint, running speeddecreases as the contribution of the high-energyphosphate stores is reduced (see Fig. 41.1), and atthe end of the 100-m race, anaerobic glycolysis isthe main energy source (Hirvonen et al. 1987). Adecline in running speed or power outputtowards the end of a 400-m race and a 30-s tread-
mill sprint is also associated with very low PCrvalues (Hirvonen et al. 1992; Greenhaff et al.1994).
The importance of PCr is highlighted becausepower output declines when PCr utilizationdecreases, despite adequate stores of ATP andglycogen. For example, during a maximal 30-streadmill sprint, muscle glycogen was reducedby 27% and 20% in type II and type I fibres,respectively (Greenhaff et al. 1994). ATPdecreased by a similar amount (20%) in both fibretypes. After 30s of sprint cycling, there was stillsufficient glycogen and ATP left in both fibretypes in the muscle to sustain energy metabolism(Boobis et al. 1987; Vollestad et al. 1992). Why,then, do the sprinters fatigue when substrate isstill available for energy metabolism? A possibleanswer is that initial force generation is depen-dent on the availability of PCr, once intramuscu-lar PCr stores are depleted. Sprinting speedcannot be maintained because the availableglycogen cannot be used quickly enough tosustain the high rates of ATP utilization required.In addition, accumulation of inorganic phos-phate (Pi) may inhibit the cross-bridge recyclingbetween actin and myosin filaments directly(Hultman et al. 1987).
The decline in running speed observedtowards the end of a 400-m race is due to a reduc-tion in the rate of glycogen hydrolysis, despite
sprinting 539
100
0
75
50
25
Pre-exercise
Phos
phoc
reat
ine
(mm
ol. k
g–1 d
m)
Postexercise
1000
800
600
400
Pow
er o
utpu
t (W
)
*
Peak power
End power*
Fig. 41.4 Musclephosphocreatine concentrationsin type I ( ) and type II ( )fibres before and after a 30-ssprint on a non-motorizedtreadmill (Greenhaff et al. 1994).*, P < 0.01, type I vs. type II.

ample availability of muscle glycogen. The paral-lel increase in hydrogen and lactate ions duringsprinting may inhibit glycolysis, thus contribut-ing to the development of fatigue (Sahlin 1996). Afurther explanation for fatigue during the 400-msprint and repeated shorter sprints during train-ing is that the increase in ammonia observed as aconsequence of decreases in PCr and ATP con-centrations during sprinting (Schlict et al. 1990;Tullson & Turjung 1990) may be implicated in thefatigue process (Green 1995).
Influence of sprint training on energy production
The main focus of many studies on the adapta-tions to sprint training is the changes in energymetabolism underpinning improvements in per-formance. This approach has led to a greaterunderstanding of the metabolic causes of fatigueduring sprinting.
The main and consistent finding in the labora-tory and in the field is that sprint train-ing improves performance. This performance ismeasured as an increase in maximum poweroutput during the initial period of exercise, anincrease in the amount of work done during abrief exercise bout, or an increase in exerciseduration at high exercise intensities (Brooks et al.1993).
Nevill et al. (1989), investigated the effect of 8weeks of high-intensity training on metabolismduring a 30-s treadmill sprint. Sixteen matchedsubjects were assigned to either a training or acontrol group. After training, peak powerincreased by 12% during the initial period ofexercise, and the total work done during the test was increased by 6%. This improvement in performance was equivalent to a 1.5-s reduc-tion in 200-m running time. Maximum musclelactate concentration increased by 20% aftertraining, and an equivalent increase in the rate of ATP resynthesis from anaerobic glycolysis was also observed. The excess postexerciseoxygen consumption also increased by 18% after training. However, despite the increase inmuscle lactate concentration, training did not
540 sport-specific nutrition
change muscle pH during maximal treadmillsprinting.
The increased ATP required as a consequenceof the improvement in performance after sprinttraining was provided from anaerobic glycolysis(Nevill et al. 1989). No changes were observed inthe contribution from PCr or aerobic metabolism.The increased resynthesis from anaerobic glycol-ysis was facilitated by an increase in the activityof phosphofructokinase (PFK), the rate-limitingenzyme in anaerobic glycolysis, and by anincreased efflux of H+ from the muscle cell aftertraining. This is in agreement with other studies,which have reported that adaptations to sprinttraining include an increase in the muscle’sbuffering capacity (Sharp et al. 1986), an increasein the activity of muscle PFK (Fournier et al. 1982;Roberts et al. 1982; Sharp et al. 1986; Jacobs et al.1987), and an increase in the proportion of typeIIa fibres (Jacobs et al. 1987).
However, factors other than increased anaero-bic energy production may also contribute toimprovement in performance after sprint train-ing. These include an improved regulation of K+ during exercise and changes in the Na+–K+-ATPase concentrations (McKenna et al. 1993),which are important in the excitation–contrac-tion coupling in skeletal muscles. Other factorsinclude the determinants of muscle tension atboth the whole muscle and single fibre level.These include action-potential frequency, fibrelength and fibre diameter. It is beyond the scopeof this review to consider these factors, which arediscussed in detail elsewhere (Brooks et al. 1993).
Nutritional influences on sprinting
Dietary intake
In contrast to the plethora of information on the dietary intake of endurance athletes, thenutritional habits of sprinters are not well documented. It is a well-established belief in thepower- and strength-training community thatstrength is improved when a diet high in proteinis consumed. Quantitatively, the recommendedprotein intake for these athletes is about 1.4–1.7g

protein · kg–1 body mass ·day–1 (Lemon 1992). Adiet containing 12–15% of its energy from proteinshould be adequate for strength athletes (includ-ing sprinters), assuming that the total energyintake is sufficient to cover their high dailyenergy expenditure (Lemon & Proctor 1991).
Should sprinters consume a particular type ofdiet? Total energy intake should be increased inorder to cover the demands of training and com-petition. Most of the studies which have reportedthe energy intakes of runners have focused onendurance athletes. One study of trained univer-sity track athletes (Short & Short 1983) reportedthat the daily energy intake of these sprinterswas approximately 16.8 MJ (4000 kcal), similar tothe energy intake of university bodybuilders inthe same study. Unfortunately, no data on thephysical characteristics of these athletes weredocumented. A well-balanced diet, containing awide variety of foods, is all that is recommendedto ensure that all needs for energy, vitamins andminerals are met. At least 60–70% (7–8 g · kg–1) ofdaily energy intake should come from carbohy-drates, about 12% from protein (1.2–1.7 g · kg–1),and the remaining energy provided by fat(Devlin & Williams 1991; Lemon 1992). However,only endurance athletes seem to comply withthese recommendations (C. Williams 1993). Theonly nutrient supplementation which mayenhance sprinting is creatine (see Chapter 27)and bicarbonate (see Chapter 29). Currently,there is little evidence to suggest that sprintersrequire any other supplements (including vita-mins and minerals) in addition to a normal bal-anced diet containing a wide range of foodscovering the individual’s energy requirements.Further research is necessary to establishwhether some nutrients and combinations of nutrients have an ergogenic effect duringsprinting.
Carbohydrate loading and sprinting
Muscle glycogen ‘supercompensation’ improvesperformance during prolonged exercise (Costill1988), and is a nutritional strategy used byendurance athletes in preparation for competi-
tion. The importance of the initial glycogen concentration on the performance of maximal or high-intensity exercise remains an issue,although it is clear that very low pre-exerciseglycogen concentrations are associated withreductions in performance in high-intensityexercise (Maughan & Poole 1981; Pizza et al.1995). However, it is unlikely that increasedglycogen stores will affect sprinting perfor-mance, as glycogen per se is not a limiting factorduring sprints over distances of 400 m or less(Hirvonen et al. 1992). Laboratory studies onbrief, maximal exercise also support this conclu-sion. The mean and peak power outputs of athletes performing 30 s of maximal exerciseusing the WAnT protocol on a cycle ergometerwere unchanged after carbohydrate loading(Wootton & Williams 1984).
This lack of ergogenic effect is elucidated whenthe metabolic responses to sprinting are exam-ined in single fibres of human skeletal muscle(Greenhaff et al. 1994). Biopsies were obtainedfrom six subjects before and after a 30-s sprint on a non-motorized treadmill. Glycogen wasreduced by 20% and 27% in the type I and type IIfibres, respectively, in agreement with the signifi-cant contribution from muscle glycogen during a30-s sprint reported by Cheetham et al. (1986).However, the 65% decline in power outputduring the 30-s sprint was probably associatedwith the large decline in PCr concentration inboth type I fibres (83% decrease), and particu-larly the type II fibres (94% decline).
Varying the carbohydrate intake in the daysbefore exercise has been shown to influence per-formance during high-intensity (not maximal)exercise when undertaken either continuously(Maughan & Poole 1981; Pizza et al. 1995), orintermittently (Bangsbo et al. 1992; Nicholas et al.1997). However, a relationship between carbohy-drate status and exercise performance duringmaximum exercise has not been consistentlyreported (Symons & Jacobs 1989; Vandenbergheet al. 1995). There may, however, be a critical concentration of glycogen below which high-intensity exercise is impaired. Indeed, it has beenshown that below a muscle glycogen concentra-
sprinting 541

tion of 20–30 mmol · kg–1 of wet weight, the rateof energy production is reduced and perfor-mance decreased (Costill 1988).
Carbohydrate loading and repeated sprints
Sprint training involves many sprints duringdaily training sessions. The metabolic and physi-ological responses to repeated sprints performedin the laboratory (Gaitanos et al. 1993; Trump etal. 1996) provide some information on the glyco-gen demands of a sprint training session, or insports such as soccer or rugby (Nicholas et al.1994), where maximal sprints are performedbriefly between periods of less intense exerciseover an 80–90-min period.
Several studies have examined maximaldynamic muscle power output and the associ-ated metabolic changes in muscle during three tofour bouts of maximal cycling at 100 r.p.m.(10.5 rad · s-1), separated by 4-min recovery inter-vals (McCartney et al. 1986; Spriet et al. 1989;Trump et al. 1996). In these studies, power outputand work done decreased by 20% in both thesecond and third exercise periods, but there wasno further decrement in performance in the
542 sport-specific nutrition
fourth bout (McCartney et al. 1986). Changes inmuscle glycogen, lactate and glycolytic interme-diates suggested that the rate of glycogenolysiswas limited at the PFK level during the first andsecond exercise periods, and at the phosphory-lase level in the third and fourth exercise periods(McCartney et al. 1986). In agreement with thesefindings, Spriet et al. (1989) reported that muscle[H+] was higher and the glycolytic flux lowerafter the third exercise bout than after the second,even though ATP and PCr degradation wassimilar in the two exercise bouts. As a conse-quence of the reduction in the rate of glycolysisduring the third and fourth sprints, there is agreater reliance on aerobic metabolism (Fig.41.5), and possibly the intramuscular triglyceridestores (McCartney et al. 1986).
The laboratory studies on repeated sprints of30s duration are relevant to training sessionswhere sets of 200 or 300 m are performed.However, muscle metabolism during repeatedshorter sprints (<6 s) has a wider applicability,not only for sprint training, but also to the multi-ple sprint sports. Gaitanos et al. (1993) examinedmuscle metabolism during intermittent maximalexercise. The exercise protocol consisted of 10 ¥
100
0
75
50
25
Gly
coge
n co
ncen
trat
ion
(mm
ol. k
g–1 w
et w
t)
Sampling time
1800
1600
1400
1000
Peak
pow
er (W
)
PPO
1200
800Rest
18.2 14.8 –2 3
Sprint 1 Sprint 2 Sprint 3 Sprint 4
Fig. 41.5 Post-sprint glycogenconcentration and power outputduring four bouts of 30-sisokinetic cycling (McCartney etal. 1986). The amount of glycogenutilized during each bout is alsoshown (in mmol ·kg-1 wet wt).PPO, peak power output.

6-s maximal sprints on a cycle ergometer with 30s of recovery between each sprint. The appliedload for the sprints was calculated as for theWAnT protocol (75g · kg–1 body mass). Biopsieswere taken from the vastus lateralis musclebefore and after the first sprint and 10s beforeand immediately after the 10th sprint. Meanpower output generated over the first 6-s sprintwas sustained by an equal contribution from PCrdegradation and anaerobic glycolysis. By the endof the first sprint, PCr and glycogen concentra-tion decreased by 57% and 14%, respectively, ofresting values, and muscle lactate concentrationincreased to 28.6mmol · kg–1 dry matter, an indi-cation of significant glycolytic activity. However,in the 10th sprint, mean power output wasreduced to 73% of that generated in the firstsprint, despite the fact that there was a dramaticreduction in the energy yield from anaerobic gly-colysis. Thus it was suggested that power outputduring the last sprint was supported by energythat was mainly derived from PCr degradationand an increased aerobic metabolism.
Thus the weight of available evidence showsthat it is unlikely that sprinting is limited bymuscle glycogen availability, unless the glycogenconcentration falls below a critical thresholdvalue of 100mmol ·kg–1 of dry matter. Glycogenavailability is also unlikely to limit peak poweroutput during repeated sprints because of thedecline in glycogenolysis and lactate productionobserved under these conditions. However, asreviewed in the next section, evidence shows thatan inadequate intake of carbohydrate in the dietis detrimental to sprinting.
Carbohydrate intake and repeated maximal sprints
An inadequate carbohydrate intake has beenshown to decrease performance during a secondmaximal cycle ergometer interval test performed2–3 days after the first test (Fulcher & Williams1992; Jenkins et al. 1993). Fulcher and Williams(1992) studied the effects of 2 days’ intake ofeither a normal carbohydrate (450±225 g) or alow carbohydrate (71± 27g) diet on power
output during maximal intermittent exercise.Two trials were performed, one before, and thenone following the 2 days of dietary manipula-tion. The test protocol comprised five sets of five all-out fixed level sprints with 30s recovery(65 g ·kg–1 applied load) separated by 5 minactive recovery. A final, sixth set comprised 10¥6-s sprints, separated by 30 s recovery. Those sub-jects who ate their normal amount of carbohy-drate showed a significant improvement in peakpower output during the five sets of sprints intest 2 compared with test 1. No such improve-ment was shown in test 2 after the low carbohy-drate diet. In the study by Jenkins and colleagues(1993), 14 moderately trained individuals com-pleted two intermittent exercise tests, separatedby 3 days. Each test comprised five bouts of 60-scycle performed maximally, with successiveexercise periods separated by 5 min of passiverecovery. During the 3-day period between trials,each subject was randomly assigned to either ahigh carbohydrate (83%), moderate carbohy-drate (58%) or low carbohydrate (12%) diet.Although performance declined in the low car-bohydrate condition in both these studies, theamount of carbohydrate ingested (10% and 12%,respectively, of total energy intake) was signifi-cantly lower than the amount normally con-sumed by athletes. Nevertheless, these studieshighlight the importance of an adequate intakeof dietary carbohydrate for those individualsperforming repeated sprint exercise.
These results emphasize the need for sprintersin training, and sportsmen and women compet-ing in the multiple sprint sports (see Chapter 45for a more detailed review) to consume adequateamounts of carbohydrate on a daily basis. Muchresearch has been carried out to determine theamount of carbohydrate needed to replenishglycogen stores within 24h of intense training. A diet which comprised approximately 8–10gcarbohydrate · kg–1 body mass was sufficient to replace muscle glycogen stores after daily 1-htraining sessions (Pascoe et al. 1990). High-intensity endurance capacity was also improvedfollowing a high carbohydrate recovery diet(Nicholas et al. 1997). However, some studies
sprinting 543

have shown that when a fixed amount of exerciseis performed on a daily basis, performance is notaffected when only a moderate amount of carbo-hydrate is consumed (Simonsen et al. 1991; Nevillet al. 1993; Sherman et al. 1993).
Nevill et al. (1993) reported that power outputduring 1h of intermittent sprint exercise wasunchanged after the carbohydrate intake wasmanipulated during the 24-h recovery (Fig. 41.6).During the first trial, 18 games players per-formed 30 maximum 6-s sprints, interspersedwith walking and jogging, on a non-motorizedtreadmill. The subjects were then randomlyassigned to three equally matched groups andrepeated the test 24 h later, after consumingeither a high, low or normal carbohydrate diet(79 ±3%, 47 ±8%, 12± 1% carbohydrate, respec-tively). Power output over the 30 sprints was notdifferent between trials; however, the high carbo-hydrate group did perform better than the lowcarbohydrate group over the first nine sprints.
However, although no performance decre-ments were observed in the short term, anincreased carbohydrate intake is recommendedbecause it may improve performance after an
544 sport-specific nutrition
intensive training period (Simonsen et al. 1991).Laboratory studies have shown that one 6-ssprint reduces glycogen by approximately 44mmol ·kg–1 dry matter (14%), and after 10sprints, glycogen is reduced by 36% (Gaitanos etal. 1993). A sprinter may train intensively — say,three to five times per week — which may cumu-latively reduce glycogen stores, leading to glyco-gen depletion. Performance during maximalexercise may be reduced by 10–15% when glycogen concentration falls below a criticalthreshold (Jacobs et al. 1982). Although there isno ergogenic benefit of carbohydrate loading inthe days prior to a single sprint, an adequate car-bohydrate intake is recommended for sprintersin training to support the intense daily trainingsessions.
Dietary supplements and sprinting
Protein and amino acids
Anabolic steroids, used by bodybuilders toincrease lean muscle tissue, are illegal in sportingcompetition, and may pose a number of healthrisks. A variety of nutrients are believed toprovide an effective, safe and legal alternativeinstead (M.H. Williams 1993). Amino acid sup-plements have been advertised for strength ath-letes because they are said to provide a safeanabolic or muscle-building effect. The two mostcommonly used amino acids are arginine andornithine because of their stimulatory effects onhuman growth hormone (HGH) production(Hatfield 1987; Williams 1989). It is well documented that exogenous growth hormoneproduces anabolic effects in growth hormone-deficient animals and humans, but it is question-able as to whether this same effect exists innormal animals and humans.
However, many athletes believe that supple-mentation with these amino acids stimulates the release of HGH, which is thought to act byincreasing insulin-like growth factors (IGF1 andIGF2). Thus, protein and nucleic acid synthesis isstimulated in skeletal muscle (Lombardo et al.1991). However, many well-controlled studies
800
400
700
600
500
Trial 1
Mea
n po
wer
(W)
Trial 2
Fig. 41.6 Mean power output during 30 maximal 6-ssprints during trial 1 and trial 2 for three dietarygroups: , high carbohydrate; �, normalcarbohydrate; , low carbohydrate (Nevill et al. 1993).

have failed to observe an increase in the serumconcentration of HGH following supplementa-tion with these amino acids. Those studies whichhave shown some anabolic effect of these aminoacid supplements are flawed. Suminski et al.(1997) found that the ingestion of 1500mg of argi-nine and 1500 mg of lysine immediately beforeresistance exercise did not alter exercise-inducedchanges in the concentration of growth hormonein weight-training males. When the same aminoacid mixture was ingested under basal condi-tions, the secretion of growth hormone wasincreased to levels which were higher than afteringestion of a placebo, 60 min after amino acidingestion during resting conditions. Additionalresearch is required to evaluate claims for com-mercial products.
A few studies have examined the effect of argi-nine and/or ornithine supplementation on bodycomposition, measures of muscular strength orpower and reported significant increases in leanbody mass. Where increases in lean body masshave been reported (Crist et al. 1988; Yarasheski et al. 1992), the functional ability of the musclewas not assessed. M.H. Williams (1993) empha-sizes the flawed experimental methodology ineach study, thus questioning the interpretation ofthe findings. Although statistical significancewas reported in two of the studies, a recalcula-tion, using the appropriate statistical technique,actually revealed no significant differencesbetween the supplement and the placebo. Otherstudies have reported no significant effect ofarginine or a mixture of amino acids on measuresof strength, power or HGH in experiencedweightlifters (Hawkins et al. 1991; Warren et al.1991). The use of both HGH and anabolicsteroids is contraindicated for athletes, since theyare both proscribed by the IOC and both carrysignificant health risks (Lombardo et al. 1991;M.H. Williams 1993).
The ergogenic effect of supplementing the dietwith low-dose oral amino acids has been ques-tioned (Fogelholm et al. 1993; Fry et al. 1993;Lambert et al. 1993). Fogelholm et al. (1993) foundno difference in the concentrations of serumgrowth hormone or insulin of competitive
weightlifters following 4 days supplementationwith l-arginine, l-orthinine and l-lysine. Thisresult was consistent with the findings ofLambert et al. (1993), who reported that serumgrowth hormone concentrations were not ele-vated in male bodybuilders after the ingestion of commercial amino acid supplements in thequantities specified by the manufacturers. Thesupplements of amino acids comprised two mixtures: 2.4 g of arginine and lysine, and 1.85 gof ornithine and tyrosine.
Fry and colleagues monitored both hormonaland performance responses to amino acid sup-plementation in parallel with high-volume train-ing. In this study, 28 elite junior weightlifterswere tested for strength before and after 7 days ofhigh-volume training sessions. During this 7-daytraining period, the subjects’ diets were supple-mented with capsules containing either aminoacids (protein group) or lactose (placebo group).The protein group took 2.4g of amino acids (con-taining a mixture of all 20 amino acids) immedi-ately prior to their three daily meals for 7 days, as well as 2.1g of branched-chain amino acids (l-leucine, l-isoleucine, l-valine, supplementedwith l-glutamine and l-carnitine), prior to eachtraining session. It was concluded that hormonalresponses, both at rest and following training,were unaltered.
It is important to recognize that brief periodsof high-intensity exercise significantly increasethe concentration of growth hormone. Growthhormone increased and remained approximately10 times the basal value in sprint-trained athletes, 1 h after a maximal 30-s sprint on a non-motorized treadmill (Nevill et al. 1996). Thegrowth hormone response was greater in sprint-trained than endurance-trained athletes, and nodifferences were found between males andfemales. Peak power output and the magnitudeof metabolic response to the sprint accounted for 82% of the variation in serum peak growthhormone response. Thus, sprint training per se iseffective in increasing growth hormone. Whetheror not sprinting could promote increases in IGF1and IGF2 is unknown, but repeated eccentriccontractions have been shown to increase the
sprinting 545
immunoreactivity of IGF1 in muscle 4 days afterexercise (Yan et al. 1993).
In summary, a high carbohydrate diet is rec-ommended in order to replenish the muscleglycogen depleted during intense training ses-sions on a daily basis. With the exception of crea-tine supplementation (reviewed in Chapter 27)and bicarbonate supplementation (reviewed inChapter 29), there is little evidence to suggestthat sprinters need any additional nutrient sup-plementation (including vitamins and minerals)provided that they eat a normal balanced diet,containing a wide range of foods, which coversthe individual’s energy requirements (Clarkson1990; Van Der Beek 1990).
References
Bangsbo, J., Norregaard, L. & Thorsoe, F. (1992) Theeffect of carbohydrate diet on intermittent exerciseperformance. International Journal of Sports Medicine13, 152–157.
Bar-Or, O. (1978) The Wingate Anaerobic Test: anupdate on methodology, reliability and validity.Sports Medicine 4, 381–394.
Boobis, L.H., Williams, C., Cheetham, M.E. & Wootton,S.A. (1987) Metabolic aspects of fatigue duringsprinting. In Exercise Benefits, Limits and Adaptations(ed. D. Macleod, R. Maughan, M. Nimmo, T. Reilly &C. Williams), pp. 116–143. E and FN Spon, London.
Brooks, S., Burrin, J., Cheetham, M.E., Hall, G.M., Yeo,T. & Williams, C. (1988) The responses of the cate-cholamines and B-endorphin to brief maximal exer-cise in man. European Journal of Applied Physiology 57,230–234.
Brooks, S., Nevill, M.E., Meleagros, L., Lakomy, H.K.A.,Hall, G.M., Bloom, S.R. & Williams, C. (1990) Thehormonal responses to repetitive brief maximal exer-cise in humans. European Journal of Applied Physiology60, 144–148.
Brooks, S., Nevill, M.E., Gaitanos, G. & Williams, C.(1993) Metabolic responses to sprint training. InIntermittent High Intensity Exercise: Preparation,Stresses and Damage Limitation (ed. D.A.D. Macleod,R.J. Maughan, C. Williams, C.R. Madeley, J.C.M.Sharp & R.W. Nutton), pp. 33–47. E and FN Spon,London.
Cheetham, M.E., Boobis, L.H., Brooks, S. & Williams, C.(1986) Human muscle metabolism during sprintrunning. Journal of Applied Physiology 61, 54–60.
Clarkson, P.M. (1990) Minerals: exercise performance
546 sport-specific nutrition
and supplementation in athletes. Journal of Sports Sciences 9, S91–S116.
Costill, D.L. (1988) Carbohydrates for exercise: dietarydemands for optimal performance. InternationalJournal of Sports Medicine 9, 1–18.
Costill, D.L., Barnett, A., Sharp, R., Fink, R.J. & Katz, A.(1983) Leg muscle pH following sprint running. Medicine and Science in Sports and Exercise 15, 325–329.
Crist, D.M., Peake, G. & Egan, P. et al. (1988) Body com-position response to exogenous GH during trainingin highly conditioned adults. Journal of Applied Physiology 65, 579–584.
Davies, C.T.M. (1980) The effects of wind assistanceand resistance on the forward motion of a runner.Journal of Applied Physiology 48, 702–709.
Devlin, J.T. & Williams, C. (1991) Foods, nutrition andsports performance: a final consensus statement.Journal of Sports Sciences 9 (Suppl.), iii.
Durant, J. (1961) Highlights of the Olympics: From AncientTimes to the Present. Arco Publications, London.
Falk, B., Weinstein, Y., Dotan, R., Abramson, D.A.,Mannsegal, D. & Hoffman, J.R. (1996) A treadmilltest of sprint running. Scandinavian Journal of Medicine and Science in Sports 6, 259–264.
Faulkner, J.A., Clafin, D.R. & McCully, K.K. (1986)Power output of fast and slow fibres from humanskeletal muscle. In Human Power Output (ed. N.L.Jones, N. McCartney & A.J. McComas), pp. 81–89.Human Kinetics Publishers, Champaign, IL.
Fogelholm, G.M., Naveri, H.K., Kiilavuori, K.T.K. &Harkonen, M.H.A. (1993) Low dose amino acid sup-plementation: no effect on serum growth hormoneand insulin in male weightlifters. InternationalJournal of Sport Nutrition 3, 290–297.
Fournier, M., Ricci, J., Taylor, A.W., Ferguson, R.J.,Montpetit, R.R. & Chaitman, B.R. (1982) Skeletalmuscle adaptation in adolescent boys: sprint andendurance training and detraining. Medicine andScience in Sports and Exercise 14, 453–456.
Fry, A.C., Kraemer, W.J., Stone, M.H. et al. (1993)Endocrine and performance responses to highvolume training and amino acid supplementation inelite junior weightlifters. International Journal of SportNutrition 3, 306–322.
Fulcher, K.Y. & Williams, C. (1992) The effect of diet onhigh-intensity intermittent exercise performance.Journal of Sports Sciences 10, 550–551A.
Gaitanos, G.C., Williams, C., Boobis, L.H. & Brooks, S.(1993) Human muscle metabolism during intermit-tent maximal exercise. Journal of Applied Physiology75, 712–719.
Green, H.J. (1995) Metabolic determinants of activityinduced muscular fatigue. In Exercise Metabolism(ed. M. Hargreaves), pp. 211–256. Human Kinetics,Champaign, IL.
Greenhaff, P.L., Nevill, M.E., Soderlund, K. et al. (1994)The metabolic responses of human type I and IImuscle fibres during maximal treadmill sprinting.Journal of Physiology 478, 149–155.
Hatfield, F.C. (1987) Ultimate Sports Nutrition. Contem-porary Books, Chicago.
Hautier, C.A., Wouassi, D., Arsac, L.M., Bitanga, E.,Thiriet, P. & Lacour, J.R. (1994) Relationshipsbetween postcompetition blood lactate concentra-tion and average running velocity over 100-m and200-m races. European Journal of Applied Physiology 68,508–513.
Hawkins, C.E., Walberg-Rankin, J. & Sebolt, D.R. (1991)Oral arginine does not affect body composition or muscle function in male weight lifters (Abstract).Medicine and Science in Sports and Exercise 23, S15.
Hirvonen, J., Rehunen, S., Rusko, H. & Harkonen, M.(1987) Breakdown of high-energy phosphate compounds and lactate accumulation during shortsupramaximal exercise. European Journal of AppliedPhysiology 56, 253–259.
Hirvonen, J., Nummela, H., Rehunen, S. & Harkonen,M. (1992) Fatigue and changes of ATP, creatine phos-phate, and lactate during the 400-m sprint. CanadianJournal of Sport Science 17, 141–144.
Hultman, E., Spriet, L.L. & Soderlund, K. (1987) Energymetabolism and fatigue in working muscle. In Exer-cise Benefits, Limits and Adaptations (ed. D. Macleod,R. Maughan, M. Nimmo, T. Reilly & C. Williams), pp.63–80. E and FN Spon, London.
Jacobs, I., Kaiser, P. & Tesch, P. (1982) The effects ofglycogen exhaustion on maximal short-term perfor-mance. In Exercise and Sport Biology (ed. P.V. Komi),pp. 103–108. Human Kinetics, Champaign, IL.
Jacobs, I., Tesch, P.A., Bar-Or, O., Karlsson, J. & Dotan,R. (1983) Lactate in human skeletal muscle after 10and 30 s of supramaximal exercise. Journal of AppliedPhysiology 55, 365–367.
Jacobs, I., Esbjornsson, M., Sylven, C., Holm, I. &Jansson, E. (1987) Sprint training effects on musclemyoglobin, enzymes, fibre types, and blood lactate.Medicine and Science in Sports and Exercise 19, 368–374.
Jenkins, D.G., Palmer, J. & Spillman, D. (1993) Theinfluence of dietary carbohydrate on performance ofsupramaximal intermittent exercise. European Journalof Applied Physiology 67, 309–314.
Lacour, J.R., Bouvat, E. & Barthelemy, J.C. (1990) Postcompetition blood lactate concentrations as indica-tors of anaerobic energy expenditure during 400-mand 800-m races. European Journal of Applied Physiol-ogy 61, 172–176.
Lakomy, H.K.A. (1986) Measurement of work andpower output using friction-loaded cycle ergome-ters. Ergonomics 29, 509–517.
Lakomy, H.K.A. (1987) The use of a non-motorized
treadmill for analyzing sprint performance.Ergonomics 30, 627–637.
Lambert, M.I., Hefer, J.A., Millar, R.P. & Macfarlane,P.W. (1993) Failure of commercial oral amino acidsupplements to increase serum growth hormoneconcentrations in male body builders. InternationalJournal of Sport Nutrition 3, 298–305.
Lemon, P.W.R. (1992) Effect of exercise on proteinrequirements. In Foods, Nutrition and Sports Perfor-mance (ed. C. Williams & J.T. Devlin), pp. 65–86. E.and F.N. Spon, London.
Lemon, P.W.R. & Proctor, D.N. (1991) Protein intakeand athletic performance. Sports Medicine 12,313–325.
Linthorne, N.P. (1994) The effect of wind on 100 msprint times. Journal of Applied Biomechanics 10,110–131.
Locatelli, E. & Arsac, L. (1995) The mechanics and ener-getics of the 100-m sprint. New Studies in Athletics 10,81–87.
Lombardo, J.A., Hickson, R.C. & Lamb, D.R. (1991)Anabolic/androgenic steroids and growth hormone.In Perspectives in Exercise Science and Sports Medicine.Vol. 4. Ergogenics: Enhancement of Performance in Exer-cise and Sport (ed. D.R. Lamb & M.H. Williams), pp.249–278. Brown and Benchmark, Indianapolis, IN.
McCartney, N., Spriet, L.L., Heigenhauser, G.J.F.,Kowalchuk, J.M., Sutton, J.R. & Jones, N.L. (1986)Muscle power and metabolism in maximal inter-mittent exercise. Journal of Applied Physiology 60,1164–1169.
McKenna, M.J., Schmidt, T.A., Hargreaves, M.,Cameron, L., Skinner, S.L. & Kjeldsen, K. (1993)Sprint training increases human skeletal muscleNa+–K+ ATPase concentration and improves K+
regulation. Journal of Applied Physiology 75, 173–180.Mann, R. (1985) Biomechanical analysis of the elite
sprinter and hurdler. In The Elite Athlete (ed. N.K.Butts, T.K. Gushiken & B. Zairns), pp. 43–80. Spectrum Publications, New York.
Mann, R. & Sprague, P. (1983) Kinetics of sprinting.Track and Field Quarterly Review 83, 4–9.
Maughan, R.J. & Poole, D.C. (1981) The effects of a glycogen-loading regimen on the capacity toperform anaerobic exercise. European Journal ofApplied Physiology 46, 211–219.
Murase, Y., Hoshikawa, T., Yasuda, N., Ikegami, Y. &Matsui, H. (1976) Analysis of the changes in progres-sive speed during 100-metre dash. In BiomechanicsV-B (ed. P.V. Komi), pp. 200–207. University ParkPress, Baltimore, MD.
Nevill, M.E., Boobis, L.H., Brooks, S. & Williams, C.(1989) Effect of training on muscle metabolismduring treadmill sprinting. Journal of Applied Physiol-ogy 67, 2376–2382.
sprinting 547

Nevill, M.E., Williams, C., Roper, D., Slater, C. & Nevill,A.M. (1993) Effect of diet on performance duringrecovery from intermittent sprint exercise. Journal ofSports Sciences 11, 119–126.
Nevill, M.E., Holmyard, D.J., Hall, G.M., Allsop, P., van Oosterhout, A. & Nevill, A.M. (1996) Growthhormone responses to treadmill sprinting in sprint-and endurance-trained athletes. European Journal ofApplied Physiology 72, 460–467.
Nicholas, C.W., Williams, C., Boobis, L.H. & Little, N. (1994) Effect of ingesting a carbohydrate–electrolyte beverage on muscle glycogen utilizationduring high intensity, intermittent shuttle running(Abstract). Clinical Science 87, 26A.
Nicholas, C.W., Green, P.A., Hawkins, R.D. & Williams,C. (1997) Carbohydrate intake and recovery of inter-mittent running capacity. International Journal of SportNutrition 7, 251–260.
Pascoe, D.D., Costill, D.L., Robergs, R.A., Davis, J.A.,Fink, W.J. & Pearson, D.R. (1990) Effects of exercisemode on muscle glycogen restorage during repeateddays of exercise. Medicine and Science in Sports andExercise 22, 593–598.
Pizza, F.X., Flynn, M.G., Duscha, B.D., Holden, J. &Kubitz, E.R. (1995) A carbohydrate loading regimenimproves high intensity, short duration exercise per-formance. International Journal of Sport Nutrition 5,110–116.
Pugh, L.G.C.E. (1970) Oxygen intake in track and tread-mill running with observations on the effect of airresistance. Journal of Physiology 207, 823–835.
Quercetani, R.L. (1964) A World History of Track and FieldAthletica. Oxford University Press, Oxford.
Radford, P.F. (1990) Sprinting. In Physiology of Sports(ed. T. Reilly, N. Secher, P. Snell & C. Williams), pp.71–99. E and FN Spon, London.
Roberts, A.D., Billeter, R. & Howald, H. (1982) Anaero-bic muscle enzyme changes after interval training.International Journal of Sports Medicine 3, 18–21.
Sahlin, K. (1996) Acid-base balance during high-intensity exercise. In Oxford Textbook of Sports Medi-cine (ed. M. Harries, C. Williams, W.D. Stanish & L.J.Micheli), pp. 46–52. Oxford University Press, NewYork.
Schlicht, W., Naretz, W., Witt, D. & Rieckert, H. (1990)Ammonia and lactate: differential information onmonitoring training load in sprint events. Interna-tional Journal of Sports Medicine 11 (Suppl. 2), S85–S90.
Sharp, R.L., Costill, D.L., Fink, W.J. & King, D.S. (1986)Effects of eight weeks of bicycle ergometer sprinttraining on human muscle buffer capacity. Interna-tional Journal of Sports Medicine 7, 13–17.
Sherman, W.M., Doyle, J.A., Lamb, D.R. & Strauss, R.H.(1993) Dietary carbohydrate, muscle glycogen, and exercise performance during 7 d of training.American Journal of Clinical Nutrition 57, 27–31.
548 sport-specific nutrition
Short, S.H. & Short, W.R. (1983) Four-year study of uni-versity athletes’ dietary intake. Journal of the AmericanDietetic Association 82, 632–645.
Simonsen, J.C., Sherman, W.M., Lamb, D.R., Dernbach,A.R., Doyle, J.A. & Strauss, R. (1991) Dietary carbo-hydrate, muscle glycogen, and power output duringrowing training. Journal of Applied Physiology 70,1500–1505.
Spriet, L.L., Lindinger, M.I., McKelvie, R.S., Heigenhauser, G.J.F. & Jones, N.L. (1989) Muscle glycogenolysis and H+ concentration duringmaximal intermittent cycling. Journal of Applied Physiology 66, 8–13.
Suminski, R.R., Robertson, R.J., Goss, F.L. et al. (1997)Acute effect of amino acid ingestion and resistanceexercise on plasma growth hormone concentrationin young men. International Journal of Sport Nutrition7, 48–60.
Symons, J.D. & Jacobs, I. (1989) High-intensity exerciseperformance is not impaired by low intramuscularglycogen. Medicine and Science in Sports and Exercise21, 550–557.
Trump, M.E., Heigenhauser, G.J.F., Putman, C.T. &Spriet, L.L. (1996) Importance of muscle phospho-creatine during intermittent maximal cycling. Journalof Applied Physiology 80, 1574–1580.
Tullson, P.C. & Terjung, R.L. (1990) Adenine nucleotidedegradation in striated muscle. International Journalof Sports Medicine 11 (Suppl. 2), S47–S55.
Van Der Beek, E.J. (1990) Vitamin supplementation and physical exercise performance. Journal of SportsSciences 9, S77–S89.
Vandenberghe, K., Hespel, P., Vanden Eynde, B.,Lysens, R. & Richter, E.A. (1995) No effect of glyco-gen level on glycogen metabolism during high-intensity exercise. Medicine and Science in Sports andExercise 27, 1278–1283.
Vollestad, N.K., Tabata, I. & Medbo, J.I. (1992) Glycogenbreakdown in different human muscle fibre typesduring exhaustive exercise of short duration. ActaPhysiologica Scandinavica 144, 135–141.
Warren, B.J., Stone, M.H., Kearney, J.T., Fleck, S.J.,Kraemer, W.J. & Johnson, R.L. (1991) The effect ofamino acid supplementation on physiologicalresponses of elite junior weightlifters (Abstract).Medicine and Science in Sports and Exercise 23, S15.
Williams, C. (1993) Carbohydrate needs of elite athletes. In Nutrition and Fitness for Athletes (ed. A.P.Simopoulos & K. Pavlou), pp. 34–60. Karger, NewYork.
Williams, M.H. (1989) Beyond Training: How AthletesEnhance Performance Legally and Illegally. LeisurePress, Champaign, IL.
Williams, M.H. (1993) Dietary supplements, drugs andperformance. In Intermittent High Intensity Exercise:Preparation, Stresses and Damage Limitation (ed.

D.A.D. Macleod, R.J. Maughan, C. Williams, C.R.Madeley, J.C.M. Sharp & R.W. Nutton), pp. 139–158.E and FN Spon, London.
Wootton, S.A. & Williams, C. (1984) Influence of carbo-hydrate status on performance during maximal exercise. International Journal of Sports Medicine 5,126–127.
Yan, Z., Biggs, R.B. & Booth, F.W. (1993) Insulin-like
growth factor immunoreactivity increases in muscleafter acute eccentric contractions. Journal of AppliedPhysiology 74, 410–414.
Yarasheski, K.E., Campbell, J.A., Smith, K., Rennie,M.J., Holloszy, J.O. & Bier, D.M. (1992) Effect ofgrowth-hormone and resistance exercise on musclegrowth in young men. American Journal of Physiology262, E261–E267.
sprinting 549

Introduction
Many athletes steadfastly believe that thereexists a single nutritional ingredient that willsuddenly transform them into world champions.Yet, to the best of our knowledge, the only sub-stances that may confer such advantages to acompetitor are already on the InternationalOlympic Committee’s list of banned substances.But, ever alert to commercial opportunities, mar-keters of nutritional supplements for athletescontinue to make extravagant claims for the performance-enhancing effects of their products.Sports practitioners need to be aware that thereexist few controls to regulate the extent of theclaims that such nutritional companies can makefor the effectiveness of their products. Unlike thepharmaceutical industry, which requires that allproduct claims be substantiated by the results ofcostly, controlled clinical trials, no such control isrequired in the marketing of nutritional supple-ments for sport. It is therefore not surprising tofind that athletes are often confused about theextent to which nutrition can improve performance.
In this review we analyse the scientific basisfor the nutritional practices of athletes, withspecial reference to distance runners. We believethat although nutrition is important for success,it is only part of a balanced approach. AsOlympic gold and silver marathon medallistFrank Shorter has said: ‘You don’t run 5 minutesa mile for 26 miles on good looks and a secretrecipe.’
What do athletes eat and what shouldthey eat during training?
The major nutritional concern for athletes is theexcess energy expended during strenuous train-ing, which, if not matched by an increasedenergy consumption, will inevitably result in areduced training capacity and a drop in perfor-mance. Top-class athletes undergoing strenuoustraining can have daily energy expenditures twoto three times greater than untrained, weight-matched individuals. This greater energy expen-diture may exceed nutritional intake if onlynormal eating patterns are maintained and couldexplain the nibbling patterns of eating amongathletes.
The macronutrient intakes of well-trainedmale and female middle- and long-distancerunners reported in a review of publishedstudies (Hawley et al. 1995a) are summarized inTables 42.1 and 42.2. A mean weighted carbohy-drate (CHO) intake of 48% of total energy con-sumption was reported by both male and femalerunners. However, in contrast to male distancerunners who usually consume sufficient energyto meet daily training requirements, the energyintake of many of the female athletes was lowerthan would be expected, given their workload.Among female athletes, iron, zinc, vitamin B12and calcium intakes were also below the recom-mended daily allowance.
It has long been proposed that the optimumdiet for athletes, especially for endurancerunners, should contain up to 70% of energy
Chapter 42
Distance Running
JOHN A. HAWLEY, ELSKE-JEANNE SCHABORT ANDTIMOTHY D. NOAKES
550
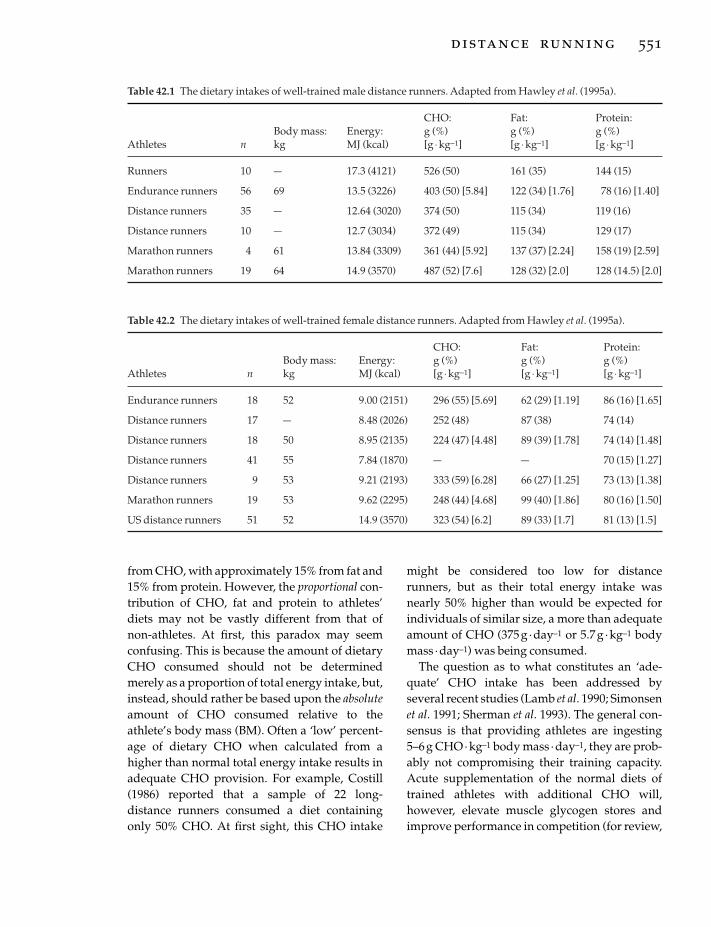
from CHO, with approximately 15% from fat and15% from protein. However, the proportional con-tribution of CHO, fat and protein to athletes’diets may not be vastly different from that ofnon-athletes. At first, this paradox may seemconfusing. This is because the amount of dietaryCHO consumed should not be determinedmerely as a proportion of total energy intake, but,instead, should rather be based upon the absoluteamount of CHO consumed relative to theathlete’s body mass (BM). Often a ‘low’ percent-age of dietary CHO when calculated from ahigher than normal total energy intake results inadequate CHO provision. For example, Costill(1986) reported that a sample of 22 long-distance runners consumed a diet containingonly 50% CHO. At first sight, this CHO intake
might be considered too low for distancerunners, but as their total energy intake wasnearly 50% higher than would be expected forindividuals of similar size, a more than adequateamount of CHO (375g · day–1 or 5.7g ·kg–1 bodymass ·day–1) was being consumed.
The question as to what constitutes an ‘ade-quate’ CHO intake has been addressed byseveral recent studies (Lamb et al. 1990; Simonsenet al. 1991; Sherman et al. 1993). The general con-sensus is that providing athletes are ingesting5–6g CHO · kg–1 body mass · day–1, they are prob-ably not compromising their training capacity.Acute supplementation of the normal diets oftrained athletes with additional CHO will,however, elevate muscle glycogen stores andimprove performance in competition (for review,
distance running 551
Table 42.1 The dietary intakes of well-trained male distance runners. Adapted from Hawley et al. (1995a).
CHO: Fat: Protein:Body mass: Energy: g (%) g (%) g (%)
Athletes n kg MJ (kcal) [g ◊kg-1] [g ◊kg-1] [g ◊kg-1]
Runners 10 — 17.3 (4121) 526 (50) 161 (35) 144 (15)
Endurance runners 56 69 13.5 (3226) 403 (50) [5.84] 122 (34) [1.76] 78 (16) [1.40]
Distance runners 35 — 12.64 (3020) 374 (50) 115 (34) 119 (16)
Distance runners 10 — 12.7 (3034) 372 (49) 115 (34) 129 (17)
Marathon runners 4 61 13.84 (3309) 361 (44) [5.92] 137 (37) [2.24] 158 (19) [2.59]
Marathon runners 19 64 14.9 (3570) 487 (52) [7.6] 128 (32) [2.0] 128 (14.5) [2.0]
Table 42.2 The dietary intakes of well-trained female distance runners. Adapted from Hawley et al. (1995a).
CHO: Fat: Protein:Body mass: Energy: g (%) g (%) g (%)
Athletes n kg MJ (kcal) [g ◊kg-1] [g ◊kg-1] [g ◊kg-1]
Endurance runners 18 52 9.00 (2151) 296 (55) [5.69] 62 (29) [1.19] 86 (16) [1.65]
Distance runners 17 — 8.48 (2026) 252 (48) 87 (38) 74 (14)
Distance runners 18 50 8.95 (2135) 224 (47) [4.48] 89 (39) [1.78] 74 (14) [1.48]
Distance runners 41 55 7.84 (1870) — — 70 (15) [1.27]
Distance runners 9 53 9.21 (2193) 333 (59) [6.28] 66 (27) [1.25] 73 (13) [1.38]
Marathon runners 19 53 9.62 (2295) 248 (44) [4.68] 99 (40) [1.86] 80 (16) [1.50]
US distance runners 51 52 14.9 (3570) 323 (54) [6.2] 89 (33) [1.7] 81 (13) [1.5]
see Hawley et al. 1997b). Further, when an athleterequires rapid recovery from training, a CHOintake of 8–10g · kg–1 body mass ·day–1 isrecommended.
Muscle glycogen stores and the effectof CHO loading on metabolism
The glycogen content of skeletal muscle ofuntrained individuals consuming a mixed diet isaround 80 mmol · kg–1 wet weight muscle. Forindividuals involved in regular endurance training and consuming a similar diet, muscleglycogen content is somewhat higher, at ap-proximately 125mmol ·kg–1 wet weight muscle,although this figure will obviously depend onwhen the measurement was taken in relation tothe last training session. After several days of a high (8 g ·kg–1 body mass) CHO diet and areduction in training, the muscle glycogencontent may be elevated to values around175–200mmol ·kg–1 wet weight. There is someevidence that trained athletes who habituallyconsume a moderate- to high-CHO diet (ª6gCHO· kg–1 body mass ·day–1) do not increasetheir muscle glycogen contents to the sameextent as untrained individuals (Hawley et al.1997a). Indeed, if well-trained athletes consumea moderate- to high-CHO diet, muscle glycogen‘supercompensation’ can occur on a day-to-daybasis. In this respect, Costill et al. (1981) have pre-viously reported that muscle glycogen contentwas not significantly different when trainedrunners consumed either 525 or 650g CHO ·day–1, suggesting that the extent of muscle glyco-gen supercompensation is not further increasedby the ingestion of very large (>600 g ·day–1)quantities of dietary CHO.
The mechanism(s) explaining the ergogeniceffect of CHO loading still needs to be estab-lished. One possibility is that the higher muscleglycogen content may delay the onset of fatigueresulting from muscle glycogen depletion duringexercise. Alternatively, the increased availabilityof muscle glycogen could slow the rate of liverglycogen depletion because it would reduce themuscle’s demand for blood glucose. Liver glyco-
552 sport-specific nutrition
gen sparing would depend on the rate of hepaticglycogenolysis, which seems to be accelerated bya high liver glycogen content after CHO loading.
Effect of carbohydrate loading onrunning performance
The results of studies which have examined theeffects of CHO loading and CHO restriction onrunning performances, are summarized in Tables42.3 and 42.4. Although there are many labora-tory studies which demonstrate a positive rela-tionship between pre-exercise muscle glycogenstores and endurance performance for bothcycling and running (for review, see Hawley et al.1997b), to the best of our knowledge only onestudy has evaluated this effect in the field.Sherman et al. (1981) examined the effects ofeither low-, moderate- or high-CHO diets onmuscle glycogen content and utilization during ahalf-marathon event (20.9km) in six trainedrunners. They found that large differences in pre-exercise muscle glycogen contents of the runnershad no influence on subsequent performance. Infact, running times were generally a bit slowerwhen athletes started the trials with higher levelsof muscle glycogen. Perhaps of physiologicalinterest was that the absolute amount of muscleglycogen left at the end of the three runs wassimilar regardless of the initial muscle glycogencontent.
The results of Sherman et al. (1981) were subse-quently confirmed in the laboratory by Madsenet al. (1990). They reported that 25% higher start-ing muscle glycogen contents did not improvetreadmill run time to exhaustion at 75–80% ofmaximal oxygen uptake (V
.o2max.). In agreement
with the data of Sherman et al. (1981), the totalamount of muscle glycogen utilized during thetwo treadmill runs was similar. Perhaps the most important finding was that at the point of‘exhaustion’, muscle glycogen content was stillrelatively high in all subjects. These studiesstrongly suggest that CHO loading has nobenefit to performance for athletes who partici-pate in moderate-intensity events lasting up to 90 min.

In contrast, there is some evidence to indicatethat elevating pre-exercise muscle glycogen con-tents extend endurance time in events lastinglonger than 90 min (Table 42.4). Evidence for theimportant role of muscle glycogen in continuousendurance exercise also comes from studies ofthe effects of high-CHO diets on running times to fatigue at 70–75% of V
.o2max.. The largest
increases in running endurance were found in aninvestigation by Galbo et al. (1967). In that study,the subjects ingested extreme diets with either alow (10%) or a high (77%) CHO content. Com-pared with the low-CHO diet, the high-CHO diet increased muscle glycogen content by about150% and subsequently extended running timesto exhaustion by approximately 66%.
In addition to increasing running times tofatigue, CHO loading may also improve runningperformance during prolonged exercise in whicha set distance must be covered as quickly as pos-sible (i.e. in a race situation). Karlsson and Saltin(1971) reported that the consumption of a diethigh in CHO for several days before exerciseresulted in improvements of about 6% in race
times during a 30-km event. Interestingly, thetwofold higher starting muscle glycogen con-tents did not increase the initial running speedbut, instead, allowed the athletes to maintain afast race pace for longer. Williams et al. (1992)have also reported a similar finding. Theyobserved that a high-CHO diet before exerciseincreased the speed over the last 5 km of a 30-kmtreadmill running time-trial and improvedoverall performance by approximately 2%.
Fluid and energy replacement duringdistance running
The pioneering studies showing that CHOingested during prolonged exercise couldenhance endurance performance were con-ducted on runners competing in the 1924 and1925 Boston Marathon. The results of these inves-tigations clearly highlighted the importance ofCHO loading before and CHO ingestion duringprolonged, steady-state running. Unfortunatelyfor the athletic community, these findings werecompletely ignored. So too, it seems, were the
distance running 553
Table 42.3 Effects of carbohydrate loading on moderate intensity running lasting 60–90min. Adapted fromHawley et al. (1997b).
Muscle glycogen (mmol ◊kg-1 wet weight)
PerformanceDietary treatment Pre-exercise Postexercise measure Results
A: 3 days LCHO (1.5g ◊kg-1 BM, A: 208±30 A: 102±39 20.9-km run A: 83±15min (n=6M)CHO ◊day-1, then 3 days7.7g ◊kg-1 BM CHO)
B: 3 days HCHO (5.0 g ◊kg-1 BM, B: 203±28 B: 96 ±17 B: 83 ±9minCHO ◊day-1, then 3 days7.7g ◊kg-1 BM CHO)
C: 6 days NORM (5.0g ◊kg-1 BM, C: 159±13 C: 96±28 C: 83±15minCHO ◊day-1)
A: NORM A: 135±28 A: 101±32 Run to exhaustion A: 70±20min (n=3M, 3 F)at 75–80% V.o2max.
B: 3 days 50% CHO B: 168 ±19 B: 129 ±40 B: 77 ±30min3 days 70% HCHO
BM, body mass; F, female; HCHO, high carbohydrate intake; LCHO, low carbohydrate intake; M, male; NORM,normal diet; 1mmol ◊kg-1 wet weight=4.3mmol ◊kg-1 dry weight.All values are mean±SD.

early investigations showing the importance ofadequate fluid replacement during prolongedexercise in the heat. In fact, the earliest referenceto fluid replacement during long-distancerunning is found in the 1953 International
554 sport-specific nutrition
Amateur Athletic Federation (IAAF) Handbookcontrolling marathon events. The handbookstated that ‘refreshments shall only be providedby the organizers of a race after 15 km’, and that‘no refreshments could be carried or taken by a
Table 42.4 Effects of carbohydrate loading on prolonged running lasting longer than 90min. Adapted fromHawley et al. (1997b).
Muscle glycogen (mmol · kg-1 wet weight)
PerformanceDietary treatment Pre-exercise Postexercise measure Results
A: 4 days LCHO (10.5% CHO, 76% fat, A: 45 ± 19 A: 35 ± 21 Run to A: 64 ± 16 min (n = 7 M)13.5% protein) exhaustion at
B: 4 days HCHO (77% CHO, 13.5% protein, B: 112 ± 61 B: 75 ± 19 70% V.o2max B: 106 ± 13 min
9.5% fat)
A: NORM — — Run to A Trial 1: 119 ± 19 minTrial 1: 4.6 ± 1.3 g · kg-1 BM CHO · day-1 exhaustion at (n = 15 M, 15 F)Trial 2: 5.1 ± 1.4 70% V
.o2max Trial 2: 122 ± 22 min
B: COMPLEX CHO B Trial 1: 106 ± 24 minTrial 1: 4.6 ± 1.3 g · kg-1 BM CHO · day-1 Trial 2: 133 ± 46 min*Trial 2: 7.7 ± 1.8
C: SIMPLE CHO C Trial 1: 114 ± 16 minTrial 1: 4.0 ± 0.7 g · kg-1 BM CHO · day-1 Trial 2: 141 ± 27 min*Trial 2: 7.0 ± 1.2
A: 3.5 days 6.1 g · kg-1 BM CHO · day-1 (pasta) A: 103 ± 49 — Run to A: 153 ± 49 min (n = 14 M)B: 3 days 2.4 g · kg-1 BM CHO · day-1 and B: 130 ± 47 exhaustion at B: 169 ± 30 min
depletion exercise, then 3.5 days 75% V.o2max
11.2 g · kg-1 BM CHO · day-1 (pasta)C: 3.5 days 6.3 g · kg-1 BM CHO · day-1 C: 107 ± 32 C: 139 ± 26 min
(beverage)D: 3 days 2.5 g · kg-1 BM CHO · day-1 and D: 150 ± 44 D: 168 ± 27 min†
depletion exercise, then 3.5 days 11.6 g · kg-1 BM CHO · day-1 (beverage)
A: NORM A: 100 ± 39 A: 29 ± 33 30-km A: 143 ± 20 min (n = 10 M)B: HCHO — 3 days no CHO, then 3 days B: 194 ± 66 B: 105 ± 72 running race B: 135.3 ± 18 min
9 g · kg-1 BM CHO · day-1
A: NORM — — 30-km A: Trial 1: 135.3 ± 14.1 minTrial 1: 5 ± 1 g · kg-1 BM CHO · day-1 treadmill run (n = 12 M, 6 F)Trial 2: 7 days 5.4 ± 0.8 Trial 2: 135.3 ± 14.1 min
B: HCHO B: Trial 1: 137.5 ± 16.5 minTrial 1: 5.1 ± 0.8 g · kg-1 BM CHO · day-1 Trial 2: 134.9 ± 16.5 min‡Trial 2: 3 days 8.6 ± 1.3
4 days 6.9 ± 1.2
BM, body mass; F, female; HCHO, high carbohydrate intake; LCHO, low carbohydrate intake; M, male; NORM, normaldiet; 1 mmol · kg-1 wet weight = 4.3 mmol · kg-1 dry weight.All values are mean ± SD.* B2 > B1, C2 > C1 (P < 0.01).† D > C (P < 0.05).‡ 1.9% improvement; increase in speed over last 5 km during Trial 2 (P < 0.001).
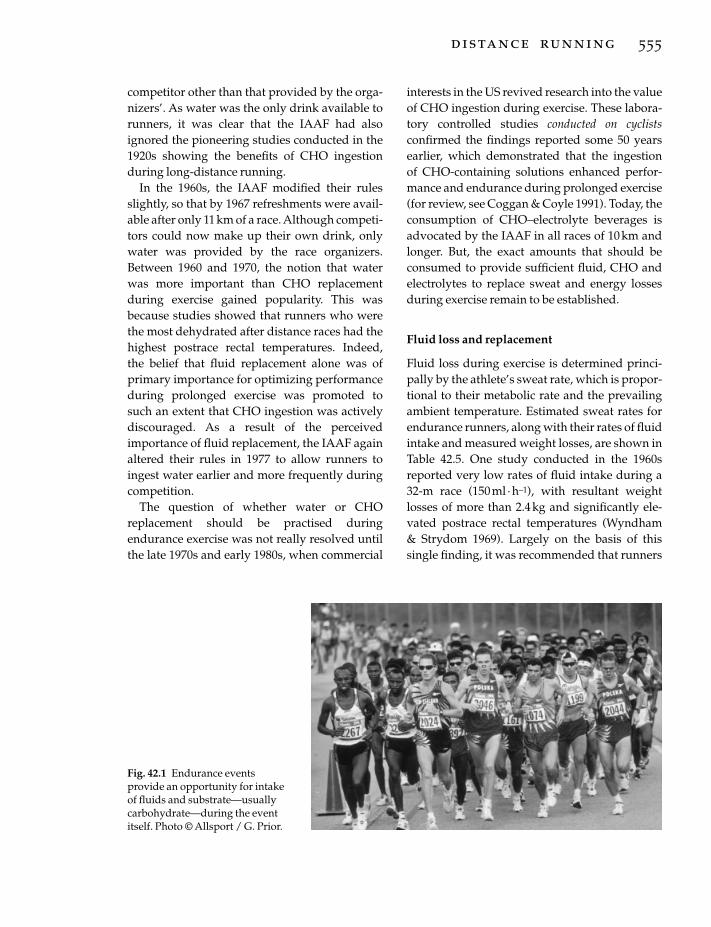
competitor other than that provided by the orga-nizers’. As water was the only drink available torunners, it was clear that the IAAF had alsoignored the pioneering studies conducted in the1920s showing the benefits of CHO ingestionduring long-distance running.
In the 1960s, the IAAF modified their rulesslightly, so that by 1967 refreshments were avail-able after only 11 km of a race. Although competi-tors could now make up their own drink, onlywater was provided by the race organizers.Between 1960 and 1970, the notion that waterwas more important than CHO replacementduring exercise gained popularity. This wasbecause studies showed that runners who werethe most dehydrated after distance races had thehighest postrace rectal temperatures. Indeed, the belief that fluid replacement alone was ofprimary importance for optimizing performanceduring prolonged exercise was promoted to such an extent that CHO ingestion was activelydiscouraged. As a result of the perceived importance of fluid replacement, the IAAF againaltered their rules in 1977 to allow runners toingest water earlier and more frequently duringcompetition.
The question of whether water or CHOreplacement should be practised duringendurance exercise was not really resolved untilthe late 1970s and early 1980s, when commercial
interests in the US revived research into the valueof CHO ingestion during exercise. These labora-tory controlled studies conducted on cyclistsconfirmed the findings reported some 50 yearsearlier, which demonstrated that the ingestion of CHO-containing solutions enhanced perfor-mance and endurance during prolonged exercise(for review, see Coggan & Coyle 1991). Today, theconsumption of CHO–electrolyte beverages isadvocated by the IAAF in all races of 10km andlonger. But, the exact amounts that should beconsumed to provide sufficient fluid, CHO andelectrolytes to replace sweat and energy lossesduring exercise remain to be established.
Fluid loss and replacement
Fluid loss during exercise is determined princi-pally by the athlete’s sweat rate, which is propor-tional to their metabolic rate and the prevailingambient temperature. Estimated sweat rates forendurance runners, along with their rates of fluidintake and measured weight losses, are shown inTable 42.5. One study conducted in the 1960sreported very low rates of fluid intake during a32-m race (150ml ·h–1), with resultant weightlosses of more than 2.4kg and significantly ele-vated postrace rectal temperatures (Wyndham & Strydom 1969). Largely on the basis of thissingle finding, it was recommended that runners
distance running 555
Fig. 42.1 Endurance eventsprovide an opportunity for intakeof fluids and substrate—usuallycarbohydrate—during the eventitself. Photo © Allsport / G. Prior.

needed to drink ‘at least 900ml of fluid per hourduring competition in order not to collapse from heat stroke’ (Wyndham & Strydom 1969).Modern studies show that runners do not volun-tary consume much more than 500 ml · h–1 duringdistance races. In contrast to these moderaterates of fluid intake, sweat rates are invariablyaround 1.0–1.2 l · h–1 during events lasting 2h ormore (for review, see Noakes 1993).
One explanation for the failure of runners tomatch their fluid intake to their fluid lossesduring exercise is that they develop symptoms of ‘fullness’ when they attempt to drink fluid athigh rates. Feelings of abdominal fullness may, inpart, be due to limited rates of fluid absorption,as duodenal and jejunal perfusion studies showthe maximum rate of water absorption occursfrom isotonic solutions containing glucose, andis limited to about 0.8 l ·h–1 (Davies et al. 1980).Similarly, in studies in which sufficient fluid wasingested to match fluid losses during exercise,
556 sport-specific nutrition
not all of the ingested fluid appeared in the extra-cellular or intracellular fluid pools. Thus, themaximum rate of fluid absorption by the smallbowel during exercise may be less than the highrates of fluid loss incurred by some athletesduring more intensive exercise, leading to pro-gressive or ‘involuntary’ dehydration (Noakes1993).
An alternative hypothesis is that man, unlikeother mammals, may develop progressive dehy-dration during exercise because of the sodiumchloride (NaCl) losses in sweat. Large sodiumlosses attenuate the rise in serum osmolalityduring exercise-induced dehydration inhumans, and since thirst is regulated by changesin both serum osmolality and plasma volume,dipsogenic drive in dehydrated humans ceasesbefore either fluid or sodium losses are fullyreplaced. Ingestion of NaCl solutions also termi-nates drinking prematurely by restoring plasmaand extracellular volumes before intracellularfluid losses have been replaced. The practical sig-nificance of this observation is that whetherdehydrated humans drink plain water or NaClsolutions, they tend to stop drinking before theyare fully rehydrated. These complex interactionsmay explain why some humans are unable toprevent the development of ‘involuntary’ dehy-dration during prolonged exercise. Additionally,the rapid alleviation of the symptoms that indi-cate drinking, such as dryness of the mouth, may also cause premature cessation of drinkingbefore full rehydration has occurred.
Carbohydrate ingestion and oxidation during exercise
Runners are often confused as to the optimumfluid replacement regimen to enhance their per-formance. Although the addition of high (>15gper 100ml) concentrations of CHO to fluidreplacement beverages may impair intestinalfluid absorption, inadequate CHO ingestionimpairs performance by limiting the rates ofCHO oxidation late in exercise. Accordingly,recent attention has focused on strategies to opti-
Table 42.5 The rate of fluid loss and fluid ingestionduring various long-distance running races. Adaptedfrom Noakes et al. (1995).
EstimatedRace distance Fluid intake sweat rate Weight loss(km) (l ·h-1) (l ·h-1) (kg)
32 0.15 1.35 2.442* 0.4±0.2 1.1 ±1.1 2.4 ±0.356 0.5 0.9 2.067 0.4 0.8 2.490 0.5 0.85 3.5
The total fluid intake of runners was determined as thesum of their individual intakes, as reported at variousrecording points during the race. Sweat rate wasestimated from the rate of water loss, minus estimatedrespiratory losses. Total weight loss was determined asthe sweat loss, plus metabolic fuel loss plus fluidintake minus urine output.*42-km values are means±SD of the average valuesfrom seven studies on male subjects. Female sweatrates were lower than those for males over distances of 42km (0.6 l ·h-1 vs. 1.1 l ·h-1) and 67km (0.5 l ·h-1 vs.0.8 l ·h-1).
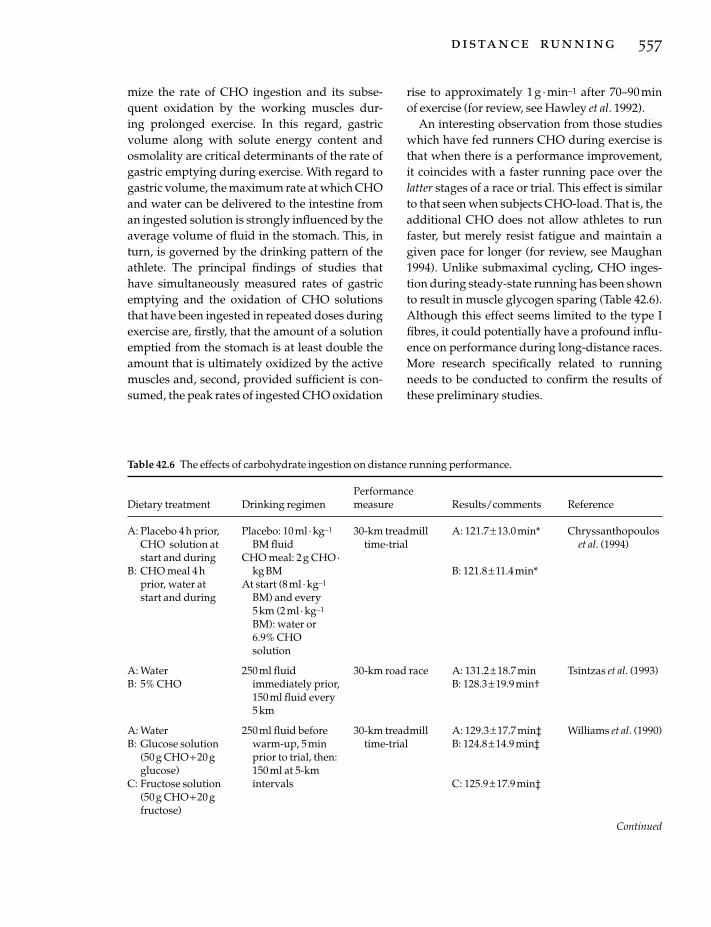
mize the rate of CHO ingestion and its subse-quent oxidation by the working muscles dur-ing prolonged exercise. In this regard, gastricvolume along with solute energy content andosmolality are critical determinants of the rate ofgastric emptying during exercise. With regard togastric volume, the maximum rate at which CHOand water can be delivered to the intestine froman ingested solution is strongly influenced by theaverage volume of fluid in the stomach. This, inturn, is governed by the drinking pattern of theathlete. The principal findings of studies thathave simultaneously measured rates of gastricemptying and the oxidation of CHO solutionsthat have been ingested in repeated doses duringexercise are, firstly, that the amount of a solutionemptied from the stomach is at least double theamount that is ultimately oxidized by the activemuscles and, second, provided sufficient is con-sumed, the peak rates of ingested CHO oxidation
rise to approximately 1g ·min–1 after 70–90minof exercise (for review, see Hawley et al. 1992).
An interesting observation from those studieswhich have fed runners CHO during exercise isthat when there is a performance improvement,it coincides with a faster running pace over thelatter stages of a race or trial. This effect is similarto that seen when subjects CHO-load. That is, theadditional CHO does not allow athletes to runfaster, but merely resist fatigue and maintain agiven pace for longer (for review, see Maughan1994). Unlike submaximal cycling, CHO inges-tion during steady-state running has been shownto result in muscle glycogen sparing (Table 42.6).Although this effect seems limited to the type Ifibres, it could potentially have a profound influ-ence on performance during long-distance races.More research specifically related to runningneeds to be conducted to confirm the results ofthese preliminary studies.
distance running 557
Table 42.6 The effects of carbohydrate ingestion on distance running performance.
PerformanceDietary treatment Drinking regimen measure Results/comments Reference
A: Placebo 4h prior, Placebo: 10ml ·kg-1 30-km treadmill A: 121.7±13.0min* Chryssanthopoulos CHO solution at BM fluid time-trial et al. (1994)start and during CHO meal: 2g CHO·
B: CHO meal 4h kgBM B: 121.8± 11.4min*prior, water at At start (8ml ·kg-1
start and during BM) and every 5km (2ml ·kg-1
BM): water or 6.9% CHO solution
A: Water 250ml fluid 30-km road race A: 131.2±18.7min Tsintzas et al. (1993)B: 5% CHO immediately prior, B: 128.3± 19.9min†
150ml fluid every 5km
A: Water 250ml fluid before 30-km treadmill A: 129.3±17.7min‡ Williams et al. (1990)B: Glucose solution warm-up, 5min time-trial B: 124.8± 14.9min‡
(50g CHO+20g prior to trial, then: glucose) 150ml at 5-km
C: Fructose solution intervals C: 125.9±17.9min‡(50g CHO+20g fructose)
Continued

558 sport-specific nutrition
Table 42.6 Continued.
PerformanceDietary treatment Drinking regimen measure Results/comments Reference
A: Water 200ml fluid at time 2-hour treadmill CHO solution Deuster et al. (1992)B: 7% CHO solution: 0, 30, 60 and run at 60–65% abolished rise in
glucose polymer/ 90min V.o2max. plasma cortisol and
fructose solution decreased exercise-induced rise in FFA
A: Water 5min prior to 60-min treadmill CHO ingestion Tsintzas et al. (1995)B: 5.5% CHO– exercise: 8ml ·kg-1 run at 70% resulted in muscle
electrolyte BM, then: 2ml ·kg-1 V.o2max. glycogen sparing in
solution BM after 20, 40min type I muscle fibres
A: Water 8ml·kg-1 BM CHO Run until A: 109.6±31.8min Tsintzas et al. (1996)B: 5.5% CHO solution ingested exhaustion B: 124.5± 26.6min§
solution prior to exercise, at 70% V.o2max.
C: 6.9% CHO then: 2ml ·kg-1 BM C: 121.4±29.7minsolution ingested at 20-min
intervals during first hour; thereafter, water until exhaustion
A: Placebo 250ml prior to Run until A: 92±27min Wilber and MoffattB: 7% CHO solution exercise and 125ml exhaustion B: 115±25min§ (1992)
(glucose polymer/ at 15-min intervals at 80% V.o2max.
sucrose) during exercise
A: Placebo 200ml 60min before, Run until A: 39.45±11.19min Sasaki et al. (1987)B: Sucrose (81±18g) 250ml prior to the exhaustion B: 58.29± 15.25min||C: Caffeine start, 250ml after at 80% V
.o2max. C: 53.02±9.16min||
(384±13 mg) 45minD: Sucrose (72±22g) D: 56 :58±11 :10min||
and caffeine (396±29mg)
A: No fluid 240ml at 15, 30, 45, Run until A: 56.0±4.39min Macaraeg (1983)B: Water 60 and 75min exhaustion B: 78.25± 4.93min¶C: 5% CHO solution at 85% V
.o2max. C: 102.3±7.28min¶
(glucose polymer and fructose)
A: Placebo 400ml 30min prior 40-km run in the A: 24.4±4.2min Millard-Stafford B: 7% CHO– to exercise and heat: 35km B: 21.9± 2.8min** et al. (1992)
electrolyte drink 250ml at 5-km training pace+intervals during 5km race pacethe run
*Not significant.†B< A (P <0.01).‡Not significant overall; however, significant decrease in running speed (P <0.05) over last 10km of trial A from4.14±0.55 to 3.75±0.86m ·s-1.§B> A (P <0.05).||B, C, D>A (P <0.05).¶B, C>A (P<0.01).**B <A (P <0.03).

Conclusions and recommendationsfor optimal fluid replacement during distance running
The principal aims of fluid ingestion during dis-tance running are to improve performance by:• limiting any dehydration-induced decreasesin plasma volume and skin blood flow;• limiting any rise in serum sodium osmolalityor serum osmolality;• diminishing progressive rises in rectal temperature;• decreasing the subjective perception of effort;and• supplementing endogenous CHO stores.
Although it has been assumed that theoptimum rate of fluid ingestion is the rate thatclosely tracks the rate of fluid loss, the exact com-position of the solution that will optimize elec-trolyte and fluid replacement of the extracellularspace has not been established. Furthermore, therates of fluid ingestion needed to replace the high(> 1 l · h–1) sweat rates typically induced duringprolonged exercise probably exceed the maximalintestinal absorptive capacity for water. Mostrunners will not be able to achieve such fluidintakes without great difficulty. However, fluidconsumption can be maximized during distancerunning by paying careful attention to the tem-perature and palatability of the drink and theaddition of electrolytes, particularly sodium, tothe beverage.
CHO ingestion during distance running is rec-ommended whenever the exercise is of sufficientduration or intensity to deplete endogenousCHO stores. If CHOs are ingested frequentlyenough and in appropriate volumes, it appearsthat, with the exception of fructose:• the type of CHO consumed does not greatlyinfluence the rate of gastric emptying of isoener-getic solutions;• there are no physiologically important differences in the rates of CHO oxidation re-sulting from repeated ingestion of a variety ofmono-, di- and oligosaccharides during exercise;and• all ingested CHOs are oxidized at a maximum
rate of approximately 1 g ·min–1 after the first70–90min of exercise.
The reason for similar peak rates of ingestedCHO oxidation from different CHOs is because,in all likelihood, it is the prevailing concentra-tions of glucose and insulin normally presentduring prolonged, moderate-intensity exercisethat set the upper limit for the rate of glucoseuptake and oxidation by skeletal muscle(Hawley et al. 1995b).
The following practical guidelines are sug-gested for runners participating in prolonged,moderate-intensity exercise of up to 6 h duration:• Immediately before exercise or during thewarm-up, the athlete should ingest up to 5 ml · kg–1 of body mass of cool, flavoured water.• For the first 60–75 min of exercise, the athleteshould ingest 100–150ml of a cool, dilute (3.0–5.0g per 100 ml) glucose polymer solution atregular intervals (10–15min). It seems unwar-ranted to consume CHO in amounts muchgreater than 30 g during this period, as only 20gof ingested CHO are oxidized in the first hour ofmoderate-intensity exercise, irrespective of thetype of CHO consumed or the drinking regimen.• After about 90 min of exercise, the concentra-tion of the ingested solution should be increasedto 7–10g per 100 ml, to which 20 mEq· l–1 ofsodium should be added. Higher sodium con-centrations may not be palatable to most athletes,although they may be beneficial. Potassium,which may facilitate rehydration of the intracel-lular fluid compartment, could also be includedin the replacement beverage in small amounts(2–4 mEq· l–1). For the remainder of the race, theathlete should consume 100–150ml of this solution at regular (10–15min) intervals. Such a drinking regimen will ensure optimal rates of both fluid and energy delivery, thereby limitingany dehydration-induced decreases in plasmavolume, and maintaining the rate of ingestedCHO oxidation at approximately 1g ·min–1 latein exercise.
References
Chryssanthopoulos, C., Williams, C., Wilson, W.,
distance running 559
Asher, L. & Hearne, L. (1994) Comparison betweencarbohydrate feedings before and during exercise onrunning performance during a 30-km treadmill timetrial. International Journal of Sport Nutrition 4, 374–386.
Coggan, A.R. & Coyle, E.F. (1991) Carbohydrate inges-tion during prolonged exercise: effects on meta-bolism and performance. In Exercise and SportsScience Reviews, Vol. 19 (ed. J.O. Holloszy), pp. 1–40.Williams and Wilkins, Baltimore.
Costill, D.L. (1986) Inside Running: Basics of Sports Physi-ology. Benchmark Press, Indianapolis, IN.
Costill, D.L., Sherman, W.M. & Fink, W.J. (1981) Therole of dietary carbohydrates in muscle glycogenresynthesis after strenuous running. Americal Journalof Clinical Nutrition 34, 1831–1836.
Davies, G.R., Santa Ana, C.A., Morawski, S.G. & Ford-tran, J.S. (1980) Development of a solution associatedwith minimal water and electrolyte absorption orsecretion. Gastroenterology 78, 991–995.
Deuster, P.A., Singh, A., Hofmann, A., Moses, F.M. &Chrousos, G.C. (1992) Hormonal responses to ingest-ing water or a carbohydrate beverage during a 2 hrun. Medicine and Science in Sports and Exercise 24,72–79.
Galbo, H., Holst, J. & Christensen, N.J. (1967) The effectof different diets and of insulin on the hormonalresponse to prolonged exercise. Acta PhysiologicaScandinavica 107, 19–32.
Hawley, J.A., Dennis, S.C. & Noakes, T.D. (1992) Oxida-tion of exogenous carbohydrate ingested during pro-longed exercise. Sports Medicine 14, 27–42.
Hawley, J.A., Dennis, S.C., Lindsay, F.H. & Noakes, T.D. (1995a) Nutritional practices of athletes: are they sub-optimal? Journal of Sports Sciences 13, S63-S74.
Hawley, J.A., Dennis, S.C. & Noakes, T.D. (1995b) Carbohydrate, fluid, and electrolyte requirementsduring prolonged exercise. In Sports Nutrition: Minerals and Electrolytes (ed. C.V. Kies & J.A.Driskell), pp. 235–265. CRC Press, Boca Raton, FL.
Hawley, J.A., Palmer, G. & Noakes, T.D. (1997a) Effectof carbohydrate supplementation on muscle glyco-gen content and utilisation during one hour cyclingperformance. European Journal of Applied Physiologyand Occupational Physiology 75, 407–412.
Hawley, J.A., Schabort, E.J., Noakes, T.D. & Dennis, S.C.(1997b) Carbohydrate loading and exercise perfor-mance: an update. Sports Medicine 24, 73–81.
Karlsson, J. & Saltin, B. (1971) Diet, muscle glycogen,and endurance performance. Journal of Applied Physi-ology 31, 203–206.
Lamb, D.R., Rinehardt, K.F., Bartels, R.L., Sherman,W.M. & Snook, J.T. (1990) Dietary carbohydrate andintensity of interval swim training. American Journalof Clinical Nutrition 52, 1058–1063.
560 sport-specific nutrition
Macaraeg, P.V.J. (1983) Influence of carbohydrate elec-trolyte ingestion on running endurance. In NutrientUtilization During Exercise (ed. E.L. Fox), pp. 91–96.Ross Laboratories, Columbus, OH.
Madsen, K., Pedersen, P.K. & Rose, P. (1990) Carbohy-drate supercompensation and muscle glycogen uti-lization during exhaustive running in highly trainedathletes. European Journal of Applied Physiology 61,467–472.
Maughan, R. (1994) Physiology and nutrition formiddle distance and long distance running. In Per-spectives in Exercise Science and Sports Medicine. Vol. 7.Physiology and Nutrition for Competitive Sport (ed. D.R.Lamb, H.G. Knuttgen & R. Murray), pp. 329–364.Cooper Publishing, Carmel, IN.
Millard-Stafford, M.L., Sparling, P.B., Rosskopf, L.B. & Dicarlo, L.J. (1992) Carbohydrate–electrolytereplacement improves distance running perfor-mance in the heat. Medicine and Science in Sport andExercise 24, 934–940.
Noakes, T.D. (1993) Fluid replacement during exercise.In Exercise and Sports Science Reviews, Vol. 21 (ed. J.O.Holloszy), pp. 297–330. Williams and Wilkins, Baltimore.
Noakes, T.D., Hawley, J.A. & Dennis, S.C. (1995) Fluidand energy replacement during prolonged exercise.In Current Issues in Sports Medicine, 3rd edn (ed. R.J. Shephard & J.S. Torg), pp. 571–520. Mosby, Philadelphia.
Sasaki, H., Maeda, J., Usui, S. & Ishiko, T. (1987) Effectof sucrose and caffeine ingestion on performance ofprolonged strenuous running. International Journal ofSports Medicine 8, 261–265.
Sherman, W.M., Costill, D.L. & Fink, W.J. (1981) Theeffect of exercise and diet manipulation on muscleglycogen and its subsequent use during perfor-mance. International Journal of Sports Medicine 2,114–118.
Sherman, W.M., Doyle, J.A., Lamb, D.R. & Strauss, R.H.(1993) Dietary carbohydrate, muscle glycogen andexercise performance during 7 d of training. American Journal of Clinical Nutrition 57, 27–31.
Simonsen, J.C., Sherman, W.M., Lamb, D.R., Dernbach,A.R., Doyle, J.A. & Strauss, R. (1991) Dietary carbo-hydrate, muscle glycogen, and power output duringrowing training. Journal of Applied Physiology 70,1500–1505.
Tsintzas, K., Liu, R., Williams, C., Campbell, I. & Gaitanos, G. (1993) The effect of carbohydrate ingestion on a performance during a 30-km race.International Journal of Sport Nutrition 3, 127–139.
Tsintzas, K., Liu, R., Williams, C., Boobis, L. & Green-haff, P. (1995) Carbohydrate ingestion and glycogenutilization in different fibre types in man. Journal ofPhysiology 489, 243–250.
Tsintzas, K., Williams, C., Wilson, W. & Burrin, J. (1996)

Influence of carbohydrate supplementation early inexercise on endurance running capacity. Medicine andScience in Sports and Exercise 28, 1373–1379.
Wilber, R.L. & Moffatt, R.J. (1992) Influence of carbohy-drate ingestion on blood glucose and performance in runners. International Journal of Sport Nutrition 2,317–327.
Williams, C., Nute, M.G., Broadbank, L. & Vinall, S.(1990) Influence of fluid intake on endurance
running performance. European Journal of AppliedPhysiology 60, 112–119.
Williams, C., Brewer, J. & Walker, M. (1992) The effect ofa high carbohydrate diet on running performanceduring a 30-km treadmill time trial. European Journalof Applied Physiology 65, 18–24.
Wyndham, C.H. & Strydom, N.B. (1969) The danger ofinadequate water intake during marathon running.South African Medical Journal 43, 893–896.
distance running 561

Introduction
Without doubt, cycling is the sport most inten-sively studied by exercise physiologists andsport nutritionists. Christensen and Hansen(1939) were among the first to report the effect ofdifferent diets on cycling performance. Theseearly reports already demonstrated the impor-tance of carbohydrates (CHO) for improving ormaintaining exercise performance. Since then,many studies have investigated the effect ofCHO feedings during cycling, and the role ofCHO after exercise to replenish glycogen storesand improve recovery (see Chapters 5–8). Thischapter will review some of the nutritional habitsof cyclists and will define some recommenda-tions for nutrition during bicycling races orintensive training. Although cycling obviouslyhas many disciplines (including road racing,time trialing, track cycling, mountain biking,BMX), this chapter will focus on road racing andtime trialling.
Energy cost of cycling
Cycling, triathlon and cross-country skiing areamong the sports with the highest reportedenergy turnovers. The levels of energy expendi-ture in these endurance sports have been mea-sured in the field by using doubly labelled water,an accurate technique which allows measure-ments over longer periods (days) in the field(Westerterp et al. 1986). Of particular interest arethe data obtained during the most demanding
cycling race in the world: the Tour de France(Saris et al. 1989). This race has 20 stages and lastsabout 3 weeks in which the riders cover almost4000km. During these 3 weeks, energy expendi-tures of up to 35MJ · day-1 (8300 kcal · day-1) havebeen reported during the long (300km) stages(Saris et al. 1989). Recently, we performed meas-urements of power output during the stages ofthe Tour de France using a power-measuringsystem (SRM Training System, Germany) whichis claimed to be accurate to ± 1%, and to recordand store power data at 1-s intervals (G. Leinders& A.E. Jeukendrup, unpublished findings).These data show that average power outputduring a 6-h stage may be over 240W, whichindicates a very high energy turnover. With anestimated average efficiency of 22%, this repre-sents an energy expenditure of about 24MJ (5700 kcal) during the race itself. In order tomaintain energy balance, a similar amount ofenergy has to be consumed on a daily basis.
Most of the energy intake is derived from CHO(Saris et al. 1989), which is less energy-dense than lipid, and many CHO-rich foods are bulkyand rich in fibre. A high-CHO/high-energy dietentails a large food volume and considerableeating time. Since cyclists in the Tour de Franceare usually on the bike for 4–6h · day–1 and theyavoid eating 1–3h before the start, there is barelytime left to eat the large meals. Besides this,appetite is usually depressed after strenuousexercise. These factors make it very hard to main-tain energy balance on a daily basis.
Studies on energy balance have usually
Chapter 43
Cycling
ASKER E. JEUKENDRUP
562

employed indirect calorimetry or doublylabelled water as techniques to measure energyexpenditure, while energy intake is usually esti-mated by the reported food intakes of athletes.The reported energy intakes, however, displaylarge variation and are susceptible to a number ofmethodological errors. Besides that, there areonly a few studies available in the literaturewhich systematically looked at the food intake ofcyclists. Nevertheless, the few available studiesreport mean energy intakes which are similar to those of other groups of endurance athletesand which range from 15 to 25 MJ ·day-1 (3500–6000kcal · day-1) for male athletes (Erp van-Baartet al. 1989), cyclists in the Tour de France and
Tour de l’Avenir having the highest energyintakes (Table 43.1).
During the Tour de France, mean food in-take was 24.3MJ · day-1 (5800 kcal · day-1) whilethe highest recorded values reached 32.4MJ (7600 kcal) on the days of the long (300 km) stages(Saris et al. 1989). This indicates that the athletesin the Tour de France match their energy expen-ditures quite well with their food intake (Fig.43.1), and they remain weight stable (i.e. main-tain energy balance) during the entire race. Onlyduring the long stages with extremely highenergy expenditures could food intake not com-pletely compensate for the energy expended. Ingeneral, riders in the Tour de France remain
cycling 563
Table 43.1 Daily energy expenditures (EE) and energy intakes (EI) in cyclists.
Race/category EE EI (MJ) Reference
24-h race NR 43.4 Lindeman et al. 1991Race across America NR 35.4 Lindeman et al. 1991Tour de France (peak) 32.7MJ 32.4 Saris et al. 1989Tour de France (mean) 25.4MJ 24.7 Saris et al. 1989Tour de France NR 24.3 Van Erp-Baart et al. 1989Tour de l’Avenir NR 23.3 Van Erp-Baart et al. 1989Amateur cyclists NR 18.3 Van Erp-Baart et al. 1989
NR, not recorded.
40
35
30
25
20
15
12.5Ener
gy
exp
end
itu
re (
MJ)
Ener
gy
inta
ke (
MJ)
Alps
1 2 3 4 6 7 8 9 10 11 12 13 14 15 16 17 18 19 20 21r r r
Day
500 km
35
30
25
20
15
12.5
Fig. 43.1 Daily energyexpenditure (�) and energy intake(�) as measured in a cyclistduring the Tour de France. Theprofile of the race as well as thelength of the stages are indicatedat the bottom of this figure. r, daysof rest. From Saris et al. (1989).

remarkably weight stable (Saris et al. 1989; A.E.Jeukendrup & G. Leinders, unpublished find-ings). Anecdotal evidence suggests that racerswho lose weight may not be able to finish therace.
Brouns and colleagues (Brouns et al. 1989b–d)performed a simulation study in the laboratoryin which the effect of diet manipulation wasstudied in athletes expending 26MJ · day-1
(6200 kcal ·day-1) by exercising for 5h in a respi-ration chamber. Subjects received ad libitum aconventional solid diet with a high carbohydratecontent (62.5% CHO diet) supplemented withwater or the same diet supplemented with a 20%CHO solution (80% CHO diet). Although foodintake was allowed ad libitum in both trials, theCHO supplement enabled the subjects to main-tain their daily energy balance, which they couldnot when supplemented with water. As a conse-quence, exercise performance was improved.These data show that during stage races or multi-ple days of intensive training, energy expendi-ture is very high and CHO-containing drinksmay be required to maintain energy balance incyclists involved in such rigorous programmes,since digestion and absorption of solid meals will be impaired and hunger feelings are sup-pressed during intensive physical exercise(Brouns 1986).
Other reports in the literature regardingenergy intake of cyclists include those of the RaceAcross America, a race from the West coast to theEast coast of the United States (Lindeman 1991).Energy intake in one individual taking part inthis race was 35.4MJ (8429kcal) daily of which78% was derived from CHO. During the prepa-ration, this individual rode a 24-h race where his energy intake was as much as 43.4MJ · day-1
(10 343kcal · day-1) with 75% of the energy fromCHO.
Eating behaviour of cyclists
An important observation from several of theinvestigations which have reported very highenergy intakes in athletes is that a significantamount of the day’s nutrient intake may be con-
564 sport-specific nutrition
sumed while the individual is exercising. Forexample, CHO-rich foods and drinks consumedwhile riding provided nearly 50% of the totalenergy, and 60% of the daily CHO intake ofcyclists competing in the Tour de France stages(Saris et al. 1989). Only by adopting such a nutri-tional regimen do these cyclists maintain energybalance over the 20 days of the Tour de France.Suitable food choices to attain such goals includeconcentrated sports drinks and portable CHO-rich foods such as fruit, confectionery, bread,cakes and sports bars. It has also been reportedthat a large part of the carbohydrates is fromsnacks. These snacks usually contain simple car-bohydrates, a fair amount of fat and little or nomicronutrients, and therefore it has often beenrecommended that riders should replace thesesnacks by fruit and snacks that contain less fatand more micronutrients (Brouns 1986).
Preparing for a race
Athletes involved in prolonged moderate- tohigh (>70% of maximal oxygen uptake) intensityexercise not only have unusually high energyrequirements but they also have greatlyincreased CHO needs. The extra CHO is neces-sary to optimize fuel availability during trainingsessions used, and to promote postexercisemuscle glycogen resynthesis. A well-knownmethod to restore glycogen levels to the pre-exercise level or even above that is known asglycogen loading or glycogen supercompensa-tion.
Glycogen loading
Muscle glycogen depletion and low bloodglucose levels have been shown to be majorfactors in the development of fatigue duringendurance exercise. It is therefore important toensure optimal glycogen storage prior to exerciseand optimal delivery of CHO during exercise.These aspects have been discussed in detail in Chapter 7. Supercompensation protocols as described by Bergström and Hultman(Bergström et al. 1967) and later adapted by
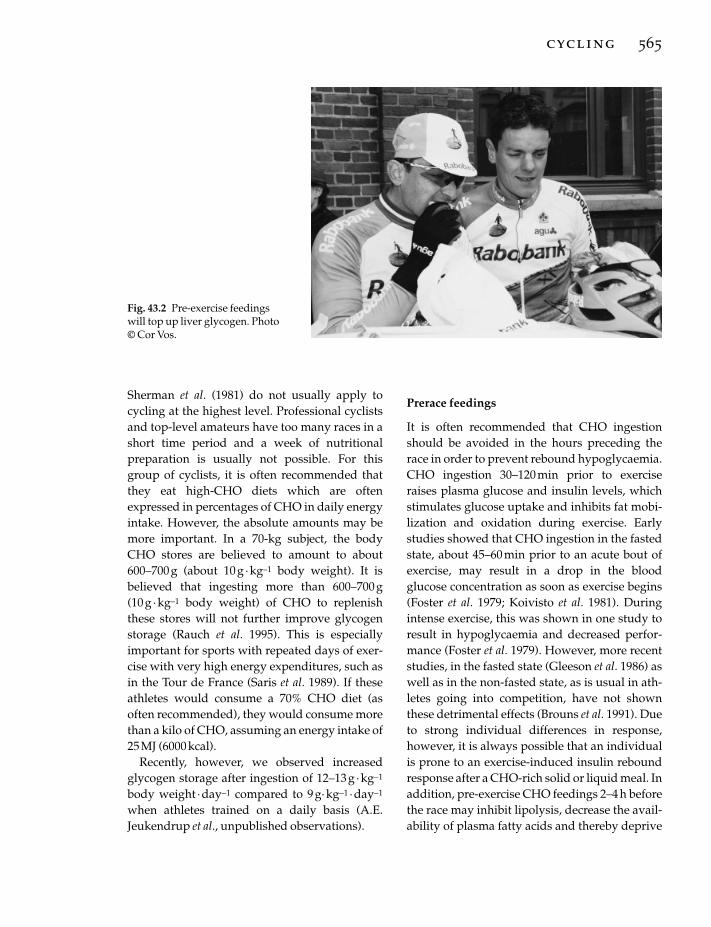
Sherman et al. (1981) do not usually apply tocycling at the highest level. Professional cyclistsand top-level amateurs have too many races in ashort time period and a week of nutritionalpreparation is usually not possible. For thisgroup of cyclists, it is often recommended thatthey eat high-CHO diets which are oftenexpressed in percentages of CHO in daily energyintake. However, the absolute amounts may bemore important. In a 70-kg subject, the bodyCHO stores are believed to amount to about600–700g (about 10g · kg–1 body weight). It isbelieved that ingesting more than 600–700 g (10 g ·kg–1 body weight) of CHO to replenishthese stores will not further improve glycogenstorage (Rauch et al. 1995). This is especiallyimportant for sports with repeated days of exer-cise with very high energy expenditures, such asin the Tour de France (Saris et al. 1989). If theseathletes would consume a 70% CHO diet (asoften recommended), they would consume morethan a kilo of CHO, assuming an energy intake of25MJ (6000 kcal).
Recently, however, we observed increasedglycogen storage after ingestion of 12–13g ·kg-1
body weight ·day-1 compared to 9 g· kg-1 · day-1
when athletes trained on a daily basis (A.E. Jeukendrup et al., unpublished observations).
Prerace feedings
It is often recommended that CHO ingestionshould be avoided in the hours preceding therace in order to prevent rebound hypoglycaemia.CHO ingestion 30–120min prior to exerciseraises plasma glucose and insulin levels, whichstimulates glucose uptake and inhibits fat mobi-lization and oxidation during exercise. Earlystudies showed that CHO ingestion in the fastedstate, about 45–60min prior to an acute bout ofexercise, may result in a drop in the bloodglucose concentration as soon as exercise begins(Foster et al. 1979; Koivisto et al. 1981). Duringintense exercise, this was shown in one study toresult in hypoglycaemia and decreased perfor-mance (Foster et al. 1979). However, more recentstudies, in the fasted state (Gleeson et al. 1986) aswell as in the non-fasted state, as is usual in ath-letes going into competition, have not shownthese detrimental effects (Brouns et al. 1991). Dueto strong individual differences in response,however, it is always possible that an individualis prone to an exercise-induced insulin reboundresponse after a CHO-rich solid or liquid meal. Inaddition, pre-exercise CHO feedings 2–4 h beforethe race may inhibit lipolysis, decrease the avail-ability of plasma fatty acids and thereby deprive
cycling 565
Fig. 43.2 Pre-exercise feedingswill top up liver glycogen. Photo© Cor Vos.

the muscle of substrate. This, in turn, may accel-erate glycogenolysis and increase whole-bodyCHO oxidation. Large pre-exercise CHO feed-ings may compensate for the excess oxidizedCHO by providing sufficient glucose through theblood, whereas small CHO feedings may notprovide sufficient substrate and result in prema-ture glycogen depletion and fatigue. So, pre-exercise CHO feedings should be large enough (> 200g) to provide substrate to the muscle tocompensate for the accelerated glycogen break-down and increased CHO oxidation.
Recommendations for precompetition nutrition
1 Ensure a CHO intake of 10 g · kg–1 bodyweight ·day–1 during the 3 days before the race.This amount of CHO should maximize glycogenstorage.2 Drink plenty of fluids during the days beforethe race, to ensure euhydration at the start. Iflarge sweat losses are to be expected, add a littlesodium (a pinch of salt) to the drinks.3 Avoid food with a high dietary fibre contentduring the days before the competition toprevent gastrointestinal problems.4 Eat a CHO-rich meal 2–4h before the race toreplenish the liver glycogen stores: before shortraces, light digestible CHO foods or energydrinks; before long races, semisolid or solid foodsuch as energy bars and bread. Too much proteinand fat should be avoided since this may slowgastric emptying and may cause gastrointestinaldiscomfort. This meal should contain a fairamount of CHO (> 200g) to compensate for theincreased glycogen breakdown and CHO oxidation.5 Although in general the intake of CHO in thehours before a race does not have adverse effectson performance, some individuals may developrebound hypoglycaemia when ingesting a high-CHO meal or drinks before the race. These individuals should delay eating CHO until thewarming up or 5 min before the race. An oralglucose tolerance test can be used to determinewhich individuals are prone to develop reboundhypoglycaemia.
566 sport-specific nutrition
Nutrition during exercise
Nutrition during exercise longer than 90min
CHO ingestion during exercise has been shownto improve exercise performance in events of90min duration and longer by maintaining highplasma glucose levels and high levels of CHOoxidation. The increased availability of plasmaglucose enables the athlete to postpone fatigue orto develop a higher power output in a final sprintfollowing endurance exercise (Hargreaves et al.1984; Coggan & Coyle 1987, 1988, 1989; Mitchellet al. 1988; Goodpaster et al. 1996). From numer-ous studies, we know that most of the solubleCHO (glucose, maltose, sucrose, glucose poly-mers, soluble starch) are oxidized at similar rates,as reviewed by Hawley et al. (1992), and similarimprovements in cycling performance have beenobserved when ingesting glucose, maltodextrinsor soluble starch (Goodpaster et al. 1996). Excep-tions are fructose, galactose and insoluble starch,which are oxidized at slightly lower rates (Saris etal. 1993; Leijssen et al. 1995) and do not seem tohave the same positive effect on performance(Goodpaster et al. 1996). Therefore, glucose,maltose, sucrose, glucose polymers and solublestarch are all good CHO types to ingest duringexercise. Ingested CHO may be oxidized at ratesup to 1 g ·min–1, which appears to be the maximalexogenous CHO oxidation rate (for review, seeHawley et al. 1992). Recently, we reported thatthe oxidation rate of ingested CHO was similarin well-trained cyclists and untrained individ-uals when they are exercising at the same relativeintensity and same rates of total CHO oxidation(Jeukendrup et al. 1997b). The oxidation of exoge-nous CHO seems related to the amount ingested(up to a certain limit) and the exercise intensityand active muscle mass rather than any othervariables. Its maximal oxidation rate may bedetermined by the absorption rate or by livermetabolism (Jeukendrup 1997; Jeukendrup et al.1999). However, additional research is requiredto study the factors limiting exogenous CHO oxidation. In order to maximize the contributionof oral CHO to total energy expenditure, it maybe advised that 1–1.2 g CHO ·min–1 (60–70 g · h–1)

should be ingested during exercise while slightlyhigher rates of ingestion during the first hourmay speed up the achievement of these highlevels of oxidation. However, ingesting morethan 1.5g · min–1 during exercise may not result in increased exogenous CHO oxidation(Wagenmakers et al. 1993) and increases the riskof gastrointestinal problems.
Most studies of cyclists have shown that CHOingestion does not alter the rate of muscle glycogen breakdown during exercise, althoughduring intermittent exercise glycogen may beresynthesized during the low-intensity cycles(Hargreaves et al. 1984; Kuipers et al. 1986). So themechanism by which CHO ingestion duringcycling improves performance in road races maynot only be maintaining the plasma glucose con-centration, but also the resynthesis of muscleglycogen during periods of low intensity.
Nutrition during high-intensity exercise of about 1h
Although previous studies suggested that CHOfeedings can improve exercise performanceduring exercise of longer than 90 min duration,recent evidence shows that CHO feedings canalso be effective during high-intensity exercise ofshorter duration (60 min) (Anantaraman et al.1995; Below et al. 1995; Jeukendrup et al. 1997a).
We recently found improved time-trial perfor-mance (comparable to a 40-km time trial) in well-trained cyclists when they ingested a carbohydrate–electrolyte solution during exer-cise (75 g of CHO) compared with placebo (Fig.43.3) (Jeukendrup et al. 1997a). Seventeen out of 19 subjects showed improved time-trial perfor-mance, while two athletes displayed a decreasedperformance with the carbohydrate–electrolytesolution. The average power output during thetime trial when the carbohydrate–electrolytesolution was ingested was 298± 10W vs. 291 ±10W with placebo. Although the beneficial effectof the CHO ingestion during high intensity exer-cise of about 1h duration has now been con-firmed by several studies, the mechanism behindthis performance effect remains unclear andcentral effects of glucose on the brain cannot beexcluded at this point (Jeukendrup et al. 1997a).Optimally, athletes should ingest a carbohy-drate–electrolyte solution throughout exercise inorder to maintain a certain volume of fluid in thestomach which will enhance gastric emptying(Rehrer et al. 1990). It has recently been shownthat ingestion of CHO throughout exerciseimproves performance more than ingestion of anidentical amount of CHO late in exercise(McConell et al. 1996). Again, these resultssuggest that CHO ingestion improves perfor-mance through mechanisms other than, or in
cycling 567
68
65
62
60
58
55
Tim
e to
co
mp
lete
wo
rk (
min
)
CEPlaceboPlacebo CE57
58
59
60
61
Tim
e to
co
mp
lete
wo
rk (
min
)
(b)(a)
Fig. 43.3 Ingestion of acarbohydrate–electrolyte (CE)drink reduces time to complete aset amount of work (analogues tocompletion of a 40-km time trial).(a) Individual data of 17 male (�)and 2 female athletes (�); (b) themeans.
addition to, an increased CHO availability to thecontracting muscles.
Medium-chain triacylglycerol ingestion during exercise
Recently it has been suggested that medium-chain triacylglycerol (MCT) ingestion duringcycling exercise may provide an additional fuel,thereby possibly sparing endogenous CHOstores and improving exercise capacity. MCT isderived from coconut oil and contains medium-chain fatty acids which are rapidly absorbed andoxidized (Massicotte et al. 1992; Jeukendrup et al.1995, 1996a). However, despite its rapid metabo-lism, several studies show that ingestion of smallamounts of MCT (25–45g of MCT over the courseof 1–3h) may not be sufficient to alter fat oxida-tion, glycogen breakdown or cycling perfor-mance (Ivy et al. 1980; Jeukendrup et al. 1995,1996a, 1996b, 1998). Larger amounts generallycause gastrointestinal problems and can there-fore not be recommended.
Fluid intake during exercise
Besides CHO, cyclists need to maintain theirwater balance. Exercise-induced dehydrationmay augment hyperthermia and multiplestudies show that prevention of dehydration byfluid ingestion improves performance (seeChapter 16). Dependent on the weather condi-tions, fluid losses may vary from 0.5 to up toalmost 3 l · h–1. Individual fluid loss can be esti-mated from weight loss although this alsoincludes a small amount of weight loss due toglycogen and fat oxidation. During 90 min ofexercise, 100–300 g of glycogen and fat may beoxidized. By regularly monitoring body weightbefore and after training sessions and competi-tions, it is possible to predict the fluid loss in acertain race. However, since the main limitationseems to be the amount of beverage that can betolerated in the gastrointestinal tract, in mostconditions it is advisable to drink as much as pos-sible. Completely compensating for sweat lossby fluid consumption may not always be pos-
568 sport-specific nutrition
sible because sweat losses may exceed 2 l · h–1 andingestion of such amounts cannot be tolerated bythe gastrointestinal tract. Observations in profes-sional cyclists during the Mediterranean Tour inFrance and the Ruta del Sol in Spain show thatriders lose about 2.1–4.5kg during a 4–5-h stage,indicating that even cyclists who are well awareof the importance of drinking cannot drink suf-ficiently during a race (G. Leinders & A.E. Jeukendrup, unpublished findings). Therefore,fluid and CHO consumption is usually limitedby the practical situation and by the amount ofdrink that can be tolerated after ingestion. Thishighlights the importance of making ‘drinkingduring exercise’ a part of the regular trainingprogramme.
Also during high-intensity exercise of about 1h duration, water seems to be beneficial to per-formance. Below et al. (1995) showed that wateringestion, independently of CHO, improvedtime-trial performance (time trial of about 10minduration after 50min at 80% V
.o2max.), while
the CHO and water had an additive effect on performance.
Palatability of drinks and food is a very impor-tant aspect because it will stimulate consumptionand with it increase the intake of fluid and CHO.In addition, taste and flavour perception mayalso influence the rate of gastric emptying. Disliked flavour or aroma may slow gastric emptying and may even cause nausea.
Nutrition during exercise: some observationsin professional cyclists
In general, professional cyclists tend to eat solidfood during the first hours of their stages, usuallyconsisting of chunks of banana, apple, whitebread with jamor rice cakes. The pace during thefirst hours is usually slow and there is plenty oftime to digest the solid food. As soon as the speedincreases, the cyclists switch to fluid ingestionand solid food will only be eaten when the speeddrastically drops or their stomachs feel empty.Since they have only two bottles on their bike,usually containing 0.5 l each, they have to getnew bottles regularly during the race. Profes-

sional cyclists often receive their new bottlesfrom the team director in the car behind the pack.One or two riders of the team will go to the carand bring bottles for the whole team. Also theyusually have the opportunity to get additionalbottles at the feeding zone (2–4 h into the race). Atthese feeding zones the athletes will receive alittle bag containing one or two bottles of fluidand some solid food in case they get hungry orget an empty feeling in their stomach (Fig. 43.4).Often riders will take the bottles and throw awaythe solid food.
Recommendations for nutrition during exercise
1 During intense exercise lasting 45min ormore, a CHO solution should be ingested. Thismay improve performance by reducing/delay-ing fatigue.
2 Consume 60–70 g CHO· h–1 of exercise. Thiscan be optimally combined with fluid in quanti-ties related to needs determined by environ-mental conditions, individual sweat rate andgastrointestinal tolerance.
3 During exercise of up to 30–45 min duration,there appears to be little need to consume CHO.
4 The type of soluble CHO (glucose, sucrose,glucose polymer, etc.) does not make much dif-
ference when ingested in low to moderate quan-tities. Fructose and galactose are less effective.
5 Athletes should consume CHO beveragesthroughout exercise, rather than only water earlyin exercise followed by a CHO beverage late inexercise.
6 Avoid drinks extremely high in CHO and/or osmolality (>15–20% CHO) because fluiddelivery will be hampered and gastrointestinalproblems may occur.
7 Try to predict the fluid loss during enduranceevents of more than 90 min. The amount of fluidto be ingested should in principle equal the pre-dicted fluid loss. In warm weather conditionswith low humidity, athletes have to drink moreand the drinks can be more dilute. In coldweather conditions, athletes will drink onlysmall amounts and drinks have to be more concentrated.
8 Large drink volumes stimulate gastric emp-tying more than small volumes. Therefore, it is recommended to ingest a fluid volume of 6–8ml · kg–1 body weight 3–5min prior to the startto ‘prime’ the stomach, followed by smallervolumes (2–3ml · kg–1 body weight) every 15–20min.
9 The volume of fluid that athletes can ingest isusually limited. Athletes should ‘learn’ to drinkduring exercise. This aspect can be trained.
cycling 569
Fig. 43.4 Feeding zone wherebags with solid and liquid foodare given to the riders. Photo ©Cor Vos.

10 After drinking a lot, the stomach may feelempty and uncomfortable. In this case it may bewise to eat some light digestible solid food(CHO). During long, low-intensity races, solidfood can be eaten also in the first phase of therace.11 Factors such as fibre content, protein content,high osmolality and high CHO concentrationshave been associated with the development ofgastrointestinal symptoms during exercise, andthus should be avoided during exercise.
Nutrition after exercise
Quick recovery is an extremely important aspectof training and frequent competitions. Especiallyduring repeated days of training or in stageraces, it is important to recover as quickly as pos-sible. Dietary measures have been shown toinfluence recovery significantly. The restorationof muscle glycogen stores and fluid balance afterheavy training or competition is probably themost important factor determining the timeneeded to recover. The rate at which glycogencan be formed (synthesized) is dependent onseveral factors:1 The quantitative CHO ingestion.
570 sport-specific nutrition
2 The type of CHO.3 The timing of CHO ingestion after exercise.4 Coingestion of other nutrients.
Amount of CHO ingestion
The quantity of CHO is by far the most importantfactor determining the rate of glycogen resynthe-sis. In studies, it appeared that the muscle glyco-gen resynthesis rate of 50 g CHO ingested every 2h was double that of 25 g CHO ingested every 2h (Blom et al. 1987; Ivy et al. 1988b). When morethan 50g was ingested (100–225 g), muscle glyco-gen storage did not further increase (Blom et al.1987; Ivy et al. 1988b). Thus, 50 g in 2 h (or 25g · h–1) appears to result in a maximum rate of postexercise muscle glycogen resynthesis. Frequent small meals do not appear to have anadvantage over a few large meals.
Type of CHO
To optimally restore glycogen levels after exer-cise, a source of CHO which is easily digestedand absorbed is needed. The rate of absorption of a certain CHO is reflected by the glycaemicindex. Foods with a moderate to high glycaemic
Fig. 43.5 Rehydration andcarbohydrate loading startimmediately after the race. Photo© Cor Vos.

index enter the bloodstream relatively rapidly,resulting in a high rate of glycogen storage.Foods with a low glycaemic index enter thebloodstream slowly and result in a lower rate ofglycogen resynthesis. Therefore it is recom-mended that low glycaemic index foods shouldnot comprise the bulk of CHO after exercisewhen a quick recovery is required.
Timing of CHO intake
During the first hours following exercise, glyco-gen resynthesis proceeds at a somewhat higherrate than later on (Ivy et al. 1988a). Therefore, incases of short recovery times, CHO intake shouldtake place immediately after exercise. Althoughthis can maximize the rate of glycogen resynthe-sis in the early phase, the full process of glycogenstorage still takes considerable time. Dependingon the degree of glycogen depletion and the type of meals consumed, it may take 10–36h torefill the glycogen stores to pre-exercise values.Therefore, it is impossible to perform two ormore workouts per day without affecting theinitial glycogen stores. Even when CHO intakebetween training bouts or competitions is veryhigh, the muscle glycogen levels will be subopti-mal when the next activity is started within 8–16h.
The rate at which fluid balance can be restoreddepends on (i) the quantity of fluid consumedand (ii) the composition of the fluid, especiallythe sodium content. Recent studies show that the postexercise fluid retention approximates50% when the fluid that is consumed is low insodium. This is the case with most tap andmineral waters as well as fruit juices. After theconsumption of carbohydrate–electrolyte solu-tions containing 25–100 mmol · l–1 sodium, thewater retention may be as high as 70–80%(Maughan & Leiper 1995; Shirreffs et al. 1996).From these findings, it can also be concludedthat, in order to restore fluid balance, the postex-ercise fluid consumption must be considerablyhigher (150–200%) than the amount of fluid lostas sweat.
Practical considerations
Usually, appetite is suppressed after exercise andthere is a preference for drinking fluids ratherthan eating a meal. Therefore, beverages whichcontain high-glycaemic-index CHO sources insufficient quantity (6 g ·100 ml–1 or more) shouldbe made available.
If preferred, the athlete may also ingest easily digestible solid CHO-rich food such asripe banana, rice cake and sweets. When thedesire for normal meals returns, approximately10g CHO · kg–1 body weight of moderate- tohigh-glycaemic-index CHO sources should beeaten within 24 h. This can easily be realized byconsuming foods that are low in fat. For practicalreasons, a certain amount of low-glycaemic CHOcannot be excluded from the diet.
Sleeping hours interrupt the feeding possibili-ties. Therefore, it is recommended to ingest anamount of CHO prior to sleeping which is suffi-cient to supply the required 25 g ·h–1 (e.g. 250gfor a 10-h period).
Guidelines for postexercise nutrition
1 To maximize glycogen storage, it is recom-mended to ingest 100g CHO during the first 2hafter exercise in the form of liquids or easilydigestible solid or semisolid meals. In total,about 10g CHO ·kg–1 body weight should beeaten within 24 h, with two thirds of this prefer-ably as high glycaemic index foods.2 It is recommended to consume CHO sourceswith moderate to high glycaemic index to hastenrecovery.3 Addition of 25–100mmol · l–1 sodium to post-exercise rehydration beverages improves fluidretention and the recovery of fluid balance.
Acknowledgements
The author would like to thank Dr G. Leindersand the Rabobank professional cycling team fortheir friendly co-operation.
cycling 571

References
Anantaraman, R., Carmines, A.A., Gaesser, G.A. &Weltman, A. (1995) Effects of carbohydrate supple-mentation on performance during 1 h of high inten-sity exercise. International Journal of Sports Medicine16, 461–465.
Below, P.R., Mora-Rodríguez, R., Gonzáles Alonso, J. &Coyle, E.F. (1995) Fluid and carbohydrate ingestionindependently improve performance during 1 h ofintense exercise. Medicine and Science in Sports andExercise 27, 200–210.
Bergström, J., Hermansen, L., Hultman, E. & Saltin, B.(1967) Diet, muscle glycogen and physical perfor-mance. Acta Physiologica Scandinavica 71, 140–150.
Blom, P.C.S., Høstmark, A.T., Vaage, O., Kardel, K.R. &Maehlum, S. (1987) Effect of different post-exercisesugar diets on the rate of muscle glycogen resynthe-sis. Medicine and Science in Sports and Exercise 19,491–496.
Brouns, F. (1986) Dietary problems in the case of strenu-ous exertion. Journal of Sports Medicine and PhysicalFitness 26, 306–319.
Brouns, F., Rehrer, N.J., Saris, W.H.M., Beckers, E., Menheere, P. & ten Hoor, F. (1989a) Effect of carbohy-drate intake during warming up on the regulation ofblood glucose during exercise. International Journal ofSports Medicine 10, S68–S75.
Brouns, F., Saris, W.H.M., Beckers, E. et al. (1989b)Metabolic changes induced by sustained exhaustivecycling and diet manipulation. International Journal ofSports Medicine 10, S49–S62.
Brouns, F., Saris, W.H.M., Stroecken, J. et al. (1989c)Eating, drinking, and cycling: a controlled Tour deFrance simulation study. Part I. International Journalof Sports Medicine 10, S32–S40.
Brouns, F., Saris, W.H.M., Stroecken, J. et al. (1989d)Eating, drinking, and cycling: a controlled Tour deFrance simulation study. Part II. Effect of diet ma-nipulation. International Journal of Sports Medicine 10,S41–S48.
Brouns, F., Rehrer, N.J., Beckers, E., Saris, W.H.M., Menheere, P. & ten Hoor, F. (1991) Reaktive hypo-glykamie. Deutsche Zeitschrift fuer Sportmedizin 42,188–200.
Christensen, E.H. & Hansen, O. (1939) Arbeitsfahigkeitund ernahrung. Scandinavian Archives of Physiology81, 160–171.
Coggan, A.R. & Coyle, E.F. (1987) Reversal of fatigueduring prolonged exercise by carbohydrate infusionor ingestion. Journal of Applied Physiology 63,2388–2395.
Coggan, A.R. & Coyle, E.F. (1988) Effect of carbohy-drate feedings during high-intensity exercise. Journalof Applied Physiology 65, 1703–1709.
572 sport-specific nutrition
Coggan, A.R. & Coyle, E.F. (1989) Metabolism and per-formance following carbohydrate ingestion late inexercise. Medicine and Science in Sports and Exercise 21,59–65.
Coyle, E.F. & Coggan, A.R. (1984) Effectiveness of carbohydrate feeding in delaying fatigue during prolonged exercise. Sports Medicine 1, 446–458.
Erp van-Baart, A.M.J., Saris, W.H.M., Binkhorst, R.A.,Vos, J.A. & Elvers, J.W.H. (1989) Nationwide surveyon nutritional habits in elite athletes. Part I. Energycarbohydrate, protein. International Journal of SportsMedicine 10, S3–S10.
Foster, C., Costill, D.L. & Fink, W.J. (1979) Effects of preexercise feedings on endurance performance.Medicine and Science in Sports and Exercise 11, 1–5.
Gleeson, M., Maughan, R.J. & Greenhaff, P.L. (1986)Comparison of the effects of pre-exercise feeding ofglucose, glycerol and placebo on endurance and fuelhomeostasis in man. European Journal of Applied Physiology 55, 645–653.
Goodpaster, B.H., Costill, D.L., Fink, W.J. et al. (1996)The effects of pre-exercise starch ingestion onendurance performance. International Journal ofSports Medicine 17, 366–372.
Hargreaves, M., Costill, D.L., Coggan, A., Fink, W.J. &Nishibata, I. (1984) Effect of carbohydrate feedingson muscle glycogen utilisation and exercise perfor-mance. Medicine and Science in Sports and Exercise 16,219–222.
Hawley, J.A., Dennis, S.C. & Noakes, T.D. (1992) Oxidation of carbohydrate ingested during pro-longed endurance exercise. Sports Medicine 14, 27–42.
Ivy, J.L., Costill, D.L., Fink, W.J. & Maglischo, E. (1980)Contribution of medium and long chain triglycerideintake to energy metabolism during prolonged exer-cise. International Journal of Sports Medicine 1, 15–20.
Ivy, J.L., Katz, A.L., Cutler, C.L., Sherman, W.M. &Coyle, E.F. (1988a) Muscle glycogen synthesis afterexercise: effect of time of carbohydrate ingestion.Journal of Applied Physiology 64, 1480–1485.
Ivy, J.L., Lee, M.C., Brozinick, J.T. & Reed, M.J. (1988b)Muscle glycogen storage after different amounts ofcarbohydrate ingestion. Journal of Applied Physiology65, 2018–2023.
Jeukendrup, A. (1997) Aspects of Carbohydrate and FatMetabolism during Exercise. De Vrieseborch, Haarlem.
Jeukendrup, A.E., Saris, W.H.M., Schrauwen, P.,Brouns, F. & Wagenmakers, A.J.M. (1995) Metabolicavailability of medium chain triglycerides co-ingested with carbohydrates during prolonged exercise. Journal of Applied Physiology 79, 756–762.
Jeukendrup, A.E., Saris, W.H.M., Van Diesen, R.,Brouns, F. & Wagenmakers, A.J.M. (1996a) Effect of endogenous carbohydrate availability on oralmedium-chain triglyceride oxidation during pro-
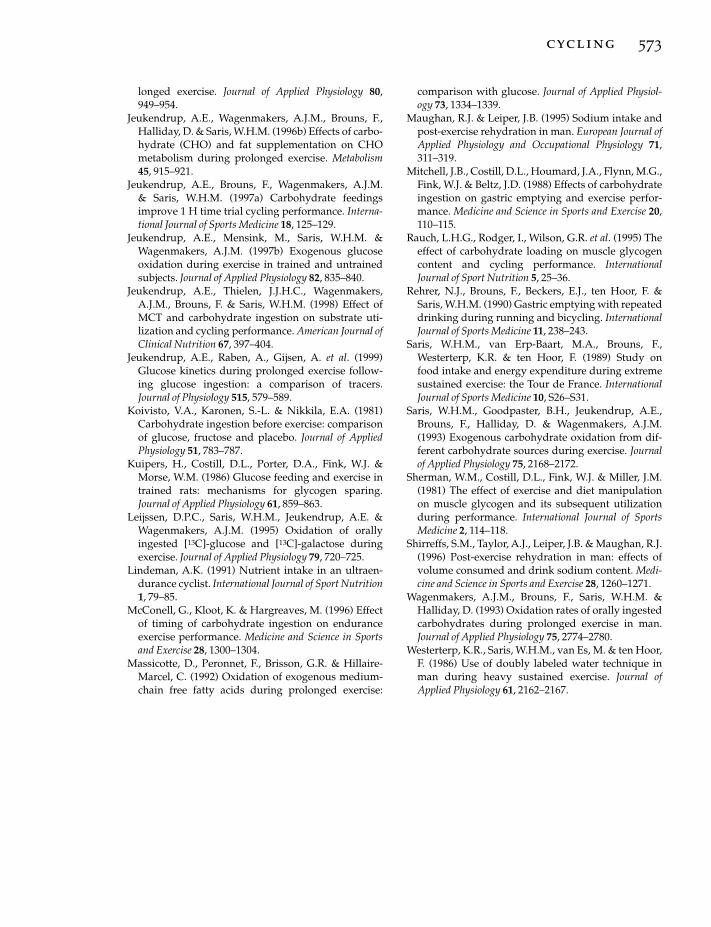
longed exercise. Journal of Applied Physiology 80,949–954.
Jeukendrup, A.E., Wagenmakers, A.J.M., Brouns, F.,Halliday, D. & Saris, W.H.M. (1996b) Effects of carbo-hydrate (CHO) and fat supplementation on CHOmetabolism during prolonged exercise. Metabolism45, 915–921.
Jeukendrup, A.E., Brouns, F., Wagenmakers, A.J.M. & Saris, W.H.M. (1997a) Carbohydrate feedingsimprove 1 H time trial cycling performance. Interna-tional Journal of Sports Medicine 18, 125–129.
Jeukendrup, A.E., Mensink, M., Saris, W.H.M. &Wagenmakers, A.J.M. (1997b) Exogenous glucoseoxidation during exercise in trained and untrainedsubjects. Journal of Applied Physiology 82, 835–840.
Jeukendrup, A.E., Thielen, J.J.H.C., Wagenmakers,A.J.M., Brouns, F. & Saris, W.H.M. (1998) Effect ofMCT and carbohydrate ingestion on substrate uti-lization and cycling performance. American Journal ofClinical Nutrition 67, 397–404.
Jeukendrup, A.E., Raben, A., Gijsen, A. et al. (1999)Glucose kinetics during prolonged exercise follow-ing glucose ingestion: a comparison of tracers.Journal of Physiology 515, 579–589.
Koivisto, V.A., Karonen, S.-L. & Nikkila, E.A. (1981)Carbohydrate ingestion before exercise: comparisonof glucose, fructose and placebo. Journal of AppliedPhysiology 51, 783–787.
Kuipers, H., Costill, D.L., Porter, D.A., Fink, W.J. &Morse, W.M. (1986) Glucose feeding and exercise intrained rats: mechanisms for glycogen sparing.Journal of Applied Physiology 61, 859–863.
Leijssen, D.P.C., Saris, W.H.M., Jeukendrup, A.E. &Wagenmakers, A.J.M. (1995) Oxidation of orallyingested [13C]-glucose and [13C]-galactose duringexercise. Journal of Applied Physiology 79, 720–725.
Lindeman, A.K. (1991) Nutrient intake in an ultraen-durance cyclist. International Journal of Sport Nutrition1, 79–85.
McConell, G., Kloot, K. & Hargreaves, M. (1996) Effectof timing of carbohydrate ingestion on enduranceexercise performance. Medicine and Science in Sportsand Exercise 28, 1300–1304.
Massicotte, D., Peronnet, F., Brisson, G.R. & Hillaire-Marcel, C. (1992) Oxidation of exogenous medium-chain free fatty acids during prolonged exercise:
comparison with glucose. Journal of Applied Physiol-ogy 73, 1334–1339.
Maughan, R.J. & Leiper, J.B. (1995) Sodium intake andpost-exercise rehydration in man. European Journal ofApplied Physiology and Occupational Physiology 71,311–319.
Mitchell, J.B., Costill, D.L., Houmard, J.A., Flynn, M.G.,Fink, W.J. & Beltz, J.D. (1988) Effects of carbohydrateingestion on gastric emptying and exercise perfor-mance. Medicine and Science in Sports and Exercise 20,110–115.
Rauch, L.H.G., Rodger, I., Wilson, G.R. et al. (1995) Theeffect of carbohydrate loading on muscle glycogencontent and cycling performance. InternationalJournal of Sport Nutrition 5, 25–36.
Rehrer, N.J., Brouns, F., Beckers, E.J., ten Hoor, F. &Saris, W.H.M. (1990) Gastric emptying with repeateddrinking during running and bicycling. InternationalJournal of Sports Medicine 11, 238–243.
Saris, W.H.M., van Erp-Baart, M.A., Brouns, F., Westerterp, K.R. & ten Hoor, F. (1989) Study on food intake and energy expenditure during extremesustained exercise: the Tour de France. InternationalJournal of Sports Medicine 10, S26–S31.
Saris, W.H.M., Goodpaster, B.H., Jeukendrup, A.E.,Brouns, F., Halliday, D. & Wagenmakers, A.J.M.(1993) Exogenous carbohydrate oxidation from dif-ferent carbohydrate sources during exercise. Journalof Applied Physiology 75, 2168–2172.
Sherman, W.M., Costill, D.L., Fink, W.J. & Miller, J.M.(1981) The effect of exercise and diet manipulationon muscle glycogen and its subsequent utilizationduring performance. International Journal of SportsMedicine 2, 114–118.
Shirreffs, S.M., Taylor, A.J., Leiper, J.B. & Maughan, R.J.(1996) Post-exercise rehydration in man: effects ofvolume consumed and drink sodium content. Medi-cine and Science in Sports and Exercise 28, 1260–1271.
Wagenmakers, A.J.M., Brouns, F., Saris, W.H.M. & Halliday, D. (1993) Oxidation rates of orally ingestedcarbohydrates during prolonged exercise in man.Journal of Applied Physiology 75, 2774–2780.
Westerterp, K.R., Saris, W.H.M., van Es, M. & ten Hoor,F. (1986) Use of doubly labeled water technique inman during heavy sustained exercise. Journal ofApplied Physiology 61, 2162–2167.
cycling 573

Introduction
In determining proper nutritional recommenda-tions in a sport discipline, it is important to assessthe requirements of the sport and determinewhether substrate availability may limit perfor-mance. In team sports such as basketball, rugby,soccer, hockey, ice-hockey, volleyball and teamhandball, the players perform many differenttypes of exercise. The intensity can alter at anytime and range from standing still to sprinting(Fig. 44.1). This is in contrast to sports disciplinessuch as a 100-m sprint and a marathon run, inwhich during the entire event continuous exer-cise is performed at a very high or at a moderateintensity, respectively. Due to the intermittentnature of team sports, performance may not onlybe impaired toward the end of a match, but alsoafter periods of intense exercise. Both types of fatigue might be related to the metabolicprocesses that occur during match-play. There-fore, before discussing the diet of athletes in teamsports, energy provision and substrate utiliza-tion during intermittent exercise and in teamsports will be considered.
Energy production and substrateutilization in team sports
In most team sports, the exercise performed isintermittent. It is therefore important to knowhow metabolism and performance during anexercise bout are influenced by previous exercise.Through the years, this has been investigated
systematically by changing one of the variablesat a time. Such studies form the basis for under-standing the physiology of intermittent exercise.It has to be recognized, however, that in most la-boratory studies the variations in exercise inten-sity and duration are regular, whereas in manyintermittent sports the changes in exercise inten-sity are irregular and can be almost random.
Anaerobic energy production
In one study, subjects performed intermittentcycle exercise for 1h, alternating 15 s rest and 15sof exercise at a work rate that for continuouscycling demanded maximum oxygen uptake(Essen et al. 1977). Considerable fluctuations inmuscle levels of adenosine triphosphate (ATP)and phosphocreatine (PCr) occurred. The PCrconcentration after an exercise period was 40% ofthe resting level, and it increased to about 70% ofthe initial level in the subsequent 15-s recoveryperiod, whereas the increase in muscle lactatewas low.
Also during competition in team sports, thePCr concentration probably alternates continu-ously as a result of the intermittent nature of thegame. Figure 44.2 shows an example of the fluc-tuations of PCr determined by nuclear magneticresonance (NMR) during three 2-min intermit-tent exercise periods that each included shortmaximal contractions, low-intensity contractionsand rest. A pronounced decrease of PCr wasobserved during the maximal contractions, but italmost reached pre-exercise value at the end of
Chapter 44
Team Sports
JENS BANGSBO
574
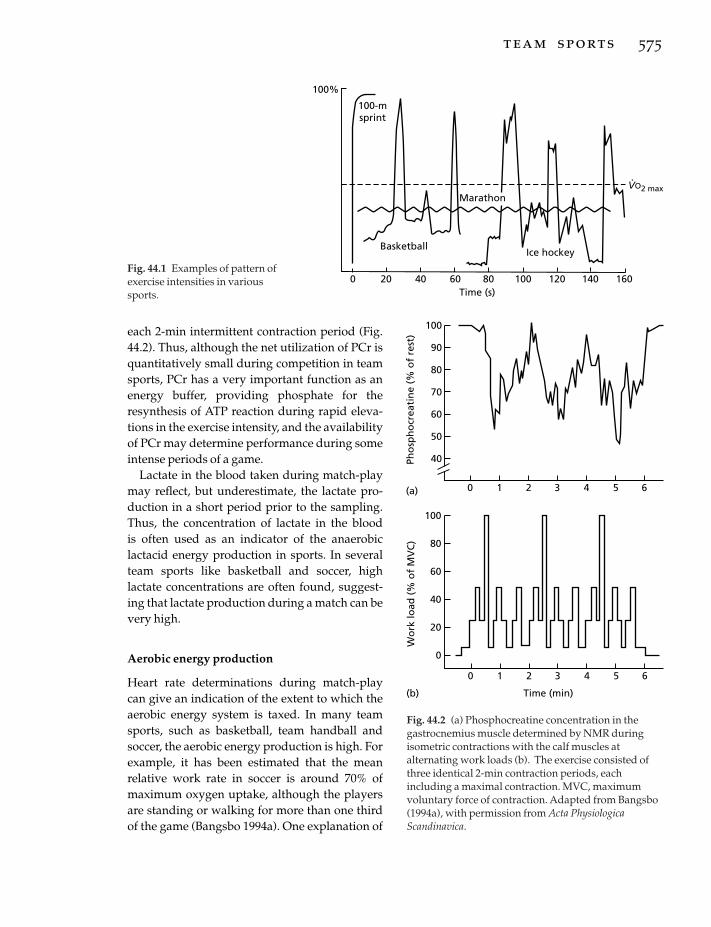
each 2-min intermittent contraction period (Fig.44.2). Thus, although the net utilization of PCr isquantitatively small during competition in teamsports, PCr has a very important function as anenergy buffer, providing phosphate for theresynthesis of ATP reaction during rapid eleva-tions in the exercise intensity, and the availabilityof PCr may determine performance during someintense periods of a game.
Lactate in the blood taken during match-playmay reflect, but underestimate, the lactate pro-duction in a short period prior to the sampling.Thus, the concentration of lactate in the blood is often used as an indicator of the anaerobiclactacid energy production in sports. In severalteam sports like basketball and soccer, highlactate concentrations are often found, suggest-ing that lactate production during a match can bevery high.
Aerobic energy production
Heart rate determinations during match-playcan give an indication of the extent to which theaerobic energy system is taxed. In many teamsports, such as basketball, team handball andsoccer, the aerobic energy production is high. Forexample, it has been estimated that the mean relative work rate in soccer is around 70% ofmaximum oxygen uptake, although the playersare standing or walking for more than one thirdof the game (Bangsbo 1994a). One explanation of
team sports 575
100-msprint
VO2 max
Basketball
Marathon
Ice hockey
Time (s)
.
100%
0 20 40 60 80 100 120 140 160Fig. 44.1 Examples of pattern ofexercise intensities in varioussports.
(a)
100
90
80
70
60
50
40
100
80
60
40
20
0
0 1 2 3 4 5 6
Time (min)(b)
Pho
sph
ocr
eati
ne
(% o
f re
st)
Wo
rk lo
ad (
% o
f M
VC
)
0 1 2 3 4 5 6
Fig. 44.2 (a) Phosphocreatine concentration in thegastrocnemius muscle determined by NMR duringisometric contractions with the calf muscles atalternating work loads (b). The exercise consisted ofthree identical 2-min contraction periods, eachincluding a maximal contraction. MVC, maximumvoluntary force of contraction. Adapted from Bangsbo(1994a), with permission from Acta PhysiologicaScandinavica.

the high aerobic energy utilization is that oxygenuptake in the recovery periods after intense exer-cise is high (Bangsbo 1994a).
Substrate utilization
The large aerobic energy production and the pro-nounced anaerobic energy turnover duringperiods of a match in many team sports are asso-ciated with a large consumption of substrates.The dominant substrates are carbohydrate andfat, either stored within the exercising muscle ordelivered via the blood to the muscles.
The carbohydrate used during a match ismainly the glycogen stored within the exercisingmuscles, but glucose extracted from the bloodmay also be utilized by the muscles. Informationabout the use of muscle glycogen during a matchcan be obtained from determinations of glycogenin muscle samples taken before and after thematch. The difference in glycogen content repre-sents the net utilization of muscle glycogen, but itdoes not show the total glycogen turnover, sincesome resynthesis of glycogen probably occursduring the rest and low-intensity exerciseperiods during a match (Nordheim & Vøllestad1990; Bangsbo 1994a). Muscle glycogen utiliza-tion may be high in team sports. As an example,
576 sport-specific nutrition
in a study of Swedish soccer players the averagethigh muscle glycogen concentrations of fiveplayers were 96, 32 and 9mmol ·kg–1 wet weightbefore, at half-time and after a non-competitivematch, respectively (Saltin 1973). An importantaspect to consider in intermittent sport is thateven though the muscle glycogen stores are notcompletely depleted, the level of muscle glyco-gen may be limiting for performance (see below).
Fat oxidation is probably high during mostteam sports. Studies focusing on recovery fromintense exercise and intermittent exercisesuggest that fat is oxidized to a large extent afterintense exercise (Essen 1978; Bangsbo et al. 1991).The primary source of the fat oxidized in the restperiods in between the more intense exercisemay be muscle triacylglycerol (Bangsbo et al.1991).
The role of protein in metabolism in teamsports is unclear, but studies with continuousexercise at a mean work rate and duration similarto team sports such as soccer and basketball haveshown that oxidation of proteins may contributeless than 10% of the total energy production(Wagenmakers et al. 1990).
As an example, an estimation of substrate uti-lization and energy production during a soccergame is shown in Fig. 44.3. It is clear that muscle
300
0
250
150
50
Protein
Subs
trat
e ut
iliza
tion
(g)
Aerobic
100
96
40
20
Ener
gy tu
rnov
er (%
)
200
100
0
60
80
98
Fat
Bloodglucose
Muscleglycogen
Anaerobic
ATP + PCr
Fig. 44.3 Estimated relativeaerobic and anaerobic energyturnover (right) andcorresponding substrateutilization (left) during a soccermatch. Adapted from Bangsbo(1994a), with permission fromActa Physiologica Scandinavica.

glycogen is the most important substrate insoccer and likely also in other team sports.
It should be noted that in team sports largeinterindividual differences exist in the energyproduction during a match due to the variety offactors influencing the exercise intensity, e.g.motivation, physical capacity and tactical limita-tions. Therefore, there may be major individualvariations in the demand of players in the sameteam.
Diet in team sports
In this section the importance of nutrition inteam sports is discussed and dietary recommen-dations to accommodate nutritional require-ments for training and matches are provided. Itshould be emphasized that maintaining an ade-quate diet will improve the potential to reach amaximum level of performance, but does notensure good performance during a match. Thereare many other factors that influence perfor-mance, including technical abilities and tacticalunderstanding.
Diet and performance in intermittent exercise
It is well established that performance duringlong-term continuous exercise is improved byintake of a carbohydrate-rich diet in the daysbefore the exercise. In order to evaluate whethera diet high in carbohydrate also affects perfor-mance during prolonged intermittent exercise, a study of eight top-class Danish players wasperformed.
A soccer-specific intermittent exercise test wasused to evaluate performance (Fig. 44.4). Theplayers ran intermittently until they wereexhausted and the test result was the total distance covered. The average exercise inten-sity during the tests was 70–80% of maximumoxygen uptake, which resembles the averageintensity during several team sports such as teamhandball, soccer and basketball. The players per-formed the test on two occasions separated by 14days. On one of the occasions, the test wascarried out with the players having ingested a
diet containing 39% carbohydrate (control diet;C-diet) during the days before the test, and onthe other occasion the players performed the testhaving consumed a high (65%) carbohydrate diet(CHO-diet) prior to the test. Both tests werecarried out 3 days after a competitive soccermatch, with the diets maintained during the 2days following the match. The order of the testswas assigned randomly. The total running dis-tance of 17.1 km after the CHO-diet was signifi-cantly longer (0.9km) than after the C-diet. Thus,increasing the carbohydrate content in the dietfrom 39% or 355g to 65% or 602g ·day–1 (4.6 and7.9g · kg–1 body mass) improved intermittentendurance performance. Similarly, it has beenobserved that performance during long-termintermittent exercise consisting of 6-s workperiods separated by 30-s rest periods wasrelated to the initial muscle glycogen concentra-tion (Balsom 1995).
The findings in the above mentioned studiessuggest that elevated muscle glycogen levelsprior to competition can increase the mean workrate during a team sport match. In agreementwith this suggestion are findings in a study ofsoccer players. It was observed that the use ofglycogen was more pronounced in the first thanin the second half of a game (Saltin 1973). Fur-thermore, the players with initially low glycogencovered a shorter distance and sprinted signifi-cantly less, particularly in the second half, thanthe players with normal muscle glycogen levelsprior to a match (Saltin 1973). It can be assumedthat the players would have been better preparedfor the second half if the muscle glycogen storeshad been higher prior to the match.
In may not only be towards the end of a matchthat the level of muscle glycogen affects perfor-mance. In a study using 15 repeated 6-s sprintsseparated by 30-s rest periods, it was found thatperformance was significantly increased whenthe subjects had elevated the muscle glycogenstores prior to the exercise (Fig. 44.5). In agree-ment with this finding, it has been observed thathigh muscle glycogen levels did not affect per-formance in single intense exercise periods, butwhen exercise was repeated 1 h later, fatigue
team sports 577
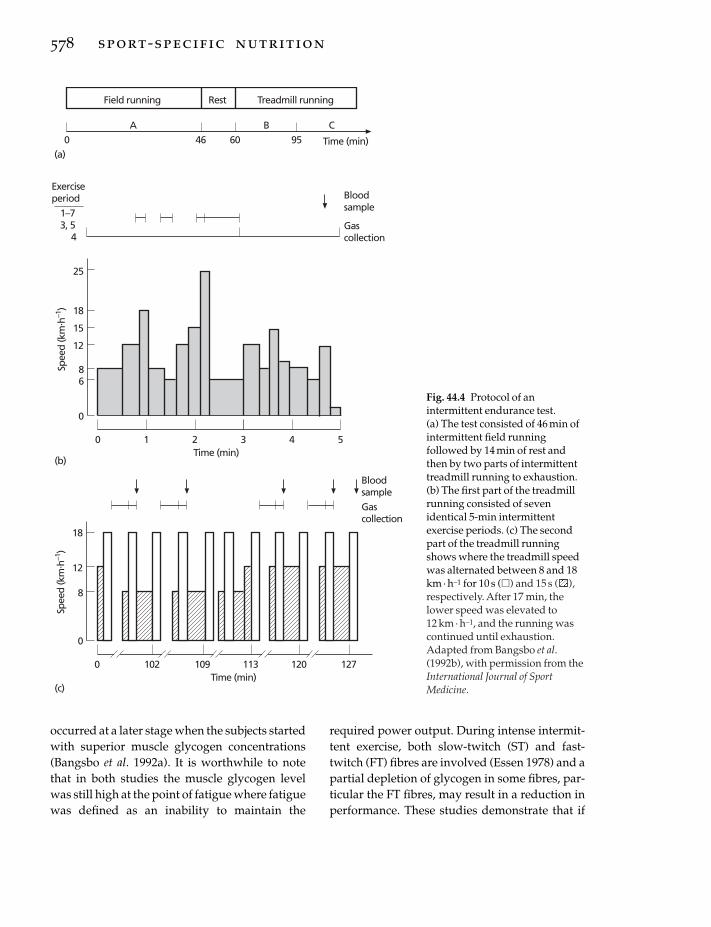
occurred at a later stage when the subjects startedwith superior muscle glycogen concentrations(Bangsbo et al. 1992a). It is worthwhile to notethat in both studies the muscle glycogen levelwas still high at the point of fatigue where fatiguewas defined as an inability to maintain the
578 sport-specific nutrition
required power output. During intense intermit-tent exercise, both slow-twitch (ST) and fast-twitch (FT) fibres are involved (Essen 1978) and apartial depletion of glycogen in some fibres, par-ticular the FT fibres, may result in a reduction inperformance. These studies demonstrate that if
Spee
d (k
m. h
–1)
0
18
12
102Time (min)
8
Gascollection
Gascollection
0 109 113 120 127
Spee
d (k
m. h
–1)
0
18
15
1Time (min)
8
0 2 3 4 5
25
12
6
Bloodsample
460 9560 Time (min)
Field running Treadmill runningRest
Exerciseperiod
1–73, 5
4
(b)
(a)
(c)
Bloodsample
A B C
Fig. 44.4 Protocol of anintermittent endurance test. (a) The test consisted of 46 min ofintermittent field runningfollowed by 14 min of rest andthen by two parts of intermittenttreadmill running to exhaustion.(b) The first part of the treadmillrunning consisted of sevenidentical 5-min intermittentexercise periods. (c) The secondpart of the treadmill runningshows where the treadmill speedwas alternated between 8 and 18km · h–1 for 10 s (�) and 15 s ( ),respectively. After 17 min, thelower speed was elevated to 12 km · h–1, and the running wascontinued until exhaustion.Adapted from Bangsbo et al.(1992b), with permission from theInternational Journal of SportMedicine.

the muscle glycogen levels are not high prior to agame, performance of repeated intense exerciseduring the game may be impaired.
Diets of athletes in team sports
The above mentioned studies clearly show thathigh glycogen levels are essential to optimizeperformance during intense intermittent exer-cise. However, athletes in team sports may notactually consume sufficient amounts of carbohy-drate, as illustrated in a study of Swedish elitesoccer players. After a competitive match playedon a Sunday, the players were monitored untilthe following Wednesday, when they played aEuropean Cup match. One light training sessionwas performed on the Tuesday. Immediatelyafter the match on Sunday, and on the following2 days, muscle samples were taken from aquadriceps muscle for determination of glyco-gen content (Fig. 44.6). After the match, the
muscle glycogen content was found to bereduced to approximately 25% of the level beforethe match. Twenty-four hours (Monday) and 48h(Tuesday) later, the glycogen stores had onlyincreased to 37% and 39% of the prematch level,respectively. Muscle samples were not taken onthe Wednesday because of the European Cupmatch, but it can be assumed that the glycogenstores were less than 50% of the prematch levels.Thus, the players started the match with onlyabout half of their normal muscle glycogenstores, which most likely reduced their physicalperformance potential.
The food intake of each player was analysedduring the same period (Sunday to Wednesday).The average energy intake per day was 20.7MJ (4900 kcal), with a variation between playersfrom 10.5 to 26.8 MJ (2500–6400 kcal). By use ofthe activity profile and body weight of eachplayer, it was calculated that most of the playersshould have had an intake of at least 20 MJ
team sports 579
End
peda
lling
freq
uenc
y (r
ev. m
in–1
)
140
0
No. of work periods
130
120
1 2 3 4 5 6 7 8 9 10 11 12 13 14 15
**
* *
Fig. 44.5 Pedalling frequency during the last 2 s of 15 ¥ 6-s periods of intense cycling separated by 30-s rest periodswith a diet low (�) and high ( ) in carbohydrates in the days before the test. The subjects were supposed tomaintain a pedalling frequency of 140 rev · min–1. Note that after the high-carbohydrate diet the subjects were betterable to keep a high pedalling frequency. *, significant difference between high- and low-carbohydrate diet. Adaptedfrom Balsom (1995), with permission.

(4800 kcal). Therefore, for some of the players thetotal energy consumption was much lower thanrequired.
The quality of the diet must also be considered,e.g. the proportion of protein, fat and carbohy-drate. The players’ diet contained, on average,14% protein of total energy intake (which lieswithin the recommended range), 47% carbohy-drate and 39% fat. If these percentages are com-pared with those recommended of at least 60%carbohydrate and no more than 25% fat, it isevident that the carbohydrate intake by theplayers was too low on the days before the Euro-pean Cup match. This factor, together with therelatively low total energy consumption of someplayers after the Sunday match, can explain thelow muscle glycogen stores found on the daysprior to the European Cup match. Thus, the dietof the players was inadequate for optimal physi-cal performance.
It is evident that many athletes in team sports
580 sport-specific nutrition
are not aware of the importance of consuminglarge amounts of carbohydrates in the diet. Itmay be possible to achieve major changes indietary habits just by giving the players appro-priate information and advice.
In the study concerning the effect of a carbohydrate-rich diet on intermittent exerciseperformance, 60% of the soccer players’ diet wascontrolled and within given guidelines theycould select the remaining 40% themselves.Using this procedure, the average carbohydrateintake was increased from about 45% in thenormal diet to 65% in the high-carbohydrate diet. The foods that were consumed in the carbohydrate-rich diet are found in most house-holds. This means it is not necessary to drasti-cally change dietary habits in order to obtain amore appropriate diet.
Everyday diet
carbohydrates
It is clear that eating a carbohydrate-rich diet onthe days before a match is of importance for per-formance. To consume a significant amount ofcarbohydrate in the everyday diet is also benefi-cial to meet the demands of training. Figure 44.7illustrates how the muscle glycogen stores mayvary during a week of training for a player thatconsumed either a high-carbohydrate diet or a‘normal’ diet. During training, some of the glyco-gen is used, and between training sessions thestores are slowly replenished. If the diet containslarge amounts of carbohydrate, it is possible torestore glycogen throughout the week. This may not be achieved if the diet is low in carbohydrates.
An increase in glycogen storage is followed byan enhanced binding of water (2.7g water ·g–1
glycogen). Thus, a high-carbohydrate diet islikely to result in an increase in body weight,which might adversely affect performance in theearly stage of the match. However, this effect isprobably small and the benefit of high muscle-glycogen concentrations before a match willprobably outweigh the disadvantages of any
100
75
25
Gly
coge
n co
nten
t (%
)
50
Pre-
mat
ch
Post
-mat
ch
24h
post
-mat
ch
48h
post
-mat
ch
Pre
Euro
pean
Cup
mat
ch
Fig. 44.6 The muscle glycogen content of a quadricepsmuscle for players in a Swedish top-class soccer team,before and just after a league match (Sunday). Thefigure also gives muscle glycogen values 24 and 48 hafter the match, and an estimate of the level before aEuropean Cup match on the following Wednesday(dashed bar). The values are expressed in relation tothe level before the league match (100%). Note thatmuscle glycogen was only restored to about 50% of the‘normal level’ before the European Cup match.Adapted from Bangsbo (1994b), with permission fromHO + Storm.

increase in body weight. The maximal additionalmuscle-glycogen synthesis when consuming a high-carbohydrate diet as compared with anormal diet should be 150g, which correspondsto a weight gain of less than 0.5kg. Furthermore,a more pronounced breakdown of glycogen willenhance the release of water, which will reducethe net loss of water.
protein
Protein is used primarily for maintaining andbuilding up tissues, such as muscles. The amountof protein required in the diet is a topic fre-quently discussed, particularly with respect tothose sports where muscle strength is importantor where muscle injuries often occur. Most teamsports can be included in both of these categories.However, in most cases the athletes take in suffi-cient amount of proteins (see Chapter 10). Forexample, the daily intake of protein by Swedishand Danish soccer players was 2–3 g · kg–1 bodyweight, which is above the recommended daily
intake for athletes of 1–2g · kg–1 (Jacobs et al. 1982;Bangsbo et al. 1992b). In general, supplementingprotein intake by tablets or protein powders isunnecessary for athletes in team sports, evenduring an intensive strength-training period.
fat
Fat exists in two forms — saturated fat and un-saturated fat. The saturated fats are solid at roomtemperature (butter, margarine and fat in meat)while unsaturated fats are liquid or soft at roomtemperature (vegetable oil, vegetable margarineand fat in fish). An adequate intake of unsatu-rated fats is essential for the body, and, in con-trast to saturated fats, unsaturated fats may aidin lowering the amount of cholesterol in theblood, thereby reducing the risk of heart disease.Therefore, it is important that saturated fats arereplaced with unsaturated fats where possible.The total content of fat in the average diet for anathlete is often too high and a general lowering offat intake is advisable.
team sports 581
100
75
50
25
0
Gly
cog
en le
vel (
%)
Activity: Match Training Training Training Training Match
Sun Mon Tues Wed Thurs Fri Sat Sun
Fig. 44.7 A hypothetical example of how muscle glycogen stores can vary during a week for a soccer player with ahigh-carbohydrate (circles) and a ‘normal’ (squares) diet. There is a match on Sunday, a light training session onMonday, an intensive training session on Tuesday and Thursday, and a light training session on Saturday. The filledsymbols indicate the values after the match and training. Note that the glycogen stores are replenished at a fasterrate with the high-carbohydrate diet, thus allowing for proper preparation for training and the subsequent match.In contrast, consuming a ‘normal’ diet may result in reduced training efficiency and the glycogen stores may belowered before the match. Adapted from Bangsbo (1994b), with permission from HO + Storm.

minerals and vitamins
Food and drink supplies the body with fluids,energy-producing substrates, and other impor-tant components, such as salt, minerals, and vita-mins. In a well-balanced diet, most nutrients aresupplied in sufficient amounts. However, therecan be some exceptions.
Iron is an important element in haemoglobin,which binds to the red blood cells and aids in thetransport of oxygen throughout the body. There-fore, an adequate iron intake is essential for ath-letes and especially for female athletes, who loseblood and, thus, haemoglobin during menstrua-tion (see Chapter 24). The recommended dailyintake of iron for a player is approximately 20mg, which should be ingested via solid foodsrather than in tablet form, as iron found in solidfoods is more effectively absorbed from the intes-tine to the blood. Animal organs (liver, heart andkidneys), dried fruits, bread, nuts, strawberriesand legumes are foods with a high content ofiron. It is advisable to increase iron intake inperiods when players are expected to increasetheir red blood cell production, e.g. during thepreseason or when training at a high altitude.
A question commonly asked is whether or notplayers should supplement their diet with vita-mins. In general, vitamin supplementation is not necessary, but there are conditions where itmight be beneficial. For example, it is advisableto enhance vitamin E intake when training athigh altitudes, and to use vitamin C and multipleB-vitamin supplements in hot climates (seeChapters 20 and 26).
creatine
In team sports, the rate of muscle PCr utilizationis high during periods of match play and in the following recovery periods PCr is resynthesized(see above). This leads to the question whetheran athlete in team sports can benefit from inges-tion of creatine in a period before a match, as ithas been shown that intake of creatine increasesthe PCr and particularly creatine levels inmuscles (Harris et al. 1992). For example, it was
582 sport-specific nutrition
found that five subjects increased their totalmuscle creatine level (PCr and creatine) by 25%after a creatine intake of 20 g ·day–1 for 5 days(Greenhaff et al. 1994). The effect of intake of crea-tine is discussed in detail in Chapter 27 and thediscussion here will focus on issues relevant tothe team games players.
An elevated level of creatine and PCr mayaffect PCr resynthesis after exercise (Greenhaff etal. 1994), which may have an impact on theability to perform intermittent exercise. In onestudy, subjects performed 10 6-s high-intensityexercise bouts on a cycle-ergometer separated by24s of rest, after they had ingested either creatine (20 g ·day–1) or placebo for a week (Balsom et al.1993a). The group which ingested creatine had alower reduction in performance as the test pro-gressed than the placebo group. On the otherhand, as one would expect, creatine ingestionappears to have no effect on prolonged (>10min)continuous exercise performance (Balsom et al.1993b).
Although creatine ingestion increases musclePCr and creatine concentration, it is doubtful thatathletes in team sports, except probably for vege-tarians, will benefit from creatine supplementa-tion, since creatine ingestion also causes anincrease in body mass. It is still unclear whatcauses this increase, but it is most likely due to anincreased accumulation of water. Nevertheless, again in body weight has a negative influence insports in which the athletes have to move theirbody mass against gravity. For example, no dif-ference in performance during intense intermit-tent running (Yo-Yo intermittent recovery test)was observed when a group of subjects per-formed the test after 7 days of creatine intake (20 g ·day–1) compared with a test under controlconditions. Furthermore, it is unclear howingesting creatine for a period influences thebody’s own production of creatine and theenzymes that are related to creatine/PCr synthe-sis and breakdown. It may be that an athlete,through regular intake of creatine, reduces hisability to produce PCr and creatine, which mayresult in a reduction in the PCr and creatinelevels when the athlete no longer is ingesting

creatine. In addition, very little is known aboutany possible side-effect of a frequent intake ofcreatine. Regular high concentrations of creatinein the blood may, on a long-term basis, have negative effects on the kidney, which is the organthat has to eliminate the excess creatine. Oneshould also consider that ingestion of creatinecan be considered as doping, even though it isnot on the IOC doping list. It may be argued thatcreatine is a natural compound and that it is con-tained in the food. However, it is almost impossi-ble to get doses of creatine corresponding tothose used in the experiments which showedenhanced performance, as the content of creatinein 1 kg of raw meat is around 5 g.
Pretraining and precompetition meal
On the day of a match, the intake of fat andprotein (especially derived from meat) should berestricted. The pretraining or prematch mealshould be ingested 3–4h prior to competition or training. If too much food is ingested after this time, there still may be undigested food inthe stomach and intestine when the training ormatch begins. The meal should mainly consist ofa sufficient amount of carbohydrate. It has beendemonstrated that ingestion of 312g of carbohy-drate 4 h prior to strenuous continuous exerciseresulted in a 15% improvement in exercise per-formance, but no improvement was observedwhen either 45 or 156g of carbohydrate wasingested (Sherman et al. 1989). A snack high incarbohydrate, e.g. bread with jam, may be eatenabout 1.5h before the match. However, thesetime references are only guidelines. There aregreat individual differences in the ability todigest food. It is a good idea for players to experi-ment with a variety of different foods at differenttimes before training sessions.
An improvement in exercise performance has been observed if carbohydrate was ingestedimmediately before exercise (Neufer et al. 1987).On the other hand, glucose ingestion 30–60 minprior to severe exercise has been shown toproduce a rapid fall in blood glucose with theonset of exercise, an increase in muscle glycogen
utilization and a reduction in exercise time toexhaustion (Costill et al. 1977). However, not all studies have shown a detrimental effect ofingesting carbohydrate before exercise, andsome studies have shown improved perfor-mance after carbohydrate ingestion in the lasthour prior to strenuous exercise (Gleeson et al.1986). The differences seem to be closely relatedto the glucose and insulin responses. When exer-cising with a high insulin concentration, there isan abnormally large loss of glucose from theblood, resulting in a low blood glucose concen-tration. Consequently, the muscles and the braingradually become starved of glucose, whicheventually leads to fatigue.
Food intake after exercise
Physical activity is a powerful stimulus to glyco-gen resynthesis, as was elegantly shown in astudy where a glycogen-depleted leg attainedmuscle glycogen levels twice as high as theresting control leg during a 3-day period(Bergström & Hultman 1966). In addition, itseems that the muscles are particularly sensitiveto glucose uptake and glycogen resynthesis inthe period immediately after exercise (Ploug et al.1987). It was found that the rate of glycogenresynthesis during the first 2 h after carbohydrateintake was faster if carbohydrate was ingestedimmediately following an exercise bout, ratherthan delaying the intake by 2h (Ivy et al. 1988).Thus, to secure a rapid resynthesis of glycogen,an athlete should take in carbohydrates immedi-ately after training and a match. For specific recommendations about amount and type of car-bohydrate, see Chapter 7.
An inverse relationship between the rate ofglycogen rebuilding and the muscle-glycogenconcentration after prolonged continuous exer-cise or soccer match-play has been demonstrated(Piehl et al. 1974; Jacobs et al. 1982). Therefore, inteam sports the players should be able to replen-ish the muscle glycogen stores within 24h after a match, irrespective of the magnitude of thedecrease of carbohydrates during the game.However, other factors have been shown to influ-
team sports 583
ence the rate of glycogen synthesis. Glycogenrestoration is impaired after eccentric exerciseand after exercise causing muscle damage (Blomet al. 1987; Widrick et al. 1992). In most teamsports the players are often performing someeccentric exercise and muscle damage can occurdue to physical contact. It has been demonstratedthat an increased ingestion of carbohydrate can partially overcome the effect of the muscledamage on glycogen resynthesis (Bak & Peterson1990). Thus, also in this respect the players canbenefit from a high carbohydrate intake follow-ing match-play and training.
Fluid intake in team sports
In many team sports, the loss of body water,mainly due to the secretion of sweat, can be largeduring competition. For example, under normalweather conditions the decrease in body fluidduring a soccer match is approximately 2 l, andunder extreme conditions the reduction in bodywater can be higher, e.g. in a World Cup soccermatch in Mexico, one Danish player lost about4.5 l of fluid. Such changes in body fluid caninfluence performance negatively during match-play (Saltin 1964). Thus, it is important for theplayers to take in fluid during a game and alsoduring a training session to maintain the effi-ciency of the training. The question is what andhow much to drink before, during and after atraining session or a game.
Before a training session or match
It is important that the players are not dehy-drated before a match. The players should beginthe process of ‘topping-up’ with fluid on the daybefore a match. For example, an additional litreof juice can be drunk on the evening before amatch, which will also provide an extra supply ofsugar.
On the match day, the players should haveplenty to drink and be encouraged to drink evenwhen they are not feeling thirsty. The content ofsugar should be less than 10%. During the last
584 sport-specific nutrition
hour before the match, the players should nothave more than 300ml (a large cup) of a liquidwith a sugar concentration less than 5% every 15min.
The intake of coffee should be limited, as coffeecontains caffeine, which has a diuretic effect andcauses the body to lose a larger amount of waterthan is absorbed from the coffee.
During a training session or match
Besides reducing the net loss of body water, theintake of fluid can supply the body with carbohy-drates. As low muscle glycogen concentrationsin some team sports might limit performance atthe end of a match, intake of carbohydrate solu-tions during a match is useful.
Questions remain concerning the optimumcomposition of the drink, particularly withrespect to its concentration, form of carbohy-drates, electrolyte content, osmolality, pH,volume and temperature. These considerationsdepend, among other things, on the temperatureand humidity of the environment, which shoulddetermine the ratio between the need for fluidand need for carbohydrates. In a cold environ-ment, there is little need for water, and a drinkwith a sugar concentration up to 10% can beused, whereas in a hot environment the carbohy-drate content should be much less. Before usingdrinks with high sugar concentrations in amatch, however, the players should have triedthese drinks during training to ensure thatstomach upset does not occur. There are largeindividual differences in the ability to toleratedrinks and to empty fluid from the stomach.While some players are unaffected by largeamounts of fluid in the stomach, others find itdifficult to tolerate even small quantities of fluid.The players will benefit by experimenting withdifferent drinks and drinking habits duringtraining. For further discussion of the composi-tions of the fluid, see Chapters 17 and 39.
During a match, small amounts of fluid shouldbe drunk frequently. It is optimal to drinkbetween 100 and 300 ml with a 2–5% sugar con-

centration every 10–15 min. In a soccer match,this will give a total fluid intake of between 1 and2 l, plus 30–50 g of sugar during the match. This issufficient to replace a significant amount of thewater lost through sweat, and to cover some ofthe demand for sugar. Although fluid intakeduring a match is important, it should not interfere with the game. The players should only drink when there is a natural pause in thegame as the drinking may disturb the playingrhythm. In some team sports, such as basketballand ice-hockey, the players can drink duringtime-outs or when they are on the bench,whereas in other sports, such as soccer, it is moredifficult. In the latter case, it is convenient toplace small bottles of fluid at different positionsaround the field in order to avoid long runs to theteam bench.
After a training session or match
The players should drink plenty of fluid after amatch and training. Several studies have demon-strated that restoration of fluid balance is a slowprocess and that it is not sufficient merely toincrease fluid intake immediately after a match(see Chapter 19). It is not unusual for players to be partially dehydrated on the day after amatch. The body can only partially regulatewater balance through the sensation of thirst, asthirst is quenched before a sufficient amount offluid has been drunk. Thus, in order to maintainfluid balance, more fluid has to be drunk thanjust satisfies the sensation of thirst.
The colour of urine is a good indicator of thefluid balance and the need for water. If the bodyis dehydrated, the amount of water in the urine is reduced and the colour becomes a strongeryellow.
Recommendations
The following recommendations regarding fluidintake may be helpful for an athlete in teamsports:• Drink plenty of fluid the day before a match
and on the day of the match — more than just toquench thirst.• Drink frequently just before and during amatch as well as at half-time, but only smallamounts at a time — not more than 300 ml of fluidevery 15min.• Drinks consumed just before and during amatch should have a sugar concentration lowerthan 5% and a temperature between 5 and 10°C.• Drink a lot after a match — even several hoursafterwards.• Use the colour of the urine as an indication ofthe need for fluid — the yellower the urine, thegreater the need for fluid intake.• Experiment with drinking habits during train-ing so that any difficulties in absorbing fluidduring exercise can be overcome.
Conclusion
In most team sports, the players perform high-intensity intermittent exercise, at times for a long duration. The intense exercise periodsrequire a high rate of energy turnover and thetotal energy cost of a game can be high. Muscleglycogen appears to the most important sub-strate in team sports, and performance may belimited due to a partial depletion of the muscleglycogen stores.
Athletes that are taking part in team sportsshould have a balanced diet that contains largeamounts of carbohydrate to allow for a hightraining efficiency and for optimal preparationfor matches. Therefore, it is important for theplayers to be conscious of the nutritive value ofthe food that they consume. The highest poten-tial for storing glycogen in the muscles is imme-diately after exercise. It is therefore advisable toconsume carbohydrate, either in solid or liquidform, shortly after a match or training session.This is particularly important if the players aretraining twice on the same day. On the day ofcompetition, the last meal should be ingested 3–4h before the start, and it should mainly consistof carbohydrates that can be rapidly absorbed.During the last hour before a match, solid food or
team sports 585
liquid with a high carbohydrate content may beavoided.
To limit the extent of dehydration and toprovide the body with carbohydrate duringmatch-play, the players should take in fluid witha low carbohydrate content both before andduring a match. Also, fluid ingestion should behigh after a match.
References
Bak, J.F. & Peterson, O. (1990) Exercise enhanced activation of glycogen synthase in human skeletalmuscle. American Journal of Physiology 258,E957–E963.
Balsom, P.D. (1995) High intensity intermittent exercise:performance and metabolic responses with very highintensity short duration work periods. Doctoral thesis,Karolinska Institutet, Sweden.
Balsom, P.D., Ekblom, B., Söderlund, K., Sjödin., B. &Hultman, E. (1993a) Creatine supplementation anddynamic high-intensity intermittent exercise. Scandi-navian Journal of Medicine and Science in Sports 3,143–149.
Balsom, P.D., Harridge, S.D.R., Söderlund, K., Sjödin,B. & Ekblom, B. (1993b) Creatine supplementationper se does not enhance endurance exercise per-formance. Acta Physiologica Scandinavica 149, 521–523.
Bangsbo, J (1994a) The physiology of soccer: withspecial reference to intense intermittent exercise.Acta Physiologica Scandinavica 151 (Suppl. 610), 1–156.
Bangsbo, J (1994b) Fitness Training for Football: A Scien-tific Approach. HO + Storm, Bagsværd, Copenhagen,Denmark.
Bangsbo, J., Gollnick, P.D., Graham, T.E. & Saltin, B.(1991) Substrates for muscle glycogen synthesis inrecovery from intense exercise in humans. Journal ofPhysiology 434, 423–440.
Bangsbo, J., Graham, T.E., Kiens, B. & Saltin, B. (1992a)Elevated muscle glycogen and anaerobic energy pro-duction during exhaustive exercise in man. Journal ofPhysiology 451, 205–222.
Bangsbo, J., Nørregaard, L. & Thorsøe, F. (1992b) Theeffect of carbohydrate diet on intermittent exerciseperformance. International Journal of Sports Medicine13, 152–157.
Bergström, J & Hultman, E. (1966) Muscle glycogensynthesis after exercise: an enhancing factor local-ized to the muscle cells in man. Nature 210, 309–310.
Blom, P.C.S., Costill, D.L. & Völlestad, N.K. (1987)Exhaustive running: inappropriate as a stimulus of
586 sport-specific nutrition
muscle glycogen supercompensation. Medicine andScience in Sports and Exercise 19, 398–403.
Costill, D.L., Coyle, E.F., Dalsky, G., Evans, W., Fink, E.& Hoppes, D. (1977) Effects of elevated plasma FFAand insulin on muscle glycogen usage during exer-cise. Journal of Applied Physiology 43, 695–699.
Essén, H. (1978) Studies on the regulation of metabo-lism in human skeletal muscle using intermittentexercise as an experimental model. Acta PhysiologicaScandinavica (Suppl.) 454, 1–32.
Gleeson, M., Maughan, R.J & Greenhaff, P.L. (1986)Comparison of the effects of pre-exercise feeding ofglucose, glycerol and placebo on endurance and fuelhomeostasis in man. European Journal of Applied Physiology 55, 645–653.
Greenhaff, P.L., Bodin, K., Söderlund, I. & Hultman, E.(1994) The effect of oral creatine supplementation on skeletal muscle phosphocreatine resynthesis.American Journal of Physiology 266, E725–E730.
Harris, R.C., Söderlund, K. & Hultman, E. (1992) Eleva-tion of creatine in resting and exercise muscles of normal subjects by creatine supplementation.Clinical Science 83, 367–374.
Ivy, J.L., Katz, A.L., Cutler, C.L., Sherman, W.M. &Coyle, E.F. (1988) Muscle glycogen synthesis afterexercise: effect of time of carbohydrate ingestion.Journal of Applied Physiology 64, 1480–1495.
Jacobs, I., Westlin, N., Karlsson, J., Rasmusson, M. &Houghton, B. (1982) Muscle glycogen and diet inelite soccer players. European Journal of Applied Physi-ology 48, 297–302.
Neufer, P.D., Costill, D.L., Glynn, M.G., Kirwan, J.P.,Mitchell, J.B. & Houmard, J (1987) Improvements inexercise performance: effects of carbohydrate feed-ings and diet. Journal of Applied Physiology 62,983–988.
Nordheim, K. & Vøllestad, N.K. (1990) Glycogen andlactate metabolism during low-intensity exercise inman. Acta Physiologica Scandinavica 139, 475–484.
Piehl, K., Adolfsen, S. & Nazar, K. (1974) Glycogenstorage and glycogen synthetase activity in trainedand untrained muscle of man. Acta Physiologica Scandinavica 90, 779–788.
Ploug, T., Galbo, H., Vinten, J., Jørgensen, M. & Richter,E.A. (1987) Kinetics of glucose transport in ratmuscle: effects of insulin and contractions. AmericanJournal of Physiology 253, E12–E20.
Saltin, B. (1964) Aerobic work capacity and circulationat exercise in man: with special reference to the effectof prolonged exercise and/or heat exposure. ActaPhysiologica Scandinavica 62 (Suppl.), 1–52.
Saltin, B. (1973) Metabolic fundamentals in exercise.Medicine and Science in Sports and Exercise 5, 137–146.
Sherman, W.M., Brodowicz, G., Wright, D.A., Allen,W.K., Simonsen, J. & Dernback., A. (1989) Effects of

4 h pre-exercise carbohydrate feedings on cyclingperformance. Medicine and Science in Sports and Exercise 21, 598–604.
Wagenmakers, A.J.M., Coakley, J.H. & Edwards, R.H.T.(1990) Metabolism of branched-chain amino acidsand ammonia during exercise: clues from McArdle’s
disease. International Journal of Sports Medicine 11,101–113.
Widrick, J., Costill, D.L., McConell, G.K., Anderson,D.E., Pearson, D.R. & Zachwieja, J.J (1992) Timecourse of glycogen accumulation after eccentric exer-cise. Journal of Applied Physiology 75, 1999–2004.
team sports 587
Introduction
Enrolment in gymnastics programmes continuesto flourish for a variety of reasons. There is anincreasing availability of good gymnasticsschools and coaches in more locations, and a highlevel of media attention has been afforded gym-nastics during recent Olympic Games (gymnas-tics coverage for the 1996 Summer OlympicGames in Atlanta represented the most coveragegiven to any sport). The ever-increasing numberof young gymnastics competitors requires thatthose in sports medicine pay careful attention totheir health and well-being, especially as theseathletes are assessed for growth, weight, bone-health, eating behaviour, and other develop-mentally important factors. For the seasonedcompetitors, every effort must be made to ensurean evolution of nutritional habits that will opti-mize performance while guaranteeing theopportunity for good health.
The concern for improving the nutritionalhealth of gymnasts is real. The traditional para-digm in gymnastics is to develop gymnasts whoare small, and gymnasts themselves commonlyview this small body image as the ideal for theirsport. The issue of weight is a prevailing theme,regardless of the gymnastics discipline. Even inmen’s gymnastics, it is ordinarily suggested thatcontrolling energy intake to achieve lowerweight is an appropriate and desired act if agymnast is to achieve success (Maddux 1970). Itis also a common practice to regularly weighgymnasts as a normal part of training, but the
results of these weigh-ins are not often used con-structively. Since there is a normal expectationfor growth in children, there should be a con-comitant expectation for increasing weight.Failure to accept this fact may place abnormalpressures on young gymnasts to achieve an arbi-trarily low weight through unhealthy means.Adolescent females, as a group, are the most vul-nerable to disordered eating patterns, and thisgroup constitutes the majority of competitivewomen in gymnastics. This makes it imperativethat those working with gymnasts become sensi-tive to the possibility that some of these athletesmay have a predisposition to eating behavioursthat could put them at health risk. Thus, while alowering of excess body fat will reduce bodymass and, perhaps, lower the risk of traumaticinjuries to joints, excessive attention to weightcarries with it its own set of health and injuryrisks (Houtkooper & Going 1994).
There has been a consistent drop in the age atwhich gymnasts compete at the elite level. In1960, the United States Olympic gymnasts hadan average height of about 157.5cm and anaverage weight of 50 kg. In 1992, the UnitedStates Olympic gymnasts had an average heightof 146cm and an average weight of 37.5kg.During this same time, the average age of thesecompetitors dropped from 18.5 to 16 years(Nattiv & Mendelbaum 1993). The FédérationInternationale de Gymnastique (FIG) hasaddressed this issue by making 16 the minimumage for competing at the Olympic Games, begin-ning in the year 2000. However, the pace at which
Chapter 45
Gymnastics
DAN BENARDOT
588
gymnasts must learn increasingly difficult skillscontinues to accelerate, placing a higher value oncurtailing adolescent body changes that couldinhibit the gymnastics learning curve. To makematters more difficult, the means commonlyused by gymnasts to attain a desired body com-position is counterproductive in several ways.Restrained eating, besides being associated withinadequate energy intake, is also associated witha lowering of metabolic rate and a lowering ofnutrient intake. A lower metabolic rate makes itmore difficult for the gymnast to eat normallywithout increasing fat storage, and consumptionof less energy is associated with inadequatenutrient intake, just at a time (adolescence) whennutrient demands are high. For instance, there isample survey evidence that gymnasts tend toconsume an inadequate level of calcium, a nutri-ent critical for proper bone development. Thismalnutrition may predispose gymnasts to stressfractures, and may also increase the risk for earlydevelopment of osteoporosis. Inadequate energyand nutrient intake may also reduce the benefitsgymnasts derive from training, because the con-ditioning benefit from intense activity is likely tobe minimized when working muscles haveinsufficient fuel and metabolites to work at anoptimal level. Since the same primary fuelresponsible for muscular work (glucose) is alsothe primary fuel for brain and nervous systemfunction, there is also good reason to suspect thatinjury rates may be higher when there is a failureto provide sufficient energy to support the activity.
Background
Elite level gymnastics has four separate disci-plines, including men’s gymnastics, women’sartistic gymnastics, women’s rhythmic gymnas-tics, and women’s rhythmic group gymnastics.• Women’s artistic gymnastics: Competitionsinclude four different events, including the floor exercise, vault, uneven bars and balancebeam.• Men’s artistic gymnastics: Competitionsinclude six different events, including the floor
exercise, side horse, horse vault, parallel bars andhorizontal bar.• Rhythmic sportive gymnastics (women):Competitions include four different routines,each performed as a floor exercise, with four ofthe five rhythmic apparatus (rope, ball, hoop,clubs and ribbon). The four apparatus to be usedare determined by FIG every 2 years followingthe World Championships.• Rhythmic group gymnastics (women): Com-petitions include two different routines per-formed by teams of six gymnasts. Each routine isperformed with a combination of rhythmic appa-ratus. For instance, at the 1996 Olympic Games,the rhythmic group teams performed one routinewith two ribbons and three balls, and anotherroutine with hoops. The apparatus combinationsto be used is determined every 2 years by FIG fol-lowing the World Championships.
Gymnastics training at the elite level takesplace 5 or 6 days per week, for 3–5 h each day. Insome cases, gymnasts have two practices eachday, a morning practice that lasts for 1 or 2h, andan afternoon practice that lasts for 2–3h.Although the total time spent in gymnasticspractice is high for elite gymnasts (up to 30h of practice each week), the actual time spent inconditioning and skills training is considerablyless. Gymnasts begin practice with a series ofstretches, and then initiate a series of basic skillson the floor mat as part of the warm-up routine.Following warm-up, each gymnast takes a turnpracticing one of the events. The time perform-ing a skill in practice never exceeds that of thecompetition maximum, and is usually a smallfraction of it. Because practice involves repeatedbouts of highly intense, short-duration activity,gymnasts rest between each practice bout toregenerate strength. With the exception of thegroup competition in rhythmic gymnastics, noneof the competition events within each of thesedisciplines has a duration longer than 90 s. Thisduration categorizes gymnastics as a high-intensity, anaerobic sport (Table 45.1).
As anaerobes, gymnasts rely heavily on typeIIb (pure fast twitch) and type IIa (intermediatefast twitch) muscle fibres (Bortz et al. 1993). These
gymnastics 589

fibres, while capable of producing a great deal ofpower, are generally regarded as incapable offunctioning at high intensity for longer than 90 s.Type II fibres have a low oxidative capacity, afactor that limits fat usage as an energy substrateduring gymnastic activity, and a poor capillary
590 sport-specific nutrition
supply, which deprives these fibres of nutrient,oxygen, and carbon dioxide exchange duringintensive work. Because of these factors, gym-nastics activity is heavily dependent on creatinephosphate and carbohydrate (both glucose andglycogen) as fuels for activity.
Fig. 45.1 Many studies show thatestimates of the energy intake ofelite gymnasts are less than theestimated energy requirements.Photos © IOC / Olympic MuseumCollections.
(a)
(b)

Gymnastics competition typically involvesthose who have not yet reached the age of 25,with those who are between 16 and 19 years oldconstituting the majority of the elite ranks(Nattiv & Mendelbaum 1993). However, thereare increasing numbers of junior gymnasts whoare already seasoned competitors at age 12(Benardot et al. 1989, 1993).
Energy and nutrient intake
A number of studies have evaluated the nutrientintake of elite gymnasts. In general, these studiesdemonstrate an inadequacy in the intake of totalenergy, iron and calcium. Heavy gymnastic training and inadequate nutrient intake are
implicated as causative factors in the primaryamenorrhoea experienced by many young gym-nasts, and may also contribute to the secondaryamenorrhoea experienced by older gymnasts.Inadequate calcium intake is associated withpoor bone development and increased risk ofstress fracture (see Chapter 23). Inadequate ironintake is associated with anaemia, which is a riskfactor in the development of amenorrhoea(Loosli 1993) (see Chapter 24).
energy intake
Table 45.2 presents a summary of selected published energy intake data obtained fromseveral gymnastics populations. Included in this
gymnastics 591
Table 45.1 Gymnastics disciplines and duration (in seconds) of each competitive event.
Rhythmic Rhythmic Women’s Men’sActivity (individual) (group) artistic artistic
Floor exercise 75–90 135–150 60–90 50–70Balance beam — — 70–90 —Horizontal bar — — — 15–30Parallel bars — — — 20–30Uneven parallel bars — — 20–30 —Pommel horse — — — 20–30Vault — — 6–8 6–8Rings — — — 20–30
Table 45.2 Comparison of energy intakes vs. requirements of different artistic gymnastic populations.
Subject Population Intake Intake RDA† Predictedage (years) evaluated* (n) (kJ) (kcal) (%) requirement (%) Reference
9.4± 0.8 US junior elite (29) 6934±1525 1651± 363 — 76 Benardot et al. (1989)11.4 ± 0.9 US junior elite (22) 7165±1768 1706± 421 — 76 Benardot et al. (1989)11.5 ± 0.5 Turkish club (20) 6586 1568 59 — Ersoy (1991)12.3± 1.7 Italian club (26) 6518±2138 1552± 509 78 — Reggiani et al. (1989)14.8 US Level I, II (20) 7325 1744 99 — Calabrese (1985)14.8± 1.2 Swedish elite (22) 8106±1911 1930± 455 — 73 Lindholm et al. (1995)15.2± 4.1 US high school (13) 8077±2831 1923± 674 96 84 Moffatt (1984)15.8± 0.9 US national team (14) 6283±1743 1496± 415 71 66 Benardot (1996)19.7± 0.2 US college team (26) 5800±458 1381± 109 63 47 Kirchner et al. (1995)— US college team 8736 2080 72 — Short and Short
(male) (10) (1983)36.3± 1.0 Former competitive 11 004± 1100 2620± 262 119 119 Kirchner et al. (1996)
(18)
* All data are for female gymnasts, except for data from Short and Short (1983).†RDAs are country specific.
summary are young, beginning gymnasts averaging age 9, club gymnasts, college male and female gymnasts, competitive gymnasts,national team gymnasts, and former competitivegymnasts. Of these groups, only the former com-petitive gymnasts had average energy intakesthat exceeded the recommended level. Collegeteam gymnasts from the United States were theoldest of the competitive gymnasts evaluated(mean age, 19.7 years) and had the lowest dailyenergy intakes of all the groups evaluated. Thesecond lowest daily energy intake was seen inthe USA national team members. It appears fromthis summary that gymnasts involved in thehighest levels of competition are most likely tohave the greatest differential between energyintake and energy requirement.
The youngest gymnasts to be evaluated forenergy intake were junior elite gymnasts rangingin age from 7 to 10 years (mean age, 9.4 years;Benardot et al. 1989). These gymnasts wereserious about gymnastics, spending approxi-mately 3–4h in the gym each day. Despite thisheavy practice schedule, they had an averageenergy intake of 69.1 MJ (1650kcal), which waspredicted to be 76% of their energy requirement.The findings for an older group (11–14 years) of junior elite gymnasts were similar, with gymnasts consuming an average of 7.1MJ (1700 kcal) (Benardot et al. 1989).
An even greater energy deficit was found in agroup of 20 Turkish gymnasts, averaging 11.5years of age, who trained between 5 and 6 h daily(Ersoy 1991). These gymnasts had an energyintake of 6.6 MJ (1570 kcal), a level of intake thatwas predicted to be only 59% of the recom-mended level. A majority of these gymnasts(75%) had reported feeling dizzy, weak, andshort of breath during gymnastics practices(Ersoy 1991).
A survey of Italian club gymnasts (involved incompetitions but not at the ‘elite’ level) whoaveraged 12.3 years of age revealed a similartrend in underconsumption of total energy (Reg-giani et al. 1989). These gymnasts had an averageenergy intake of 6.5 MJ · day–1 (1550 kcal ·day–1),which was 78% of the recommended level. The
592 sport-specific nutrition
authors point out that this level of intake is con-sistent for the standard of intake when adjustedby body weight (180 kJ · kg–1, 43 kcal ·kg–1). How-ever, it appears that this level of energy intakedoes not meet the additional energy demands ofgrowth, which should be an expectation for 12-year-olds. According to the World HealthOrganization, the daily energy requirement of10–14-year-old children with average activitylevels is between 189 and 227kJ · kg–1 (45.2–54.2kcal · kg–1) (Lemons 1989).
In a study of recreational club gymnasts (meanage, 14.8 years), it was found that energy intakewas 7.3MJ · day–1 (1744 kcal ·day–1), or 99% of thestandard requirement (Calabrese 1985). A similarfinding was observed in a group of 13 femalehigh-school gymnasts, who consumed 8MJ ·day–1 (1923 kcal · day–1), or 96% of the recom-mended intake and 84% of the predicted require-ment (Moffatt 1984). It is important to note thatthese two groups were performing at the lowestcompetitive level of the groups evaluated, andcame the closest to meeting energy requirements.
In a study of 22 elite adolescent femaleSwedish gymnasts (mean age, 14.8 years) evalu-ated for energy intake, it was determined thatthey consumed approximately 3035±2436 kJ (725 ±582 kcal) of energy less than their predi-cted requirement (11.1±1.36 MJ, 2653±325 kcal)(Lindholm et al. 1995). This value takes intoaccount the gymnasts’ current height, weight,gender, age (growth requirement), and dailyactivity (including an average daily gymnasticspractice of approximately 3h). This value can becompared to that of a reference group of equiva-lently aged non-gymnast females who experi-enced an average predicted energy deficit of 1879±1528 kJ (449± 365kcal) compared to their need(8883±1005 kJ, 2122± 240kcal) (Lindholm et al.1995). Compared to established standards, over50% of these gymnasts were below the standard,while the majority of the non-gymnasts fellwithin the standard of intake (Lindholm et al.1995).
Members of the United States National Team(average age, 15.8) were evaluated in 1994, andwere found to consume either 5119 or 6258kJ ·

day–1 (1223 or 1495kcal ·day–1), depending onthe technique used to obtain food intake data(Benardot 1996). These values represent approxi-mately 60–70% of the recommended intake and66% of the gymnasts’ predicted energy require-ment. In this study there was a statistically sig-nificant relationship between energy intake andbody-fat percentage. Gymnasts with the lowestenergy intake had the highest body fat levels,and gymnasts with the greatest number ofwithin-day energy deficits greater than 1255 kJ(300 kcal) also had the highest body-fat percent-ages. These data were sufficiently powerful thatbody fat could be predicted from the largestenergy deficit (Benardot 1996):
Body fat %DEXA* =Largest energy deficit(0.00385893)+ 7.92609
Standard error of estimation= 2.438
Multiple R2 = 0.582
P= 0.0035
These data suggest that the gymnasts’ adap-tive mechanism to energy inadequacy is toincrease energy storage (fat), probably through adecrease in the metabolic rate and a heightenedinsulin response to food. These data also supportthe idea that regular energy restriction is coun-terproductive in the attainment of low body fat,and may create an increasingly difficult cycle ofcontinually greater food restrictions to maintainthe desired body composition.
A group of older United States college gym-nasts, averaging 19.7 (±0.2) years of age, reportedan energy intake of 5780 kJ ·day–1 (1380 kcal ·day–1), representing 63% of the RDA and 47% ofthe predicted energy expenditure of 12.2MJ (2911kcal) (Kirchner et al. 1995). The differencebetween reported energy intake and predictedenergy requirement represents an energy intakethat provided only 47% of the predicted require-ment for this group. This was the oldest group ofcompetitive gymnasts studied, and a group
with the greatest average height and weight.Nevertheless, this group had the greatest differ-ential between predicted energy expenditureand energy intake. They also consumed signifi-cantly less daily energy than age-, height- andweight-matched non-gymnast controls (5780 vs.7304kJ, 1381 vs. 1745 kcal) (Kirchner et al. 1995).
The only reviewed published survey of energy and nutrient intake in male gymnastsdetermined that these athletes had the lowestenergy intake (approximately 8707 kJ · day–1 or2080kcal · day–1) of college athletes involved invarious college sports (Short & Short 1983). Theother sports evaluated in this survey includedwrestling, basketball, football (American), crew,track, track and field, lacrosse, football (soccer),mountain climbing and body building.
A study of 18 former competitive gymnasts(female), with a mean age of 36.3 years at the timeof the study, were found to consume 10.9 MJ ·day–1 (2620 kcal ·day–1) (Kirchner et al. 1996). Thislevel of intake is 119% of the RDAand 12% higherthan a group of age-, height- and weight-matched controls (Kirchner et al. 1996). This is adramatic departure from the energy intake ofgymnasts who are actively competing, and mayindicate a degree of liberalized eating behaviourthat follows years of restrained eating.
Energy substrate distribution
The intake of energy substrates in gymnasticsshould be based on usage rate and the associa-tion of different energy substrates with otherneeded nutrients. Because gymnastics activity inboth competition and practice is primarily an-aerobic, there is a heavy reliance on glycogen andcreatine phosphate as fuels. Glycogen storage isbest accomplished on diets that are high instarchy carbohydrates. Creatine storage, whichcan be synthesized from the amino acids glycine,arginine and methionine, is best obtained in thediet through consumption of skeletal muscle(meat protein) (Crim et al. 1976; Coggan & Coyle1988). (For information related to creatine me-tabolism and creatine monohydrate supplemen-tation, see Chapter 27.)
gymnastics 593
*Body fat percentage derived by dual energy X-rayabsorptiometry (DEXA).

The anaerobic nature of gymnastics shouldplace limitations on the total quantity of fat con-sumed, since there would be difficulty in meta-bolizing fat as an energy substrate duringtraining. Therefore, it appears that a conservativedistribution of energy substrates for gymnastsshould be as follows: 20–25% of total caloriesfrom fat, 15% of total calories from protein, and60–65% of total calories from carbohydrate. Thisrepresents an energy distribution that is onlyslightly lower in fat and slightly higher in carbo-hydrate than that recommended for the generalpopulation (30% from fat, 15% from protein, and55% from carbohydrate) (Table 45.3) (Whitney etal. 1994).
Some studies suggest that intense exercise for1h can significantly lower liver glycogen, and 2h of intense exercise may deplete both liverglycogen and the glycogen in specific musclesinvolved in the activity, particularly when carbo-hydrate intake is inadequate (Bergstrom et al.1967; Costill et al. 1971; Coggan & Coyle 1988).Studies have also established the importance ofglycaemic index and timing of carbohydrateingestion as important factors in glycogen reple-tion. (For issues related to glycogen storage, seeChapter 7.) Results of these studies suggest thatthe most rapid rise in postexercise muscle glyco-gen occurs with high glycaemic index foods, andthat consumption of foods immediately follow-
594 sport-specific nutrition
ing exercise results in a better glycogen storagethan if food ingestion is delayed (Ivy et al. 1988;Burke et al. 1993).
While the requirement for carbohydrate ishigh in gymnastic activities, it is unclear whethergymnasts would benefit by pursuing a glycogen-loading technique to enhance total glycogenstorage (Maughan & Poole 1981; Wooton &Williams 1984). There is a particular concern thata supersaturation of the tissues with glycogenmay cause excessive stiffness and a feeling ofheaviness because of the increased water reten-tion associated with stored glycogen (2.7g H2Ofor each g of glycogen stored) (McArdle et al.1986). This would be unacceptable in a sportwhere flexibility is needed for achieving therequired skills. A reasonable approach thereforewould be one that encourages a high level of car-bohydrate intake as a regular part of the dietrather than the initiation of a protocol that wouldlead to a supercompensation of carbohydrate inthe tissues.
Total energy intake in gymnasts is inadequateand, of the energy consumed, too great a propor-tion is derived from fats and too little from carbo-hydrates (see Table 45.3). Of the 11 studiesreviewed, only one had a carbohydrate intakegreater than 60% from total kilocalories, andseven of the studies had fat intakes greater than30% of total kilocalories. The highest carbohy-
Table 45.3 Energy substrate distribution in different gymnastic populations, organized by age of subjects.
Subject Total Total Energy from Energy Energy age energy energy carbohydrate from from(years) (kJ) (kcal) (%) protein (%) fat (%) Reference
9.4±0.8 6934 ±1525 1651 ±363 52.3 15.9 32.1 Benardot et al. (1989)11.4±0.9 7165 ±1768 1706 ±421 52.7 15.0 32.5 Benardot et al. (1989)11.5±0.5 6586 1568 57.1 15.2 27.4 Ersoy (1991)12.3±1.7 6518 ±2138 1552 ±509 47.7 15.3 36.0 Reggiani et al. (1989)14.8 7325 1744 50.0 12.8 38.7 Calabrese (1985)14.8±1.2 8106 ±1911 1930 ±455 52.0 15.0 32.0 Lindholm et al. (1995)15.2±4.1 8077 ±2831 1923 ±674 46.1 15.4 28.3 Moffatt (1984)15.8±0.9 6283 ±1743 1496 ±415 64.9 18.6 16.4 Benardot (1996)19.7±0.2 5800 ±458 1381 ±109 52.1 15.5 31.1 Kirchner et al. (1995)— 8736 2080 44.0 15.0 39.0 Short and Short (1983)36.3±1.0 11004 ±1100 2620 ±262 48.1 13.9 26.2 Kirchner et al. (1996)

drate and lowest fat intake is seen in nationalteam gymnasts, and the lowest carbohydrate andhighest fat is seen in college male gymnasts. Anincrease in fat and protein intake has been pro-posed recently as a means of increasing athleticperformance (Sears 1995), but there is little evi-dence that such a diet would actually improveathletic performance (Coleman 1996). There isgood evidence that increasing dietary fat intakemay not influence energy metabolism to thedegree that increasing carbohydrate intake does(Schutz et al. 1989). Therefore, increasing fatintake may make it easier for a gymnast toincrease body fat than would increasing carbo-hydrate intake. This relationship betweendietary fat intake and body-fat percentage is wellelaborated. In a review of five studies that evalu-ated this relationship in both males and females,all have shown a positive relationship betweenfat intake and body fat storage (Dattilo 1992).Assuming that the gymnastics surveys representa true reflection of the energy distribution ofgymnasts, it appears that most gymnasts wouldbenefit by lowering fat intake and increasing theintake of carbohydrates. However, since carbo-hydrates provide energy in a lower densitypackage than fats, it is conceivable that gymnastscould consume a greater volume of food and stillobtain less total energy. Therefore, care must betaken that this shift in the intake of energy sub-strates does not further reduce the already inade-quate energy intake of gymnasts.
To further discourage gymnasts from consum-ing a low-carbohydrate diet, there is evidencethat low-carbohydrate diets, consumed in con-junction with exercise and training, adverselyaffect the mood state of the athlete (Keith et al.1991). While there are limited data on male gym-nasts, two surveys indicated that protein intakein male gymnasts is 2.0g · kg–1 ·day–1, or morethan 20% of total energy from protein (Short &Short 1983; Brotherhood 1984). By most measures, this level of protein intake is excessiveand is not likely to be optimal for gymnasts(Tarnopolsky et al. 1988; Kaufman 1990; Butter-field et al. 1992). (For information on proteinrequirements in athletes, see Chapter 10.)
The issue of creatine intake (either as pre-formed creatine from dietary meat, or as a crea-tine monohydrate supplement) is an importantone to consider, since several studies havereported that athletes involved in high-intensityanaerobic sports may benefit from a higher levelof creatine intake (Harris et al. 1992; Greenhaff etal. 1993; Balsom et al. 1995; Maughan 1995). In arecently completed study on elite female gym-nasts, it was found that those consuming creatinemonohydrate during an intensive 3-day trainingcamp were better able to maintain anaerobicpower and anaerobic endurance than those con-suming an energy-equivalent placebo (Kozak et al. 1996). Since these gymnasts consumed lessthan their predicted requirement for energy, it isnot possible to know if the same result wouldhave been seen with adequate energy consump-tion. (Creatine metabolism, phosphocreatine andcreatine monohydrate supplementation are sub-jects covered in Chapter 27.)
Given the substantial scientific evidence thatdiets high in carbohydrates, moderate in protein,and low in fat provide the best mix of fuels forboth aerobic and anaerobic activities, there islittle reason to support another type of a dietaryregimen. A starting point for gymnasts would beto increase complex carbohydrate intake anddecrease fat intake, all with an eye toward sup-plying sufficient nutrient and energy to meetphysiological needs.
Nutrient intake
What follows is a review of surveys that haveevaluated nutrient intake in gymnasts. Ingeneral, these surveys indicate that gymnaststypically have intakes that are below establishedrecommended levels in one or more nutrients,likely because total energy intake is also belowdesired levels. It is difficult to predict the truerequirement for nutrients in this populationbecause, although growing, they are small instature with a higher proportion of metabolicmass than the average for people their age.
Most nutrient requirements for highly activeanaerobic (power) athletes have not been well
gymnastics 595

studied. Therefore, it is unclear whether smallstature would translate into a generally lowerrequirement for a nutrient, or the higher leanmass would translate into a generally higherrequirement for a nutrient. In addition, there isno clear way to predict how anaerobic activitiesmight influence nutrient usage (and require-ment) in this population (Table 45.4).
Vitamin A (retinol)
In three studies evaluating vitamin A intake ingymnasts, subjects consumed less than the rec-ommended level of 1000 mgRE (Moffatt 1984; Reggiani et al. 1989; Ersoy 1991). In four othersurveys, gymnasts were found to consume ade-quate levels of vitamin A (Short & Short 1983;Benardot et al. 1989; Lindholm et al. 1995). Thereis no apparent pattern of vitamin A intake amongyounger, older, elite and non-elite gymnasts.When a value of 75% of the RDA is applied to theintake of vitamin A, all surveys indicate that theconsumption of vitamin A in gymnasts is ade-quate. (See Chapters 20 and 21 for information onvitamins.)
Vitamin C (ascorbic acid)
Only one study, which evaluated vitamin C
596 sport-specific nutrition
consumption in 12–13-year-old competitivegymnasts in Italy, noted an intake that was marginally below the recommended intake (56.1vs. 60.0mg; Reggiani et al. 1989). The intake ofvitamin C in four other studies was only margin-ally better than the recommended intake of 60mg ·day–1 (Short & Short 1983; Moffatt 1984;Ersoy 1991; Lindholm et al. 1995). In one surveyof 7–10-year-old and 11–14-year-old gymnasts,the intake of vitamin C was approximatelydouble the recommended level (adjusted for ageand gender; Benardot et al. 1989). (See Chapters20 and 21 for information on vitamins.)
Vitamin B1 (thiamin)
The intake of vitamin B1 was below the recom-mended level of 1.3–1.5mg ·day–1 in threesurveys of gymnasts (Short & Short 1983; Moffatt1984; Reggiani et al. 1989; Ersoy 1991). A margin-ally adequate intake of vitamin B1 was found in7–10-year-old and 11–14-year-old competitivefemale gymnasts (Benardot et al. 1989). The gym-nastic survey data are troubling because of thestrong and well-established association betweenthiamin intake and athletic performance. It islikely that athletes consuming an adequate levelof energy would obtain a sufficient level ofvitamin B1 if a wide variety of foods, emphasiz-
Table 45.4 Summary of selected nutrient intakes in surveys of artistic gymnasts. Values are average intakes.
Vit. A Vit. C Vit. B1 Vit. B2 Niacin Calcium IronSubject group (n) (mgRE) (mg) (mg) (mg) (mgNE) (mg) (mg) Reference
College elite male (10) 1100 97.0 1.10 1.20 16.00 1059 12.0 Short and Short (1983)High-school female (13) 883 83.6 1.04 1.39 13.36 706 11.3 Moffatt (1984)7–10-year-old 1031 129.0 1.40 1.80 17.50 840 11.0 Benardot et al. (1989)
competitive female (29)11–14-year-old 1127 145.0 1.50 1.80 18.20 867 11.0 Benardot et al. (1989)
competitive female (22)12–13-year-old 771 56.1 0.60 0.70 8.70 539 6.2 Reggiani et al. (1989)
competitive female (26)10–12 year-old 834 64.0 0.74 1.45 8.50 397 8.4 Ersoy (1991)
competitive female (20)Elite adolescent female (22) 1200 79.0 — — — 1215 14.0 Lindholm et al. (1995)College elite female (26) — — — — — 683 11.8 Kirchner et al. (1995)

ing complex carbohydrates, are consumed. Sincemost of the gymnastic surveys indicate an under-consumption of energy, an appropriate strategyfor improving vitamin B1 intake in gymnasts isan improvement in total energy consumption.(See Chapters 20 and 21 for information on vitamins.)
Vitamin B2 (riboflavin)
With the exception of a single survey (Benardot et al. 1989), all other nutrient intake studies indi-cate that riboflavin intake is below the RDA of1.5–1.8mg ·day–1. However, when evaluated as0.6mg per 4.2MJ (1000kcal) consumed (the basisof the RDA, assuming normal energy consump-tion), the vitamin B2 intake of gymnasts meets orexceeds the required level in all of the surveys.There are some reports, however, that athletesmay have higher rates of vitamin B2 utilization,and may have a predisposition to mild symp-toms of riboflavin deficiency (particularly cheilo-sis), especially when involved in aerobic work(Belko et al. 1983). It is unclear whether gym-nasts, who consume less energy than their pre-dicted requirements and who have less totalvitamin B2 intake than the RDA, would be atsimilar risk, especially since the majority of theirtraining is anaerobic. (See Chapters 20 and 21 forinformation on vitamins.)
Niacin
Using the niacin RDA for young and adolescentfemales of 15mgNE, three groups of surveyedgymnasts had niacin intakes below the recom-mended level (Moffatt 1984; Reggiani et al. 1989;Ersoy 1991). These groups, including gymnastsin high school, elite gymnasts and very youngcompetitive gymnasts, had intakes of niacin thatranged between 89% and 57% of the recom-mended levels. There is no discernible pattern inthe intake of niacin in the published surveys, so itis not clear whether a recommendation should bemade for an additional intake on niacin in gym-nasts. It is clear, however, that with a balancedintake of food high in complex carbohydrates,
moderate in protein, and moderately low in fat,gymnasts would have little difficulty in obtain-ing the needed niacin from consumed foods. (SeeChapters 20 and 21 for information on vitamins.)
Calcium
The results of several surveys on gymnasts indi-cate a level of calcium intake that is significantlylower than the recommended level of intake (seeTable 45.4). With the exception of the survey con-ducted by Lindholm et al. (1995) on elite adoles-cent females, which found an average calciumintake at the recommended level of 1200mg, allother surveys indicate a calcium intake rangingbetween 397mg (10–12-year-old females) and1059mg (college-age males). Given the fre-quency with which gymnasts suffer from muscu-loskeletal injury, and the degree to which calciumintake is associated with a reduction of skeletalinjury risk, it is alarming that the calcium intakeof gymnasts appears to be so inadequate acrossall groups evaluated (Dixon & Fricker 1993;Nattiv & Mandelbaum 1993; Sands et al. 1993).
Even with inadequate calcium intakes, there is evidence that gymnasts have higher bonemineral densities than those of age-matched con-trols (Nichols et al. 1994; Kirchner et al. 1995). It islikely that the physical stresses placed on theskeleton from gymnastics activity stimulatescalcium deposition in the bone (Slemenda et al.1991; Carbon 1992; Fehily et al. 1992; Vanden-Bergh et al. 1995). It is confounding, however,that gymnasts have high bone densities despitehaving multiple risk factors related to poor bonedevelopment and bone loss, including primaryand secondary amenorrhoea (Sundgot-Borgen1994), high cortisol levels (Licata 1992), lowcalcium intake (VandenBergh et al. 1995), lowweights (Miller et al. 1991), and low heights(Miller et al. 1991). Given the high level of leanbody (muscle) mass found in gymnasts (in the75th percentile for their height and age (Benardot& Czerwinski 1991), it may be that bone density,while high, remains insufficient to support thislevel of muscular force. This latter possibility issupported by the disproportionately high level
gymnastics 597

of skeletal injuries suffered in gymnastics(Dyment 1991). It is prudent therefore to encourage gymnasts to consume at least 1200mg calcium · day–1. There is some evidencethat a higher level of calcium (up to 1500 mgcalcium ·day–1) may be even more beneficial insupporting bone development and reducingskeletal injury risk, especially for young athleticfemales (Carbon 1992). (See Chapter 23 for infor-mation on calcium.)
Iron
The iron intake of gymnasts was found to bebelow the recommended level (15mg· day–1 infemales between 11 and 24 years) in all of thesurveys reviewed (see Table 45.4). This hasnumerous implications for the gymnasts’ resis-tance to disease, but also has implications forgrowth, strength, and the ability to concentrate(Loosli 1993). The current recommendation of 15mg iron · day–1 for adolescents is based on the10-mg adult male and postmenopausal femalerequirement, plus an allowance for menstruallosses and growth (National Research Council1989). In fact, linear growth velocity and enlarge-ment of blood volume during adolescence is the reason the male recommended intake is only slightly lower (12 mg·day–1) than that forfemales (National Research Council 1989). Sincegymnasts have delayed menarche and a slowergrowth velocity than non-gymnasts, it is possibleto conclude that the requirement for iron intakein gymnasts is lower than that for the generalpopulation. With only limited published data onthe actual haemoglobin, haematocrit, and ferritinstatus of gymnasts, it is impossible to fullyunderstand if current iron intakes match actualneed. There are some data indicating, however,that a significant number of gymnasts do havelow low serum iron and a high rate of anaemia(Lindholm et al. 1995).
The typical diet in industrialized nations pro-vides approximately 6 mg of iron per 4.2MJ (1000kcal) of energy (Whitney et al. 1994). Given theenergy intakes seen in past surveys of gymnasts,it is doubtful that gymnasts would consume
598 sport-specific nutrition
more than 12mg iron · day–1. With the exceptionof the subjects in the Lindholm et al. study (1995),where gymnasts consumed close to the recom-mended intake of 14 mg iron ·day–1, and where anumber of gymnasts were found to have lowserum iron, all other nutrient intake surveys indi-cate that gymnasts consume between 6.2 and12.0mg iron ·day–1. Therefore, even assuming nogrowth or menstrual losses of iron, the intake ofiron in gymnasts must be considered inadequate.
A commonly used strategy for reducinganaemia risk or improving a known low bloodiron level is to supplement gymnasts with a dailydose of oral iron (Loosli 1993). However, thisstrategy may not be the most effective techniquefor assuring normal iron status. Recent datasuggest that administration of oral iron every 3–7days is as good as daily dosing in children, andproduces fewer side-effects (Viteri et al. 1992;Gross et al. 1994; Stephenson 1995). It alsoappears that daily oral iron supplementationmay reduce weight gain and growth velocity byinterfering with normal absorptive mechanisms(Idjradinata et al. 1994). Therefore, it seems rea-sonable to suggest that gymnasts consider takinga weekly or bi-weekly supplement of iron andconsume more iron-rich foods to reduce the risk of developing iron-deficiency anaemia. (SeeChapter 24 for information on iron.)
Nutritionally related problemsstudied in gymnasts
Female athlete triad
This triad of disorders represents eating disor-ders (anorexia nervosa, anorexia athletica,bulimia, and other restrictive eating behaviours),amenorrhoea (both primary and secondary), andearly development of osteoporosis (Smith 1996).The degree to which the female athlete triad occursin gymnastics remains unclear because asymptom of eating disorders is denial of thedisease, and surveys typically rely on the respon-dent to provide clear and accurate information(Benardot et al. 1994). There are additional weak-nesses in the reliability of the Eating Disorder

Inventory (Garner et al. 1983) and the Eating Attitude Test (Garner & Garfinkel 1979) whenapplied to athlete populations (Sundgot-Borgen1994). Despite these problems in determiningincidence data, there is no question that thefemale athlete triad exists, and represents aserious and potentially life-threatening reality ingymnastics (Rosen & Hough 1988; Sundgot-Borgen 1994). Therefore, it is important for every-one associated with gymnastics, including teamand personal physicians, nutritionists, judges,coaches, parents, and the athletes themselves, tobecome sensitized to the warning signs of thetriad to ensure that its frequency and seriousnessis controlled.
Weight preoccupation appears to be associatedwith gymnastics training, but disordered eatingpatterns are reduced following retirement fromgymnastics (O’Connor et al. 1996b). It alsoappears that, in initiating disordered eatingbehaviours, gymnasts are trying to achieve anideal body (i.e. small, muscular, strong appear-ance) rather than trying to achieve an ideal bodyfat (O’Connor et al. 1996b).
Eating disorders have also been shown to havea negative impact on athletic performance,although this area has not been well studied.Athletes who lower water intake or increasewater loss to lower weight have been shown tolose endurance and have reduced exercise per-formance (Webster et al. 1990). Fasting, whichwould encourage a faster depletion of muscleglycogen (a critical factor in high-intensity activ-ity such as gymnastics), has also been shown toreduce performance (Sundgot-Borgen 1994).
There is a relationship between dietaryrestraint and menstrual cycle difficulties (short-ened luteal phase length), both of which may beassociated with lower bone density of predomi-nantly trabecular bone (Prior et al. 1990; Barr et al.1994). Trabecular bone, which has a higherturnover rate than cortical bone, is more sensitiveto low circulating oestrogen, while cortical bonemay be stabilized or even increase in densitywith physical activity, even in the presence ofinadequate oestrogen (Slemenda et al. 1991;Carbon 1992). This has been clearly demon-
strated in one study evaluating elite college gym-nasts, which showed an increase in bone mineraldensity despite the presence of amenorrhoea or oligomenorrhoea (Nichols et al. 1994). (SeeChapter 40 for information on eating disorders inathletes, Chapter 32 for information on theyoung athlete, and Chapter 31 for information onthe female athlete.)
Gymnastics injuries
Although gymnastics is commonly mentioned asa hazardous sport, a review of all the injuriesreported between 1982 and 1991 in 42 male and74 Australian female elite artistic gymnastsfound a low number of severe injuries and no catastrophic injuries (Dixon & Fricker 1993). In astudy analysing posture, spinal sagittal mobility,and subjective back problems in former femaleelite gymnasts, it was determined that the gym-nasts had fewer problems than an age-matchedcontrol group (27% vs. 38%, respectively; Tsai &Wredmark 1993).
Despite these data, it is clear that gymnasticsinjuries do occur, and often it is an injury thattakes talented gymnasts out of the sport. In thestudy by Dixon and Fricker (1993), stress frac-tures of the lumbosacral spine accounted for 45%of all bony injuries in female gymnasts. The feetaccounted for 32% of stress fractures and 28% ofall bony injuries. In male gymnasts, stress frac-tures of the lumbosacral spine accounted for 33%of all stress fractures and 16% of all bony injuries.In the male gymnasts, there were approximatelythe same number of stress fractures and fractures(Dixon & Fricker 1993). A 5-year prospectivestudy by Sands et al. (1993) determined that anew injury was expected to occur nine out of every 100 training exposures, with the mostfrequent injuries related to repetitive stress syndrome. There was a higher injury incidenceassociated with competitions and performanceof full routines than training (Sands et al. 1993).
The nutritional relationship to injury is diffi-cult to prove, but several studies have demon-strated a relationship between injury frequencyand nutritional factors. Muscle-glycogen deple-
gymnastics 599

tion is associated with fatigue, muscle fibredamage, and joint weakness that could predis-pose an athlete to skeletal injury (Schlabach1994). An adequate calcium intake of 1500mg ·day–1 may impart some degree of safetyin helping to reduce fracture risk (Heaney 1991),and if it is not possible to obtain sufficientcalcium through food consumption, calciumsupplementation has been found to be effectivein increasing bone mineral density in children(Johnston et al. 1992).
Attainment of ideal body composition
The literature is filled with data showing that
600 sport-specific nutrition
competitive gymnasts, regardless of age, havebody fat levels that are lower than those of age-matched control groups (O’Connor et al. 1996a).The best male gymnasts, who attain their top ath-letic performances in late adolescence, tend tohave low body fat levels (3–4% has been reportedin the literature), and an average lean bodyweight of 63.5 kg (Bale & Goodway 1990). Whenfemale gymnasts reach the elite ranks in mid- tolate adolescence, they tend to have weights ofabout 50kg, with body fat levels of between 10%and 16% (Bale & Goodway 1990).
Gymnasts appear to be particularly suscepti-ble to methods of achieving desirable weight andbody composition that are commonly described
Fig. 45.2 In both men’s andwomen’s gymnastics, a highpower to mass ratio is essential.Elite competitors arecharacterized by good muscledevelopment and low body fatcontent. (a) Photo © Allsport / M.Powell. (b) Photo © Allsport / D.Pensinger.
(a)
(b)

as ‘pathogenic’ (Rosen et al. 1986). In fact, gym-nasts are often seen as having a body composi-tion that is most similar to that seen in anorexicsand female long-distance runners. The onlymajor difference observed between these groupsis a slightly higher body-fat percentage andlower lean body mass in the anorexics (Bale et al.1996). The physical development of the upperbody may exacerbate the development of eatingproblems. It has been shown that gymnasts havea well-developed upper-body musculature thatmay limit movement of the thorax to reduce itsresting end-expiratory size. This limitation mayreduce a gymnast’s ventilation efficiency, lower-ing oxygen flow to the working muscles (Barlett
et al. 1984). This reduction in oxygen exchangemay exacerbate the difficulties many gymnastsexperience in maintaining ideal body weight byreducing fat metabolism capability, and mayhelp to explain why so many gymnasts aredriven to pathogenic weight control methods toachieve the desired body composition.
Data from several surveys (Tables 45.5, 45.6)generally indicate a steady rise in height andweight by age. Using the statistical technique ofmeta-analysis, it was determined that age is sig-nificantly correlated to body-fat percentage (r =0.712; P =0.004), height (r= 0.720; P=0.002) andweight (r =0.829; P= 0.000). However, body-fatpercentage is not significantly correlated to
gymnastics 601
Table 45.5 Heights, weights and body-fat percentages of gymnasts.
Population, Height Weight Body fatage in years (n) (cm) (kg) (%) Method Reference
Junior elite, 131.1±6.6 27.3±4.1 8.6 ±2.0 Skinfolds Benardot and Czerwinskiage 9.1 (100) (1991)
Junior elite, 134.9 30.6 9.3 Skinfolds Benardot et al. (1989)age 9.4 (51)
Junior elite, 141.0±6.9 32.8±4.9 9.2 ±1.9 Skinfolds Benardot and Czerwinskiage 11.3 (46) (1991)
Junior elite, 142.0±2.8 31.6±1.5 21.5 Skinfolds Ersoy (1991)age 11.5 (19)
Junior club, 145.8±8.5 37.9±6.9 15.0 ±3.5 Bioelectrical Reggiani et al. (1989)age 12.3 (26) impedence
Junior elite, 142.0±1.3 33.2±1.0 14.9 ±0.7 Skinfolds Theintz et al. (1993)age 12.3 (22)
Junior elite, 148.0±9.6 39.9±7.9 10.9 ±3.2 Hydrostatic Bale et al. (1996)age 13.3 (20) weighing
Club level, age 152.0 43.5 — — Calabrese (1985)14.8 (20)
Junior elite, 158.0 46.8 13.2 Skinfolds Lindholm et al. (1995)age 14.8 (22)
High school, 161.1±3.8 50.4±6.5 13.1±5.1 Hydrostatic Moffatt (1984)age 15.2 (13) weighing
National team, 153.3±5.9 46.9±6.1 11.3±3.7 DEXA Benardot (1996)age 15.8 (22)
College, age 159.4±4.3 55.0±6.5 15.6±2.9 DEXA Robinson et al. (1995)19.5 (21)
College, age 158.7±4.8 53.0±6.1 16.8±3.2 Hydrostatic Barlett et al. (1984)19.7 (10) weighing
College, age 158.0±1.1 54.1±1.2 17.0 ±0.5 DEXA Kirchner et al. (1995)19.7 (26)
Former elite, 161.6±1.5 59.7±1.8 23.9 ±1.0 DEXA Kirchner et al. (1996)age 36.3 (18)

height and weight in these populations. This isdue to the notable exceptions in body-fat trendsseen in the more competitive groups analysed.These more competitive gymnasts have higherweights, but lower body fat, indicating that themore elite gymnasts have more muscle mass perunit weight. The least competitive of the groupsanalysed are the tallest, weigh the most, andhave the highest body fats for their age groups.This finding is in agreement with a study ofyoung highly elite gymnasts, who were in the25th percentile for height/age and weight/age,but in the 75th percentile for arm-muscle circum-ference and arm-muscle area (Benardot & Czerwinski 1991).
It was pointed out in a study by Grediagin et al.(1995) that exercise of different intensities is notrelated to differential changes in body fat if thetotal energy burned is equivalent. In this study, itwas determined that change in body fat wasequivalent in high- and low-intensity activity,but low-intensity exercise (aerobic) caused agreater change in weight because the high-intensity activity was better able to maintain (orincrease) lean body mass. Therefore, seeing lowbody fat levels and high lean body mass in highlyactive gymnasts involved in high-intensityanaerobic activity is not unexpected.
A standard technique used by gymnasts toattain (or retain) what they perceive to be an idealbody for gymnastics is restrained eating. Thereare several questions about whether restrainedeating is, ultimately, a good strategy for achiev-ing this end since we have adaptive mechanismsthat tend to stabilize tissue composition, even inthe presence of altered energy intake (Flatt 1987;
602 sport-specific nutrition
Saltzman & Roberts 1995). A study by Benardot(1996) demonstrated this point. In evaluatingenergy balance by monitoring within-day energyimbalances on national team gymnasts, he foundthat the size of the largest energy deficit within aday was significantly correlated (r= 0.583; P=0.004) to body-fat percentage, and the number ofenergy deficits within a day that were greaterthan 300kcal explained a sufficient amount ofvariance in body-fat percentage that it could bepredicted (see section on energy intake, above).In addition, total energy intake had a significantnegative correlation with body-fat percentage (r =0.418; P= 0.038). That is, the lower the energyintake, the higher the body-fat percentage. Thisadaptive response of lower energy expenditureand higher body-fat storage with inadequateenergy intake may drive gymnasts to continuallyeat less to achieve the desired body profile. Sadly,this restrained eating pattern may also be thestimulus to the eventual development of disor-dered eating and related problems that are sooften seen in gymnasts.
Growth retardation
Gymnasts are significantly smaller than non-gymnasts of the same age and they appear to bemissing the distinct growth spurt typically seenin adolescence (Lindholm et al. 1994). However, itremains unclear whether this shorter stature isdue to a self-selection in the sport, which mayattract and retain small individuals, or if there isa real stunting of growth that occurs as a result ofparticipation in gymnastics. It has been reportedthat gymnasts who train more than 18 h ·week–1
Table 45.6 Meta-analysis: Pearson correlation coefficients of means.
Age (years) Body fat (%) Height (cm) Weight (kg)
Age (years) 1.000 0.712* 0.720* 0.829*Body fat (%) 0.712* 1.000 0.505 0.520Height (cm) 0.720* 0.505 1.000 0.961*Weight (kg) 0.829* 0.520 0.961* 1.000
*Correlation is significant at the 0.01 level (2-tailed).

before and during puberty do, if fact, havemarked stunting of growth (Theintz et al. 1993).Theintz et al. (1993) also pointed out that, if thisintensive exercise schedule occurred beforepuberty, the gymnasts would permanently alterthe growth rate and keep them from ever reach-ing full adult height. It was particularly noted inthis study that leg length was significantlystunted in gymnasts, resulting in a marked difference in sitting height/leg-length ratiowhen compared to age-equivalent swimmers.This stunting of leg length was associated with arelated reduction in predicted height. However,these data do not agree with those of Claessens etal. (1992), who found that artistic gymnasts donot differ from non-athletes in leg length, but dohave broader shoulders relative to hips. The dataof Claessens et al. (1992) and Theintz et al. (1993)do agree in the area of height and weight. Thesedata demonstrate that gymnasts between theages of 13 and 20 are considerably shorter andlighter with narrower hips than age-matchednon-gymnasts.
It is unclear whether the reduced growth ingymnasts is due to a diet-related inhibition of thehypothalamic–pituitary–gonadal axis from inad-equate energy and nutrient intake, or from thecombination of inadequate energy and nutrientscoupled with a heavy training regimen (Lind-holm et al. 1994). It is possible that iron statusplays a role in this reduced growth. Anaemia,which is seen in about one-third of the gymnastsevaluated, is associated with poor growth veloc-ity in children (Lifshitz et al. 1987; Benardot et al.1989; Lindholm et al. 1995). Gymnasts have sig-nificantly delayed age of menarche when com-pared to non-gymnasts, and are also shorter andlighter.
It has been suggested that, because gymnastsfail to achieve normal growth velocity duringwhat should be the adolescent growth spurt,gymnastic training should be decreased (Mans-field & Emans 1993). It is hypothesized thatdecreased training would reduce the incidence ofathletic amenorrhoea and the associated hypo-oestrogenaemia that is associated with decreasedbone density and delayed puberty.
Summary recommendations
General guidelines
Exercise causes two fundamental physiologicalevents: the body burns energy at a faster rate,and the increase in energy usage causes bodytemperature to rise, causing a greater rate ofwater loss through sweat. Therefore, gymnastsshould consume sufficient energy to meet theneeds of activity plus the needs of growth, andshould consume sufficient fluids to ensure ade-quate hydration. Both the provision of sufficientenergy and fluids will improve athletic perfor-mance by assuring sufficient glycogen andnormal muscle function (muscles are approxi-mately 70% water when optimally hydrated)(Hargreaves 1996).
The majority of food consumed should befrom complex carbohydrates, but the consump-tion of fibrous vegetables should be avoided for several hours before training or competitionbecause they are gas causing and may make thegymnast feel uncomfortable from distention. It isnot necessary to avoid fat consumption, but aslight lowering of fat intake coupled with anincrease in carbohydrate intake may be a desir-able dietary change for many gymnasts. This canmost easily be achieved through limited con-sumption of fried foods, visible fats (butter, mar-garine, meat fat, etc.), and fatty dairy products.There should be a reliance on food rather thanvitamin and mineral supplements for obtainingneeded nutrients, but the intake of certainmineral supplements (calcium and iron in par-ticular) may be advisable under some circum-stances. Periodic consumption of lean red meat isadvisable, in that it is an excellent source of ironand zinc, and may improve the availability ofcreatine or its precursors (amino acids).
Restrained eating behaviours are counterpro-ductive and may initiate more serious pathologicdisordered eating patterns. Therefore, gymnastsshould try to maintain a frequent eating andsnacking pattern to maintain metabolic rate and blood glucose, and improve total energy andnutrient intake. Small but frequent meals and
gymnastics 603

snacks are better than larger less frequent meals,even when the total energy and nutrient contentof the meals is similar.
Fluid consumption should be constant tomaintain optimal hydration status. Both waterand sports beverages are appropriate for gym-nasts. Avoidance of thirst is important, since the thirst sensation does not occur until there has been a significant lowering of total bodywater (Harkins et al. 1993). Returning the body to normal hydration after this occurs is time consuming, and may interfere with a normaltraining schedule.
Precompetition/pretraining eating
The two main goals for the precompetition/pre-training eating (PCPTE) include the provision ofenergy to see the athlete through a significantportion of the PCPTE, and sufficient fluid toassure optimally hydrated muscles. The PCPTEis not a time to experiment with untried eatingregimens or new foods. In general, the PCPTEshould focus on providing starch-based carbohy-drates (bread, pasta, rice, etc.) and fluids. Provi-sion of a nutritionally balanced meal should notbe a major concern at this time, especially if nutritious foods are commonly consumedduring other times.
There should be adequate opportunity forgastric emptying before the initiation of exercise.Because fats cause a delay in gastric emptying,fat intake for the PCPTE should be kept as low aspossible. If the meal consumed is large, it shouldbe completed 3.5–4.0h prior to the initiation of the PCPTE. Small meals can be completed2.0–3.0h before exercise. Light carbohydratesnack (crackers, etc.) may be consumed within 1h of exercise, but solid foods should always be consumed with fluids (Harkins et al. 1993).
Athletes with nervous stomachs may not toler-ate solid food well before competition, yet theystill require energy to fuel the activity. One possi-ble solution for this group is to consume largeamounts of carbohydrate the day before the competition, and consume only small periodicsnacks with fluids on the day of competition.
604 sport-specific nutrition
Fluid consumption should be sufficient beforethe PCPTE to produce clear urine. The usual rec-ommendation is the consumption of 235–470 mlof fluid 2h before the PCPTE, followed by 115–235ml of fluid immediately before the PCPTE(Burke 1996; O’Connor 1996).
Eating during competition/practice
Gymnasts require some source of energy duringtraining and competition. Two main strategiesmay be tried during training. One strategy is to consume a sports beverage that contains carbohydrate energy throughout the practice.Consumption of approximately 115–235 ml of beverage every 15–20 min is the generallyaccepted recommendation (American College ofSports Medicine 1996), but the amount should beadjusted by the size of the gymnast and environ-mental heat and humidity. It is important toavoid drinking a great deal all at one time, sincethat may cause difficulties with training. Instead,the gymnast must become accustomed tosipping on the beverage periodically. Anotherstrategy is to consume water (115–235ml ofwater every 15–20 min), and take a brief (10 min)snack break 2.5–3.0 h after the initiation of prac-tice. A snack may include several crackers andsome sports beverage, or several bites of a bagelwith some sports beverage. The goal is to assurethat blood glucose is maintained.
During gymnastics competition, it is not reasonable to assume that the gymnast will beable to take a snack break. Therefore, gymnastsshould periodically sip small amounts of sportsbeverage between events throughout the compe-tition (115–235 ml every 15–20min when possi-ble; O’Connor 1996). Since this is the only logicaltechnique to be following during competition,gymnasts should consider this the best techniqueto follow during practice, so as to become wellpracticed in this consumption pattern.
Postcompetition/postpractice eating
Muscles are very receptive to replacing glycogenwithin the first hour following strenuous activity.
Therefore, gymnasts should have carbohydr-ate snacks available to consume immediately following training or competition. Ideally, thegymnast should consume 840–1670kJ (200–400kcal) (one medium-sized bagel is 695kJ or165kcal; 1 cup pasta is 900kJ or 215kcal) immedi-ately following the activity, and then consume anadditional 840–1260 kJ (200–300 kcal) of carbohy-drate within the next several hours (Harkins etal. 1993). As always, fluids should be consumedwhen solid foods are consumed. Every effortshould be made by the gymnast to return hydra-tion to a precompetition state (Burke 1996).
References
American College of Sports Medicine (1996) Exerciseand fluid replacement (position stand). Medicine andScience in Sports and Exercise 28, i–vii.
Bale, P. & Goodway, J. (1990) Performance variablesassociated with the competitive gymnast. SportsMedicine 10, 139–145.
Bale, P., Doust, J. & Dawson, D. (1996) Gymnasts, dis-tance runners, anorexics body composition and men-strual status. Journal of Sports Medicine and PhysicalFitness 36, 49–53.
Balsom, P.D., Soderlund, K., Sjodin, B. & Ekblom, B.(1995) Skeletal muscle metabolism during shortduration high intensity exercise: influence of creatinesupplementation. Acta Physiologica Scandinavica 154,303–310.
Barlett, H.L., Mance, M.J. & Buskirk, E.R. (1984) Bodycomposition and expiratory reserve volume infemale gymnasts and runners. Medicine and Science inSports and Exercise 16, 311–315.
Barr, S.I., Prior, J.C. & Vigna, Y.M. (1994) Restrainedeating and ovulatory disturbances: possible implica-tions for bone health. American Journal of ClinicalNutrition 59, 92–97.
Belko, A.Z., Obarzanke, E., Kalkwarf, H.J. et al. (1983)Effects of exercise on riboflavin requirements ofyoung women. American Journal of Clinical Nutrition37, 509–517.
Benardot, D. (1996) Working with young athletes:views of a nutritionist on the sports medicine team.International Journal of Sport Nutrition 6, 110–120.
Benardot, D. & Czerwinski, C. (1991) Selected bodycomposition and growth measures of junior elitegymnasts. Journal of the American Dietetic Association91 (1), 29–33.
Benardot, D., Schwarz, M. & Heller, D.W. (1989) Nutri-ent intake in young, highly competitive gymnasts.Journal of the American Dietetic Association 89, 401–403.
Benardot, D., Joye, A. & Shah, B. (1993) Talent opportu-nity program (TOPS) gymnasts: nutrient intake andbody composition assessment results. Technique 13,17–20.
Benardot, D., Engelbert-Fenton, K., Freeman, K., Hart-sough, C. & Steen, S.N. (1994) Eating Disorders in Athletes: the Dietician’s Perspective. Sports ScienceExchange Roundtable, Gatorade Sports ScienceInstitute, Series No. 5.
Bergstrom, J., Hermansen, L., Hultman, E. & Saltin, B.(1967) Diet, muscle glycogen, and physical perfor-mance. Acta Physiologica Scandinavica 71, 140–150.
Bortz, S., Schoonen, J.C., Kanter, M., Kosharek, S. &Benardot, D. (1993) Physiology of anaerobic andaerobic exercise. In Sports Nutrition: A Guide for theProfessional Working with Active People (ed. D. Benar-dot), pp. 2–10. The American Dietetic Association,Chicago, IL.
Burke, L.M. (1996) Rehydration strategies before andafter exercise. Australian Journal of Nutrition and Diet53 (Suppl. 4), S22–S26.
Burke, L.M., Collier, G.R. & Hargreaves, M. (1993)Muscle glycogen storage after prolonged exercise:effect of the glycemic index of carbohydrate feed-ings. Journal of Applied Physiology 75, 1019–1023.
Butterfield, G., Cady, C. & Moynihan, S. (1992) Effect ofincreasing protein intake on nitrogen balance inrecreational weight lifters. Medicine and Science inSports and Exercise 24, S71.
Brotherhood, J.R. (1984) Nutrition and sports perfor-mance. Sports Medicine 1, 350–389.
Calabrese, L.H. (1985) Nutritional and medical aspectsof gymnastics. Clinics in Sports Medicine 4, 23–30.
Carbon, R.J. (1992) Exercise, amenorrhoea and theskeleton. British Medical Bulletin 48, 546–560.
Claessens, A.L., Malina, R.M., Lefevre, J. et al. (1992)Growth and menarcheal status of elite female gym-nasts. Medicine and Science in Sports and Exercise 24,755–763.
Coggan, A.R. & Coyle, E.F. (1988) Effect of carbohy-drate feedings during high-intensity exercise. Journalof Applied Physiology 65, 1703–1705.
Coleman, E.J. (1996) The BioZone Nutrition System: A dietary panacea? International Journal of SportNutrition 6, 69–71.
Costill, D.L., Bowers, R., Branam, G. & Sparks, K. (1971)Muscle glycogen utilization during prolonged exer-cise on successive days. Journal of Applied Physiology31, 834–838.
Crim, M.C., Calloway, D.H. & Margen, S. (1976) Creatine metabolism in men: creatine pool size and turnover in relation to creatine intake. Journalof Nutrition 106, 371–381.
Dattilo, A.M. (1992) Dietary fat and its relationship tobody weight. Nutrition Today 27, 13–19.
Dixon, M. & Fricker, P. (1993) Injuries to elite gymnasts
gymnastics 605

over 10 years. Medicine and Science in Sports and Exercise 25, 1322–1329.
Dyment, P.G. (ed.) (1991) Sports Medicine: Health Care for Young Athletes, 2nd edn. American Academy ofPediatrics, Elk Grove Village, IL.
Ersoy, G. (1991) Dietary status and anthropometricassessment of child gymnasts. Journal of Sports Medi-cine and Physical Fitness 31, 577–580.
Fehily, A.M., Coles, R.J., Evans, W.D. & Elwood, P.C.(1992) Factors affecting bone density in youngadults. American Journal of Clinical Nutrition 56,579–586.
Flatt, J.P. (1987) Dietary fat, carbohydrate balance, andweight maintenance: effects of exercise. AmericanJournal of Clinical Nutrition 45, 296–306.
Garner, D.M. & Garfinkel, P.E. (1979) An index ofsymptoms of anorexia nervosa. Psychological Medi-cine 9, 273–279.
Garner, D.M., Olmsted, M.P. & Polivy, J. (1983) Devel-opment and validation of a multidimensional eatingdisorder inventory for anorexia nervosa andbulimia. International Journal of Eating Disorders 2,15–34.
Grediagin, A., Cody, M., Rupp, J., Benardot, D. & Shern,R. (1995) Exercise intensity does not effect body com-position change in untrained, moderately overfatwomen. Journal of the American Dietetic Association 95,661–665.
Greenhaff, P.C., Casey, A., Short, A.H., Harris, R.,Soderlund, K. & Hultman, E. (1993) Influence of oralcreatine supplementation of muscle torque duringrepeated bouts of maximal voluntary exercise inman. Clinical Science 84, 565–571.
Gross, R., Schultink, W. & Juliawati (1994) Treatment ofanemia with weekly iron supplementation. Lancet344, 821.
Hargreaves, M. (1996) Physiological benefits of fluidand energy replacement during exercise. AustralianJournal of Nutrition and Dietetics 53 (Suppl. 4), S3–S7.
Harkins, C., Carey, R., Clark, N. & Benardot, D. (1993)Protocols for developing dietary prescriptions. InSports Nutrition: A Guide for the Professional Workingwith Active People (ed. D. Benardot), pp. 170–185.American Dietetic Association, Chicago, IL.
Harris, R.C., Soderlund, K. & Hultman, E. (1992) Eleva-tion of creatine in resting and exercised muscle of normal subjects by creatine supplementation.Clinical Science 83, 367–374.
Heaney, R.P. (1991) Effect of calcium on skeletal devel-opment, bone loss, and risk of fractures. AmericanJournal of Medicine 91 (Suppl. 5B), 23–28.
Houtkooper, L.B. & Going, S.B. (1994) Body composi-tion: how should it be measured? Does it affect sportperformance? Gatorade Sports Science Exchange 7 (5s),SSE#52.
606 sport-specific nutrition
Idjradinata, P., Watkins, W.E. & Pollitt, E. (1994)Adverse effect of iron supplementation on weightgain of iron-replete young children. Lancet 343,1252–1254.
Ivy, J.L., Katz, A.L., Cutler, C.L., Sherman, W.M. &Coyle, E.F. (1988) Muscle glycogen synthesis afterexercise: effect of time of carbohydrate ingestion.Journal of Applied Physiology 64, 1480–1485.
Johnston, C.C., Miller, J.Z., Slemenda, C.W., Reister,T.K., Hui, S., Christian, J.C. & Peacock, M. (1992)Calcium supplementation and increases in bonemineral density in children. New England Journal ofMedicine 327, 82–87.
Kaufman, D.A. (1990) Protein as an energy substrateduring intense exercise. Annals of Sports Medicine 5,142.
Keith, R.E., O’Keeffe, K.A., Blessing, D.L. & Wilson,G.D. (1991) Alterations in dietary carbohydrate,protein, and fat intake and mood state in trainedfemale cyclists. Medicine and Science in Sports andExercise 23, 212–216.
Kirchner, E.M., Lewis, R.D. & O’Connor, P.J. (1995)Bone mineral density and dietary intake of femalecollege gymnasts. Medicine and Science in Sports andExercise 27, 543–549.
Kirchner, E.M., Lewis, R.D. & O’Connor, P.J. (1996)Effect of past gymnastics participation on adult bonemass. Journal of Applied Physiology 80, 226–232.
Kozak, C.J. (1996) The effect of creatine monohydrate sup-plementation on anaerobic power and anaerobicendurance in elite female gymnasts. Master’s Thesis,Georgia State University.
Lemons, P.W.R. (1989) Nutrition for muscular develop-ment of young athletes. In Perspectives in ExerciseScience and Sports Medicine. Vol. 2. Youth, Exercise, andSport (ed. C.V. Gisolfi & D.R. Lamb), pp. 370–371.Benchmark Press, Indianapolis, IN.
Licata, A.A. (1992) Stress fractures in young athleticwomen: case reports of unsuspected cortisol-induced osteoporosis. Medicine and Science in Sportsand Exercise 24, 955–957.
Lifshitz, S., Moses, N., Cervantes, C. & Ginsberg, L.(1987) Nutritional dwarfing in adolescents. Seminarsin Adolescent Medicine 3, 255–266.
Lindholm, C., Hagenfeldt, K. & Ringertz, B.-M. (1994)Pubertal development in elite juvenile gymnasts:effects of physical training. Acta Obstetrica et Gynaeco-logica Scandinavica 73, 269–273.
Lindholm, C., Hagenfeldt, K. & Hagman, U. (1995) Anutrition study in juvenile elite gymnasts. Acta Paedi-atrica 84, 273–277.
Loosli, A.R. (1993) Reversing sports-related iron andzinc deficiencies. Physician and Sportsmedicine 21,70–78.
McArdle, W.D., Katch, F.I. & Katch, V.L. (1986) Exercise
Physiology: Energy, Nutrition, and Human Performance,2nd edn. Lea & Febiger, Philadelphia, PA.
Maddux, G.T. (1970) Men’s Gymnastics. Good year Pub-lishing, Pacific Palisades, CA.
Mansfield, M.J. & Emans, S.J. (1993) Growth in femalegymnasts: should training decrease during puberty?Journal of Pediatrics 122, 237–240.
Maughan, R.J. (1995) Creatine supplementation andexercise performance. International Journal of SportNutrition 5, 94–101.
Maughan, R. & Poole, D. (1981) The effects of a glycogen-loading regimen on the capacity toperform anaerobic exercise. European Journal ofApplied Physiology 46, 211–214.
Miller, J.Z., Slemenda, C.W., Meaney, F.J., Reister, T.K.,Hui, S. & Johnston, C.C. (1991) The relationship ofbone mineral density and anthropometric variablesin healthy male and female children. Bone andMineral 14, 137–152.
Moffatt, R.J. (1984) Dietary status of elite female highschool gymnasts: inadequacy of vitamin and mineralintake. Journal of the American Dietetic Association 84,1361–1363.
National Research Council Committee on DietaryAllowances (1989) Recommended Dietary Allowances.National Academy of Sciences, Washington, DC.
Nattiv, A. & Mandelbaum, B.R. (1993) Injuries andspecial concerns in female gymnasts: detecting, treat-ing, and preventing common problems. Physicianand Sportsmedicine 21, 66–81.
Nichols, D.L., Sanborn, C.F., Bonnick, S.L., Ben-ezra, V.,Gench, B. & DiMarco, N.M. (1994) The effects ofgymnastics training on bone mineral density. Medi-cine and Science in Sports and Exercise 26, 1220–1225.
O’Connor, H. (1996) Practical aspects of fluid replace-ment. Australian Journal of Nutrition and Dietetics 53(Suppl. 4), S27–S34.
O’Connor, P.J., Lewis, R.D. & Boyd, A. (1996a) Healthconcerns of artistic women gymnasts. Sports Medicine21, 321–325.
O’Connor, P.J., Lewis, R.D., Kirchner, E.M. & Cook,D.B. (1996b) Eating disorder symptoms in formerfemale college gymnasts: relations with body com-position. American Journal of Clinical Nutrition 64,840–3.
Prior, J.C., Vigna, Y.M., Schechter, M.T. & Burgess, A.E.(1990) Spinal bone loss and ovulatory disturbances.New England Journal of Medicine 323, 1221–1227.
Reggiani, E., Arras, G.B., Trabacca, S., Senarega, D. &Chiodini, G. (1989) Nutritional status and body com-position of adolescent female gymnasts. Journal ofSports Medicine 29, 285–288.
Robinson, T.L., Snow-Harter, C., Taaffe, D.R., Gillis, D.,Shaw, J. & Marcus, R. (1995) Gymnasts exhibit higherbone mass than runners despite similar prevalence
of amenorrhea and oligomenorrhea. Journal of Boneand Mineral Research 10, 26–35.
Rosen, L.W. & Hough, D.O. (1988) Pathogenic weight-control behaviors of female college gymnasts. Physi-cian and Sportsmedicine 16, 141–146.
Rosen, L.W., McKeag, D.B., Hough, D.O. & Curley, V.(1986) Pathogenic weight control behavior in femaleathletes. Physician and Sportsmedicine 14, 79.
Saltzman, E. & Roberts, S. (1995) The role of energyexpenditure in energy regulation: findings from adecade of research. Nutrition Reviews 53, 209–220.
Sands, W.A., Shultz, B.B. & Newman, A.P. (1993)Women’s gymnastics injuries: a 5-year study. American Journal of Sports Medicine 21, 271–276.
Schlabach, G. (1994) Carbohydrate strategies for injuryprevention. Journal Athletic Training 29, 245–254.
Schutz Y., Flatt, J.P. & Jequier, E. (1989) Failure ofdietary fat intake to promote fat oxidation: a factorfavoring the development of obesity. AmericanJournal of Clinical Nutrition 50, 307–314.
Sears, B. (1995) The Zone. ReganBooks, New York.Short, S.H. & Short, W.R. (1983) Four-year study of uni-
versity athletes’ dietary intake. Journal of the AmericanDietetic Association 82, 632–645.
Slemenda, C.W., Miller, J.Z., Hui, S.L., Reister, T.K. &Johnston, C.C. (1991) Role of physical activity in thedevelopment of skeletal mass in children. Journal ofBone and Mineral Research 6, 1227–1233.
Smith, A.D. (1996) The female athlete triad: causes,diagnosis, and treatment. Physician and Sportsmedi-cine 24, 67–76.
Stephenson, L.S. (1995) Possible new developments in community control of iron-deficiency anemia.Nutrition Reviews 53, 23–30.
Sundgot-Borgen, J. (1994) Eating disorders in femaleathletes. Sports Medicine 17, 176–188.
Tarnopolsky, M.A., MacDougall, J.D. & Atkinson, S.A.(1988) Influence of protein intake and training statuson nitrogen balance and lean body mass. Journal ofApplied Physiology 64, 187–193.
Theintz, G.E., Howald, H., Weiss, U. & Sizonenko, C.(1993) Evidence for a reduction of growth potentialin adolescent female gymnasts. Journal of Pediatrics122, 306–313.
Tsai, L. & Wredmark, T. (1993) Spinal posture, sagittalmobility, and subjective rating of back problems informer female elite gymnasts. Spine 18, 872–875.
VandenBergh, M.F.Q., DeMan, S.A., Witteman, J.C.M.,Hofman, A., Trouerbach, W. & Grobbee, D.E. (1995)Physical activity, calcium intake, and bone mineralcontent in children in the Netherlands. Journal Epi-demiology and Community Health 49, 299–304.
Viteri, F.E., Liu, X.-N. & Morris, M. (1992) Iron (Fe)retention and utilization in daily vs. every 3 days Fesupplemented rats. FASEB Journal 6, A1091.
gymnastics 607

Webster, S., Rutt, R. & Weltman, A. (1990) Physiologicaleffects of weight loss regimen practiced by collegewrestlers. Medicine and Science in Sports and Exercise22, 229–233.
Whitney, E.N., Cataldo, C.B. & Rolfes, S.R. (1994)
608 sport-specific nutrition
Understanding Normal and Clinical Nutrition, 4th edn.West Publishing, Minneapolis/St Paul, MO.
Wooton, S.A. & Williams, C. (1984) Influence of carbo-hydrate status on performance during maximal exer-cise. International Journal of Sports Medicine 5, S126.
Introduction
Competitive swimming is a sport practisedworldwide and includes swimming events ofvaried distances (50–1500 m, 22 s to 16 min) andstroke styles (freestyle or crawl stroke, back-stroke, breaststroke and butterfly). Competitiveswimming meets are held year-round and theage range of the swimmers is between 6 and 80years. In the United States alone there arebetween 1.0 and 1.5 million competitive swim-mers affiliated with community club teams, highschool teams, college teams, and masters swimming teams (M.L. Unger, personal communication).
Each swimming practice session can last up toabout 3h and may include a total swimmingvolume of 10000 metres or yards. During thistime, swimmers are engaged in various types oftraining that include long-distance endurancetraining, interval training, sprint training, andstroke instruction. The specific stroke stylesswum during training depend on the athlete’sspecialty, but most swimmers swim at least 75%of their total training volume in freestyle. Thistraining is frequently done twice per day and 6days per week. In addition to this, many swim-mers also participate in dry land training such as strength training or supplemental endurancerunning or cycling. Thus, the nutritionaldemands of training in this sport can be quiteextraordinary.
Energy demands of swimming training
The large volume of intensive training of theseathletes imposes a tremendous demand onenergy supply. Sherman and Maglischo (1992)have estimated the energy requirement of swimming training at approximately 16.8–22.6MJ ·day–1 (4000–5400 kcal ·day–1) for malesworking 4 h ·day–1 and between 14.2 and 16.8MJ ·day–1 (3400–4000 kcal · day–1) for femalesworking 4h · day–1. Certainly, these values willvary considerably according to such factors as the intensity of the exercises used, theswimmer’s body mass, and mechanical effi-ciency. Nevertheless, these high energy needscan be difficult for swimmers to meet.
Several studies have examined the daily dietsof competitive swimmers to determine if energyneeds are being met. Van Handel et al. (1984)used diet records to examine the energy intakesof 14 female and 13 male competitive swimmerswho had competed in the US National Champi-onhips and were preparing for the OlympicTrials. Their findings indicate that the energyintake of the men averaged 18.2MJ · day–1
(4350 kcal ·day–1), with a range between 12.6 and28.6MJ ·day–1 (3010–6830 kcal ·day–1). Expressedrelative to body weight, these men were consum-ing an average of 0.22 MJ · kg–1 (50 kcal ·kg–1). Thewomen had energy intakes averaging 9.6MJ ·day–1 (2300 kcal ·day–1), with a range between 6.3 and 13.8MJ · day–1 (1500–3300 kcal ·day–1).Relative to body weight, these women consumed
Chapter 46
Swimming
RICK L. SHARP
609

an average of 0.15MJ ·kg–1 (36 kcal · kg–1). Dis-tribution of energy for these athletes was 49% of energy from carbohydrate and 34% of energyfrom fat for the men, while the women reported53% of energy from carbohydrate and 30% ofenergy from fat.
Berning et al. (1991) reported energy intakes of adolescent developmental level swimmersattending a training camp. Males consumed anaverage of 21.9 MJ ·day–1 (5230 kcal ·day–1) whilefemales reported 15.0MJ · day–1 (3580 kcal ·day–1). Distribution of energy among the energymacronutrients was not different from thegeneral population, prompting the authors toconclude that these swimmers consumed toomuch fat and inadequate carbohydrate.
In an attempt to determine the influence oftraining volume on the energy intake of competi-tive swimmers, Barr and Costill (1992) examineddiet records of 24 males during a period of ‘lowvolume’ training (22 km·week–1) and during‘high volume’ training (44km· week–1). Energyintake averaged 15.3 MJ ·day–1 (3650 kcal ·day–1)during the lower volume training and increasedsignificantly to 17.7 MJ · day–1 (4230 kcal ·day–1)during the 6 weeks of high-volume training. Itwas noted that this increase in energy intake didnot fully compensate for the higher energydemand of the longer training, since the swim-mers maintained their body weight while theylost subcutaneous fat.
Costill et al. (1988a) examined male collegiateswimmers before, during and after 10 days ofincreasing training. Their training distance wasincreased from 4266 to 8970m· day–1 whileaverage intensity was maintained at 94% of theirmaximum oxygen uptake. This resulted in anaverage energy cost during training of 9.6 MJ ·day–1 (2300 kcal · day–1). It was noted that four ofthe 12 swimmers could not tolerate the highertraining volume and were forced to swim theirtraining bouts at slower speeds. In addition,these swimmers had reduced muscle glycogenconcentration as a consequence of the combinedeffect of the intensified training and their lowcarbohydrate intakes. These findings led theauthors to conclude that some swimmers have
610 sport-specific nutrition
difficulty in meeting the energy demands ofhigh-volume training and experience chronicmuscle fatigue as a result of their failure to ingestsufficient carbohydrate to match the energydemands.
The studies reviewed above suggest that male competitive swimmers in the age range of16–23 years typically ingest approximately 18.0MJ ·day–1 (4300 kcal · day–1), while femalesconsume only about 10.9 MJ ·day–1 (2600 kcal ·day–1) despite the fact that female and maleswimmers perform similar training volume andintensity. When these data are compared with theestimated energy requirements of swimmingtraining proposed by Sherman and Maglischo(1992), males tend to remain in energy balance(18.0 MJ ·day–1 average intake vs. 16.8–22.6 MJ ·day–1 (4300 vs. 5400kcal · day–1) estimatedrequirement) while female swimmers tend tomaintain a negative energy balance (10.9 MJ ·day–1 average intake vs. 14.2–16.8 MJ · day–1 (2600vs. 3400–4000kcal · day–1) estimated require-ment). These data illustrate the nutritionaldilemma facing competitive swimmers, espe-cially females, and their coaches. The tremen-dous training demands imposed on theseathletes require careful consideration of theswimmer’s diet to make sure that adequateamounts of food are eaten to provide the energy,macronutrients and micronutrients necessary tosupport the enormous training loads.
Body composition
With such high energy demands of daily trainingin competitive swimming, one might wonderwhy body fat percentages of swimmers are notlower than they are. Typically, male competitiveswimmers have body fat percentages in therange of 8–15% and females at 15–22%. Indeed,studies have confirmed that body composition ofcompetitive swimmers is usually about 4–6%greater than age- and ability-matched endurancerunners (Novak et al. 1977; Thorland et al. 1983).
There are a number of possible explanationsfor the tendency of swimmers to carry more fatthan runners despite similar training loads. One

explanation is that although running tends tohave a somewhat anorexic effect, especially inthe few hours after exercise, swimming mayhave an opposite effect by stimulating appetite(Harri & Kuusela 1986). This would imply thatswimmers tend to increase their energy con-sumption in parallel with their training whererunners may not. To this author’s knowledge,there have been no published studies comparingthe effects of running and swimming on the postexercise appetite. Under this assumption of increased appetite in swimmers, swimmerswould not be expected to lose a great deal ofbody fat during their training. A study byJohnson et al. (1989) with female universityswimmers supports this argument since nochanges in body composition were observedover a 25-week season of training. In contrast,however, Barr et al. (1991) reported decreasedbody fat, increased lean body mass, and nochange in body weight in male college swimmerstraining 22000 m·week–1 during a 25-weekseason. In agreement with this study showingchanging body composition in males duringswim training is a study by Meleski and Malina(1985) showing decreased body weight,decreased absolute and relative fat mass, andincreased lean body mass in a group of femalecollege swimmers during the first 2 months of atraining season.
Another explanation that has been proposedfor the higher body fat percentages in competi-tive swimmers is a possible difference in fuel uti-lization both during and following the exercisethat promotes fat storage in swimmers. Assupport for this argument, some have pointed tostudies of cold exposure which is known to stimulate fat storage both in animal models andin humans. To determine if swimming trainingalters fuel utilization and the hormonal milieudifferently from running, Flynn et al. (1990)monitored energy expenditure and fuel utiliza-tion of eight male swimmers and runners whileexercising at 75% of maximum oxygen uptakeand during 2h of recovery. Although the energycost of recovery was similar between the twoexercise modes, the respiratory exchange ratioresults suggested increased fat oxidation afterswimming compared with running. In contrast,serum glycerol concentration was elevated to agreater extent after running than after swim-ming, suggesting enhanced mobilization oftriglycerides with running. Whether this differ-ent response can account for the differences inbody composition between runners and swim-mers remains to be studied.
Carbohydrate needs in training
The high volume and intensity of swimming
swimming 611
Fig. 46.1 Swimmers favour hightraining volumes. This means thata high energy intake is essential,but opportunities for eating maybe limited when long trainingsessions must be combined withwork or study. Photo © Allsport.

training places a great demand not only ondietary energy, but also on the carbohydrateneeds of these athletes. Maglischo (1993) has esti-mated that dietary carbohydrate needs of swim-mers range between 500 and 800 g ·day–1. Thus, a swimmer who consumes a diet providing 16.8MJ ·day–1 (4300 kcal · day–1) with 50% of theenergy from carbohydrate will be consumingapproximately 500g ·day–1 of carbohydrate andtherefore may not meet the carbohydratedemand of the daily training. Clearly, these ath-letes should make carbohydrate intake a priorityin their daily diet.
To determine the amount of muscle glycogendepletion that can occur during typical swimtraining bouts, Costill et al. (1988b) examinedmuscle glycogen levels of male collegiate swim-mers before and after swimming either 2743 or5486m. Each swimmer performed the 5486m oftraining twice; once by doing 60¥91.4 m swimsand once by performing 12¥457.2 m swims.Biopsies were taken from the anterior deltoidbefore, at the half-way point of the trainingsession (2743 m), and at the end of each trainingsession and analysed for glycogen concentration.Additional biopsies were taken after 8h of recov-ery and ingestion of 112 g carbohydrate to assessthe amount of glycogen repletion that mightoccur in this amount of time. When the trainingsessions were performed with repeated 91.4-mswims, muscle glycogen concentration declinedby 68% at 2743 m, and by 87% at 5486m (Fig.46.2). Using repeated 457.2-m swims, muscleglycogen declined by 54% at 2743m, and by 63%at 5486 m. The greater amount of glycogen deple-tion with 91.4-m repeats than with 457.2-mrepeats was accounted for by a significantlyfaster swimming speed during the 91.4-mrepeats (ª7% faster than during the 457.2-mrepeats). In recovery, glycogen repletion was 52%complete after 8h and ingestion of 112 g of carbohydrate.
These findings show the large loss of muscleglycogen that can occur during a single trainingsession among competitive swimmers. Whenone considers that many swimmers perform thiskind of training on a daily basis, and in many
612 sport-specific nutrition
instances twice per day, the probability ofchronic glycogen depletion is great, especiallyconsidering the incomplete glycogen repletion inthe 8h of recovery. Chronic glycogen depletionmay then result in poor performances in subse-quent training sessions and in competitions thatmay follow a period of such training. An obvioussolution to this problem is to train only once per day and consume a diet containing at least500g · day–1 of carbohydrate. Less frequent train-ing would likely not deplete glycogen fromworking muscles as much as twice per day train-ing, and the higher intake of dietary carbohy-drate would tend to accelerate glycogenrepletion in the 24 h between training sessions,especially if a large quantity of carbohydrate isingested during the first 2h after the training isfinished (MacDougall et al. 1977; Ivy et al. 1988).
140
0
80
60
Pre-exercise
Mus
cle
glyc
ogen
(mm
ol. k
g–1)
120
100
40
20
2743 5486
Distance per interval set (m)
Fig. 46.2 Muscle glycogen utilization during 2743- and5486-m interval swim training using repeated 91.4-m( ) or 457-m ( ) swims. Adapted from Costill et al.(1988b).

Lamb et al. (1990) tested whether a diet inwhich 80% of calories came from carbohydratewas superior to a 43% carbohydrate diet in sup-porting the daily training of collegiate swim-mers. Both diets provided 19.6MJ · day–1 (4680kcal ·day–1) and were maintained for 9 days.During the last 5 days of each diet, swimmersperformed intervals of various distances rangingfrom 50m up to 3000m and mean swim velocitieswere recorded. These authors found no signifi-cant differences between the two diets in perfor-mance of the interval sets. However, they didnote that the swimmers who regularly consumeda high carbohydrate diet tended to performbetter than those who generally consumed a lowcarbohydrate diet. A possible reason for the lackof difference in performance between the highand moderate carbohydrate diets could be thateven in the moderate carbohydrate diet, enough carbohydrate was supplied to support thedemands of their training. At 19.6 MJ · day–1 (4680kcal ·day–1) and 43% carbohydrate, these subjectswere consuming an average of 503g carbohy-drate ·day–1. Costill and Miller (1980) reportedthat muscle glycogen repletion is proportional tothe mass of carbohydrate consumed until carbo-hydrate intake reaches approximately 600g ·day–1. Therefore, it is possible that the 935 g ofcarbohydrate that were provided in the 80% car-bohydrate diet did not stimulate any greater rateof glycogen repletion than the 503g of carbohy-drate provided in the 43% carbohydrate diet.
In light of the observations of Costill et al.(1988a), wherein four of the 12 swimmersstudied failed to eat enough carbohydrate toprevent chronic muscle glycogen depletionduring 8970 m·day–1 training, it would seemprudent to recommend that swimmers consumea diet that (i) meets the energy requirements oftraining and (ii) provides at least 600g carbohy-drate ·day–1.
Carbohydrate ingestion duringtraining sessions
A number of studies have shown improvedendurance performance when carbohydrate is
ingested at frequent intervals during the exercise(Coyle et al. 1983, 1986; Coggan & Coyle 1987;Davis et al. 1988; Tsintzas et al. 1993). Typically,the exercise modes studied in these investiga-tions have been either cycling or running. Thehypothesized benefit of carbohydrate ingestionis improved maintenance of blood glucosethroughout the duration of the activity and/ormuscle glycogen sparing leading to increasedcarbohydrate availability at a time when the lowendogenous carbohydrate supplies generallylimit muscular performance.
To determine if carbohydrate ingestion duringexercise would have similar beneficial effects onthe performance of swimming training bouts,O’Sullivan et al. (1994) measured swimming performances during a standardized trainingsession once while ingesting a placebo and oncewhile ingesting a liquid carbohydrate supple-ment. In each of these trials, the nine male colle-giate swimmers performed a 5944-m trainingsession composed of a mixture of low- and high-intensity interval training bouts. The final 914 mof the training session was 10¥ 91.4m swimswith 20 s rest between each as a performancetrial. Performance was measured as eachswimmer’s average velocity during the first 5,second 5, and for the whole set of 10¥ 91.4m.During the carbohydrate supplementation trial,the swimmers were given 1 g ·kg–1 of glucosepolymers in 50% solution 10 min into the trainingsession, and 0.6g · kg–1 of glucose polymers in20% solution every 20 min thereafter accordingto the feeding schedule of Coggan and Coyle(1988). The placebo trial was the same as the carbohydrate trial, but an artificially sweetenedplacebo drink was substituted for the carbohy-drate drink. The trials were conducted 7 daysapart in a randomized, double-blind manner.Blood samples were taken before the trainingsession, immediately before each feeding, and atthe conclusion of the 10¥91.4 m performancetrial. During the placebo trial, blood glucose con-centration remained fairly stable throughout thefirst 100 min of the training but rose significantlyduring the 10¥91.4 m performance test to a finallevel of 6.3 mmol · l–1 (Fig. 46.3). In the carbohy-
swimming 613

drate feeding trial, blood glucose concentrationwas slightly elevated over the placebo trial at alltime points, but no significant differences wereobserved. Performance times for the 10¥ 91.4mtraining set at the end of training averaged 59.1sin the placebo trial and 59.9s during the carbohy-drate trial. The authors concluded that carbohy-drate supplementation was not effective inimproving performance late in a swimmingpractice because blood glucose remains stableeven without supplemental carbohydrate.However, individual differences in their re-sponses were presented. Two of the subjects did
614 sport-specific nutrition
experience a substantial decline in blood glucoseconcentration during the training in the placebotrial. During his placebo trial, one swimmer’sblood glucose concentration dropped from 4.3mmol · l–1 before the training to a low of 2.6mmol · l–1 immediately before the 10¥ 91.4m per-formance trial (Table 46.1). The ingestion of car-bohydrate completely prevented this decline andhis performance time improved by 1.3 s from 64.3s in the placebo trial to 63.0 s in the carbohy-drate trial. Another subject experienced a drop inblood glucose concentration from 5.6 mmol · l–1
pre-exercise to 3.7mmol · l–1 immediately beforethe performance trial. Again, the carbohydratesupplementation prevented this decline and per-formance improved by 1.1 s from 58.4 to 57.3s.Thus, it seems that the carbohydrate supplemen-tation protocol used in this study is effective inimproving late-practice performance but onlyfor those individuals who normally experiencedeclining blood glucose concentration duringthe training.
Because it would be impossible for swimmersto know if they normally experience decliningblood glucose concentration during trainingwithout taking blood samples, coaches maywant to recommend carbohydrate supplementa-tion for the entire team. In those individuals whoare able to maintain their blood glucose concen-trations without supplemental carbohydrate,there is little, if any, risk in consuming the carbo-hydrate. Therefore, supplementing the entireteam would be one way of assuring that thoseswimmers who need the extra carbohydratewould get it. Alternatively, coaches could watchtheir swimmers for signs of excessive muscle
7
6
5
4
3
Blo
od
glu
cose
(m
M)
4846 m swim Perf.
0 20 40 60 80 100 120
Time (min)
Fig. 46.3 Blood glucose concentration throughout a5486-m swim training session when fed placebo (�) orcarbohydrate (�) every 20 min. Perf., performance trialof 10 ¥ 91.4-m swims. Adapted from O’Sullivan et al.(1994).
Table 46.1 Responses of two subjects who had declining blood glucose concentration during placebo andcarbohydrate trials. Adapted from O’Sullivan et al. (1994).
Pre-exercise PreperformanceTrial (mmol · l-1) (mmol · l-1) Time/91.4m (s)
Subject 1 Placebo 4.3 2.6 64.3Carbohydrate 4.5 4.3 63.0
Subject 2 Placebo 5.6 3.7 58.4Carbohydrate 5.7 7.2 57.3

fatigue during the latter part of training sessionsand prescribe a carbohydrate supplement only tothose who consistently seem to have difficultymaintaining their work output.
There is a more fundamental question thanwhether or not carbohydrate supplementation iseffective in improving training performance. Bypreventing the decline in blood glucose concen-tration during training, we effectively eliminateone of the physiological/metabolic stressesimposed by the training. Since training is acareful dosage of physical stress to create long-term adaptations that will ultimately improvecompetitive performance potential, eliminationof these stresses may lessen the degree of adapta-tion experienced by the athlete. Whether or notone adapts in a performance-enhancing way tolow carbohydrate availability is not currentlyknown, but this may be part of the stimulus thatimproves glycogen storage in endurance athletes(Gollnick et al. 1973; Piehl et al. 1974; Costill et al.1985a).
Carbohydrate ingestion after training
Studies have shown that muscle glycogen resyn-thesis is accelerated when carbohydrate isingested within 1–2 h after the exercise is stopped(Ivy et al. 1988). In this immediate postexerciseperiod, evidence suggests that high glycaemicindex sugars may be the preferred carbohydratesource since insulin is known to be a potent activator of muscle glycogen synthase. A recentstudy also suggests including some protein inthe postexercise meal because the protein willaugment the insulin response to the carbohy-drate and thereby stimulate an even greater rateof muscle glycogen storage (Zawadzki et al.1992). Since competitive swimmers likely experi-ence large decrements in muscle glycogen concentration during single training sessions, itseems wise to provide a carbohydrate sourcesoon after the training session ends. This strategymay be helpful in preventing the chronic muscleglycogen depletion that undoubtedly occurs inmany swimmers, especially those training twiceper day.
Chronic muscle glycogen depletionand overtraining
With all the training competitive swimmers do, itis not surprising that overtraining has becomealmost an epidemic in swimming. The frequent,high-volume, and high-intensity training theseathletes perform often results in a chronic musclefatigue that, if unchecked, may lead to the devel-opment of an overtraining state. Chronic musclefatigue has been linked to failure to adequatelyreplace the muscle glycogen stores betweentraining sessions due to the combination ofheavy training and inadequate dietary carbohy-drate intake. Since a competitive swimmingseason may last as long as 25 weeks before abreak from training is taken, swimmers cansuffer from chronic depletion for up to 6 months.At the end of most swimming seasons, swim-mers gradually reduce both the volume andintensity of training in preparation for theirseason-ending competition. This ‘taper period’has not been studied extensively, but the fewstudies that have been done indicate thatimproved strength or power and increasedmuscle glycogen stores may be partly responsi-ble for the enhanced performance that typicallyoccurs with the taper.
Protein requirements duringswimming training
The prior discussion concerning carbohydrateneeds of competitive swimmers suggests thatmany swimmers may experience chronic muscleglycogen depletion during their daily training.Lemon and Mullin (1980) have shown thatprotein catabolism is accelerated when exercis-ing while glycogen depleted. Therefore, com-petitive swimming training may often result inincreased protein catabolism that needs to becompensated for with extra dietary proteinintake. Furthermore, the relatively low energyintake that has been reported for some swimmersmay also trigger an increase in protein catabolism.
Lean body mass has been shown to signifi-
swimming 615

cantly correlate with swimmers’ performance ina 91.4-m freestyle (Stager et al. 1984). In addition,numerous studies have shown the importance ofmuscle strength and power in performance ofcompetitive swimming (Sharp et al. 1982; Costillet al. 1985b, 1986; Sharp 1986; Cavanaugh &Musch 1989). Thus, development and mainte-nance of lean mass to preserve muscle strengthand power should be a priority for competitiveswimmers. Unfortunately, this seems to be a dif-ficult task during the heavy training phase oftheir season as studies have shown decrementsin muscle power despite continued resistancetraining during midseason (Sharp 1986;Cavanaugh & Musch 1989) followed byincreased power during the taper phase of train-ing (Costill et al. 1985b). Whether these changesin muscle power are related to a chronic increasein muscle protein catabolism followed by anattenuation of muscle wasting during the taperphase has not been studied.
There are other studies which provide indirectevidence of an enhanced protein need duringswimming training. Kirwan et al. (1988) andMorgan et al. (1988) showed evidence of muscledamage with a twofold increase in serum crea-tine kinase activity and increased muscle sore-ness in male college swimmers when trainingvolume was increased from 4266m ·day–1 to8970m· day–1. In another study on the effects ofswimming training on protein catabolism,Lemon et al. (1989) observed an increase in serumurea concentration and urinary urea excretionafter a 4572-m training session in competitiveswimmers. Conversely, Mussini et al. (1985)found no evidence of increased muscle proteoly-sis using postexercise urinary 3-methyl-histidineexcretion in a group of 16–20-year-old males per-forming a 2000-m competitive swimming train-ing session. It should be noted, however, that thetraining volume used in this study was consider-ably less than that used in the previous studiesand less than that typically used by mostcompetitive swimmers.
Although the United States recommendeddaily allowance (RDA) for protein is set at 0.8g · kg–1 for adults, Friedman and Lemon (1989)
616 sport-specific nutrition
suggest that a protein intake of approximately1.5g · kg–1 may be more appropriate to sup-port endurance exercise training. In addition,Marable et al. (1979) recommend a protein intakeup to 2–3g · kg–1 to support the muscle buildingrequirements of resistance training. Since com-petitive swimming training employs con-siderable involvement in both endurance andresistance training, their protein needs may lie somewhere within this range of about 1.5–2g · kg–1 ·day–1. The typical young-adultfemale competitive swimmer in the Netherlandsconsumes approximately 50–60g protein · day–1,translating to about a protein intake of 0.9–1.2g · kg–1 ·day–1 (van Erp-Baart et al. 1989).These authors also report the typical proteinintake of male swimmers in the range of 80–100g · day–1, or a protein intake of about 1.1–1.3g · kg–1 ·day–1.
Perhaps if swimmers maintained a higherprotein intake and a higher carbohydrate intake,and consumed enough calories to match theenergy demands of their training, responses suchas loss of muscle power in the middle of theseason, chronic muscle fatigue, overtraining, andrecovery of power and performance abilityduring taper would be lessened. Elimination of these responses might be expected to result in improved performance of these athletesthroughout their competitive season, instead of only at the end of a taper period. However,many coaches worry that the large performanceimprovement usually observed with the season-ending taper would no longer occur if the swim-mers were not pushed to the edge of overtrainingthroughout the early and midseason phases. In addition, they often fear that physiologicalcapacities such as aerobic endurance and anaero-bic power will not be fully developed in their athletes if training volume is reduced. Conse-quently, training for competitive swimming willlikely continue to place extraordinary demandson the young athletes who choose this as theirsport.

Micronutrient requirements incompetitive swimming
The only vitamin or mineral that has receivedmuch attention in the literature on dietary habitsof competitive swimmers is iron. Perhaps thereason for this is that swimmers tend to consumea large amount of food and typically exceed theRDA for most of the nutrients. However, there isevidence of iron deficiency, particularly amongfemale swimmers, even when RDA is met.
Brigham et al. (1993) determined iron status in25 female college swimmers on a biweekly basisthroughout a 25-week competitive season. Inaddition, they examined the effectiveness of ironsupplementation during this season. Beforebreaking the swimmers into an experimental(iron supplement) and placebo group, theseauthors observed that 17 of the swimmers haddepleted iron stores (defined as serum ferritinconcentration < 12mg · l–1) while five of the swim-mers were defined as anaemic (haemoglobin <12 g ·dl–1). During the 5 weeks in which theexperimental group received 39mg elementaliron as an iron supplement per day, haemoglobinconcentration increased in 24% of the subjectsand plasma ferritin concentration increased in68% of the subjects. In the control group who didnot ingest an iron supplement, haemoglobin con-centration decreased despite consuming a dietcontaining 16.3mg iron · day–1. These authorsconcluded that moderate iron supplementationis effective in preventing a decline in iron statusduring swimming training but a higher dosemay be needed to reverse a pre-existing iron deficiency.
Ganzit et al. (1993; cited in Burke 1993) testedthe effectiveness of 80 mg iron supplementationper day in male and female swimmers. Swim-mers in the experimental group maintained theirplasma ferritin levels while those swimmers inthe placebo group experienced a decrease inplasma ferritin concentration. These authors also noted an improvement in anaerobic capacityand reduced lactic acid response to submaximalexercise that was more marked in the experimen-tal group than in the placebo group. In the
females, these improvements were confined only to the group that received the dietary ironsupplement. Since haemoglobin concentrationsdid not change in either of the groups, theseauthors concluded that performance gains weremade at the level of iron-associated muscleenzymes.
Walsh and McNaughton (1989) studied theeffects of 150mg iron supplementation per dayon the haematology and V
.o2max. of competitive
female swimmers training at least 2h · day–1 and7 days a week. During this period, the experi-mental group had an increase in haemoglobinconcentration from 12.5g ·dl–1 before supple-mentation to 13.6g · dl–1 after supplementationwith no change in the placebo group. Plasma fer-ritin concentration dropped in the placebo groupfrom 28 to 16mg · l–1 while no signficant changewas observed in the experimental group (26 to 21mg · l–1). By the end of the study, 40% of the sub-jects in the placebo group were classified as irondeficient (serum ferritin £12 mg · l–1, haemoglobin≥12 g ·dl–1) and 10% of the subjects were clas-sified as anaemic (serum ferritin £12mg · l–1,haemoglobin £12 g · dl–1). These data are shownin Fig. 46.4. None of the swimmers who receivedthe iron supplement was classified as either iron deficient or anaemic. These authors con-cluded that young female swimmers should beroutinely tested for iron status and that iron supplementation undertaken when deemed necessary.
Conclusion
The nutritional problems that have been summa-rized in this chapter may all be linked to thevolume, frequency and intensity of training theseathletes perform. Thus, the difficulties in tryingto meet the energy demands, supply adequatecarbohydrate to fuel the exercise and aid recov-ery, minimize muscle proteolysis, and preventiron depletion and the associated negative effectson haematology could be avoided most simplyby reducing training. At the very least, swim-ming coaches should design training pro-grammes that lessen the risk of developing the
swimming 617
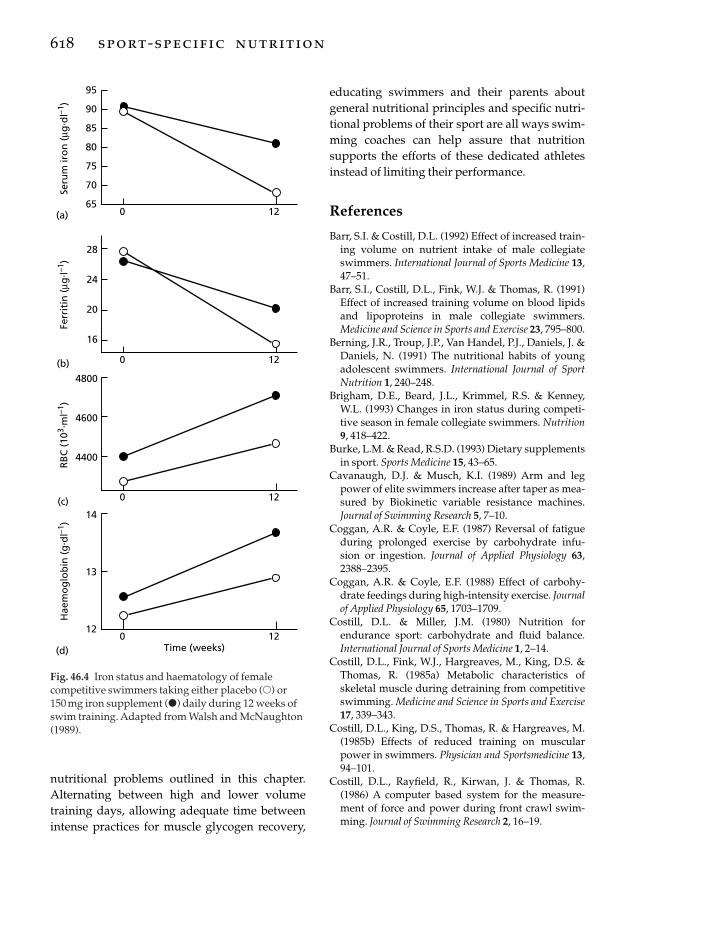
nutritional problems outlined in this chapter.Alternating between high and lower volumetraining days, allowing adequate time betweenintense practices for muscle glycogen recovery,
618 sport-specific nutrition
educating swimmers and their parents aboutgeneral nutritional principles and specific nutri-tional problems of their sport are all ways swim-ming coaches can help assure that nutritionsupports the efforts of these dedicated athletesinstead of limiting their performance.
References
Barr, S.I. & Costill, D.L. (1992) Effect of increased train-ing volume on nutrient intake of male collegiateswimmers. International Journal of Sports Medicine 13,47–51.
Barr, S.I., Costill, D.L., Fink, W.J. & Thomas, R. (1991)Effect of increased training volume on blood lipidsand lipoproteins in male collegiate swimmers. Medicine and Science in Sports and Exercise 23, 795–800.
Berning, J.R., Troup, J.P., Van Handel, P.J., Daniels, J. &Daniels, N. (1991) The nutritional habits of youngadolescent swimmers. International Journal of SportNutrition 1, 240–248.
Brigham, D.E., Beard, J.L., Krimmel, R.S. & Kenney,W.L. (1993) Changes in iron status during competi-tive season in female collegiate swimmers. Nutrition9, 418–422.
Burke, L.M. & Read, R.S.D. (1993) Dietary supplementsin sport. Sports Medicine 15, 43–65.
Cavanaugh, D.J. & Musch, K.I. (1989) Arm and legpower of elite swimmers increase after taper as mea-sured by Biokinetic variable resistance machines.Journal of Swimming Research 5, 7–10.
Coggan, A.R. & Coyle, E.F. (1987) Reversal of fatigueduring prolonged exercise by carbohydrate infu-sion or ingestion. Journal of Applied Physiology 63,2388–2395.
Coggan, A.R. & Coyle, E.F. (1988) Effect of carbohy-drate feedings during high-intensity exercise. Journalof Applied Physiology 65, 1703–1709.
Costill, D.L. & Miller, J.M. (1980) Nutrition forendurance sport: carbohydrate and fluid balance.International Journal of Sports Medicine 1, 2–14.
Costill, D.L., Fink, W.J., Hargreaves, M., King, D.S. &Thomas, R. (1985a) Metabolic characteristics ofskeletal muscle during detraining from competitiveswimming. Medicine and Science in Sports and Exercise17, 339–343.
Costill, D.L., King, D.S., Thomas, R. & Hargreaves, M.(1985b) Effects of reduced training on muscularpower in swimmers. Physician and Sportsmedicine 13,94–101.
Costill, D.L., Rayfield, R., Kirwan, J. & Thomas, R.(1986) A computer based system for the measure-ment of force and power during front crawl swim-ming. Journal of Swimming Research 2, 16–19.
95
90
85
80
75
70
65
28
24
20
16
4800
4600
4400
14
13
120 12
Time (weeks)
RB
C (
103 .
ml–1
)H
aem
og
lob
in (
g. d
l–1)
Ferr
itin
(µg
. l–1)
Seru
m ir
on
(µg
. dl–1
)
(a)
(b)
(c)
(d)
0 12
0 12
0 12
Fig. 46.4 Iron status and haematology of femalecompetitive swimmers taking either placebo (�) or 150 mg iron supplement (�) daily during 12 weeks ofswim training. Adapted from Walsh and McNaughton(1989).

Costill, D.L., Flynn, M.G., Kirwan, J.P. et al. (1988a)Effects of repeated days of intensified training onmuscle glycogen and swimming performance. Medi-cine and Science in Sports and Exercise 20, 249–254.
Costill, D.L., Hinrichs, D., Fink, W.J. & Hoopes, D.(1988b) Muscle glycogen depletion during swim-ming interval training. Journal of Swimming Research4, 15–18.
Coyle, E.F., Hagberg, J.M., Hurley, B.F., Martin, W.H.,Ehsani, A.A. & Hollszy, J.O. (1983) Carbohydratefeeding during prolonged strenuous exercise candelay fatigue. Journal of Applied Physiology 55,230–235.
Coyle, E.F., Coggan, A.R., Hemmert, M.K. & Ivy, J.L.(1986) Muscle glycogen utilization during prolongedexercise when fed carbohydrate. Journal of AppliedPhysiology 61, 165–172.
Davis, J.M., Lamb, D.R., Pate, R.R., Slentz, C.A.,Burgess, W.A. & Bartoli, W.P. (1988) Carbohydrate–electrolyte drinks: effects on endurance cycling in the heat. American Journal of Clinical Nutrition 48,1023–1030.
Flynn, M.G., Costill, D.L., Kirwan, J.P. et al. (1990) Fatstorage in athletes: metabolic and hormonalresponses to swimming and running. InternationalJournal of Sports Medicine 11, 433–440.
Friedman, J.E. & Lemon, P.W. (1989) Effect of chronicendurance exercise on retention of dietary protein.International Journal of Sports Medicine 10, 118–123.
Ganzit, G.P., Giribaudo, C.G. & Biancotti, P.P. (1989)Effetti della somministrazione di supplemento diferro ferritinico sull’ adaltamento funzionale aerobico e anaerobico all’ alienamento, in nuotatorimaschi e femmine. Medicina dello Sport 42, 7–15.
Gollnick, P.D., Armstrong, R.B., Saltin, B., Saubert,C.W., Sembrowich, W.L. & Shepherd, R.J. (1973)Effects of training on enzyme activity and fiber com-position of human skeletal muscle. Journal of AppliedPhysiology 34, 107–111.
Harri, M. & Kuusela, P. (1986) Is swimming exercise orcold exposure for rats? Acta Physiologica Scandinavica126, 189–197.
Ivy, J.L., Katz, A., Cutler, C.L., Sherman, W.M. & Coyle,E.F. (1988) Muscle glycogen synthesis after exercise:effect of time of carbohydrate ingestion. Journal ofApplied Physiology 64, 1480–1485.
Johnson, G.O., Nebelsick-Gullett, L.J., Thorland, W.G.& Housh, T.J. (1989) The effect of a competitiveseason on the body composition of university femaleathletes. Journal of Sports Medicine and Physical Fitness29, 314–320.
Kirwan, J.P., Costill, D.L., Flynn, M.G. et al. (1988)Physiological responses to successive days of intensetraining in competitive swimmers. Medicine andScience in Sports and Exercise 3, 255–259.
Lamb, D.R., Rinehardt, K.F., Bartels, R.L., Sherman,
W.M. & Snook, J.T. (1990) Dietary carbohydrate andintensity of interval swim training. American Journalof Clinical Nutrition 52, 1058–1063.
Lemon, P.W. & Mullin, J.P. (1980) Effect of initial muscleglycogen levels on protein catabolism during exer-cise. Journal of Applied Physiology 48, 624–629.
Lemon, P.W., Deutsch, D.T. & Payne, W.R. (1989) Ureaproduction during prolonged swimming. Journal ofSports Science 7, 241–246.
MacDougall, J.D., Ward, G.R., Sale, D.G. & Sutton, J.R.(1977) Muscle glycogen repletion after high-intensityintermittent exercise. Journal of Applied Physiology 42,129–132.
Maglischo, E.W. (1993) Swimming Even Faster. MayfieldPublishing, Mountain View, CA.
Marable, N.L., Hickson, J.F., Korslund, M.K., Herbert,W.G., Desjardins, R.F. & Thye, F.W. (1979) Urinarynitrogen excretion as influenced by a muscle-building exercise program and protein intake varia-tion. Nutrition Reports International 19, 795–805.
Meleski, B.W. & Malina, R.M. (1985) Changes in bodycomposition and physique of elite university-levelfemale swimmers during a competitive season.Journal of Sports Science 3, 33–40.
Morgan, W.P., Costill, D.L., Flynn, M.G., Raglin, J.S. &O’Connor, P.J. (1988) Mood disturbance followingincreased training in swimmers. Medicine and Sciencein Sports and Exercise 4, 408–414.
Mussini, E., Colombo, L., De Ponte, G., Calzi, M. &Marcucci, F. (1985) Effect of swimming on proteindegradation: 3-methylhistidine and creatinine excre-tion. Biochemical Medicine 34, 373–375.
Novak, L.P., Woodward, W.A., Bestit, C. & Mellerowicz, H. (1977) Working capacity, body com-position and anthropometry of olympic female ath-letes. Journal of Sports Medicine 17, 275–283.
O’Sullivan, S., Sharp, R.L. & King, D.S. (1994) Carbohy-drate ingestion during competitive swim training.Journal of Swimming Research 10, 35–40.
Piehl, K., Adolfsson, S. & Nazar, K. (1974) Glycogenstorage and glycogen synthase activity in trainedand untrained muscle of man. Acta Physiologica Scan-dinavica 90, 779–788.
Sharp, R.L. (1986) Muscle strength and power asrelated to competitive swimming. Journal of Swim-ming Research 2, 5–10.
Sharp, R.L., Troup, J.P. & Costill, D.L. (1982) Relation-ship between power and sprint freestyle swimming.Medicine and Science in Sports and Exercise 14, 53–56.
Sherman, W.M. & Maglischo, E.W. (1992) Minimizingathletic fatigue among swimmers: special emphasison nutrition. In Sports Science Exchange, GatoradeSports Science Institute. 4, 35.
Stager, J.M., Cordain, L. & Becker, T.J. (1984) Relation-ship of body composition to swimming performance
swimming 619
in female swimmers. Journal of Swimming Research 1,21–26.
Thorland, W.G., Johnson, G.O., Housh, T.J. & Refsell,M.J. (1983) Anthropometric characteristics of eliteadolescent competitive swimmers. Human Biology55, 735–748.
Tsintzas, K., Liu, R., Williams, C., Campbell, I. & Gaitanos, G. (1993) The effect of carbohydrate inges-tion on performance during a 30 km race. Interna-tional Journal of Sport Nutrition 3, 127–129.
Van Erp-Baart, A.M.J., Saris, W.H.M., Binkhorst, R.A.,Vos, J.A. & Elvers, J.W.H. (1989) Nationwide surveyon nutritional habits in elite athletes. Part I. Energy,
620 sport-specific nutrition
carbohydrate, protein, and fat intake. InternationalJournal of Sports Medicine 10 (Suppl. 1), 3–10.
Van Handel, P.J., Cells, K.A., Bradley, P.W. & Troup, J.P.(1984) Nutritional status of elite swimmers. Journal ofSwimming Research 1, 27–31.
Walsh, R. & McNaughton, L. (1989) Effects of iron sup-plementation on iron status of young female swim-mers during the pre-season phase of competition.Journal of Swimming Research 5, 13–18.
Zawadzki, K.M., Yaspelkis, B.B. & Ivy, J.L. (1992) Carbohydrate–protein complex increases the rate of muscle glycogen storage after exercise. Journal ofApplied Physiology 72, 1854–1859.
Introduction
The success of athletes in many competitivesports is determined by the extent to which theyhave developed their strength–velocity charac-teristics: these include strength, speed and powerof muscle function. Peak expression of the func-tional capability of the athlete requires themaximum voluntary effort that can be achieved,and thus depends not only on the characteristicsof the muscle, but also on the initiation ofimpulses in the motor centres of the centralnervous system, on the maintenance of highfiring rates in the motor nerves, and on the coor-dination of the activation of synergistic andantagonistic muscles. Important muscle charac-teristics include, in addition to muscle size itself,the orientation of the muscle fibres, the propor-tions of the different fibre types present, and theamount and structure of the connective tissue.
The basics of muscle structure and functionhave been reviewed in Chapter 2, and will be discussed only briefly here. The following characteristics of muscle are important for thedevelopment of force and power:1 The maximum muscular effort that can beachieved is directly proportional to the length ofthe individual sarcomeres (Faulkner & White1990). This cannot be changed with training, butwill be influenced by joint angle, which will inturn change the length of the muscle. In a wholemuscle, maximum force-generating capacity inan isometric contraction is largely determined by cross-sectional area (Maughan et al. 1983).
Adding more sarcomeres in parallel will increasethe maximum force that can be achieved, butadding more sarcomeres in series will have noeffect on maximum force other than by shiftingthe position on the length–tension relationship atany given joint angle.2 The maximum velocity of shortening of amuscle is dependent on the load applied. Forsingle muscle fibres, the maximum velocity ofshortening, and therefore the maximum speed ofmovement, is a function of the myosin adenosinetriphosphatase (ATPase) activity: this deter-mines the rate at which ATP can be used to powerthe interactions between actin and myosin. Infast-contracting (type IIb) muscle fibres, themaximum velocity of shortening is four timeshigher than in slow-contracting (type I) fibres(Burke & Edgerton 1975).3 The power that can be developed by a muscleis a linear function of the maximum ATPaseactivity, and thus is closely related to the propor-tions of the different fibre types present. Muscleswith a high proportion of type II fibres will beable to achieve higher power outputs than thosewhere type I fibres predominate. Muscles of elitesprinters typically contain more than 60% type Ifibres, whereas type I fibres predominate in themuscles of endurance athletes (Costill et al. 1976).4 The characteristic relationship between force,or strength, and velocity referred to above wasdescribed by Hill (1938). Force is greatest duringan isometric activation of the muscle, where theapplied load exceeds the force generating capac-ity of the muscle and the velocity of shortening
Chapter 47
Weightlifting and Power Events
VICTOR A. ROGOZKIN
621

is zero: the maximum velocity, in an isolatedmuscle or an individual fibre, occurs duringunloaded shortening. This situation cannot beachieved with the muscle in situ because of themass of the limb segments that must be movedand other biomechanical factors, and maximumvelocity is achieved when the load applied is lessthan 20% of the maximum isometric force that can be generated. The maximum values ofisometric force that can be achieved by humanmuscle are approximately 15–30¥104 N·m2
(Saltin & Gollnick 1982). The maximum force perunit cross-sectional area of the muscle is not sig-nificantly different between the different fibretypes (Faulkner & White 1990).
The known relationships between strengthand velocity of muscle contraction allow identifi-cation of the main components of a programmedesigned for developing the strength and powercharacteristics of an athlete. For development of the maximum isometric strength, training
622 sport-specific nutrition
should be carried out at forces between 70% and 100% of the maximum voluntary isometricstrength. To improve performance where highspeeds of movement are required, the forceshould not exceed 70% of maximum isometricstrength. Where high rates of power generationare to be developed, the force applied duringtraining should be in the range of 40–70% ofmaximum isometric force.
Speed–strength sports
The 1996 Olympic Games included a number ofvery different types of sport where strength andspeed are primary requirements for the partici-pants (Table 47.1). These include:• Boxing: open to men only, including 12 weightcategories ranging from 48kg to over 91 kg.• Judo: open to men (weight categories from 60kg to over 80kg) and women (from 48 to over72kg).
Table 47.1 Profile of major championship sports with a high strength component and in which competition is byweight category.
WrestlingBoxing Judo Weightlifting
Greco-RomanParameters Male Male Female Male Female and freestyle
Weight 48 60 48 54 46 48classes (kg) 51 65 51 59 50 52
54 71 56 64 54 5757 78 61 70 59 6260 86 66 76 64 6863.5 90 72 83 70 7467 Over 90 Over 72 91 76 8271 99 83 9075 108 Over 83 10081 Over 108 13091Over 91
Match rules Three 2-min One 5-min bout Three lifts One 5-min periodrounds
Matches per No more No more than three No more than one No more than day than one recommended in 2 three are
days recommended
Weigh-in rules 3h before 2h before competition 2h before competition Night beforecompetition each day competition

• Weightlifting: open to men only, with 10weight classes from 54 to over 108 kg.• Wrestling: Greco-Roman and freestyle compe-tition, open to men only, with 10 weight classesfrom 48kg to over 130kg, giving a total of 20competitions.
In addition, strength and speed are vital com-ponents of the sprint events on the track and ofall field events, including long jump, high jump,triple jump, pole vault, shot, discus, javelin,hammer throw. In cycling, there are sprint events on the track for men and women. In theWinter Olympic competition, speed skating andbobsleigh (two-man and four-man) also require
similar characteristics: indeed many speedskaters are also top class cyclists, and bobsleighcompetitors often compete at 100 m on the trackin the summer. It is clear that sports in this group-ing account for the majority of medals awardedat the Olympic Games.
Non-Olympic sports involving similar charac-teristics and demands include a variety ofmartial arts (karate, Tae Kwondo). Bodybuildingtraining follows broadly similar principles,although the training loads and numbers of repetitions performed may be somewhat differ-ent and the demands of competition are also different.
weightlifting and power events 623
Fig. 47.1 In all weight categorysports, a high power to mass ratiois essential. Increasing body massmoves the competitor up into ahigher weight category. (a) Photo© Allsport; (b) photo © Allsport /J. Jacobsohn.
(a)
(b)
The two main characteristics of this group ofsports, therefore, are that, at least in most ofthem, competition is open to men and women,and that, in many, athletes compete in specificweight categories. This latter fact places parti-cular demands on the athlete, with special consideration required for training and diet inpreparation for competition.
General nutritional principles for athletes
The requirements of the athlete for energy andfor individual nutrients are different in differentsports, and will be influenced very much by thetotal training load that is carried out (Rogozkin1978). Body mass is also a major factor, as isimmediately obvious when looking at therequirements of a light-flyweight boxer (48 kgweight class), a track athlete, or a wrestler in thesuper-heavyweight class (over 130kg). Even for athletes with similar body size, however, the nutritional requirements will vary greatlydepending on the training load: this is set in partby the demands of the sports but will also varywithin any given event depending on the pro-gramme selected by the athlete and coach. Rec-ommended energy intakes for male and femaleathletes in different sports are clearly influencedby many factors, but are likely to be about14.6–23.0MJ (3500–5500 kcal) daily for male ath-letes and 12.5–18.8MJ (3000–4500 kcal) for femaleathletes during periods of hard training(Rogozkin 1978).
The protein requirement of athletes in differentsports is described in detail in Chapter 10. It is clear that the requirement for protein willdepend to some extent on the specific nature ofthe sport, but will also be very much influencedby the amount and intensity of the training load,which will vary at different times of the season.In Russia, it is generally recommended that thedaily protein intake for athletes in hard trainingshould be about 1.4–2.0 g ·kg–1 body mass(Rogozkin 1978). The requirement for carbohy-drate will be closely related to the power outputrequired in training and competition, and a daily
624 sport-specific nutrition
carbohydrate intake of 8–10g · kg–1 would beconsidered normal. Depending on the type of sport, fat intake should be about 1.7–2.4g · kg–1 ·day–1. These recommendations aremade in absolute amounts related to bodyweight rather than as a fraction of total energyintake, but if the guidelines are followed, thiswill give a diet with the following composition:15–16% of total energy intake from protein,25–26% from fat and 58–60% from carbohydrate.
The fundamental principles of nutritionalsupport which have been developed in theRussian Federation for athletes competing instrength and power events have been describedin detail by Rogozkin (1993). These are summa-rized in the following recommendations.1 The body must be provided with sufficientenergy to meet its needs. For athletes, the energyrequirement will be largely determined by thetotal training load. If the energy demand is notmet, it will not be possible to continue with thesame intensity and duration of training.2 An appropriate nutritional balance among thevarious essential nutrients must be maintained.The proportions of the different macronutrientsand micronutrients necessary to achieve thisbalance will depend on the total energy intakeand on the period of preparation relative to com-petition. Protein intake must provide an appro-priate balance of all the essential amino acids,and the dietary fat must supply all of the essen-tial fatty acids. In addition, the intake of vita-mins, minerals and fibre must be adequate forthe athlete’s needs.3 The choice of foods and nutritional productsthat will meet the nutrient requirements will bedifferent during periods of intensive training,during the period of preparation for competition,during competition itself, and during the recov-ery phase after competition.4 Several nutrients, mostly vitamins and miner-als, play a key role in the activation and regula-tion of intracellular metabolic processes, and adeficiency of any of these in the diet will impairperformance during training and competition.5 Biosynthetic processes involved in tissuerepair and recovery after exercise will be influ-

enced by the hormonal environment: importantfactors include the catecholamines, insulin, corti-costeroids, growth hormone, cyclic nucleotidesand others. Dietary influences on the metabolicenvironment in the recovery phase will influencethe extent of recovery from training and competition.6 A varied diet is essential to provide all thenutrients needed by that athlete in adequateamounts, but other factors, including especiallythose associated with the storage and prepara-tion of foods, will affect the availability of thesenutrients from the diet.7 The diet must be chosen to include foodstuffsthat will provide all of the essential nutrients, butcare must be taken to ensure that, during periodswhen the athlete is training two or three timesper day, the meals are readily digested andabsorbed and do not result in gastrointestinaldisturbances.8 Where there is a need to increase body mass,usually in the form of lean tissue, and specificallyin the form of muscle, the diet must contain suffi-cient protein and other nutrients to ensure thatthe increased requirement is met. For athletescompeting in weight category sports, and forothers where a low body mass or a low body fatcontent are important, there must be specialattention to the composition of the diet to ensurethat all nutritional requirements are met from therestricted total energy intake.9 The diet must be chosen to take account of theindividual physiological, metabolic and anthro-pometric characteristics of the individual athlete,and should consider the condition of the athlete’sdigestive system. It must also take personaltastes and preferences into account.
Only if the diet is selected in the light of theseconsiderations is it possible to meet all of therequirements imposed by training and competi-tion and to optimize the athlete’s performance.
Strength training
Muscle, fat and bone are the three major struc-tural components that determine the body shapeand size of the individual. Body build is to a large
degree genetically determined, as is the ability toachieve success in sport. Specific types of physi-cal training can modify the expression of theindividual’s genetic endowment, resulting inchanges in body composition. Weight training iseffective when the aim is to increase musclemass, whereas endurance training can alterenergy balance and reduce fat mass. An appro-priate weight-training regimen, however, willalso be effective in reducing body fat content ifcombined with a suitable diet.
There are several categories of strength exer-cise that can be included in a weight training programme: these include isometric (static) con-tractions, which are not truly contractions, as themuscle is not allowed to shorten during activa-tion and the angle of the limb is fixed. Because ofstretching of the elastic components, however,there will be some shortening of individual sar-comeres. Isokinetic exercise involves shorteningof the muscle at a fixed velocity, and requiresspecial apparatus to keep the velocity of shorten-ing constant while measuring the applied force.Isotonic exercise, in which a constant load isapplied to the muscle is the type of training most familiar to and popular with coaches andathletes (Fahey 1986). The applied load may be in the form of free weights or a resistance ma-chine. Isotonic strength-training techniques mayinclude constant or variable load, and mayinvolve lengthening of the muscle (eccentric acti-vation) as well as the more normal shortening(concentric activation) when the load is applied.Plyometric and speed loading techniques mayalso be included in a strength programme.
It has been shown that greater increases instrength can be achieved following a programmeof maximum-force concentric and eccentric acti-vation than when concentric activation alone is used (Fahey 1986). The available evidence suggests that eccentric activity results in somedegree of damage to the muscle, involving dis-ruption of the muscle membrane and possiblyalso some disruption of the contractile compo-nents, and the subsequent repair process seemsto be important for the increase in the size ofmuscle fibres that results from a strength training
weightlifting and power events 625

programme (Faulkner & White 1990). Strengthtraining with high loads leads to an increase in the cross-sectional area of the muscle withoutany appreciable change in muscle length, andchanges in cross-sectional area of the muscle canbe used as an index of the gain in muscle mass.Both type I and type II fibres increase in size inresponse to this type of training stimulus, andincreases in cross-sectional area of 39% for type Ifibres and 31% for type II fibres have beenreported after a programme of heavy resistanceexercise (MacDougall et al. 1980). Increases inforce-generating capacity after strength trainingmay be large (30–40%) in the early stages of atraining programme, and are invariably greaterthan the increase in cross-sectional area(Maughan 1984). Some of the increase in musclestrength is therefore likely to be the result ofchanges in the muscle recruitment pattern and inneural drive. In pennate muscles, where the indi-vidual fibres lie at an angle to the long axis of themuscle, increases in the size of the individualfibres will result in an increase in the angle ofpennation, which will have the effect of decreas-ing the force relative to the anatomical cross-sectional area (Maughan 1984).
Release of a variety of hormones is stimulatedduring and after high resistance training: theseinclude growth hormone, testosterone, cate-cholamines and cortisol (Sutton et al. 1990). Therelease of these hormones will be influenced bythe intensity of training, the length of rest periodsallowed, and the level of training of the athlete.The response to training is specific to the muscle,so there must be a change in the sensitivity of theactive muscle to the circulating hormones andgrowth factors so that changes in the systemicconcentration results in specific changes inprotein synthesis. This may involve a change inreceptor number or sensitivity and/or release oflocal growth factors (including insulin-likegrowth factor) in the working muscle in responseto hormonal stimulation.
Increases in muscle strength and musclehypertrophy have been shown to be greater afterprolonged fatiguing contractions than after
626 sport-specific nutrition
short, intermittent contractions (Schott et al.1995). The authors speculated that the enhancedresponse after fatiguing contractions indicatedan involvement of changes in intracellularmetabolite levels and pH in determining theresponse of the muscle.
In addition to the changes in muscle size andstrength, weight training will have a significanteffect on bone mass. Peak bone mass, which isnormally reached in the third decade of life, canbe increased by any form of weight-bearing exer-cise, and will help to protect the skeleton againstthe stresses imposed on it. These processes aredescribed in detail in Chapter 23.
As the muscle becomes stronger with trainingand the load that can be applied increases, so thestimulus for new bone formation should also be increased to a degree consistent with theimposed load or relative intensity of the exercise.The imposed load is more important for deter-mining the response of bone than the number ofloading cycles completed. Progressive resistancetraining should therefore allow the bone mass toincrease until it reaches the genetically deter-mined peak bone mass. Given the greater lengthof time required for new bone formation relativeto the adaptation of skeletal muscle, which isapparent within a few days of training begin-ning, changes in bone mass require long-termadherence to a training programme that willeffectively load the skeleton.
Training diet
The adaptive changes that occur in the variousorgans and tissues of the athlete in response tothe training load occur in a phasic manner. Theacute responses to a single bout of exercise aretranslated into a permanent (at least as long asthe training persists) condition by a series ofevents that may be described as fatigue, restora-tion and supercompensation. The adaptationswhich occur in response to training result in anincreased capacity for force generation, poweroutput or endurance, depending on the type oftraining. This will be manifested during the
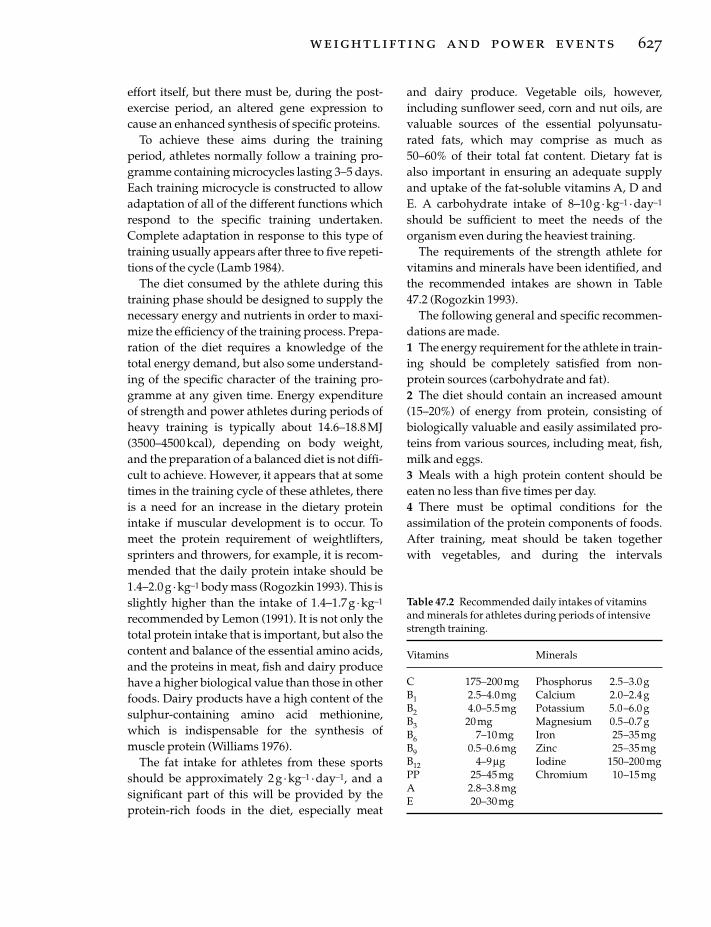
effort itself, but there must be, during the post-exercise period, an altered gene expression tocause an enhanced synthesis of specific proteins.
To achieve these aims during the trainingperiod, athletes normally follow a training pro-gramme containing microcycles lasting 3–5 days.Each training microcycle is constructed to allowadaptation of all of the different functions whichrespond to the specific training undertaken.Complete adaptation in response to this type oftraining usually appears after three to five repeti-tions of the cycle (Lamb 1984).
The diet consumed by the athlete during thistraining phase should be designed to supply thenecessary energy and nutrients in order to maxi-mize the efficiency of the training process. Prepa-ration of the diet requires a knowledge of thetotal energy demand, but also some understand-ing of the specific character of the training pro-gramme at any given time. Energy expenditureof strength and power athletes during periods ofheavy training is typically about 14.6–18.8 MJ(3500–4500 kcal), depending on body weight,and the preparation of a balanced diet is not diffi-cult to achieve. However, it appears that at sometimes in the training cycle of these athletes, thereis a need for an increase in the dietary proteinintake if muscular development is to occur. Tomeet the protein requirement of weightlifters,sprinters and throwers, for example, it is recom-mended that the daily protein intake should be1.4–2.0g · kg–1 body mass (Rogozkin 1993). This isslightly higher than the intake of 1.4–1.7g ·kg–1
recommended by Lemon (1991). It is not only thetotal protein intake that is important, but also thecontent and balance of the essential amino acids,and the proteins in meat, fish and dairy producehave a higher biological value than those in otherfoods. Dairy products have a high content of thesulphur-containing amino acid methionine,which is indispensable for the synthesis ofmuscle protein (Williams 1976).
The fat intake for athletes from these sportsshould be approximately 2g · kg–1 ·day–1, and asignificant part of this will be provided by theprotein-rich foods in the diet, especially meat
and dairy produce. Vegetable oils, however,including sunflower seed, corn and nut oils, arevaluable sources of the essential polyunsatu-rated fats, which may comprise as much as50–60% of their total fat content. Dietary fat isalso important in ensuring an adequate supplyand uptake of the fat-soluble vitamins A, D andE. A carbohydrate intake of 8–10 g ·kg–1 · day–1
should be sufficient to meet the needs of theorganism even during the heaviest training.
The requirements of the strength athlete forvitamins and minerals have been identified, andthe recommended intakes are shown in Table47.2 (Rogozkin 1993).
The following general and specific recommen-dations are made.1 The energy requirement for the athlete in train-ing should be completely satisfied from non-protein sources (carbohydrate and fat).2 The diet should contain an increased amount(15–20%) of energy from protein, consisting ofbiologically valuable and easily assimilated pro-teins from various sources, including meat, fish,milk and eggs.3 Meals with a high protein content should beeaten no less than five times per day.4 There must be optimal conditions for theassimilation of the protein components of foods.After training, meat should be taken togetherwith vegetables, and during the intervals
weightlifting and power events 627
Table 47.2 Recommended daily intakes of vitaminsand minerals for athletes during periods of intensivestrength training.
Vitamins Minerals
C 175–200mg Phosphorus 2.5–3.0gB1 2.5–4.0mg Calcium 2.0–2.4gB2 4.0–5.5mg Potassium 5.0–6.0gB3 20mg Magnesium 0.5–0.7gB6 7–10mg Iron 25–35mgB9 0.5–0.6mg Zinc 25–35mgB12 4–9 mg Iodine 150–200mgPP 25–45mg Chromium 10–15mgA 2.8–3.8mgE 20–30mg
between training sessions, special protein sup-plements should be taken.5 It is necessary to ensure an adequate intake of vitamins (B1, B2, B6, C and PP) which promoteprotein synthesis and the accumulation ofmuscle mass.
Careful attention to diet is necessary duringperiods of intensive weight training in order tocreate the appropriate metabolic environment toallow increases in muscle mass to occur.
Diet and weight control
Restriction of energy intake sufficient to result ina negative energy balance is an essential part of any successful weight-control programme(Williams 1976). Most fad diets that promiserapid loss of body weight stress weight lossrather than fat loss, and may seriously affect theathlete’s performance because loss of lean tissueis likely to account for much of the loss in weight.These diets are often unpalatable and unhealthy,and do not represent an eating pattern thatwould be possible to sustain on a long-termbasis. A rebound gain of the lost weight is almostinevitable. The goal of the dietary programmewhen weight loss is required should be a loss ofbody fat followed by maintenance of that loss.
Many popular diets promote a low carbohy-drate intake, and these diets may be successful incausing large weight losses, perhaps as much as5–10kg in a few weeks. However, a diet that islow in carbohydrate will result in depletion ofthe liver and muscle glycogen stores and in a lossof water from tissues. Although the weight lossseems impressive, there may be little loss of bodyfat. Additionally, glycogen depletion greatlydiminishes exercise capacity, leading to adecreased exercise level, which in turn means adecreased level of energy expenditure. Periods of low exercise levels in combination withrestricted energy intake result in a loss of muscletissue.
A successful weight-loss programme requiresa negative energy balance. Given that the energycontent of 0.45kg of fat is about 14.7MJ (3500kcal), which is as much as most athletes expend
628 sport-specific nutrition
in day, it is clearly impossible to lose more than afew pounds of fat in a week. Empirical evidencesuggests that, if weight is lost at a faster rate, theloss must come increasingly from loss of musclemass. Diets that promise large decreases in fat ina short time are misleading: they are potentiallydangerous and will impair performance.
Weight loss and making weight
The aim of all weight-loss programmes shouldbe to restrict food intake so that the body’s fatreserve is gradually reduced while the normalfunctions of the body are maintained. The onlysuccessful approach is to reduce energy intakewhile ensuring that the nutrient density, and inparticular the carbohydrate content, is kept high.The reducing diet will therefore be achieved byrestricting fat, rather than carbohydrate, intake.Foods should be chosen to provide not only car-bohydrate, which should be present mostly inthe form of complex carbohydrates, but also vita-mins, minerals and trace elements in adequateamounts, rather than simply being high in fibre.All visible fat should be removed from meat, andlow-fat foods should be substituted for high-fatalternatives where these are available. If the dietis already very low in fat, the only availableoption is to reduce the overall amount of foodbeing eaten.
Making weight is a different situation from agradual weight-loss programme. This situationarises when athletes have to prepare to competein a particular weight category. Most athletesparticipating in sports with specific weight cate-gories, including boxing, judo, wrestling andweightlifting, compete in a class that is 5–10%below their usual weight. Typical weight reduc-tion techniques used to induce large weightlosses in a short time include dietary restriction,fluid restriction, dehydration through exercise inthe heat or in a rubber suit, or sitting or exercisingin a sauna or steam room. Less commonly usedtechniques include the use of diuretics and laxa-tives, vomiting and spitting.
Athletes will commonly lose weight rapidly inthe last few days before competition (3–4kg in
the space of 3–4 days) by a combination of sweat-ing and severe restriction of food and fluidintake. This practice of making weight may berepeated very often in a competitive season, asthe lost weight is quickly regained. A moregradual weight loss (3–4 kg over 3–4 weeks)achieved by a more modest restriction of energyintake and increased energy expenditure wouldprobably allow a better hydration state to bemaintained. Prolonged dietary restriction,however, would inevitably involve restriction ofprotein and carbohydrate intake, and might leadto some loss of body proteins and glycogenstores. Although dehydration has a muchsmaller impact on high-intensity exercise than onendurance activities, and does not seem to compromise muscle strength or performance inevents lasting less than 30s, some reduction infunction may occur (Sawka & Pandolf 1990).Dehydration is better tolerated by trained athletes than by sedentary individuals, with less impact on thermoregulation and exerciseperformance (Sawka & Pandolf 1990). Thetrained person has an increased body waterreserve, and may be able to tolerate a fluid deficitof up to 5% of body mass without a significantdetrimental effect on some aspects of physiologi-cal function (Rehrer 1991).
Athletes should be encouraged to maintain a relatively stable body weight and to loseunwanted fat gradually. The practical experienceof athletes and coaches, however, indicates thatthe most successful performers often undergosevere weight-loss regimens in the few daysbefore competition. The use of diuretics, andcompetition after their use, is to be discouraged.Not only does this impair performance, but alsoposes a health risk.
Gaining weight
A high body mass is an advantage in manysports, including the throwing events in athlet-ics, and the top weight categories in weightlift-ing, wrestling and judo. If too much of thisweight is made up of fat, however, performancewill suffer. The principles of weight gain are the
same as those for weight loss: a positive energybalance will result in weight gain, and a negativeenergy balance will result in weight loss. Athleteswho are seeking to gain weight should strive toensure that as much as possible of the gain is inthe form of lean tissue. This can be achieved mosteffectively through a vigorous weight-trainingprogramme that stresses the large muscle groupsin the legs, hips, shoulders, arms and chest.Increases in muscle mass occur only slowly, andmay take many years to be fully realized, but thisis preferable to the increase in body fat that isquickly added by the use of high-energy weight-gain supplements.
Eating a high-protein diet will not in itselfresult in an increase in muscle mass (Lemon1991). Any protein consumed in excess of thebody’s requirement will simply be used as a fuelfor oxidative metabolism, and the excess nitro-gen will be excreted. The common practice ofeating large amounts of meat, dairy produce andeggs is expensive, and is potentially detrimentalto the athlete’s health and performance. Abnor-mal eating habits established during the years oftraining are not easily altered in later life, andconsumption of a relatively high fat diet, whichalmost invariably accompanies a high intake ofthese foods, may lead to an increased risk of car-diovascular disease. In addition, if the intake ofprotein and fat is too high, there will be littleroom left in the diet for high-carbohydrate foods.Without an adequate dietary carbohydrateintake, the athlete is unlikely to be able to train tofull potential and will be unable to maximize thebenefits that accrue from consistent intensivetraining.
Many weightlifters and bodybuilders use spe-cific amino acid supplements in an attempt tostimulate output of growth hormone and insulin,as both of these hormones are involved in thestimulation of protein synthesis and thus in theprocesses of muscle growth and repair. In a care-fully controlled trial, however, supplementationwith the amino acids that are purported to beeffective at a dosage equal to that commonlyused by power athletes (1 g arginine, 1gornithine and 1g lysine, twice daily), had no
weightlifting and power events 629
effect on serum growth hormone or insulin con-centrations (Fogelholm et al. 1993). There seemsto be no substantial evidence to support the useof these supplements.
The addition of medium-chain triglycerides,which include fatty acids with a carbon chain6–12 atoms long, to the diet of athletes is a newphenomenon (Manore et al. 1993). Medium-chaintriglycerides are metabolized differently fromlonger chain fatty acids. They are absorbedrapidly in the gut and transported via the portalvein to the liver, rather than through the lym-phatic system in the form of chylomicrons. Aswith longer chain fatty acids, oxidation occurs inthe mitochondria, but carnitine is not requiredfor transport across the mitochondrial mem-brane. They are rapidly oxidized after ingestion.The use of medium-chain triglycerides is becoming popular with athletes, especiallybodybuilders, because they are energy dense (35.3 kJ · g–1, 8.4 kcal ·g–1), providing twice theenergy of carbohydrate on a weight basis. Asingle dose of 25–30 g of medium-chain tri-glycerides does not cause any gastrointestinalproblems, but some symptoms may occur withhigher doses (Berning 1996). They are, however,relatively expensive. Also, ingestion of largeamounts will stimulate ketone body formation ifnot consumed with an adequate amount of car-bohydrate, and have a strong thermogenic effect.
Creatine supplementation in an appropriatedose can provide improved performance for ath-letes in explosive events: these include all eventslasting from a few seconds to a few minutes. Theeffects and use of creatine are described fully inChapter 27. One commonly reported side-effectis a gain in weight of 1–2 kg within a week ofbeginning supplementation. Most of this extraweight is accounted for by water, but this mayhave implications for athletes in weight categorysports.
References
Berning, J.R. (1996) The role of medium-chain triglyc-erides in exercise. International Journal of Sport Nutri-tion 6, 121–133.
630 sport-specific nutrition
Burke, R.E. & Edgerton, V.R. (1975) Motor unit proper-ties and selective involvement in movement. In Exercise and Sport Science Reviews, Vol. 3, pp. 33–81(ed. J.H. Wilwore & J.F. Keogh). Academic Press,New York.
Costill, D.L., Fink, W.J. & Pollock, M.L. (1976) Musclefiber composition and enzyme activities of elite distance runners. Medicine and Science in Sports 8,96–100.
Fahey, T. (ed.) (1986) Athletic Training: Principles andPractice. Mayfield, Mountain View, CA.
Faulkner, J.A. & White, T.P. (1990) Adaptations of skele-tal muscle to physical activity. In Exercise, Fitness andHealth (ed. C. Bouchard, R.J. Shephard, T. Stephans,J.R. Sutton & B.D. McPherson), pp. 265–279. HumanKinetics, Champaign, IL.
Fogelholm, G.M., Naveri, H.K., Kiilavouri, K.T. &Härkönen, M.H. (1993) Low-dose amino acid sup-plementation: no effect on serum human growthhormone and insulin in male weight lifters. Interna-tional Journal of Sport Nutrition 3, 290–297.
Hill, A.A. (1938) The heat of shortening and thedynamic constants of muscle. Nutrition 126, 136–195.
Lamb, D.R. (1984) Physiology of Exercise: Responses andAdaptations. Macmillan, New York.
Lemon, P.W. (1991) Effect of exercise on protein require-ments. Journal of Sports Science 9, 53–70.
MacDougall, J.D., Elder, G.C., Sale, D.G., Moroz, J.R. &Sutton, J.R. (1980) Effects of strength training andimmobilisation on human muscle fibres. EuropeanJournal of Applied Physiology 43, 25–34.
Manore, M., Thompson, J. & Russo, M. (1993) Diet andexercise strategies of a world-class bodybuilder.International Journal of Sport Nutrition 3, 76–86.
Maughan, R.J. (1984) The relationship between muscle strength and muscle cross-sectional area andthe implications for training. Sports Medicine 1,263–269.
Maughan, R.J., Watson, J.S. & Weir, J. (1983) Strengthand cross-section area of human skeletal muscle.Journal of Physiology 338, 37–49.
Rehrer, N.J. (1991) Aspects of dehydration and rehy-dration during exercise. In Advances in Nutrition andTop Sport Medicine and Sport Science (ed. F. Brouns),pp. 128–146. Karger, Basel.
Rogozkin, V. (1978) Some aspects of athletes’ nutrition.In Nutrition, Physical Fitness and Health. InternationalSeries on Sport Science (ed. J. Parizkova & V.Rogozkin), pp. 119–123. University Park Press, Balti-more, MD.
Rogozkin, V.A. (1993) Principles of athletes’ nutritionin the Russian federation. World Review of Nutritionand Diet 71, 154–182.
Saltin, B. & Gollnick, P.D. (1982) Skeletal muscle adapt-ability: significance for metabolism and perfor-mance. In Handbook of Physiology (ed. L.D. Peachey,

R.H. Adrian & S.R. Geiger), pp. 555–631. Williams &Wilkins, Baltimore, MD.
Sawka, M.N. & Pandolf, K.B. (1990) Effects of bodywater loss on physiological function and exerciseperformance. In Perspectives in Exercise Science andSports Medicine. Vol. 3. Fluid Homeostasis during Exer-cise (ed. C.V. Gisolfi & D.R. Lamb), pp. 1–38. Bench-mark Press, Carmel, IN.
Schott, J., McCully, K. & Rutherford, O.M. (1995) Therole of metabolites in strength training: short vs. long
isometric contractions. European Journal of AppliedPhysiology 71, 337–341.
Sutton, J.R., Farrel, P.A. & Harber, V.J. (1990) Hormonaladaptation to physical activity. In Exercise, Fitness andHealth (ed. C. Bouchard, R.J. Shepard, T. Stephans,J.R. Sutton & B.D. McPherson), pp. 217–257. HumanKinetics, Champaign, IL.
Williams, M.H. (1976) Nutritional Aspects of HumanPhysical and Athletic Performance. Charles C. Thomas,Springfield, IL.
weightlifting and power events 631

Introduction
Racquet sports are played in all parts of theworld and, in addition to being a popular form of recreational activity, have well-developed professional circuits and are represented at theOlympic Games. These games are played eitheron a divided court area across a net (e.g. tennis,badminton) or on a common court against a wall(e.g. squash, racquetball). Table tennis provides aslight variation on these general themes. Thenutritional requirements for racquet sports willvary greatly between the sports and betweenindividuals and are likely to be determined by anumber of factors. Of most importance is thelevel of energy expenditure which, in turn, isinfluenced by the game duration, level of partici-pation and quantity of training/competition,type of match (singles vs. doubles), ability ofopponent and the extent to which they dictateplaying patterns and, in the case of tennis, courtsurface. Environmental conditions will have anadditional impact and are a major determinant offluid needs. For the purposes of this chapter, dis-cussion will be limited to tennis, squash and bad-minton; however, the general principles shouldapply to all racquet sports. Given the complexityof these sports and the interactions between cognitive and physical performance, the racquetsports have been less studied by scientists withan interest in sports performance.
Physiological and metabolic demandsof racquet sports
The physiological and metabolic demands ofracquet sports have been well summarized byReilly (1990). In general, they can be character-ized as intermittent exercise, with relativelyshort bursts of activity, involving both the upperand lower limb muscles, followed by periods ofrest. The average duration of a rally is in therange of 4–12s (Docherty 1982; Dawson et al.1985; Christmass et al. 1995; Faccini & Dal Monte1996), but competitive matches may last fromjust under an hour up to several hours depend-ing upon the number of games/sets played. Forexample, some years ago a tennis match in theDavis Cup team competition, when advantagerather than tiebreak sets were played, lasted forover 6h! Of the racquet sports, tennis has thegreatest range of court surfaces, the consequenceof which is variation in the duration of rallies andmatches. Matches on grass courts tend to be char-acterized by shorter rallies and dominated by theserve and volley. In contrast, matches on hardand clay courts usually involve longer ralliesfrom the baseline. In general, rallies in squashtend to be longer than those in badminton andtennis (Docherty 1982), which may be a functionof the walled court allowing potential ‘out balls’to remain in play.
Measurements of heart rate and V.o2max. during
racquet sports support the contention that thesesports can be classified as moderate- to high-intensity aerobic activities, with values in the
Chapter 48
Racquet Sports
MARK HARGREAVES
632

range of 60–90% of maximal heart rate and50–80% V
.o2max. (Docherty 1982; Elliott et al. 1985;
Garden et al. 1986; Reilly 1990; Bergeron et al.1991; Therminarias et al. 1991; Christmass et al.1995; Faccini & Dal Monte 1996). The heart rateand blood pressure responses tend to be higherin squash and this has led to some discussionabout the risk of cardiovascular events in suscep-tible individuals who play squash vigorously.
The metabolic changes during racquet sportsare consistent with the cardiorespiratoryresponses. Blood glucose usually increases orremains at pre-exercise levels during relativelyshort periods (45–90 min) of play (Noakes et al.1982; Garden et al. 1986; Bergeron et al. 1991;
Therminarias et al. 1991; Christmass et al. 1995). Itis possible that, in the absence of carbohydratesupplementation, blood glucose may fall duringan extended duration match (Burke & Ekblom1982). Blood lactate levels are generally withinthe 1–4mmol · l–1 range (Noakes et al. 1982;Garden et al. 1986; Bergeron et al. 1991; Thermi-narias et al. 1991), although values as high as 5–6mmol · l–1 have been observed (Reilly 1990;Christmass et al. 1995). While this may reflect aperiod of intense activity just prior to sampling,it nevertheless suggests the potential for signifi-cant lactate production during racquet sports.Although no data on muscle metabolites duringracquet sports exist, there is likely to be a largereliance on muscle glycogen, particularly duringlonger matches. The observed increases inplasma glycerol and free fatty acids (Noakes et al.1982; Garden et al. 1986; Christmass et al. 1995),which correlate with match duration, suggest anincrease in lipolysis. Increases in the plasmalevels of catecholamines, adrenocorticotrophichormone, growth hormone, renin and vaso-pressin, and decreases in insulin, have beenobserved during racquet sports (Noakes et al.1982; Garden et al. 1986; Therminarias et al. 1991).
The intermittent nature of racquet sportsresults in a thermal load which is less than thatencountered during continuous exercise ofsimilar intensity. Environmental heat andhumidity will potentially have a greater impacton thermoregulation and fluid balance duringracquet sports. For example, it is not uncommonfor the on-court temperature to be as high as45–50°C on some days of the Australian Opentennis tournament (held during the summermonth of January) and this creates a major chal-lenge to the thermal and fluid balance of eliteplayers. Medical treatment for heat illness (i.v.fluids and postmatch monitoring) was requiredfor two players in the 1997 tournament. In addi-tion, factors such as air-conditioning, ventilation,humidity, and heat generation from lighting will influence the environmental conditionswhen squash, badminton and tennis are playedindoors. Increases in rectal temperature of0.8–1.5°C have been observed following tennis
racquet sports 633
Fig. 48.1 The intermittent nature of sports such astennis combines the demands of an endurance eventwith those of repeated sprints. Photo © Allsport / G.M.Prior.

(Elliot et al. 1985; Therminarias et al. 1991) andsquash (Blanksby et al. 1980; Noakes et al. 1982) inmoderate conditions and greater increases arereported during exercise in the heat (Dawson etal. 1985). Losses of body mass have been reportedin the range of 0.9–2kg (Therminarias et al. 1991;Bergeron et al. 1995), a relatively large fluid losswhich is determined by the balance betweensweat fluid losses and fluid replacement. Theopportunities for fluid replacement tend to begreater in tennis, where there is a change of endsevery two games and a 90-s rest period. In con-trast, during squash and badminton, fluid intakeis usually limited to the end of a game. Anotherconcern for the tournament tennis player is theneed to sometimes play more than one match perday and to play a number of matches on succes-sive days. During the course of several days oftournament play, it is possible that the fluid and electrolyte status of players is challenged(Bergeron et al. 1995).
Nutrition for racquet sports
In general, the nutritional strategies adopted byracquet sport competitors should adhere to theguidelines suggested for most athletes. Totalenergy intake should be sufficient to cover theenergy requirements of competition and train-ing, which in the case of players at the elite levelcan be large. For the recreational racquet sportsparticipant, where total energy expenditure isless and the need to maintain an optimal bodyweight by energy restriction may be greater,there should be a greater emphasis on carbohy-drate intake. Particular attention should be paidto carbohydrate and fluid requirements for thereasons that have been well described in previ-ous chapters. Tournament play will create certaindifficulties in achieving nutritional goals. Theneed for international travel will cause disrup-tion to normal cycles and eating patterns andprovide food choices that differ from thoseusually consumed. Adequate preparation priorto an international trip is essential and this maybe as simple as becoming familiar with food
634 sport-specific nutrition
choices available at a tournament venue or asinvolved as taking certain foods and/or supple-ments as part of the luggage. Most internationaltournaments have excellent catering services;however, delays due to bad weather, prolongedmatches and/or alterations in playing schedulescan interfere with eating plans. Under such circumstances, it is advisable to have a range of light, easily digested, high carbohydrate-containing meals available. Liquid meals/supplements are often appropriate. The othernutritional challenge for the tournament playeris the need for rapid recovery, since matches arescheduled on a daily basis and if a successfulcompetitor is also involved in doubles, there canbe many matches over a relatively short period.Towards the end of a tournament, it is notuncommon for successful competitors to playmultiple games on successive days. To facilitaterapid recovery and optimize liver and muscleglycogen reserves and whole body hydration,carbohydrate and fluid replacement should be emphasized early in the recovery period. The principles underlying this practice havebeen well described in Chapters 7 and 19, respectively.
Another aspect of nutritional practice relatedto the racquet sports is the need for carbohydrateand fluid replacement during activity. The ben-eficial effects of carbohydrate and fluid supple-mentation on performance during exercise, andthe underlying mechanisms, have been welldescribed in the literature (see Chapters 8, 16 and17). It could be argued that any nutritional inter-vention that minimizes the risk of fatigue duringprolonged, strenuous racquet sport activitywould contribute to at least maintained, if notimproved, performance. Furthermore, given theheavy reliance on perceptual and motor skills in the racquet sports, attenuation of the effects of carbohydrate depletion and dehydration oncentral nervous system function is likely toenhance performance. Relatively few studieshave directly tested such hypotheses. Mitchell etal. (1992) observed no benefit of carbohydratesupplementation on indices of tennis perfor-

mance (serve velocity/accuracy, error rates)during 3 h of tennis play. Because a decline inblood glucose was not observed during exercisein the control trial, the authors speculated thatglucose availability was not limiting during thetennis match and accordingly, carbohydrate sup-plementation would have little effect. In contrast,Burke and Ekblom (1982) observed that the addi-tion of carbohydrate to a rehydration beverageenhanced indices of tennis performance to agreater extent than water alone or no fluids. Furthermore, Vergauwen et al. (1998) recentlyobserved that carbohydrate ingestion during 2hof strenuous tennis training increased perfor-mance during a shuttle running test and a spe-cific tennis performance test that assessed errorrates, ball velocity and precision of ball place-ment when compared with ingestion of a sweetplacebo. Based on previous work demonstratingthe benefits of energy and fluid replacementduring continuous and intermittent exercise, it isrecommended that such practices be adoptedduring racquet sports. There is little argumentthat fluids should be ingested. The need for car-bohydrate supplementation will depend uponthe intensity and duration of the match and islikely to be of most benefit the longer the matchprogresses. Athletes should experiment withenergy replacement beverages during trainingand competition of varying duration to identify apractice that best suits their needs.
In summary, the physiological and metabolicdemands of racquet sport training and competi-tion are such that total energy, carbohydrate andfluid intakes should be increased. The trainingdiet should contain sufficient amounts of thesenutrients, together with vitamins and minerals.During periods of intense training and tourna-ment competition, carbohydrate and fluid intake may need to be increased to facilitaterapid recovery on a daily basis. Ingestion of fluid during matches will minimize the risk ofdehydration and carbohydrate supplementationshould also be considered, especially when duration is extended. Given the large number offactors that will influence the nutritional needs of
racquet sport competitors, nutritional guidelinesshould be formulated on an individual basis.
References
Bergeron, M.F., Maresh, C.M., Kraemer, W.J., Abraham,A., Conroy, B. & Gabaree, C. (1991) Tennis: a physio-logical profile during match play. InternationalJournal of Sports Medicine 12, 474–479.
Bergeron, M.F., Maresh, C.M., Armstrong, L.E. et al.(1995) Fluid–electrolyte balance associated withtennis match play in a hot environment. InternationalJournal of Sport Nutrition 5, 180–193.
Blanksby, B.A., Elliott, B., Davis, K.H. & Mercer, M.D.(1980) Blood pressure and rectal temperatureresponses of middle-aged sedentary, middle-agedactive and ‘A’ grade competitive male squashplayers. British Journal of Sports Medicine 14, 133–138.
Burke, E.R. & Ekblom, B. (1982) Influence of fluidingestion and dehydration on precision andendurance performance in tennis. Athletic Training17, 275–277.
Christmass, M.A., Richmond, S.E., Cable, N.T. & Hart-mann, P.E. (1995) A metabolic characterisation ofsingle tennis. In Science and Racket Sports (ed. T. Reilly,M. Hughes & A. Lees), pp. 3–9. E & FN Spon,London.
Dawson, B., Elliott, B., Pyke, F. & Rogers, R. (1985)Physiological and performance responses to playingtennis in a cool environment and similar intervalizedtreadmill running in a hot climate. Journal of HumanMovement Studies 11, 21–24.
Docherty, D. (1982) A comparison of heart rateresponses in racquet games. British Journal of SportsMedicine 16, 96–100.
Elliott, B., Dawson, B. & Pyke, F. (1985) The energeticsof singles tennis. Journal of Human Movement Studies11, 11–20.
Faccini, P. & Dal Monte, A. (1996) Physiologic demandsof badminton match play. American Journal of SportsMedicine 24, S64–S66.
Garden, G., Hale, P.J., Horrocks, P.M., Crase, J.,Hammond, J. & Nattrass, M. (1986) Metabolic andhormonal responses during squash. European Journalof Applied Physiology 55, 445–449.
Mitchell, J.B., Cole, K.J., Grandjean, P.W. & Sobczak,R.J. (1992) The effect of a carbohydrate beverage ontennis performance and fluid balance during pro-longed tennis play. Journal of Applied Sport ScienceResearch 6, 96–102.
Noakes, T.D., Cowling, J.R., Gevers, W. & Van Niekark,J.P. de V. (1982) The metabolic response to squashincluding the influence of pre-exercise carbohydrateingestion. South African Medical Journal 62, 721–723.
racquet sports 635

Reilly, T. (1990) The racquet sports. In Physiology ofSports (ed. T. Reilly, N. Secher, P. Snell & C. Williams),pp. 337–369. E & FN Spon, London.
Therminarias, A., Dansou, P., Chirpaz-Oddou, M.-F.,Gharib, C. & Quirion, A. (1991) Hormonal and meta-bolic changes during a strenuous tennis match: effect
636 sport-specific nutrition
of ageing. International Journal of Sports Medicine 12,10–16.
Vergauwen, L., Brouns, F. & Hespel, P. (1998) Carbohy-drate supplementation improves stroke perfor-mance in tennis. Medicine and Science in Sports andExercise 30, 1289–1295.

Introduction
Most athletes are concerned with either attainingor maintaining an optimal body weight and com-position for their sport, or event within theirsport. For some athletes, increased body size can be an advantage (e.g. basketball, rugby andAmerican football), providing that the increasein size is the result of an increase in the athlete’sfat-free mass. For other athletes, body size is notnearly as important, but it is critical to maintain alow relative body fat (% fat mass) and a high rela-tive fat-free mass (% fat-free mass) to optimizeperformance (e.g. distance running, soccer andswimming). For still other athletes, their bodyweight is dictated by a specific weight category(range of weights) within which the athlete mustfall in order to be eligible to compete (i.e. weightcategory sports).
Weight category sports include all sports inwhich the athlete must compete within a givenweight category. Examples of weight categorysports are provided in Table 49.1. There are also sports, or events within a sport, which areweight controlled. In these sports or events, competition is not organized by weight cat-egories, yet the tradition of the sport or event dic-tates a slim figure, and thus a low body weight.For example, in diving and figure skating, ath-letes are rated by judges as to how well theyperform a certain dive or skating routine. Whilethe emphasis in judging is to be placed on theathlete’s performance, appearance does play asignificant role, and a leaner body is associated
with success. Examples of weight-controlledsports are provided in Table 49.1. Weight-controlled sports are included with weight cate-gory sports in this chapter as they share anumber of common nutritional concerns.Weight-controlled sports are also addressed inChapter 39.
Weight category and weight-controlled sportsand events present a unique challenge from thenutritional perspective (Wilmore 1992). Many ofthese athletes are consciously trying to eitherreduce weight or maintain a weight well belowwhat would be considered normal or optimal for them. This leads to a variety of unhealthynutritional practices, including skipping meals,avoiding specific foods or food groups which are necessary for meeting the minimum dailyrequirement for certain vitamins, minerals ormacronutrients, and the binge–purge syndrome,including the use of diuretics and laxatives,among others. This chapter will focus on nutri-tional issues unique to weight category andweight-controlled sports. It will address tech-niques used to achieve weight loss and weightmaintenance for these sports, the health, physio-logical and performance consequences of weightloss and maintenance through these techniques,and practical considerations as to how to bestachieve and maintain an optimal body weightfor these sports.
Chapter 49
Weight Category Sports
JACK H. WILMORE
637

Weight loss and weight maintenance techniques
For both weight category sports and weight-controlled sports, the rate of weight loss can berapid (i.e. within 24–72 h), moderate (from 72h toseveral weeks), or gradual (from several weeksto months). In some sports, moderate and rapidweight loss will occur many times over a singleseason. Tipton has stated that in wrestling, thisprocess can be repeated between five and 30times per season (Tipton 1981). Thus, the conse-quences of not only an acute period of moderateor rapid weight loss must be considered, but alsothe cumulative effects over the course of a seasonwhere there are multiple bouts of weight loss and
638 sport-specific nutrition
weight regain, or what has been termed weightcycling. The magnitude of the weight loss percycle can also be substantial. Steen and Brownell(1990), in their survey of 63 college wrestlers and368 high school wrestlers, reported that 41% of the college wrestlers reported weight losses of5.0–9.1kg each week of the season while 23% ofthe high school wrestlers lost 2.7–4.5kg weekly.
For sports like wrestling, where both rapid andmoderate rates of weight loss are used, the tech-niques for achieving a given weight loss are quitevaried. Horswill (1994) has listed a number of common methods of weight loss used bywrestlers which are presented in Table 49.2. Thetechnique of negative energy balance is commonacross rapid, moderate and gradual rates ofweight loss. Dehydration, purging and the othertechniques listed in Table 49.2 are most commonfor rapid weight loss, but can extend across themoderate rate of weight loss category as well.
Establishing a negative energy balance is thepreferred technique for weight loss. However,this technique has limited efficacy when theathlete must lose weight in a short period of time.Ideally, the athlete will establish a goal weightwell in advance of his or her need to achieve that weight. A negative energy balance of2100–4200kJ (500–1000 kcal) daily is ideal, andthis should be achieved through a balance of
Table 49.1 Examples of weight category and weight-controlled sports and events.
Weight category sports Weight-controlled sports
Body building Dance (ballet)Boxing Distance runningHorse racing (jockeys) DivingMartial arts (e.g. judo, Figure skating
karate)Rowing GymnasticsWeight lifting Synchronized swimmingWrestling
Table 49.2 Methods of weight loss used by wrestlers. Adapted from Horswill (1994).
Weight lossMethod Example compartment
Negative energy balance Body cell massIncrease energy output Aerobic trainingDecrease energy intake Diet, fasting
Intentional dehydration Body waterMetabolic ExerciseThermal Sauna, sweat suit, rubber suitDiuresis Diuretics, high-protein dietBloodletting
Purging Laxatives, vomiting Gastrointestinal tractOther Haircut Body cell mass
Inversion*
* Inversion involves the wrestler standing on his head to redistribute his blood and body fluids, which somewrestlers believe affects the scale reading.

increased energy expenditure and decreasedenergy intake. The objective is to reach thedesired goal weight over a reasonable period oftime, minimizing the potential loss of fat-freemass (Wilmore 1992).
It has been clearly established that for bothrapid and moderate rates of weight loss, a sub-stantial percentage of the weight loss, i.e. 50% ormore of the weight, can be derived from the fat-free mass, predominantly from the total bodywater and protein stores. In fact, with very lowenergy diets (i.e. 1680–3360 kJ · day–1, 400–800kcal · day–1) or low energy diets extendedover longer periods of time, water and proteincan still constitute a substantial percentage of theweight lost. Keys et al. (1950), in their classicseries of studies on human starvation, fed non-obese adult men a test diet of 6570 kJ · day–1 (1570kcal ·day–1) for 24 weeks. The subjects’ dietwhich maintained stable weight prior to goingon the low energy diet was 14.5 MJ ·day–1 (3468kcal ·day–1). Over the first 11 weeks, approxi-mately 40% of the weight lost was from fat, 12%from protein, and 48% from water, with anaverage rate of weight loss of 0.15kg per day. In astudy of obese subjects, Yang and Van Itallie(1976) reported an average rate of weight loss of0.45kg per day in obese subjects on a 5020 kJ ·day–1 (1200 kcal · day–1) mixed diet over the first 5 days on the diet. Water comprised 66% of the
total weight loss. The relatively high contribu-tion of water to initial weight losses is at leastpartially the result of obligatory water lossaccompanying the metabolism of glycogen andprotein. Both glycogen and protein have hydra-tion ratios of approximately 3–4 g water ·g–1 ofsubstrate, both for storage and degradation (VanItallie & Yang 1977). Thus, athletes must be verycareful when dieting to maximize weight losswhile minimizing loss of fat-free tissue. Again, itis important to combine exercise with diet toachieve a given energy deficit per day. Includingexercise as a component of the energy deficitattenuates the loss of fat-free mass when com-pared to diet alone (Ballor & Poehlman 1994;Saris 1995).
Dehydration is the most widely used tech-nique for rapid weight loss. Intentional dehydra-tion is probably a better phrase to use since theintent of the technique is specific to producingbody water loss, where unintentional dehydra-tion is an unexpected consequence of negativeenergy balance resulting from the obligatorywater loss associated with glycogen and proteindegradation. With intentional dehydration, bothmetabolic and thermal techniques are intendedto induce water loss through sweating, althoughan added bonus from exercise is the obligatorywater loss from depletion of the body’s glycogenstores as discussed previously. Sweat losses,
weight category sports 639
Fig. 49.1 Rapid weight loss tomake weight for competition canpose health risks and can impairperformance. However, as long ascompetitors perceive anadvantage, the practice willpersist. Photo © Allsport / D.Leah.

which are composed mostly of water, can be ashigh as 2–3 l ·h–1 in men acclimatized to heat overthe short term, and up to 10–15 l · day–1 (Wenger1988). Sauna and sudation or water vapour-barrier garments have been widely used topromote sweating, and the subsequent loss ofwater can be considerable. These techniques arenot without risk or negative consequences (Vuori& Wilmore 1994), but dehydration remains apowerful tool for major losses of weight in shortperiods of time.
Dehydration can potentially be induced by theuse of a high-protein diet, as water loss has beenassociated with a high-protein diet. However, thecontribution of a high-protein diet to water loss ismost likely associated with the fact that carbohy-drate intake is reduced. This forces the body torely more on fats, with the resulting productionof ketone bodies. It has been clearly establishedthat an excessive formation of ketone bodies, orketosis, leads to diuresis. Also, as the intake ofcarbohydrate is limited, muscle and liver glyco-gen stores are gradually depleted, resulting infurther water loss, i.e. the obligatory water lossassociated with glycogen degradation. Prescrip-tion diuretics are also used to induce dehydra-tion, although these are on the banned list ofsubstances for use by athletes (Wadler & Hain-line 1989). Certain foods, particularly alcoholand those foods containing caffeine, have sub-stantial diuretic properties. However, caffeine isa banned substance when ingested in excessivequantities, e.g. 6–8 cups of coffee in one sitting(Wadler & Hainline 1989). Refer to Chapter 28 forfurther details.
Bloodletting has been stated as a method usedfor weight loss by wrestlers (Horswill 1994);however, it is unclear if this is widely practised.This was not mentioned as a technique forweight loss in the comprehensive review ofFogelholm (1994), and was not included as atechnique for weight loss in a large survey ofhigh school wrestlers (Weissinger et al. 1991).Most likely, bloodletting is not widely used forweight loss in athletes, as most athletes do notlike invasive techniques and recognize the
640 sport-specific nutrition
obvious physiological and performance disad-vantages of blood loss.
Purging behaviours are discussed in detail inChapter 39, and will not be addressed in detail inthis chapter. Self-induced vomiting and the useof laxatives are the primary purging behaviours.These behaviours can lead to transient weightlosses, but have substantial clinical risk, arepotentially addictive, and can negatively impactathletic performance. While haircuts and inver-sion might be used in hopes of reducing theathlete’s weight, there is no evidence to supportthe efficacy of these techniques.
Health consequences of weight loss
Athletes generally lose weight for one of threepurposes: to qualify for a specific weight cate-gory, to achieve a more aesthetic appearance, and to improve performance potential. There area number of questions raised concerning thepotential for detrimental health consequences ofweight loss. While most critical attention hasbeen focused on rapid and moderate rates ofweight loss, there is also concern over gradual,long-term weight loss. Each of these will beaddressed.
The primary concern with rapid and moderaterates of weight loss is the consequences of severedehydration. Wrestlers have reduced bodyweight by 4–5% in 12–24 h, and losses of up to12% of body weight have been reported(Brownell et al. 1987; Fogelholm 1994). The great-est percentage of the weight lost is from the totalbody water stores. Water accounts for approxi-mately 60% of the total weight of an adult man.Thus, for a 70-kg man, total body water wouldrepresent about 42 kg, or 42 l, assuming a waterdensity of 1.000. The intracellular fluid accountsfor about 67% of the total body water, or 28 l, andthe extracellular fluid accounts for the remaining14 l. Of the 14 l of extracellular fluid, plasmavolume would account for 3 l and the interstitialfluid would account for the remaining 11 l(Guyton & Hall 1996). With rapid weight loss,water is lost from each of the fluid compart-

ments. It has been estimated that the intracellularcompartment can contribute 30–60% of the total;the interstitial fluid, 30–60% of the total; and theplasma volume, 8–12% of the total (Mack &Nadel 1996).
In a study by Costill et al. (1976), eight healthymen cycled at 70% of V
.o2max. in an environmental
chamber (Tamb =39°C) until they were progres-sively dehydrated by 2%, 4% and 6% of theirinitial body weight during a single, prolongedexercise bout. After achieving each level of dehy-dration, the subjects rested for 30 min in a supineposition while a blood sample and muscle biopsywere obtained. Plasma and muscle water con-tents were reduced by 2.4% and 1.2%, respec-tively, for each percentage decrease in bodyweight. Figure 49.2 illustrates the changes in theplasma, interstitial and intracellular fluid com-partments at each level of dehydration.
What are the health implications of such majorchanges in total body water? Of obvious concernis the potential for disturbances in thermoregula-tion. Sawka (1992) concludes from his review ofthe literature that hypohydration, consequent to dehydration, causes greater heat storage (i.e.increased core temperature) and reduces toler-ance to heat strain. This is the result of reductionsin the rate of sweating and skin blood flow. Evenwith decreased skin blood flow, there is still con-siderable displacement of blood to the skin forcooling, making it difficult to maintain centralvenous pressure and an adequate cardiac output.
Excessive sweat or urine loss could also resultin large losses of electrolytes, which could pos-sibly have serious health consequences, such ascardiac dysrhythmias. However, Costill (1977)has concluded that even those electrolyte lossescan be large, they are largely derived from theextracellular compartment, and that losses ofions in sweat and urine have little effect on the K+
content of plasma or muscle.Further, concern has been expressed as to the
effects of chronic dehydration on renal function.Zambraski (1990), in a review of renal function,fluid homeostasis and exercise, concluded thatexercise, particularly in conjunction with hypo-
hydration, sodium deprivation, and/or heatstress, presents a major stress to the kidneys.Renal vasoconstriction and antinatriureticresponses are increased in magnitude whendehydration and/or heat stress are combinedwith exercise. Exercise proteinuria and haema-turia have been reported, indicating dramaticchanges in renal function. However, the inci-dence of acute renal failure is relatively small.The long-term consequences of repeatedepisodes of acute renal stress are unknown.
Repeated bouts of weight cycling have also
weight category sports 641
Tota
l bod
y w
ater
loss
(l)
–2.2
Levels of dehydration (%)
–4.1 –5.80
1.0
2.0
3.0
4.0
30%
60%
10%
52%
10%
38%
50%
39%
11%
3.5
2.5
0.5
1.5
Fig. 49.2 Changes in the plasma (�), interstitial ( )and intracellular water ( ) compartments withexercise and thermal dehydration of 2%, 4% and 6% ofbody weight. Adapted from Costill et al. (1976), withpermission.

been postulated to have negative health conse-quences (Brownell et al. 1987). These wouldinclude an increased energy efficiency, thus anincreased risk of weight gain, increased deposi-tion of fat in the upper body (i.e. visceral fat),lipid and lipoprotein disorders, reproductivedisorders such as delayed menarche and sec-ondary amenorrhoea, and bone mineral distur-bances consequent to secondary amenorrhoea.Fortunately, most of these concerns have nowbeen clearly established to be unrelated to weightcycling (van der Kooy et al. 1993; Anonymous1994; Jeffery 1996).
Athletes attempting to maintain a body weightwhich is lower than that which is normal andhealthy for them is also a cause for concern.These athletes are often in a state of chronicenergy deficit (i.e. energy expenditure> energyintake for many days, weeks or months). Infemale athletes, Loucks and Heath (1994a, 1994b)have demonstrated that once the energy deficitexceeds a certain critical level, reproductive andthyroid function are suppressed, which mightserve as a trigger for athletic amenorrhoea (sec-ondary amenorrhoea in the athletic population).Amenorrhoea in athletes is associated with lowconcentrations of 17b-oestradiol and proges-terone, which are, in turn, associated with lowbone mineral density in the spine (Snead et al.1992). The combination of disordered eating(including energy deficit), amenorrhoea andbone mineral disorders has been termed the‘female athlete triad,’ with the assumption thatdisordered eating can lead to menstrual dysfunc-tion, which, in turn, can lead to bone mineral disorders (Wilmore 1991). The female athletetriad has become a topic of great concern and isthe focus of a recent position statement by theAmerican College of Sports Medicine (Otis et al.1997).
Physiological and performanceconsequences of weight loss
With rapid and moderate rates of weight loss,there will be reductions in total body water,muscle and liver glycogen stores, as well as in
642 sport-specific nutrition
other components of the fat-free mass (Oppligeret al. 1996). For the most part, these athletes arealready very lean prior to weight loss, and sovery little of the weight lost will be derived fromthe fat stores. In fact, Friedl et al. (1994) havereported that there is likely a lower limit to theloss of body fat with weight loss in lean individu-als. In a group of 55 soldiers participating in an 8-week Ranger Training Course, those whoachieved a minimum relative body fat of 4–6% by6 weeks demonstrated only small additionaltotal and subcutaneous fat losses in the final 2weeks and lost increasingly larger proportions offat-free mass. Therefore, as the athlete reaches alow total fat mass, there is a reduced likelihood offurther losses of body fat with weight loss. Con-sequently, the percentage of the actual weightloss from the fat-free mass during rapid andmoderate rates of weight loss is likely to be high.Generally, decrements in performance are associ-ated with losses in the body’s fat-free mass(Wilmore 1992).
Several recent papers have reviewed theresearch literature on the effects of rapid andmoderate rates of weight loss on physiologicalfunction and performance (Fogelholm 1994; Horswill 1994; Oppliger et al. 1996). The results of these reviews are summarized in Table 49.3.Since there is typically an interval of timebetween weigh-in and actual competition formost sports, ranging from a few minutes up to 20h or more, it is extremely important to under-stand how physiological function and perfor-mance respond following a variable period ofrehydration and replenishment of nutrients.Unfortunately, while a great deal is known aboutthe effects of acute dehydration on physiologicalfunction and performance, far less is knownabout the regain in function and performancewith rehydration and intake of nutrients.
From this table, it is very clear that rapid ormoderate rates of weight loss can have majoreffects on both physiological function and per-formance. What is less certain are the potentialchanges that occur with rehydration and foodintake during the interval of time betweenweigh-in and competition. It appears that some

of the function and performance that was lostduring an acute episode of a rapid or a moderaterate of weight loss can be regained within 5–20hproviding ample food and beverage are availableand the athlete is willing to eat. There are stillmany questions to be answered regarding thetotal efficacy of eating and drinking during thisperiod between weigh-in and competition withrespect to regaining normal physiological func-tion and performance. The issue of replacing car-bohydrate postexercise is covered in Chapter 7,and rehydration after exercise-induced sweatloss is covered in Chapter 19.
Practical considerations for weight loss
As stated in a previous section of this paper, theideal way to lose weight for competition is toestablish a goal weight several months inadvance of the start of the competitive season,and achieve this goal weight by gradual reduc-tions in body fat of not more than 0.45–0.9 kg ·week–1 while maintaining or increasing the fat-free mass. Koutedakis et al. (1994) have shownthat weight reduction of the same magnitude(6–7% of body weight) over 2 months vs. 4
weight category sports 643
Table 49.3 Alterations in physiological function and performance consequent to rapid and moderate rates ofdehydration. Data from reviews of Fogelholm (1994), Horswill (1994), Keller et al. (1994) and Oppliger et al. (1996).
Variables Dehydration Rehydration
Physiological functionCardiovascular
Blood volume/plasma volume Ø Ø*Cardiac output Ø ?Stroke volume Ø ?Heart rate ≠ ?
MetabolicAerobic capacity (V
.o2max.) ´, Ø ´*
Anaerobic power (Wingate test) ´, Ø ´, ØAnaerobic capacity (Wingate test) ´, Ø ´, ØBlood lactate (peak value) Ø Ø*Buffer capacity of the blood Ø ?Lactate threshold (velocity) Ø ?Muscle and liver glycogen Ø ØBlood glucose during exercise Possible Ø ?Protein degradation with exercise Possible ≠ ?
Thermoregulation and fluid balanceElectrolytes (muscle and blood) Ø ´Exercise core temperature ≠ ?Sweat rate Ø, delayed onset ?Skin blood flow Ø ?
PerformanceMuscular strength ´, Ø ´, ØMuscular endurance ´, Ø ´, ØMuscular power ? ؆Speed of movement ? ?Run time to exhaustion Ø ?Total work performed Ø Ø*Wrestling simulation tests† Ø ´ ؆
Ø, decrease; ≠, increase; ́ , no known change, or return to normal values; ?, unknown.*From Burge et al. (1993).†From Oopik et al. (1996).
months in the same athletes 1 year lateradversely altered fitness-related performanceparameters in international lightweight oars-women. Unfortunately, for many athletes a pro-longed weight loss protocol is not possible. Sincemost of them are already very lean (low fatmass), they are able to achieve their competitiveweight only by losing large amounts of fat-freeweight with minimal losses of fat mass. This isaccomplished primarily through decreases in thetotal body water stores, and the muscle and liverglycogen stores, both of which are critical to successful performance. Therefore, the length oftime between the weigh-in and competition isextremely important, as is the fluid and nutrientreplenishment protocol. While a solid data baseis not yet available, it would seem logical that thelonger the period of repletion of fluid and energystores, and the more fluid and energy the athletecan ingest during this period, the better will bethe subsequent performance.
What might be an optimal rehydration/refeeding protocol? Of primary concern wouldbe the need to replenish both fluid and glycogenstores. Of secondary concern would be thereplacement of electrolytes lost during theprocess of dehydration. However, electrolytereplacement is essential for the restoration offluid balance (Maughan & Leiper 1995; Shirreffset al. 1996). Thus, it would seem logical to useboth a sports drink (5–10% carbohydrate andelectrolytes) plus a high-carbohydrate foodsource such as sports bars (providing there is atleast 2–3 h before competition). The combinationof the sports drink and sports bar should provideoptimal replenishment for the time available.Since there is not a good data base on this issue,athletes should be encouraged to experimentwith different combinations to see what worksbest for them, keeping in mind that they need toreplenish both fluids and glycogen.
Effective strategies to make weight wouldinclude each of the following.• Compete in an attainable weight category — donot drop down to an unrealistic category.• Lose most of the weight preseason, and lose itgradually to maximize fat loss.
644 sport-specific nutrition
• Ideally, if you need to lose 10% of body weight,lose the first 6% gradually during the preseason,and the last 4% through dehydration 24–48hprior to competition.• Eat a high-carbohydrate diet during trainingand during periods of weight loss to maintain asbest as possible muscle and liver glycogen stores.• Supplement vitamins and minerals if restrict-ing food to lose weight.• Maintain normal hydration during training,except for the 24–48-h period before weigh-in if itbecomes necessary to dehydrate to make weight.• Maximize the period of time between weigh-inand competition to replenish both water andenergy stores.
References
Anonymous (1994) Weight cycling: National TaskForce on the Prevention and Treatment of Obesity.Journal of the American Medical Association 272,1196–1202.
Ballor, D.L. & Poehlman, E.T. (1994) Exercise-trainingenhances fat-free mass preservation during diet-induced weight loss: a meta-analytical finding. Inter-national Journal of Obesity 18, 35–40.
Brownell, K.D., Steen, S.N. & Wilmore, J.H. (1987)Weight regulation practices in athletes: analysis ofmetabolic and health effects. Medicine and Science inSports and Exercise 19, 546–556.
Burge, C.M., Carey, M.F. & Payne, W.R. (1993) Rowingperformance, fluid balance, and metabolic functionfollowing dehydration and rehydration. Medicineand Science in Sports and Exercise 25, 1358–1364.
Costill, D.L. (1977) Sweating: its composition andeffects on body fluids. Annals of the New York Academyof Sciences 301, 160–174.
Costill, D.L., Cote, R. & Fink, W. (1976) Muscle waterand electrolytes following varied levels of dehydra-tion in man. Journal of Applied Physiology 40, 6–11.
Fogelholm, M. (1994) Effects of bodyweight reductionon sports performance. Sports Medicine 18, 249–267.
Friedl, K.E., Moore, R.J., Martinez-Lopez, L.E. et al.(1994) Lower limit of body fat in healthy active men.Journal of Applied Physiology 77, 933–940.
Guyton, A.C. & Hall, J.E. (1996) Textbook of MedicalPhysiology, 9th edn, pp. 298–299. Saunders, Philadelphia, PA.
Horswill, C.A. (1994) Physiology and nutrition forwrestling. In Physiology and Nutrition for CompetitiveSport (D.R. Lamb, H.G. Knuttgen & R. Murray), Vol.7, pp. 131–174. Cooper, Carmel, IN.

Jeffery, R.W. (1996) Does weight cycling present ahealth risk? American Journal of Clinical Nutrition 63(Suppl.), 452S–455S.
Keller, H.L., Tolly, S.E. & Freedson, P.S. (1994) Weightloss in adolescent wrestlers. Pediatric Exercise Science6, 211–224.
Keys, A., Brozek, J., Henschel, A., Mickelsen, O. &Taylor, H.L. (1950) The Biology of Human Starvation.University of Minnesota Press, Minneapolis, MN.
Koutedakis, Y., Pacy, P.J., Quevedo, R.M. et al. (1994)The effects of two different periods of weight-reduction on selected performance parameters inelite lightweight oarswomen. International Journal ofSports Medicine 15, 472–477.
Loucks, A.B. & Heath, E.M. (1994a) Dietary restrictionreduces luteinizing hormone (LH) pulse frequencyduring waking hours and increases LH pulse ampli-tude during sleep in young menstruating women.Journal of Clinical Endocrinology and Metabolism 78,910–915.
Loucks, A.B. & Heath, E.M. (1994b) Induction of low-T3syndrome in exercising women occurs at a thresholdof energy availability. American Journal of Physiology266, R817–R823.
Mack, G.W. & Nadel, E.R. (eds) (1996) BodyFluid Balance during Heat Stress in Humans. OxfordUniversity Press, New York.
Maughan, R.J. & Leiper, J.B. (1995) Sodium intake andpost-exercise rehydration in man. European Journal ofApplied Physiology 71, 311–319.
Oopik, V., Paasuke, M., Sikku, T. et al. (1996) Effect ofrapid weight loss on metabolism and isokinetic per-formance capacity: a case study of two well trainedwrestlers. Journal of Sports Medicine and PhysicalFitness 36, 127–131.
Oppliger, R.A., Case, H.S., Horswill, C.A., Landry, G.L.& Shelter, A.C. (1996) Weight loss in wrestlers: anAmerican College of Sports Medicine position stand.Medicine and Science in Sports and Exercise 28, ix–xii.
Otis, C.L., Drinkwater, B., Johnson, M., Loucks, A. &Wilmore, J. (1997) The Female Athlete Triad. Medicineand Science in Sports and Exercise 29, i–ix.
Saris, W.H.M. (1995) Exercise with or without dietaryrestriction and obesity treatment. InternationalJournal of Obesity 19 (Suppl. 4), S113–S118.
Sawka, M.N. (1992) Physiological consequences ofhypohydration: exercise performance and ther-moregulation. Medicine and Science in Sports and Exer-cise 24, 657–670.
Shirreffs, S.M., Taylor, A.J., Leiper, J.B. & Maughan, R.J.(1996) Post-exercise dehydration in man: effects ofvolume consumed and drink sodium content. Medi-cine and Science in Sports and Exercise 28, 1260–1271.
Snead, D.B., Weltman, A., Weltman, J.Y. et al. (1992)Reproductive hormones and bone mineral density inwomen runners. Journal of Applied Physiology 72,2149–2156.
Steen, S.N. & Brownell, K.D. (1990) Patterns of weightloss and regain in wrestlers: has the traditionchanged? Medicine and Science in Sports and Exercise22, 762–768.
Tipton, C.M. (1981) Consequences of rapid weight loss. In Nutrition and Athletic Performance (ed. W.L.Haskell, J. Scala & J.H. Whittam), pp. 176–197. Bull,Palo Alto, CA.
van der Kooy, K., Leenen, R., Seidell, J.C., Deurenberg,P. & Hautvast, J.G.A.J. (1993) Effect of a weight cycleon visceral fat accumulation. American Journal of Clinical Nutrition 58, 853–857.
Van Itallie, T.B. & Yang, M.-U. (1977) Current conceptsin nutrition: diet and weight loss. New EnglandJournal of Medicine 297, 1158–1161.
Vuori, I. & Wilmore, J.H. (1994) Adjuvants to physicalactivity: do they help in any way? In Physical Activity,Fitness, and Health (ed. C. Bouchard, R.J. Shephard & T. Stephens), pp. 270–284. Human Kinetics, Champaign, IL.
Wadler, G.I. & Hainline, B. (1989) Drugs and the Athlete.F.A. Davis, Philadelphia, PA.
Weissinger, E., Housh, T.J., Johnson, G.O. & Evans, S.A.(1991) Weight loss behavior in high school wrestling:wrestler and parent perceptions. Pediatric ExerciseScience 3, 64–73.
Wenger, C.B. (1988) Human heat acclimatization. InHuman Performance Physiology and EnvironmentalMedicine at Terrestrial Extremes (ed. K.B. Pandolf,M.N. Sawka & R.R. Gonzalez), pp. 153–197. Benchmark Press, Indianapolis, IN.
Wilmore, J.H. (1991) Eating and weight disorders in thefemale athlete. International Journal of Sports Nutrition1, 104–117.
Wilmore, J.H. (1992) Body weight standards and ath-letic performance. In Eating, Body Weight and Perfor-mance in Athletes: Disorders of Modern Society (ed. K.D.Brownell, J. Rodin & J.H. Wilmore), pp. 315–329. Lea& Febiger, Philadelphia, PA.
Yang, M.-U. & Van Itallie, T.B. (1976) Composition ofweight lost during short-term weight reduction:metabolic responses of obese subjects to starvationand low-calorie ketogenic and nonketogenic diets.Journal of Clinical Investigation 58, 722–730.
Zambraski, E.J. (1990) Renal regulation of fluid home-ostasis during exercise. In Perspectives in ExerciseScience and Sports Medicine. Vol. 3. Fluid Homeostasisduring Exercise (ed. C.V. Gisolfi & D.R. Lamb), pp.247–276. Benchmark Press, Carmel, IN.
weight category sports 645

Introduction
Speed skating, ice hockey and figure skating,while quite different activities, all make up thesport of skating. The different types of skatingvary from each other and also within discipline.Speed skating is rhythmical, continuous and fast,and includes long and short track, pack style, in-line, and marathon skating. Ice hockey hasnumerous starts, stops and direction changesand thus is non-rhythmical, and is played by for-wards, defensemen and goalies. Finally, figureskating is more rhythmical than hockey skating,and is also slower and graceful, with the variousjumps being of particular importance in competi-tion in singles, pairs and ice dancing. While thedifferent activities vary in nature, the basicskating motion involves contraction of the hipand knee extensors during the stroke. The threetypes of skating will be discussed independentlyin this chapter.
Speed skating
Skating has been performed in cold weatherlocations since the 1200s as a means of travelwherever there was sufficient ice. Initially,skating was performed with wooden runnersattached to shoes, with iron runners first used inthe late 1500s.
An Olympic sport for men since 1924, and forwomen since 1960, long-track speed skating isperformed on a 400-m oval ice rink. Five eventsare performed by both men (500–10 000m) and
women (500–5000m) lasting approximately0.59–13.50 and 0.63–7.05 min, respectively (Table50.1). In long-track events, two skaters race atone time, thus a time trial is performed, with thefastest skater of all pairs the event winner. Worldchampionships are contested annually in bothsprint (500 and 1000 m) and all-around (500,1500, 3000/5000 and 5000/10000m) events, withtwo events usually held per day.
Short-track skating is generally performed ona hockey rink converted to an 111-m oval. Short-track skating was a demonstration sport in the1988 Olympic Games and has been a medal sportever since. Both men and women perform the500-and 1000-m events, as well as a 3000-m relayfor women and a 5000-m relay for men at theOlympics. At world championship events, menand women also perform the 1500- and 3000-mevents. With short-track skating, multiple skaters(at least four) are on the ice during each race,with multiple heats per event and many eventsper day.
Finally, marathon skating generally entailsmore than 1 h of skating (on a course of at least 40km), and includes such races as the 11 citiesspeed skating race/tour (De Elfstedentocht).This 200-km event is held whenever the channelsof the northern Netherlands are frozen (the eventin 1997 was the 15th) with a limit of 20 000 partic-ipants. Skating times for the event range from6.75 to 18h.
Thus, speed-skating events last from 0.6 min to18h. As very little has been written concerningthe non-Olympic speed-skating events and the
Chapter 50
Skating
ANN C. SNYDER AND CARL FOSTER
646

athletes who participate in them, long-trackskating will be discussed in greater detailthroughout this chapter as it occurs more widelyin the literature.
Propulsion in the speed-skating stroke isobtained from a sideward push-off caused byextension of the hip and knee joint muscles. Gen-erally, 60–80 skating strokes are performed perminute (de Boer & Nilsen 1989). The propulsionor push-off phase of the stroke lasts 0.15–0.20sand is in the middle of the glide (0.50–0.75 s) andrecovery (0.05–0.20 s) phases (de Boer & Nilsen1989). The muscle contraction time/total stroketime (duty cycle) of the hip and leg muscles isapproximately 55% of the activity (de Boer 1986).
Characteristics of speed skaters
The average body composition (men, 10% bodyfat; women, 21% body fat), height (men, 177cm)and weight (men, 74 kg; women, 63 kg) of speedskaters for the most part are similar to that of theaverage man and woman (Snyder & Foster 1994).Muscular strength and endurance (i.e. anaerobicability) are up to 20–35% greater in speed skatersrelative to body weight than the sedentary indi-vidual (Foster & Thompson 1990). Maximalaerobic power in speed skaters is approximately65ml · kg–1 ·min–1 for men and 58ml ·kg–1 · min–1
for women. Skaters reach only 85–90% of theirrunning or cycling aerobic power during askating event, more than likely due to thereduced blood flow caused by the isometricmuscle contractions of the hip and knee exten-sors (Foster & Thompson 1990).
Training practices
Due to a lack of year-round venue availability,speed skaters, like most winter sports athletes,face unique training problems. Even thoughthere are now eight indoor 400-m ice ovals in theworld, very few venues have ice the whole yearround, with most venues open only from Sep-tember to March. Thus, many dry land trainingtechniques are needed. The general training yearfor speed skaters can be broken down into prepa-ration, competition and transition phases (Crowe1990; van Ingen Schenau et al. 1992). Overall con-ditioning is the primary goal of the preparationphase, with general activities progressing to spe-cific skating activities (June to October). Skatingtechnique is emphasized and conditioning main-tained during the competition phase (Novemberto March). Finally, recovery is emphasized dur-ing the transition period (April to June) withactivities other than skating performed.
Generally, elite skaters spend about 30–35 h in14 different exercise sessions per week duringthe preparation phase (Pollock et al. 1982; vanIngen Schenau et al. 1992). As the energy sourceof the different speed-skating races variesdepending on the distance (Fig. 50.1), trainingactivities include: (i) aerobic (distance runningand cycling) activities (40%), (ii) high-intensityinterval/anaerobic activities (20%), (iii) strengthand endurance resistance training (15%), and (iv) skating-related training (25%) (Pollock et al.1982). During the preparation phase, 3 weeks ofintensive training are followed by 1 week ofeasier training (Knapp et al. 1986; van IngenSchenau et al. 1992). The aerobic activities ofskaters are quite similar to those of distance athletes and are intended to build an aerobicbase. The muscular strength and enduranceactivities involve primarily high-intensity (orhigh weight), low repetition and tempo work ofthe hip and knee extensor muscles (Figs 50.2,50.3).
Due to the general lack of ice availability, spe-cific dry land skating activities have been devel-oped and used with varying degrees of success.Dry skating (Fig. 50.4) and low walking are two
skating 647
Table 50.1 Current fastest recorded times for long-track speed-skating events.
Event (m) Women Men
500 0 :37.55 0 :34.761000 1 :14.61 1 :08.551500 1 :56.95 1 :46.433000 4 :01.67 3 :53.065000 6 :58.63 6 :21.49
10000 13 :08.71

activities which can be performed anywhere, butlow walking is usually performed going up a hill(Fig. 50.5). Physiologically and biomechanically,a skater responds differently to low walking anddry skating, therefore activities more similar tospeed skating such as slide board exercise (Fig.50.6) or in-line skating should also be performed(de Boer et al. 1987a, 1987b, 1987c; de Groot et al.1987; Kandou et al. 1987). Because maximal speedbetween speed skating and in-line skating is different, heart rate may be a better indicator of exercise intensity than speed (de Boer et al.1987c). However, since trained individuals may
648 sport-specific nutrition
require high speeds to obtain cardiovascularbenefits from in-line skating, skating up hill maybe required (Hoffman et al. 1992; Snyder et al.1993).
Technique and skating endurance become thegoals once the skater gets on the ice. To facilitatethe skating endurance, goal measurement oflactate ice-profiles may be important. From thelactate ice-profiles we have observed that whenskaters use correct skating posture, with low pre-extension angles of the knee and hip joints,no matter how slow the skater is skating, bloodlactate concentrations of at least 5–7mM occur(Foster & Thompson 1990). We have alsoobserved a right shifting of the lactate ice-profile(i.e. a lower blood lactate concentration at anygiven skating speed) when an athlete is trainingand/or muscle glycogen depleted (Foster et al.1988).
Ener
gy c
ontr
ibut
ion
(%)
1000
Event (m)
5000 100000
20
40
80
100
60
1500500
Fig. 50.1 The aerobic ( ) and anaerobic (�) energycontributions in long-track speed-skating eventsenergy contributions. Adapted from van IngenSchenau et al. (1990).
Fig. 50.2 Long-track speed skater performing heavyweight resistance training. From Foster and Thompson(1990), with permission.
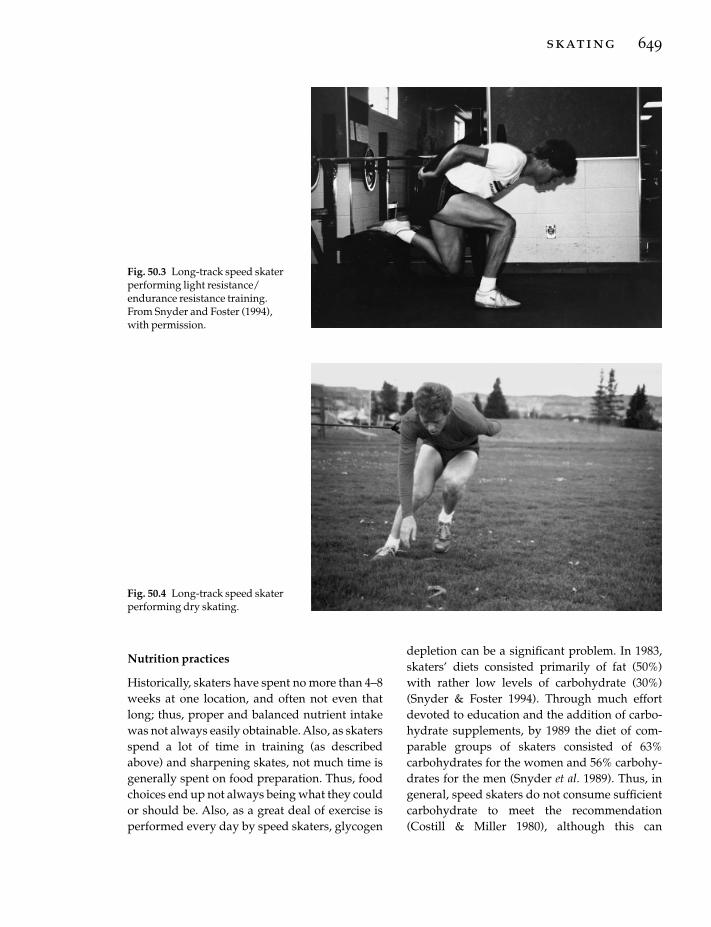
Nutrition practices
Historically, skaters have spent no more than 4–8weeks at one location, and often not even thatlong; thus, proper and balanced nutrient intakewas not always easily obtainable. Also, as skatersspend a lot of time in training (as describedabove) and sharpening skates, not much time isgenerally spent on food preparation. Thus, foodchoices end up not always being what they couldor should be. Also, as a great deal of exercise isperformed every day by speed skaters, glycogen
depletion can be a significant problem. In 1983,skaters’ diets consisted primarily of fat (50%)with rather low levels of carbohydrate (30%)(Snyder & Foster 1994). Through much effortdevoted to education and the addition of carbo-hydrate supplements, by 1989 the diet of com-parable groups of skaters consisted of 63%carbohydrates for the women and 56% carbohy-drates for the men (Snyder et al. 1989). Thus, ingeneral, speed skaters do not consume sufficientcarbohydrate to meet the recommendation(Costill & Miller 1980), although this can
skating 649
Fig. 50.3 Long-track speed skaterperforming light resistance/endurance resistance training.From Snyder and Foster (1994),with permission.
Fig. 50.4 Long-track speed skaterperforming dry skating.
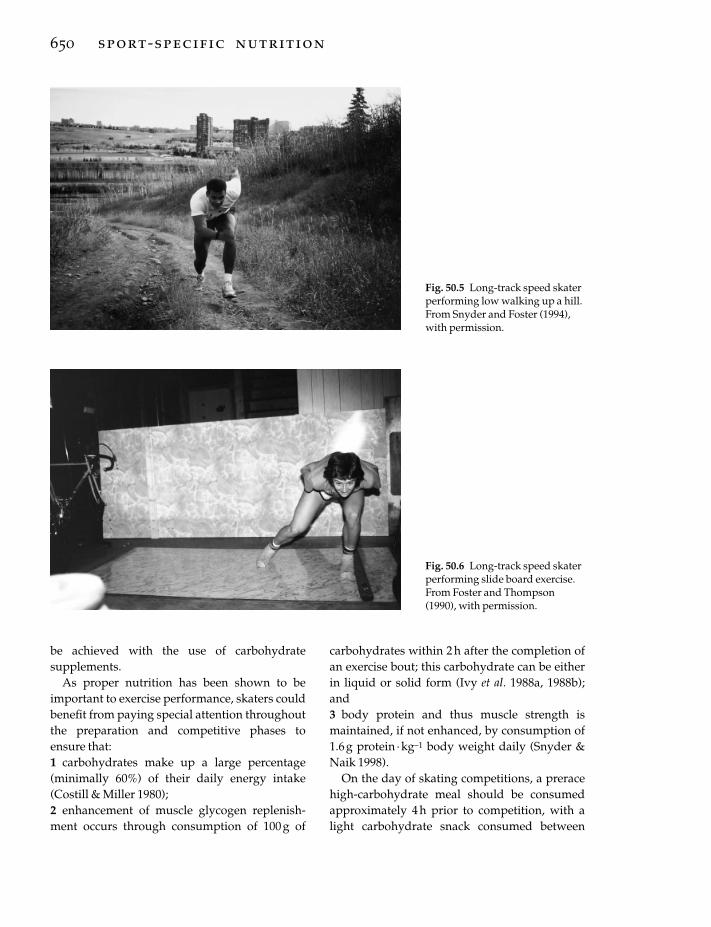
be achieved with the use of carbohydrate supplements.
As proper nutrition has been shown to beimportant to exercise performance, skaters couldbenefit from paying special attention throughoutthe preparation and competitive phases toensure that:1 carbohydrates make up a large percentage(minimally 60%) of their daily energy intake(Costill & Miller 1980);2 enhancement of muscle glycogen replenish-ment occurs through consumption of 100 g of
650 sport-specific nutrition
carbohydrates within 2h after the completion ofan exercise bout; this carbohydrate can be eitherin liquid or solid form (Ivy et al. 1988a, 1988b);and3 body protein and thus muscle strength ismaintained, if not enhanced, by consumption of1.6g protein ·kg–1 body weight daily (Snyder &Naik 1998).
On the day of skating competitions, a preracehigh-carbohydrate meal should be consumedapproximately 4h prior to competition, with alight carbohydrate snack consumed between
Fig. 50.5 Long-track speed skaterperforming low walking up a hill.From Snyder and Foster (1994),with permission.
Fig. 50.6 Long-track speed skaterperforming slide board exercise.From Foster and Thompson(1990), with permission.

events if time permits. A high-carbohydrate mealshould be consumed following the completion ofthe events, in addition to the 100 g of carbohy-drates within the first 2h after competition dis-cussed above, so that muscle glycogen levels arereplenished for the next day of competition.
Fluid should be readily available at all exerciseand competition sites, and should be consumedaccording to a predetermined schedule but alsoas needed, as the thirst mechanism does notalways indicate when the body is in the earlystages of dehydration. Monitoring body weightbefore and after exercise sessions can be used todetect dehydration via weight loss. Through theuse of these guidelines and constant education ofthe athletes regarding food intake and supple-mentation, especially that of carbohydrates, thespeed skater’s diet should be appropriate fortheir exercise and training needs.
Ice hockey
Canadians began playing ice hockey in the early1800s and it became an Olympic sport for men in1920 and for women in 1998. An ice hockey oval is approximately 61¥ 30.5m and is usuallyindoors. The ice hockey game consists of three20-min periods, with a 12-min intermissionbetween periods. Six players are on the ice at onetime for each team: three forwards, two defence-men and one goalie. A team generally has 9–12(3–4 lines or shifts) forwards and 4–6 (2–3 lines)defencemen. The most recent time–motionanalysis has shown that the average skating timeper shift is about 40s, with a large number ofshifts in the playing rotation (Montgomery 1988).As there are fewer defencemen on a team,defencemen generally play for more minutes, ata slower velocity (62% of forwards’ velocity)than forwards.
Even though the ice hockey skate (shorterblade, stiffer/taller boot) is different from thespeed skate, the ice hockey skating stroke, likethat of the speed skater, involves three compo-nents: (i) glide with single support, (ii) propul-sion with single support, and (iii) propulsionwith double support (Marino & Weese 1979).
Propulsion during the stroke therefore occursusing both one and two legs.
Characteristics of ice hockey players
As ice hockey is a relatively new sport forwomen, very little information is available con-cerning women ice hockey players; therefore, thecharacteristics referred to will be those of men.Ice hockey players tend to weigh approximately80kg, are 180cm tall and have about 10% bodyfat (Green & Houston 1975; Houston & Green1976; Orvanova 1987; Agre et al. 1988). Ice hockeyplayers, even more so than speed skaters, tend to have relatively ordinary aerobic abilities (55 ml ·kg–1 · min–1). Finally, as was observed withthe speed skaters, the maximal aerobic ability ofice hockey players was slightly less while skatingthan while running.
Training practices
A typical ice hockey season can last from 5 to 8months and may involve upwards of 100 games.Two to three games can be played in a weekduring the season, with practices usually held onnon-game days. During the season, practice sessions generally involve developing skill andgetting ready for the next game, as games occurfrequently. During a typical practice, a shortwarm-up period will occur along with repeatbouts of high-intensity skating, instruction,special plays and controlled scrimmages, allwithin 1.5–2h (Daub et al. 1982). As with anumber of athletes, during the season aerobicability and muscular strength and endurance aregenerally not enhanced in ice hockey players,and can actually be lower at the end of the seasonthan after preseason training (Green & Houston1975; Cotton et al. 1979; Green et al. 1979; Quinneyet al. 1982; Daub et al. 1983; Johansson et al. 1989;Posch et al. 1989).
In an attempt to increase the aerobic and/ormuscular ability of ice hockey players during thehockey season, additional on-ice or non-ice training was incorporated into the training pro-gramme for a short period (6–7 weeks), with
skating 651
improvements in aerobic ability and skatingspeed and acceleration observed (Hollering &Simpson 1977; Hutchinson et al. 1979; Greer et al.1992). However, addition of a low-intensity (ª 74% V
.o2max.) cycling exercise to a hockey train-
ing programme did not cause any changes inaerobic ability (Daub et al. 1983).
Nutrition practices
Very little literature is available concerning thenutrition practices of ice hockey players. One 7-day diet survey of seven players reported thatthey consumed per day: 2.8 servings of meat orequivalent, 2.3 servings of milk or equivalent, 1.6servings of vegetables, 1.2 servings of fruit, 4.6servings of grain, 2.1 servings of soft drinks andsweets, and 3.0 servings of alcohol (Houston1979). Breads, pasta and crackers made up theprimary grain consumed, while french fries comprised about half of the vegetable servings.Approximately 2.4 meals per day were con-sumed by the ice hockey players, with almosthalf (45%) of the meals consumed away fromhome. Finally, breakfast was skipped 67% of thetime by the players.
Two potential limitations to ice hockey perfor-mance are those imposed by energy metabolismand disturbances in temperature regulation. Dueto the nature of the game, very high intensityexercise is performed for a short period of timeand repeated many times during a game. Theresult for the ice hockey player is great utilizationof muscle glycogen, elevated levels of bloodlactate concentration, and slow recovery fromthe metabolic acidosis due to the sedentarynature of the brief recovery period. In an attemptto enhance performance by enhancing muscleglycogen levels, ice hockey players consumed360g of supplemental carbohydrate for 3 daysprior to a championship series and obtainedmuscle glycogen levels twice as high as those ofplayers who did not consume the supplement(Rehunen & Liitsola 1978). As suggested with thespeed skaters, regular consumption of a high-carbohydrate supplement may be necessary to
652 sport-specific nutrition
ensure normal muscle glycogen levels in icehockey players.
Due to the high-intensity exercise performedand the protective clothing worn by ice hockeyplayers, they can lose 2–3kg of body weightduring a game despite ad libitum fluid intake(Green et al. 1978; MacDougall 1979). Somethings can be done to reduce the protective cloth-ing, such as removing the helmet and gloveswhen not playing, but greater consumption offluids is probably also necessary to ensure properhydration of the ice hockey players.
As the ice hockey season is long and the gamesand practice sessions relatively strenuous,proper nutrient intake is important. Similar tothe recommendations for speed skaters, icehockey players need to consume large amountsof carbohydrate (ª 60% of total energy intake)and protein (ª1.6 g · kg–1 body weight) to ensurereplenishment of muscle and liver glycogenstores and strength maintenance/development.Likewise, fluid intake before, during and after agame should be encouraged to reduce the loss ofbody fluids.
Figure skating
The sport of figure skating has four very differentevents which are performed by different groupsof athletes: men’s singles (Olympic sport since1908), women’s singles (Olympic sport since1920), pairs (Olympic sport since 1920) and icedancing (Olympic sport since 1976). The figureskating rink is maximally 60¥ 30m, and isusually indoors. The figure skate blade is widerthan that of a speed skate, but narrower than thatof an ice hockey skate, with the boot being ofleather (similar to the speed skate) and extendingabove the ankle joint (similar to the ice hockeyskate). Figure skaters perform a short pro-gramme (maximum time, 2.5 min) and a longprogramme (maximum time, 4.0min) duringtheir event.

Characteristics of figure skaters
Figure skaters tend to be shorter (men, 170cm;women, 160cm), lighter (men, 63kg; women, 50kg) and leaner (men, 7% body fat; women, 11%body fat) than speed skaters and ice hockeyplayers (Brock & Striowski 1986; Niinimaa 1982).Compared to the sedentary individual, the elitefigure skater is also generally leaner and lighter.Maximal aerobic ability of figure skaters tends tobe comparable (men, 66ml ·kg–1 · min–1, women,57ml · kg–1 ·min–1) to that of speed skaters andslightly higher than that of ice hockey players(Kjaer & Larsson 1992).
Training practices
At elite level, figure skaters typically spend mostof their training time skating, with total trainingtime being approximately 5 h · day–1 (Niinimaa1982; Brock & Striowski 1986; Smith & Ludington1989). Of this time, approximately: (i) 0.1h · day–1
are spent in preskating warm-up, (ii) 0.9 h · day–1
are spent performing strength and aerobic activi-ties, and (iii) 4h ·day–1 are spent with on-iceactivities (Brock & Striowski 1986). Others (Smith& Micheli 1982) have also reported that less than5min off-ice and on-ice warm-up activities wereperformed by elite figure skaters before eachtraining session.
Heart rate during figure skating is dependentupon the skill being performed, but averagesapproximately 92% of the maximal value (Wochet al. 1979; Kjaer & Larsson 1992). Similarly,oxygen uptake averages approximately 80% ofmaximal for men, and 75% of maximal forwomen during a figure-skating programme(Niinimaa 1982).
A major component of a figure-skating perfor-mance is the jumps, with a high jump usuallyproducing a greater score for technical merit(Podolsky et al. 1990). Muscular strength wouldtherefore seem to be important to the figureskater. Historically, however, figure skaters haveperformed very little resistance training off theice, with almost all of their muscular develop-
ment occurring through repetitions of jumps onthe ice (Podolsky et al. 1990).
Nutrition practices
The nutrition practices of 17 men and 23 womenfigure skaters using the Eating Attitude Test(EAT) and a 3-day diet record were examined by Rucinski (1989). Daily energy intake was 4.9± 1.9MJ (1170±450 kcal) for the women and12.1± 4.5MJ (2890±1075 kcal) for the men.Because of their low energy intake, the womenconsumed less than 60% of the US recommendeddaily allowance for vitamin B6, vitamin B12,vitamin D, folacin, pantothenic acid, iron, andcalcium, whereas the men consumed less than60% of the RDA for only folacin. Additionally,48% of the women were within the anorexicrange.
Figure skaters, similar to the speed skaters andice hockey players, perform demanding exercisesessions throughout a very long season. Thefigure skaters, however, unlike the other skaters,have had to be conscious of their body weightand physique, and disordered eating is thusmore than likely very prevalent, especiallyamong the women. However, the demands of thesport still require adequate nutrient intake, withhigh amounts of complex carbohydrates (ª60%)and appropriate levels of protein (ª1.6 g ·kg–1
body weight). Athletes consuming less thanthese recommendations will not only be impair-ing their exercise performance, but could also beimpairing their health both currently and/or inthe future.
Conclusion
The sport of skating involves many differenttypes of activities, most of which are anaerobic innature. Although preparing to perform theirevents on ice, skaters quite often must perform aportion of their training with dry land activities.The dry land activities need to be as skill-specificas possible and also must stress the anaerobicand aerobic energy systems. Due to the long
skating 653

hours of training performed by all types ofskaters, as well as the multiple bouts of high-intensity exercise, proper food and fluid intakeare a requirement for good performance. Finally,proper warm-up and cool-down activities, flexi-bility exercises, and strength development areimportant in the overall programme of a skater.
Acknowledgements
The United States Olympic Committee (USOC)and United States Speedskating (formerlyUSISA) have funded most of our work with thespeed skaters. We also need to acknowledge theassistance and co-operation of the coaches (DaveBesteman, Mike Crowe, Dianne Holum, GerardKempers, Stan Klotkowski, Jeroun Otter, SusanSchobe, Guy Thiboult and Nick Thometz) andathletes who allowed us to test them over theyears, and also allowed us to learn from them.Finally, we would like to acknowledge KenRundell, Nancy Thompson, Matt Schrager andRalph Welsh, who assisted us in the testing of theathletes.
References
Agre, J.C., Casal, D.C., Leon, A.S., McNally, C., Baxter,T.L. & Serfass, R.C (1988) Professional ice hockeyplayers: physiologic, anthropometric, and muscu-loskeletal characteristics. Archives in Physical andMedical Rehabilitation 69, 188–192.
Brock, R.M. & Striowski, C.C. (1986) Injuries in elitefigure skaters. Physician and Sportsmedicine 14,111–115.
Costill, D.L. & Miller, J.M. (1980) Nutrition forendurance sport: carbohydrate and fluid balance.International Journal of Sports Medicine 1, 2–14.
Cotton, C.E., Reed, A., Hansen, H. & Gauthier, R. (1979)Pre and post seasonal muscular strength tests of pro-fessional hockey players. Canadian Journal of AppliedSport Science 4, 245–251.
Crowe, M. (1990) Year-round preparation of the wintersports athlete. In Winter Sports Medicine (ed. M.J.Casey, C. Foster & E.G. Hixson), pp. 7–13. F.A. Davis,Philadelphia, PA.
Daub, W.B., Green, H.J., Houston, M.E., Thompson, J.A.,Fraser, I.G. & Ranney, D.A. (1982) Cross-adaptiveresponses to different forms of leg training: skeletalmuscle biochemistry and histochemistry. CanadianJournal of Physiology and Pharmacology 60, 628–633.
654 sport-specific nutrition
Daub, W.B., Green, H.J., Houston, M.E., Thompson,J.A., Fraser, I.G. & Ranney, D.A. (1983) Specificity ofphysiological adaptations resulting from ice-hockeytraining. Medicine and Science in Sports and Exercise 15,290–294.
de Boer, R.W. (1986) Training and Technique in SpeedSkating. Free University Press, Amsterdam.
de Boer, R.W. & Nilsen, K.L. (1989) The gliding andpush-off technique of male and female Olympicspeed skaters. International Journal of Sport Biome-chanics 5, 119–134.
de Boer, R.W., de Groot, G. & van Ingen Schenau, G.J.(1987a) Specificity of training in speed skating. InBiomechanics X-B. (ed. B. Jonsson), pp. 685–689.Human Kinetics, Champaign, IL.
de Boer, R.W., Ettema, G.J.C., Faessen, B.G.M. et al.(1987b) Specific characteristics of speed skating:implications for summer training. Medicine andScience in Sports and Exercise 19, 504–510.
de Boer, R.W., Vos, E., Hutter, W., de Groot, G. & vanIngen Schenau, G.J. (1987c) Physiological and biome-chanical comparison of roller skating and speedskating on ice. European Journal of Applied Physiology56, 562–569.
de Groot, G., Hollander, A.P., Sargeant, A.J., van IngenSchenau, G.J. & de Boer, R.W. (1987) Applied physi-ology of speed skating. Journal of Sport Science 5,249–259.
Foster, C. & Thompson, N. (1990) The physiology ofspeed skating. In Winter Sports Medicine (ed. M.J.Casey, C. Foster, and E.G. Hixson), pp. 221–240. F.A.Davis, Philadelphia, PA.
Foster, C., Snyder, A.C., Thompson, N.N. & Kuettel, K.(1988) Normalization of the blood lactate profile inathletes. International Journal of Sports Medicine 9,198–200.
Green, H.J. & Houston, M.E. (1975) Effect of a season of ice hockey on energy capacities and associatedfunctions. Medicine and Science in Sports 7, 299–303.
Green, H.J., Houston, M.E. & Thompson, J.A. (1978)Inter- and intragame alterations in selected bloodparameters during ice hockey performance. In IceHockey (ed. F. Landry & W.A.R. Orban), pp. 37–46.Symposia Specialists, Miami, FL.
Green, H.J., Thompson, J.A., Daub, W.D., Houston,M.E. & Ranney, D.A. (1979) Fiber composition, fibersize and enzyme activities in vastus lateralis of eliteathletes involved in high intensity exercise. EuropeanJournal of Applied Physiology 41, 109–117.
Greer, N., Serfass, R., Picconatto, W. & Blatherwick, J. (1992) The effects of a hockey-specific trainingprogram on performance of bantam players. Canadian Journal of Sport Science 17, 65–69.
Hoffman, M.D., Jones, G.M., Bota, B., Mandli, M. &Clifford, P.S. (1992) In-line skating: physiological

responses and comparison with roller skiing. Interna-tional Journal of Sports Medicine 13, 137–144.
Hollering, B.L. & Simpson, D. (1977) The effects of threetypes of training programs upon skating speed ofcollege ice hockey players. Journal of Sports Medicine17, 335–340.
Houston, M.E. (1979) Nutrition and ice hockey perfor-mance. Canadian Journal of Applied Sport Science 4,98–99.
Houston, M.E. & Green, H.J. (1976) Physiological andanthropometric characteristics of elite Canadian icehockey players. Journal of Sports Medicine and PhysicalFitness 16, 123–128.
Hutchinson, W.W., Maas, G.M. & Murdoch, A.J. (1979)Effect of dry land training on aerobic capacity ofcollege hockey players. Journal of Sports Medicine 19,271–276.
Ivy, J.J., Katz, A.L., Cutler, C.L., Sherman, W.M. &Coyle, E.F. (1988a) Muscle glycogen synthesis afterexercise: effect of time on carbohydrate ingestion.Journal of Applied Physiology 64, 1480–1485.
Ivy, J.J., Lee, M.C., Brozinick, J.T. & Reed, M.J. (1988b)Muscle glycogen storage after different amounts ofcarbohydrate ingestion. Journal of Applied Physiology65, 2018–2023.
Johansson, C., Lorentzon, R. & Fugl-Meyer, A.R. (1989)Isokinetic muscular performance of the quadricepsin elite ice hockey players. American Journal of SportsMedicine 17, 30–34.
Kandou, T.W.A., Houtman, I.L.D., Bol, E.V.D., de Boer,R.W., de Groot, G. & van Ingen Schenau, G.J. (1987)Comparison of physiology and biomechanics ofspeed skating with cycling and with skateboardexercise. Canadian Journal of Sport Science 12, 31–36.
Kjaer, M. & Larsson, B. (1992) Physiological profile andincidence of injuries among elite figure skaters.Journal of Sports Science 10, 29–36.
Knapp, D.N., Gutmann, M.C., Rogowski, B.L., Foster,C. & Pollock, M.L. (1986) Perceived vulnerability toillness and injury among olympic speedskating can-didates: effects on emotional response to training. InSport and the Elite Performer (ed. D. Landers), pp.103–112. Human Kinetics, Champaign, IL.
MacDougall, J.D. (1979) Thermoregulatory problemsencountered in ice hockey. Canadian Journal of AppliedSport Science 4, 35–38.
Marino, G.W. & Weese, R.G. (1979) A kinematic analy-sis of the ice skating stride. In Science in Skiing,Skating and Hockey (ed. J. Terauds & H.J. Gros), pp.65–74. Academic Publishers, Del Mar, CA.
Montgomery, D.L. (1988) Physiology of ice hockey.Sports Medicine 5, 99–126.
Niinimaa, V. (1982) Figure skating: what do we knowabout it? Physician and Sportsmedicine 10, 51–56.
Orvanova, E. (1987) Physical structure of winter sportsathletes. Journal of Sports Science 5, 197–248.
Podolsky, A., Kaufman, K.R., Cahalan, T.D., Aleshin-skky, S.Y. & Chao, E.Y.S. (1990) The relationship ofstrength and jump height in figure skaters. AmericanJournal of Sports Medicine 18, 400–405.
Pollock, M.L., Foster, C., Anholm, J. et al. (1982) Bodycomposition of Olympic speed skating candidates.Research Quarterly 53, 150–155.
Posch, E., Haglund, Y. & Eriksson, E. (1989) Prospectivestudy of concentric and eccentric leg muscle torques,flexibility, physical conditioning, and variation ofinjury rates during one season of amateur ice hockey.International Journal of Sports Medicine 2, 113–117.
Quinney, H.A., Belcastro, A. & Steadward, R.D. (1982)Seasonal fitness variations and pre-playoff bloodanalysis in NHL players. Canadian Journal of AppliedSport Science 7, 237 (Abstract).
Rehunen, S. & Liitsola, S. (1978) Modification of themuscle-glycogen level of ice-hockey players througha drink with high carbohydrate content. DeutscheZeitschrift fuer Sportmedizin 26, 15–25.
Rucinski, A. (1989) Relationship of body image anddietary intake of competitive ice skaters. Journal ofAmerican Dietetic Association 89, 98–100.
Smith, A.D. & Ludington, R. (1989) Injuries in elite pairskaters and ice dancers. American Journal of SportsMedicine 17, 482–488.
Smith, A.D. & Micheli, L.J. (1982) Injuries in com-petitive skaters. Physician and Sportsmedicine 82,36–47.
Snyder, A.C. & Foster, C. (1994) Physiology and nutri-tion for skating. In Perspectives in Exercise Science andSports Medicine. Vol. 7. Physiology and Nutrition forCompetitive Sport (ed. D.R. Lamb, H.G. Knuttgen & R.Murray), pp. 181–219. Cooper Publishing Group,Carmel, IN
Snyder, A.C. & Naik, J. (1998) Protein requirements ofathletes. In Sports Nutrtion for the 90s: The Health Pro-fessional’s Handbook (ed. J. Berning & S. Nelson Steen),Vol. 2, pp. 45–58. Aspen Publishers, Gaithersburg,MD.
Snyder, A.C., Schulz, L.O. & Foster, C. (1989) Voluntaryconsumption of a carbohydrate supplement by elitespeed skaters. Journal of the American Dietetic Associa-tion 89, 1125–1127.
Snyder, A.C., O’Hagan, K.P., Clifford, P.S., Hoffman,M.D. & Foster, C. (1993) Exercise responses to in-lineskating: comparisons to running and cycling. Inter-national Journal of Sports Medicine 14, 38–42.
van Ingen Schenau, G.J., Bakker, F.C., de Groot, G. & de Koning, J.J. (1992) Supramaximal cycle tests donot detect seasonal progression in performance ingroups of elite speed skaters. European Journal ofApplied Physiology 64, 292–297.
Woch, Z.T., Niinimaa, V. & Shephard, R.J. (1979) Heartrate responses during free figure skating manoeu-vres. Canadian Journal of Sport Science 4, 274–276.
skating 655
Introduction
Recreational touring and racing skiing arecommon activities in many countries today butcross-country skiing has been practised forseveral thousand years in northern countries.Ski-racing equipment has changed considerably,and the dimensions of the ski have changed frombeing 3 m long, 10 cm wide, and weighing 2–3kgat the beginning of this century to 2 m, 4cm andabout 0.5kg in the modern era. There are special-ized skis for classic and free-style ski racing. Thecourses on which competition takes place havechanged as well. Now grooming machines areused at least for the more advanced levels ofcompetition, which makes the tracks very hardand durable, thus making the conditions moreequal for all competitors. It must be emphasizedthat racing conditions vary due to changes insnow and weather conditions.
Skiing competitions are classified into two different styles: classic skiing and free style.Three main techniques are used in classic skiing:double pole, kick double pole, and diagonal. Infree-style events, skating techniques dominate:these are characterized by leg movements similarto those in ice-skating combined with variousforms of double poling.
Elite skiing competitions are performed over distances ranging from 5 to 90km. In theOlympic Games and the world championships,the distances range from 5 to 30km in femaleevents and from 10 to 50 km for males. Relayraces are 4¥5 km and 4¥10 km for women and
men, respectively. At present, individual raceslast 12–90 min for women and 22–140 min formen.
Modern rules stipulate that the courses forinternational races must in length be equallydivided into uphill, downhill, and level skiing.Since the racing speed differs greatly amongthese three parts of the course, the time spent inuphill skiing is more than half of the total racingtime, while downhill skiing time correspond-ingly occupies less than 10%. Even so, downhillskiing ability is important. A fall in a downhillpart causes loss of speed and rhythm in skiing.Compared to the winner, the time ‘lost’ is great-est in uphill and level skiing. The exact relationbetween time spent in the different parts is, ofcourse, dependent on many factors such as levelof competition and type of terrain.
Characteristics of elite skiers
International elite competitors are often rela-tively old — average ages are reported to be 27and 29 years for females and males, respectively,indicating that it takes years of training toachieve that level of performance. These eliteathletes do not differ very much in body size,body weight and appearance from other non-obese persons, having relatively little body fatbut not to the extreme degree observed in someendurance sports.
The leg muscles of elite cross-country skiershave been found to consist of predominantlyslow-twitch fibres but the variability is consider-
Chapter 51
Cross-country Skiing
BJORN EKBLOM AND ULF BERGH
656
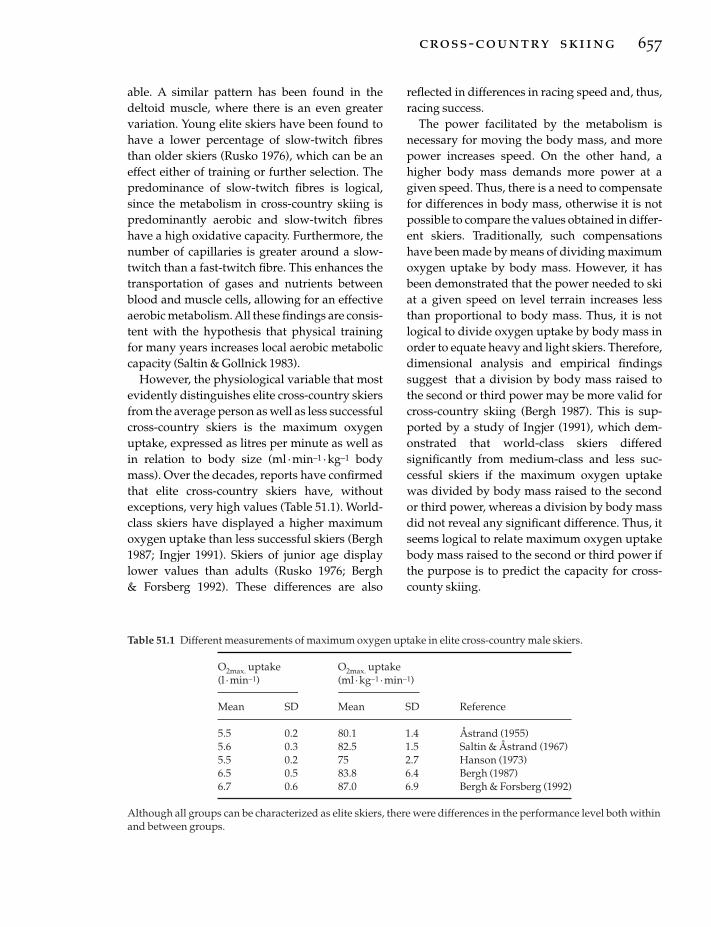
able. A similar pattern has been found in thedeltoid muscle, where there is an even greatervariation. Young elite skiers have been found tohave a lower percentage of slow-twitch fibresthan older skiers (Rusko 1976), which can be aneffect either of training or further selection. Thepredominance of slow-twitch fibres is logical,since the metabolism in cross-country skiing ispredominantly aerobic and slow-twitch fibreshave a high oxidative capacity. Furthermore, thenumber of capillaries is greater around a slow-twitch than a fast-twitch fibre. This enhances thetransportation of gases and nutrients betweenblood and muscle cells, allowing for an effectiveaerobic metabolism. All these findings are consis-tent with the hypothesis that physical trainingfor many years increases local aerobic metaboliccapacity (Saltin & Gollnick 1983).
However, the physiological variable that mostevidently distinguishes elite cross-country skiersfrom the average person as well as less successfulcross-country skiers is the maximum oxygenuptake, expressed as litres per minute as well asin relation to body size (ml ·min–1 ·kg–1 bodymass). Over the decades, reports have confirmedthat elite cross-country skiers have, withoutexceptions, very high values (Table 51.1). World-class skiers have displayed a higher maximumoxygen uptake than less successful skiers (Bergh1987; Ingjer 1991). Skiers of junior age displaylower values than adults (Rusko 1976; Bergh & Forsberg 1992). These differences are also
reflected in differences in racing speed and, thus,racing success.
The power facilitated by the metabolism isnecessary for moving the body mass, and morepower increases speed. On the other hand, ahigher body mass demands more power at agiven speed. Thus, there is a need to compensatefor differences in body mass, otherwise it is notpossible to compare the values obtained in differ-ent skiers. Traditionally, such compensationshave been made by means of dividing maximumoxygen uptake by body mass. However, it hasbeen demonstrated that the power needed to skiat a given speed on level terrain increases lessthan proportional to body mass. Thus, it is notlogical to divide oxygen uptake by body mass inorder to equate heavy and light skiers. Therefore,dimensional analysis and empirical findingssuggest that a division by body mass raised tothe second or third power may be more valid forcross-country skiing (Bergh 1987). This is sup-ported by a study of Ingjer (1991), which dem-onstrated that world-class skiers differedsignificantly from medium-class and less suc-cessful skiers if the maximum oxygen uptakewas divided by body mass raised to the secondor third power, whereas a division by body massdid not reveal any significant difference. Thus, itseems logical to relate maximum oxygen uptakebody mass raised to the second or third power ifthe purpose is to predict the capacity for cross-county skiing.
cross-country skiing 657
Table 51.1 Different measurements of maximum oxygen uptake in elite cross-country male skiers.
O2max. uptake O2max. uptake(l ·min-1) (ml ·kg-1 ·min-1)
Mean SD Mean SD Reference
5.5 0.2 80.1 1.4 Åstrand (1955)5.6 0.3 82.5 1.5 Saltin & Åstrand (1967)5.5 0.2 75 2.7 Hanson (1973)6.5 0.5 83.8 6.4 Bergh (1987)6.7 0.6 87.0 6.9 Bergh & Forsberg (1992)
Although all groups can be characterized as elite skiers, there were differences in the performance level both withinand between groups.

The high values of maximum oxygen uptakein elite cross-country skiers are the result of a high maximum cardiac output elicited by alarge stroke volume. Maximum cardiac output over 40 l · min–1 and stroke volumes over 200 mlhave been measured in skiers with maximumoxygen uptake values over 6 l · min–1 (Ekblom &Hermansen 1968). The maximum heart rates and the arteriovenous differences were close tovalues obtained in less successful athletes andnon-athletes and cannot account for the observeddifferences between the different groups of individuals. Blood volume is also high in these athletes, while haemoglobin concentra-tions are within the normal ranges of non-athletes and less successful athletes (Ekblom &Hermansen 1968).
The information on muscular strength of theelite competitor is not very extensive. Availabledata indicate that the maximum strength of thelegs is only slightly greater than that of theaverage person. However, in endurance tests —such as 50 consecutive knee joint extensions —skiers show superior endurance values to those of most other endurance athletes. The armmuscle strength for poling and, thus, skiing per-formance, is also of the utmost importance.
Ski racing
Energy expenditure
The skier has to expend power in order to moveforward. This power is used for:1 overcoming friction between ski and snow;2 elevating the body mass in uphill skiing andfor each stride during level skiing;3 accelerating the different body segments andthe centre of mass; and 4 overcoming air resistance.
The relative importance of these factors forenergy expenditure during skiing is dependenton several factors, including body composition,type of skiing technique, level of coordinationand technique, type of terrain, snow conditions,and racing speed. Hence, quantitative informa-tion will only be valid under specific conditions.
658 sport-specific nutrition
It is, however, safe to state that on uphill terrainthe cost of elevating the centre of mass accountsfor the major part of the energy expenditure. Indownhill sections, the main resistances are thefriction between the ski and the snow and the airresistance. The power to sustain this powerexpenditure comes from the metabolism exceptin downhill terrain. Hence, skiing speed willdepend on the power producing capacity of themetabolism.
As stated above, the capacity and effectivenessof the aerobic energy system is the most impor-tant factor for physical performance during skiracing, indicating that the central circulation andthe regulation of its distribution are of primaryimportance for skiing capacity. Maximal uphillskiing produces higher oxygen uptake thanmaximal running (Stromme et al. 1977). There isno difference in maximum oxygen uptakebetween maximal uphill skiing using the classicor free-style technique (Bergh & Forsberg 1991).Thus, the muscle mass used during maximalskiing has a metabolic potential which exceedsthe transport capacity of oxygen of the centralcirculation. Any variation in the amount ofoxygen from the heart to the peripheral muscleswill undoubtedly influence skiing performance.During uphill skiing, the heart rate is close to oreven exceeds peak heart rate obtained duringconventional all-out maximal running on atreadmill. During the downhill parts, the heartrate is some 20 beats ·min–1 below maximum,mainly because the strain on the circulation isstill high. During level skiing, the heart rate is onthe average 10–15 beats ·min–1 below maximumand, during longer races, such as the 50km, theheart rate is on the average somewhat lower thanin the shorter races on the same parts of the trackdue to the lower average speed in the longer race.
Training
Important characteristics of cross-country skiingare as follows.1 Metabolism is mainly aerobic.2 Oxygen uptake can be taxed maximally.3 Certain techniques cannot elicit maximum
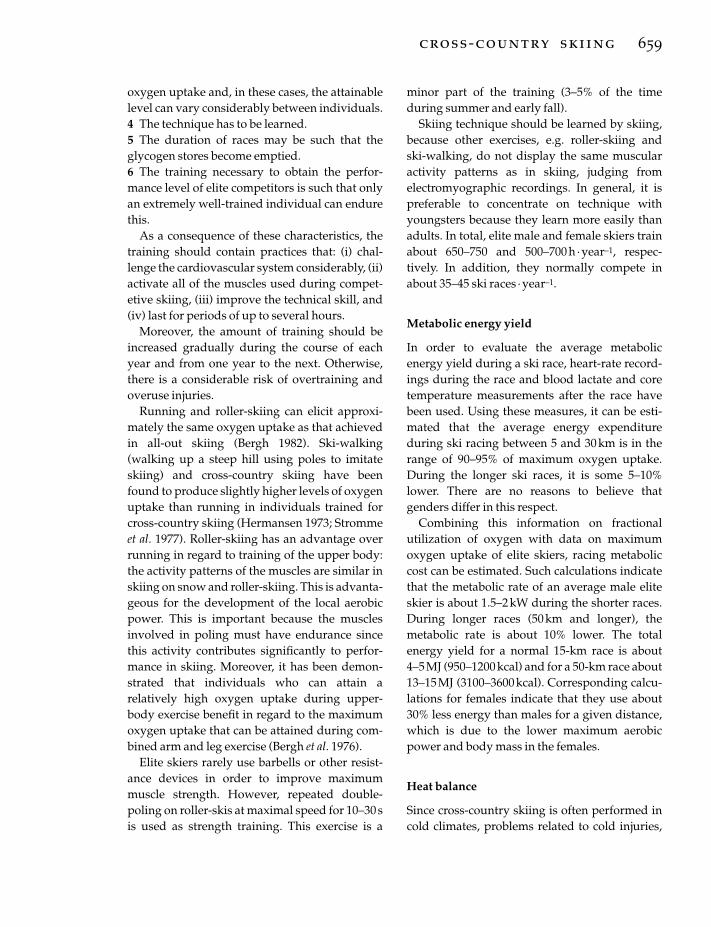
oxygen uptake and, in these cases, the attainablelevel can vary considerably between individuals.4 The technique has to be learned.5 The duration of races may be such that theglycogen stores become emptied.6 The training necessary to obtain the perfor-mance level of elite competitors is such that onlyan extremely well-trained individual can endurethis.
As a consequence of these characteristics, thetraining should contain practices that: (i) chal-lenge the cardiovascular system considerably, (ii)activate all of the muscles used during compet-etive skiing, (iii) improve the technical skill, and(iv) last for periods of up to several hours.
Moreover, the amount of training should beincreased gradually during the course of eachyear and from one year to the next. Otherwise,there is a considerable risk of overtraining andoveruse injuries.
Running and roller-skiing can elicit approxi-mately the same oxygen uptake as that achievedin all-out skiing (Bergh 1982). Ski-walking(walking up a steep hill using poles to imitateskiing) and cross-country skiing have beenfound to produce slightly higher levels of oxygenuptake than running in individuals trained forcross-country skiing (Hermansen 1973; Strommeet al. 1977). Roller-skiing has an advantage overrunning in regard to training of the upper body:the activity patterns of the muscles are similar inskiing on snow and roller-skiing. This is advanta-geous for the development of the local aerobicpower. This is important because the musclesinvolved in poling must have endurance sincethis activity contributes significantly to perfor-mance in skiing. Moreover, it has been demon-strated that individuals who can attain arelatively high oxygen uptake during upper-body exercise benefit in regard to the maximumoxygen uptake that can be attained during com-bined arm and leg exercise (Bergh et al. 1976).
Elite skiers rarely use barbells or other resist-ance devices in order to improve maximummuscle strength. However, repeated double-poling on roller-skis at maximal speed for 10–30 sis used as strength training. This exercise is a
minor part of the training (3–5% of the timeduring summer and early fall).
Skiing technique should be learned by skiing,because other exercises, e.g. roller-skiing and ski-walking, do not display the same muscularactivity patterns as in skiing, judging from electromyographic recordings. In general, it ispreferable to concentrate on technique withyoungsters because they learn more easily thanadults. In total, elite male and female skiers trainabout 650–750 and 500–700h · year–1, respec-tively. In addition, they normally compete inabout 35–45 ski races ·year–1.
Metabolic energy yield
In order to evaluate the average metabolicenergy yield during a ski race, heart-rate record-ings during the race and blood lactate and coretemperature measurements after the race havebeen used. Using these measures, it can be esti-mated that the average energy expenditureduring ski racing between 5 and 30km is in therange of 90–95% of maximum oxygen uptake.During the longer ski races, it is some 5–10%lower. There are no reasons to believe thatgenders differ in this respect.
Combining this information on fractional utilization of oxygen with data on maximumoxygen uptake of elite skiers, racing metaboliccost can be estimated. Such calculations indicatethat the metabolic rate of an average male eliteskier is about 1.5–2 kW during the shorter races.During longer races (50km and longer), themetabolic rate is about 10% lower. The totalenergy yield for a normal 15-km race is about 4–5MJ (950–1200 kcal) and for a 50-km race about13–15MJ (3100–3600 kcal). Corresponding calcu-lations for females indicate that they use about30% less energy than males for a given distance,which is due to the lower maximum aerobicpower and body mass in the females.
Heat balance
Since cross-country skiing is often performed incold climates, problems related to cold injuries,
cross-country skiing 659

breathing problems, and hypothermia might beexpected. For the body as a whole, the metabolicheat production during ski racing is usuallygreater than the heat loss due to convection, con-duction and radiation. Therefore, the skier mustsweat to maintain heat balance. During skiracing, the weight loss, mainly due to water loss,might be some 2–3% of body mass during 15- to30-km races. This will undoubtedly impair per-formance. Therefore, fluid replacement duringraces longer than 15–20km is needed.
Although heat production is high, cold injuriesto peripheral parts of the body, such as fingers,toes, nosetip and ears, are not uncommon duringcold weather, since the wind velocity is high,especially during long downhill segments of a course. Furthermore, pulmonary ventilationmay be at least 100–150 l · min–1 and, in manycases or parts of a track, over 200 l · min–1. Thisputs large demands on the airways, since cold airis very dry and must be heated and saturatedwith water before it reaches the alveolae. Manyskiers experience coughing problems duringraces and after exercise. Therefore, many top eliteskiers use antiasthmatic medications. To avoidlocal cold injuries and breathing problems, com-petitions and hard training sessions should beavoided at temperatures below –20°C.
Total energy yield
The energy cost of cross-country skiing is high, asmentioned earlier. During the preparation ormain training part of the year, which oftenincludes two training sessions per day, the estimated total energy turnover is some 20–25MJ ·day–1 (4800–6000 kcal · day–1). Duringtraining camps, it can be 4–8MJ (950–1900 kcal)higher. The total energy turnover for a 15- and50-km race is about 4–5MJ (950–1200 kcal) and13–15MJ (3100–3600 kcal), respectively.
One of the main nutritional problems is tocover this high energy demand. In many cases,this problem is solved by having three mainmeals — breakfast, lunch and dinner — and,added to that, small meals after each trainingsession. A carbohydrate-rich meal just before
660 sport-specific nutrition
bedtime facilitates restoring the muscle glycogen.
Quality of the meal
The glycogen concentration in activated arm andleg muscles is low or almost empty in manymuscle cells at the end of a race or a long trainingsession. Thus, a meal rich in carbohydrates is anessential part of an elite cross-country skier’sdiet. The post-training meal is especially impor-tant, since the rate of glycogen resynthesis andaccumulation in the muscles seems to be fasterwhen a high-carbohydrate meal is consumed justafter the exercise. It is a general experience thatmost skiers are not hungry immediately after arace, but failure to eat at this time may delayrecovery and limit the training load. Of interestfor the hard training cross-country skier, there-fore, is the observation that postexercise muscleglycogen concentration can be enhanced abovenormal with a carbohydrate–protein supplementas a result of the interaction of carbohydrate andprotein on insulin secretion.
During the racing season, there may be specificnutritional problems at hand. Racing and pro-longed hard training sessions may damage themuscle cells as indicated by a leakage of proteinand other molecules from slow-twitch fibres. Ifthis occurs, the rate of glycogen resynthesis maybe reduced after exhaustive exercise. Therefore,it might not always be possible to fully replenishglycogen stores within 24–48 h after hard racesand training sessions.
Rehydration during skiing
During races, skiers may sweat a lot even in acold climate. The body mass loss for a 15- and 50-km race may be in the range of 2–4% of initialvalue of body mass. It is a well-known fact thatthis can impair physical performance. Rehydra-tion is therefore of great importance for counter-acting the negative influence of the dehydration.However, not only rehydration is of importance.During prolonged exercise, as in cross-countryskiing, a carbohydrate intake during prolonged

exercise will also enhance performance. Themechanism is not clear but it is most likely that the glucose uptake from the bloodstream may contribute considerably to the aerobicmetabolism.
Therefore, most skiers consume some 100–200ml of a 5–10% carbohydrate drink about each10–15min in races with a duration longer than 1h. The intake is of the same order of magnitude asthe minimum of 40–60g · h–1 suggested by Coyle(1991). However, some skiers also take in a solu-tion with up to 25–30% of carbohydrates. Thereason for this is that the net uptake of glucose ishigher in such a solution than with a traditional5–8% concentration, although the water uptakeis, of course, less.
During training camps at altitude, the waterturnover is increased because of the increasedurine output and the high respiratory waterlosses. Some elite skiers drink up to 8–10 l · day–1
in order to compensate for the increased rate ofdehydration during altitude training.
Vitamins and minerals
Vitamins and minerals are essential nutrients foroptimal performance. It is well known that defi-ciencies impair general health and human func-tions but, in present-day society, obvious vitamindeficiencies are rare. Cross-country skiers have ahigh energy intake. Since the amount of nutrientintake mainly follows energy intake when theathlete consumes ‘normal’ food (Blixt 1965),there is a general agreement that the risk of aninadequate nutrient intake is low in athletes withhigh total energy intakes.
Conclusion
Cross-country skiing is dynamic exercise involv-ing a large muscle mass. There are many differentskiing techniques. The energy yield is mainlyaerobic and the cardiovascular system can betaxed maximally during skiing. Therefore, cross-country skiing is effective in regard to endurancetraining. The elite skier is characterized by anextremely high maximum oxygen uptake and
the skeletal muscles contain predominantlyslow-twitch fibres. Body size is not very differentfrom the average person of correspondinggender and age. Training is mainly performed byskiing, roller-skiing and running. The energydemand is very high, and in longer races, theglycogen stores may be emptied. Proper rehy-dration procedures during races are of greatestimportance.
References
Åstrand, P.O. (1955) New records in human power.Nature 176, 922–923.
Bergh, U. (1982) Physiology of Cross-Country Ski Racing.Human Kinetics, Champaign, IL.
Bergh, U. (1987) The influence of body mass in cross-country skiing. Medicine and Science in Sports andExercise 19, 324–331.
Bergh, U. & Forsberg, A. (1991) Cross-country skiracing. In Endurance in Sports (ed. R. Shephard & P.O.Åstrand), pp. 570–581. Blackwell Science, Oxford.
Bergh, U. & Forsberg, A. (1992) Influence of body masson cross-country ski racing performance. Medicineand Science in Sports and Exercise 24, 1033–1039.
Bergh, U., Kanstrup-Jensen, I.-L. & Ekblom, B. (1976)Maximal oxygen uptake during exercise withvarious combinations of arm and leg work. Journal ofApplied Physiology 41, 191–196.
Blixt, G. (1965) A study on the relation between totalcalories and single nutrients in Swedish food. ActaSociologica et Medica Upsallieusis 70, 117–125.
Coyle, E.F. (1991) Carbohydrate feedings: effects onmetabolism, performance and recovery. In Advancesin Nutrition and Top Sport (ed. F. Brouns), pp. 1–4.Medicine and Sports Science No. 32. Karger, Basels.
Ekblom, B. & Hermansen, L. (1968) Cardiac output inathletes. Journal of Applied Physiology 25, 619–625.
Hanson, J. (1973) Maximal exercise performance inmembers of the US nordic ski team. Journal of AppliedPhysiology 35, 592–595.
Hermansen, L. (1973) Oxygen transport during exer-cise in human subjects. Acta Physiologica ScandinavicaSuppl. 339, 1–104.
Ingjer, F. (1991) Maximal oxygen uptake as a predictorof performance in women and men elite cross-country skiers. Scandinavian Journal of Medicine andScience in Sports 1, 25–30.
Rusko, H. (1976) Physical performance characteristics inFinnish athletes. Studies in Sports, Physical Educationand Health Vol. 8. University of Jyvèskylè, Jyvèskylè,Finland.
cross-country skiing 661

Saltin, B. & Åstrand, P.O. (1967) Maximal oxygenuptake in athletes. Journal of Applied Physiology 23,353–358.
Saltin, B. & Gollnick, P.D. (1983) Skeletal muscle adapt-ability: significance for metabolism and perfor-mance. In Handbook of Physiology (ed. L.D. Peachy,
662 sport-specific nutrition
R.H. Adrian & S.R. Geiger), pp. 555–631. Williamsand Wilkins, Baltimore, MD.
Stromme, S.B., Ingjer, F. & Meen, H.D. (1977) Assessment of maximal aerobic power in specificallytrained athletes. Journal of Applied Physiology 42,833–837.
Page numbers in bold refer to tables; page numbers in italic refer to figures.
skeletal muscle contraction 17hydrolysis 19
tricarboxylic acid (TCA) cycleformation 26, 27, 27
adipose tissue 184lipoprotein lipase 46non-esterified fatty acids (NEFA)
release 46, 47triacylglycerol
lipolysis 189storage 29, 472
adolescent athletesbone density 430, 431calcium requirements 430, 438, 589delayed sexual development 432
age at menarche 432, 433, 433developmental changes 430dieting behaviour 430–1eating disorders 588fat intake 435fluid intake 435–7
composition 436, 437growth-related nutrient requirements
435growth spurt 430, 602gymnasts 591
body fat composition 600, 601, 602energy requirements 591, 592female 588growth characteristics 602inadequate nutritional intake 589
iron balance 327, 431, 438menstrual iron losses 430
nutritional education 430, 438–9carbohydrate intake 434–5
nutritional requirements 430protein requirements 146, 435swimmers 610thermoregulation 435–6vitamin/mineral supplements 430vitamin status 437–8
adrenal cortex 32adrenal medulla 32adrenaline 32, 91
carbohydrate ingestion duringperformance response 502
cold stress responses 498sprinting-associated release 538
adrenocorticotrophic hormone (ACTH)187
aerobic metabolism 26–8carbohydrate 5, 6, 7
endurance training response 37maximal exercise intensity 88, 89prolonged exercise 35, 36respiratory quotient (RQ) 8
distance skiing 657, 658energy sources 5, 6–7maximum aerobic power see maximum
aerobic power/oxygen uptake(V
.O2max.)
metabolic power production 7, 7steady state exercise 5, 10team sports 575–6, 576type I muscle fibres 9–10, 19type IIa muscle fibres 20
aerobic training 12, 12–13cardiovascular system response 15child athletes 434duration of events 12oxygen uptake 10, 10power development capacity
detriment 15programme components 13pulmonary ventilation 10, 10skeletal muscle response 15specificity of effects 13see also endurance training
age-related changesenergy expenditure 58splanchnic blood flow 246sweating capacity 207thirst mechanism 211
alanine 125lymphocyte/macrophage metabolism
159muscle production 121, 137, 138production from pyruvate 120, 123,
125–6, 129alanine aminotransferase 125, 125–6, 127,
128, 129albumin-binding protein 187alcohol consumption 357, 405–13
accidents/high-risk behaviour 411athletes’ lifestyles 405–6, 408, 412banned substance status 407
Index
663
abdominal cramps 248, 250, 251acetyl coenzyme A 21, 26, 29, 87acetylcholine
central fatigue 172, 179–80synthesis 179
acid reflux 242, 248, 249acid–base balance 393–5
bicarbonate buffer system 394–5during exercise 395–6regulation 394
acidosis 394, 395acids 393actin filaments 17, 18, 18, 319
contraction mechanism 19action potential 18activities list, energy expenditure 58,
62–72acute phase response 329, 330, 342
zinc serum levels 340adaptive thermogenesis 473adenosine monophosphate (AMP) 22–3,
30deamination to inosine
monophosphate (IMP) 23, 121hot environment exercise 501
glycogenolysis regulation 86, 87adenosine monophosphate (AMP)–
deaminase reaction 23, 121adenosine receptor antagonism by
caffeine 386adenosine triphosphate (ATP) 5, 17, 21,
155, 356energy source 6, 7, 85, 86
high-intensity exercise 33energy yield 21glycolytic pathway 23, 24, 25resynthesis 5, 6, 7, 85
anaerobic 88, 94biochemistry 21energy charge relationship 32maximal exercise intensity 88metabolic overtraining
(overreaching) 493oxidative 88, 94phosphocreatine (PCr) 21–3prolonged exercise 35, 36rates 21submaximal exercise intensity 90

alcohol consumption (Cont.)binge drinking 406, 408, 412chronic intake effects 412cutaneous vasodilation 410–11diuretic effect 262
weight loss techniques 640energy balance 21, 472ergogenic benefits 407guidelines for sensible use 412–13‘hangover’ effects on performance
411–12metabolism 406–7
acetaldehyde metabolite 407during exercise 407hypoglycaemia 407
motor skills effects 408, 412oxidative stress 295postexercise recovery effects 408–12
glycogen resynthesis 410rehydration 262, 409, 409–10soft tissue damage repair 410thermoregulation 411
sports performance response 408standard measures 407
alcohol dehydrogenase 406aldehyde dehydrogenase 407aldosterone 211, 213, 259, 328alkalosis 394, 395allosteric activation
alanine aminotransferase 125, 126, 127,128
energy metabolic pathways 22, 30, 31,34, 86, 87
alpha(a)-carotene 300, 301alpha(a)-ketoglutarate dehydrogenase
87, 125, 269alpha(a)-tocopherol see vitamin EAlzheimer’s disease 292amenorrhoea
bone health relationship 346, 424, 453,517, 642
osteoporosis 320–1, 438chronic energy deficit 642female athlete triad 598–9gymnasts 591, 598–9, 603vegetarians 453
amino acid metabolism 29, 119–29,153–66
oxidative modification 295skeletal muscle 119, 120
alanine aminotransferase 125, 126,127
exercise-related 125–9fatigue mechanism 126, 126–7glucose–alanine cycle 122, 122–3glutamine–glutamate cycle 124–5glutamine synthesis/release 119,
120, 121, 122, 124, 161postabsorptive arteriovenous
differences 120–1protein-containing meal ingestion
123–4at rest 119–25strenuous exercise 161in vitro 120
amino acid pools 119, 134–5, 135amino acid supplements 153, 529
megadose consumption 145, 357–8sprint exercise 544–6strength training 629–30
664 index
amino acidsdispensible/non-dispensible 155energy yield 29insulin secretion stimulation 105protein composition 153, 154
amino acids complementation 79vegetarian diet 446
aminotransferase reactions 120, 120, 121ammonia
active muscle production 121, 137, 138
hot environment exercise 501sprint exercise 540
glutamine–glutamate cycle 125levels with branched-chain amino acid
supplements ingestion 176amphetamines 178, 514amylo-1,6-glucosidase 24amylopectin 73, 75amylose 73anabolic steroids 544, 545anaemia
athletic performance impairment 333definition 328see also iron deficiency anaemia
anaerobic metabolism 21–6, 85adenosine monophosphate (AMP)
levels 22–3children/adolescents 434glycolysis see glycolysisgymnastics 589high-intensity exercise 33, 33–4phosphocreatine (PCr) 21–2pulmonary ventilation data 10, 10–11rate of energy yield 24, 88sprinting 536, 537team sports 574–5, 576type IIb muscle fibres 9, 19
anaerobic training 12, 13duration of events 12, 13skeletal muscle response 15speed skating training 647strength combined training see sprint
trainingtype II fibres as targets 13see also resistance (strength) training
angina 40angiotensin 211, 213
splanchnic blood flow regulation 247anorexia athletica 511
eating patterns 515–16female athlete triad 598–9physical symptoms 514psychological/behavioural symptoms
514–15anorexia nervosa 430
complications 513diagnostic categories 510eating patterns 515–16female athlete triad 598–9mortality 513physical symptoms 514psychological/behavioural symptoms
514–15subclinical cases 511
antacids 249antiasthmatic medication 660antibiotics 251antibody synthesis 164anticholinergics 251
antidiarrhoeal agents 251–2antidiuretic hormone (ADH; vasopressin)
210, 211, 212, 213, 328exercise intensity response 211, 213
antioxidant enzymesexercise-associated changes 344trace mineral dependence 339
antioxidant nutrients 292–311, 527exercise-induced oxidative stress
303–4female athletes’ intake 423supplementation 304–10, 423
hot climate exercise 503, 505antispasmodics 251apolipoproteins 46
oestrogen effects 419apomorphine 178arginine
insulin secretion stimulation 105supplements 357–8, 544, 545, 629
arteriovenous oxygen difference 11ascorbic acid see vitamin Casparagine 119, 121, 129aspartate 119, 121, 129
lymphocyte/macrophage metabolism159
aspirin 332astaxanthin 300atherosclerotic disease 39, 40
body fat regional distribution 49high protein diet relationship 145lipoprotein metabolism 46, 47
atrial natriuretic factor 211, 213
banned drugs 526baroreceptors 210, 213basal metabolic rate (BMR) 203
energy requirements estimation 418inadequate nutritional intake 589
bases 393basketball 10beer as rehydration drink 409–10belching 248, 249beta(b)-carotenes 79, 276, 287, 288, 310
antioxidant properties 300, 301beta(b)-cryptoxanthin 300, 301beta(b)-endorphins 538beta(b)-hydroxy-acyl-CoA-
dehydrogenase (HAD) 199beta(b)-hydroxy-b-methylbutyrate
(HMB) 356–7, 358–9bicarbonate buffer system 394–5bicarbonate (sodium bicarbonate) 393–
401, 541detection in urine samples 401exercise performance response 395–8
dose 398–9, 399duration of action 399–400
gastrointestinal side effects 400legitimacy of use 401
biotin 274bismuth subsalicylate 489blood composition 10blood glucose 16
carbohydrate ingestion during exercise113, 114
energy yield 29exercise intensity responses 90, 91, 91,
94glycolysis substrate provision 23–4

postprandial response to carbohydratefoods 75, 77
see also glycaemic indexprolonged exercise 32, 35, 35, 36, 36regulation 32, 458submaximal exercise 90supply to muscle 90
blood letting techniques 640blood oxygen-carrying capacity 11body fat/lean tissue composition
chromium supplements 347–8cold stress response 611gymnasts 600–2, 601, 602
dietary fat intake 595response to inadequate energy intake
589, 593power events 625ranges for specific sports 477–8, 479swimmers 610–11weight gain programmes 629weight reduction effects 642, 644
body weight 15, 49–50chromium supplements 347–8energy expenditure measurement units
53energy intake relationship 53travel-associated changes 486
bodybuilding 623bone density 318, 319, 322, 323, 642
adolescentsdieting behaviour 431nutritional requirements 430
amenorrhoea relationship 320, 346,424, 438, 453, 517, 642
calcium intake 423exercise effects 322female athletes 423–4multiple micronutrient therapy 346strength training 626stress fracture risk 323vegetarians 453–4
boron 350, 351bowel movement urgency 248, 250, 251boxing 622, 622branched-chain a-keto acid
dehydrogenase 126, 127branched-chain amino acid
aminotransferase 120, 123, 126–7branched-chain amino acids 119, 120,
121, 128, 129brain metabolism 156central fatigue 156
5-hydroxytryptamine hypothesis387
daily requirements 138exercise-associated metabolism 137–8,
138brain 5-hydroxytryptamine
synthesis 172, 173overtraining syndrome (staleness) 494postprandial muscle uptake 123, 124
branched-chain amino acids supplements127, 153, 157, 158, 159, 529
fatigue 157, 159, 174–6, 175, 180hot environment exercise 501side effects 176
branched-chain oxoacid dehydrogenase137
bronchitis 292buffer systems 394
index 665
buffering agents see bicarbonate (sodiumbicarbonate); citrate (sodiumcitrate)
bulimia nervosa 430complications 513diagnostic categories 510eating patterns 515–16female athlete triad 598–9mortality 513physical symptoms 515psychological/behavioural symptoms
515subclinical cases 511
cacitonin 319caffeine 251, 357, 379–90
abuse 388–9urine levels 389
actions of metabolites 387–8, 388central nervous system effects 385–7
adenosine receptor antagonism 3865-hydroxytryptamine central fatigue
hypothesis 387rating of perceived exertion 386–7
cold environment exercise 499, 500‘controlled/restricted drug’ status 379,
388diuretic effects 389, 584
weight loss techniques 640dose 388–9endurance exercise performance
response 379, 380, 380–1, 381, 390carbohydrate intake interactions 389field studies 383metabolic studies 381
fatty acid plasma level response 195habitual consumption 389jet lag management 488lipoprotein lipase upregulation 187liver metabolism 387mechanisms of action 383–7
energy metabolism 384–5skeletal muscle ion handling 383,
385oestrogen interactions 388postexercise fluid replacement 262respiratory quotient (RQ) effect 8short-term exercise performance
response 381–3, 384–5side effects 380–1skeletal muscle effects
calcium transport 319creatine metabolism 376
team sports 584variability of response 388
calcitonin 322calcium 318–23
balance 321–2exercise effects 322–3
bone health 318, 319, 423stress injuries 493
children/adolescents’ requirements320, 323, 430, 437, 438, 589
dietary sources 79female athletes’ requirements 423–5
distance runners 550food sources 321glycogenolysis regulation 30, 86, 319gymnasts’ requirements 589, 591,
597–8, 600
recommendations 603intake 319–21, 323
eating-disordered athletes 516iron absorption inhibition 321
losses 321high protein diet-associated urinary
145, 321sweat 217
roles in body 318–19skeletal muscle physiology
caffeine ergogenic actions 385contraction 17–18, 19, 319fatigue 34sarcoplasmic reticulum reuptake 21
vegetarian diet 449–50weight loss programmes 480
calcium supplements 318, 320, 322children/adolescents 438
bone density 600female athletes 423, 424gymnasts 603zinc uptake effects 424
calorie (cal) 4, 5calorimetry 54
direct/indirect 54energy expenditure in cyclists 563fat metabolism studies 185portable units 55–6
calpain 137cancer 292, 343, 453canthaxanthin 300carbamoyl phosphate synthase II 160carbohydrate-containing rehydration
fluids 234, 235, 235, 528hot climate exercise 504, 505
carbohydrate–electrolyte solutionschildren/adolescents 436hot climate exercise 504ingestion during exercise
cycling 567, 567distance runners 555, 559
postexercise rehydration 259, 263, 571see also glucose–electrolyte solutions
carbohydrate foods 73–83classification
simple versus complex 75–7structural 73, 74
functional characteristics 74glycaemic index 77–8, 78intake recommendations 80–3, 82intake targets 79nutrient density 78–9nutritional heterogeneity 75, 76postprandial response 75practical aspects 79–80, 80
carbohydrate gels 528carbohydrate ingestion during exercise
15, 112–16amount 115cold environment exercise 498–9, 499cycling 562, 566–70, 567
events longer than 90 min 566–7events up to 60 min 567, 567–8recommendations 569–70
distance runners 553–5, 556–7effect on performance 556–7, 557–8recommendations 559
distance skiing 660–1guidelines 81gymnasts 604
carbohydrate ingestion (Cont.)hot environment exercise 502metabolic response 113, 113–14, 114practical aspects 114–16prolonged exercise 36, 37swimming 613–15, 614, 614team sports 584–5timing of consumption 115–16type of carbohydrate 114–15
carbohydrate intake (requirements) 45,46
children/adolescents 434–5distance running 550, 551, 551–2distance skiing 660female athletes 419–21glycogen recovery after exercise
long term 101–3, 102short term 103–8team sports 583, 584
gymnastics 594–5, 604recommendations 603
hot climate exercise 504jet lag management 487, 488postexercise nutrition 103, 103–8, 492
overreaching (metabolicovertraining) prevention 493
protein plus carbohydrate 105–6see also postexercise recovery
power events 624, 627, 628skating 649–50, 651sprinting/sprint training 543–4, 544swimming 611–13, 612team sports 579, 580–1
pretraining/competition meals 583utilization balance 469, 470weight loss programmes 480
carbohydrate loadingcentral fatigue 174–7, 175, 180cycling 564distance running
effect on performance 552–3, 553,554
skeletal muscle glycogen stores 552gastrointestinal symptoms 248, 249gymnastics 594see also glycogen supercompensation
carbohydrate metabolism 39, 85–94aerobic 7
endurance training response 37energy sources 5, 6maximal exercise intensity 88, 89prolonged exercise 35, 36respiratory quotient (RQ) 8
anaerobic glycolysis see glycolysispostexercise replacement see
postexercise carbohydratereplacement
regulation during exercise 457–8thermic effect of food (TEF) 475tricarboxylic acid (TCA) cycle 26see also carbohydrate utilization
carbohydrate stores 15–16, 29, 29–30energy yield 29
carbohydrate utilization 5, 6, 21, 85, 86,97, 108, 356
carbohydrate intake balance 469, 470children 433–5cold environment exercise 498female athletes 419gymnastics 590, 593, 594, 594
666 index
hot environment exercise 500–1intermittent exercise 577–9oxygen utilization in combustion 57respiratory quotient (RQ) 57, 58swimming 610team sports 576, 577–9, 578, 579see also carbohydrate metabolism
carbonic anhydrase 340carbonic anhydrase inhibitors 218cardiac output 10, 11
aerobic power conditioningprogrammes 12–13
definition 11distance skiers 658endurance training response 37oxygen uptake relationship 11, 11
cardiovascular disease 423cardiovascular risk factors 39, 40, 51
cholesterol serum level 46, 48endurance-training effect 47physical activity response 47
cardiovascular training programmeresponse 15
carnitine 357supplements 360–1, 527transport system 188
carnitine palmitoyl transferase (CPT I)199
carotenoids 423antioxidant properties 300–1
catalase 297, 326, 344catecholamines 32
acute stress response 177central fatigue 177–9
nutrition effects 178–9cold stress response 498exercise-associated central
metabolism/depletion 177–8lipoprotein lipase upregulation 187,
188reactive oxygen species (ROS)
generation 294secretion 32strength training response 626systemic effects 32
cathepsins 137cellulose 73central fatigue 153–4, 156, 171–81, 393
acetylcholine 179–80brain catecholamines 177–9children/adolescents 4355-hydroxytryptamine hypothesis 156,
172–4, 173caffeine ergogenic actions 387nutritional effects 174–7, 175
mechanisms 171–2, 180neurotransmiter function 172nutritional strategies 180overtraining syndrome (staleness) 494specific inhibition of motor drive 171
central nervous systemcaffeine ergogenic actions 384, 385–7
adenosine receptor antagonism 3865-hydroxytryptamine central fatigue
hypothesis 387rating of perceived exertion 386–7
fatigue see central fatiguestaleness (overtraining syndrome) 494
cerebrovascular disease 292ceruloplasmin 341, 342, 343
children 429–39calcium requirements 320, 323, 438carbohydrate energy sources 433–5dehydration 207energy expenditure 58fat intake 435fat utilization 433–5fluid intake 435–7
composition 436, 437growth 435
elite athletes 432, 432–3energy requirements 429, 430, 432influence of exercise 432
gymnasts 588, 591body fat composition 601, 602energy requirements 591, 592
iron balance 327, 334, 438iron supplements 598nutritional education 438–9
carbohydrate intake 434–5nutritional requirements 430, 435protein requirements 146, 435sport-specific training 513sweating capacity 207thermoregulation 207, 435–6vitamin status 437, 438see also adolescent athletes
chlorideintake 208losses in sweat 209, 210, 217, 218, 228,
228children/adolescents 436distance runners 556
plasma levels following exercise 210cholecystokinin 247cholesterol 46, 47
oestrogen effects 419choline 357
acetylcholine synthesis 179, 180exercise-associated plasma levels 180supplements 180, 362, 527
chromium 339, 346–9exercise effects 347food sources 346–7requirements 346supplements 346, 347, 351
body fat loss 348lean body mass response 347–8negative effects 349
chylomicrons 46, 185, 187cimetidine 249ciprofloxacin 489circulation 10, 11–12citrate (sodium citrate) 393, 400–1
detection in urine samples 401exercise performance response 395–8gastrointestinal side effects 400legitimacy of use 401
citrate synthase 32, 87citric acid cycle see tricarboxylic acid
(TCA) cycleclosed circuit oxygen consumption
measurement 54cocaine 514coenzme Q10 see ubiquinonecold environment exercise 497–500
cold stress see cold stressdietary modification 498–500ergogenic aids 499substrate utilization 498

cold stress 497body fat composition effects 611distance skiing 659–60swimmers 611
colonic mucosal ischaemia 332colorectal cancer 247complete nutrition/energy beverages
528concentric muscle action 4conditioning adaptation 12–15
circulatory variables 12skeletal muscle fibre types 19
conduction heat loss 204, 216convection heat loss 204copper 339, 341–3
exercise effects 342–3food sources 342requirements 342supplementation 425
core temperature elevationclimatic heat stress 220, 220–1gastric emptying response 243hyperhydration response 221–2sweating response 227
coronary heart disease 40–2, 41, 292vegetarians 445
cortisol 32carbohydrate ingestion during
performance response 502secretion 33strength training response 626
counter-regulatory hormones 458cramp 229
see also abdominal crampscreatine 35, 88, 357, 367–76
biosynthesis 367, 368degradation to creatinine 368distribution 367metabolic abnormalities in
pathological states 373creatine kinase 21, 88creatine supplements 526, 527, 530, 541,
546carbohydrate combinations 370–1, 371ethical aspects 583exercise performace effects 372–5, 374gymnasts 595health risks 371–2, 376mechanism of action 375–6skeletal muscle accumulation 368–71,
369, 370, 371, 374, 374, 375strength training 630team sports 583
creatinine 368levels following creatine
supplementation 368–9critical evaluation of research/product
claims 525cross-country skiing see distance skiingcyanocobalamin 273cycling 562–71
eating behaviour 564energy costs 203, 204, 562–4fluid intake
during exercise 568exercise recovery 571
glycogen supercompensation 564–6nutrition during exercise 566–70
events longer than 90 min 566–7events up to 60 min 567, 567–8
index 667
feeding zones 569medium-chain triglyceride ingestion
568practical aspects 568–9recommendations 569–70
postexercise nutrition 570–1guidelines 571
prerace feeding 565–6recommendations 566
dancers, calcium balance 320, 323, 438definitions 3dehydration 207, 216–23, 256
children/adolescents 207, 436distance runners 556diuretics-induced 218education programmes 236exercise capacity effects 219, 219, 256,
258endurance exercise 219–20
gastric emptying response 243gastrointestinal symptoms 247hot environment exercise 503maximum aerobic power/oxygen
uptake (V.
O2max.) 218–19, 219for rapid precompetition weight loss
216, 629, 638, 639–40health consequences 640–1, 641performance consequences 643physiological consequences 643replenishment 237, 643, 644
sweating losses 216, 218, 226sweating response impairment 221,
221, 229thirst 211, 212travel-associated 486–7, 488traveller’s diarrhoea 489water deficit alleviation 217–18
dental caries 75, 77depression 177diabetes mellitus 43, 77, 292, 457–65
foot problems risk 463–4insulin-dependent (type I; juvenile)
457, 460–3blood glucose monitoring 460, 461,
462dietary modification 461–2exercise training 460–1glycogen stores replenishment 462,
463hypoglycaemia avoidance 461–2,
462insulin therapy 457, 460, 461
non-insulin-dependent (type II) 39, 51,457, 463–5
benefits of exercise 463dietary modification 464–5exercise training 463–4insulin resistance/
hyperinsulinaemia 43, 463diarrhoea 250, 251, 257
Oral Rehydration Fluid therapy 263travel-associated 488–9
food safety 489prophylactic drugs 489treatment 489
dibencozide 529diet pills 513, 514diet reports
alcohol consumption 405
energy intake estimation 477, 563protein requirements assessment 146
dietary fibre 73, 75bowel bacteria metabolism 76–7health benefits 77postprandial blood glucose curve 75
dietary guidelines 417–18nomenclature 417
dietary-induced thermogenesis seethermic effect of food
dietary reference values (DRV) 417dieting behaviour 469, 479–80, 513
weight category sports 637dihydroxyacetone plus pyruvate (DHAP)
357dilutional pseudoanaemia 328disaccharides 73, 75
functional characteristics 74distance running 550–9
carbohydrate ingestion during running553–5
effect on performance 556–7, 557–8carbohydrate loading 552
effect on performance 552–3, 553,554
dietary intake during training 550–2,551
fluid losses 555–6, 556fluid replacement 553–5
recommendations 559skeletal muscle glycogen stores 552sodium chloride losses 556see also marathon running
distance skiing 656–61competition distances 656elite competitor characteristics 656–8
cardiovascular variables 658maximum aerobic power/oxygen
uptake (V.
O2max.) 657, 657energy expenditure 658energy intake 660fluid intake 660–1heat balance 659–60iron profile in competition 329metabolic energy yield 659techniques 656training 658–9vitamins/minerals 661
diuretics 218, 220banned status 514caffeine 389, 584, 640eating disorders-associated use 513,
514weight category sports 637
making weight 629, 640DNA oxidative damage 296dopamine
central fatigue 172, 177–8drug responses 178
central neurotransmission 177doping definition 526Doppler ultrasound 245, 246Douglas bag method 55doxycycline 489drinking behaviour 211, 212
rehydration following distancerunning 556
water deficit alleviation 212, 217drug abuse 513–14drug nutrients 357

dry skating 647, 649duration of exercise
carbohydrate metabolism 88conditioning programmes 12, 13energy sources 5excess postexercise oxygen
consumption (EPOC) 474fat metabolism effects 185–7, 186high-intensity exercise 34metabolic response to exercise 35–7power production relationship 6–8, 7resistance training 13respiratory quotient (RQ) 8see also prolonged exercise
dynamic muscle action 3, 4concentric 4eccentric 4
eating disorders 431, 469, 510–20aetiological model 513, 514diagnostic categories 510–11eating patterns 515–16female athlete triad 598–9figure skaters 653gymnasts 588, 598–9, 601laboratory tests 518long-term health effects 516–17medical aspects 513–14prevalence 511–12
data collection methods 512female athletes 511, 511male athletes 511–12
prevention 519–20psychological effects 516risk factors 512–13self-report versus clinical interview
512sports performance effects 516treatment 517–19
goals 518nutritional counselling 517training/competition during 518–19
weight category sports 637eccentric muscle action 4
muscle damage 107–8, 137postexercise recovery 584strength training 625team sports 584
electrolyte balance 216–18, 226–38intake 208losses
hot climate exercise 504sweating 208–10, 209, 217, 228–9,
256, 504voluntary dehydration for rapid
weight loss 641plasma levels following exercise
209–10postexercise restoration 237, 258–9rehydration fluids 234, 235, 235renal function 213replacement during exercise 233–4
sports drinks 233, 233, 234electron transport chain 26–7, 28, 88, 342
reactive oxygen species (ROS)generation 293
emotional stress, gastric emptyingresponse 243, 250
emphysema 292
668 index
endothelin-1 247endurance exercise
caffeine response see caffeinecarbohydrate intake
female athletes 420guidelines 81
dehydration-associated impairment219
high fat dietadaptation over time 196–9, 198, 199animal studies 192–4brief carbohydrate-rich diet
combination regimens 193–4,200–1, 201
human studies 194–201muscle glycogen content 199–200short-term impairment 196
muscle glycogen stores 36, 97, 199–200protein metabolism 136–7, 137, 138,
139–40, 140branched-chain amino acids 137,
138protein requirements 140–2, 141, 142,
144pulmonary ventilation as limiting
factor 11, 12sweating
rates 227, 228water loss 226, 236
endurance training 12carbohydrate energy sources 108distance skiing 658–9ergogenic aids 359–64metabolic responses
antioxidant enzyme activity 297insulin-mediated glucose uptake
44–5iron balance 327, 328lipoprotein profiles 47substrate use 37
non-insulin-dependent diabetes 464skeletal muscle changes 15, 37
triacylglycerol content 188speed skating training 647, 649, 650see also aerobic training
energy 6–8SI units 4
energy balance 49–51assessment 477carbohydrate intake/utilization 469,
470cycling 562–4, 563, 563expenditure see energy expenditurefat intake/utilization 471, 471–2intake see energy intake (requirements)protein intake/utilization 470–1weight loss programmes 469, 638–9
energy bars 528energy charge of muscle cell 32energy costs see energy expenditureenergy expenditure 53–9, 203–4, 472–5
activities list 58, 62–72children 58components 53, 472–3, 473cycling 562–4, 563, 563distance running 550, 551distance skiing 658, 659elderly people 58excess postexercise oxygen
consumption (EPOC) 474
measurement methods 54–8, 475–7calorimetry 54food consumption 56oxygen consumption 54–6, 57physiological variables 56–7
measurement units 53–4racquet sports 632respiratory exchange ratio (RER) 58respiratory quotient (RQ) 57–8
energy intake (requirements) 45, 46, 50,108, 418–19
body size relationship 53children 429cycling 563, 563, 563disease risk associations 39, 40distance skiing 660eating-disordered athletes 516energy balance assessment 477growth 429gymnasts 591, 591–3
inadequate 591, 592, 593, 602measurement 477power events 624, 627, 628sprint training 541swimming 609–10travel-associated changes 486
energy metabolism 20–1, 22aerobic 26–8anaerobic 21–6caffeine ergogenic actions 383, 384–5children/adolescents 433–5iron-dependent enzymes 447iron requirement 326putative nutrition supplement
enhancers 530regulation 30–3, 31, 85–8
hormones 32–3intracellular factors 30–2
trace mineral-dependent enzymes339
energy stores 17, 29, 29–30, 49, 85, 86energy substrates 6, 85, 86, 97, 155, 356
cold environment exercise 498exercise intensity
maximal 88–9, 89submaximal 90
female athletes 419gymnastics 593–5hot environment exercise 500–1intermittent exercise 577–9muscle metabolism 5–6, 20–1prolonged exercise 35, 35–6, 36, 90short-term sports performance 5team sports 576, 576–7
ephedrine 499, 500epigastric fullness (bloating) 248, 249epigastric pain 249ergogenic aids 356–64
aerobic endurance sports 359–64cold environment exercise 499definition 527ethical aspects 526legality 364mode of action 357safety 364strength/power sports 357–9
erythrocyte glutathione reductase 270,271
erythrocyte transketolase 269erythropoietin 332

essential amino acids 153estimated average requirement (EAR)
417ethical aspects 526, 583evaporative heat loss 204–5, 216, 226
determinant factors 205hot weather 206–7
excess postexercise oxygen consumption(EPOC) 474
exercisebenefits 39
see also health gainsdefinition 3physiology 3–16quantitation 4–5types 4
exercise machines 13exhaustive exercise see prolonged
exerciseexternal respiration (pulmonary gas
exchange) 10–11
FADH 26, 87, 88fast twitch muscle fibres see type II muscle
fibresfat energy sources 21, 85, 86, 97, 184–5,
185, 192, 356oxygen utilization in combustion 57respiratory quotient (RQ) 57, 58
fat intake (requirements) 51children/adolescents 435distance runners 551, 551female athletes 422gymnasts 594–5
recommendations 603non-insulin-dependent diabetes
mellitus 464power events 627, 628team sports 580, 581utilization relationship 50–1, 471,
471–2fat metabolism 6, 7, 39, 184–9
caffeine ergogenic actions 384energy availability 184, 185exercise intensity/duration effects 35,
36, 185–7, 186oestrogen effects 419regulation during exercise 457–8thermic effect of food (TEF) 475see also fat utilization; fatty acid
oxidationfat stores 6, 15, 29, 29–30, 49–50, 184
regional distribution 49, 50skeletal muscle 17
fat utilizationcaffeine ergogenic actions 383, 384children 433–5cold environment exercise 498endurance training response 37energy sources 5, 155–6fat intake relationship 50–1, 471, 471–2female athletes 419gymnastics 594, 594high fat diet 192hot environment exercise 501prolonged exercise 35, 36swimming 610team sports 576see also fat metabolism
fatigue 93, 153–9, 458
index 669
amino acid metabolism 126, 126–7bicarbonate (sodium bicarbonate)
ingestion effects 395biochemical mechanisms 153–5branched-chain amino acids
supplements 127, 157, 159carbohydrate ingestion during exercise
37carbohydrate intake deficiency 83causes 393central see central fatiguedefinition 34, 171, 393excitation-coupling failure 34–5glycogen depletion 36, 97, 112, 127,
128, 155, 157glycogen supercompensation regimens
101high-intensity exercise 34hot environment exercise 501–3hypoglycaemia 97inosine 5’-monophosphate (IMP)
accumulation 501intermittent exercise 577–8iron deficiency anaemia 326jet lag 487lactic acid accumulation 34, 93, 155peripheral 154, 171, 393phosphocreatine (PCr) depletion 21,
93, 372, 372creatine intake response 373glycine intake response 373
skeletal muscle calcium metabolism34, 319
skeletal muscle fibre types 20sprinting 536, 538–40swimmers 610, 612, 614–15
fatty acid-binding protein 187high fat diet response 196, 199
fatty acid mobilization 156–7central fatigue 156
carbohydrate feeding effects 174tryptophan/branched-chain amino
acids plasma elevation 156, 157,172, 173
fatty acid oxidation 5, 26, 30, 51, 356energy availability 184, 185exercise intensity/duration effects
185–7, 186limiting factors 185, 188–9mitochondrial metabolism 26plasma level relationship 194, 195, 195,
196tricarboxylic acid (TCA) cycle 26
fatty acidsalbumin-bound blood transport 185composition 184–5energy sources 155–6muscle uptake limiting factors 187–8
fatty acyl CoA synthetase 187female athlete triad 598–9, 642female athletes 417–26
alcohol consumption 405antioxidant vitamins 423bone mass loss 318calcium intake 320, 423–5, 550carbohydrate recommendations
419–21chromium supplements 347–8distance runners’ nutrient intake 550,
551
energy requirements estimation418–19
fat intake recommendations 422ferritin serum levels 425fluid intake 425fruit and vegetables intake 423gymnasts 588, 589
energy intake 591, 592female athlete triad 598–9
iron status 328–9dietary intake 334, 335, 425distance runners 331, 332–3losses 327swimmers 617vegetarian diet 448
menstrual cycle influences onassessment methodology 419
protein intake recommendations 421–2relative body fat ranges for specific
sports 479resting metabolic rate (RMR) 473, 474
prediction equations 476substrate metabolism 419sweating capacity 207swimmers’ energy intake 610vitamin B6 intake 422–3vitamin/mineral supplement use 422,
425weight/height ratios 419
ferritin 327acute phase response 329
ferritin serum level 327, 330–1, 447depletion
animal model 334athletic performance relationship
333–4causes 331–3‘liver shift’ hypothesis 333training-associated 328, 329
dietary iron intake/absorption 334–5female athletes 425, 438
swimmers 617figure skating 652–3
eating disorders 653nutrition 653
fish oils 305–6fitness
coronary heart disease risk 41, 41metabolic response to exercise 33
flatulence 248, 249, 250fluid and electrolyte balance 203, 216–18fluid ingestion during exercise
cold environment exercise 498–9carbohydrate content 498–9, 499, 499
cycling 568distance runners 553–5
carbohydrate content 553–5, 556–7fluid absorption rates 556recommendations 559
distance skiing 660–1gymnasts 604habituation during training 235hot environment exercise 503, 503–4sweating response 229team sports 584–5see also carbohydrate-containing
rehydration fluids;carbohydrate–electrolyte solutions
fluid intakecarbohydrate-containing drinks 79
fluid intake (Cont.)children/adolescents 435–7
composition of drinks 436, 437distance skiing 660–1female athletes 425gastrointestinal function 229–33
gastric emptying 229–31, 230, 231small intestinal absorption 231–2,
232gymnastics 604hot climate exercise 504
carbohydrate content 504, 505postexercise see postexercise fluid
replacementracquet sports 633, 634skaters 651team sports 584–5
fluid replacement beverages see sportsdrinks
fluoxetine 174folic acid 272–3, 286
deficiency 272food sources 286supplementation 273
food allergies/intolerance 489–90food consumption for energy
expenditure estimation 56footstrike haemolysis 330, 333force, SI units 4free fatty acids 29
central fatigue in children 435prolonged exercise 35, 35, 36, 36respiratory quotient (RQ) 8
fructo-oligosaccharides 73fructose 73, 74, 77
absorption 76ingestion during exercise 114postexercise ingestion 257
glycogen restoration 106, 106, 107,108, 258
rehydration fluids 236small intestinal uptake 232
fructose diphosphate (FDP) 357fruit intake 79, 423furosemide 218, 220
galactose 115gamma(g)-carotene 300gamma(g)-oryzanol 357, 359, 529gastric emptying
effects of exercise 242–4emotional stress response 250impairment-associated gastric
symptoms 249–50ingested fluids availability 229–30
carbonation 231glucose polymer solutions 230–1,
231glucose solutions 230, 230temperature effects 231
gastric symptoms 249–50gastritis 249, 332gastrointestinal bleeding 249, 250–1
causes 332iron losses 332–3
gastrointestinal dysfunction 247–52causes 247, 248
gastrointestinal function 241–52effects of exercise 241–7ingested fluids availability 229–33
670 index
gastric emptying 229–31, 230, 231small intestinal absorption 231–2,
232gastrointestinal transit
alterations 251–2exercise effects 247
gender differencesadolescent growth spurt 430resting metabolic rate (RMR) 473sweating 207see also female athletes
general activity factor (GAF) 476genetic aspects
resting metabolic rate (RMR) 473–4skeletal muscle fibre types 9, 19, 20young athletes’ growth characteristics
432, 433ginseng 357, 363–4glucagon 32, 91gluconeogenesis 28, 37, 258, 458
carbohydrate ingestion during exercise113
glutamine precursor 123hormonal regulation 32prolonged exercise 35–6
glucose 73, 74cell membrane transport 23, 459gastric emptying response 230, 230glycolysis 23ingestion during exercise 114, 115
availability 230, 230–2, 232cold environment exercise 498–9cycling 566see also carbohydrate ingestion
during exerciseinsulin-mediated tissue uptake 44
endurance training enhancement44–5
postexercise ingestion 257glycogen restoration 106, 106, 107,
108rehydration fluids 235skeletal muscle glycogen restoration
102skeletal muscle uptake 458, 459, 459
non-insulin-dependent diabetes 464postexercise 99
small intestinal absorption 231–2, 232,244
glucose–alanine cycle 122, 122–3, 126glucose–electrolyte solutions
intravenous delivery 526postexercise rehydration 235, 235, 237,
259, 260small intestinal uptake 232, 232, 233see also carbohydrate–electrolyte
solutionsglucose–fatty acid cycle 31
prolonged exercise 36glucose intolerance 43glucose polymers 73, 79, 108
ingestion during exercisecycling 566gastric emptying response 230–1,
231small intestinal uptake 232swimming 613, 614, 614
rehydration fluids 235glucose tolerance, chromium
supplements effects 346
glucose tolerance factor 346glucose-1-phosphate 24, 85, 98glucose-6-phosphate 23, 24, 85, 86, 90, 98
glycogen synthase activation 99, 100metabolism 21
GLUT-4 glucose transporter 23, 459, 464exercise-induced increase 44, 99–100insulin-mediated glucose uptake 44muscle damage-induced
downregulation 108glutamate 119, 121, 125, 129
lymphocyte/macrophage metabolism159
postprandial muscle uptake 123, 124glutamate dehydrogenase 121glutamine
exercise-associated plasma levels 160immunodepression 161overtraining 160, 161
gluconeogenesis substrate 123lymphocyte/macrophage energy
metabolism 159–60muscle synthesis/release 119, 120, 121,
122, 129, 137, 138, 160, 161function 124postprandial 123, 124
stress-associated plasma levels 160supplements 153, 529
clinical studies 161–2, 162response following exhaustive
exercise 164–6glutamine–glutamate cycle 124–5glutamine synthase 120glutaminolysis 159glutathione 304, 343, 346
antioxidant properties 301–2supplementation 308–9
glutathione peroxidase 343, 344selenium cofactor 303, 307
glycaemic index 77–8, 78postexercise carbohydrate ingestion
570–1skeletal muscle glycogen restoration
102–3, 258glycerol 187, 188, 357glycerol kinase 35glycerol–water hyperhydration 222,
236–7, 363, 503–4, 505glycine supplements 529glycogen 29
energy substrate 6, 184maximal exercise intensity 88–9, 89prolonged exercise 35, 35, 36, 36–7submaximal exercise intensity 90
energy yield 29glycolysis see glycolysisliver 85, 86
metabolism 36–7, 90–1, 91skeletal muscle stores 15–16, 17, 29, 85,
86, 97–108aerobic training response 15, 37carbohydrate intake guidelines 81,
82carbohydrate intake relationship
101–3, 102carbohydrate-type influence 102–3content–endurance performance
relationship 36cycling 565distance runners 552

high-fat diet adaptation 199–200intermittent exercise 577, 578–9sprinting 541, 543, 544team sports 576, 579, 580, 580–1, 581
storage capacity 6, 184child athletes 434
type II fibres 13, 19utilization see glycogenolysis;
glycolysisglycogen depletion 93, 107, 256, 458
chronic 612, 615distance skiing 660fatigue 36, 97, 112, 127, 128, 155, 157
hot environment exercise 501, 502liver 97metabolic overtraining (overreaching)
493skeletal muscle 97, 107, 112, 127, 155,
256performance relationship 256
sprinting 538swimming training 612, 612, 615
glycogen phosphorylase 24, 26, 34a form 86, 87, 93allosteric activators 30b form 86, 93caffeine ergogenic actions 383calcium-mediated stimulation 319skeletal muscle fibre types 92
glycogen restoration after exercise 97alcohol consumption 410carbohydrate intake 81, 82, 104–7, 257,
492, 493, 543–4, 583, 584diabetes mellitus 462, 463, 464–5gymnastics 604–5lactate substrate 107liver 258long-term recovery 101–3, 102maximum resynthesis rate 257recommendations 81, 82, 108short-term (rapid) recovery 103
carbohydrate consumptionfrequency/amount 104, 104–5
carbohydrate consumption timing103, 103–4
exercise-type influences 107–8protein plus carbohydrate
supplements 105–6simple carbohydrate differences
106, 106–7solid versus liquid supplements 107
skaters 650skeletal muscle synthesis 98, 98–100
enhancement 101–8insulin-dependent (slow) phase 98,
99–100insulin-independent (rapid) phase
98, 99postexercise carbohydrate
supplementation effect 98–9, 100team sports 583–4see also postexercise carbohydrate
replacementglycogen supercompensation 99, 108
cycling 564–6dietary regimens 100–1, 102sprinting 541
repeated sprints 542, 542–3glycogen synthase 98
exercise-induced increase 99
index 671
glycogenin 98glycogenolysis 85
calcium-dependent enzymes 319cold environment exercise 498gymnastics 593hot environment exercise 500–1
fluid ingestion response 503, 503intensity of exercise 88–91, 94
maximal 88–9submaximal 89–91
regulation 86–7hormonal 32
team sports 576, 577type I fibres 92, 92–3type II fibres 92, 92–3
glycolysis 6, 7, 23–6, 25, 85, 269, 356, 458adenosine triphosphate (ATP)
resynthesis 21calcium-dependent enzymes 319children 434cold environment exercise 498duration/amount limitation 10energy yield/rate 5, 6, 24
maximal adenosine triphosphate(ATP) production 88–9, 89
high-intensity exercise 33, 33–4lactic acid formation 5, 6, 7, 395lymphocyte/macrophage metabolism
159NAD+/NADH metabolism 28pH sensitivity 395regulation 30, 87sprinting 536
repeated sprints 542, 543grain-based foods 78, 446, 448growth
energy requirements 429gymnastics-associated retardation
602–3growth hormone 32, 544, 545
actions 32amino acid supplements response 357,
544, 545carbohydrate ingestion during
performance response 502exercise-associated release 545sprinting-associated release 538strength training response 626supplementation 358
gums 73, 74gymnastics 588–605
age of competitors 588–9amenorrhoea 591, 598–9, 603body fat composition 600–2, 601, 602
inadequate energy intake response589, 593, 602
calcium balance 320, 438, 589, 591,597–8, 600, 603
characteristics of activity 589–91duration of events 589, 591
creatine ingestion 595eating disorders 516, 601energy intake (requirements) 591,
591–3, 594, 602energy substrate distribution 593–5,
594female athlete triad 598–9female weight/height ratios 419, 432fluid intake 604growth retardation 602–3
injury rates 589, 599–600iron balance 598nutrient intake 591, 595–8, 596
inadequate 589, 591, 594, 602nutritional guidelines 603–5
eating during events 604postexercise 604–5precompetition/pretraining eating
604nutritional myths 516stress fractures 591vitamins intake 596–7weight restriction 588, 589, 602young athletes’ height 432
gyrate atrophy 373
H2-receptor antagonists 249, 251haemochromatosis 335haemoglobin 326, 327, 342, 447
aerobic conditioning programmes 13training-associated decline 327, 328
haemorrhagic gastritis 249Haldane apparatus 55health gains 39–51
cardiovascular risk 39, 40–2energy balance 49–51insulin-mediated glucose uptake 44–5lipoprotein metabolism 46–9overweight people 49–50
health riskscreatine supplements 371–2, 376dehydration for rapid precompetition
weight loss 640–1, 641protein intake supplementation 144–5
heart rate 11, 12distance skiers 658energy expenditure measurement 56–7oxygen uptake (aerobic power)
relationship 11, 11heartburn 248
symptomatic relief 249heat, SI units 4heat acclimatization
fluid and electrolyte balance 218sweat gland sodium reabsorption 217sweating responses 227
heat balance equations 204heat illness 220, 226, 256, 258, 556
prevention by fluid replacement 234heat production 203
direct measurement 54food source variation in oxygen
utilization 57units (joules) 53
hemicellulose 73herbal ergogenic aids 359hexokinase 23, 24, 30, 85, 90, 94, 98, 199
carbohydrate supplementationresponse 100
high-altitudeoxidative stress 295sprinting speeds 539training 485
distance skiing 661high-density lipoprotein (HDL) 46
dietary fat/cholesterol reductionresponse 47–8
non-insulin-dependent diabetes 43oestrogen effects 419physical activity responses 47, 48
high fat diet 192–201endurance performance
adaptation over time 196–9, 198, 199animal studies 192–4brief carbohydrate-rich diet
combination regimens 193–4,200–1, 201
human studies 194–201short-term impairment 196
fatty acid plasma levels 194, 195female athletes 422historical aspects 192
high-intensity exercise 34, 35calcium transport 34fatigue 34metabolic response 33, 33–5nutritional influences 35
high protein dietadverse health effects 144–5urinary calcium losses 145, 321see also protein supplements
hormonal regulationenergy metabolism 31, 32–3splanchnic blood flow 246, 247
hot environment exercise 216, 217, 226,500–6
core temperature elevation 220, 220–1dehydration 206–7
heat tolerance time 220maximum aerobic power/oxygen
uptake (V.
O2max.) deficit 219dietary intake guidelines 504–6energy substrates 500–1fatigue 501–3
glycogen depletion 501, 502fluid ingestion during exercise 503,
503–4high humidity conditions 226hyperhydration 505immune system depression 502inosine 5¢-monophosphate (IMP)
accumulation 501, 502, 502oxidative stress 505
hydration status 15, 207definitions 216high-protein diets 145postexercise liquid supplements 108pre-exercise 236–7
hydrogen ionslactate metabolism 25–6pH relationship 394, 395
hydrogen peroxide 292, 343hydroxyl radical 292, 3435-hydroxytryptamine central fatigue
hypothesis 156, 157, 172–3, 173caffeine ergogenic actions 387children/adolescents 435dopamine interactions 1785-hydroxytryptamine
agonist/antagonist studies 173–4nutritional effects 174–7, 175overtraining syndrome (staleness) 494prolonged exercise study 172–3
hyperhydration 221–2, 236–7hot climate exercise 503–4, 505methods 222
hyperlipidaemia 77hypertension 42–3, 51
non-insulin-dependent diabetes 463,464
672 index
hypoglycaemia 32, 97, 107, 112, 458alcohol consumption-related 407, 411central fatigue 37children 434insulin-treated diabetes 457, 460
precautions for exercise training461–2, 462
pharmacologically treated non-insulin-dependent diabetes 464
rebound following pre-exercisecarbohydrate ingestion 101, 565,583
hypohydration see dehydrationhyponatraemia 233, 260
ice hockey 651–2nutrition 652
immune system 162–6cellular nutrition 159–62exhaustive exercise effects 163–4glutamine feeding response 162, 162
immunodepression, exercise-induced161
glutamine plasma levels 161hot environment exercise 502
inorganic phosphate see Piinosine 357
supplements 362–3inosine monophosphate (IMP) 23, 121
accumulationfatigue 501hot environment exercise 501, 502,
502glycogenolysis regulation 86
insulin 32actions 32amino acid secretogogues 105blood glucose regulation 91, 458chromium-dependent actions 346exercise-associated decrease 458lipid metabolism 46–7, 189lipoprotein lipase downregulation 187net training effect 45, 45–6non-insulin-dependent diabetes 43postexercise glycogen restoration 492
carbohydrate supplementationresponse 99, 100
slow phase 98, 99–100postprandial release 458–9secretion 32, 45sensitivity 45
see also insulin resistanceskeletal muscle glucose uptake 44, 90,
458, 459endurance training enhancement
44–5insulin-like growth factors 357, 544,
545–6insulin resistance
exercise training response 464lipoprotein metabolism abnormalities
47non-insulin-dependent diabetes 43,
463skeletal muscle
after exercise 103–4glucose uptake 464
insulin therapy 457, 460, 461, 463adjustment for planned exercise 461,
462, 463
integrating motor pneumotachograph(IMP) 56
intensity of exerciseanaerobic metabolism 21, 22, 24antidiuretic hormone response 211blood glucose response 90, 91, 91branched-chain amino acids
metabolism 138, 138carbohydrate loading response 541–2catecholamines release 32conditioning programmes 12dehydration effects 219–20energy sources 458excess postexercise oxygen
consumption (EPOC) 474fat metabolism effects 185–7, 186fibre type recruitment order 20gastric emptying 242–3gastrointestinal tract bleeding 250glycogen utilization 88–91, 94
skeletal muscle fibre types 92, 92–3growth hormone release 32heat production 204metabolic response 33–5phosphocreatine (PCr) breakdown 21renal blood flow response 211splanchnic blood flow redistribution
246team sports 574, 575type II fibres activation 92
intermittent exercisefatigue 577–8racquet sports 632, 633team sports 577–9, 578, 579
internal respiration 10International System of Measurement 4interval training
aerobic power conditioningprogrammes 13
speed skating 647intestinal symptoms 250iron 326–35
athletic performance relationship333–4
balance 327, 330–1biological roles 326body stores 327children/adolescents 430, 431, 437, 438competition effects 329–30deficiency 249
adolescents 431, 438assessment 327gastrointestinal bleeding 332–3surveys of athletes 330–1
food sources 334, 335, 448intake 334–5
adolescents 430calcium absorption inhibition 321distance runners 550eating-disordered athletes 516female athletes 425, 550gymnasts 591, 598, 603inadequate 332team sports 582
lossesmenstrual 430sweat/urine 333
non-haem source bioavailability 335,447, 447
swimmers 617, 618

training effects 327–30dilutional pseudoanaemia (‘sports
anaemia’) 328iron profile 328–9
vegetarian diet 447–8weight loss programmes 480
iron deficiency anaemia 326, 447–8definition 328diagnosis 333female athletes 425
swimmers 617gastrointestinal bleeding 332–3iron supplementation 425prevalence in athletes 331stages of development 327training associations 328, 329
iron supplements 251, 326, 335female athletes 425
swimmers 617, 618gymnasts 598, 603therapeutic trial 333
ischaemia reperfusion 293–4ischaemic colitis 332isocitrate dehydrogenase 87isokinetic activities 625isometric muscle activity 4, 621
maximum force values 622training programmes 622, 625
isotonic strength training 625isotope tracer studies
energy expenditure measurement 563fat metabolism 185gastric emptying 242ingested fluids uptake 232nitrogen balance in women 421protein metabolism 136small intestinal absorption 244–5
jet lag 487–8melatonin treatment 488
joule (J) 4, 53judo 622, 622jumping events 5
kilocalorie (kcal) 4, 5kilogram-metre (kg-m) 5Kofranyi–Michaelis respirometer 55, 56Krebs cycle see tricarboxylic acid cycle
lactase 76lactate
accumulation 24–5, 85, 88fatigue 34, 93, 155hot environment exercise 500racquet sports 633speed skating training (lactate ice
profiles) 648sprinting 536–7, 537, 538, 540team sports 575
acid–base balance 395, 396alcohol metabolism interaction 407endurance training response 37glycogen restoration after exercise 107lipolysis suppression 188–9lymphocyte/macrophage metabolism
159muscle cell pH 25–6production 5, 6, 7, 23, 24
force/power development inhibition6, 7
index 673
prolonged exercise 35pulmonary ventilation relationship 11type IIb fibres 19–20
lactate dehydrogenase 434lactose 73, 74, 77
digestion/absorption 75–6laxatives 251
eating disorders-associated use 513,514
weight category sports 637lectins 77legumes 78, 79, 446, 448leucocytes, prolonged exercise response
163glutamine feeding effects 164–5, 166
lignans 451lignin 73limits to performance 15–16linoleate 184lipase 29lipid peroxidation 295, 344
antioxidant vitamin supplements 310,423
fish oils 306selenium supplements 345vitamin E supplements 304, 305, 306–
7lipoic acid
antioxidant properties 302–3supplementation 309–10
lipolysis 29exercise intensity/duration effects 35,
185–7, 186, 189hormonal regulation 32insulin-associated suppression during
exercise 189lactate suppression 188–9
lipoprotein lipase 46, 48, 49regulation 187, 188, 189skeletal muscle fatty acid metabolism
187, 188lipoprotein metabolism 46–9
physical activity response 47–8, 48postprandial 48–9triacylglycerol clearance 46, 47, 48
lipoproteins 46chromium supplements effects 346oestrogen effects 419
liveralcohol metabolism 406–7gluconeogenesis 37, 258, 458
carbohydrate ingestion duringexercise 113
glucose release 90, 91, 91prolonged exercise 35–6, 37
glycogen 85, 86depletion 36, 37, 91, 91, 97metabolism 90–1postexercise resynthesis 258storage 29
hormonal regulation 32iron storage 327
longevity 39loperamide 251low-density lipoprotein (LDL) 46
oestrogen effects 419low-fat foods 79lower oesophageal sphincter tone 241,
242oesophageal symptoms 248, 249
lower reference nutrient intake (LRNI)417
lutein 300lycopene 300lymphocytes
glutamine utilization 159–60local demand in damaged muscle
161nucleotides synthesis 159, 160prolonged exercise response 164
glutamine feeding effects 165, 166lysine supplements 357–8, 545, 629lysosomal proteases-mediated muscle
damage 137
McArdle’s disease 127macrophages
glutamine utilization 159–60local demand in damaged muscle
161iron storage 327nucleotides synthesis 159, 160reactive oxygen species (ROS)
generation 294red cell destruction 327
magnesiumchildren/adolescents 437electrolyte replacement 234losses in sweat 209, 217, 228, 229plasma levels following exercise 210supplementation 425weight loss programmes 480
make weight strategies 644see also dehydration, for rapid
precompetition weight lossMallory–Weiss tear 249maltodextrins
ingested fluids availability 231ingestion during exercise 114postexercise ingestion 257
maltoseintake during cycling 566rehydration fluids 235
marathon running 10blood glucose levels 97calcium balance 320, 322energy substrates 36, 155fluid intake 236fluid replacement guidelines 234gastrointestinal bleeding 332glutamine feeding study 164–6, 165iron balance 327, 328, 331
competition effects 329oxidative metabolism 7, 8plasma volume expansion 328sweating rates 227, 228, 236temperature regulation 204, 206–7upper respiratory tract infection 163,
165, 165warm weather competition 206–7water losses 207see also distance running
marijuana 514martial arts 623maximum aerobic power/oxygen uptake
(V.
O2max.) 6children/adolescents 434dehydration effects 218–19, 219distance skiing 657, 657endurance training response 12, 37

maximum aerobic power (Cont.)metabolic power production 7, 7, 8
medium-chain triglyceridesingestion during cycling 568strength training 630
megadoses of essential nutrients 357melatonin 488menarche 432, 433, 433menstrual cycle
irregularity in vegetarians 450, 451,452, 453
resting metabolic rate (RMR)variability 474
MET (metabolic equivalent) 53–4, 59metabolic heat production 216metabolic response to exercise 33–7
adaptation to exercise training 37high-intensity exercise 33, 33–5prolonged exercise 35–7
metabolic syndrome 47metaclopramide 249metformin 463, 464methylxanthine metabolism 387–8Micro-Scholander apparatus 55mineral supplements 527, 529
adolescents’ use 430female athletes 425weight loss programmes 480
minerals intakedistance skiing 661power events 624, 627, 627team sports 582
minute volume 11conditioning-mediated increase 12, 13oxygen uptake relationship 11, 11
mitochondriaalcohol metabolism 407electron transport chain 26–7, 28endurance training response 15, 37fatty acid metabolism 26, 188–9function during heat stress 502–3oxidative phosphorylation 21, 26, 27,
27, 28pyruvate metabolism 23, 26reactive oxygen species (ROS)
generation 293type I muscle fibres 19type II muscle fibres 19
monosaccharides 73, 75functional characteristics 74
motivation, brain catecholamines 177,178
motor units 9recruitment 20
mucilages 73Müller–Franz calorimeter 56muscle action 3
classification 3–4, 4energy 5–6see also skeletal muscle
myofibrillar proteins 17, 119myofibrils 17myofilaments 17, 18, 18
contraction mechanism 18–19myoglobin 17, 326, 327, 447
training-associated increase 15, 331type I muscle fibres 9, 19type II muscle fibres 19
myokinase 22myosin
674 index
amino acid composition 154fibre type isoforms 19, 37
myosin ATPase 19, 20, 21, 621type I muscle fibres 19type II muscle fibres 19, 20
myosin filaments 17, 18, 18, 319contraction mechanism 18–19
NAD+ 88glycolytic pathway 24, 25, 28oxidative regeneration 24, 28
NAD-dependent alcohol dehydrogenase406
NADH 87, 88glycolysis 28tricarboxylic acid (TCA) cycle 26
natural killer cells 164nausea 248, 249, 250neuroglycopenia 97, 112neutrophils
carbohydrate ingestion response 502oxidative burst 294prolonged exercise response 163
glutamine feeding effect 165newton (N) 4niacin 273–4, 284–5, 346, 597
deficiency 273, 285food sources 285supplements 526
nitric oxide synthesis 294nitrogen balance 135–6
exercise programmes 139, 139–41, 140
endurance training 139, 139–40, 140,141, 141
resistance training 141, 141–2, 142,143–4
losses in sweat 136women 421, 422
non-esterified fatty acids (NEFA) 46non-starch polysaccharides 73, 74non-steroidal anti-inflammatory drugs
(NSAIDs) 249, 250noradrenaline 32
central fatigue 172, 177tyrosine supplementation response
179central neurotransmission 177childrens’ energy metabolism 434splanchnic blood flow regulation 246,
247sprinting-associated release 538
norfloxacin 489nucleotides synthesis
branched point sensitivity 160lymphocytes/macrophages 159, 160
nutrient density of carbohydrate foods78–9
nutrition planning 15nutrition supplements 550
see also sports nutrition products
obesity 49, 348fat storage capacity 184non-insulin-dependent diabetes 463,
464obstructive lung disease, chronic 292oesophageal function 241–2oesophageal reflux 242, 248, 249oesophageal symptoms 248–9
oestradiol-17-b 452, 453oestrogen levels in vegetarians 450,
451–2oestrogen replacement therapy 342oleate 184, 185oligomenorrhoea, osteoporosis risk
320–1oligosaccharides 73, 75omeprazole 249open circuit oxygen consumption
measurement 54–5oral contraceptives 342oral rehydration fluid 263, 489ornithine supplements 357–8, 544, 629osmoreceptors 210, 213osteoporosis 318, 424, 431, 450
amenorrhoea/oligomenorrhoeaassociation 320
calcium intake in children/adolescents438
female athlete triad 598–9weight restriction association 320
overreaching (metabolic overtraining)493
overtraining 492–5, 493early detection 495glutamine plasma levels 160, 161mechanical 493metabolic (overreaching) 493prevention 495staleness (overtraining syndrome)
494swimming 615sympathetic/parasympathetic forms
494–5treatment 495
overweight 42, 43, 48, 49physical activity response 49–50see also weight loss programmes
oxalates 449, 450oxidative metabolism see aerobic
metabolismoxidative phosphorylation 21, 26
contribution to maximal intensityexercise 88, 89
oxidative stress 292–9, 344, 423antioxidant defence systems 297, 298
dietary restriction effects 298–9nutritional influences 297
disease associations 292DNA damage 296exercise-induced 292–5
mechanisms 293–5hot environment exercise 502–3, 505lipid peroxidation 295protein oxidation damage 295–6
oxygen consumptionenergy expenditure measurement 54
closed circuit method 54heart rate measurement 57open circuit method 54–5portable self-contained units 55–6
heart rate relationship 56–7heat production from various
foodstuffs 57oxygen uptake (aerobic power)
aerobic activity 10, 10cardiovascular variables 11, 11–12pulmonary ventilation ratio 10, 10
oxylog 56

palmitate 184, 185–6pancreatic islet cells 32, 43pantothenic acid 274, 286parathyroid hormone 319, 322paraxanthine 387, 388Parkinson’s disease 292paroxetine 174peak force (strength) 9pectins 73pentose phosphate pathway 269peptic ulcer bleeding 332peroxidase 326peroxynitrite anion 294pH 394, 394
hydrogen ion relationship 394, 395phosphatidyl serine 529phosphocreatine (PCr) 17, 85, 86, 356, 367
adenosine triphosphate (ATP)resynthesis 5, 21–3
maximal exercise intensity 88–9, 89allosteric activators 22, 30depletion
creatine intake response 373–4, 375fatigue 93, 372, 372
high-intensity exercise 33, 34, 34, 35prolonged exercise 35type II muscle fibres 19utilization
gymnastics 590, 593repeated sprints 543sprinting 536–7, 537, 537, 538, 539,
539team sports 574–5, 575, 582
phosphodiesterase 385phosphofructokinase 26, 30, 31, 34, 87,
93, 395children 434
phosphoglucomutase 24, 85, 98phosphorus (phosphate) supplements
359–60phosphorylase see glycogen
phosphorylasephysical activity index 54phytates 77
calcium absorption impairment 449phytochemicals 357, 359phyto-oestrogens 451–2Pi (inorganic phosphate) 21, 23, 93
glycogenolysis regulation 30, 86, 87pituitary gland, anterior 32, 33plasma osmolality
renal regulation 213sweating-associated elevation 213, 218thermoregulation effects 209–10thirst physiology 212
plasma volume 10, 11training-associated dilutional
pseudoanaemia 328, 331plyometric techniques 625portable respirometers 56postexercise anorexia 250postexercise carbohydrate replacement
98–9, 100, 103–8, 257–8, 264amount of carbohydrate 104, 104–5,
257, 570cycling 570–1distance skiing 660exercise-type influences 107–8fluid replacement 258–60, 264
drink composition 259–60
index 675
form of ingestion 107, 257–8frequency of intake 104, 104–5glycogen resynthesis see glycogen
restoration after exerciseprotein plus carbohydrate
supplements 105–6simple carbohydrate supplements 106,
106–7swimming 615team sports 583, 584timing 103, 103–4, 104, 258, 258, 571type of carbohydrate 257–8, 570–1
postexercise fluid replacement 237,258–9, 263–4
alcohol consumption 262children/adolescents 436cycling 571distance runners 553–5drink composition 259–60, 263drink volume 260–1gymnastics 605rehydration prioritizing 264solid food combined consumption 262,
261–2, 263team sports 585voluntary fluid intake 262–3
postexercise nutrition 15gymnastics 604–5
postexercise recovery 256–64alcohol consumption effects see alcohol
consumptioncarbohydrate intake (requirements)
257–8, 264, 492cycling 571guidelines 81gymnastics 604–5sprint exercise 543–4, 544swimming 615
glycogen resynthesis see glycogenrestoration after exercise
skaters 650team sports 583–4
postprandial metabolismblood glucose response to
carbohydrate foods 75, 77dietary fibre effects 75insulin release 458–9lipids 46lipoproteins 48–9muscle amino acids 123, 124
postural muscles 20potassium
caffeine ergogenic actions 385children/adolescents 437losses in sweat 209, 217, 228, 228–9plasma levels following exercise 210postexercise replacement 234, 237, 260,
263renal handling 211, 213sports drinks 234
power 6–8endurance relationship 6, 7, 7energy sources 6–7, 7
anaerobic metabolism 21, 22respiratory quotient (RQ) relationship
7, 8SI units 4
power events 621–30carbohydrate intake 627, 628characteristics 622
energy expenditure 627, 628fat intake 627, 628nutritional principles 624–5protein intake 627–8, 629strength training 625–6
hormonal responses 626microcycles 627
training diet 626–8vitamins/minerals 627, 627, 628weight categories 622, 624weight control 628
gaining weight 629–30making weight 628–9
pregnant women 146profile of mood states (POMS) scale 495prolactin 157prolonged exercise 97, 107
aerobic power conditioningprogrammes 13
amino acid metabolism 153branched-chain amino acids
supplements 174–5carbohydrate/fat metabolism
integration 36carbohydrate ingestion during 36, 37,
81, 112, 113, 113–14, 114children 434energy substrates 90glutamine plasma levels 160, 161–25-hydroxytryptamine in central fatigue
172immune system effects 163–4
glutamine feeding response 164–6upper respiratory tract infection
162–3, 163metabolic response 35–7
protein energy sources 5, 21, 133, 356energy yield 29, 29oxygen utilization in combustion 57
protein intake (requirements) 133–4, 144animal sources 442children/adolescents 435distance runners 551, 551endurance exercise programmes
140–2, 141, 142, 144exercise-associated increase 136–44,
137female athletes 421–2first/second class proteins 153guidelines 145–6gymnastics 593, 594, 594, 595hot climate exercise 505jet lag management 487, 488plant proteins 446postexercise carbohydrate combined
intake 105–6power events 624, 625, 627–8, 629resistance training 141, 141–4, 142, 143skating 650sprint training 540–1swimming 615–16team sports 576, 581utilization in energy balance 470–1vegetarian diet 445–6weight loss programmes 480, 640
protein metabolism 133, 134–6, 135endurance exercise 137, 138, 139,
139–40, 140, 141, 141exercise-related catabolism 29, 30,
136–7, 137

protein metabolism (Cont.)hot environment exercise 501
metabolic tracer techniques 136nitrogen balance 135–6resistance training 138, 139, 139, 141,
141–2, 142, 143–4thermic effect of food (TEF) 475whole body degradation rates 135whole body synthetic rates 135
protein oxidation damage 295–6protein supplements 529
adverse health effects 144–5guidelines 145–6muscle performance response 144sprinting 544–6strength training 628urine output/water losses 208
protein synthesismeasurement in skeletal muscle 136whole-body rates 135
pseudoanaemia 328pulmonary gas exchange (external
respiration) 10–11pulmonary ventilation 10–11
hydrogen ion excretion 394oxygen uptake ratio 10, 10
pyridoxal phosphate 271pyridoxine see vitamin B6pyruvate 23, 29, 86
aerobic metabolism 23alanine production 28, 123, 125–6anaerobic metabolism 24
lactate production 23, 24formation from glucose-6-phosphate
24, 25oxaloacetic acid synthesis 28oxidative metabolism 26, 27
regulation 87–8pyruvate carboxylase 28pyruvate dehydrogenase 30, 87, 88, 269
quadriceps group fibre types 20quality of life 39
racquet sports 10, 632–5cardiorespiratory responses 632–3energy expenditure 632fluid balance 633, 634intermittent exercise 632, 633nutrition 634–5thermoregulation 633–4young athletes 432
radiant heat loss 204, 216raffinose 73ranitidine 249reactive oxygen species (ROS) 292, 343
detrimental effects 292lipid peroxidation 295liver enzymes 292, 293
recommended daily allowance (RDA)417
recommended nutrient intake (RNI) 417recovery from exercise see postexercise
recoveryrectal bleeding 250, 251red cell mass 331–2red cell turnover 327reference nutrient intake (LRNI) 417rehydration 216–23, 226, 256–64
alcohol consumption
676 index
effects 409, 409–10guidelines 412–13
carbohydrate ingestion during exercise115
choice of fluids 234–6distance running 556following dehydration for rapid weight
loss 643, 644see also postexercise fluid replacement
renal blood flow 210, 213exercise intensity response 211
renal function 212–14acid–base balance 394regulation 212sodium regulation 210–11water balance 210
renin 259, 328repetition maximum (RM) 13resistance (strength) training 12, 13–14
amino acid supplements 357–8, 629–30amino acids metabolism 138, 139, 139distance skiing 659duration of exercise 13hormonal response 626iron balance effects 329, 331metabolic response 37methods 13–14non-insulin-dependent diabetes 464power events 625–6
microcycles 627protein requirements 134, 141, 141–3,
142, 143repetition maximum (RM) 13skeletal muscle capillarization
response 14skeletal muscle mass effect 37, 44speed skating 647, 648, 649swimmers 616type II fibres hypertrophic response 14weight gain programmes 629
resistant starch 76respiration chamber 54respiratory exchange ratio (RER) 58
children/adolescents 434cold environment exercise 498high fat diet 192
respiratory quotient (RQ) 57–8high fat diet 192, 194metabolic power relationship 7, 8
respiratory water losses 208, 227resting energy expenditure (REE) 418resting metabolic rate (RMR) 53, 203, 472,
473determinant factors 473–4exercise training response 474prediction equations 475–6
retinol see vitamin Ariboflavin see vitamin B2roller-skiing 659room calorimeters 54runner’s trots 251running
energy expenditure 49, 203see also distance running; marathon
running; sprinting
salicylates 249sarcolemma 18, 21sarcoplasm 17sarcoplasmic reticulum 17
calcium 17–18, 319secretin 247selenium 339, 343–6
antioxidant properties 303deficiency 303–4exercise-associated changes 344–5food sources 344intake 344supplements 307, 343, 346, 351
lipid peroxidation prevention 345sex hormone-binding globulin 452shivering thermogenesis 497, 498SI units 4
exercise quantitation 4–5skating 646–54
figure skating 652–3fluid intake 651ice hockey 651–2speed skating 646–51
characteristics 646–7nutrition 649–51speed records 647training 647–8, 648, 649, 650
skeletal muscle 8–10, 17–20amino acid metabolism see amino acid
metabolismamino acid pools 119caffeine ergogenic actions 383, 385capillarization 10, 11, 13, 14–15, 19, 37contraction mechanism 3, 17, 18, 18–19
calcium 319electrical excitation 18–19pH sensitivity 395
creatine levels 367supplementation response 368–71,
369, 370, 371cross-sectional area 9, 14, 37, 621
peak force (strength) relationship 9energy charge 32energy sources 20–1exercise-mediated glucose delivery 90,
94fat storage 29, 185fatigue see fatiguefatty acids oxidation 188–9fatty acids uptake 29, 187–8fibre types 9–10, 19–20
biochemical characteristics 20carbohydrate metabolism 92, 92–3conditioning programme responses
13, 19, 626endurance athletes 621intermittent exercise 577maximum velocity of shortening
621motor unit recruitment order 20power output 621sprinters 621
force/power development 3–4, 9,621–2
cross-sectional area relationship 9,621
length–tension relationship 621glucose uptake 99, 458, 459, 459
insulin-mediated 44, 464glycogen see glycogen; glycogen
depletion; glycogen restorationafter exercise
injury see skeletal muscle damagelipoprotein lipase activity 48, 49

myofibrillar proteins 119pH values 25–6
fatigue 34physiology 3protein synthesis measurement 136putative growth promoting nutrition
supplements 529–30‘red’ 9, 19structure 8–9, 9total adenine nucleotide pool 32training programme responses 10, 13,
14–15endurance training 13, 15, 37hypertrophy 37, 626insulin sensitivity 459–60
triacylglycerol 185, 188metabolism 188, 189mobilization 186
‘white’ 9, 19skeletal muscle damage
acute phase response 329alcohol consumption effects 410distance skiing 660eccentric exercise 107–8, 137
strength training 625–6glutamine demand 160, 161glycogen resynthesis rates 107–8lysosomal proteases 137overtraining 493team sports 584
ski-walking 659skiing see distance skiingskills training 12slow twitch muscle fibres see type I
muscle fibressmall intestinal absorption
effects of exercise 244–5splanchnic blood flow 246
fluid ingestion during distance running556
fructose 257glucose, sodium stimulation 232, 260,
263ingested fluids availability 231–2, 232
glucose–electrolyte solutions 232,232, 233
small intestinal permeability 245smilax 359smoking 295soccer 10sodium
caffeine ergogenic actions 385children/adolescents 436, 437intake (requirements) 208losses in sweat 209, 210, 217, 218, 228,
228children/adolescents 436distance runners 556hot climate exercise 504
plasma levelsfollowing exercise 210regulation 210–11
postexercise replacement 233, 237, 263
alcohol consumption 409, 410rehydration fluids 236, 259–60, 263
children/adolescents 436–7sports drinks 233
renal handling 210–11, 213exercise response 211
index 677
small intestinal glucose absorptionstimulation 232, 260, 263
sweat gland reabsorption 217sodium bicarbonate see bicarbonatesodium citrate see citratesoleus fibre types 20soya products 78, 79specific activity factor (GAF) 476specific dynamic action see thermic effect
of foodspeed loading techniques 625speed–strength sports 622, 622–4
see also power eventssplanchnic blood flow 332
effects of exercise 245–7sport, definitions 3‘sports anaemia’ 328sports drinks 79, 527–8
composition 233electrolyte replacement 233–4glucose polymers 230ingestion during exercise 115potassium 234sodium 233, 263, 504
sports foods 79, 80sports nutrition products 523–30
amino acid supplements 529carbohydrate gels 528carbohydrate-rich beverages 528categories 526–7complete nutrition/energy beverages
528definition 523–4energy bars 528energy metabolism enhancers 530ethical aspects 526evaluating product claims 524–6fluid replacement beverages see sports
drinksgoals of use 524mineral supplements 529muscle growth promoters 529–30protein supplements 529sprint training 541vitamin supplements 528–9
sprint trainingmetabolic response 37, 540skeletal muscle response 15, 44
sprinting 5, 535–46caffeine response 382–3carbohydrate loading 541–2current world records 536definition 536dietary intake 540–1fatigue 536, 538–40metabolic responses 536–7
laboratory studies 537–8training effects 540
protein/amino acid supplements544–6
repeated sprintscarbohydrate intake 543–4, 544carbohydrate loading 542, 542–3
stachyose 73starch 73
functional characteristics 74ingestion during exercise 115, 566resistant 76skeletal muscle glycogen restoration
102
starvation 29–30, 639children’s growth effects 432glutamine plasma levels 160liver glycogen depletion 36muscle glycogen metabolism 122, 123
static exercise 3stearate 184storage polysaccharides 73strength training see resistance trainingstress fractures 323
calcium intake inadequacy 589, 591gymnasts 589, 591, 599
stress response, brain catecholamines177
tyrosine supplementation effects 179stroke 42stroke volume 11
conditioning-mediated increase 12distance skiers 658oxygen uptake relationship 11, 11
succinate dehydrogenase 326sucrose 73, 74
glycogen restoration after exercise 106,106, 107
ingested fluids availability 231ingestion during exercise 114, 115
cold environment exercise 498–9cycling 566
postexercise ingestion 257rehydration fluids 235
suit calorimeter (Webb) 54sulphonylureas 463, 464superoxide dismutase 297, 342, 344superoxides 292, 343sustained rhythmic exercise 9–10sweating 203
age-related changes 207calcium losses 321children/adolescents 436climatic factors 216–17, 217, 504, 660dehydration-associated impairment
221, 221, 229electrolyte losses 208–10, 209, 217,
228–9, 321, 333, 340hot climate exercise 504postexercise replacement 234, 236,
237, 260, 263evaporative heat loss 204–5gender differences 207iron losses 333plasma osmolality changes 211rates during exercise 226–7, 227, 228,
229sodium losses 209, 210, 217, 218, 228,
228, 436, 504distance runners 556
sweat composition 228, 228water losses 207, 216, 218, 226–7, 256
cold climate exercise 660cycling 568distance runners 555–6, 556distance skiing 660team sports 584weight loss techniques 639–40
sweetened dairy foods 79, 80swimming 609–18
body composition 610–11chronic glycogen depletion 612, 615cold stress 497, 498, 611energy costs 203, 204

swimming (Cont.)iron status 617, 618overtraining 615protein requirements 615–16training carbohydrate requirements
611–13, 612during swimming sessions 613–15,
614, 614training energy demands 609–10young athletes 432
Le Système International (SI) 4
team sports 574–86aerobic energy production 575–6anaerobic energy production 574–5creatine ingestion 582–3fluid intake 584–5
after exercise 585before exercise 584during exercise 584–5recommendations 585
food intake 579–80carbohydrate 580–1minerals 582postexercise 583–4pretraining/competition meals 583protein 581vitamins 582
intensity of exercise 574, 575nutritional requirements 577
intermittent exercise performance577–9, 578, 579
substrate utilization 576, 576–7telemetry 56testosterone
strength training response 626vegetarians 452, 453
theobromine 387theophylline 387
cold environment exercise 499, 500thermic effect of activity (TEA) 472thermic effect of food (TEF) 53, 472
determinant factors 474–5thermoregulation 203–7, 205, 216
alcohol consumption effects 411children/adolescents 207, 435–6cold environment exercise 497, 498distance skiing 659–60evaporative heat loss 226exercise performance 218–21heat balance equations 204hyperhydration response 221hypohydration effects 220, 220–1, 641plasma osmolality relationship 209–10racquet sports 633–4
thiamin see vitamin B1thiaminpyrophosphate 268, 269, 283thiazide 218thirst 211, 556, 585, 604
physiology 211–12central control centres 212
water deficit alleviation 212, 217–18thirst control centres 212time, SI units 4Tissot tank 55total adenine nucleotide pool 32total daily energy expenditure (TDEE)
472energy intake estimation 477
678 index
prediction 475–7total energy expenditure (TEE) 418, 419trace minerals 339–51
supplements 350–1adverse effects 425
tranquillizers abuse 514transcranial magnetic stimulation (TMS)
171transferrin 327transketolase 269trauma, glutamine demand 160travel 484–91
body mass changes 486dehydration 486–7eating strategy 490food allergies/intolerance 489–90food availability 485–6illness 488–9
food safety 489jet lag 487–8
traveller’s diarrhoea 488–9food safety 489
triacylglycerol 29, 29, 46, 47, 48, 85, 185adipose tissue storage 29, 472clearance 46
exercise effects 48, 49insulin resistance-associated
abnormalities 47postprandial 49
endurance training response 37energy yield 29fatty acids mobilization 185, 186lipolysis 189lipoprotein lipase hydrolysis 187lipoprotein sources 187non-insulin-dependent diabetes 43oestrogen effects 419skeletal muscle metabolism 188, 189
team sports 576skeletal muscle storage 17, 29, 188
tricarboxylic acid (TCA) cycle 21, 26, 27,28, 87, 88, 93, 269
amino acid metabolism 29, 119, 120,122, 128–9
alanine aminotransferase 125, 126,127, 128, 129
fatigue mechanism 126, 126–7children 434endurance training response 37regulation 30, 31, 32
trimethoprim-sulfamethoxazole 489tropomyosin 17, 18, 18, 19troponin 17, 18, 18, 395troponin C 319tryptophan 487
brain metabolism 1565-hydroxytryptamine synthesis
172–3, 173central fatigue 156, 157, 387exercise-associated plasma elevation
172fatty acid mobilization-associated
plasma levels 156, 157megadoses as ergogenic aids 357overtraining syndrome (staleness) 494
tryptophan hydroxylase 172type I (slow twitch) muscle fibres 9, 19,
92capillarization 19
distance skiing 657distribution in whole muscles 20endurance training response 13, 15, 37intermittent exercise 577lipoprotein lipase activity 188maximum velocity of shortening 621motor unit recruitment order 20muscle power output 621properties 19strength training response 626submaximal exercise 93triacylglycerol 188
type II (fast twitch) muscle fibres 9, 19,85, 92
aerobic training response 15anaerobic training response 13, 14, 15,
626capillarization 19creatine supplementation response
374, 375distribution in whole muscles 20intermittent exercise 577maximal exercise 92muscle power output 621myosin ATPase staining 9
type IIa (fast twitch fatigue resistant)muscle fibres 9, 19
gymnastics 589–90metabolic characteristics 20motor unit recruitment order 20
type IIab (fast twitch) muscle fibres 9type IIb (fast twitch fatiguable) muscle
fibres 9, 19anaerobic capacity 19glycogenolytic/glycolytic enzymes
19gymnastics 589–90maximum velocity of shortening 621metabolic characteristics 19–20motor unit recruitment order 20
tyrosine metabolism 177, 178tyrosine supplementation 178–9
ubiquinone 266antioxidant properties 301supplements 307–8, 361–2
female athletes 423upper respiratory tract infection 162–3,
163glutamine feeding study 165, 165
urea metabolism 137, 138uridine diphosphate (UDP)-glucose 98urinary caffeine levels 389urinary calcium losses 321urinary creatinine excretion 368urinary iron losses 333urinary nitrogen 57, 58urinary zinc losses 340urine output 208
postexercise alcohol consumption 262,409
postexercise rehydration fluidcompostiion 259, 262, 260, 261
regulation 210, 213
vanadium 339, 349–50, 351vanadyl sulphate 529vasopressin see antidiuretic hormonevastus lateralis fibre types 20

vegansathletic performance 443calcium 449, 450diet 444, 454vitamin B12 intake 446, 447zinc intake 449
vegetables 79, 423vegetarians 442–54
athletic performance 443–4bone mass 453–4calcium 321, 449–50classification of diets 444, 445health benefit 444–5historical aspects 442–3hormonal alterations 450–3
male sex steroids 452–3menstural cycle irregularities 450,
451, 452, 453oestrogen levels 450, 451–2
iron 447–8deficiency in adolescents 431intake/absorption 334, 335
nitrogen balance 422nutrient strategies 451, 454protein intake 146, 153, 445–6
protein complementation 446, 446vitamin B12 286, 446–7zinc 335, 448–9
verbascose 73very low density lipoproteins (VLDL) 46,
47, 48, 185fatty acids release to muscle 187
violaxanthin 300vitamin A (retinol) 276, 287–8, 596
food sources 288overdosage 276, 288
vitamin B1 (thiamin) 268–70, 283–4,596–7
biochemistry 268–9deficiency 269supplementation 269, 283
safety 269–70, 284vitamin B2 (riboflavin) 79, 270–1, 284,
597biochemistry 270deficiency 284food sources 284supplementation 270–1
safety 271vitamin B6 (pyridoxine) 271–2, 285,
422–3biochemistry 271deficiency 271, 285food sources 285supplementation 272, 285
safety 272vitamin B12 272–3, 285–6, 550
deficiency 273, 286, 447drug-induced malabsorption 447food sources 286supplementation 273, 286, 447
safety 273vegetarian diet 446–7
vitamin B15 266vitamin B complex 286
carbohydrate food sources 78, 79supplementation 286
hot climate training 582weight loss programmes 480
index 679
vitamin C (ascorbic acid) 79, 274–5,286–7, 596
antioxidant activity 301, 310, 423biochemistry 274deficiency 303food sources 287iron absorption enhancement 447supplementation 266, 275, 287, 307,
310hot climate exercise 505, 582megadoses 356, 357safety 275
vitamin D 276–7, 288calcium metabolism 319, 320deficiency 276, 288eating-disordered athletes 516food sources 288overdosage 276, 288vegan diet 450
vitamin E (a-tocopherol) 275–6, 288–9,296
antioxidant activity 299–300, 300, 310,423
biochemistry 275deficiency 296, 303, 305, 493food sources 299supplementation 266, 275–6, 289, 299,
300, 304–5, 306–7, 310, 493female athletes 423high altitude training 582hot climate exercise 505safety 276
vitamin K 277vitamin supplements 281, 282–3, 527,
528–9children/adolescents 430, 437, 438female athletes 422, 425team sports 582weight loss programmes 480
vitamins 266–77, 281–9deficiency 267, 268, 281–2definition 266fat-soluble 266, 275–7, 283functional output relationshop 267,
268intake (requirements)
children/adolescents 437, 438distance skiing 661gymnasts 596–7power events 624, 627, 627, 628team sports 582
metabolic functions 266–7, 267overvitaminosis 267, 268recommended dietary allowances
(RDA) 281, 282, 284water-soluble 266, 268–75, 283
vomiting 250
walking, energy cost 49, 203water balance 207, 216–18, 226–38
hyperhydration 221–2, 236–7renal function 213small intestinal uptake 231–2
water intake (requirements) 226, 227climatic factors 216exercise-associated factors 216, 217inappropriate 212postexercise fluid replacement 258–9
plain water 259, 260, 262, 504
rehydration fluids 234, 235, 235,263–4
regulation 211–12, 217water of nutrient oxidation 212
water losses 207, 208, 208cold climate exercise 660cycling 568distance runners 555–6, 556distance skiing 660hot weather exercise 216maximum aerobic power/oxygen
uptake (V.
O2max.) 218–19, 219renal regulation 210–11respiratory 227sweating 207, 216, 218, 226–7, 256,
555–6, 556, 568, 584, 660team sports 584weight loss techniques 638, 639–40
watt (W) 4weight category sports 637–44, 638
dieting behaviour 637eating disorders 637weight cycling 638weight loss methods 638–40weight maintenance 638–40see also weight restriction
weight-controlled sports 637, 638see also weight restriction
weight cycling 638health consequences 641–2
weight gain programmes 629–30weight loss programmes 513
antioxidant defence system effects298–9
blood letting 640body composition changes 479, 642body fat composition ranges 477–8,
479dehydration 638, 639–40diuretics 640eating disorders prevention 519–20energy balance 469, 638–9goals 477, 478, 479health consequences 640–2nutrition education 469, 480performance consequences 642–3, 643physiological consequences 642–3, 643power events 628
making weight 628–9, 644practical guidelines 477–80, 481, 643–4
behaviour modification 480dietary modification 479–80exercise 480make weight strategies 644
reasons for weight loss 469weight category sports 638–40see also weight restriction
weight restrictioncalcium intake 320, 321, 424female athletes 424
adolescents 430–1nitrogen balance 422vitamin B6 intake 423vitamin/mineral supplement use
425gymnastics 588, 589, 602iron deficiency 334power events 628–9protein requirements 146

weight restriction (Cont.)travel-associated food changes 486young athletes 430–1, 438zinc deficiency 339see also weight loss programmes
weightlifting 5, 6, 621–30characteristics 622, 623see also power events
whole body protein degradation rate 135whole body protein synthetic rate 135work, SI units 4
680 index
wrestlingcharacteristics 622, 623weight loss 638
methods 638, 640
xanthine dehydrogenase 294xanthine oxidase 294
yohimbine 357, 359, 529young athletes see adolescent athletes;
children
zeaxanthin 300zinc 339–41
calcium supplements effects 424children/adolescents 437exercise effects 339–40, 449food sources 339, 449intake 335, 550supplementation 340–1, 351, 425vegetarian diet 448–9weight loss programmes 480