Nutrition and food systems
128
HLPE DRAFT V0 (24 October 2016) – DO NOT CITE OR QUOTE 1 Committee on World Food Security 1 High Level Panel of Experts on Food Security and Nutrition 2 3 Nutrition and food systems 4 5 V0 DRAFT REPORT 6 7 24 th October 2016 8 Submitted by the HLPE to open electronic consultation 9 until 5 December 2016 10 11 This V0 draft is publicly available on the HLPE consultation platform: 12 http://www.fao.org/fsnforum/cfs-hlpe/nutrition-and-food-systems-V0 13 Please read the consultation cover letter on pages 2 and 3 of this document 14 Comments can be sent by e-mail to: [email protected] or to [email protected]. 15 16 This consultation will be used by the HLPE to further elaborate the report, which will then be submitted to 17 peer review, before its finalization and approval by the HLPE Steering Committee. 18 19 20 21 22 23 DISCLAIMER HLPE V0 drafts are deliberately presented early enough in the process - as a work-in-progress, with their range of imperfections – to allow sufficient time to give proper consideration to the feedback received so that it can play a really useful role in the elaboration of the report. It is a key part of the scientific dialogue between the HLPE Project Team and Steering Committee, and the rest of the knowledge community. This V0 draft may be thoroughly corrected, modified, expanded and revised after the present consultation. In order to strengthen this draft, the HLPE would welcome submission of material, evidence-based suggestions, references, and examples, in particular addressing the important questions in the cover letter (pages 2 and 3). For this reason we kindly invite you not to cite nor quote elements from this V0. Please only refer to the final publication for quotations.
-
Upload
khangminh22 -
Category
Documents
-
view
1 -
download
0
Transcript of Nutrition and food systems

HLPE DRAFT V0 (24 October 2016) – DO NOT CITE OR QUOTE
1
Committee on World Food Security 1
High Level Panel of Experts on Food Security and Nutrition 2
3
Nutrition and food systems 4
5
V0 DRAFT REPORT 6
7
24th October 2016 8
Submitted by the HLPE to open electronic consultation 9
until 5 December 2016 10
11
This V0 draft is publicly available on the HLPE consultation platform: 12
http://www.fao.org/fsnforum/cfs-hlpe/nutrition-and-food-systems-V0 13
Please read the consultation cover letter on pages 2 and 3 of this document 14
Comments can be sent by e-mail to: [email protected] or to [email protected]. 15
16
This consultation will be used by the HLPE to further elaborate the report, which will then be submitted to 17 peer review, before its finalization and approval by the HLPE Steering Committee. 18
19
20
21
22
23
DISCLAIMER
HLPE V0 drafts are deliberately presented early enough in the process - as a work-in-progress, with their range of imperfections – to allow sufficient time to give proper consideration to the feedback received so that it can play a really useful role in the elaboration of the report. It is a key part of the scientific dialogue between the HLPE Project Team and Steering Committee, and the rest of the knowledge community.
This V0 draft may be thoroughly corrected, modified, expanded and revised after the present consultation.
In order to strengthen this draft, the HLPE would welcome submission of material, evidence-based suggestions, references, and examples, in particular addressing the important questions in the cover letter (pages 2 and 3).
For this reason we kindly invite you not to cite nor quote elements from this V0. Please only refer to the final publication for quotations.
HLPE DRAFT V0 (24 October 2016) – DO NOT CITE OR QUOTE
2
COVER Letter from the HLPE to this V0 Consultation 1
HLPE consultation on the V0 draft of the Report: 2
Nutrition and food systems 3
At its 42nd session in October 2015, the UN Committee on World Food Security (CFS) requested the High 4 Level Panel of Experts on Food Security and Nutrition (HLPE) to prepare a report on Nutrition and Food 5 Systems. This report is expected to be presented at CFS 44 in October 2017. 6
As part of the process of elaboration of its reports, the HLPE is organizing a consultation to seek inputs, 7 suggestions, and comments on the present V0 draft. This open e-consultation will be used by the HLPE 8 to further elaborate the report, which will then be submitted to external expert review, before finalization 9 and approval by the HLPE Steering Committee. 10
HLPE V0 drafts are deliberately presented early enough in the process - as a work-in-progress, with their 11 range of imperfections – to allow sufficient time to give proper consideration to the feedback received so 12 that it can play a really useful role in the elaboration of the report. It is a key part of the scientific dialogue 13 between the HLPE Project Team and Steering Committee, and the rest of the knowledge community. It 14 should be noted that the present V0 draft report does not yet identify areas for recommendations as it is 15 too early to determine the major propositions stemming from the report. 16
It should be noted that there are several reports on nutrition and diets that have just been released or will 17 be released over the coming year including the GloPan Foresight Report1 (September 2016) and the 18 EAT-Lancet Commission on sustainable diets and food systems (June 2017). The Project Team 19 members will ensure that these reports will be kept in due consideration. 20
In order to strengthen this draft, the HLPE would welcome submission of material, evidence-based 21 suggestions, references, and examples, in particular addressing the following important questions: 22
23
1. The purpose of this report is to analyse the ways in which food systems influence dietary patterns 24
and hence nutritional outcomes. The objective is to focus on consumers and consider 25
sustainability issues. The report aims to be solution oriented and to highlight efficient policies and 26
programs. Are those major objective(s) clearly reflected in the V0 draft? 27
2. Do you think that the overall structure of the draft is comprehensive enough, and adequately 28
considered and articulated? Does the draft strike the right balance of coverage across the various 29
chapters? Are there important aspects that are missing? Does the report correctly focus on the 30
links between nutrition and food systems without straying beyond that? 31
3. Does the conceptual framework need to be edited? Simplified? Should “the food environment” as 32
defined in the draft be central to the framework? 33
4. Are production systems and their role in shaping diets and nutritional outcomes adequately 34
addressed? 35
5. Does this draft cover adequately the main controversies in the field of Nutrition and food 36
systems? Are there any remaining gaps? 37
6. The project team is working on a categorization of food systems. Are you aware of specific 38
approaches of use in that perspective, and particularly of quantitative indicators that could be 39
1 Global Panel on Agriculture and Food Systems for Nutrition. 2016. Food systems and diets: Facing the challenges of the
21st century. London, UK.

HLPE DRAFT V0 (24 October 2016) – DO NOT CITE OR QUOTE
3
used? 1
7. Does this draft adequately show the multiplicity and complexity of diets and nutrition issues 2
across different food systems and specific contexts with a good regional balance? 3
8. What areas of the document are in need of strengthening or shortening? 4
9. Chapter 4, Section 4.1 contains case studies/examples of effective policies and actions in 5
different contexts/countries across the food system for diets and nutrition. Could you offer other 6
practical, well-documented and significant examples to enrich the report and provide better 7
balance to the variety of cases and the lessons learned, including the trade-offs or win-win 8
outcomes in terms of addressing the different dimensions of diets for FSN? 9
10. Section 4.2.2 on “Institutional Changes and Governance Across the Food System Movements for 10
Nutrition” requires more work, and more inclusion of evidence and of the various players. Any 11
inputs on this section are most welcome. 12
11. Is the report too technical or too simplistic? Are all the concepts clearly defined? 13
12. Are there any major omissions or gaps in the report? Are topics under-or over-represented in 14
relation to their importance? 15
16
We thank in advance all the contributors for being kind enough to read and comment and suggest inputs 17 on this early version of the report. 18
19
We look forward to a rich and fruitful consultation. 20
21
The HLPE Project Team and Steering Committee 22
23
24
25
26
27
HLPE Project Team 28
Project Team Leader: Jessica Fanzo (United States of America) 29
Project Team Members: Mandana Arabi (Iran), Barbara Burlingame (New Zealand), Lawrence Haddad (United 30
Kingdom), Simon Kimenju (Kenya), Gregory Miller (United States of America), Fengying Nie (China), Elisabetta 31
Recine (Brazil), Lluís Serra-Majem (Spain), Dipa Sinha (India) 32
33 HLPE Steering Committee 34
Chairperson: Mr Patrick Caron (France), Vice-Chairperson: Ms Carol Kalafatic (USA) 35
Steering Committee Members: Mr Amadou Allahoury (Niger), Ms Louise Fresco (the Netherlands), Ms Eileen 36
Kennedy (USA), Mr Muhammad Azeem Khan (Pakistan), Mr Bernardo Kliksberg (Argentina), Mr Fangquan Mei 37
(China), Ms Murphy Sophia (Canada), Mr Mohammad Saeid Noori Naeini (Iran), Mr Michel Pimbert (United 38
Kingdom), Mr Juan Ángel Rivera Dommarco (Mexico), Ms Magdalena Sepúlveda (Chile), Mr Martin Yemefack 39
(Cameroon), Mr Rami Zurayk (Lebanon) 40
Experts participate in the work of the HLPE in their individual capacities, and not as representatives of 41 their respective governments, institutions or organizations 42

HLPE DRAFT V0 (24 October 2016) – DO NOT CITE OR QUOTE
4
Contents 1
2
SUMMARY AND RECOMMENDATIONS ....................................................................... 8 3
INTRODUCTION ............................................................................................................. 9 4
1 APPROACH AND CONCEPTUAL FRAMEWORK ................................................ 11 5
1.1 Links between food systems, the food environment and diets for good nutrition ............... 11 6
1.1.1 The conceptual framework ................................................................................................ 12 7 1.1.2 The elements of food systems .......................................................................................... 15 8 1.1.3 Healthy diets ...................................................................................................................... 18 9
1.2 Typologies of food systems ........................................................................................................ 21 10
1.3 Conclusion .................................................................................................................................... 23 11
2 THE BURDEN ........................................................................................................ 24 12
2.1 Undernutrition and its causes and consequences ................................................................... 25 13
2.2 Overweight and obesity and its causes and consequences ................................................... 30 14
2.3 Micronutrient malnutrition and its causes and consequences ............................................... 35 15
2.3.1 Vitamin A deficiency ......................................................................................................... 35 16 2.3.2 Iron deficiency and iron deficiency anaemia ..................................................................... 36 17 2.3.3 Iodine deficiency ................................................................................................................ 37 18 2.3.4 Other important micronutrient deficiencies ........................................................................ 38 19
2.4 Conclusion .................................................................................................................................... 38 20
3 DIETARY CHANGES AND THEIR DRIVERS ........................................................ 39 21
3.1 Changing diets – what do diets look like currently? ................................................................ 39 22
3.1.1 Change over time .............................................................................................................. 40 23 3.1.2 Changes with national income level .................................................................................. 41 24 3.1.3 Diets of key population subgroups .................................................................................... 42 25
3.2 Food system drivers that impact diets and nutrition ............................................................... 43 26
3.2.1 Biophysical and environmental drivers .............................................................................. 43 27 3.2.2 Innovation and research drivers ........................................................................................ 49 28 3.2.3 Political and economic drivers ........................................................................................... 50 29 3.2.4 Sociocultural drivers .......................................................................................................... 57 30 3.2.5 Demographic drivers ......................................................................................................... 58 31
3.3 Food systems typologies and their impact on diets and nutrition ......................................... 66 32
3.4 Conclusion .................................................................................................................................... 66 33
4 GARNERING QUALITY DIETS FROM SUSTAINABLE FOOD SYSTEMS .......... 67 34
4.1 Achieving sustainable and healthy food systems .................................................................... 67 35
4.1.1 The rationale for focusing on policies, programmes and projects ..................................... 67 36 4.1.2 A synthesis of how food value chains and the food environment affect nutrition 37
and diets ............................................................................................................................ 68 38 4.1.3 Case studies of policies and programmes with evidence of impact .................................. 70 39 4.1.4 Knowledge gaps and areas for future work ....................................................................... 91 40
Fujitsu
Nota
Re recommendations in general: Will the report indicate how policy-makers are to choose between, balance or combine the different options for tackling nutrition issues – ag production, food supplements, fortification, biofortification, cash handouts, social protection schemes such as school meals, food education, crop/food subsidies, import duties etc? Ideally countries should have an instrument which will help them map what is already in place, assess its cost-effectiveness and review models of other countries’ overall policies and plans. The ICN2 framework is simply a list, and does not suggest how to prioritise.

HLPE DRAFT V0 (24 October 2016) – DO NOT CITE OR QUOTE
5
4.2 Looking to the future ................................................................................................................... 92 1
4.2.1 Technology ........................................................................................................................ 92 2 4.2.2 Food system changes ....................................................................................................... 97 3 4.2.3 Nutrition governance, institutions and partnerships ........................................................ 104 4 4.2.4 Future research areas and data needs ........................................................................... 107 5
4.3 Conclusion .................................................................................................................................. 110 6
REFERENCES ............................................................................................................ 111 7
8
List of Figures 9
Figure 1 Conceptual framework of food systems for nutrition and diets .............................................. 14 10
Figure 2 Trends in child stunting versus the trends in child overweight (UNICEF Global Database, to 11 be updated with 2015 data) .................................................................................................... 24 12
Figure 3 Percentage of children under five who are stunted, 2010–2015 ............................................ 26 13
Figure 4 Changes in number of underweight children under the age of five ........................................ 27 14
Figure 5 Wasting prevalence worldwide ............................................................................................... 28 15
Figure 6 Causes and consequences of maternal and child undernutrition .......................................... 29 16
Figure 7 Trends in the number of obese people, according to region ..................................................... 31 17
Figure 8 Deaths and burden of disease attributable to selected behavioural and dietary risk factors in 18 2010 and the metabolic and physiological mediators of their hazardous effects ................... 32 19
Figure 9 Regional trends (1990–2013) of malnutrition in children under five years old ....................... 33 20
Figure 10 Vitamin A deficiency mapped in preschool children ............................................................... 36 21
Figure 11 Anaemia as a public health problem ...................................................................................... 37 22
Figure 12 Public health significance of iodine deficiency in the world based on the urinary iodine (UI) 23 levels ....................................................................................................................................... 38 24
Figure 13 Intake of key foods and diet components, by region, 2013 .................................................... 39 25
Figure 14 Changes in intake of key foods and diet components by region, 1990–2013 ( percent) ....... 40 26
Figure 15 Consumption of foods and other diet components by national income group, 2013 ............. 42 27
Figure 16 The homogeneity of the world’s food supply .......................................................................... 45 28
Figure 17 CO2 fertilization effects on nutrients of crops ........................................................................ 47 29
Figure 18 Percentage increase in zinc deficiency in response to elevated atmospheric CO2 ............... 47 30
Figure 19 Greenhouse gas emissions of food groups of different diet types ......................................... 49 31
Figure 20 Income spent on food ............................................................................................................. 52 32
Figure 21 Food demand projects vs food production projections ........................................................... 59 33
Figure 22 Production and supply diversity and imports .......................................................................... 60 34
Figure 23 Stages of the nutrition transition ............................................................................................. 61 35
Figure 24 Reductions in stunting correlate with conflict ......................................................................... 63 36
Figure 25 Timing of increases in the food price index with food-related riots and protests ................... 64 37
Figure 26 Correlation between violence and hunger .............................................................................. 66 38
Figure 27 Exit and entry points along the value chain for nutrition ......................................................... 68 39
Figure 28 Interventions aimed at increasing net nutrition along the value chain .................................... 69 40
Figure 29 The way in which value chains interface with the food environment and the potential impact 41 pathways to improve diets and nutrition ................................................................................. 69 42

HLPE DRAFT V0 (24 October 2016) – DO NOT CITE OR QUOTE
6
List of Definitions 1
Definition 1 Food system ...................................................................................................................... 11 2
Definition 2 Sustainable food system ................................................................................................... 11 3
Definition 3 Food environments ........................................................................................................... 11 4
Definition 4 Diets .................................................................................................................................. 12 5
Definition 5 Sustainable diets ............................................................................................................... 12 6
Definition 6 Key indicators .................................................................................................................... 25 7
Definition 7 Body Mass Index (BMI). .................................................................................................... 30 8
Definition 8 Complementary feeding indicators ................................................................................... 42 9
Definition 9 Ecosystem services .......................................................................................................... 43 10
Definition 10 Food system policies......................................................................................................... 67 11
List of Tables 12
Table 1 Recommended foods in selected evidence-based dietary guidelines ...................................... 20 13
Table 2 TENTATIVE Examples of indicators and data sources for each food system element ............ 22 14
Table 3 Summary of main nutrition and physical activity influences on major NCDs, obesity and other 15 important NCDs ......................................................................................................................... 34 16
Table 4 Stunting projections with climate change .................................................................................. 46 17
List of Boxes 18
Box 1 Global and regional health effects of future food production under climate change ................... 71 19
Box 2 Forest restoration interventions in Central Burkina Faso ............................................................ 71 20
Box 3 Biodiversity of local bananas in the Pacific Island countries ....................................................... 72 21
Box 4 Policy and investment frameworks for achieving MDG hunger targets: 22 Bangladesh Experience ............................................................................................................... 72 23
Box 5 Role of cash in conditional cash transfer programmes for child health, growth and development 24 in Mexico ...................................................................................................................................... 73 25
Box 6 The use of trade-related policy to reduce fatty meat availability in Samoa and Fiji .................... 73 26
Box 7 Malawi’s fertilizer subsidy and its association with improvements in FSN .................................. 74 27
Box 8 Biofortification to improve micronutrient intakes .......................................................................... 75 28
Box 9 African Orphan Crops Consortium: promotion of nutritious, high yielding and climate change-29 resilient crops ............................................................................................................................... 76 30
Box 10 Solar-powered drip irrigation to improve food security in the Sahel ............................................ 76 31
Box 11 Traditional food for health in Pohnpei, Federated States of Micronesia ..................................... 76 32
Box 12 Preserving the traditional Mediterranean diet to promote health and sustainability .................... 77 33
Box 13 Identifying interventions to improve the vegetable value chains in Sierra Leone ....................... 77 34
Box 14 Small scale farmer to entrepreneur: a value chain approach for community-led 35 crop cultivation ............................................................................................................................. 78 36
Box 15 Promoting sustainable agriculture among rice farmers in the Philippines ................................... 78 37
Box 16 Helen Keller International’s Enhanced-Homestead Food Production programme 38 in Burkina Faso ............................................................................................................................ 79 39
Box 17 The Development of Sustainable Aquaculture Project in Bangladesh ........................................ 79 40

HLPE DRAFT V0 (24 October 2016) – DO NOT CITE OR QUOTE
7
Box 18 Pathways of impact of livestock health and transfer programme on household resilience and 1 dietary diversity in central Malawi ................................................................................................ 79 2
Box 19 Strengthening food and nutrition security through family poultry and crop integration in Central 3 Tanzania ...................................................................................................................................... 80 4
Box 20 Post-harvest interventions to reduce aflatoxins in Guinea .......................................................... 80 5
Box 21 Reducing neural tube defects with folic acid fortification in Canada and the United States of 6 America ........................................................................................................................................ 81 7
Box 22 A partnership among government, NGOs and producer cooperatives to improve iodized salt 8 coverage in Ethiopia .................................................................................................................... 82 9
Box 23 Food fortification (wheat flour, maize flour, milk) with iron in Costa Rica .................................... 82 10
Box 24 Small fish powder for the first 1 000 days in Cambodia .............................................................. 82 11
Box 25 The impact of transfat policies worldwide .................................................................................... 83 12
Box 26 The United Kingdom Food Standards Agency’s Salt Reduction Programme ............................. 84 13
Box 27 Taxation of sugar-sweetened beverages and non-essential energy-dense foods in Mexico ..... 85 14
Box 28 Eating better for less: a national discount programme for healthy food purchases 15 in South Africa ............................................................................................................................. 85 16
Box 29 The public distribution system in India ......................................................................................... 85 17
Box 30 The Tianjin Project: a community based education programme to reduce salt consumption ..... 86 18
Box 31 Alive & Thrive’s behaviour change communication strategies in Viet Nam, Bangladesh and 19 Ethiopia ........................................................................................................................................ 86 20
Box 32 The North Karelia Project: a media- and education-based community intervention to reduce the 21 risk of coronary heart disease ..................................................................................................... 87 22
Box 33 Star rating labels in the United States of America and Australia ................................................. 87 23
Box 34 An overview of countries’ efforts to incorporate sustainability into dietary guidelines ................. 88 24
Box 35 Banning advertising to children in Quebec, Canada ................................................................... 89 25
Box 36 Increasing the availability of fruits and vegetables in low-income neighbourhoods 26 of New York ................................................................................................................................. 89 27
Box 37 GAIN’s Marketplace for Nutritious Foods: increasing the availability of chicken to low-income 28 populations .................................................................................................................................. 89 29
Box 38 Farm-to-school programmes in Brazil and the Caribbean ........................................................... 90 30
Box 39 Developing a tool to design nutritious school meals with locally grown food in Ghana .............. 91 31
Box 40 Human Genome Project ............................................................................................................ 110 32
33
34

HLPE DRAFT V0 (24 October 2016) – DO NOT CITE OR QUOTE
8
SUMMARY AND RECOMMENDATIONS 1
2
This section will be developed by Version 1. 3
4

HLPE DRAFT V0 (24 October 2016) – DO NOT CITE OR QUOTE
9
INTRODUCTION 1
Malnutrition in all its forms affects every country on the planet and is a major impediment to achieving 2 both global food security and nutrition and sustainable development worldwide.2 Globally, one in three 3 people are malnourished. If current trends continue, this number will reach one in two by 2030. This 4 trajectory is in stark contrast to the aspirations of the new Sustainable Development Goals (SDGs) to end 5 all forms of malnutrition by 2030. The number of people that are hungry is 795 million, the number that 6 are deficient in essential vitamins or minerals is 2 billion and the number that experience overweight and 7 obesity is 1.9 billion. While hunger and micronutrient deficiencies are declining slowly, overweight and 8 obesity are increasing rapidly (IFPRI, 2016). 9
All forms of malnutrition are the result of interactions between poor diets and unhealthy environments. 10 Food systems govern the types of food produced and the nature of their journey from farm to fork via 11 value chains. As populations urbanize, incomes increase and the food industry concentrates and 12 globalizes, the length of value chains has increased. This provides many opportunities to enhance or 13 diminish the nutritional value of foods. Similarly, as the food industry concentrates and globalizes in 14 response to increased purchasing power, concentrated markets and liberalized financial regulations, 15 many opportunities are generated for improving or worsening the nutritional value of foods. 16
Despite the centrality of food quantity and quality as determinants of nutrition adequacy and the 17 fundamental importance of food systems in determining which foods are available, affordable and 18 acceptable, the multiple opportunities to intervene in food systems to promote nutrition are not well 19 known, understood or addressed. This is because both food systems and malnutrition burdens are 20 complex and context-specific, making it difficult to identify the links between them and the actions needed 21 to leverage those links. 22
The failure to identify and implement actions to make food systems more nutrition promoting is costly. The 23 human health and economic consequences of malnutrition are crippling: 45 percent of all under five 24 mortality results from malnutrition and, taken together, all forms of malnutrition represent the biggest 25 cluster of drivers of the global burden of disease, with low-quality diets being the number one risk factor 26 for global disease burdens. The economic costs of malnutrition are large, resulting in GDP and household 27 income losses of 10 percent, year in, year out. And the burdens are transmitted across generations, 28 because malnourished mothers are more likely give birth to malnourished babies who are more likely to 29 grow up to be malnourished adults. 30
The environmental health and its economic consequences are equally crippling. Global food systems, 31 from industrial-scale production through excessive consumption and waste, are not sustainable, resulting 32 in significant environmental degradation and pollution, and extensive damage to natural systems. 33 Industrial farming practices cost the environment some USD3 trillion per year (FAO, 2015a). 34
If current trends continue, these costs will worsen, and they will be felt most strongly in the low- and 35 middle-income countries that are grappling with new forms of malnutrition without eliminating the old 36 forms. This overlap of burdens is already occurring: 44 percent of countries with data show simultaneous 37 and serious levels of undernutrition and overweight/obesity. Fortunately, as this report will show, there are 38 choices to be made by policy-makers that can change this picture: they can accelerate reductions in 39 undernutrition and slow down increases in overweight and obesity – and even begin to turn them around. 40 For low- and middle-income countries, it is imperative that these choices are identified and made. Such 41 countries are building new food systems rapidly and they have the chance to make the right decisions for 42 nutrition at the first time of asking. They do not have to follow the long and damaging path that many high-43 income countries have taken, involving the creation of food systems that maximize profits without an 44 adequate focus on the nutrition consequences. 45
To be sustainable, food system policy choices have to focus on the environmental as well as nutritional 46 consequences. Different foods require different amounts of energy, water and fertilizers to grow, harvest, 47 process, store, transport, trade, market and retail. Their value chains also generate different levels of 48
2 The term malnutrition includes undernutrition, micronutrient deficiencies, overweight and obesity.

HLPE DRAFT V0 (24 October 2016) – DO NOT CITE OR QUOTE
10
greenhouse gas (GHG) emissions. As far as the evidence allows, decision-makers need to know the 1 nutrition and environment consequences of the food system decisions they take. 2
This HLPE report aims to help members of the Committee on World Food Security (CFS) make the case 3 for their key policy-makers to act boldly and decisively to make their food systems more nutrition 4 promoting in a sustainable manner. Specifically, the report will present the evidence base for CFS policy 5 convergence work on nutrition beyond 2017, building on the momentum from the International 6 Conference on Nutrition in 2014, the UN Decade of Action for Nutrition, the Sustainable Development 7 Goals, the Right to Food and other political agendas attempting to improve nutrition through sustainable 8 development. Most importantly, the report will provide guidance on which policy and programme actions 9 to take in a given malnutrition context, and the environmental synergies and trade-offs of doing so. 10
The report is the twelfth issued from the CFS HLPE and draws on the foundation of the reports that have 11 preceded it, many of which are highly relevant to different components of food systems (such as livestock 12 and fish production systems, sustainable agriculture, and food loss and waste). 13
Acting to change systems is never easy. Vested interests, technical difficulties and human and financial 14 resource constraints all have to be overcome. Effort and focus need to be sustained. But key decision-15 makers in the public and private sectors have an obligation and a responsibility to act, and they should 16 feel empowered to do so. Right now the political momentum is with those who aim to shape their food 17 system towards improved nutrition. The SDGs – the world’s main accountability tool for sustainable 18 development over the next 15 years – have a lot to say about food security, nutrition, climate and 19 sustainable consumption. 20
In addition, the UN decade of Action for Nutrition, launched in April 2016, is heavily focused on food 21 systems and a plethora of reports from a wide range of bodies has made the case for food systems that 22 are more nutrition focused and environment friendly. Most of these reports fall short in outlining specific 23 food system actions policy-makers could implement and what they might expect to see as a result of 24 implementation. This report seeks to fill this crucial evidence gap and make it easier for leaders to act for 25 nutrition in the food system space. The short-term costs of the actions outlined in this report may seem 26 high, but the cost of inaction is much higher and carries with it a terrible legacy affecting generations to 27 come. 28
The purpose of this report is two-fold: (i) to analyse the ways in which food systems influence dietary 29 patterns and hence nutritional outcomes for consumers; and (ii) to highlight effective policies and 30 programmes that shape food systems in order to contribute more effectively to improved nutrition and 31 ensure the right to food for all in a sustainable way. The report begins with our overall approach and 32 conceptual framework of food systems and how they shape diets and nutrition. The second chapter will 33 focus on the multiple burdens of malnutrition. The third chapter will focus specifically on how diets are 34 changing and the food system drivers of change. The fourth chapter will focus on what works across 35 programmes and policies and areas of future thought, along with controversies across the nutrition field. 36
37
38
HLPE DRAFT V0 (24 October 2016) – DO NOT CITE OR QUOTE
11
1 APPROACH AND CONCEPTUAL FRAMEWORK 1
This chapter aims to build a common understanding of the importance of food systems for food security 2 and nutrition (FSN). It outlines the approach and concepts used in this report. 3
Section 1.2 explains our conceptual framework which links food systems – including the often overlooked 4 food environment – with diets and nutrition status. The section begins by summarizing the role of diets as 5 drivers and outcomes of food systems, and food systems as a driver of diets. In doing so, it examines 6 some of the key terms and definitions that define the current state of diets and nutrition. The framework 7 established in this report is in line with conceptual frameworks established by the HLPE that link FSN to 8 sustainable food systems (HLPE, 2014). The section articulates the different elements of food systems 9 and, at the same time, establishes the framing and narrative of the report. 10
Section 1.3 will establish food system typologies building upon key indicators of different food system 11 components. Later in the report, we will undertake a comparative analysis of these typologies: which 12 countries have which food system types, what do the food systems look like in terms of their structural 13 features, and what are the nutrition outcomes associated with each of them? 14
1.1 Links between food systems, the food environment and diets for 15
good nutrition 16
Definition 1 Food system
A food system consists of all the elements (environment, people, inputs, processes,
infrastructures, institutions, etc.) and activities that relate to the production, processing, distribution, preparation and consumption of food, and the outcomes of these activities, namely nutrition and health status, socio-economic growth and equity and environmental sustainability (HLPE, 2014).
17
The SDGs reiterate the importance of sustainability as an overarching goal for food systems in the 18 context of climate change and economic development (Whitmee et al., 2015). The HLPE (2014) definition 19 of food systems captures the nutrition and sustainability dimensions well. 20
21
Definition 2 Sustainable food system
A sustainable food system (SFS) is a food system that ensures food security and nutrition for all in such a way that the economic, social and environmental bases to generate food security and nutrition of future generations are not compromised.
22
Diets drive food systems because dietary choices have implications for food production, processing, 23 storage, trade and retailing. And food systems drive diets in terms of availability, affordability, 24 acceptability and safety of foods that are sustainable and promote good nutrition. 25
Definition 3 Food environments
Food environments refer to the physical, economic, policy and socio-cultural surroundings, opportunities and conditions that influence food choices and nutritional status (Swinburn et al., 2014). It influences the accessibility (physical proximity of food), affordability (food prices) and
Fujitsu
Nota
1) Very good to show the reciprocity between diets and the food system - but the way this is expressed seems to imply that dietary choices are apart from food systems, rather than part of them. Can anything be done about this? 2) Definition 3 Second sentence subject should be plural?

HLPE DRAFT V0 (24 October 2016) – DO NOT CITE OR QUOTE
12
acceptability of food, which is mediated through food preferences and knowledge3 (Caspi et al., 2012; Swinburn et al., 2014). Healthy food environments enable consumers to make nutritious food choices with the potential to improve diets and reduce the burden of malnutrition in all its forms.
1
Definition 4 Diets
Diets comprise the individual foods that a person consumes on a given day, week or month, in a habitual way that forms a dietary pattern. Diets that are considered nutritious and sustainable are those with low environmental impacts and contribute to food and nutrition security and to healthy life for present and future generations.
2
Definition 5 Sustainable diets
Sustainable diets are protective and respectful of biodiversity and ecosystems, culturally acceptable, accessible, economically fair and affordable; nutritionally adequate, safe and healthy; while optimizing natural and human resources (FAO, 2012).
3
However, many gaps remain in understanding how to achieve sustainable diets for all (Johnston et al., 4 2014; Jones et al., 2016). 5
1.1.1 The conceptual framework 6
The conceptual framework used in this report (Figure 1) illustrates the elements and inputs, activities and 7 actors and outcomes within a food system for FSN and sustainable development. This framework has 8 been adapted from many other frameworks that have been visualized and vetted in the past (GloPan, 9 2016; Ingram, 2011; Lawrence et al., 2015; Pinstrup Andersen and Watson, 2011; Soba, 1998). 10
This framework makes three significant contributions to previous frameworks: (i) it highlights the role of 11 diet as a core link between food systems and nutrition outcomes; (ii) it highlights the importance of “food 12 environments” – the context within which consumers acquire food – for making nutritious and sustainable 13 choices easier; and (iii) it develops the links to the economic and environmental sustainability as identified 14 in previous HLPE reports. 15
The framework acknowledges that food systems encompass multiple components, levels, scales and 16 sectors, affecting and being affected by other systems (HLPE, 2016). It can be applied in several 17 contexts, from local and national to international levels. It also illustrates the complex relationships 18 between system actors and the components and outcomes. Although a system’s components themselves 19 are important, it is the relationships among components that make a system a system (Neff et al .,2011). 20
Food system activities, actors and outcomes are shaped and influenced by numerous factors. They are: 21 biophysical and environmental (e.g. natural resource availability); innovation and research (e.g. 22 infrastructure and technology for transport); political and economic (e.g. the economic incentives for the 23 private sector and the political priorities of government); socio-cultural (e.g. traditions, attitudes on what is 24
3 Acceptability refers to people’s attitudes about attributes of their local food environment, and whether or not the given supply of
products meets their personal standards. (Caspi et al., 2012)
Fujitsu
Nota
Definition 4 1) reword -are those with low environmental impacts and which contribute to food andnutrition security.. 2) Is it really safe to marry nutritious and sustainable as though they are perfectly compatible and complementary? (since they are not) 3) Will we have a definition of consumers? (Does it mean those who consume food or those who buy it?)

HLPE DRAFT V0 (24 October 2016) – DO NOT CITE OR QUOTE
13
a healthy diet); and demographic (e.g. the age and rural/urban profiles of the population) (Ingram, 2011). 1 The relative importance and impact of each factor will depend on the type of food system, the type of 2 actors, and the actions and policies that are decided upon (IOM and NRC, 2015). 3
Two key components of food systems that are influenced by these drivers and, in turn, influence 4 consumer choice and diets are: food value chains and the food environment. The food value chain 5 consists of the activities and actors that take food from production to consumption and to the disposal of 6 its waste (Hawkes and Ruel, 2012. A food value chain emphasizes the addition of commercial value 7 accrued (or lost) across the different steps of the chain as well as the value produced through the 8 functioning of the value chain as a whole (Gelli et al., 2015). Although the ”value” added (or lost) in the 9 food value chain is typically viewed in economic terms, it can also be examined from a nutrition 10 perspective as the entry or exit of nutrition along the food value chain. The value chain actors influence 11 the way in which food is produced, processed, distributed, marketed and consumed and whether or not 12 nutritious foods are accessible, affordable and acceptable within a given food environment. 13
A food system does not sit in isolation. It interacts with other systems such as the health, energy and 14 transportation systems. A shock to one system can perturb another system. Shocks to food systems can 15 also be caused by events such as natural disasters and conflict. These systems are interlinked and in 16 continual adaptive cycles of growth, restructuring and renewal (Gunderson et al., 2012). 17
18
Fujitsu
Nota
Add "desirable" to "accessible, affordable and acceptable"

HLPE DRAFT V0 (24 October 2016) – DO NOT CITE OR QUOTE
14
Figure 1 Conceptual framework of food systems for nutrition and diets 1
2
Fujitsu
Nota
NIce diagram. It appears however that everything affects consumers but they affect very little. It seems that consumers are limited to making food choices in response to external influences. But by devolving wilingness to pay and preferences to "food environments", and omitting knowledge, understanding, habits and perceptions, the diagram limits the consumers' influence on the cycle. .
Fujitsu
Nota
1. Where should consumer associations be shown? 2. Does food advertising fall under "information and guidelines", under "sociocultural drivers"), under "markets" or under "food acceptability"? 3. The directrelationship of food environment to consumer behaviour is signalled only by overlap and not by arrows. Is this intended? 4. Can we include BCC, professional training, food and nutrition education under "information and guidelines"? 4. From the POV of education and training it would be useful if the map could show all the significant actors involved in the food system. This isdone in several of the boxes, but we are missing some (e.g. politicians, planners, ministry staff, food industry managers -and perhaps include street food vendors with the retailers.

HLPE DRAFT V0 (24 October 2016) – DO NOT CITE OR QUOTE
15
The following sections describe the features and drivers of food systems, the activities and actors within 1 value chains, food environments where consumers make their food choices and the diets that are 2 recommended by public health bodies around the world to support good nutrition status. 3
1.1.2 The elements of food systems 4
Drivers 5
There are key elements and inputs that drive the activities, actors, environments and outcomes of the 6 food system. These elements and inputs are derived from other systems and can be classified broadly 7 as: biophysical and environmental drivers; innovation and research drivers; political and economic 8 drivers; socio-cultural drivers; and demographic drivers. 9
Biophysical and environmental drivers: The main aspects of these drivers of food systems include natural 10 resource capital, ecosystem services, climate adaptation and resilience. As shown in Figure 1.1, 11 biophysical and environmental drivers mostly influence value chain actors and their activities, as well as 12 the food environments. Fundamental features of production systems such as land, soil and water are key 13 resources for diets. Land is one of the most important inputs and drivers of food production because it is 14 the source of soils, which are the main source of nutrients and support to plants. Water bodies, whether 15 natural or human-made, on the other hand, are essential reservoirs for fisheries production. Water is also 16 an essential input in crop and livestock production, as well as in food processing and preparation. 17 Production systems are affected by climate, making climate an important driver of food systems 18 (McMichael et al., 2015). Land and climate characteristics convey endowment, resulting in comparative 19 advantage in production systems. 20
In the context of diets, important aspects of the biophysical elements are soil composition, biodiversity 21 and water. If soils lack some key nutrients, this contributes to lower crop yields and lower livestock 22 production, which affect diet quality and human health. The presence of heavy metals from chemical 23 fertilizers can also result in negative consequences for human health. Biodiversity is essential for FSN. 24 Agricultural biodiversity is represented by the plant and animal species, and intraspecies diversity, within 25 an agroecological zone or production area. Richness in biodiversity in a given agroecological zone is 26 related to both improved nutrient intakes as well as environmental health (Kuhnlein et al., 2010). 27
Innovation and research drivers: Innovation is generated through research. Important innovations that 28 influence food systems include technological and infrastructural innovations. Innovation and research 29 drivers also affect food systems through value chain actors and their activities as well as through the food 30 environments. Infrastructure include physical ones such as roads, rail, irrigation and energy. These kinds 31 of infrastructure investment support both production and value-addition activities (UNEP, 2016), 32 (International Resource Panel, 2007). 33
Examples of technology drivers on value chain activities include more-nutrient-rich seed, fertilizers, 34 mechanization, storage, processing and distribution technologies. Applications of science and technology 35 can be used to develop more nutritious and healthier foods (Floros et al., 2010). These include 36 fortification, which can be used to increase nutrient content of processed foods (Bouis et al., 2011). In 37 addition, technology advancements can improve processing, storage and preservation leading to a 38 retention of nutritional value and enhancement of food safety (Sight and Life, 2016). 39
Political and economic drivers: Political and economic drivers affect the value chain actors and their 40 activities, the food environment and the behaviour of consumers. Political drivers are concerned with 41 governance structure, rules and regulations. Examples of these elements are policies, incentives and 42 governance. Policy can be implemented at the subnational, national, regional or international levels, with 43 various influences on the food systems and diets. National level policies involve governments, which 44 could make strategies and erect programmes to influence diets, such as the regulation of the selling of 45 certain foods such as those with saturated fats or sugars (UNEP, 2016). Other national policies include 46 land-use and land-tenure laws, and development of physical infrastructure that supports production and 47 marketing, especially by smallholder farmers. 48
49

HLPE DRAFT V0 (24 October 2016) – DO NOT CITE OR QUOTE
16
At the international and regional levels, an example of a political driver that would affect food systems and 1 diets is trade policy. Trade liberalization affects food systems directly or indirectly through changes in 2 incomes or emergence of diseases (Thow et al., 2009). Trade liberalization influences the rapid 3 modernizing of the retail environment leading to expansion of supermarkets and hypermarkets that bring 4 about changes in the food environment (Qaim, 2016). Other aspects of international trade include food 5 standards that need to be followed by producers and other value chain actors. 6
Economic drivers on the other hand deal with gross development product (GDP), incomes, prices and 7 poverty, among others. Their effect may be directly at the consumer level or at the value chain and food 8 environment levels. Income rise can lead to either healthier or less healthy diets. Income growth is 9 associated with diets shifting from traditional staples and coarse grains to diets richer in sugars, fats and 10 salt. On the other hand, income increases come with increases in consumption of animal-sourced foods, 11 vegetables and fruits, leading to a more diversified diet (UNEP, 2016, Alexandratos et al., 2012, Kearney, 12 2010) 13
Socio-cultural drivers: These drivers include aspects such as traditions, social norms, religion and rituals, 14 social stratification and gender. Their influence on food systems is mainly through food environments and 15 consumer behaviour. On consumer behaviour, for instance, these elements affect consumer preference 16 resulting in differing food choices. For instance, the extent to which consumers substitute vegetable with 17 animal products is influenced by factors such as traditions regarding culture, beliefs and religious 18 traditions (Kearney, 2010). Policies towards healthier foods through better consumption patterns need to 19 take into consideration such factors (Kearney, 2010). 20
Demographic drivers: These drivers include aspects such as urbanization, population growth, changing 21 age profiles, age and education. Similar to socio-cultural drivers, their influence is mainly on food 22 environments and consumer behaviour. Population growth will come with increased urbanization. While 23 population growth is projected to reach 9.3 billion people in 2050, the number of people living in cities will 24 increase by 75 percent from 2010 to 2050 (UNDESA, 2013) (UNEP, 2016) These changes may come 25 with less or more healthier food environments depending on the context, with potentially higher 26 prevalence of non-communicable diseases (NCDs), as urban food consumers not only eat more but also 27 have reduced physical activity, and higher preference for cheap, quick and convenient foods that end up 28 being the more processed ones with high salt, fat and sugar (Kearney, 2010). 29
Value chain activities and actors 30
The drivers influence the choices of the value chain actors and the activities they undertake (Downs et al., 31 2016; Porter and Millar, 1985). At the core of any food system are key activities that can be grouped into 32 five categories: production; storage, exchange and distribution; processing and packaging; retail, 33 marketing and advertising; and food acquisition, preparation and consumption (Figure 1.1). These 34 activities are performed by different actors. 35
Production: Food production encompasses all those activities involved in the transformation of resources 36 into raw food materials, namely crop and livestock commodities (Sobal et al., 1998) (Ingram, 2011). 37 These activities include growing crops, animal husbandry and hunting, fishing and gathering (Sobal et al., 38 1998). The main actors in a production system are the producers themselves who include farmers, 39 hunters and firms, and owners of productive resources such as land and plantations. Other important 40 actors are suppliers of services involved in production such as providers of financial services, providers of 41 inputs such as agrichemicals, extension and labourers (Ingram, 2011). Productivity of crops is important 42 as this increases farm income and lowers price to consumers. The choice of crops towards which efforts 43 to improve productivity are directed is likely to have implications for diet quality: for example, if the 44 productivity of fruits and vegetables is prioritized this is likely to make them more available at lower prices 45 to the consumer. However this will take resources away from the enhancement of productivity of different 46 crops and so careful analysis of the net effects is essential. Another aspect of the production system 47 thought important for healthier diets is diversification; however research suggests that both diverse 48 production systems and market access are important in dietary diversity (Jones et al., 2016; ADD Refs). 49
Storage, exchange and distribution: Commodities that are not used up or stored by their producers are 50 usually exchanged in markets, be they local, regional or international markets. Exchange is aided by 51

HLPE DRAFT V0 (24 October 2016) – DO NOT CITE OR QUOTE
17
distribution. In distribution, the output moves through channels to places where acquisition and 1 consumption are needed, or alternatively to processing (Sobal et al., 1998).The extent and complexity of 2 distribution depend on how wide the exchange covers. It is important to note that storage happens in 3 many distribution points. 4
A variety of actors are involved in this stage. These include the producers who store some of their 5 produce, brokers/intermediaries, traders and transporters. Other important actors include manufacturers 6 of storage and warehousing equipment, as well as governments and donor programmes that are involved 7 in food procurement and distribution. Examples include school feeding, food transfers and emegergency 8 distribution programmes. 9
During this stage of the food system, important aspects for achieving healthier diets are food safety, 10 waste and loss. These outcomes can occur throughout the value chain, but are frequently seen most 11 clearly at this point. Storage and distribution of fresh produce bring about many possibilities for 12 contamination, with negative consequences on diets and health. 13
Processing and packaging: Processing is concerned with transforming raw fresh foods into food products 14 through industrial methods (Asfaw, 2011). Among other reasons, food is processed for preservation and 15 converting into more convenient forms to allow subsequent processes such as exchange (Floros et al., 16 2010). Processed food is usually packaged, which may take different forms, with a main aim being to 17 contain the product and prevent it from contamination (Floros et al., 2010). Different kinds of actors are 18 involved in processing and packaging. These include processing and packaging plants, food 19 manufacturers, small and medium-sized enterprises (SMEs) engaged in value addition and processing, 20 as well as regulators and standard setters. 21
A key aspect for healthy diets during this stage of the food system is food safety. Food processing and 22 packaging confers several benefits in this direction – mainly, the removal of health hazards associated 23 with microbial pathogens. This safety is extended by packaging, which prevents the product from 24 pathogens and other agents that can accelerate deterioration (Floros et al., 2010). Processing and 25 packaging are associated with reduced food loss. Packaging also provides media for conveying 26 information to the consumer (labels) including expiry dates, etc. On the other side, food processing can 27 result in lower micronutrient contents of foods, and creates attractive, hyper-palatable, foods with high 28 amounts of fats, sugar and salt, associated with rising rates of overweight/obesity and increase risk of 29 chronic diseases (Lipinski et al., 2013). 30
Retailing, marketing, advertising: Retailing, marketing and advertising involve activities undertaken by 31 actors to facilitate exchange of food products. They involves product distribution, warehousing/storage, 32 promotion and actual selling. A common aspect of promotion is advertising. Many actors are involved in 33 this stage including food companies, transporters, warehousing operators, advertising companies, and 34 traditional and modern retailers, including supermarkets (Ingram, 2011). 35
One of the key concerns here as related to healthier diets is the modernization of the retail environment 36 that is associated with globalization, food industry power and trade. It is documented that among other 37 factors influencing food systems are global food advertising and promotion, as well as growth of 38 transnational food companies (Hawkes et al., 2009). This global advertising and the rapid spread of 39 supermarkets and fast food chains have an effect on shopping behaviour and consumption patterns 40 (Reardon et al., 2003), (Timmer, 2009). Evidence shows that buying in supermarkets increases 41 consumption of processed foods (Asfaw, 2008), (Rischke et al., 2015), (Kimenju et al., 2015) . 42
Food environments 43
Food environments refer to the physical, economic, policy and socio-cultural surroundings, opportunities 44 and conditions that influence consumer food choices and, hence, nutritional status (Caspi et al., 2012; 45 Swinburn et al., 2014). The food environment is the space in which consumers engage to acquire foods. 46 Within the food environment, consumers are influenced by issues of access, affordability and 47 acceptability and by the information available to make choices, be they healthy or unhealthy. Individual 48 consumer preferences influence eating patterns, and the structural context (environment) within which 49 those choices are framed and bounded is crucial in terms of shaping those preferences. 50
Food access: Physical food access depends on food production and trade, but also on the distribution 51

HLPE DRAFT V0 (24 October 2016) – DO NOT CITE OR QUOTE
18
and retail system. Barriers to food access can lead to increased risks of undernourishment as well as 1 obesity and diet-related non-communicable diseases (NCDS), depending on the context (Duran et al., 2 2015; Feng et al., 2010; Holsten, 2009, Glanz et al., 2005). For example, low-income neighbourhoods in 3 some countries such as the United States of America experience food deserts where the food 4 environment is characterized by limited access to fresh produce and nutritious foods. In many LMICs, lack 5 of infrastructure such as roads (particularly in rainy seasons) can limit access to food. 6
Governments have a particular duty to ensure access to healthy foods via state channels such as in 7 emergency provisioning, social protection programmes, investment in infrastructure, public schools, 8 hospitals and prisons. Many governments also choose to regulate access to healthy foods in non-state 9 actors such as employer workplaces, private schools, nurseries and hospitals (L’Abbe et al., 2013). 10
Food affordability: Food affordability is the cost of the diet of a household relative to the household's 11 income (Powell et al., 2013) and is a key determinant in accessing healthy diets (Darmon and Drenowski, 12 2008; Beydoun and Wang, 2008). Volatility of food prices can create uncertainty for all actors within the 13 food systems and can have negative effects on the most vulnerable consumers, particularly those that 14 already invest most of their income on food items (HLPE, 2011). Depending on the country, food prices 15 are mainly defined by market forces but government food fiscal policies, such as taxes, subsidies and 16 other food pricing policies, may also have significant impact on food prices (Lee et al., 2013). 17
Food acceptability and preferences: There are different models to explain eating behaviour. The 18 interaction among intrapersonal, interpersonal, situational and societal factors influences specific eating 19 habits (Story et al., 2002). The level of information and knowledge a consumer has can also shape food 20 acceptability and preferences, as can food advertising and branding. Food advertising directed at children 21 can be particularly harmful in terms of influencing food preferences, purchase requests and consumption 22
patterns (Cairns et al., 2013; McGinnis et al., 2006; Kelly et al., 2013; PAHO, 2011).. 23
Information and guidelines: Many countries have food-based dietary guidelines. Although these 24 guidelines provide information about which foods are recommended in a given country context from a 25 nutrition and health perspective, they do not necessarily lead to changes in dietary intakes. Consumers 26 need more than information alone to make healthy food choices. Nutrition labels are a key source of 27 potentially useful information for consumers seeking to make healthier choices. They also have the 28 potential to alter food manufacturer behaviour by encouraging product reformulation (Cowburn and 29 Stockley, 2005; Campos et al., 2011; Wartella et al., 2012). 30
There are several initiatives to facilitate the use and understanding of nutrition information. In addition to 31 the often difficult to interpret basic package of nutrition information, other formats to facilitate informed 32 choice are emerging, such as the easy to interpret front-of-pack nutrition labelling (e.g. traffic light labels) 33 (BEUC, 2015; Rayner et al., 2013). The food environment within the household is also critical for diet 34 quality. 35
Composition, quality and safety: To be developed 36
37
1.1.3 Healthy diets 38
There is no single “ideal” healthy diet that is right for everyone; however, there are basic principles that 39 can help define diets associated with health. These have been distilled and promulgated by the World 40 Health Organization (WHO) and by many national governments. Diets for health contain an appropriate 41 level of food energy, help achieve nutrient adequacy, support growth and maintenance of health across 42 the life course, and reduce the risk of chronic/non-communicable diseases. According to WHO, “the exact 43 make-up of a diversified, balanced and healthy diet will vary depending on individual needs (e.g. age, 44 gender, lifestyle and degree of physical activity), cultural context, locally available foods and dietary 45 customs” (WHO, 2015). 46
47
48
Fujitsu
Nota
Another limitation on access is lack of electricity for refrigeration (e.g. in college canteens, snack stalls) which restricts access to fresh F&V.
Fujitsu
Nota
At some point, need to say that acquisition/consumption does not necessarily follow from access, and to list the various barriers to be recognized.
Fujitsu
Nota
In view of the powerful influence of the factors listed in reference to Story, it would be valuable to give more detail here and would even up the balance of the whole, which tends to favour external influences. E.g. convenience, time, social status, family preferences

HLPE DRAFT V0 (24 October 2016) – DO NOT CITE OR QUOTE
19
Characteristics of diets for health (Needs references) 1
Contain food energy that is adequate to support physical activity and maintain life and appropriate 2 for achieving and maintaining a healthy body weight. 3
Include a variety of nutrient-dense foods from basic food groupings including vegetables, fruits, 4 whole grains/cereals, dairy foods, and animal- and plant-based protein foods. Specific types and 5 amounts of foods within these groups, especially staple foods, will vary geographically and 6 culturally. 7
Limit overconsumption of nutrient-poor foods high in energy, saturated and transfats, added 8 sugars, and salt or sodium. Fat, sugar and sodium included in moderate amounts in nutrient-dense 9 foods can improve palatability and enjoyment of foods; however, nutrient-poor foods high in these 10 food components should be limited. 11
Have characteristics that reflect an eating pattern linked to positive health outcomes, such as the 12 Mediterranean eating pattern or the Dietary Approaches to Stop Hypertension (DASH) diet. 13
Contribute variety, balance and moderation, as well as pleasure, to eating, and are also affordable, 14 accessible and culturally appropriate. 15
Contain adequate and appropriate micronutrient and macronutrient amounts to meet individual 16 nutrition and health needs. 17
Overall, research supports the concept that there is no single ideal diet, and that multiple eating patterns 18 that are rich in a variety of nutrient-dense foods, and accommodate regional food preferences, can be 19 considered to lead to good health. More research is needed: to characterize the effects of specific eating 20 patterns on morbidity and mortality; to better understand the synergies, cumulative effects and trade-offs 21 of consuming specific foods, beverages and nutrients in combination; and to confirm observational 22 findings about links between eating patterns and health outcomes with randomized controlled trials. In 23 addition, food availability, food processing and food preparation in different regions may influence health 24 benefits associated with certain diets; therefore, understanding how best to adapt eating patterns 25 recommended for health to include regional foods or taste preferences is also needed. 26
Eating patterns associated with health as described in evidence-based dietary guidelines 27
In 1996, FAO) and WHO published guidelines for the development of food-based dietary guidelines 28 (FBDGs) (WHO/FAO, 1996). FAO’s Web site now includes 83 member state FBDGs. Some countries 29 have a rigorous process in place to review the science on health and nutrition to guide development of 30 FBDGs, while other countries adapt existing nutritional recommendations and FBDGs to their needs. 31
FBDGs are often based on a system of food groupings thatcan aid in achieving adequate intakes of 32 vitamins, minerals and macronutrients. Guidelines may include advice on controlling body weight, or 33 limiting consumption of dietary components such as saturated fat, trans fat, added sugars and sodium, 34 though specific guidance about how to reduce consumption of these components may differ in different 35 countries. Language regarding sustainability has entered some FBDGs recently (Gonzales Fisher et al, 36 2016), though not in a systematic way. 37
Table 1 summarizes core foods and components recommended in recently developed dietary guidelines 38 from the United States of America (US. Department of Health and Human Services/United States 39 Department of Agriculture, 2015), Brazil (Ministry of Health of Brazil, 2014), Australia (Commonwealth of 40 Australia, 2013), and Nordic countries (Nordic Council of Ministers, 2014). These countries reviewed 41 scientific evidence on eating patterns and health to develop their guidelines, though the processes used 42 were not identical. This is not a comprehensive review of FBDGs, but is included to illustrate the similarity 43 of core components of healthy eating defined in guidelines developed in the last five years. 44
In the context of eating patterns, a variety of nutrient-dense foods is needed to ensure nutrient adequacy. 45 Foods contain different vitamins, minerals and macronutrients (protein, carbohydrates and fats) plus other 46 bioactive components. In addition, nutrients are consumed as a part of a complex food matrix that may 47 impact the effect of nutrients on health. Different countries may emphasize regional staple foods within 48 food groups such as roots and tubers in Brazil, or potatoes and berries in Nordic recommendations. 49 Plant-based diets are recommended by all, though definitions vary, but note that the phrase is not 50
Fujitsu
Nota
Should probably be mentioned that if the impact of the guidelines is not assessed or there is no implementation program, we don't know what effect they have had. Without these caveats, there is a tendency to assume that dietary guidelines are effective in themselves.
Fujitsu
Nota
AGreed that it's not comprehensive, and would be good to have one or two examples from developing countries

HLPE DRAFT V0 (24 October 2016) – DO NOT CITE OR QUOTE
20
synonymous with vegan or vegetarian diets. 1
Consumption of nutrient-poor, energy-dense foods tends to be associated with negative health outcomes 2 (Tapsell, 2016). Guidance about foods containing saturated fat, transfat, added sugars and sodium 3 varies, although specific dietary limits for saturated fat, added sugars and sodium are present in most of 4 these guidelines. Recommendations often emphasize choosing foods that are low in these food 5 components, such as lean meats and reduced-fat dairy foods, or choosing fewer foods containing high 6 amounts of them, such as sugar-sweetened beverages or high sodium processed foods. Brazil highlights 7 the important role these food components play in culinary preparation to improve the enjoyment of foods. 8 Because some foods that are important contributors of fibre and micronutrients may also be high in 9 energy, saturated fat or added sugars, reducing food sources of key underconsumed micronutrients to 10 reduce dietary energy, saturated fat or added sugars may lead to the unintended consequence of 11 lowering overall diet quality (Huth, 2013). Guidance about alcohol intake varies, though moderation is 12 generally recommended. 13
Choosing minimally processed foods or avoiding highly processed foods has been introduced as a way to 14 help build diets for health (Ministry of Health of Brazil, 2014). While it is prudent to limit foods that are 15 nutrient-poor and high-energy, processed foods (canned, pasteurized, dried, pickled, fermented) are an 16 important part of the food supply. A variety of foods that are processed to enhance safety, shelf-life, or 17 nutrient content (fortification or enrichment) may be included to expand access to nutritious foods (Eicher-18 Miller, 2012). Food processing can also improve palatability and nutrient bioavailability of staple foods. 19
Table 1 Recommended foods in selected evidence-based dietary guidelines 20
Country Foods to include To limit
2015 United States Dietary Guidelines
2015 US Department of Health and Human Services/ US Department of Agriculture, 8th edition
A variety of vegetables from all of the subgroups – dark green, red and orange, legumes (beans and peas), starchy and other
Fruits, especially whole fruits
Grains, at least half of which are whole grains
Fat-free or low-fat dairy, including milk, yoghurt, cheese and/or fortified soy beverages
A variety of protein foods, including seafood, lean meats and poultry, eggs, legumes (beans and peas), and nuts, seeds and soy products
Oils
Saturated fats
Transfats
Added sugars
Sodium
2014 Dietary Guidelines for the Brazilian Populations (Ministry of Health of Brazil)
Natural or minimally processed foods, in great variety, and mainly of plant origin, are the basis for diets. Variety means foods of all types – cereals, legumes, roots, tubers, vegetables, fruits, nuts, milk, eggs, meat – and diversity within each type – such as beans and lentils, rice and corn, potato and cassava, tomatoes and squash, orange and banana, chicken and fish.
Limit consumption of processed foods
Avoid consumption of ultra-processed foods
Use oils, fats, salt and sugars in small amounts when seasoning and cooking natural or minimally processed foods and to create culinary preparations
2013 Australian Dietary Guidelines (Commonwealth of Australia)
Plenty of vegetables, including different types and colours, and legumes/beans
Fruit
Grain (cereal) foods, mostly wholegrain and/or high cereal fibre varieties, such as breads, cereals, rice, pasta, noodles, polenta, couscous, oats, quinoa and barley
Lean meats and poultry, fish, eggs, tofu, nuts and seeds, and legumes/beans
Limit intake of foods containing
Saturated fat
Added salt
Added sugars and
Alcohol
Fujitsu
Nota
Should mention the dual role of meat in guidelines - more is needed by some consumers and less by others (a point emphasized in the recent Foresight Report)

HLPE DRAFT V0 (24 October 2016) – DO NOT CITE OR QUOTE
21
Milk, yoghurt, cheese and/or their alternatives, mostly reduced fat (reduced fat milks are not suitable for children under the age of two years)
2012 Nordic Nutrition Recommendations
2014 Nordic Council of Ministers, 5th edition
Increase:
Vegetables
Pulses
Fruits and berries
Fish and seafood
Nuts and seeds
Exchange:
Refined cereals for whole cereals
Butter for vegetable oils
Butter-based spreads for vegetable oil-based spreads
High-fat dairy for low-fat dairy
Limit:
Processed meat
Red meat
Beverages and foods with added sugar
Salt
Alcohol
Source: 1 2
1.2 Typologies of food systems 3
--To be developed for Version 1-- 4 5 Typologies of food systems are useful because they help policy-makers to categorize countries’ food 6 systems and explore their relationship to different outcomes (e.g. environmental, health, economic, etc.) 7 (Ericksen, 2010). While there are many described typologies of farming and agriculture systems (HLPE, 8 2016; IFPRI, 2015), there is only one example that has developed a set of food system typologies that 9 examine nutrition and diets (IFPRI, 2015). Here we build on the IFPRI (2015) classification by bringing 10 new data to bear and using a more statistically driven approach. 11
Typologies of food systems can be organized in several different ways (Ericksen, 2008); they can be 12 arranged by production systems, production diversity, technological advancement, global market 13 integration, etc. (IFPRI, 2015; HLPE, 2016). There is debate among different stakeholders as to what an 14 “ideal” food system looks like for nutrition and healthy diets, as ideality is dependent on stakeholders’ 15 outcome of interest (e.g. climate, undernutrition, obesity, food access). However, it is often argued that 16 “ideal” food systems often result in both low levels of malnutrition and efficient use of environmental 17 resources (IFPRI, 2015). In this report, we describe X# different categories of food systems that cover 18 both the food value chain and the food environment. They are: [list the identified typologies] (Figure 1.2). 19 We created these typologies to comprehensively describe the variation and breadth in different countries’ 20 unique food systems. 21
22

HLPE DRAFT V0 (24 October 2016) – DO NOT CITE OR QUOTE
22
Figure 1.2 RADAR CHARTS OF DIFFERENT FOOD SYSTEM TYPOLOGIES BASED ON 1
INDICATORS USED? AND EXAMPLES OF COUNTRIES FOR EACH TBD 2
3 To determine the typology of each country, we used a set of indicators representing the entire food 4 system, including key elements from the food value chain and food environments (Table 2). For each 5 element, we created a list of all possible indicators. To determine which indicator we would use, we 6 narrowed the indicator to indicators that had breadth (i.e. had data available for multiple low-, middle- and 7 high-income countries) and that were appropriate and comprehensive measures for the different 8 elements of food systems. The indicators identified do not include information related to outcomes on 9 health, diet or nutrition, and instead focus only on the drivers along the food value chain and food 10 environment. 11
Table 2 TENTATIVE Examples of indicators and data sources for each food system element 12
Food system element
Indicator Data source
Valu
e c
hain
Production Share of dietary energy supply derived from cereals roots and tubers ( percent)
Average Dietary Energy Supply Adequacy
percent Imported foods/total food supply
FAO STAT
FAO STAT
FAO STAT
Storage and distribution
Per capita food losses and waste at pre-consumption
percent urbanization
Road density
FAO STAT
UN DESA
FAO STAT
Processing and packaging
percent market sales of packaged/processed foods
Wheat fortification legistlation
Euromonitor
Global Nutrition Report
Retail and marketing
percent fresh food distributed by retail channels ( percent colume)
International advertisement investment
Euromonitor
Undetermined
Fo
od
en
vir
on
men
t
Food access Food insecurity experience scale
percent consumption outside the home
Gallup
World Bank
Food affordability Domestic food price volatility index
Food budget share
FAO STAT
Euromonitor
Food acceptability and preferences
Fujitsu
Nota
As a non-expert in food security I find this table incomprehensible in parts. Should it be a means of estimating the efficiency of the local food system for generating nutritious and sustainable diets? How can it do that? Is there no estimate of dietary diversity? Where do we find micronutrient adequacy? What does percent consumption outside the home indicate? What is the value of guidelines for diabetes if (for example) they are not properly implemented or we have no data on the incidence or increase of diabetes? How does it show us that diets are sustainable?
Fujitsu
Nota
This line needs filling! What consumer and consumption indicators will be suggested to balance the very strong supplyside emphasis of this table? (e.g. food knowledge and attitudes, changes in market food choices, actual dietary changes, existence of consumer pressure groups, changes in home F&V production). NOte that the information and guidelines in the following line are no indication of changes in practice. In any case, why are only diabetes and hypertension guidelines mentioned?

HLPE DRAFT V0 (24 October 2016) – DO NOT CITE OR QUOTE
23
Information and guideiines
Nutrition features in National Development Plans
Standardized national labelling system
Guidelines for management of diabetes and hypertension
Global Nutrition Report
Authors
Global Nutrition Report
Composition, quality and safety
Food safety indicator
percent calories from fruits and vegetables
Vegetable:animal protein availability
Global Food Security Index
FAO STAT
FAO STAT
1
By organizing food systems into different typologies, we can compare different outcomes for different food 2 system types. In Chapter 4, we use the typologies described above to explore the relationship of the 3 different food systems to different health, diet, nutrition and environmental outcomes (Include whichever 4 other outcomes we will examine). This allows countries to get an idea about how their respective food 5 system is doing, and gives country policy-makers and decision-makers information about anticipated 6 outcomes based on their countries’ food systems and, as a result, potential priorities for change. 7
8
1.3 Conclusion 9
Understanding the food system and its food environments is key to understanding how our diets are 10 changing and their impact on nutritional status. Many would consider the food system “broken” and in 11 need of repair but there are many diverse, intertwined drivers and many steps, actors and forces that 12 move food from production to consumption. This chapter provides a conceptual framework of that food 13 system and the environments in which consumers engage, and the typologies of food systems that could 14 be constructed for diets and nutrition. This report will focus squarely on this conceptual framework as its 15 guide to detail what is not working, what is working and where there is potential to improve. 16
17 18
Fujitsu
Nota
So can you show us how this evaluation mechanism would work?

HLPE DRAFT V0 (24 October 2016) – DO NOT CITE OR QUOTE
24
2 THE BURDEN 1
This section will outline the multiple burdens of malnutrition – undernutrition, overweight and obesity and 2 micronutrient malnutrition – and the health, economic and social equity impacts of these burdens on 3 society. 4
The term malnutrition can refer to both undernutrition and to overweight and obesity (as both indicate 5 inappropriate nutritional status, underlying deprivations and future health risks). Childhood malnutrition, 6 as a result of undernutrition, consists of underweight, stunting, wasting and deficiencies in essential 7 vitamins and minerals. Traditionally, undernutrition has been known to be prevalent in low- and middle-8 income countries (LMICs), whereas obesity was seen as an epidemic in wealthy countries. However, 9 overweight and obesity have recently been increasing in developing countries. In addition, micronutrient 10 deficiencies (sometimes known as the “hidden hunger”) such as iron or iodine deficiency are still 11 prevalent, indicating that many countries are struggling with multiple burdens of malnutrition. 12
Undernutrition, overweight or obesity and micronutrient deficiencies can coexist in countries, 13 communities, families and even in an individual. A child who is stunted and deficient in vitamins and 14 minerals can at the same time be overweight or obese. The coexistence of stunting and overweight 15 presents a unique programmatic challenge in countries where relatively high rates of both stunting and 16 overweight persist among the country’s under-five population. 17
Global trends in the prevalence of stunting and overweight among children under age five have moved in 18 opposite directions since 1990 (Figure 2). Compared with two decades ago, today there are 54 percent 19 more overweight children globally and 35 percent fewer stunted children. Since 1990, the number of 20 overweight children under five in low-income countries has nearly quadrupled, compared with a decrease 21 of 20 percent among upper-middle-income countries (UNICEF/WHO/World Bank, 2015). 22
Figure 2 Trends in child stunting versus the trends in child overweight (UNICEF Global 23
Database, to be updated with 2015 data) 24
25
26
With this background, clearly special attention to the existing multiple burdens of malnutrition is needed, 27 especially from a food systems perspective, as many of the drivers in the food system leading to 28 undernutrition in some individuals can lead to overnutrition in the same individuals or same communities. 29

HLPE DRAFT V0 (24 October 2016) – DO NOT CITE OR QUOTE
25
2.1 Undernutrition and its causes and consequences 1
Undernutrition jeopardizes survival, health, growth and development and significantly slows national 2 progress towards sustainable development goals. Unfortunately, undernutrition in its various forms is still 3 an invisible problem and is mostly manifested through its distal outcomes such as vulnerability to 4 infections, higher risk of chronic diseases and overall higher mortality and morbidity. Without action to 5 improve nutrition and prevent malnutrition, critical windows of opportunity will be lost for reducing more 6 than half of childhood deaths, significantly improving long-term well-being and productivity, and reducing 7 the burden of chronic diseases that are vastly affecting social and economic development of nations 8 (Black et al., 2013). 9
Undernutrition can manifest itself in different ways during an individual’s life cycle. Nutritional status is 10 most commonly assessed through measurement of anthropometrics (weight and height) against a 11 standard population, as well as through biochemical and clinical assessment (especially to assess 12 deficiencies in vitamins and minerals or “micronutrients”). There are three types of indicators that are 13 used to measure undernutrition most commonly in children under the age of five that are defined below. 14
Definition 6 Key indicators
Acute malnutrition: Measurement of undernutrition. Reflects a recent and severe process that
has led to substantial weight loss, usually associated with caloric deprivation and/or disease. Acute malnutrition can take on three forms: wasting (see definition below), bipedal pitting oedema and oedematous wasting, and includes moderate acute malnutrition (MAM) and severe acute malnutrition (SAM).
Chronic malnutrition: Chronic malnutrition occurs over time, unlike acute malnutrition. A child
who is stunted or chronically malnourished often appears to be normally proportioned but is actually shorter than normal for his/her age.
Stunting: Low height-for-age measurement used an indicator of chronic malnutrition,
calculated by comparing the height-for-age of a child with a reference population of well-nourished and healthy children (> -2 SD).
Wasting: Low weight-for-height measurement used as an indicator of acute malnutrition,
calculated by comparing the weight-for-height of a child with a reference population of well-nourished and healthy children or by measuring the mid-upper arm circumference of less than 115 mm.
Underweight: Low weight-for age measurement used as a composite indicator, calculated by
comparing weight-for age of a child with a reference population of well-nourished and healthy children.
15
Chronic malnutrition is defined as a form of growth failure that causes both physical and cognitive delays 16 in growth and development. Stunting, also known as linear growth failure, is defined as the inability to 17 attain potential height for a particular age, and is the most common measurement used to identify chronic 18 malnutrition. However, stunted growth is only one manifestation of chronic malnutrition. Compared with 19 children who have been given optimal opportunities to grow and develop, a chronically malnourished child 20 will be challenged to attain the same height, will likely not develop the same cognitive ability, and will 21 have higher risk of poor health outcomes throughout life. 22
All in all, despite all the impressive progress in addressing chronic malnutrition, currently a concerning 23 159 million children (23.8 percent) are stunted, (UNICEF/WHO/World Bank, 2015). The majority of 24 stunted children live in low- and middle-income countries, with the highest proportion in African countries, 25 where 35.6 percent of all children under five years are stunted, and the greatest absolute number in Asian 26 countries, where 95.8 million children under five years are stunted (UNICEF/WHO/World Bank. 2015). 27 Globally, over the last few decades, the prevalence of stunting has decreased. Three regions have 28 exceeded a 50 percent reduction in stunting prevalence (Figure 3) and, since 2000, have also achieved a 29 marked reduction in the urban–rural gap for stunting. The greatest declines in stunting prevalence 30 occurred in East Asia and the Pacific. This region experienced about a 70 percent reduction in prevalence 31
Fujitsu
Nota
This section is almost entirely based on child undernutrition. It is true that this is where most action and data are, but perhaps the bias needs more justification. Does undernutrition cease at age 5?,

HLPE DRAFT V0 (24 October 2016) – DO NOT CITE OR QUOTE
26
– from 42 percent in 1990 to 11 percent in 2015. However, it should be noted that this major reduction 1 was largely due to improvements made by China. The prevalence of stunting in China decreased from 2 more than 30 percent in 1990 to 10 percent in 2010. Latin America and the Caribbean also reduced 3 stunting prevalence by nearly half during this same period. The South Asia and Middle East and North 4 Africa regions have both achieved more than a one-third reduction in stunting prevalence since 1990. 5
However, prevalence of stunting in sub-Saharan Africa has remained stagnant compared with other 6 regions, from 47 percent in 1990 to 36 percent in 2015. Currently, 80 percent of the total number of 7 stunted children live in just 14 countries, including three countries with large populations India, Nigeria, 8 and Pakistan ( UNICEF/WHO/World Bank, 2015). In the four countries with the highest prevalence 9 (Timor-Leste, Burundi, the Niger and Madagascar), more than 50 percent of children under the age of five 10 are stunted. These countries have varied and contextual development challenges, which can broadly be 11 rooted in high poverty, conflict (past and current), and/or natural disasters. These challenges have an 12 impact on the likelihood of poor nutrition outcomes. 13
Figure 3 Percentage of children under five who are stunted, 2010–2015 14
15
Source: UNICEF Global Database (2015). 16 17
While stunting rates are increasingly recognized as a better indicator for chronic undernutrition, child 18 underweight rates have also been used to assess growth faltering in children worldwide. Since the 19 prevalence of underweight children under age five was an indicator to measure progress towards 20 Millennium Development Goal (MDG)1 (that aimed to halve the proportion of people who suffer from 21 hunger between 1990 and 2015), it is worthwhile to take a look at its trends and current situation. 22
Globally, 95 million children under age five were underweight in 2015. Underweight prevalence continues 23 to decline, but at a slow pace. Between 1990 and 2015, it decreased from 25 to 14.3 percent of the under 24 five population worldwide. 25
Like stunting, three regions, met or exceeded the MDG target in 2015: East Asia and the Pacific, Latin 26 America and the Caribbean, and Central and Eastern Europe and the Commonwealth of Independent 27 States (CEE/CIS) (Figure 4). The Middle East and North Africa were very close to the target. West and 28 Central Africa has experienced the smallest relative decrease, with an underweight prevalence of 22 29

HLPE DRAFT V0 (24 October 2016) – DO NOT CITE OR QUOTE
27
percent in 2015, down from 31 percent in 1990. Therefore, in sub-Saharan Africa, underweight 1 prevalence dropped only by 26 percent (rather than 50 percent, or being “halved” by 2015). 2
Examining the statistics as absolute numbers of children rather than percentages demonstrates an even 3 grimmer picture. While the total number of underweight children has reduced in East and Central Africa, 4 the number of underweight children has been on the rise in West and Central Africa. 5
Figure 4 Changes in number of underweight children under the age of five 6
7
Source: UNICEF Global Database (2015). 8 9
Furthermore, while countries make progress towards targets by decreasing underweight prevalence, 10 these declines may represent an accompanying transition towards a higher prevalence of overweight with 11 persistent levels of stunting. Some countries have low underweight prevalence but unacceptably high 12 stunting rates. For example, in Guatemala, Liberia, Malawi, Mozambique, Rwanda, the United Republic of 13 Tanzania and Zambia, child underweight prevalence is lower than 20 percent, while stunting prevalence 14 remains above 40 percent indicating that while some interventions may work for one type of burden, 15 different interventions are required for other burden types. Of the countries that achieved the MDG 1 by 16 2015, many still have high stunting rates. 17
Acute malnutrition, most often demonstrated by wasting, is frequently seen in temporary or cyclical 18 settings like emergencies, seasonal depressions, and highly-infectious-disease environments. Wasting in 19 children under five years of age has decreased 11 percent since 1990 (Black et al., 2013) but, still, 50 20 million children suffer (UNICEF/WHO/World Bank, 2015). The prevalence of wasting in South Asia is so 21 severe that it is approaching the level of a critical public health problem (Figure 5). While the number of 22 children with acute malnutrition (compared to chronic malnutrition measured as stunting) is smaller, 23 wasted children are at a higher risk of death due to common illnesses of childhood (Black et al., 2013). 24 There are specific, evidence-based protocols for the treatment of moderate and severe acute malnutrition 25 (Black et al., 2013). 26
27

HLPE DRAFT V0 (24 October 2016) – DO NOT CITE OR QUOTE
28
Figure 5 Wasting prevalence worldwide 1
2
Source: UNICEF (2015). 3
Child undernutrition is caused not just by the lack of adequate, nutritious food, but by frequent illness, 4 poor care practices and lack of access to health and other social services (Figure 6). These multifactorial 5 determinants were first outlined in UNICEF’s conceptual framework of child undernutrition more than two 6 decades ago (UNICEF, 1990). This framework remains as relevant today as when it was first developed, 7 being one of the most widely used frameworks for analysis and decision-making in the field of nutrition. 8 Identifying immediate, underlying and basic causes of undernutrition, the framework has evolved to 9 incorporate new knowledge and evidence on the causes, consequences and impacts of undernutrition 10 (UNICEF, 2013). 11
Immediate causes of undernutrition are inadequate dietary intake and frequent disease exposure, which 12 have a direct impact on a person’s nutritional status (Scrimshaw et al., 1968). A child’s dietary intake and 13 exposure to disease are affected by a number of underlying factors that affect households and 14 communities including: household food insecurity (lack of availability, access and/or utilization of a 15 diverse diet); inadequate care and feeding practices for children; unhealthy household and surrounding 16 environments; and inaccessible and often inadequate health care (UNICEF, 1990). Basic causes of poor 17 nutrition encompass the societal structures and processes that neglect human rights and perpetuate 18 poverty, as well as gender and societal inequalities, thereby limiting or denying the access of vulnerable 19 populations to essential resources. Social, economic and political factors can have long-term influence on 20 maternal and childhood undernutrition. Moreover, chronic undernutrition can lead to poverty, creating a 21 vicious cycle (Heltberg et al .,2013). 22
Stunted growth in early life increases the risk of overweight later in life. By preventing stunting, promoting 23 linear growth and preventing excessive weight gain in young children, we can reduce adult risk of 24 excessive weight gain and non-communicable diseases (Adair ,2013; Barker et al., 1998). 25
The consequences associated with undernutrition can be devastating. In the short term; undernutrition 26 increases the risk of mortality and morbidity, and in the longer term the consequences of stunting extend 27 to adulthood increasing risk of poor pregnancy outcomes, impaired cognition ability that results in poor 28 school performance, reduced economic productivity and earnings (Hoddinott et al., 2008), and future risk 29 of overweight and, subsequently, non-communicable diseases such as hypertension and cardiovascular 30 disease (Barker, 1997; Norris et al., 2012; Prentice, 2003; Sawaya et al., 2003; Uauy et al., 2011, Victora 31 et al., 2008). 32
33
Fujitsu
Nota
The UNICEF diagram has some limitations, in that (a) it deals only with children, (b) it deals only with undernutrition, (c) all the behavioural and attitudinal essentials are subsumed in "care", which does not seem the appropriate word for e.g. adolescents and adults, (d) "education" (or lack of it) is given as a basic cause, but the kind of education is not specified.

HLPE DRAFT V0 (24 October 2016) – DO NOT CITE OR QUOTE
29
Figure 6 Causes and consequences of maternal and child undernutrition 1
2
Source: UNICEF (2013). 3
Groups vulnerable to undernutrition typically include those with increased nutrient requirements 4 throughout the life cycle, but also those who often have less control over (or the privilege of) making food 5 choices and purchases. Young children, adolescent girls, pregnant and lactating women, and people who 6 are ill or immune-compromised are particularly vulnerable to poor nutritional outcomes (Black et al., 7 2008). Poor nutrition during the first year has important consequences into adulthood (Martorell et al., 8 2010; Adair et al., 2013). The nutritional needs of children under two years of age are critical for growth, 9 cognitive development and long-lasting productivity into adulthood (Victora et al., 2008). Most growth 10 faltering occurs between the ages of six and 24 months when the child is no longer protected by exclusive 11 breastfeeding and is more exposed to disease and infection through contaminated food or water. Some 12 evidence suggests that a child adequately nourished after 24 months of age is unlikely to recover growth 13 ”lost” in the first two years as a result of malnutrition (Shrimpton et al., 2001; Victora et al., 2010). 14
Adolescence is a period of rapid growth during which many important physical, intellectual and 15 psychological events take place. There is a pronounced increase in the nutritional demand rarely satisfied 16 in the poor, who carry the cumulative burden of past deprivation and lack of access to adequate nutrition 17 and sanitation. Nourished girls have earlier menarche and optimal growth, particularly height. Girls living 18 in poverty take longer to grow and are usually still growing during their first pregnancy and competing for 19 nutrients with the developing foetus (Prentice et al., 2013), resulting in potentially devastating outcomes 20 for both the young mother and her newborn child. 21
There are also increased nutrient needs during pregnancy and lactation. Inadequate food intake during 22 pregnancy can increase the risk of delivering an undernourished baby. During pregnancy, poor nutrition is 23 a common cause of intrauterine growth restriction and low birth weight (Black et al., 2008; Black et al., 24 2013). Newborns with low birth weight have greater mortality risk, are more frequently affected and less 25 resistant to infectious diseases during early postnatal life, and are candidates for future non-26 communicable diseases largely due to foetal programming (Godfrey and Barker, 2001). Maternal obesity 27 and excessive weight gain during pregnancy are also associated with socio-demographic, lifestyle and 28 genetic factors and with increased risks of adverse maternal, fetal and childhood outcomes (Gallard et al., 29 2013; Kramer et al., 1990). When mothers are breastfeeding they require extra energy, which they can 30 get from the reserves they have built up during pregnancy and from eating extra food after birth in optimal 31
Fujitsu
Nota
A final problem with the diagram is that the basic causes (so many and so broad) appear to be beyond the capacity of most nutrition-focused initiatives. Hence "education" of all kinds is included with the wide inequities of land ownership, income and employment. It cannot therefore show a role for food education except in the "care" prescribed for infants.
HLPE DRAFT V0 (24 October 2016) – DO NOT CITE OR QUOTE
30
environments where food is available and of nutritional quality (Black et al., 2008). Special attention is 1 needed in public health programmes to assure that vulnerable populations receive effective and at times 2 additional interventions to make up for the deprivations that affect them disproportionally and perpetuate 3 the vicious cycle of deprivation, malnutrition and poverty across generations. 4
2.2 Overweight and obesity and its causes and consequences 5
The International Obesity Task Force (IOTF) and WHO have declared obesity as the epidemic of the 6 twenty-first century because of its impact on morbidity-mortality, quality of life and associated healthcare 7 expenditures. Overweight and obesity are major determinants of non-communicable diseases (NCDs) 8 and, despite global efforts to address this problem, obesity trends are not moving in the right direction. 9 WHO acknowledges the role obesity plays on the development of the most prevalent NCDs: 10 cardiovascular disease (CVD), type 2 diabetes, musculoskeletal pathologies and a growing number of 11 certain cancers. The increasing rates of overweight and obesity worldwide are linked to a rise in NCDs –12 life-threatening conditions that are overburdening health systems. Excess bodyweight is also associated 13 with significant direct and indirect economic costs and a greater demand for social and health services 14 (medical check-ups, absenteeism, special needs, loss of autonomy, etc.) is also incurred. Excess body 15 weight also triggers the onset of disorders associated to self-esteem, body image and social interactions. 16
Definition 7 Body Mass Index (BMI).
A method to quantify the amount of solid tissue mass (muscle, fat and bone) in an individual, and then categorize that person as underweight, normal weight, overweight or obese based on that value. For adults (20 years and above) It is calculated by dividing weight in kilograms by height in metres squared. Both high and low indexes are associated with poor health. The normal range for a healthy adult is 18.5 to 24.9. 2 Combined Glossary of Terms A BMI below 18.5 is considered underweight, while one above 25–30 is considered overweight. A BMI greater than 30 is considered obese, and one greater than 40 is morbidly obese. BMI is an inexpensive and easy-to-perform method of screening for weight categories that may lead to health problems. BMI Formula: weight {(lb)/[height (in)]2 x 703} or for metric measurements weight (kg)/[height (m)]2 .
17 18 The worldwide prevalence of obesity (defined as a BMI ≥30) doubled between 1980 and 2008, to 9.8 19 percent among men and 13.8 percent among women – equivalent to more than half a billion obese 20 people worldwide (205 million men and 297 million women) (Figure 7) (Stevens et al., 2012, Finucane et 21 al., 2011). In addition, 950 million adults have a BMI of 25≤30, which may increase mortality risk by 22 around 11 percent. The United States of America has had the largest absolute increase in the number of 23 obese people since 1980, followed by China, Brazil and Mexico (Stevens et al., 2012). To date, the age-24 standardized mean BMI spans from less than 22 in some regions of sub-Saharan Africa and Asia to 30 to 25 35 in certain Pacific islands and countries in the Middle East and North Africa (Finucane et al., 2011). 26 Obesity prevalence ranges from less than 2 percent in Bangladesh to more than 60 percent in certain 27 Pacific islands. (Stevens et al., 2012, Ezzati and Riboli, 2013). 28
29

HLPE DRAFT V0 (24 October 2016) – DO NOT CITE OR QUOTE
31
Figure 7 Trends in the number of obese people, according to region 1
2
3
Source: Ezzati and Riboli (2013). 4
Currently, an overwhelming 2.1 billion people suffer from overweight and obesity globally, of which an 5 estimated 41 million children under five years of age are overweight. Two-thirds of those children reside 6 in low- and middle-income countries, which are confronted with the double burden of complex, 7 overlapping and interrelated malnutrition problems, with the combination of under-five stunting and 8 overweight and obesity being the most common (Figure 2.8). In Africa, the number of overweight or 9 obese children has nearly doubled from 5.4 million in 1990 to 10.6 million in 2014. Almost 50 percent of 10 children under five who were overweight or obese in 2014 lived in Asia. Overweight and obesity are 11 associated with more deaths globally than underweight. Globally, more people are obese than 12 underweight – and this can be seen in every region with the exception of parts of sub-Saharan Africa and 13 Asia. An updated analysis of obesity trends (NCD Risk Factor Collaboration, 2016) further delineates that 14 266 million men and 375 million women are obese. Recent reviews of socio-economic inequalities in 15 obesity suggest that as countries grow into high rates of development (i.e. countries with a GNI per capita 16 >USD12 275 or a Human Development Index > 0.80), obesity shows a clear shift to the economically 17 disadvantaged groups within those countries, at least among women (Dinsa et al., 2012). 18
NCDs presently constitute the most common cause of adult death and disability across the globe, 19 accounting for two out of every three deaths or 68 percent of worldwide mortality. Of the 38 million deaths 20 attributed to NCDs in 2012, an increase from 14.6 million in 2000,16 million (42 percent) were premature 21 and preventable. Globally, overall mortality among adults has declined in most countries with the 22 exception of Eastern Europe and parts of Africa where it has increased in the past decades. 23
Obesity increases the risk of over forty NCDs and associated disease risk factors, including diabetes, 24 cardiovascular disease and certain cancers. Currently, approximately 3.4 million deaths per year and 3.8 25 percent of the global burden of disease is attributed to excess weight, with diseases having low mortality 26 and lengthy periods of disability, such as diabetes and musculoskeletal diseases, comprising a proportion 27 of this burden (Lim et al., 2012). Adiposity-related chronic diseases, including type 2 diabetes, 28 cardiovascular diseases (CVDs) and cancers, cause more than 17 million global deaths each year 29 (Lozano et al., 2012). 30
31

HLPE DRAFT V0 (24 October 2016) – DO NOT CITE OR QUOTE
32
Figure 8 Deaths and burden of disease attributable to selected behavioural and dietary risk 1
factors in 2010 and the metabolic and physiological mediators of their hazardous 2
effects 3
4
Source: Ezzati et al. (2013). Note: High-income regions are Australasia, the Asia–Pacific region, North America 5 and western Europe. DALYs denotes disability-adjusted life-years. 6
7
Although infectious disease mortality has declined worldwide, as well as mortality from CVDs, the global 8 burden of these diseases has risen exponentially. Excess weight, sedentary lifestyles and dietary factors 9

HLPE DRAFT V0 (24 October 2016) – DO NOT CITE OR QUOTE
33
constitute some of the key risk factors leading to a large share of the global NCD burden by having a 1 direct impact through conditions such as high blood pressure or elevated blood glucose, among many 2 other elements (Figure 8). The figure depicts deaths (Panel A) and disease burden (Panel B) that are 3 attributable to the total effects of each individual risk factor. Overlap exists among the effects of risk 4 factors due to multicausality as well as the effects of certain risk factors (e.g. physical inactivity) are partly 5 mediated through other risk factors (e.g. high BMI). As such, the mortality and disease burden attributable 6 to individual risk factors cannot be summed up together. 7
In 2015, 415 million people were living with diabetes worldwide, representing 8.8 percent of the global 8 adult population (IDF, 2015). Approximately 75 percent lived in low- and middle-income countries. It is 9 expected that the prevalence will increase to 642 million by 2040, affecting one adult in ten. The 10 prevalence was higher in the North American and Caribbean countries (11.5 percent of the population), 11 followed by the Middle East and North Africa. Globally, there were more people with diabetes in urban 12 (269.7 million) than in rural (145.1 million) areas and the differences will increase by 2040. 13
Figure 9 Regional trends (1990–2013) of malnutrition in children under five years old 14
15
Source: UNICEF/WHO/World Bank (2015). 16
Since 2000, all the regions worldwide have suffered an increase in the number of deaths associated with 17 CVD. NCD deaths have increased in the Southeast Asian Region, from 6.7 million in 2000 to 8.5 million in 18 2012, and in the Western Pacific Region from 8.6 million to 10.9 million. In 2012, the age-standardized 19 NCD death rate was 539 per 100 000 population globally. The rate was 397 per 100 000 in high-income 20 countries and 625 per 100 000 in low-income countries and 673 per 100 000 lower-middle-income 21 countries. (WHO, 2014a). Premature death is a major consideration when evaluating the impact of NCDs 22 on the population, affecting especially low- and middle-income countries (82 percent), where 48 percent 23 of all NCD deaths are estimated to occur in people younger than 70 years. (WHO, 2014a). 24
The focus to reduce NCDs should be to reduce the incidence of the major risk factors such as high blood 25 pressure, unhealthy diets and physical inactivity. But it should also address other aspects such as 26 urbanization, migration and improved economic prosperity as well as the relationship between early 27 human development and the risk of NCD in later life (evaluating how certain aspects of the developmental 28 environment, such as the mother's diet or her body composition affect the risk of suffering diabetes or 29 being obese) (Hanson and Gluckman, 2015; Lelijveld et al., 2016). 30
Unhealthy diets, in particular excessive consumption of calories, salt, saturated fat and sugar, cause at 31 least 40 percent of all NCD mortality, and around one-fourth of all deaths globally (WHO, 2009). 32
Fujitsu
Nota
Balance: a very lengthy demonstration of the high incidence and growth of obesity and NCDs, but much less attention to the causes, and we need much more on the reasons for current poor obesogenic diets and lack of activity - sure it's eating habits and lifestyle, but what determines these? Could you include a UNICEF-type causal diagram for overweight?

HLPE DRAFT V0 (24 October 2016) – DO NOT CITE OR QUOTE
34
Moreover, physical inactivity caused 9 percent of premature mortality, or more than 5.3 million deaths 1 worldwide in 2008 (Lee et al., 2012). While energy-dense, nutrient-poor diets increase the risk of NCDs, 2 healthy diets can be protective against NCDs. Plant-based diets rich in fruits and vegetables can 3 decrease the risk of cardiovascular disease and several types of cancer. Breastfeeding diminishes the 4 risk of childhood obesity and may decrease the risk of ensuing diabetes. Moreover, breastfeeding can 5 directly benefit the mother, with nursing having been associated with a reduced risk of diabetes and 6 breast cancer. A summary of the main influences on major NCDs and obesity risk associated with diet 7 and physical activity as well as influences on other important NCDs are highlighted in Table 3. 8
Table 3 Summary of main nutrition and physical activity influences on major NCDs, obesity 9
and other important NCDs 10
Increases risk Decreases risk
Obesity
Sedentary behaviour High intake of energy-dense foods and beverages Micronutrient poor foods Heavy marketing of energy-dense foods and fast-food outlets High intake of sugar-sweetened soft drinks and fruit juices
Regular physical activity Diets high in fibre Being breastfed Home, community and school environments supporting healthy food choices for children
Type 2 diabetes
Overweight and obesity Abdominal obesity Physical inactivity
Voluntary weight loss in overweight people Physical activity High intake of dietary fibre from a variety of plant- based foods Mediterranean/vegetarian diet
Cardiovascular diseases
Trans fatty acids Saturated fats High salt intake, including from salt-preserved and processed foods Overweight and obesity
Regular physical activity Fish and fish oils Fruits and vegetables Diets high in fibre from a variety of plant-based foods Wholegrain cereals Nuts (unsalted) Plant sterols and stanols Polyunsaturated fats from plant sources Mediterranean diet
Diet-related cancers
Abdominal fatness and body fatness Red and processed meat Salt-preserved food and salt Arsenic in drinking water Aflatoxins
Physical activity Fruits and vegetables Diets high in fibre, vitamin C, beta-carotene, carotenoids and folate Lactation
Dental diseases
High or frequent consumption of free sugars Consumption of acidic soft drinks and juices
Hard cheese Sugar-free chewing gum Maintaining adequate Vitamin D status Adequate intake of fluorine
Osteoporosis Low body weight Maintaining adequate calcium intake and Vitamin D
status Physical activity
Source: Adapted from Joint WHO/FAO (2002). 11 12
Eating habits and lifestyle are the principal determinants for the appearance of NCDs (CVD, cancer, 13 obesity, diabetes, cognitive decline and neurodegenerative diseases, etc.). In this context, dietary 14 guidelines for health promotion have been based on diet patterns, foods and nutrients, as their 15
Fujitsu
Nota
Do we need this level of detail?

HLPE DRAFT V0 (24 October 2016) – DO NOT CITE OR QUOTE
35
consumption can be predictive of the risk for certain chronic diseases. Table 2.2 shows foods, nutrients 1 and diet patterns that have been associated with increased or decreased NCD risk in different 2 epidemiological studies. However, it is currently considered that the best estimation of the relationship 3 between diet and health consists of evaluating global dietary patterns and not in the analysis of the 4 effects of specific foods and nutrients. In this way, the synergistic effects of distinct food components can 5 be analysed, as well as other dimensions of diet such as cultural, economic and environmental 6 implications. 7
8
2.3 Micronutrient malnutrition and its causes and consequences 9
Micronutrient malnutrition is also known as “hidden hunger”, since it reflects nutritional deprivations that 10 may not be visible or even felt be individuals but can have devastating outcomes, leading to mental 11 impairment, poor health, low productivity and even death. These deficiencies are estimated to affect more 12 than 2 billion individuals worldwide and often they can co-exist with other forms of malnutrition (FAO, 13 IFAD and WFP, 2013). Their adverse effects on child health and survival are particularly acute, especially 14 within the first 1 000 days of a child’s life, from conception to the age of two, resulting in serious physical 15 and cognitive consequences (UNICEF, Tracking Progress on Child and Maternal Nutrition, 2015). 16
Even mild to moderate deficiencies can affect a person’s well-being and development. In addition to 17 affecting human health, hidden hunger can curtail socio-economic development, particularly in low- and 18 middle-income countries. While the status of vitamin A, iron and iodine are highlighted below (because of 19 the prevalence and their inclusion as World Health Assembly [WHA] Targets), other deficiencies such as 20 folate, zinc, vitamin D and B12, and several other key nutrients can also be important public health 21 threats that can be effectively targeted through food-based interventions. 22
2.3.1 Vitamin A deficiency 23
Vitamin A deficiency (VAD) is the leading cause of preventable blindness in children and increases the 24 risk of disease and death from severe infections. In pregnant women, VAD causes night blindness and 25 may increase the risk of maternal mortality. Vitamin A deficiency is still a public health problem in more 26 than half of the developing countries, especially in Africa and Southeast Asia. Figure 2.9 shows just a 27 snapshot of these deficiencies as measured by serum levels of the vitamin in preschool children. 28
In children, lack of vitamin A causes severe visual impairment and blindness, and significantly increases 29 the risk of severe illness, and even death, from such common childhood infections as diarrhoeal disease 30 and measles. For pregnant women in high-risk areas, VAD occurs especially during the last trimester 31 when demand by both the foetus and the mother is highest. The mother’s deficiency is demonstrated by 32 the high prevalence of night blindness during this period. While supplementation programmes have been 33 a major area of focus as a public health solution, increasingly more attention is needed to food-based 34 solutions such as fortification of foods as well as increasing availability, accessibility and affordability of 35 foods with high vitamin A in the diet. 36
37
Fujitsu
Nota
by
Fujitsu
Nota
A big issue under discussion by nutritionists is whether micronutrient deficiencies can be successfully dealt with piecemeal, or even through dietary supplements. I am not an expert here, I am just noting these trends in opinion.
Fujitsu
Nota
"the best estimation of the relationship between diet and health consists of evaluating global dietary patterns and not in theanalysis of specific foods and nutrients." However the text goes on to look in depth at 3 specific micronutrient deficiencies. Should there be more on dietary imbalances?

HLPE DRAFT V0 (24 October 2016) – DO NOT CITE OR QUOTE
36
Figure 10 Vitamin A deficiency mapped in preschool children 1
2
Source: WHO global VMNIS database (2016). 3
2.3.2 Iron deficiency and iron deficiency anaemia 4
Iron deficiency is estimated to affect about 25 percent of the world population, most of them among young 5 children and women. It is known as the most common nutritional deficiency in the world as it is the only 6 nutrient deficiency that is also significantly prevalent in industrialized countries (WHO Global Database on 7 Anaemia). Data availability on iron deficiency still poses a problem at the global level. Data show that a 8 staggering 2 billion people – over 30 percent of the world’s population – are anaemic, a clinical problem 9 that is due to a group of causes including but not limited to iron deficiency (a snapshot of anaemia 10 prevalence in preschool children is shown in Figure 11). When data are available, they show that a large 11 proportion of anaemia is due to iron deficiency. In resource-poor areas, this is frequently exacerbated by 12 infectious diseases. Malaria, HIV/AIDS, hookworm infestation, schistosomiasis and other infections such 13 as tuberculosis are particularly important factors contributing to the high prevalence of anaemia in some 14 areas. 15
16
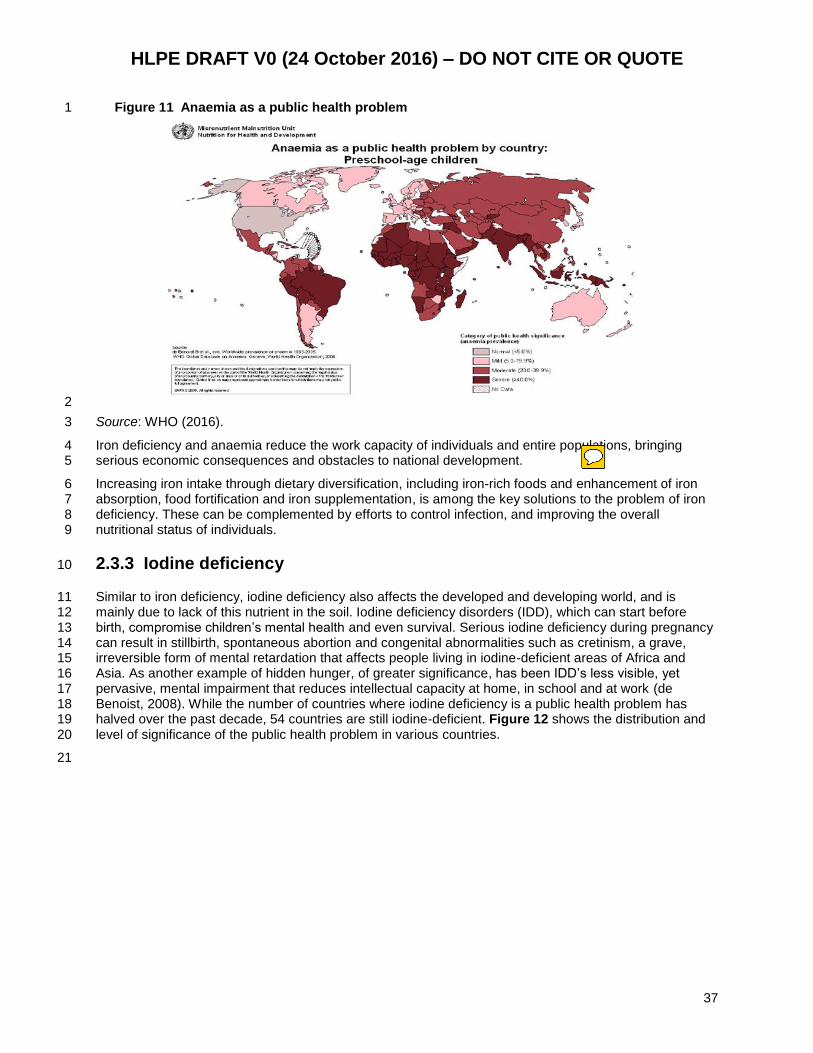
HLPE DRAFT V0 (24 October 2016) – DO NOT CITE OR QUOTE
37
Figure 11 Anaemia as a public health problem 1
2
Source: WHO (2016). 3
Iron deficiency and anaemia reduce the work capacity of individuals and entire populations, bringing 4 serious economic consequences and obstacles to national development. 5
Increasing iron intake through dietary diversification, including iron-rich foods and enhancement of iron 6 absorption, food fortification and iron supplementation, is among the key solutions to the problem of iron 7 deficiency. These can be complemented by efforts to control infection, and improving the overall 8 nutritional status of individuals. 9
2.3.3 Iodine deficiency 10
Similar to iron deficiency, iodine deficiency also affects the developed and developing world, and is 11 mainly due to lack of this nutrient in the soil. Iodine deficiency disorders (IDD), which can start before 12 birth, compromise children’s mental health and even survival. Serious iodine deficiency during pregnancy 13 can result in stillbirth, spontaneous abortion and congenital abnormalities such as cretinism, a grave, 14 irreversible form of mental retardation that affects people living in iodine-deficient areas of Africa and 15 Asia. As another example of hidden hunger, of greater significance, has been IDD’s less visible, yet 16 pervasive, mental impairment that reduces intellectual capacity at home, in school and at work (de 17 Benoist, 2008). While the number of countries where iodine deficiency is a public health problem has 18 halved over the past decade, 54 countries are still iodine-deficient. Figure 12 shows the distribution and 19 level of significance of the public health problem in various countries. 20
21
Fujitsu
Nota
Another major question about micronutrients is whether the best solutions are food-based.

HLPE DRAFT V0 (24 October 2016) – DO NOT CITE OR QUOTE
38
Figure 12 Public health significance of iodine deficiency in the world based on the urinary 1
iodine (UI) levels 2
3
Source: WHO Global Database (accessed 2016).4 4
Universal salt iodization has been one of the most successful public health nutrition programmes in the 5 past two decades and, according to WHO, elimination of iodine deficiency as the leading global cause of 6 brain damage will be considered as a “major public health triumph that ranks with getting rid of smallpox 7 and poliomyelitis” (WHO Global VMNIS Database, 2016). This is an example of an intervention that 8 needs to be continued once elimination has been achieved, since the soil compositions of the deficient 9 areas will not likely change in future. Therefore, food-based interventions such as fortification of salt and 10 other potential vehicles are needed to remain as sustainable programmes and be continued in future. 11
2.3.4 Other important micronutrient deficiencies 12
This section will be developed for Version 1. 13
14
2.4 Conclusion 15
This chapter outlined the multiple burdens of malnutrition, their causes and their consequences. While 16 undernutrition has been on the decline in many regions of the world, overweight and obesity along with 17 NCDs are on the rise everywhere. The causes and consequences of these burdens are debilitating to 18 countries and often the burdens interact and are associated with issues such as poverty, conflict and 19 inadequate infrastructure, including weak food systems to deliver healthy, nutritious commodities to 20 communities. 21
22
4 http://www.who.int/nutgrowthdb/en/

HLPE DRAFT V0 (24 October 2016) – DO NOT CITE OR QUOTE
39
3 DIETARY CHANGES AND THEIR DRIVERS 1
This chapter provides an overview of diets and the various drivers that explain and influence diets, all in 2 the context of food systems. Globally, diets have been changing in the last several decades. While some 3 of these changes have been positive towards healthier diets and more sustainable food systems, most of 4 the changes have been in the opposite direction. There are multiple factors that influence diets and food 5 systems including biophysical and environmental, political, economic, socio-cultural and demographic 6 drivers. In this chapter, these different drivers and their impact on diets and nutrition literature are 7 analysed. 8
3.1 Changing diets – what do diets look like currently? 9
To date, diets are often characterized with FAO food balance sheet data (e.g. Keats and Wiggins, 2014). 10 However, food balance sheet data measure food supply, not food intake. The best current data resource 11 for describing diets from around the world is the Global Dietary Database (GDD) that draws together 12 household surveys that measure actual diets. Though the data released to date do not include all food 13 groups, they are considered to be the best collation of diet data that is available5. 14
Analysis of the Global Dietary Database 2013 food intake data, reveals substantial variation in food 15 consumption in different regions (see Figure 13, Panels A and B). From Panel A we can see that fruit 16 consumption tends to increase from lower- to higher-income regions, while vegetable consumption 17 declines. Consumption of seafood omega fatty acids, present in fatty fish, is highest in Southeast Asia, 18 while consumption of dairy is highest in North America and Europe. From Panel B we can see that red 19 meat consumption is similar in East Asia, Latin America, North America and the EU15. Transfat intake is 20 highest in South Asia and the relative consumption of sugar-sweetened beverages is very high in Latin 21 America and North America. 22
Figure 13 Intake of key foods and diet components, by region, 2013 23
Panel A 24
25 26 27
5 See Global Panel Report on Food Systems (2016). Note that FAO and WHO are developing a Global Individual
Database on Food Intake (GIFT), which, once completed, promises to represent an additional valuable resource on diets. – Could this be in the text? In a Box? What is the timeline for this study? Are there some first results already available?

HLPE DRAFT V0 (24 October 2016) – DO NOT CITE OR QUOTE
40
Panel B 1
2 Source: Global Panel (2016). 3
3.1.1 Change over time 4
In general, the consumption of the foods and diet components in Panel A (the so-called “healthy” items) 5 has grown in all regions over the past decade and only about 5 percent show declines in a few areas 6 (Figure 14). However, there are some important differences across food types. Fruit consumption is 7 increasing in all regions, while vegetable consumption is increasing in only four out of seven. Intake of 8 whole grains is rising substantially only in Southeast Asia, while consumption of seafood omega 3 fatty 9 acids is declining in three out of seven regions. 10
Figure 14 Changes in intake of key foods and diet components by region, 1990–2013 ( percent) 11
Panel A 12
13
14
15

HLPE DRAFT V0 (24 October 2016) – DO NOT CITE OR QUOTE
41
Panel B 1
2 Source: Global Panel (2016). 3
The changes in consumption patterns for the foods and diet components in Panel B (the so-called 4 “unhealthy” items) are mixed (Figure 14). The picture for transfats is encouraging, with declines in all 5 regions. The United States’ Food and Drug Administration is in the process of banning transfat from their 6 food supply. Red meat consumption has declined everywhere except in East Asia where it has risen by 7 nearly 40 percent.6 Consumption of processed meat has risen in all regions, while sugar-sweetened 8 beverage consumption has risen in more than half of the regions, with the largest increase in North 9 America over the period. Changes in salt/sodium consumption have been minimal in all regions. 10
3.1.2 Changes with national income level 11
Analysis of the impact of income level on diet changes across countries in Figure 15 shows that as 12 countries get wealthier, the consumption of foods that are associated with high-quality diets (the so-called 13 “healthy” components) increases. But the consumption of those associated with low-quality diets 14 increases even more strongly. For example, as national income increases, the consumption of fruits, 15 seafood and milk increases as does the share of polyunsaturated fats, but vegetable consumption 16 declines as does fibre. Red meat consumption increases and so too does the consumption of less healthy 17 foods and diet components such as processed meat, sugar-sweetened beverages and sodium. The 18 consumption of transfats stays constant. While the effects on the overall quality of the diet are not clear, 19 Figure 3.3 illustrates the double-edged sword nature of income growth when it comes to diet quality. 20 Increased levels of income certainly enable higher quality diets, but they also enable lower quality diets. 21 22 23
6The decline in South and SE Asia and sub-Saharan Africa may reflect a substitution of red meat by other types of fresh meat, but the
current data do not allow this possibility assumption to be assessed. – Could we use FAO Food Balance sheets to see the domestic supply of white meat?

HLPE DRAFT V0 (24 October 2016) – DO NOT CITE OR QUOTE
42
Figure 15 Consumption of foods and other diet components by national income group, 2013 1
2 Source: Global Panel 2016 3
3.1.3 Diets of key population subgroups 4
The data from Tufts University’s Global Dietary Database are not available for different age and sex 5 groups and for some age groups, regular diet surveys may not cover their particular dietary needs. Yet as 6 the previous chapter outlined, there are some very important groups of individuals that have special 7 nutrition requirements throughout the life cycle. Here we draw on specialized data to fill the gap. 8 For infants under the age of six months, WHO recommends exclusive breastfeeding. The latest data from 9 the 2016 Global Nutrition Report indicate that only 41 percent of all babies in the world meet this 10 recommendation. 11
Definition 8 Complementary feeding indicators
Minimum dietary diversity (MDD): Proportion of children 6–23 months of age who receive foods from four or more food groups. Dietary diversity is a proxy for adequate micronutrient-density of foods. Dietary data from children 6–23 months of age in ten developing country sites have shown that consumption of foods from at least four food groups on the previous day would mean that in most populations, the child had a high likelihood of consuming at least one animal-sourced food and at least one fruit or vegetable, in addition to a staple food.
Minimum acceptable diet (MAD): Proportion of children 6–23 months of age who receive a minimum acceptable diet (apart from breast milk). Because appropriate feeding of children 6–23 months is multidimensional, it is important to have a composite indicator that tracks the extent to which multiple dimensions of adequate child feeding are being met. The minimum acceptable diet indicator combines standards of dietary diversity and feeding frequency by breastfeeding status. The indicator thus provides a useful way to track progress at simultaneously improving the key quality and quantity dimensions of children’s diets.
12 For infants and young children aged 6–23 months, WHO recommend that breastmilk consumption should 13 continue, complemented by the intake of foods that are sufficiently energy-dense and diverse to promote 14 optimal growth. Two indicator-thresholds are recommended by WHO to assess the diet quality of infants 15 and young children: the percentage of 6–23 month olds who attain a minimum diet diversity (MDD) and 16 the percentage who attain a minimum acceptable diet (MAD). Between them they measure diet quality for 17 this age group (IFPRI, 2014). 18
For low- and middle-income countries where data are available, the median percent of infants and young 19 children is low: an average of 28 percent of infants are consuming MDD in the 60 countries for which we 20 have data, and an average 15 percent of infants are consuming a MAD in the 50 countries for which data 21 are available (IFPRI, 2016). However, the range is wide for both indicators – between 5 and 90 percent 22
0
25
50
75
100
125
150
175
200
225
250
275
Fruits (g) Vegetables(g)
Wholegrains(g)
Seafood n-3s (g*100)
Milk (g) Nuts andseeds (g*10)
Fiber (g) PUFA (% ofenergy*10)
Red meat(g)
Processedmeat (g)
Sugar-Sw.beverages
(g)
Sodium(g*10)
Transfat (%of
energy*100)
Income group 1 (lowest) 2 3 4 Income group 5 (highest)
HLPE DRAFT V0 (24 October 2016) – DO NOT CITE OR QUOTE
43
and 3 and 72 percent, respectively, suggesting the potential for improvements even within a low- and 1 middle-income context. 2
The nutrition status of adolescent girls is at risk due to the loss of nutrients through the onset of 3 menstruation and as many of them get ready to become mothers. A recent major review of the quality of 4 diet of adolescent girls (10–20 years) in a wide range of low- and middle-income countries (Elliot et al., 5 2015) found that prevalence of inadequacy tends to be above 50 percet for iron, zinc, calcium, vitamin D, 6 folate, thiamin and riboflavin – micronutrients that are all vital for the good health of the young women and 7 any baby to which she may give birth. The authors conclude that: “cereal-based diets, with low 8 consumption of nutrient dense foods, characterize intakes across regions”. 9
Maternal nutrition is closely tracked because of the nutritional demands of pregnancy on women and 10 because of the consequences of poor maternal nutrition on their newborn children (Black et al., 2013). 11 However, few countries collect internationally comparable data on the quality of women’s diet. What we 12 have are from nationally representative surveys (demographic and health surveys) in a small number of 13 sub-Saharan countries (Kothari et al., 2014). These data show that most women in all six countries report 14 consumption of starchy staples, but less than 50 percent of women – for all six countries – consumed 15 legumes and nuts, vitamin A-rich fruits and vegetables, dairy or eggs during the preceding day. 16
Using these same data, analysis (Kothari et al., 2014) shows that higher socio-economic status was 17 associated with higher dietary diversity for women, showing an increased intake in the number of food 18 groups consumed, and more frequent consumption of fruits and vegetables, and animal-sourced foods 19 (meat, dairy and eggs). Interestingly, obese women, compared with thin women, had a greater amount of 20 dietary diversity, with particular increases in fruits and vegetables, and animal-sourced foods. As noted in 21 the previous section, rising incomes may simultaneously facilitate access to more diverse and nutrient-22 rich foods, as well as more energy-dense diets. This trend has also been reported elsewhere (Mayen et 23 al., 2014; Imamura et al., 2015). 24
3.2 Food system drivers that impact diets and nutrition 25
This section provides an overview of the major drivers of changes across foods systems and the 26 associated challenges and opportunities for diets and potentially health and nutrition outcomes. The 27 political, environmental, economic, social and technological drivers will be examined as well as the 28 interlinkages between them. 29
3.2.1 Biophysical and environmental drivers 30
Natural resource degradation and ecosystems 31
Food systems, and their respective outcomes with regard to diets and nutrition, are intimately tied to 32 natural resources, the environment and ecosystems (Pinstrup Anderson, 2011). Agriculture, which serves 33 as the bedrock of food systems, relies on natural resource capital in order to produce food. That function 34 can only continue if soils, water and land are sustainably managed. By doing so, food systems work in 35 tandem with ecosystem services that provide not only benefits to the larger nutrient recycling system but 36 also for human health (MA, 2005). 37
Definition 9 Ecosystem services
Ecosystem services are supporting services (e.g. nutrient cycling), provisioning services (e.g. food, water, fuel), regulating services (e.g climate and disease regulation) and cultural services
Source: MA (2005).
38
Humans are increasingly influencing ecosystems largely in negative ways, which is causing irreversible 39 changes to natural resourceso which we rely on for FSN (Whitmee et al., 2015). Forests, grasslands and 40
Fujitsu
Nota
Not sure how this section follows from the last....

HLPE DRAFT V0 (24 October 2016) – DO NOT CITE OR QUOTE
44
wetlands are being converted to farmland by humans to feed a growing population along with the animals 1 that we consume (Rangathan et al., 2016). This conversion is threatening many of the “planetary 2 boundaries” in which our Earth can sustain itself. The concept of “planetary boundaries” is designed to 3 define a “safe operating space for humanity” as a precondition for sustainable development. This concept 4 is based on scientific research that indicates that since the Industrial Revolution, human actions have 5 gradually become the main drivers of global environmental change (Whitmee et al., 2015). Scientists 6 assert that once human activity has passed certain tipping points, defined as these “planetary 7 boundaries,” there is a risk of “irreversible and abrupt environmental change.” There are nine Earth 8 system processes, which have boundaries that, to the extent that they are not crossed, mark the safe 9 zone for the planet. However, because of human activities, many of which touch the food system, some 10 of these dangerous boundaries have already been crossed, while others are in imminent danger of being 11 crossed. One of the major boundaries already crossed is biodiversity loss and natural habitats that affect 12 finite water and nutrient flows (Rockstrom et al., 2009). 13
Throughout the course of human history, humans have used roughly 7 000 plant species as food in 14 addition to a wide array of animal, insect and other species including fungi, algae, yeasts and bacteria 15 (Wilson, 1992). A shared axiom of ecosystems, diets and nutrition is that, within certain ranges, diversity 16 enhances the health and function of complex biological systems (DeClerck, 2013; Khoury, 2014). In 17 ecosystems, species diversity has been shown to stimulate productivity, stability, ecosystem services and 18 resilience in natural and agricultural ecosystems (Gamfeldt et al., 2013). There are nutrient content 19 differences among varieties and breeds of the same species as well as differences between species 20 (Bennett et al., 2015). Likewise, variation in food species contributing to diets has been associated with 21 nutritional adequacy and food security (Steyn et al., 2006; Moursi et al., 2008; Arimond and Ruel, 2004; 22 Kennedy et al., 2005; Graham et al., 2007). 23
National food supplies are becoming increasingly homogeneous and dependent on a couple of truly 24 ”global crops”, including major cereals and oil crops (Khoury et al., 2014), and current agricultural 25 practices are moving further towards intensified monocultures, which increase grain yields in the short 26 term, but limit dietary and biological diversity (Graham et al., 2006; Negin et al., 2009; Khoury et al., 27 2014). Approximately 200 plant species and five animal species supply most of the foods consumed for 28 human nutrition at the global level (Groombridge and Jenkins, 2002; FAO, 2004). Wheat, rice and maize 29 alone contribute roughly 56 percent of the global dietary energy supply derived directly from plants 30 (Heywood et al., 2013). Figure 16 shows that a country’s food supply composition (in this figure, Belize, 31 Nepal, Rwanda, Thailand and United Arab Emirates) is moving towards a more homogeneous state over 32 time from the 1960s to the present day (Khoury et al., 2014). This homogeneity of the food supply will 33 impact availability and access of a diverse set of foods that would attribute to dietary diversity and quality. 34
35

HLPE DRAFT V0 (24 October 2016) – DO NOT CITE OR QUOTE
45
Figure 16 The homogeneity of the world’s food supply 1
2
Source: Khoury et al. (2014). 3 Unsustainable management of land, water and other natural resources can lead to soil erosion, siltation in 4 watersheds, seasonal water scarcities and water-borne and insect vector–transmitted diseases, with 5 negative effects on agricultural yields and incomes as well as on nutrition and health. Studies have shown 6 that environmental degradation is associated with food insecurity and malnutrition and ecosystem types 7 are associated with infant mortality (drylands that offer limited ecosystem services tend to have high rates 8 of mortality) (MA, 2005). For example, one study in west Africa demonstrated that child mortality is 9 correlated with high soil degradation (Herforth, 2010). Industrial agriculture often requires fossil fuel-10 based inputs such as fertilizers and pesticides. If not managed appropriately, agriculture run-off can 11 contaminate soils, groundwater and streams with volatile organic compounds. This in turn can create 12 dead zones, which have impacts on the ecosystems, economies and human health. Pesticide effects 13 have been shown to have impacts on neurological, respiratory and reproductive systems and some have 14 the potential to be carcinogenic (Landrigran and Benbrook, 2015; Pimentel, 2005). 15 16
Climate change 17
The world is experiencing climate change and, with that, increased severity and frequency of natural 18 disasters. Both floods and droughts will continue to occur but with less predictability and more intensity, 19 as the variability of climate systems increases (Hansen et al., 2007). These changes are likely to have the 20 greatest impact on the agricultural output of many low-resource regions, reducing yields of crops, soil 21 fertility, and forest and animal productivity, which may result in lower income, reduced climate resiliency 22 and, subsequently, decreased access to sufficient, nutrient-dense foods, impairing the nutritional status of 23 many low-income communities (Mason and Shrimpton, 2010). 24
Climate change is and will make it incredibly challenging to meet everyone’s FSN needs, particularly in 25 food-insecure areas. Those countries and communities in the southern tropics, which do not have 26 adaptation strategies in place, will likely see a reversal in gains in reducing undernutrition, and more food 27 insecurity. Even in the optimistic scenario, the number of malnourished children in 2050 increases from 28 76 million to 84 million, depending on climate change modelling (as measured by the average per capita 29 caloric consumption, female access to secondary education, the quality of maternal and child care and 30 health and sanitation) (Nelson et al., 2010). Some studies estimate an even greater impact, with stunting 31 increasing by as much as 30 percent as compared with a scenario in which climate is stable (Lloyd et al., 32 2011). Climate change and variability may eliminate much of the improvement in child malnourishment 33 levels that would occur in the absence of increased climate change and variability. 34
According to the 2014 International Panel for Climate Change (IPCC) report, the health of human 35 populations will be impacted by shifts in weather patterns and other aspects of climate change due to 36 alterations in temperature, precipitation and extreme weather events as well as ecological disruptions (i.e. 37

HLPE DRAFT V0 (24 October 2016) – DO NOT CITE OR QUOTE
46
changing patterns of disease vectors). The IPCC also showed that the effects of climate change on crop 1 and food production are currently evident in several regions of the world, particularly the abundance and 2 distribution of harvested aquatic species and aquaculture production systems in various parts of the 3 globe. These are expected to continue, with negative impacts on FSN for especially vulnerable people, 4 particularly in some tropical low- and middle-income countries. 5
There are, of course, downstream negative impacts on food security, health and nutrition outcomes, with 6 soil and water degradation, loss of biodiversity and reduction of ecosystems (including pollinators and 7 forests). Temperature and rainfall shifts also have human health impacts due to weather extremes such 8 as heat waves, droughts and floods. Land degradation, water issues, soil nutrient loss and eroding crop 9 genetic diversity threaten people’s present and future livelihoods as well as their nutritional status. 10
It is estimated that there will be a world with a medium-high climate change that will have an additional 11 25.2 million malnourished (shown as stunted) children compared with one without climate change 12 (Phalkey et al., 2014) (Table 4) ,with Africa having the most number of stunted children by 2050. WHO 13 (2015) indicates that undernutrition morbidity and mortality will increase with significant impacts on 14 undernutrition. By 2030, in South Asia and East Africa alone, 21 000 and 27 000 annual deaths of 15 children under five will be associated with undernourishment due to climate change globally. Furthermore, 16 climate change modelling shows reductions in global food availability with decreases in fruits and 17 vegetables and red meat consumption by 2050. These reductions will potentially contribute to 529 000 18 more deaths (Springmann et al., 2016). 19
Table 4 Stunting projections with climate change 20
21
Models show that the nutritional content in some foods will decline, and for other foods increase due to 22 [CO2] fertilization effects, a consequence of increasing greenhouse gases (Smith et al., 2015) 23 (Figure 17). [CO2] fertilization effect is the idea that the larger amount of carbon dioxide in the 24 atmosphere that has resulted from rising anthropogenic emissions could promote the growth of plants 25 that use carbon dioxide during photosynthesis. Myers et al. (2014) found that elevated [CO2] was 26 associated with significant decreases in the concentrations of zinc and iron in all C3 grasses and 27 legumes, and protein was lower in C3 grasses and in wheat and rice grains. There was elevated [CO2] 28 associated with a small decrease in protein in field peas, and there was no significant effect in soybeans 29 or C4 crops. The nutritional quality of food and fodder, including protein and micronutrients, is negatively 30 affected by elevated [CO2], but these effects may be counteracted by effects of other aspects of climate 31 change. Myers et al. (2014) showed that there will be an increase in zinc deficiency with increased 32 elevated [CO2] (Figure 18). 33 34

HLPE DRAFT V0 (24 October 2016) – DO NOT CITE OR QUOTE
47
Figure 17 CO2 fertilization effects on nutrients of crops 1
2
3
Figure 18 Percentage increase in zinc deficiency in response to elevated atmospheric CO2 4
5
Climate drives the seasonal patterns of FSN – including the availability of micronutrient-rich foods, the 6 presence of infectious disease and patterns of human behaviour – to generate a complex series of 7 interacting effects (Devereux et al., 2013). This is particularly acute in regions where the rains are highly 8 seasonal and agriculture is rainfed. Seasonal food insecurity can lead to low diet diversity and a 9 concomitant insufficiency in dietary iron (Savy et al., 2006). Most of the world’s acute hunger and 10 undernutrition occurs not in conflicts and natural disasters but in the annual ‘‘hunger season”, the time of 11 year when the previous year’s harvest stocks have dwindled, food prices are high and jobs are scarce. 12 What happens during seasonal hunger and what happens in famine differs only in severity, but coping 13 sequences are similar (Devereaux, 2015). The link between them is causal, and leads to a chain of 14 shocks that leads to erosion of resilience. 15
HLPE DRAFT V0 (24 October 2016) – DO NOT CITE OR QUOTE
48
Food systems contribute 19–29 percent of global anthropogenic greenhouse gas (GHG) emissions, which 1 includes all aspects of a functional food supply chain, from agricultural production through processing, 2 distribution, retailing, home food preparation and waste (Vermeulen et al., 2012). Agricultural production, 3 including indirect emissions associated with land-cover change, contributes 80–86 percent of total food 4 system emissions, with significant regional variation (Garnett et al., 2013). Modelling indicates that the 5 impact of climate change on food systems will be widespread, geographically and temporally variable, 6 and influenced by socio-economic conditions. There is strong evidence that climate change will affect 7 agricultural yields and livelihoods, food prices, reliability of delivery, food quality and safety, which in turn 8 will have significant implications on human health (Vermeulen et al., 2012). 9
It is also clear that the way in which animal-source foods (ASF) are produced and consumed can impact 10 environmental and climactic triggers such as the intensification of methane production, which leads to 11 increases in GHG emissions, with ruminant animals having a bigger impact than those animals (e.g. fish 12 and chicken) whose place is lower on the food chain. That said, ruminants have the advantage of being 13 able to utilize pasture that would otherwise have no nutritional value (Stokstad, 2010). Of course, they are 14 not exclusively dependent on pastureland and, if they are fed concentrated feeds instead of being grazed, 15 they produce relatively small amounts of the GHG methane, so the issue of their environmental impact is 16 a complex one. Nevertheless, if current dietary trends continue at their present rate, they could by 2050 17 fuel an estimated 80 percent increase in global agricultural GHG emissions from food production and 18 global land clearing. Moreover, these dietary shifts are greatly increasing the incidence of NCDs. 19
Current ASF production systems and practices create substantial negative impacts on the environment 20 because of emissions of GHGs and other air pollutants, contamination of surface water and groundwater, 21 and degradation of ecosystem services (Ranganathan et al., 2016; Gerber et al., 2013). These impacts 22 arise directly from the animals (e.g. waste) and indirectly from the production of animal fodder (e.g. 23 clearing habitat for feed or pasture) (Bouwman et al., 2013; IPCC, 2014; Walker et al., 2005). In many 24 agricultural contexts, however, animals are positively valued as investments and sources of fertilizer and 25 energy (NAS, 2015; Steinfeld et al., 2006). The way in which ASF are produced can impact 26 environmental and climactic triggers such as the intensification of methane production, which leads to 27 increases in GHG emissions, with ruminant animals having a bigger impact than those animals (e.g. fish 28 and chicken) whose place is lower on the food chain. 29
Current ASF consumption patterns create substantial negative impacts on human and planetary health. 30 Diets high in ASF are generally more resource-intensive with regard to land, water and carbon footprints 31 (Ranganathan et al., 2016; Tilman and Clark, 2014). Figure 19 shows the GHG emissions per kilocalorie 32 for 22 different foods that make up four different diet types – omnivorous, Mediterranean, vegetarian and 33 pescatarian. Livestock and some types of fish sourcing have the highest GHG emissions. Our global food 34 system efficiently produces food in large quantities, yet malnutrition exists in almost every country (Fanzo, 35 2014; IFPRI, 2016; Popkin et al., 2012). Although countries are shifting from plant-based diets to more 36 ASF (Keats and Wiggins, 2014; Zeisel and daCosta, 2009), access to ASF by the poorest remains 37 limited. This limitation affects health because ASF provide nutrients that are more difficult to obtain in 38 adequate quantities from plant-sourced foods alone (Dewey and Adu-Afarwuah, 2008; Black et al., 2013). 39 Deficiencies of these nutrients lead to anaemia, rickets, blindness, impaired cognitive performance, 40 neuromuscular deficits, morbidity and mortality. In contrast, overconsumption of processed meats and 41 ASF high in saturated fats contributes to increased risk of obesity and NCDs (You and Henneberg, 2016; 42 Bouvard et al., 2015). 43
44

HLPE DRAFT V0 (24 October 2016) – DO NOT CITE OR QUOTE
49
Figure 19 Greenhouse gas emissions of food groups of different diet types 1
2 3
It cannot always be assumed that what is considered a healthy diet will always have lower GHG 4 emissions. With different combinations of food, it is possible to consume a diet that meets dietary 5 requirements for health, but has high GHG emissions (Macdiarmid, 2013). Foods should be examined 6 across a wider range of environmental indicators beyond just GHGs. Downs and Fanzo (2015) examined 7 the environmental impacts across carbon, water and ecological footprints of a cardio-protective diet. 8 While fruits, vegetables and whole grains all tend to have low carbon and water footprints, nuts and olive 9 oil have relatively higher water footprints and fish have a high ecological footprint. 10
3.2.2 Innovation and research drivers 11
Technology 12
Science and innovations serve as major drivers of food systems and large shifts in the access to 13 technology have had impacts on FSN (Pingali, 2012). The Industrial Revolution modernized agriculture 14 production through mechanization and new breeding. Technologies such as food processing and 15 preservation changed the way food could be stored and distributed. Transportation breakthroughs were 16 ushered in during the industrial age including improved roadways, railroads, ships and canal systems 17 (Hueston, 2012). 18
Global dietary changes, together with a decrease in activity levels – driven largely by increases in 19 sedentary job opportunities, increased the use of motorized transportation and decreased active 20 transportation (i.e. walking and cycling) likely due to insufficient infrastructure (e.g. sidewalks) and lack of 21 leisure time – have resulted in rising levels of obesity in many countries (including low- and middle-22 income) (Lenfant, 2001; Popkin and Du, 2003; Marshall, 2004; WHO, 2013; Laverty et al., 2015; Kohl et 23 al., 2012). Now, less energy is expended due to less labour-intensive occupations that come with 24 urbanization, as well as changes in transportation and leisure activities that involve more sedentary type 25 activities (Popkin, 2012). Food systems too have been profoundly altered by technology from production, 26 transport, marketing, media and advertising and the food service sector overall. 27
The need to produce increased quantities of healthier food will also need new technologies as mass 28 production is adopted (Boesrup et al., 1983). Some of these technologies would come with negative 29 effects on human health, but some positive. For instance, concentrated livestock production systems lead 30 to use of antibiotics in infection prevention, which will increase antimicrobial resistance in humans 31 (Ranganathan et al., 2016). However, there is need to understand which technologies are necessary, and 32 which are inappropriate for the food system and ensure non-maleficence. 33
34
Fujitsu
Nota
Seems to be some repetition in this para.

HLPE DRAFT V0 (24 October 2016) – DO NOT CITE OR QUOTE
50
Infrastructure 1
With urbanization, there is more focus on the infrastructure of food systems within cities. There is also 2 more focus on how infrastructures in rural sectors can be improved. The “built” environment, or 3 physical environment in relation to food systems, is evolving. This spans from built infrastructure of 4 physical activity (“walkability” and green spaces, land-use mix, transportation systems) as well as 5 infrastructure of the food environment (accessibility to different types of food outlets, types of markets 6 etc.). These types of infrastructure or built environments can favour unhealthy dietary patterns that can 7 impact public health (Oppert and Charreire, 2012). 8
Infrastructure is also key for rural development. Access to roads, which lead to markets, is often 9 underdeveloped, leaving many populations geographically isolated. “Food deserts” are often discussed in 10 terms of urban environments, but many rural areas in LMICs suffer the same fate with little access to buy 11 or sell healthy foods. Infrastructure that supports food storage, distribution, transport and trade is often 12 lacking in many rural areas. Ensuring proper storage of foods to reduce wastage, distributing food more 13 efficiently and ensuring that there are roads and adequate infrastructure in place to transport food can 14 help increase access to nutritious foods. For example, a dairy farming development assistance project in 15 Zambia – which aimed to reduce household food insecurity among vulnerable groups through increased 16 incomes generated from the sale of milk and other dairy-related products – improved storage and 17 transportation through technologies for milk aggregation and cooling (Swanson, 2009; Hawkes and Ruel, 18 2011). This led to improved availability of safe, high-quality, cooled milk through milk collection centres 19 and increased farmer profits, diet diversity and food security (Swanson, 2009; Hawkes and Ruel, 2011). 20
Social networks and movements 21
Social networks are another key driver of food systems. In the undernutrition context, for the last several 22 years, there has been a more substantive, unified advocacy response to ensure nutrition is a 23 development priority – a momentum spurred in part by many international organizations and governments 24 partnering to draw greater investments and attention to nutrition (UNICEF, 2013). International 25 organizations are prioritizing long-term investments towards nutrition programming and complementing 26 these with increased governance and management of multisectoral nutrition policies (SUN, 2013). 27 Nutrition has also become increasingly recognized at the highest political levels, with its inclusion in G8 28 meetings, the UN Decade of Action, and the UN Secretary-General’s Zero Hunger Call. The Copenhagen 29 Consensus, in both 2008 and 2012, chose nutrition as one of the best-valued investments to improve 30 overall development (Hoddinott et al., 2012; Horton et al., 2008). 31
The CFS has been critically important in elevating nutrition and food systems with a progressive 32
realization of the right to adequate food in the context of national food security. The Scaling up 33 Nutrition (SUN) movement was founded on the principle that all people have a right to food and good 34 nutrition. It unites people – from governments, civil society, the UN, donors, businesses and researchers 35 – in a collective effort to improve nutrition. SUN has also been an important catalyst in garnering country-36 level attention to the global malnutrition challenges with now 56 countries involved. The collective and 37 coordinated response of the international community during the past years, through multilateral 38 mechanisms as well as bilateral channels, is an implied acknowledgement that food and nutrition security 39 represents a global public good (Page, 2013). 40 41 There are also certain food movements that are driving change in certain countries through civil society 42 organizations (CSOs), or the general public. Brazil is an example of a strong CSO advocacy movement 43 that has driven change in the food system (Meijas Acosta and Fanzo, 2014). There are other such 44 grassroots movements that focus on the growing concern about our health and the current directions of a 45 globalized food system to Via Campesina movements across agriculture systems (Friedmann, 2005). 46
3.2.3 Political and economic drivers 47
Income, food prices and volatility 48

HLPE DRAFT V0 (24 October 2016) – DO NOT CITE OR QUOTE
51
On the demand side, income growth is an important driver of changes in diets. The effect on diets is even 1 stronger when income growth is combined with rising urbanization. The effects of urbanization are 2 discussed below in detail. This evidence is found in many countries ranging from China to Brazil, with the 3 exception of India where income increases do not necessarily result in increase in demand for ASF 4 protein, mainly due to cultural reasons (Tilman and Clark, 2014). In developed nations, with already 5 higher incomes per capita, per capita demand for ASF is higher compared with the poorer nations (Tilman 6 and Clark, 2014). 7
The poor spend the largest proportion of their incomes on food. Increases in food prices particularly affect 8 the poor adversely because a high proportion of their expenditure is on food with poor households in 9 developing countries spending 50–80 percent of their incomes on food (UN, 2011). As seen above, 10 people in LMIC countries have highly cereal-based diets with inadequate quantities of vegetables and 11 fruits. Income growth is seen to be playing an essential facilitating role in reducing malnutrition (Smith and 12 Haddad, 2015). 13
With projections that incomes and urbanization are going to increase with time, influence on global diets 14 could increase. It is projected that by 2030, about 3 billion more people will enter the global middle-class 15 and more than two-thirds of the global population will live in cities by 2050, which could come with 16 increased demand and consumption of more food and that based on animal products (Ranganathan et 17 al., 2016). Future diets are expected to be different. For instance, in the 2050s, people could be 18 consuming 15 percent more total calories and 11 percent more total protein driven by increased incomes 19 (Tilman and Clark, 2014). 20
Other drivers of diets that are associated with incomes are relative prices and price-based policies. In a 21 systematic review of 162 countries (Green et al., 2013), increases in the price of all foods resulted in 22 increased reductions in food consumption in low-income countries. In low- and high-income countries, a 1 23 percent increase in the price of cereals resulted in 0.6 and 0.4 percent reductions in consumption, 24 respectively. With a 1 percent increase in the price of meat, consumption reduced 0.78 and 0.60 percent. 25 These data demonstrate that with food price increases, consumers in poor or wealthy countries hold 26 back, but the poor are more affected by price changes. Diet is not the only compromise. Food prices have 27 been shown to also impact school attendance and health-care expenditures, which indirectly affect 28 nutrition outcomes (Thompson, 2009). Furthermore, healthier foods, in general, tend to be expensive and 29 those of lower socio-economic status are unable to afford healthy diets (Darmon and Drewnowski, 2015). 30
Evidence shows that changes in the relative price of food alter consumption behaviour (Wiggins et al., 31 2015). These authors find evidence that consumption patterns can change if relative prices of less 32 healthy foods and beverages significantly change. With evidence that prices of unhealthy foods are falling 33 further compared with healthy foods (Wiggins et al., 2015), we would expect increased consumption of 34 such foods. 35
Rising prices affect diets as the amount and type of food consumed are typically adjusted in response to 36 price levels. Further, it has been found that even more than food prices, food price volatility has a 37 negative effect on diets and nutrition. The year 2008 saw an unprecedented rise in prices of food 38 commodities including staples globally, with the cereal price index reaching a peak 2.8 times higher than 39 in 2000 (UN, 2011). This food crisis provoked a number of studies looking at its impact on food security, 40 nutrition and poverty. The World Bank estimated that the increase in the price of global food commodities 41 in 2008 pushed 100 million people into poverty and in 2010–11 an additional net increase in extreme 42 poverty of about 44 million people in low- and middle-income countries was experienced (World Bank, 43 2011). 44
The HLPE report on food price volatility argued that the impact of food price volatility on food security is 45 not fully understood. While there are studies, including by FAO, that show an increase in hungry and 46 undernourished people as a result of the 2008 global food crisis, there are others that point to flaws in 47 methodology. These argue that even though there was a spike in prices, a number of countries escaped 48 the negative impact of the rising prices on nutrition because of high economic growth and rising incomes 49 during the same period. So while it is difficult to get a global picture, evidence from different contexts 50 shows that there is a negative impact of food inflation at least in those contexts (HLPE, 2011). 51
Fujitsu
Nota
Could you also explain that in many cases HH income growth does not necessarily affect child nutrition status, and indicate the interaction with psychosocial factors in this respect?

HLPE DRAFT V0 (24 October 2016) – DO NOT CITE OR QUOTE
52
A study in ten low- and lower-middle income countries across 23 communities following the global food 1 crises found that one of the ways in which people were coping with the crisis was to shift to cheaper 2 foods, often moving towards more processed, packaged and purchased foods of different types. Women 3 in particular were doing more paid work than in the past and with less time available to feed the family 4 were resorting to the use of convenience food, in particular ready-made sauces and quick-cook staples. 5 This leads to children adopting all manner of processed foods (Scott-Villiers et al., 2016). Increased food 6 prices reduced the quality and quantity of food consumed among poor households who spend a large 7 proportion of their incomes on food (Sanogo, 2009, Swan, Hadley and Cichon, 2010) (Figure 20). Most 8 farmers also do not benefit from a rise in prices because less than 20 percent of food producers are net 9 sellers of food. Seventy-three percent of low-income countries are net food-importers and so are highly 10 vulnerable to food price rises. 11
Figure 20 Income spent on food 12
13
Source: Save the Children (2012). 14 15
Reduced quality of diets in turn has an adverse impact on both nutrition and health. Studies have shown 16 that increases in food prices can lead to higher levels of stunting among children (Martin-Prevel et.al., 17 2000) as well as decreased maternal micronutrient status and impaired growth of infants (Gitau et.al., 18 2005). 19
In Bangladesh, rice prices are associated positively with prevalence of undernutrition and negatively with 20 household non-grain food expenditures (Cambpell et al., 2010; Thorne-Lyman et al., 2010). Campbell et 21 al. (2010), based on the study of food expenditure data7 and anthropometry in Bangladesh, find that 22 households that spent a greater proportion on non-rice foods and less on rice had a lower prevalence of 23 maternal and child malnutrition. They argue that such an effect is exacerbated during times of high food 24 prices because in Bangladesh, when the food costs are high, poor rural families often end up purchasing 25 primarily rice. Torlesse et al. (2003) also find that in Bangladesh the prevalence of underweight children 26 decreased when people were able to spend more on non-rice foods as a result of a decline in rice prices. 27
7 Rice expenditure was used as a proxy of rice prices.

HLPE DRAFT V0 (24 October 2016) – DO NOT CITE OR QUOTE
53
Further, a 50 percent increase in rice prices translated approximately to a five percentage point increase 1 in the prevalence of children with a low weight-for-age. 2
Studies in India have also established the negative effects of food price rises on diets as well as 3 nutritional outcomes. As food prices rose from 2007–08 onwards, it was seen that the proportion of 4 incomes spent on food increased between 2005 and 2010 to 57 percent from 55 percent, reversing the 5 earlier trend of a declining proportion of total household expenditure being spent on food (Vellakal and 6 Raman, 2016). It was also seen that increasing food prices during this period reduced the quantity of 7 vegetables and fruits for the low-income population (Vellakal et al., 2015); high protein meat and dairy 8 products (Fledderjohann et al., 2016) were associated with an increased risk of malnutrition and morbidity 9 (Vellakal et al., 2015; Fledderjohann et al., 2016). 10
Devereux (2009) has studied the volatile effect of food market seasonality in Ghana, Namibia, Malawi and 11 Ethiopia and pointed out how damaging this price volatility is for nutrition. In Malawi, for example, the 12 causal linkage between maize prices and child malnutrition was dramatic: between October 2004 and 13 January 2005, during which time maize prices doubled, and admission for severe acute malnutrition 14 increased by a factor of 7, falling back when maize prices started decreasing. 15
Compton et al. (2010) found that the prevalence of underweight and wasting in young children went up by 16 about half in surveys in Bangladesh, Cambodia and Mauritania following food price rises (e.g. from 17 17 percent to 26 percent wasting in rural Bangladesh). Among the factors responsible were cutbacks in 18 special complementary (weaning) foods, as well as reduced consumption of more expensive and 19 nutritious foods. 20
Not only does food inflation affect diets and nutrition negatively, it is poorer households that already face 21 inadequate diets and a high burden of malnutrition that are disproportionately affected. A study in 22 Bangladesh on the impact of rise in food prices in 2008 found that while the wealthier households were 23 most likely to benefit from the increase in the price of key staples, the poorest households in the 24 community were worse off. Further, the gap between the richest and poorest households was wider in 25 2008 than in 2004 (Save the Children, 2009). 26
While this problem is definitely more intense in poorer countries, even the poor in advanced countries are 27 disproportionately affected by inflation (Nord, 2009). A study by Save the Children (2014) on child poverty 28 in the United Kingdom found that rising food costs put considerable pressure on the budgets of low-29 income families. On average, food comprises one-fifth of household expenditure, with the poorest 10 30 percent spending a quarter of their income on food. This study found that with the price of food rising by 31 19 percentage points more than the general price level between 2005 and 2014, the fall in real spending 32 on food since 2008 is by 9 percent. Further, families with young children cut back by 18 percent and 33 reduced the nutritional quality of food that they were eating in order to save money. 34
Most people living in urban and rural areas in developing countries are net food buyers (97 and 75 35 percent, respectively), meaning they buy more food than they sell. In developing countries, food 36 comprises a large share of household expenditure – up to 80 percent in some cases – so even small 37 price rises affect their ability to buy high-quality, nutritious food (Save the Children, 2012). 38
A report published by IFPRI highlighted the need to explore how countries and population groups in low-39 income countries are differentially affected by the rise in food prices. Countries that are net importers of 40 food are most likely to be affected by food-price rises (Von Grebmer et.al., 2015). A study by Save the 41 Children found that increases in prices affect importing countries more as each 10 percent increase in the 42 price of cereals and rice adds USD4.5 billion to the cereals import bill of net-importing developing 43 countries (Save the Children, 2012). Further, data from Save the Children’s 2012 Child Development 44 Index show that the average prevalence of underweight in countries identified as ”exposed” to food price 45 volatility is 23 percent. In ”highly exposed” countries, it is even higher, at 26 percent. This compares with 46 an average prevalence of underweight of 10 percent in countries not identified as exposed to food price 47 spikes (Save the Children, 2012). All 36 of the ”high malnutrition burden” countries, which together are 48 home to 90 percent of malnourished children, are among the most exposed to food prices. All but three of 49 these countries are net food importers, and families in these countries spend a very high proportion of 50 their expenditure (30–55 percent on average) on food, with the poorest people spending as much as 80 51 percent of their income on food. Fouere et al. (2000), based on a study of African countries in the context 52

HLPE DRAFT V0 (24 October 2016) – DO NOT CITE OR QUOTE
54
of increased food prices as a result of currency devaluation, find that the poor adjust by decreasing the 1 amount of fat and vegetables in meals, reduction in dietary diversity and skipping some meals. 2
Female-headed households are also more severely affected by high food prices. Women typically have 3 less access to land and agricultural services, so their ability to produce food is limited and they have to 4 rely more on market-bought food. And restricted access to credit and savings services means they are 5 less able to respond to increased pressure on household budgets (Save the Children, 2012; Compton et 6 al., 2010). 7
Food inflation is an important driver not only because of the direct impact it has on diets and nutrition but 8 also through the influence it has on livelihood and work patterns. Further, it is also crucial to understand 9 the reasons for food inflation as they are rooted within the food system itself, having an impact not just on 10 prices but directly on other aspects as well such as availability and sustainability in food production. 11
Trade and globalization 12
With trade, especially trade in food items being a significant component of trade as well as contributing a 13 large share of food consumed, the prevailing trade patterns and norms impact nutrition in a number of 14 ways. FAO (2015b) suggests four pathways through which trade and nutrition are linked. First, trade can 15 have an effect on food security by its impact on prices. The second pathway given by FAO (2015b) is 16 through the potential trade has to enhance the diversity of national diets by increasing the availability of 17 different types of foods. Third, trade enables lower food prices in theory because open trade allows 18 production of foods to switch from higher to lower cost producers. Finally, increased trade is associated 19 with rising incomes, which can provide government revenues and improve food access if trade positively 20 impacts employment for poor people. 21
However, in the real world these pathways do not always work in the way theory suggests they would. 22 For instance, the domestic economy is protected from global price fluctuations in cases of countries that 23 are less dependent on trade for food items. As seen below, net food-importing countries were most 24 affected by the global price volatility in 2008. Thus the way that trade affects net-exporting countries and 25 net-importing countries is different (Brooks and Matthews, 2015). Similarly, with a homogenization of the 26 food consumed across the world (especially in relation to staples) as a result of trade, there is an impact 27 on both diets and nutrition as well as production of food and food systems. Just eight countries 28 comprising 11 percent of the global population produced 70 percent of cereal exports during the past 29 decade. Whether trade allows for lower prices and, even if it does, how it impacts the livelihoods of local 30 producers are also questionable. It is clear that the effect trade has on FSN depends on the context and 31 the prevailing conditions and there is no universal solution. 32
Some of ways in which these pathways operate also have a direct impact on nutrition and not just on food 33 supply and incomes. For example, where trade results in lowering the prices of healthy foods (e.g. fruits, 34 fish) (Huang et al., 2010; Asche et al., 2015), there will be desirable nutritional impacts whereas when the 35 prices of foods that should be consumed in moderation (e.g. soft drinks and snacks) are reduced because 36 of trade, then it can be quite harmful (Hawkes, 2006; Stuckler et al., 2012; Schram et al., 2015).The 37 association of unhealthy eating with trade is one that has received particular attention owing to concerns 38 about excessive consumption of high-calorie snacks and drinks. Concerns have also been raised about 39 the impact of trade on the availability and promotion of breastmilk substitutes (Smith et al., 2014). 40
In 2014, the Rome Declaration on Nutrition called for “trade policies to be conducive to fostering food 41 security and nutrition for all” (FAO/WHO, 2014). Both nutrition and trade policy are included in the SDGs, 42 which call for greater coherence between policies in implementing the Goals. 43
Globalization also affects diets through different pathways. In so much as globalization leads to increase 44 in national incomes and urbanization, it contributes to a nutrition transition through its impact on changes 45 in ways of living and associated food demands. In addition, globalization enhances interconnectedness of 46 places and people through markets, human migration, and social and political institutions, which are 47 expected to lead to convergence in tastes and preferences including diets (Brunelle et al., 2014). 48
Trade and globalization could be very important tools to strengthen food production in developing 49 countries while also ensuring food security; however the history of international trade negotiations and the 50

HLPE DRAFT V0 (24 October 2016) – DO NOT CITE OR QUOTE
55
resulting rules framework has not been very positive in this regard. Since the General Agreement on 1 Tariffs and Trades (GATT), the trade policy in place restricts the kind of subsidies and trade policy 2 instruments countries can use. The categorization of agriculture-related subsidies into the green, amber 3 and blue boxes resulted in most of the subsidies (especially income support) given by the developed 4 countries (United States of America and the European Union, mainly) being placed in the green box 5 without any restrictions whereas instruments used by developing countries such as input subsidies, 6 tariffs, public procurement and stockholding operations have been placed in the amber box, with 7 subsidies in this box having caps on how high they can be. This has been possible because green box 8 subsidies are supposed to be non-trade-distorting as they are said to have a minimal effect on the market 9 or on world agricultural trade. Amber box, blue box and de minimis categories on the other hand are 10 supposed to be trade distorting as they are linked to production and prices (Khor, 2006). 11
It has been argued that the current trade policies are a hindrance to food sovereignty as they do not allow 12 developing countries to implement certain policies that they might have in response to food crisis. Further, 13 there is a bias in the trade policies towards strengthening larger corporations and allowing the dumping of 14 cheaper, imported products into developing countries. This could also skew the food systems towards 15 imported foods. This has an impact on local production, local livelihoods and dietary patterns that could 16 lead to undesirable nutritional outcomes (Madeley, 2000; Consumers International, 2000, FoE 17 International, 2003). For example, when India liberalized trade there was an increase in the import of 18 palm oil at cheaper rates, which replaced the different kinds of edible oils that people were earlier using, 19 which were also healthier (Hawkes, 2006). 20
It is in this context that the shrinking space for developing countries at the 10th Ministerial Conference of 21 the World Trade Organization (WTO) in Nairobi assumes importance. The contentious Doha 22 Development Round, with its promise of a single undertaking (SU) framework, has now been abandoned 23 without the resolution of the critical issues that developing countries are confronted with. It has been 24 argued that the WTO ministerial in Nairobi, if anything, has re-imposed the ”transatlantic hegemony of the 25 US and the EU” (Ravi Kanth, 2014) on the global trade order. The Nairobi package has implications for 26 policies affecting diets and nutrition in developing countries. 27
With the issue of the public stock holding still unresolved, countries will not be able to start new domestic 28 support programmes for food security, if existing programmes are in breach of the de minimis 29 requirements of the Aggregate Measure of Support (AMS), which are set to the reference prices of 1986–30 88. The refusal of the developed countries to an inflation index change in the reference price and 31 updating to current prices since food prices have risen by over 500 percent in the corresponding period 32 has presented issues since the inception of the WTO. 33
Similarly, the refusal by the developed countries to cede any ground to the developing countries for the 34 Special Products/SSM similarly has the potential for undermining the food security of developing 35 countries by discouraging local production of food grains and not allowing developing countries the policy 36 space to deal with a surge in imports. The refusal of the developed countries in Nairobi to make any 37 binding commitments to end domestic subsidies will continue to impact domestic production and export of 38 agriculture commodities, which has implications both ways on the nutrition of communities. First by 39 impacting local agriculture and food systems as developed country products would be more competitive 40 than local goods, and second because of the fall of incomes of producer families in developing countries, 41 which would impact local livelihoods and thereby the nutrition at the household level. 42
Trade policies encourage super-marketization and growth in availability of products of transnational food 43 corporations (TFCs). TFCs have an impact on the food-system by introducing new ways to sell and 44 promote foods, stimulating new forms of competition, thereby affecting the availability, accessibility, price 45 and desirability of foods not just from TFCs but from all actors in the food market. An increase in food 46 imports can have nutritional implications by altering food availability and/or prices, thus helping to shape 47 preferences (Chopra et al., 2002; Chopra, 2002). Whether food imports have actually changed the nature 48 of the food supply, rather than just substituting for foods previously produced domestically needs further 49 rigorous research. 50
Most studies that have attempted to analyse the impact of agricultural trade liberalization on food security 51 in development countries have not been able to arrive at a strong causal relationship either way because, 52

HLPE DRAFT V0 (24 October 2016) – DO NOT CITE OR QUOTE
56
in most cases, a number of other reforms were also put in place along with reforms in agriculture and 1 trade. It is therefore difficult to say how precisely trade liberalization had an impact on food security. In a 2 systematic review, it was found that of the 34 studies considered in detail, there was no clear consensus 3 on the effect that trade liberalization would have on food security. Thirteen of the 34 studies concluded 4 that food security would increase following trade liberalization, 10 that it would decline, and 11 that the 5 outcome would be more mixed and diverse. These studies used different metrics for food security and 6 trade liberalization. Further, most of the studies looked at net outcomes for food security and did not 7 consider distributional effects in relation to gender, between net consumers and producers, between 8 urban and rural regions and so on, which are important to reflect the true status of food security in a 9 country (Corriston et al., 2013). 10
Food policies and agriculture subsidies 11
Food and agricultural policies at the national and international level could have a positive or a negative 12 effect on nutrition. One of the ways in which policies around agriculture have an impact on nutrition is 13 through policies that have encouraged biofuels, with the intention of cutting down on the use of fossil 14 fuels. The strong global demand for biofuels led to the diversion of a large and increasing share of maize 15 (corn) to ethanol production in the United States of America, thereby resulting in a significant decline in 16 the availability of maize for consumption as food. This was one of the reasons for the rise in maize prices. 17 Maize is not only a staple food crop and the primary source of calories and nutrients for many but also 18 one of the most widely used crops for animals. Therefore the availability of maize had a direct impact on 19 its price as well as the price of dairy products, eggs and meats (Action Aid, 2012, Wise, 2012). 20
Policy can also play a role in diets and nutrition through the regulation of food prices/food commodity 21 markets. A future market in food commodities was also seen as one of the reasons for the increasing 22 food prices and price volatility during the 2007–08 food price crisis (UNCTAD, 2009; De Schutter, 2010). 23 While it was argued that the deregulation of commodity markets in the United States of America allowed a 24 rapid influx of large sums of money resulting in increasing prices on food commodity markets between 25 2002 and 2008 (UNCTAD, 2009), countries such as India banned futures trade in certain food 26 commodities as a response to inflation (Government of India, 2008). There is evidence that subsidizing 27 healthier foods increases their consumption significantly (Wiggins et al., 2015). 28
Direct food subsidy programmes are seen to have mixed results in terms of their impact on nutritional 29 outcomes. There are a number of studies related to the public distribution system (PDS) in India, which 30 show that access to subsidized grain through the PDS has had a positive impact on calorie consumption 31 as well as certain other sources of nutrition. On the other hand, a study by Kaushal and Muchomba 32 (2015) found that while the increase in income resulting from the subsidy increased consumption of the 33 subsidized grains and certain more expensive sources of nutrition, it lowered consumption of coarse 34 grains and increased expenditures on non-food items having no effect on nutrition in poor households. 35
In contrast, the debate in the United States of America regards the link between farm subsidies and 36 obesity. Several studies have suggested that overproduction of maize and soy, followed by excessive 37 consumption, is the prime cause of the increase in body mass index in the United States of America and 38 elsewhere (Putnam et al., 2002; Silventoinen et al., 2004). On the other hand, some have argued that it 39 cannot be established convincingly that agriculture subsidies have a role to play in impacting diets and 40 therefore obesity or overweight prevalence. Some argue that the dietary guidelines views on low-fat over 41 the last three decades have seen an increase in obesity due to the rise in sugar consumption as a 42 substitute. 43
The other set of policies/subsidies that has a direct impact on nutrition and diets are feeding programmes 44 – particularly school feeding and supplementary feeding programmes for school-going and pre-school 45 children. School meals world over have seen to have a positive influence on school attendance as well as 46 addressing hunger and improving diets among children. School meals are also an opportunity to influence 47 dietary practices by inculcating at a young age a habit of eating health foods. 48
Leadership 49
Fujitsu
Nota
Effects of school feeding on nutrition perhaps need more in-depth consideration. Some points are (a) that most SF programs do not make claims about measurable nutrition impact and the Global School Feeding Sourcebook indicates that very few SM programs have been evaluated for nutrition impact. (b) Short-term impacts on study performance are sometimes estimated, but long-term effects on HH diet or on students' own future food practices are not measured. (c) It is hard to see how good meals can actually change students' eating habits without involving parents etc.

HLPE DRAFT V0 (24 October 2016) – DO NOT CITE OR QUOTE
57
Political commitment and leadership are crucial factors in determining whether the right policy choices are 1 made towards strengthening food systems and changing diets towards improved nutrition for all. While 2 there might be consensus with regard to the essential interventions for nutrition based on scientific 3 evidence, the priority that these interventions receive and ensuring that they are seen through depend on 4 the leadership over issues. A number of studies have highlighted the role of leadership at the national and 5 global levels in bringing nutrition on to the agenda and making possible the adequate investments and 6 policies for nutrition (Shiffman, 2010; Shiffman and Smith, 2007; Nisbett et al., 2015). Leadership has also 7 been identified as a key factor in national level capacity for action (Bryce et al., 2008). 8
Such a political economy perspective is also seen in the Lancet Nutrition Series of 2008 where the paper 9 by Morris (2008) focused on the fragmented and dysfunctional ”international nutrition system” of actors 10 and agencies involved in development nutrition issues. This paper proposed several areas in which 11 improvements were needed including global ”stewardship” or leadership. Nisbett et al. (2014) highlights 12 the importance of political commitment as well as leadership, participation and accountability. Further, the 13 IFPRI (2016a) shows that the commitment to reduce hunger and commitment to improve nutrition are 14 only loosely linked and therefore the commitment is required for both hunger and nutrition. 15
3.2.4 Sociocultural drivers 16
Culture, religions and rituals 17
Social and cultural norms, religion and nutritional knowledge also influence diets and nutrition outcomes 18 (Tilman and Clark, 2014) and play important roles in diet and nutrition outcomes. Diets serve not only to 19 provide nourishment but also to provide pleasure heavily influenced by social traditions (Sobal et al., 20 1998). 21
Culture is inherent in agriculture. Food is the product of agriculture and can serve as a powerful lens to 22 how we tie ourselves to the land and preserve social traditions and culture. The types of foods people 23 consume, preparation and cooking practices, and the way foods are consumed and with whom and 24 where, are repositories of tradition that embody the values of cultures (Counihan and Van Esterik, 2013). 25 Food systems are consistently shaping our culture and traditions. 26
Taste, health, social status, cost and resources are all influencers of what foods we choose to eat, but 27 culture and tradition are also key factors (Pelto and Backstrand, 2003). Events also influence 28 consumption: social events and gatherings, holiday traditions, special occasions and religious or ritual 29 observances that call for special foods. But food choice can be deeply personal and often hinges on our 30 ideals, sense of identity and habits. Food itself is central to our sense of identity, often showing the 31 geography, diversity and hierarchy of a certain culture (Furst et al., 1996). 32
For instance, despite increases in income for India, consumption of animal-based proteins remains lower 33 when compared with other emerging economies, likely resulting from cultural and religious factors 34 (Ranganathan et al., 2016). At the same time, studies have shown that the majority of Indians are non-35 vegetarians and that the reason for the low consumption of meat is probably more economic than cultural. 36 In recent times, norms on eating meat, particularly beef, have become a political issue in India, with a 37 number of states banning the consumption of beef (Nair, 2016). 38
Food taboos are practised among most human societies. Most religions declare certain food items 39 appropriate and others unfit for human consumption. Dietary restrictions and rules may govern particular 40 phases across the lifespan (Meyer-Rochow, 2009). Many of these taboos occur during pregnancy and 41 lactation including appropriate food intake, energy expending activities and food restrictions. Cultural 42 perceptions of food behaviour and activity can have significant impacts on woman’s lives and their food 43 security and nutritional status. There are also food acceptability issues that can influence diets. 44
Gender 45
Gender relationships and norms are two of the most significant drivers of food environments and diets. 46 Women’s status influences diets and food systems both through women’s biological roles in giving birth to 47 children and breastfeeding them as well as their social roles in their household as the primary caregivers. 48 In most societies women are seen as being responsible for deciding what the household eats and 49 therefore access to information and knowledge on appropriate diets for women is critical. Women’s 50
Fujitsu
Nota
The points raised about policy and leadership in these two paragraphs could be refined. (a) Policies may be fine but may never be adequately implemented, (b) Good leadership may not prevail where there is lack of institutional capacity and public awareness.(c) Coherence in outside interventions and an attention to developing national capacity may be key.
Fujitsu
Nota
This section could be amplified. Some psycho-social factors which drive food actions are (a) the inertial power of habits and acquired skills: HH cooks pay a big price in changing food practices and learning new skills. (b) Family food practices as a drag on change, if dominated by men who are conservative about change, or if family members object. (c) time and convenience for HH cooks - big factors in the nutrition transition, (d) the values given to specific foods (e.g. F&V not seen as important, pulses are for the poor, soda drinks are young and glamorous.(e) lack of the general "health beliefs" which link diet and health, and the concept of preventive health, (f) the habit of changing practices, maintaining them and passing them on to the next generation (g) the practice of getting information, knowing where to get it, and acting on it. All these are widespread and influential, more so than specific food taboos.

HLPE DRAFT V0 (24 October 2016) – DO NOT CITE OR QUOTE
58
educational attainment therefore has a number of positive impacts on the quality of care and nutrition that 1 they themselves receive and that they give to their children (Ruel et al., 2013; Smith, 2003). Appropriate 2 dietary practices as well as hygiene and sanitation are all seen to be positively related to women’s 3 education levels (Guldan et al., 1993). 4
Women’s status within the household, the degree of gender equality and women’s empowerment are 5 widely recognized as important determinants of child undernutrition through their impact on such factors 6 as women’s control of their time and household income and on their mental health, confidence and self-7 esteem (Haddad and Smith, 2015; Bhagowalia et al., 2012; Smith et al., 2003). Women also invest a 8 greater proportion of their incomes on food (IFPRI, 2005). The Global Hunger Index report compares 9 indicators of gender discrimination and hunger and finds a high correlation. Gender disparities in access 10 to education and health show the strongest correlation with hunger statistics for the entire population 11 (IFPRI, 2009). 12
A cross-country study of developing countries covering the period 1970–1995 found that 43 percent of the 13 reduction of hunger that occurred was attributable to progress in women’s education. This was almost as 14 much as the combined effect on hunger reduction of increased food availability (26 percent) and 15 improvements to the health environment (19 percent) during that period. An additional 12 percent of the 16 reduction of hunger was attributable to increased life expectancy of women. Thus, fully 55 percent of the 17 gains against hunger in these countries during those 25 years were due to the improvement of women’s 18 situation within society (Smith and Haddad, 2000; ADB, 2013). 19
There are a number of other ways in which gender norms and relationships impact the diets and nutrition 20 of women and children. With care work seen as being women’s responsibility, women bear an unequal 21 burden of unpaid care work within the household. The unpaid care work that a woman is engaged in 22 affects the time available to her for other kinds of work, including paid work, and thereby has an impact on 23 the kind of diets a household can afford. Health and nutritional outcomes depend as much on child caring 24 – including breast-feeding, adequate storage and preparation of food, and hygiene practices – as on food 25 intake. Consequently, the provision in the household and the community of time, attention and support to 26 meet the physical, mental and social needs of the growing child and other family members becomes a 27 decisive factor in adequate nutrition. 28
Women being the primary care-providers, paid or outside-home work burdens of women, while bringing in 29 more income, might have a negative effect on the care received by the child (including breastfeeding, 30 complementary feeding) and thereby a negative impact on nutrition status as well (Gillepsie and Mason, 31 1990; Longhurst and Tomkins, 1995; Haddad and Oshaug, 1999; ADB, 2013). 32
One of the ways in which women are discriminated is in unequal access to resources, especially 33 ownership of land. It has been found that if women had the same access to productive resources as men, 34 they could increase yields on their farms by 20–30 percent. This could raise total agricultural output in 35 developing countries by 2.5–4 percent, which could in turn reduce the number of hungry people in the 36 world by 12–17 percent (FAO, 2010; ADB, 2013). 37
38
3.2.5 Demographic drivers 39
Population pressure, changing ages and urbanization 40
Assuming that our global food supply remains static with no positive technological ratchets (Boesrup, 41 2005) that would outpace a Malthusian fate, some estimate that present-day food supplies may not be 42 sufficient to feed the 9 billion people who will inhabit the earth by 2050 (Meadows et al., 2005). Although 43 there are enough food calories to provide for the current population, FAO classifies 784 million as 44 undernourished (FAO, 2016). Undernutrition is multicausal, with some attribution to inequitable 45 distribution, waste, loss and poor access to food in many parts of the world (Ehrlich et al., 2015). 46 Business-as-usual scenarios of population growth and food consumption patterns indicate that 47 agricultural production will need to increase by 70 percent by 2050 to meet global demand for food. Food 48 demand is projected to rise by at least 20 percent globally over the next 15 years, with the largest 49
Fujitsu
Nota
Can you give more information about the exact pathways to nutrition impact from women's education? Lines 20-28 seem to indicate that having more time and knowing what to do are key factors: how do these relate to "education" and what kind of education is involved (especially since most school education does not cover the knowhow described)? Are there intermediate factors like increased income, later marriage?

HLPE DRAFT V0 (24 October 2016) – DO NOT CITE OR QUOTE
59
increases projected in sub-Saharan Africa, South and East Asia (World Bank, 2015) (Figure 21). The 1 types of foods in demand are changing, with an increased appetite for animal-sourced foods, edible oils, 2 packaged foods and luxury brand items (Popkin et al., 2012). 3
To meet the demand for a more diverse appetite, food will need to reach more of the population and more 4 people living in more distant regions (Figure 3.10). While it may be easier to get food to urban centres 5 rather than rural due to poor infrastructure, Africa’s transition to urban centres will be slower, even with 6 decreasing farm sizes (Masters et al., 2015). Countries such as Malaysia, Senegal and Haiti are already 7 relying on foods grown in other places, while other countries are less reliant on imports and instead 8 produce much of their own food. One study showed that of the diversity of the food supply within a given 9 country, some countries produce a high amount of diversity through their own production whereas others 10 are reliant on imports to supply that diverse food supply (Remans et al., 2015). (Figure 22). Our food 11 systems need to get more sophisticated if we want to address the growing demand for foods, and food 12 that is more nutritious. 13
Figure 21 Food demand projects vs food production projections 14
15
Source: World Bank Development Report (2015). 16
17

HLPE DRAFT V0 (24 October 2016) – DO NOT CITE OR QUOTE
60
Figure 22 Production and supply diversity and imports 1
2
3
Source: Remans et al. (2015). 4
5
Urbanization can also have effects outside the combined effect with income. It causes a change in other 6 factors such as norms and attitudes about food, and it also increases the opportunity cost of time, as well 7 as demographic and technological changes such as more women entering the labour force and new 8 infrastructure that alter food preferences and open new opportunities (Seto and Ramankuty, 2016). 9
With projections that incomes and urbanization are going to increase with time, influence on global diets 10 will increase. It is projected that by 2030, about 3 billion more people will enter the global middle class 11 and more than two-thirds of the global population will live in cities by 2050, which will definitely come with 12 increased demand and consumption of more food and that based on animal products (Ranganathan et 13 al., 2016). Future diets are expected to be different. For instance, in the 2050s, people will be consuming 14 15 percent more total calories and 11 percent more total protein driven by increased incomes (Tilman and 15 Clark, 2014). 16
In addition, by 2020, individuals aged 60 and older will be greater in number than children under the age 17 of five. By 2050, the world’s older adult population will have doubled to 2 billion. This will put great strain 18 on health and food systems with the rise in the non-communicable disease burden (WHO, 2015). 19
While populations are increasing, so is overall wealth in some countries, particularly India, China and 20 Brazil, as well as certain countries of Africa. Diets are shifting increasingly towards nutrient-dense 21 products such as meat, dairy products and oils – but also towards more ultra-processed foods (Popkin et 22 al., 2012; Keats and Wiggins, 2014). The pressure to produce more food in an environmentally 23 sustainable way, while upholding safety and health standards, runs counter to these consumer demands. 24
The nutrition transition is described as a shift towards increased obesity and NCDs (Popkin, 1999) 25 (Figure 23). The first pattern, which is linked with hunter-gather societies and is often called the 26 Paleolithic pattern (but covers a longer period), was one in which the diet was very healthy, but infectious 27 diseases and other natural causes resulted in a very short life span. The second pattern, when modern 28
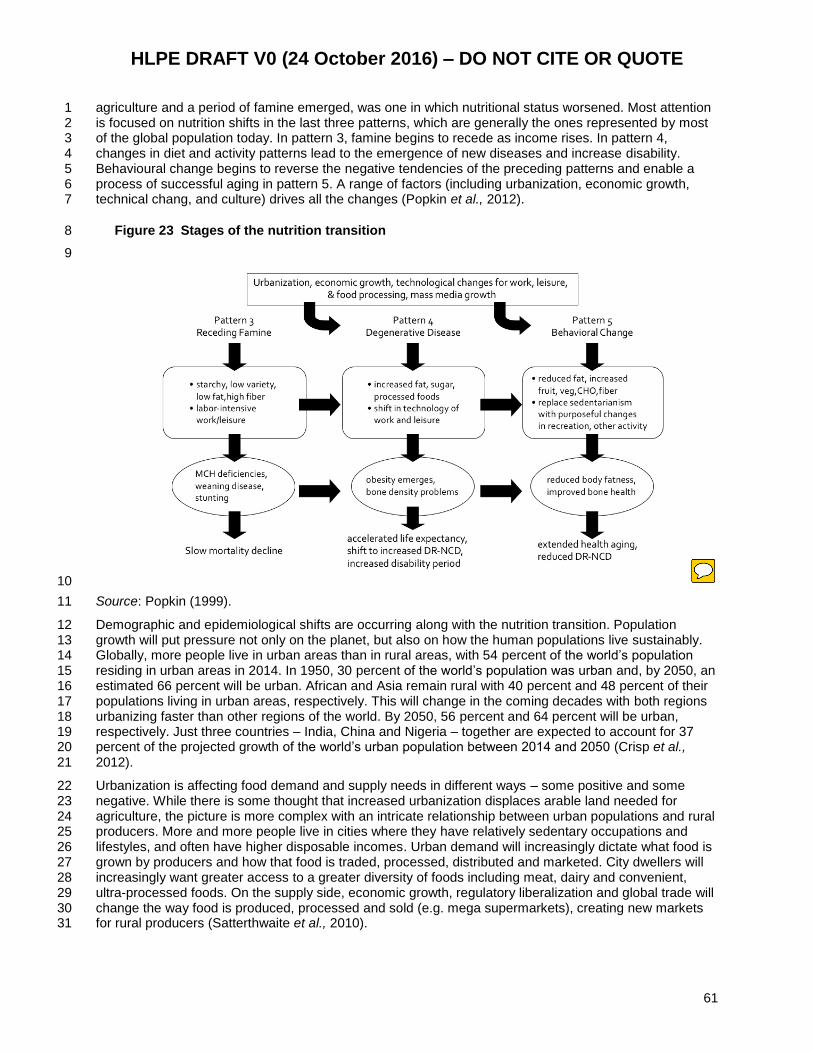
HLPE DRAFT V0 (24 October 2016) – DO NOT CITE OR QUOTE
61
agriculture and a period of famine emerged, was one in which nutritional status worsened. Most attention 1 is focused on nutrition shifts in the last three patterns, which are generally the ones represented by most 2 of the global population today. In pattern 3, famine begins to recede as income rises. In pattern 4, 3 changes in diet and activity patterns lead to the emergence of new diseases and increase disability. 4 Behavioural change begins to reverse the negative tendencies of the preceding patterns and enable a 5 process of successful aging in pattern 5. A range of factors (including urbanization, economic growth, 6 technical chang, and culture) drives all the changes (Popkin et al., 2012). 7
Figure 23 Stages of the nutrition transition 8
9
10
Source: Popkin (1999). 11
Demographic and epidemiological shifts are occurring along with the nutrition transition. Population 12 growth will put pressure not only on the planet, but also on how the human populations live sustainably. 13 Globally, more people live in urban areas than in rural areas, with 54 percent of the world’s population 14 residing in urban areas in 2014. In 1950, 30 percent of the world’s population was urban and, by 2050, an 15 estimated 66 percent will be urban. African and Asia remain rural with 40 percent and 48 percent of their 16 populations living in urban areas, respectively. This will change in the coming decades with both regions 17 urbanizing faster than other regions of the world. By 2050, 56 percent and 64 percent will be urban, 18 respectively. Just three countries – India, China and Nigeria – together are expected to account for 37 19 percent of the projected growth of the world’s urban population between 2014 and 2050 (Crisp et al., 20 2012). 21
Urbanization is affecting food demand and supply needs in different ways – some positive and some 22 negative. While there is some thought that increased urbanization displaces arable land needed for 23 agriculture, the picture is more complex with an intricate relationship between urban populations and rural 24 producers. More and more people live in cities where they have relatively sedentary occupations and 25 lifestyles, and often have higher disposable incomes. Urban demand will increasingly dictate what food is 26 grown by producers and how that food is traded, processed, distributed and marketed. City dwellers will 27 increasingly want greater access to a greater diversity of foods including meat, dairy and convenient, 28 ultra-processed foods. On the supply side, economic growth, regulatory liberalization and global trade will 29 change the way food is produced, processed and sold (e.g. mega supermarkets), creating new markets 30 for rural producers (Satterthwaite et al., 2010). 31
Fujitsu
Nota
Can we know if this scenario is widely accepted? Seems very optimistic and perhaps cued to western countries?

HLPE DRAFT V0 (24 October 2016) – DO NOT CITE OR QUOTE
62
Limited access to social services, safe and nutritious food, and poor public health infrastructure leave 1 urban shantytown populations at risk for both communicable and non-communicable diseases (Ghosh 2 and Shah, 2012; Popkin et al., 2012; Popkin, 2006). These shifts will require delicate decisions on how 3 much food should be produced, what type, where and how. Nutrition outcomes will surely be affected 4 without the proper planning, infrastructure, and health and social services that many of the lower- and 5 middle-income countries lack. 6
The food environment around us is altering how we make those choices and how we access, prepare and 7 consume food including the ever growing influence of supermarkets but also restaurants, vending 8 machines, small kiosks, bodegas and corner stores (Herforth and Ahmed, 2015; Mozaffarrian, 2016). Half 9 a century ago, most food was grown for household food consumption among smallholder farmers living in 10 rural areas. Food was also purchased at small, localized markets. Now, most food purchased by 11 consumers has travelled longer distances and is purchased in markets. These markets, whether they are 12 local, regional or international, are increasingly interconnected due to globalization and trade (REF). 13 These purchase patterns have been influenced by changes in food consumption patterns prompted by 14 rapid urbanization, income growth and expansion of modern retailers, processors and distributors. 15 Supermarkets have risen in many different areas and at a different pace, with Asia and Latin American 16 markets growing exponentially whereas Africa lags behind but is catching up (Minten and Reardon, 17 2008). 18
Food value chains in the developing world have undergone a rapid transformation in recent years. Only a 19 few decades ago, most food in these regions was grown by family farms located in rural areas and was 20 intended for local domestic consumption. Food was also purchased at small, local markets. This has 21 changed. Now, most food purchased by consumers in the middle- and high-income countries has 22 travelled longer distances and has touched several different actors across a food value chain. This has 23 been influenced by changes in food consumption patterns that have been prompted by rapid 24 urbanization, income growth and expansion on the part of modern retailers, processors and distributors. 25
Furthermore, increasing numbers of households are moving out of rural areas into urban centres, where 26 they make use of modern supermarkets and are diversifying their diets, sometimes with both positive and 27 negative consequences. The demand for more highly-valued, nutrient-rich products such as meats, dairy, 28 fruits and vegetables is growing. In addition, the markets for packaged, processed and ready-to-eat foods 29 are expanding. This category includes breakfast cereals, confectionary, ready-to-eat meals and 30 carbonated soft drinks. Rural populations also depend on food value chains for their food purchases 31 because most of them, including the very poor, are net-food buyers and are employed in the food sector 32 or in industries supporting farming (Downs and Fanzo, 2016). 33
With urbanization, there is also a rise in street food. "Street foods are a wide range of ready-to-eat foods 34 and beverages sold and sometimes prepared in public places, notably streets. Like fast foods, the final 35 preparation of street foods occurs when the customer orders the meal, which can be consumed where it 36 is purchased or taken away. Street foods and fast foods are low in cost compared with restaurant meals 37 and offer an attractive alternative to home-cooked food” (Winarno, 1986). These foods make a significant 38 contribution to nutrition. A systematic review found that daily energy intake from street foods in adults 39 ranged from 13 to 50 percent of energy, and up to 50 percent of protein requirements. In children, street 40 foods contributed to 13–40 percent of the energy needs for the day. It was also found that street foods 41 are composed of high intakes of saturated and transfats, sugar and salt (Steyn et al., 2014). There is also 42 a concern of increased risk of food-borne illnesses with the unsanitary conditions in storing and cooking 43 of the foods (Nonato et al., 2016). 44
Migration 45
Migration is increasingly becoming an underlying driver of destabilized, overtaxed food systems. There 46 are approximately 740 million migrants in the world, many of whom are on the move within their own 47 country rather than abroad. The most obvious is the out-migration from rural areas to urban centres due 48 to food insecurity, poverty, lack of rural employment and natural resource declines. In 2015, there were 49 244 million international migrants, representing an increase of 40 percent since 2000. They included 150 50 million migrant workers. About one-third of all international migrants are aged 15–34. Women account for 51

HLPE DRAFT V0 (24 October 2016) – DO NOT CITE OR QUOTE
63
almost half of all international migrants, many originating from rural areas (FAO,IFAD & WFP, 2015). 1
There is a growing concern regarding the number of children who are migrating due to conflict. UNICEF 2 (2016) estimates there are 50 million children who have been “uprooted.” In 2015 around 45 percent of all 3 child refugees under UNHCR’s protection came from the Syrian Arab Republic and Afghanistan. This 4 instability puts these children at increased risk of undernutrition due to a lack of access to social services 5 and health foods. “All aspects of health care, nutrition, water and sanitation, and social protection are 6 routinely disrupted or halted altogether as children and families move or spend extended periods in 7 displacement. Each of these can have devastating effects on individual families as well as the larger 8 communities in which they live” (UNICEF, 21016). There is also considerable concern about the impacts 9 of human-induced climate change on migration. McMichael (2014) indicates that climate change will 10 adversely affect food security in many regions, which may contribute to migration. One of the triggers of 11 this migration will be to find food sources that are more secure. However, the movement in the coming 12 decades due to climate change may also lead to more food insecurity in sites of settlement and 13 relocation. 14
Conflicts and social unrest 15
Countries and areas in protracted crisis are “environments in which a significant proportion of the 16 population is acutely vulnerable to death, disease and disruption of livelihoods over a prolonged period of 17 time” (Harmer and Macrae, 2004). Areas in protracted crisis and fragile states have some commonalities 18 including competition over natural resources, poor governance, poor access to health and social services, 19 dysfunctional institutions, loss of assets, food insecurity that impacts livelihoods and persistent hunger. 20
The trigger for violent conflict or crisis may be natural, such as a prolonged drought, or economic, such as 21 the change in price of a country’s major staple or cash crop. Whatever the reason, these crises are 22 causes and effects of food insecurity, and inadequate or inequitable access to assets. As well as being a 23 consequence of conflict, food insecurity can also lead to conflict (Brinkman et al., 2011). Environmental 24 scarcities and food insecurity do not always lead to conflict, but can elicit or escalate situations to violence 25 and conflict. 26
Most of the countries currently experiencing conflict are classified by FAO as "low-income, food-deficit,” 27 have high burdens of undernourishment and stunted children. FSN in complex crises has gained 28 increasing attention over the past decade. The growing acknowledgment is that complex crises have both 29 immediate and long-term consequences for nutritional status, inextricably linked to food insecurity and 30 attempts to respond (Egal ,2006). WHO reports that “Over the past two decades, the number of stunted 31 children in conflict-affected countries in the developing world increased from an estimated 97.5 million 32 (equivalent to 46 percent of all stunted children in developing countries) to 12.1 million (equivalent to 65 33 percent)” (Breisinger et al., 2015). Figure 24 shows those countries that see the most dramatic reductions 34 in stunting are those who are undergoing less conflict (green vs red) (Breisinger et al., 2012). 35
Figure 24 Reductions in stunting correlate with conflict 36
Fujitsu
Nota
Right, stunting goes down less in conditions of conflict, but maybe the heading should read "correlate negatively with conflict"?

HLPE DRAFT V0 (24 October 2016) – DO NOT CITE OR QUOTE
64
1
2
One instigator of conflict is rising food prices. Asia and Africa have become increasingly dependent on 3 food imports to feed their countries. The 20 most populated countries in Africa are net grain importers 4 (Hendrix, 2016). This dependence on imports leaves many countries vulnerable to rising food prices and 5 food price volatility. If food prices spike, this can shock the food system of some of these countries, 6 leaving them vulnerable to social unrest and conflicts. Hendrix demonstrated that food price-related 7 protests toppled governments in Haiti and Madagascar in 2007 and 2008. In 2010 and 2011, food prices 8 and grievances related to food policy were one of the major drivers of the Arab Spring (Hendrix, 2016) 9 (Figure 25). The causes of conflict and social unrest are many, but it is clear that “a hungry man, is an 10 angry man.” Figure 26 shows the correlation between hunger and violence in countries. As the 11 percentage of the hungry population declines, in most cases but not all, violence also declines (FAO, 12 2015). 13
Figure 25 Timing of increases in the food price index with food-related riots and protests 14
15
16 17 18

HLPE DRAFT V0 (24 October 2016) – DO NOT CITE OR QUOTE
65
Conflict impacts global food security as well. Geopolitical conflicts cross the borders of different food 1 systems. Fragile and failed nation-states are often suffering under the repression of extreme poverty and 2 are touched by war and conflict (OECD, 2007). These fragile states impact and are impacted by global 3 market forces and food security is often one of the first to be influenced (Quinn et al., 2014). 4
Food systems that are repeatedly put under stress by conflict tend to move from predictable food value 5 chains to instability and volatility. Violent, armed conflict can lead to the destruction of crops, livestock, 6 land and water systems, as well as disruptions in infrastructure such as roads and other transportation 7 modalities, markets and the human resources required for food production, processing, distribution and 8 safe consumption (Pingali et al., 2005). 9
Those participating or instigating war and conflict often use hunger as a weapon: “they use siege to cut 10 off food supplies and productive capacities, starve opposing populations into submission, and hijack food 11 aid intended for civilians” (Messer et al., 2012). 12
13
14 15

HLPE DRAFT V0 (24 October 2016) – DO NOT CITE OR QUOTE
66
Figure 26 Correlation between violence and hunger 1
2
Source: FAO (2015). 3
4
5
3.3 Food systems typologies and their impact on diets and nutrition 6
To be developed for Version 1. 7
8
3.4 Conclusion 9
Diets are changing across the world and these changes are both positive and negative. While the 10 consumption of ”healthy diets” is increasing, there is also an increase in consumption of some 11 components of ”unhealthy diets” in many parts of the world. There are a number of factors driving these 12 changes. Each of these can also have mixed effects and policy can be designed such that the negative 13 effects are addressed. This chapter looked at biophysical and environmental drivers, innovation and 14 research drivers, political and economic drivers as well as socio-cultural drivers affecting diets and 15 nutrition. These drivers are all important and are located differently in different food systems. The analysis 16 of these drivers shows that moving towards healthy diets and improved nutrition requires changes not just 17 in agriculture and food policy but also in economic policy, social norms, political leadership, etc. 18 19
20
21
HLPE DRAFT V0 (24 October 2016) – DO NOT CITE OR QUOTE
67
4 GARNERING QUALITY DIETS FROM SUSTAINABLE FOOD 1
SYSTEMS 2
Much has been presented in the first three chapters about food systems and environments, and how 3 these influence nutritional status and diets. While the picture may seem dismal and not fixable, there are 4 many promising avenues that are being tried, tested, piloted and scaled across programmes and policies. 5 In this section, we will highlight interesting case studies that are trying to address diets and nutrition 6 through the food system. We will also highlight future areas of promise including technology, institutions 7 and research that should be watched as we move into a new era of commitment for nutrition. We will also 8 address controversies that still need resolution. 9
10
4.1 Achieving sustainable and healthy food systems 11
This section provides an overview of the policies and programmes that have been shown to contribute to 12 healthy food systems by having a positive impact on the food system drivers, value chain activities and 13 actors or food environments. The section includes a rationale for focusing on the role of policies and 14 programmes to ensure that food systems deliver for nutrition, an overview of how food value chains and 15 the food environment can affect nutrition and diets, the criteria for selecting case studies and a series of 16 case studies demonstrating diet, nutrition and/or food security impacts of policies and programmes 17 targeting the different components of the food system. The section concludes with the identification of 18 gaps and areas where additional evidence is needed. 19
4.1.1 The rationale for focusing on policies, programmes and projects 20
The case studies presented in this chapter are focused on policies and programmes aimed at improving 21 diet, nutrition and/or food security outcomes. Policy is often conceptualized as the decisions taken by 22 those with responsibility for a given sector such as health, the environment, agriculture, trade, education, 23 etc. It can be made at various levels – in national or local governments, in multinational companies, local 24 businesses or organizations. For the purposes of this report, we adapt the definition of health policy by 25 Buse et al. (2012) (Box 8). 26
Definition 10 Food system policies
The courses of action (or inaction) that affect the institutions, organizations, services and funding arrangements of the food system.
27
The terms "policy", "programme" and "project" are progressively more specific in both time and place with 28 policies often being long term and crossing a broader domain, whereas programmes and projects are 29 often shorter in duration and more localized (Doran, 1995). Programmes are the embodiment of policies 30 and are what reach people through different mechanisms. Policies and programmes can all influence 31 FSN outcomes by addressing food system elements, activities and actors and food environments. They 32 have the ability to target national, regional and local populations. 33
There has been growing recognition that food system issues need to be better integrated into the goals 34 and design of programmes as well as into policy in an attempt to address malnutrition (Jones and Ejeta, 35 2016). Although there is strong evidence surrounding the nutrition-specific policies and programmes that 36 could improve nutrition outcomes (Bhutta et al., 2013), less is known about those that are nutrition-37 sensitive and tackle broader dimensions of the food systems (Ruel et al., 2013; Pinstrup-Andersen, 38 2013). 39
Fujitsu
Nota
Would it be possible to start this chapter with a summary of what needs changing in the food system, drawn from all the previous observations?

HLPE DRAFT V0 (24 October 2016) – DO NOT CITE OR QUOTE
68
4.1.2 A synthesis of how food value chains and the food environment 1
affect nutrition and diets 2
The way food is produced and moves along the value chain can affect nutrition and diets both positively 3 and negatively by creating both entry and exit points for nutrition along the chain. Value chains have been 4 highlighted as a potential way to leverage agriculture to improve nutrition, particularly with regard to 5 traditional value chains for micronutrient rich foods (Ruel et al., 2013). However, value chains need to be 6 considered more broadly in terms of the way in which all foods are produced, processed, distributed and 7 marketed and how these activities can affect the nutritional quality of the foods that are accessible, 8 affordable and acceptable within the food environment. 9
Food value chains can lead to nutrition entering the chain by increasing access to micronutrients (e.g. 10 biofortified crops, micronutrient fortification) as well as decreasing nutrients associated with diet-related 11 NCDs (e.g. transfat, sodium). They can also lead to nutrition exiting the chain when nutrients are removed 12 from a given food as it moves along the value chain. Figure 27 depicts the ways in which nutrition can 13 enter and exit the value chain. 14
Figure 27 Exit and entry points along the value chain for nutrition 15
16
Source: Downs and Fanzo (2016). 17
One of the key steps in the value chain that has an important role to play in terms of improving diets and 18 nutrition outcomes is food processing (Augustin et al., 2016). Food processing can help to reduce food 19 losses along the value chain, enhance preservation, nutrient content and the safety and shelf-life of foods 20 (Augustin et al., 2016) as well as improve palatability, nutrient bioavailability and convenience 21 (Mozaffarian et al., 2016). However, food processing can also lead to the exit of nutrition along the value 22 chain. More specifically, the potential harms of food processing include loss of nutrients such as fibre, 23 phenolics, minerals, healthy fatty acids and vitamins while also leading to the introduction of harmful 24 additions such as sodium, other preservatives, transfats and other compounds (Mozaffarian et al., 2016). 25
Following the processing of food, the way food is distributed, sold and marketed feeds into the food 26 environment in which consumers interact to make decisions about which foods to purchase and 27 subsequently consume. There are various incentives (and disincentives) that can help stimulate activity 28 among value chain actors to produce and consume more nutritious foods and many of the policies and 29 programmes discussed in section 4.1.4 are aimed at incentivizing the production, processing, distribution, 30 retailing and marketing of nutritious foods while simultaneously removing barriers for the movement of 31

HLPE DRAFT V0 (24 October 2016) – DO NOT CITE OR QUOTE
69
nutritious food along the value chain. Figure 4.2 provides an overview of interventions aimed at 1 increasing nutrition along the value chain. 2
Figure 28 Interventions aimed at increasing net nutrition along the value chain 3
4
Source: Downs and Fanzo (2016). 5
6
Figure 29 depicts the way in which value chains interface with the food environment and the potential 7 pathways to improve diets and nutrition. There are three main pathways in which value chains can 8 improve diets and nutrition outcomes, mediated through the food environment: (i) by increasing 9 consumption of nutritious foods; (ii) by decreasing consumption of less nutritious foods; and (iii) by 10 generating income, which enables consumers to purchase healthier foods. Entry points to educate and 11 raise awareness among the different actors in the value chain are also important in terms of stimulating 12 demand for nutritious foods. Economic constraints, lack of knowledge and information, and related lack of 13 demand for nutritious foods are also critical factors that limit access to nutritious foods. 14
Figure 29 The way in which value chains interface with the food environment and the potential 15
impact pathways to improve diets and nutrition 16
17
18
FoodEnvironmentsFoodaccess(physicalproximity)Foodaffordability(economic)Foodacceptability(behavior)Information&guidelines(education)Composition,branding&quality(preferences)
ProductionSystems
Farmers,agribusiness,land&plantationowners,fisheries,financialentities
Transporters,agribusiness,traders
Packingplants,foodindustry,SMEs
Retailers,markets,foodoutlets,distributors,restaurants,wholesalers
Retail,marketing&advertising
Processing&Packaging
Storage,Exchange&Distribution
FoodValueChain
Outcomes Impact
Changesinhealth
andnutritionstatus
Changesinincomeand
economicstatus
Changesinhealth&hygieneprac ces
Changesinfeedingprac ces
Changesinsalesandprofits
Changesinproduc onsystems
Changesinnutri on,dietsandknowledge
Changesinfoodquality,quan ty&safety
Changesinfoodacceptability
Changesinproduc onandpostharvestprac ces
Changesinmarket/storeaccess
Changesinnutrientcontentoffoods
ExamplesofpoliciesandprogramsaimedatimprovingthequalityofthefoodenvironmentBehaviorchangecommunication,socialmarketing,foodlabeling,pricingpolicies(taxesandsubsidies),nutritionguidelines,zoningpolicies,etc.
ExamplesofpoliciesandprogramsaimedatincreasingnutritionenteringthevaluevalueImprovementinproductionpractices,extension,biofortifica t i on ,improvedstorageanddistribution,foodfortification,productreformulation,etc.
Changesindiets
Changesinfoodpurchasing
Outcomes FoodEnvironment
ExamplesofpoliciesandprogramsthatcanleadtonutritionexitingthevaluechainSubsidiesforproductionoflessnutritiousfoods(e.g.,sugar,palmoil,etc.),tradeagreementsthatlimit‘policyspace’forpoliciesaimedatimprovingnutrition,etc.
ExamplesofpoliciesandprogramsthatcanleadtoanunhealthyfoodenvironmentNutritionguidelinesincongruentwithevidence,misleadinglabeling,unrestrictedmarketingoffoodandbeveragestochildren,etc.
Fujitsu
Nota
Nice diagram. Surely one of the main entry points for nutrition in the system will be consumer demand for healthier food? This is shown in the Conceptual Framework (Fig 1) in the arrow which carries consumer influences back along the bottom of the figure to affect all the parts of the food system. Can we maintain this cyclical picture?
Fujitsu
Nota
Generally, "knowledge and information", although essential, have been found inadequate to effect changes in food behaviour. Food educators would want to add other elements to the formula, such as "belief, practice and social support". The same applies to Fig. 29 below.
Fujitsu
Nota
entering the value chain?
Fujitsu
Nota
OK, if we accept that "information and guidelines" will effect changes in food purchasing, feeding practices, diets, knowledge (and belief, skills, motivation and social support). However the evidence is very strongly against this assumption: this theory of change would need to be supported.

HLPE DRAFT V0 (24 October 2016) – DO NOT CITE OR QUOTE
70
The food environment influences diets and nutrition by mediating food availability, access, affordability 1 and acceptability as well as information and guidelines, food composition, branding and quality. It is the 2 space that consumers interface with when making decisions about which foods to purchase and 3 subsequently consume. The lack of availability of a given food is the most basic tenet of the food 4 environment that affects dietary choices – in order for a food to be consumed it needs to be available 5 within the food supply (Herforth and Ahmed, 2015). The association between the availability and 6 consumption of food is bi-directional, with one influencing the other (Herforth and Ahmed, 2015). Studies 7 that have examined the role of the availability of food in shaping dietary intake have found a consistent 8 positive relationship between the availability of healthy food and its consumption (Caspi et al., 2012). 9 However, an inconsistent relationship between food accessibility (physical proximity) and dietary intake 10 has been found (Caspi et al., 2012). This can likely be attributed to the fact that many of the studies 11 examining food access use GIS-based measures and do not necessarily take into account how easy or 12 difficult it is for consumers to access markets that may be defined as accessible based on distance alone 13 (Caspi et al., 2012). Measures of food accessibility need to better account for the multiple dimensions of 14 access, including how long it takes consumers to access markets. 15
In order for consumers to be able to purchase and consume the foods that are available and accessible 16 within the food environment, they also need to be affordable. There is evidence from high-income as well 17 as low- and middle-income countries that suggests that healthier diets tend to be more expensive 18 (Drewnowski and Specter, 2004; Drewnowski, 2004; Rao et al., 2013). When prices of non-staple foods 19 increase, diet quality declines (Ahmed and Herforth, 2015). Moreover, lower regional food prices have 20 been associated with improved dietary health (Caspi et al., 2012). Lack of affordable nutritious food can 21 create a marked barrier to consumption. 22
In addition to food availability, access and affordability, the acceptability of food can also influence 23 consumer diets. Acceptability can be influenced by information, guidance and promotion of specific foods 24 and diets as well as consumer preferences (e.g. cultural preferences). These preferences can also be 25 influenced through advertising and marketing activities in the value chain as well as product branding, 26 particularly among children (Boyland and Halford, 2013). Food preferences are associated with dietary 27 intakes (Drewnoski and Hann, 1999) – consumers are more likely to consume the foods that they find to 28 be more acceptable. 29
4.1.3 Case studies of policies and programmes with evidence of impact 30
Criteria for case studies 31
Case studies were selected by conducting a literature search for policies and programmes that had 32 evidence of an impact on diet, nutrition and/or food security outcomes for each of the components of the 33 food system framework. In addition, we solicited case studies from experts in the field to identify and 34 compile additional case studies. The following criteria were used to select the case studies included in 35 this report. The case studies: (i) were in line with the conceptual framework of this report; (ii) were 36 published in peer reviewed or grey literature; (iii) had some evidence of impact; (iv) were from a variety of 37 geographical locations; and (v) included a diet, nutrition or food security outcome. A small number of 38 additional case studies that did not meet the aforementioned criteria but were deemed promising were 39 also included. These case studies were selected using the following criteria: (i) based on the conceptual 40 framework; (ii) demonstrated innovation; and (iii) included some indicator of positive outcomes. 41
Given the variability in the quality of the evaluations of the included case studies, a quality assessment 42 tool for quantitative studies developed by the Effective Public Health Practice Project was used to assess 43 the overall quality of the studies by evaluating selection bias, study design, confounders, blinding, data 44 collection methods, withdrawals and drop outs, intervention integrity and analyses (Armijo-Olivo et al., 45 2012). The quality rating for each of the case studies included in this section can be found in Appendix (x-46 note this hasn’t been completed yet). 47
The compiled case studies do not provide a comprehensive overview of all the possible policies and 48 programmes that could deliver improved/positive nutrition outcomes. The purpose is to provide examples 49 of options for policies and programmes aimed at promoting and strengthening healthy food systems. 50
Fujitsu
Nota
Need to mention that access and availability will increase consumption provided that the foods in question are valued and in demand. The experience of the Year of Pulses demonstrates the difficulties if they are not.
Fujitsu
Nota
So can prevailing perceptions of nutritious food and belief in its value to protect health. These amount to rather more than "acceptability". Please do include these factors in your analyses.
Fujitsu
Nota
Two criteria that have emerged as essential are (a) cost-effectiveness (especially for lower- and middle-income countries), and (b) "sustainability" of project impact (too many campaigns have a brief success which dies away quite rapidly).

HLPE DRAFT V0 (24 October 2016) – DO NOT CITE OR QUOTE
71
Moreover, there are several innovative policies, programmes and projects that are likely to have impacts 1 on diets, nutrition and/or food security but have not yet been evaluated. 2
3
Case studies 4
***The following case studies are being considered for inclusion in this report; however, it is 5 important to note that the case studies described below have not been finalized and are still being 6 reviewed by the High Level Panel of Experts. Not all of the case studies will be included in the 7 final report.*** 8
This section describes policies and programmes aimed at increasing nutrition entering and decreasing 9 nutrition exiting the value chain as well as improving the quality of the food environment to enable 10 consumers to make healthy food choices. It is organized according to the conceptual framework 11 described in Chapter 1. 12
Policies and programmes targeting food system drivers 13
Policies and programmes targeting food systems drivers have the potential to have a trickle down effect 14 on the system as a whole. They can be outcomes of the system as well as inputs. Case studies 15 highlighting policies and programmes targeting these elements and inputs are described below. 16
17
Biophysical and environmental drivers 18
Biophysical and environmental drivers can affect diets, and FSN by influencing the foods that are 19 available in our food system along with the quality of those foods. Although there is not an abundance of 20 policies or programmes targeting biophysical elements of the food system, there is some evidence to 21 suggest that climate change will significantly affect diets (Box 1), that forest landscape restoration can 22 improve food security (Box 2) and that maintaining biodiverse landscapes has the potential to improve 23 micronutrient intakes (Box 3). 24
Box 1 Global and regional health effects of future food production under climate change
A recent modelling study examining the effects of climate change on agriculture and the implications of these changes on dietary and weight-related risk factors, and associated excess mortality, was conducted for 155 world regions in the year 2050. The study linked the International Model for Policy Analysis of Agricultural Commodities and Trade (IMPACT) to a comparative risk assessment of changes in diets (fruit and vegetable and red meat consumption) and body weight on death due to CHD, stroke, cancer and all other causes combined. The model suggested that by 2050 climate change would lead to a 3.2 percent per person reduction in global food availability, a 4 percent reduction in fruit and vegetables and a 0.7 percent reduction in red meat consumption. The aforementioned changes would be associated with 529 000 climate-related deaths worldwide, which represents a 28 percent reduction in the number of deaths that could be avoided due to changes in dietary and weight related risk factors from 2010 to 2050. Twice as many climate-related deaths were associated with reductions in fruit and vegetable intakes as compared with those related to the prevalence of underweight.
Source: Springmann et al. (2016).
25
Box 2 Forest restoration interventions in Central Burkina Faso
An initiative to restore forests lands began in the early 2000s led by Tiipaalga (formerly NewTree) NGO in three provinces in central Burkina Faso: Kadiogo, Kourweogo and Oubritenga. As part of the programme, approximately three hectares of land at the household level were enclosed to allow the natural regeneration of woody and herbaceous vegetation in order to restore land productivity, forest resources and ecosystem services. A ten-metre strip around the perimeter of the enclosed area was cultivated to serve as a firebreak. The objectives of the project were to: (i) restore forest cover and (ii) create potential carbon storage with the view to improving resilience of smallholder farmers. Between May and July 2014, household surveys were conducted to ascertain information regarding land restoration interventions contributing to food security and
Fujitsu
Nota
Very nice project.

HLPE DRAFT V0 (24 October 2016) – DO NOT CITE OR QUOTE
72
improving regulation services such as soil fertility, erosion reduction, etc. Overall, 66 percent of interviewed households attributed high importance to the restored land in terms of contributing to food availability. The major food crops harvested from the restored lands were beans, groundnuts, honey, dry fodder, nuts and small wildlife, birds and rodents. Households reported that legumes and small rodents were mainly used for household consumption. In addition to households perceiving that the restored lands contributed to food security, the majority perceived strong improvements in soil fertility regeneration (92 percent), biodiversity (81 percent) and erosion reduction (89 percent).
Source: Cuc (2015).
1
Box 3 Biodiversity of local bananas in the Pacific Island countries
To be written
2
Political and economic drivers 3 Political and economic drivers can affect diets and FSN through a variety of mechanisms. Having good 4 governance is crucial in terms of laying the foundation to allow policies and programmes to be enacted, 5 implemented and enforced. When there is weak governance, several bottlenecks for improved nutrition 6 and strengthening food systems emerge (Bryce et al., 2011). Given that the policies and programmes that 7 are needed to promote healthy food systems cross various sectors having good governance is key – 8 Bangladesh (Box 4) and Brazil (Box 5) both provide examples of strengthening governance across 9 sectors to improve nutrition. Brazil is a country that has taken several steps to strengthen food and 10 nutrition governance, which has led to the development and implementation of several policies and 11 programmes that promote and support healthy food systems. 12
Having good governance helps to support the provision of social services. The social services and social 13 safety nets that a country provides can impact FSN outcomes and can make vulnerable populations more 14 resilient to shocks. Cash transfers (CTs), both conditional and unconditional, have been effective in terms 15 of improving nutrition outcomes (Lagarde et al., 2007; Bastagli et al., 2016). The majority of studies 16 examining the impact of CTs on diet and nutrition outcomes have found improvements in dietary diversity, 17 while a smaller number have shown improvements in anthropometric indicators (Bastagli et al., 2016). 18 However, given the shifts in the burden of disease from undernutrition to overweight and obesity, CT 19 programmes will need to be continuously monitored to ensure that there are no unintended 20 consequences regarding excessive weight gain. Box 6 provides an example of the impact of conditional 21 cash transfer in Mexico. 22
Box 4 Policy and investment frameworks for achieving MDG hunger targets: Bangladesh Experience
Bangladesh has made remarkable progress in reducing hunger. The MDG 1 targets for reducing prevalence of undernourishment and child underweight were met at 16.4 percent and 32.6 percent, respectively. The Bangladesh experience shows that the policy-making process, within a multistakeholder environment, can benefit from a strong link to participatory knowledge generation, information dissemination and consensus building. The process of developing, implementing and monitoring a comprehensive interministerial policy framework has contributed to a better identification of priorities and an increased knowledge and capacity for investment planning and monitoring. The National Food Policy Capacity Strengthening Programme has been instrumental in building Bangladesh’s institutional and human capacities to design and implement related policies. In 2006, Bangladesh adopted the National Food Policy and its associated Plan of Action for 2008–2015, and the Country Investment Plan in Agriculture, Food Security and Nutrition 2010–2015, to guide coherent efforts towards the MDG 1 hunger targets. This led to the articulation of a clear set of 26 multidimensional areas of interventions, flagging over 300 actions for 12 investment programmes covering nutrition-sensitive and specific areas. However, the establishment of this policy framework has been complex, requiring constructive multisectoral collaboration, inclusive solutions and wide consultation processes among the government, development partners, the private sector and civil society.
Fujitsu
Nota
Could mention that the nutrition effects of CTs are greatly enhanced by an element of food education- several studies demonstrate. .
Fujitsu
Nota
Indeed! A point which could come out more strongly throughout the document.

HLPE DRAFT V0 (24 October 2016) – DO NOT CITE OR QUOTE
73
Source: Lalita Bhattacharjee, FAO
1
Box 5 Good food and nutrition governance in Brazil
This case study presents the Brazilian experience of governance in FSN through the establishment of a national system that articulates public policies of different sectors whose main objective is the realization of the human right to adequate food. The National System of Food and Nutrition Security and Nutrition is an intersectoral system that has formal processes of participation and social control at the national, state and local levels that interacts with government bodies that articulate different sectors.
The improvement and coordination among programmes that have resulted in the strengthening of family agriculture, an increase in the quality of food and nutrition programmes such as the school meals programme, the drastic reduction of undernutrition that resulted in the removal of the country from the FAO Hunger Map and also the integration of actions for the prevention and control of all forms of malnutrition are outcomes of a process of articulated and intersectoral governance, based on social participation.
2
Box 5 Role of cash in conditional cash transfer programmes for child health, growth and development in Mexico
In 1998, low-income communities (n=506) in Mexico were randomly assigned to be a part of a conditional cash transfer (CCT) programme (Opportunidades) for a period of 18 months. The Opportunidades (formerly Progresa) cash transfer is in the form of either monthly fixed stipends conditional on family members obtaining preventive medical care with the intent to allow families to spend more on better food, or educational scholarships given to families of children starting the third grade in primary school, and is conditional on them attending school (minimum of 85 percent attendance) and not repeating a grade more than twice. In 2003, health, growth and development outcomes were assessed in children (n=2449) aged 24–68 months who had been enrolled in the programme for the duration of their lives. A doubling of cash transfers was associated with a lower prevalence of stunting, lower BMI for age percentile and a lower prevalence of being overweight. These children also did better in terms of motor development, cognitive development and with receptive language.
Although there were significant improvements in children, there were unintended consequences of the CCT programme among adults – a doubling of cash transfers was associated with an increased BMI, higher diastolic blood pressure and higher prevalence of overweight and obesity in participants.
Source: Fernald et al,( 2008a, 2008b).
3
Economic policies have significant implications for the food system. Trade policies impact the food that is 4 available and affordable within a given country and subsidies can shift production patterns and lead to 5 improvements in the way food is produced. Box 7 provides an example of how trade policy has been 6 used to reduce the availability of fatty meats in Pacific Island countries and how Ghana has used an 7 innovative policy approach to avoid repercussions of using trade policy to limit fatty meats from trade 8 partners. Box 8 describes how Malawi’s fertilizer subsidy coincided with improvements in FSN outcomes. 9
Box 6 The use of trade-related policy to reduce fatty meat availability in Samoa and Fiji
Trade-related policy has been used as a tool to try to address the “dumping” of fatty meats in the Pacific Island countries of Fiji and Samoa. In Fiji, the sale of mutton flaps was banned in February 2000. In August 2007, the Government of Samoa banned turkey tail imports given concerns related to their high fat content (32 percent). Both of these policies led to a sharp decline in the availability of these fatty meats. In Fiji, prior to the ban, 221 tonnes of mutton flaps were exported from New Zealand and by 2001 no flaps were exported from New Zealand; however, imports increased slowly to 115.1 tonnes by 2005. In Samoa, turkey tail imports ceased after the ban. A consumer survey conducted by the Samoan Nutrition Centre found that just under half of respondents shifted consumption from turkey tails to other cheap meats including chicken, sausage or mutton; however, approximately a quarter reported eating lower fat meat or seafood while a few
Fujitsu
Nota
2 box 5's
Fujitsu
Nota
Box7?

HLPE DRAFT V0 (24 October 2016) – DO NOT CITE OR QUOTE
74
respondents reported eating less meat due to the ban. Nevertheless, as part of Samoa’s accession to the WTO the ban on turkey tails was removed, given that it was considered a barrier to trade and has now been replaced by a 300 percent import duty.
Another alternative to using trade-related policy, which may lead to resistance from WTO members, is using food standard policy to limit fatty meats. Ghana implemented a food standards policy to limit the amount of fat in beef, mutton, pork and poultry in response to rising imports of low-quality meat associated with trade liberalization in the early 1990s. The standards were developed in response to health concerns related to fatty meat (particularly turkey tails) and the overall effect of the ban has been a reduction of high-fat meats (e.g. turkey tails and chicken feet) in the Ghanaian food supply. One of the strengths of this policy is that it is compliant with global trade law and much more likely than product-specific bans to be justifiable given that it does not discriminate between imports and domestically produced meats, and applies to the main types of meat sold.
Source: Thow et al. (2010 , 2014).
1
2
3
Box 7 Malawi’s fertilizer subsidy and its association with improvements in FSN
In 2005, the Government of Malawi introduced a Farm Input Subsidy Program (FISP) targeting smallholder farmers. Although there was an increase in maize production following the inception of the FISP, poverty levels remained stagnant. However, there is some evidence from panel data collected from the Third Integrated Household Survey from 2010 to 2011 to suggest improvements in food consumption and child nutrition since the programme began. More specifically, there has been an increase in weight-for-age and weight-for-height z-scores for households that received a FISP voucher. These households consumed a more balanced and diverse diet – they consumed more cereals, nuts, vegetables, meats and fruits but fewer root vegetables compared with those households that did not receive vouchers.
Source: Harou, under review
4
Innovation and research drivers 5
Strategies to improve infrastructure and develop and adopt novel technologies have the potential to have 6 marked impacts on food systems. Having access to infrastructure such as roads to get fruits and 7 vegetables and other nutrient-rich foods to the markets will subsequently increase consumer access to 8 those foods and increase the likelihood that people purchase and consume them. Using technology to 9 improve the quality of food also has the potential to improve diets. There is a role for technology from 10 inputs into agricultural production, all along the value chain right to the consumer level. For example, 11 biofortification of specific staple crop seeds has been successful in increasing micronutrient intakes (De 12 Moura et al., 2014; Salzman et al., 2016) and is likely to be cost-effective (Meenakshi et al., 2010). Box 9 13 provides a case study of the impact of biofortification in Uganda and India. 14
Investing in research and development (R&D) may be a key area for governments to focus on in terms of 15 identifying potential policies and programmes that could be scaled up to improve production practices 16 (Perez and Rosegrant, 2015) and the way food moves through the value chain, subsequently leading to 17 improvements in diets. For example, investment in R&D in the United States of America was a major 18 driver of productivity gains for staple crops (Fuglie and Heisey, 2007). Although the implications of these 19 increases in productivity may have had the unintended consequence of making highly processed foods 20 cheaper, investing in R&D for nutrient-rich crops such as fruits and vegetables could lead to 21 improvements in productivity, which has the potential to lead to improvements in access. However, there 22 is a dearth of evidence related to the impact of increased investment in R&D to improve production of 23 nutrient-rich crops given that countries continue to focus on staple crop investment. However, there are 24 examples from consortiums that include government, academics, the private sector and NGOs working 25 together to use technology to ensure that more nutritious and resilient crops are produced (Box 10). 26
Fujitsu
Nota
Is there any information on the impact on nutrition?
Fujitsu
Nota
Need to clarify the nature of the subsidy and what the voucher covered, so we understand why farmers first only increased maize production but then went for crop diversity.

HLPE DRAFT V0 (24 October 2016) – DO NOT CITE OR QUOTE
75
Improved technology can also be used to improve the way in which food is produced. Given that 1 agricultural production greatly contributes to the global water footprint, finding technological solutions to 2 produce food with less water while still maintaining high yields can have a profound effect on water 3 resources. Box 11 describes a project in Benin that uses drip irrigation, powered by solar panels, for 4 vegetable production. 5
6
Box 8 Biofortification to improve micronutrient intakes
Uganda
Micronutrient deficiencies are highly prevalent in Uganda. Among children and women, the prevalence of vitamin A deficiency is 20 percent and 19 percent, respectively (Uganda Bureau of Statistics, 2007). A two-year effectiveness study of the introduction of pro-vitamin A-rich orange sweet potato (OSP) to farming households in 2007–2009 resulted in significantly improved OSP dietary intake and vitamin A status among children. At follow-up, children consumed an average of approximately 40–50 g per day of OSP, which provided 44–60 percent of their total vitamin A intake (Hotz et al., 2012). Nutritional knowledge about vitamin A was found to have a positive effect on OFP consumption (de Brauw et al., 2015). Building on the effectiveness study findings, HarvestPlus has been implementing a USAID-funded biofortification programme in 15 districts across Uganda since 2011, exploring community-based opportunities for scale-up. In 2014, focus group discussions were conducted with 431 of the 1 050 programme beneficiaries (103 male; 328 female) in rural communities to understand infant and young child feeding (IYCF) practices and ascertain enablers to increase nutrition knowledge and improve infant and young child nutrition, including consumption of nutrient-rich biofortified crops. The community dialogues revealed that developing a cadre of mothers to continually lead, teach and support communities to feed their children and families well was a sustainable, community-based approach to improve IYCF in this setting.
The HarvestPlus ”lead mother” initiative trained 105 community-nominated, voluntary lead mothers on: (i) IYCF practices and maternal nutrition, including the importance of consumption of micronutrient-rich foods like OSP and high iron beans; (ii) effective communications; (iii) good agronomic practices and techniques; and (iv) water, sanitation and hygiene. Led by their lead mothers, farmer groups subsequently developed dramas and songs to effectively promote OSP consumption and other recommended nutrition practices while also addressing cultural beliefs, misconceptions and gender issues within their communities at large. The lead mother initiative has been very successful in sustainably improving IYCF. From 2013 to 2015, the proportion of children aged 6–23 months receiving a minimum acceptable diet in project areas rose from 6.9 percent to 16 percent in breastfed children and 4.7 percent to 11 percent in non-breastfed children
(HarvestPlus, 2015). Keys to success include basing the initiative on formative research; empowering communities (women and men) to self-select their lead mother, creating a sense of programme ownership; transparency about voluntary service; providing training and materials to lead mothers; encouraging development of farming groups; and building linkages to permanent government structures and programmes to optimize cultural, political and economic sustainability.
India
Pearl millet is an important staple crop for millions in arid and semi-arid regions of Asia and Africa where it is used as food and feed, and where micronutrient deficiencies constitute a common public health problem. The objective of the HarvestPlus pearl millet biofortification programme is to contribute to food and nutrition security by developing varieties that are high in iron – the nutrient most frequently insufficient in diets globally – and exhibit agronomic traits desired by farmers, including high yield, disease-resistance and drought tolerance. In 2012, the first biofortified high-iron pearl millet open-pollinated variety was developed by the International Crops Research Institute for the Semi-Arid Tropics (ICRISAT) with an iron content of 71 ppm and a zinc content of 40 ppm (average baseline for iron content in pearl millet is estimated at 47 ppm). A randomized control trial conducted by Finkelstein et al. (2015) found that high-iron pearl millet significantly
improved iron status in school children (12–16 years) in rural Maharashtra after four months of regular consumption, particularly among those who were iron-deficient at baseline.
Source: HarvestPlus, 2015
7
Fujitsu
Nota
Another effective project with a strong food education component.

HLPE DRAFT V0 (24 October 2016) – DO NOT CITE OR QUOTE
76
Box 9 African Orphan Crops Consortium: promotion of nutritious, high yielding and climate change-resilient crops
A partnership of 15 government organizations, scientific, agricultural bodies, universities, companies, regional organizations and NGOs, along with a network of 20 agricultural and horticultural organizations devoted to improving the diets and livelihoods of rural populations in sub-Saharan Africa has been formed. The African Orphan Crops Consortium (AOCC), founded in 2011, aims to sequence, assemble and annotate the genomes of 100 traditional African food crops. The consortium’s African Plant Breeders Academy in Nairobi, Kenya, will train 250 African scientists and technicians to sequence and breed the plants to be more nutritious, productive and resilient in the face of climate change. Significant progress has been made to demonstrate that plant research, training African scientists, and providing free access to laboratories on these underutilized crops will yield returns in terms of food security. The AOCC has already created a spin-off centre to research 40 East African orphan crops. African scientists are learning the skills to develop technologies to deploy genetics to help combat malnutrition.
Source: http://africanorphancrops.org/about/ (from Greg) Source: Thow et al. (2010, 2014).
1
Box 10 Solar-powered drip irrigation to improve food security in the Sahel
The Solar Electric Light Fund (SELF) NGO installed and financed photovoltaic-powered drip irrigation (PVDI) systems that combine drip irrigation with a solar-powered water pump to increase vegetable production in communal gardens in an effort to tackle malnutrition and poverty in rural Northern Benin. Household surveys with women farmers were conducted with two intervention villages and two comparison villages before the first harvest (but after the equipment was installed) in November 2007 and were repeated in November 2008. Food access increased markedly for the families of the women farmers who received the PVDI system both in terms of food produced and purchased. The women’s agricultural group members utilizing the PVDI systems became strong net producers of vegetables. They kept an average of 18 percent (by weight) of produce grown for home consumption, increasing vegetable intake to recommended daily allowances, and sold the rest in the local markets. With extra income earned from the sale of these crops, they significantly increased their purchases of staples, pulses and protein throughout the dry season, and oil during the rainy season. Moreover, their standard of living increased relative to the comparison group by 80 percent of the baseline. The PVDI was also found to be cost-effective.
Source: Burney et al. (2010).
2
Socio-cultural drivers 3
Underlying socio-cultural norms and demographic trends have the potential to both positively and 4 negatively influence healthy food systems. Cultural norms and traditions shape the food that is produced, 5 prepared and our preferences for consumption. Although many low- and middle-income countries are 6 currently undergoing a nutrition transition, which in many cases has led to shifts towards higher 7 consumption of energy-dense foods of lower nutritional quality (Popkin et al., 2012), there are some 8 countries and regions that are actively promoting the retention of traditional cultural practices. Box 12 9 provides an example from the Pacific island of Pohnpei. Another example of preserving traditional diets to 10 promote health is the traditional Mediterranean diet (Box 13). 11
12
Box 11 Traditional food for health in Pohnpei, Federated States of Micronesia
As with many Pacific Island Countries, the Federated States of Micronesia are experiencing increasing rates of NCDs, a shift away from traditional foods and a growing reliance on imports. Between 2005 and 2007, a community-based participatory programme was implemented in Pohnpei to promote a local traditional diet. The first phase of the programme entailed documenting the traditional food system and imported foods and Phase 2 involved promotion and intervention activities focused on building awareness, conserving rare crop varieties and small-scale food processing. Phase 1 found that the traditional food system had been neglected; there was a reliance on rice and other imported processed food as well as a
Fujitsu
Nota
OK, an interesting undertaking, no idea yet whether it will succeed.

HLPE DRAFT V0 (24 October 2016) – DO NOT CITE OR QUOTE
77
high prevalence of overweight, obesity, diabetes, stunting, vitamin A deficiency and dental decay among children. Campaign slogans as part of the promotional activities included “Let’s Go Local” and “Going Yellow” to promote nutrient-rich foods including yellow and orange-fleshed banana, giant swamp taro, breadfruit and pandanus, green leafy vegetables and fruits. An evaluation of the programme with a random sample of households (47 of the 71 community households) indicated increased provitamin A carotenoid intake (110 percent) and increased frequency of local food consumption including banana (53 percent), giant swamp taro (476 percent) and local vegetables (130 percent) as well as increased dietary diversity from local foods (5.5 local food groups consumed in 2007 as compared with 4.8 in 2005). Moreover, banana and taro rich in carotenoids became popular and appeared in markets where they had not been previously sold.
Source: Englberger et al. (2010a, 2010b; 2011).
Demographic drivers 1
In addition to culture, demographics influence healthy food systems. For example, there is evidence from 2 Bangladesh that reducing fertility rates can lead to improvements in undernutrition (Headey et al., 2015). 3 Thus, policies and programmes aimed at reducing fertility rates have the potential to improve FSN 4 outcomes. This will become increasingly important as the global population continues to rise to 9 billion 5 by 2050. 6
Box 12 Preserving the traditional Mediterranean diet to promote health and sustainability
In 2013, the traditional Mediterranean diet was inscribed on UNESCO’s Representative List of the Intangible Cultural Heritage of Humanity. The traditional Mediterranean diet is characterized by olive oil, cereals, fruits and vegetables, moderate amounts of fish, dairy and meat. Consuming the Mediterranean diet has been associated with a myriad of health benefits (Sofi et al., 2008). However, the diet is comprised
of more than just food. It also promotes social interaction and constitutes a set of skills, knowledge, practices and traditions conducive to the health of people and the planet.
Source: Petrillo (2012).
7
Policies and programmes targeting the food system activities and actors 8
There are several points to intervene with policies and programmes throughout the food value chain – 9 from production through to the food environment – all of which impact both the supply and demand for 10 food. In many cases, it is necessary to intervene across the value chain as a whole in order to improve 11 the availability, affordability and acceptability of nutritious foods. Using value chain analysis is a promising 12 approach for harnessing value chains to improve food systems (Allen et al., 2016). Box 14 provides an 13 example of using value chain analysis to identify points for intervening along the value chain and Box 15 14 provides an example of a programme supported by CARE to strengthen value chains for chillies in 15 Bangladesh. The private sector also has a role to play in terms of intervening across the food value chain. 16
Box 13 Identifying interventions to improve the vegetable value chains in Sierra Leone
The Koindagu district of Sierra Leone is known for its vegetable production, which is chiefly carried out by women and can account for as much as 50 percent of household incomes. A detailed analysis to identify key entry points along the value chain for improving nutrition for smallholder producers and their families involved in vegetable production was conducted:
Production: The Government has begun offering workshops to increase farmers’ understanding of the preparation of various crops for improved nutritional status, but no large-scale investments in irrigation have been made. Such investments would be key to growing nutrient-dense vegetables that can be sold at market.
Processing/packaging: Currently, almost no processing of vegetables takes place. Small minorities practise some forms of processing by drying their vegetables and by making tomato paste. However, since processing is often not carried out correctly, or else done using unhygienic equipment, spoilage rates are still high. Introducing processed traditional vegetables into urban markets should be considered in areas that are closer to urban centres.
Transportation and storage: Cold chain transport and storage pose major challenges to all key actors in Koinadugu due to a lack of infrastructure in the area. Because of the lack of built capital, most of the
Fujitsu
Nota
This was a nice campaign-based project. Need to know if it lasted beyond the campaign. "Sustainability" of intervention impact has to be a criterion.
Fujitsu
Nota
Check box numbers

HLPE DRAFT V0 (24 October 2016) – DO NOT CITE OR QUOTE
78
vegetables produced are sold immediately at the local markets, leaving little or nothing for home consumption. There is some investment by the private sector and NGOs for cold-room storage facilities in market places.
Marketing: The main challenges faced when selling at the market are poor infrastructure and volatile prices. Improved infrastructure, access to transport and closer markets, as well as storage facilities, could all help improve nutrition by increasing household incomes. Because Koinadugu is known for its vegetable production, urban traders come straight to the district, which offers a favourable context for opening new markets. The Government is currently offering farmers training in bargaining and negotiating techniques.
Source: Njoro et al. (2013; Downs and Fanzo, in press).
1
Box 14 Small scale farmer to entrepreneur: a value chain approach for community-led crop cultivation
CARE Bangladesh’s USAID-funded Strengthening Household Ability to Respond to Development Opportunities (SHOUHARDO) II programme emphasizes a comprehensive approach, from health, hygiene, nutrition, and DRR to agriculture, livelihoods, women’s empowerment and governance, to improve food and nutrtion security in the poorest and most marginalized districts. In Uttar Horishar village, SHOUHARDO II partnered with farmers cultivating roughly 0.33 acres, on an innovative approach designed to lift them and their families out of extreme poverty.
These farmers faced low-quality inputs, poor cultivation techniques and limited access to a fragmented, weak value chain. Through SHOUHARDO II, they participated in training on advanced cultivation techniques and market engagement strategies for a high-value, high-yield-potential chilli pepper crop. CARE worked with farmers to collectively link them to extension officers, seed suppliers and wholesalers, enabling ready access to technical guidance, high-quality chilli seeds and higher prices for their chilli crop.
As a result, farmers increased their yields by 50 percent, from 560–650 kg prior to the programme to over 800 to 900 kg of chillies per eighth of a hectare, and earned a profit of USD295. Yet their success was not theirs alone: more farmers within the village joined the programme and increased their yields, while women benefited as their skills were needed for the processing of the high-yielding chilli crops. Furthermore, this combination of empowering farmers and strengthening value chains within a comprehensive programme such as SHOUHARDO II resulted in increased incomes and food and nutrition security: the months of adequate household food provisioning increased from six to 11 months a year and household dietary diversity score nearly doubled from 4.8 to 8.7. This innovative approach along the value chain, addressing inputs, practices, processing and market access, empowered farmers and their families to move from being impoverished farmers to successful entrepreneurs.
Source: CARE (2016).
2
Production systems 3
Policies and programmes aimed at producing more nutritious food, in a better way, can result in 4 improvements in livelihoods but also diets and FSN. These interventions can focus on enhancement of 5 existing production practices, diversification of production or substitution of crops (Fiorella et al., 2016). A 6 systematic review examining the impact of agricultural interventions on nutrition outcomes found some 7 evidence of success in promoting foods rich in protein and micronutrients but less evidence of an impact 8 on diets as a whole and nutrition status (Masset et al., 2012). Nevertheless, there have been more recent 9 examples of agricultural programmes leading to improvements in diets and nutrition outcomes. There has 10 been evidence of successful programmes promoting agroecology in the Philippines (Box 17), homestead 11 gardens in Burkina Faso (Box 18), aquaculture in Bangladesh (Box 19), a livestock health programme in 12 Malawi (Box 20) and a poultry production programme in the United Republic of Tanzania (Box 21). 13
Box 15 Promoting sustainable agriculture among rice farmers in the Philippines
The Magsasaka at Siyentipiko para sa Pag-unlad ng Agrikultura (MASIPAG) is a network of small-scale farmers, farmers’ organizations, scientists and NGOs that aim to improve the quality of life of resource-poor farmers through a farmer-led sustainable agriculture approach. In 2007, MASIPAG examined food security,
Fujitsu
Nota
This case raises a question about the selection of cases. Since chilli pepper is not a key food for improving nutrition, the project's impact on food security was almost entirely through increased income. Any program aimed at income generation (e.g. making baskets, weaving,growing tobacco) would have the same effect. Does this matter?

HLPE DRAFT V0 (24 October 2016) – DO NOT CITE OR QUOTE
79
income and livelihoods, yields and productivity, environmental outcomes, farmer knowledge and empowerment outcomes among its farmers practising three forms of agriculture: full organic (n=280), conversion to organic agriculture (n=280) and conventional farmers (n=280). They found that full organic farmers were more likely to state that their food security had improved since 2000 (88 percent vs 44 percent of conventional farmers). They also reported consuming 68 percent more vegetables, 56 percent more fruit, 55 percent more protein-rich staples and 40 percent more meat than in 2000, which was an increase between 2 and 3.7 times higher than for conventional farmers. They also grew 50 percent more crops than conventional farmers. Full organic farmers ate a more diverse diet and they reported experiencing better health outcomes. The full organic farmers also reported higher on-farm diversity (50 percent higher than conventional farmers), better soil fertility, less soil erosion, increased tolerance of crops to pests and diseases and better farm management skills. Moreover, they also reported higher incomes – per hectare net incomes of the full organic farmers were 1.5 times higher than those of conventional farmers.
Source: Bachmann et al. (2009).
1
Box 16 Helen Keller International’s Enhanced-Homestead Food Production programme in Burkina Faso
The Enhanced-Homestead Food Production (EHFP) programme in Burkina Faso developed by Helen Keller International (HKI) established community gardens and provided seeds, tools and knowledge about good agricultural, health, hygiene and nutrition practices to mothers with young children (3-12 months old at baseline). A cluster randomized control trial examining the impact of the programme found a reduction in underweight among mothers (8.7 percentage points as compared with the control) as well as increases in their ownership of productive assets, their social status and their role in household decision-making compared with women who were not enrolled in the programme. They also increased their consumption of fruit and marginally increased (although not significant at p<.05) their intakes of meat/poultry and dietary diversity. There were also improvements in the nutrition and health of their children. Although there was no impact on stunting or underweight prevalence, there was a 16 percentage point reduction in diarrhoea and among the youngest children (3–5.9 months) there was a 15 percentage point reduction in the prevalence of anaemia. Moreover, there were improvements in infant and young child feeding and care knowledge and practices in the EHFP programme participants as compared with the control group.
Source: Olney et al. (2015, 2016; van den Bold et al., 2015).
2
Box 17 The Development of Sustainable Aquaculture Project in Bangladesh
The Development of Sustainable Aquaculture Project (DSAP) was implemented by the World Fish Centre in Bangladesh between 2001 and 2005. The project aimed to improve resource-use efficiency and increase productivity at the farm level in a sustainable manner by the provision of low-cost aquaculture technologies as well as three years of continuous training support to farmers. The DSAP was implemented in 42 of the 64 districts in Bangladesh with the assistance of 48 partner NGOs. A before and after study with a control group was used to examine the impact of the programme. A total of 225 participating farmers and 123 control farmers were selected from the four DSAP working areas (Mymensingh, Comilla, Magura and Bogra) in 2002–03 prior to the commencement of the programme and again in 2005–06. The project had a significant and positive impact on income and employment as well as additional benefits such as the accumulation of social capital through gifting of fish to community members, which increased at a rate of 22.8 percent among the participating farmers over the three years as compared with 2.1 percent among the controls. Moreover, annual per capita fish consumption increased at a higher rate (9.9 percent average growth as compared with 2.13 percent) in the participating households as compared with controls.
Source: E-Jahan et al., (2010).
3
Box 18 Pathways of impact of livestock health and transfer programme on household resilience and dietary diversity in central Malawi
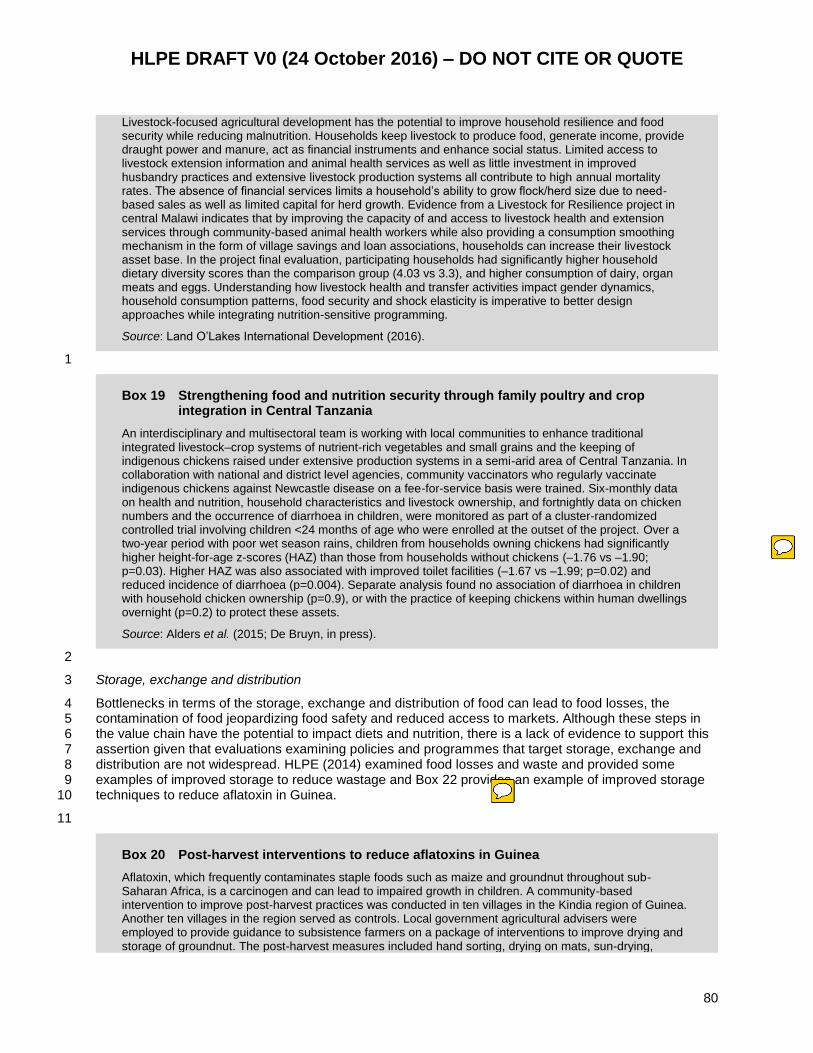
HLPE DRAFT V0 (24 October 2016) – DO NOT CITE OR QUOTE
80
Livestock-focused agricultural development has the potential to improve household resilience and food security while reducing malnutrition. Households keep livestock to produce food, generate income, provide draught power and manure, act as financial instruments and enhance social status. Limited access to livestock extension information and animal health services as well as little investment in improved husbandry practices and extensive livestock production systems all contribute to high annual mortality rates. The absence of financial services limits a household’s ability to grow flock/herd size due to need-based sales as well as limited capital for herd growth. Evidence from a Livestock for Resilience project in central Malawi indicates that by improving the capacity of and access to livestock health and extension services through community-based animal health workers while also providing a consumption smoothing mechanism in the form of village savings and loan associations, households can increase their livestock asset base. In the project final evaluation, participating households had significantly higher household dietary diversity scores than the comparison group (4.03 vs 3.3), and higher consumption of dairy, organ meats and eggs. Understanding how livestock health and transfer activities impact gender dynamics, household consumption patterns, food security and shock elasticity is imperative to better design approaches while integrating nutrition-sensitive programming.
Source: Land O’Lakes International Development (2016).
1
Box 19 Strengthening food and nutrition security through family poultry and crop integration in Central Tanzania
An interdisciplinary and multisectoral team is working with local communities to enhance traditional integrated livestock–crop systems of nutrient-rich vegetables and small grains and the keeping of indigenous chickens raised under extensive production systems in a semi-arid area of Central Tanzania. In collaboration with national and district level agencies, community vaccinators who regularly vaccinate indigenous chickens against Newcastle disease on a fee-for-service basis were trained. Six-monthly data on health and nutrition, household characteristics and livestock ownership, and fortnightly data on chicken numbers and the occurrence of diarrhoea in children, were monitored as part of a cluster-randomized controlled trial involving children <24 months of age who were enrolled at the outset of the project. Over a two-year period with poor wet season rains, children from households owning chickens had significantly higher height-for-age z-scores (HAZ) than those from households without chickens (–1.76 vs –1.90; p=0.03). Higher HAZ was also associated with improved toilet facilities (–1.67 vs –1.99; p=0.02) and reduced incidence of diarrhoea (p=0.004). Separate analysis found no association of diarrhoea in children with household chicken ownership (p=0.9), or with the practice of keeping chickens within human dwellings overnight (p=0.2) to protect these assets.
Source: Alders et al. (2015; De Bruyn, in press).
2
Storage, exchange and distribution 3
Bottlenecks in terms of the storage, exchange and distribution of food can lead to food losses, the 4 contamination of food jeopardizing food safety and reduced access to markets. Although these steps in 5 the value chain have the potential to impact diets and nutrition, there is a lack of evidence to support this 6 assertion given that evaluations examining policies and programmes that target storage, exchange and 7 distribution are not widespread. HLPE (2014) examined food losses and waste and provided some 8 examples of improved storage to reduce wastage and Box 22 provides an example of improved storage 9 techniques to reduce aflatoxin in Guinea. 10
11
Box 20 Post-harvest interventions to reduce aflatoxins in Guinea
Aflatoxin, which frequently contaminates staple foods such as maize and groundnut throughout sub-Saharan Africa, is a carcinogen and can lead to impaired growth in children. A community-based intervention to improve post-harvest practices was conducted in ten villages in the Kindia region of Guinea. Another ten villages in the region served as controls. Local government agricultural advisers were employed to provide guidance to subsistence farmers on a package of interventions to improve drying and storage of groundnut. The post-harvest measures included hand sorting, drying on mats, sun-drying,
Fujitsu
Nota
Was the training of the vaccinators the only project input? Not clear just how this linked to the results.
Fujitsu
Nota
Very interesting would also be the impact of refrigeration facilities on (a) what foods are offered in canteens and on the street, and (b) on their prices.
HLPE DRAFT V0 (24 October 2016) – DO NOT CITE OR QUOTE
81
storage in natural-fibre bags, wooden pallets and the use of insecticides. The concentrations of blood aflatoxin-albumin adducts from 600 people were measured immediately after harvest and at 3–5 months post-harvest to assess the impact of the intervention. In the control villages, mean aflatoxin-albumin concentrations increased over time from 5.5 pg/mg immediately after harvest to 18.7 pg/mg five months later. In the farmers that participated in the intervention, concentrations were 7.2 pg/mg, which increased only slightly to 8.0 pg/mg at five months post-harvest. Moreover, five months post-harvest 2 percent of people in the control villages had non-detectable adduct concentrations as compared with 20 percent in the intervention group.
Source: Turner et al. (2005).
1
Processing and packaging 2
Food processing can help reduce food losses throughout the food value chain, can improve nutrient 3 content, safety and shelf-life (Augustin et al., 2016). Interventions aimed at improving food processing can 4 be effective both in terms of diet-related NCDs as well as undernutrition. Policies and programmes can be 5 put in place to add micronutrients into foods (i.e. fortification) or to remove less healthy ingredients (e.g. 6 product reformulation to reduce sodium and transfat) from processed foods. 7
Fortification is an effective strategy to improve micronutrient intakes and in some cases improve health 8 outcomes (Das et al., 2013). Perhaps one of the best examples of the impact of fortification on improving 9 health outcomes is folic acid fortification. The fortification of flour with folic acid has dramatically reduced 10 congenital abnormalities such as neural tube defects in several countries worldwide (Castillo-Lancellotti et 11 al., 2012), including Canada and the United States of America (Box 23). 12
In addition to folic acid fortification, salt iodization programmes have been successful in reducing the risk 13 of goitre, cretinism, low cognitive function and iodine deficiency in countries worldwide (WHO, 2014b) as 14 have iron fortification programmes in terms of increasing haemoglobin and iron status and reducing the 15 prevalence of anaemia in women and children (Gera et al., 2012; Das et al., 2013). Box 24 describes a 16 salt iodization programme in Ethiopia and Box 25 describes an iron fortification program in Costa Rica. 17 Fortification programmes need to be continuously monitored to limit unintended consequences. This is 18 particularly important for fortification vehicles that may, when consumed in excess, lead to diet-related 19 NCDs (e.g. excess salt consumption). 20
Processing whole foods may be an alternative to fortifying foods to improve micronutrient intakes in some 21 cases. For example, fish powder is being promoted in Cambodia in an effort to improve nutrient intakes 22 during the first 1 000 days (Box 26). These types of approaches, while promising, will require evaluations 23 to examine their impact. 24
25
Box 21 Reducing neural tube defects with folic acid fortification in Canada and the United States of America
Consuming adequate amounts of folic acid before conception and during early pregnancy can prevent neural tube defects. Given that many pregnancies are unplanned, population level fortification policies have been adopted in several countries worldwide to prevent neural tube defects. In 1998, mandatory folic acid fortification of a variety of cereal products came into effect in both Canada and the United States of America. Live births, stillbirths and termination of pregnancies because of foetal anomalies were examined in seven Canadian provinces between 1993 and 2002. Over this time period, there was a 46 percent reduction in neural tube defects (1.58 per 1 000 births before fortification to 0.86 per 1 000 births). In the United States of America, a national study of birth certificate data for live births in 45 states as well as Washington, DC, were examined between 1990 and 1999. During this period, there was a 19 percent decline in the birth prevalence of neural tube defects from 37.8 per 100 000 to 30.5 per 100 000.
Although there is strong evidence of the positive impact on neural tube defects, there have been some concerns raised over the potential increase in colon cancer that coincided with folic acid fortification in Canada and the United States of America (Mason et al., 2007); however, the strength of this evidence is weak and does not imply causality.

HLPE DRAFT V0 (24 October 2016) – DO NOT CITE OR QUOTE
82
Source: Honein et al. (2001; De Wals et al., 2007).
1
Box 22 A partnership among government, NGOs and producer cooperatives to improve iodized salt coverage in Ethiopia
In 2005, the Ethiopian Health and Nutrition Research Institute (now called the Ethiopian Public Health Institute) estimated that over 83 percent of school children had mild to severe iodine deficiency, as measured by urinary iodine concentration. Goiter rates of 40 percent in children and 36 percent in mothers were also found, which are also indicative of severe iodine deficiency. Moreover, surveys indicated household coverage of iodized salt in Ethiopia to be as low as 4.7 percent in 2008 (NNP baseline survey, Ethiopian Public Health Institute, 2008). In order to address this gap in coverage, the Global Alliance for Improved Nutrition (GAIN) has been supporting the National Universal Salt Iodization (USI) Program in Ethiopia since 2009 through technical and financial assistance working with government, the salt industry, civil society and consumers to increase the availability and access to adequately iodized salt as part of improving the national food system. GAIN has provided input and built capacity across the entire fortification impact model, from foundation building, set-up and launch stages through to scale-up and delivery and demonstrating impact. One critical activity of GAIN’s support has been the successful establishment of a viable national revolving fund with distribution for potassium iodate. Preliminary results from the 2014 National Micronutrient Survey indicated that coverage of iodized salt has increased significantly during the time of GAIN’s engagement: 95.2 percent of households now have access to salt with some iodine and 42.7 percent of households have access to salt that is adequately iodized to national standards. Preliminary data from a cluster randomized control trial examining the impact of fortification in children <36 months in 60 villages in Amhara have suggested improvements in children’s iodine status, mental development and growth (Bougma et al., 2015).
Source: Garrett et al. (2016).
2
Box 23 Food fortification (wheat flour, maize flour, milk) with iron in Costa Rica
Costa Rica has been a pioneer for mass fortification with many foods and condiments. Although wheat flour was first fortified with iron in 1958, since the 1990s there has been a stronger push for iron fortification in the country. In 1999 maize flour was fortified with iron, as was milk in 2001 and wheat flour in 2002 (in a higher quantity and with a more bioavailable fortificant than in the past). In order to examine the impact of the fortification programme, the anaemia prevalence in women (15–45 years) and children (1–7 years) was examined before (1996) and after (2008–09) the mandatory fortification using national survey data of 910 women and 965 children before the fortification programme and 863 women and 403 children following the introduction of the programme. During this time period, anaemia declined from 19.3 percent to 4.0 percent in children and from 18.4 percent to 10.2 percent at the national level. Moreover, iron deficiency declined from 26.9 percent to 6.8 percent in children and iron deficiency anaemia declined from 6.2 percent to no longer being detectable.
Source: Martorell et al. (2015).
3
4
Box 24 Small fish powder for the first 1 000 days in Cambodia
Small fish, especially when using the head and bones, are ideal for promoting growth given that fish contain many of the nutrients needed for good growth and development. However, many children from the age of six months do not eat these fish due to difficulty eating fish with bones. Small fish powder is a local, low-cost, sustainable innovation to address this need. Rice-field fish are a special natural resource in Cambodia and can be easily caught in rice fields and canals when flooded from October to December. Although Cambodia has plentiful fish resources, many people do not use this valuable resource. In powder form, small fish can be safely stored to ensure that pregnant and lactating women and children 6–23 months eat
Fujitsu
Nota
In order to understand how the iodine reaches the consumers we need to know if they are able to choose iodised salt (or have no other choice), if they areaware of its importance, and what the pricing policy is.
Fujitsu
Nota
Same questions as for iodized salt above.

HLPE DRAFT V0 (24 October 2016) – DO NOT CITE OR QUOTE
83
fish even during lean months when fresh rice-field fish are not freely available. This fish preservation and storage method was tested by the Institute Pasteur of Cambodia and confirmed to be safe for eating.
Source: World Fish Cambodia (2016).
1
In terms of food processing policies and programmes aimed at addressing diet-related NCDs, both 2 industrially produced transfat and sodium have been targeted and are both considered “best buys” for 3 reducing the burden of NCDs in LMICs (WHO/World Economic Forum, 2011). Using policy to reduce 4 transfat in the food supply has been called one of the most straightforward public health interventions to 5 improve diets and reduce the risk of diet-related NCDs (Mozaffarian and Stampler, 2010). The main 6 approaches to reducing transfat in the food supply have been legislative limits (often referred to bans) of 7 the amount of transfat allowable in food, introducing mandatory transfat labelling or voluntary approaches 8 usually driven by industry. These policies lead to product reformulation to reduce the levels of transfat in 9 foods. Although the evidence suggests that all policy approaches will lead to reductions in transfat levels 10 in foods and subsequent intakes, stronger policies will likely have an even more pronounced effect by 11 ensuring that the policy reaches all foods and does not have a differential effect on the most vulnerable 12 populations, unlike labelling where high TFA products remain in the food supply and are 13 disproportionately consumed by low-income groups (Downs et al., 2013; Pearson-Studdard et al., 2015). 14 Box 27 provides an overview of transfat reduction worldwide. 15
16
Box 25 The impact of transfat policies worldwide
Partially hydrogenated oils (PHOs) are the main dietary source of transfatty acids. They entered the food supply in the early 1900s and quickly became a key ingredient in processed foods given their long shelf-life and low cost. Denmark was the first country to ban industrially produced transfat in 2003, paving the way for other countries, cities and states to implement similar policies. The ban in Denmark virtually eliminated transfat from the food supply. In the United States of America, a more local approach to transfat bans has been adopted in restaurants and fast-food outlets. New York City was the first city in the United States of America to ban transfat in restaurant and fast-food outlets, which led other jurisdictions to adopt similar policy measures, reducing the quantity of transfat in the food supply. Mandatory labelling of transfat has been another approach to reducing transfat availability in the food supply. Canada and the United States of America were the first countries to adopt transfat labelling, which led the food industry to reformulate many of their products leading to significant reductions in the availability of transfat in the food supply (Mozaffarian et al., 2010; Ratnayake et al., 2009), which coincided with reductions in transfat levels in blood serum (United States of America) and breast milk (Canada) (Vesper et al., 2012; Ratnayake et al., 2014). More recently, the Food and Drug Administration (FDA) of the United States of America proposed removing the “generally recognized as safe” (GRAS) status from PHOs in that country, which would essentially act as a countrywide transfat ban.
Source: Downs et al. (2013).
17
Prepared and processed foods often contain high amounts of “hidden” salt given that consumers are not 18 aware of the high salt content (Fe et al., 2012). One of the most effective ways to reduce “hidden” salt 19 consumption may be to encourage the food industry to reduce levels in foods by setting targets or 20 standards for salt levels in different categories of foods that all companies should meet. 21
22
As of 2015, 75 countries had national salt reduction policies (Trieu et al., 2015). There is some evidence 23 to suggest a reduction in population intakes, salt levels in foods and improvements in knowledge, 24 attitudes and behaviour in some countries; however, more rigorous evaluations of salt reduction 25 programmes are needed (Trieu et al., 2015). Perhaps the most compelling evidence for the effectiveness 26 of salt reduction strategies to date has been from the United Kingdom (Box 28). However, in recent years 27 some countries (South Africa, Argentina, etc.) have moved to set mandatory salt standards in processed 28 food categories – evaluations of these policies are needed. 29
Fujitsu
Nota
In some places children have issues with the taste of fish powder. Is there evidence of increase consumption?

HLPE DRAFT V0 (24 October 2016) – DO NOT CITE OR QUOTE
84
1
Box 26 The United Kingdom Food Standards Agency’s Salt Reduction Programme
From 2003 to 2010, the United Kingdom Food Standards Agency undertook a salt reduction programme. The programme consisted of three key elements: (i) setting targets and working with industry to reformulate foods to reduce salt levels; (ii) encouraging use of improved nutrition labelling to make it easier for consumers to make healthier choices; and (iii) undertaking consumer awareness campaigns and work with NGOs to raise salt awareness. Throughout the period of the salt reduction programme, there were substantial reductions in the salt content of foods (up to 70 percent in some cases) as well as a 15 percent reduction in 24-hour urinary sodium between 2000 and 2001 (9.5 g/d) and 2008 (8.6 g/day). Moreover, there was evidence of increased awareness of the health benefits of reducing salt intake with 43 percent of adults in 2009 stating they had made an effort to reduce salt in their diet as compared with 34 percent of adults in 2004 prior to the commencement of the consumer awareness campaign.
Source: Wynes et al. (2011); He et al. (2014).
2
Retail, marketing and advertising 3
The retail, marketing and advertising activities and actors in the food system feed into the food 4 environment by influencing the foods that are available, affordable and acceptable. The policies and 5 programmes related to these components of the value chain can shape consumer behaviour and 6 preferences and vice versa. 7
Policies and programmes targeting the food environment 8
Healthy food environments make it easier for consumers to make healthy choices in terms of the 9 purchase and consumption of foods. Although there has been a substantial amount of research 10 describing food environments in high-income countries – particularly in urban settings – less work has 11 been focused on low- and middle-income countries. Nevertheless, policies and programmes aimed at 12 improving the quality of the food environment have been implemented worldwide, some of which are 13 described below. 14
Food affordability 15
Making healthier foods cheaper and less healthy foods more expensive is one way to nudge consumers 16 to purchase healthier foods – taxes and subsidies are one way to accomplish this. There is a significant 17 amount of evidence to suggest that both subsidies and taxes influence food purchasing behaviour and 18 subsequent intakes (Eyles et al., 2012; Thow et al., 2014). Although the majority of studies that have 19 examined the effects of taxes and subsidies to date have been modelling studies, there is strong 20 evidence within those to suggest that fiscal policy is an effective tool for changing dietary intakes, with the 21 strongest and most consistent evidence for the effectiveness of soft drink taxes in the range of 20–50 22 percent in reducing consumption, and fruit and vegetable subsidies in the range of 10–30 percent in 23 terms of increasing consumption (Thow and Downs, 2014). There is also growing evidence for the likely 24 effectiveness of combinations of taxes and subsidies, particularly as a mechanism to reduce potential 25 substitution with unhealthy foods (Thow et al., 2014). Although there is a potential for taxes to be 26 regressive (disproportionately affect the poor), well-designed taxes targeting energy-dense foods of low 27 nutritional value with close, healthier (untaxed) substitutes may result in greater behaviour change among 28 low-income consumers, thus minimizing regressivity (as they would then pay less of the tax), and could 29 be further supported by complementary subsidies targeted to low-income populations (Thow and Downs, 30 2014). 31
In recent years, several countries have implemented taxes on less healthy foods, including Mexico. Box 32 29 provides an overview of the sugary drinks and high-caloric-density food taxes implemented in Mexico 33 in January 2014. 34
Subsidies have also been used as a tool to promote consumption of healthier foods, particularly among 35 low-income populations. Box 30 summarizes the public distribution system in India to combat 36
Fujitsu
Nota
Nice example of multi-sided intervention with a considerable consumer education element.

HLPE DRAFT V0 (24 October 2016) – DO NOT CITE OR QUOTE
85
undernutrition and Box 31 describes a healthy food subsidy by Discovery Health Insurance in South 1 Africa aimed at targeting the rising rates of overweight and obesity and diet-related NCDs. 2
Box 27 Taxation of sugar-sweetened beverages and non-essential energy-dense foods in Mexico
In January 2014 an excise duty of 1 peso (~10 percent) per litre was applied to sugary drinks and an ad valorem excise duty of 8 percent was applied to non-essential energy-dense foods. Nielsen Mexico’s Consumer Panel Services data on purchases from January 2012 to December 2014 were used to examine purchases of over 6 000 households. The volume of food purchases that were taxed and untaxed in these households was examined from January 2012 to 2014, controlling for household characteristics and contextual factors. Relative to the counterfactual in 2014, purchases of taxed sugar-sweetened beverages decreased by an average of 6 percent and continued to decrease to 12 percent by December 2014. Among lower socio-economic households, there was a 9 percent decline during 2014 and by December 2014 there was a 17 percent decrease compared with pre-tax trends. Moreover, purchases of untaxed beverages were 4 percent higher than the counterfactual, mainly attributed to increased bottled water purchases. A similar pattern was found for non-essential energy-dense foods where there was a 5.1 percent reduction in purchases beyond what would have been expected based on pre-tax trends. There were no corresponding changes in purchases of untaxed foods. Among low socio-economic households, there was a 10.2 percent reduction in the purchases of taxed foods compared with what would have been expected – high socio-economic households did not change their purchasing.
Source: Colchero et al. (2015); Batis et al. (2016).
3
Box 28 Eating better for less: a national discount programme for healthy food purchases in South Africa
HealthyFood is a large discount programme launched in 2009 operated through South Africa’s largest private health insurance company’s (Discovery) health promotion campaign, Vitality. Approximately 260 000 households are enrolled in the Vitality programme across South Africa and there are approximately 800 participating supermarkets. Members of the programme receive up to 25 percent cash back on healthy food purchases. Once their account is activated, members begin receiving a 10 percent discount on healthy food purchases, which is subsequently increased to 25 percent after they complete an online health risk assessment questionnaire, which is completed on a rolling 12-month basis. The health risk assessment questionnaire includes a limited amount of information on dietary behaviour, which was used to assess the impact of the programme. Participating in the programme was associated with a higher consumption of fruits/vegetables and whole grains as well as lower consumption of high-sugar/salt foods, fried foods, processed meats and fast-food; however, there was no evidence that participation reduced obesity.
Using monthly household supermarket food purchase scanner data for 170 000 households between 2009 and 2012, food expenditures of programme participants were also examined. Households that received a 10 percent rebate for healthy food purchases increased the ratio of healthy to total food expenditure by 6 percent whereas those who received a 25 percent discount increased the ratio by 9.3 percent. In terms of fruits and vegetables, there was an increase in the ration of fruit and vegetables to total food expenditure by 5.7 percent in the 10 percent discount group and 8.5 percent in the 25 percent discount group. There was also a reduction in the ration of less desirable foods to total food expenditure by 5.6 percent for 10 percent and 7.2 percent for the 25 percent discount group.
Source: An et al. (2013); Sturm et al. (2013).
4
5
Box 29 The public distribution system in India
India’s public distribution system (PDS)s the largest food-based social safety net in the world. In 2013, the Government of India passed the National Food Security Act, which expands the PDS to cover two-thirds of the population. Although there are differences by state, the main commodities distributed through the system are: wheat, rice and sugar. In some states, legumes and oil are also distributed through the system. There have been mixed results in terms of the impact of the PDS on poverty alleviation, diets and nutrition.
Fujitsu
Nota
Interesting! This program was new to me. Perhaps needs more time to see an impact on obesity.

HLPE DRAFT V0 (24 October 2016) – DO NOT CITE OR QUOTE
86
However, after expansion of the availability of PDS grains and reforms to improve procurement in the state of Chhattisgarh, there were improvements in dietary intakes. More specifically, following the PDS reforms there was a near doubling of households consuming PDS rice (from 10 to 19 percent) and the average quantity consumed increased by 400 percent. There was also growth in the consumption of calories from pulses, animal-sourced protein and from produce since the reforms.
Source: Krishnamurthy et al. (2014); Radharkrishna et al., (1997); Chakrabarti et al. (2016).
1
Information and guidelines 2
Although knowledge and awareness are important in terms of equipping consumers with the information 3 needed to make healthy choices, it does not necessarily lead to improved behaviour. Nutrition education 4 alone has had limited success in terms of influencing dietary intakes. However, targeted mass media can 5 lead to improvements in consumption patterns (Mozaffarian et al., 2012). For example, mass media 6 campaigns that have focused solely on increasing fruit and vegetable intake and those that have focused 7 on reducing sodium intake (Box 32) have demonstrated evidence of impact (Mozaffarian et al., 2012). 8 There is also evidence to suggest that behaviour change communication programmes that go beyond 9 simply providing information but also provide insight on how to change the behaviour may be effective in 10 terms of changing behaviour, particularly in terms of improving infant and young child feeding practices 11 (Box 33). Moreover, multicomponent community-based media and nutrition-education-based 12 interventions to improve diets and reduce the risk of diet-related NCDs have also shown some promise 13 with the North Karelia Project providing the most compelling evidence (Box 34). 14
Box 30 The Tianjin Project: a community based education programme to reduce salt consumption
Between 1989 and 1992, the Tianjin Project promoted reduced salt consumption through the following activities: training of healthcare personnel about salt and blood pressure, distribution of leaflets door to door, distribution of posters and stickers to food retailers, and the introduction of lower sodium salt in a limited number of retail stores. In order to examine the impact of the programme, sodium intakes and blood pressure were assessed in cross-sectional surveys in seven intervention and ten control neighbourhoods. From 1989 to 1992, mean sodium intakes decreased among men (22 mmol/d) and women (11 mmol/d) in the intervention neighbourhoods whereas in the control neighbourhoods sodium increased (18 mmol/d in men and 4 mmol/d in women). As compared with the control neighbourhoods, blood pressure decreased in the intervention neighbourhoods in both men and women and sodium-related knowledge improved.
Source: Tian et al. (1995).
15
16
Box 31 Alive & Thrive’s behaviour change communication strategies in Viet Nam, Bangladesh and Ethiopia
Between 2010 and 2014, Alive & Thrive implemented large-scale behaviour change communication strategies to improve infant and young child feeding in Viet Nam, Bangladesh and Ethiopia. Behaviour change communication strategies differed by country but included mass communication including broadcast radio and television, out of home communication such as posters and billboards, and digital, including online placement and social media. Preliminary evidence from the programme’s impact evaluation has found that exclusive breastfeeding increased in all three countries, tripling in Viet Nam and reaching more than 80 percent in Bangladesh and Ethiopia. The percentage of young children (6–23 months) eating a diverse diet also increased in all three countries. In Bangladesh it increased by 32 percentage points and it doubled in Ethiopia, although it remains low.
Source: Alive & Thrive (2016).
17
Fujitsu
Nota
This paragraph is really misleading! Please change your definition of "nutrition education" and include it in your opening definitions, along with SBCC. "Nutrition education" does not mean simply increasing knowledge and awareness but aims at behaviour change and a lot more. The definition adopted by the Society for Nutrition Education and Behavior is that NE (Contento 2011) is " Any combination of educational strategies, accompanied by environmental supports, designed to facilitate voluntary adoption of food choices and other food- and nutrition-related behaviors conducive to health and well-being. Nutrition education is delivered through multiple venues and involves activities at the individual, community, and policy levels." Mass media are definitely part of NE, although the evidence is that they need a framework of support in order to be most effective.

HLPE DRAFT V0 (24 October 2016) – DO NOT CITE OR QUOTE
87
Box 32 The North Karelia Project: a media- and education-based community intervention to reduce the risk of coronary heart disease
The North Karelia Project was implemented between 1972 and 1977 and aimed to address risk factors for coronary heart disease (CHD) given that the region had among the highest rates in the world. The project targeted reducing consumption of butter, whole-fat dairy products, non-lean meats and salt, while simultaneously increasing consumption of vegetable oils/vegetable-oil-based margarines, low-fat dairy products, lean meats, vegetables, berries and fruit. A variety of activities were employed including diet education via posters, leaflets, newspaper and radio coverage, primary care doctors/nurses, schools and other community groups. Local food manufacturers were also encouraged to prepare healthier foods. Diets improved substantially and there were declines in blood cholesterol and blood pressure. These changes later coincided with reductions in CHD rates. Given the programme’s success, it was later expanded nationally and additional complementary policy approaches were implemented.
Source: Pekka et al. (2002); Puska (1985); Puska and Stahl (2010).
1
Nutrition labelling has been commonplace in many countries for several decades. It aims to provide 2 consumers with information about the nutrient content of a given food. In 1985, the CODEX Alimentarius 3 adopted its first guidelines on nutrition labelling, which have since been updated several times. Although 4 since the development of the CODEX guidelines many countries have adopted back-of-the-pack 5 information on energy and specific nutrients, there is limited evidence to suggest that these labels have 6 influenced food-purchasing decisions. These labels require some degree of nutritional literacy and are 7 difficult to interpret for many people. For this reason, there have been recent moves to adopt easy-to-8 interpret labels (e.g. traffic light, star ratings, etc.) on front-of-packs or on store shelves (Box 35). These 9 types of labels have been shown to be easier for consumers to interpret, across all socio-economic 10 groups (Kelly et al., 2009). Although there is some evidence to suggest that consumers use these labels 11 and it allows them to make better food choices, the evidence related to purchasing behaviour and intake 12 is both limited and mixed (Hersey et al., 2013). It does appear that labelling systems that are nutrient-13 specific rather than providing an overall score for a given food product are more effective in terms of 14 helping consumers identify healthier products as do labelling systems that incorporate text and colour to 15 indicate high, medium and low levels of nutrients (Hersey et al., 2013). Recently, Chile and Ecuador have 16 adopted front-of-pack labels. These labels can provide an incentive to industry to reformulate their 17 products. There is preliminary evidence to suggest that Ecuador’s front-of-pack traffic light labels have led 18 to product reformulation by large and medium food industries with over 20 percent of large and medium 19 food industries reporting a reduction of at least one product that contains the red traffic light for sugar, fat 20 or salt (ANDES, 2016). In June 2016, Chile’s front-of-pack labels that consist of a black stop sign for 21 items with high quantities of calories, saturated fat, sugar and sodium came into effect. The regulation will 22 also restrict advertising to children under the age of 14 of products that require a stop sign – evaluations 23 of these policies are needed. 24
Box 33 Star rating labels in the United States of America and Australia
Guiding Stars is a nutrition navigation programme that was implemented in the Northeast supermarket chain stores located in Maine, New Hampshire, Vermont, Massachusetts and northern New York. The programme used a nutrient-profiling algorithm (debiting points for foods high in transfat, saturated fat, cholesterol, sodium and added sugar while crediting points for vitamins, mineral, fibre and whole grains) to provide a star rating for individual products. More than 60 000 food and grocery items were rated and products that earned 1, 2 or 3 stars according to the nutrition criteria included a star icon displayed on the shelf tag. Purchasing data from 2006 to 2008 was used to examine the impact of the shelf labelling system on consumer food purchases in 168 stores located in northern New England and New York prior to the implementation of the labelling and at one- and two-year follow-up periods. There were significant changes in food purchasing following the implementation of the shelf labelling system, which remained at the two-year follow-up period. Despite the same number of products containing star icons available on the shelves between 2006 and 2008, there was an increase in the purchase of these products. Overall, there was a 1.39 percentage point increase in the proportion of products purchased that contained the rating, which translates to approximately 2.9 million more items with stars being purchased every month.
Fujitsu
Nota
Indeed.

HLPE DRAFT V0 (24 October 2016) – DO NOT CITE OR QUOTE
88
Although guiding stars were used as a shelf labelling system, there is some preliminary evidence from Australia to suggest that star ratings on the front-of-pack of packaged foods have led to changes in food purchasing. Australia recently adopted a voluntary health star rating system across various packaged food products. Preliminary data suggest that consumers are aware of the labels and that they have led to changes in food purchasing. A survey was conducted with a nationally representative sample of 1 000 Australians 18 years and older and found that 47 percent reported that they would likely use the labels on a regular basis and, among those aware of the labels, 33 percent reported that they have decided to purchase a product that they do not normally purchase due to the labels.
Source: Sutherland et al. (2010); Parker and Frith (2015).
1
More than 100 countries worldwide have developed dietary guidelines, which provide dietary advice – 2 based on local culture and availability of food – for populations. These guidelines can be used to inform 3 food provisioning (e.g. schools in the United States of America) and they often lay the foundation for 4 dietary advice given by health professionals. Few studies have examined the impact of dietary guidelines 5 on food consumption. In the United States of America there is very limited evidence of dietary guidelines 6 directly influencing consumption patterns (Haack and Byker, 2014). Nevertheless, guidelines can still 7 influence nutrition and food systems through indirectly influencing consumption patterns, while in some 8 cases simultaneously potentially influencing production practices in the context of sustainability. Box 36 9 provides examples of linking dietary guidelines to sustainability. 10
11
Box 34 An overview of countries’ efforts to incorporate sustainability into dietary guidelines
In recent years, there has been a growing recognition in many countries worldwide that current consumption patterns are no longer sustainable. Although incorporating sustainability into dietary guidelines has been contentious in the United States of America, other countries have begun incorporating different elements of healthy and sustainable food systems into their guidelines, including Germany, the Netherlands, Qatar, Brazil, United Kingdom, Sweden and China as well as the traditional Mediterranean diet. The dietary guidelines that include issues of sustainability highlight reducing meat and shifting to a more plant-based diet to improve both health and the environment.
Source: Fisher and Garnett (2016).
12
Food acceptability 13
Consumer preferences and what foods they deem acceptable are shaped by a variety of factors including 14 taste, culture and convenience, among others. Advertising and marketing influence these preferences 15 and increase consumer demand for those products. Although there have been steps taken to reduce 16 marketing to children over the past decade, most notably with the 2010 WHO recommendations on 17 marketing of foods and non-alcoholic beverages to children, which was endorsed by member states 18 (Resolution WHA63.14) (WHO, 2010), insufficient progress has been made (Kraak et al., 2016). It is likely 19 that stronger regulatory approaches are needed such as advertising bans to children. Box 37 describes 20 the impact of an advertising ban in the Canadian province of Quebec. 21 22 The private sector has a strong role to play in terms of increasing the acceptability of food. For example, a 23 supermarket chain in France began the Inglorious Fruit and Vegetable programme in France to fight food 24 waste by providing a market for imperfect fruits and vegetables. The retailer launched a mass media 25 campaign to promote this produce using print media, billboards, television, radio and social media 26 platforms. These fruits and vegetables were offered at a 30 percent discount, further incentivizing their 27 purchase. On average, 1.2 tonnes were sold per store in the first two days of the campaign. This initiative 28 benefits producers, retailers and consumers by increasing the acceptability (and affordability) of imperfect 29 produce that would not normally meet uniformity requirements by retailers. 30
31

HLPE DRAFT V0 (24 October 2016) – DO NOT CITE OR QUOTE
89
Box 35 Banning advertising to children in Quebec, Canada
Since 1980, there has been a ban on commercial advertising targeted at children under the age of 13 in the Canadian province of Quebec. As part of the Consumer Protection Act, advertisement of products (food and non-food items) that are exclusively designed or appeal to children are banned when children consist of 15 percent of the audience. The rest of Canada does not abide by the code; however, there are voluntary commitments to reduce advertising to children under the Canadian Children’s Food and Beverage Advertising Initiative. Although there has been some mixed evidence as to whether or not the ban has been effective in terms of reducing exposure to advertisements, there is some evidence to suggest that the ban was associated with reduced fast-food purchases in Quebec as compared with Ontario.
Source: Dhar and Baylis (2011).
1
Food accessibility 2
The foods that are more available in a given food environment influence what consumers are able to 3 purchase, and subsequently consume. There is evidence from some high-income countries to suggest 4 that in low-income areas consumers experience food deserts with fewer supermarkets and less access to 5 fresh produce and minimally processed foods (Walker et al., 2010). Several studies in the United States 6 of America have begun initiating policies to improve the availability of healthier foods in low-income 7 neighbourhoods, including Philadelphia, Baltimore and New York City, among others. Box 38 provides an 8 overview of the policies that have been put in place in New York to address the issue of food availability 9 and Box 39 provides an example of GAIN’s Marketplace for Nutritious Foods, which aims to increase the 10 availability of chicken to low-income populations in Kenya. 11
12
Box 36 Increasing the availability of fruits and vegetables in low-income neighbourhoods of New York
In an effort to increase fruit and vegetable consumption among lower socio-economic groups in New York City, the city has implemented several initiatives aimed at improving both the supply and demand for fruits and vegetables including Green Carts, the Healthy Bodega Initiative and the Food Retail Expansion to Support Health (FRESH) programme. These initiatives are aimed at improving the availability of fresh produce.
New York City provided vendor licences for Green Carts that sell fresh fruits and vegetables in low-income neighbourhoods. An evaluation of this programme found that the Green Cart programme was reaching low-income populations, some of which reported increasing their fruit and vegetable consumption since shopping at the Green Cart. There is some evidence to suggest that the Healthy Bodega Initiative, which aims to increase the availability, quality and variety of healthy foods in bodegas, led to increased sales of healthier items and some improvements in consumer purchases (Dannefer et al., 2012). Lastly, the FRESH
programme provides zoning and financial incentives to promote the establishment and retention of grocery stores in underserved neighbourhoods. Nineteen FRESH projects have been approved and nine stores have opened since the programme’s commencement. A survey of shoppers conducted by the New York Economic Development Corporation (2015) found that 80.4 percent reported purchasing more fruits and vegetables since the stores opened.
Source: Downs and Fanzo, in press; Dannefer et al. (2012); NYCEDC (2015).
13
Box 37 GAIN’s Marketplace for Nutritious Foods: increasing the availability of chicken to low-income populations
Eric Muraguri used to work at the largest poultry processing company in East Africa. When he noticed that women would come to the slaughterhouse to collect offal and take it back to poor areas in Nairobi to sell, he saw an opportunity. In 2005, Eric quit his job and launched Chicken Choice Ltd., a company that prepares safe and affordable chicken products for those most vulnerable to malnutrition. Chicken Choice

HLPE DRAFT V0 (24 October 2016) – DO NOT CITE OR QUOTE
90
started with a single retail shop on the outskirts of Nairobi and by 2012 had grown to operate eight retail outlets across the city. The Marketplace for Nutritious Foods started working with Chicken Choice in 2013 and has since supported the development of a business plan and a marketing strategy on which to base the company’s expansion. GAIN has provided customer service training to staff and technical expertise to strengthen the company’s financial systems. With support from GAIN’s Marketplace, Chicken Choice has opened six new retail outlets and has procured a refrigerated truck to facilitate safer and more efficient distribution. Funding from GAIN has supported an increase in production capacity as well, through the introduction of new farm facilities outside Nairobi. Rearing its own birds and managing its own retail outlets, Chicken Choice currently works along the entire poultry value chain to make chicken and chicken products, rich in protein, available to consumers from all economic backgrounds. Currently Chicken Choice manages farms at two locations and runs 14 of its own retail outlets, which have sold approximately 140 tonnes (or 1.4 million 100-g servings) of chicken since October 2015. The Marketplace for Nutritious Foods is funded by USAID, the United States Agency for International Development.
Source: GAIN, Marketplace for Nutritious Foods
1
The provision of food in schools, hospitals, workplaces and government buildings has the potential to 2 improve diets but it can also influence production through sourcing of food from local producers. There 3 have recently been a number of countries that have implemented farm-to-school programmes to improve 4 the provisioning of nutritious foods in schools while simultaneously improving linkages between farmers 5 and schools creating a guaranteed market for local farmers. Although the findings related to the impact of 6 farm-to-school programmes are preliminary, they suggest some potential trends in behaviour changes 7 that could lead to healthier diets for children at the same time as providing more diversified income 8 streams for regional growers (Joshi et al., 2008). Box 40 provides an overview of farm-to-school 9 programmes in Brazil and the Caribbean. Moreover, Box 41 describes the development of an innovative 10 tool in Ghana to assist with the planning of school meals that are sourced with local ingredients while 11 meeting nutrient recommendations. 12
Box 38 Farm-to-school programmes in Brazil and the Caribbean
Farm-to-school programmes can provide local farmers with a guaranteed market for the majority of the year, benefiting farmers immensely. At the same time, these programmes can lead to increased access to nutritious foods among schoolchildren representing a win–win situation.
Brazil
In Brazil, the National School Meals Programme (PNAE) requires that at least 30 percent of the food purchased through the school feeding programme be bought locally, directly from family farmers. Moreover, the Food Acquisition Programme (PAA) pays 30 percent more for organic and agroecological food, thus encouraging local, diversified procurement for diversification of the national school feeding programme. The PNAE is required to provide 20 percent of the daily nutritional needs of students enrolled in part-time education when one daily meal is offered and 30 percent of the daily nutritional needs when two or more daily meals are offered as well as in schools located in indigenous and quilombo communities. One of the unforeseen consequences of the nutritional content stipulations of the PNAE was the lack of data on nutrient content of local foods leading them to not be procured for the school meal programme. However, a Global Environment Facility project was funded to allow nutrient content to be analysed and now many highly nutritious local fresh foods can be used in the programme. There is evidence to suggest that the PNAE has led to improvements in the availability and consumption of fruits and vegetables and improved food quality.
Source: Sidaner et al. (2013).
St Kitts-Nevis and Trinidad and Tobago, Caribbean
In St Kitts-Nevis and Trinidad and Tobago the agriculture, education and health sectors worked together to promote a farm-to-fork initiative to tackle childhood obesity. The programme uses a value chain approach to improving the quality of school lunches. The programme has three main pillars: (i) improving children’s diets by increasing fruits and vegetables and animal-sourced foods; (ii) procurement of produce from local farmers; and (iii) equipping smallholder farmers to enhance year-round production of local fruits and vegetables, including drip irrigation, post-harvest quality management and the introduction of new crop
Fujitsu
Nota
School feeding can provide one nourishing meal a day during the school year (about half the year). Can we call this "improving diets" if there is no effect on home diets or on children's own capacity to eat well when they leave school?

HLPE DRAFT V0 (24 October 2016) – DO NOT CITE OR QUOTE
91
varieties. Moreover, catering staff also received training in food service and safety. Yields have increased and post-harvest losses decreased since the initiation of the programme. Children in farm-to-fork schools also consumed more fruits and vegetables compared with schools that were not participating. Moreover, up to 90 percent of the fruits and vegetables supplied to farm-to-fork schools was through local producers compared with almost no local fresh produce prior to the programme’s initiation.
Source: Lowitt et al. (2015); Phillip et al. (2016).
1
Box 39 Developing a tool to design nutritious school meals with locally grown food in Ghana
One of the challenges faced by farm-to-school programmes is the difficulty in ensuring that locally sourced food will meet the nutrient requirements outlined by school feeding policies. In 2003, home-grown school feeding was included as a key intervention for tackling food security in the Comprehensive Africa Agriculture Development Programme. As of 2014, 87 percent (47 of 54) of African countries had implemented school feeding programmes, 20 or more of which included home-grown school feeding. Although the policies for such programmes required “nutritious” meals to be served, there were no clear indications of what that meant in practice. In order to overcome this barrier, a school meals planner tool was developed in Ghana to meet the needs of governments implementing home-grown school feeding programmes as well as to meet the practical requirements of the Ghana School Feeding Programme (GSFP). GSFP menus can be tailored to foods grown by farmers in the community and the broader agroecological zone and are designed at the district level. By linking local market prices and local ingredients, the tool allows the creation a fully costed nutritious menu using locally grown foods. The tool has been used to design menus in 42 out of 216 districts in Ghana.
Source: Fernandes et al. (2016).
2
In addition to farm-to-school programmes, some local governments have begun developing citywide 3 policies to improve the provision of food at the municipal level. There are several cities and municipalities 4 around the world that have developed policies specifying a proportion of food consumed locally that they 5 aim to have sourced locally within a given timeline. It has been estimated that 200 municipalities in North 6 America alone are undertaking food policy work aimed at strengthening food systems (MacRae and 7 Donahue, 2013). Although these projects are in a nascent stage and there is not currently a body of 8 evidence to support their uptake, they may be a promising approach to fostering healthy food systems. 9
10
4.1.4 Knowledge gaps and areas for future work 11
This section has provided examples of policies and programmes with evidence of impact as well as 12 promising policies and programmes that still require further evaluation of their impact. In order to improve 13 diets for populations worldwide, policies and programmes will need to be targeted at a multitude of food 14 system drivers, activities and actors as well as the food environment. There are several gaps in terms of 15 the current state of the evidence including: R&D investment in the production of nutrient-rich foods by 16 both governments and private sector; interventions to improve the storage, exchange and distribution of 17 food among smallholders; primary processing of whole foods (e.g., fish powder) to allow for year-round 18 access to nutrient-rich foods in LMIC contexts; the impact of local/municipal food system policies; and the 19 impact of sustainable dietary guidelines on dietary intakes, among others. Future work should aim to 20 address these gaps. 21
As new policies and programmes are implemented, high-quality evaluations designed to assess their 22 impact will be needed. There are many promising approaches to ensuring that the food system supports 23 the consumption of nutritious foods but the evidence of impact is scarce. Policy and programme 24 interventions at the national and local levels need to be evaluated in order to inform future policy and 25 programme development. Private sector actions aimed at improving the quality of the food system should 26 also be evaluated and the impact of these initiatives should be made publicly available. 27
Fujitsu
Nota
... impact of sustainable dietary guidelines and other nutrition education and behaviour change initiatives ... (since the guidelines themselves can only be a small element in changing food practices)

HLPE DRAFT V0 (24 October 2016) – DO NOT CITE OR QUOTE
92
4.2 Looking to the future 1
This section looks to the future to outline where the opportunities and constraints are for the food system 2 to be more sustainable and where diets can be improved in quantity, quality, safety, diversity and 3 affordability. Some opportunities are seen as current challenges that need to be acknowledged; however 4 challenges can also be opportunities for dynamic change. We highlight four key areas: technology, future 5 areas of research, institutions and partnerships. 6
4.2.1 Technology 7
To meet the challenges of the Sustainable Development Goals and the Decade of Nutrition necessitates 8 investment and the greatest innovation challenge. The challenges are across the value chain from 9 farming, transportation, food processing, waste, health, investment, policy and consumer education. This 10 section will explore the important role that innovation in technology will play in the future of food and 11 nutrition security in the next 30 years. Emerging technologies will likely having system effects. It is 12 imperative for researchers and innovators take a multidisciplinary approach to examine economic, 13 environmental and social system trade-offs.(“A Framework for Assessing Effects of the Food System 14 Characteristics of the Food System,” n.d.) 15
Food technology and fortification 16
Ability to provide nutrient-dense food to alleviate micronutrient deficiencies that lead to stunting and 17 wasting. Micronutrient fortification of food staples and food aid commodities can be a relatively cost-18 effective means of helping to alleviate regional dietary deficiencies of one or more vitamins and minerals 19 critical to good health and development. Adequate consumption of fortified food has been shown to 20 improve nutrition outcomes. While fortification has long been considered a cost-effective best practice, 21 this section will explore emerging technologies in fortification (Nordin et al., 2013; “SUSTAIN - Technology 22 For Better Nutrition,” n.d.). 23
Fortification 24
Without question, the preferred way to prevent malnutrition due to micronutrient deficiencies is to ensure 25 and provide a balanced diet supplying adequate nutrients. However, numerous challenges remain before 26 the global food system will be able to fulfil this need. Food fortification “has the dual advantage of being 27 able to deliver nutrients to large segments of the population without requiring radical changes in food 28 consumption patterns” (WHO | Guidelines on food fortification with micronutrients, 2015) According to 29 GAIN, “food fortification involves adding small amounts of micronutrients to foods, with minimal effects on 30 the taste and cooking properties”. Nutrient fortification is a highly cost-effective investment in population 31 health and well-being. Over 2 billion people lack the essential vitamins and nutrients needed to grow and 32 live healthy lives, primarily due to diets consisting of starchy staples that provide calories but not 33 nourishment (Sommer et al., 2009). Worldwide, according to WHO, “an estimated 250 000 to 500 000 34 vitamin A-deficient children become blind every year, half of them dying within 12 months of losing their 35 sight”. 36
Some of the key micronutrients of concern globally, and therefore the biggest targets for fortification 37 programmes, include iron, zinc, iodine, vitamin A, folic acid and vitamin D. Insufficient amounts of these 38 nutrients in the diet, especially during pregnancy, infancy and childhood, can lead to severe and often 39 permanent developmental issues. Currently, fortification predominantly takes place during the processing 40 of foods, and requires that fortified foods get to malnourished populations regularly and in sufficient 41 quantities to be effective. 42
There are many success stories in food fortification, but micronutrient deficiencies continue to exist. 43
New fortification technologies 44
Milled rice grains: because rice is often washed before cooking and consumption, fortification can 45 be less effective as the added nutrients can be washed away. Fortified rice-shaped kernels can 46
Fujitsu
Nota
Could consumer capacity be a fifth key area (consumer education is highlighted in the following paragraph)? This would balance the largely supplyside focus of the document and give some space to people's actions on their own behalf, consumer movements etc.
Fujitsu
Nota
have
Fujitsu
Nota
sentence needs a main verb
Fujitsu
Nota
Is there any assessment of the extent to which food fortification with specific micronutrients can affect overall nutrition status, especially in comparison with food solutions? It would fit in well here,
Fujitsu
Nota
Can we have more on affordable low-tech solutions? They can be socially innovative even if they are technically conventional.

HLPE DRAFT V0 (24 October 2016) – DO NOT CITE OR QUOTE
93
be made using rice flour and a mixture of vitamins and minerals (Roks, 2014). These kernels can 1 then be mixed in with unfortified rice grains and supplied to undernourished communities. 2
Crop fortification/biofortification: the need for post-production fortification of staple crops could be 3 reduced or eliminated if the crops themselves are able to incorporate or produce sufficient 4 amounts of micronutrients of concern. This can take place through improvements to the ways in 5 which foods are grown (including soil health), enhanced nutrition through conventional plant 6 breeding techniques and by genetic modification to have plants produce nutrients they otherwise 7 would not be able to. 8
o Agronomic fortification: efforts are being made to understand how, physiologically, plants 9 incorporate certain nutrients from the soil, such as iron or zinc, into their edible tissues as 10 they grow, and under what conditions they promote the concentration of nutrients. The 11 depletion and degradation of soils may play a significant role. Agronomic fortification is 12 the process of supplying micronutrients through fertilization or supplemented irrigation 13 water, as well as utilizing other practices that may promote increased absorption of 14 nutrients. Cakmak (2008) has suggested that zinc fortification of cereals may be a “useful 15 strategy in solving Zn deficiency-related health problems globally and effectively”. 16
o Genetic modification: although the most widely known crop traits promoted through 17 genetic modification include herbicide resistance, pest management and drought 18 tolerance, there has been significant research into introducing or increasing micronutrient 19 concentrations in important staple crops. Progress has been made in the accumulation of 20 iron, zinc, vitamins A and E, and others (Poletti et al., 2004). Golden rice, which has been 21 genetically modified to produce beta-carotene (a metabolic precursor to vitamin A) in its 22 grains, it one of the best known examples of fortification through genetic modification. It 23 has not been widely deployed yet because of the development time needed to bring 24 nutrient concentrations up to useful levels, and because of a high level of resistance to 25 genetically modified food crops. 26
27
Considerations 28
The most significant consideration surrounding fortification is whether or not it is worth the investment in 29 new technologies when the existing successful method of merely adding micronutrients to foods during 30 processing might simply be expanded. In theory, fortification that occurs during production rather than 31 processing might become self-sustaining instead of requiring ongoing support and management. 32 However, nutrient fortification at the moment is typically quite inexpensive and often not very complicated 33 to deploy, in theory. Genetic modification, if the new crops are successful and adopted, would likely 34 remove much of the need for centralized logistics and administration for micronutrient fortification, 35 although the crops themselves would still be exposed to the risks (drought, disease, fertility loss, etc.) 36 faced by agriculture in general. There are also ethical issues that need to be resolved with genetic 37 modification. 38
Food safety 39
Food safety is an essential component of food security and closely coupled with health and nutrition. In 40 vulnerable, food-insecure areas, hygiene, safety and nutrition are often neglected in order to fulfil basic, 41 immediate needs. Food-borne illnesses are caused by bacteria, viruses or chemical substances that 42 enter the body through contaminated food or water. Because food and water contamination can occur at 43 all points in the production and distribution system, there are numerous ways that must be employed to 44 effectively address these issues from production to preparation. Unsafe foods create a cycle of disease 45 and malnutrition for many and are the direct cause of 420 000 deaths per year (Food Safety, 2015), 46 disproportionately affecting children and the elderly. Improving food safety by addressing food and water 47 contamination is a critical consideration in addressing food and nutrition security. 48
Contamination by micro-organisms such as bacteria, viruses and mycotoxins is the most common cause 49 of food-borne illness but chemical food safety is also a concern; pesticide residues and heavy metals can 50 negatively impact both short- and long-term health. 51

HLPE DRAFT V0 (24 October 2016) – DO NOT CITE OR QUOTE
94
Food safety efforts focus on minimizing the contamination of raw materials, inactivating pathogens during 1 processing, and preventing recontamination and growth of micro-organisms after processing. Many 2 innovations in food safety technology are in making basic heating and cooling technologies more 3 accessible through improving the efficiency and affordability of existing methods and altering them to 4 work effectively at various scales. 5
Emerging technologies in food safety 6
Processing interventions: Processing techniques that can be used to reduce microbial activity 7 include removal and inactivation. Emerging and innovative technologies in this field include 8 filtration, centrifugation and separation, which are driven by pressure gradients. Inactivation unit 9 operations include a number of physical and/or sporicidal effects. Due to different fundamental 10 principles, the performance capabilities of novel technologies and processes differ from traditional 11 processing in terms of the types of food categories that can be treated, microbial efficacy, 12 destruction models, desired and undesired effects on food quality, and their economic and 13 environmental impact (Koutchma and Keener, 2015). 14
Biosensing technology: Smart monitoring of nutrients and fast screening of biological and 15 chemical contaminants are among the key evolving issues challenging the assessment of food 16 quality and safety. Advances in material science and nanotechnology, electomechanical and 17 microfluidic systems, protein engineering and biomimetics design are boosting sensing 18 technology from bench to market. Biosensors exhibit many features in terms of reliability, cost 19 efficiency, stability and multiplexing analysis and can allow for real-time, on-line measurements 20 along the supply chain (Scognamiglio et al., 2014). 21
Mycotoxin prevention: There are many strategies being developed and employed to prevent the 22 prevalence of mycotoxins, a pathogen produced by a wide variety of moulds. Chronic effects 23 often result from prolonged ingestion of low to moderate levels of toxin that do not produce 24 symptoms of an acute illness, making the chronic effects difficult to contribute to contaminated 25 food (Archer et al., 2002). Mycotoxins can contaminate agricultural produce, both in the field and 26 during storage. The use of pre-harvest control strategies for resistant varieties, field management, 27 the use of biological and chemical agents, harvest management and post-harvest applications, 28 including improving drying and storage conditions, and irradiation have been shown to be 29 important in the prevention of mycotoxinogenic mould growth and mycotoxin formation. Emerging 30 research and application have demonstrated the utility of utilizing biological control strategies 31 (inoculation) to prevent the pre-harvest aflatoxin contamination of crops (Milićević et al., 2010). 32
Disinfection: Technology plays a major role in drinking water disinfection, which is a vital part of 33 protecting the public from outbreaks of infectious and parasitic diseases found in water (Amy et 34 al., 2000). Adding chlorine, chloramines, ozone, iodine, chlorine dioxide and ultraviolet light are 35 common ways to affect water’s microbial, chemical and aesthetic qualities (AwwaRF, 2007). 36 Principal factors that influence inactivation efficiency of these agents are the “disinfectant 37 concentration, contact time, temperature, and pH” and must therefore be closely monitored to 38 achieve desired outcomes (WHO, 2004). Water filtration systems are another commonly used 39 form of water disinfection continually undergoing technological innovation. Filtration technologies 40 can be an effective and consistent barrier for microbial pathogens. Filtration processes and 41 membrane technologies in water treatment differ for different microbial particles and further 42 investment is needed (WHO, 2004) .Simple cost-effective deployable membrane or filtration 43 techniques could help reduce the incidence of diarrhoeal diseases, food contamination and other 44 bacteria manifestations. 45
46
Considerations 47
There are numerous emerging technologies relevant to food safety at all levels of the supply chain; 48 however, because most food-borne illnesses occur in developing areas with minimal access to electricity 49 and other modern technologies, emphasis is placed on making existing technologies, such as those 50 which allow for the basic heating and cooling of raw materials and the storage of these products after 51 processing, affordable and accessible at all scales. 52
Fujitsu
Nota
Can this section also include household practices (e.g. promoted by WASHE), or is it only intended to deal with commercial processes?
HLPE DRAFT V0 (24 October 2016) – DO NOT CITE OR QUOTE
95
Technological innovations that address these challenges play a leading role in the future of food safety. 1 Food-borne illnesses are a major public health concern and the safety of food is of utmost importance in 2 dialogues regarding food and nutrition security. 3
Transportation and storage 4
“Too often, missing or poor-quality infrastructure prevents the connectivity needed for well-5 functioning modern supply chains.” (Bereuter et al., 2016) 6
Effective transportation and logistical systems are the components of a food system that connect 7 production to consumption and help to ensure the reliability and accessibility of foods delivered within 8 their useful life spans. To varying degrees, supply chain efficiency also influences the safety and 9 affordability of foods, all of which are critical considerations for a secure and sustainable food system. As 10 global populations continue not only to grow but redistribute geographically, existing supply chains will 11 need to expand and adapt. Shifts in dietary preferences, which may occur as populations become more 12 urban and as social and economic conditions change for many people, could place additional demands 13 on distribution systems. With an estimated 40 percent of food wasted globally, it is essential to address 14 the challenges of getting food from harvest to the consumer without spoilage .For example, increased 15 meat consumption or the demand for fresh fruits and vegetables further from their farm sources could 16 lead to increased spoilage and loss without appropriate cold storage en route, at distribution hubs, at 17 retail sites and in homes. Additionally, using edible food that could be donated to the hungry or a 18 secondary market is frequently a logistics problem to procure and redistribute. 19
Transportation 20
Naturally, transportation also has a clear relationship to the environmental impacts of food and 21 agriculture, most directly through carbon emissions. It has been estimated that 25 percent of the total 22 energy consumption of the food system in the United States of America is through diesel fuel use (Heller 23 and Keoleian, 2000). Any gains made in transportation efficiency will bring sensible emissions reductions. 24
While a great deal of emphasis is placed on food systems based upon local, sometimes smallholder 25 agriculture in sustainable food systems, the ability to also transport food regionally and globally will add 26 resilience in the face of a changing climate. More frequent and widespread droughts and floods would, for 27 example, make regional short-term fluctuations in food production more severe, and “how strongly these 28 impacts will be felt will crucially depend on whether such fluctuations can be countered by… higher food 29 imports” (Schmidhuber and Tubiello, 2007). 30
New transportation technologies 31
Satellite technologies: Satellite technologies, including GPS, “enables shippers and carriers to 32 monitor quality, reduce risk (and costs) of liability claims, and shorten cargo delivery time. 33 Profitability in perishable product trade will likely increase further as… technologies continue to 34 adapt” (Coyle et al., 2001). In addition to providing these benefits, the use of satellite technology 35 can aid in the traceability of food, of increasing interest to many in the supply chain, by providing 36 detailed information about the path a product takes on its way to consumers. 37
Refrigeration: Advances in refrigeration technology will continue to allow greater control over food 38 quality and longevity. Some refrigerated transportation containers now allow for control over not 39 only temperature but atmospheric composition, airflow, ventilation and humidity, further reducing 40 spoilage by maintaining ideal conditions and slowing down the ripening process during shipping. 41 A recent report by the California Air Resources Board identified several promising technologies 42 that have the potential to dramatically reduce the emissions impact of refrigerated transportation; 43 these include cryogenic transport, hydrogen fuel cell-powered refrigerated transport and all-44 electric and cold plate transport refrigerators. 45
Transportation logistics: Transportation management systems (TMS) can offer food transporters 46 fast and efficient means of planning, executing, tracking and measuring supply chain routes and 47 key performance indicators. While these systems are used widely throughout food systems, 48 further deployment in developing areas or in the face of an uncertain climate could lead to better 49 decision-making and greater food security. The ability to integrate with other data-driven 50
Fujitsu
Nota
Would be good to have a note on small-scale green energy solutions to local refrigeration as well as high-tech ones.

HLPE DRAFT V0 (24 October 2016) – DO NOT CITE OR QUOTE
96
technologies, such as real-time weather or traffic reporting systems, will maximize their 1 effectiveness worldwide. 2
Other emerging technologies: Additional transportation technologies, such as drones and self-3 guided vehicles, hold great potential for food security as they do for many other matters. For 4 example, they could bypass the need for additional infrastructure but still reliably reach small or 5 remote communities. 6
7
Storage 8
Although efficiency in transportation is important to get food to its destination within its useful life, the 9 ability to properly prepare and store foods can increase their life spans. Unless a food product is ordered 10 or purchased at the point of production by a consumer, it will very likely be stored at least once within the 11 value chain (Wakeland et al., 2012). Sufficient storage capacity can reduce losses and moderate 12 fluctuations in production and pricing, and help to keep food systems sustainable and secure. 13
There are also a number of promising technologies that may be applied to food during the processing 14 stage to enhance shelf-stability and possibly reduce the need for other types of energy intensive storage, 15 such as refrigeration. These include (Augustin et al., 2016): 16
High pressure processing: Subjecting certain foods to high pressures can disrupt or destroy 17 microbial cells without the risk of diminished food quality and nutrient value that can come with 18 high temperature treatments. 19
Pulsed electric field: Pulsed electric field application to foods can disrupt microbe activity and has 20 potential as an alternative to pasteurization. 21
Cool plasma: Low temperature plasma technologies can be applied to foods or processing 22 equipment to clean and sterilize without harming the integrity and nutritional value of the food, in 23 specific applications. 24
Ultrasound: Ultrasonic frequencies have been demonstrated to facilitate the separation and 25 reclamation efficiency of oils from foods and enhance homogenization 26
27
Nutrition-smart accessibility through technology 28
Consumers face many barriers to healthy eating, and the way that they interact with food and health is 29 affected not only by their own beliefs and decisions but is influenced by the people in their lives, their 30 community and environment, and the culture that they live in. Increasingly, technology is playing a bigger 31 role in influencing behaviour though nudges or prompts in purchasing decisions. A technology focus on 32 prevention through nutrition and wellness category could be a well over USD trillion dollar market 33 opportunity 34 (https://www.mckinseyonmarketingandsales.com/sites/default/files/pdf/Consumer_Health_Wellness.pdf). 35 The increase in available technology has empowered consumers to take charge of their own health. The 36 ability to take the best available science and co-create it with consumers for real-time data on health 37 outcomes can be a transformation to the nutrition research community. 38
Smart apps and wearables 39
● Wearables are on the rise for development and have allowed consumers to take control of their 40 physical activity. 41
● Trackers for food and nutrition intake and tech-powered water bottles that track water intake. 42 ● Straight-to-consumer nutrition and health coaching has risen in recent years, largely due to tech-43
powered innovation that has increased telehealth coaching capabilities and led to the creation of 44 apps that rank how healthy a food is for a person based on specific anthropometric data. 45
● Other trackers and apps focus on providing solutions for specific populations, for diabetics 46 tracking their blood sugar levels or helping consumers with food allergies. 47
48
Nutritious meal consumption 49
Fujitsu
Nota
Seems to apply mainly to the developed world.

HLPE DRAFT V0 (24 October 2016) – DO NOT CITE OR QUOTE
97
In both the developed and developing world, with the increase in urbanization and increase in work 1 productivity, the available time to procure ingredients to cook a nutritious meal may need innovation. 2 Innovations to have groceries delivered or healthy meals that meet dietary needs. 3
● Apps that focus on providing a fast, easy way to order groceries to be delivered within the hour. 4 ● A variety of other apps aid consumers in making shopping lists, providing recipes and cooking 5
meals at home easier. Some apps go a step further, providing consumers with step-by-step 6 cooking instructions through voice command. 7
● Smart appliances designed to make healthy eating and cooking easier. 8 ● Convenient and ready-to-cook meals, delivered weekly to keep families within a budget and 9
cooking, are exploding. 10 11
Considerations 12
Advancements in science will increasingly become translated at the personal level as consumers seek 13 specific solutions to preventative health needs. Consumers increasingly will look for immediate 14 information and solutions rather than waiting for expert advice on health and nutrition. The ability to 15 connect the right social nudges through information and convenience will help combat the issues of 16 obesity. 17
18
4.2.2 Food system changes 19
Based on existing research results, good practices and lessons learned, this section identifies some 20 promising changes that may influence the food systems and bring about healthier nutrition outcomes in 21 the future. This section covers activities and actors, the food environment, and economic and socio-22 cultural elements of food systems. Issues of ethics and justice, and top-level design of leveraging a food 23 system for nutrition are also involved. 24
Food system activities and actors 25
Promising changes targeting different parts of food value chains include: promoting sustainable natural 26 resource management and diversified agroecological production systems; developing a cold chain; and 27 taking advantage of the booming trend of supermarkets and e-commerce development. 28
Resources 29
Sustainable natural resource management. The sustainable agricultural intensification approach ensures 30 the current food system is more efficient by using new technologies and improving current production 31 systems (IFPRI, 2014). Some agricultural practices have led to the pollution and degradation of land and 32 water resources from excessive fertilizer and pesticide runoff, the destruction of agricultural ecology and 33 decreased production potential. The issue of land degradation has been compounded by dwindling farm 34 sizes (IFPRI, 2016b), while on the other hand, urbanization in transforming economies has urged land 35 consolidation and may imply additional water needs (Liu and Saveniji, 2008). In both ways, sustainable 36 agricultural intensification holds promise to play a role in the broader effort to ensure food security with 37 sustainable management of land and water and preservation of biodiversity, which can help improve 38 health and nutrition not only directly by offering nutritious and safe food, and a good environment, but also 39 indirectly by maintaining agricultural yields and incomes (Herforth, 2010; Fan and Pandya-Lorch, 2012). 40 Adoption of sustainable agricultural practices includes enhanced nitrogen-use efficiency, no-till cultivation, 41 heat- and drought-tolerant crop varieties, precision agriculture, drip irrigation, and crop protection against 42 diseases, weeds and pests (IFPRI, 2013). In terms of wider community development changes in areas 43 known to have potential contributions to nutrition, availability of improved water sources and toilets are 44 improved good practices. Systematic reviews have shown that improving water quality can reduce the risk 45 of diarrhoea by 17 percent, and introducing hand hygiene interventions can reduce gastrointestinal illness 46 by 31 percent and respiratory illness by 21 percent. WASH (Water, Sanitation and Hygiene) provides a 47 set of good interventions, such as safe and reliable pipe water supply (improvements in water quality) and 48 sewer connections, and the availability and usage of sanitation facilities (IFPRI, 2016b). In this process, 49 both government and civil society are likely to be integral to success, with government providing strategic 50
Fujitsu
Nota
Advances
Fujitsu
Nota
Could have a box in the text to explain nudges, and the fact that they only work when the need is immediately apparent to the nudgee.

HLPE DRAFT V0 (24 October 2016) – DO NOT CITE OR QUOTE
98
direction, funding and coordination among multiple actors, including the private sector, and communities 1 adapting models to their own unique environments, improving sustainability. 2
Production 3
Diversified agroecological production systems. Diversified agroecological systems, which is a 4 fundamentally different model of agriculture based on diversifying farms and farming landscapes, 5 optimizing biodiversity and stimulating interactions between different species (IPES-FOOD, 2016), is 6 recognized as a win–win solution that brings ipositive environmental and nutritional outcomes. Even 7 though the yield comparison of conventional and agroecological systems remains a controversy (Badgley 8 et al., 2007; Pretty et al., 2006; Rodale Institute, 2015), consensus has been reached that diversified 9 agroecological systems can deliver more stable outputs over time, enabling farmers to build resilience in 10 the face of natural shocks (Altieri et al., 2015; Rodale Institute, 2015), contribute to carbon sequestration 11 (Aguilera et al., 2013), resource efficiency (Gliessman, 2007) and wild biodiversity (Scherr and McNeely, 12 2008), improve dietary diversity at the farm household level and beyond (Carletto et al., 2015), and 13 reduce exposure to harmful chemicals used in agriculture, which will make food safer. As for the supports 14 of transition to diversified agroecological systems, some governments have started to provide incentives 15 for moving away from industrial modes of agriculture (IPES-FOOD, 2016). Integrated landscape initiatives 16 can help to lay the foundations for food systems that are diversified at multiple levels; these initiatives 17 often organized by environmental organizations and farmer learning networks, and have proved to be 18 fruitful (Milder et al., 2014). International collaborative research on integrated food systems and peer-to-19 peer field actions such as spreading agroecological knowledge and techniques to farmers can also make 20 a difference (IPES-FOOD, 2016). Activities in diversified agroecological systems are labour-intensive, 21 which is a barrier for promoting the system. In some remote areas, farmers conduct diversified 22 agroecological production instinctively, but on a very small scale and badly connect to the markets, which 23 limit its development and value added opportunities. A set of movements such as improving organic food 24 certification, building a tracing system and cold chain, and expanding market channels should be 25 enhanced to make the system viable and sustainable. 26
Storage, exchange and distribution 27
Developing cold chains. Improving the techniques and management strategies at the stages of storage 28 and distribution can not only add economic value by saving management cost, increasing efficiency and 29 reducing food loss but can also reduce nutritional value loss by keeping food from being corrupted 30 quickly, and can retain shelf-life and food safety (FAO, 2015c). Developing a cold chain is a promising 31 way for better nutrition at this stage, especially for middle- and low-income countries. A cold chain refers 32 to an uninterrupted series of activities that maintain a given temperature range from the production point 33 to the consumer. Effective cold chain management starts with pre-cooling, cold storage, refrigerated 34 transport and refrigerated display during marketing (HLPE, 2014). A cold chain is mainly developed for 35 perishable foods such as vegetables, fruits and fish, which have a lot of nutritive value and can bring high 36 economic benefit to farmers. A well-managed cold chain can activate the food value chain by generating 37 aggregation effect of perishable food producers, stimulating primary processing and tertiary industry in 38 the community, which can create more job opportunities, stabilize increased income and realize inclusive 39 development of smallholders. Consumers can also benefit from fresher foods. To develop a cold chain, 40 the most important issue is to improve the cold chain infrastructure; this iusually starts with interventions 41 by governments, and then actual investment by traders, food enterprises and even large supermarkets. 42 For example, in Tunisia, cold chain development has been written into the national plan, and it helped to 43 incentivize investment of the private sector, which enabled the cold storage capacity to increase by 65 44 percent in ten years (HLPE, 2014). Well-trained technicians and better management to overcome 45 underutilization of equipment also need to be in place. Moreover, the government cannot lose sight of 46 other important supporting conditions such as road infrastructure, improved product specialization and 47 standardization. 48
Retail, marketing and advertising 49
Supermarket booms. Many developing countries are experiencing a food system transformation with a 50 rapid growth of supermarkets. The supermarket revolution is impacting dietary patterns and nutritional 51

HLPE DRAFT V0 (24 October 2016) – DO NOT CITE OR QUOTE
99
outcomes. As the supermarkets modernize the procurement of fresh products, governments need to 1 supplement private efforts with public investments in improving farmers’ access to assets, services, 2 training and information, and make efforts to provide assistances with market linkages between small 3 farmers and supermarkets (Reardon and Gulati, 2008). For example, in recent years China has been 4 advocating supermarkets should have direct procurement links to farmers with fresh agricultural products. 5 In addition, the total nutrition effects of supermarket participation could be even more positive if women 6 were able to keep their control over farm revenues in the process of commercialization (Chege et al., 7 2014). For consumers, several empirical studies have been carried out to evaluate how changes in the 8 retail environment affect their diet and health status, especially in developing countries. In particular, the 9 relationship between supermarket access and overweight/obesity has generated discussion (Chege et 10 al., 2014; Umberger et al., 2014). Different policy measures should be developed to ensure that 11 supermarkets have a "healthier" impact on diets and should be encouraged to supply more healthy food 12 items such as fresh fruits and vegetables at affordable prices. 13
E-commerce. Information technology has played an increasingly important role in today’s business 14 activities, which has led to the emergence of e-commerce. In developing countries, business-to-consumer 15 (B2C) e-commerce is rapidly expanding, particularly in Asia and Africa. China has already emerged as 16 the largest global market for B2C e-commerce (UNCTAD, 2015). The development of e-commerce has 17 been affecting the food system, and the relationship has changed across the actors in the food supply 18 chain. Farmers, especially smallholders, have the opportunity to run their own business by integrating the 19 application of e-commerce into their innovative ideas or local advantageous industries. They could also 20 be involved in the food supply chain and build closer market linkages with customers through e-21 commerce platforms. Agricultural firms have been changing the way they think about their business 22 structure and functions by adopting e-commerce practices (Manouselis et al., 2009). Due to the existence 23 of several barriers to further development, governments need to take actions to establish a good e-24 commerce environment for related actors, including making national strategies for medium- or long-term 25 development, building legal and regulatory frameworks for trust transactions between traders, improving 26 awareness and knowledge related to e-commerce among different actors and providing ICT 27 infrastructure. 28
Food environment 29
Institutional changes in the food environment can help create affordable, accessible and available healthy 30 food choices and improve consumers’ knowledge and awareness of healthy diets. 31
Food accessibility 32
Improving community food options: Community food environments have direct impacts on food options, 33 which will then affect consumers’ food choice and diet quality. For example, people who live near an 34 abundance of fast-food restaurants and convenience stores, compared with grocery stores and fresh 35 produce vendors, have a significantly higher prevalence of obesity and diabetes (Babey et al, 2008). For 36 promoting healthy diets, policies such as providing retail incentives, promoting smaller-scale markets 37 such as grocery stores, community gardens and farmers’ markets that sell fresher healthier foods, using 38 zoning to limit the number of fast-food restaurants in overburdened communities, and requiring nutritional 39 information on restaurant menus (Babey et al, 2008). 40
Food affordability 41
Affordable healthy foods: Affordability is an important element of consumer choice. If nutritious foods are 42 unaffordable, education may not help to increase consumption (Lee, 2016). Food price incentives and 43 related interventions are promising ways to improve food affordability – for example, exemption of healthy 44 foods from a goods and services tax or a value-added tax; subsidies to agriculture and related industries, 45 such as rural and transport subsidies; and subsidies or voucher systems targeted to high-risk groups 46 (Lee, 2013). One study found that consumption of nutritious foods decreased with affordability, and 47 affordability of nutritious foods decreased as the economic level of countries decreased (Miller, 2016). 48 Therefore, international policy approaches and cooperation for improving food affordability for those of 49 low income should be initiated and developed. 50
Food quality 51
Fujitsu
Nota
Perhaps I'm not reading this right, but do you mean "increased" instead of "decreased"?
Fujitsu
Nota
The influence can be reciprocal: the environment and theconsumer are both conditioned and conditioning - e.g. in areas where consumer demand for fast-food restaurants is high, the market will supply. The trick is to work out the balance.

HLPE DRAFT V0 (24 October 2016) – DO NOT CITE OR QUOTE
100
Enhancing food traceability: Consumer demand has refocused agricultural and food markets from price-1 based to quality-based competition (Henson and Reardon, 2005). Consumers have increasingly focused 2 on a broader array of food quality, from where and how their food is produced to their environmental and 3 social impacts. Traceability is a method of providing safer food supplies and of connecting producers and 4 consumers; it is the ability to trace and follow food, feed or food-producing animals or ingredients, through 5 all stages of production and distribution. The direct benefits of traceability are supply chain optimization, 6 product safety and market advantages (Regattieri et al., 2007). Consumers are able to track the full path 7 of food from the origin to the table, know the quality of the food and buy safer food to meet their needs. 8 Food firms on the other hand may gain customer satisfaction, reduce operating costs and increase 9 productivity. Unfortunately, there is currently no general legal requirement for the establishment and 10 monitoring of traceability systems in food chains. In addition, a compatible traceability standard has not 11 been established. Therefore, it is necessary that government puts in place certain requirements for 12 tracing, and ensures that sectors more effectively. 13
Knowledge and awareness 14
Advertising: The traditional function of advertising is to sell more of the branded products or service, and 15 to gain a higher benefit, but now research indicates that health-related communications can have 16 significant and measurable effects on consumer cognition, emotions and behaviour (Pechmann and 17 Catlin, 2016). Government should adopt legislative resolutions to limit advertising and marketing of 18 unhealthy foods and beverages to children (Boyle et al, 2007). Furthermore, public service advertising 19 can encourage people to be aware of the significance of nutritious diets and healthier food consumption 20 behaviour, which need to be extended in the future. 21
Communicating dietary guidelines: Guidelines play a positive role in guiding and educating people to 22 adopt a balanced diet and enhance health. Many countries have formulated their own dietary guidelines 23 and are universally guided by the science on what is considered a healthy diet; however, their impact on 24 consumer behaviour change is mixed. In the United States of America, while knowledge of consuming 25 five fruits and vegetables per day increased over a five-year period, consumption of five fruits and 26 vegetables did not change. Thus, guidelines need to be effectively communicated to instil their adoption 27 (ref). 28
Food labelling: Driven by increasing consumer demand for healthier, safer and more environmentally 29 friendly food products, the use of food labelling has been very important (Loureiro and McCluskey, 2000). 30 It consists of many categories, such as food and nutrient composition, sourcing and fair trade. However, 31 issues remain with labels. First, whose duty is it to certify the labels to ensure they meet specific 32 standards and exhibit accurate information? Second, what are the most effective ways to communicate 33 information to consumers and ensure that labels are understandable? For example, dates provided on 34 the packages of food and drinks, such as “use-by,” “sell-by” and “best before,” are intended to provide 35 consumers with information regarding the freshness and safety of foods (Lipinski et al., 2013). However, 36 these seemingly simple dates can actually confuse consumers about how long it is safe for them to store 37 food and when they should dispose of uneaten items. 38
Economic drivers 39
Economic interventions aimed at a healthy diet for nutrition include taxes on non-preferred food types and 40 subsidies for nutrient-rich foods to influence the production and consumption. Trade policies that enhance 41 tliberalization and globalization should be promoted while the counter-cyclical trade policies and the 42 banning of food exports should be eliminated. 43
Taxes 44
Food taxes have been frequently identified as a powerful tool to improve population diets (WHO, 2015), 45 with evidence indicating that taxes are an effective intervention to improve the healthiness of consumption 46 patterns (Thow et al., 2014). WHO recommends that country-level programmes targeted to combat 47 obesity should include economic tools, such as taxes and subsidies, to improve the affordability of healthy 48 food products and discourage the consumption of unhealthy options. One set of levers that could affect 49 people’s economic access to healthy foods consists of the “fat taxes” and “thin subsidies” (Joanna and 50
Fujitsu
Nota
Make it clear that this depends on the level of consumer education, which enables consumers to recognize quality and the need for it. Large
Fujitsu
Nota
Large parts of the global population are unable to do this.
Fujitsu
Nota
main verb needed
Fujitsu
Nota
Instead of "effectively communicated" we can say "guidelines need to be translated into continuing action through effective food education and behaviour change approaches involving all relevant channels (e.g. community action programs, workplace canteens, food markets and supermarkets, health services, schools)"

HLPE DRAFT V0 (24 October 2016) – DO NOT CITE OR QUOTE
101
Tunis, 2014). These are gaining ground in many countries as a way to mitigate obesity trends. A fat tax 1 would be a useful tool to generate revenue that could be allocated towards prevention or information 2 campaigns (Chouinard et al., 2005; Kuchler, 2005). Furthermore, evidence from Denmark shows that 3 dietary effects of nutrient- and food-based taxes coupled with subsidies are minimal, but more improved 4 nutrient intake occurs when the tax is focused on nutrient content rather than on specific food items (e.g. 5 saturated fats vs red meat) (Jensen and Smed, 2007).The research on an additional 20 percent tax on 6 sugar-sweetened beverages (SSBs) on health and health-care expenditure in Australia shows an 7 average change in consumption of SSBs from 141 g/day to 124 g/day across the Australian adult male 8 population and from 76 g/day to 67 g/day for women, representing a 12.6 percent decrease. Twenty-five 9 years after the introduction of the tax, there would be 4 400 fewer prevalent cases of heart disease and 10 1 100 fewer people living with the consequences of stroke, and an estimated 1 606 lives everted as a 11 result of the tax (Veerman et al., 2016). This is particularly important information for policy-makers, for 12 whom the timeframe for return on investment is likely to be an important consideration. As we move 13 forward on taxing foods, governments need to carefully design and implement effective food taxes that 14 put constraints on the production and marketing of unhealthy foods and beverages but being aware of 15 autonomy issues. Because poorer people tend to spend a larger share of their incomes on food, these 16 taxes could hit poor people’s pocketbooks the hardest. Besides taxing non-preferred food types, ”choice 17 editing” is another means, through regulatory or voluntary actions including purchasing guidelines by 18 retailers and the food service sector, to restrict choices by consumers or selectively enhance access to 19 better foods (Foresight, 2011). 20
Subsidies 21
Subsidy interventions can be used both at production and consumption stages. From the producers’ side, 22 fiscal incentives to promote resource-use efficiency include resource management pricing that 23 internalizes the social and environmental costs and benefits of agricultural production, including the 24 gradual elimination of agricultural subsidies that encourage the overuse of agricultural inputs such as 25 water and fertilizers. Policy-makers should use the savings from the elimination of distortive subsidies to 26 diversify agricultural production and consumption to include more nutritious food products such as beans, 27 vegetables, fruits and dairy products. Moreover, nutrition outcomes, instead of productivity goals, should 28 be used to evaluate the performance of the agriculture sector (Joanna and Tunis, 2014). 29
A more direct means to exert influence would be to promote healthy diets within government-sponsored 30 feeding programmes (for example, relief efforts or school lunch programmes), although the benefits would 31 be limited to the intervention’s target population (Shenggen and Rajul, 2012). Also, some nutrition 32 programmes precisely targeted provide a valuable consumption subsidy to low-income citizens. 33
Trade policy 34
Researchers have explicit accounts for the role of sectors that are most relevant to improving people’s 35 nutritional status: agriculture, trade and infrastructure, and health and education (Shenggen and Rajul, 36 2012). International markets, which are becoming increasingly integrated, can help domestic and foreign 37 food producers both increase and improve food production. Highly-specialized industrial agriculture and 38 export orientation have reinforced each other over time; the global division of labour into specialized 39 production zones has yielded large volumes of tradable commodities, facilitating global agricultural trade 40 which, in turn, has created further incentives for specialized, export-oriented farming. The food system is 41 not a single designed entity, but rather a partially self-organized collection of interacting parts. For 42 example, the food systems of different countries are now linked at all levels, from trade in raw materials 43 through to processed products (Foresight, 2011). 44
Socio-cultural drivers 45
Improving community-based nutrition programmes 46
Community-based nutrition programmes have contributed a lot to combat malnutrition (IFPRI, 2016b). 47 Besides nutritional outcomes, these programmes often deliver other outcomes such as diversifying local 48 production, reviving the local economy, reactivating the rural environment and protecting the ecosystem 49 and landscape (Serra-Majem, 2016). Context or environment, such as high literacy rate, women’s 50 empowerment, community organizational capacity and structures, appropriate legislation, and adequate 51
Fujitsu
Nota
NB Behaviour changes resulting from taxes are generally assumed to be due to price change. However tax proposals are often accompanied by media controversy which can itself have a major effect, as for example in NY, where the tax was not eventually implemented but consumption of soft drinks nevertheless went down after long public discussion of the tax.
Fujitsu
Nota
Yes -and this is seldom done. Should also consider that real performative adoption of healthy diets by a target population is transferred across generations.
Fujitsu
Nota
"Trade" here does not seem to deal with the import of processed foods and possible trade barriers, important elements in the nutrition transition - Or is that dealt with elsewhere?

HLPE DRAFT V0 (24 October 2016) – DO NOT CITE OR QUOTE
102
infrastructure, is essential for community-based nutrition programmes to run smoothly and succeed in the 1 long run. This robust context is particularly influenced by policy and governmental investment. Besides 2 policy-makers, researchers, donors, community organizations and community leaders are key actors in 3 such programmes, who can mobilize and motivate people to do more for themselves in a genuinely self-4 reliant way; that is why a bottom-to-top pathway in such programmes is encouraged and has often proved 5 to have a better effect than top-to-bottom ones. Individuals and communities should be prompted to 6 participate in assessing the nutrition problem, analyse its causes and their available resources, and act in 7 response (IFPRI, 2016b). In addition, respect must be paid to local and native culture, religion, tradition 8 and resources in designing and complementing such programmes. To be more specific, do not simply 9 copy reproducible pervasive methods and experiences to design a community-based programme; the 10 characteristics and main nutritional problems of ”the community” should be carefully clarified, and then a 11 unique programme tailored for ”the community”. For example, if resource advantages are clearly 12 identified, such as wild foods, dietary diversification may be improved by exploiting and developing 13 production activities that have been overlooked before, such as gathering, hunting and fishing. Actions to 14 design and complement the protection of gastronomic, cultural and agricultural heritage of the community 15 should be seen as a priority for the sustainability of food and nutrition in and of itself. 16
Agricultural heritage and precise targeting 17
While we are looking forward to future opportunities that are conducive to enhancing nutrition and 18 agricultural productivity, the crucial role of beneficial practices of agricultural heritage systems, including 19 the traditional farming approaches to agriculture and sustainable development of the environment, 20 provides good practice for sustainable food systems. These systems have resulted not only in 21 outstanding landscapes, maintenance and adaptation of globally significant agricultural biodiversity, 22 indigenous knowledge systems and resilient ecosystems, but in the sustained provision of multiple goods 23 and services, food and livelihood security for millions of poor and small farmers (GIAHS, website). But, 24 above all, agricultural heritage as a carrier of long-lasting agricultural culture contributes to the 25 maintenance of human wisdom and culture. The practices initiated from those specific circumstances 26 reflect the traditions and social norms and provide references from history and cultural aspect. 27
The complicated geopolitics, diversified geography characteristics and different resource endowments 28 call for precise targeting policies. Some specific regions with the most and intensive hunger and 29 malnourished populations need special endorsement. Evidence-based policies and actions should target 30 weaknesses in the activities along the food system. Programmes targeting specific nutritionally vulnerable 31 groups should be tailored among different livelihood categories, with good examples including social 32 safety nets in transforming economies, and food aid in middle- and low-income countries. 33
Making local and traditional diets for nutrition 34
Traditional food systems are changing mainly because of globalized food market integration. It is reported 35 in various studies that imported new food products are substituting traditional foods rich in vitamins and 36 micronutrients. The resurgence of interest in agricultural biodiversity within traditional food systems is 37 bringing ongoing efforts to steer populations away from very simplified diets to more diversified diets, 38 which is helpful to household food and nutrition security. But there is still a knowledge gap about the 39 potential value of traditional foods and diets for health. Therefore, key programmes have been developed 40 to revitalize the traditional food systems, address important constraints to the production of traditional 41 foods, and help people build nutrition and health benefits of consuming foods from traditional and local 42 food systems through public awareness tools and education. For example, in West Africa, international 43 organizations working in collaboration with regional research institutions as well as the West African 44 Health Organization (WAHO) have developed research and intervention programmes to address and 45 ultimately slow down the trend towards dietary simplification and its deleterious effects on the population’s 46 nutrition and health (Smith, 2013). 47
Vulnerable populations 48
Vulnerable groups especially smallholders, women, children and the elderly may be faced with problems 49 such as hardly any benefit from the increased production of food, faced with constraints to produce and 50 sell, and have very limited influence on food policy that directly affects them. 51
Fujitsu
Nota
Indeed, this point could be made more strongly throughout.
Fujitsu
Nota
This might be a good place for a para on urban agriculture. In the States it is said that it does not contribute much to the food supply is great at raising food awareness. It may be that in developing countries the reverse is true? Either way it is an opportunity.
Fujitsu
Nota
cut "and"?
Fujitsu
Nota
"Targeting vulnerable groups" is important but still tends more to cure than to prevention. Many vulnerable groups (e.g. infants, pregnant women, old people) are subsets of "normal" groups - i.e. they develop from "normal" people and are surrounded by them. A broader social understanding of dietary needs at all points in the life cycle might prevent a lot of people from moving into the "vulnerable" category. This is one of the arguments for wider school and public food education of all kinds.

HLPE DRAFT V0 (24 October 2016) – DO NOT CITE OR QUOTE
103
Smallholder inclusiveness 1
Investment in smallholder agriculture is important not only due to smallholder agriculture’s role in 2 achieving food security and poverty reduction, but also its position as part of the socio-economic-3 ecological landscape in most countries (HLPE, 2013). Data indicate that 80 percent of the food supply in 4 Asia and sub-Saharan Africa (SSA) is considered to be provided by smallholders (Riesgo et al., 2016) 5 and half of the world’s undernourished people, three-quarters of Africa’s malnourished children and the 6 majority of people living in absolute poverty can be found on small farms (Pingali, 2010), which means a 7 focus on smallholders can tackle food insecurity and poverty directly. 8
Smallholder farming has been long neglected until it became the dominant agricultural development 9 strategy after Asian countries were able to launch a smallholder-based Green Revolution. However, gains 10 from smallholder agriculture have still been significantly hindered due to the preference of medium- and 11 large-scale farmers by policies, investments and business models over smallholders. Based on the 12 importance of smallholder agriculture for food security, the needs of smallholders should be prioritized. 13 The public sector, together with the private sector, need to invest more in research related to smallholder 14 agriculture, and create suitable environments for smallholders to access and use new technologies, and 15 help smallholders play a leading role in developing sustainable and ecologically friendly farming systems. 16 There is also a need to empower farmers to shape local and national institutions (Conway et al., 2010). In 17 addition, policies to support smallholders should also reflect the stage of economic development of a 18 country, such as raising the productivity of smallholders in agrarian countries and providing incentives for 19 smallholders to shift into high-value agriculture as countries undergo transformations (Riesgo et al., 20 2016). 21
Women’s empowerment 22
Women have a special role in improving the nutritional outcomes of their families because of their role in 23 childcare and household food preparation in many societies. Evidence has shown that over 50 percent of 24 the reduction in child underweight from 1970 to 1995 is attributable to improvements in women’s status 25 (World Bank, 2013). 26
Women empowerment is a multidimension definition. In agricultural activities, increasing women’s 27 discretionary income and reducing women’s time and labour constraints appear to be especially important 28 to improve nutrition (World Bank, 2013). It has been found from lessons in South Asia that ensuring 29 women earn and control their incomes was one of several “success factors’’ encompassed in the most 30 effective programmes (Lesser Blumberg et al., 2013). Evidence has also shown that increasing the share 31 of household income controlled by women, either through their own earnings or cash transfers, changes 32 spending in ways that benefit children (The International Bank for Reconstruction and Development / The 33 World Bank, 2011). However, gender norms are culture-specific and context-specific. Policy interventions 34 designed to empower women and improve nutritional status need to be based on understanding which 35 specific domains of women’s empowerment matter for particular outcomes in a specific context (Malapit 36 and Quisumbing, 2015). For example, leadership in the community and control of resources are the most 37 promising areas for policy intervention to empower twomen and improve household food security in 38 Bangladesh (Sraboni et al., 2014). 39
Given the role that women play in agriculture, special requirements should be met to help women obtain 40 access to resources such as land and water, access to credit, access to market, be involved in the design 41 and use of technology and extension services, and participate in farmer cooperatives or women 42 organizations, which can strengthen their capacities to provide for the food security, health and nutrition 43 of their families. In addition, more direct, women-centric innovations need to be considered in nutrition 44 programming and interventions (Lesser Blumberg et al., 2013). 45
Youth development 46
In many developing countries, young people are migrating to cities in search of business opportunities, 47 leaving behind an increasingly ageing population in the rural area. This is a big challenge for the 48 sustainable progress of food security. There is a need to cultivate a new breed of young food practitioners 49 and propose innovative career patterns for them. Youth models need to be developed to engage them in 50 productive activities in agriculture that hold economic and livelihood promise. At the same time, the young 51
Fujitsu
Nota
Indeed, yes. Can this be reflected in your section on technology?

HLPE DRAFT V0 (24 October 2016) – DO NOT CITE OR QUOTE
104
entrepreneurs could be promoting agriculture among other young people through peer education, training 1 and demonstration of agricultural best practices, and business skills in value chain development, which 2 are needed to transform food security in the developing countries. 3
Social safety nets 4
With many of the world’s poorest people – who are typically net buyers of food – bypassed by economic 5 progress, social protection interventions have been an important countercyclical tool to help vulnerable 6 households address current and future vulnerabilities. Well-targeted and productive social protection 7 policies have the potential both to cushion against short-term weather, health and financial shocks to food 8 and nutrition security (through, for example, food assistance) and to improve access to productive 9 resources that offer long-term opportunities to escape food and nutrition insecurity (through, for example, 10 access to credit, education, extension and technology). 11
During the last decade, cross-sectoral social protection programmes have gained momentum in countries 12 such as Bangladesh, Brazil, Ethiopia and Mexico. These initiatives are noteworthy examples of how the 13 government can leverage social safety nets to provide an integrated package of education, nutrition, 14 agricultural and health services to the poor and food-insecure. The innovative framework lies in the 15 successful combination of effective public investments in areas such as human capital formation with 16 social protection for the most vulnerable segments of the population, complementing geographic targeting 17 with some sort of household assessment mechanisms. A review of conditional cash transfer programmes 18 in Latin and Central America shows that their successful implementation requires significant investment in 19 human and financial resources and a complex interinstitutional framework to guide cross-sectoral 20 interactions. Furthermore, other key characteristics of efficient programmes include: transparent and 21 precise targeting of poor households; the monitoring and evaluation of programme inputs, outputs and 22 impacts; and the dynamic and recurrent management of the registry of beneficiaries (Paes-Sousa, 2013). 23
4.2.3 Nutrition governance, institutions and partnerships 24
Nutrition has been increasingly recognized as both essential for development and a social right; however, 25 it is prominently in the policy-making processe Global awareness and commitment still need to be made, 26 including international advocacy and cooperation, national strategies on nutrition and multisectoral 27 coordination, system concept and nutrition orientation, public–private partnerships and investment 28 support and cooperation backup. These and similar initiatives require top-level designs and multisectoral 29 commitment and support. 30
International advocacy and cooperation 31
There has been some interesting international cooperation that relates to nutrition. In 2012, the World 32 Health Assembly adopted the 2025 Global Targets for Maternal, Infant and Young Child Nutrition, with 33 3 000 attendees representing 194 WHO member states participating. In 2013, at the first Nutrition for 34 Growth (N4G) Summit, donors committed USD23 billion to actions to improve nutrition. In 2016, the FAO 35 sustainable agricultural project works through Farmer Field Schools (FFSs) to help communities living in 36 these watersheds to better manage their land and improve their means of food production and 37 nutrition. In the future, they need to do more, such as organizing and cooperating better to keep the 38 global food system more effective and targeting the SDGs, contributing more to resources protection, 39 advocating for food-nutrient-oriented food systems and diversified food models, focusing on the 40 globalization of markets, increasing food trade and preventing trade restrictions, spreading best practices 41 and coping with climate change. More here on SUN etc. 42
National strategies on nutrition and multisectoral coordination 43
Designing and implementing national strategies on nutrition and attaching importance to multisectoral 44 coordination are crucial to realize nutrition goals. For instance, in 2014, the Chinese Government 45 published the Food and Nutrition Developing Outline 2014–2020, which clearly set national nutritional 46 goals and promoted different departments to cooperate closely. Thailand has set another good example 47 in reducing child undernutrition, and the key for its success was strong political will, clear goals, effective 48 strategic and programme planning, and sustained integrated action and systematic monitoring. Most 49
Fujitsu
Nota
Some impressive SP schemes have demonstrated far greater impact on nutrition when an education element is included.
Fujitsu
Nota
unfinished sentence
Fujitsu
Nota
Also we need far more treatment of consumer capacity and behaviour in international publications (like this one).

HLPE DRAFT V0 (24 October 2016) – DO NOT CITE OR QUOTE
105
notably, this success was fuelled by widespread mobilization of volunteers and by community ownership 1 (IFPRI, 2016b).. 2
More examples to be added here (e.g. from Nepal, Ethiopia, Uganda, Peru, etc.) 3
Nutrition is not a sector but a cross-cutting development problem that needs to be integrated into the 4 activities and policies of the agriculture, food, health, education, sanitation and water sectors (among 5 others), and featured in the priorities of broader agencies such as ministries of finance and gender (Fan 6 and Pandya-Lorch 2012). Thus it is necessary for governments to put forward and conduct good 7 strategies on planning, integration, social mobilization and local action-oriented surveillance and 8 cooperation, so that they can formulate effective strategies. 9
It should be noted that nutrition often lacks a high-profile place in institutional design, although nutrition 10 grabs the spotlight as hunger persists (IFPRI, 2014). The government serves as the most important actor 11 to take a leading role in prioritizing nutrition. High-level policy and political backing of effective nutrition 12 strategies plans and programmes, political and bureaucratic stability, and the emergence of a supportive 13 policy and fiscal framework at the national level is in urgent need. 14
Public–private partnerships 15
There is widespread recognition of the potential for public–private partnerships (PPPs) in agricultural 16 research (Hall, 1998, 2001) and there are also many successful cases of PPPs in food systems. 17
Add examples here 18
However, there are some constraints that may impede the success of PPPs in the near term, such as an 19 inadequate legal and regulatory framework for PPPs, lack of technical skills to manage PPP programmes 20 and projects, unfavourable investor perception of country risk, small market size, limited infrastructure and 21 limited financial markets (Venkatesan and Madhavi, 2016). In order to make PPPs more successful and 22 effective, elements of good governance need to be considered, including setting clear objectives and 23 legal rules, and implementing regular monitoring and evaluation that use well-established, open and 24 competitive processes to select PPPs for public participation (Moreddu , 2016). Transparency is desirable 25 at all stages of implementation. Improving partners’ capacity to design, manage and participate in PPPs is 26 an important factor of success, and is particularly relevant for agricultural innovation. Coordination 27 mechanisms are also very important in PPPs. 28
Investment support and cooperation backup 29
Lack of investment is a key factor that hinders the food system considering agriculture is a comparatively 30 low-profit and high-risk sector. Enlarged investment with operational programmes including both long-31 term investment in relevant education and short-term nutrition programmes is an important motivation for 32 the food system. Effective operational programmes focused on an enabling investment environment can 33 go hand in hand with the traditional up to down investment plans. Vulnerable regions, economies and 34 groups of people may need more investment to move out of the trap of being in competition for key 35 resources. Also, investment relies heavily on the economy status; different investment scenarios will be 36 resilient to economic shocks and keeps stability under the blur of global and national trends. Priorities at 37 global, national and local levels should be considered in the investment plan. Infrastructure investment 38 plays a major role in middle- and low-income countries while technology transfer and south–north and 39 south–south cooperation are effective. These also urge public–private partnership. Eight principles 40 including incorporating nutritional concerns into the design and implementation of agricultural policies, 41 projects and investments for operational investment have received support as an accepted working 42 definition of nutrition-sensitive agricultural programming and are considered important in most cases for 43 nutrition-sensitive agricultural activities (Herforth et al., 2012). 44
A cooperative environment can reduce transaction costs and increase the efficiency of current resource 45 utilization. Three layers of cooperation need to be enhanced: global cooperation in market liberalization 46 and trade towards global food availability, food aid targeting least-developed or vulnerable countries with 47 non-self-sufficient poor resources and collaborative research on global burning issues related to the food 48 system; public–private partnerships with functions having separate advantages, such as governments in 49 their roles as initiators and the private sector in investment and marketing inclusive of international 50
Fujitsu
Nota
i.e. a strong educational element (peer-to-peer communication, practice, ownership).
Fujitsu
Nota
Hoddinott et al. (2015) "found little in the way of independently generated high-quality evidence of the impact of PPPs on reducing child undernutrition.”
Fujitsu
Nota
Is it possible to discuss the relative cost-effectiveness (re nutrition) of investing in small-scale homestead gardening vs large industrial agriculture?

HLPE DRAFT V0 (24 October 2016) – DO NOT CITE OR QUOTE
106
organizations and NGOs; and multisectoral cooperation aiming beyond programmes towards food system 1 development and comprehensive livelihood improvement. 2
Conflicts of interest 3
This section will be further elaborated in Version 1. 4
5
Movements for nutrition 6
This section will be further elaborated to describe other movements. Below is one movement on 7 CSOs. 8
The challenges to confront all forms of malnutrition have required discussion on the redesign of 9 governance in nutrition from global to national levels. The multilevel determination of food and nutrition 10 problems requires a complex organization that reflects the different needs and priorities, protects the 11 decisions in conflicts of interest and that incorporates the demands of social movements and 12 organizations of public interest based on legitimate participation. The limited results that have been 13 achieved have created the opportunity for deeper coordination between food and nutrition dimensions in 14 order that food systems promote nutrition. 15
Organizations and social movements have improved their organization and focus in these discussions. A 16 clear achievement was the Civil Society Mechanism (CSM) of CFS and also a broader movement that 17 was gathered around the process of preparation, participation and follow up of the 2nd International 18 Conference on Nutrition. 19
The CSM has developed a view about the nutrition agenda to contribute to the discussions in the CFS. 20 The document details what social movements and civil society organizations consider the role of the CFS 21 as a legitimate forum to promote policy coherence, across different policy domains, in the global 22 architecture of nutrition governance. Considering the centrality of the RTF in the nature of the CFS policy 23 space requires hierarchy between human rights and private economic rights and safeguards against 24 conflict of interest. 25
For the CSM, policy coherence requires a holistic vision on nutrition. The fragmentation is result of 26 technical decisions that sometimes weaken the decisions of the countries about their own policies and is 27 also a result of a fragmented and reductionist conceptual framework of agriculture and food and nutrition 28 sciences. Policy convergence to achieve significant results depends on the adoption of a holistic view of 29 nutrition that consider determinants, dimensions and actors involved. That is what will support an 30 interdisciplinary and intersectoral approach. 31
Another important aspect is that the prevention and control of all forms of malnutrition requires strategies 32 addressed to the structural determinants of malnutrition in all its forms and a strong gender approach 33 focus on women’s rights and non-discrimination. Structural discrimination and violence, at societal, 34 community and household levels, have negative implications for the full enjoyment of women’s potential, 35 but also contribute to rendering women and their rights invisible in FSN policies. 36
Finally, the CSM document defends the importance of a shift from food-product approaches to food 37 systems that support diversified, balanced, sustainable and healthy diets. Healthy diets must be promoted 38 and supported by sustainable, local and regional food systems, firmly centred on agricultural biodiversity, 39 small-scale sustainable food producers, protected against unfair competition and aligned with 40 agroecological and food sovereignty principles. 41
A group with a larger number of social movements and organizations of public interest launched, in 2014, 42 a declaration during the Second International Conference on Nutrition (ICN2), which presented the vision 43 and demands for global governance in nutrition and an agenda of priorities. Many points of this statement 44 coincide with what was then prepared by CSM. The civil society movements and organizations of public 45 interests reinforce the role of small-scale farmers, pastoralists, small-scale fishers and fishing 46 communities, agricultural and food workers, indigenous peoples, landless people, rural women and youth 47 as main producers of food around the world and demanded global and national policies to protect and 48
Fujitsu
Nota
cut "that"

HLPE DRAFT V0 (24 October 2016) – DO NOT CITE OR QUOTE
107
promote their activities and rights. They claim that it is urgent to recognize that small-scale food 1 producers, based on sustainable and resilient local food systems, can best respond to climate change 2 and contribute significantly to the prevention of malnutrition in all its forms. 3
More than the action of isolated organizations there are already initiatives of alliances of organizations to 4 work with social communication to raise the awareness of the public about these issues and also 5 advocate for regulatory actions. A current example is the law to tax sugary drinks in Mexico that was led 6 by an alliance of civil society organizations. The impact of these measures is being monitored but the 7 social and political environments that facilitate this decision indicate a more effective positioning of civil 8 society in relation to food and nutrition issues. There are also broader partnerships such as the Coalition 9 Healthy Latin America, which facilitates the exchange of experiences and information among a wide 10 range of organizations. 11
Consumers’ organizations have also initiated discussion about the establishment of a Global Convention 12 to Protect and Promote Healthy Diets (CI, 2014; Vandevijvere, 2014). The proposal contains measures 13 to: protect and promote healthy diets through education, skills, communications and public awareness; 14 provision of nutrition information; ensure responsible food and beverage advertising, promotion and 15 sponsorship; control advertising, promotion and sponsorship; improve nutritional quality of foods and 16 reduce levels of potentially harmful nutrients; implement nutritional standards for food services in schools, 17 hospitals and public institutions; and intervene to influence positive consumption patterns. The document 18 recognizes that some of the measures have already been implemented, or partially implemented, in some 19 countries but highlight that the commitment in the form of a Global Convention would offer a better 20 chance to secure healthy diets for all. 21
4.2.4 Future research areas and data needs 22
This section identifies some recommended examples of research that needs to be undertaken to improve 23 the understanding of how the food systems can work better for nutrition. There exists a gap both in 24 knowledge on how various aspects of the food system influence diets and nutrition, and how they can be 25 influenced to play a better role in this through policy and programmes. Tied to this is the importance of 26 data that is needed to fill this gap in knowledge. Sufficient knowledge may be lacking due to different 27 reasons including the observation that this is an emerging area of research that has not yet received 28 much attention, or because of a lack of good and reliable data even when science has shifted focus to 29 such areas. Here below we single out some examples of areas/aspects of the food system that will need 30 more research in future. In addition, we highlight the important role of good data and how research 31 collaboration can be used to reduce the gap in good data. 32
Food production and supply 33
There has been considerable research focus in the past on increasing global food supply. With increasing 34 global population, how to further improve food supply will continue to be important area of research as the 35 world seeks to produce enough food for future generations (Godfray et al., 2010). We identify two 36 streams of future research in this aspect. First, more research will be needed to close gaps in yield 37 between producers who may have achieved near potential and those still realizing low yields (Jaggard et 38 al., XXXX). While yield potential for crop and animal production may have been reached in several parts 39 of the developed world, many parts of the developing world, especially sub-Saharan Africa, still 40 experience low yields. There is also a need to emphasize the production of more nutritious foods such as 41 fruits and vegetables, pulses and animal-sourced foods, including fish, with a more balanced investment 42 in these foods and not just staple crop commodities. 43
The second stream of future research will be on addressing current constraints and future threats to food 44 production. For instance, more research is need to increase resource use efficiency in production 45 (Godfray et al., 2010), which can be achieved through cost reduction measures including technology and 46 innovations that can support sustainable intensification. Research efforts towards sustainable agricultural 47 production that has minimum effects on the environment, and how to make agriculture more resilient to 48 different aspects of climate change will continue to be important for research (Power, 2010). Additionally, 49 understanding the extent of food loss and waste in different contexts and how to reduce them will 50 continue to be an important research area (HLPE, 2014; Parfitt et al., 2010). Future work on food loss and 51

HLPE DRAFT V0 (24 October 2016) – DO NOT CITE OR QUOTE
108
waste reduction should not only focus on loss of physical food but also the loss of quality/nutrients along 1 the food chain. 2
Concerning agriculture, there are already emerging hypotheses and little empirical evidence on the role of 3 agriculture and other nutrition-sensitive sectors on nutrition (Ruel et al., 2013; Carletto et al., 2015). 4 However, since this is in most cases early evidence, research on these aspects will continue to be 5 important in future. 6
Food environments 7
As shown in Figure 1.1, the food environment is a key component of the food system. The food 8 environment is constantly changing, with different consequences on diets, nutrition and health. Future 9 research on food environments can be envisaged to have three aspects. First, there is need to document 10 the extent of changes in the food environment in different contexts and the specific role of certain drivers. 11 For instance, good metrics and indicators to track the nutrition transition are lacking, leading to 12 researchers using only proxies for this kind of research (Kimenju and Qaim, 2016). 13
The second stream of future research relates to the effect of food environments on nutrition and health. 14 Effects of different aspects and drivers of the nutrition transition on diets and nutrition may differ by 15 context and age group and involve several trade-offs (Kimenju et al., 2015; Gómez et al., 2015). 16 Longitudinal data on the effect of nutrition transition on nutrition are clearing lacking in most parts of the 17 world. In addition, the nutrition transition has many aspects and drivers and there may be a need to 18 understand the role of specific drivers on diets, such as trade and globalization (Thow, 2009; Kearney, 19 2010). 20
The third stream of research on food environments will be on how to effectively influence the food 21 environment to stock/supply healthier food products. The mechanism of what works is not clear, be it 22 government regulation, industry self-regulation or incentives. Considering the immense industry power 23 holds on consumers, an important future research area is how such power of the retail environment/food 24 industry can be harnessed to bring about desired changes in consumer choice and diets (Kimenju, 2014). 25
Consumption demand and behaviour change 26
As population and urbanization grow and food environments continue to change, various kinds of 27 research will be needed. The first kind of research will be on accuracy in estimation of future food 28 demand (amount and types) especially with regard to income changes and distribution (Cirera and 29 Masset, 2010) but also to predict the effect of other drivers such as population and urbanization growth. 30 This will come with a need for data on food consumption, which unfortunately are only available for a few 31 countries. 32
The second stream of research will be on understanding which are the effective policies that can 33 effectively influence consumer choice and diets in this era of changing food environments. Research is 34 needed to inform policy-makers about how to support behaviour that results in shifting consumption in 35 favour of recommended foods and beverages so that eating patterns contain fewer nutrient-poor foods 36 and beverages. Important aspects of research include behavioural economics to further improve the 37 understating of how consumers make choices (Godfray et al., 2010), and effectiveness of various 38 measures to promote healthy diets including the role of government policy such as through prices, taxes 39 and subsidies and other types of nudges (Wiggins et al., 2015; Haggblade et al., 2016; Hawkesworth et 40 al., 2010). Additionally, not enough is known about how consumers’ attitudes and food practices evolve in 41 response to better information about nutrition and healthy diets (IFPRI, 2016), and hence this will also 42 continue to be a research area of interest in the future. 43
Diets 44
We recommend future research towards developing healthier and sustainable diets. Research will be 45 needed to identify effective mechanisms to encourage production of healthier foods (Hawkesworth et al., 46 2010). In addition, it will continue to be important to focus on how to make current diets healthier, 47 especially considering that research has shown that it is not easy to change consumer behaviour. Diets 48 can be made healthier through breeding for higher nutrients in crops (e.g. biofortication) and animal 49
Fujitsu
Nota
In the light of this statement, does it become necessary to justify the very large proportion of this report which focuses on improvements in agriculture?
Fujitsu
Nota
"Better information" is only a small part of changing food practices. SBCC in 2014 published a list of research gaps relating to behaviour change methodology (https://www.spring-nutrition.org/publications/reports/conference-report-and-strategic-agenda-nutrition-sbcc, Annex 2)

HLPE DRAFT V0 (24 October 2016) – DO NOT CITE OR QUOTE
109
products, for instance healthier meat products (Hawkesworth et al., 2010). In addition, more research is 1 needed on increasing the range and reach of added micronutrients to processed foods, which can be 2 done by the food industry (Hawkesworth et al., 2010). Related to this is the research on developing 3 nutrient-dense foods that incorporate low cost and good taste (Haggblade et al., 2016). 4
Last, research on biodiversity will continue to be important in the future, especially with a focus on 5 neglected and underutilized species and orphan crops. Greater understanding of the nutritional and 6 toxicological properties of underutilized species is needed (Bharucha and Pretty, 2010) and there is need 7 of whole value chain research to promote production, marketing and consumption of orphan crops 8 (Gómez et al., 2015). 9
Nutritional and health outcomes 10
There are gaps on the effects of consumption of various diets and nutrients on nutritional and health 11 outcomes. Specific areas that future research can focus on include: 12
Randomized controlled trials on the effects of low sodium consumption on heart disease 13 outcomes (not blood pressure) are needed to understand the observational findings that sodium 14 consumption below 2 300 mg/day is associated with increased mortality for some populations. 15 Consideration of sodium content in the context of high-quality diets should be included to account 16 for dietary components like potassium that may counteract the effects of sodium. 17
Randomized controlled trials are needed to determine how modifying macronutrient types and 18 proportions in the context of high-quality eating patterns may impact long-term weight status, 19 metabolic consequences and risk of NCDs. Of special interest are the effects of saturated fat 20 compared with unsaturated fat on heart disease, and the role of refined carbohydrates on weight 21 and metabolic outcomes. 22
The total diet approach has improved the understanding about the combined effects of eating 23 patterns – all foods, beverages and nutrients consumed – on health, but alternative methods to a 24 priori scoring indices are needed to better understand the synergies, cumulative effects and 25 trade-offs associated with specific eating consumption patterns and their effects on key health 26 outcomes. In addition, better methods to accurately quantify food intake are needed. 27
28
Need for good data and the role of nutrition research collaboration 29
As earlier mentioned, good data are key to good research. Indeed, sound, reliable and transparent data 30 and information are not only the basis of nearly all kinds of research, but also the foundation of right 31 policy direction. Basic data such as consumption patterns, nutrient intakes and health conditions provide 32 a good starting point for planning and adopting a nutrition-sensitive value chain approach by telling what 33 populations eat now, where they obtain that food, and where the “gaps” are in their ability to meet their 34 nutrient requirements (Allen, 2011;; IFPRI, 2011). But because such data are time-consuming and 35 expensive to collect, they are severely lacking and fragmented, usually only context-specific to a small 36 area. This lack of data is most severe in terms of anthropometric data (Meeker and Haddad, 2013). 37 Strengthening of data collection needs support at the country level, as part of support for country 38 strategies, or even at global level, for formulating a set of data needed, offering training in data collection 39 and establishing platforms for data aggregation, comparison and sharing. 40
The rate and scale of malnutrition suggest a broader collaboration platform and need to increase the 41 speed of the intervention and solutions. There are many public–private partnerships working on the triple 42 burden of malnutrition, but the current academic system requires a peer review process and approval 43 process that can be lengthy. The valuable data from studies are left on researchers’ computers and the 44 outcomes of the research are held in academic journals. While these methods are valuable, they overlook 45 the new collaborative opportunities to foster better research among academics, policy-makers, funders 46 and the consuming public. Given the sheer breadth and scale of information required to understand the 47 triple burden of malnutrition, there is a strong need to develop open access to nutrition research 48 outcomes. The nutrition community could develop open source protocols for sharing research and data. 49 The availability of data is essential to accelerate the speed of research and decision-making. The 2016 50 Global Nutrition Report calls for a ”data revolution”. The scarcity of data prevents us from identifying and 51 learning from real progress at the global level (IFPRI, 2016). One example that has worked to transform 52

HLPE DRAFT V0 (24 October 2016) – DO NOT CITE OR QUOTE
110
the speed of information sharing such Internet protocols, the Human Genome Project, has direct 1 application to the nutrition research community. This is highlighted in the box below. 2
3
Box 40 Human Genome Project
The Human Genome Project was an international research effort to determine the sequence of the human genome and identify the genes that it contains. The Human Genome Project operated on principles to bring about the greatest advancement to the scientific community by allowing the rapid deposition of DNA sequences into the public database (NHGRI, 2003). The biomedical research community demonstrated the power of international collaboration through the Human Genome Project to revolutionize the future biological research and organized virtual resource teams to collaborate and share information. The collaboration and information-sharing model had commitment from 20 international sequencing centres in the International Human Genome Sequencing Consortium, led by the National Human Genome Research Institute and the Department of Energy. The resulting collaboration accelerated the completion of an accurate human genome sequence in 2003, two years ahead of schedule and under the budget originally anticipated (NHGRI, 2003) This example of collaborative research could apply to the field of malnutrition as research needs to be increasingly collaborative and outcome-based, and requires accelerated funding models.
4
4.3 Conclusion 5
In this section we have attempted to outline promising case studies that have made a difference in 6 improving nutrition and diets either through policies or programmes. Technology holds great promise for 7 some areas of improving diets. There are also changes that can be made across food systems and food 8 environments that target actors and activities. Governance, institutions and movements are key to 9 following through on best practices, learning lessons on things that did not work, and holding themselves 10 and others accountable to ensure that we do no harm and uphold the ethics of research and 11 development. 12

HLPE DRAFT V0 (24 October 2016) – DO NOT CITE OR QUOTE
111
REFERENCES
Not all references are included in this version. Full reference list will be provided in Version 1.
Action Aid. 2012. Biofueling hunger: how US corn ethanol policy drives up food prices in Mexico. Action Aid
International USA. Acosta, A. M., & Fanzo, J. (2012). Fighting maternal and child malnutrition: analysing the political and
institutional determinants of delivering a national multisectoral response in six countries. A synthesis paper. Adair, L.S., Caroline HD Fall, Clive Osmond, Aryeh D Stein, Reynaldo Martorell, Manuel Ramirez-Zea,
Harshpal Singh Sachdev, Darren L Dahly, Isabelita Bas, Shane A Norris, Lisa Micklesfield, Pedro Hallal, Cesar G Victora and for the COHORTS group. 2013. Associations of linear growth and relative
weight gain during early life with adult health and human capital in countries of low and middle income: findings from five birth cohort studies. Lancet. 382(9891): 525-534. https://www.ncbi.nlm.nih.gov/pmc/articles/PMC3744751/
Aguilera, E., Lassaletta, L., Gattinger, A. & Gimeno, B.S. 2013. Managing soil carbon for climate change mitigation and adaptation in Mediterranean cropping systems: A meta-analysis. Agriculture, Ecosystems & Environment, 168: 25–36.
Alders, R., Aongola, A., Bagnol, B., de Bruyn, J., Darnton-Hill, I., Jong, J., Kimboka, S., Li, M., Lumbwe, H., Mor, S., Maulaga, W., Mulenga, F., Rukambile, E. & Wong, J. 2015. Village chickens and their contributions to balanced diverse diets throughout the seasons. World Veterinary Poultry Association Congress. Cape
Town, 7-11 September 2015, e-Booklet p. 115. Alexandratos, N. & Bruinsma, J. 2012. World agriculture towards 2030/2050: the 2012 revision (No. 12-03, p.
4). Rome, FAO: ESA Working paper. Allen L. 2011. Priorities from a nutrition perspective. Speaker summary note for the Conference Leveraging
Agriculture for Improving Nutrition and Health, 10–12 February 2011, New Delhi. Allen, S.L., de Brauw, A. & Gelli, A. 2016. Harnessing value chains to improve food systems. Washington, DC,
IFPRI. Altieri, M., Nicholls, C., Henao, A. & Lana, M. 2015. Agroecology and the design of climate change-resilient
farming systems. Agronomy for Sustainable Development, 35(3): 869–890. Amy, G., Craun, G., Craun, G.F. & Siddiqui, M. 2000. Disinfectants and disinfectant by-products, Issue 216 of
Environmental Health Criteria, by ILO, UNEP, WHO. Geneva, Switzerland, World Health Organization. An R, Patel D, Segal D & Sturm R. 2013. Eating better for less: a national discount program for healthy food
purchases in South Africa. Am J Health Behav. 37(1): 56-61. ANDES. 2016. Health Authorities in Ecuador highlight decrease of sugar, fat and salt in food due to new labelling.
Available at: http://www.andes.info.ec/en/news/health-authorities-ecuador-highlight-decrease-sugar-fat-and-salt-food-due-new-labelling.html
Arimond, M. & Ruel, M.T. 2004. Dietary diversity is associated with child nutritional status: evidence from 11
demographic and health surveys. J. Nutr., 134(10): 2579–2585. Armijo‐ Olivo, S., Stiles, C.R., Hagen, N.A., Biondo, P.D. & Cummings, G.G. 2012. Assessment of study
quality for systematic reviews: a comparison of the Cochrane Collaboration Risk of Bias Tool and the Effective Public Health Practice Project Quality Assessment Tool: methodological research. Journal of Evaluation in Clinical Practice, 18(1): 1–18.
Asche, F., Bellemare, M.F., Roheim, C., Smith, M.D. & Tveteras, S. 2015. Fair enough? Food security and the international trade of seafood. World Development, 67: 151–160.
Asfaw, A. 2008. Does supermarket purchase affect the dietary practices of households? Some empirical
evidence from Guatemala. Development Policy Review, 26(2): 227–243. Asfaw, A. 2011. Does consumption of processed foods explain disparities in the body weight of individuals? The
case of Guatemala. Health Economics, 20(2), 184–195. Augustin, M.A., Riley, M., Stockmann, R., Bennett, L., Kahl, A., Lockett, T., Osmond, M., Sanguansri, P.,
Stonehouse, W., Zajac, I. & Cobiac, L. 2016. Role of food processing in food and nutrition security. Trends in Food Science & Technology, 56: 115–125.
AwwaRF. 2007. Long-term effects of disinfection changes on water quality (available at
http://www.waterrf.org/publicreportlibrary/91169.pdf). Babey, S.H., Diamant, A.L., Hastert, T.A., Harvey, S., Goldstein, H., Flournoy, R., Banthia, R., Rubin, V. &
Treuhaft, S. 2008. Designed for disease: the link between local food environments and obesity and diabetes,
Policy Brief, UCLA Center for Health Policy Research. Bachmann, L., Cruzada, E. & Wright, S. 2009. Food security and farmer empowerment: a study of the impacts
of farmer-led sustainable agriculture in the Philippines. Los Banos, Philippines, Magsasaka at Siyentipiko para sa Pag-unlad ng Agrikultura MASIPAG.
Badgley, C., Moghtader, J., Quintero, E., Zakem, E., Chappell, M.J., Avilés-Vázquez, K., Samulon, A. & Perfecto, I. 2007. Organic agriculture and the global food supply. Renewable Agriculture and Food Systems,
22(2): 86–108. Barker DJP, Clark PM. Fetal undernutrition and disease in later life. Rev Reprod. 1997;2:105–112 Barker DJP. 1998. Mothers, Babies and Health in Later Life. Churchill Livingstone; Edinburgh: 1998.

HLPE DRAFT V0 (24 October 2016) – DO NOT CITE OR QUOTE
112
Bastagli, F., Hagen-Zanker, J., Harman, L., Sturge, G., Barca, V., Schmidt, T. & Pellerano, L. 2016. Cash transfers: what does the evidence say? A rigorous review of programme impact and the role of design and implementation features. London, Overseas Development Institute (available at www.odi.org/projects/2797-social-protection-literature-review-poverty-impact).
Batis, C., Rivera, J.A., Popkin, B.M. & Taillie, L.S. 2016. First-year evaluation of Mexico’s tax on nonessential energy-dense foods: an observational study. PLoS Med, 13(7).
Bennett, E. M., Cramer, W., Begossi, A., Cundill, G., Díaz, S., Egoh, B. N., ... & Lebel, L. 2015. Linking
biodiversity, ecosystem services, and human well-being: three challenges for designing research for sustainability. Current opinion in environmental sustainability, 14, 76-85.
BEUC. 2015. Informed food choices for healthier consumers. BEUC position on nutrition. Brussels (available at
http://www.beuc.eu/publications/beuc-x-2015-008_pca_beuc_position_paper_on_nutrition.pdf). Berry, E.M., Dernini, S., Burlingame, B., Meybeck, A. & Conforti, P. 2015. Food security and sustainability:
can one exist without the other? Public Health Nutrition, doi: 10.1017/S136898001500021X. Beydoun, M.A. & Wang, Y. 2008. How do socio-economic status, perceived economic barriers and nutritional
benefits affect quality of dietary intake among US adults? Eur. J. Clin. Nutr., 62: 303–313. Bhagowalia, P., Menon, P., Quisumbing, A. R., & Soundararajan, V. 2012. What dimensions of women’s
empowerment matter most for child nutrition?: Evidence using nationally representative data from Bangladesh. IFPRI Discussion Paper No. 1192. Washington, DC: International Food Policy Research Institute.
Bharucha, Z. & Pretty, J. 2010. The roles and values of wild foods in agricultural systems. Philosophical Transactions of the Royal Society of London B: Biological Sciences, 365(1554): 2913–2926.
Bhutta, Z.A., Das, J.K., Rizvi, A., Gaffey, M.F., Walker, N., Horton, S., Webb, P., Lartey, A., Black, R.E. & The Lancet Nutrition Interventions Review Group, the Maternal and Child Nutrition Study Group. 2013.
Evidence-based interventions for improvement of maternal and child nutrition: what can be done and at what cost? The Lancet, 382(9890): 452–477.
Black RE, Allen LH, Bhutta ZA. 2008. For the Maternal and Child Undernutrition Study Group Maternal and child
undernutrition: global and regional exposures and health consequences. Lancet. 2008 published online Jan 17. DOI: 10.1016/S0140-6736(07)61690-0
Black, R.E., Alderman, H., Bhutta, Z.A., Gillespie, S., Haddad, L., Horton, S., Lartey, A., Mannar, V., Ruel, M., Victora, C.G., Walker, S.P. & Webb, P. 2013. Maternal and child nutrition: building momentum for impact. The Lancet, 382(9890): 372–375.
Boserup, E. (2005). The conditions of agricultural growth: The economics of agrarian change under population
pressure. Transaction Publishers. Boserup, E., Makhoul, N., Munn, R. E., Srinivasan, T. N., Robinson, J. A., & Rocha, C. 1983. Population and
technological change: A study of long-term trends. International Journal of Health Services, 13(1), 15-31. Bougma, K., Marquis, G., Aboud, F., Frongillo, E., Lemma, T. & Samuel, A. 2015. Iodized salt improves
child's iodine status, mental development, and physical growth in a cluster randomized trial in Ethiopia. The FASEB Journal, 29(1 Supplement).
Bouis, H.E., Hotz, C., McClafferty, B., Meenakshi, J.V. & Pfeiffer, W.H. 2011. Biofortification: a new tool to reduce micronutrient malnutrition. Food and Nutrition Bulletin, 32(1 suppl1): S31–S40.
Bouvard, V., Loomis, D., Guyton, K.Z., Grosse, Y., Ghissassi, F.E., Benbrahim-Tallaa, L., Guha, N., Mattock, H., Straif, K. & International Agency for Research on Cancer Monograph Working Group. 2015. Carcinogenicity of consumption of red and processed meat. Lancet Oncol., 16(16): 1599–1600.
Bouwman, L., Goldewijk, K.K., Van Der Hoekc, K.W., Beusena, A.H.W., Van Vuurena, D.P., Willemsa, J., Rufinoe, M.C. & Stehfesta, E. 2013. Exploring global changes in nitrogen and phosphorus cycles in agriculture induced by livestock production over the 1900–2050 period. Proceedings of the National Academy of Sciences, 110(52): 20882–20887.
Boyland, E.J. & Halford, J.C. 2013. Television advertising and branding. Effects on eating behaviour and food
preferences in children. Appetite, 62(1): 236–241. Boyle, M., Stone-Francisco, S. & Samuels, S.E. 2007. Environmental strategies and policies to support healthy
eating and physical activity in low-income communities. Journal of Hunger & Environmental Nutrition, 1(2): 3–25.
Burney, J., Woltering, L., Burke, M., Naylor, R. & Pasternak, D. 2010. Solar-powered drip irrigation enhances food security in the Sudano–Sahel. Proceedings of the National Academy of Sciences, 107(5): 1848–1853.
Buse, K., Mays, N. & Walt, G. 2012. Making health policy. McGraw-Hill Education, UK. Breisinger, C., Ecker, O., Al-Riffai, P. & Yu, B. 2012. Beyond the Arab awakening: policies and investments for
poverty reduction and food security. Washington, DC, IFPRI. Breisinger, C., Ecker, O., Al-Riffai, P., & Yu, B. (2012). Beyond the Arab awakening: policies and investments
for poverty reduction and food security. Intl Food Policy Res Inst. Brinkman, H.J. & Hendrix, C.S. 2011. Food insecurity and violent conflict: causes, consequences, and
addressing the challenges. World Food Programme Occasional Paper No. 24 (available at http://documents.wfp.org/stellent/groups/public/documents/newsroom/wfp238358.pdf).
Brooks, J. & Matthews, A. 2015. Trade dimensions of food security. OECD Food, Agriculture and Fisheries
Papers, No. 77. Paris, OECD Publishing. Brunelle, T., Dumas, P. & Souty, F. 2014. The impact of globalization on food and agriculture: the case of the
diet convergence. The Journal of Environment & Development, 23(1): 41–65.

HLPE DRAFT V0 (24 October 2016) – DO NOT CITE OR QUOTE
113
Bryce, J., Coitinho, D., Darnton-Hill, I., Pelletier, D., Pinstrup-Andersen, P. & Maternal and Child Undernutrition Study Group. 2008. Maternal and child undernutrition: effective action at national level. Lancet, 371(9611): 510–526.
Cairns, G., Angus, K., Hastings, G. & Caraher, M. 2013. Systematic reviews of the evidence on the nature, extent and effects of food marketing to children. A retrospective summary. Appetite, 62: 209–215.
Cakmak, I. 2008. Enrichment of cereal grains with zinc: agronomic or genetic biofortification? Plant Soil, 302(1):
1–17. Campbell, A.A., de Pee, S., Sun, K., Kraemer, K., Thorne-Lyman, A., Moench-Pfanner, R., Sari, M., Akhter,
N., Bloem, M.W. & Semba, R.D. 2010. Household rice expenditure and maternal and child nutritional status
in Bangladesh. J. Nutr., 140(1):189–194. Campos, S., Doxey, J. & Hammond, D. 2011. Nutrition labels on prepackaged foods: a systematic review.
Public Health Nutr.,14: 1496–1506. Carletto, G., Ruel, M., Winters, P. & Zezza, A. 2015. Farm-level pathways to improved nutritional status:
Introduction to the special issue. The Journal of Development Studies, 51(8): 945–957. Caspi, C.E., Sorensen, G., Subramanian, S.V. & Kawachi, I. 2012. The local food environment and diet: a
systematic review. Health & Place, 18(5): 1172–1187. Castillo-Lancellotti, C., Tur, J.A. & Uauy, R. 2013. Impact of folic acid fortification of flour on neural tube
defects: a systematic review. Public Health Nutrition, 16(5): 901–911. Cesar G Victora, Linda Adair, Caroline Fall, Pedro C Hallal, Reynaldo Martorell, Linda Richter, Harshpal
Singh Sachdev. 2008. Maternal and Child Undernutrition Study Group. 2008. Maternal and child
undernutrition: consequences for adult health and human capital. 371(9609): 340-357. https://www.ncbi.nlm.nih.gov/pmc/articles/PMC2258311/
Chakrabarti, S., Kishore, A. &Roy, D. 2016. Effectiveness of food subsidies in raising healthy food consumption: public distribution of pulses in India. Washington, DC, IFPRI.
Chege, C.G.K., Andersson, C.I.A. & Qaim, M. 2014. Impacts of supermarkets on farm household nutrition in Kenya. Paper prepared for presentation at the EAAE 2014 Congress ‘Agri-Food and Rural Innovations for
Healthier Societies’ 26–29 August 2014, Ljubljana, Slovenia. Chopra, M. 2002. Globalization and food: implications for the promotion of “healthy” diets. Geneva, Switzerland,
World Health Organization. Chopra, M., Galbraith, S. & Darnton-Hill, I. 2002. A global response to a global problem: the epidemic of
overnutrition. Bulletin of the World Health Organization, 80: 952–958. Chouinard, H., Davis, D., LaFrance, J.T. & Perloff, J. 2005. The effects of a fat tax on dairy products. CUDARE
Working Paper 1007. Berkeley, USA, Department of Agricultural and Resource Economics, University of California.
Cirera, X. & Masset, E. 2010. Income distribution trends and future food demand.2010. Income distribution trends and future food demand. Philosophical Transactions of the Royal Society of London B: Biological Sciences, 365(1554): 2821–2834.
Colchero, M.A., Popkin, B.M., Rivera, J.A. & Ng, S.W. 2016. Beverage purchases from stores in Mexico under
the excise tax on sugar sweetened beverages: observational study. BMJ, 352 (available at http://www.bmj.com/content/bmj/352/bmj.h6704.full.pdf).
Commonwealth of Australia. 2013. Eat for health Australian dietary guidelines (available at
(https://www.nhmrc.gov.au/_files_nhmrc/publications/attachments/n55a_australian_dietary_guidelines_summary_131014.pdf).
Compton, J., Wiggins, S. & Keats, S. 2010. Impact of the global food crisis on the poor: what is the evidence?
London, Overseas Development Institute (available at https://www.odi.org/sites/odi.org.uk/files/odi-assets/publications-opinion-files/6371.pdf).
Consumers International. 2000. The agreement on agriculture, post-Seattle. Trade and Economics Briefing
Paper, No.2, London, Consumers International. Counihan, C. & Van Esterik, P. eds. 2013. Food and culture: a reader. Routledge. Coyle, W., Hall, W. & Ballenger, N. 2001. Transportation technology and the rising share of U.S. perishable food
trade. In A. Regmi, ed. Changing structure of global food consumption and trade. Market and Trade Economics Division, Economic Research Service, US Department of Agriculture, Agriculture and Trade Report. WRS-01-1.
Cowburn, G. & Stockley, L. 2005. Consumer understanding and use of nutrition labelling: a systematic review. Public Health Nutr., 8: 21–28.
Crisp, J., Morris, T. & Refstie, H. 2012. Displacement in urban areas, new challenges, new partnerships. Disasters, 36(s1): S23–S42.
Cuc, N. 2015. Mangrove forest restoration in northern Viet Nam. In C. Kumar, S. Begeladze, M. Calmon & C. Saint-Laurent, eds. Enhancing food security through forest landscape restoration: Lessons from BurkinaFaso, Brazil, Guatemala, Viet Nam, Ghana, Ethiopia and Philippines, pp.106–121. Gland, Switzerland, IUCN.
Dannefer R, Williams DA, Baronberg S, Silver L. 2012. Healthy bodegas: increasing and promoting healthy
foods at corner stores in New York City. American Journal of Public Health. 2012;102:e27–31. Darmon, N. & Drenowski, A. 2008. Does social class predict diet quality? Am. J. Clin. Nutr., 87: 1107–1117. Das, J.K., Salam, R.A., Kumar, R. & Bhutta, Z.A. 2013. Micronutrient fortification of food and its impact on
woman and child health: a systematic review. Systematic Reviews, 2(1): 67.

HLPE DRAFT V0 (24 October 2016) – DO NOT CITE OR QUOTE
114
De Benoist B. (2008). Conclusions of a WHO Technical Consultation on folate and vitamin B12 deficiencies.
Food Nutr. Bull. 29, S238–S244 [PubMed] De Bruyn, J., Maulaga, W., Rukambile, E., Bagnol, B., Li, M., Darnton-Hill, I., Thomson, P., Simpson, J.,
Mor, S. and Alders, R. [in press] Village chicken ownership, irrespective of location of overnight housing, has
a positive association with height-for-age Z-scores of infants and young children in central Tanzania. Accepted for an oral presentation at the International One Health Ecohealth Congress, Melbourne, 3-7 December 2016
De Clerck, F. (2013) Harnessing biodiversity: from diets to landscapes. in: Fanzo, J. and Hunter, D. Borelli, T.
and Mattei, F. (eds) Diversifying Food and Diets: Using Agricultural Biodiversity to Improve Nutrition and Health. Issues in Agricultural Biodiversity, Earthscan, UK.
De Moura, F.F., Palmer, A.C., Finkelstein, J.L., Haas, J.D., Murray-Kolb, L.E., Wenger, M.J., Birol, E., Boy, E. & Peña-Rosas, J.P. 2014. Are biofortified staple food crops improving vitamin A and iron status in women and children? New evidence from efficacy trials. Advances in Nutrition: An International Review Journal, 5(5): 568–570.
de Brauw, A., Eozenou, P., Gilligan, D., Kumar, N. & Meenakshi, J.V. 2015. Biofortification, crop adoption and health information: Impact pathways in Mozambique and Uganda. HarvestPlus Working Paper No. 21 (available at http://www.a4nh.cgiar.org/files/2013/06/BiofortificationCropAdoptionAndHealthInformation1.pdf).
De Schutter, O. 2010. Food commodities speculation and food price crises. Briefing Note 02. September
(available at http://www2.ohchr.org/english/issues/food/docs/Briefing_Note_02_September_2010_EN.pdf). De Wals, P., Tairou, F., Van Allen, M.I., Uh, S-H., Lowry, R.B., Sibbald, B., Evans, J.A., Van den Hof, M.C.,
Zimmer, P., Crowley, M., Fernandez, B., Lee, N.S. & Niyonsenga, T. 2007. Reduction in neural-tube defects after folic acid fortification in Canada. The New England Journal of Medicine, 357(2): 135–142.
DeSA, U.N. 2013. World population prospects: the 2012 revision. New York, USA, Population Division of the
Department of Economic and Social Affairs of the United Nations Secretariat. Devereux, S. 2009. Seasonality and social protection in Africa. Future Agricultures, Working Paper 011 (available
at http://www.future-agricultures.org/publications/research-and-analysis/109-seasonality-and-social-protection-in-africa/file).
Devereux, S., Sabates-Wheeler, R., & Longhurst, R. (Eds.). (2013).Seasonality, rural livelihoods and
development. Routledge. Devereux, S., Masset, E., Sabates-Wheeler, R., Samson, M., te Lintelo, D. T., & Rivas, A. M. (2015).
Evaluating the targeting effectiveness of social transfers: a literature review. Dewey, K.G. & Adu‐ Afarwuah, S. 2008. Systematic review of the efficacy and effectiveness of complementary
feeding interventions in developing countries. Maternal & Child Nutrition, 4(s1): 24–85. Dhar, T. & Baylis, K. 2011. Fast-food consumption and the ban on advertising targeting children: the Quebec
experience. Journal of Marketing Research, 48(5): 799–813. Dinsa, G.D., Goryakin, Y., Fumagalli, E. & Suhrcke, M. 2012. Obesity and socioeconomic status in developing
countries: a systematic review. Obes. Rev., 13(11): 1067–1079. Doran, M. 1995. Livestock policy analysis. ILRI (available at http://pdf.usaid.gov/pdf_docs/PNABW979.pdf). Downs S and Fanzo J. 2016. Managing Value Chains for Improved Nutrition. Good Nutrition: Perspectives for
the 21st Century, pp. 45-59. Karger: Basel, Switzerland. Downs, S. & Fanzo J. 2016. Managing value chains for improved nutrition in nutrition & health in developing
world. 3rd ed. Downs, S. & Fanzo, J. 2015. Is a Cardio-Protective Diet Sustainable? A Review of the Synergies and Tensions
Between Foods That Promote the Health of the Heart and the Planet. Curr Nutr Rep. 4(4): 313-322. Downs, S.M., Thow, A.M. & Leeder, S.R. 2013. The effectiveness of policies for reducing dietary trans fat: a
systematic review of the evidence. Bulletin of the World Health Organization, 91(4): 262–269 (available at http://www.who.int/bulletin/volumes/91/4/12-111468/en/).
Drewnowski, A. 2004. Obesity and the food environment: dietary energy density and diet costs. American Journal of Preventive Medicine, 27(3): 154–162.
Drewnowski, A. & Hann, C. 1999. Food preferences and reported frequencies of food consumption as predictors of current diet in young women. The American Journal of Clinical Nutrition, 70(1): 28–36.
Drewnowski, A. & Specter, S.E. 2004. Poverty and obesity: the role of energy density and energy costs. The American Journal of Clinical Nutrition, 79(1): 6–16.
Duran, A.C., De Almeida, S.L., Latorre, M.R. & Jaime, P.C. 2015. The role of the local retail food environment in fruit, vegetable and sugar-sweetened beverage consumption in Brazil. Public Health Nutrition (Wallingford),
9: 1–10. E-Jahan, K., Ahmed, M. & Belton, B. 2010. The impacts of aquaculture development on food security: lessons
from Bangladesh. Aquaculture Research, 41(4): 481–495. Egal, F. (2006). Nutrition in conflict situations. British Journal of Nutrition,96(S1), S17-S19. Ehrlich, P. R., & Harte, J. (2015). Opinion: To feed the world in 2050 will require a global revolution. Proceedings
of the National Academy of Sciences, 112(48), 14743-14744. Eicher-Miller, H.A., Fulgoni, V.L. & Keast, D.R. 2012. Contributions of processed foods to dietary intake in the
US from 2003–2008: a report of the Food and Nutrition Science Solutions Joint Task Force of the Academy of Nutrition and Dietetics, American Society for Nutrition, Institute of Food Technologists. J. Nutr., 142(11): 2065S–2072S.

HLPE DRAFT V0 (24 October 2016) – DO NOT CITE OR QUOTE
115
Englberger, L., Kuhnlein, H.V., Lorens, A., Pedrus, P., Albert, K., Currie, J., Pretrick, M., Jim, R. a& Kaufer, L. 2010. Pohnpei, FSM case study in a global health project documents its local food resources and successfully promotes local food for health. Pacific Health Dialog., 16(1): 121–128.
Englberger, L., Lorens, A., Pretrick, M., Raynor, B., Currie, J., Corsi, A., Kaufer, L., Naik, R.I., Spegal, R. & Kuhnlein, H.V. 2011. Approaches and lessons learned for promoting dietary improvement in Pohnpei,
Micronesia. In FAO/CAB International. Combating micronutrient deficiencies: food-based approaches. Rome. Englberger, L., Lorens, A., Pedrus, P., Albert, K., Levendusky, A., Hagilmai, W., Paul, Y., Moses, P., Jim,
R., Jose, S. and Nelber, D., 2013. Let's Go Local! Pohnpei promotes local food production and nutrition for
health. Indigenous peoples' food systems and well-being: interventions and policies for healthy communities, pp.191-220. FAO: Rome, Italy.
Ericksen, P. J. (2008). Conceptualizing food systems for global environmental change research. Global
Environmental Change, 18(1), 234-245. Ethiopian Public Health Institute. 2009. Nutrition Baseline Survey report for the National Nutrition Program of
Ethiopia. Available at: http://www.ephi.gov.et/images/nutrition/nutrition%20baseline%20survey%20report.pdf Eyles, H., Mhurchu, C.N., Nghiem, N. & Blakely, T. 2012. Food pricing strategies, population diets, and non-
communicable disease: a systematic review of simulation studies. PLoS Med, 9(12). Ezzati, M. & Riboli, E. 2013. Behavioral and dietary risk factors for noncommunicable diseases. N. Engl. J. Med.,
369(10): 954–64. Fanzo, J. 2014. Strengthening the engagement of food and health systems to improve nutrition security:
Synthesis and overview of approaches to address malnutrition. Global Food Security, 3(3): 183–192. Fan, S. & Pandya-Lorch, R. 2012. Reshaping agriculture for nutrition and health: an IFPRI 2020 book.
Washington, DC, IFPRI. FAO. 2012. Sustainable diets: directions and solutions for policy, research and action. Rome. FAO. 2015a. Natural capital impacts in agriculture (available at
http://www.fao.org/fileadmin/templates/nr/sustainability_pathways/docs/Natural_Capital_Impacts_in_Agriculture_final.pdf).
FAO. 2015b. Nutrition in the trade and food security nexus. The state of agricultural commodities markets in depth, by C. Hawkes. Rome (available at http://www.fao.org/3/a-i5223e.pdf).
FAO. 2015c. Designing nutrition-sensitive agriculture investments. Checklist and guidance for programme formulation. Rome.
FAO. 2011. The state of food and agriculture 2010-2011. Women in agriculture, Closing the gender gap for
development. Rome (avaliable at http://www.fao.org/docrep/013/i2050e/i2050e00.htm). FAO (2004) What is Agrobiodiversity? FAO, Rome. FAO/IFAD/WFP. 2016. The State of Food Insecurity in the World 2016. FAO/IFAD/WFP. 2015. The State of Food Insecurity in the World 2015. Meeting the 2015 international hunger
targets: taking stock of uneven progress. Rome (available at http://www.fao.org/3/a-i4646e.pdf). FAO/IFAD/WFP. 2013.The State of Food Insecurity in the World 2013. The multiple dimensions of food security.
Rome, FAO http://www.fao.org/docrep/018/i3434e/i3434e.pdf FAO/WHO. 2014. Conference outcome document: Rome Declaration on Nutrition. Second International
Conference on Nutrition (ICN2), Rome, 19–21 November 2014. Feng, J., Glass, T.A., Curriero, F.C., Stewart, W.F. & Schwartz, B.S. 2010. The built environment and obesity:
a systematic review of the epidemiologic evidence. Health Place, 16: 175–190. Fernald, L.C.H., Gertler, P.J. & Hou, X. 2008a. Cash component of conditional cash transfer program is
associated with higher body mass index and blood pressure in adults. J. Nutr., 138(11): 2250–2257. Fernald, L.C.H., Gertler, P.J. & Neufeld, L.M. 2008b. Role of cash in conditional cash transfer programmes for
child health, growth, and development: an analysis of Mexico's Oportunidades. Lancet, 371: 828–837. Fernandes, M., Galloway, R., Gelli, A., Mumuni, D., Hamdani, S., Kiamba, J., Quarshie, K., Bhatia, R.,
Aurino, E., Peel, F. & Drake, L. 2016. Enhancing linkages between healthy diets, local agriculture, and sustainable food systems; the school meals planner package in Ghana. Food and Nutrition Bulletin.
Finkelstein, J.L., Mehta, S., Udipi, S.A., Ghugre, P.S., Luna, S.V., Wenger, M.J., Murray-Kolb, L.E., Przybyszewski, E.M. & Haas, J.D. 2015. A randomized trial of iron-biofortified pearl millet in school children in India. J. Nutr., 145(7): 1576–1581.
Finucane, M.M., Stevens, G.A., Cowan, M.J., Danaei, G., Lin, J.K., Paciorek, C.J., Singh, G.M., Gutierrez, H.R., Lu, Y,. Bahalim, A.N., Farzadfar, F., Riley, L.M., Ezzati, M., on behalf of the Global Burden of Metabolic Risk Factors of Chronic Diseases Collaborating Group (Body Mass Index). 2011. National,
regional, and global trends in body-mass index since 1980: systematic analysis of health examination surveys and epidemiological studies with 960 country-years and 9·1 million participants. The Lancet. 377(9765): 557–567.
Fiorella, K.J., Chen, R.L., Milner, E.M. & Fernald, L.C. 2016. Agricultural interventions for improved nutrition: a
review of livelihood and environmental dimensions. Global Food Security, 8: 39–47. Fisher, C.G. & Garnett, T. 2016. Plates, pyramids, planet Developments in national healthy and sustainable
dietary guidelines: a state of play assessment. Rome, FAO/The Food Climate Research Network at The University of Oxford.
Fledderjohann, J., Vellakkal, S., Khan, Z., Ebrahim, S. & Stuckler, D. 2016. Quantifying the impact of rising
food prices on child mortality in India: a cross-district statistical analysis of the District Level Household Survey. Int. J. Epidemiol., 45(2): 554–564.

HLPE DRAFT V0 (24 October 2016) – DO NOT CITE OR QUOTE
116
Floros, J.D., Newsome, R., Fisher, W., Barbosa‐ Cánovas, G.V., Chen, H., Dunne, C.P., German, J.B., Hall, R.L., Heldman, D.R., Karwe, M.V., Knabel, S.J., Labuza, T.P., Lund, D.B., Newell-McGloughlin, M., Robinson, J.L., Sebranek, J.G., Shewfelt, R.L., Tracy, W.F., Weaver, C.M. & Ziegler, G.R. 2010. Feeding the world today and tomorrow: the importance of food science and technology. Comprehensive Reviews in Food Science and Food Safety, 9(5): 572–599.
Foresight. 2011. The future of food and farming: challenges and choices for global sustainability. London,
Government Office for Science. Fouéré T, Maire B, Delpeuch F, Martin-Prével Y, Tchibindat F, Adoua-Oyila G. 2000. Dietary changes in
African urban households in response to currency devaluation: foreseeable risks for health and nutrition. Public Health Nutr. 3(3):293-301.
Friedmann, H. (2005) from colonialism to green capitalism: social movements and emergence of food regimes,
in: F. BUTTEL and P. MCMICHAEL (eds) New Directions in the Sociology of Global Development, Research in Rural Sociology and Development, oxford: elsevier, pp. 227–264.
Fuglie, K.O. & Heisey, P.W. 2007. Economic returns to public agricultural research. US Department of
Agriculture, Economic Research Service. Economic Brief Number 10. Furst, T., Connors, M., Bisogni, C.A., Sobal, J. & Falk, L.W. 1996. Food choice: a conceptual model of
process. Appetite, 26: 247–265. Gaillard R, Durmuş B, Hofman A, Mackenbach JP, Steegers EA, Jaddoe VW. 2013. Risk factors and
outcomes of maternal obesity and excessive weight gain during pregnancy. Obesity (Silver Spring). 21(5): 1046-1055. https://www.ncbi.nlm.nih.gov/pubmed/23784909
Gamfeldt, L., Snäll, T., Bagchi, R., Jonsson, M., Gustafsson, L ., Kjellander, P., et al. 2013. Higher levels of
multiple ecosystem services are found in forests with more tree species. Nat. Commun. 4, 1340 (2013) Garrett, G.S., Luthringer, C.L. & Mkambula, P. 2016. Improving nutritious food systems by establishing national
micronutrient premix supply systems. Sight and Life, 30(1): 62–68. Garnett, T., Appleby, M. C., Balmford, A., Bateman, I. J., Benton, T. G., Bloomer, P., ... & Herrero, M. (2013).
Sustainable intensification in agriculture: premises and policies. Science, 341(6141), 33-34. Gera, T., Sachdev, H.S. & Boy, E. 2012. Effect of iron-fortified foods on hematologic and biological outcomes:
systematic review of randomized controlled trials. Am J Clin Nutr, 96(2): 309–324. Gerber, P.J., Steinfeld, H., Henderson, B., Mottet, A., Opio, C., Dijkman, J., Falcucci, A. & Tempio, G. 2013.
Tackling climate change through livestock – A global assessment of emissions and mitigation opportunities.
Rome, FAO. Ghosh, D., & Shah, J. (2012). A comparative analysis of greening policies across supply chain structures.
International Journal of Production Economics, 135(2), 568-583. Gillespie S, Mason J. (1991). Nutrition relevant actions: some experiences from the eighties and lessons for the
nineties ACC/SCN State-of-the-Art Series. Nutrition Policy Discussion Paper no. 10 Geneva: United Nations. Gitau, R., Makasa, M., Kasonka, L., Sinkala, M., Chintu, C., Tomkins, A. & Filteau, S. 2005. Maternal
micronutrient status and decreased growth of Zambian infants born during and after the maize price increases resulting from the southern African drought of 2001-2002. Public Health Nutr. 8(7): 837–843.
Glanz, K., Sallis, J.F., Saelens, B.E. & Frank, L.D. 2005. Healthy nutrition environments: concepts and
measures. Am. J. Health Promot., 19: 330–333. Gliessman, S.R. 2007. Agroecology: the ecology of sustainable food systems. CRC Press. Global Panel on Agriculture and Food Systems for Nutrition. 2016. Food systems and diets: Facing the
challenges of the 21st century. London, UK. Godfray, H.C.J., Crute, I.R., Haddad, L., Lawrence, D., Muir, J.F., Nisbett, N., Pretty, J., Robinson, S.,
Toulmin, C. & Whiteley, R. 2010. The future of the global food system. Philosophical Transactions of the Royal Society of B: Biological Sciences, 365(1554): 2769–2777.
Godfrey KM & Barker DJ. 2001. Fetal programming and adult health. Public Health Nutr. 4(2B): 611-624.
https://www.ncbi.nlm.nih.gov/pubmed/11683554 Gómez, M.I., Barrett, C.B., Raney, T., Pinstrup-Andersen, P., Meerman, J., Croppenstedt, A., Lowder, S.,
Carisma, B. & Thompson, B. 2013. Post-green revolution food systems and the triple burden of malnutrition. ESA Working Paper No. 13-02. FAO. Rome.
Government of India. 2008. Report of the expert committee to study the impact of futures trading on agricultural commodity prices. Ministry of Consumer Affairs, Food & Public Distribution.
Graham, R.D., Welch, R.M., Saunders, D.A., Ortiz-Monasterio, I., Bouis, H.E., Bonierbale, M., de Haan, S., Burgos, G., Thiele, G., Liria, R. et al. 2007. Nutritious subsistence food systems. Adv. Agron. 92, 1–74
(2007) Green, R; Cornelsen, L; Dangour, AD; Turner, R; Shankar, B; Mazzocchi, M; Smith, RD (2013) The effect of
rising food prices on foodconsumption: systematic review with meta-regression. BMJ (Clinicalresearch ed), 346. f3703.
Groombridge, B. & Jenkins, M. 2002. World Atlas of Biodiversity. Berkeley, California, USA, University of
California Press. 256 pp. Guldan GS, Zeitlin MF, Beiser AS, Super CM, Gershoff SN, Dhatta S. 1993. Maternal education and child
feeding practices in Bangladesh. Soc Sci Med. 36:925–935 Haack, S.A. & Byker, C.J. 2014. Recent population adherence to and knowledge of United States federal
nutrition guides, 1992–2013: a systematic review. Nutr. Rev., 72(10): 613–626.

HLPE DRAFT V0 (24 October 2016) – DO NOT CITE OR QUOTE
117
Haddad, L., & Oshaug, A. (1998). How does the human rights perspective help to shape the food and nutrition
policy research agenda?. Food Policy, 23(5), 329-345. Haggblade, S., Duodu, K.G., Kabasa, J.D., Minnaar, A., Ojijo, N.K. & Taylor, J.R. 2016. Emerging early
actions to bend the curve in sub-Saharan Africa’s nutrition transition. Food and Nutrition Bulletin, 37(2): 219–241.
Hansen, J. E. (2007). Scientific reticence and sea level rise. Environmental Research Letters, 2(2), 024002. Hall, A.J., Sivamohan, M.V.K., Clark, N., Taylor, S. & Bockett, G. 1998. Institutional developments in Indian
agricultural R and D systems: Emerging patterns of public and private sector activities. Science, Technology and Development, 16: 51–76.
Hall A., Bockett, G., Taylor, S., Sivamohan, M.V.K. & Clark, N. 2001. Why research partnerships really matter:
innovation theory, institutional arrangements and implications for the developing new technology for the poor. World Development, 29(5): 783–797.
Hanson, M.A. & Gluckman, P.D. 2015. Developmental origins of health and disease--global public health
implications, Best Pract. Res. Clin. Obste.t Gynaecol., 29(1): 24–31. Harmer, A. & Macrae, J. 2004. Beyond the continuum: aid policy in protracted crisis, HPG Report 18. p.1.
London, Overseas Development Institute. Harou, A. under review. Unraveling the effect of targeted input subsidies on household consumption and child
nutrition: the case of Malawi. HarvestPlus Project Monitoring Report. 2015. Understanding the role of various parameters on micronutrient
malnutrition, dietary intakes of vitamin A and iron, and their implications on the project approach in 12 districts of Uganda.
Hawkes, C. 2006. Uneven dietary development: Linking the policies and processes of globalization with the
nutrition transition, obesity and diet-related chronic diseases. Global Health, 2:4. Hawkes, C., Chopra, M. & Friel, S. 2009. Globalization, trade, and the nutrition transition. In R. Labonté, T.
Schrecker, C. Packer & V. Runnels. Globalization and health: pathways, evidence and policy. Routledge. Hawkes, C., & Ruel, M. T. (2012). Value chains for nutrition. Reshaping agriculture for nutrition and health, 73-
82. IFPRI, Washington DC. http://www.fao.org/fsnforum/sites/default/files/discussions/contributions/Value-Chains-for-Nutrition.pdf
Hawkesworth, S., Dangour, A.D., Johnston, D., Lock, K., Poole, N., Rushton, J., Uauy, R. & Waage, J. 2010. Feeding the world healthily: the challenge of measuring the effects of agriculture on health. Philosophical Transactions of the Royal Society of London B: Biological Sciences, 365(1554): 3083–3097.
He, F.J., Brinsden, H.C. & MacGregor, G.A. 2014. Salt reduction in the United Kingdom: a successful experiment in public health. J. Hum. Hypertens., 28(6): 345–352.
He, F.J., Campbell, N.R. and MacGregor, G.A., 2012. Reducing salt intake to prevent hypertension and
cardiovascular disease. Revista Panamericana de Salud Pública, 32(4), pp.293-300. Headey, D., Hoddinott, J., Ali, D., Tesfaye, R. & Dereje, M. 2015. The other Asian enigma: explaining the rapid
reduction of undernutrition in Bangladesh. World Development, 66; 749–761. Heller, M.C. & Keoleian, G.A. 2000. Life cycle-based sustainability indicators for assessment of the U.S. food
system. The Center for Sustainable Systems Report No. CSS00-04. Heltberg, R. (2009), Malnutrition, poverty, and economic growth. Health Econ, 18: S77–S88. doi:
10.1002/hec.1462 Hendrix, C.S. 2016. When Hunger Strikes: How Food Security Abroad Matters for National Security at Home,
Global Food & Agriculture. https://www.thechicagocouncil.org/sites/default/files/Report_When_Hunger_Strikes_1604.pdf
Henson, S. & Reardon, T. 2005. Private agri-food standards: Implications for food policy and the agri-food system, Food Policy, 30(3): 241–253.
Herforth, A. 2010. Nutrition and the environment: fundamental to food security in Africa. In P. Pinstrup-Andersen, ed. The african food system and its interaction with human health and nutrition. Cornell University Press.
Herforth, A., Andrew, J. & Pinstrup-Anderson, P. 2012. Prioritizing nutrition in agriculture and rural development: guiding principles for operational investments. Health, Nutrition and Population (HNP)
Discussion Paper. Washington DC, World Bank. Herforth, A. & Ahmed, S. 2015. The food environment, its effects on dietary consumption, and potential for
measurement within agriculture-nutrition interventions. Food Security, 7(3): 505–520. Hersey, J.C., Wohlgenant, K.C., Arsenault, J.E., Kosa, K.M. & Muth, M.K. 2013. Effects of front-of-package
and shelf nutrition labeling systems on consumers. Nutr. Rev., 71(1): 1–14. Heywood, V. (2013) Overview of agricultural biodiversity and its contribution to nutrition and health in: Fanzo, J.
and Hunter, D. Borelli, T. and Mattei, F. (eds) Diversifying Food and Diets: Using Agricultural Biodiversity to Improve Nutrition and Health. Issues in Agricultural Biodiversity, Earthscan, UK.
HLPE. 2011. Price volatility and food security. A report by the High Level Panel of Experts on Food Security and
Nutrition of the Committee on World Food Security, Rome (available at www.fao.org/cfs/cfs-hlpe). HLPE. 2013. Investing in smallholder agriculture for food security. A report by the High Level Panel of Experts on
Food Security and Nutrition of the Committee on World Food Security, Rome (available at http://www.fao.org/3/a-i2953e.pdf).
HLPE. 2014. Food losses and waste in the context of sustainable food systems. A report by the High Level Panel
of Experts on Food Security and Nutrition of the Committee on World Food Security, Rome (available at http://www.fao.org/3/a-i3901e.pdf).

HLPE DRAFT V0 (24 October 2016) – DO NOT CITE OR QUOTE
118
HLPE. 2016. Sustainable agricultural development for food security and nutrition: what roles for livestock?
A report by the High Level Panel of Experts on Food Security and Nutrition of the Committee on World Food Security, Rome.
Hoddinot, J., M. Rosegrant, and M. Torero. 2012. “Investments to Reduce Hunger and Undernutrition.”
Copenhagen Consensus 2012 Challenge Paper, Hunger and Malnutrition. International Food Policy Research Institute, Washington DC.
Holsten J. 2009. Obesity and the community food environment: a systematic review. Public Health Nutr., 12:
397–405. Honein, M.A., Paulozzi, L.J., Mathews, T.J., Erickson, J.D. & Wong, L.Y.C. 2001. Impact of folic acid
fortification of the US food supply on the occurrence of neural tube defects. JAMA, 285(23): 2981–2986. Horton, S., H. Alderman, J. Rivera, and B. Lomborg. 2008. Copenhagen Consensus 2008 Challenge Paper,
Hunger and Malnutrition. Copenhagen Consensus Center Draft, 11. Hotz, C., Loechl, C., Lubowa, A., Tumwine, J.K., Ndeezi, G., Nandutu Masawi, A., Baingana, R., Carriquiry,
A., de Brauw, A., Meenakshi, J.V. & Gilligan, D.O. 2012. Introduction of β-carotene–rich orange sweet
potato in rural Uganda resulted in increased vitamin A intakes among children and women and improved vitamin A status among children. J. Nutr., 142(10): 1871–1880.
Huang, S. 2010. Global trade of fruits and vegetables and the role of consumer demand. In C. Hawkes, C. Blouin, S. Henson, N. Drager & L. Dubé, eds. Trade, food, diet and health: perspectives and policy options. Oxford,
UK, Wiley Blackwell. Hueston W. & McLeod, A. 2012. Overview Of The Global Food System: Changes Over Time/Space And
Lessons For Future Food Safety. In Improving Food Safety Through a One Health Approach: Workshop Summary. https://www.ncbi.nlm.nih.gov/books/NBK114491/
Huth, P.J., FulgoniIII, V.L., Keast, D.R., Park K. & Auestad, N. 2013. Major food sources of calories, added
sugars, and saturated fat and their contribution to essential nutrient intakes in the U.S. diet: data from the national health and nutrition examination survey (2003–2006). Nutrition Journal. 12: 116.
Imamura, F., Micha, R., Khatibzadeh, S., Fahimi, S., Shi, P., Powles, J., Mozaffarian, D. on behalf of the Global Burden of Diseases Nutrition and Chronic Diseases Expert Group (NutriCoDE). 2015. Dietary quality among men and women in 187 countries in 1990 and 2010. Lancet Global Health, 3: e132–42.
IDF (International Diabetes Federation). 2015. IDF diabetes atlas. 7th ed. Brussels (available at
http://www.diabetesatlas.org). IFPRI. 2011. Leveraging agriculture for improving nutrition and health, highlights from an international conference.
Washington, DC, IFPRI. IFPRI. 2014. 2013 Global food policy report. Washington, DC, IFPRI. IFPRI. 2016a. Global Nutrition Report 2016: from promise to impact: ending malnutrition by 2030. Washington,
DC, IFPRI. IFPRI. 2016b. Nourishing millions: stories of change in nutrition, by S. Gillespie, J. Hodge, S. Yosef & R. Pandya-
Lorch, eds. Washington, DC, IFPRI. IFT (Institute of Food Technologists). 2002. IFT expert report on emerging microbiological food safety issues.
Chicago, USA (available at http://www.ift.org/~/media/Knowledge%20Center/Science%20Reports/Expert%20Reports/Emerging%20Microbiological/Emerging%20Micro.pdf).
Ingram, J. 2011. A food systems approach to researching food security and its interactions with global environmental change. Food Security, 3(4): 417–431.
International Bank for Reconstruction and Development / The World Bank. 2007. From Agriculture to
Nutrition: Pathways, Synergies and Outcomes. Washington, DC. IPCC. 2014. Climate Change 2014: impacts, adaptation, and vulnerability. Part A: Global and Sectoral Aspects.
Contribution of Working Group II to the Fifth Assessment Report of the Intergovernmental Panel on Climate Change. C.B. Field, V.R. Barros, D.J. Dokken, K.J. Mach, M.D. Mastrandrea, T.E. Bilir, M. Chatterjee, K.L. Ebi, Y.O. Estrada, R.C. Genova, B. Girma, E.S. Kissel, A.N. Levy, S. MacCracken, P.R. Mastrandrea & L.L. White, eds. Cambridge, UK, and New York, USA, Cambridge University Press. 1132 p.
IPES-FOOD (International Panel of Experts on Sustainable Food Systems). 2016. From uniformity to
diversity: a paradigm shift from industrial agriculture to diversified agroecological systems. Jensen, J.D. & Smed, S. 2007. Cost-effective design of economic instruments in nutrition policy, International
Journal of Behavioral Nutrition and Physical Activity, 4(10). Johnston, J.L., Fanzo, J. C. & Cogill, B. 2014. Understanding sustainable diets: a descriptive analysis of the
determinants and processes that influence diets and their impact on health, food security, and environmental sustainability. Advances in Nutrition, An International Review Journal, 5(4), 418–429.
Jones, A.D. & Ejeta, G. 2016. A new global agenda for nutrition and health: the importance of agriculture and food systems. Bulletin of the World Health Organization, 94(3): 228 (available at
http://dx.doi.org/10.2471/BLT.15.164509). Jones, A. D., Hoey, L., Blesh, J., Miller, L., Green, A., & Shapiro, L. F. (2016). A Systematic Review of the
Measurement of Sustainable Diets. Advances in Nutrition: An International Review Journal, 7(4), 641-664. Joshi, A., Azuma, A.M. & Feenstra, G. 2008. Do farm-to-school programs make a difference? Findings and
future research needs. Journal of Hunger & Environmental Nutrition, 3(2–3): 229–246.

HLPE DRAFT V0 (24 October 2016) – DO NOT CITE OR QUOTE
119
Kaushal, N. & Muchomba, F.M. 2015. How consumer price subsidies affect nutrition. World Development, 74:
25–42. Kearney, J. 2010. Food consumption trends and drivers. Philosophical Transactions of the Royal Society B:
Biological Sciences, 365(1554): 2793–2807. Keats, S. & Wiggins, S. 2014. Future diets: implications for agriculture and food prices. London, Overseas
Development Institute (available at http://www.odi.org/sites/odi.org.uk/files/odi-assets/publications-opinion-files/8776.pdf).
Kelly, B., Hughes, C., Chapman, K., Louie, J.C.Y., Dixon, H., Crawford, J., King, L., Daube, M. & Slevin, T.
2009. Consumer testing of the acceptability and effectiveness of front-of-pack food labelling systems for the Australian grocery market. Health Promot. Int., 24(2): 120–129.
Kelly, B., King, L., Baur, L., Rayner, M., Lobstein, T., Monteiro, C., Macmullan, J., Mohan, S., Barquera, S., Friel, S., Hawkes, C., Kumanyika, S., L'Abbé, M., Lee, A., Ma, J., Neal, B., Sacks, G., Sanders, D., Snowdon, W., Swinburn, B., Vandevijvere, S., Walker, C. & INFORMAS. 2013. Monitoring food and
nonalcoholic beverage promotions to children. Obes. Rev., 14(1): 59–69. Kennedy, G. L., Pedro, M. R., Seghieri, C., Nantel, G., & Brouwer, I. (2007). Dietary diversity score is a useful
indicator of micronutrient intake in non-breast-feeding Filipino children. The Journal of nutrition, 137(2), 472-477.
Khor, M. 2006. World trading system and development concerns. Third World Network. 13 March 2006 (available
at http://www.policyinnovations.org/ideas/policy_library/data/01272). Khoury, C.K., Bjorkman, A.D., Dempewolf, H., RamirezVillegas, J., Guarino, L., Jarvis, A., Rieseberg, L.H.,
Struik, P.C. 2014. Increasing homogeneity in global food supplies and the implications for food security. Proc.
Natl. Acad. Sci. USA 111, 4001–4006 (2014) Kimenju, S.C. 2014. The nutrition transition, supermarkets, and nutritional outcomes in developing countries.
Dissertation. University of Goettingen, Germany (available at https://ediss.uni-goettingen.de/bitstream/handle/11858/00-1735-0000-0022-5F36-F/Kimenju-dissertation-published.pdf?sequence=1).
Kimenju, S.C., Rischke, R., Klasen, S. & Qaim, M. 2015. Do supermarkets contribute to the obesity pandemic in developing countries? Public Health Nutrition, 18(17): 3224–3233.
Kimenju, S.C. & Qaim, M. 2014. The nutrition transition and indicators of child malnutrition. Food Security, 8(3):
571–583. Kohl, H. W., Craig, C. L., Lambert, E. V., Inoue, S., Alkandari, J. R., Leetongin, G., Kahlmeier, S., & Lancet
Physical Activity Series Working Group. (2012). The pandemic of physical inactivity: global action for public
health. The Lancet, 380(9838), 294-305. Koutchma, T. & Keener, L. 2015. Novel food safety technologies emerge in food production. Food Safety
Magazine. Kraak, V.I., Vandevijvere, S., Sacks, G., Brinsden, H., Hawkes, C., Barquera, S., Lobstein, T. & Swinburn,
B.A. 2016. Progress achieved in restricting the marketing of high-fat, sugary and salty food and beverage products to children. Bulletin of the World Health Organization Article ID: BLT.15.158667 (available at
http://www.who.int/bulletin/online_first/BLT.15.158667.pdf). Krishnamurthy, P., Pathania, V.S. & Tandon, S. 2014. Food price subsidies and nutrition: evidence from state
reforms to India's public distribution system. UC Berkeley Public Law Research Paper (available at http://www.isid.ac.in/~epu/acegd2014/papers/VikramSinghPathania.pdf).
Kuchler, F., Tegene, A. & Harris, J.M. 2005. Taxing snack foods: Manipulating diet quality or financing information programs? Review of Agricultural Economics, 27(1): 4−20.
L’Abbe, M, Schermel, A., Minaker, L., Kelly, B., Lee, A., Vandevijvere, S., Twohig, P., Barquera, S., Friel, S., Hawkes, C., Kumanyika, S., Lobstein, T., Ma, J., Macmullan, J., Mohan, S., Monteiro, C., Neal, B., Rayner, M., Sacks, G., Sanders, D., Snowdon, W., Swinburn, B., Walker, C. & INFORMAS. 2013. Monitoring foods and beverages provided and sold in public sector settings. Obes. Rev., 14(1): 96–107.
Lagarde, M., Haines, A. & Palmer, N. 2007. Conditional cash transfers for improving uptake of health interventions in low-and middle-income countries: a systematic review. JAMA, 298(16):1900–1910.
Landrigan, P. J., & Benbrook, C. (2015). GMOs, Herbicides, and Public Health. The New England Journal of
Medicine. Retrieved from http://www.nejm.org/doi/full/10.1056/NEJMp1505660#t=article Laverty A.A., Raffaele Palladino, John Tayu Lee and Christopher Millett. 2015. Associations between active
travel and weight, blood pressure and diabetes in six middle income countries: a cross-sectional study in older adults. International Journal of Behavioral Nutrition and Physical Activity. 12:65.
Lawrence, M. A., Friel, S., Wingrove, K., James, S. W., & Candy, S. (2015). Formulating policy activities to
promote healthy and sustainable diets. Public health nutrition, 18(13), 2333-2340. Lee, A. 2016. Affordability of fruits and vegetables and dietary quality worldwide. The Lancet Global Health, 4(10):
e664–e665. Lee, I-M., Shiroma, E.J., Lobelo, F., Puska, P., Blair, S.N. & Katzmarzyk, P.T. 2012. Effect of physical
inactivity on major non-communicable diseases worldwide: an analysis of burden of disease and life expectancy. The Lancet, 380(9838): 219–229.
Lee, A., Mhurchu, C.N., Sacks, G., Swinburn, B., Snowdon, W., Vandevijvere, S., Hawkes, C., L'abbé, M., Rayner, M., Sanders, D., Barquera, S., Friel, S., Kelly, B., Kumanyika, S., Lobstein, T., Ma, J., Macmullan, J., Mohan, S., Monteiro, C., Neal, B., Walker, C. & INFORMAS. 2013. Monitoring the price and affordability of foods and diets globally. Obes. Rev., 14(1): 82–95.

HLPE DRAFT V0 (24 October 2016) – DO NOT CITE OR QUOTE
120
Lelijveld, N., Seal, A., Wells, J.C., Kirkby, J., Opondo, C., Chimwezi, E., Bunn, J., Bandsma, R., Heyderman, R.S., Nyirenda, M.J. & Kerac, M. 2016. Chronic disease outcomes after severe acute malnutrition in
Malawian children (ChroSAM): a cohort study. Lancet Glob. Health, 4(9): e654–662. Lenfant, C. 2001. Can we prevent cardiovascular diseases in low- and middle-income countries? Bulletin of the
World Health Organization, 79: 980–987. http://www.who.int/bulletin/archives/79(10)980.pdf Lesser Blumberg, R., Dewhurst, K., Sen, S.G. 2013. Gender-inclusive nutrition activities in South Asia. Volume
2. Lessons from global experiences. Washington, DC, World Bank. Lim, S.S. Vos, T., Flaxman, A.D., Danaei, G., Shibuya, K., Adair-Rohani, H., AlMazroa, M.A., Amann, M.,
Anderson, H.R., Andrews, K.G., Aryee, M., Atkinson, C., Bacchus, L.J., Bahalim, A.N., Balakrishnan, K., Balmes, J., Barker-Collo, S., Baxter, A., Bell, M.L., Blore, J.D., Blyth, F., et al. 2012. A comparative risk
assessment of burden of disease and injury attributable to 67 risk factors and risk factor clusters in 21 regions, 1990-2010: a systematic analysis for the Global Burden of Disease Study 2010. The Lancet, 380(9859): 2224–2260.
Lipinski, B., Hanson, C., Lomax, J., Kitinoja, L., Waite, R. & Searchinger, T. 2013. Installment 2 of “Creating a
Sustainable Food Future”: reducing food loss and waste. Washington, DC, World Resources Institute, United Nations Environment Programme (available at http://www.wri.org/sites/default/files/reducing_food_loss_and_ waste.pdf).
Lipinski, B., Hanson, C., Waite, R., Searchinger, T., Lomax, J. Kitinoja, L. 2013. Reducing food loss and
waste. Creating a sustainable food future, installment two. Washington, DC, World Resources Institute. Liu, J. & Saveniji. H.H.G. 2008. Food consumption patterns and their effect on water requirement in China.
Hydrological Earth Systems Sciences Discussions, 12(3): 887–898. Lloyd, S. J., Kovats, R. S., & Chalabi, Z. (2011). Climate change, crop yields, and undernutrition: development
of a model to quantify the impact of climate scenarios on child undernutrition. Environmental health perspectives,119(12), 1817.
Longhurst R. & Tomkins A. 1995. The role of care in nutrition - a neglected essential ingredient. SCN News, 12,
United Nations Administrative Committee on Coordination/Sub-Committee on Nutrition, Geneva: 1–5. Lozano et al., 2012. Global and regional mortality from 235 causes of death for 20 age groups in 1990 and 2010:
a systematic analysis for the Global Burden of Disease Study 2010. Lancet. 380(9859): 2095-2128. https://www.ncbi.nlm.nih.gov/pubmed/23245604
Lowitt, K., Hickey, G.M., Ganpat, W.& Phillip, L. 2015. Linking communities of practice with value chain development in smallholder farming systems. World Development, 74: 363–373.
Macdiarmid J.I. 2013. Is a healthy diet an environmentally sustainable diet? Proc Nutr Soc., 72(1):13-20. MacRae, T. & Donahue, K. 2013. municipal food policy entrepreneurs: A preliminary analysis of how Canadian
cities and regional districts are involved in food system change. http://tfpc.to/wordpress/wp-content/uploads/2013/05/Report-May30-FINAL.pdf
Madeley, J. 2000. Hungry for trade: how the poor pay for free trade. Zed Books, London. Malapit, H.J.L. & Quisumbing, A.R. 2015. What dimensions of women’s empowerment in agricultural matter for
nutrition in Ghana? Food Policy, 52: 54–63. Malden C. Nesheim, Maria Oria, and Peggy Tsai Yih, Editors. 2014 Committee on a Framework for Assessing
the Health, Environmental, and Social Effects of the Food System; Food and Nutrition Board; Board on Agriculture and Natural Resources; Institute of Medicine; National Research Council . http://www.nycfoodpolicy.org/wp-content/uploads/2014/05/A-Framework-for-Assessing-Effects-of-the-Food-System.pdf
Manouselis, N., Konstantas, A., Palavitsinis, N., Costopoulou, C. & Sideridis, A.B. 2009. A survey of Greek agricultural e-markets. Agricultural Economics Review, 10: 97–112.
Marshall, S. J. (2004). Developing Countries Face Double Burden of Disease. Bulletin of the World Health
Organization 82(7): 556-56. Martin-Prevel, Y., Delpeuch, F., Traissac, P., Massamba, J.P., Adoua-Oyila, G., Coudert, K. & Trèche, S.
2000. Deterioration in nutritional status of young children and their mothers in young children and their mothers in Brazzaville, Congo, following the 1994 devaluation of the CFA franc. Bull. World Health Organ., 78:108–118.
Martorell, R., Ascencio, M., Tacsan, L., Alfaro, T., Young, M.F., Addo, O.Y., Dary, O. & Flores-Ayala, R.
2015. Effectiveness evaluation of the food fortification program of Costa Rica: impact on anemia prevalence and hemoglobin concentrations in women and children. Am, J, Clin, Nutr., 101(1): 210–217.
Martorell, R., B. L. Horta, L. S. Adair, A. D. Stein, L. Richter, C. H. Fall, S. K. Bhargava, S. D. Biswas, L. Perez and F. C. Barros – Consortium on Health Orientated Research in Transitional Societies Group.
2010. Weight Gain in the First Two Years of Life Is an Important Predictor of Schooling Outcomes in Pooled Analyses from Five Birth Cohorts from Low-and Middle-Income Countries. . The Journal of Nutrition 140(2): 348-354.
Mason, J.B., Dickstein, A., Jacques, P.F., Haggarty, P., Selhub, J., Dallal, G. & Rosenberg, I.H. 2007. A
temporal association between folic acid fortification and an increase in colorectal cancer rates may be illuminating important biological principles: a hypothesis. Cancer Epidemiol, Biomarkers Prev., 16(7): 1325–1329.
Mason, J. B. and R. Shrimpton (2010). 6th Report on the world nutrition situation.
HLPE DRAFT V0 (24 October 2016) – DO NOT CITE OR QUOTE
121
Masters, W. A., Djurfeldt, A. A., De Haan, C., Hazell, P., Jayne, T., Jirström, M., & Reardon, T. (2013).
Urbanization and farm size in Asia and Africa: implications for food security and agricultural research. Global Food Security,2(3), 156-165.
Masset, E., Haddad, L., Cornelius, A. & Isaza-Castro, J. 2012. Effectiveness of agricultural interventions that aim to improve nutritional status of children: systematic review. BMJ, 344.
McCluskey, J.J. & Loureiro M.L. 2000. Consumer preferences and willingness to pay for food labeling: A discussion of empirical studies. Journal of Food Distribution Research, 34(3): 95–102.
McGinnis, J.M., Gootman, J.A. & Kraak, V.I. eds. 2006. Food marketing to children: threat or opportunity?
Washington, DC, National Academies Press. McMichael, A.J., Butler, C.D. & Dixon, J. 2015. Climate change, food systems and population health risks in
their eco-social context. Public Health, 129(10), 1361–1368. McMichael, C. (2014). Climate change and migration: Food insecurity as a driver and outcome of climate
change-related migration. In A. Malik, R. Ahtar, & E.Grohmann (Eds.), Environmental deterioration and human health (pp. 291-313). New York: Springer.
MEA, 2005. Millennium Ecosystem Assesment (MEA). Ecosystems and Human Well-being: Current State and
TrendsVol. 1, , Island Press, Washington, DC (2005) Meadows, D., Randers, J., & Meadows, D. (2004). Limits to growth: The 30-year update. Chelsea Green
Publishing. Meeker, J. & Haddad, L. 2013. A state of the art review of agriculture-nutrition linkages. An AgriDiet Position
Paper. Brighton UK, Institute of Development Studies. Meenakshi, J.V., Johnson, N.L., Manyong, V.M., De Groote, H., Javelosa, J., Yanggen, D., Naher, F.,
Gonzalez, C., Garcia, J. & Meng, E. 2010. How cost-effective is biofortification in combating micronutrient
malnutrition? An ex ante assessment. World Development, 38(1): 64–75. Messer, E, Cohen MJ, and Marchione, T. (2001) Conflict: a cause and effect of hunger. Field Exchange 12,
April 2001. p8. www.ennonline.net/fex/12/conflict Meyer-Rochow, V.B. 2009. Food taboos: their origins and purposes. Journal of Ethnobiology and
Ethnomedicine, 5: 18. Milder, J.C., Hart, A.K., Dobie, P., Minai, J. & Zaleski, C. 2014. Integrated landscape initiatives for African
agriculture, development, and conservation: a region-wide assessment, World Development, 5: 68–80. Milićević, D.R., Škrinjar, M. & Baltić, T. 2010. Real and perceived risks for mycotoxin contamination in foods
and feeds: challenges for food safety control. Toxins (Basel), 2(4): 572–592. Miller V, Yusuf S, Chow CK, et al. 2016. Availability, affordability, and consumption of fruits and vegetables in 18
countries across income levels: fi ndings from the Prospective Urban Rural Epidemiology (PURE) study. Lancet Glob Health 2016; http://dx.doi.org/10.1016/S2214-109X(16)30186-3.
Ministry of Health of Brazil. 2014. Dietary Guidelines for the Brazilian Population; 2nd Edition.
http://www.foodpolitics.com/wp-content/uploads/Brazilian-Dietary-Guidelines-2014.pdf Minten, B., Reardon, T., & Sutradhar, R. (2010). Food prices and modern retail: The case of Delhi. World
Development, 38(12), 1775-1787. Moreddu, C. 2016. Public-private partnerships for agricultural innovation: lessons from recent experiences,
OECD Food, Agriculture and Fisheries Papers, No. 92. Paris,OECD Publishing. Morris S.S., Bruce Cogill, Ricardo Uauy. 2008. Maternal and Child Undernutrition Study Group. Effective
international action against undernutrition: why has it proven so difficult and what can be done to accelerate progress? The Lancet. 371(9612): 608-621.
Moursi, M.M., Arimond, M., Dewey, K.G., Trèche, S., Ruel, M.T. & Delpeuch, F. 2008. Dietary diversity is a good predictor of the micronutrient density of the diet of 6- to 23-month-old children in Madagascar. J. Nutr., 138(12): 2448–2453.
Mozaffarian, D., Jacobson, M.F. & Greenstein, J.S. 2010. Food reformulations to reduce trans fatty acids. N. Engl. J. Med., 362: 2037–2039.
Mozaffarian, D. & Stampfer, M.J. 2010. Removing industrial trans fat from foods. BMJ, 340. Mozaffarian, D., Afshin, A., Benowitz, N.L., Bittner, V., Daniels, S.R., Franch, H.A., Jacobs, D.R., Kraus,
W.E., Kris-Etherton, P.M., Krummel, D.A., Popkin, B.M., Whitsel, L.P. & Zakai, N.A. 2012. Population
approaches to improve diet, physical activity, and smoking habits a scientific statement from the American Heart Association. Circulation, 126(12): 1514–1563.
Mozaffarian, D. (2016). Dietary and Policy Priorities for Cardiovascular Disease, Diabetes, and Obesity A
Comprehensive Review. Circulation,133(2), 187-225. NCD Risk Factor Collaboration. 2016. Trends in adult body-mass index in 200 countries from 1975 to 2014: a
pooled analysis of 1698 population-based measurement studies with 19·2 million participants. The Lancet. 387(10026): 1377–1396.
Neff, R.A., Parker, C.L., Kirschenmann, F.L., Tinch, J. & Lawrence, R.S. 2011. Peak oil, food systems, and
public health. American Journal of Public Health, 101(9): 1587–1597. Negin J, Remans R, Karuti S, Fanzo JC. 2009. Integrating a broader notion of food security and gender
empowerment into the African Green Revolution. Food Sec 1:351–360. Nelson, G. C., Rosegrant, M. W., Palazzo, A., Gray, I., Ingersoll, C., Robertson, R., ... & Msangi, S. (2010).
Food security, farming, and climate change to 2050: Scenarios, results, policy options (Vol. 172). Intl Food Policy Res Inst.

HLPE DRAFT V0 (24 October 2016) – DO NOT CITE OR QUOTE
122
Nesheim, M.C., Oria, M. & Yih, P.T. eds. 2015. A Framework for Assessing Effects of the Food System
Characteristics of the Food System. https://www.nap.edu/catalog/18846/a-framework-for-assessing-effects-of-the-food-system
NHGRI (National Human Genome Research Institute). 2003. International Consortium completes Human Genome Project (available at https://www.genome.gov/11006929/2003-release-international-consortium-completes-hgp/).
Nisbett, N., Elise Wach, Lawrence Haddad, Shams El Arifeen. 2015. What drives and constrains effective
leadership in tackling child undernutrition? Findings from Bangladesh, Ethiopia, India and Kenya. Food Policy. 53: 33-45.
Nisbett, N., Stuart Gillespie, Lawrence Haddad, Jody Harrisb. 2014. Why Worry About the Politics of
Childhood Undernutrition? World Development, 64: 420–433. Njoro, J., Nyahabeh, A., de Hoogh, I. Fanzo, J., Chahid, N., Fornah, D., Gboku, M.L.S., Kamara, M., Kargbo,
A., Koroma, A., Ljungqvist, B., Momoh, J.J., Osiro, A., Sawi, M., Rhodes, E., Scott, S., Torgerson, S., van Dorp, M. & Wiegers, E. 2013. An analysis of the food system landscape and agricultural value chains for
nutrition: A case study from Sierra Leone, ICN2 Second International Congress on Nutrition. FAO and WHO (available at http://www.fao.org/3/a-as566e.pdf).
Nonato. I.L., Luciana Oliveira de Almeida Minussi, Grazieli Benedetti Pascoal, and Daurea Abadia De-Souza. 2016. Nutritional Issues Concerning Street Foods. Journal of Clinical Nutrition & Dietetics. 2(1).
http://clinical-nutrition.imedpub.com/nutritional-issues-concerning-street-foods.pdf Nord, M. 2009. Food spending declined and food insecurity increased for middle-income and low-income
households from 2000 to 2007. Economic Information Bulletin, No. (EIB-61). 25 p. Nordic Council of Ministers. 2014. Nordic nutrition recommendations 2012: integrating nutrition and physical
activity, 5th ed. (available at: https://www.norden.org/en/theme/nordic-nutrition-recommendation/nordic-nutrition-recommendations-2012).
Nordin, S.M., Boyle, M., Kemmer, T.M. & Academy of Nutrition and Dietetics. 2013. Position of the academy of nutrition and dietetics: nutrition security in developing nations: sustainable food, water, and health. J. Acad. Nutr. Diet., 113(4): 581–95.
Norris, S. A., C. Osmond, D. Gigante, C. W. Kuzawa, L. Ramakrishnan, N. R. Lee, M. Ramirez-Zea, L. M. Richter, A. D. Stein and N. Tandon (2012) Size at birth, weight gain in infancy and childhood, and adult
diabetes risk in five low-or middle-income country birth cohorts. Diabetes care 35(1): 72-79. NYCEDC (New York City Economic Development Corporation). 2015. FRESH: Impact Report. NYC, NY
(available at http://www.nycedc.com/system/files/files/program/FRESH%20Impact%20Report.pdf). OECD. 2007. Principles for good international engagement in fragile states and situations. Paris. Olney, D.K., Pedehombga, A., Ruel, M.T. & Dillon, A. 2015. A 2-year integrated agriculture and nutrition and
health behavior change communication program targeted to women in Burkina Faso reduces anemia, wasting, and diarrhea in children 3–12.9 months of age at baseline: a cluster-randomized controlled trial. J. Nutr., 145(6): 1317–1324.
Olney, D.K., Bliznashka, L., Pedehombga, A., Dillon, A., Ruel, M.T. & Heckert, J. 2016. A 2-year integrated
agriculture and nutrition program targeted to mothers of young children in Burkina Faso reduces underweight among mothers and increases their empowerment: a cluster-randomized controlled trial. J. Nutr., 146(5): 1109–1117.
Oppert, J. M., & Charreire, H. (2012). The importance of the food and physical activity environments. In Obesity
Treatment and Prevention: New Directions (Vol. 73, pp. 113-121). Karger Publishers. Paes-Sousa, R., Regalia, F. & Stampini, M. 2013. Conditions for success in implementing CCT programs:
lessons for Asia from Latin America and the Caribbean. Social Protection and Health Division Policy Brief No. IDB-PB-192. Washington, DC, Inter-American Development Bank.
Page, H. 2013. Global Governance and Food Security as Global Public Good. CENTER ON INTERNATIONAL
COOPERATION. http://cic.nyu.edu/sites/default/files/page_global_governance_public_good.pdf PAHO (Pan American Health Organization). 2011. Recommendations from Pan American Health Organization
Expert Consultation on Marketing of Food and Non Alcoholic Beverages to Children in the Americas. Washington, DC.
Parfitt, J., Barthel, M. & Macnaughton, S. 2010. Food waste within food supply chains: quantification and potential for change to 2050. Philosophical Transactions of the Royal Society of London B: Biological Sciences, 365(1554): 3065–3081.
Parker, G. & Frith R. 2015. Health star rating system: campaign evaluation report (available at
http://healthstarrating.gov.au/internet/healthstarrating/publishing.nsf/Content/8240FC006B958E48CA257FB000190995/$File/HSR%20Campaign%20Evaluation%20Report.pdf).
Pearson-Stuttard, J., Critchley, J., Capewell, S. & O’Flaherty, M. 2015. Quantifying the socio-economic benefits of reducing industrial dietary trans fats: modelling study. PloS One, 10(8): e0132524.
doi:10.1371/journal.pone.0132524 Pechmann, C. & Catlin, J.R. 2016. The effects of advertising and other marketing communications on health-
related consumer behaviors, Current Opinion in Psychology, 10: 44–49. Pekka, P., Pirjo, P. & Ulla, U. 2002. Influencing public nutrition for non-communicable disease prevention: from
community intervention to national programme-experiences from Finland. Public Health Nutr., 5(1A): 245–252.

HLPE DRAFT V0 (24 October 2016) – DO NOT CITE OR QUOTE
123
Pelto, G.H. & Backstrand, J.R. 2003. Interrelationships between power-related and belief-related factors
determine nutrition in populations. J. Nutr., 133(1): 297S–300S. Perez, N. & Rosegrant, M.W. 2015. The impact of investment in agricultural research and development and
agricultural productivity. Washington, DC, IFPRI. Petrillo, P.L. 2012. Biocultural diversity and the Mediterranean diet. In FAO/Bioversity. Sustainable diets and
biodiversity, direction and solutions for policy research and action. Rome. Phillip, L., Johnston, D. & Granderson, I. undated. A farm to fork approach for nutritious school meals: tackling
childhood obesity in the Caribbean (available at: https://www.idrc.ca/sites/default/files/sp/Documents%20EN/idrc-a-farm-to-fork-approach-for-nutritious-school-meals.pdf).
Pimentel, D., Zuniga, R., Morrison, D. (2005). Update on the environmental and economic costs associated with
alien invasive species in the United States. Ecological Economics 52; 273–288. Pingali, P., Alinovi, L. & Sutton, J. 2005. Food security in complex emergencies: enhancing food system
resilience. Disasters, 29(s1): S5–S24. Pingali, P. L. (2012). Green Revolution: Impacts, limits, and the path ahead. Proceedings of the National
Academy of Sciences, 109(31), 12302-12308.Pinstrup-Andersen, P. 2013. Nutrition-sensitive food systems: from rhetoric to action. The Lancet, 382(9890): 375–376.
Pinstrup-Andersen, P. and Watson, D. (2011). Food Policy in Developing Countries: The Role of Government
in Global, National, and Local Food Systems. Ithaca, NY: Cornell University Press. Poletti, S., Gruissem, W. & Sautter, C. 2004. The nutritional fortification of cereals. Curr. Opin. Biotechnol.,
15(2): 162–5. Popkin, B.M. 1999. Urbanization, lifestyle changes and the nutrition transition. World Development, 27: 1905–
1916. Popkin, B.M., Adair, L.S. & Ng, S.W. 2012. Global nutrition transition and the pandemic of obesity in developing
countries. Nutrition Reviews, 70(1): 3–21. Popkin B. M., Du S. 2003. Dynamics of the nutrition transition toward the animal foods sector in China and its
implications: a worried perspective. Am. Soc. Nutr. Sci. J. Nutr. 133, S3898–S3906 Popkin BM. 2006. Global nutrition dynamics: the world is shifting rapidly toward a diet linked with
noncommunicable diseases. Am J Clin Nutr. 84(2):289-98. Powell, L.M., Chriqui, J.F., Khan, T., Wada, R. & Chaloupka, F.J. 2013. Assessing the potential effectiveness
of food and beverage taxes and subsidies for improving public health: a systematic review of prices, demand and body weight outcomes. Obes. Rev., 14:110–128.
Power, A.G. 2010. Ecosystem services and agriculture: tradeoffs and synergies. Philosophical Transactions of the Royal Society of London B: Biological Sciences, 365(1554): 2959–2971.
Prentice, A. M., K. A. Ward, G. R. Goldberg, L. M. Jarjou, S. E. Moore, A. J. Fulford and A. Prentice (2013)
Critical windows for nutritional interventions against stunting. The American journal of clinical nutrition. 9 8(3):856-7
Pretty J, Noble AD, Bossio D, Dixon J, Hine RE, Penning de Vries FWT, Morison JIL. 2006. Resource-
conserving agriculture increases yields in developing countries. Environmental Science & Technology 2006;3:24-43.
Puska, P., Nissinen, A., Tuomilehto, J., Salonen, J.T., Koskela, K., McAlister, A., Kottke, T.E., Maccoby, N. & Farquhar, J.W. 1985. The community-based strategy to prevent coronary heart disease: conclusions from
the ten years of the North Karelia project. Ann. Rev. Public Health, 6(1): 147–193. Puska, P. & Ståhl, T. 2010. Health in all policies-the Finnish initiative: background, principles, and current issues.
Ann. Rev. Public Health, 31: 315–328. Putnam, J., Allshouse, J. & Scott Kantor, L. 2002. US per capita food supply trends: more calories, refined
carbohydrates, and fats. Food Rev., 25(3): 2–15. Qaim, M. 2016. Globalisation of agrifood systems and sustainable nutrition. Proc. Nutr. Soc., 15: 1–10. Quinn, J., Zeleny, T. & Bencko, V. 2014. Food Is security: the nexus of health security in fragile and failed
states. Food and Nutrition Sciences, 5(19): 1828–1842. Radharkrishna, R., Subbarao, K., Indrakant, S. & Ravi, C. 1997. India's public distribution system: a national
and international perspective. World Bank Discussion Paper No. 380. Washington, DC, The World Bank (available at http://documents.worldbank.org/curated/en/820471468750260965/Indias-public-distribution-system-a-national-and-international-perspective).
Ranganathan, J., Vennard, D., Waite, T., Dumas, P., Lipinski, B., Searchinger, T. & GLOBAGRI-WRR model authors. 2016. Shifting diets for a sustainable food future. Installment 11 of “Creating a Sustainable Food
Future”, Working Paper. World Resources Institute (available at http://www.wri.org/sites/default/files/Shifting_Diets_for_a_Sustainable_Food_Future_0.pdf).
Rao, M., Afshin, A., Singh, G. & Mozaffarian, D. 2013. Do healthier foods and diet patterns cost more than less
healthy options? A systematic review and meta-analysis. BMJ open, 3(12). Ratnayake, W.M.N., L'Abbe, M.R. & Mozaffarian, D. 2009. Nationwide product reformulations to reduce trans
fatty acids in Canada: when trans fat goes out, what goes in? Eur. J. Clin. Nutr., 63(6): 808–811. Ratnayake, W.M.N., Swist, E., Zoka, R., Gagnon, C., Lillycrop, W. & Pantazapoulos, P. 2014. Mandatory
trans fat labeling regulations and nationwide product reformulations to reduce trans fatty acid content in foods contributed to lowered concentrations of trans fat in Canadian women's breast milk samples collected in 2009–2011. The American Journal of Clinical Nutrition, 100(4): 1036–1040.

HLPE DRAFT V0 (24 October 2016) – DO NOT CITE OR QUOTE
124
Ravi Kanth, D. 2014. WTO upside down: trade facilitation vs agriculture. Third World economics. Third World Network (available at http://www.twn.my/title2/twe/2014/576/7(Analysis).htm).
Rayner, M., Wood, A., Lawrence, M., Mhurchu, C.N., Albert, J., Barquera, S., Friel, S., Hawkes, C., Kelly, B., Kumanyika, S., L'Abbé, M., Lee, A., Lobstein, T., Ma, J., Macmullan, J., Mohan, S., Monteiro, C., Neal, B., Sacks, G., Sanders, D., Snowdon, W., Swinburn, B., Vandevijvere, S., Walker, C. & INFORMAS. 2013. Monitoring the health-related labelling of foods and non-alcoholic beverages in retail settings. Obes. Rev., 14(1): 70–81.
Reardon, T.A. 2016. Growing food for growing cities: transforming food systems in an urbanizing world, The
Chicago Council on Global Affairs (available at https://www.thechicagocouncil.org/sites/default/files/report_growingfoodforgrowingcities2.pdf).
Reardon T. & Gulati A. 2008. The supermarket revolution in developing countries: policies for “competitiveness with inclusiveness”. IFPRI Policy Brief 2.
Reardon, T., Timmer, C.P., Barrett, C.B. & Berdegué, J. 2003. The rise of supermarkets in Africa, Asia, and Latin America. American Journal of Agricultural Economics, 85(5): 1140–1146.
Regattieri, A., Gamberi, M. & Manzini, R. 2007. Traceability of food products: general framework and experimental evidence, Journal of Food Engineering, 81(2): 347–356.
Remans, R., Wood, S. A., Saha, N., Anderman, T. L., & DeFries, R. S. (2014). Measuring nutritional diversity of
national food supplies. Global Food Security, 3(3), 174-182. Revati K. Phalkey, Clara Aranda-Jan, Sabrina Marx, Bernhard Höfle and Rainer Sauerborn. 2015.
Systematic review of current efforts to quantify the impacts of climate change on undernutrition. Proc Natl Acad Sci U S A. 112(33): E4522–E4529.
Riesgo, L., Louhichi, K., Gomez y Paloma, S., Hazell, P., Ricker-Gilbert, J., Wiggins, S., Sahn, D.E. & Mishra, A.K. 2016. Food and nutrition security and role of smallholder farms: challenges and opportunities.
Workshop proceedings. JRC Conference and workshop reports, European Union. doi:10.2791/653314. Rischke, R., Kimenju, S.C., Klasen, S. & Qaim, M. 2015. Supermarkets and food consumption patterns: the
case of small towns in Kenya. Food Policy, 52: 9–21. Rockstrom et al., 2009. A safe operating space for humanity. Nature 461, 472-475 Rodale Institute. 2015. The farming systems trial (available at http://rodaleinstitute.org/assets/FSTbooklet.pdf). Roks, E. 2014. Review of the cost components of introducing industrially fortified rice. Ann. N.Y. Acad. Sci.,
1324(1): 82–91. Ruel, M.T., Alderman, H. & the Maternal and Child Nutrition Study Group. 2013. Nutrition-sensitive
interventions and programmes: how can they help to accelerate progress in improving maternal and child nutrition? The Lancet, 382(9891), pp.536-551.
Salzman, A., Andersson, M.A., Asare-Marfo D., Lividini K., De Moura, F.F., Moursi, M., Oparinde, A. & Taleon, V. 2015. Biofortification techniques to improve food security. Reference Module in Food Science.
Elsevier, 1–9. Samuel S. Myers, Antonella Zanobetti, Itai Kloog, Peter Huybers, Andrew D. B. Leakey, Arnold J. Bloom,
Eli Carlisle, Lee H. Dietterich, Glenn Fitzgerald, Toshihiro Hasegawa, N. Michele Holbrook, Randall L. Nelson, Michael J. Ottman, Victor Raboy, Hidemitsu Sakai, Karla A. Sartor, Joel Schwartz, Saman Seneweera, Michael Tausz & Yasuhiro Usui. 2014. Increasing CO2 threatens human nutrition. Nature. 510:
139-142. Sanogo, I. 2009. The global food price crisis and household hunger: a review of recent food security
assessments. Humanitarian Exchange Magazine (available at http://www.odihpn.org/report.asp?id=2988). Satterthwaite, D., McGranahan, G. & Tacoli, C. 2010. Urbanization and its implications for food and
farming. Philosophical Transactions of the Royal Society B, 365(1554): 2809–2820. Save the Children. 2009. How the global food crisis is hurting children: the impact of the food price hike on a
rural community in northern Bangladesh. London, The Save the Children Fund. Save the Children. 2012. A high price to pay: the impact of rising and volatile food prices on children’s nutrition
and food security. London, The Save the Children Fund. Save the Children. 2014. A Fair Start for Children: Why we must act now to tackle child poverty in the UK.
London, The Save the Children Fund. Savy, M., Martin-Prével, Y., Traissac, P. Eymard-Duvernay, S. & Delpeuch, F. 2006. Dietary diversity scores
and nutritional status of women change during the seasonal food shortage in rural Burkina Faso. Journal of Nutrition, 136(10): 2625–2632.
Sawaya, A. L., P. Martins, D. Hoffman and S. B. Roberts (2003) The link between childhood undernutrition
and risk of chronic diseases in adulthood: a case study of Brazil. Nutrition Reviews 61(5): 168-175. Scherr, S.J. & McNeely, J.A. 2008. Biodiversity conservation and agricultural sustainability: towards a new
paradigm of “ecoagriculture” landscapes. Philosophical Transactions of the Royal Society B, 363(1491): 477–494.
Schmidhuber, J. & Tubiello, F.N. 2007. Global food security under climate change. Proc. Natl. Acad. Sci.,
104(50): 19703–19708. Schram, A., Labonte, R., Baker, P., Friel, S., Reeves, A. & Stuckler, D. 2015. The role of trade and investment
liberalization in the sugar-sweetened carbonated beverages market: a natural experiment contrasting Vietnam and the Philippines. Globalization and Health, 11(1): 1–13.

HLPE DRAFT V0 (24 October 2016) – DO NOT CITE OR QUOTE
125
Scognamiglio, V., Arduini, F., Palleschi, G. & Rea, G. 2014. Biosensing technology for sustainable food safety.
TrAC Trends Anal. Chem., 62: 1–10. Scott-Villiers, P., Chisholm, N., Wanjiku Kelbert, A. & Hossain, N. 2016. Precarious lives: work, food and care
after the global food crisis. Oxfam and Institute of Development Studies. Scrimshaw, N.S. Taylor, C.E. and Gordon, J.E. (1968) Interactions of Nutrition and Infection, WHO Monograph
Series No. 37. Serra-Majem, L. 2016. Decalogue for sustainable food and nutrition in the community: Gran Canaria Declaration.
In Revitalizing the Mediterranean diet, from healthy to dietary pattern to a healthy Mediterranean sustainable lifestyle (available at http://www.ifmed.org/wp-content/uploads/2016/07/abstracts.pdf).
Seto, K.C. & Ramankutty, N. 2016. Hidden linkages between urbanization and food systems. Science,
352(6288): 943–945. Shiffman J, Smith S. 2007. Generation of political priority for global health initiatives: a framework and case
study of maternal mortality. The Lancet 370: 1370–9. Shiffman J. 2010. Issue attention in global health: the case of newborn survival. The Lancet 375(9730): 2045–9 Shrimpton R., Victoria C.G., de Onis M., Lima R.C., Blossner M., and Clugston, G. 2001. “Worldwide Timing
of Growth Faltering: Implications of Nutritional Interventions.” Pediatrics, 107(5): E75. Sidaner, E., Balaban, D. & Burlandy, L. 2013. The Brazilian school feeding programme: an example of an
integrated programme in support of food and nutrition security. Public Health Nutr., 16(06): 989–994. Sight and Life. 2016. Focus on Food Systems. 30(1) (available at
https://www.dsm.com/content/dam/dsm/cworld/en_US/documents/sal-magazine-1-2016.pdf). Silventoinen, K., Sans, S., Tolonen, H., Monterde, D., Kuulasmaa, K., Kesteloot, H., Tuomilehto, J. & WHO
MONICA Project. 2004. Trends in obesity and energy supply in the WHO MONICA Project. Int. J. Obes.
Relat. Metab. Disord., 28(5): 710–718. Smith, J.P., Galtry, J. & Salmon, L. 2014. Confronting the formula feeding epidemic in a new era of trade and
investment liberalisation. Journal of Australian Political Economy, 73: 132–171. Smith, L.C. & Haddad, L. 2015. Reducing Child Undernutrition: Past Drivers and Priorities for the Post-MDG Era.
World Development. 68: 180-204. Smith, L.C. & Haddad, L. 2000. Explaining child malnutrition in developing countries: a cross-country analysis.
Washington, DC, IFPRI. Smith, L. C., Ramakrishnan, U., Ndiaye, A., Haddad, L., & Martorell, R. (2003). The importance of women’s
status for child nutrition in developing countries. IFPRI Research Report #131. Washington, DC: International Food Policy Research Institute.
Smith, M. R., Singh, G. M., Mozaffarian, D., & Myers, S. S. (2015). Effects of decreases of animal pollinators on
human nutrition and global health: a modelling analysis. The Lancet, 386(10007), 1964-1972. Sobal, J., Khan, L. K. & Bisogni, C. 1998. A conceptual model of the food and nutrition system. Social Science
& Medicine, 47(7): 853–863. Sofi, F., Cesari, F., Abbate, R., Gensini, G.F. & Casini, A. 2008. Adherence to Mediterranean diet and health
status: meta-analysis. BMJ, 337. Springmann, M., Mason-D'Croz, D., Robinson, S., Garnett, T., Godfray, H.C.J., Gollin, D., Rayner, M.,
Ballon, P. & Scarborough, P. 2016. Global and regional health effects of future food production under climate change: a modelling study. The Lancet, 387(10031): 1937–1946.
Sraboni, E., Malapit, H.J., Quisumbing, A.R. & Ahmed, A.U. 2014. Women’s empowerment in agriculture: what
role for food security in Bangladesh? World Development, 61: 11–52. Steinfeld, H., Wassenaar, T. & Jutzi, S. 2006. Livestock production systems in developing countries: status,
drivers, trends. Rev. Sci. Tech., 25(2): 505–516. Stevens, G.A., Singh, G.M., Lu, Y., Danaei, G., Lin, J.K., Finucane, M.M., Bahalim, A.N., McIntire, R.K.,
Gutierrez, H.R., Cowan, M., Paciorek, C.J., Farzadfar, F., Riley, L., Ezzati, M. & the Global Burden of Metabolic Risk Factors of Chronic Diseases Collaborating Group (Body Mass Index). 2012. National, regional, and global trends in adult overweight and obesity prevalences. Popul. Health Metr., 10:22. doi: 10.1186/1478-7954-10-22.
Steyn NP, McHiza Z, Hill J, Davids YD, Venter I, Hinrichsen E, Opperman M, Rumbelow J, Jacobs P. 2014.
Nutritional contribution of street foods to the diet of people in developing countries: a systematic review. Public Health Nutr. 17(6): 1363-1374.
Steyn, N.P., Nel., J.H., Nantel, G., Kennedy, G. and Labadarios, D. 2006. Food variety and dietary diversity
scores in children: are they good indicators of dietary adequacy? Public Health Nutrition, 9: 644–650. Stokstad, E. 2010. Could less meat mean more food? Science, 327(5967): 810–811. Story, M., Neumark-Sztainer, D. & French, S. 2002. Individual and environmental influences on adolescent
eating behaviors. Journal of the American Dietetic Association 102(3): S40–S51. Stuckler, D., McKee, M., Ebrahim, S. & Basu, S. 2012. Manufacturing epidemics: the role of global producers in
increased consumption of unhealthy commodities including processed foods, alcohol, and tobacco. PLoS Medicine, 9(6).
Sturm, R., An, R., Segal, D. & Patel, D. 2013. A cash-back rebate program for healthy food purchases in South Africa: results from scanner data. Am. J. Prev. Med., 44(6): 567–572.
SUN (2013). Scaling Up Nutrition Website: Sun Country Approach. Available online as of 23/4/2013 at:
http://scalingupnutrition.org/about/sun-country-approach

HLPE DRAFT V0 (24 October 2016) – DO NOT CITE OR QUOTE
126
Sutherland, L.A., Kaley, L.A. & Fischer, L. 2010. Guiding stars: the effect of a nutrition navigation program on consumer purchases at the supermarket. Am. J. Clin. Nutr., 91(4): 1090S–1094S.
Swan, S.H., Hadley, S. & Cichon, B. 2010. Crisis behind closed doors: global food crisis and local hunger. Journal of Agrarian Change, 10(1): 107–118.
Swanson, R. (2009). Final Evaluation of Dairy Development FFP DAP for Vulnerable Populations in Zambia.
Available at: http://www.fsnnetwork.org/sites/default/files/final_evalution_of_zambia_title_ii.pdf Swinburn, B., Dominick, C. & Vandevijvere, S. 2014. Benchmarking food environments: experts' assessments
of policy gaps and priorities for the New Zealand Government. Auckland, University of Auckland. Tapsell, L.C., Neale, E.P., Satija, A. & Hu, F.B. 2016. Foods, nutrients, and dietary patterns: interconnections
and implications for dietary guidelines. Adv. Nutr., 7:445–454. The International Bank for Reconstruction and Development / The World Bank. 2011. World Development
Report: gender equality and development. Washington, DC. Thompson B (2009). Impact of the Financial and Economic Crisis on Nutrition – Policy and Programme
Responses. Rome: FAO. Thorne-Lyman, A.L., Valpiani, N., Sun, K., Semba, R.D., Klotz, C.L., Kraemer, K., Akhter, N., de Pee, S.,
Moench-Pfanner, R., Sari, M. & Bloem, M.W. 2010. Household dietary diversity and food expenditures are closely linked in rural Bangladesh, increasing the risk of malnutrition due to the financial crisis, Journal of Nutrition, 140(1): 182S–188S.
Thow, A.M. 2009. Trade liberalisation and the nutrition transition: mapping the pathways for public health nutritionists. Public Health Nutrition, 12(11): 2150–2158.
Thow, A.M., Annan, R., Mensah, L. & Chowdhury, S.N. 2014. Development, implementation and outcome of
standards to restrict fatty meat in the food supply and prevent NCDs: learning from an innovative trade/food policy in Ghana. BMC Public Health, 14(1).
Thow, A. M. & Hawkes, C. 2009. The implications of trade liberalization for diet and health: a case study from Central America. Globalization and Health, 5(5).
Thow, A.M., Swinburn, B., Colagiuri, S., Diligolevu, M., Quested, C., Vivili, P. & Leeder, S. 2010. Trade and
food policy: case studies from three Pacific Island countries. Food Policy, 35(6): 556–564. Thow, A.M., Annan, R., Mensah, L. & Chowdhury, S.N. 2014. Development, implementation and outcome of
standards to restrict fatty meat in the food supply and prevent NCDs: learning from an innovative trade/food policy in Ghana. BMC Public Health, 14: 249.
Thow, A.M. & Downs, S. 2014. Fiscal policy options with potential for improving diets for the prevention of non-
communicable diseases (NCDs). Background paper for technical meeting on fiscal policies for improving diets. Geneva, Switzerland, World Health Organization.
Thow, A.M., Downs, S. & Jan, S. 2014. A systematic review of the effectiveness of food taxes and subsidies to improve diets: understanding the recent evidence. Nutrition Reviews, 72(9): 551–565. Tian, H.G., Guo, Z.Y., Hu, G., Yu, S.J., Sun, W., Pietinen, P. & Nissinen, A. 1995. Changes in sodium intake
and blood pressure in a community-based intervention project in China. J. Hum. Hypertens., 9(12): 959–968. Tilman, D. & Clark, M. 2014. Global diets link environmental sustainability and human health, Nature, 515(7528):
518–522. Timmer, C.P. 2009. Do supermarkets change the food policy agenda? World Development, 37(11): 1812–1819. Torlesse, H., Kiess, L. & Bloem, M.W. 2003. Association of household rice expenditure with child nutritional
status indicates a role for macroeconomic food policy in combating malnutrition, Journal of Nutrition, 133(5): 1320–1325.
Trieu, K., Neal, B., Hawkes, C., Dunford, E., Campbell, N., Rodriguez-Fernandez, R., Legetic, B., McLaren, L., Barberio, A. & Webster, J. 2015. Salt reduction initiatives around the world–a systematic review of progress towards the global target. PloS One, 10(7).
Turner, P.C., Sylla, A., Gong, Y.Y., Diallo, M.S., Sutcliffe, A.E., Hall, A.J. & Wild, C.P. 2005. Reduction in
exposure to carcinogenic aflatoxins by postharvest intervention measures in west Africa: a community-based intervention study. Lancet, 365(9475): 1950–1956.
Uauy, R., J. Kain and C. Corvalan (2011) How can the Developmental Origins of Health and Disease (DOHaD)
hypothesis contribute to improving health in developing countries? The American journal of clinical nutrition 94(6 Suppl): 1759S-1764S.
UN (United Nations). 2011. The global social crisis: report on the world social situation 2011. New York, USA,
Department of Economic and Social Affairs. UNCTAD (2009) Trade and Development Report UNCTAD /TDR/2009 UNEP. 2016. Food systems and natural resources. A Report of the Working Group on Food Systems of the
International Resource Panel. H. Westhoek, J. Ingram, S. Van Berkum, L. Özay & M. Hajer. Nairobi. UNICEF. 2016. Uprooted The Growing Crisis For Refugee And Migrant Children.
http://www.unicef.org/lac/20160907_UNICEF_Uprooted_Low(1).pdf UNICEF/WHO/World Bank. 2015. Child nutrition interactive dashboard: 2015 edition (available at
http://data.unicef.org/resources/child-nutrition-interactive-dashboard-2015-edition/). US Department of Health and Human Services/US Department of Agriculture. 2015. 2015–2020 Dietary
guidelines for Americans. 8th Edition (available at: http://health.gov/dietaryguidelines/2015/guidelines/). Wartella, E.A., Lichtenstein, A.H., Yaktine, A. & Nathan, R. eds. 2012. Front-of-package nutrition rating
systems and symbols: promoting healthier choices. Washington, DC, Institute of Medicine.

HLPE DRAFT V0 (24 October 2016) – DO NOT CITE OR QUOTE
127
van den Bold, M., Dillon, A., Olney, D.K., Ouédraogo, M., Pedehombga, A. & Quisumbing, A.R. 2015. Can
integrated agriculture-nutrition programmes change gender norms on land and asset ownership? Evidence from Burkina Faso. The Journal of Development Studies, 51(9): 1155–1174.
Vandevijvere, S. 2014. Why a global convention to protect and promote healthy diets is timely. Public Health Nutrition, 17(11): 2387–2388.
Veerman, J.L., Sacks, G., Antonopoulos, N. & Martin, J. 2016. The impact of a tax on sugar-sweetened beverages on health and health care costs: a modelling study. PLoS ONE, 11(4).
Venkatesan, M. 2016. The global agriculture and food security program: an evaluation of the public private partnership in Malawi. Economics Faculty Publications.
Vellakal, S. & Raman, V.R. 2016. Growing food prices and crumbling nutrition scenario: the need of universal food coverage for better nutrition for all. MSF Bulletin. 369 – 370.
Vellakkal, S., Fledderjohann, J., Basu, S., Agrawal, S., Ebrahim, S., Campbell, O., Doyle, P. & Stuckler, D.
2015. Food Price Spikes Are Associated with Increased Malnutrition among Children in Andhra Pradesh, India. J. Nutr., 145(8): 1942–1949.
Vermeulen, S.J., Campbell, B.M. & Ingram, J.S. 2012. Climate change and food systems. Annual Review of Environment and Resources, 37(1): 195–222.
Vesper, H.W., Kuiper, H.C., Mirel, L.B., Johnson, C.L. & Pirkle, J.L. 2012. Levels of plasma trans-fatty acids in
non-Hispanic white adults in the United States in 2000 and 2009. JAMA, 307(6): 562–563. Victora, C. G., M. de Onis, P. C. Hallal, M. Blössner and R. Shrimpton (2010) Worldwide timing of growth
faltering: revisiting implications for interventions. Pediatrics 125(3): e473-e480. Von Grebmer, K., Ringler, C., Rosegrant, M. W., Badiane, O., Torero, M., Yohannes, Y., ... & Scenery, G.
(2011). Global Hunger Index: the challenge of hunger: taming price spikes and excessive food price volatility. In Deutsche Welthungerhilfe, International Food Policy Research Institute, and Concern Worldwide.
Wakeland, W., Cholette, S. & Venkat, K. 2012. Food transportation issues and reducing carbon footprint. In J.I. Boye & Y. Arcand, eds. Green technologies in food production and processing, Food Engineering Series, Springer USA.
Walker, R.E., Keane, C.R. & Burke, J.G. 2010. Disparities and access to healthy food in the United States: A review of food deserts literature. Health & Place, 16(5): 876–884.
Walker, P., Rhubart-Berg, P., McKenzie, S., Kelling, K. & Lawrence, R.S. 2005. Public health implications of meat production and consumption. Public Health Nutrition, 8(04): 348–356.
Whitmee, S., Haines, A., Beyrer, C., Boltz, F., Capon, A.G., de Souza Dias, B.F., Ezeh, A., Frumkin, H., Gong, P., Head, P., Horton, R., Mace, G.M., Marten, R., Myers, S.S., Nishtar, S., Osofsky, S.A., Pattanayak,S.K., Pongsiri, M.J., Romanelli, C., Soucat, A., Vega, J. & Yach, D. 2015. The Rockefeller
Foundation–Lancet Commission on Planetary Health. Safeguarding human health in the Anthropocene epoch: Report of The Rockefeller Foundation–Lancet Commission on Planetary Health. Lancet, 386: 1973–2028.
WHO. 2004. Water treatment and pathogen control: process efficiency in achieving safe drinking water, by M.W.
LeChevalier & K-K. Au, eds. WHO Drinking-water Quality Series. IWA Publishing. WHO. 2010. Marketing of foods and non-alcoholic beverages to children. WHO: Geneva, Switzerland. WHO. 2014a. Global status report on noncommunicable diseases 2014: attaining the nine global
noncommunicable diseases targets; a shared responsibility. Geneva, Switzerland. WHO. 2014b. Effect and safety of salt iodization to prevent iodine deficiency disorders: a systematic review with
meta-analyses, by N. Aburto, M. Abudou, V. Candeias & T. Wu, T. Geneva, Switzerland. WHO. 2015. Guidelines on food fortification with micronutrients. Geneva, Switzerland. WHO/FAO. 1996. Preparation and use of food-based dietary guidelines. Report of a joint FAO/WHO consultation
Nicosia, Cyprus. WHO/World Economic Forum. 2011. From burden to" best buys": reducing the economic impact of non-
communicable disease in low-and middle-income countries. Geneva, Switzerland. Wilson, E.O. (1992). The diversity of life. Cambridge MA: Harvard University Press. Wiggins, S. & Keats S., with Han, E., Shimokawa, S., Hernández, J.A.V. & Claro, R.M. 2015. The rising cost
of a healthy diet: changing relative prices of foods in high-income and emerging economies. London, ODI. Winarno, F.G., ed, 1986. Street foods in Asia: a proceeding of the regional workshop. Jogjakarta, Indonesia,
FAO; Food Technology Development Centre, Bogor Agricultural University. Wise, T.A. 2012. The costs to Mexico of U.S. ethanol expansion. GDAE Working Paper No. 12-01. Tufts
University, Medford, USA (available at http://www.ase.tufts.edu/gdae/Pubs/wp/12-01WiseBiofuels.html). World Bank. 2013. Improving nutrition through multisectoral approaches: agriculture and rural development, Brief
75103 (available at http://documents.worldbank.org/curated/en/124841468326707024/pdf/751030BRI0Impr00Box374299B00PUBLIC0.pdf).
World Bank. 2011. Food price watch. Poverty Reduction and Equity Group. Poverty Reduction and Economic
Management (PREM) Network. Washigton, DC,The World Bank. World Bank (2015) Climate Smart Agricutlure. World Bank, Washington, DC. Wyness LA, Butriss JL, Stanner SA. 2012. Reducing the population's sodium intake: the UK Food Standards
Agency's salt reduction programme. Public Health Nutr. 15(2): 254-261. You, W. & Henneberg, M. 2016. Meat consumption providing a surplus energy in modern diet contributes to
obesity prevalence: an ecological analysis. J. Nutr. Food Sci., 6:4.

HLPE DRAFT V0 (24 October 2016) – DO NOT CITE OR QUOTE
128
Zeisel, S.H. & da Costa, K.A. 2009. Choline: an essential nutrient for public health. Nutrition Reviews, 67(11):
615–623.