Agricultural Sector Food Security and Nutrition Strategy 2016
107
The Federal Republic of Nigeria Agricultural Sector Food Security and Nutrition Strategy 2016 – 2025 Federal Ministry of Agriculture and Rural Development
-
Upload
khangminh22 -
Category
Documents
-
view
2 -
download
0
Transcript of Agricultural Sector Food Security and Nutrition Strategy 2016

The Federal Republic of Nigeria
Agricultural Sector Food Security and
Nutrition Strategy
2016 – 2025
Federal Ministry of Agriculture and Rural Development

The Federal Republic of Nigeria
Agricultural Sector Food Security and
Nutrition Strategy
2016 – 2025
(Nutrition Component of Agricultural Policy;
Agricultural Sector Component of National Policy on Food and Nutrition)
May 2017

ii
CONTENTS
ACRONYMS ......................................................................................................................................... iv
FOREWORD ......................................................................................................................................... vi
ACKNOWLEDGEMENT .................................................................................................................... vii
LIST OF CONTRIBUTORS ............................................................................................................... viii
EXECUTIVE SUMMARY ................................................................................................................... ix
INTRODUCTION .................................................................................................................................. 1
SITUATIONAL ANALYSIS ................................................................................................................. 3
Country Background ........................................................................................................................... 3
Physical Geography ........................................................................................................................ 3
Agriculture Sector Description ........................................................................................................... 3
Food Security (Food Availability, Access, Utilization, and Stability) ............................................ 4
Food Safety ..................................................................................................................................... 5
Nutrition Context ................................................................................................................................ 5
Micronutrient Deficiencies ............................................................................................................. 6
Diet Related Non-Communicable Diseases (NCDs) ...................................................................... 6
The Major Causes of Malnutrition .................................................................................................. 7
THE AGRICULTURAL SECTOR, FOOD SECURITY, AND NUTRITION ...................................... 9
FOOD SECURITY AND NUTRITION STRATEGY ......................................................................... 10
Overall objective ............................................................................................................................... 10
Specific objectives ............................................................................................................................ 10
Ultimate Impact Targets ................................................................................................................... 10
Key Recommendations for Nutrition-Sensitive Agriculture............................................................. 11
Guiding Principles of the AFSNS ..................................................................................................... 11
Conceptual Framework for Food Security, Livelihoods and Nutrition (FAO-FIVIMS) – Guiding
Principle #1 ................................................................................................................................... 11
Integrating Nutrition into Agricultural Value Chains – Guiding Principle #2 .............................. 12
Supporting Private Sector Roles for Sustainability, Scale and Impact: Guiding Principle #3 ...... 12
Addressing Food Security and Nutrition as a Human Right: Guiding Principle #4 ..................... 13
Strategic Priorities of the AFSNS ..................................................................................................... 13
Priority Area 1: Enhance Value Chains for Improved Nutrition .................................................. 13
Priority Area 2: Diversify Household Food Production and Consumption Especially Targeting
Women and Increase Access to Micronutrient Rich Foods .......................................................... 14
Priority Area 3: Improve Food Safety along the Value Chain ...................................................... 15
Priority Area 4: Build Resilience and Social Protection Nets through Food Systems for
Vulnerable Groups ........................................................................................................................ 15

iii
Priority Area 5: Promote Nutrition Research and Information Systems ...................................... 16
Priority Area 6: Improve the Capacity to Address Food Security and Nutrition Problems within
the Agricultural Sector .................................................................................................................. 16
Priority Area 7: Nutrition Education, Social Marketing, Behaviour Change Communication, and
Advocacy ...................................................................................................................................... 17
Priority Area 8: Nutrition Surveillance and Monitoring and Evaluation ...................................... 17
Theory of Change of the Food Security and Nutrition Strategy ....................................................... 18
Target Beneficiaries of the Food Security and Nutrition Strategy .................................................... 20
Geographic Focus ............................................................................................................................. 20
COORDINATION AND INSTITUTIONAL FRAMEWORKS FOR THE AFSNS ........................... 22
National Structure ............................................................................................................................. 22
Ministerial Structure within FMARD ............................................................................................... 22
AFSNS MONITORING AND EVALUATION SYSTEM .................................................................. 23
Structure of the AFSNS M&E System ............................................................................................. 23
AFSNS Results Framework (RF) ................................................................................................. 24
AFSNS Monitoring and Reporting Process .................................................................................. 24
AFSNS Independent Evaluation Process ...................................................................................... 25
AFSNS Risk Management process ............................................................................................... 25
AFSNS INVESTMENT PLAN, COSTING AND IMPLEMENTATION PHASING ........................ 27
Conversion of AFSNS into Investment Plan .................................................................................... 27
AFSNS Costs .................................................................................................................................... 31
Costs by Categories ....................................................................................................................... 32
Implementation Phasing ................................................................................................................ 33
ANNEX ................................................................................................................................................ 34
Membership of the Inter-ministerial Agriculture Nutrition Working Group .................................... 34
Terms of Reference of the Inter-ministerial Agriculture Nutrition Working Group ........................ 34
Figure Illustrating Expected Coordination of Nutrition-Sensitive Agriculture Activities within
FMARD ............................................................................................................................................ 35
Agricultural Sector Food Security and Nutrition Strategy Results Framework Matrix .................... 36
Investment Costs by Sub-Category and Output ................................................................................ 72
GLOSSARY ......................................................................................................................................... 95

iv
ACRONYMS
ACF Action Contre la Faim (Action Against Hunger)
ADP Agriculture Development Programme
AFEX Africa Exchange Holdings
AFSNS Agricultural Sector Food Security and Nutrition Strategy
ARCN Agricultural Research Council of Nigeria
ATA Agriculture Transformation Agenda
BMGF Bill and Melinda Gates Foundation
BOA Bank of Agriculture
CBOs Community Based Organizations
CFSVA Comprehensive Food Security and Vulnerability Analysis
CIP International Potato Center
CPC Consumer Protection Council
CRS Catholic relief Services
CSOs Civil Society Organizations
DFID Department of International Development
DHS Demographic and Health Survey
EA Extension agents
ECOWAS Economic Community of West African States
FADAMA III Third National Fadama Development Project in Nigeria
FAO Food and Agriculture Organization of the United Nations
FBOs Faith Based Organizations
FCT Federal Capital Territory
FDA Federal Department of Agriculture of the FMARD
FEWSNET Famine Early Warning Systems Network
FIIRO Federal Institute of Industrial Research, Oshodi
FISS Farm Input Support Services
FMARD Federal Ministry of Agriculture and Rural Development
FME Federal Ministry of Education
FMF Federal Ministry of Finance
FMI Federal Ministry of Information and Culture
FMITI Federal Ministry of Industry, Trade and Investment
FMOH Federal Ministry of Health
FMST Federal Ministry of Science and Technology
FMWA Federal Ministry of Women Affairs
FMWR Federal Ministry of Water Recourses
FSR Food and Strategic Reserves
GAIN Global Alliance for Improved Nutrition
GDP Gross Domestic Product
GES Growth Enhancement Scheme
GHI Global Health Index
HKI Helen Keller International
IANWG Interministerial Agriculture Nutrition Working Group
ICRISAT International Crops Research Institute for the Semi-Arid Tropics
IDPs Internally Displaced People
IFAD International Fund for Agriculture Development
IFDC International Fertilizer Development Centre
IFPRI International Food Policy Research Institute

v
IITA International Institute of Tropical Agriculture
IYCF Infant and Young Child Feeding
KAP Knowledge Attitude and Practices
LGAs Local Government Areas
LGCFN Local Government Committee on Food and Nutrition
M&E Monitoring and Evaluation
MB&NP Ministry of Budget and National Planning
MDAs Ministries, Departments, and Agencies
MDD-W Minimum Dietary Diversity for Women of reproductive age
MRLs Maximum Residues Levels
NAERLS National Agricultural Extension and Research Liaison Services
NAFDAC National Agency for Food and Drug Administration and Control
NAIC Nigerian Agricultural Insurance Corporation
NAQS Nigerian Agriculture Quarantine Service
NARIs National Agriculture Research Institutes
NASC National Agriculture Seed Council
NASSI Nigerian Association of Small Scale Industrialists
NBS National Bureau of Statistics
NCC National Codex Committee
NCFN National Committee on Food and Nutrition
NCRP Nationally Coordinated Research Projects
NDHS Nigerian Demographic Health Survey
NFCNS National Food Consumption and Nutrition Surveys
NGOs Non-Governmental Organizations
NIFST Nigerian Institute of Food Science and Technology
NIHORT National Horticultural Research Institute
NIRSAL Nigeria Incentive-Based Risk Sharing System for Agricultural Lending
NNHS National Nutrition and Health Survey
NPFS National Programme for Food Security
NUC National University Commission
PACA Partnership for Aflatoxin Control in Africa
PCD Partnership for Child Development
PPC Planning Policy and Coordination Department of FMARD
PTA Parent-Teacher Association
RF Results Framework
RUFIN Rural Finance Institution Building Programme
RUWASA Rural Water Supply & Sanitation Agency
SCFN State Committee on Food and Nutrition
SCI Save the Children International
SHESTCO Sheda Science and Technology Complex
SMEs Small and Medium Enterprises
SON Standards Organization of Nigeria
UNICEF United Nations Children's Fund
USAID United States Agency for International Development
VAM Vulnerability Analysis and Mapping
WDI World Development Indicators
WEAI Women Empowerment in Agriculture Index
WFP World Food Programme

vi
FOREWORD

vii
ACKNOWLEDGEMENT

viii
LIST OF CONTRIBUTORS
FMARD Adeyinka Onabolu
Zainab Towobola
M.O. Adewoye
Nuhu A. Kilishi
M. A. Adeleke
Oyetunji Ajani
Mosunmola Umoru
Kehinde Akindele
Tundun Adedun
Ariyo Maiye
Adeyinka Akinbinu
Salisu Gusau Ahmed
B.N. Odunze
Kingsley Onigwe
Emeka Okpala
Olalekan Babalola
Maryam Nimzing
Unwana Oliver
Ayo Adelabu
J. Abdussalam
O. M. Ayodele
MB&NP Roselyn Gabriel
SON Margaret Eshiett
BMGF Victor Ajieroh
FAO Florence Conteh
Giorgia Nicolo
Sophia Lyamouri
Olutayo Adeyemi
GAIN Francis Aminu
Augustine Okoruwa
Private Sector Olawale Adetoyi

ix
EXECUTIVE SUMMARY
Substantial and sustainable reduction in malnutrition in Nigeria will remain a significant challenge
without the effective engagement of the agricultural sector. With at least 5% of the global burden of
undernutrition in Nigeria, and more than 14 million malnourished children, the Government
recognizes that addressing malnutrition is indispensable for economic and social development. While
nutrition-specific interventions – such as micronutrient supplementation, breastfeeding, immunization,
which address the immediate causes of malnutrition (inadequate dietary intake and diseases) – are
necessary, they are not sufficient for achieving adequate nutrition. In fact, implementing the ten most
effective nutrition-specific interventions at 90% coverage will only reduce stunting by 20%. Other
interventions are therefore crucial for achieving additional reduction. In particular, nutrition-sensitive
interventions in areas such as agriculture, social protection, and education are required.
Nutrition-sensitive interventions address the underlying causes of malnutrition including poverty,
food insecurity, inadequate health services and caregiving, and poor sanitation and hygiene. These
interventions are implemented at scale and can reach the poor who are most at risk of malnutrition;
and can be used to increase the effectiveness and coverage of nutrition-specific interventions. The
agricultural sector especially has a unique role to play because it is the source of food; it affects the
incomes of the majority of the population; it influences food prices; and it influences women’s control
over resources and the time they have available for optimal childcare and feeding practices.
Consequently, ongoing efforts to transform the agricultural sector in Nigeria especially prioritize
improved food security and nutrition as a fundamental outcome. This Nigerian Agricultural Sector
Food Security and Nutrition Strategy 2016 – 2025 (AFSNS) has been developed to guide the activities
of the Federal Ministry of Agriculture and Rural Development (FMARD) and the wider agricultural
sector in Nigeria for improved nutrition. It is expected that the Strategy will ensure effective advocacy
for mobilizing necessary human, material, and financial resources; and encourage sustained
commitment to agricultural development for improved nutrition. The Strategy has eight interrelated
priority areas:
1. Enhance value chains for improved nutrition: Value chains can improve nutrition by increasing
nutrient content, preventing the loss of nutrients, decreasing anti-nutrients, increasing ease of
preparation, and/or improving food safety; while educating actors along the chain about the
nutrition benefits of added value. This priority area links the nutrition problems of target
populations with possible constraints in the supply and demand of specific foods that are then
addressed by interventions, whilst also expanding market access.
2. Diversify household food production and consumption, especially targeting women, and
increase access to micronutrient rich foods: Diversifying crop production of farming households
can increase their access to nutritious foods and the stability of food supply. Increased access to
fruits and vegetables is one of the most sustainable ways to reduce and prevent micronutrient
deficiencies in resource poor communities. The priority area focuses on increasing the production
of fruits and vegetables, and research will be undertaken to increase their shelf life and marketing
and distribution. This focus has implications for the reduction of both undernutrition and
overweight and obesity and the incidence of diet related non communicable diseases. Targeting
women will increase their control over resources and decision-making, with attendant benefits for
nutrition.
3. Improve food safety along the value chain: Unsafe foods reduce the quantity and quality of
agricultural production, thereby reducing food availability and reducing food access for households
whose incomes depend on their sale. Moreover, when contaminated food is eaten, the utilization is
poor and there is an increased risk of malnutrition and illness. This priority area focuses on actions
that promote the safety of foods for consumption and eligibility for trade.

x
4. Build resilience and social protection nets through food and nutrition systems for vulnerable
groups: Households without resilience to shocks periodically lack access to food and do not have
stability of food supply. Such households are also likely to deplete their assets, which further
increases their vulnerability. This priority area aims to help households vulnerable to recurrent
shocks to maintain their supply of nutritious foods so as to conserve their assets, increase
resilience, improve nutrition and facilitate inclusive growth.
5. Promote nutrition research and information systems: This priority area focuses on promoting
and advancing a wide range of policy, operations, scientific, and adapted research that support the
maximization of the potential of agriculture to influence and lead to positive nutrition outcomes.
6. Improve the agricultural sector capacity to address food security and nutrition problems:
Without appropriately skilled people who are part of a broader, goal-oriented institutional
structure, policy statements and action plans to sharply reduce malnutrition will continue to be
unfulfilled. Consequently, capacity building in managerial and technical ability, multi-stakeholder
processes, mobilizing strategic collaboration, partnerships and innovative financing; and focused
trainings on linking agriculture with nutrition is a necessary component of the agricultural sector’s
efforts to improve nutrition in Nigeria.
7. Nutrition education, social marketing, behaviour change communication, and advocacy: The
various nutrition-sensitive agriculture initiatives require concerted and consistent information
dissemination and social dialogue, and provide a platform for nutrition education and behaviour
change. This priority area will ensure successful and sustained nutrition education and behaviour
change by combining educational and communication strategies delivered through multiple
channels; and accompanied by environmental support designed to facilitate the voluntary adoption
of healthy food choices and other food and nutrition-related behaviours conducive to health and
well-being.
8. Nutrition surveillance and monitoring and evaluation: A surveillance and monitoring and
evaluation (M&E) system will be necessary to provide accurate, reliable, and timely information
on the progress of Strategy implementation. This priority area focuses on establishing an
agriculture-based food and nutrition information system, including predefined indicators, to meet
the data needs required for surveillance and M&E. The priority area further supports the creation
of a database to keep accurate and relevant information, and the introduction of a feedback
mechanism to enable sharing of data.
The Strategy especially targets women of child bearing age, children 6 – 59 months old, school-aged
children, and internally displaced persons. The Strategy recognizes that malnutrition is generally high
in Nigeria across all the geopolitical zones but disproportionately higher in the North West and North
East zones. In the principle of leaving no one behind, the Strategy adopts a national approach in
addressing the diverse challenges of malnutrition, in ways that prioritize high prevalence areas across
the zones. Thus, the Strategy works towards virtual elimination of malnutrition in zones where
considerable progress has been made, and significant reduction in zones where prevalence levels
remain disproportionately high. It supports the implementation of actions and initiatives that
recognize the interconnectedness of all zones from a food systems perspective, the diversity of the
nutrition challenge, and how public and private sector stakeholders operate and are distributed across
the various zones in Nigeria.
Pending the establishment of a full directorate of nutrition in the Federal Ministry of Agriculture and
Rural Development, the Federal Department of Agriculture through the Nutrition and Food Safety
Division will be primarily accountable for the implementation of this Strategy. The inaugurated Inter-
ministerial Agriculture and Nutrition Working Group with its secretariat at the Nutrition and Food
Safety Division will provide strategic influence, policy, and programmatic support for the
implementation of this Strategy; to ensure consistency, coherence, and synergy with other sectoral and
related policies and initiatives.

1
INTRODUCTION
Malnutrition in its many forms does not result just from a lack of food. There are many contributing
factors, including health, care practices and education. However, food choices determine diet quality
which is crucial to good nutrition. These food choices are framed by the local context of food
availability, accessibility, affordability, and appeal.
There is a re-awakening of interest in addressing nutrition by the Nigerian government, as there is the
recognition that without adequate investments in nutrition, the quest for further economic and social
development will not be realized within the framework of national development goals and the broader
post 2015 development agenda. Consequently, several recent efforts to improve economic and living
standards in Nigeria include aims of improving food security and nutrition. Specifically, accelerating
progress in ensuring nutrition and food security for vulnerable households in Nigeria by
mainstreaming nutrition into agriculture, and maximizing the resultant positive nutrition outcomes, is
a key focus of current agricultural development initiatives of the Nigerian agricultural sector. These
initiatives seek to unlock Nigeria’s agricultural potential and to improve availability and access to
diverse foods, create jobs, and contribute to economic development through the building of food
commodity value chains and related institutions.
Over the decades, there have been a number of governmental agricultural development initiatives,
including the Agricultural Policy in 1946 which had a goal to move from forestry exploitation to
agricultural production. The Nigerian Cooperatives Ordinance formulated in 1935 led to the
establishment of Commodity Marketing Boards from 1947 to 1986, as well as the creation of a
Department of Cooperatives in 1974. From 1964, there was the establishment of Agricultural
Research Institutes, while a National Accelerated Food Production Project was instituted in the 1970s.
The Nigerian Agricultural Cooperative Bank began in 1973, and the Agricultural Development
Projects (ADPs) which are now present in all states of the Federation including Abuja FCT,
commenced in 1975. Other initiatives include the River Basin Development Authorities (from 1977 to
date); Operation Feed the Nation (1976 – 1979); Green Revolution (1979 – 1983); Directorate of
Foods and Roads and Rural Infrastructure (1986 – 1993); National Agricultural Land Development
Authority (1991 – 1999); and Presidential Initiatives on cocoa, cassava, cocoa, rice, livestock,
fisheries, vegetables (1999 – 2007). To varying extents, all of these initiatives aimed at increasing the
supply of agricultural inputs and mechanization; developing key commodities; increasing credit
access; and generally supporting actions that could increase the income of farmers; create jobs; and
provide industrial raw materials.
Although it would appear that these objectives are the same as those of current agricultural
development initiatives alluded to earlier, there are major differences. Beginning with the National
Programme for Food Security (2008 till date) and continued by the Agricultural Transformation
Agenda (from 2011), nutrition began to be a key and explicit impact domain of agricultural
development initiatives. The focus of agricultural initiatives also began to shift from mere
development into the creation of transformative agricultural businesses with meaningful participation
of the private sector. The paradigm shift is anchored by the recent Agriculture Promotion Policy
(2016 – 2020), and it is this Policy, in addition to the National Policy on Food and Nutrition and other
frameworks, that provide fundamental guidance for the establishment of priority strategic directions to
improve nutrition through agriculture in Nigeria. Indeed, the Nigerian Agricultural Sector Food
Security and Nutrition Strategy (AFSNS) is primarily an elaboration to guide the implementation of
the food and nutrition component of the Agriculture Policy; as well as an elucidation of the role of the
agriculture sector in achieving the objectives of the National Policy on Food and Nutrition. The
priority strategic directions provided by these policies recognize that agricultural production is just

2
one domain in a complex food system that integrates production with market and trade systems,
consumer purchasing power, and food transformation and consumer demand.1
The rationale of the Nigerian Agricultural Sector Food Security and Nutrition Strategy (AFSNS) is to
have a standing written document as a point of reference and a navigation tool to guide the Federal
and State Ministries of Agriculture and Rural Development (FMARD and SMARDs), and the wider
agricultural sector in Nigeria, in all current and future interventions linking agriculture to nutrition in
Nigeria. The AFSNS maximizes the potential of the agriculture sector to provide sustainable food
security and nutrition by mainstreaming nutrition into agricultural policies, programmes and value
chains. The Strategy comes as a timely response to the nutrition situation in the country where only
little improvement has been made in the nutrition landscape over several decades. The Strategy will
support effective advocacy to mobilize and guide the allocation of the human, material and financial
resources required for the realization of FMARD and SMARDs nutrition interventions.
In addition to the Agriculture Policy and National Policy on Food and Nutrition already mentioned,
implementation of the Strategy will also support the objectives of several other national policies,
including the National Policy on Infant and Young Child Feeding, and the National Social Protection
Policy. The Strategy further contributes to the achievement of regional and international frameworks
that Nigeria has committed to, such as the CAADP Framework, ECOWAS Zero Hunger Initiative,
Malabo Declaration, International Conference on Nutrition (ICN2) Commitments, and the Sustainable
Development Goals (SDGs).
This Strategy document continues with a situational analysis that presents the Nigerian context within
which the Strategy will be implemented. The contextual section is followed by a brief description of
the relationship between agriculture, food security and nutrition; after which the guiding principles,
priority areas, and theory of change of the Strategy is discussed. The concluding sections present the
coordination and institutional arrangements for the Strategy, and highlight the monitoring and
evaluation system as well as costing of the Strategy.
1 Global Panel for Agriculture and Food Systems for Nutrition (2014) Retrieved from
http://www.glopan.org/sites/default/files/pictures/GlobalPanelLeaflet_July15_updated.pdf

3
SITUATIONAL ANALYSIS
Country Background
Physical Geography
Nigeria is the most populous country in Africa and the seventh most populous in the world, with an
estimated 173 million people in 2013. The population continues to grow at an annual rate of 3.2% as a
result of a high fertility rate (5.38 children per woman). Rising population pressure is leading to
overcrowding with an estimated population density of 174 people per square kilometre in 2010. The
pressure on land and other resources in rural areas is contributing to rapid urban migration, and
Nigeria has one of the highest urban growth rates in the world at 4.1%.
As at 2015, Nigeria was the world's 20th largest economy, worth more than $500 billion and $1
trillion in terms of nominal GDP and purchasing power parity (PPP) respectively. It overtook South
Africa to become Africa's largest economy in 2014. Also, the debt-to-GDP ratio is only 11 percent,
which is 8 percent below the 2012 ratio. Nigeria is considered to be an emerging market by the World
Bank and has been identified as a regional power on the African continent. Nigeria is considered to be
a middle power in the world, and has also been identified as an emerging power; it is a member of the
MINT2 group of countries, which are widely seen as the globe's next "BRIC-like" economies. It is
also listed among the "Next Eleven" economies set to become among the biggest in the world. Nigeria
is a member of the Commonwealth of Nations, the African Union, OPEC, and the United Nations
among other international organizations.
Yet, it is estimated that 61% of the population live on less than a dollar a day and 69% live below the
relative poverty line, which is set slightly higher at 1.25 dollars per day (66,802 NGN per year). The
proportion of Nigerians living below the relative poverty line has increased significantly from just
27% of the population in 1980. Poverty is not equally distributed, with the highest proportion of poor
in the North East and North West zones. Poverty is also higher in rural areas than urban. The degree
of inequity among the population, measured using the Gini coefficient, is also increasing. In 2010 the
Gini coefficient was 0.447, which represents an increase of 4.1% in the degree of inequity from 2004,
and is close to the sub-Saharan African regional average of 0.46.
Nigeria is made up of over 300 ethnic/linguistic groups. Historically, most of the ethno linguistic
groups that constitute the present-day Nigeria existed as autonomous political entities prior to
colonization. The country presently operates a federal system consisting of 36 states plus the Federal
Capital Territory (FCT) of Abuja. The 36 states are grouped into six distinct geo-political zones —
North Central, North East, North West, South East, South South, and South West — which to a great
extent reflect ethnic affinity. The states are also divided into 774 local government areas serving as
administrative units and a third tier of government.
Agriculture Sector Description3
Despite the economic dominance of the oil industry in Nigeria, it is still by significant measure an
agricultural based economy with two-thirds of population dependent on the agriculture sector for
employment. However production levels have fallen within the last 20 years with the value-added per
capita rising less than 1% annually. There have also been significant losses in Nigeria’s export power
of key commodities such as groundnut, palm oil, cocoa, and cotton, attributable to several factors.
2 MINT is an acronym referring to the economies of Mexico, Indonesia, Nigeria, and Turkey
3 FMARD (2011). Agricultural Transformation Agenda Blueprint. Abuja, Nigeria: FMARD

4
Domestic food crop production has not kept pace with population growth, resulting in rising food
imports and declining national food self-sufficiency. While Nigeria is the world’s largest producer of
cassava, yam, cowpea, and food sorghum, it has been a food-deficit nation and a net importer of food
and major importer of wheat, rice, sugar and fish. The importation of these four commodities
amounted to over one trillion naira in foreign exchange every year from 2005 until recently. Nigeria’s
food imports are growing at an unsustainable rate of 11% per annum; yet relying on the importation of
expensive food from the global market fuels domestic inflation. In this context, Nigeria is essentially
importing what it can produce domestically. This import dependency is hurting Nigerian farmers by
displacing local production and creating rising unemployment.
Additional challenges faced by the sector are based on organizational and governance constraints; the
absence of policy clarity at all three levels of government; resource market failure; limited access to
improved technologies, technological constraints, poor research and extension services as well as
weak linkages with farmers for the uptake of innovations in areas such as seeds and pest and disease
control. Furthermore, there are infrastructure inadequacies such as poor road network particularly
feeder roads, inadequate markets and storage/processing facilities; as well as inadequate irrigation
facilities which limit agricultural production to only the wet season in many parts of the country. This
current status is neither guaranteeing food security and nutrition nor solving the challenges of
malnutrition in the country.
Food Security (Food Availability, Access, Utilization, and Stability)
Food insecurity remains a challenge in Nigeria. Although there was some improvement in the Global
Hunger Index Scores (GHI): from 47.7 in 1990 to 32.8 in 20154, the GHI score of 32.8 still represents
a serious level of hunger. Indeed, Nigeria has a 38kcal/person/day food energy deficit, and there is a
critical shortage of nutrient-rich foods. Dietary availability of iron from animal sources is
1mg/person/day compared to 2.9mg globally, and the consumption of quality protein is
35g/person/day compared to 68.6g globally. Food Consumption Score is unacceptable in 29% of the
poorest households and 15% of the richest households. Moreover, available foods are not very
affordable. Food comprises 58% of household expenditures nationally, and more than 80% of
households in the lowest wealth quintile spend more than 75% of their resources on food. Recent
changes in climate that have led many states to experience delayed rains and/or flooding have
hampered agricultural activities, limiting household food stability. Poor processing, storage and
preservation techniques also mean that food prices fluctuate depending on the crop, season, and
geographic location in the country. The volatility of global food prices have similarly led to increases
in the prices of imported foods. Paradoxically, agricultural households have among the highest levels
of food insecurity. Indeed, more than 50% of foods consumed in households, including agricultural
households, are purchased. With Nigeria’s population increasing at an alarming rate of 3.2% per
annum, food availability, accessibility, stability and utilization must constantly be increased to prevent
food insecurity.5,6,7
Crisis-related acute food insecurity is further a challenge in some states as conflict impacts access to
food. As a result of the conflict and insurgency in parts of the country, households experience well
4 2015 Global Hunger Index: Armed conflict and the challenge of hunger. Washington, DC: International Food
Policy Research Institute; 2015 5 Bill & Melinda Gates Foundation (2014). Nigeria factbase for FMARD
6 Global Food Security Index (2014). Accessed 19 November, 2014 from The Economist Intelligence Unit
website: http://foodsecurityindex.eiu.com/Country/Details#Nigeria 7 Atehnkeng, J., Augusto, J., Senghor, L., Bonkoungou, S., Diedhiou, P., Akande, A., Akello, J., Mutegi, C.,
Cotty, P., and Bandyopadhyay, R. (2015). Farmers’ guide to management of aflatoxins in maize and groundnuts
in West Africa. Ibadan, Nigeria: IITA

5
below-average harvests and have limited access to income-earning activities and markets. Households
in these areas also experience limited participation in off-season activities due to security concerns.
Food Safety
Nigeria has alarmingly poor levels of food safety. From food production, to preparation and storage,
food in Nigeria is exposed to a variety of hazards. During production, indiscriminate use of
agricultural inputs such as fertilizers, herbicides, pesticides, and veterinary medicines, often leads to
contamination of food with chemical hazards. Inadequate agricultural practices also lead to biological
contamination of food with moulds, viruses, parasites, prions, or bacteria; some of which organisms
produce toxins like cancer causing aflatoxins. During food processing, contamination further occurs,
especially for unpackaged foods. A lot of foods in Nigeria are processed by drying. This drying is
usually done on bare ground by the sides of major roads. The food items are thus exposed to dust, lead
from car exhaust, and contamination by pests. There have also been cases of factory processed foods
being mixed with unwholesome ingredients and even non-food contaminants. The result is that the
food security, health, and wealth of Nigerians are being significantly impaired by poor food safety.
For instance, aflatoxin contaminates up to 25% of groundnuts and maize crops, limiting food
availability, accessibility, and utilization. Furthermore, it is estimated that each year, about 7,761
cases of liver cancer and 100,965 disability adjusted life years result from aflatoxin exposure alone;
which translates to an annual loss of about $380 million to $3,174 million (0.2% – 1.6% of Nigeria’s
GDP). These figures do not account for economic losses due to foregone trade, which also run into
millions of dollars.8,9
Nutrition Context According to the 2013 Nigeria Demographic and Health survey, 37% of children under-five are
stunted; with 21% severely stunted. This indicates chronic, long-standing malnutrition. The highest
levels of severe and moderate stunting are found in children between 18 and 23 months, with
approximately half of the children in this age category stunted. Among infants less than6 months of
age the rates of stunting are also relatively high, with 1 in 5 children affected. Furthermore, 18% of
children under the age of five years are wasted (too thin for height), with 12% severely wasted, which
is a sign of acute malnutrition. In addition, 29% of Nigerian children are underweight or too thin for
their age.10
While malnutrition is in itself a problem, it creates additional problems because it reduces health,
educational attainment, and economic productivity. It is also a leading cause of child death. Indeed,
one reason why the prevalence of stunting reduces among children older than 24 months of age is that
by this time, a lot of the children have died, and are therefore no longer included in the calculation of
stunting prevalence. Given the high rates of child deaths in Nigeria (Nigeria contributed 13% of
global child deaths in 201311
), it is imperative that something is done to address malnutrition;
especially in northern Nigeria where the burden of both malnutrition and child deaths is much higher
than the national average.
Not only is malnutrition high among young children, malnutrition is also very prevalent among other
groups in the population. For instance, among women 15 to 49 years old, 11% are underweight, while
25% are overweight or obese.
8 Abt Associates Inc. Country assessment for aflatoxin contamination and control in Nigeria. 2013; 1-63
9 WB. Costed plans for Scaling Up Nutrition: Nigeria. Washington, DC: World Bank; 2014
10 National Population Commission (NPC) [Nigeria] and ICF International. 2014. Nigeria Demographic and
Health Survey 2013. Abuja, Nigeria, and Rockville, Maryland, USA: NPC and ICF International (NDHS 2013) 11
UN. Levels and trends in child mortality: Report of the United Nations Inter-agency Group for Child
Mortality Estimation New York, NY: UNICEF; 2013

6
Micronutrient Deficiencies
Micronutrient deficiencies are considered to be an aspect of undernutrition, and the most common
micronutrient insufficiencies are of iron, iodine, vitamin A and zinc. These deficiencies can
contribute to growth retardation, reduced resistance to infection, increased risk of morbidity and
mortality, brain damage, reduced cognitive development in children and reduced productivity in
adults. Deficiencies in folic acid and niacin are also of concern. Micronutrient deficiencies can be
associated with metabolic problems, but are often linked with non-diversified food intake patterns that
prevent adequate intake of one or many micronutrients. Children and women of reproductive age are
especially vulnerable because they have particularly high micronutrient requirements.12,13 In Nigeria,
around 47% of non-pregnant women of reproductive age are anaemic and 31% are iodine deficient.
Children’s anaemia is very high at 71% for children 6-59 months old, and there is a 29.5% deficiency
of vitamin A among these children. Neural tube defects (risk of which is considerably increased with
folic acid deficiency) occurs in about 9,500 births annually; and 21% of the population are at risk of
inadequate zinc intake
The government of Nigeria has taken key policy initiatives over the years to address micronutrient
deficiencies. A notable effort is the mandatory fortification of key staples with major micronutrients;
such as vitamin A for wheat flour, maize flour, sugar and vegetable oils; iron in wheat and maize
flour; and iodine in salt. The Government of Nigeria has also identified biofortification as one of the
priority initiatives in its efforts to improve micronutrient status. Biofortification is a process through
which the nutrient content of foods is increased during plant growth, rather than during food
processing as is done in conventional fortification. Biofortification is hence an important method of
mainstreaming nutrition into agriculture, and is covered in the revised National Policy on Food and
Nutrition.
Diet Related Non-Communicable Diseases (NCDs)
In addition to high rates of malnutrition, Nigeria is also witnessing a significant rise in the incidence
of Diet Related Non-Communicable Diseases (NCDs). With NCDs, the most important risks include
high blood pressure, high concentrations of fat in the blood, high blood glucose levels, and
overweight or obesity. These risk factors are closely related to diet and physical activity. NCDs and
their risk factors were initially mostly limited to economically successful groups in low- and middle-
income countries. However, recent evidence shows that, over time, patterns of unhealthy behaviour
and the NCDs associated with them cluster among poor communities and contribute to social and
economic inequalities. In Nigeria, diet related NCDs such as obesity, diabetes mellitus, and
cardiovascular diseases are increasing public health concerns. In 2012, it was projected that about 5
million Nigerians would die of NCDs by the year 2015, and diabetes alone was projected to cause
about 52% of the mortality in 2015. At present, about 8 million Nigerians suffer from hypertension
and 4 million have diabetes. 14
Agriculture can play a big role in the prevention and management of NCDs by ensuring increased
availability and access to fruits, vegetables, and other nutrient dense foods that promote health.
Indeed, increasing access (including affordability) to fruits, vegetables, and legumes will
simultaneously address both micronutrient deficiencies and NCDs. Agricultural interventions can also
12
Black RE, Allen LH, Bhutta ZA, et al. (2008). Maternal and child undernutrition: global and regional
exposures and health consequences. The Lancet 371(9608): 243-60 13
MI (2009). Investing in the Future: A United Call to Action on Vitamin and Mineral Deficiencies. Ontario,
Canada: Micronutrient Initiative (MI) 14
Ekpenyong, C. E., Udokang, N.E., Akpan, E.E. and Samson, T.K. (2012). Double burden, non-communicable
diseases and risk factors evaluation in sub-Saharan Africa: The Nigerian experience. European Journal of
Sustainable Development 1(2): 249-270

7
be harnessed to prevent the excessive consumption of fats, oils, and sugars, which are major
contributors to obesity and high blood pressure.15
The Major Causes of Malnutrition
The immediate causes of malnutrition are inadequate dietary intake and disease, underlying which are
three particular issues: poor maternal and child care, inadequate access to health, and food insecurity.
Addressing each of these underlying issues is necessary, but not sufficient to address malnutrition –
All three factors are indispensable. In Nigeria, the availability and access to the three factors are quite
inadequate.
Poor Maternal and Child Care (including Suboptimal Infant and Young Child Feeding Practices)
Optimal infant and young child feeding (IYCF) practices include early initiation of breastfeeding
(within one hour of birth), exclusive breastfeeding for six months, appropriate introduction of water
and complementary foods from 6 months, and continued breastfeeding up to 24 months. In Nigeria,
early initiation of breastfeeding occurs at a rate of 38%. A mere 17% of infants are exclusively
breastfed during the first six months of life. However, 97% of infants less than 2 years of age are
breastfed at some point, with a median duration of 18 months. The median length of exclusive
breastfeeding is less than one month. Although 91% of children 6–23 months of age were fed with
complementary food, only 10% were fed a minimally acceptable diet, in accordance with established
Infant and Young Child Feeding (IYCF) practices. Children’s diets are especially lacking in the key
micronutrients. For instance, only 52% and 35% of children 6–23 months old consumed foods rich in
vitamin A and iron respectively in the 24 hours preceding the 2013 NDHS.16
The role and care of women holds a key relevance in nutrition. In Nigeria, women and female-headed
households are frequently the most chronically poor within rural communities. Although women in
Nigeria play important roles as producers of food, as managers of natural resources, in income
generation, and as providers of care for their families, they continue to have limited access to land,
education, credit, information, technology, and decision making bodies. The control of land confers
on the owner access to credit, and access to inputs such as agricultural extension service, seeds,
modern irrigation systems, fertilizers, pesticides, and membership of cooperative societies. Without
land, many women have no security and have to depend on landowners for employment.17
The
nutritional status of a woman at conception and throughout pregnancy determines the nutritional level
of her child to a meaningful extent. It has been found that stunting often begins in utero, and around
15% of children in Nigeria are born with low birth weight. Women, and the time available to them,
also play a great role in appropriate IYCF practices. When women spend a lot of time away from
home and/or are encumbered with too many chores while at home, it limits the time they have
available for childcare. In fact, women are the key to food security and nutrition for young children
and indeed, all household members.18
Improved nutrition will only be achieved when education
opportunities are improved for women and they are better integrated into the socioeconomic life of
Nigeria. 19
15
WCRF (2014).The link between food, nutrition, diet and non-communicable diseases. London: World Cancer
Research Fund International (WCRF).
http://www.wcrf.org/sites/default/files/PPA_NCD_Alliance_Nutrition.pdf 16
NDHS 2013 17
Ukeje, E. (2003). Modernizing small holder agriculture to ensure food security and gender empowerment:
Issues and policy. Retrieved from http://g24.org/wp-content/uploads/2014/03/Session-2_216.pdf 18
Quisumbing, A. R., Brown, L. R., Feldstein, H. S., Haddad, L. J., & Peña, C. (1995). Women: The key to
food security. Washington, DC: International Food Policy Research Institute (IFPRI) 19
IFAD (2003). Women as agents for change. Rome: International Fund for Agricultural Development (IFAD)

8
Access to health
Access to health services is quite poor. For instance, from 2008 to 2013, only 38% of deliveries were
attended by a skilled birth attendant, and only 25% of children 12 to 23 months old were fully
vaccinated20
. Unsanitary environments also hinder health. Poor water, sanitation, and hygiene can
increase the risk of diarrhoea, malaria, and other illnesses that increase the nutritional needs and/or
cause loss of nutrients from the body. Environmental contaminants such as aflatoxins have significant
effects on health, in addition to agriculture and food security, amongst other developmental indices.
Aflatoxins in the body can cause cell death, restrictions in DNA and RNA synthesis, reductions in
protein synthesis, and/or membrane instability and cell damage; and have been associated with
stunted growth.21
Another environment related factor, tropical enteropathy, compromises the integrity
of the gut, impairs intestinal absorption, and is associated with growth faltering and undernutrition.
Food-and/or water-borne parasites and faecal bacteria from unsanitary and unhygienic environments
are key contributors to tropical enteropathy.22
Food Insecurity:
In addition to the food security situation earlier discussed, it has previously been noted that the
prevalence of minimum acceptable diets is low. While this may be partly due to insufficient
knowledge about what constitutes an adequate diet, families that receive education surrounding
appropriate IYCF practices often lack access to affordable foods with sufficient quantities of micro-
and macronutrients required for growing children. Indeed, a majority of households consume
monotonous staple-based diets and lack access to nutrient-dense foods. Limited availability of
nutritious foods, economic constraints, lack of knowledge and information, and related lack of
demand for nutritious foods are critical factors that limit poor people’s access to such foods.23
Another and emerging cause of malnutrition in Nigeria is conflict. Some parts of Nigeria have been
affected by conflict between armed groups and governmental forces, especially in the three North East
states of Yobe, Adamawa and Borno. As a result, more than 2.1 million people are internally
displaced. Many of these internally displaced persons (IDPs) have precarious living conditions, with
little or no assistance provided. The conflict is thus exacerbating Nigeria’s food and nutrition
challenges, with agriculture and trade being significantly disrupted. In addition many health facilities
have shut down, not only leaving thousands of malnourished children lacking the treatment needed to
survive, but also restricting access to other health services and essential nutrition actions.
20
NDHS 2013 21
Abt Associates Inc. Country assessment for aflatoxin contamination and control in Nigeria. 2013; 1-63. 22
Lin, A., Arnold, B. F., Afreen, S., Goto, R., Huda, T. M. N., Haque, R. and Luby, S. P. (2013). Household
environmental conditions are associated with enteropathy and impaired growth in rural Bangladesh. The
American journal of tropical medicine and hygiene, 89(1), 130-137 23
Kuku-Shittu, O., Mathiassen, A., Wadhwa, A., Myles, L., & Akeem, A. (2013). Comprehensive Food
Security and Vulnerability Analysis Nigeria. Washington, DC: International Food Policy Research Institute
(CFSVA, 2011)

9
THE AGRICULTURAL SECTOR, FOOD SECURITY, AND NUTRITION
Agriculture provides several unique opportunities for improving nutrition. The agricultural sector can
help address malnutrition by developing nutrition-sensitive agricultural livelihoods and interventions
with income generating activities for at-risk groups, and by making nutritious foods more accessible
(available and affordable), more nutrient-dense, and acceptable culturally.
In general, nutrition-sensitive agricultural livelihoods and interventions address nutrition in
multidimensional ways. These livelihoods and interventions address the underlying causes of
malnutrition – food security, health services, and caregiving – by: boosting agricultural production,
lowering prices, increasing incomes, increasing dietary diversity and access to quality diets,
empowering women, improving the effectiveness and coverage of nutrition-specific interventions,
amongst other activities. Nutrition-specific interventions are those interventions that address the
immediate causes of malnutrition – dietary intake and disease. Such interventions include
micronutrient supplementation, promotion of exclusive breastfeeding and optimal complementary
feeding, food supplementation, fortification, treatment of severe acute malnutrition, immunization,
and water, sanitation, and hygiene (WASH) interventions.24
While these nutrition-specific interventions are crucial to addressing malnutrition, they are not
sufficient. For instance, evidence shows that if the most effective nutrition-specific interventions are
implemented at 90% coverage, the prevalence of stunting will only reduce by about 20%.25
Other
reports indicate that a 10% increase in per capita gross domestic product (GDP) can reduce child
stunting, underweight and anaemia by about 5.9%, 7.0% and 2.4% respectively. A 10% increase in
per capita GDP can also reduce maternal underweight and anaemia by 4.0% and 1.8% respectively.22
It is clear therefore that nutrition-sensitive interventions are indispensable for substantial reductions in
malnutrition. Nutrition-sensitive agricultural interventions are especially important for several
reasons. First, nutrients come from food, and agriculture is the source of food for all humanity.
Second, agriculture is the major occupation of people living in rural areas, and malnutrition is
concentrated in rural areas. Third, agriculture is a major source of income for a significant proportion
of the population and adequate income increases access not just to food, but also to health, care, and
other factors necessary for adequate nutrition. Moreover, agriculture influences food prices, thereby
affecting the purchasing power of both net sellers and net buyers of food. Fifth, agriculture influences
women’s empowerment, time, and health, with attendant effects on nutrition. As previously noted
women’s participation in agriculture can enhance their access to and control over resources and/or
resource allocation. Agriculture can also affect the time women have available for childcare, as well
as increase their exposure to/risk of diseases. 26,27
Notwithstanding, creating nutrition-sensitive agricultural livelihoods and interventions does not
automatically occur even with increased agricultural development. For instance, market forces can
prioritize production of only a few foods, without consideration of whether these foods include the
variety necessary to sustain nutrition and health. Social and cultural constraints can further limit the
range of foods people are willing to produce and consume. Agriculture must therefore be deliberately
harnessed to reduce malnutrition.
24
Ruel MT, Alderman H. Nutrition-sensitive interventions and programmes: How can they help to accelerate
progress in improving maternal and child nutrition? The Lancet. 2013; published online June 6.
http://dx.doi.org/10.1016/S0140-6736(13)60843-0 25
Bhutta ZA, Das JK, Rizvi A, Gaffey MF, Walker N, Horton S, Webb P, Lartey A, Black RE. Maternal and
Child Nutrition 2 – Evidence-based interventions for improvement of maternal and child nutrition: What can be
done and at what cost? The Lancet 2013; 382(9890): 452-477 26
Meeker and Haddad (2013) 27
UNSCN (2014). Findings from a review of country level programming in nutrition-sensitive agriculture.
Geneva, Switzerland: United Nations Standing Committee on Nutrition (UNSCN)

10
FOOD SECURITY AND NUTRITION STRATEGY
Overall objective To improve the food and nutrition security of all Nigerians while empowering women and promoting
resilience of the most vulnerable through sustainable agricultural livelihoods.
Specific objectives 1. To improve food security at the national, community, and household levels;
2. To significantly reduce undernutrition, including micronutrient deficiency disorders,
among infants, children, adolescents, and women of reproductive age;
3. To prevent chronic nutrition-related non-communicable diseases;
4. To increase the knowledge of nutrition among the populace and integrate nutrition
education into agricultural formal and informal trainings;
5. To strengthen systems that build resilience for improved food and nutrition situation; and
6. To incorporate food and nutrition considerations into the Federal, State and Local
Government agricultural sector development plans.
Ultimate Impact Targets Impact targets for the AFSNS have been set based on global and regional food security and nutrition
targets and the expected contributions of sectors other than the agricultural sector.
1. 50% reduction in the Global Hunger Index (from baseline of 2015 GHI figure: 32.8)
2. 40% reduction in the prevalence of stunting (from baseline of 2013 NDHS figure: 37%)
3. 50% reduction in anaemia in women 15 to 49 years old (from baseline of 2011 World
Development Indicators (WDI) figure for non-pregnant women: 47%)
4. 30% reduction of low birth weight (from baseline of WDI 2011 figure: 15%)
5. 0% increase in obesity in women 15 to 49 years old (from baseline of 2013 NDHS figure: 8%)
6. 0% increase in prevalence of childhood overweight (from baseline of 2013 NDHS figure: 4%)
7. 75% reduction in wasting (from baseline of 2013 NDHS figure: 18%)
8. 100% increase in children 6 – 23 months old who consume minimum dietary diversity (from
baseline of 2013 NDHS figure: 19%)
9. 20% increase in the percentage of poorest households with acceptable Food Consumption Score
(from baseline of 2011 CFSVA: 71%)
10. At least, 100% increase in percentage of national agriculture budget allocated to nutrition (from
baseline of 201428
: 0.62%)
28
Study commissioned in 2015 by FMARD – Mainstreaming nutrition into agriculture in Nigeria: Situation
analysis and evidence building

11
Key Recommendations for Nutrition-Sensitive Agriculture
There are several international principles and recommendations that underpin the concept of nutrition-
sensitive agricultural livelihoods and interventions. The major recommendations are29,30
1. Incorporate explicit nutrition objectives and indicators into the design and implementation of such
livelihoods and interventions
2. Conduct an assessment of the local context to ensure that activities appropriately address the
major nutrition challenges and their causes
3. Target vulnerable groups and increase equity
4. Collaborate and coordinate with other sectors
5. Maintain or improve the natural resource base (e.g. water, soil, biodiversity)
6. Invest in and empower women
7. Diversify production and livelihoods, with increased production of nutrient-dense foods
8. Improve food processing, storage, and preservation
9. Expand markets and market access for vulnerable groups
10. Incorporate nutrition education into activities
These international recommendations provide the basis for the guiding principles, priority areas,
choice of target beneficiaries, and geographic focus for the Nigerian Agricultural Sector Food
Security and Nutrition Strategy (AFSNS). The guiding principles underscore key issues that will be
integrated into all AFSNS activities, while the priority areas highlight the particular activities that
would be emphasized.
Guiding Principles of the AFSNS
Conceptual Framework for Food Security, Livelihoods and Nutrition (FAO-FIVIMS) –
Guiding Principle #1
In 2000, the Food and Agricultural Organization developed a framework for the analysis of food
security and nutrition for the Food Insecurity and Vulnerability Information Mapping System.31
This
framework (Figure 1) facilitates the contextual assessment of local nutrition situations, and aids the
design of livelihoods and interventions that address nutrition. It especially specifies ways in which the
food component of the underlying causes of malnutrition is influenced.
The AFSNS will support the availability, accessibility, use, and stability of resources (capital,
knowledge, and other) for vulnerable groups; to promote improved food consumption, care practices,
and access to health services. Ongoing agricultural initiatives aim to significantly increase food
availability and food stability, as well as boost incomes. The AFSNS will ensure that the increases in
food and income translate into meaningful improvements in food security and nutrition by facilitating
the inclusion of smallholder farmers in the sector’s activities. Also, the AFSNS will support activities
to increase market and food access for currently marginalized groups. Moreover, other resources such
as the nutrition knowledge and social and institutional support required for appropriate food
consumption and utilization will be provided through the Strategy.
29
Herforth A, Jones A, Pinstrup-Andersen P. (2012). Prioritizing nutrition in agriculture and rural development:
Guiding principles for operational investments. Health, Nutrition, and Population Discussion paper.
Washington, DC: World Bank 30
FAO (2015). Key recommendations for improving nutrition through agriculture and food systems. Rome:
Food and Agriculture Organization. Available at http://www.fao.org/3/a-i4922e.pdf 31
Food and Agriculture Organization (2000). Food Insecurity and Vulnerability Information and Mapping
Systems (FIVIMS) Framework of Food Security

12
Figure 1: Food Insecurity and Vulnerability Information Mapping System
Integrating Nutrition into Agricultural Value Chains – Guiding Principle #2
Value chains that improve nutrition (nutrition-sensitive value chains) are those that increase nutrient
content, prevent the loss of nutrients, decrease anti-nutrients, increase ease of preparation, and/or
improve food safety, while educating actors along the chain about the nutrition benefits of added
value.32
Nutritional opportunities may exist at multiple levels of the value chain, including production,
processing/ preservation, market, and household level opportunities.
A key focus of the agricultural sector is to improve existing agricultural commodity value chains,
including those for food, and create new value chains where necessary. The AFSNS will strongly
promote nutrition-sensitive value chains, in addition to food-based strategies within its key priority
areas. Attention will be given to food-based interventions that promote dietary diversity and the
consumption of nutritionally rich foods. It will support efforts to accelerate the reduction of
malnutrition by leveraging existing agricultural service delivery platforms to promote complementary
nutrition-specific interventions. The Strategy will also take strong consideration of the role of local
food consumption preferences and individual lifestyle factors.
Supporting Private Sector Roles for Sustainability, Scale and Impact: Guiding Principle #3
There is a growing understanding that sustainable improvements in food security and nutrition will
remain challenging without a role for the private sector. Most goods and services that impact on food
security and nutrition typically involve the private sector; and new partnership paradigms that put the
private sector at the centre of driving for improved food security and nutrition are imperative. Thus,
Nigeria’s new agricultural initiatives are implemented from the orientation of doing agriculture as a
business and promoting a government enabled, private sector led approach to transforming
agriculture.
32
IFPRI (2011) CGIAR Research Program 4: Agriculture for improved nutrition and health. Washington, DC:
International Food Policy Research Institute (IFPRI)

13
The AFSNS will strongly support special incentives to ensure that the private sector prioritizes foods
and products that the poor and vulnerable groups consume. This support includes research to identify
current market access for the most vulnerable groups, challenges to production and expanded market
access, and actions necessary to ensure adequate private sector participation and product coverage.
The AFSNS will also support private sector regulation. Effective regulation means a positive
relationship that promotes good business and nutritional outcomes, while conforming to the highest
national and international standards expected from that business.
Addressing Food Security and Nutrition as a Human Right: Guiding Principle #4
A human rights approach entails focusing on those who are most vulnerable, understanding what
causes this vulnerability or susceptibility to adverse outcomes, and changing conditions to improve
their situation. Various countries of the world including Nigeria have committed to The Voluntary
Guidelines to Support the Progressive Realization of the Right to Adequate Food in the Context of
National Food Security (VGRTF) Framework. Article 16 of the 1999 Nigeria Constitution expressly
states that “The State shall direct its policy towards ensuring that suitable and adequate foods are
provided for all citizens.”
This AFSNS therefore recognizes that the right to adequate food and nutrition should be the main
objective of food security and nutrition policies, programmes, strategies and legislation; that the
human rights principles of participation, accountability, non-discrimination, transparency, human
dignity, empowerment, and rule of law should guide activities designed to improve food security and
nutrition; and that policies, programmes, strategies and legislation need to enhance the empowerment
of rights-holders and the accountability of duty-bearers, thus reinforcing the notions of rights and
obligations as opposed to charity and benevolence. Thus, the AFSNS will primarily target population
groups in Nigeria with the highest burden of malnutrition.
Strategic Priorities of the AFSNS
Priority Area 1: Enhance Value Chains for Improved Nutrition
The “value chain for nutrition approach” can be defined as the process that addresses the established
nutritional challenges of a country within specific value chains. This priority area is expected to
improve food security through production, processing, storage and preservation at national levels,
whilst also expanding market access. The following will be the key critical action points of entry:
a. Postharvest loss reduction for improved nutrition: This entry point will create a back to back
business alliance to reduce postharvest losses. Proper cold storage, packaging and crating, and
processing solutions will be developed to reduce produce perishability and damage along the
value chain.
b. Increasing production and processing of animal foods. The entry point is to increase access to
animal source foods, including the development and promotion of animal food value chains.
c. Increasing production of food crops, especially fruits and vegetables: The entry point will
intensify efforts to de-risk agricultural value chains and increase incentives for participation.
Actions will include zero tariffs for the importation of agricultural equipment; support for local
production, repair, and maintenance of agricultural equipment; tax holidays for investors who set
up processing plants in the government established Staple Crops Processing Zones (SCPZs);
increased import levies and excise duties on commodities that can be locally produced; and
improved credit facilities (including risk sharing, insurance and technical assistance) for
agricultural value chain investments.
d. Reviving prison farms and agro-allied prison industries: The programme will use prison farms to
significantly increase the local production of high import bill foods (such as rice, wheat, and fish),
while at the same time building the capacity of inmates in agro-based skills and increasing their

14
ability to successfully re-engage into the society. The food produced through the programme will
also be used to achieve food security for prisons across the country, thereby reducing the costs of
maintaining these institutions. The food will further contribute to national food security.
e. Increasing market access for agricultural produce: This priority area will facilitate the
establishment of aggregation centres and distribution channels that address the food gaps of the
population. Commodity trading platforms and warehouse receipt systems will be developed.
f. Implementing the Transformative Partnership for High Energy Foods (P4HNF): P4HNF is an
initiative to improve the production, processing, distribution and consumption of high energy
nutritious foods for Nigeria. It aims to promote the growth, transformation, as well as utilization
of key crops such as sorghum, maize, soybeans, and peanuts; and fortify them with essential
micronutrients to meet the demand for high energy nutritious foods in Nigeria for relief and
institutional food procurement purposes. It is expected to operate through market-based
mechanisms that are sustained by locally available food commodities and a collaborative
partnership between key stakeholders in industry, government, international development
partners, and academia.
g. The expansion of bio-fortified staple foods in order to increase nationwide consumption and
utilization: Key bio-fortified staples that would be promoted include pro-vitamin A cassava,
yellow maize, orange flesh sweet potato, iron sorghum, iron beans, zinc rice, and vitamin A
plantain and bananas. Bio-fortified crops that have already been introduced into the Nigerian
market – pro-vitamin A cassava, yellow maize, orange flesh sweet potato, and iron sorghum –
will be scaled-up to reach more Nigerians, while other bio-fortified crops will be introduced.
h. Facilitate the business-to-business fortification of food around the aggregation centres and in
each SCPZ that drive transformation of staples and horticulture commodities. The extension of
existing legislation on fortification will be promoted to cover other important food staples not
presently covered by existing policies and regulations. Furthermore, multisectoral efforts to
strengthen the regulatory environment for food fortification and improve compliance will be
supported.
Priority Area 2: Diversify Household Food Production and Consumption Especially
Targeting Women and Increase Access to Micronutrient Rich Foods
Special attention will be paid to increasing production and consumption of fruits, vegetables, and
animal foods at the household level. Consumption of vegetables, legumes, fruits, and animal foods is
the most sustainable way of reducing and controlling micronutrient deficiencies in resource-poor
communities33
. Moreover, diversifying household food production increases household resilience,
thereby supporting stability of food supply.34
The following will be the key points of entry:
a. Scaling up the production of vegetables and fruits by smallholder farmers: Activities will
facilitate access to inputs such as improved seeds, information, and irrigation, among other
technological advances.
b. Promoting homestead gardens: The priority area seeks to improve production and diversification
of fruits and vegetable around the homesteads. Where feasible, the production of indigenous
vegetables will be encouraged.
c. Management of natural resources: Keyhole and raised bed garden activities, which produce food
even in conditions of extreme heat and lack of rain, will be prioritized. Construction of roof water
harvesting structures which not only provide water for the household but additional water for
irrigation (multi-use water structures) will also be supported.
33 FAO-AVRDC (2003). Increasing the consumption of micronutrient-rich foods through production and promotion of
indigenous foods. Proceedings of international workshop, March 5–8, 2002, Arusha, Tanzania 34
FAO (1997). Agriculture food and nutrition for Africa - A resource book for teachers of agriculture. Rome:
FAO

15
d. Promotion of small animal husbandry: This entry point will increase access to animal foods.
Priority area three will thus complement horticulture production.
e. Promoting school agriculture programmes: The entry point will focus on making available the
services of agriculture extension staff to schools; providing support to the operation of young
farmers clubs; and supplying improved farm inputs for crop and animal farming in schools
Priority Area 3: Improve Food Safety along the Value Chain
In keeping with national efforts to assure safe and wholesome foods, the following entry points will
be prioritized to achieve food safety:
a. Promoting good agricultural practices (GAP) among farmers: This will ensure that the exposure
of foods to biological and chemical hazards is reduced. GAPs include the use of improved seeds,
appropriate use of inputs (fertilizers, pesticides, etc.), use of biological controls (e.g. Aflasafe),
integrated pests management, and moisture regulation.
b. Scaling up the use of modern drying and storage techniques and technologies: Such techniques
include precision drying of produce and hermetic storage which control for temperature, moisture,
and insect attack.
c. Irradiation of food products: The entry point will use gamma irradiation for food preservation,
especially fruits, vegetables, and meat/meat products
d. Development of a National Aflatoxin Control Initiative: The entry point will minimize aflatoxin
contamination along the value chain. Necessary actions will be supported at pre-harvest, harvest,
in storage, during processing, in markets, and at consumer level.
e. Ensuring that agricultural practices and produce conform to Codex standards along the value
chain: This entry point will ensure that relevant technical departments within FMARD provide
inputs into the setting of Codex standards, including standards for pesticide residues, metallic
contaminants, contaminants, among others. The National Agricultural Technical Working Group
for Codex will also be strengthened.
f. Collaborating with food safety regulatory agencies to facilitate compliance with standards: The
entry point will ensure that export-oriented farmers are aware of international food standards and
are able to meet these standards. To facilitate this action, a certification system will be developed
with these agencies to endorse foods meeting specific standards.
g. Ensuring greater support for actions that promote food safety: The use of adequately equipped
and functional storage technologies and techniques such as silos, warehouse receipt systems, and
commodities exchange boards will be promoted.
Priority Area 4: Build Resilience and Social Protection Nets through Food Systems for
Vulnerable Groups
Smallholder agricultural producing households are very vulnerable to shocks including droughts,
floods, conflicts, and insecurity. Households often deploy a variety of coping strategies in response to
these shocks. Irreversible coping strategies deplete assets, leave households even more susceptible to
future shocks, and perpetuate poverty. This priority area focuses on objectives and actions that will
ensure the ability of households and communities to mitigate, adapt to, and recover from shocks and
stresses in a manner that reduces acute and chronic vulnerability; and facilitates inclusive growth. The
efforts will focus on people and places at the intersection of chronic poverty and exposure to shocks
and stresses. The entry points to be prioritized will include:
a. Supporting landless agrarian community households to establish small-scale agro-processing
businesses: Households will be supported with starter packs and trainings for threshing, milling,
grinding or other processing activities.

16
b. Supporting smallholder farmers to diversify livelihoods: This entry point will provide inputs and
training for smallholder farmers to increase the types and quality of crops and/or livestock
produced.
c. Ensuring that smallholder farmers are linked with institutional markets: The entry point will
create regulatory frameworks to ensure strategic procurement of food items from smallholder
farmers, for school feeding programmes, and other institutional markets such as the
Transformative Partnership on High Energy Nutritious Foods for Africa. Moreover, entry barriers
for smallholder farmers to access the school feeding market (such as lack of information;
inadequate capacity to meet the traditional tendering requirements; lack of capacity to supply,
store, and transport commodities; and vulnerability to post-harvest losses) will be addressed.
d. Facilitating access to credit for smallholder farmers: The entry point will organize farmers into
cooperatives and link these cooperatives to microcredit facilities
e. Extending insurance services to smallholder farmers: This entry point will be implemented by
providing insurance access to produce cooperatives
Priority Area 5: Promote Nutrition Research and Information Systems
This priority will focus on promoting and advancing a wide range of policy, operations, scientific, and
adapted research that will maximize the potential of agriculture to influence positive nutrition
outcomes. Existing projects such as the Nationally Coordinated Research Projects (NCRP) and West
African Agricultural Productivity Program (WAAPP) implemented by the Agricultural Research
Council of Nigeria (ARCN) will be leveraged. The entry points for this priority area include:
a. Sponsoring the regular conduct of the National Food Consumption and Nutrition Survey
b. Development of crop varieties with enhanced nutritional attributes: The priority area will support
research to produce crop varieties with increased nutrient content, decreased anti-nutrients,
increased ease of preparation, and/or improved food safety.
c. Development of food products with improved nutritional attributes: Research supported under this
entry point will identify improved processing techniques that can increase nutrient content,
prevent the loss of nutrients, decrease anti-nutrients, increase ease of preparation, and/or improve
food safety.
d. Context assessment to guide implementation of entry points in the AFSNS: The entry points in the
AFSNS will not be universally applicable in communities and LGAs. Landscape analyses will be
conducted to guide the selection of sites, the target beneficiaries, and the specific implementation
modalities for each entry point of the Strategy.
Priority Area 6: Improve the Capacity to Address Food Security and Nutrition Problems
within the Agricultural Sector
Building human resources and the relevant institutional capacities to deliver sustainable nutrition-
sensitive interventions is not only critical but is the main thrust of this priority area. The AFSNS
recognizes that there can be no scale-up in nutrition-sensitive agriculture actions without a scale-up in
relevant capacities to act. This priority area focuses on the following key points of entry.
a. Strengthening the planning and managerial capacity of federal, state, and LGA nutrition focal
persons within the agricultural sector: There will be training and re-training of these focal
persons and other relevant service providers to improve their capacity for food and nutrition
programme management within the agricultural sector.
b. Capacity building for federal, state, and LGA agricultural extension personnel: Nutrition
education will be integrated into agricultural extension services, and intensive training will be
conducted for extension agents/officers to provide sufficient technical knowledge about issues
related to nutrition, food security and food safety; and behaviour change communication. The
training will also establish referral systems for issues which the agents are unable to address. The

17
entry point will further promote the expansion and better resourcing of current extension services,
to ensure that the populations most vulnerable to malnutrition are covered by these services.
c. Upgrading the Nutrition and Food Safety Division of FMARD into a Directorate: This will
promote the management level visibility, authority, advocacy, and support necessary for nutrition-
sensitive agriculture across FMARD.
d. Facilitating integration of nutrition into the agricultural curriculum of tertiary institutions: This
entry point will institute a mechanism for periodic curriculum review and the identification of
nutrition training gaps in existing agricultural curriculum.
e. Training community artisans and masons to construct, maintain, and repair local technologies:
Activities within this entry point will include training on the construction of durable roof water
harvesting structures; training for constructing modern drying and storage techniques, among
other techniques and technologies.
Priority Area 7: Nutrition Education, Social Marketing, Behaviour Change Communication,
and Advocacy
The various nutrition-sensitive agriculture initiatives require concerted and consistent information
dissemination and social dialogue. These activities provide a platform for nutrition education and
behaviour change. Such nutrition education will be delivered through multiple avenues, and involves
activities at the individual, community, and policy levels. Firstly, there will be an awareness-raising
element to focus attention on nutrition and increase the motivation to improve diets. Secondly, there
will be an action component, where the goal is to facilitate people’s ability to take action to improve
their diets; and then, an environmental component where nutrition educators will work with
policymakers at national and community levels to make healthy foods more accessible. Activities may
include nutrition counselling for mothers, cooking demonstrations, health promotion, production and
dissemination of dietary guidelines, as well as ensuring that schools and workplaces offer healthier
meals. The following will be the key points of entry:
a. Promoting the production and consumption of diverse diet: This will include comprehensive
nutrition education about the benefits of backyard gardens and school gardens and consumption
of fortified food and products.
b. Advocacy for the legislation and regulation of nutrition labelling on packaged food products: The
entry point will support social demand for nutritious foods. This will be achieved by working with
the National Agency for Food and Drug Administration and Control (NAFDAC) as well as the
Standards Organization of Nigeria (SON).
c. Production and dissemination of food-based dietary guidelines: Collaboration with the Ministries
of Health, Education, Social Services, and Women’s Affairs will be undertaken to revise/develop
appropriate food based dietary guidelines for healthy living.
d. Ensuring that schools and workplaces offer healthier meals: Activities for this entry point will
include providing recommendations for healthy school and workplace meals and advocacy to
regulatory agencies to monitor compliance with recommendations
e. Promoting positive attitudes and behavioural change: This entry point will facilitate improved
diet quality, adequate nutritional intake, and better dietary utilization.
Priority Area 8: Nutrition Surveillance and Monitoring and Evaluation
There is need for effective surveillance and monitoring/evaluation (M&E) systems. This is to generate
and utilize data to build and track indicators for monitoring progress in achieving the targets of the
Strategy. This will further provide accurate, reliable, and timely information on progress of Strategy
implementation and regular reporting on the specific priorities, objectives, and programme-level
outcome indicators. The information generated will be useful for future planning exercises, as well as

18
for overall monitoring and evaluation of the success of government’s efforts in addressing the
problem of malnutrition in Nigeria. The entry points will include the following:
a. Develop a comprehensive monitoring and evaluation framework for the AFSNS: This entry point
will identify and compile the key performance indicators for the Strategy, and well as design a
plan to monitor progress towards the achievement of these indicators.
b. Conduct sample surveys: The entry point will regularly obtain information (about the food and
nutrition situation of different LGAs and states) that will be used to bring about improvement.
c. Create an information database: Accurate and relevant information will be compiled through
vertical and horizontal collation of data from the LGAs, state, and federal levels; so that progress
and changes are tracked and impact measured.
Theory of Change of the Food Security and Nutrition Strategy The linkages through which the priority areas are expected to improve nutritional status are
highlighted in Figure 2. This theory of change situates the priority areas within the FIVIMS
Framework of Food Security while aligning with other conceptual frameworks on the causes of
malnutrition. Priority areas 1, 2, and 3 which focus on increasing production, access, and safety, are
expected to improve food availability, access, and stability; while at the same time improving
household livelihoods, assets, and activities. Priority area 4 of building food security and nutrition
safety nets for vulnerable groups is expected to directly impact household food access; while it is
expected that priority area 7 will lead to improved care practices. Priority 7 is further expected to
influence the foods that households choose to grow and purchase, and ensure that improved household
food security and care practices translate into improved food consumption. Nutrition research,
information systems, surveillance, and monitoring and evaluation – priority areas 5 and 8 – provide
the necessary guidance to correctly implement and achieve results from priority areas 1, 2, 3, 4, and 7.
Nevertheless, central to all of these 7 priority areas and their potential impact is priority area 6:
institutional and human resource capacity development.

19
Figure 2: Simplified AFSNS Theory of Change
5: Nutrition Research
& Information
Systems
6: Improve
Institutional Capacity
& Human Resources
8: Surveillance &
Monitoring &
Evaluation
7: Nutrition Education, Social
Marketing, Behaviour Change
Communication, Advocacy
Food
Consumption
Food
Utilization
Nutritional
Status
Household Livelihood
Strategies, Assets, &
Activities
Household
Food Access
Care
Practices
Health &
Sanitation
Food Availability
Food Stability
Community Food
Access
1: Enhance Food Value
Chains
2: Diversify Food
Production, Targeting
Women, and Increase
Nutritious Food Access
4: Build Resilience &
Social Protection Nets
3: Improve Food Safety
along the Value Chains

20
Target Beneficiaries of the Food Security and Nutrition Strategy
To have a sustained impact on reducing malnutrition, and breaking its intergenerational cycle, the
AFSNS will adopt a life cycle approach. In particular, activities will focus on:
i. Women of childbearing age (15–49 years): From conception through six months is a vital
period for a child’s future development. In fact, the first 1,000 days of life (from conception
to age of 2 years) is a window of opportunity during which adverse malnutrition outcomes
can be reversed. Targeting women of childbearing age will help to increase future birth
weight as well as support the mother during pregnancy and lactation. The AFSNS will seek to
promote dietary diversity and improved nutrition among these women; while at the same time
providing timesaving technologies for food production and processing to allow women more
time for childcare as well as their own care. The AFSNS will further focus on ways to
increase women’s participation in agricultural markets, so as to increase their income and
control over resources, thus further improving their access to food as well as health services.
ii. Children 6-59 months: This group faces an increased risk of morbidity, mortality and
growth impairment due to a heightened vulnerability to infections and the development of
severe acute undernutrition. The AFSNS will focus on how to improve complementary
feeding for infants, improved access and consumption of diverse and nutritious foods for
older children, and promote the local production of ready to use therapeutic foods in the
context of high energy nutritious foods for treatment of severely acute malnourished children.
iii. School-aged children. Provision of adequate and diverse nutritious foods to address
undernutrition, micronutrient deficiencies, and overweight/ obesity will be prioritized for this
group. Interventions will include school based interventions that promote healthy diets and
lifestyles and build household resilience, while boosting livelihoods and the local agricultural
economy (e.g. school feeding linked to local agriculture). Nutrition education and behavioural
change initiatives will further be promoted.
iv. Internally Displaced People (IDPs): This particular profile is new in Nigeria and given the
adverse disruption of agriculture and trade activities, the food security and nutrition status of
IDPs have been greatly compromised. Youth employment, school feeding linked to local
procurement of food from small holder farmer associations and other direct and targeted food
distribution and nutrition interventions are possible points of entry.
v. Special circumstances vulnerable groups: These include prisoners, children in orphanages,
people living with disability, and people living with HIV/AIDS.
Geographic Focus The maps below, showing the prevalence of stunting by state in 2013, indicate that the burden of
undernutrition is by far higher in the North West and North East geopolitical zones that in any other
zones. In the North Central zone, a few states also have high prevalence of stunting. All states in the
southern zones have stunting prevalence rates that are at least 10% points lower than the national
stunting prevalence.

21
Thus, the Strategy recognizes that malnutrition is generally high in Nigeria across all the geopolitical
zones but disproportionately higher in the North West and North East zones. In the principle of
leaving no one behind, the Strategy will adopt a national approach towards addressing the diverse
challenges of malnutrition in ways that prioritize high prevalence areas across the zones. The Strategy
works towards virtual elimination in zones where considerable progress has been made and significant
reduction in zones where prevalence levels remain disproportionately high. It will support the
implementation of actions and initiatives that recognize the interconnectedness of all zones from a
food systems perspective. The diversity of the nutrition challenge and how public and private sector
actors operate and are organized across the various zones in the country will also be taken into
consideration.

22
COORDINATION AND INSTITUTIONAL FRAMEWORKS FOR THE
AFSNS
Nigeria has two institutional avenues for the coordination of nutrition interventions. There is a
national structure that coordinates cross-sectoral activities and there is a sectoral structure within
FMARD.
National Structure In 1990, the Federal Government of Nigeria established a National Committee on Food and Nutrition
(NCFN) as an institutional arrangement to coordinate and provide comprehensive leadership and
actions that could effectively reduce malnutrition in Nigeria. Membership of the Committee is drawn
from relevant ministries, departments and agencies of government as well as representatives of
tertiary institutions dealing with issues of food and nutrition. The NCFN is domiciled within the
Ministry of Budget and National Planning (MBNP) and is responsible for the National Policy on Food
and Nutrition (NPFN).
The NCFN ensures that the representatives of relevant sectors on the committee undertake effective
implementation of their various policies and programmes, and further advises on the formulation of
appropriate strategies for programme monitoring and evaluation.
In order to achieve the objectives of the NPFN and implement its programmes, there are State
Committees on Food and Nutrition (SCFN) and Local Government Committees on Food and
Nutrition (LGCFN)
Ministerial Structure within FMARD The Federal Ministry of Agriculture and Rural Development inaugurated an Inter-ministerial
Agriculture Nutrition Working Group to provide high profile advisory support to the new Nutrition
and Food Safety Division of the Federal Ministry of Agriculture and Rural Development. The Inter
Ministerial Agriculture Nutrition Working Group will also coordinate nutrition actions within the
agricultural sector, through the Nutrition and Food Safety Division. The Working Group draws
membership from different sectors to ensure that activities taken within the agricultural sector are
implemented in a manner that will have the most impact on nutrition. In addition, the Working Group
will also support representation of the agricultural sector on the NCFN through the Nutrition and Food
Safety Division. Further details about the membership of the Working Group and the Terms of
Reference of the Group are in the Annex.
The Strategy proposes the institutionalization of a Directorate level nutrition leadership position in the
federal and state ministries of agriculture or a professionalized and specialized agency as may be
deemed appropriate and feasible.

23
AFSNS MONITORING AND EVALUATION SYSTEM
The monitoring and evaluation (M&E) system is to support the Federal Ministry of Agriculture and
Rural Development (FMARD), at both central and decentralised level, to give account towards key
institutional stakeholders, donor organisations and most importantly Nigerian citizens on the
implementation of the AFSNS for 2016 to 2025. The primary purpose of the M&E System is to assess
the extent to which the Strategy is accomplishing its overall goal of improving the food and nutrition
security of all Nigerians while empowering women and promoting resilience of the most vulnerable
through sustainable agricultural livelihoods. A second important purpose is to understand the
effectiveness and relevance of the Strategy in achieving the different identified specific objectives and
how these objectives contribute to the overall goal. The M&E system will aim to assess and provide
evidence on if and how each of the specific objectives contributes to the overall goal, if and how
programmes and projects (clustered within the 6 specific objectives) are consistent with the overall
goal (relevance) and if and how the expected outputs are achieved (effectiveness).
The AFSNS M&E system is underpinned by the Results Based Management (RBM) approach defined
as a broad management strategy aimed at achieving improved performance and demonstrable
results35
. RBM emphasizes the importance of linking planning, monitoring and evaluation processes36
for enhancing the effectiveness of policies, strategies, programmes and projects. The establishment of
an effective M&E system supports the adoption of the RBM approach as M&E systems are basically
aimed to ensure an effective interconnection of these 3 complementary processes of planning,
monitoring and evaluation. In RBM, planning is the critical process through which policies, strategies,
programmes and projects are developed and focused on the results that matter. M&E supports the
learning process from successes and challenges, and informs decision making, so that current and
future interventions are improved. Linking planning, monitoring and evaluation generates a
continuous process of doing, learning, and improving, which is commonly referred to as the RBM life
cycle.
Structure of the AFSNS M&E System
The AFSNS M&E System rests on the following 4 pillars:
1. AFSNS Results Framework (RF);
2. AFSNS Monitoring and Reporting Process;
3. AFSNS Independent Evaluation Process;
4. AFSNS Risk Management Process
The above 4 pillars and the respective processes are closely linked to each other. The AFSNS RF
Matrix (Pillar 1) is the overarching reference for conducting M&E actions and linking all actions to
their expected results and targets (Pillars 2, 3 and 4). The AFSNS Monitoring and Reporting Process
(Pillar 2) focuses on RF planned (specific) objectives and verification criteria. The AFSNS
Independent Evaluation Process (Pillar 3) complement monitoring findings by providing independent
assessments of the results achieved (at different levels) and the relevance of the actions implemented.
35
The United Nations Evaluation Group (UNEG), www.uneg.org. 36
The UNEG defines Planning, Monitoring and Evaluation as the three interconnected processes of the Results
Based Management (RBM) approach, where: a) Planning is the process through which stakeholders identify a
shared vision of the future, goals and objectives to be achieved; b) Monitoring is the process through which
regular feedback on the progress being made towards achieving the set goals and objectives is obtained; c)
Evaluation is the rigorous and independent assessment to determine the relevance and the extent to which
development initiatives achieve stated objectives.

24
By highlighting issues to be addressed and opportunities to be considered, both monitoring as well as
evaluation generate information that supports periodic review of plans and the continuous Risk
Management Process (Pillar 4).
AFSNS Results Framework (RF)
The Results Framework (RF) is the key AFSNS planning, monitoring and evaluation tool. It translates
the AFSNS and its theory of change into a results chain and provides the criteria (indicators, targets
and sources of verifications) to monitor and assess progress being made towards the expected outputs,
outcomes and, ultimately, impact. The RF defines what the country wants to achieve through the
AFSNS in terms of measurable food security and nutrition results, and how to achieve them through
the required investments. The RF is a key tool for alignment and coordination of investments when, as
proposed here, it is closely linked to operational activities and interventions. The RF development
process was a top-down exercise which translated the actions already identified in the AFSNS and
inputs from key stakeholders into a logical matrix.
The RF reflects the AFSNS and its scope, its overall goal and specific objectives and prioritized
interventions. These have been translated in expected SMART results (Specific, Measurable,
Achievable, Relevant and Time-bound). Following the 6 specific objectives areas identified by the
AFSNS, expected impact and outcome statements are associated to a set of measurable indicators. For
each of them: (i) baseline figures were extracted from relevant authoritative sources; (ii) targets to be
achieved, within the timeframe of the AFSNS (2016-2025), have been agreed upon through
consultations; (iii) the proposed sources and means of verification have also been identified and
confirmed through consultations with relevant stakeholders. Draft risks and assumptions have been
defined for the impact and outcomes levels. Expected outcomes reflect the intended improvements of
people’s wellbeing. The RF specifies intermediate and immediate outcomes. The intermediate
outcomes are the Strategy’s priority areas, are linked to the specific objectives, and are the Strategy’s
longer-term outcomes which achievement is expected to logically contribute to the achievement of the
ultimate AFSNS overarching goal. The immediate outcomes are associated with the sub-components
under each specific objective and are delivered through the expected outputs. The sub-components are
the entry points of the priority areas of the AFSNS. The summary AFSNS RF is presented in Figure 3,
and the RF is provided in its integral version in the Annex.
AFSNS Monitoring and Reporting Process
The second pillar of the AFSNS M&E system is the monitoring and reporting process through which
the national, state and local level institutional and relevant non-institutional stakeholders will receive
periodic feed-back on the AFSNS implementation performance towards the objectives defined in the
RF. These stakeholders will, in their turn, be requested to provide the needed relevant information for
the M&E system to work efficiently. AFSNS monitoring and reporting is both a bottom-up and top-
down process. At decentralized (state/LGA) levels, each AFSNS implementing partner will be
responsible to report on substantial progress made in the delivery of the outputs and on the financial
execution of the investments under their responsibility. Decentralised FMARD M&E unit/focal
points, which will be located in the state offices of FMARD, will receive the information, consolidate
it and pass it to the national level for national reporting purposes. The central FMARD M&E Unit will
analyse and collate the received information and share it back to the relevant stakeholders at
decentralised level for aligning processes as well as for learning purposes. The information will also
be shared with relevant institutional and non-institutional stakeholders at national level, including the
National Committee on Food and Nutrition and relevant donors.

25
AFSNS Independent Evaluation Process
The third pillar of the AFSNS M&E system is the AFSNS evaluation process. Evaluations are
expected to complement monitoring actions with independent assessments of the main results
achieved. While monitoring activities focus mainly on the assessment of interventions and outputs
delivery, external evaluations will be conducted on a regular basis and focus on each of the expected
specific objective outcomes of the AFSNS. The purpose of AFSNS outcome evaluations is to identify
the critical lessons to be learned from implementation, and to bring the learning to the institutional
level so that positive change is enabled. AFSNS outcome evaluations are also intended to support in
identifying factors (risks) with potential negative or positive impacts on the implementation of the
AFSNS interventions. Periodic surveys to assess the extent to which AFSNS specific objectives
immediate outcomes are achieved will be planned to complement the independent evaluations. One
long-term ex-post impact evaluation can further be commissioned to look at the sustainability of the
achieved impact. Two main areas of evaluation will be the relevance of the actions/initiatives as well
as their effectiveness.
Relevance – Is the strategy (and its programmes and projects) doing the right things? Is the strategy
responding to the situation needing improvement? Does it really deal with target group priorities?
Why or why not? Is the Strategy focusing on the right areas of improvements? Why or why not? In
which geographical areas do we have to work to implement the AFSNS in Nigeria both at national as
well as a state level? What are the results we can reasonably expect from our efforts? These questions
inform the formulation of the impact and outcomes statements.
Effectiveness – Is the strategy (and its programmes and projects) doing things right? Have the planned
purpose and component purposes, outputs and activities been achieved? Why or why not? Is the
intervention logic correct? Why or why not? Are the different components of the strategy proceeding
at the same pace? Why or why not?
AFSNS Risk Management process
The fourth pillar of the M&E system is the risk management process, which is intended to support
FMARD and other stakeholders in identifying factors with a potential negative or positive impact on
the implementation of the strategy. Risk management will be firmly institutionalized and related
provisions will be considered in the overall AFSNS M&E arrangements. The analysis of operational
risks with potentially negative impact on output delivery performance will be complemented by the
identification of opportunities that may positively impact the implementation of the Strategy. Follow-
up on risks/opportunities will be periodically conducted and risk mitigation measures will be planned,
budgeted and implemented. These risk mitigation measures will be incorporated into the AFSNS, and
plans and interventions will be adjusted accordingly.

26 KEY: Goal – Overall Objective of the FSN Strategy IR – Intermediate Results, which are also the Priority Areas Obj. – Specific Objectives
Figure 3: Summary Results Framework of the Agricultural Sector Food Security and Nutrition Strategy
IR 2: Increased access
to micronutrient rich
foods, especially
targeting women
IR 3: Improved
food safety
along the value
chain
IR 1:
Enhanced
value chains
for nutrition
IR 5: Nutrition
research and
information
systems promoted
IR 7: Nutrition education,
social marketing,
behavior change
communication, and
advocacy
IR 6: Improved
agricultural sector
capacity to address
food security and
nutrition problems
IR 4: Resilience and
social protections nets
for vulnerable groups
built through food
systems
IR 8: Nutrition
surveillance
and monitoring
and evaluation
OBJ. 1: Improve food
security at the national,
community, and
household levels
OBJ. 2: Reduce
undernutrition, including
micronutrient deficiency
disorders
OBJ. 3: Prevent chronic
nutrition-related
noncommunicable
diseases
OBJ. 4: Increase the
knowledge of nutrition and
integrate nutrition into
agricultural trainings
OBJ. 5: Strengthen
systems that build
resilience for improved
food and nutrition
OBJ. 6: Incorporate food and
nutrition considerations into
national agricultural sector
development plans
GOAL: TO IMPROVE THE FOOD AND NUTRITION SECURITY OF ALL NIGERIANS WHILE EMPOWERING WOMEN AND
PROMOTING RESILIENCE OF THE MOST VULNERABLE THROUGH SUSTAINABLE AGRICULTURAL LIVELIHOODS
Indicators
% of farms using commodity-specific
good agricultural practices
Tonnes of
commodities dried or stored using improved
techniques and
technologies
% of farmers of
susceptible crops that deploy appropriate
guidelines for
aflatoxin control
Volume of agricultural
produce that meet food safety standards
Targets
25% decrease in aflatoxin
contamination in
maize and groundnut at point of
consumption
Indicators
Ratio of domestic to
imported rice and wheat
Number and price of fruits and vegetables
available all year
round
Quantity of high
energy nutritious foods produced
Number of farmers producing bio-fortified
crops
% of locally processed
foods that are fortified
Targets
10% increase in Food Production Index
25% increase in cereal yields (kg) per hectare
≥50% reduction in Food Insecurity
Experience Scale
Indicators
Number of home gardens established
Number of households establishing small
animal husbandry
% of primary and secondary schools that
have a functional
school garden or rear animals
% of people who consume fruits and
vegetables everyday
Targets
≥15% rural increase and
≥50% urban increase in
households with home
gardens
≥10% rural increase and ≥5%
urban increase in households
rearing small animals
Increase in Women’s
Empowerment in Agriculture
Index
Indicators
Policy brief based on
the results of the
NFCNS that highlight
the implications of the
results for nutrition
education
interventions
Number of crop
varieties developed
Number of new food
products with
enhanced nutrition
attributes developed
Targets
Multisector national food and
nutrition security
information system publicly accessible
electronically
Indicators
Number of ASFNS
related interventions
that incorporate
nutrition education
% of packaged foods
that have a label with
nutrition information
% of population 6 – 49
years old that are
aware of food-based
dietary guidelines
% of population who
know and are able to
prepare meals meeting
the dietary guidelines
Targets
25% increase in % of
population ≥15 years old
who can correctly state
food groups that need to be
consumed daily for good
nutrition, and give
examples of foods in each
food group
Indicators
% of landless agrarian
community households with
productive assets
% of smallholder farmers
that experience little to no
hunger
Targets
Increase in resilience
Index of households in
poor rural or
marginalized
communities
Indicators
Number of nutrition
focal points within
federal, state, and
LGA MDAs
% of extension agents
trained on nutrition
Percentage of
agriculture graduates
who take at least one
nutrition course as part
of their training
Targets
50% of SMARDs and SADPs
have a Nutrition Focal Point
100% of agricultural
extension departments in
polytechnics and universities
include nutrition in
curriculum
Indicators
Number of FMARD MDAs that consider
the objectives,
outcomes, and outputs of the AFSNS in
conducting their
activities
Number of LGAs and
states for which there is updated food and
nutrition situation
information
Targets
Electronic, annually
updated Agricultural
Sector Food Security
and Nutrition database

27
AFSNS INVESTMENT PLAN, COSTING AND IMPLEMENTATION PHASING
The expected results and achievable targets identified through the results framework have been a key
reference to guide the formulation of the AFSNS Investment Plan with its costing, and a first
fundamental step towards the establishment of a strong financial tracking system for nutrition-
sensitive agriculture. The Federal Ministry of Agriculture and Rural Development (FMARD)
considered the costing of the AFSNS as a crucial step in moving from high level planning to a
harmonized understanding of resource mobilization and implementation phases. In proceeding with
the costing, the Investment Plan needed to be designed with a view to reach a refined level of details
of formulated investments. The costing was then key to adjust investments according to their targets,
objectives, level of realism, and the modelling of enabling “soft’’ environment around investments.
The costing exercise had multiple objectives to:
i. Understand and address financial gaps for nutrition-sensitive agriculture, through resource
mobilization
ii. Create an enabling environment for nutrition and a basis for anchoring donor investments
iii. Agree on interventions falling within specific results and output groups, and establish a
classification system according to technical entry points, thereby facilitating the identification
of operationalization channels
iv. Set up targets for each intervention through a thorough exercise emerging from high level
consultative consensus and debates following strategic orientations and sets of criteria
v. Accompany the M&E framework with nutrition budgetary allocation and yearly progress
analyses within the agriculture sector towards expected national results for nutrition. (This will
not only help keep track of the right investments but also enable adequate modelling of federal
and state level scenarios to understand highest impact agriculture investments on nutrition,
depending on specific contexts in country.)
vi. Develop a strong consensus-generating ownership among planning, M&E and operation experts
in FMARD
To accelerate the costing process, FMARD organized a costing workshop that brought together a
Costing Working Group of local agricultural programming and nutrition experts. The team was
supported by an international costing expert from FAO Rome and FAO Country Office staff. The
following sections describe the process taken as well as methods and key outcomes of the costing
exercise.
Conversion of AFSNS into Investment Plan
The approach taken for costing is the “activity-based costing or ingredient approach”37
, referring to
investments under formulation, for which the biggest work is to identify a level of implementation not
37
“This approach is used when a programme does not exist or exists but is inadequate. In this approach, the
programme to be implemented is divided, based on a priori reasoning and limited experience, into its
components and subcomponents by the activities to be undertaken (Fiedler 2003; Fiedler et al. 2008; Matz et al.
1984; Baker 1998). The inputs are identified for each activity and the input coefficients and the amounts of
inputs required to produce the target outputs are appropriately assessed. The information on the price of inputs
is collected from the competitive markets (or the shadow prices—the calculated price of a good or service for
which no market price exists—are entered), and finally the total cost is estimated by component and cost centre
(the basic unit of responsibility in an organization for which costs are accumulated)” Nutrition Costing:
Technical Guidance Brief, USAID 2017: https://www.usaid.gov/what-we-do/global-health/nutrition/technical-
areas/nutrition-costing-technical-guidance-brief

28
existing yet and set ambitious but realistic targets. The Costing Working Group converted the Strategy
into its Investment Plan by establishing a classification system using technical entry points of
agriculture for nutrition and referring to the matrix of investment types and entry points for nutrition38
.
Identified and selected categories were divided in two groups: (i) hard investments, interventions
requiring a material cost, and (ii) soft investments, designed on the basis of human, administrative,
political, trade and social actions (Table 1).
Further steps were then taken:
1. Determination of phases of implementation: Costs are subject to change due to food market price
volatility and fluctuations; socio-demographic growth; evolution of conflict areas; national,
regional and international trade balance, flows and regulations; etc. Consequently, the duration
chosen for the costing was a strategic choice of 4 years, 2017 – 2020. It will be crucial to engage
in a second costing exercise for 2021 – 2025 based on preliminary results and indicators from
implementation of nutrition-sensitive interventions. This second costing is crucial in order to
prioritize interventions that show highest impacts and cost-effectiveness for nutrition, as well as to
increase coverage from the 2017 – 2020 costing.
2. Reviewing and identifying interventions to be costed: Costing can only take place when
interventions identified have been formulated taking into account operational parameters, with the
understanding of nutrition incremental value. The interventions already identified in the results
framework were disaggregated as needed into activities and sub-activities meant for the
interventions operationalization. The activities were then grouped according to the already
identified and selected categories. (See Annex for activity costs by category and sub-category.
Activities are labelled by their associated output number in the results framework).
3. Targeting, geographic and individual coverage, and potential impact pathways leading to
expected results: Establishing consensus around the states to be covered for each intervention;
communities, associations, groups, households and individuals to be targeted; and estimating
impact pathways based on interventions to results is crucial. The targets selected differed from
one intervention and category to another, but mostly smallholder producers or producer
organizations were targeted, with a specific emphasis on women groups. All geopolitical zones
were covered, with emphasis on 13 selected states with the highest burden of stunting.
4. Collection of data on unit costs and unit targets: Unit cost information depends on different sets of
criteria, such as market price fluctuations, implementation agency (government, NGO,
development partner etc.), quantity, operational and administrative costs, among other factors.
Unit targets were determined by inclusive discussions among the Costing Working Group by
considering between the ideal case scenario and the realistic/down-to-earth scenario. Unit costs
were provided and thoroughly reviewed by national stakeholders, and development partners.
5. Computation of costs: The unit costs and targets were computed to obtain investment costs.
38
FAO (2016). Compendium of indicators for nutrition-sensitive agriculture. Rome: Food and Agriculture
Organization of the United Nations

29
Table 1: Categorization through operational entry points for strategic costing
Category type Category title Sub-categories Impact pathways Costing specificities
SOFT
INVESTMENTS
C.1 ENABLING
ENVIRONMENT
C.1.1 Institutions and coordination
mechanisms
C.1.2 Trade and markets
C.1.3 Advocacy and communication
C.1.4 Infrastructures and organizational
capacities
Access to entitlements
Social protection /
entitlements
Women’s empowerment
Official documentation
Official dialogues/
committees/ meetings
Consultations
C.8 RESEARCH
C.8.1 Production / crop varieties
C.8.2 Development of nutrient-dense
products
C.8.3 Identification and targeting of
groups
C.8.4 Technologies
Food production
Community driven
development (CDD)
Food market environment
Consultations
Laboratory analyses
Research report drafting
Meetings
C.9 CAPACITY
C.9.1 Planning and managerial capacities
at all levels
C.9.2 Capacities of agriculture extension
workers at all levels
C.9.3 Capacity enhancement in the use of
technologies
C.9.4 Capacity development among
beneficiaries
Awareness, skills, and
knowledge
Capacity development
Sustainable enabling
environment
Trainings
Organizational development
Material design
Consultation
C.10 MONITORING &
EVALUATION
C.10.1 Baseline assessment and survey
design
C.10.2 Data management
C.10.3 Regular monitoring
Cost-effectiveness of
nutrition-sensitive
investments
Best practices
Surveys/ studies
Investigation staff
Tools
Consultations

30
Category type Category title Sub-categories Impact pathways Costing specificities
HARD
INVESTMENTS
C.2 PRODUCTION
C.2.1 Assets and inputs for diversified
production
C.2.2 Prison farming for internal food
security
C.2.3 Household-based farming
C.2.4 Animal based foods: fisheries
C.2.5 Animal based foods: livestock
Natural resources
environment
Food production
Agricultural income
Consumption
Women’s empowerment
Hectares of land
Inputs
Assets
Technical assistance
C.3
BIOFORTIFICATION
C.3.1 Iron biofortification
C.3.2 Zinc biofortification
C.3.3 Vitamin A biofortification
Food production
Agricultural income
Consumption
Natural resources
environment
Samples
Selected households
Technical demonstrations
C.4 POST-HARVEST
C.4.1 On farm storage
C.4.2 Processing
C.4.3 Transportation
Food market environment
Agricultural income
Consumption
Women’s empowerment
Machines and equipment
Structures
Demonstration assistance
C.5 FOOD SAFETY
C.5.1 Production stage
C.5.2 Processing stage
C.5.3 SOPs
C.5.4 Veterinary public health services
Heath, water and
sanitation environment
Food production
Natural resources
environment
Drafting of procedures
Tests and control packs
Monitor’s supervision
Dissemination events
Structures
C.6 MARKETS
C.6.1 Infrastructures
C.6.2 Packaging
C.6.3 Labelling
C.6.4 Promotion and marketing
Food production
Agricultural income
Consumption
Women’s empowerment
Structures
Consultations
Marketing campaigns/ events
Business studies
C.7 NUTRITION
EDUCATION &
BEHAVIOUR CHANGE
COMMUNICATION
C.7.1 Nutrition education
C.7.2 Behavior Change
Communication
Awareness, skills and
knowledge
Consumption
Women’s empowerment
Manuals and guidelines
Communication events/
messages/ modules
Physical demonstrations

31
6. Prioritization of costing based on adopted criteria: Selected criteria for prioritization were
discussed and adopted through review sessions. Criteria considered were the following:
a. Impact on nutrition outcomes – direct, intermediary and indirect;
b. Highest burden of undernutrition areas – 13 States prioritized;
c. Agro-ecological zones and comparative advantages;
d. Capacity for implementation (organizational, human, social);
e. Synergies with donor projects.
7. Comparison of expected outcomes with costs: The level of financial investment estimated for
interventions and categories, and their relevance, were reviewed with regards to the results
framework; to re-adjust where too heavy or too light compared to expected impact. The expected
impacts were classified into three – indirect impact (*), intermediary impact (**), and direct
impact (***).
AFSNS Costs
The four-year cost estimation for implementation of the AFSNS Investment Plan (2017 – 2020) is
about NAIRA 339,345,227,910; USD 1,112,607,305.
Categories with the heaviest weight (Figure 4) are Production (26.1%), followed by Food safety
(23.8%), Bio-fortification (13.20%), and Nutrition Education and BCC (10.6%).
Figure 4: Cost Estimation by Nutrition Entry Point Category

32
Costs by Categories
AFSNS INVESTMENT PLAN 2017 - 2020 Total cost (Naira) Total cost (US$)
Programme costs 261,034,790,700 USD 855,851,773
Administrative and operational costs (20%) 78,310,437,210 256,755,532
Total 2017 - 2020 339,345,227,910 USD 1,112,607,305
OVERALL GOVERNANCE
C.1 ENABLING ENVIRONMENT 7,424,502,000 2.84%
C.1.1 Institutions and coordination mechanisms 3,714,672,000
C.1.2 Trade and markets 114,160,000
C.1.3 Advocacy and communication 2,613,792,000
C.1.4 Infrastructures and organizational capacities 981,878,000
HARD INVESTMENTS PROGRAMMES
C.2 PRODUCTION 68,140,127,000 26.10%
C.2.1 Assets and inputs for diversified production 57,925,900,000
C.2.2 Prison farming for internal food security 2,840,800,000
C.2.3 Household-based farming 5,062,227,000
C.2.4 Animal based foods: fisheries 2,311,200,000
C.2.5 Animal based foods: livestock 6,215,840,000
C.3 BIOFORTIFICATION 34,495,167,600 13.21%
C.3.1 Iron biofortification 11,621,610,000
C.3.2 Zinc biofortification 7,625,448,000
C.3.3 Vitamin A biofortification 15,248,109,600
C.4 POST-HARVEST 20,574,710,000 7.88%
C.4.1 On farm storage 105,790,000
C.4.2 Processing 11,144,920,000
C.4.3 Transportation 9,324,000,000
C.5 FOOD SAFETY 62,228,782,000 23.84%
C.5.1 Production stage 2,988,856,000
C.5.2 Processing stage 723,840,000
C.5.3 SOPs 11,969,936,000
C.5.4 Veterinary public health services 46,546,150,000
C.6 MARKETS 19,456,076,000 7.45%
C.6.1 Infrastructures 904,440,000
C.6.2 Packaging 627,680,000
C.6.3 Labelling 11,224,000
C.6.4 Promotion and marketing 17,912,732,000
C.7 NUTRITION EDUCATION & BCC 27,721,804,000 10.62%
C.7.1 Nutrition education 8,773,704,000
C.7.2 Behaviour Change Communication 18,948,100,000
SOFT INVESTMENT PROGRAMMES
C.8 RESEARCH 514,327,500 0.20%
C.8.1 Production / crop varieties 360,627,500
C.8.2 Development of nutrient-dense products 91,875,000
C.8.3 Identification and targeting of groups 23,125,000
C.8.4 Technologies 38,700,000
C.9 CAPACITY 16,687,464,000 6.39%
C.9.1 Planning and managerial capacities at all levels 4,341,050,000
C.9.2 Capacities of agriculture extension workers at all levels 8,334,554,000
C.9.3 Capacity enhancement in the use of technologies 95,787,000
C.9.4 Capacity development among beneficiaries 3,916,073,000
C.10 MONITORING & EVALUATION 3,791,830,600 1.45%
C.10.1 Baseline assessment and survey design 3,390,570,800
C.10.2 Data management 301,041,800
C.10.3 Regular monitoring 100,218,000

33
Implementation Phasing
Total cost estimations for year one appear to be lighter than for the following years, as a result of
higher “Soft Investments” (capacity, enabling environment, etc.) to prepare for technical interventions
at the end of the year and following years.
AFSNS INVESTMENT PLAN 2017 - 2020 Cost 2017 (N) Cost 2018 (N) Cost 2019 (N) Cost 2020 (N)
Programme costs 62,560,766,958 66,363,286,025 67,162,546,025 64,948,191,692
Administrative and operational costs (30%) 18,768,230,088 19,908,985,808 20,148,763,808 19,484,457,508
Total 2017 - 2020 81,328,997,046 86,272,271,833 87,311,309,833 84,432,649,199
OVERALL GOVERNANCE
C.1 ENABLING ENVIRONMENT 2,051,883,667 1,643,689,667 2,207,633,667 1,521,295,000
C.1.1 Institutions and coordination mechanisms 979,743,000 949,143,000 892,893,000 892,893,000
C.1.2 Trade and markets 47,290,000 22,290,000 22,290,000 22,290,000
C.1.3 Advocacy and communication 992,450,667 322,778,667 992,450,667 306,112,000
C.1.4 Infrastructures and organizational capacities 32,400,000 349,478,000 300,000,000 300,000,000
HARD INVESTMENTS PROGRAMMES
C.2 PRODUCTION 17,035,031,750 17,035,031,750 17,035,031,750 17,035,031,750
C.2.1 Assets and inputs for diversified production 14,481,475,000 14,481,475,000 14,481,475,000 14,481,475,000
C.2.2 Prison farming for internal food security 710,200,000 710,200,000 710,200,000 710,200,000
C.2.3 Household-based farming 1,265,556,750 1,265,556,750 1,265,556,750 1,265,556,750
C.2.4 Animal based foods: fisheries 577,800,000 577,800,000 577,800,000 577,800,000
C.2.5 Animal based foods: livestock 1,553,960,000 1,553,960,000 1,553,960,000 1,553,960,000
C.3 BIOFORTIFICATION 8,623,791,900 8,623,791,900 8,623,791,900 8,623,791,900
C.3.1 Iron biofortification 2,905,402,500 2,905,402,500 2,905,402,500 2,905,402,500
C.3.2 Zinc biofortification 1,906,362,000 1,906,362,000 1,906,362,000 1,906,362,000
C.3.3 Vitamin A biofortification 3,812,027,400 3,812,027,400 3,812,027,400 3,812,027,400
C.4 POST-HARVEST 5,117,230,000 5,152,493,333 5,152,493,333 5,152,493,333
C.4.1 On farm storage - 35,263,333 35,263,333 35,263,333
C.4.2 Processing 2,786,230,000 2,786,230,000 2,786,230,000 2,786,230,000
C.4.3 Transportation 2,331,000,000 2,331,000,000 2,331,000,000 2,331,000,000
C.5 FOOD SAFETY 15,210,337,000 15,240,949,000 15,889,054,000 15,888,442,000
C.5.1 Production stage 945,068,000 965,680,000 539,360,000 538,748,000
C.5.2 Processing stage 180,960,000 180,960,000 180,960,000 180,960,000
C.5.3 SOPs 2,984,734,000 2,994,734,000 2,995,234,000 2,995,234,000
C.5.4 Veterinary public health services 11,099,575,000 11,099,575,000 12,173,500,000 12,173,500,000
C.6 MARKETS 4,942,150,000 4,944,234,000 4,935,958,000 4,633,734,000
C.6.1 Infrastructures 301,360,000 301,360,000 301,360,000 360,000
C.6.2 Packaging 156,920,000 156,920,000 156,920,000 156,920,000
C.6.3 Labelling 500,000 9,500,000 1,224,000 -
C.6.4 Promotion and marketing 4,483,370,000 4,476,454,000 4,476,454,000 4,476,454,000
C.7 NUTRITION EDUCATION & BCC 4,868,975,000 7,380,941,667 7,736,493,667 7,735,393,667
C.7.1 Nutrition education 87,700,000 2,658,666,667 3,014,218,667 3,013,118,667
C.7.2 Behaviour Change Communication 4,781,275,000 4,722,275,000 4,722,275,000 4,722,275,000
SOFT INVESTMENT PROGRAMMES
C.8 RESEARCH 44,816,875 371,266,875 92,386,875 5,856,875
C.8.1 Production / crop varieties 20,941,875 268,691,875 69,011,875 1,981,875
C.8.2 Development of nutrient-dense products 9,000,000 82,875,000 - -
C.8.3 Identification and targeting of groups - 3,625,000 19,500,000 -
C.8.4 Technologies 14,875,000 16,075,000 3,875,000 3,875,000
C.9 CAPACITY 3,414,209,500 4,685,048,167 4,294,103,167 4,294,103,167
C.9.1 Planning and managerial capacities at all levels 1,226,197,250 1,062,804,250 1,026,024,250 1,026,024,250
C.9.2 Capacities of agriculture extension workers at
all levels 2,098,244,000 2,300,422,000 1,967,944,000 1,967,944,000
C.9.3 Capacity enhancement in the use of technologies 9,000,000 43,387,000 21,700,000 21,700,000
C.9.4 Capacity development among beneficiaries 80,768,250 1,278,434,917 1,278,434,917 1,278,434,917
C.10 MONITORING & EVALUATION 1,252,341,267 1,285,839,667 1,195,599,667 58,050,000
C.10.1 Baseline assessment and survey design 1,163,190,267 1,122,802,267 1,104,578,267 -
C.10.2 Data management 77,447,000 94,299,400 81,133,400 48,162,000
C.10.3 Regular monitoring 11,704,000 68,738,000 9,888,000 9,888,000

34
ANNEX
Membership of the Inter-ministerial Agriculture Nutrition Working Group
i. Director of Agriculture
ii. Director of Rural Development
iii. Director of Livestock
iv. Director of Planning Policy and Coordination.
v. Director of Agriculture Extension
vi. Director of Fisheries
vii. Director of Gender and Youth
viii. Director of Food and Strategic Reserve
ix. Assistant Director I (Permanent Secretary’s Office)
x. Representative, Agricultural Research Council of Nigeria
xi. Representative of Fadama III
xii. Representative of the National Programme for Food Security (NPFS)
xiii. Representative of Ministry of Budget and National Planning
xiv. Representative of Federal Ministry of Health
xv. Representative of Federal Ministry of Women Affairs
xvi. Representative of Federal Ministry of Education
xvii. Representative of Federal Ministry of Water Resources
xviii. Representative of Federal Ministry of Industry, Trade, and Investments
xix. Representative of Food and Agriculture Organization of the United Nations (FAO)
xx. Representative of United Nations Children’s Fund (UNICEF)
xxi. Representative of International Fund for Agricultural Development (IFAD)
xxii. Representative of the European Union (EU)
xxiii. Representative of Bill and Melinda Gates Foundation (BMGF)
xxiv. Representative of Save the Children International
xxv. Representative of Global Alliance for Improved Nutrition (GAIN)
xxvi. Representative of TechnoServe
xxvii. Representative of Africare Nigeria
xxviii. Representative of Clinton Health Access Initiative (CHAI)
xxix. The Senior Advisor to the Honourable Minister on Food Security and Nutrition
xxx. The FMARD Nutrition Desk Officer/ Head of the Nutrition and Food Safety Division
The Directors of the Federal Department of Agriculture and Department of Rural Development chair
the meetings on behalf of the Permanent Secretary of Federal Ministry of Agriculture and Rural
Development; and the Nutrition and Food Safety Division serves as the Secretariat. This body through
the Nutrition and Food Safety Division will engage appropriate zonal and state level ministries of
agriculture and other parastatals towards the implementation of nutrition sensitive agricultural policies
and this Strategy in Nigeria.
Terms of Reference of the Inter-ministerial Agriculture Nutrition Working Group
The key scope and functionality of the Inter Ministerial Agriculture Nutrition Working Group is to:
1. Drive the development and institutionalization of innovative approaches that will improve
nutritional outcomes and raise the level of food and nutrition security
2. Raise the profile of food security and nutrition within FMARD and mainstream nutrition into
agricultural policies and programmes
3. Build and strengthen the evidence base for improving nutrition through the agricultural sector
4. Strengthen the leadership role of FMARD in improving nutrition through multi-stakeholder
platforms

35
Figure Illustrating Expected Coordination of Nutrition-Sensitive Agriculture
Activities within FMARD
National
Council on
Agriculture
Agricultural
Development
Programme
(ADP) Manager
FMARD
Directorate of
Nutrition
Zonal Agriculture
Director
State
Agriculture
Director
Subject Matter
Specialist
(SMS)
Zonal
Extension
Office
Block
Extension
Office
Village
Extension
Agents
Farming
Families
Permanent
Secretary
Honourable
Commissioner
for
Agriculture
LGA
Department of
Agriculture
State MARD
LGA Extension
Agents
Fadama III +
AF Project
State Fadama
Office
LGA
Chairman
Director of
LGA
National
Programme for
Food Security
NPFS)
FMARD Offices
at the State
Permanent
Secretary
Honourable
Minister for
Agriculture
Beneficiary
KEY
Federal
Level
State
Level
LGA Level
Interministerial
Agriculture-
Nutrition
Working Group
(IANWG)
Senior
Advisor Food
Security &
Nutrition

36
Agricultural Sector Food Security and Nutrition Strategy Results Framework Matrix
OVERALL STRATEGY GOAL To improve the food and nutrition security of all Nigerians while empowering women and promoting resilience of the most vulnerable
through sustainable agricultural livelihoods
ULTIMATE IMPACT Increase intake of nutritious food in adequate quantity and quality among the target populations
IMPACT INDICATOR BASELINE TARGET VERIFICATION
SOURCES ASSUMPTIONS
Percentage of poorest households with
acceptable Food Consumption Score
(FCS)
71% (2011 Comprehensive
Food Security and
Vulnerability Analysis –
CFSVA)
20% increase CFSVA or baseline
survey
The sustained and equitable development of
nutrition-sensitive agriculture (including nutrition-
sensitive agricultural value chains) contributes to
economic growth, poverty reduction and increased
food and nutrition security in Nigeria
Increasing interest and commitment by the
government of Nigeria in investing in agricultural
developments with the aim of improving nutrition
formally and financially translates into adequate
investments, high level coordination and cross-
sectoral national and state level mechanisms of
collaboration
Capacities at both federal and state levels to
formulate, coordinate, monitor and evaluate
ASFSNS interventions are strengthened where
already existing and/or developed. Appropriate
financing mechanisms and resources identified and
implemented
Percentage of women of reproductive
age (15-49) with increased Dietary
Diversity or Minimum Dietary
Diversity for Women at reproductive
age (MDD-W)
TBD 20% increase from baseline values
MDD-W baseline,
mid-term and end-line
surveys
Percentage of children 6 – 23 months
old with Minimum Dietary Diversity
(MDDIYC)
19% (2013 Nigeria
Demographic and Health
Survey -NDHS)
100% increase
NDHS or Nigeria
Nutrition and Health
Survey (NNHS)
Global Hunger Index (GHI) 32.8% (2015 GHI) 50% reduction
International Food
Policy Research
Institute (IFPRI)
Percent of national agriculture budget
allocated to nutrition-sensitive
interventions
0.62% (2014 FMARD
budget analysis) ≥100% increase
Budget Office,
Ministry of Finance or
Department of Finance
and Administration,
FMARD
The ASFSNS will also contribute in achieving the following national nutrition impacts and targets
Prevalence of stunting among children
<5 years old 37% (2013 NDHS) 40% reduction NDHS
Other relevant sectors such as health, social
protection, and education contribute and converge
in their roles for addressing malnutrition
Prevalence of anaemia in non-pregnant
women 15 to 49 years old 47% (2011 WDI) 50% reduction
World Development
Indicators (WDI)
Prevalence of low birth weight 15% (2011 WDI) 30% reduction WDI
Prevalence of obesity in women 15 to
49 years old 8% (2013 NDHS) 0% increase NDHS
Prevalence of overweight among
children <5 years old 4% (2013 NDHS) 0% increase NDHS
Prevalence of wasting among children
<5 years old 18% (2013 NDHS) 75% reduction NDHS

37
SPECIFIC OBJECTIVES INTERMEDIATE OUTCOMES
1 To improve food security at the national, community,
and household levels
Improved food safety along the value chain
Enhanced value chains for improved nutrition
2
To significantly reduce undernutrition, including
micronutrient deficiency disorders, among infants,
children, adolescents, and women of reproductive age Diversified household food production and consumption, especially targeting women, and generally increased
access to micronutrient rich foods 3 To prevent chronic nutrition-related non-communicable
diseases
4
To increase the knowledge of nutrition among the
populace and integrate nutrition education into
agricultural formal and informal trainings
Nutrition research and information systems promoted
Nutrition education, social marketing, behaviour change communication, and advocacy
5 To strengthen systems that build resilience for improved
food and nutrition situation Resilience and social protections nets for vulnerable groups built through food systems
6
To incorporate food and nutrition considerations into the
Federal, State and Local Government agricultural sector
development plans
Improved agricultural sector capacity to address food security and nutrition problems
Nutrition surveillance and monitoring and evaluation
PROXY INDICATORS BASELINES TARGETS VERIFICATION SOURCES RISKS AND ASSUMPTIONS
Specific objective 1:
to improve food security at the
national, community, and
household levels
INTERMEDIATE OUTCOME 1 Improved food safety along the value chain
Change in aflatoxin contamination in
maize and groundnut at point of
consumption
TBD
25% decrease from
baseline values at
national level
Data/reports from
1. Partnership for Aflatoxin
Control in Africa (PACA)
2. International Institute of
Tropical Agriculture (IITA)
Aflatoxin control measures are scaled
up in the planting, harvesting,
processing, marketing, and storage of
susceptible crops
Tonnes of exported food commodities
declared unsafe by international
standards
TBD
50% decrease from
baseline values at
national level
Reports from the
1. Nigerian Customs Service
(NCS)
2. National Agency for Food
and Drug Administration and
Control (NAFDAC)
3.National Bureau of Statistics
(NBS)
Capacities of farmers, processors, and
exporters to meet international food
safety standards are increased

38
PROXY INDICATORS BASELINES TARGETS VERIFICATION SOURCES RISKS AND ASSUMPTIONS
INTERMEDIATE OUTCOME 2 Enhanced value chains for improved nutrition
Food Production Index 115 (2013 WDI) 25% increase
Reports from Federal Ministry
of Agriculture and Rural
Development (FMARD)
Food Production Index in past and
updated years are properly calculated
and accurate
Cereal yields (kg) per hectare 1,537 (2013 WDI) 50% increase Reports from the
FMARD
Availability and widespread coverage
of improved seeds, inputs, irrigation,
and technical knowhow
Food Insecurity Experience Scale
53% moderate to severe
food insecurity (2014
provisional estimates
from Gallup Word Poll)
≥50% reduction
FAO/WFP survey reports
Baseline, mid-term and end-
line survey reports
Gallup World Polls
Equity in physical, economic, and
physiological distribution of food
Change in quantity of food imports TBD 60% reduction from
baseline values NBS trade reports
Agricultural development reverses the
underperformance of agriculture and
thus reduces the level of food imports
Retail market price of specified staple
and nutrient-rich foods:
TBD
≤10% decrease
from baseline
values
Nigeria Agricultural Market
Information System (AMIS)
NBS price bulletins
FEWSNET
Agricultural development and
reduction in food imports has a
positive impact on food prices.
Markets are competitive and integrated
across and within geopolitical zones
and states.
Maize
Millet
Rice
Groundnuts
Cowpeas
Cassava
Yam
Beef
Chicken eggs
Specific objective 2:
to significantly reduce
undernutrition, including
micronutrient deficiency
disorders, among infants,
children, adolescents, and
women of reproductive age
INTERMEDIATE OUTCOME 2 Enhanced value chains for improved nutrition
Tonnes of selected nutrient rich foods
(including bio-fortified crops) that are
domestically produced, such as:
TBD 25% increase from
baseline values
FMARD
NBS
Food Balance Sheets
National and state governments are
committed to enhance farmer’s
capacities to access inputs,
technologies and knowledge to boost
agricultural production and
productivity, with focus on
marginalized rural households and
women.
Actions and activities to reduce
postharvest loss and waste of
nutritious foods such as vegetables,
fruits, and animal foods, are accessed
by smallholder farmers and scaled up.
Capacities to collect, analyse, process
and disseminate data on agricultural
production and productivity might
differ from state to state with data
collection methods and outputs not
being standardized. National
authorities, in terms of resources and
investments, strengthen capacity to
harmonize and standardize
Agricultural Information Systems
Tomatoes
Orange
fleshed sweet
potato
Pro-vitamin A
rich cassava
Iron rich beans
Sorghum
Milk
Meat
Fish
Eggs
Percentage of postharvest loss
reduction of nutritious foods TBD
40% reduction from
baseline values
FMARD
NBS
Percentage of waste reduction of
nutritious foods TBD
40% reduction from
baseline values
FMARD
NBS

39
PROXY INDICATORS BASELINES TARGETS VERIFICATION SOURCES RISKS AND ASSUMPTIONS
INTERMEDIATE OUTCOME 3 Diversified household food production and consumption, especially targeting women, and generally increased access
to micronutrient rich foods
Women’s Empowerment in
Agriculture Index (WEAI) TBD
Increase from
baseline values
Ad-hoc baseline, mid-term and
end-line surveys
Women, including those in
marginalized and poor rural
communities, have access to inputs,
technologies, capacity development,
and finance opportunities; and are able
to access markets
Percentage of households with home
gardens disaggregated by rural/urban
residence
TBD
≥15% rural increase
≥50% urban
increase from
baseline values
Ad-hoc baseline, mid-term and
end-line surveys
Significant proportion of households
have access to land/appropriate space
and other inputs for home gardens
Percentage of households rearing
poultry and/or small ruminants TBD
≥10% rural increase
≥5% urban increase
from baseline
values
Ad-hoc baseline, mid-term and
end-line surveys
Significant proportion of households
have access to land/ appropriate space,
knowledge, and inputs for small
animal husbandry
Specific objective3:
to prevent chronic nutrition-
related non-communicable
diseases (NCDs)
INTERMEDIATE OUTCOME 3 Diversified household food production and consumption, especially targeting women, and generally increased access
to micronutrient rich foods
Number of domestically produced
fruits and vegetables for commercial
purposes
TBD ≥10% increase from
baseline values
FMARD
Ad-hoc baseline, mid-term and
end-line surveys
Demand for indigenous vegetables and
fruits is successfully increased
Per capita consumption of fruits and
vegetables TBD
≥10% increase from
baseline values
National Food Consumption
and Nutrition Survey
Increased awareness of the importance
of fruits and vegetables in reducing
malnutrition and preventing NCDs
Physical and economic barriers to fruit
and vegetable intake are reduced
Percentage of
households/communities who
received nutrition education sessions
(also contributing to specific objective
4)
TBD ≥30% increase from
baseline values
Ad-hoc baseline, mid-term and
end-line surveys
Nutrition education material needs to
be adapted for specific needs and
purposes at state level.
Need assessment needs to be carried
out prior to the starting of any activity

40
PROXY INDICATORS BASELINES TARGETS VERIFICATION SOURCES RISKS AND ASSUMPTIONS
Specific objective 4:
to increase the knowledge of
nutrition among the populace
and integrate nutrition
education into agricultural
formal and informal trainings
INTERMEDIATE OUTCOME 4 Nutrition research and information systems promoted
Multisector national food and
nutrition security information system
in place
No system currently in
place
Effective federal
and state level
system publicly
accessible
electronically
Regular bulletin on food
security and nutrition released
by the National Committee on
Food and Nutrition (NCFN)
Solid understanding of the underlying
causes of persistent hunger and
malnutrition which is grounded in
reliable data, statistics and analysis.
Better information sharing and
coordination
Multisector state food and nutrition
security information system in place TBD
At least 30% of
states are running a
project to set up a
food security and
nutrition
information system
Regular bulletins of food
security and nutrition at state
level
Thorough needs assessment needs to
be conducted in terms of food security
and nutrition information at state level
INTERMEDIATE OUTCOME 5 Nutrition education, social marketing, behaviour change communication, and advocacy
Percentage of the population ≥15
years old who can correctly state food
groups that need to be consumed daily
for good nutrition, and give examples
of foods in each food group
TBD 75% increase from
baseline values
Ad-hoc baseline, mid-term and
end-line KAP surveys
Nutrition communication is conducted
at scale using contextually appropriate
language, channels, and media
Nutrition communication is
understood and can be applied in
everyday food consumption patterns
Percentage of extension services who
received training in nutrition-sensitive
agriculture
TBD 50% increase from
baseline values Reports of the trainings
Well-functioning platforms need to be
in place at state and local level to
facilitate the delivery of the training
Specific objective 5:
to strengthen systems that
build resilience for improved
food and nutrition situation
INTERMEDIATE OUTCOME 6 Resilience and social protections nets for vulnerable groups built through food systems
Resilience Index of households in
poor rural or marginalized
communities
TBD Increase from
baseline values
Resilience Index and
Measurement Analysis of Ad-
hoc baseline, mid-term and
end-line surveys
Non-agricultural sector dimensions of
household resilience are addressed by
relevant stakeholders
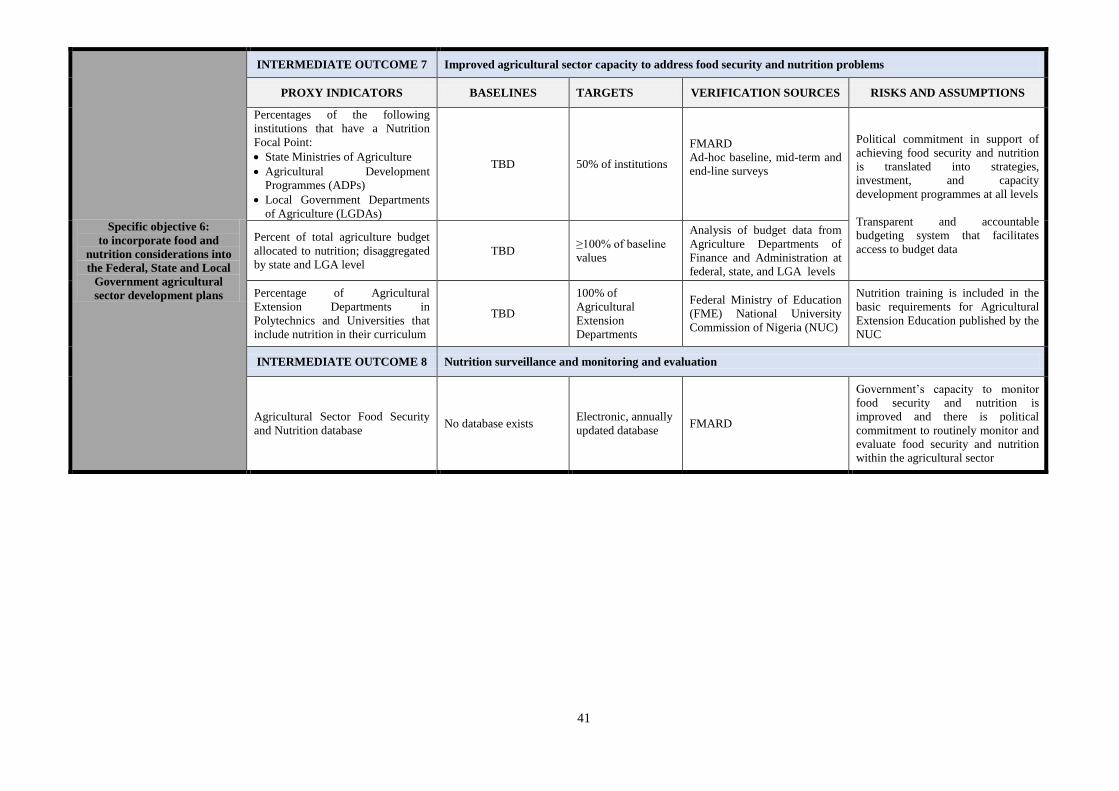
41
Specific objective 6:
to incorporate food and
nutrition considerations into
the Federal, State and Local
Government agricultural
sector development plans
INTERMEDIATE OUTCOME 7 Improved agricultural sector capacity to address food security and nutrition problems
PROXY INDICATORS BASELINES TARGETS VERIFICATION SOURCES RISKS AND ASSUMPTIONS
Percentages of the following
institutions that have a Nutrition
Focal Point:
State Ministries of Agriculture
Agricultural Development
Programmes (ADPs)
Local Government Departments
of Agriculture (LGDAs)
TBD 50% of institutions
FMARD
Ad-hoc baseline, mid-term and
end-line surveys
Political commitment in support of
achieving food security and nutrition
is translated into strategies,
investment, and capacity
development programmes at all levels
Transparent and accountable
budgeting system that facilitates
access to budget data Percent of total agriculture budget
allocated to nutrition; disaggregated
by state and LGA level
TBD ≥100% of baseline
values
Analysis of budget data from
Agriculture Departments of
Finance and Administration at
federal, state, and LGA levels
Percentage of Agricultural
Extension Departments in
Polytechnics and Universities that
include nutrition in their curriculum
TBD
100% of
Agricultural
Extension
Departments
Federal Ministry of Education
(FME) National University
Commission of Nigeria (NUC)
Nutrition training is included in the
basic requirements for Agricultural
Extension Education published by the
NUC
INTERMEDIATE OUTCOME 8 Nutrition surveillance and monitoring and evaluation
Agricultural Sector Food Security
and Nutrition database No database exists
Electronic, annually
updated database FMARD
Government’s capacity to monitor
food security and nutrition is
improved and there is political
commitment to routinely monitor and
evaluate food security and nutrition
within the agricultural sector

42
Specific Objective (SO) 1: to improve food security at the national, community, and household levels
Sub-component 1.1 of SO1: to promote good agricultural practices (GAPs) among farmers
Immediate outcome 1.1 Proxy indicator Baseline Target Verification Source
Farmers apply commodity-
specific GAPs in the food
value chain (including
nutrition-dense foods)
Percent of farmers
applying commodity-
specific GAPs
(disaggregated by
states/gender and
commodities)
TBD At least 50% of farmers use appropriate GAPs
in the food value chain
Agricultural
Production Surveys
by National
Programme for Food
Security (NPFS)
ASSOCIATED OUTPUTS
EXPECTED OUTPUTS OUTPUT PROXY
INDICATORS BASELINES INTERVENTIONS/ INVESTMENTS TARGETS
VERIFICATION
SOURCES
RESPONSIBLE
INSTITUTIONS
1.1.1 Development/
adaptation of GAPs
manuals for major
commodities (including
nutrition-dense
commodities)
Number of GAPs
manuals released
(developed or
adapted for the
Nigerian context)
TBD
Identification, standardization, and
documentation of best practices in the
production of each commodity (including
nutrition dense commodities)
≥5 commodity-
specific GAPs
released per year
until all relevant
commodities are
addressed
GAPs manuals
validated and
published
FMARD – FDA,
Agricultural
Extension
Department, FISS,
National Agriculture
Seed Council
(NASC)
State ADPs,
International
Fertilizer
Development (IFDC),
National Agriculture
(NARIs), Federal
Institute of Industrial
Research Oshodi
(FIIRO), Private
Sector Stakeholders,
Farmers Associations
1.1.2 Increased capacity of
extension agents (EAs) to
use GAPs manuals to train
and support farmers
Number of extension
agents who have the
capacity to train and
support farmers on
commodity-specific
GAPs
(disaggregated by
gender, state and
commodity)
TBD
Training sessions (and regular refreshment
trainings) on GAPs for groups of EAs, with a
focus on commodities produced in the
livelihood zones covered by each EA group
≥50 EAs have
acquired relevant
GAPs knowledge
and practices each
month
Reports of the
trainings
Knowledge tests of the
EA
Feed-backs from the
community of farmers
1.1.3 Strengthen capacity of
producer/farmer
associations in commodity-
specific GAPs
Number of producer/
farmer associations
with strengthened
capacity in
commodity-specific
GAPs
TBD
Organization/identification of producer/farmer
associations
Establishment of commodity-specific
demonstration plots (through FFSs where
available)
Training of producer associations
≥10 associations
trained per
commodity produced
in each livelihood
zone per year
Reports of trainings/
(including results of
KAP questionnaires)

43
Sub-component 1.2 of SO1: the scale-up of modern/improved transformation and storage techniques and technologies (at community and household level)
Immediate outcome 1.2 Proxy indicator Baseline Target Verification Source
Improved transformation
and storage of food
(including nutrient dense
food)
Quantity (tonnes) of
commodities
transformed and
stored using
improved techniques
and technologies
TBD
At least 50% increase in the use of improved
transformation and storage techniques and
technologies
FMARD reports
Ad-hoc surveys at
farm or household
level
ASSOCIATED OUTPUTS
EXPECTED OUTPUTS OUTPUT PROXY
INDICATORS BASELINES INTERVENTIONS/ INVESTMENTS TARGETS
VERIFICATION
SOURCES
RESPONSIBLE
INSTITUTIONS
1.2.1 Facilitated
procurement/ manufacture
of improved drying and
storage technologies by
farmer associations
Change in number of
precision drying and
hermetic storage
equipment available
and affordable for
farmers
TBD
Institution of duty/tax waivers for import/
production of hermetic storage and precision
drying equipment
Reduction in lending rates for procurement/
production of equipment
At least 50%
increase in the
number of improved
drying and storage
technologies
acquired by farmer
associations
FMARD
FMARD –
Departments of
Agricultural
Mechanization, Food
Strategic Reserves
(FSR), Extension,
Federal Department
of Agriculture (FDA)
of the FMARD
Private Sector
Stakeholders, State
ADPs
1.2.2 Promotion of
improved transformation
and storage techniques and
technologies to farmer
associations
Change in number of
farmers using
improved
technologies,
(disaggregated by
state and gender)
TBD
Prepare guidelines on use of improved
technologies and techniques, such as precision
drying, hermetic storage, and on-farm storage
technologies (e.g. 1 tonne metal silo bin)
Training of extension workers to disseminate
guidelines
Training of farmers to use technologies and
techniques
At least 50%
increase in the
number of improved
drying and storage
technologies
effectively used by
farmer associations
FMARD
Sub-component 1.3 of SO 1: to promote food irradiation
Immediate outcome 1.3 Proxy indicator Baseline Target Verification Source
Reduced microbial
contamination and spoilage
in food
Percent reduction in
postharvest losses
attributable to local
gamma irradiation
0%
≥20% reduction in postharvest losses in
attributable to gamma irradiation of local
produce
FMARD
ASSOCIATED OUTPUTS
EXPECTED OUTPUTS OUTPUT PROXY
INDICATORS BASELINES INTERVENTIONS/ INVESTMENTS TARGETS
VERIFICATION
SOURCES
RESPONSIBLE
INSTITUTIONS
1.3.1 Capabilities for food
irradiation is enhanced
Gamma irradiation
facility at Sheda,
Abuja is certified by
experts and ready for
use
Irradiation facility
is not completely
ready to use
Construction of road leading to gamma
irradiation facility and other structures necessary
to finalize the use of the facility (not funded
under this ASFSNS)
Development of standard operating procedures
for irradiation of various foods
Appropriate training of personnel
1. Standard
operating procedures
are available
2. All personnel at
the Sheda Irradiation
facility is trained
Reports from the
Sheda Science and
Technology Complex
(SHESTCO)
Federal Ministry of
Science and
Technology (FMST)
FMARD – FSR,
Extension
State ADPs, Private
Sector Stakeholders

44
EXPECTED OUTPUTS OUTPUT PROXY
INDICATORS BASELINES INTERVENTIONS/ INVESTMENTS TARGETS
VERIFICATION
SOURCES
RESPONSIBLE
INSTITUTIONS
1.3.2 States are sensitized
about the use of gamma
irradiation
Number of trainings
about gamma
irradiation conducted
to relevant
stakeholders at state
level
Number of states
visited
0 Relevant
stakeholders
trained
0 States
Identification of states with requisite
infrastructure to send produce to the irradiation
centre
Identification of produce to be targeted for
irradiation
Preparation of presentation to highlight the
benefits of irradiation for each produce
Advocacy visits to state and local level
policymakers, as well as farmer associations
All relevant
stakeholders in the
11 states within a 4
to 5 hour drive from
the facility, and
Abuja Federal
Capital territory
(FCT)
Reports of advocacy
visits
Reports of trainings
Knowledge and
practice test for the
personnel
Federal Ministry of
Science and
Technology (FMST)
FMARD – FSR,
Extension
State ADPs, Private
Sector Stakeholders 1.3.3 Gamma irradiation is
deployed for food security
and safety
Tonnes of food
irradiated by state 0
Establishment of preparation and bagging
centres in the states involved
Preparation of irradiation and movement
schedules for produce
20% increase from
baseline values
Reports from
SHESTCO
Sub-component 1.4 of SO 1: to develop a National Aflatoxin Control Initiative
Immediate outcome 1.4 Proxy indicator Baseline Target Verification Source
Implementation of National
Strategy on Aflatoxin
Control
Percent of farmers of
susceptible crops that
apply appropriate
practices for
aflatoxin control
(disaggregated by
state and gender)
TBD ≥50% increase in farmers applying appropriate
practices for aflatoxins control
FMARD
ASSOCIATED OUTPUTS
EXPECTED OUTPUTS OUTPUT PROXY
INDICATORS BASELINES INTERVENTIONS/ INVESTMENTS TARGETS
VERIFICATION
SOURCES
RESPONSIBLE
INSTITUTIONS
1.4.1 National Aflatoxin
Control Strategy is
developed
Aflatoxin control
strategy is published
There is no
national aflatoxin
control strategy
Research to identify entry points of aflatoxin
contamination in susceptible crops
Research and dialogue with subject matter
specialists to determine best practices for
reducing aflatoxin contamination at each entry
point
Compilation of best practices into a national
strategy
Validation and finalization of the strategy
Aflatoxin strategy
document that
addresses all
susceptible crops and
all potential entry
points of
contamination is
available by 2018
Research reports
Reports of the expert
meetings and
validation meetings FMARD – FDA,
Extension services
International Institute
for tropical
Agricutlure (IITA),
National Agency for
Food and Drug
Administration and
Control (NAFDAC) 1.4.2 Capacity to implement
National Aflatoxin Control
Strategy is increased
Number of trainings
related to
implementation of
the aflatoxin strategy
Number of people
trained,
disaggregated by
gender
Action plan available
No training
currently available
Development of training materials based on the
aflatoxin strategy
Training of extension agents
Cascading of audience specific training to
farmers, processors, distributors and other actors
along susceptible value-chains
Support for increased production of necessary
technologies for aflatoxin control (such as
Aflasafe)
All relevant
stakeholders have
the capacity to
implement the
strategy by 2020
Training reports

45
Sub-component 1.5 of SO 1: to ensure that agricultural practices and produce conform to Codex Alimentarius standards
Immediate outcome 1.5 Proxy indicator Baseline Target Verification Source
Reduced chemical
contamination of food
Percentage of
commodity-specific
market samples that
comply with Codex
Alimentarius
Maximum Residue
Limits (MRLs) for
pesticides
TBD At least 75% of market samples are within
Codex MRLs for pesticides
NAFDAC
monitoring reports
ASSOCIATED OUTPUTS
EXPECTED OUTPUTS OUTPUT PROXY
INDICATORS BASELINES INTERVENTIONS/ INVESTMENTS TARGETS
VERIFICATION
SOURCES
RESPONSIBLE
INSTITUTIONS
1.5.1 Relevant technical
departments within
FMARD provide inputs into
the setting of Codex
standards
Number of FMARD
technical
departments that
attend NCC meetings
TBD
Advocacy to relevant departments in FMARD
on importance of attendance at NCC meetings
Resource mobilization for attending NCC
meetings
Targeted activities to develop capacity to
effectively attend the NCC meetings
All departments
involved participate
with relevant
stakeholders to NCC
meetings
Minutes and list of
participants of NCC
meetings
FMARD – FDA,
Animal Husbandry,
Fisheries, FSR,
NAQS
Standards
Organization of
Nigeria (SON), NCC,
NAFDAC, Consumer
Protection council
(CPC), Ministry of
Industry, Trade and
Investment (FMITI),
Ministry of Science
and Technology
(FMST)
1.5.2 National Agricultural
Technical Working Group
for Codex is strengthened
Number of standards
and codes of
practices established
Number of codes of
practices
implemented
TBD
Resource mobilization to convene regular
working group meetings
Identification and compilation of country-
specific commodities and corresponding
international MRLs
Research and consultations to establish MRLs
within national context
≥50% increase in the
number of codes of
practices established
≥50% increase in the
number of codes of
practices
implemented
FMARD reports
Minutes of Working
Group meetings
1.5.3 Capacity of
stakeholders in the
agricultural value chains to
conform to Codex MRLs for
pesticides is increased
Number of
information
dissemination for
a/trainings on Codex
MRLs for pesticides
Number of people
trained
(disaggregated by
state and gender)
TDB
Development of education manuals for
stakeholders at different points of agricultural
value chains
Information dissemination on pesticide MRLs
Training on guidelines of actions that ensure
conformity with MRLs
≥50% increase in the
number of for
a/trainings on Codex
MRLs for pesticides
≥50% increase in the
number of relevant
stakeholders trained
Training reports
1.5.4 Increased monitoring
and evaluation of pesticide
MRLs in commodities
Number of M&E
exercises TBD
Development of standard operating procedures
for monitoring MRLs in commodities
Purchase of rapid pesticide level detection test
kits
Training to regulatory agencies on use of test
kits and adequate sampling procedures
Resource mobilization for monitoring at
different points along commodity value chains
≥50% increase in the
number of M&E
exercises
Monitoring reports

46
Sub-component 1.6 of SO 1: to collaborate with food safety regulatory agencies to facilitate compliance with standards
Immediate outcome 1.6 Proxy indicator Baseline Target Verification Source
Locally consumed foods
meet international
standards of safety and
quality
Volume (in tonnes)
of agricultural
produce that meets
standards of safety
and quality
TBD
≥50% increase in the quantity (tonnes) of
agricultural produce that meets standards of
safety and quality
Reports from ad-hoc
sampling and testing
surveys
ASSOCIATED OUTPUTS
EXPECTED OUTPUTS OUTPUT PROXY
INDICATORS BASELINES INTERVENTIONS/ INVESTMENTS TARGETS
VERIFICATION
SOURCES
RESPONSIBLE
INSTITUTIONS
1.6.1 Certification system to
signal quality for foods
meeting standards is
developed
Existence of a
unified certification
system
Fragmented and
confusing
certification system
Compilation of standards for different
commodities
Identification of all ministries, department, and
agencies (MDAs) involved in adequate product
certification
Development of a unified system to certify food
quality
Development of a logo to signal certification of
food quality
A multi-agency
unified and
streamlined
certification process
FMARD reports
FMARD – Nigerian
Agriculture
Quarantine Services
(NAQS), FDA, Food
Strategic reserves
(FSR)
Nigerian Customs
Services, SON,
NAFDAC, Private
Sector Stakeholders,
Export Promotion
Council, State ADPs,
Farmers associations
1.6.2 Public (including
farmers and marketers) is
aware of international
standards of quality and
certification signals for
quality
Number of public
awareness events
conducted
Number of farmers
and marketers
trained
(disaggregated by
state and gender)
TBD
Identification of appropriate media and channels
for different audience
Development of education materials for
different media
Periodic public enlightenment events/sessions,
conveying consistent messages
≥50% of the
population reached
with food quality
and certification
messages
Ad-hoc surveys
1.6.3 Farmers and
marketers are supported to
meet standards
Percent of foods
intended for export
that meet
international quality
standards
TBD
Electronic platform where specific standards for
different commodities can be accessed
Platform for expert consultation on challenges
faced in achieving food quality standards
≥30% increase
Reports from ports of
exit around the
country
Sub-component 1.7 of SO 1: to support facilities and systems that can promote food safety
Immediate outcome 1.7 Proxy indicator Baseline Target Verification Source
Food safety is promoted in
warehouse receipt systems,
commodities exchange
boards, and aggregation
centres
Percentage of food
samples from
facilities/systems that
meet food quality
standards
TBD
100% of food samples taken from warehouse
receipt systems, commodities exchange boards,
and aggregation centres meet minimum food
safety and quality standards
SON monitoring
reports

47
ASSOCIATED OUTPUTS
EXPECTED OUTPUTS OUTPUT PROXY
INDICATORS BASELINES INTERVENTIONS/ INVESTMENTS TARGETS
VERIFICATION
SOURCES
RESPONSIBLE
INSTITUTIONS
1.7.1 Facilities and systems
that can promote food safety
and quality are inventoried
Existence of a list of
appropriate
facilities/systems
TBD
Research to identify formal and informal
warehouse receipt systems, commodities
exchange boards, aggregation centres, and
similar facilities/ systems
Documentation of facilities/ systems,
commodities involved, and existing food safety
efforts
Complete list of
relevant facilities/
systems, including
location and priority
commodities
FMARD reports FMARD – FSR,
FDA (Nutrition &
Food Safety
Division)
NAFDAC, AFEX
Commodity
Exchange, Private
Sector Stakeholders,
State ADPs, Farmers
Groups/ Associations
1.7.2 Food safety and quality
standards are enforced in
facilities and systems
Number of facilities/
systems that follow
standard operating
procedures for
ensuring food quality
TBD
Development of contextually appropriate
standard operating procedures (SOPs) and
guidelines for achieving food quality standards
within facilities and systems
Provision of SOPs and guidelines to each
facility/ system and education about use
Routine monitoring of facilities/ systems to
ensure that SOPs and guidelines are in use
Enforcement of SOPs and guidelines in non-
complying facilities/ systems
100% of facilities/
systems adhere to
food quality SOPs
and guidelines
Routine monitoring
reports
Sub-component 1.8 of SO 1: to increase production of nutrient dense food crops
Immediate outcome 1.8 Proxy indicator Baseline Target Verification Source
Improved productivity and
production of major
nutrient dense foods in
different geo-political zones
Ratio of domestic to
imported nutrient
dense commodities
TBD
Domestic to imported selected nutrient dense
crops ratio increases by 30%
Reports from
FMARD
NBS
ASSOCIATED OUTPUTS
EXPECTED OUTPUTS OUTPUT PROXY
INDICATORS BASELINES INTERVENTIONS/ INVESTMENTS TARGETS
VERIFICATION
SOURCES
RESPONSIBLE
INSTITUTIONS
1.8.1 Improved and
streamlined access to land
Number of acres of
new farmland
cultivated (by state
and gender)
TBD
Liaise with state governors to reserve tracts of
land for farming
Facilitate a transparent and efficient land
acquisition and documentation process
TBD
Reports of ease of
doing
business in agriculture
index
FMARD – Federal
Department of
Agriculture (FDA),
Horticulture
Division, Federal
Input Supply
Services, Agriculture
Mechanization,
Extension, Land &
Climate Change
Department
NIRSAL, RUFIN,
BOA, RUWASA,
Federal Ministry of
Water and Resources
1.8.2 Improved credit and
insurance facilities to
incentivize additional
private sector participation
in nutrient dense crop
production
% reduction in
agricultural lending
interest rates
Number of additional
commercial farmers
(disaggregated by
state and gender)
TBD
Research on the agricultural credit approval
process and turnaround time, to identify entry
points for a more efficient process
Willingness-to-pay studies to identify insurance
premiums
Awareness creation about available resources
and opportunities
TBD
Audit reports of Bank
of Agriculture (BOA),
Rural Finance
Institution Building
Programme (RUFIN),
and Nigeria Incentive-
Based Risk Sharing
System for Agriculture
landing (NIRSAL)
1.8.3 Increased access to
mechanized agriculture
Number of tractors
per 100 acres TBD
Establish waivers for agriculture equipment
Ensure that agriculture credit and insurance
facilities extend to agriculture equipment
TBD World Development
Indicators

48
EXPECTED OUTPUTS OUTPUT PROXY
INDICATORS BASELINES INTERVENTIONS/ INVESTMENTS TARGETS
VERIFICATION
SOURCES
(FMWR), state
ADPs, CBN, Federal
Ministry of Finance,
Nigerian Customs
Services, FAO,
USAID, World Bank,
International
Development Fund
(IFAD), Bill and
Melinda Gates
Foundation (BMGF)
1.8.4 Increased import levies
and excise duties on
commodities that can be
locally produced
Percent reduction in
commodity
importation
following increase in
levies and duties
TBD
Validate that domestic production has been
significantly increased
Identify level of duties and tariffs that will
prohibit importation of affected commodities
Liaise with Nigerian Customs Services to ensure
that levies and duties are enforced
TBD
Reports from Nigerian
Customs Services
(NCS)
1.8.5 Water resources are
harnessed for sustainable
year-round crop production
Number of multi-use
water systems built TBD
Support construction of roof water harvesting
structures and other multi-use water systems
Identify contextually appropriate irrigation
solutions and facilitate their scale up
Ensure that waivers and credit for mechanized
agriculture extend to irrigation equipment
TBD
Reports from Federal
Ministry of Water
Resources (FMWR),
FMARD
1.8.6 Meaningful extension
services exist for crop
production
Number of farmers
that access extension
services
TBD
Establish a comprehensive expert consultation
platform that includes resources for every aspect
of the production process, including land
clearing, commodity selection, planting,
irrigation, pest management, food safety,
mechanization, harvesting, processing, credit,
etc.
TBD Farmer surveys
Sub-component 1.9 of SO 1: to revive prison farms and agro-allied prison industries
Immediate outcome 1.9 Proxy indicator Baseline Target Verification Source
Increased food availability
Number of additional
tonnes of food
produced from
prison farms
TBD TBD Nigerian Prison
Services
ASSOCIATED OUTPUTS
EXPECTED OUTPUTS OUTPUT PROXY
INDICATORS BASELINES INTERVENTIONS/ INVESTMENTS TARGETS
VERIFICATION
SOURCES
RESPONSIBLE
INSTITUTIONS
1.9.1 Prison farms are
revived/ established for
growing nutrient dense
foods
Number of hectares
of nutrient dense
foods cultivated
through the Nigerian
Prison Services
TBD
Dialogue with Nigerian Prison Services to
commence large/ medium-scale production on
prison farms and market gardens
Identification of a private agro-based
implementing partner companies
Resource mobilization for cultivation of prison
farms
Identification of commodities to be produced
per prison farm/ market garden
Provision of agricultural inputs (tractors and
tractor-driven implements, seeds, fertilizer,
agro-chemicals and veterinary products) for
farm cultivation
Provision of agricultural extension services for
prison farms
All farm centres and
market gardens will
be cultivating 100%
of their arable land,
and farms will
achieve a yield of up
to 4 metric tons of
cereals per hectare
and 35 metric tons of
tubers per hectare,
by 2020
Reports from FMARD
and Nigerian Prison
Services
Inspection visits
reports
FMARD – FDA,
Animal Husbandry,
Fisheries, FISS,
Extension
Nigeria Prison
Service, State ADPs

49
EXPECTED OUTPUTS OUTPUT PROXY
INDICATORS BASELINES INTERVENTIONS/ INVESTMENTS TARGETS
VERIFICATION
SOURCES
RESPONSIBLE
INSTITUTIONS
1.9.2 Prisoners’ agro-based
capacity and skills
developed
Number of prisoners
trained in at least one
aspect of an agricultural
value-chain
TBD
Select prisoners to benefit from agro-based
training, based on severity of crimes and
incarceration time yet to be completed
Conduct baseline assessment to identify existing
skills and abilities
Divide prisoners into groups based on the
particular skills be transferred to each group
(e.g. crop production, animal rearing,
processing, etc.)
Develop training manuals for different skills,
and train prisoners
≥5,000 prison
inmates have their
capacity built in
agro-based skills
Records of the
Nigerian Prison
Services FMARD – FDA,
Animal Husbandry,
Fisheries, FISS,
Extension
Nigeria Prison
Service, State ADPs
1.9.3 Agro-allied prison
industries revived/
developed
Number of additional
functional agro-allied
prison industries
TBD
Dialogue with Nigerian Prison Services to
commence medium-scale agro-allied industries
Identification of the type of industry to be
established, based on raw materials available
from prison farms close by
Identification of private agro-based
implementing partner companies
Resource mobilization and support for the
acquisition of necessary equipment
3 agro-allied,
medium-scale prison
industries revived/
established per year,
commencing from
2018
Inspection visits
reports
Sub-component 1.10 of SO 1: to increase market access for nutrient dense agricultural produce
Immediate Outcome 1.10 Proxy indicator Baseline Target Verification Source
Markets are integrated
across the country
Correlation coefficient
of first differenced price
series of staple foods
TBD
≥0.80 correlation coefficient between all geo-
political zones in the country, for all staple
foods
NBS
ASSOCIATED OUTPUTS
EXPECTED OUTPUTS OUTPUT PROXY
INDICATORS BASELINES INTERVENTIONS/ INVESTMENTS TARGETS
VERIFICATION
SOURCES
RESPONSIBLE
INSTITUTIONS
1.10.1 Increased availability
of facilities and systems that
enable market access
Additional number of
each appropriate
facilities/systems
TBD
Increased establishment of silos, warehouse
receipt systems, commodities exchange boards,
and aggregation centres through public-private
partnerships and tax exemptions/ low interest
financing
TBD FMARD reports FMARD – FSR,
FDA (Nutrition and
Food Safety
Division)
Africa Exchange
Holdings (AFEX)
Commodity
Exchange, Private
Sector Stakeholders,
State ADPs, Farmers
groups and farmer
associations
1.10.2 Access to facilities
and systems are enabled for
smallholder farmers
Percent of smallholder
farmers linked to
facilities/ systems,
disaggregated by gender
TBD
Include list of facilities/ systems, services
offered, and location in information systems
Liaise between smallholder farmers associations
and commodity/ location appropriate
facility/system
TBD
User database of
facilities and systems
1.10.3 Commodity
marketers and distributors
are incentivized to use
facilities/systems
Number of marketers/
distributors that
purchase through
facilities/systems
TBD
Regularly updated online platform where prices,
quality, and available quantities of each
commodity in a facility/system is available.
Contact information, including phone numbers,
of each facility/ system is also provided
TBD Usage records of the
platform

50
Specific Objective (SO) 2: to significantly reduce undernutrition, including micronutrient deficiency disorders, among infants, children,
adolescents, and women of reproductive age
Sub-component 2.1 of SO 2: to reduce postharvest losses for improved nutrition
Immediate outcome 2.1 Proxy indicator Baseline Target Verification Source
Increased availability and
affordability of fruits and
vegetables at markets
Available variety
(number) of fruits and
vegetables all year round
Price of fruits and
vegetables available all
year around
TBD
Stable availability of fruits and vegetables all
year round
Affordable price of fruits and vegetables all
year around
FMARD
Market surveys
ASSOCIATED OUTPUTS
EXPECTED OUTPUTS OUTPUT PROXY
INDICATORS BASELINES INTERVENTIONS/ INVESTMENTS TARGETS
VERIFICATION
SOURCES
RESPONSIBLE
INSTITUTIONS
2.1.1 Backward integration is
increased in the local fruits
and vegetables products
industry
Percentage of local fruits
and vegetables products
companies that source
their raw materials
locally
TBD
Stakeholders’ dialogue with representatives of
local fruits and vegetables products companies to
identify raw material requirements and factors
that will facilitate backward integration
Staffed electronic communication system where
companies can input their raw material needs,
including quality and quantity
Identification of fruits and/or vegetables farmers
associations to meet companies demands
TBD
FMARD reports
Records of electronic
communication system
FMARD – Nutrition
& Food Safety
Division, Food
Strategic Reserve
Department
Financial Institutions
(NIRSAL), Global
Alliance for
Improved Nutrition
(GAIN), Food and
Agriculture
Organisation (FAO),
BMGF, food safety
experts (SON,
NAFDAC), industry
leaders (cold chain,
packaging, crating,
and processing),
research partners
(including FIIRO),
IFAD, World Bank,
Rockefeller
Foundation
2.1.2 Technology for
transformation and
transportation of fruits and
vegetables is available and
affordable for small and
medium enterprises
Number of cold storage
facilities; packaging
solutions established
Number of SMES that
have access to improved
technology
TBD
Research to identify packaging solutions and
other technology to increase shelf-life of fruits
and vegetables, while maintaining nutrient
content
Identification and promotion of crating solutions
for transporting fruits and vegetables
Ensuring that agricultural credit facilities and
equipment waivers extend to the procurement of
cold storage facilities
TBD FMARD

51
Sub-component 2.2 of SO 2: to increase production and processing of animal foods
Immediate outcome 2.2 Proxy indicator Baseline Target Verification Source
Increased affordability of
animal foods
Increased availability of fish,
beef, and dairy products at
retail markets
Decreased price of fish, beef,
and dairy products at retail
markets
TBD
10% increase of availability of animal
source food at retail market level
10% decrease of price of animal
source food at retail market level
NBS (price bulletins)
FMARD
Development partners
through their price
surveillance
mechanisms, FAO,
World Food
Programme-
Vulnerability
Analysis Mapping-
(WFP-VAM),
FEWSNET
ASSOCIATED OUTPUTS
EXPECTED OUTPUTS OUTPUT PROXY
INDICATORS BASELINES INTERVENTIONS / INVESTMENTS TARGETS
VERIFICATION
SOURCES
RESPONSIBLE
INSTITUTIONS
2.2.1 Increased knowledge
generation for animal
production and processing
Number of studies conducted TBD
Identification of the necessary inputs, including
feed and medicines, for rearing locally consumed
animals
Research to identify ways to safely, sustainably,
and efficiently supply feed and water for animal
production
Research local ways to process and package
animal foods into locally consumed products
TBD Study reports
FMARD – Animal
Husbandry and
Fisheries
Departments
FAO, BMGF,
Research Institutes,
World Bank, Private
Sector, NAFDAC,
SON
2.2.2 Increased access to safe
feed, water, and medicines
for animal production
Percentage of animal producers
with constraints in accessing
animal feed, disaggregated by
gender
TBD
Tax holidays for animal feed companies,
contingent on quality, quantity, and reach of feeds
sold
Provision of boreholes at strategic locations in
high animal production livelihood zones
Provision of safe solid and liquid waste disposal
mechanisms
75% reduction Sample surveys of
animal producers
2.2.3 Improved capacity for
animal production and
processing
Number of animal producers
trained, disaggregated by
gender
TBD
Development of a ‘National Guide to Animal
Production and Processing for Food’ that will be
used to train farmers on essential knowledge for
safe, efficient, and sustainable production
Training of extension workers to use the guide,
and cascading of training to animal farmers
TBD Training reports
2.2.4 Increased access to
extension and veterinary
services
Percentage of animal producer
groups/ associations that are
linked to regular extension
services and veterinary services
Percentage of female members
in groups/ associations
TBD
Listing of available animal production extension
and veterinary services by state, specifying
physical location of service providers
Establishment of animal producer associations,
including female members
Linking animal producer associations to closest/
most appropriate extension and veterinary service
TBD Sample surveys

52
EXPECTED OUTPUTS OUTPUT PROXY
INDICATORS BASELINES INTERVENTIONS / INVESTMENTS TARGETS
VERIFICATION
SOURCES
RESPONSIBLE
INSTITUTIONS
2.2.5 Increased access to
credit and machinery for
animal production and
processing
Percentage of animal producers
with access to credit and
mechanized production
Number of additional animal
foods processing companies
TBD
Ensuring that animal producers and processors are
eligible for available credit and insurance facilities
Ensuring that waivers on agricultural equipment
cover equipment for animal production and
processing
Creation of animal food processing zones
(AFPZs) to facilitate sourcing of raw materials an
d marketing/ distribution of finished products
TBD FMARD
Sample surveys
Sub-component 2.3 of SO 2: to implement the Transformative Partnership for High Energy Foods (P4HNF)
Immediate outcome 2.3 Proxy indicator Baseline Target Verification
Source
Increased local production of
ready to use therapeutic and
supplementary foods
Quantity of high energy
nutritious foods produced TBD 100% of local demand
FMARD
FMOH
ASSOCIATED OUTPUTS
EXPECTED OUTPUTS OUTPUT PROXY
INDICATORS BASELINES INTERVENTIONS/ INVESTMENTS TARGETS
VERIFICATION
SOURCES
RESPONSIBLE
INSTITUTIONS
2.3.1 Constraints to the local
production of high energy
nutritious foods in Nigeria
are reduced
Number of companies
producing high energy
nutritious foods
TBD
Identification of the policy, regulatory, market,
and food safety related constraints to the local
production of high energy nutritious foods
Identification of the government agencies that are
necessary to address these constraints
Stakeholders’ fora to agree on and assign actions
to address the constraints
TBD
Reports from
NAFDAC
company
registration/
monitoring
FMARD – Nutrition
& Food Safety
Division,
Extension, Agri-
business
Private Sector
Stakeholders, PCD,
GAIN, UNICEF,
FAO, WFP, NASSI,
Research Institutes,
International
Development
Agencies
2.3.2 Demand for high energy
nutritious foods is increased
Number of persons consuming
high energy nutritious foods,
disaggregated by gender
TBD
Establish structured market incentives for locally
produced therapeutic, supplementary, and
complementary foods by linking these foods with
institutional initiatives such school feeding
programmes, Community Management of Acute
Malnutrition projects, prison feeding programmes,
and related institutions
TBD
Reports of
institutional
initiatives
2.3.3 Farmers’ cooperatives
are linked to key value chains
for P4HNF
Number of farmer associations
linked to supply chain of
P4HNF
TBD
Periodic identification of quantity of each
commodity required for the production of high
energy nutritious foods
Identification of the production capacity of
involved farmer associations
Liaise between farmer associations and companies
to facilitate procurement of commodities
Training and agribusiness development for farmer
associations to supply the quality and quantity
demanded
TBD
FMARD
Reports from
farmers’
associations

53
Sub-component 2.4 of SO 2: to increase coverage of bio-fortified staple crops
Immediate outcome 2.4 Proxy indicator Baseline Target Verification Source
Increased production and
distribution of bio-fortified
crops
Number of farmers producing
bio-fortified crops,
(disaggregated by state and by
gender)
TBD TBD FMARD
ASSOCIATED OUTPUTS
EXPECTED OUTPUTS OUTPUT PROXY
INDICATORS BASELINES INTERVENTIONS/ INVESTMENTS TARGETS
VERIFICATION
SOURCES
RESPONSIBLE
INSTITUTIONS
2.4.1 Bio-fortified crops
already locally introduced
are scaled-up
Number of states where orange
fleshed sweet potato, pro-
vitamin A cassava, yellow
maize, and iron sorghum can be
found in the markets
TBD
Compilation of best practices for the production
and utilization of available varieties of orange
flesh sweet potato, pro-vitamin A cassava, yellow
maize, and iron sorghum
Awareness creation among farmers producing
traditional varieties of crops to promote switch to
bio-fortified varieties
Support for viable seed system
Social mobilization among the public about the
benefits of bio-fortified crops and how to identify
them
36 states and
FCT by 2025 Market surveys
FMARD – FDA,
ARCN, NAERLS
National Centre for
Genetic Resources
and Biotechnology,
ICRISAT,
HarvestPlus, IITA,
CIP, BMGF
2.4.2 Additional bio-fortified
crops are locally introduced
Iron beans and zinc rice are
developed and tested for local
production
TBD
Research to identify local adaptation needs of
internationally available varieties of iron beans,
zinc rice, and other bio-fortified crops
Research to develop contextually appropriate
varieties
Field testing of varieties and adjustments as
necessary
Varietal release
Varieties of iron
beans and zinc
rice are
available for
local scale-up
Reports from
agricultural
research institutes
IITA, HarvestPlus,
National
Agricultural
Research Institutes
(NARIs)
Sub-component 2.5 of SO 2: to facilitate the business-to-business fortification of food around aggregation centres and SCPZs
Immediate outcome 2.5 Proxy indicator Baseline Target Verification Source
Increased fortification of
locally processed foods
Percentage of locally processed
foods that are fortified TBD TBD FMARD

54
ASSOCIATED OUTPUTS
EXPECTED OUTPUTS OUTPUT PROXY
INDICATORS BASELINES INTERVENTIONS/ INVESTMENTS TARGETS
VERIFICATION
SOURCES
RESPONSIBLE
INSTITUTIONS
2.5.1 Regulatory
environment for food
fortification is strengthened
Percentage of food vehicles
covered by existing mandatory
food fortification legislation that
are actually fortified
TBD
Dialogue with processors in staple crops
processing zones (SCPZs) to identify barriers to
food fortification
Advocacy to necessary institutions to reduce
policy and regulatory barriers
Communication of fortification standards,
regulations, and guidelines to processors
Support for the enforcement of fortification
legislation by providing information about food
processors to regulatory agencies
75% increase
Fortification
Assessment
Coverage Tool
(FACT) Survey
FMARD – FDA,
Food Strategic
Reserves,
Agribusiness &
Marketing
Department
Federal Ministry of
Industry, Trade, and
Investment; Private
sector, NAFDAC,
SON, CPC, GAIN,
MI, BMGF
2.5.2 Existing legislation on
fortification covers food
vehicles not presently
covered
Number of additional food
vehicles for which fortification
is mandated
TBD
Identification of foods that are widely processed
in Nigeria, including those process in SCPZs
Identification of widely processed foods that are
already covered by existing fortification
legislation
Dialogue with National Fortification Alliance
(NFA) to promote legislation on additional foods
TBD Reports of NFA
meetings
Sub-component 2.6 of SO 2: to promote homestead gardens
Immediate outcome 2.6 Proxy indicator Baseline Target Verification Source
Increased household access
to micronutrient rich
vegetables
Number of home gardens
established TBD TBD FMARD
ASSOCIATED OUTPUTS
EXPECTED OUTPUTS OUTPUT PROXY
INDICATORS BASELINES INTERVENTIONS/ INVESTMENTS TARGETS
VERIFICATION
SOURCES
RESPONSIBLE
INSTITUTIONS
2.6.1 Production of fruits
and vegetables around
homesteads, especially by
women, is supported
Number of community trainings
on establishing homestead
gardens
Number of female beneficiaries
of trainings
TBD
Development of a national generic manual on
establishing home gardens, which includes
nutrition information
Advocacy to Local Government Chairmen and
Community Heads to facilitate access to land for
homestead gardens
Promotion of the establishment of women groups
Provision of training to women groups
Provision of extension support centres that can
assist households in resolving challenges with
home gardening
TBD FMARD
FMARD – FDA,
Extension, FISS,
Land & Climate
Change Department,
Rural Mobilization
RUWASA, FMWR,
FMWA, NPFS,
state ADPs, NGOs,
CSOs, CBOs

55
EXPECTED OUTPUTS OUTPUT PROXY
INDICATORS BASELINES INTERVENTIONS/ INVESTMENTS TARGETS
VERIFICATION
SOURCES
RESPONSIBLE
INSTITUTIONS
2.6.2 Indigenous vegetables
are promoted Simpson Index TBD
Identification of indigenous vegetables in each
livelihood zone
Research to identify conditions necessary for
growth of indigenous vegetables
Promotion of the growth of indigenous vegetables
in homestead gardens
10% increase
Agricultural
biodiversity
surveys
Household surveys
2.6.3 Increased adoption of
innovative ideas to
homestead gardening and
better management of
natural resources
Number of households with
limited access to land that have
vegetable gardens
TBD
Identification of contextually adaptable
innovations for limited land home gardening, such
as keyhole gardens and raised bed gardens
Piloting of innovations through the establishment
of demonstration plots
Dissemination of technology to households and
training
TBD
Sub-component 2.7 of SO 2: to promote small animal husbandry
Immediate outcome 2.7 Proxy indicator Baseline Target Verification Source
Increased household access
to animal source foods,
especially in rural areas
Number of households
establishing small animal
husbandry
TBD TBD FMARD
ASSOCIATED OUTPUTS
EXPECTED OUTPUTS OUTPUT PROXY
INDICATORS BASELINES INTERVENTIONS/ INVESTMENTS TARGETS
VERIFICATION
SOURCES
RESPONSIBLE
INSTITUTIONS
2.7.1 Mixed farming systems
are promoted
Number of households growing
crops as well as rearing animals TBD
Compile best practices for maximizing the
benefits of combining horticulture with small
animal production, while achieving food safety
Support community-based fish and poultry
hatchery, and goat and sheep breeding services
Conduct community based training on small
animal husbandry
TBD FMARD FMARD –
Livestock, Fisheries,
Veterinary & Pest
Control, Extension,
Rural Mobilization
FMWA, State
ADPs, NGOs, CSOs 2.7.2 Consumption of animal
source foods in producing
households is increased
Ratio of livestock producing
households that consume an
animal source food daily to non-
producing households that do the
same
TBD
Include nutrition messages in animal husbandry
training, emphasizing the importance of daily
consumption of animal source foods
Train households to safely collect and process
eggs and goat milk for household consumption
TBD Household surveys
Sub-component 2.8 of SO 2: to promote school agriculture programmes
Immediate Outcome 2.8 Proxy indicator Baseline Target Verification Source
Access to vegetables and
animal source foods is
increased through the school
system
Percentages of primary and
secondary schools that have a
functional school garden or rear
animals
TBD TBD Federal Ministry of
Education

56
ASSOCIATED OUTPUTS
EXPECTED OUTPUTS OUTPUT PROXY
INDICATORS BASELINES INTERVENTIONS/ INVESTMENTS TARGETS
VERIFICATION
SOURCES
RESPONSIBLE
INSTITUTIONS
2.8.1 Services of agriculture
extension staff are available
to schools
Number of schools that receive
agricultural extension services TBD
Obtain list of primary and secondary schools from
Ministry of Education by LGA and ward
Assign schools to available extension agents in
LGAs
Provide list of extension agents assigned to
schools to the LGA Department of Education,
including contact details of the agents
Through the Ministry of Education, advocate to
schools to establish school gardens in accordance
with the Implementation Guidelines on National
School Health Programme
TBD
FMARD
Ministry of
Education
Federal Ministry of
Education
FMARD – Nutrition
& Food Safety
Division, FDA,
Extension
State ADPs, FMOH,
FAO, NGOs, CSOs
2.8.2 Supply of improved
farm inputs for crop and
animal farming in schools is
promoted
Number of schools receiving
inputs TBD
Advocate to farmers associations and parent-
teachers associations to provide inputs to school
farms in their catchment areas
TBD Federal Ministry of
Education
2.8.3 Operation of young
farmers clubs are supported
Number of young farmers clubs
established TBD
Encourage schools to set up young farmers clubs
Identify farming mentors and role models for the
clubs through local farmers associations
Encourage farmers associations to adopt a club
and motivate children to pursue agricultural
careers
TBD Federal Ministry of
Education
2.8.4 Learning experiences
for successful home
gardening are increased
Number of home gardens
inspired through school gardens TBD
Local, successful school gardens/ farms are used
as a point of reference for establishing home
gardens
School gardens/ farms are used as demonstration
plots for agricultural best practices
Pupils are encouraged to use school gardens/
farms as a models for gardens around their
homestead
TBD Federal Ministry of
Education

57
Specific Objective 3: to prevent chronic nutrition-related non-communicable diseases (NCDs)
Sub-component 3.1 of SO 3: To scale-up the production of vegetables and fruits by smallholder farmers
Immediate outcome 3.1 Proxy indicator Baseline Target Verification Source
Increased consumption of
fruits and vegetables
Percentage of people who
consume fruits and vegetables
everyday
TBD TBD
FMARD
Food Consumption
and Nutrition
surveys
ASSOCIATED OUTPUTS
EXPECTED OUTPUTS OUTPUT PROXY
INDICATORS BASELINES INTERVENTIONS/ INVESTMENTS TARGETS
VERIFICATION
SOURCES
RESPONSIBLE
INSTITUTIONS
3.1.1 Access to inputs,
including improved seeds,
information, and irrigation
is increased for smallholder
fruit and vegetables farmers
Number of smallholder farmers
producing fruits and vegetables TBD
Research to calculate average return on
investment to smallholder farmers who produce
fruits and/or vegetables
Preparation on information brochures for fruit and
vegetable farmers
Provision of starter-packs and extension services
for fruits and vegetable farming
TBD FMARD
FMARD – FDA,
Horticulture,
Extension, FISS,
NIHORT
Universities, NGOs,
CBOs, Federal
Ministries of
Education; Labour
& Productivity; and
Health; and
Nigerian Prison
Services
3.1.2 Demand driven
production is supported
through the use of
institutional markets
Number of institutions where
fruits and vegetables can be
regularly accessed
TBD
Promote the inclusion of fruits and vegetables in
institutional markets such as schools, hospitals,
and prison feeding programmes
Advocate to workplaces to include fruit/vegetable
kiosks or vending in cafeterias, restaurants, or
dining halls
Link institutional markets with fruits and
vegetables farmers associations
TBD Institutional
surveys
Specific Objective 4: To increase the knowledge of nutrition among the populace and integrate nutrition education into agricultural formal and
informal trainings
Sub-component 4.1 of SO 4: to sponsor the National Food Consumption and Nutrition Survey (NFCNS)
Immediate outcome 4.1 Proxy indicator Baseline Target Verification
Source
Information to guide the
content and design of
nutrition interventions,
including nutrition
education, is provided
Policy brief based on the results
of the NFCNS that highlight the
implications of the results for
nutrition education interventions
No policy brief available
Policy brief developed and disseminated
within two weeks of the release of
NFCNS results
MB&NP
FMARD
FMOH

58
ASSOCIATED OUTPUTS
EXPECTED OUTPUTS OUTPUT PROXY
INDICATORS BASELINES INTERVENTIONS/ INVESTMENTS TARGETS
VERIFICATION
SOURCES
RESPONSIBLE
INSTITUTIONS
4.1.1 Survey is designed Report of survey design No survey
design
Convening of stakeholders to identify appropriate
sampling, indicators, data collection, and
instruments for conducting the NFCNS
Compiling information into a survey design
Validation of the survey design
Standardized
survey design
with multi-
stakeholder
partnerships
NBS reports
FMARD reports
FMARD – ARCN,
Nutrition & Food
Safety Division
National Bureau of
Statistics,
Development
Partners,
Universities
4.1.2 Data collectors,
supervisors, and monitors
are trained
Number of data collectors,
supervisors, and monitors
trained
Zero people
trained
Determination of the numbers of data collectors,
supervisors, and monitors necessary and
modalities of training
Identification of suitable and competent persons to
perform these roles
Designing training materials
Conducting and cascading training
TBD Training reports
4.1.3 Data is collected,
cleaned, and analysed Existence of NFCNS data set No data set
Community mobilization
Operationalizing the survey design and collecting
data
Cleaning the data and addressing inconsistent
entries
Data analysis and tables generation
Publicly
available, cleaned
data set with
standard
indicators and
recode manual
NBS reports
4.1.4 Data is translated into
easily understood
information
Existence of survey report No survey
report
Tables are merged and synthesized into intuitive
versions
Narratives are written around tables
Charts and graphs are drawn to
simplify/emphasize important information
A comprehensive
survey report
with an executive
summary, that
presents the
findings of the
survey in a
concise and
engaging manner
NBS
Sub-component 4.2 of SO 4: to develop crop varieties with enhanced nutritional attributes
Immediate outcome 4.2 Proxy indicator Baseline Target Verification
Source
Increased number of
nutrient dense crops
Number of crop varieties
developed TBD TBD NARIs
ASSOCIATED OUTPUTS
EXPECTED OUTPUTS OUTPUT PROXY
INDICATORS BASELINES INTERVENTIONS / INVESTMENTS TARGETS
VERIFICATION
SOURCES
RESPONSIBLE
INSTITUTIONS
4.2.1 Research to achieve
desired traits in local crops
is conducted
Number of studies conducted
to enhance the nutrient
content of crop varieties
TBD
Identification of crops to enhance
Determining which of several desired traits
(increased nutrient content, decreased anti-
nutrients, increased ease of preparation, and/or
improved food safety) to target in each crop
Literature review and research on methods of
achieving desired traits
Plant breeding to achieve the desired traits
TBD Study reports
FMARD –
ARCN, NARIs
Universities, IITA,
HarvestPlus,
National
Biotechnology
Development
Agency

59
EXPECTED OUTPUTS OUTPUT PROXY
INDICATORS BASELINES INTERVENTIONS / INVESTMENTS TARGETS
VERIFICATION
SOURCES
RESPONSIBLE
INSTITUTIONS
4.2.2 Developed crop
varieties is field-tested
Number of farmers planting
new crop varieties for a trial TBD
Identification and selection of farmers to field test the
production of new crop varieties
Support to identified farmers to plant new varieties
and keep track of certain key performance indicators
Monitoring of test fields and farmer experiences with
new varieties
Laboratory tests on harvests from new varieties to
ensure that enhanced nutritional attributes are retained
in real world setting
TBD
Reports from
NARIs
Ad hoc surveys FMARD –
ARCN, NARIs
Universities, IITA,
HarvestPlus,
National
Biotechnology
Development
Agency 4.2.3 Promotion and
dissemination of successfully
nutritionally enhanced new
crop varieties
Number of hectares of new
crop varieties planted
Number of farmers who have
switched from traditional to
enhanced crop varieties
TBD
Inclusion of new crop seeds in national seeds system
Identification and selection of seed producers
Campaigns to farmers to promote new crop varieties,
citing the advantages over other varieties and show
casing farmers who successfully tried new varieties
and their testimonies
Support to farmers to replace base crop varieties with
new varieties
TBD
Campaign reports
Ad hoc farmer
surveys
Sub-component 4.3 of SO 4: to develop food products with improved nutritional attributes
Immediate outcome 4.3 Proxy indicator Baseline Target Verification
Source
Increased number of
nutritious food products
Number of new food
products with enhanced
nutrition attributes developed
TBD TBD
NAFDAC
product
registration
reports
ASSOCIATED OUTPUTS
EXPECTED OUTPUTS OUTPUT PROXY
INDICATORS BASELINES INTERVENTIONS/ INVESTMENTS TARGETS
VERIFICATION
SOURCES
RESPONSIBLE
INSTITUTIONS
4.3.1 Research to achieve
desired properties in new
food products
Number of studies conducted
to improve the nutritional
attributes of processed foods
TBD
Identification of foods to improve
Determining which of several desired properties
(increased nutrient content, decreased anti-nutrients,
increased ease of preparation, and/or improved food
safety) can be achieved through processing in each food
Literature review and research on improved processing
techniques that can achieve desired properties
Development of technologies to produce the improved
food products
Tests to determine palatability and acceptance of
organoleptic properties of developed food products; and
refinement where necessary
TBD Study reports
FIIRO
FMARD – FDA,
Animal
Husbandry,
Fisheries,
Extension,
NARIs
State ADPs,
GAIN, Private
Sector
Stakeholders,
SON, NAFDAC,
CPC
4.3.2 Production of new food
products are increased
Number of enterprises
producing new food products TBD
Product marketing to small and medium scale
enterprises to adopt technologies and techniques of
improved food products
Advertisement to stimulate public demand of new food
products
TBD NAFDAC product
registration reports

60
Sub-component 4.4 of SO 4: to conduct assessments to guide implementation of entry points in the FSN Strategy
Immediate outcome 4.4 Proxy indicator Baseline Target Verification
Source
Contextualized knowledge
to inform the
operationalization of the
AFSN Strategy
Number of relevant
stakeholders aware of the
Strategy
TBD TBD FMARD
ASSOCIATED OUTPUTS
EXPECTED OUTPUTS OUTPUT PROXY
INDICATORS BASELINES INTERVENTIONS/ INVESTMENTS TARGETS
VERIFICATION
SOURCES
RESPONSIBLE
INSTITUTIONS
4.4.1 Population groups with
the greatest potential-to-
benefit are the targets of
each Strategy sub-
component
Number of Strategy related
interventions that are
preceded by a pre-
assessment
TBD
Promotion of mini-studies prior to the implementation
of any sub-component, to identify locations most
affected by the sub-component, and to select target
beneficiaries within these locations
Technical assistance and support for conduct of studies
Support for rapid analysis of study data, interpretation,
and implications for sub-component implementation
TBD Ad hoc surveys FMARD –
ARCN, NARIs
FAO, GAIN,
BMGF, IFPRI,
DFID, USAID,
CRS, ACF, SCI,
FEWS NET
4.4.2 Implementation
modalities for the sub-
components in the Strategy
are context specific and
sensitive
Number of Strategy related
interventions that involved
community participation in
the planning stage
TBD
Promote community mobilization for interventions
during the planning phase
Engage communities to discuss the intervention being
planned, its benefits, and the importance of taking
specified steps to ensure that community nutrition is also
improved
Record reactions of communities and integrate their
suggestions into sub-component implementation plan
TBD Ad hoc surveys
Sub-component 4.5 of SO 4: to promote the production and consumption of diverse diet
Immediate outcome 4.5 Proxy indicator Baseline Target Verification
Source
All production activities are
complemented with
nutrition education
messages that promote a
diverse diet
Number of Strategy related
interventions that incorporate
nutrition education
TBD TBD FMARD
ASSOCIATED OUTPUTS
EXPECTED OUTPUTS OUTPUT PROXY
INDICATORS BASELINES INTERVENTIONS/ INVESTMENTS TARGETS
VERIFICATION
SOURCES
RESPONSIBLE
INSTITUTIONS
4.5.1 All new agricultural
production/processing
guidelines and training
manuals include nutrition
messages
Number of
production/processing
manuals and guidelines with
nutrition messages
TBD
Advocacy within FMARD to ensure that all crop and
animal value chains realize the importance of including
nutrition in their manuals and trainings
Support to each crop/animal value chain to compile
crop/animal specific nutrition information
Support to value chains to prepare easily understood
messages around nutrition information
TBD
Manuals and
training reports of
value chains
FMARD –
Nutrition & Food
Safety Division
State ADPs,
FME, FMI,
NAFDAC, SON,
CPC

61
EXPECTED OUTPUTS OUTPUT PROXY
INDICATORS BASELINES INTERVENTIONS/ INVESTMENTS TARGETS
VERIFICATION
SOURCES
RESPONSIBLE
INSTITUTIONS
4.5.2 Resources for nutrition
education within the
agricultural sector are
mobilized
Amount of Naira budgeted
for and spent on nutrition
education within agricultural
sector interventions
TBD
Promote an emphases on nutrition within value chain
interventions, to stimulate social demand for products
Support value chains to prepare brochures on products,
including messages on the nutritional/health benefits of
consuming products
Support value chains to disseminate these brochures as
an integral part of all interventions
TBD FMARD reports
Sub-component 4.6 of SO 4: to advocate for the legislation and regulation of nutrition labelling on packaged food products
Immediate outcome 4.6 Proxy indicator Baseline Target Verification
Source
Packaged foods have labels
that include nutrition
information
Percentage of
packaged foods that
have a label with
nutrition information
TBD TBD CPC reports
ASSOCIATED OUTPUTS
EXPECTED OUTPUTS OUTPUT PROXY
INDICATORS BASELINES INTERVENTIONS/ INVESTMENTS TARGETS
VERIFICATION
SOURCES
RESPONSIBLE
INSTITUTIONS
4.6.1 Standards for
nutrition labels are ratified
Existence of local
standards for
nutrition labels
TBD
Discussions with stakeholders, including NAFDAC, SON,
FMOH, and private sector to criteria for appropriate
standards for nutrition labels in Nigeria
Setting of standards on nutrition labels for packaged foods
Establishment of penalties for non-compliance with label
standards
Ensuring that standards are endorsed and legislated
Multi-
stakeholder
agreed
standards
SON
FMARD –
Nutrition & Food
Safety Division
NAFDAC, SON,
FMOH
Ministry of
Information,
NIFST, Food
Manufacturer’s
Association,
Universities/
NARIs
4.6.2 Guidelines for label
regulation are published
Existence of
regulatory guidelines
for monitoring
nutrition labels
TBD
Support to regulatory agencies to communicate nutrition
labels standards and penalties to food products
manufacturing companies
Identification of guidelines for label regulation including
standard operating procedures (SOPs) for label monitoring at
factory, distribution, and retail levels
Label monitoring and regulation is integrated into routine
monitoring activities of SON and NAFDAC
Nutrition labelling is enforced by penalizing repeated non-
compliers
SOPs for SON
and NAFDAC
routine
monitoring
activities
include
guidelines for
label
monitoring and
regulation
SON and NAFDAC
routine monitoring
forms
Sub-component 4.7 of SO 4: to produce and disseminate food-based dietary guidelines
Immediate outcome 4.7 Proxy indicator Baseline Target Verification
Source
The populace know about
Nigeria’s food based
dietary guidelines
Percentage of the
population 6 – 49
years old that are
aware of local food-
based dietary
guidelines
TBD ≥75% Nutrition KAP
surveys

62
ASSOCIATED OUTPUTS
EXPECTED OUTPUTS OUTPUT PROXY
INDICATORS BASELINES INTERVENTIONS/ INVESTMENTS TARGETS
VERIFICATION
SOURCES
RESPONSIBLE
INSTITUTION
S
4.7.1 Nigeria’s food-based
dietary guidelines are
established
Existence of
published dietary
guidelines
Dietary guidelines
are inadequate and
outdated
Compilation of contextually appropriate recommended
dietary allowances/ dietary reference intakes
Grouping of all foods eaten locally into food groups, based
on similarities in nutrient composition
Estimation of amount for one serving of each food group,
based on body’s nutrient requirements and food group’s
nutrient content
Determination of range of servings to be consumed for each
food group daily, to meet nutritional needs but not exceed
them
Compilation of information into a National Food-Based
Dietary Guidelines, using contextually appropriate, easy to
understand language
Comprehensive
food based
dietary
guidelines that
take into
account daily
nutrient
requirements
for different
age groups and
physiologic
statuses; and
how to meet
these
requirements
through the diet
Minutes of meetings
held to establish
dietary guidelines
FMARD–
Nutrition & Food
Safety Division
FMOH, State
MDAs, Relevant
Professional
Associations,
SMEs, FIIRO,
Research
Institutes, NGOs,
CBOs,
Development
Partners
4.7.2 Food based dietary
guidelines are disseminated
Number of copies of
food-based dietary
guidelines distributed
TBD
Translation of dietary guidelines into major local languages,
including pidgin English
Production of at least 100,000 copies of the guidelines, with
numbers of copies assigned to different languages based on
population of language readers
Production and distribution of summary guideline posters to
be displayed in places of food consumption such as
restaurants, cafeterias, etc.
Dissemination of copies to different states by identifying a
focal point for dissemination and most popularly read
languages in the state
Supporting state focal points for dissemination to publicise
and distribute copies in local institutions
TBD
Reports from the
Nutrition & Food
Safety Division at
FMARD
Sub-component 4.8 of SO 4: to ensure that schools, workplaces and homes offer healthier meals
Immediate outcome 4.8 Proxy indicator Baseline Target Verification
Source
People are able to prepare
meals that meet the
national dietary guidelines
Percentage of the
population who
report knowing and
being able to prepare
meals that meet the
dietary guidelines
TBD TBD Nutrition KAP
surveys

63
ASSOCIATED OUTPUTS
EXPECTED OUTPUTS OUTPUT PROXY
INDICATORS BASELINES INTERVENTIONS/ INVESTMENTS TARGETS
VERIFICATION
SOURCES
RESPONSIBLE
INSTITUTIONS
4.8.1 Tasty recipes based
on national food-based
dietary guidelines are
developed
Number of recipes
developed and
analysed for
contribution of daily
nutrient requirements
TBD
Compilation and standardization of recipes commonly eaten
across the country
Analyses of recipes to determine nutrient content and
contributions to daily nutrient requirements
Estimation of amount for one serving of each recipe
Compilation of information into a recipe book using contextually
appropriate measurements and language
Recipe book
which includes
standardized
commonly
consumed
recipes across
the country
Reports from
FMARD Nutrition
& Food Safety
Division FMARD –
Nutrition & Food
Safety Division
FMOH,FME,
Federal Ministry of
Labour &
Productivity, FMI,
State Partners,
FIIRO, Nutrition
Society of Nigeria,
NIFST, Int.
Development
Partners
4.8.2 Opportunities are
created for people to taste
and accept recipes
Number of schools,
workplaces, and
restaurants using
recipes to prepare
meals
TBD
Campaigns to publicise recipes and their role in supporting people
to achieve dietary guidelines
Dissemination of recipes to restaurants, schools and workplaces
Support for integration of recipes into school feeding and
workplace menus
Certification of restaurants that serve meals that are based on the
recipe book
TBD
National Food
Consumption and
Nutrition Surveys
(NFCNS)
Ad hoc surveys
4.8.3 People’s capacity are
built to prepare recipes at
home
Percentage of
population who use
recipes in their
homes
TBD
Recipe book is translated into major local languages, including
pidgin English
Recipe book is distributed to libraries and booksellers across the
country
Recipe book is made freely available for consultation in primary
health care centres, hospitals, and schools
Support for the use of recipe book in food demonstration sessions
in primary health care centres and schools, including training of
health workers and teachers
Monthly publicized television programme that demonstrates the
preparation of the meals in the recipe book
TBD
Nutrition KAP
surveys
NFCNS
Sub-component 4.9 of SO 4: to promote positive attitudes and behavioural change for improved nutrition
Immediate outcome 4.9 Proxy indicator Baseline Target Verification
Source
The populace are aware of
the importance of good
nutrition and practices that
contribute to good
nutrition
Percentage of 15 –
49 years old who are
able to correctly state
the most appropriate
way to feed a child 0
– 6 months old
TBD TBD Nutrition KAP
surveys
ASSOCIATED OUTPUTS
EXPECTED OUTPUTS OUTPUT PROXY
INDICATORS BASELINES INTERVENTIONS/ INVESTMENTS TARGETS
VERIFICATION
SOURCES
RESPONSIBLE
INSTITUTIONS
4.9.1 Nutrition sensitization
messages are developed
Number of messages
developed TBD
Contextually appropriate, easy to understand messages that
promote good dietary practices, health, sanitation, and hygiene at
household and community levels and schools are developed using
a multi-stakeholder participatory process
Messages are translated into major local languages, including
pidgin English
TBD
Minutes of
stakeholder
meetings to
develop messages
FMARD
Federal Ministry of
Information, FME,
FMOH, NGOs,

64
EXPECTED OUTPUTS OUTPUT PROXY
INDICATORS BASELINES INTERVENTIONS/ INVESTMENTS TARGETS
VERIFICATION
SOURCES
Development
Partners,
Professional
Associations 4.9.2 Leaflets and radio
programmes are designed
around messages
Number of leaflets
distributed
Number of radio
programmes aired
TBD
Messages are edited into leaflet format, including appropriate
graphics and are distributed across the country
Scripts are developed around messages for broadcast, and a
weekly family radio programme "Eating well for a healthy life" is
launched
TBD FMARD reports
Specific Objective 5: To strengthen systems that build resilience for improved food and nutrition situation
Sub-component 5.1 of SO 5: to support landless agrarian community households to establish small-scale agro-processing businesses
Immediate outcome 5.1 Proxy indicator Baseline Target Verification
Source
Landless agrarian
community households
have increased income
Percentage of
landless agrarian
community
households with
productive assets
TBD TBD
Food Security and
Vulnerability
Surveys
ASSOCIATED OUTPUTS
EXPECTED OUTPUTS OUTPUT PROXY
INDICATORS BASELINES INTERVENTIONS/ INVESTMENTS TARGETS
VERIFICATION
SOURCES
RESPONSIBLE
INSTITUTIONS
5.1.1 Income earning
capacity of landless
households in agrarian
communities is increased
Number of eligible
households that
receive income
generation
assistance
TBD
Identification of eligible households in regions
most vulnerable to malnutrition
Provision of starter packs and trainings for
threshing, milling, grinding or other processing
activities
TBD Food Security and
Vulnerability Surveys
FMARD –
Extension,
Agribusiness
State ADPs, NARIs,
IFPRI, NAERLS,
NPFS, development
partners, NGOs,
CBOs, FBOs
5.1.2 Market access is
increased for beneficiary
households
Number of
households
receiving assistance
that are able to
sustain income
generating activities
TBD
Support for beneficiary households to
successfully establish business and attract
customers
Support for the establishment of cooperatives
and savings and loans scheme so that
beneficiaries can expand business
TBD Ad hoc baseline, mid-
term and end-line surveys

65
Sub-component 5.2: to support smallholder farmers to diversify and sustain livelihoods
Immediate outcome 5.2 Proxy indicator Baseline Target Verification
Source
Smallholder farmers have
increased incomes, food
security and nutrition
Percentage of
smallholder farmers
that experience little
to no hunger
TBD TBD
Food Security and
Vulnerability
Surveys
ASSOCIATED OUTPUTS
EXPECTED OUTPUTS OUTPUT PROXY
INDICATORS BASELINES INTERVENTIONS / INVESTMENTS TARGETS
VERIFICATION
SOURCES
RESPONSIBLE
INSTITUTIONS
5.2.1 Capacity of
smallholder farmers to
engage in additional
agricultural activities is
increased
Number of
smallholder farmers
assisted to diversity
production
Volume of inputs
distributed
TBD
Identification of suitable mixed cropping or
mixed farming systems for intervention
livelihood zone
Training for smallholder farmers to increase the
types, quantity, and quality of crops and/or
livestock produced
Increasing access of smallholder farmers to
necessary inputs
TBD Training reports
FMARD –
Extension, FDA,
Animal husbandry,
Fisheries
State ADPs, NARIs,
IFPRI, NAERLS,
NPFS, development
partners, NGOs,
CBOs, FBOs
5.2.2 Smallholder farmers
are linked with
institutional markets
Number of
smallholder farmers
that are linked to
school feeding
programmes
TBD
Creating regulatory frameworks to ensure food
procurement from smallholder farmers for
school feeding programmes and other
institutional markets
Identifying and removing entry barriers to the
participation of smallholder farmers in school
feeding programmes
TBD Reports from FMARD
FMARD – FDA,
FSR, Animal
Husbandry,
Fisheries,
State ADPs, LGAs,
NGOs, CBOs,
School PTAs,
Private Sector
Stakeholders
5.2.3 Access to credit for
smallholder farmers is
facilitated
Number of
smallholder farmers
that receive credit
TBD
Organizing smallholder farmers into
cooperatives
Using participatory mechanisms to establish
innovative cooperative bylaws that hold
members accountable for loans taken and reduce
risk of defaulting
Link the cooperatives to microcredit facilities
TBD Reports from RUFIN
FMARD – FDA,
RUFIN
State ADPs, LGAs,
Microfinance
Banks, Private
Sector Stakeholders,
IFAD
5.2.4 Insurance services are
extended to smallholder
farmers
Number of
smallholder farmers
with insurance
coverage
TBD
Research the experiences of other countries to
identify insurance structure for smallholder
farmers
Conduct willingness-to-pay studies to establish
insurance premiums and modalities for collection
Promote insurance services through produce
cooperatives
TBD Reports from NAIC
FMARD – FDA,
RUFIN, NAIC
State ADPs, LGAs,
Private Sector
Stakeholders, IFAD

66
Specific Objective 6: to incorporate food and nutrition considerations into the Federal, State and Local Government agricultural sector
development plans
Sub-component 6.1 of SO 6: to strengthen the planning and managerial capacity of federal, state, and LGA nutrition focal persons within the agricultural sector
Immediate outcome 6.1 Proxy indicator Baseline Target Verification
Source
The ability of the agricultural
sector to track the nutrition-
sensitivity of actions is
increased
Number of nutrition
focal points within
federal, state, and
LGA MDAs
(disaggregated by
gender)
TBD
At least 1 nutrition focal point in each office of
the Ministry of Agriculture (at state and
decentralised level)
FMARD
ASSOCIATED OUTPUTS
EXPECTED OUTPUTS OUTPUT PROXY
INDICATORS BASELINES INTERVENTIONS/ INVESTMENTS TARGETS
VERIFICATION
SOURCES
RESPONSIBLE
INSTITUTIONS
6.1.1 Agricultural sector state
and LGA MDAs are
sensitized to appoint
nutrition focal points
Number of states and
LGAs sensitized 0
Staggered inclusion of key decision makers
from state MARDs and state ADPs in
federal level nutrition events within the
agricultural sector
Advocacy for the appointment of state and
LGA nutrition focal points at these events
At least 1 nutrition
focal point from
the FMARD
should attend
nutrition events
Attendance list at nutrition
events within the
agricultural sector
FMARD –
Nutrition & Food
Safety Division
State ADPs,
FMOH, FADAMA
III, Nutrition
Society of Nigeria,
FAO, development
partners
6.1.2 The capacity of
nutrition focal points is
periodically increased
Number of trainings
held for agricultural
sector nutrition focal
points
Number of nutrition
focal points trained
0
Development of training materials for
nutrition focal points within the agricultural
sector
Identification of appointed nutrition focal
points at federal, state, and LGA levels
Staggered training and re-training of
nutrition focal points
≥ 1 training a year
in each state
All nutrition focal
points trained in
raising nutrition
issues/ year
Training reports
Sub-component 6.2 of SO 6: to build the capacity for federal, state, and LGA agricultural extension personnel to integrate nutrition into activities
Immediate outcome 6.2 Proxy indicator Baseline Target Verification
Source
Extension agents are able to
effectively deliver nutrition
education and implement the
principles of nutrition-
sensitive agriculture
Percentage of
extension agents
trained
TBD
≥ 50% increase in the number of extension
workers with proven capacity to implement
nutrition-sensitive principles in agriculture
FMARD,
Department of
Agricultural
Extension

67
ASSOCIATED OUTPUTS
EXPECTED OUTPUTS OUTPUT PROXY
INDICATORS BASELINES INTERVENTIONS / INVESTMENTS TARGETS
VERIFICATION
SOURCES
RESPONSIBLE
INSTITUTIONS
6.2.1 Agricultural extension
agents/officers are intensively
trained on nutrition and
nutrition-sensitive
agriculture
Number of trainings
conducted
Number of extension
agents trained,
disaggregated by
gender
TBD
Development of facilitators’ and
participants’ manual for training
agricultural extension agents on nutrition,
covering issues related to nutrition; food
security and food safety; behaviour change
communication; and activities related to the
implementation of the sub-components in
the AFSN Strategy
Listing of agricultural extension agents by
state and LGA
Staggered training of extension agents
≥75% of extension
agents/officers Training reports
FMARD –
Extension, FDA
(Nutrition & Food
Safety)
State ADPs, LGAs
6.2.2 Referral systems are
established for issues which
the agents are unable to
address
Extension agents
possess protocol for
referring clients for
more specialized
nutritional care
0
For each LGA, mapping of nutrition related
institutions and compilation of nutrition
services provided
Developing a decision making flow chart
for identifying individuals that need to be
referred to receive certain services, and
where to refer them to
Providing LGA-specific mapping of
institutions and services, and decision
making flow charts to extension agents
At least 50% of the
issues that
extension agents
are unable to
answer to are
answered through
the referral system
FMARD reports
Sub-component 6.3 of SO 6: to upgrade the Nutrition and Food Safety Division of FMARD into a Directorate
Immediate outcome 6.3 Proxy indicator Baseline Target Verification
Source
Increased capacity of
FMARD to advocate and
mobilise resources for
nutrition
Increase in the
resources mobilised
for nutrition
FMARD has a Nutrition and Food Safety Division headed by a
Deputy Director
A full-fledged Directorate of Nutrition and Food
Safety, with commensurate involvement in
ministerial decision making and distinct
budgetary allocations
FMARD reports
ASSOCIATED OUTPUTS
EXPECTED OUTPUTS OUTPUT PROXY
INDICATORS BASELINES INTERVENTIONS/ INVESTMENTS TARGETS
VERIFICATION
SOURCES
RESPONSIBLE
INSTITUTIONS
6.3.1 The structure of a
Nutrition Directorate within
FMARD is established
Existence of an
organogram for a
Nutrition Division
within FMARD
0
Identification of the necessary divisions and
units that will need to be included in the
Nutrition Directorate, and the specific roles
and actions these divisions and units will
perform
Identification of the expected relationships
among the divisions and units in the
Nutrition Directorate, and with other
Directorates in the Ministry
An available
organogram
Reports from FMARD
Nutrition & Food Safety
Division
FMARD
Office of the Head
of Service of The
Federation

68
EXPECTED OUTPUTS OUTPUT PROXY
INDICATORS BASELINES INTERVENTIONS/ INVESTMENTS TARGETS
VERIFICATION
SOURCES
RESPONSIBLE
INSTITUTIONS
6.3.2 The proposal for a
Nutrition Department within
FMARD receives high level
support
The Minister or
Permanent Secretary
of FMARD formally
support the creation of
a Nutrition Directorate
0
Development of a proposal that highlights
the need for a Nutrition Directorate within
FMARD, the roles that this Directorate is
anticipated to perform, the benefits to the
Ministry and to Nigeria, and the reasons
why these roles cannot be effectively
performed as a Division
Advocacy at the executive and legislative
levels for the creation of this Directorate/
Department
Establishment of
the nutrition
department with
FMARD reports
FMARD
Office of the Head
of Service of The
Federation
Sub-component 6.4 of SO 6: to facilitate the integration of nutrition into the agricultural curriculum of tertiary institutions
Immediate outcome 6.4 Proxy indicator Baseline Target Verification
Source
Agriculture graduates from
Nigerian Universities have
basic nutrition knowledge
and understand the role of
agriculture in improving
nutrition
Percentage of
agriculture graduates
who take at least one
nutrition course as part
of their training
TBD 100% FME
ASSOCIATED OUTPUTS
EXPECTED OUTPUTS OUTPUT PROXY
INDICATORS BASELINES INTERVENTIONS/ INVESTMENTS TARGETS
VERIFICATION
SOURCES
RESPONSIBLE
INSTITUTIONS
6.4.1 The nutrition content
for agricultural training in
tertiary institutions is
developed
Existence of a syllabus
for nutrition within
agricultural training
0
Discussions among stakeholders to identify
the nutrition knowledge that would be
important for students in agricultural
training
Development of this content into a modular
format, including identifying the sequence
of modules
Training material
developed/adapted FME
FME, FMARD –
Agricultural
Research Council
of Nigeria
Nutrition Society
of Nigeria,
Relevant federal/
state universities,
NUC, FAO,
IFPRI, MBNP,
FMOH, FME,
FMF, other
relevant MDAs
6.4.2 Nutrition content is
integrated into existing
national agricultural
curricula
Updated agricultural
curricula is published 0
Discussions with NUC about updating the
agricultural curricula to include identified
modules
Review of existing agricultural curricula to
identify appropriate entry points for
nutrition modules and or most suitable
point in training to undertake full nutrition
course
TBD NUC
6.4.3 Updated agricultural
curricula is promoted in
tertiary institutions
Number of agriculture
training institutions
that adopt updated
curricula
0
Distribution of updated curricula to
agriculture departments in universities and
other tertiary training institutions
Support for the adoption and
implementation of the curricula is provided
through the Nutrition Society of Nigeria
TBD NUC

69
Sub-component 6.5 of SO 6: to build national capacity to construct, maintain, and repair technologies for the implementation of the AFSN Strategy
Immediate outcome 6.5 Proxy indicator Baseline Target Verification
Source
Communities are able to
sustain the use of
technologies that support
improved nutrition
Percentage of
intervention
communities that have
local capacity to
maintain introduced
technologies
TBD 100%
Ad hoc baseline,
mid-term and end-
line surveys
ASSOCIATED OUTPUTS
EXPECTED OUTPUTS OUTPUT PROXY
INDICATORS BASELINES INTERVENTIONS/ INVESTMENTS TARGETS
VERIFICATION
SOURCES
RESPONSIBLE
INSTITUTIONS
6.5.1 Technologies that can
be locally constructed and/or
maintained are identified
List of technologies
related to the ASFSNS
that can be locally
constructed/maintained
TBD
Assessment of technologies necessary for
the implementation of the sub-components
of the AFSN Strategy, and identification of
those that can be locally constructed/
maintained. (Technologies can include roof
water harvesting structures or other multi-
use water system structures; improved
drying, storage, or other processing
techniques)
Identification of construction/ maintenance
materials, and determination of availability
of these materials across the country
Specification of LGAs across the country in
which each technology can be constructed/
maintained, given identified constraints,
such as those in accessing materials
LGA-specific list
of technologies
that can be
contextually
constructed/
maintained
FMARD reports
FMARD –
Mechanization,
Agribusiness
State ADPs,
Private Sector
Stakeholders
6.5.2 Community artisans
and masons are trained to
construct and maintain
AFSN Strategy-related
technologies
Number of artisans
and masons trained TBD
Development of training materials for the
construction/repair/maintenance of each
applicable technology
Identification of trainees for each feasible
technology in interventions LGAs (based
on LGA list of feasible technologies)
Training of artisans
Support to establish viable business around
the technologies, including facilitating
access to potential clients
TBD FMARD reports

70
Sub-component 6.6 of SO 6: to establish a comprehensive M&E Framework for the AFSN Strategy
Immediate outcome 6.6 Proxy indicator Baseline Target Verification
Source
The AFSN Strategy is
systematically implemented
and achieved
Number of FMARD
MDAs that consider
the objectives,
outcomes, and outputs
of the ASFSNS in
conducting their
activities
Zero MDAs TBD FMARD
ASSOCIATED OUTPUTS
EXPECTED OUTPUTS OUTPUT PROXY
INDICATORS BASELINES INTERVENTIONS/ INVESTMENTS TARGETS
VERIFICATION
SOURCES
RESPONSIBLE
INSTITUTIONS
6.6.1 Activity framework for
the AFSN Strategy is
elaborated
Completed activity
framework
No activity
framework for the
AFSN Strategy is
available
Expansion of the entry points for achieving
the expected ASFSNS intermediate results
into outputs and activities
Identifying the organizations responsible
for implementing these outputs and
activities and the expected timeline
A complete
framework of
activities for the
ASFSNS Strategy
is available
Draft AFNS Strategy
document
FMARD –
Planning & Policy
Coordination
Department
FMOH, FME,
NGOs, CBOs,
private sector,
GAIN,
development
partners
6.6.2 M&E framework is
drafted
Draft M&E framework
document
No draft M&E
framework
Using a participatory process, activity
framework is translated into an M&E
framework, including intermediate and
immediate outcome indicators, output
indicators, baselines and targets, and data
verification sources
A complete
framework that is
aligned with the
ASFSNS activity
framework
FMARD
6.6.3 M&E framework is
validated
Dissemination of
M&E framework for
use by MDAs and
other stakeholders
No awareness exist
regarding the M&E
framework
Multisectoral stakeholder workshop to
review the M&E framework vis-à-vis the
AFSN Strategy, and identification of gaps
and ambiguities
Incorporation of stakeholder comments and
feedback into draft M&E framework
Publishing and dissemination of finalized
M&E framework
At a least a
validation
workshop for the
validation and
dissemination of
the strategy
FMARD
Sub-component 6.7 of SO 6: to obtain regular information about the food and nutrition situation of different LGAs and states
Immediate outcome 6.7 Proxy indicator Baseline Target Verification
Source
The implementation of the
AFSN Strategy is able to
prioritize LGAs most
vulnerable to malnutrition
Number of LGAs and
states for which there
is updated food and
nutrition situation
information
TBD TBD FMARD

71
ASSOCIATED OUTPUTS
EXPECTED OUTPUTS OUTPUT PROXY
INDICATORS BASELINES INTERVENTIONS/ INVESTMENTS TARGETS
VERIFICATION
SOURCES
RESPONSIBLE
INSTITUTIONS
6.7.1 Available state and
LGA food and nutrition
situation is mapped
A table exists that
summarizes the food
and nutrition situation
in each state and LGA
TBD
Compilation of accurate and relevant
information through vertical and horizontal
collation of food security and nutrition data
from the LGAs, state, and federal levels
Development of a yearly summary table
containing food and nutrition situation
disaggregated by state and LGA
TBD FMARD PPC Department
FMARD –
Planning & Policy
Coordination
Department (PPC);
Nutrition & Food
Safety Division
National Bureau of
Statistics, States
and LGA, FMOH,
FME, NGOs,
CBOs, private
sector, GAIN,
development
partners
6.7.2 Data gaps in food and
nutrition situation are
identified
Number of surveys
conducted TBD
Identification of states/ LGAs for which
there is insufficient data on food and
nutrition situation
Conducting sample surveys in states/LGAs
with missing data
Conducting sample surveys to update data
in states/LGAs with outdated data
TBD Survey reports
6.7.3 A food security and
nutrition database is
established
Launching of a
national food security
and nutrition database
TBD
Development of an online database
containing available state and LGA
information
Establishing and promoting a system for
state and LGAs to submit updated
information for review, validation, and
subsequent inclusion in the database
Creating a knowledge management
platform to assist states/LGAs in
conducting assessments, designing
interventions, targeting, and implementing
interventions
Creating awareness about database and
knowledge management initiatives and
providing assistance for states/LGAs to
access the resources
TBD Report of database launch
event

72
Investment Costs by Sub-Category and Output
Output
Nb. ENABLING ENVIRONMENT FOR
NUTRITION IMPACT INDICATORS TARGETS UNIT COSTS
TOTAL COST/
INVESTMENT
GOVERNANCE
C.1.1 INSTITUTIONS AND COORDINATION MECHANISMS 3,714,672,000
1.8.1 Liaise with state governors to reserve
tracts of land for farming
1.a Nb of letters prepared to reserve tracts of
land for farming from FMARD to State
governors
1.b Nb of dialogues between FMARD and
State governors
1.
1.a 37 letters
1.b 37 meetings (30 ppl)
1.
1.a courier: 5,000 / letter
1.b 30 ppl (1 day)
104,340,000
1.8.1 Facilitate a transparent and efficient land
acquisition and documentation process
1. Frequency of transparency committee
meetings
2. Nb of regular check-ups to strengthen
transparency in the documentation process for
land acquisition
3. Nb of compliance committees for land
acquisition wrongly documented
1. 1 / 6 month (50 ppl, 1
day)
2. 200 / year
3. 1 meeting every 6
months
1.
2. Documentation
2 pers for 1 week /
check-up
20,000 N / week total /
check up
41,792,000
1.8.3 Establish waivers for agriculture
equipment and animal production and
processing equipment
1.a Nb of request letters prepared for request
for agricultural credit facilities and equipment
waivers from FMARD to FMOF
1.b Nb of dialogues between FMARD and
FMOF
1.
1.a At least 2 letters
1.b 2 consultation meetings
/ year
1.
1.a courier: 5,000 / letter
1.b 50 ppl (1 day)
5,640,000
1.10.2
Linking smallholder farmers associations,
women groups and animal producer
associations and commodity / location
with appropriate facility/system
1. Nb of smallholder farmer associations
approached to be linked with appropriate
facilities
2. Nb of women groups approached to be
linked with appropriate facilities
3. Nb of animal producer associations
approached to be linked to vet services
4. Nb of negotiation joint meetings with
facility / system coordinators and groups
1. 10,000 associations
2. 10,000 women groups
3. 20,000 animal producer
associations (+ poultry,
livestock & fish)
4. at least 1,000 / year
1. 1 prospector / ward for
10 days each, 5,000 /
hour
2. 612,000 / meeting
2,224,000,000
2.2.4
Establishment of women animal producer
associations and regular trainings on
management (accounting, literacy etc.),
animal health and nutritional benefits of
animal proteins
1. Nb of women animal producer associations
established
2. Nb of associations trained
3. Nb of technical assistants for establishment
and development
1. 1 / LGA = 5,000
2. 1 / LGA = 5,000
3. 1 / LGA = 2,500
1. 2 months / year
(transport + per diem +
accommodation)
2. 3 months / year
200 women / group
3. 5 months / year
30,000 / month
541,800,000
2.6.1
Establishment of horticulture based
women groups and regular trainings on
management (accounting, literacy etc.), ag
maintenance and nutritional benefits of
animal proteins
*
1. Nb of women groups established
2. Nb of technical assistants (extension agents)
for establishment and development
3. Nb of trainings held
1. 1 / LGA = 5,000
2. 1 / LGA = 5,000
3. 1 / LGA = 2,500
1&2. 10,000 N/technical
assistant/ward for 10,000
wards
3. 300,000 N/ training for
10,000 trainings
541,800,000

73
Output
Nb.
ENABLING ENVIRONMENT FOR
NUTRITION IMPACT INDICATORS TARGETS UNIT COSTS
TOTAL COST/
INVESTMENT
2.3.1
Identification of the constraints (policy,
regulatory market, and food safety related
) to the local production of high nutritious
foods and addressing them to related
government agencies
1. Consultation to identify constraints to local
production of nutritious foods
2. Dissemination of major constraints and
meetings with related government agencies
3. Nb of stakeholder meetings to agree on and
assign actions to address constraints
1. 2 consultants (6 months
each)
2. 1 / year
3. 2 stakeholder's meetings
/ year
1. 500,000 N each /
month
2. 612,000
3. 4M / meeting
60,000,000
4.6.1
Discussions with stakeholders, including
NAFDAC, SON, FMOH, and private
sector to set up criteria for appropriate
standards for nutrition labels in Nigeria
1. Nb of stakeholders meetings to set up
standards for nutrition labels in Nigeria
2. Nb of days for nutrition desk officer to
compile criteria for nutrition labels
1. 3 stakeholder meetings /
year (50 ppl, 2 days for
travel)
2. 10
1. N 4 M
2. 5,000 48,200,000
6.3.1
Identification of the expected relationships
among the divisions and units in the
Nutrition Directorate, and with other
Directorates in the Ministry
1. Nb of consultants to identify the expected
inter and intra divisional relationships, and the
roles and actions to be performed
2. Nb of advocacy documents produced
1. 2 consultants for 2
months
2. 1 advocacy document
produced ( * 4 as updated 1
/ year)
1. 500,000
2. 6,000,000
1.5.2,
1.5.4,
1.9.1,
1.5.1,
1.9.3
Mobilize resources for meetings,
monitoring of pesticide MRLs, cultivation
in prison farms and acquisition of
necessary equipment
1. Nb of resource mobilization proposals
developed
2. Nb of funding agencies approached
3. Nb of private institutions approached
1. At least 5 proposals
2. At least 10 funding
agencies
3. At least 50 private
institutions
1. 3 working sessions /
proposal (15) = 1 day * 5
ppl
2. 2 * 10 meetings
3. 2 * 50 meetings
112,500,000
1.4.1
Collection and compilation of best
practices for aflatoxin control into a
national strategy
1. Nb of months for desk reviews
2. Nb of months for case studies documented
1. 5 months, for each of 10
States
Nutrition officers / State
2. At least 3 months (1 /
case study)
1. 500,000 N
2. 500,000 N 28,600,000
C.1.2 TRADE and MARKETS
114,160,000
1.8.4
Identify level of duties and tariffs that will
prohibit importation of affected
commodities
1.
1.a Nb of request letters prepared for increase
of duties and tariffs from FMARD to FMOF
1.b Nb of dialogues between FMARD and
FMOF
2. Nb of circulars / gazettes on levies and
duties issued by Nigerian Customs Services
1.
1.a at least 10 letters
1.b 20 consultation
meetings
2. at least 10 circulars /
gazettes
1.
1.a courier: 5,000 / letter
1.b 50 ppl (1 day)
53,160,000
2.2.2 Tax holidays for animal feed companies,
contingent on quality, quantity, and reach
of feeds sold
1. Nb of stakeholder meetings with aninmal
feed companies
2. Nb of communiques for tax holiday
1. 1 meeting / yr
2. 1 communique
1. 4 M
2. 5 M / communique 36,000,000
5.2.2
Creating regulatory frameworks to ensure
food procurement from smallholder
farmers for school feeding programmes
and other institutional markets
1. Nb of consultants developing regulatory
frameworks for school feeding programmes
2. Nb of stakeholders meetings
1. 2 consultants * 5 months
2. 5 stakeholders meetings
1. 500,000 / month
2. N 4M / meeting 25,000,000

74
Output
Nb.
ENABLING ENVIRONMENT FOR
NUTRITION IMPACT INDICATORS TARGETS UNIT COSTS
TOTAL COST/
INVESTMENT
C.1.3 ADVOCACY for FINANCIAL AND POLITICAL COMMITMENT AND COMMUNICATION 2,613,792,000
1.3.2,
1.5.1,
1.9.1,
2.5.1,
2.6.1,
2.8.2,
2.8.3,
4.5.1,
6.3.2
Organize advocacy meetings at all levels
about:
1) the use of gamma irradiation,
2) agribusiness in prison farms,
3) reduction of policy and regulatory
barriers,
4) access to land and establishment of
homestead gardens,
5) nutrition-related activities in school,
6) inclusion of nutrition in all value chain
manuals and trainings
1. Nb of advocacy high level meetings at
central level by thematic
2. Nb of advocacy meetings at State level by
thematic
3. Nb of advocacy meetings at LGA level
1. 6 / year
2. 6 / year * 37 = 259
3. 6 / year * 774 = 5418
1. 37 ppl, 3h / day
2. 50 ppl / 6h
3. 50 ppl / 1 day 1,339,344,000
2.5.1,
2.5.2
Generate dialogue
1) with processors in staple crops
processing zones (SCPZs) to identify
barriers to food fortification; and
2) with National Fortification Alliance
(NFA) to promote legislation on additional
foods
1. Nb of meetings with processors (SCPZs)
2. Nb of meetings with National Fortification
Alliance (NFA)
1. 7 (once) / year (100 ppl)
2. 1 / yr
1. N 11 M
2. 612,000 N 170,448,000
1.6.3,
2.1.1
Develop a promotion strategy for
platforms developed as per:
1) Electronic platform where specific
standards for different commodities can
be accessed, and
2) Staffed electronic communication
system / platform where companies can
input their raw material needs, including
quality and quantity
1. Nb of communities reach by promotion of
electronic platforms
2. Nb of companies reach by promotion of
electronic communication system / platform
1. at least 10,000
communities (wards)
1 promoter / LGA = 774
promoters
1 month / year (4 wards /
year / promoter)
2. at least 5,000 companies
Promotion event = 1 / yr
50 M 50,000,000
1.6.2 Periodic public enlightenment
events/sessions, conveying consistent
nutrition messages
1. Nb of TV live sessions / events organized
1.a nb TV events / sessions developed
1.b nb TV events / sessions periodically
screened
2. Nb of live demonstrations
1. 3 TV live sessions / yr
1.a Development
1.b Propagation: 1 / month
2. LGA level = 774
demonstrations total
1.
1.a 5M N
1.b 10 M N / session
2. 1 M / session
1,054,000,000
C.1.4 INFRASTRUCTURES AND ORGANIZATIONAL CAPACITES FOOD ENVIRONMENT 981,878,000
1.6.1 Development of a unified system to certify
food quality and relevant criteria *
1. Nb of stakeholders meeting
2. Nb of consultants engaged to develop
unified systems
3. Nb of validation meetings
4. Nb of certification system manuals
produced
5. Nb of training of MDA staff on certification
system
1. 4 stakeholders meetings
2. 2 consultants (1 month)
3. 2 validation meetings
4. 1000 manuals
5. 1 training for 50 MDA
staff
1. 5 M per meeting
2. 1,000,000/month for 2
consultants
3. 5 M per meeting
4. 2,500 per manual
5. 12 M per training
46,500,000

75
Output
Nb.
ENABLING ENVIRONMENT FOR
NUTRITION IMPACT INDICATORS TARGETS UNIT COSTS
TOTAL COST/
INVESTMENT
1.8.5 Support construction of roof water
harvesting structures *
1. Nb of roof water harvesting structures
2. Nb of months for technical assistance
1. 1 / ward = 10,000
structures
2. 1 technician/ ward (1
month / year)
1. 70,000 / structure &
transportation
2. 20,000 / month 900,000,000
1.8.5
Identify contextually appropriate
irrigation solutions and facilitate their
scale up
*
1. Consultation to identify and develop
contextually appropriate irrigation solutions
2. Management committee meeting to adopt
irrigation solutions
1. 2 consultants (6 months
each)
2. 2 management
committee meetings
1. 1,000,000 N/ month
for 2 consultants
2. 289,000 N / for 2
consultants to attend
management meeting
6,578,000
1.10.1
Establishing public-private partnerships
and tax exemptions/ low interest financing
for increased utilization of silos,
warehouse receipt systems, commodities
exchange boards, and aggregation centres
*
1. Nb of communication exchanged with
banks, commodity exchanges, marketing
boards, aggregation centres and other storage
centres
2. Nb of consultative meetings between
FMARD and stakeholders
1. At least 100
communication exchanges/
consultative meeting = 400
communication exchanges
per year
2. 4 consultative meetings/
year
(100 ppl in each, 1 day)
1. 1,000/ communication
exchange for 400
exchanges
2. 7,000,000 N/
consultative meeting for
4 consultative meetings
per year
28,800,000
Output
Nb PRODUCTION
EXPECTED
IMPACT INDICATORS TARGETS UNIT COST
TOTAL COST/
INVESTMENT
C.2.1 ASSETS and INPUTS for DIVERSIFIED
PRODUCTION 57,925,900,000
5.1.2
Establishment of cooperatives and savings
and loans schemes so that beneficiaries
can expand business
*
1. Nb of cooperatives established
2. Frequency of management
assistance
3. Nb of MoU agreements
(government guarantee
programme) with banks
1. 1 / LGA = 774
2. Cooperative management class (accounting,
management, literacy, book keeping, etc)
3. 774 MoU agreements
1. Technical assistance for
establishment: 1 M N / year
/ LGA
2. 3.7 M N / year / LGA
3. 500,000 N / year / LGA
14,851,200,000
3.1.1 Multiplication of indeterminate tomato
seeds *
1.Nb of hectares / State
2. Kg of seeds provided / farmer
3. Nb of hours for technical
assistance
1. 1 ha / farmer = 5 ha / State
2. / ha
3. TA for 1 ha: 21 days/ yr
first stage = establishment of nursery: 1 wk
second stage = control of weeds: 2 wks
third stage = harvesting: 1 week
1. 1,677,500 / kit
2. 150,000 / month =
450,000/ year
3,148,700,000
3.1.1 Provision of soil testing kits through labs
(1 kit is usable for at least 1,000 samples) *
1. Nb of standard soil testing kits:
soil doctor (1 kit for 2000
samples)
2. Nb of lab operators / carriers
(for 3 months)
1. 10 / State: 370 / year
2. 370 / year
1. 1,677,500 / kit
2. 150,000 / month =
450,000 / year
3,148,700,000

76
Output
Nb PRODUCTION
EXPECTED
IMPACT INDICATORS TARGETS UNIT COST
TOTAL COST/
INVESTMENT
3.1.1 Provision of irrigation materials for dry
season farming *
1. small water pumps
2. drip lines (pipes for drip
irrigation) + accessories
3. hoses
4. washbore
Agro-ecological targeting:
Humid Forest area (12 States) and Derived
Savannah area (10 States): 10%
Sahel Savannah, Sudan Savannah and Mid-
Altitude: 60%
Northern and Southern Guinea Savannah: 30%
1. 500 / State = 37,000
2. drip line: 500 / State = 37,000
3. 1,000 / State = 74,000
4. 500 / State
1. 80.000 N / pump
2. drip line: 300,000 N / drip
line
3. 20,000 N / 50 meter roll
(= 400 N / meter)
4. 60,000 N
7,520,000,000
5.2.1 Provision of necessary inputs to
smallholder farmers **
29,257,300,000
Provision of seeds Seed kg / ha
Each seed: 1,000 farmers = 37,000 * 8 =
296,000 (8,000 farmers / State)
Seed kg / ha:
Rice: 30 kg / ha
Maize: 25 kg / ha
Cassava: 60 bundles / ha
Beans: 25 kg / ha
Tomato: 5 kg / ha
Sweet potato: 3 tons / ha
Yam: 3 tons / ha
Carrots:
Rice: 450 N / kg
Maize: 400 N / kg
Cassava: 600 N / bundle
Beans: 700 N / kg
Tomato:
Sweet potato: 500 / bundle
Carrot:
Yam: 1 million / ton
Agrochemicals
1. Herbicide: L / ha
2L pre and 4L post
2. Pesticides: L / ha
1. for 1 year: 6 L / farmer = 15,600 * 6 =
93,600 L / year
2. for 1 year: 8 L / farmer = 15,600 * 8 =
124,800 L / year
Herbicide: 3,500 / L
Pesticide: 3,500 / L
Fertilizers
1. Organic fertilizer
1.a Liquid fertilizer
1.b Solid fertilizer
1.a 2.5 L / farmer / yr
1.b 200 kg / farmer / yr
Organic fertilizer:
1.a 1,200 / L
1.b 3,500 / bag (50kg)
(Non-organic:
7,000 / bag ( = 50kg) )
Technical assistance 5 technicians for 1,000 farmers 4 months / year Monthly salary = 50,000N /
farmer
C.2.2 PRISON FARMING FOR INTERNAL FOOD
SECURITY 2,840,800,000
1.9.1
Provision of inputs (tractors and tractor-
driven implements, seeds, fertilizer, agro-
chemicals and veterinary products) for
farm cultivation in prison farms (13 prison
farms)
*
1. Nb of hectares
2. Nb of tractors
3. Seed kgs / ha
4. agrochemicals
1. 1,200 ha / prison = 15,600 ha
2. 2 / prison = 26
3. Seeds for 15,600 ha
4. Agrochemicals
2,840,800,000
Provision of seeds Seed kg / ha Rice: 30 kg / ha
Maize: 25 kg / ha
Rice 2000 ha
Maize 2000 ha

77
Output
Nb PRODUCTION
EXPECTED
IMPACT INDICATORS TARGETS UNIT COST
TOTAL COST/
INVESTMENT
Cassava: 60 bundles / ha
Beans: 25 kg / ha
Tomato: 5 kg / ha
Orange flesh sweet potato: 3 tons / ha
Yam: 10,000 of 250g seed yam = 2,500 kg / ha
Carrots:
Cassava 2000 ha
Beans 2000 ha
Tomato 2000 ha
Sweet potato 2000 ha
Carrot 2000 ha
Yam 1560 ha
Agrochemicals 1. Herbicide: L / ha
2L pre and 4L post
2. Pesticides: L / ha
For 1 year
1. 6 L / ha = 15,600 * 6 = 93,600 L/ year
2. 8 L / ha = 15,600 * 8 = 124,800 L/ year
Herbicide: 3,000 / L
Pesticide: 3,000 / L
Fertilizers 1. Organic fertilizer
1.a Liquid fertilizer
1.b Solid fertilizer
2. Non-organic fertilizer
1.a 2.5 L / ha
1.b 200 kg / ha
2. 200 kg / ha
Organic fertilizer:
1.a 1,200 / L
1.b 3,500 / bag (50kg)
2. Non-organic:
7,000 / bag ( = 50kg)
Livestock 1. Dairy cattle
2. Beef cattle
3. Assorted veterinary drugs
(antibiotics, dewormers,
antiprotozoan, acaricides)
4. Animal vaccine
5. Veterinary kits
6. Feed supplementation
7. Fodder pasture
1. 20 / 3 prison farms = 60
2. 20 / 3 prison farms = 60
3. 10,000 ml / farm = 30,000ml
4. 150 doses / farm = 450 doses
5. 2 kits / farm = 6 kits
6. 1 metric ton / farm = 3 metric tons
7. 5 ha / farm = 15 ha
1M / 5 ha
C.2.3 HOUSEHOLD FARMING
5,062,227,000
1.8 Subsidizing soya bean seed *
1. Nb States (wit comparative adv)
2. Nb ha
3. Seeds / ha
1. 7 States
2. 1,000 ha / State = 7,000 ha
3. 50 kgs / ha
700 N / kg = 35,000 / ha 245,000,000
1.1.3 Setting up farm centres for promotion /
demonstration of good agricultural
practices
*
1. Nb of farm centres
2. ha / farm centre
3. Nb of hours for ag technician
4. Inputs / assets pack
4.a Kilos / ha by seeds
4.b Kgs / ha by organic fertilizers
4.c L / ha by arochemicals
1. 109 farm centres
2. 5 ha / farm centre = 545 ha
3. 109 (additional time: nb hours / week)
4.
4.a seeds: 30 kgs / ha = 16,350 kgs
4.b fertilizers: 200 kgs / ha = 109,000 kgs
4.c agrochemicals: 6 L / ha = 3270 L
2. farm centre =
3. 14 hour / week for 6
months
3,000 / hour
4.a 1,000 N / kg
4.b 1,200 N / L
4.c 3,500 N / L
744,252,000
2.6.3
Establishement of kitchen gardens for 500
vulnerable households by LGA for 397
LGAs in 18 States (39,875 households /
year)
(7 States North West, 6 States North East
+ Plateau & Nasarawa in North Central,
Oyo in South West & Ebonyi in South
East & Akwalbom in South-South)
***
1. kg / household of seeds
(vegetable, tomatos, peppers,
carots , etc.)
2. Nb of contacts / yr for technical
assistance
3. Nb of demonstration kitchen
gardens
1. 500 g / household / year = 2kg / HH total
5. 5 technical assistants / 500 HH: 5 contacts
(8h/contact) a year / household
6. 10,000 demonstration kitchen gardens (at
least 1 / ward)
4. Veg seeds: 1,500 / kg
5. 40hr / year / household = 3,992,625,000

78
Output
Nb PRODUCTION
EXPECTED
IMPACT INDICATORS TARGETS UNIT COST
TOTAL COST/
INVESTMENT
2.6.3
Pilot establishement of urban and peri
urban kitchen gardens (inclusing also
rooftop gardens / sackfarming etc.) in 4
States
***
1. 100 / State = 400 households
2. kg / household of seeds
(vegetable, tomatoes, peppers,
carrots , etc.)
2. Nb of contacts / yr for technical
assistance
3. Nb of demonstration kitchen
gardens
1. 500 g / household / year = 2kg / HH total
5. 5 technical assistants / 500 HH: 5 contacts
(8h/contact) a year / household
6. 100 demonstration kitchen gardens (at least 1
/ ward)
4. Veg seeds: 1,500 / kg
5. 40hr / year / household = 10,350,000
3.1.1
Provision of starter-packs for fruit and
vegetable farming (in the 7 agroecological
zones), for 1,000 smallholder farmers by
zone
**
1. Nb of starter packs
1.a Kilos / ha by seeds
1.b Kgs / ha by organic fertilizers
1.c L / ha by agrochemicals
1. 7,000 starter packs
1.a Seeds:
1.b Fertilizers: 1 bag (50 kg)
1.c Agrochemicals: 1 L
1. 7,000 starter packs
1.a Fertilizers: 7,000 / bag
(50 kg)
1.b Seeds:
1.c Agrochemicals: 1,500/ L
70,000,000
C.2.4 ANIMAL-BASED FOODS:
FISHERIES 2,311,200,000
2.7.1 Provsion of fish hatcheries and
maintenance *
1. Number of fish hatcheries
2. Nb of contacts / yr for technical
assistance
1. 20 (1 / State for 20 States)
2. 50h / technical assistant (by hatchery)
1. 5 M N ( structure and
equipment)
2. 5,000 N /hr 105,000,000
2.7.1 Provision of fish starter pack (tilapia and
clarias) **
1. Number of farmers
2.a Nb of juveniles / pack
2.b Nb of feed bags
3. Nb of contacts / yr for technical
assistance
1. 100 farmers / 20 State: 2,000 farmers
2.a 200 / pack
2.b 3 bags = 15 kg*3 = 45 kg / pack
3. 40 technical assistants
2.a 450 N / juvenile
2.b 7,500 N / bag = 22,500
N / pack
3. Technical assistance: 15 h
contact / year / farmer
2,000 N / hr for technical
service
2,206,200,000
C.2.5 ANIMAL-BASED FOODS:
LIVESTOCK 6,215,840,000
1. small ruminants
2.7.1 Provision of small ruminant packs (5
sheep / goats, concentrate, minerals and
vitamins, vaccine and drugs)
**
1. Number of farmers
2. Starter pack
2.a Nb of sheeps / goats
2.b Nb of concentrates
2.c Nb of minerals / vitamins
2.d Nb of vaccines
2.e Nb of vet drugs
3. Nb of hours by vet technician
1. 100 / State = 3,700 farmers
2. Starter pack
2.a 5 / pack
2.b 2 bags / pack = 50 kg / pack
2.c 2 sachets / pack = 200 g / pack
2.d vaccine: 10 doses / pack
2.e vet drugs: 50 ml / pack
3. 2 vet technicians / State = 74
2.a 10,000 N / animal
2.b 3,000 N / bag
2.c 1,200 N / sachets
2.d 200 / doses
2.e 100 N / ml
3.
1 vet technician: 6 times a
year = 12h / year / farmer =
600h / technician / year =
10.000 / hour
388,500,000
2. cattle (beef and dairy)
2.2.2
Provision of hand pump boreholes at
strategic locations for livestock in
vulnerable livelihood zones
* 1. Vulnerable States
2. nb boreholes
1. 18 vulnerable States
2. 2 boreholes / State = 36 boreholes 2. 1.5 M N / borehole 54,000,000

79
Output
Nb PRODUCTION
EXPECTED
IMPACT INDICATORS TARGETS UNIT COST
TOTAL COST/
INVESTMENT
2.2.4 Provision of dairy cattle and beef and
animal health services **
1. Number of farmers
2. Starter pack
2.a Nb of dairy cattle / beefs
2.b Nb of concentrates
2.c Nb of minerals / vitamins
2.d Nb of vaccines
2.e Nb of vet drugs
3. Nb of hours by vet technician
1. 50 / State = 1,850 farmers
2. Starter pack
2.a 2 / pack
2.b 5 bags / pack = 125 kg / pack
2.c 10 sachets / pack = 1kg / pack
2.d vaccine: 50 doses / pack
2.e vet drugs: 200 ml / pack
3. 2 vet technicians / State = 74
2.a 80,000 N / head of cattle
2.b 3,000 N / bag
2.c 1,200 N / sachets
2.d 200 / doses
2.e 100 N / ml
1 vet technician: 6 times a
year = 12h / year / farmer =
600h / technician / year =
10,000 / hour
4,441,480,000
APICULTURE
2.7.1 Provision of bee keeping starter packs **
1. Nb of farmers
2. Nb of starter packs (gloves,
boots, bee suit, brush, smoker,
hive)
3. Nb of hours vet technician
1. 50 / State (15 States) = 750
2. 1 starter pack / farmer / 4 yr
3. 1 vet technician / State = 50 vet technicians
Approx. 150,000 N/ pack
for 10 colonies: 2 sets bee
suits, accessories = 245,000
training: 37,000 (when
giving the starter pack)
298,100,000
POULTRY
2.7.1 Provision of poultry starter packs ***
1. Number of farmers
2. Starter pack
2.a day-old-chicks
2.b feed
2.c minerals / vitamins
2.d vaccine
2.e vet drugs
3. Vet technician
1. 500 / State = 18,500 farmers
2. Starter pack
2.a 100 doc / pack
2.b 3 bags / pack = 75 kg / pack
2.c 2 sachets / pack = 200g / pack
2.d vaccine: 600 doses / pack
2.e vet drugs: 500g / pack
3. 4 vet technicians / State = 148
2.a 250 N / doc
2.b 4,500 N / bag
2.c 1,200 N / sachet
2.d 20 N / dose
2.e 1,500 N / pack
3. 1 vet technician: 6 times a
year = 12h / year / farmer =
600h / technician / year =
10,000 / hour
1,024,160,000
2.7.1 Provision of poultry hatchery * 1. Number of hatcheries
2. Technical assistance
1. 6 poultry hatcheries
2. 6 technical assistants
1. poultry hatchery = 150 M
N (structure, incubator,
equipment)
2. 6 contacts/ year
9,600,000
Output
Nb BIOFORTIFICATION
EXPECTED
IMPACT INDICATORS TARGETS UNIT COST
TOTAL COST /
INVESTMENT
C.3.1 IRON BIOFORTIFICATION
11,621,610,000
1. Rice
2.4.2
Dissemination of iron biofortified rice
crops and provision of samples to targeted
smallholder farmers
***
1. Frequency of dissemination
2. Nb of smallholders provided
with samples
3. Technical assistance
1. 3/ year/ LGA = 2,322/ yr
10,000 dissemination
meetings
2. 3 / LGA = 2,322
3. 15 h contact/ year/ farmer
1. 1,2M N / delivery for 200 households
2. 1 sample (seeds) = 500 / kg
1 / year / each farmer (2,322)
3. Technical assistance:
2,000 N / hr for technical service
3,998,484,000

80
Output
Nb BIOFORTIFICATION
EXPECTED
IMPACT INDICATORS TARGETS UNIT COST
TOTAL COST /
INVESTMENT
2. Sorghum
2.4.2 Dissemination of iron biofortified sorghum
crops and provision of samples to
smallholder farmers
***
1. Frequency of dissemination
2. Nb of smallholders provided
with samples
3. Technical assistance
1. 3 / year / LGA = 2,322 /
year
10,000 dissemination
meetings
2. 3 / LGA = 2,322
3. 1/ yr/ each farmer (2,322)
1. Dissemination campaign
7 M / campaign
2. 1 sample (seeds) = 250 / kg
3. Technical assistance: 15 h contact / yr/
farmer
2,000 N/ hr for technical service
3,810,402,000
3. Beans
2.4.2
Dissemination of iron biofortified bean
crops and provision of samples to
smallholder farmers
***
1. Frequency of dissemination
2. Nb of smallholders provided
with samples
3. Technical assistance
1. 3 / year / LGA = 2,322 /
year
10,000 dissemination
meetings
2. 3 / LGA = 2,322
3. 1/ yr/ each farmer (2,322)
1. Dissemination campaign
7 M / campaign
2. 1 sample (seeds) = 500 / kg
3. Technical assistance: 15 h contact / yr/
farmer
2,000 N / hr for technical service
3,812,724,000
C.3.2 ZINC BIOFORTIFICATION
7,625,448,000
1. Rice
2.4.2 Dissemination of zinc biofortified rice
crops and provision of samples to
smallholder farmers
***
1. Frequency of dissemination
2. Nb of smallholders provided
with samples
3. Technical assistance
1. 3 / year / LGA = 2,322 /
year
10,000 dissemination
meetings
2. 3 / LGA = 2,322
3. 1/ yr/ each farmer (2,322)
1. Dissemination campaign
7 M / campaign
2. 1 sample (seeds) = 500 / kg
3. Technical assistance: 15 h contact /
year/ farmer
2,000 N / hr for technical service
3,812,724,000
2. Wheat
2.4.2 Dissemination of zinc biofortified wheat
crops and provision of samples to
smallholder farmers
***
1. Frequency of dissemination
2. Nb of smallholders provided
with samples
3. Technical assistance
1. 3 / year / LGA = 2,322 /
year
10,000 dissemination
meetings
2. 3 / LGA = 2,322
3. 1/ yr/ each farmer (2,322)
1. Dissemination campaign
7 M / campaign
2. 1 sample (seeds) = 500 / kg
3. Technical assistance: 15 h contact /
year/ farmer
2,000 N / hr for technical service
3,812,724,000
C.3.3 VITAMIN A BIOFORTIFICATION
15,248,109,600
1. Cassava
2.4.1
Dissemination of vitamin A biofortified
cassava crops and provision of samples to
smallholder farmers
***
1. Frequency of dissemination
2. Nb of smallholders provided
with samples
3. Technical assistance
1. 3 / year / LGA = 2,322 /
year
10,000 dissemination
meetings
2. 3 / LGA = 2,322
3. 1/ yr/ each farmer (2,322)
1. Dissemination campaign
7 M / campaign
2. 1 sample (seeds) = 400 / kg
3. Technical assistance: 15 h contact /
year/ farmer
2,000 N / hr for technical service
3,811,795,200
2. Maize
2.4.1 Dissemination of vitamin A biofortified
maize crops and provision of samples to
smallholder farmers
***
1. Frequency of dissemination
2. Nb of smallholders provided
with samples
3. Technical assistance
1. 3 / year / LGA = 2,322 /
year
10,000 dissemination
meetings
1. Dissemination campaign
7 M / campaign
2. 1 sample (seeds) = 300 / kg
3. Technical assistance: 15 h contact / year
3,810,866,400

81
Output
Nb BIOFORTIFICATION
EXPECTED
IMPACT INDICATORS TARGETS UNIT COST
TOTAL COST /
INVESTMENT
2. 3 / LGA = 2,322
3. 1/ yr/ each farmer (2,322)
/ farmer
2,000 N / hr for technical service
3. Sweet potato
2.4.1 Dissemination of vitamin A biofortified
sweet potato and provision of samples to
smallholder farmers
***
1. Frequency of dissemination
2. Nb of smallholders provided
with samples
3. Technical assistance
1. 3 / year / LGA = 2,322 /
year
10,000 dissemination
meetings
2. 3 / LGA = 2,322
3. 1/ yr/ each farmer (2,322)
1. Dissemination campaign
7 M / campaign
2. 1 sample (seeds) = 500 / kg
3. Technical assistance: 15 h contact / year
/ farmer
2,000 N / hr for technical service
3,812,724,000
4. Plantains & bananas
2.4.2 Dissemination of vitamin A biofortified
plantain and bananas and provision of
samples to smallholder farmers
***
1. Frequency of dissemination
2. Nb of smallholders provided
with samples
3. Technical assistance
1. 3 / year / LGA = 2,322 /
year
10,000 dissemination
meetings
2. 3 / LGA = 2,322
3. 1/ yr/ each farmer (2,322)
1. Dissemination campaign
7 M / campaign
2. 1 sample (seeds) = 500 / kg
3. Technical assistance: 15 h contact / year
/ farmer
2,000 N / hr for technical service
3,812,724,000
Output
Nb POST-HARVEST
EXPECTED
IMPACTS INDICATORS TARGETS UNIT COSTS
TOTAL COST /
INVESTMENT
C.4.1 ON-FARM STORAGE
105,790,000
1.2.1,
1.9.1 Provision of 1 ton metal silo *
1. nb of silos / prison farms
2. nb of silos / cooperative of women
groups
1. 10 silos / prison farm = 130
silos
2. 3 silos / cooperative * (3*774) =
6,966
10,000 N / metal silo 70,960,000
1.2.1 Provision of hermetic storage * Nb of hermetic storage for youth &
women cooperative groups benefiting
4644 (3 women groups + 3 youth
groups/ LGA)
1,500 N / hermetic storage bag - 5
bags per group 34,830,000
C.4.2 PROCESSING
11,144,920,000
5.1.1 Provision of processing starter
packs for soya bean commodity
group
*
1. Nb of starter packs for soya bean
commodity producer groups (miller,
extractor, preservator)
2. Nb of hours for demonstration
1. 1 starter pack / commodity
group (7 States)
2. 5h / starter pack
1. Starter pack:
dehusker
toasting machine
extractor
press
miller
2. 2,000 / hour
844,200,000
5.1.1 Provision of processing starter
packs for fruit commodity group **
1. Nb of starter packs for fruit
commodity groups (dryer, canning
machine, extractor, processor)
2. Nb of hours for demo
1. 1 starter pack / commodity
group
2. 5h / starter pack
1. Starter pack:
dryer
packaging equipment
5KVA petrol generator
2. 2,000 / hour
1,784,880,000

82
Output
Nb POST-HARVEST
EXPECTED
IMPACTS INDICATORS TARGETS UNIT COSTS
TOTAL COST /
INVESTMENT
5.1.1 Provision of processing starter
packs for vegetable commodity
group
**
1. Nb of starter packs for vegetable
commodity groups (dryer, processor)
2. Nb of hours for demonstration
1. 1 starter packs / commodity
group
2. 5h / starter pack
1. Starter pack:
dryer, packaging equipment,
grinder
5KVA petrol generator
2. 2,000/ hour
1,784,880,000
5.1.1
Provision of processing starter
packs for fish commodity group
including vulnerable farmer
groups
**
1. Nb of starter packs for fish
commodity groups (dryer (charcoal
powered), smoking kiln, packaging)
2. Nb of hours for demonstration
1. 1 starter packs / commodity
group
2. 5h / starter pack
1. Starter pack:
kiln, packaging, 5KVA petrol
generator
2. 2,000 / hour
896,880,000
5.1.1
Provision of processing starter
packs for livestock commodity
group including vulnerable farmer
groups
**
1. Nb of starter packs for livestock
commodity groups (dryer, meat
chopper / grinder, milking machine,
cheese making machine)
2. Nb of hours for demo
1. 1 starter packs / commodity
group (20 States only)
2. 5h / starter pack
1. Starter pack:
Abattoir, Dryer, Grinder, Butcher
kits, Milking machine, Cheese
making machine, packaging
equipment
2. 2,000 / hour
1,204,000,000
5.1.1 Provision of processing starter
packs for groundnut commodity
group
*
1. Nb of starter packs for groundnut
commodity groups (sheller, miller,
dryer, extractor, grinder, processor)
2. Nb of hours for demonstration
1. 1 starter packs / commodity
group (22 States only)
2. 5h / starter pack
1. Starter pack:
sheller, roaster, miller, dryer,
extractor, grinder, processor,
Packaging equipment
5KVA petrol generator
2. 2,000 / hour
1,061,280,000
1.2.1 Setting up of aggregation centres
for sorting and grading *
1. Nb of aggregation centres (structural
construction)
2. Sets of equipment: dryer, cleaner,
weighting scales, magnetic separators,
converyers, elevators, storage bins,
miller, processor, sorter, grader,
moisturemeter, generators
3. Supervision and operational
assistance / centre
1. 3 aggregation centre for 24
States: 72
2. 72 sets of equipment
3. 2 people / centre / year - 6
months / year
1. 7 M / centre
2. 8M / set
3. 50,000N / month
1,082,400,000
2.2.3 Setting up milk collection centres
for dairy **
1. Nb of collection centres (structural
building)
2. Milk collection equipment (milk
can, milk testing kits)
4. Technical supervision and testing
1. 4 milk collection centres for
each of 15 States: 60
2. 60 sets of equipment
3. 60 technicians: 12 months /
collection centre
1. 8M N / collection centre
2. 2M N / set of equipment
3. 1 month = 30,000 N 2,486,400,000
C.4.3 TRANSPORTATION
9,324,000,000
2.2.3
Provision of cooling vans for meat
chain , fish, fruit / veg and milk
chains
**
1. Nb of meat cooling vans
2. Nb of fish cooling vans
3. Nb of fruit / veg cooling vans
4. Nb of milk cooling vans
5. Spare parts, services and
maintenance
1. 2 / State
2. 1 / State
3. 2 / State
4. 1 / State
5. 5% of total cost
1. 40M
2. 40M
3. 40M
4. 40M
5. 8M
9,324,000,000

83
Output
Nb FOOD SAFETY
EXPECTED
IMPACT INDICATORS TARGETS UNIT COSTS
TOTAL COST /
INVESTMENT
C.5.1 PRODUCTION STAGE
2,988,856,000
1.3.2 Development of standard operating
procedures for irradiation of various foods *
1. Nb of consultations to draft the
operating procedures
2. Nb of stakeholders operating
procedures validation meetings
3. Nb of committee meetings for
dissemination and adoption
1. 2 consultants (3 months
each), 1 National & 1
International
2. 2 stakeholder's meetings
3. 1 management committee
meetings
1. 500,000 N each / month
2. 5M / meeting
3. 612,000 N / committee
meeting
13,612,000
1.3.3 Establishment of preparation and bagging
centres in the States involved *
1. Nb of preparation and bagging
centres built
2. Nb of preparation equipment sets
3. Nb of sets of bagging materials
4. Nb of months by technician
1. 3 centres for each of 20
States = 60 centres
2. 60 sets of preparation
equipment
3. 60 sets of bagging materials
4. 60 technicians: 5 months /
year for 4 years
1. 25M / centre (structure)
2. 2.5M: weighting machine,
1.5M: sewing machine = 4M
package
3. Cost handled by farmers
4. 2,000N / hour
843,360,000
1.5.4
Development of standard operating
procedures for monitoring MRLs
(Maximum Residual Levels) in
commodities
*
1. Nb of consultants to draft the
operating procedures
2. Nb of stakeholders meetings
3. Nb of management meetings for
dissemination and adoption
1. 2 consultants (6 months
each), 1 National & 1
International
2. 2 stakeholder's meetings
3. 1 management committee
meetings
1. 500,000 N / month
2. 5M / meeting
3. 612,000 N / committee
meeting
13,612,000
1.5.5 Provision of rapid pesticide level detection
test kits for the monitors of MRLs *
1. Nb of rapid pesticide level
detection test kits provided
2. Nb of hours for monitor's
supervision
3. Nb of days transportation
supervision monitoring
1. 1 / ward = 10,000
2. 1 / LGA = 774, 6 times (4h) /
year
3. 3 days / year transportation
1. 140,000 N / kit
2. 2,000 N / hour
3. 220,000 N / year /
supervisor
2,118,272,000
C.5.2 PROCESSING STAGE
723,840,000
1.4.2
Distribution of aflatoxin control
technologies (such as Aflasafe) to farmer
groups
**
1. Nb of aflatoxin control packs
distributed
2. Nb of technical assistants for
distribution and demonstrations
1. 10 / ward / year = 400,000
2. 774 technicians (1/LGA), for
2 months / year
1. 1,500 N / pack
2. 20,000 N / month
(+transport) 723,840,000
C.5.3 SOPs
11,969,936,000
1.7.2
Development of contextually appropriate
standard operating procedures (SOPs)
and guidelines for achieving food quality
standards within facilities and systems
*
1. Nb of consultants to develop
SOPs
2. Nb of stakeholders meeting for
validation of SOPs
3. Nb of management committees
1. 2 consultants (3 months
each), 1 National & 1
International
2. 2 stakeholder's meetings
3. 1 management committee
meetings
1. 500,000 N each / month
2. 5M / meeting
3. 612,000 N / committee
meeting
13,000,000
1.7.3 Provision of SOPs and guidelines to each
facility / system and education about use *
1. Nb of LGAs provided with SOPs
2. Nb of dissemination events at
zonal level
1. 774 LGAs: 3,000 SOPs
2. 6 dissemination events (1 /
region)
1. 5,000 N by SOP (5,000
SOPs)
2. 11,634,000,000

84
Output
Nb FOOD SAFETY
EXPECTED
IMPACT INDICATORS TARGETS UNIT COSTS
TOTAL COST /
INVESTMENT
1.7.4 Routine monitoring of facilities/ systems to
ensure that SOPs and guidelines are in use *
1. Frequency of monitorings
2. Nb of supervising monitors
1. 2 times / year
2. 1 / State = 74 2. 1 M N / year / supervisor 296,000,000
1.7.5 Enforcement of SOPs and guidelines in
non-complying facilities/ systems *
1. Frequency of monitorings
2. Nb of supervising monitors
1. 1 times / year / State
2. 1 / State = 74 2. 182,000 N / State / year 26,936,000
C.5.4 VETERINARY PUBLIC HEALTH SERVICES 46,546,150,000
2.2.2
Provision of safe solid and liquid waste
(animal and domestic) processing sites in
rural communities
**
1. Nb of waste processing sites /
senitorial district (3 by State)
2. Nb of waste vans
3. Nb of waste disposal equipments
(incinerators)
4. Nb of hours for supervision
technicians
5. Nb of days for van drivers
6. Nb of days for waste collectors
1. 1 / senitorial district = 109
2. 109
3. 109 equipment sets
4. 109 technicians: 1h / day
5. 109 drivers
6. 218 waste collectors
1. 50M N / site
2. 35M N / van
3. 15 M N / equipment set
4. 2,000 N / h
5. 3,000 / day for 5 working
days (4 years)
6. 2,000 N / day for 5
working days
10,900,000,000
2.2.2 Construction of slaughter slabs for
vulnerable rural communities *
1. Nb of slaughter slabs
2. Nb of equipment sets for
slaughter slab
3. Nb of hours for vet technical
supervisors
1. 1 / LGA = 774
2. 774
3. 4h / day for 4 years (1 vet
technical supervisor / State)
1. 15 M / slaughter slab
2. 1.5 M / set
3. hour = 5,000 N
12,948,600,000
Live bird market for poultry processing at
rural community level **
1. Nb of live bird markets
constructed
2. Nb of equipment sets for lbm
3. Nb of hours for vet technical
supervisors
1. 1 / LGA = 774
2. 1 package / LGA = 774
3. 12 months / vet assistant for
4 years
1. 20 M / lbm
2. 1 M / set
3. month = 50,000 N 22,697,550,000
Output
Nb MARKETS
EXPECTED
IMPACT INDICATORS TARGETS UNIT COSTS
TOTAL COST/
INVESTMENT
C.6.1 INFRASTRUCTURES
904,440,000
2.2.5 Creation of animal food processing zones (AFPZs)
to facilitate sourcing of raw materials and
marketing / distribution of finished products
*
1. Nb of AFPZs created
2. Nb of equipment sets
3. Nb of supervision assistants
1. 6 (1 / geopolitical zone)
2. 6 equipment sets
3. 18 supervision assistants (3 /
zone)
1. Structure: 150 M N
each
2. Equipment set:
500,000 M N / set
3. 3 months / year
20,000 N / month
904,440,000
C.6.2 PACKAGING
627,680,000
2.1.2.
Identification and promotion of packaging
(crating) and transportation solutions for fruits,
vegetables, complementary food products and
animal and aquatic products (milk, egg, meat, fish)
* 1.Nb of consultants
2. Nb of sensitization campaigns
1. 6 consultations (for each food
group)
2. 37 sensitization campaigns /
year
1. 500,000 N / consultant
(1 month each)
2. 4,160,000 / campaign 627,680,000

85
Output
Nb MARKETS
EXPECTED
IMPACT INDICATORS TARGETS UNIT COSTS
TOTAL COST/
INVESTMENT
C.6.3 LABELLING
11,224,000
1.6.1 Development of a logo to signal certification of
food quality *
1. Nb of logos produced
2. Nb consultants to develop logo
3. Nb consultative meetings on logo
4. Nb of validation committee meeting
1. At least 1 logo
2. 3 consultants (1 month each)
3. 3 consultative meetings
4. 2 validation meetings
2. 500,000 N /
consultant/ month
3. 3 M N / meeting
4. 612,000N / meeting
11,224,000
C.6.4 PROMOTION AND MARKETING
17,912,732,000
4.3.2
Promote technologies and techniques of improved
food products to small and medium scale
enterprises
** 1. Nb of stakeholders sensitization meetings
2. Nb of demonstrations
1. 4 / year
2. 1 / geopolitical zone = 6
demos / year
1. 4 M N / meeting
2. 1.6 M / demo 102,400,000
4.3.2 Advertisement to stimulate public demand of new
food products *
1. Nb of printed advertisements
2. Nb of TV ads
2.a nb TV ads developed
2.b Nb of months when TV ads propagated
3. Nb of radio ads
3.a nb radio spots developed
3.b nb radio spots regularly propagated
1. 3 / year = 12 ads
2. 1 TV ad
2.a Development
2.b Propagation: 1 / month
3. 3 radio spots / week
3.a Development
3. b Propagation
1. 1.5 M N / ad
2.a 5M N
2.b 3 M N / slot
3.a 500,000 / spot
3.b 100,000 / spot
455,000,000
2.3.2
Support local small and medium scale production
of therapeutic, supplementary, and
complementary foods
***
1. Nb of scoping studies on complementary
foods commercialized in the country
2. Nb of cooperatives benefiting from locally
adapted fortification modules
3. Nb of complementary food products
developed
4. Nb of joint meetings with producer
groups and buyers
1. 1 scoping study
2. 774 cooperatives in the 4
years
3. At least 1 / agro-ecological
zone = 7
4. 2 / year cooperative
17,337,600,000
1.10.3
Expand the eagriculture.gov.ng online platform
with regularly updated quality information on
crop prices, quality, location, available quantities
and facilities / services for each commodity
*
1. Nb of information compilers / LGA
2. Nb of online platforms developed
3. Nb of regular updates of platforms
1. 774 information compilers (1
month / compiler / LGA)
2. 1 platform
3. 1 week / month
1. 20,000 N / month
2. 2M N
3. 7,000 / week 17,732,000
Output
Nb NUTRITION EDUCATION & BCC
EXPECTED IMPACT
INDICATORS TARGETS UNIT COST TOTAL COST/
INVESTMENT
C.7.1 NUTRITION EDUCATION
8,773,704,000
2.6.1
Development of a national generic
manual on establishing home gardens
based on local biodiversity and
indigenous crops, which includes
nutrition information
*
1. Nb of days for consultants
2. Nb of generic home garden
manuals produced
3. Nb of generic home garden
manuals distributed
4. Nb of validation meetings held
1. 2 consultants for 1 home garden
manual developed
2. 500,000 generic home garden
manuals produced
3. 500,000 generic home garden
manuals distributed
4. 2 validation meeting held
1. Development: 2 consultants
(150,000 N/ day/ consultant) for 80
days
2. 1,000 N / manual, total: 200 M N
3. 100,000 N / State (13500
manuals / State)
4. 5,000,000 N / validation meeting
537,700,000

86
Output
Nb NUTRITION EDUCATION & BCC
EXPECTED
IMPACT INDICATORS TARGETS UNIT COST
TOTAL COST/
INVESTMENT
4.5.2
Support 24 value chain units to
prepare brochures on products,
including messages on the
nutritional/health benefits of
consuming products
*
1. Nb of months for experts to
develop nutrition messages
1.a Nb of communication experts
1.b Nb of nutrition experts
2. Nb of months for translation of
brochures
3. Nb of months for graphic designer
4. Nb of brochures printed and
produced
5. Nb of brochures distributed
1. Development of nutrition messages
1 communication expert (6 months)
1 nutrition expert (1 year)
2. 3 languages = 3 translators (1
month each)
3. graphic designer (1 month)
4. 4 brochures /value chain = 96 * 37
= 3,552
5. 3,552 brochures distributed across
all Value Chain Unit (VCU)
1.a comm = 200,000 N
1.b nutrition expert = 300,000 /
month,
2. translator = 400,000 N / month
3. graphic designer = 200,000 N /
month
4. 1,000N / brochure
5. 0 N (no cost) / VCU
17,404,000
4.7.1,
4.7.2
Compilation of information into a
National Food-Based Dietary
Guidelines, using contextually
appropriate, easy to understand
language
*
1.a Nb of months for nutrition expert
1.b Nb of months for communication
expert
1.c Nb of months for laboratory
expert
2. Nb of months for translation
3. Nb of months for graphic design
4. Nb of Guidelines disseminated and
distributed
1.
1.a nutrition expert (1 year),
1.b communication expert (6
months),
1.c laboratory assistance (2 months)
2. 2 months for each of 3 translators
3. graphic designer (2 months)
4. 200,000 / State
1.a nutrition expert: 300,000 /
month
1.b communication expert: 200,000
/ month
1.c laboratory assistance: 300,000 /
month
2. 300,000 / month
3. 200,000 / month
4. 1,000 / guideline
7,426,400,000
4.8.1
Compilation of information into 5
recipe books using contextually
appropriate measurements and
language
*
1. Nb of months for consultation in
recipe book production process
1.a nutrition expert
1.b Laboratory analysis
2. Nb of months for translation of
recipe books
3.a Nb of months for graphic design
3.b Nb of recipe books distributed
1. 1.a 9 months
1.b 5 months
2. 4 laboratory assistants, 2 months
3. 50,000 / geographical zone =
300,000
1. 1.a nutrition expert = 300,000 /
month
1.b Laboratory assistance = 300,000
/ month
2. translator = 300,000 / month
3. graphic designer (1 months)
2,500 N / recipe book
4. 50,000 / Geographical zone
776,200,000
6.4.2
Review of existing agricultural
curricula to identify appropriate entry
points for nutrition modules
1. Nb of days for consultations to
review ag curricula and identify entry
points
2. Nb of validation meetings
1. 2 consultants (20 days each)
2. 2 validation meetings
1. 150,000 N each / day
2. 2,500,000/ meeting
3. 16,000,000
C.7.2 BEHAVIOR CHANGE COMMUNICATION 18,948,100,000
2.4.1 &
4.7.2
Social mobilization among the public
about how to get the best out of your
food (including food based dietary
guidelines, the benefits of fortified
foods and bio-fortified crops and how
to identify them, etc.)
1. Nb of sensitization campaigns
2. Nb of community mobilization
officers/LGA NOA Officers
1. 1 campaign/ ward = 10,000
campaigns
2. 1 / LGA = 774 community
mobilization officers/LGA NOA
Officers
1. 1.5 M N / campaign
2. 1 Officers / day = 50,000 15,038,700,000
4.8.3
Support for the use of recipe book in
food demonstration sessions in
primary health care centres and
schools
**
1. Nb of primary health care centres
receiving food demonstration using
recipe book
2. Nb of schools receiving food
demonstration using recipe book
1. 1 / ward = 10,000
2. 1 / ward = 10,000
1. 200,000 / demonstration session
2. Food: 12,000 2,120,000,000

87
Output
Nb NUTRITION EDUCATION & BCC
EXPECTED
IMPACT INDICATORS TARGETS UNIT COST
TOTAL COST/
INVESTMENT
4.9.2
Scripts are developed around
messages for broadcast, and a weekly
family radio programme "Eating well
for a healthy life" is launched
**
1. Nb of radio broadcasts
2. nb radio scripts developed
3. nb radio messages regularly
propagated
1. 3 radio spots / week for 48 weeks /
year
2. Development
3. Propagation
1
2. 500,000 / spot
3. 100,000 / spot 182,400,000
6.4.1
Development of nutrition content as
modular format into agricultural
training
*
1. Nb of stakeholder meetings
2. Nb of consultants engaged to
develop nutrition modules
3. Nb of validation meetings
1. 3 stakeholders meetings
2. 3 consultants engaged
3. 2 validation meetings for nutrition
modules
1. 6.4 M / meeting
2. 150,000/day each for 3
consultants for 60 days
3. 6.4 M/ meeting
59,000,000
2.3.3
Focus group discussions with
cooperative members for selection of
commodities with nutritional added
value
*** 1. Nb of focus group discussions 4 stakeholder meeting/year 500,000M / focus group discussion 1,548,000,000
Output
Nb OPERATIONAL RESEARCH
EXPECTED IMPACT
INDICATORS TARGETS UNIT COSTS TOTAL COST/
INVESTMENT
C.8.1 PRODUCTION / CROP VARIETIES
360,627,500
1.5.2 Identification and compilation of country-specific
commodities and corresponding international MRLs *
1. Nb of days for consultations to
draft document
2. Nb of validation meetings
3. Nb of documents printed
1. One consultant to conduct research,
including travel for data gathering and
consultations
2. 1 validation meeting with members
of National Codex Committee
3. 250 copies
1. Consultant days:
N150,000 = N3,000,000 for
20
2. 2 validation meeting:
N2,520,000
3. 2,500
6,145,000
1.5.2 Research and consultations to establish MRLs
within national context *
1. Nb of days for consultations
2. Nb of consultative meetings
3. Nb of commodities collected
4. Nb of lab analyses
1. 20*2 day consultations to conduct
research, including travel for data
gathering and consultations
2. 3 Consultative meetings with
members of National Codex
Committee on related issues and data
sources
3. Collection of commodities from
across the country
4. Nb of laboratory analyses
1. Consultant days:
N150,000 = N6,000,000 for
40 days
2. 3 consultative meetings:
N4,000,000 per meeting X
3. Collection of
commodities from across
the country: N700,000
4. Laboratory analyses of
samples: N5,000,000
42,920,000
1.6.1 Compilation of food safety standards for different
commodities
1. Nb of days for consultations to
draft document
2. Nb of validation meetings
a. One consultant to conduct research,
and compile
b. 3 validation meetings
1. Consultant man days:
N150,000 = N2,250,000 for
15 days
2. validation meeting =
2,500,000
17,250,000
1.7.1
Research to identify formal and informal warehouse
receipt systems, commodities exchange boards,
aggregation centres, and similar facilities/ systems
1. Nb of days for consultants
producing research reports
2. Nb of validation meetings
1. One consultant to conduct research
for 38 days
2. 3 validation meetings
a. Consultant days:
N150,000 = N5,700,000 for
38 days 10,700,000

88
Output
Nb OPERATIONAL RESEARCH
EXPECTED
IMPACT INDICATORS TARGETS UNIT COSTS
TOTAL COST/
INVESTMENT
1.7.1 Documentation of facilities/ systems, commodities
1. Nb of days for consultants to
documenting list of facilities/
systems
2. Nb of validation meetings
One research consultant
a. Consultant man days:
N150,000 = N300,000 for 2
days 5,500,000
1.8.4 Document and validate that domestic production
has been significantly increased
1. Nb of days for consultants to
documenting domestic production
increase
2. Nb of validation meetings
1. One consultant to conduct research
for one week
2. 1 validation meetings
a. Consultant man days:
N150,000 / day 3,550,000
2.1.1 Identification of fruits and/or vegetables farmers
associations to meet companies demands
1. Nb of lists of fruits/vegetables
farmers associations and production
capacity established
1.a Nb of staff in charge of
identification
a. Three staff of the horticultural
division working for 5 days
a. Staff man days: N5,000
per staff per day X 3 =
N75,000 75,000
2.2.1 Identification of the necessary inputs, including feed
and medicines, for rearing locally consumed animals
Nb of staff in charge of listing inputs
used for rearing locally consumed
animals by state
Two staff of State Ministry of
Agriculture in each state working for
3 days
Staff man days: N5,000 per
staff per day X 2 staff X 3
days X 37 states =
N1,110,000
1,735,000
2.2.1 Research to identify ways to safely, sustainably, and
efficiently supply feed and water for animal
production
Nb of research reports produced by
consultants
One consultant to conduct research
and write report for
Consultant man days:
N150,000 / day 2,125,000
2.2.1 Research local ways to process and package animal
foods into locally consumed products
Nb of research reports produced by
consultants
One consultant to conduct research
and write report
Consultant man days:
N150,000 2,125,000
2.4.2
Complementary research to support the local
adaptation of internationally available varieties of
iron, zinc rice, and vitamin A bio-fortified crops;
development of contextually appropriate varieties;
and field test varieties
Nb of research reports produced by
research institutes
One research institute to conduct
research and write report 95,000,000
2.6.2
Identification of indigenous vegetables in each
livelihood zone and research to identify conditions
necessary for the growth of indigenous vegetables
Nb of surveys on indigenous
vegetables in each livelihood zone/
state is available produced by
consulting firms
One consultant to conduct research
and write report for
Consultant man days:
N150,000 4,325,000
4.2.1 Research on crops and plant breeding systems to
enhance nutritional attributes
1. Nb of research institutes selected
through competitive bids
2. Nb of universities involved in the
research
1. Institute selected between research
institutes and agriculture universities
1. contract to 1 research
institute: N50,000,000 per
institute 152,500,000
4.2.2 Field trials of developed crop varieties
Nb of farmers supported for the new
varieties field trials
1 Kg of seeds supplied
2. L of pesticides
3. kg of fertilizers
1. 175 farmers
2. 175 field trials
3.
1.
2. 7,927,500

89
Output
Nb OPERATIONAL RESEARCH
EXPECTED
IMPACT INDICATORS TARGETS UNIT COSTS
TOTAL COST/
INVESTMENT
4.7.1 Grouping of all foods eaten locally into food groups,
based on similarities in nutrient composition
Nb of research reports produced by
research consultant
One research consultant to conduct
research and write report
Consultant man days:
N150,000 = N3,000,000 for
20 days 5,125,000
5.2.1 Identification of suitable mixed cropping or mixed
farming systems for intervention livelihood zone
Nb of research reports produced by
research consultant
a. One research consultant to conduct
research and write report
b. Stakeholders meeting for validation
and consultation
a. Consultant man days:
N150,000 = N3,000,000 for
20 days
b. 1 Stakeholders meeting:
N4,240,000
3,625,000
C.8.2 DEVELOPMENT OF NUTRIENT-DENSE PRODUCTS 91,875,000
1.1.1 Identification, standardization, and documentation
of best practices in the production of each
commodity (including nutrition dense commodities)
Research report is available a. One research consultant to conduct
research and write report
a. Consultant man days:
N150,000 = N6,000,000 for
40 days
6,625,000
2.1.2
Research to identify packaging solutions and other
technology to increase shelf-life of fruits and
vegetables, while maintaining nutrient content
Research report is available
a. One research institute appointed
through a bidding process to conduct
research and write report
a. Contract to research
institute: N25,000,000 25,625,000
4.3.1 Identification of foods to improve nutrition
properties through processing in each food
1. Nb of research reports
2. Nb of tests to determine
palatability of organoleptic
properties
1. Contract to Federal Institute of
Industrial Research, Oshodi (FIIRO)
1. and 2. Institutional
support to FIIRO:
N50,000,000 50,625,000
4.8.1 Development of standard recipe book compiling
locally eaten recipes, their nutrient contents and
nutritional contribution
Standardized recipe book containing
serving sizes of recipes and nutrient
contents in one serving
a. Research consultant to conduct
research and write report
a. Consultant man days:
N150,000 = N9,000,000 for
60 days
9,000,000
C.8.3 IDENTIFICATION OF GROUPS WITH POTENTIAL TO BENEFIT ACTIVITIES 23,125,000
1.8.2 Research on the agricultural credit approval process
and turnaround time
Research report available and
evidence based insurance premiums
available
a. Research consultant to conduct
research and write report
a. Consultant man days:
N150,000 = N3,000,000 for
20 days 3,625,000
4.7.1 Development of food based dietary guidelines
a. Local dietary reference intakes
available
b. Food based dietary guidelines are
developed and available
a. Nutrition education consultant to
conduct research and write report
b. 3 Stakeholders meeting to validate
dietary reference intakes and food
based dietary guidelines
a. Consultant man days:
N150,000 = N9,000,000 for
60 days
b. Stakeholder meetings:
N4,900,000 per meeting X
3 meetings
19,500,000
C.8.4 TECHNOLOGIES
38,700,000
1.4.1 Research to identify entry points of aflatoxin
contamination in susceptible crops and dialogue
with subject matter specialists
1. Nb of consultants for the aflatoxin
research
2. Nb of consultation meetings with
subject matter specialists
3. Nb of validation / dialogue
meetings
1. 1 consultant for 60 days
2. 2 total
3. 1 validation meeting / year
1. 150,000 / day
2. 600,000
3. 5M
12,200,000

90
Output
Nb OPERATIONAL RESEARCH
EXPECTED
IMPACT INDICATORS TARGETS UNIT COSTS
TOTAL COST/
INVESTMENT
2.6.3 Identification of contextually adaptable innovations
for limited land home gardening, such as keyhole
gardens and raised bed gardens
1. Nb of consultants for the
identification of innovations for
home-gardening
2. Nb of validation meetings
1. 1 consultant for 60 days
2. 1 validation meeting / year
1. 150,000 / day
2. 5M
11,000,000
4.2.2
Laboratory tests on harvests from new varieties to
ensure that enhanced nutritional attributes are
retained in real world setting
Nb of new varieties tested through
laboratory At least 15 new varieties 5 M / lab sample test 15,500,000
Output
Nb CAPACITIES
EXPECTED
IMPACT INDICATORS TARGETS UNIT COSTS
TOTAL COST/
INVESTMENT
C.9.1 PLANNING & MANAGERIAL CAPACITY AT ALL LEVELS 4,341,050,000
1.1.3 Organization/identification of
producer/farmer associations *
1. Nb of smallholder producer
associations formed
1a. Nb of producer associations
registered with CAC
1b. Nb of producer associations
registered with institutional markets
2. Nb of facilitators supporting
formation of producer groups
2a. Nb of travels for facilitators
2b. Nb of days of facilitation
1. 20 associations/ state (each association
with 100 members)
Total is 740 associations
1a. 740 associations registed with CAC
1b. 740 associations registered with
financial institutions (Insurance, banks)
2. 74 facilitators (2 per state)
2a. 1 travel per facilitator per year
2b. 50 days of work / facilitator / yr
1a. N100,000 per CAC registration
1b. N10,000 per institutional market
registration
2a. N100,000/ person/ trip for 4 trips
2b. N20,800 DTA/day for 50 days per
year for 4 years
418,840,000
1.1.3,
1.4.2,
1.2.2
Establishment of commodity-specific
demonstration plots (through FFSs
where available), including
demonstration of aflatoxin control
measures, use of improved
technologies
*
1. Nb of hectares of land of
demonstration plots
2. Nb of kg of seeds used in
demonstration plots
3. Nb of kg of fertilizers used in
demonstration plots
4. Nb of litres of herbicides used
5. Nb of litres of insecticides used
6. Nb of packaging materials used
7. Nb of farm operators
8. Nb of small water pumps
9. Nb of metres of hoses
10. Nb of washbores
11. Nb of improve technologies
available for demonstration plot
1. 0.25 hectares per LGA in each LGA =
0.25 * 774 demonstration plots = 193.5
hectares
2. 6.25 kg / LGA
3. 50 kg / LGA
4. 1 litre / LGA
5. 1 litre / LGA
6. 10 packaging materials/ LGA
7. 1 farm operator/ LGA
8. 1 water pump/ demonstration plot
9. 10 meter roll / LGA
10. 1 washbore per LGA
11. 2 technologies per LGA (1 ton metal
silo and 10 hermatic storage bag)
1. 0 N (free)/ 0.25 hectares of land
2. 4,375 N for 6.25 kg of seeds
3. 8,000 N for 50 kg of fertilizer
4. 1,200 N per litre of herbicide
5. 1,800 N per litre of insecticide
6. 6,000 N for 10 packaging materials
7. N30,000 per farm operator (15 man
days) per month
8. 80,000 per LGA
9. 4000 N per LGA
10. 60,000 N per LGA
11. 25,000 N per LGA
1,311,543,000

91
Output
Nb CAPACITIES
EXPECTED
IMPACT INDICATORS TARGETS UNIT COSTS
TOTAL COST/
INVESTMENT
1.1.3 Training of producer associations
Nb of training held
1. Nb of training venue
2. Nb of farmers trained
3. Nb of trainers
4. Nb of training leaflets
2 trainings per year (2 days each) for four
years/ LGA = Total of 6,192 trainings
1. 6,192 venues
2. 100 farmers/ training =619,200 farmers
3. 2 trainers/ training = 12,384 trainers
4. 100 leaflets/training = 619,200 leaflets
400, 000 N per training
(Farmer transportation=2,000 N/farmer
Lunch = 1,500 N per farmer and trainer
DTA for trainers = 16,000 N per trainer
Leaflets = 100 N per leaflet)
2,476,800,000
1.5.1 Targeted activities to develop
capacity to effectively attend National
Codex Committee (NCC) meetings
Nb. of meetings held to develop
technical papers to be presented to
NCC by FMARD
16 meetings to develop 10 technical
papers over four years 45,000 N per meeting 720,000
1.5.3
Development of (Codex MRLs)
education manuals for stakeholders
at different points of agricultural
value chains
1. Nb of consultants engaged to
develop education manuals
2. Nb of validation meetings held on
the education manuals
1. 1 consultant
2. 2 validation meetings
1. 500,000 N / month for 6 months
2. 5,000,000 / validation meeting 13,000,000
1.5.3 Information dissemination on
pesticide MRLs
1. Nb of copies of pesticide
information materials printed
2. Nb of formal launch event
1. 1,000 copies printed
2. 1 formal launch event
1. 2,500 N per copy
2. 520,000 N per launch event (venue,
refreshments and programme) 3,020,000
1.5.3
Training (of trainers) on guidelines of
actions that ensure conformity with
MRLs (Maximum Residue Levels)
1. Nb of trainings for master trainers 1 Master Trainers training (100 Master
trainers) 20,760,000 N per training 20,760,000
4.4.1 Technical assistance and support for
the conduct of such (potential-to-
benefit) studies
Nb of consultancy days for which
technical assistance is provided 30 consultancy days / year N150,000/ day 18,000,000
4.5.1
Support to each crop, fish and
livestock value chain units to identify
and compile crop/animal species
specific nutrition information
Nb of consultancy days to compile
value chains specific nutrition
information
60 consultancy days 150,000 N per day 9,000,000
6.1.2
Development of training materials for
nutrition focal points within the
agricultural sector
1. Nb of consultancy days to develop
manual
2. Nb of validation meetings
3. Nb of manuals printed
1. 60 consultancy days
2. 2 validation meetings
3. 500 copies of manuals printed
23,050,000
6.1.2
Identification and training and re-
training of appointed nutrition focal
points at federal, state, and LGA
levels
1. Nb of trainings for master trainers
held
2. Nb of trainings for focal points
held
1. 1 master training held (30 master
trainers trained)
2. 12 trainings for focal points (2 per geo-
political zone; 400 focal points trained
across the country)
1. 9,825,000 N per training
2. 6,082,000 N per training 46,317,000
C.9.2 CAPACITIES OF AGRICULTURE EXTENSION WORKERS AT ALL LEVELS 8,334,554,000
1.1.2,
1.2.2,
1.4.2,
2.2.3,
6.2.1,
6.2.2
Training Extension Agents (EAs) on
GAPs; nutrition; and other activities
related to the implementation of the
sub-components in the AFSN
Strategy
1. Nb of consultancy days to develop
extension agents manual for the
agricultural sector food security and
nutrition strategy
2. Nb of validation meetings for the
extension agents manual
1. 240 consultancy days
2. 4 consultation/ validation meetings
3. 3 translations of extension agents
manual
4. 40,000 extension agents manual printed
5. 3 trainings for master trainers (35
1. 150,000 N / consultancy day
2. 10,000,000 N per consultation/
validation meeting
3. 100,000 N per translation of extension
agents manual
4. 2,500 N per manual printed
7,334,300,000

92
Output
Nb CAPACITIES
EXPECTED
IMPACT INDICATORS TARGETS UNIT COSTS
TOTAL COST/
INVESTMENT
3. Nb of translations of extension
agents manual
4. Nb of extension agents manual
printed
5. Nb of trainings for master trainers
6. Nb of trainings for extension
agents
master trainers per training)
6. 222 trainings for extension agents per
year (6 trainings per state per year, to
train a total of 10,000 extension agents
per year, for four years)
5. 18,000,000 N per training
6. 8,000,000 N per training
1.4.2
Cascading of audience specific
(aflatoxin) training to processors,
distributors and other actors along
susceptible value-chains
1. Nb of trainings for processor
associations
2. Nb of trainings for marketing
association
1. 1 processor association training per
state per year (37 trainings per year for
four years)
2. 1 marketing association training per
state per year (37 trainings per year for
four years)
1. 2,256,000 N per training
2. 2,256,000 N per training 667,776,000
1.5.4
Training to regulatory agencies on
use of pesticide MRLs test kits and
adequate sampling procedures
Nb of trainings for regulatory
agencies
1 training per geo-political zone (10
agents recruited across NAFDAC and
SON trained per state)
4,538,000 N per training 27,228,000
2.6.1
Provision of extension support
centres that can assist households in
resolving challenges with home
gardening
1. Nb of extension support centres
established
2. Nb of extension agents staffing
extension support centres
3. Nb of motorcycles to transport
extension agents
1. 5 functional centres per state
2. 2 extension agents as permanent staff
of the centre
3. 1 motorcycle per centre
1. 200,000 N per centre (cost of
refurbishing and furnishing offices)
2. 600,000 / agent/ year/ centre
3. 250,000 per centre
305,250,000
C.9.3 CAPACITY ENHANCEMENT IN THE USE OF TECHNOLOGIES 95,787,000
1.3.1 Appropriate training of personnel (on
gamma irradiation)
Nb of trainings for personnel on
gamma irradiation 1 training for 20 personnel 3,967,000 per training 3,967,000
6.5.2
Development of training materials for
the construction/repair/maintenance
of each applicable technology
1. Nb of consultancy days for the
development of training materials
2. Nb of validation meetings for
manual
3. Nb of training materials printed
1. 60 consultancy days
2. 2 validation meetings
3. 1,000 training materials printed
1. 150,000 N per day
2. 5,000,000 N per validation meeting
3. 2,500 N per training material 21,500,000
6.5.2
Identification and training of trainees
for each feasible technology in
interventions LGAs (based on LGA
list of feasible technologies)
1. Nb of trainings of master trainers
2. Nb of trainings of trainees for
different technologies
1. 1 training of master trainers for 10
master trainers
2. 10 trainings of trainees for 400 trainees
from 380 LGAs (40 trinees per training)
1. 5,220,000 N per training
2. 6,510,000 N per training 70,320,000
C.9.4 CAPACITY DEVELOPMENT AMONG BENEFICIARIES 3,916,073,000
2.3.3
Training and agribusiness
development for farmer associations
to supply the quality and quantity
demanded (by P4HNF)
Nb of trainings held for farmers
associations
144 trainings of farmers associations
(6 farmer associations (100 members
each) trainings per geo-political zone per
year)
3,000,000 per training 432,000,000
2.6.3 Training of (urban) households on
technology (for innovative gardening
approaches)
Nb of trainings for urban households
335 trainings (20 trainings in each of 10
high density urban states and 5 trainings
in each of 27 other states)
600,000 N per training 201,000,000

93
Output
Nb CAPACITIES
EXPECTED
IMPACT INDICATORS TARGETS UNIT COSTS
TOTAL COST/
INVESTMENT
2.2.3
Establishment of demonstration
farms for livestock, poultry and
fishery (through FFSs where
available)
*
1. Nb of animal farms constructed
2. Nb of starter stock (animals) used
3. Nb of kg of feed used
4. Nb of mls of assorted veterinary
drugs and vaccines used
5. Nb of technical assistants
6. Nb of animal farm equipment
(feeder and drinkers)
1. 1 animal-specific farm per LGA
2. 50 day old chicks/ 2 goats/ 2 sheep/ 200
fish fingerlings/ 1 cow per LGA
3. 100 kg of feed per LGA
4. 50 mls / LGA
5. 9 technical assistants per state (3 per
senatorial disctrict)
6. 2 farm equipment per LGA
1. 125,000 N for construction of farm
structures per LGA
2. 30,000 N per LGA
3. 20,000 N per LGA
4. 2,500 N per LGA
5. 30,000 N per technical assistant per
month
6. 2,000 N per LGA
148,923,000
1.1.3 Training of animal producer
associations
Nb of training held
1. Nb of training venue
2. Nb of animal farmers trained
3. Nb of trainers
4. Nb of training leaflets
1 training (2 days each) per LGA = Total
of 744 trainings
1. 744 venues
2. 50 farmers / training = 37,200 farmers
3. 2 trainers/ training = 1,548 trainers
4. 50 leaflets per training = 37,200 leaflets
225, 000 N per training
(Transportation for farmers = 2,000 N
per farmer
Lunch = 1,500 N per farmer and trainer
DTA for trainers = 16,000 N per trainer
Leaflets = 100 N per leaflet)
174,150,000
4.8.3 Training of primary health care staff
and school teachers on recipe book
1. Nb of trainings held for primary
health care workers
2. Nb of trainings held for school
teachers
1. 5 trainings (2 days each) per state =
Total of 185 trainings
2. 5 trainings (2 days each) per state =
Total of 185 trainings
1. 8,000,000 N per training
2. 8,000,000 N per training 2,960,000,000
Output
Nb MONITORING AND EVALUATION
EXPECTED
IMPACTS INDICATORS TARGETS UNIT COSTS
TOTAL COST/
INVESTMENT
C.10.1 Baseline assessment and survey design 3,390,570,800
4.1.1 Conduct for National Food
consumption and Nutrition Survey See details in table ''detail costs'' See details in table ''detail costs''
See details in table ''detail costs''
(includes costs for collecting,
shipping, and analyzing blood and
food samples)
3,313,734,800
6.7.3
Creating a knowledge management
platform to assist states/LGAs in
conducting nutrition assessments,
designing interventions, targeting,
and implementing interventions
1. Nb of Stakeholders meeting
2. Nb of managment meeting to
validate the platform
3. Nb of consultant engaged
4. Nb of supporting tools for the
operationilization of the platform
5. Technical supervision/State
1. 4 Stakeholders meeting
2. 2 management meeting
3. 2 consultants
4. 37 computerized tools
5. 37 Technical supervision
1. N4,964,000/stakeholders
meeting
2.N 612,000 / management
meeting
3. N500,000/ month
4. N500,000/tool/State
5. N100,000/technician/month
37,724,000
C.10.2 Data management (collection, compilation) 301,041,800
2.2.4
Updating the list of available animal
production extension and veterinary
services by State, specifying physical
location of service providers
1. Nb of enumerators for data
collection 1 enumerator / LGA / 2 day/ twice a year 1. 5,000/ day for enumerator 37,848,000

94
Output
Nb MONITORING AND EVALUATION
EXPECTED
IMPACTS INDICATORS TARGETS UNIT COSTS
TOTAL COST/
INVESTMENT
2.3.3 Assessment of farmer association
production capacity for food crops
destined for mandatory fortification
1. Nb of stakeholder meeting
2. Nb of Monitors
1. 2 stakeholder meeting/year
2. 2 Monitors / LGA /2 day
1. N4 M /stakeholders meeting
2. 25,000 / day with transportation 170,800,000
2.8.1
Compile list of primary / secondary
schools (from Ministry of Education)
and extension agents (from MoA) by
LGA and wards
1. Nb of contacts by State
2. Nb of validation meetings
1. 2 / State
2. 1 validation meeting / State
1. /
2. 305,000
11,285,000
4.4.1
Promotion of mini-studies prior to the
implementation of any sub-
component to target the most
vulnerable beneficiaries
1. Nb of mini studies through
consultations
2. Nb of printed mini studies
1. at least 100 mini studies = 2 days / study
2. 250 printings
1. 150,000 N / day 30,625,000
6.2.2
Mapping nutrition related
institutions, compiling nutrition
services provided for each LGA and
developing decision making flow chart
1. Nb of contacts by State
2. Nb of validation meetings
1. 2 / LGA
2. 6 validation exercise / State
1. /
2. 800,000 29,600,000
6.7.1
Mapping of food and nutrition
situation at State and LGA level
through collection and compilation of
relevant information
1. Nb of enumerators
2. Nb of supervisors
3. Nb of monitors
4. Nb of enumerators trainings
5. Nb of consultants
6. Nb of reports printed
1. 1 / LGA
2. 1/ 10 LGAs
3. 1/ 20 LGAs
4. 2 trainings
5. 1 consultant / geopolitical zone
1.
2. N560,000 / monitor
4. 908,000 / training
5. N500, 000 / month
20,883,800
C.10.3 Regular monitoring and tracking 100,218,000
2.4.1
Compilation of best practices for the
production and utilization of available
varieties of orange flesh sweet potato,
pro-vitamin A cassava, yellow maize,
and iron sorghum
1. Nb of stakeholder meeting
2.Nb of Monitoring activities
3. Nb of Monitors deployed to collect
food security and nutrition data
4. Nb of Consultant
1. 2 stakeholder meeting/year
2. 2 Monitoring activities
3. 2 Monitors/State/10day
4. 1 Consultant/10days
1. N4,964,000/stakeholders
meeting
3. N560,000 / monitor
4. N500, 000 / month
18,625,000
2.7.1 Compile best practices for
maximizing mixed farming systems 1. Nb of focal State persons 1. 1 / State = 37
1. 8000,000 for field visits by
focal State person
2. 500,000 / day
3. 2,500 / printed report
40,225,000
4.6.2
Label monitoring and regulation is
integrated into routine activities of
SON and NAFDAC
Nb of advocacy / consultative
meetings 7,368,000
6.6.4 Tracking and assessing the M&E
framework indicators
1. Nb of in house trainings
2. Nb of consultations for expert = 5
day / year
1. 1 / year
2. 500,000 / training
1. N4,964,000/stakeholders
meeting
2. . N560,000 / monitor
3. N500, 000 / month
34,000,000

95
GLOSSARY
Nutrition is the intake of food, considered in relation to the body’s dietary needs”.
Aflatoxins are poisons produced by Aspergillus fungi species, and colonized on food crops both on-
farm and off-farm, in warm temperatures, favourable moisture conditions, and through pest damage
Food access is a function of the physical, social, and policy environment that determine how
effectively households are able to use their resources (capital, labour, knowledge, and others) to meet
their food security objectives. Access is therefore ensured when all households and all individuals
within those households have sufficient resources to obtain appropriate foods for a nutritious diet.
Food availability refers to the physical existence of food whether from individual production or from
the market. It is a combination of domestic food production, commercial food imports, food aid, and
domestic food stocks, as well as the underlying determinants of all of these factors.
Food security “is a situation that exists when all people, at all times, have physical, social and
economic access to sufficient, safe and nutritious food that meets their dietary needs and food
preferences for an active and healthy life. It has four pillars – food availability, food access, food
utilization, and food stability”.
Food stability means that households should not risk losing access to food as a consequence of
sudden shocks (climatic crisis, price fluctuations) or cyclical events (e.g. seasonal food insecurity) or
conflict.
Food systems refer to “the production, marketing, transformation and purchase of food, and the
consumer practices, resources and institutions involved in these processes”
Food utilization means that “food is properly used; proper food processing and storage techniques
are employed; adequate knowledge of nutrition and child care techniques exists and is applied; and
adequate health and sanitation services exist”.
Malnutrition occurs if diets do not provide adequate calories, protein, and micronutrients for growth
and maintenance or a person is unable to fully utilize the food eaten due to illness (undernutrition).
Malnutrition also occurs if too many nutrients are consumed (overnutrition).
Nutritious foods or nutrient-dense foods are foods that have a meaningful amount of multiple
nutrients. They include animal-source foods (including fish, meat, eggs, and dairy products), fruits
and vegetables, bio fortified staples, fortified foods, and traditional local crops (including neglected
and underutilized species and wild foods).

96