Personalized Nutrition - MDPI
156
Personalized Nutrition George Moschonis, Katherine Livingstone and Jessica Biesiekierski www.mdpi.com/journal/nutrients Edited by Printed Edition of the Special Issue Published in Nutrients nutrients
-
Upload
khangminh22 -
Category
Documents
-
view
0 -
download
0
Transcript of Personalized Nutrition - MDPI
Personalized Nutrition
George Moschonis, Katherine Livingstone and Jessica Biesiekierski
www.mdpi.com/journal/nutrients
Edited by
Printed Edition of the Special Issue Published in Nutrients
nutrients

Personalized Nutrition


Personalized Nutrition
Special Issue Editors
George Moschonis
Katherine Livingstone
Jessica Biesiekierski
MDPI • Basel • Beijing • Wuhan • Barcelona • Belgrade

Katherine Livingstone Deakin University Australia
Special Issue Editors George Moschonis
La Trobe University
Australia
Jessica BiesiekierskiLa Trobe University Australia
Editorial Office
MDPISt. Alban-Anlage 66 4052 Basel, Switzerland
This is a reprint of articles from the Special Issue published online in the open access journal Nutrients
(ISSN 2072-6643) from 2018 to 2019 (available at: https://www.mdpi.com/journal/nutrients/
special issues/Personalized Nutrition)
For citation purposes, cite each article independently as indicated on the article page online and as
indicated below:
LastName, A.A.; LastName, B.B.; LastName, C.C. Article Title. Journal Name Year, Article Number,
Page Range.
ISBN 978-3-03921-445-7 (Pbk)
ISBN 978-3-03921-446-4 (PDF)
c© 2019 by the authors. Articles in this book are Open Access and distributed under the Creative
Commons Attribution (CC BY) license, which allows users to download, copy and build upon
published articles, as long as the author and publisher are properly credited, which ensures maximum
dissemination and a wider impact of our publications.
The book as a whole is distributed by MDPI under the terms and conditions of the Creative Commons
license CC BY-NC-ND.

Contents
About the Special Issue Editors . . . . . . . . . . . . . . . . . . . . . . . . . . . . . . . . . . . . . vii
Jessica R. Biesiekierski, Katherine M. Livingstone and George Moschonis
Personalised Nutrition: Updates, Gaps and Next StepsReprinted from: Nutrients 2019, 11, 1793, doi:10.3390/nu11081793 . . . . . . . . . . . . . . . . . . 1
Barbara Brayner, Gunveen Kaur, Michelle A. Keske and Katherine M. Livingstone
FADS Polymorphism, Omega-3 Fatty Acids and Diabetes Risk: A Systematic ReviewReprinted from: Nutrients 2018, 10, 758, doi:10.3390/nu10060758 . . . . . . . . . . . . . . . . . . . 6
Elie Chamoun, Nicholas A. Carroll, Lisa M. Duizer, Wenjuan Qi, Zeny Feng,
Gerarda Darlington, Alison M. Duncan, Jess Haines, David W.L. Ma and
the Guelph Family Health Study
The Relationship between Single Nucleotide Polymorphisms in Taste Receptor Genes,Taste Function and Dietary Intake in Preschool-Aged Children and Adults in the Guelph FamilyHealth StudyReprinted from: Nutrients 2018, 10, 990, doi:10.3390/nu10080990 . . . . . . . . . . . . . . . . . . . 17
Kerstin Kempf, Martin Rohling, Katja Niedermeier, Babette Gartner and Stephan Martin
Individualized Meal Replacement Therapy Improves Clinically Relevant Long-Term GlycemicControl in Poorly Controlled Type 2 Diabetes PatientsReprinted from: Nutrients 2018, 10, 1022, doi:10.3390/nu10081022 . . . . . . . . . . . . . . . . . . 30
Enza D’Auria, Mariette Abrahams, Gian Vincenzo Zuccotti and Carina Venter
Personalized Nutrition Approach in Food Allergy: Is It Prime Time Yet?Reprinted from: Nutrients 2019, 11, 359, doi:10.3390/nu11020359 . . . . . . . . . . . . . . . . . . . 46
Edyta Adamska-Patruno, Lucyna Ostrowska, Joanna Goscik, Joanna Fiedorczuk,
Monika Moroz, Adam Kretowski and Maria Gorska
The Differences in Postprandial Serum Concentrations of Peptides That RegulateSatiety/Hunger and Metabolism after Various Meal Intake, in Men with Normal vs.Excessive BMIReprinted from: Nutrients 2019, 11, 493, doi:10.3390/nu11030493 . . . . . . . . . . . . . . . . . . . 62
Mads F. Hjorth, George A. Bray, Yishai Zohar, Lorien Urban, Derek C. Miketinas,
Donald A. Williamson, Donna H. Ryan, Jennifer Rood, Catherine M. Champagne,
Frank M. Sacks and Arne Astrup
Pretreatment Fasting Glucose and Insulin as Determinants of Weight Loss on Diets Varying inMacronutrients and Dietary Fibers—The POUNDS LOST StudyReprinted from: Nutrients 2019, 11, 586, doi:10.3390/nu11030586 . . . . . . . . . . . . . . . . . . . 73
Theresa Drabsch and Christina Holzapfel
A Scientific Perspective of Personalised Gene-Based Dietary Recommendations forWeight ManagementReprinted from: Nutrients 2019, 11, 617, doi:10.3390/nu11030617 . . . . . . . . . . . . . . . . . . . 85
v

George Moschonis, Maria Michalopoulou, Konstantina Tsoutsoulopoulou,
Elpis Vlachopapadopoulou, Stefanos Michalacos, Evangelia Charmandari,
George P. Chrousos and Yannis Manios
Assessment of the Effectiveness of a Computerised Decision-Support Tool for HealthProfessionals for the Prevention and Treatment of Childhood Obesity. Results from aRandomised Controlled TrialReprinted from: Nutrients 2019, 11, 706, doi:10.3390/nu11030706 . . . . . . . . . . . . . . . . . . . 99
Edyta Adamska-Patruno, Joanna Godzien, Michal Ciborowski, Paulina Samczuk,
Witold Bauer, Katarzyna Siewko, Maria Gorska, Coral Barbas and Adam Kretowski
The Type 2 Diabetes Susceptibility PROX1 Gene Variants Are Associated with PostprandialPlasma Metabolites Profile in Non-Diabetic MenReprinted from: Nutrients 2019, 11, 882, doi:10.3390/nu11040882 . . . . . . . . . . . . . . . . . . . 116
Jessica R Biesiekierski, Jonna Jalanka and Heidi M Staudacher
Can Gut Microbiota Composition Predict Response to Dietary Treatments?Reprinted from: Nutrients 2019, 11, 1134, doi:10.3390/nu11051134 . . . . . . . . . . . . . . . . . . 130
vi

About the Special Issue Editors
George Moschonis is Associate Professor and Head of the discipline Dietetics and Human Nutrition
at La Trobe University. During the last 15 years, he has built a strong research profile that is
internationally recognised, mainly due to his roles as Project Manager and Key Investigator in nine
interdisciplinary multicentre studies funded by the European Union. His main research interests are
the identification of determinants or predictors (starting from very early life stages) of obesity and
obesity-related cardiometabolic complications and the design, implementation, and evaluation of
the effectiveness of personalised nutrition and lifestyle optimisation intervention programs which
aim to tackle obesity and related co-morbidities (i.e., type 2 diabetes, cardiovascular disease, etc.) in
children and adults.
Katherine Livingstone is Lecturer in Population Nutrition in the School of Exercise and Nutrition
Sciences at Deakin University. Prior to being appointed as Lecturer, Dr Livingstone received
two international fellowships to establish her research program in dietary patterns, determinants
of dietary choices, and links to cardiometabolic health. Since completing her Ph.D. in 2013,
Dr Livingstone has published >50 peer-reviewed journal articles which have amassed over 1000
citations. She has supervised a number of Masters, Honours, and Ph.D. students in these areas.
Dr Livingstone also leads the research in better understanding the potential for personalised nutrition
approaches to improve dietary patterns and overall dietary behaviours, and has collaborated on a
pan-European personalised nutrition intervention.
Jessica Biesiekierski is Lecturer and Research Fellow in Dietetics and Human Nutrition at La Trobe
University. She has international research expertise in the dietary effects on gastrointestinal
physiology in health and disease, having completed her Ph.D. in the dietary management of
gastrointestinal disorders and postdoctoral research exploring gastric nutrient sensing, including
gastrointestinal motility, regulation of food intake, signalling pathways, and gut–brain interactions.
Dr Biesiekierski’s most notable research achievements include twice being awarded the international
Rome Foundation’s Award for the Most Cited Paper on Functional Gastrointestinal and Motility
Disorders (most recently in 2015 and also in 2013) for her seminal work on gluten sensitivity.
vii


nutrients
Editorial
Personalised Nutrition: Updates, Gaps and Next Steps
Jessica R. Biesiekierski 1,*, Katherine M. Livingstone 2 and George Moschonis 1
1 Department of Dietetics, Nutrition and Sport, School of Allied Health, Human Services and Sport,La Trobe University, Bundoora VIC 3086, Australia
2 Institute for Physical Activity and Nutrition (IPAN), School of Exercise and Nutrition Sciences,Deakin University, Geelong VIC 3125, Australia
* Correspondence: [email protected]
Received: 29 July 2019; Accepted: 1 August 2019; Published: 2 August 2019
1. Introduction
Personalised nutrition approaches provide healthy eating advice tailored to the nutritional needsof the individual. Although there is no one definition for personalised nutrition, advice has typicallybeen based on the individual’s behaviours, biological characteristics, and their interactions [1]. Theobjective of personalised nutrition is to improve dietary habits for the prevention or treatment ofchronic disease, ultimately contributing to improvements in public health [2].
Two levels of the personalisation of nutrition advice have been conceived, which are based on theanalysis of current behaviours, phenotypic characteristics and biological responses to diet [3]. Thefirst level of personalised nutrition incorporates current behaviours and phenotypic characteristics(such as adiposity) to develop tailor-made dietary recommendations. The second level of personalisednutrition builds on the first layer but also takes into consideration the different responses to foodsand/or nutrients that are dependent on genotypic or other biological characteristics [3].
Although there is some randomised controlled trial (RCT) evidence for the effectiveness ofpersonalised nutrition advice [4], the scientific basis for personalisation of dietary advice is still in itsinfancy. The studies in this special issue of “Nutrients” bring together a series of recent clinical trialsand review articles that present new data and update critical thinking to the current scientific basisthat underpins personalised nutrition.
1.1. Behavioural Level of Personalised Nutrition
The first level of personalisation of nutrition advice requires the collection of information onan individual’s current eating habits, behaviours and phenotypic characteristics [3]. These data arecombined to provide personalised dietary advice tailored to these characteristics.
Maintaining sustained behavioural changes in personalised nutrition interventions is critical.Recent advances in technology have led to the development of behavioural tools to better facilitateadherence to personalised nutrition interventions. An example of this is demonstrated by Moschoniset al., who developed a computerised decision-support tool (DST) for use by paediatric healthcareprofessionals. The authors conducted an RCT designed to provide appropriate personalised nutritionmeal plans and lifestyle recommendations in 35 overweight children and their families with healthcareprofessional support [5]. After three months of intervention, the group receiving advice through theDST showed improved changes in dietary patterns and body weight composition compared to thecontrol group that received general recommendations [5].
Nutrients 2019, 11, 1793; doi:10.3390/nu11081793 www.mdpi.com/journal/nutrients1

Nutrients 2019, 11, 1793
1.2. Biological Levels of Personalised Nutrition
A number of studies in this special issue contributed to the scientific basis for personalisation basedon biological characteristics (i.e., biomarkers, genotype, and microbiota). This includes understandingof the biological response due to dietary modifications, ranging from high-carbohydrate or high-fatmeal challenges to whole diet interventions, and indicators of health and disease risk, includingdiabetes, obesity and appetite regulation.
1.2.1. Biomarkers
Hjorth et al. utilised fasting plasma glucose, fasting insulin and a homeostatic model assessmentof insulin resistance (HOMA-IR) as prognostic markers of long-term weight loss. These biomarkerswere assessed in 811 overweight adults following diets differing in carbohydrate, fat, and proteincontent [6]. After 24 months of dietary intervention, subjects with normal glycemia lost the mostweight on the low-fat/high-protein diet, subjects with high HOMA-IR had the highest weight loss onthe high-fat/high protein diet, and subjects with prediabetes and low fasting insulin benefited mostfrom higher intakes of dietary fibre (≥35 g/10 MJ) [6].
Glycemic control was also investigated by Kempf et al., who conducted a 12-week RCT in adultswith type 2 diabetes risk (T2D) with poorly controlled glucose levels (HbA1c ≥ 7.5%). Individualswere randomised to either a two- or three-meal replacement therapy. In weeks 2–4 of the intervention,both groups reintroduced a low carbohydrate lunch based on individual adaption to self-monitoringof blood glucose (SMGB), followed by breakfast reintroduction after week four and a final follow-upperiod at week 12 [7]. The findings showed that the individualised meal replacement accompanied withSMBG demonstrated beneficial reduction in HbA1c and other cardiometabolic risk factors in T2D [7].Furthermore, the initiation of such an approach led to clinically relevant long-term improvements inHbA1c, compared to an observational control group that had standard care [7].
Further insights into the effective design of personalised meal plans was reported in a studyled by Adamska-Patruno et al. [8]. The authors conducted a crossover trial in 23 normal-weightand 23 overweight/obese adult males using meal challenges containing meals comprised of either ahigh-carbohydrate, normal carbohydrate or high-fat content [8]. Results showed that normal-weightmen had higher adiponectin and lower total ghrelin response after the high-carbohydrate meal and theoverweight/obese men showed higher fasting and postprandial leptin levels overall [8]. These findingsdemonstrate how differences in postprandial gastric hormone levels are dependent on macronutrientmeal composition and baseline body weight [8], highlighting the importance of regulating satiationand appetite sensations in the design of personalised interventions.
1.2.2. Genetics
Adamska-Patruno et al. conducted an acute meal-challenge study exploring gene variants andmetabolites for T2D [9]. A total of 28 non-diabetic men were divided into either high risk or lowrisk according to carriage of the rs340874 SNP in the prospero-homeobox 1 (PROX1) gene [9]. Ahigh or normal carbohydrate meal identified differences in postprandial metabolites associated withinflammatory and oxidative stress pathways, and bile acid signalling and lipid metabolism in PROX1high-risk genotype men [9].
A systematic review performed by Brayner et al. evaluated the association between the FADSpolymorphism, plasma long chain n-3 polyunsaturated fatty acids (PUFA) concentrations and risk ofdeveloping T2D [10]. Evaluation of five human observational studies and RCTs showed that FADSpolymorphism may alter plasma fatty acid composition, therefore playing a protective role in thedevelopment of T2DM, while plasma n-3 PUFA levels were not associated with T2DM risk [10].
Taste receptor genes were investigated in an acute study in in 44 families to investigate tastefunction and dietary intake [11]. Chamoun et al. found key differences between children and parentsas to which SNP in each of the sweet, fat, salt, umami and sour taste receptor genes was significantly
2

Nutrients 2019, 11, 1793
associated with taste preference [11]. Furthermore, a multiple trait analysis of taste preference andnutrient composition of diet in the children revealed that rs9701796 in the TAS1R2 sweet taste receptorgene was associated with both sweet preference and percent energy from added sugar in the diet [11].These findings suggest that for each taste preference, certain genetic variants are associated with tastefunction and thus, may be implicated in eating patterns.
1.2.3. Microbiota
A review of gut microbiota composition as a prediction tool for the clinical response after dietaryintervention was reported by Biesiekierski et al. [12]. Although there are data to show that the gutmicrobiota composition and inter-individuality in response to diet are linked, this review highlightedthat current data are too limited and inconsistent to support specific microbial signatures predictingresponse to dietary interventions [12]. This was true for both weight loss and/or glycaemic response inobesity, and symptom improvement in irritable bowel syndrome.
2. Remaining Challenges and Future Steps
There are a number of remaining research questions that require elucidation before theimplementation of personalised nutrition advice can be effectively and confidently incorporatedinto clinical practice. This special issue identified that the many factors responsible for inter-individualdifferences vary in response to diet and that there is a paucity of RCTs that incorporate all of thesefactors into the one personalised nutrition offering.
The existing literature and abovementioned studies show a predominate focus on weightmanagement and markers for T2D and obesity. There remain many other disease cohorts that areyet to be explored in relation to the appropriateness of personalised nutrition approaches. One areais individualised allergen avoidance advice. D’Auria et al. contributed a review addressing this,and highlighted that although personalised nutritional management of IgE mediated food allergyhas improved, especially with increased understanding of allergy phenotypes, more research isrequired [13].
To further assess genotype-based personalised nutrition, Drabsch and Holzapfel reported an overalllack of strong clinical evidence for using genetic variants for personalised dietary recommendations forweight management [14]. The authors highlighted the lack of evidence supporting the use of geneticdirect-to-consumer tests by evaluating a number of commercial companies offering gene-based dietaryrecommendations for weight loss [14]. Multidisciplinary intervention studies are necessary to providethe appropriate evidence on the effectiveness of these commercial tests.
The findings presented in this special issue will help inform the development and implementationof personalised nutrition approaches. The suggested sequence for implementation should follow astep wise approach beginning with the simplest level of personalising dietary advice, based on dietaryintake and behavioural and phenotypical characteristics, before progressing to the more complex levelthat includes the addition of biomarkers, genotypic and microbiota data [1]. Given the complexityof continually changing behavioural and biological information that are both influenced by diet andinfluence response to dietary interventions, the finer details of how best to implement such an approachare still to be elucidated through advances in big data and digital science.
Future research to strengthen the evidence for personalised nutrition should include largerRCTs of longer intervention duration that aim to assess the effectiveness of personalised nutrition onlong-term improvements in a variety of health outcomes. Moreover, future research should aim toaddress the current lack of consistency in the design of personalised advice across studies and theirchosen methodologies [12]. This special issue will aid researchers in the design of more effective andcomprehensive personalised nutrition research based on behavioural and biological characteristics.
3

Nutrients 2019, 11, 1793
3. Key Messages
This special issue on personalised nutrition presents a dynamic selection of reviews and originalresearch in the ongoing development of evidence informing personalised nutrition strategies. Despitegaps in the scientific evidence, the future holds bright for the continued advancement of personalisednutrition, and ultimately how behavioural and biological characteristics can be integrated intostep wise nutritional solutions specific to the needs of the individual for maintaining health andpreventing disease.
Author Contributions: J.R.B., K.M.L. and G.M. conceptualised and co-wrote this article.
Conflicts of Interest: The authors declare no conflict of interest.
References
1. Celis-Morales, C.; Livingstone, K.M.; Marsaux, C.F.; Forster, H.; O’Donovan, C.B.; Woolhead, C.;Macready, A.L.; Fallaize, R.; Navas-Carretero, S.; Wim, H.M.; et al. Design and baseline characteristics ofthe Food4Me study: A web-based randomised controlled trial of personalised nutrition in seven Europeancountries. Genes Nutr. 2015, 10, 450. [CrossRef] [PubMed]
2. Gibney, M.; Walsh, M.; Goosens, J. Personalized Nutrition: Paving the Way to Better Population Health, in GoodNutrition: Perspectives for the 21st Century; Eggersdorfer, M., Kraemer, K., Cordaro, J.B., Fanzo, J., Gibney, M.,Kennedy, E., Labrique, A., Steffen, J., Eds.; Karger Publishers: Basel, Switzerland, 2016; pp. 235–248.
3. Ordovas, J.M.; Ferguson, L.R.; Tai, E.S.; Mathers, J.C. Personalised nutrition and health. BMJ 2018, 361,bmj.k-2173. [CrossRef] [PubMed]
4. Celis-Morales, C.; Livingstone, K.M.; Marsaux, C.F.; Macready, A.L.; Fallaize, R.; O’Donovan, C.B.;Woolhead, C.; Forster, H.; Walsh, M.C.; Navas-Carretero, S. Effect of personalized nutrition on health-relatedbehaviour change: Evidence from the Food4me European randomized controlled trial. Int. J. Epidemiol. 2016,46, 578–588. [CrossRef] [PubMed]
5. Moschonis, G.; Michalopoulou, M.; Tsoutsoulopoulou, K.; Vlachopapadopoulou, E.; Michalacos, S.;Charmandari, E.; Chrousos, G.P.; Manios, Y. Assessment of the Effectiveness of a ComputerisedDecision-Support Tool for Health Professionals for the Prevention and Treatment of Childhood Obesity.Results from a Randomised Controlled Trial. Nutrients 2019, 11, 706.
6. Hjorth, M.F.; Bray, G.A.; Zohar, Y.; Urban, L.; Miketinas, D.C.; Williamson, D.A.; Ryan, D.H.; Rood, J.;Champagne, C.M.; Sacks, F.M. Pretreatment Fasting Glucose and Insulin as Determinants of Weight Loss onDiets Varying in Macronutrients and Dietary Fibers—The POUNDS LOST Study. Nutrients 2019, 11, 586.[CrossRef] [PubMed]
7. Kempf, K.; Röhling, M.; Niedermeier, K.; Gärtner, B.; Martin, S. Individualized Meal Replacement TherapyImproves Clinically Relevant Long-Term Glycemic Control in Poorly Controlled Type 2 Diabetes Patients.Nutrients 2018, 10, 1022. [CrossRef] [PubMed]
8. Adamska-Patruno, E.; Ostrowska, L.; Goscik, J.; Fiedorczuk, J.; Moroz, M.; Kretowski, A.; Gorska, M. TheDifferences in Postprandial Serum Concentrations of Peptides That Regulate Satiety/Hunger and Metabolismafter Various Meal Intake, in Men with Normal vs. Excessive BMI. Nutrients 2019, 11, 493. [CrossRef][PubMed]
9. Adamska-Patruno, E.; Godzien, J.; Ciborowski, M.; Samczuk, P.; Bauer, W.; Siewko, K.; Gorska, M.; Barbas, C.;Kretowski, A. The Type 2 Diabetes Susceptibility PROX1 Gene Variants Are Associated with PostprandialPlasma Metabolites Profile in Non-Diabetic Men. Nutrients 2019, 11, 882. [CrossRef] [PubMed]
10. Brayner, B.; Kaur, G.; Keske, M.; Livingstone, K. FADS Polymorphism, Omega-3 Fatty Acids and DiabetesRisk: A Systematic Review. Nutrients 2018, 10, 758. [CrossRef] [PubMed]
11. Chamoun, E.; Carroll, N.; Duizer, L.; Qi, W.; Feng, Z.; Darlington, G.; Duncan, A.; Haines, J.; Ma, D. TheRelationship between Single Nucleotide Polymorphisms in Taste Receptor Genes, Taste Function and DietaryIntake in Preschool-Aged Children and Adults in the Guelph Family Health Study. Nutrients 2018, 10, 990.[CrossRef] [PubMed]
12. Biesiekierski, J.R.; Jalanka, J.; Staudacher, H.M. Can Gut Microbiota Composition Predict Response to DietaryTreatments? Nutrients 2019, 11, 1134. [CrossRef] [PubMed]
4

Nutrients 2019, 11, 1793
13. D’Auria, E.; Abrahams, M.; Zuccotti, G.; Venter, C. Personalized Nutrition Approach in Food Allergy: Is ItPrime Time Yet? Nutrients 2019, 11, 359. [CrossRef] [PubMed]
14. Drabsch, T.; Holzapfel, C. A Scientific Perspective of Personalised Gene-Based Dietary Recommendations forWeight Management. Nutrients 2019, 11, 617. [CrossRef] [PubMed]
© 2019 by the authors. Licensee MDPI, Basel, Switzerland. This article is an open accessarticle distributed under the terms and conditions of the Creative Commons Attribution(CC BY) license (http://creativecommons.org/licenses/by/4.0/).
5

nutrients
Review
FADS Polymorphism, Omega-3 Fatty Acids andDiabetes Risk: A Systematic Review
Bárbara Brayner 1, Gunveen Kaur 2, Michelle A. Keske 2 and Katherine M. Livingstone 2,*
1 Laboratory of Nutritional Biochemistry, Centre of Health Science, Federal University of Rio de Janeiro,Rio de Janeiro 21941-902, Brazil; [email protected]
2 Institute for Physical Activity and Nutrition (IPAN), Deakin University, Geelong 3220, Australia;[email protected] (G.K.); [email protected] (M.A.K.)
* Correspondence: [email protected]
Received: 11 May 2018; Accepted: 11 June 2018; Published: 13 June 2018
Abstract: The role of n-3 long chain polyunsaturated fatty acids (LC n-3 PUFA) in reducing the riskof type 2 diabetes (T2DM) is not well established. The synthesis of LC n-3 PUFA requires fatty aciddesaturase enzymes, which are encoded by the FADS gene. It is unclear if FADS polymorphismand dietary fatty acid intake can influence plasma or erythrocyte membrane fatty acid profileand thereby the risk of T2DM. Thus, the aim of this systematic review was to assess the currentevidence for an effect of FADS polymorphism on T2DM risk and understand its associations withserum/erythrocyte and dietary LC n-3 PUFA. A systematic search was performed using PubMed,Embase, Cochrane and Scopus databases. A total of five studies met the inclusion criteria and wereincluded in the present review. This review identified that FADS polymorphism may alter plasmafatty acid composition and play a protective role in the development of T2DM. Serum and erythrocyteLC n-3 PUFA levels were not associated with risk of T2DM, while dietary intake of LC n-3 PUFA wasassociated with lower risk of T2DM in one study only. The effect of LC n-3 PUFA consumption onassociations between FADS polymorphism and T2DM warrants further investigation.
Keywords: FADS polymorphism; omega-3 fatty acids; type 2 diabetes
1. Introduction
Type 2 diabetes mellitus (T2DM) is a chronic disease that is characterized by an elevation ofblood glucose levels (fasting glucose >7 mmol/L or HbA1c >6.5%) [1]. T2DM is often preceded by aninsulin resistant state, where the normal biological response to the hormone insulin is impaired andinsulin production is disregulated (compensatory hyperinsulinemia) to maintain normoglycemia [2,3].The prevalence of T2DM and insulin resistance is increasing globally, affecting more than 400 millionpeople worldwide [4]. This is leading to increasing rates of co-morbidities, such as neuropathy,hypertension and cardiovascular disease, and their associated healthcare costs [4].
The determinants of T2DM include genetic risk, poor diet and a sedentary lifestyle. It is estimatedthat 40% of first-degree relatives of patients with T2DM develop this disease, however the incidence inthe general population worldwide is approximately 6% [5,6]. Dietary and exercise-based interventionshave resulted in delayed progression of T2DM in as many as 50–60% of people with insulin resistanceor pre-diabetes [7,8]. Moreover, the amount and quality of fatty acid consumption has been linked torisk of developing T2DM [9].
High intakes of saturated fatty acids and n-6 polyunsaturated fatty acids (PUFA) have been linkedwith impaired glucose tolerance and insulin resistance [9,10]. This is likely to be due to accumulationof excess lipids in liver, muscle and adipose tissue and an increase in pro-inflammatory compounds,such as the eicosanoids prostaglandin E2 and leukotriene B4, which are products of omega-6 fattyacid (arachidonic acid (AA)) [11]. In contrast, long chain omega-3 fatty acids (LC n-3 PUFA) such as
Nutrients 2018, 10, 758; doi:10.3390/nu10060758 www.mdpi.com/journal/nutrients6

Nutrients 2018, 10, 758
docosahexaenoic acid (DHA) and eicosapentaenoic acid (EPA) are precursors of anti-inflammatoryproducts, including resolvins, docosatriens and protectins [11,12], which have been shown to improveglucose tolerance and insulin sensitivity [12,13]. In a recent meta-analysis investigating the effect of LCn-3 PUFA in T2DM patients, the consumption of n-3 fatty acids, especially EPA and DHA, was shownto decrease serum triglyceride levels. In addition, the longer the intervention lasted, the better its effecton glucose control and lipid levels [14]. Given the association between LC n-3 PUFA and improvedinsulin sensitivity, it is important to understand if this translates to a reduced risk of developing T2DM.Foods and nutrients are not consumed in isolation, making it important to consider the role n-3 fattyacid intakes play within the context of the overall diet, i.e., dietary patterns [15]. Studies have shownthat dietary patterns high in oily fish consumption have been linked to lower risk of T2DM [16], yet theimpact of these dietary patterns on associations between the FADS polymorphism, plasma LC n-3PUFA concentrations and risk of developing T2DM is unclear. In addition, little is known about howendogenous LC n-3 PUFA production and genetic risk influence these relationships.
The concentration of LC n-3 PUFA in red blood cells and plasma is dependent on bothdietary intake and adequate endogenous production of these fatty acids [17]. LC n-3 PUFAcan be endogenously synthesized via metabolism of the essential fatty acid alpha-linolenicacid (ALA). This endogenous production is mediated by the enzymes delta-5-desaturase (D5D) anddelta-6-desaturase (D6D), which are encoded by the genes fatty acid desaturase 1 (FADS1) and fattyacid desaturase 2 (FADS2), respectively [18,19] (Figure 1).
Figure 1. Pathway of desaturation and elongation of n-3 and n-6 fatty acids. The enzymes Δ6and Δ5 desaturase are encoded by FADS2 and FADS1, respectively. LA: linoleic acid; DGLA:dihomo-gamma linolenic acid; AA: arachidonic acid; ALA: alpha-linolenic acid; EPA: eicosapentaenoicacid; DPA: docosapentaenoic acid; DHA: docosahexaenoic acid.
Single nucleotide polymorphisms (SNP) in the FADS gene have been linked to variations in fattyacid composition in various human compartments, such as erythrocyte membrane, plasma and breastmilk [20–22]. However, little is known about which SNPs are responsible for these alterations [23].A genetic variation in the FADS gene is linked to lower expression and activity of D5D and D6D,thereby increasing concentrations of the precursors linoleic acid (LA) and ALA but not of theirdownstream fatty acids AA, EPA and DHA [24–26]. The impact of dietary intakes and its potentialto attenuate differences between major and minor allele carriers of the FADS polymorphism remainsunclear [26,27].
Few studies have investigated whether LC n-3 PUFA intake is able to mitigate differences inplasma fatty acid profile among carriers of the FADS minor allele. Moreover, very little is known about
7

Nutrients 2018, 10, 758
how the FADS polymorphism and plasma concentrations and dietary intakes of n-3 fatty acids ordietary patterns high in n-3 fatty acids interact to influence an individual’s risk of T2DM. The aim of thisreview was thus to systematically evaluate evidence on associations between the FADS polymorphism,plasma LC n-3 PUFA concentrations and risk of developing T2DM and understand the role of dietaryfatty acid intakes on these associations.
2. Materials and Methods
2.1. Study Selection
This review includes publications from human observational studies and randomized controlledtrials. Animal and in vitro studies were excluded. In order to be included in this review, the studieswere required to include information on (i) FADS polymorphisms; (ii) omega-3 fatty acid intakes;(iii) plasma or erythrocyte membrane omega-3 fatty acid concentrations and (iv) whether participantspresented with or were at risk of T2DM. Only publications in English were considered.
2.2. Search Strategy
Published studies between inception and February 2018 were identified from a literature searchof four electronic databases: PubMed, Embase, Scopus and Cochrane Library. A manual search of thereference lists of relevant articles was also conducted to identify any additional papers that were notreturned by the initial search. The search strategy involved combining three search themes using theBoolean operator ‘and’. The first theme was (‘FADS’ OR ‘Fatty acid desaturase’), the second theme was(‘fatty acid*’ OR ‘n-3′ OR ‘n-3 fatty acid*’ OR ‘alpha linolenic acid’ OR ‘ala’ OR ‘eicosapentaenoic acid’OR ‘epa’ OR ‘docosahexaenoic acid’ OR ‘dha’ OR ‘docosapentaenoic acid’ OR ‘dpa’ OR ‘long chainfatty acid*’ OR ‘diet’ OR ‘dietary pattern*’ OR ‘dietary fat*’) and the third theme was (‘type 2 diabetes’OR ‘pre diabetes’ OR ‘insulin resistance’ OR ‘impaired glucose tolerance’ OR ‘glucose intolerance’).The search results were exported to a Reference Manager software, and were saved in a master file.Duplicates were removed via an in-built function within the software. A detailed record of all stages ofthe protocol was kept. This systematic review was undertaken in accordance with PRISMA guidelinesand has been registered with PROSPERO, the International Prospective Register of Systematic Reviews(registration number: CRD42018084831).
2.3. Study Selection and Screening
Two reviewers independently assessed the article titles and abstracts for eligibility according tothe inclusion and exclusion criteria. If both reviewers deemed the study suitable, the full text wasretrieved for further evaluation. If there was disagreement, a third independent reviewer was used.
2.4. Data Extraction and Quality Assessment
Data extraction was performed by one reviewer using a standardized excel form developed bythe researchers. A second reviewer checked the extraction for accuracy and consistency. The followinginformation was extracted: (i) intervention characteristics: study design, sample size and country(ii) participant characteristics: age and sex (iii) FADS polymorphism (iv) fatty acids intakes andconcentrations: dietary fatty acid intakes (saturated fatty acids, monounsaturated fatty acids,polyunsaturated fatty acids, eicosapentaenoic acid, docosapentaenoic acid and docosahexaenoic acid)and plasma or erythrocyte membrane n-3 fatty acid concentrations and (v) T2DM risk: defined by bloodglucose levels; HbA1c levels; glucose tolerance; insulin sensitivity or type 2 diabetes. Two independentreviewers assessed the quality of the studies using the Cochrane Risk of Bias Tool [28]. A third reviewerwas consulted if there was a discrepancy. The quality of each study was assessed according to thefollowing criteria: measurement protocols, blinding, incomplete data outcome and selective reporting.
8

Nutrients 2018, 10, 758
3. Results
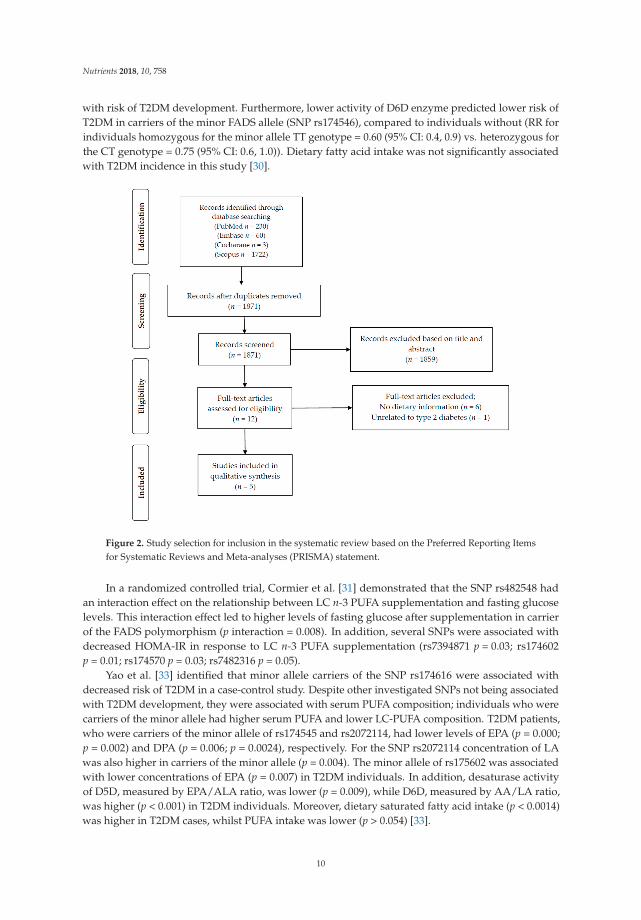
The initial search identified a total of 2015 potential studies. After removal of duplicates, titles andabstracts of 1871 papers were screened. Based on this screening process, 1859 articles were excluded fornot meeting our pre-defined inclusion criteria. The 12 articles selected after the screening process werethen assessed in more depth using the full-text article. As detailed in Figure 2, six of those 12 articlesdid not have information on dietary intake and were therefore excluded from this review. One articledid not report information on type 2 diabetes and was thus also excluded. In total, five articles weredeemed eligible and were included in the present review.
The characteristics of the studies included in this review are presented in Table 1. The firststudy had a cross-sectional design [29], the second was a prospective cohort [30], the third was arandomized controlled trial [31], the fourth was a case-control study and the fifth was a prospectivecohort study [32]. Most of the studies included both male and female participants, except for thecross-sectional study, which only included men [29]. The sample size ranged from 208 [31] to 2114 [30].All of the studies were conducted with adult participants and the mean age ranged from 31 [31] to63 years [33]. Three studies investigated the risk of developing T2DM: one by physician diagnosisduring the cohort study (using International Classification of Diseases criteria) [30], one by pastphysician diagnosis (using World Health Organization criteria) [33] and the last one using an oralglucose tolerance test [32]. Two studies [29,31] analyzed fasting glucose and insulin and from thatcalculated insulin resistance/insulin sensitivity by the homeostasis model assessment (HOMA).All five studies investigated polymorphisms in the FADS gene cluster. Three studies collectedinformation on serum fatty acid composition [29,32,33] and two of those assessed the desaturaseenzymes activity [32,33]. One study analyzed erythrocyte membrane fatty acid composition and alsoinvestigated desaturase enzymes activity [30]. Three studies used food frequency questionnaires tocollect dietary information [30,31,33], one used a 3-day food record [33] and the other used three24-h recalls, which assessed intake on two typical week days and one atypical day (weekend orholiday) [29]. Dietary intakes reported included intakes of key nutrients and select food groups only.No studies reported overall dietary patterns.
The majority of the studies included in this systematic review were considered to have low risk ofbias in their measurement protocols, blinding of volunteers and personnel, outcomes and selectivereporting. Only one study [33] did not provide clear information on the blinding protocol for theparticipants (performance bias) and the outcome assessment (detection bias) (see supplementaryTable S1).
Kim et al. [29] investigated cross-sectional associations between FADS gene polymorphism(SNPs rs174537, rs174575, rs1000778) and insulin resistance as well as serum fatty acid composition.Findings showed that HOMA-IR was higher in carriers of the minor FADS allele when individuals hadhigher serum concentrations of DGLA (≥1.4% in total serum phospholipids (p for interaction = 0.009)or AA (≥4.6% in total serum phospholipids, p for interaction = 0.047). No significant association wasfound between n-3 fatty acid levels in serum phospholipids, FADS polymorphism and HOMA-IR.Regarding dietary lipid intake, no significant association was found between different FADSpolymorphisms. Additionally, individuals with this polymorphism had significantly higher fastinginsulin (mean 9.7 ± 5.9 μIU/mL) than individuals who were homozygous for the major allele (mean8.7 ± 3.8 μIU/mL) (p < 0.05) [29].
In a prospective cohort, Kroger et al. [30] identified that the fatty acid profiles of erythrocytemembrane phospholipids and the activity of desaturase enzymes, but not dietary fatty acids,were strongly linked to the incidence of T2DM. Results showed that high proportions of LA inerythrocyte membrane fatty acid were linked with lower risk of developing T2DM (relative risk (RR)for the highest versus the lowest quintiles of LA concentrations = 0.8 (95% CI: 0.5, 1.1)). In contrast,high proportions of gamma-linolenic acid (18:3n-6) and DGLA (20:3n-6) predicted increased risk ofT2DM (RR for the highest versus the lowest quintiles of gamma-linolenic acid = 2.0 (95% CI: 1.4, 2.9);1.72 (95% CI: 1.2, 2.5), respectively). The concentration of n-3 PUFA was not significantly associated
9
Nutrients 2018, 10, 758
with risk of T2DM development. Furthermore, lower activity of D6D enzyme predicted lower risk ofT2DM in carriers of the minor FADS allele (SNP rs174546), compared to individuals without (RR forindividuals homozygous for the minor allele TT genotype = 0.60 (95% CI: 0.4, 0.9) vs. heterozygous forthe CT genotype = 0.75 (95% CI: 0.6, 1.0)). Dietary fatty acid intake was not significantly associatedwith T2DM incidence in this study [30].
Figure 2. Study selection for inclusion in the systematic review based on the Preferred Reporting Itemsfor Systematic Reviews and Meta-analyses (PRISMA) statement.
In a randomized controlled trial, Cormier et al. [31] demonstrated that the SNP rs482548 hadan interaction effect on the relationship between LC n-3 PUFA supplementation and fasting glucoselevels. This interaction effect led to higher levels of fasting glucose after supplementation in carrierof the FADS polymorphism (p interaction = 0.008). In addition, several SNPs were associated withdecreased HOMA-IR in response to LC n-3 PUFA supplementation (rs7394871 p = 0.03; rs174602p = 0.01; rs174570 p = 0.03; rs7482316 p = 0.05).
Yao et al. [33] identified that minor allele carriers of the SNP rs174616 were associated withdecreased risk of T2DM in a case-control study. Despite other investigated SNPs not being associatedwith T2DM development, they were associated with serum PUFA composition; individuals who werecarriers of the minor allele had higher serum PUFA and lower LC-PUFA composition. T2DM patients,who were carriers of the minor allele of rs174545 and rs2072114, had lower levels of EPA (p = 0.000;p = 0.002) and DPA (p = 0.006; p = 0.0024), respectively. For the SNP rs2072114 concentration of LAwas also higher in carriers of the minor allele (p = 0.004). The minor allele of rs175602 was associatedwith lower concentrations of EPA (p = 0.007) in T2DM individuals. In addition, desaturase activityof D5D, measured by EPA/ALA ratio, was lower (p = 0.009), while D6D, measured by AA/LA ratio,was higher (p < 0.001) in T2DM individuals. Moreover, dietary saturated fatty acid intake (p < 0.0014)was higher in T2DM cases, whilst PUFA intake was lower (p > 0.054) [33].
10

Nutrients 2018, 10, 758
Ta
ble
1.
Cha
ract
eris
tics
ofth
efiv
est
udie
sth
atm
etth
ein
clus
ion
crit
eria
ofth
issy
stem
atic
revi
ew.
Au
tho
r,Y
ear
Co
un
try,
Ag
e(M
ean
,S
D)
nS
tud
yD
esi
gn
Exp
osu
reO
utc
om
eR
esu
lts
Co
ncl
usi
on
Kim
etal
.,20
11[2
9]K
orea
,30–
69ye
ars
(48.
7,9.
3)57
6C
ross
-sec
tion
alst
udy
FAD
Spo
lym
orph
ism
s:rs
1745
37,r
s174
575,
rs10
0077
8
T2D
Mri
sk:f
asti
nggl
ucos
e(m
g/dL
),fa
stin
gin
sulin
(μIU
/mL)
and
HO
MA
–IR
Fatt
yac
idco
ncen
trat
ion:
seru
mph
osph
olip
idFA
com
posi
tion
(rel
ativ
e%
):SF
A,M
UFA
,PU
FA(A
LA,L
A,A
A,
EPA
,DG
LA,D
PA,D
HA
)In
sulin
Res
ista
nce
(HO
MA
)
HO
MA
-IR
and
seru
mFA
com
posi
tion
orFA
rati
osw
ere
asso
ciat
edw
ith
the
FAD
SSN
Ps(r
s174
575
min
oral
lele
carr
iers
had
high
erH
OM
A-I
Rw
hen
they
had
high
erco
ncen
trat
ions
ofD
GLA
(≥1.
4%in
tota
lFA
,pfo
rin
tera
ctio
n=
0.00
9)or
ofA
A(≥
4.6%
,pfo
rin
tera
ctio
n=
0.04
7)).
No
sign
ifica
ntas
soci
atio
nw
asfo
und
betw
een
n-3
FAse
rum
com
posi
tion
,FA
DS
poly
mor
phis
man
dH
OM
A-I
R.
FAD
SSN
Psw
ere
asso
ciat
edw
ith
high
erH
OM
A-I
R,w
hen
indi
vidu
als
had
high
erse
rum
LCn-
6PU
FA.N
osi
gnifi
cant
asso
ciat
ion
was
foun
dfo
rse
rum
n-3
FA.
Kro
ger
etal
.,20
11[3
0]
Ger
man
y,35
–65
year
s(C
ontr
ols
50,8
.9an
dca
ses
55.1
,7.
4)
Con
trol
s:21
14;c
ases
:67
3
Pros
pect
ive
coho
rt,
7ye
arfo
llow
up
Die
tary
inta
ke:S
FA(%
ofto
talf
atin
take
),M
UFA
(%of
tota
lfat
inta
ke),
n-3
PUFA
(%of
tota
lfat
inta
ke),
n-6
PUFA
(%of
tota
lfat
inta
ke),
tota
lPU
FA(%
ofto
talf
atin
take
)FA
DS
poly
mor
phis
m:r
s174
546
Des
atur
ase
acti
vity
Fatt
yac
idco
ncen
trat
ion:
eryt
hroc
yte
mem
bran
eph
osph
olip
ids
FA(%
ofto
tal
FA),
AA
/DG
LA(D
5D)a
ndA
LA/L
A(D
6D)r
atio
s
T2D
Mri
sk:c
linic
aldi
agno
sis
ofT2
DM
Ris
kof
T2D
Mdi
ffer
edac
cord
ing
toFA
profi
leof
eryt
hroc
yte
mem
bran
eph
osph
olip
ids.
Hig
her
prop
orti
ons
ofLA
wer
eas
soci
ated
wit
hlo
wer
risk
ofT2
DM
(RR
for
extr
eme
quin
tile
s=
0.76
(95%
CI:
0.54
,1.0
8));
whe
reas
high
erpr
opor
tion
sof
GLA
and
DG
LApr
edic
ted
incr
ease
dT2
DM
risk
(RR
for
extr
eme
quin
tile
s=
2.00
(95%
CI:
1.38
,2.8
8);R
R=
1.72
(95%
CI:
1.18
,2.5
3),r
espe
ctiv
ely)
.Act
ivit
yof
desa
tura
seen
zym
esw
aslin
ked
toin
cide
nce
ofT2
DM
.Low
erac
tivity
ofD
6Dpr
edic
ted
low
erri
skof
T2D
Min
carr
iers
ofth
em
inor
alle
leco
mpa
red
toth
ose
wit
hout
(RR
CT
geno
type
=0.
75(9
5%C
I:0.
59,0
.96)
;TT
geno
type
=0.
64(9
5%C
I:0.
43,0
.94)
).D
ieta
ryFA
inta
kew
asno
tas
soci
ated
wit
hT2
DM
.
T2D
Min
cide
nce
was
high
erin
indi
vidu
als
wit
hhi
gher
prop
orti
ons
ofLC
n-6
PUFA
and
low
erD
6Dac
tivity
.No
asso
ciat
ion
was
foun
dw
ith
diet
ary
n-3
FAin
take
.
Cor
mie
ret
al.,
2013
[31]
Can
ada,
18–5
0ye
ars
(30.
8,8.
7)20
8R
ando
miz
edco
ntro
lled
tria
l,6
wee
kdu
rati
on
Die
tary
inta
ke:3
–3.3
g/da
yof
fish
oil
(1.9
–2.2
gof
EPA
+1.
1of
DH
A)
FAD
Spo
lym
orph
ism
:rs1
7455
6,rs
1746
27,
rs48
2548
,rs2
0721
14,r
s128
0700
5,rs
1744
48,
rs28
4557
3,rs
7394
871,
rs79
4271
7,rs
7482
316,
rs17
4602
,rs4
9879
3,rs
1745
46,
rs17
4570
,rs1
7457
9,rs
1746
11,r
s174
616,
rs96
8567
Fast
ing
Glu
cose
(mM
),Fa
stin
gIn
sulin
(ρ/L
),H
OM
A-I
R
SNPs
invo
lved
inth
eFA
DS
gene
clus
ter
wer
eas
soci
ated
wit
hgl
ycem
icco
ntro
lpa
ram
eter
s(a
supp
lem
enta
tion
*ge
noty
pein
tera
ctio
nef
fect
onFG
leve
lsw
asob
serv
edfo
rrs
4825
48(p
=0.
008)
),m
ainl
yde
crea
sed
HO
MA
-IR
,in
resp
onse
toa
high
dose
inte
rven
tion
wit
hn-
3PU
FA(s
uppl
emen
tati
on*
geno
type
inte
ract
ion
effe
ctfo
rrs
1746
02(p
=0.
01);
rs17
4570
(p=
0.03
);rs
7394
871
(p=
0.03
))
FAD
SSN
Psw
ere
asso
ciat
edw
ith
low
erH
OM
A-I
Ran
dhi
gher
fast
ing
gluc
ose
inre
spon
seto
ahi
ghdo
sen-
3PU
FAsu
pple
men
tati
on.
11

Nutrients 2018, 10, 758
Ta
ble
1.
Con
t.
Au
tho
r,Y
ear
Co
un
try,
Ag
e(M
ean
,S
D)
nS
tud
yD
esi
gn
Exp
osu
reO
utc
om
eR
esu
lts
Co
ncl
usi
on
Yao
etal
.,20
15[3
3]
Chi
na,
(Con
trol
s:51
.38,
11.2
7ye
ars;
case
s:63
.24,
10.4
3ye
ars)
Con
trol
s:42
1;ca
ses:
331
Cas
e-co
ntro
lstu
dy
Die
tary
inta
ke:t
otal
fat(
%E)
,SFA
(%E)
,MU
FA(%
E),P
UFA
(%E)
FAD
Spo
lym
orph
ism
:rs1
7454
5,rs
2072
114,
rs17
4602
,rs1
7461
6D
esat
uras
eac
tivi
tyFa
tty
acid
conc
entr
atio
n:se
rum
PUFA
com
posi
tion
(%of
tota
lFA
),EP
A/A
LA(D
5D)
and
AA
/LA
(D6D
)rat
ios
T2D
Mri
sk*
Min
oral
lele
carr
iers
ofth
ers
1746
16ar
eas
soci
ated
wit
ha
decr
ease
dri
skof
T2D
M(p
=0.
023)
.D
esat
uras
eac
tivi
tyof
D5D
was
decr
ease
d(p
=0.
009)
,whi
leD
6Dw
asin
crea
sed
(p<
0.00
1)in
T2D
Min
divi
dual
s.D
ieta
rysa
tura
ted
fatt
yac
id(p
<0.
0014
)w
assi
gnifi
cant
lyhi
gher
inT2
DM
case
s,w
hils
tPU
FAin
take
was
low
er(p
>0.
054)
Hig
her
PUFA
sin
take
,de
satu
rase
acti
vity
and
SNP
rs17
4616
are
asso
ciat
edw
ith
decr
ease
dri
skof
T2D
M.
Takk
unen
etal
.,20
16[3
2]Fi
nlan
d,40
–65
year
s(5
5.4,
7.14
)40
7Pr
ospe
ctiv
eco
hort
,6
year
follo
wup
Die
tary
inta
ke:t
otal
fat(
g/da
y),S
FA(g
/100
gof
tota
lfat
),M
UFA
(g/1
00g
ofto
talf
at),
PUFA
(g/1
00g
ofto
talf
at)
Des
atur
ase
acti
vity
:AA
/DG
LA(D
5D)a
ndA
LA/L
A(D
6D)r
atio
sus
ing
FAD
Spo
lym
orph
ism
(rs1
7455
0)fo
rva
lidat
ion
Fatt
yac
idco
ncen
trat
ion:
20se
rum
FA(m
ol%
)
T2D
Min
cide
nce
OG
TT(m
mol
/L)
Tota
lser
umLC
n-3
PUFA
(p=
0.00
1)an
des
tim
ated
D5D
acti
vity
(p=
0.01
1)pr
edic
ted
low
erin
cide
nce
ofT2
DM
.
Low
erin
cide
nce
ofT2
DM
was
asso
ciat
edw
ith
seru
mLC
n-3
PUFA
,pro
port
ions
ofm
arin
en-
3FA
and
esti
mat
edD
5Dac
tivi
ty.
FAD
S:fa
tty
acid
des
atu
rase
;HO
MA
:hom
eost
asis
mod
elas
sess
men
t;O
GT
T:or
algl
uco
seto
lera
nce
test
;FG
:fas
ting
glu
cose
;FA
:fat
tyac
ids;
SNP
:sin
gle
nucl
eoti
de
pol
ymor
phi
sm;
T2D
M:t
ype
2d
iabe
tes
mel
litu
s;A
A:a
rach
idon
icac
id;A
LA
:alp
ha-l
inol
enic
acid
;LA
:lin
olei
cac
id;D
GL
A:d
ihom
oga
mm
a-lin
olen
icac
id;E
:ene
rgy
inta
ke;E
PA:e
icos
apen
taen
oic
acid
;DH
A:d
ocos
ahex
aeno
icac
id;G
LA
:gam
ma-
linol
enic
acid
;D5D
:del
ta5
des
atur
ase;
D6D
:del
ta6
des
atur
ase;
SFA
:sat
urat
edfa
tty
acid
;MU
FA:m
onou
nsat
urat
edfa
tty
acid
;%E
:pe
rcen
tage
ofto
tale
nerg
yin
take
;PU
FA:p
olyu
nsat
urat
edfa
tty
acid
;LC
-PU
FA:l
ong
chai
npo
lyun
satu
rate
dfa
tty
acid
;RR
:rel
ativ
eri
sk;C
I:co
nfide
nce
inte
rval
.*T
his
stud
ylo
oked
atT2
DM
asan
expo
sure
and
anou
tcom
e.
12

Nutrients 2018, 10, 758
Takkunen et al. [32] demonstrated that total serum LC n-3 PUFA concentration (p = 0.001) andD5D activity (p = 0.011) were associated with lower incidence of T2DM in a prospective cohort.In addition, serum concentrations of EPA (p = 0.016) and DPA (p = 0.024) were positively associatedwith insulin sensitivity.
4. Discussion
This is the first review to systematically evaluate the evidence regarding the association betweenFADS polymorphism, plasma or erythrocyte membrane LC n-3 PUFA fatty acid concentrations andT2DM risk, and if those relationships are influenced by dietary fatty acid intakes. After conducting asystematic search across four databases, five articles were identified that were eligible for inclusionin this review. The main findings were that FADS polymorphism and higher D5D and lower D6Dactivity may alter plasma and erythrocyte fatty acid composition, thereby playing a protective rolein the development of T2DM. While two studies showed no association between serum n-3 PUFAconcentration [29] or erythrocyte n-3 PUFA concentration [30] and risk of T2DM, these studies didshow that higher concentrations of some of the n-6 PUFA in serum/erythrocytes (DGLA, 18:3n-6 and20:3n-6) were associated with higher risk of T2DM, while 18:2n-6 was associated with lower risk ofT2DM. In addition, dietary consumption of LC n-3 PUFA had a protective association with T2DM inone study [32], but no association was observed in others [29,30,33]. Supplementation with high dosesof LC n-3 PUFA improved HOMA-IR in some variants of FADS polymorphism but increased fastingglucose levels in carriers of the minor allele for rs482548 (FADS2) [31].
The literature suggests there is an association between serum fatty acid composition andFADS SNPs. The cross-sectional study by Kim et al. [29], conducted with 576 Korean men, showed thatthe serum fatty acid composition varied in individuals with different SNPs of FADS gene. However,these variations were only significant for n-6 fatty acids (18:2n-6, AA and DGLA levels in serumphospholipids). Another study investigated this correlation in Caucasian individuals in Germany,with a sample of 727 subjects [20]. The SNPs investigated in this study explained 28% of the variancein AA in the individuals with polymorphism and 12% of its fatty acids precursors. In this study, LC n-3PUFA concentrations also varied between different genotypes: DPA and EPA were lower whilst itsprecursor ALA was higher in individuals with a polymorphism in the FADS gene [20], suggestingthat FADS polymorphism does influence fatty acids levels in blood. Similarly, Malerba et al. [21],genotyped 658 Italian subjects from the Verona Heart Project and measured fatty acid composition notonly in serum but also in erythrocyte membrane. This study confirmed that the substrates of D5D andD6D (LA, ALA) were higher in serum and erythrocyte membranes of minor allele carriers, whilst theirproducts (AA, EPA, DPA) were lower.
Studies have also investigated the relationship directly between the activity of desaturase enzymesand T2DM [30,33]. A prospective cohort of 2114 subjects from Germany investigated associationsbetween dietary fatty acid intakes, T2DM risk and desaturase activity. Higher proportion of LAin erythrocytes predicted lower risk of T2DM development, whilst higher proportions of GLA andDGLA were associated with a higher risk of T2DM development. Additionally, in individuals withthis polymorphism, lower D6D activity was related to lower T2DM incidence [30]. Furthermore, astudy evaluating the influence of FADS1 and FADS2 genetic variants on desaturase activity and lipidconcentrations in 820 T2DM patients identified that FADS1 rs174547 and FADS2 rs2727270 genotypeswere significantly correlated to lower levels of D5D and D6D activity in T2DM patients [34]. Anotherprospective cohort carried out in 407 subjects from Finland found that total serum LC n-3 PUFA,proportions of marine n-3 FA and the estimated activity of D5D predicted lower incidence of T2DM,which is likely to be due to higher insulin sensitivity [32]. Therefore, it is likely that the FADSpolymorphism, which influences D5D and D6D activity, may modulate the risk of developing T2DM.
Our findings suggest that serum and erythrocyte fatty acid composition may be affected by dietaryintake of n-3 PUFA. Similarly, there is some research suggesting that the consumption of n-3 PUFAmay have a beneficial effect on glycemic control and insulin sensitivity [12–14], however, the effect
13

Nutrients 2018, 10, 758
of n-3 PUFA on risk of T2DM is still unclear. A meta-analysis of prospective studies that focused ondietary n-3 PUFA sources, biomarker levels of n-3 PUFA and the incidence of T2DM, concluded that theevidence was mixed [35]. Only dietary intake of ALA from plant-based food was found to be modestlyassociated with lower risk of developing T2DM [35]. The relationship between n-3 PUFA intake andT2DM is further complicated when considering the role of FADS polymorphism. Cormier et al. [31]identified that the FADS SNPs were significantly associated with glycemic control, including lowerHOMA-IR in response to the fish oil supplementation in Canadian subjects. These findings suggestthat LC n-3 PUFA supplementation may play a protective role against T2DM in carriers of the minorallele for FADS gene. These findings are consistent with Yao et al. [31] which observed that Chineseindividuals who were carriers of the minor allele of the FADS SNP (rs174616) had a lower risk ofdeveloping T2DM. Furthermore, higher intake of PUFA appeared to have had a protective effecton this relationship [33]. The protective role of dietary LC n-3 PUFA in the development of T2DMhas been observed more often in Asian populations than in European/North Americans. Besidescultural differences in the preparation of foods that are rich sources of LC n-3 PUFA (raw/steamed vs.deep-fried), genetic factors are likely to strongly influence this association [36].
The mechanism as to how FADS polymorphism and dietary LC n-3 PUFA intake affects T2DMdevelopment remains unclear [29,31]. However, a possible explanation is that this genetic varianthas been linked to lower D6D activity and lower concentrations of AA in plasma, red blood cellsand adipose tissue [18,20,22]. This compound is the precursor of pro-inflammatory metabolites,which are related to an increase in overall inflammatory state [11]. Importantly, LC n-3 PUFAdietary intake is associated with the production of anti-inflammatory compounds [12] and the FADSpolymorphism may lead to lower AA levels in plasma and red blood cells. As a result, this may leadto greater availability of cyclooxygenase and lipoxygenase enzymes to metabolize LC n-3 PUFA intotheir anti-inflammatory metabolites, thereby lowering inflammation and having a positive effecton T2DM risk. While this mechanism is plausible, further clinical research is needed to betterunderstand this potential mechanism of action. In addition, dietary information collected in thesestudies focused on nutrient intakes only; the role n-3 fatty acid intake within the context of dietarypatterns remains unclear.
5. Conclusions
This review was the first to systematically evaluate the role of FADS polymorphism on n-3fatty acid concentration in plasma or erythrocyte membrane and on T2DM risk, and to identifyif those relationships could be influenced by dietary intake. Given the heterogeneity in the studydesigns and the small number of studies eligible for inclusion in this review, our ability to drawfirm conclusions was limited. Nonetheless, this review identified that the FADS polymorphism mayinfluence plasma and erythrocyte fatty acid composition as well as T2DM risk markers, such asHOMA-IR and fasting glucose. All five studies demonstrated that there was a significant positiveassociation between carrying the FADS polymorphism and T2DM risk. However, dietary LC n-3 PUFAintake was only associated with lower T2DM risk in one study. When considering which FADS SNPsare involved in these associations, the majority of the studies investigated different SNPs and thereforeit was not possible to identify the role of any single SNP on risk of T2DM. Future research, preferablyrandomized controlled trials, is necessary to understand the mediation effect of dietary fatty acidintake on associations between FADS polymorphism, plasma or erythrocyte fatty acid and risk ofdeveloping T2DM. In addition, with an increasing focus on understanding diet as whole, the role ofdietary patterns on these relationships warrants further investigation.
Supplementary Materials: The following are available online at http://www.mdpi.com/2072-6643/10/6/758/s1,Table S1: Quality Assessment.
Author Contributions: Conceptualization, B.B., G.K., M.A.K. and K.M.L.; Data curation, B.B., G.K., M.A.K. andK.M.L.; Methodology, B.B., G.K., M.A.K. and K.M.L; Investigation, B.B.; Project administration G.K., M.A.K.,K.M.L.; Resources, G.K., M.A.K., K.M.L.; Writing-Original Draft Preparation, B.B, G.K., M.A.K. and K.M.L.;
14

Nutrients 2018, 10, 758
Writing-Review & Editing, G.K., M.A.K. and K.M.L.; Visualization B.B., G.K., M.A.K. and K.M.L.; Validation, G.K.,M.A.K. and K.M.L.; Supervision, G.K., M.A.K. and K.M.L.
Funding: This research received no external funding.
Conflicts of Interest: The authors declare no conflict of interest.
References
1. American Diabetes Association. Available online: http://www.diabetes.org/diabetes-basics/diagnosis/?loc=db-slabnav (accessed on 1 March 2018).
2. Beale, E.G. Insulin signaling and insulin resistance. J. Investig. Med. 2013, 61. [CrossRef] [PubMed]3. Guo, S. Insulin signaling, resistance, and the metabolic syndrome: Insights from mouse models to disease
mechanism. J. Endocrinol. 2014, 220. [CrossRef] [PubMed]4. World Health Organization. Available online: http://www.who.int/diabetes/en/ (accessed on
3 January 2018).5. Wu, Y.; Ding, Y.; Tanaka, Y.; Zhang, W. Risk factors contributing to type 2 diabetes and recent advances in
the treatment and prevention. Int. J. Med. Sci. 2014, 6, 1185–2000. [CrossRef] [PubMed]6. Hivert, M.F.; Vassy, J.L.; Meigs, J.B. Susceptibility to type 2 diabetes mellitus—From genes to prevention.
Nat. Rev. Endocrinol. 2014, 10, 189–205. [CrossRef] [PubMed]7. Knowler, W.C.; Barrett-Connor, E.; Folwer, S.E.; Hamman, R.F.; Lachin, J.M.; Walker, E.A.; Nathan, D.M.
Reduction in the incidence of type 2 diabetes with lifestyle intervention or metformin. N. Engl. J. Med. 2002,346, 393–403. [CrossRef] [PubMed]
8. Tuomilehto, J.; Lindstrom, J.; Eriksson, J.G.; Valle, T.T.; Hämäläinen, H.; Ilanne-Parikka, P.;Keinänen-Kiukaanniemi, S.; Laakso, M.; Louheranta, A.; Rastas, M.; et al. Prevention of type 2 diabetesmellitus by changes in lifestyle among subjects with impaired glucose tolerance. N. Engl. J. Med. 2001,344, 1343–1350. [CrossRef] [PubMed]
9. Sears, B.; Perry, M. The role of fatty acids in insulin resistance. Lipids Health Dis. 2015, 14, 121–129. [CrossRef][PubMed]
10. Moloney, F.; Yeow, T.P.; Mullen, A.; Nolan, J.J.; Roche, H.M. Conjugated linoleic acid supplementation,insulin sensitivity, and lipoprotein metabolism in patients with type 2 diabetes mellitus. Am. J. Clin. Nutr.2004, 80, 887–895. [CrossRef] [PubMed]
11. Fritsche, K.L. The science of fatty acids and inflammation. Adv. Nutr. 2015, 6, 293S–301S. [CrossRef][PubMed]
12. Olalla, L.M.S.; Muniz, F.J.S.; Vaquero, M.P. N-3 fatty acids in glucose metabolism and insulin sensitivity.Nutr. Hops. 2009, 24, 113–127.
13. Lardinois, C.K.; Starich, G.H. Polyunsaturated fats enhance peripheral glucose utilization in rats. J. Am.Coll. Nutr. 1991, 10, 340–345. [CrossRef] [PubMed]
14. Chen, C.; Yu, X.; Shao, S. Effects of omega-3 fatty acid supplementation on glucose control and lipid levels intype 2 diabetes: A meta-analysis. PLoS ONE 2015, 10, e0139565. [CrossRef] [PubMed]
15. Tapsell, L.C.; Neale, E.P.; Satija, A.; Hu, F.B. Foods, nutrients and dietary patterns: Interconnections andimplications for dietary guidelines. Adv. Nutr. 2016, 7, 445–454. [CrossRef] [PubMed]
16. Zhang, M.; Picard-Deland, E.; Marette, A. Fish and marine omega-3 polyunsaturated fatty acid consumptionand incidence of type 2 diabetes: A systematic review and meta-analysis. Int. J. Endocrinol. 2013, 2013, 1–11.[CrossRef]
17. Calder, P.C. Mechanism of action of (n-3) fatty acids. J. Nutr. 2012, 142, 592S–599S. [CrossRef] [PubMed]18. Lattka, E.; Illig, T.; Koletzko, B.; Heinrich, J. Genetic variants of the FADS1-FADS2 gene cluster as related to
essential fatty acid metabolism. Curr. Opin. Lipidol. 2010, 21, 64–69. [CrossRef] [PubMed]19. Merino, D.M.; Ma, D.W.L.; Mutch, D.M. Genetic variation in lipid desaturases and its impact on the
development of human disease. Lipids Health Dis. 2010, 9, 63–77. [CrossRef] [PubMed]20. Schaeffer, L.; Gohike, H.; Muller, M.; Heid, I.M.; Palmer, L.J.; Kompauer, I.; Demmelmair, H.; Illig, T.;
Koletzko, B.; Heinrich, J. Common genetic variants of the FADS1 FADS2 gene cluster and their reconstructedhaplotypes are associated with the fatty acid composition in phospholipids. Hum. Mol. Genet. 2006,15, 1745–1756. [CrossRef] [PubMed]
15

Nutrients 2018, 10, 758
21. Malerba, G.; Schaeffer, L.; Xumerle, L.; Klopp, N.; Trabetti, E.; Biscuola, M.; Cavallari, U.; Galavotti, R.;Martinelli, N.; Guarini, P.; et al. SNPs of the FADS gene cluster are associated with polyunsaturated fattyacids in a cohort of patients with cardiovascular disease. Lipids 2008, 43, 289–299. [CrossRef] [PubMed]
22. Xie, L.; Innis, S.M. Genetic variants of the FADS1 FADS2 gene cluster are associated with altered (n-6) and(n-3) essential fatty acids in plasma and erythrocyte phospholipids in women during pregnancy and inbreast milk during lactation. J. Nutr. 2008, 138, 2222–2228. [CrossRef] [PubMed]
23. Minihane, A.M. Impact of the genotype on EPA and DHA status and responsiveness to increased intakes.Nutrients 2016, 8, 123. [CrossRef] [PubMed]
24. Simpoulos, A.P. Genetic variants in the metabolism of omega-6 and omega-3 fatty acids: Their role in thedetermination of nutritional requirements and chronic disease risk. Exp. Biol. Med. 2010, 235, 785–795.[CrossRef] [PubMed]
25. Barman, M.; Nilsson, S.; Naluai, A.T.; Sandin, A.; Wold, A.E.; Sandberg, A.S. Single Nucleotide polymorphismin the FADS gene cluster but no ELOVL2 gene are associated with serum polyunsaturated fatty acidcomposition and development of allergy (in a Swedish Birth Cohort). Nutrients 2015, 7, 10100–10115.[CrossRef] [PubMed]
26. Ralston, J.C.; Matravadia, S.; Garudio, N.; Holloway, G.P.; Mutch, D.M. Polyunsaturated fatty acid regulationof adipocyte FADS1 and FADS2 expression and Function. Obesity 2015, 23, 725–728. [CrossRef] [PubMed]
27. Sholtz, S.A.; Kerling, E.H.; Shaddy, D.J.; Li, S.; Thodosoff, J.M.; Colombo, J.; Carlson, S.E. Docosahexaenoicacid (DHA) supplementation in pregnancy differentially modulates arachidonic acid and DHA status acrossFADS genotypes in pregnancy. Prostaglandins Leukot. Essent. Fat. Acids 2015, 94, 29–33. [CrossRef] [PubMed]
28. Higgins, J.P.T.; Green, S. (Eds.) Cochrane Handbook for Systematic Reviews of Interventions, Version 5.1.0[updated March 2011]; The Cochrane Collaboration, 2011. Available online: http://handbook.cochrane.org(accessed on 2 March 2018).
29. Kim, O.Y.; Lim, H.H.; Yang, L.I.; Chae, J.S.; Lee, J.H. Fatty acid desaturase (FADS) gene polymorphism andinsulin resistance in association with serum phospholipid polyunsaturated fatty acid composition in healthyKorean men: Cross-sectional study. Nutr. Metab. 2011, 8, 24. [CrossRef] [PubMed]
30. Kroger, J.; Zietemann, V.; Enzenbach, C.; Weikert, C.; Jansen, E.H.J.M.; Doring, F.; Joost, H.G.; Boeing, H.;Schulze, M.B. Erythrocyte membrane phospholipids fatty acids, desaturase activity, and dietary fatty acidsin relation to risk of type 2 diabetes in the European Prospective Investigation into Cancer and Nutrition(EPIC)-Potsdam Study. Am. J. Clin. Nutr. 2011, 93, 127–142. [CrossRef] [PubMed]
31. Cormier, H.; Rudkowska, I.; Thifault, E.; Lemieux, S.; Couture, P.; Vohl, M.C. Polymorphism in fatty aciddesaturase (FADS) gene cluster: Effects on glycemic controls following an omega-3 polyunsaturated fattyacids (PUFA) supplementation. Genes 2013, 4, 485–498. [CrossRef] [PubMed]
32. Takkunen, M.J.; Schwab, U.S.; Mello, V.D.F.; Eriksson, J.G.; Lindstrom, J.; Tuomilehto, J.; Uusitupa, M.I.J.Longitudinal associations of serum fatty acid composition with type 2 diabetes risk and markers of insulinsecretion and sensitivity in the Finish Diabetes Prevention Study. Eur. J. Nutr. 2016, 55, 967–979. [CrossRef][PubMed]
33. Yao, M.; Li, J.; Xie, T.; He, T.; Fang, L.; Shi, Y.; Hou, L.; Lian, K.; Wang, R.; Jiang, L. Polymorphism of rs174616in the FADS1-FADS2 gene cluster is associated with a reduced risk of type 2 diabetes mellitus in northernHan Chinese people. Diabetes Res. Clin. Pract. 2015, 109, 206–212. [CrossRef] [PubMed]
34. Huang, M.C.; Chang, W.T.; Chang, H.Y.; Chung, H.F.; Chen, F.P.; Huang, Y.F.; Hsu, C.C.; Hwang, S.J. FADSgene polymorphism, fatty acid desaturase activities, and HDL-C in type 2 diabetes. Int. J. Environ. Res.Public Health 2017, 14, 572. [CrossRef] [PubMed]
35. Wu, J.H.Y.; Micha, R.; Imamura, F.; Pan, A.; Biggs, M.L.; Ajaz, O.; Dujousse, L.; Hu, F.B.; Mozaffarian, D.Omega-3 fatty acids and incident type 2 diabetes: A systematic review and meta-analysis. Br. J. Nutr. 2012,107, S214–S227. [CrossRef] [PubMed]
36. Wallin, A.; Di Giuseppe, D.; Orsini, N.; Patel, P.S.; Forouhi, N.G.; Wolk, A. Fish consumption, dietarylong-chain n-3 fatty acids and risk of type 2 diabetes: Systematic review and meta-analysis of prospectivestudies. Diabetes Care 2012, 35, 918–929. [CrossRef] [PubMed]
© 2018 by the authors. Licensee MDPI, Basel, Switzerland. This article is an open accessarticle distributed under the terms and conditions of the Creative Commons Attribution(CC BY) license (http://creativecommons.org/licenses/by/4.0/).
16

nutrients
Article
The Relationship between Single NucleotidePolymorphisms in Taste Receptor Genes,Taste Function and Dietary Intake in Preschool-AgedChildren and Adults in the Guelph FamilyHealth Study
Elie Chamoun 1, Nicholas A. Carroll 1, Lisa M. Duizer 2, Wenjuan Qi 3, Zeny Feng 3,
Gerarda Darlington 3, Alison M. Duncan 1, Jess Haines 4, David W.L. Ma 1,* and the Guelph
Family Health Study 5
1 Department of Human Health and Nutritional Sciences, University of Guelph, Guelph, ON N1G 2W1,Canada; [email protected] (E.C.); [email protected] (N.A.C.); [email protected] (A.M.D.)
2 Department of Food Science, University of Guelph, Guelph, ON N1G 2W1, Canada; [email protected] Department of Mathematics and Statistics, University of Guelph, Guelph, ON N1G 2W1, Canada;
[email protected] (W.Q.); [email protected] (Z.F.); [email protected] (G.D.)4 Department of Family Relations and Applied Nutrition, University of Guelph, Guelph, ON N1G 2W1
Canada; [email protected] University of Guelph, Guelph, ON N1G 2W1, Canada; [email protected]* Correspondence: [email protected]; Tel.: +1(519)-824-4120 (ext. 52272)
Received: 9 July 2018; Accepted: 27 July 2018; Published: 29 July 2018
Abstract: Taste is a fundamental determinant of food selection, and inter-individual variations intaste perception may be important risk factors for poor eating habits and obesity. Characterizingdifferences in taste perception and their influences on dietary intake may lead to an improvedunderstanding of obesity risk and a potential to develop personalized nutrition recommendations.This study explored associations between 93 single nucleotide polymorphisms (SNPs) in sweet,fat, bitter, salt, sour, and umami taste receptors and psychophysical measures of taste. Forty-fourfamilies from the Guelph Family Health Study participated, including 60 children and 65 adults.Saliva was collected for genetic analysis and parents completed a three-day food record for theirchildren. Parents underwent a test for suprathreshold sensitivity (ST) and taste preference (PR) forsweet, fat, salt, umami, and sour as well as a phenylthiocarbamide (PTC) taste status test. Childrenunderwent PR tests and a PTC taste status test. Analysis of SNPs and psychophysical measures oftaste yielded 23 significant associations in parents and 11 in children. After adjusting for multiplehypothesis testing, the rs713598 in the TAS2R38 bitter taste receptor gene and rs236514 in the KCNJ2sour taste-associated gene remained significantly associated with PTC ST and sour PR in parents,respectively. In children, rs173135 in KCNJ2 and rs4790522 in the TRPV1 salt taste-associated generemained significantly associated with sour and salt taste PRs, respectively. A multiple trait analysisof PR and nutrient composition of diet in the children revealed that rs9701796 in the TAS1R2 sweettaste receptor gene was associated with both sweet PR and percent energy from added sugar inthe diet. These findings provide evidence that for bitter, sour, salt, and sweet taste, certain geneticvariants are associated with taste function and may be implicated in eating patterns. (Support wasprovided by the Ontario Ministry of Agriculture, Food, and Rural Affairs).
Keywords: taste; genetics; diet; health; children; adults
Nutrients 2018, 10, 990; doi:10.3390/nu10080990 www.mdpi.com/journal/nutrients17

Nutrients 2018, 10, 990
1. Introduction
The prevalence of obesity and associated co-morbidities is rising internationally despite ongoingprevention and intervention efforts [1,2]. Therefore, new strategies are warranted to promote thedevelopment of effective obesity prevention initiatives. As about half of the risk of developing obesityis heritable [3,4], characterizing the genetic component of obesity and incorporating this informationinto obesity prevention efforts may be a key part of the complex solution to this global problem.Excess intake of calories due to poor eating habits has been widely recognized as a major factor inthe development of obesity, and these habits are established in the earliest years of life [5]. While thegenetic basis of these adverse behaviors is not clear, taste preferences have been shown to vary due inpart to genetics and to be associated with poor eating habits [6]. Characterizing the genetic factors thatpredispose to certain taste preferences may therefore provide a tool to tailor eating patterns to promotehealthy eating habits.
The relationship between genetic variation and taste has previously been investigated byexamining single nucleotide polymorphisms (SNPs) with outcomes of sensory tests. In particular,studies have focused on the link between taste receptor gene SNPs and measures of taste sensitivity,taste preference, and dietary intake [7–16]. However, previous studies typically analyze very fewSNPs and only measure sensitivity, preference or dietary intake related to one type of taste. In thisstudy, 93 SNPs spanning taste receptor genes that elicit fat, sweet, salt, sour, umami, and bitter tasteswere examined for their associations with measures of taste sensitivity and taste preference. SNPsdetermined to be significantly associated with taste were then examined for potential associationswith dietary intake in children. As a result of this comprehensive analysis, SNPs that are associatedwith taste perception can subsequently be assessed for their effect on the intake of dietary componentsrelated to that same type of taste.
2. Methods
2.1. Participants
Forty-nine families, including 72 children and 81 adults, were recruited from the Guelph FamilyHealth Study—an existing family-based cohort study. Exclusion criteria included smoking, diagnosisof hypogeusia or ageusia, and having undergone bariatric surgery. Children under the age of 3 yearswere not recruited due to the potential difficulty in understanding and performing sensory tasks.This study was approved by the Research Ethics Board at the University of Guelph (REB#16-12-629).
2.2. Anthropometry, Body Composition, and Blood Pressure Measurements
Parents and their children arrived at the University of Guelph in the Body Composition Labhaving fasted for at least two hours. Among both parents, height was measured to the nearest 0.1 cmusing a wall-mounted stadiometer (Medical Scales and Measuring Devices; Seca Corp, Ontario, CA,USA) and measured in children to the nearest 0.1 cm using a pediatric length board (Weigh andMeasure, LLC; ShorrBoard®, Olney, MD, USA). Body weight was measured while wearing tight-fittingclothing and no shoes using the BOD POD™ digital scale (Cosmed Inc., Concord, CA, USA). Body massindex (kg/m2) was calculated from the weight and height measurements. The BOD POD™ was used todetermine body composition of adult participants using air displacement plethysmography. Fat mass% in children was determined using bioelectric impedance analysis. Trained research assistants usedthe Quantum IV – Body Composition AnalyzerTM (RJL Systems, Clinton Township, MI, USA) usingsingle-frequency, with electrodes placed on the right hand and foot. Total body water (TBW) wasdetermined using the Kushner equation [17], then TBW was divided by an age- and sex-specifichydration factor to obtain fat mass %. Among both parents and children, blood pressure and heartrate were measured from the right brachial artery using an automated oscillometric device (HBP-1300OMRON, Mississauga, Ontario, CA, USA). Cuff size was determined based on arm circumference.Among adults and children, three rested measurements of blood pressure (systolic and diastolic) and
18

Nutrients 2018, 10, 990
heart rate were obtained via an automatic reading while participants were seated in an upright position.The average of the final two measurements for each participant was used in subsequent analyses.
2.3. SNP Selection and Genotyping
A PubMed SNP search was conducted for the following genes previously implicated in tastedetection: CD36, GPR120, GPR40, TAS1R1, TAS1R2, TAS1R3, TAS2R38, ENaC, TRPV1, GRM4, andKCNJ2. The resulting SNPs from each gene were filtered by global minor allele frequency (MAF), andSNPs with a minor allele frequency below 5% were removed [18]. The resulting SNPs were filteredusing HaploView 4.2 software to obtain tag SNPs (tSNPs). Each tSNP is considered independent dueto low linkage disequilibrium (r2 < 0.05).
Saliva was collected at the health assessment using the Oragene•DNA (OG-575) collection kitfor Assisted Collection (DNA Genotek). Participants were fasted for a minimum of 30 minutes beforethe saliva sample was provided. Genetic material from saliva was extracted by ethanol precipitationaccording to the manufacturer’s protocol (DNA Genotek). The DNA samples were sent to The Centrefor Applied Genomics at The Hospital for Sick Children (Toronto, Canada) where they underwentgenotyping using the Agena MassArray System.
2.4. Psychophysical Measurements
Psychophysical tests for adults were administered in sensory booths at the University of GuelphSensory Laboratory (n = 65). Filter paper strips (Indigo Instruments – Cat#33814-Ctl; 47 mm × 6 mm× 0.3 mm) immersed in varying concentrations of tastants were used to determine suprathresholdsensitivity (ST) for the adults only. The tastants were: sucrose for sweet taste (Thermo Fisher Scientific,Rockford, IL, USA; S5-500), monosodium glutamate (MSG) (Thermo Fisher; ICN10180080) and inosinemonophosphate (IMP) (Thermo Fisher; AC226260250) for umami taste, sodium chloride (NaCl) for salttaste (Thermo Fisher; S641-500), citric acid for sour taste (A940-500), oleic acid for fat taste (A195-500)(Thermo Fisher Scientific), and PTC for bitter taste (Indigo Instruments, Waterloo, Ontario, Canada,–Cat#33814-PTC). Oleic acid was homogenized in deionized water prior to immersing the filter paper,and all other tastants were dissolved in water at ambient temperature. Filter paper strips wereimmersed in the tastant solution for about one second before placing them on a drying rack to dryovernight at ambient temperature. This procedure was performed only once for all strips before thestudy commenced. Taste strips immersed in a solution with the same tastant and concentration werestored together at 4 ◦C in a small plastic re-sealable bag. Each time a strip was tested, participantsplaced the taste strip in the middle of their tongue, closed their mouths, and allowed at least fiveseconds for the tastants to be sensed by taste receptors. Participants were asked to rinse and expectoratewith distilled water before beginning and following each strip. Within each taste modality, the rangeof tastant concentrations tested is shown in Table 1. Oral ST was determined using filter paper stripsfor a range of tastant concentrations by computing the area-under-the-curve (AUC) of intensity ratingson the general labeled magnitude scale (gLMS) [19], and preference (PR) was measured using aforced-choice paired comparison of hummus samples. Participants were presented with a range oftaste strips in random order and were asked to rate the intensity of the strips from 0–100 on a gLMSwhere 0 = undetectable, 2 = barely detectable, 6 = weak, 18 = moderate, 35 = strong, 52 = very strong,and 100 = strongest imaginable sensation of any kind. For bitter taste, only one rating of PTC intensitywas obtained.
In the PR test for adults, paired hummus samples labeled with random three-digit codes werepresented simultaneously to participants in a small translucent sample cup. Each pair of hummussamples consisted of one sample with a standard study formulation and the other with an addedingredient to more strongly elicit a specific taste modality. The standard study hummus was formulatedat the University of Guelph Formulation Laboratory. First, chickpeas (540 mL—ARZ Fine Foods)were rinsed in a strainer with cold water and poured into the three-quart polycarbonate bowl ofthe Robot Coupe Food Processor (Model# R2NCLR). Distilled water (92 mL—President’s Choice),
19

Nutrients 2018, 10, 990
olive + canola oil mix (54 mL—Pur Oliva), lemon juice (10 mL—ReaLemon), tahini (35 mL—ARZ),and salt (5.5 g—Thermo Fisher; S641-500) were then added to the chickpeas. The mix was processedfor 40 s, mixed with a spoon to allow chunks of chickpeas on the sides of the processor bowl to bere-incorporated, and processed again for 60 seconds. Five 150 g quantities of hummus were then setaside for the preparation of hummus samples with added ingredients. To elicit stronger fat, salt, sour,sweet, and umami taste, olive + canola oil mix (15 g), salt (0.5 g), lemon juice (7 g), sucrose (4 g), andMSG (4 g) were respectively added to a 150 g quantity of the standard study hummus and mixedthoroughly with a spoon. For each participant, ten sample cups containing five standard hummussamples as well as five hummus samples with added ingredients were prepared (8 g each). A randomnumber generator was used by a research assistant to produce the three-digit codes with which to labelthe sample cups such that the sensory test administrator was blinded to the hummus formulations.In the PR test, each sample was tasted using a metal spoon following an oral rinse with distilledwater. After the second hummus sample was tasted, participants were asked “Which of the twohummus samples did you prefer?” and responded by providing the sensory test administrator withthe three-digit code of the preferred sample. Oral ST and PR for all taste modalities were measuredduring the same study visit.
Table 1. Range of tastant concentrations used for each psychophysical test.
Taste Modality (Stimulus) Threshold/Suprathreshold (mM) Preference (mM)
Sweet (sucrose) 2.5–500 6%–36% (w/v *)Umami (MSG) 3.13–200 3.13–200Umami (IMP) 0.313–20 0.313–20
Umami (MSG+IMP) 3.13–200 MSG + 0.5 IMP 3.13–200 MSG + 0.5 IMPSalt (sodium chloride) 5–100 50–250
Sour (citric acid) 1–15 10–200Fat (oleic acid) 30–100 50–100
Bitter (PTC) 3 μg/strip -
Tastants were diluted in distilled water and filter papers were submerged in the solutions. * weight/volume. MSG:monosodium glutamate, IMP: inosine monophosphate, PTC: phenylthiocarbamide.
Children participated in a PR test and a PTC taster test only, following a 2-hour fast (n = 60). Whilethe hummus formulations in the PR test were identical to the test with the adults, the forced-choicepaired-comparison method was adapted for young children to ensure that the tasks of the procedurewould be understood. Once the children provided verbal assent to participate, they joined the testadministrator alone in a conference room that was void of any potential distractions. To confirm thatthe children understood the test, a mock forced-choice paired-comparison task was performed usinghair elastic bands of various colors and two containers labeled with a happy face on one and a sadface on the other. The children were asked to choose a “favorite color” and report this color to the testadministrator. The children were then presented with two bands, one of which was their favorite colorand the other was a different color. The children were then instructed to choose their favorite hairband and place it inside the container labeled with a happy face. If the child placed the hair band withtheir favorite color into the appropriate container, then they were deemed capable of performing thepreference test with the hummus samples. When choosing a preferred hummus sample, the childrensimply had to point to their preferred sample and the three-digit code of this sample was recorded bythe test administrator. Instead of providing an intensity rating on the gLMS for the strip of PTC paper,the children participated in a yes-no task to determine PTC taster status. The children responded witha “yes” or a “no” to the question “Does that taste bad or have no taste at all?” If the children reported abad taste, they were recorded as “PTC tasters” whereas children who reported no taste were recordedas “non-tasters”.
20

Nutrients 2018, 10, 990
2.5. Dietary Intake of Children
Parents completed a three-day food record for their children, including two weekdays and oneweekend day. Parents documented a detailed description of each food or beverage (i.e., cookingmethod, brand name) and the amount consumed. Food records were inputted into a nutrient analysisprogram (ESHA Food Processor, Version 11.0.110, Salem, OR, USA). Calories from sugar, added sugar,total carbohydrates, fat, and protein were computed from an average of three days. Energy densityof the whole diet as well as the relative contributions of energy density of sugar, added sugar, totalcarbohydrates, fat, and protein were also computed.
2.6. Statistics
With R Statistical Software Version 3.4.0 (R Foundation for Statistical Computing, Vienna, Austria),generalized estimating equations (GEE) were used first to estimate the regression coefficients for linearmodels of psychophysical measures of taste and SNPs. Secondly, SNPs significantly associated witha psychophysical measure of taste were then further analyzed using GEE to estimate the regressioncoefficients for logistic regression models of SNPs and trait pairs including one taste variable andone diet variable. A logistic regression was used as the alleles of each SNP were treated as binomialexperiments with n = 2 [20–23]. Only SNPs initially found to be significantly associated with a tastepreference in children, prior to the Bonferroni adjustment, were subsequently assessed for associationswith dietary intake using logistic regression. Taste variables were generally only paired with dietvariables whereby the nutrient elicits that type of taste. For example, SNPs significantly associatedwith sweet taste preference would only further investigated for associations with added sugar intake.As sour taste is not typically associated with sensing nutrients, it was paired with (1) percent energyfrom added sugar as sourness often accompanies sweetness in children’s candies, and (2) total energydensity of diet to examine any potential global effects of sour taste preference on the diet. GEEs werealso used to estimate the regression coefficients for linear models to examine the associations betweendiet variables and covariates including age, sex, and BMI due to the potential moderating effect ofBMI on taste perception [7,19,24–26]. Analyses for both parents and children account for correlatedoutcomes resulting from multiple siblings within some families and from sharing the same household.Regressions were only performed for SNPs located in a gene associated with the same taste modalityas the taste outcome. Statistical significance was set to p ≤ 0.05.
3. Results
3.1. Participant Characteristics
While 72 children and 81 adults from 49 families were recruited for the study, 60 children and 65adults from 44 families completed the study. Five recruited families did not complete the study due todiscontinued communication with the research personnel following recruitment. Adult participantcharacteristics are summarized in Table 2 and child participant characteristics are summarized inTable 3. Mothers (n = 41) and fathers (n = 24) had a mean age of 36.3 ± 4.3 years while boys (n = 27)and girls (n = 33) had a mean age of 4.1 ± 1.2 years. The mean BMI of adults (27.1 ± 5.6 kg/m2)indicated overweight and the mean BMI z-score of children (0.30 ± 0.99) indicated normal weight.
21
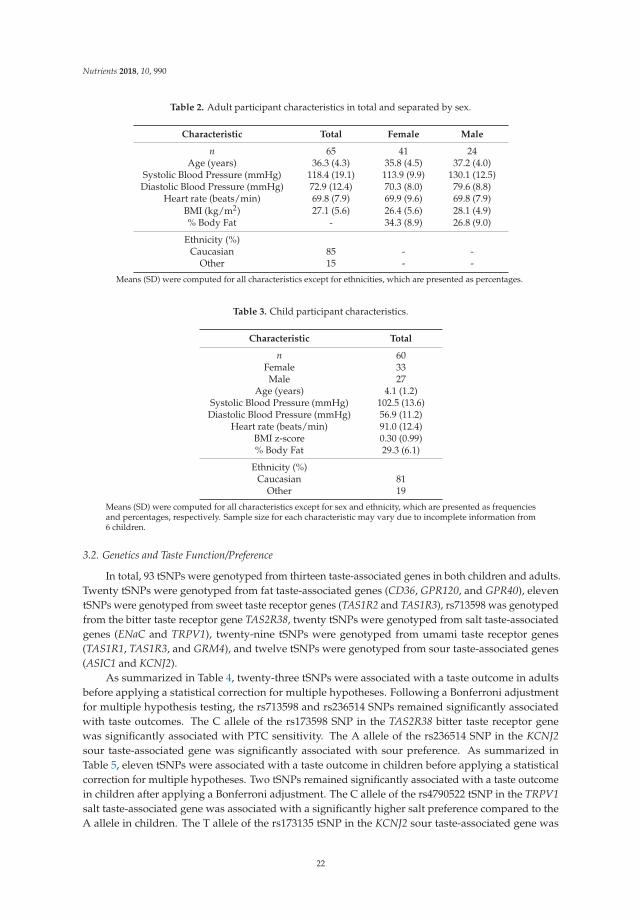
Nutrients 2018, 10, 990
Table 2. Adult participant characteristics in total and separated by sex.
Characteristic Total Female Male
n 65 41 24Age (years) 36.3 (4.3) 35.8 (4.5) 37.2 (4.0)
Systolic Blood Pressure (mmHg) 118.4 (19.1) 113.9 (9.9) 130.1 (12.5)Diastolic Blood Pressure (mmHg) 72.9 (12.4) 70.3 (8.0) 79.6 (8.8)
Heart rate (beats/min) 69.8 (7.9) 69.9 (9.6) 69.8 (7.9)BMI (kg/m2) 27.1 (5.6) 26.4 (5.6) 28.1 (4.9)% Body Fat - 34.3 (8.9) 26.8 (9.0)
Ethnicity (%)Caucasian 85 - -
Other 15 - -
Means (SD) were computed for all characteristics except for ethnicities, which are presented as percentages.
Table 3. Child participant characteristics.
Characteristic Total
n 60Female 33Male 27
Age (years) 4.1 (1.2)Systolic Blood Pressure (mmHg) 102.5 (13.6)Diastolic Blood Pressure (mmHg) 56.9 (11.2)
Heart rate (beats/min) 91.0 (12.4)BMI z-score 0.30 (0.99)% Body Fat 29.3 (6.1)
Ethnicity (%)Caucasian 81
Other 19
Means (SD) were computed for all characteristics except for sex and ethnicity, which are presented as frequenciesand percentages, respectively. Sample size for each characteristic may vary due to incomplete information from6 children.
3.2. Genetics and Taste Function/Preference
In total, 93 tSNPs were genotyped from thirteen taste-associated genes in both children and adults.Twenty tSNPs were genotyped from fat taste-associated genes (CD36, GPR120, and GPR40), eleventSNPs were genotyped from sweet taste receptor genes (TAS1R2 and TAS1R3), rs713598 was genotypedfrom the bitter taste receptor gene TAS2R38, twenty tSNPs were genotyped from salt taste-associatedgenes (ENaC and TRPV1), twenty-nine tSNPs were genotyped from umami taste receptor genes(TAS1R1, TAS1R3, and GRM4), and twelve tSNPs were genotyped from sour taste-associated genes(ASIC1 and KCNJ2).
As summarized in Table 4, twenty-three tSNPs were associated with a taste outcome in adultsbefore applying a statistical correction for multiple hypotheses. Following a Bonferroni adjustmentfor multiple hypothesis testing, the rs713598 and rs236514 SNPs remained significantly associatedwith taste outcomes. The C allele of the rs173598 SNP in the TAS2R38 bitter taste receptor genewas significantly associated with PTC sensitivity. The A allele of the rs236514 SNP in the KCNJ2sour taste-associated gene was significantly associated with sour preference. As summarized inTable 5, eleven tSNPs were associated with a taste outcome in children before applying a statisticalcorrection for multiple hypotheses. Two tSNPs remained significantly associated with a taste outcomein children after applying a Bonferroni adjustment. The C allele of the rs4790522 tSNP in the TRPV1salt taste-associated gene was associated with a significantly higher salt preference compared to theA allele in children. The T allele of the rs173135 tSNP in the KCNJ2 sour taste-associated gene was
22

Nutrients 2018, 10, 990
associated with a significantly higher sour preference compared to the C allele in children. In bothparents and children, the C allele of the rs236512 SNP from KCNJ2 was associated with sour preference.In parents, the A allele of the rs150908 SNP in TRPV1 was associated with both higher salt tastesensitivity and a lower preference for salt.
Table 4. Associations between single nucleotide polymorphisms (SNPs) in taste receptor genes andsuprathreshold sensitivity and taste preference in adults.
SNP ID (Gene) Taste Modality Outcome p-Value
rs12137730 (TAS1R2) Sweet Suprathreshold 0.021
rs2499729 (GRM4)
Umami
Suprathreshold0.031
rs3778045 (GRM4) 0.007rs4908563 (TAS1R1) 0.022
rs11759763 (GRM4)
Preference
0.007rs2451328 (GRM4) 0.021rs2451361 (GRM4) 0.012rs2499682 (GRM4) 0.020rs2499729 (GRM4) 0.036rs7772932 (GRM4) 0.015rs937039 (GRM4) 0.046rs9380406 (GRM4) 0.007
rs150908 (TRPV1)
SaltSuprathreshold
0.043rs161386 (TRPV1) 0.045rs222745 (TRPV1) 0.036
rs150908 (TRPV1) Preference 0.036
rs2301151 (GPR40)Fat Suprathreshold 0.016
rs3211816 (CD36) 0.014
rs713598 (TAS2R38) Bitter Suprathreshold 0.003 *
rs236512 (KCNJ2)
Sour Preference
0.041rs236514 (KCNJ2) 0.002 *rs376184 (ASIC1) 0.019rs643637 (KCNJ2) 0.011
Generalized estimating equations were used to estimate the regression coefficients of a linear model includingsuprathreshold sensitivity and taste preference with SNPs (n = 65). Regressions were only performed forSNPs located in a gene associated with the same taste modality as the taste outcome. Following a Bonferroniadjustment for multiple hypothesis testing, the rs713598 and rs236514 SNPs remained significantly associated withphenylthiocarbamide suprathreshold and sour preference, respectively. The Bonferroni adjustment of the reportedp-values accounted for the number of hypotheses equal to the number of SNPs in genes associated with each tastemodality. * p ≤ 0.05 following a Bonferroni adjustment for multiple hypotheses.
Table 5. Associations between SNPs in taste receptor genes and taste preference in children.
SNP ID (Gene) Taste Modality p-Value
rs7534618 (TAS1R2)Sweet
0.026rs9701796 (TAS1R2) 0.013
rs4713740 (mGluR4) Umami 0.039
rs4790151 (TRPV1)Salt
0.008rs4790522 (TRPV1) 0.001 *rs877610 (TRPV1) 0.010
rs17108968 (GPR120) Fat 0.029
23

Nutrients 2018, 10, 990
Table 5. Cont.
SNP ID (Gene) Taste Modality p-Value
rs173135 (KCNJ2)
Sour
<0.001 *rs236512 (KCNJ2) 0.007rs236513 (KCNJ2) 0.006
rs9890133 (KCNJ2) 0.006
Generalized estimating equations were used to estimate the regression coefficients of a linear model including tastepreference with SNPs (n = 60). Regressions were only performed for SNPs located in a gene associated with thesame taste modality as the taste outcome. The rs4790522 (TAS1R2) and rs173135 (KCNJ2) SNPs remained significantfollowing a Bonferroni adjustment for multiple hypothesis testing. The Bonferroni adjustment of the reportedp-values accounted for the number of hypotheses equal to the number of SNPs in genes associated with each tastemodality. * p ≤ 0.05 following a Bonferroni adjustment for multiple hypotheses.
3.3. Multiple Trait Analysis: SNPs, Taste and Dietary Intake
Results of the multiple trait analysis are summarized in Table 6. Age, sex, and BMI were notsignificantly associated with any of the diet variables. The rs9701796 SNP in the TAS1R2 sweet tastereceptor gene was associated with both sweet taste preference (p = 0.022) and percent energy fromadded sugar in the diet (p = 0.05). The rs9701796 SNP was also significantly related to sweet tastepreference when included in a model with total energy density of diet (p = 0.05), however total energydensity of diet was not statistically significant in the model. While the rs173135 SNP in the KCNJ2 sourtaste-associated gene was no longer significantly associated with sour taste preference, this SNP wassignificantly associated with total energy density of diet with sour taste preference included in themodel (p = 0.03).
Table 6. Multiple trait analysis of SNPs in taste receptor genes, taste preferences and dietary intakein children.
SNP (Gene) Taste Modality Dietary Outcomep-Value
Taste Preference Diet
rs17108968(GPR120) Fat
Total energy density (kcal/g) 0.09 0.46Energy from fat (kcal) 0.10 0.69
% Energy from fat 0.09 0.65
rs4790151 (TRPV1)Salt Sodium (mg)
0.92 0.30rs4790522 (TRPV1) 0.29 0.44rs877610 (TRPV1) 0.58 0.71
rs173135 (KCNJ2)
Sour
Total energy density (kcal/g) 0.20 0.03 *% Energy from added sugar 0.39 0.49
rs236512 (KCNJ2)Total energy density (kcal/g) 0.64 0.36% Energy from added sugar 0.80 0.35
rs236513 (KCNJ2)Total energy density (kcal/g) 0.34 0.11% Energy from added sugar 0.55 0.78
rs9890133 (KCNJ2)Total energy density (kcal/g) 0.34 0.11% Energy from added sugar 0.55 0.78
rs7534618 (TAS1R2)Sweet
% Energy from added sugar 0.47 0.11Total energy density (kcal/g) 0.32 0.39
rs9701796 (TAS1R2)% Energy from added sugar 0.02 * 0.05 *Total energy density (kcal/g) 0.05 * 0.98
rs4713740 (GRM4) UmamiTotal energy density (kcal/g) 0.37 0.59
% Energy from protein 0.37 0.99
Generalized estimating equations were used to estimate the regression coefficients of a logistic model includingSNPs with trait pairs including a taste preference variable and a diet variable (n = 60). Regressions were onlyperformed for SNPs determined to be significantly associated with taste preferences in the initial linear regressions.Taste variables were generally only paired with specific diet variables whereby the nutrient elicits that type of taste.* p ≤ 0.05.
24

Nutrients 2018, 10, 990
4. Discussion
This study examined associations between a comprehensive panel of SNPs in taste receptorgenes and psychophysical measures of taste across all known taste modalities in both parents andtheir children. Overall, the findings in this study showed that SNPs in taste receptor genes fromall of the different types of taste may contribute to inter-individual differences in psychophysicalmeasures of taste. However, only four SNPs (rs173135, rs236514, rs4790522 and rs713598) werefound to be significantly related to a taste outcome after applying a statistical correction for multiplehypothesis testing.
The rs4790522 SNP, located in the salt taste-associated gene TRPV1, was found to be significantlyassociated with preference for salt in children. Regulation of salt intake, or sodium, is due in partto variation in genes related to homeostatic sodium regulation [27–30] and to hedonic responses tothe taste of salt [8]. Sodium intake is important to monitor due to its role in the development ofhypertension, a risk factor for the development of cardiovascular disease [31–34]. The rs4790522SNP has previously been shown to change the miRNA binding site of TRPV1, suggesting thatthis SNP may affect the stability of the mRNA precursor to TRPV1 and prevent translation into itsfunctional protein [35]. The potential decreased functionality of TRPV1 may reduce salt taste sensitivityand therefore increase the preference of salt in carriers of this SNP. To the authors’ knowledge, noassociations have previously been found between the rs4790522 SNP and salt taste. Future studiesshould also consider examining the rs150908 SNP which exhibited significant associations with bothsalt sensitivity and salt preference in parents, increasing the potential relevance of this variant forsalt taste. Studies with larger sample sizes are warranted to replicate these results in order to betterunderstand the genetic basis for salt sensitivity, and therefore hypertension.
Sour taste is elicited by acidic substances through the depolarization of type III taste bud cells [36].While sourness is conventionally considered a means to avoid the consumption of spoiled foods, manyanimals find mildly acidic foods to be palatable. Moreover, genetic factors may be more importantthan shared environment to determine the pleasantness and intensity of sour taste as 34–50% of thevariation in pleasantness and use-frequency of sour foods is attributable to genetics [37]. With theknowledge that there is a genetic basis for the preference for sour foods in humans, Ye et al. (2016)proposed that sour taste is mediated by the potassium ion channel KIR2.1, encoded by the KCNJ2gene [38]. The rs173135 and rs236514 SNPs in KCNJ2 were found to be associated with the preferencefor sour in children and parents, respectively. Moreover, the rs236512 SNP was associated with sourpreference in both children and adults. Observing associations with sour preference in two differentcohorts suggests that this association may pertain to changes in sour taste function. The genetic basisof human sour taste has not previously been explored through examining KCNJ2 SNPs. These novelfindings provide a foundation for future studies to investigate the genetic basis of sour taste as well assour food intake.
Variants in TAS1R2 and TAS1R3 sweet taste receptor genes have previously been associated withchanges in taste sensitivity to sugar [39–46], the excessive consumption of which is an establishedrisk factor for obesity and chronic disease [47–49]. Previous research has implicated SNPs in TAS1R2and TAS1R3 in inter-individual differences in sugar sensitivity [7,10] and dietary intake [6,7,9,11,16].However, this study is the first to find an association between a SNP in a sweet tasting gene with bothsucrose preference and dietary sucrose intake. In an analysis of SNPs together with taste and diet,it was found that the rs9701796 SNP in the sweet taste receptor gene TAS1R2 was both associatedwith sweet taste preference and percent energy from added sugar in the children. In a previous studyin children and adolescents, rs9701796 was associated with increased waist-height ratio as well aswith a higher chocolate powder intake in obese children [14]. In another study of children aged7–12, rs9701796 was not associated with dental caries, a marker often related to excessive sweet foodconsumption [50]. More research pertaining to this variant is warranted, particularly to assess itsrelationship with the consumption of sweet foods. By establishing these types of associations in future
25

Nutrients 2018, 10, 990
studies, genetic loci can be considered risk factors for the overconsumption of sweet foods and be usedclinically to indicate the risk of developing obesity and other chronic diseases.
The bitterness of green leafy vegetables including Brassica vegetables is related to the taste ofthiol compounds and may be stronger in those homozygous for the C allele at the rs713598 locus inthe TAS2R38 taste receptor gene. Non-carriers of the C allele may not taste PTC, and this may theninfluence the perceived bitterness of Brassica vegetables [51]. While parents in this study exhibiteda strong association between rs713598 genotype and PTC tasting, no relationship was observedbetween rs713598 genotype and PTC taster status in children. Children would be expected to show astronger genotype-phenotype relationship due to having less exposure to culture at their age; however,the lack of association in this study is likely an indicator of the poor reliability of measuring PTC tastesensitivity in this age group. Children between 3–8 years of age may not have an adequately developedunderstanding of the quality of bitterness. While the study personnel administered a simple yes-notask to determine PTC taster status in the children, this task may still have been too complex due tothe unusual taste and paper format of the stimulus.
There are some limitations to consider in this study. Firstly, the data obtained by assessingtaste sensitivity in parents, using isolated compounds on filter paper strips, cannot be used to makedirect associations between genetics and food intake. This can also be considered a strength of thestudy as the observations made are accurate for specific taste modalities; however, salt taste was notaccounted for when MSG taste was analyzed. The use of hummus as a food matrix in this study mayhave introduced uncertainty due to the perception of texture, temperature, and other matrix-specificqualities; however the use of a food as a stimulus increases the relevance of these results to foodpreferences and food selection. In addition, participants were tested for sensitivity and preference ononly one occasion, but this should be repeated to confirm validity. Medication was not screened priorto the study, and it is possible that medications taken by the participants could have interfered withtaste perception. While this study was powered to observe differences in sensory outcomes, the samplesize was small and the likelihood of making type II errors would be lower with a larger sample. Finally,the genetic heterogeneity due to the presence of more than one ethnicity in this sample may hinder theinterpretation of the results as the minor allele frequencies of SNPs differ depending on the population.However, the statistical methods used in this work account for correlated outcomes as parents share ahousehold and siblings share household and genetics.
5. Conclusions
This study demonstrated that SNPs in taste receptor genes may contribute to inter-individualdifferences in taste sensitivity, taste preference and dietary intake. These findings, based on acomprehensive panel of genetic variants in adults and young children, support the relevance ofgenetics in explaining variation in taste function. The genetic determinants of taste function areimportant to understand as they may predispose individuals to developing poor eating patterns. In thefuture, effective strategies can be developed to improve eating habits and therefore risk of obesitythrough personalized nutritional recommendations based on unique taste preferences.
Author Contributions: E.C. conceived and designed the experiments, collected and analyzed data, and wrotethe paper; N.A.C. helped with data collection and analysis; L.D. helped to design the sensory experiments andprovided critical revision for the paper; Z.F. helped with the statistical analysis and provided critical revision forthe paper; W.Q. helped with statistical analysis; G.D. helped with the statistical analysis and provided criticalrevision for the paper; A.M.D. helped with the dietary data and provided critical revision for the paper; J.H.provided critical revision for the paper; D.W.L.M. conceived and designed the experiments and provided criticalrevision for the paper.
Funding: This research was funded by the Ontario Ministry of Agriculture, Food, and Rural Affairs (grant# 030194)
Conflicts of Interest: The authors declare no conflict of interest.
26

Nutrients 2018, 10, 990
References
1. World Health Organization. Obesity and Overweight. Available online: http://www.who.int/news-room/fact-sheets/detail/obesity-and-overweight (accessed on 5 May 2018).
2. Caballero, B. The global epidemic of obesity: An overview. Epidemiol. Rev. 2007, 29, 1–5. [CrossRef] [PubMed]3. Borjeson, M. The aetiology of obesity in children. A study of 101 twin pairs. Acta Paediatr. Scand. 1976, 65,
279–287. [CrossRef] [PubMed]4. Stunkard, A.J.; Foch, T.T.; Hrubec, Z. A twin study of human obesity. JAMA 1986, 256, 51–54. [CrossRef]
[PubMed]5. Skouteris, H.; McCabe, M.; Swinburn, B.; Newgreen, V.; Sacher, P.; Chadwick, P. Parental influence and
obesity prevention in pre-schoolers: A systematic review of interventions. Obes. Rev. 2011, 12, 315–328.[CrossRef] [PubMed]
6. Chamoun, E.; Hutchinson, J.; Krystia, O.; Mirotta, J.; Mutch, D.; Buchholz, A.; Duncan, A.; Darlington, G.;Haines, J.; Ma, D.; et al. Single nucleotide polymorphisms in taste receptor genes are associated withsnacking patterns of preschool-aged children in the Guelph family health study: A pilot study. Nutrients2018, 10, 153. [CrossRef] [PubMed]
7. Dias, A.G.; Eny, K.M.; Cockburn, M.; Chiu, W.; Nielsen, D.E.; Duizer, L.; El-Sohemy, A. Variation in the tas1r2gene, sweet taste perception and intake of sugars. J. Nutrigenet. Nutrigenomics 2015, 8, 81–90. [CrossRef][PubMed]
8. Dias, A.G.; Rousseau, D.; Duizer, L.; Cockburn, M.; Chiu, W.; Nielsen, D.; El-Sohemy, A. Genetic variation inputative salt taste receptors and salt taste perception in humans. Chem. Senses 2013, 38, 137–145. [CrossRef][PubMed]
9. Eny, K.M.; Wolever, T.M.; Corey, P.N.; El-Sohemy, A. Genetic variation in tas1r2 (ile191val) is associated withconsumption of sugars in overweight and obese individuals in 2 distinct populations. Am. J. Clin. Nutr.2010, 92, 1501–1510. [CrossRef] [PubMed]
10. Fushan, A.A.; Simons, C.T.; Slack, J.P.; Manichaikul, A.; Drayna, D. Allelic polymorphism within the tas1r3promoter is associated with human taste sensitivity to sucrose. Curr. Biol. 2009, 19, 1288–1293. [CrossRef][PubMed]
11. Han, P.; Keast, R.S.J.; Roura, E. Salivary leptin and tas1r2/tas1r3 polymorphisms are related to sweet tastesensitivity and carbohydrate intake from a buffet meal in healthy young adults. Br. J. Nutr. 2017, 118,763–770. [CrossRef] [PubMed]
12. Hoppu, U.; Laitinen, K.; Jaakkola, J.; Sandell, M. The htas2r38 genotype is associated with sugar and candyconsumption in preschool boys. J. Hum. Nutr. Diet. 2015, 28, 45–51. [CrossRef] [PubMed]
13. Keller, K.L.; Liang, L.C.; Sakimura, J.; May, D.; van, B.C.; Breen, C.; Driggin, E.; Tepper, B.J.; Lanzano, P.C.;Deng, L.; et al. Common variants in the cd36 gene are associated with oral fat perception, fat preferences,and obesity in African Americans. Obesity. (Silver. Spring) 2012, 20, 1066–1073. [CrossRef] [PubMed]
14. Pioltine, M.B.; de Melo, M.E.; Santos, A.S.; Machado, A.D.; Fernandes, A.E.; Fujiwara, C.T.; Cercato, C.;Mancini, M.C. Genetic variations in sweet taste receptor gene are related to chocolate powder and dietaryfiber intake in obese children and adolescents. J. Pers. Med. 2018, 8, 7. [CrossRef] [PubMed]
15. Raliou, M.; Wiencis, A.; Pillias, A.M.; Planchais, A.; Eloit, C.; Boucher, Y.; Trotier, D.; Montmayeur, J.P.;Faurion, A. Nonsynonymous single nucleotide polymorphisms in human tas1r1, tas1r3, and mglur1 andindividual taste sensitivity to glutamate. Am. J. Clin. Nutr. 2009, 90, 789S–799S. [CrossRef] [PubMed]
16. Ramos-Lopez, O.; Panduro, A.; Martinez-Lopez, E.; Roman, S. Sweet taste receptor tas1r2 polymorphism(val191val) is associated with a higher carbohydrate intake and hypertriglyceridemia among the populationof west Mexico. Nutrients 2016, 8, 101. [CrossRef] [PubMed]
17. Kushner, R.F.; Schoeller, D.A.; Fjeld, C.R.; Danford, L. Is the impedance index (ht2/r) significant in predictingtotal body water? Am. J. Clin. Nutr. 1992, 56, 835–839. [CrossRef] [PubMed]
18. The international hapmap project. Nature 2003, 426, 789–796. Available online: https://www.nature.com/articles/nature02168 (accessed on 1 March 2016).
19. Pepino, M.Y.; Finkbeiner, S.; Beauchamp, G.K.; Mennella, J.A. Obese women have lower monosodiumglutamate taste sensitivity and prefer higher concentrations than do normal-weight women. Obesity (SilverSpring) 2010, 18, 959–965. [CrossRef] [PubMed]
27
Nutrients 2018, 10, 990
20. Feng, Z.; Wong, W.W.L.; Gao, X.; Schenkel, F. Generalized genetic association study with samples of relatedindividuals. Ann. Appl. Stat. 2011, 5, 2109–2130. [CrossRef]
21. Zeny, F. A generalized quasi-likelihood scoring approach for simultaneously testing the genetic associationof multiple traits. J. R. Stat. Soc. Series C (Appl. Stat.) 2014, 63, 483–498.
22. Wang, W.; Feng, Z.; Bull, S.B.; Wang, Z. A 2-step strategy for detecting pleiotropic effects on multiplelongitudinal traits. Front. Genet. 2014, 5, 357. [CrossRef] [PubMed]
23. Yubin, S.; Zeny, F.; Sanjeena, S. A genome-wide association study of multiple longitudinal traits with relatedsubjects. Stat 2016, 5, 22–44.
24. Park, D.C.; Yeo, J.H.; Ryu, I.Y.; Kim, S.H.; Jung, J.; Yeo, S.G. Differences in taste detection thresholds betweennormal-weight and obese young adults. Acta Otolaryngol. 2015, 135, 478–483. [CrossRef] [PubMed]
25. Stewart, J.E.; Feinle-Bisset, C.; Golding, M.; Delahunty, C.; Clifton, P.M.; Keast, R.S. Oral sensitivity to fattyacids, food consumption and bmi in human subjects. Br. J. Nutr. 2010, 104, 145–152. [CrossRef] [PubMed]
26. Stewart, J.E.; Feinle-Bisset, C.; Keast, R.S. Fatty acid detection during food consumption and digestion:Associations with ingestive behavior and obesity. Prog. Lipid Res. 2011, 50, 225–233. [CrossRef] [PubMed]
27. Gu, X.; Gu, D.; He, J.; Rao, D.C.; Hixson, J.E.; Chen, J.; Li, J.; Huang, J.; Wu, X.; Rice, T.K.; et al. Resequencingepithelial sodium channel genes identifies rare variants associated with blood pressure salt-sensitivity:The gensalt study. Am. J. Hypertens. 2017, 31, 205–211. [CrossRef] [PubMed]
28. Yang, X.; He, J.; Gu, D.; Hixson, J.E.; Huang, J.; Rao, D.C.; Shimmin, L.C.; Chen, J.; Rice, T.K.; Li, J.; et al.Associations of epithelial sodium channel genes with blood pressure changes and hypertension incidence:The gensalt study. Am. J. Hypertens. 2014, 27, 1370–1376. [CrossRef] [PubMed]
29. Rao, A.D.; Sun, B.; Saxena, A.; Hopkins, P.N.; Jeunemaitre, X.; Brown, N.J.; Adler, G.K.; Williams, J.S.Polymorphisms in the serum- and glucocorticoid-inducible kinase 1 gene are associated with blood pressureand renin response to dietary salt intake. J. Hum. Hypertens. 2013, 27, 176–180. [CrossRef] [PubMed]
30. Zhao, Q.; Gu, D.; Hixson, J.E.; Liu, D.P.; Rao, D.C.; Jaquish, C.E.; Kelly, T.N.; Lu, F.; Ma, J.; Mu, J.; et al.Common variants in epithelial sodium channel genes contribute to salt sensitivity of blood pressure:The gensalt study. Circ. Cardiovasc. Genet. 2011, 4, 375–380. [CrossRef] [PubMed]
31. Strazzullo, P.; D’Elia, L.; Kandala, N.B.; Cappuccio, F.P. Salt intake, stroke, and cardiovascular disease:Meta-analysis of prospective studies. BMJ 2009, 339, b4567. [CrossRef] [PubMed]
32. Cook, N.R.; Cutler, J.A.; Obarzanek, E.; Buring, J.E.; Rexrode, K.M.; Kumanyika, S.K.; Appel, L.J.;Whelton, P.K. Long term effects of dietary sodium reduction on cardiovascular disease outcomes:Observational follow-up of the trials of hypertension prevention (tohp). BMJ 2007, 334, 885–888. [CrossRef][PubMed]
33. Liu, K.; Stamler, J. Assessment of sodium intake in epidemiological studies on blood pressure. Ann. Clin. Res.1984, 16, 49–54. [PubMed]
34. Elliott, P.; Stamler, J.; Nichols, R.; Dyer, A.R.; Stamler, R.; Kesteloot, H.; Marmot, M. Intersalt revisited:Further analyses of 24 hour sodium excretion and blood pressure within and across populations. Intersaltcooperative research group. BMJ 1996, 312, 1249–1253. [CrossRef] [PubMed]
35. Zhang, J.; Zhou, Z.; Zhang, N.; Jin, W.; Ren, Y.; Chen, C. Establishment of preliminary regulatory network oftrpv1 and related cytokines. Saudi J. Biol. Sci. 2017, 24, 582–588. [CrossRef] [PubMed]
36. Huang, Y.A.; Maruyama, Y.; Stimac, R.; Roper, S.D. Presynaptic (type iii) cells in mouse taste buds sense sour(acid) taste. J. Physiol. 2008, 586, 2903–2912. [CrossRef] [PubMed]
37. Tornwall, O.; Silventoinen, K.; Keskitalo-Vuokko, K.; Perola, M.; Kaprio, J.; Tuorila, H. Genetic contributionto sour taste preference. Appetite 2012, 58, 687–694. [CrossRef] [PubMed]
38. Ye, W.; Chang, R.B.; Bushman, J.D.; Tu, Y.H.; Mulhall, E.M.; Wilson, C.E.; Cooper, A.J.; Chick, W.S.;Hill-Eubanks, D.C.; Nelson, M.T.; et al. The k+ channel kir2.1 functions in tandem with proton influxto mediate sour taste transduction. Proc. Natl. Acad. Sci. U.S.A. 2016, 113, E229–E238. [CrossRef] [PubMed]
39. Drayna, D. Human taste genetics. Annu. Rev. Genomics Hum. Genet. 2005, 6, 217–235. [CrossRef] [PubMed]40. Keskitalo, K.; Knaapila, A.; Kallela, M.; Palotie, A.; Wessman, M.; Sammalisto, S.; Peltonen, L.; Tuorila, H.;
Perola, M. Sweet taste preferences are partly genetically determined: Identification of a trait locus onchromosome 16. Am. J. Clin. Nutr. 2007, 86, 55–63. [CrossRef] [PubMed]
41. Keskitalo, K.; Tuorila, H.; Spector, T.D.; Cherkas, L.F.; Knaapila, A.; Silventoinen, K.; Perola, M. Same geneticcomponents underlie different measures of sweet taste preference. Am. J. Clin. Nutr. 2007, 86, 1663–1669.[CrossRef] [PubMed]
28

Nutrients 2018, 10, 990
42. Keskitalo, K.; Tuorila, H.; Spector, T.D.; Cherkas, L.F.; Knaapila, A.; Kaprio, J.; Silventoinen, K.; Perola, M.The three-factor eating questionnaire, body mass index, and responses to sweet and salty fatty foods: A twinstudy of genetic and environmental associations. Am. J. Clin. Nutr. 2008, 88, 263–271. [CrossRef] [PubMed]
43. Kim, U.K.; Breslin, P.A.; Reed, D.; Drayna, D. Genetics of human taste perception. J. Dent. Res. 2004, 83,448–453. [CrossRef] [PubMed]
44. Reed, D.R.; Bachmanov, A.A.; Beauchamp, G.K.; Tordoff, M.G.; Price, R.A. Heritable variation in foodpreferences and their contribution to obesity. Behav. Genet. 1997, 27, 373–387. [CrossRef] [PubMed]
45. Reed, D.R.; McDaniel, A.H. The human sweet tooth. BMC. Oral Health 2006, 6, S17. [CrossRef] [PubMed]46. Reed, D.R.; Tanaka, T.; McDaniel, A.H. Diverse tastes: Genetics of sweet and bitter perception. Physiol Behav
2006, 88, 215–226. [CrossRef] [PubMed]47. Gross, L.S.; Li, L.; Ford, E.S.; Liu, S. Increased consumption of refined carbohydrates and the epidemic of
type 2 diabetes in the United States: An ecologic assessment. Am. J. Clin. Nutr. 2004, 79, 774–779. [CrossRef][PubMed]
48. Bray, G.A.; Nielsen, S.J.; Popkin, B.M. Consumption of high-fructose corn syrup in beverages may play arole in the epidemic of obesity. Am. J. Clin. Nutr. 2004, 79, 537–543. [CrossRef] [PubMed]
49. Lustig, R.H.; Schmidt, L.A.; Brindis, C.D. Public health: The toxic truth about sugar. Nature 2012, 482, 27–29.[CrossRef] [PubMed]
50. Haznedaroglu, E.; Koldemir-Gunduz, M.; Bakir-Coskun, N.; Bozkus, H.M.; Cagatay, P.; Susleyici-Duman, B.;Mentes, A. Association of sweet taste receptor gene polymorphisms with dental caries experience in schoolchildren. Caries. Res. 2015, 49, 275–281. [CrossRef] [PubMed]
51. Kim, U.; Jorgenson, E.; Coon, H.; Leppert, M.; Risch, N.; Drayna, D. Positional Cloning of the HumanQuantitative Trait Locus Underlying Taste Sensitivity to Phenylthiocarbamide. Science 2003, 299, 1221–1225.[CrossRef] [PubMed]
© 2018 by the authors. Licensee MDPI, Basel, Switzerland. This article is an open accessarticle distributed under the terms and conditions of the Creative Commons Attribution(CC BY) license (http://creativecommons.org/licenses/by/4.0/).
29

nutrients
Article
Individualized Meal Replacement Therapy ImprovesClinically Relevant Long-Term Glycemic Control inPoorly Controlled Type 2 Diabetes Patients
Kerstin Kempf 1,†, Martin Röhling 1,*,†, Katja Niedermeier 1, Babette Gärtner 1 and
Stephan Martin 1,2
1 West-German Centre of Diabetes and Health, Düsseldorf Catholic Hospital Group, Hohensandweg 37, 40591Düsseldorf, Germany; [email protected] (K.K.); [email protected] (K.N.);[email protected] (B.G.); [email protected] (S.M.)
2 Faculty of Medicine, Heinrich Heine University Düsseldorf, 40225 Düsseldorf, Germany* Correspondence: [email protected]; Tel.: +49-(0)211-56-60-360-76;
Fax: +49-(0)211-56-60-360-72† Equal authorship.
Received: 14 June 2018; Accepted: 1 August 2018; Published: 4 August 2018
Abstract: Background Formula diets can improve glycemic control or can even induce remissionin type 2 diabetes. We hypothesized that especially an individualized intense meal replacementby a low-carbohydrate formula diet with accompanied self-monitoring of blood glucose (SMBG)contributes to long-term improvements in HbA1c, weight, and cardiometabolic risk factors in poorlycontrolled type 2 diabetes. Methods Type 2 diabetes patients were randomized into either a moderategroup (M-group) with two meal replacements/day (n = 160) or a stringent group (S-group) withthree meal replacements/day (n = 149) during the first week of intervention (1300–1500 kcal/day).Subsequently, both groups reintroduced a low-carbohydrate lunch based on individual adaptiondue to SMBG in weeks 2–4. After week 4, breakfast was reintroduced until week 12. During thefollow-up period, all of the participants were asked to continue replacing one meal per day untilthe 52-weeks follow-up. Additionally, an observational control group (n = 100) remained in routinecare. Parameters were compared at baseline, after 12 and 52 weeks within and between all of thegroups. Results 321 participants (83%) completed the acute meal replacement phase after 12 weeksand 279 participants (72%) the whole intervention after 52 weeks. Both intervention groups achievedimprovements in HbA1c, fasting blood glucose, blood pressure, and weight (all p < 0.001) within12 weeks. However, these results were not significantly different between both of the interventiongroups. The estimated treatment difference in HbA1c reduction was (mean (95% confidence interval[CI]) -0.10% with 95% CI [−0.40; 0.21] also (p > 0.05) (S-group vs. M-group) not statistically differentafter 12 weeks. However, only the S-group showed a clinically relevant improvement in HbA1c of−0.81% [−1.06; −0.55] (p < 0.001) after 52 weeks of follow-up, whereas HbA1c was not statisticallydifferent between the M- and control group. Conclusion Individualized meal replacement withSMBG demonstrated beneficial effects on HbA1c and cardiometabolic parameters in type 2 diabetes.Furthermore, the initiation of a weight loss program with one week of full meal replacement (threemeals per day) resulted in a clinically relevant long-term HbA1c reduction, as compared to anobservational control group that had standard care.
Keywords: type 2 diabetes; low-carbohydrate diet; HbA1c; weight loss; formula diet
1. Introduction
Current type 2 diabetes mellitus guidelines recommend lifestyle intervention as basic treatment.However, patients often fail to improve their eating behavior, physical activity, body weight,
Nutrients 2018, 10, 1022; doi:10.3390/nu10081022 www.mdpi.com/journal/nutrients30
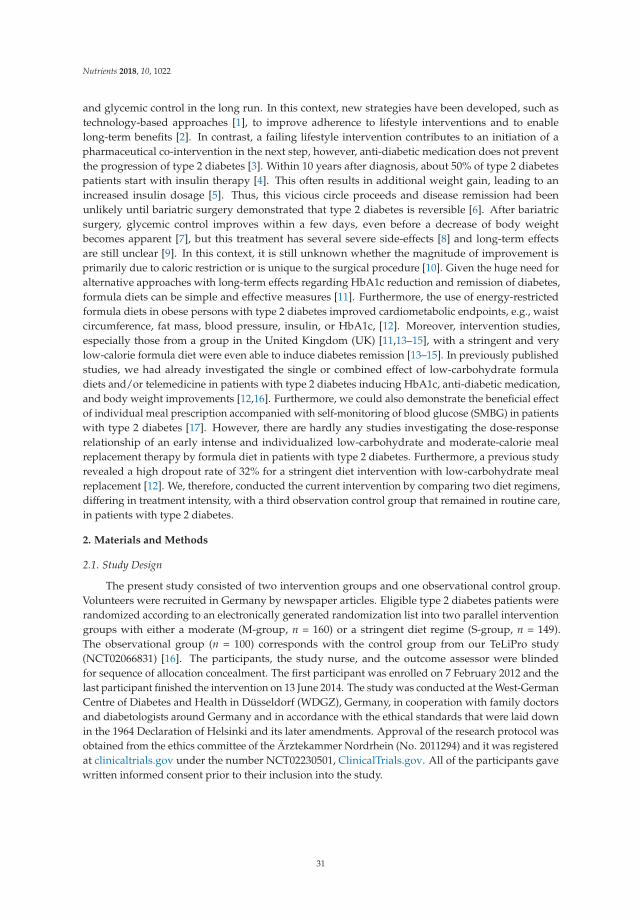
Nutrients 2018, 10, 1022
and glycemic control in the long run. In this context, new strategies have been developed, such astechnology-based approaches [1], to improve adherence to lifestyle interventions and to enablelong-term benefits [2]. In contrast, a failing lifestyle intervention contributes to an initiation of apharmaceutical co-intervention in the next step, however, anti-diabetic medication does not preventthe progression of type 2 diabetes [3]. Within 10 years after diagnosis, about 50% of type 2 diabetespatients start with insulin therapy [4]. This often results in additional weight gain, leading to anincreased insulin dosage [5]. Thus, this vicious circle proceeds and disease remission had beenunlikely until bariatric surgery demonstrated that type 2 diabetes is reversible [6]. After bariatricsurgery, glycemic control improves within a few days, even before a decrease of body weightbecomes apparent [7], but this treatment has several severe side-effects [8] and long-term effectsare still unclear [9]. In this context, it is still unknown whether the magnitude of improvement isprimarily due to caloric restriction or is unique to the surgical procedure [10]. Given the huge need foralternative approaches with long-term effects regarding HbA1c reduction and remission of diabetes,formula diets can be simple and effective measures [11]. Furthermore, the use of energy-restrictedformula diets in obese persons with type 2 diabetes improved cardiometabolic endpoints, e.g., waistcircumference, fat mass, blood pressure, insulin, or HbA1c, [12]. Moreover, intervention studies,especially those from a group in the United Kingdom (UK) [11,13–15], with a stringent and verylow-calorie formula diet were even able to induce diabetes remission [13–15]. In previously publishedstudies, we had already investigated the single or combined effect of low-carbohydrate formuladiets and/or telemedicine in patients with type 2 diabetes inducing HbA1c, anti-diabetic medication,and body weight improvements [12,16]. Furthermore, we could also demonstrate the beneficial effectof individual meal prescription accompanied with self-monitoring of blood glucose (SMBG) in patientswith type 2 diabetes [17]. However, there are hardly any studies investigating the dose-responserelationship of an early intense and individualized low-carbohydrate and moderate-calorie mealreplacement therapy by formula diet in patients with type 2 diabetes. Furthermore, a previous studyrevealed a high dropout rate of 32% for a stringent diet intervention with low-carbohydrate mealreplacement [12]. We, therefore, conducted the current intervention by comparing two diet regimens,differing in treatment intensity, with a third observation control group that remained in routine care,in patients with type 2 diabetes.
2. Materials and Methods
2.1. Study Design
The present study consisted of two intervention groups and one observational control group.Volunteers were recruited in Germany by newspaper articles. Eligible type 2 diabetes patients wererandomized according to an electronically generated randomization list into two parallel interventiongroups with either a moderate (M-group, n = 160) or a stringent diet regime (S-group, n = 149).The observational group (n = 100) corresponds with the control group from our TeLiPro study(NCT02066831) [16]. The participants, the study nurse, and the outcome assessor were blindedfor sequence of allocation concealment. The first participant was enrolled on 7 February 2012 and thelast participant finished the intervention on 13 June 2014. The study was conducted at the West-GermanCentre of Diabetes and Health in Düsseldorf (WDGZ), Germany, in cooperation with family doctorsand diabetologists around Germany and in accordance with the ethical standards that were laid downin the 1964 Declaration of Helsinki and its later amendments. Approval of the research protocol wasobtained from the ethics committee of the Ärztekammer Nordrhein (No. 2011294) and it was registeredat clinicaltrials.gov under the number NCT02230501, ClinicalTrials.gov. All of the participants gavewritten informed consent prior to their inclusion into the study.
31

Nutrients 2018, 10, 1022
2.2. Study Population
Patients with type 2 diabetes, aged 25–79 years with poorly controlled glucose levels(HbA1c ≥ 7.5%), and body mass index (BMI) ≥ 27 kg/m2 were included in the study. Participantswere excluded when one of the following exclusion criteria was existent: (i) acute infections; (ii) chronicdiseases such as cancer, chronic obstructive pulmonary disease, asthma, dementia, chronic gut diseases,psychoses, liver cirrhosis, nephropathy, and kidney insufficiency with glomerular filtration rate< 30 mL/min/1.73 m2; (iii) weight loss of >2 kg/week in the last month; (iv) smoking cessation orplanned smoking cessation during the study; (v) drugs for active weight reduction; (vi) pregnancy orbreast-feeding; and, (vii) known intolerance with components of the used formula diet.
2.3. Intervention
At the first contact, the design and intention of the study were explained to the participants bystudy nurses and trial physicians. A manual and a formula diet were handed out to the patients of theintervention groups. The manual included information about the preparation of the individualizedmeal replacement as well as general facts about low-carbohydrate meals and their interaction with theblood glucose level. Participants were instructed to perform self-monitoring of blood glucose (SMBG)and note down these values into the manual, the amount of meal replacement taken, the number ofmeals replaced, as well as their daily dose of anti-diabetic medication. Participants were advised toperform a seven-point blood glucose diurnal profile and they were urged to perform event-drivenmeasurements, e.g., 1.5–2 h after no, low-, or high- carbohydrate consumption or in the fasting state inthe morning when exercise had been done the evening before. The patients were encouraged to drawtheir own conclusions from the SMBG results and to adapt their meals and habits aiming to keep bloodglucose levels within a normal range, which was individually prescribed and adapted during the studyprocess. The manual provided guidance on how to change eating habits and how to react to elevatedblood glucose levels with physical activity. Based on their own experience and in accordance with theprescriptions to adapt their blood glucose levels, participants were responsible for modifying theirdiet and received help in the case of nutrition-related uncertainties. In sum, meal replacement andSMBG were individually recommended and adopted to the personal preferences throughout the study.Based on these values, anti-diabetic therapy was monitored and then individually adjusted by trialphysicians. This “personalized nutrition and treatment” was one of the main educative approaches inour study. At each visit, study nurses revised the manual and educated/instructed the participants interms of low-carbohydrate diet, SMBG, physical activity, and self-motivation. Study visits took placeafter week 1, 4, and 12 and were accompanied with telephone calls or personal meetings. A detailedtimeline of the study visits is shown in the Supplementary Figure S1. Participants of the control grouponly received a self-management guide, a weighing scale, as well as a step counter and they wereadvised to measure their steps and weight daily.
2.4. Outcomes and Measurements
Clinical and biochemical data were measured at baseline, after 12 weeks of intervention,and after 52 weeks of follow-up. Venous blood was collected after an overnight fast andabdication of medication of at least 10 h by inserting an intravenous cannula into the forearm vein,and laboratory parameters (HbA1c, fasting blood glucose, total cholesterol, high-density-lipoprotein(HDL), and low-density-lipoprotein (LDL) cholesterol) were analyzed at the local laboratory asdescribed in detail elsewhere [16]. Validated questionnaires were used to assess eating behavior(German version of the ‘Three-factor Eating Questionnaire’ (TFEQ)) and quality of life (‘Short Form-36’(SF36)), as previously described [16]. Anti-diabetic medication and changes throughout the study weredocumented. Adverse events were documented.
32

Nutrients 2018, 10, 1022
2.5. Diet Regimen
The chosen formula diet (Almased-Vitalkost; Almased-Wellness-GmbH, Bienenbüttel, Germany)contained 30.6 g carbohydrates and 1507 kJ (360 kcal) energy per 100 g powder and it was provided toall study probands during the whole study period. Participants of the intervention groups replacedbreakfast, lunch, and dinner with 1 g Almased/kg normal body weight (defined as height in cm−100) per meal dissolved in 250 mL water during the first week and consumed 45 g of oil rich inomega-3-fatty acids (1665 kJ; 398 kcal) and 750 mL vegetable juice each day, as previously described [16].No additional snacks were permitted. During weeks 2–4, the participants replaced breakfast anddinner with the formula diet and ate a low-carbohydrate lunch. The lunch should include 150–200 gof fish or meat, 500 g vegetables, and not more than 50 g of carbohydrates from wholegrain bread orbrown rice. The low-carbohydrate nutrition had to be continued in the weeks 5–12, while only dinnerwas replaced by formula diet. Instructions were identical for the participants of both groups. The onlydifference between both intervention groups was that the M-group should only replace two meals perday during the first week. All of the participants were asked to continue replacing one meal per dayduring the follow-up period until the final visit at the 52-weeks follow-up. Both participant and studystaff were responsible for the individualized treatment. SMBG as well as the personalized formula dietand the reintroduction of normal meals were interactively modified. Furthermore, the personalizedformula diet depends on the current weight of each proband and is characterized by low-carbohydratemeals that are aiming to regulate a normal blood glucose level. We assessed protocol compliance byrequiring the participants to note the frequency and amount of formula diet they used as well as thecomposition of their meals during the first 12 weeks. This information had to be sent back. Afterwards,they got another ration of formula diet for the next weeks. We chose this design with a very similarintervention program as the current study situation reveals that only intense behavioral lifestyleinterventions can contribute to meaningful results [14], and we were interested in the dose-responsepattern in initial treatment phase during the first week. Furthermore, we had seen in a previous studythat a very stringent regime leads to high dropout rates, and we, therefore, wanted to test a gentlerentry [12]. The control group remained in routine care (quarterly visits with their attending physicianfor routine health-care visits, as defined by the Disease Management Programs (DMP) for Type 2Diabetes in Germany) and did not participate in the meal replacement program.
2.6. Statistics
Previous own data have indicated that with the use of a low-carbohydrate meal replacement areduction in HbA1c of 0.7% could be achieved [12], while a reduction of 1.0 ± 0.8% for the S-groupwas assumed. To be able to measure differences between both of the intervention groups with a powerof 80% and a level of significance of 5%, a sample size calculation revealed that at least 230 datasetswould be needed. Since a dropout rate of about 25% was estimated, the plan was to recruit a total of140 participants per group. Data are presented as means and standard deviations (mean ± SD), medianand first and third quartiles (median (first; third quartiles)), means and 95% confidence intervals(mean [95% CI]), or percentages, as appropriate. Completer analyses were performed. Missing valueswere imputed by the ‘last-observation-carried-forward’ (LOCF) principle. As HbA1c is the primaryparameter in the present study, LOCF was solely applied for other parameters.
Primary endpoint was the differences in Hba1c after 12 weeks between groups, secondaryoutcomes were the differences in body weight, BMI, cardiometabolic risk factors, eating behavior,quality of life, and frequency of anti-diabetic medication after 12 weeks of meal replacementintervention and 52 weeks of follow-up between the two intervention groups. Furthermore,the estimated treatment difference (ETD), as well as the proportion of weight loss in percentage,was determined. Non-parametric data were analysed with Mann-Whitney U, Wilcoxon, and Friedmantest and parametric data with Student’s t-test, paired t-test, and analysis of variance with repeatedmeasures to determine the differences between groups following the intervention. Multivariableunivariate regression analyses were carried out to investigate group differences while adjusting
33

Nutrients 2018, 10, 1022
for baseline parameters. Dichotomous variables as well frequencies were compared by the Fishersexact test, McNemar test, or Cochrane Q test.
Tertiary outcomes focused on changes in all aforementioned parameters from baseline to week12 and week 52 within both intervention groups. These were analyzed while using mixed modelsadjusting for repeated measurements, baseline values, and multiple testing.
Further analyses focused on differences between the intervention groups and the observationalcontrol group in regard to HbA1c and weight loss. These analyses were performed in accordancewith the statistical approaches used for the determination of the primary endpoints. All statisticaltests were two sided, and the level of significance was set at α = 0.05. P values were adjusted formultiple comparisons using Bonferroni correction. All of the analyses were performed using SPSS 22.0(SPSS Inc., Chicago, IL, USA) and GraphPad Prism 6.04 (GraphPad Software, San Diego, CA, USA).
3. Results
A total of 309 participants were randomized into the S-group (n = 149) or M-group (n = 160),and a control group of n = 100 were observed, as shown in Figure 1. Three hundred and twenty-oneparticipants (83% [321:385], n = 125 M-group; n = 122 S-group; n = 74 control group) from the startingcohort finished the 12-weeks intervention, while 64 participants dropped out within the 12-weeksperiod. Follow-up data after 52 weeks were available from 279 participants (72% [279:385]). Reasonsfor dropouts were: (i) spontaneous intolerances (5%); (ii) health problems (25%); (iii) professionalreasons (5%); (iv) personal reasons (60%); and, other reasons (5%). The demographical and clinicalcharacteristics of the three groups are shown in Table 1. Participants who completed the interventionand follow-up phase and those who dropped out or were lost to follow-up did not differ significantly,apart from differences in diabetes duration, eating behavior, and quality of life between the groups(Supplementary Table S1). No adverse effects have been reported. Patients of the control group weremore frequently treated with antidiabetic medication than those in the intervention groups, particularly,regarding insulin therapy. The individual antidiabetic drug classes are listed in SupplementaryTable S2.
Table 1. Baseline characteristics of the participants who finished the 12-week diet intervention.
M-Group (n = 125) S-Group (n = 122) Control Group (n = 74)
Sex (% male) 46.4 52.5 52.7Age (years) 60 ± 10 59 ± 9 60 ± 8Weight (kg) 110 ± 24 107 ± 20 111 ± 21
BMI (kg/m2) 37.5 ± 7.6 36.1 ± 5.9 37.0 ± 6.7HbA1c (%) 8.4 ± 1.1 8.4 ± 1.2 8.2 ± 1.2
Known diabetes duration (years) 9 ± 6 8 ± 7 11 ± 8 ‡,‡
FBG (mg/dL) 181 ± 53 178 ± 63 179 ± 54SBP (mmHg) 135 ± 17 134 ± 14 134 ± 13DBP (mmHg) 82 ± 8 80 ± 8 81 ± 9
Total cholesterol (mg/dL) 200 ± 52 198 ± 43 194 ± 48HDL (mg/dL) 46 ± 10 47 ± 11 47 ± 11LDL (mg/dL) 118 ± 32 119 ± 37 117 ± 36
Triglyceride (mg/dL) 383 ± 586 220 ± 157 194 ± 113TFEQ [cognitive control] (au) 10 (7; 13) 10 (7; 13) 7 (6; 8) , ‡‡
TFEQ [suggestibility] (au) 7 (5; 10) 7 (4; 10) 5 (3; 6) , ‡‡
TFEQ [hunger] (au) 6 (4; 9) 5 (3; 9) 5 (4; 8)SF36 [physical health] (au) 42 (35; 50) 42 (34; 51) 40 (31; 52)SF36 [mental health] (au) 49 (38; 57) 49 (32; 57) 39 (35; 42) ,‡‡
Shown are means ± SD, median (1st; 3rd quartiles) or percentages. CON vs. M-group, p < 0.01; ‡ CONvs. M-group, p < 0.05; ‡‡ CON vs. S-group, p < 0.01; ‡ CON vs. S-group, p < 0.05; au, arbitrary units; FBG,fasting blood glucose; BMI, body mass index; DBP, diastolic blood pressure; HDL, high-density-lipoprotein; LDL,low-density-lipoprotein; SF36, short form-36; SBP, systolic blood pressure; TFEQ, three-factor eating questionnaire.
34

Nutrients 2018, 10, 1022
Figure 1. Flow chart.
Besides marginal differences in eating behavior and triglycerides, both intervention groupsshowed no significant differences in any parameter at week 12 or 52 (Table 2). The ETD in HbA1creduction after 12 weeks between both intervention groups was −0.10% with 95% CI [−0.40; 0.21](p > 0.05). Treatment superiority of the S-group vs. M-Group is not statistically significant after the52-weeks follow-up with −0.22% [−0.56; 0.10] (p = 0.15). Furthermore, the proportion of weightloss between both of the intervention groups was not different from baseline to week 12 and week52 (Figure 2).
35
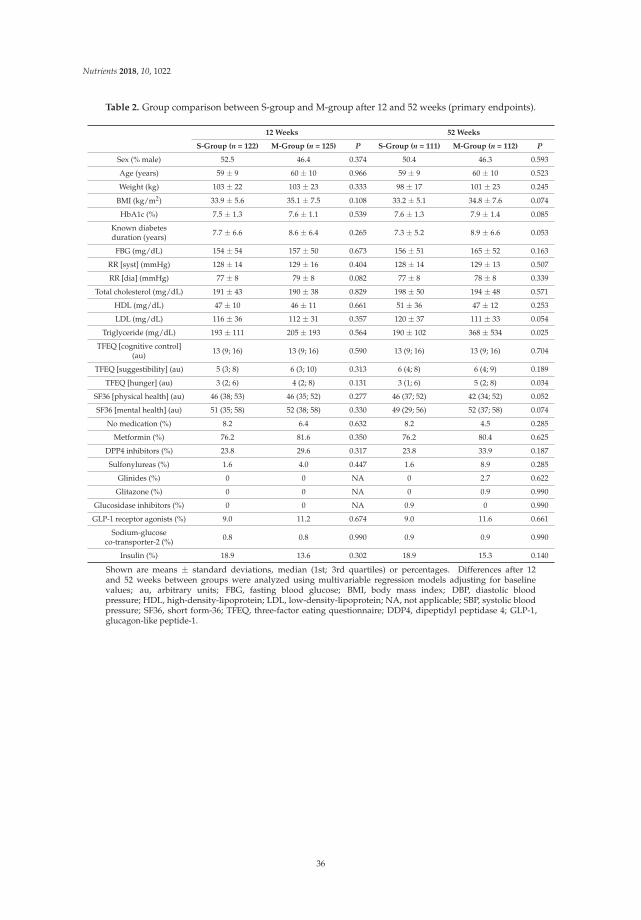
Nutrients 2018, 10, 1022
Table 2. Group comparison between S-group and M-group after 12 and 52 weeks (primary endpoints).
12 Weeks 52 Weeks
S-Group (n = 122) M-Group (n = 125) P S-Group (n = 111) M-Group (n = 112) P
Sex (% male) 52.5 46.4 0.374 50.4 46.3 0.593
Age (years) 59 ± 9 60 ± 10 0.966 59 ± 9 60 ± 10 0.523
Weight (kg) 103 ± 22 103 ± 23 0.333 98 ± 17 101 ± 23 0.245
BMI (kg/m2) 33.9 ± 5.6 35.1 ± 7.5 0.108 33.2 ± 5.1 34.8 ± 7.6 0.074
HbA1c (%) 7.5 ± 1.3 7.6 ± 1.1 0.539 7.6 ± 1.3 7.9 ± 1.4 0.085
Known diabetesduration (years) 7.7 ± 6.6 8.6 ± 6.4 0.265 7.3 ± 5.2 8.9 ± 6.6 0.053
FBG (mg/dL) 154 ± 54 157 ± 50 0.673 156 ± 51 165 ± 52 0.163
RR [syst] (mmHg) 128 ± 14 129 ± 16 0.404 128 ± 14 129 ± 13 0.507
RR [dia] (mmHg) 77 ± 8 79 ± 8 0.082 77 ± 8 78 ± 8 0.339
Total cholesterol (mg/dL) 191 ± 43 190 ± 38 0.829 198 ± 50 194 ± 48 0.571
HDL (mg/dL) 47 ± 10 46 ± 11 0.661 51 ± 36 47 ± 12 0.253
LDL (mg/dL) 116 ± 36 112 ± 31 0.357 120 ± 37 111 ± 33 0.054
Triglyceride (mg/dL) 193 ± 111 205 ± 193 0.564 190 ± 102 368 ± 534 0.025
TFEQ [cognitive control](au) 13 (9; 16) 13 (9; 16) 0.590 13 (9; 16) 13 (9; 16) 0.704
TFEQ [suggestibility] (au) 5 (3; 8) 6 (3; 10) 0.313 6 (4; 8) 6 (4; 9) 0.189
TFEQ [hunger] (au) 3 (2; 6) 4 (2; 8) 0.131 3 (1; 6) 5 (2; 8) 0.034
SF36 [physical health] (au) 46 (38; 53) 46 (35; 52) 0.277 46 (37; 52) 42 (34; 52) 0.052
SF36 [mental health] (au) 51 (35; 58) 52 (38; 58) 0.330 49 (29; 56) 52 (37; 58) 0.074
No medication (%) 8.2 6.4 0.632 8.2 4.5 0.285
Metformin (%) 76.2 81.6 0.350 76.2 80.4 0.625
DPP4 inhibitors (%) 23.8 29.6 0.317 23.8 33.9 0.187
Sulfonylureas (%) 1.6 4.0 0.447 1.6 8.9 0.285
Glinides (%) 0 0 NA 0 2.7 0.622
Glitazone (%) 0 0 NA 0 0.9 0.990
Glucosidase inhibitors (%) 0 0 NA 0.9 0 0.990
GLP-1 receptor agonists (%) 9.0 11.2 0.674 9.0 11.6 0.661
Sodium-glucoseco-transporter-2 (%) 0.8 0.8 0.990 0.9 0.9 0.990
Insulin (%) 18.9 13.6 0.302 18.9 15.3 0.140
Shown are means ± standard deviations, median (1st; 3rd quartiles) or percentages. Differences after 12and 52 weeks between groups were analyzed using multivariable regression models adjusting for baselinevalues; au, arbitrary units; FBG, fasting blood glucose; BMI, body mass index; DBP, diastolic bloodpressure; HDL, high-density-lipoprotein; LDL, low-density-lipoprotein; NA, not applicable; SBP, systolic bloodpressure; SF36, short form-36; TFEQ, three-factor eating questionnaire; DDP4, dipeptidyl peptidase 4; GLP-1,glucagon-like peptide-1.
36

Nutrients 2018, 10, 1022
Figure 2. Weight change achieved after 12 and 52 weeks of intervention. Analyses of difference infrequency distribution of weight loss were calculated by using Fisher’s exact test.
After 12 weeks of intervention, HbA1c was reduced by (mean [95% confidence interval (CI)]−0.97% [−1.21 to −0.74] in the S-group and by −0.84% [−1.08 to −0.61] in the M-group (both p < 0.001)as shown in Table 3. These improvements were still significant after the Bonferroni correction formultiple testing. After 52 weeks of follow-up, the reduction of HbA1c lost its clinical relevance(≥0.60%) [18] in the M-group with −0.55% [−0.80 to −0.29] when compared to the S-Group with−0.81% [−1.06 to −0.55]. Patients of the control group showed no improvement in HbA1c neitherafter 12 weeks nor after 52 weeks.
Changes of anthropometric, clinical, pharmaceutical, and behavioral parameters within both ofthe intervention groups after 12 and 52 weeks of intervention are shown in Table 3. Improvementsin body weight, BMI, fasting blood glucose, systolic and diastolic blood pressure, as well as eatingbehavior were observed in the M- and S-group after 12 and 52 weeks of follow-up (all p < 0.01).These changes in HbA1c, weight, BMI, fasting blood glucose, systolic and diastolic blood pressure,as well as eating behavior were still significant after the Bonferroni correction for multiple testing(p value = 0.002) in the within-groups analysis. Doses of anti-diabetic medication was already adjustedwithin the first week of intervention. Frequencies of anti-diabetic drugs were not significantly changedwithin groups after Bonferroni correction.
Table 3. Changes of anthropometric, clinical, pharmaceutical, and behavioral parameters (secondaryendpoints).
M-Group (n = 125) S-Group (n = 122) p
HbA1c (%) 8.4 ± 1.1 8.4 ± 1.2Δ HbA1c (%) 12 weeks −0.84 [−1.08; −0.61] ***,a −0.97 [−1.21; −0.74] ***,a 0.538Δ HbA1c (%) 52 weeks −0.55 [−0.80; −0.29] ***,a −0.81 [−1.06; −0.55] ***,a 0.149
Weight (kg) 110 ± 24 107 ± 20Δ Weight (kg) 12 weeks −6.93 [−8.08; −5.78] ***,a −6.91 [−8.07; −5.76] ***,a 0.999Δ Weight (kg) 52 weeks −7.30 [−8.65; −5.95] ***,a −7.45 [−8.80; −6.10] ***,a 0.615
BMI (kg/m2) 37.5 ± 7.6 36.1 ± 5.9Δ BMI (kg/m2) 12 weeks −2.38 [−2.78; −1.98] ***,a −2.35 [−2.75; −1.95] ***,a 0.911Δ BMI (kg/m2) 52 weeks −2.36 [−2.84; −1.88] ***,a −2.50 [−2.98; −2.02] ***,a 0.536
FBG (mg/dL) 181 ± 53 178 ± 63Δ FBG (mg/dL) 12 weeks −24 [−34; −13] ***,a −25 [−36; −15] ***,a 0.791Δ FBG (mg/dL) 52 weeks −17 [−30; −5] ** −22 [−35; −10] ***,a 0.196
SBP (mmHg) 136 ± 17 134 ± 14
37

Nutrients 2018, 10, 1022
Table 3. Cont.
M-Group (n = 125) S-Group (n = 122) p
Δ SBP (mmHg) 12 weeks −5.6 [−8.7; −2.5] ***,a −6.6 [−9.7; −3.5] ***,a 0.512Δ SBP (mmHg) 52 weeks −6.0 [−9.3; −2.7] ***,a −5.8 [−9.1; −2.5] ***,a 0.858
DBP (mmHg) 82 ± 8 80 ± 8Δ DBP (mmHg) 12 weeks −2.9 [−4.5; −1.3] ***,a −3.0 [−4.6; −1.4] ***,a 0.371Δ DBP (mmHg) 52 weeks −3.7 [−5.6; −1.9] ***,a −2.9 [−4.8; −1.0] ** 0.992Total cholesterol (mg/dL) 200 ± 52 198 ± 43
Δ Total cholesterol (mg/dL) 12 weeks −11.1 [−18.9; −3.3] ** −7.0 [−14.7; 0.8] 0.565Δ Total cholesterol (mg/dL) 52 weeks −8.0 [−17.3; 1.3] 0.1 [−9.3; 9.4] 0.396
HDL (mg/dL) 46 ± 10 47 ± 11Δ HDL (mg/dL) 12 weeks −0.1 [−1.6; 1.4] −0.1 [−1.6; 1.4] 0.908Δ HDL (mg/dL) 52 weeks 0.9 [−4.0; 5.9] 4.5 [−0.5; 9.5] 0.248
LDL (mg/dL) 118 ± 32 119 ± 37Δ LDL (mg/dL) 12 weeks −6.6 [−10.9; −2.3] ** −3.3 [−7.6; 1.0] 0.144Δ LDL (mg/dL) 52 weeks −7.6 [−12.8; −2.4] ** 1.8 [−3.4; 7.0] 0.012
Triglyceride (mg/dL) 383 ± 586 220 ± 157Δ Triglyceride (mg/dL) 12 weeks −186 [−268; −104] ***,a −27 [−109; 56] 0.041Δ Triglyceride (mg/dL) 52 weeks −35 [−86; 17] −31 [−83; 21] 0.865
TFEQ [cognitive control] (au) 9.7 ± 3.9 10.0 ± 4.3Δ TFEQ [cognitive control] (au) 12 weeks 2.5 [1.7; 3.3] ***,a 2.5 [1.7; 3.3] ***,a 0.847Δ TFEQ [cognitive control] (au) 52 weeks 2.3 [1.5; 3.1] ***,a 2.2 [1.4; 3.0] ***,a 0.633
TFEQ [suggestibility] (au) 7.4 ± 3.8 7.0 ± 3.5Δ TFEQ [suggestibility] (au) 12 weeks −0.8 [−1.3; −0.3] ** −0.8 [−1.4; −0.3] ***,a 0.686Δ TFEQ [suggestibility] (au) 52 weeks −0.8 [−1.3; −0.2] ** −0.9 [−1.4; −0.4] ***,a 0.342
TFEQ [hunger] (au) 6.3 ± 3.7 5.6 ± 3.3Δ TFEQ [hunger] (au) 12 weeks −1.3 [−1.8; −0.7] ***,a −1.3 [−1.9; −0.7] ***,a 0.586Δ TFEQ [hunger] (au) 52 weeks −1.1 [−1.7; −0.5] ***,a −1.4 [−2.0; −0.8] ***,a 0.074
SF36 [physical health] (au) 42 ± 10 43 ± 10Δ SF36 [physical health] (au) 12 weeks 1.5 [−0.2; 3.2] 1.4 [−0.3; 3.1] 0.773Δ SF36 [physical health] (au) 52 weeks 0.2 [1.4; 1.8] 1.2 [−0.4; 2.8] 0.150
SF36 [mental health] (au) 47 ± 13 45 ± 15Δ SF36 [mental health] (au) 12 weeks 0.6 [−2.0; 3.2] 1.2 [−1.5; 3.8] 0.953Δ SF36 [mental health] (au) 52 weeks −0.4 [−3.0; 2.2] −1.4 [−3.9; 1.2] 0.272
No medication (%) 8.0 8.2Δ no medication (%) 12 weeks −1.6 0 0.652Δ no medication (%) 52 weeks −3.5 −0.1 0.179
Metformin (%) 81.6 77.0Δ Metformin (%) 12 weeks 0 −0.8 0.660Δ Metformin (%) 52 weeks −1.2 0.5 0.942
DPP4 inhibitors (%) 28.8 24.6Δ DPP4 inhibitors (%) 12 weeks 0.8 −0.8 0.314Δ DPP4 inhibitors (%) 52 weeks 5.1 0.6 0.377
Sulfonylurea (%) 6.4 4.1Δ Sulfonylurea (%) 12 weeks −2.4 −2.5 1.000Δ Sulfonylurea (%) 52 weeks 2.5 0.4 0.920
Glinides (%) 0 0Δ Glinides (%) 12 weeks 0 0 NAΔ Glinides (%) 52 weeks 2.7 0.9 0.622
Glitazone (%) 1.6 0.8Δ Glitazone (%) 12 weeks −1.6 0 0.428Δ Glitazone (%) 52 weeks −0.5 −0.8 1.000Glucosidase inhibitors (%) 0 0.8
Δ Glucosidase inhibitors (%) 12 weeks 0 0 NAΔ Glucosidase inhibitors (%) 52 weeks 0 0.1 1.000
GLP−1 receptor agonists (%) 12.0 8.2Δ GLP−1 receptor agonists (%) 12 weeks −0.8 0.8 0.855Δ GLP−1 receptor agonists (%) 52 weeks 0.4 0.8 1.000
Sodium-glucose co-transporter−2 (%) 0.8 0.8Δ Sodium-glucose co-transporter−2 (%) 12 weeks 0 0 NAΔ Sodium-glucose co-transporter−2 (%) 52 weeks 0.1 0.1 1.000
Insulin (%) 19.2 19.7Δ Insulin (%) 12 weeks −5.6 −0.8 0.290Δ Insulin (%) 52 weeks −3.9 −0.8 0.256
Data are shown as mean ± SD and mean [95% CI] or % as appropriate; *** p < 0.001 vs. baseline; ** p < 0.01vs. baseline; Superscript letter a represents significance after Bonferroni correction for multiple testing(p < 0.002). Differences in changes after 12 and 52 weeks between both groups were analyzed using multivariableregression models adjusting baseline values. au, arbitrary units; BMI, body mass index; DBP, diastolic bloodpressure; SBP, systolic blood pressure; SF36, short form-36 questionnaire; FBG, fasting blood glucose; HDL,high-density-lipoprotein; LDL, low-density-lipoprotein; TFEQ, three-factor eating questionnaire; DDP4, dipeptidylpeptidase 4; GLP-1, glucagon-like peptide-1. NA, not applicable.
38

Nutrients 2018, 10, 1022
When compared to the control group (12 weeks: −0.20 ± 0.80 standard deviation (SD); 52 weeks:−0.10 ± 0.90 SD), only the S-group (12 weeks: −0.97 ± 1.18 SD; 52 weeks: −0.81 ± 1.20 SD)demonstrated a significant difference in HbA1c after 52 weeks of follow-up (p < 0.01), while theM-group (−0.84 ± 1.14 SD; 52 weeks: −0.55 ± 1.31 SD) was not significantly different (Figure 3).Furthermore, a higher proportion of participants with a larger weight reduction was shown in theintervention groups after 12 and 52 weeks in comparison to the control group (all p < 0.001; Figure 2).
Figure 3. Change of glycemic control after 12 weeks of intervention and 52 weeks of follow-up.At baseline, M-, S- and control group were not significantly different, however, 12 weeks of dietintervention led to reductions in HbA1c in both intervention groups in comparison to the control group.Compared to controls, only the S-group showed a significant difference in HbA1c after 52 weeks offollow-up. Analyses of variance with repeated measures were performed to determine differencesbetween groups; ns, not significant; ** p < 0.01 vs. controls.
4. Discussion
The results of the present study demonstrate that an individualized meal replacement therapystarting with intense low-carbohydrate formula diets and SMBG-accompanied reintervention oflow-carbohydrate meals lead to clinically relevant improvements in HbA1c after 12 weeks ofintervention in patients with poorly controlled long-standing type 2 diabetes. Particularly, patients ofthe more intense intervention group (S-group) showed long-term clinically relevant improvements after52 weeks of follow-up as compared to the participants of the moderate intervention group (M-group),although this difference was not statistically significant. Furthermore, the overall dropout rate afterallocation into both intervention groups was small (247:285; 13%) and not different (S-group = 12%and M-group = 14%). We hypothesize that the strict rules, the stringent and individual SMBG [17],and the complete replacement of all meals in the S-group during the first week contributed to asubtler change of behavior and higher motivation for the diet, which was shown to be necessaryfor long-term changes of behavior in high-risk individuals for type 2 diabetes in prior studies [19].Furthermore, we assume that our personalized nutrition and treatment-approach with a more intensepatient empowerment during the first week in the S-group contributed to a long-term difference inHbA1c after 52 weeks of follow-up. The recently published DIRECT study has demonstrated that
39

Nutrients 2018, 10, 1022
a strict calorie restriction with only 825–853 kcal per day for 3–5 months contributes to significantimprovements of HbA1c (−0.9%) and body weight, and in the further course to diabetes remissionafter 52 weeks of intervention [13]. However, the formula diet contained proteins and carbohydrates ina ratio of 1:2 [13]. We chose an opposite formula diet that was high in protein, but low in carbohydrates(ratio nearly 2:1) with individualized moderate-calorie supply (1300–1500 kcal/day), because wepostulate that a higher amount of carbohydrates would stimulate an increase in insulin release anda decrease in fat burning [20]. Therefore, our strong carbohydrate reduction with an accompaniedstepped food reintroduction should lead to long-term benefits like it was shown before in the DIRECTstudy [13]. Another explanation could be that the S-group was somewhat higher motivated to bephysically active due to the complete change of nutrition and behavior, respectively. Previous studieshave already demonstrated strong effects on HbA1c through very low-calorie liquid formula diets insmall groups of patients with type 2 diabetes (n < 30) during an investigation period up to 26 weeks,especially after a short duration of diabetes (<4 years) [11,14,15]. This correlation between diabetesduration and changes of HbA1c after 12 or 52 weeks could be confirmed in our study by the wholeintervention cohort (r = 0.226 (after 12 weeks) or 0.229 (after 52 weeks); both p < 0.001), independentlyof age.
Our approach of low-carbohydrate meal replacement is based on the recommendations for dietsin type 2 diabetes, as well as recently published reviews and meta-analyses [21,22]. Although, a healthydiet is crucial for type 2 diabetes, there still exists controversy in the field about the feasibility andmechanisms of these stringent types of dietary interventions and their long-term effects in HbA1c [23].The effects on the glucose metabolism (e.g., anti-diabetic medication was adjusted within the firstweek) occur immediately after beginning the meal replacement therapy [12] and before a significantweight loss takes place. The observed effects are comparable with those after bariatric surgery [7].Possible explanation approaches in this context could be altered levels of incretin secretion [24],improved mitochondrial oxidative function [25], energy restriction [10], the sudden negative energybalance [14], or a combination of all these points. Furthermore, a reduced carbohydrate intake [26]or a reduced number of carbohydrate-containing meals might trigger the fast effects on the glucosemetabolism. This would be in line with observations that two meals per day are better than six [27] fortype 2 diabetes patients, especially in terms of body weight, insulin resistance/sensitivity, and betacell function [10]. The results of the PREDIMED study, in which two high-fat/lower-carbohydrateMediterranean diets were compared to a fat-reduced diet regarding the incidence of type 2 diabetes [28]or cardiovascular events [29], as well as changes of body weight and waist circumference [30], supportour findings that carbohydrate-reduced diets are beneficial for patients with type 2 diabetes.
The improvements in glycemic control in both intervention groups in the present study werefollowed by strong reductions in body weight (Figure 2). In a recently published meta-analysis, it wasshown that very low-calorie (<800 kcal per day) or low-energy liquid-formula (>800 kcal per day)diets can induce large reductions of body weight (ranging from 8.9 to 15.0 kg) in obese people (BMI:35.5–42.6 kg/m2) with and without type 2 diabetes [31]. The slight difference in body weight reductionin our trial can be explained by a higher calorie consumption per day (≈1300–1500 kcal per day) whencompared to the studies of the meta-analysis. Furthermore, our results are comparable to the findingsof Steven et al. [11], who works with a very low-calorie and moderate-carbohydrate composition(43% carbohydrate, 34% protein, and 19.5% fat; 2.6 MJ/day [624 kcal/day]). They found that avery low-calorie diet over eight weeks can contribute to a meaningful weight reduction of ≈14 kg,which was still comparably high, even after 26 weeks (≈13 kg) in individuals with type 2 diabetes. Inregard to the aforementioned findings, we could demonstrate similar results of weight reduction with≈7 kg after 12 and 52 weeks of intervention. In contrast to Steven et al., we designed an individualizedlow-carbohydrate and moderate-calorie diet intervention (31% carbohydrate), accompanied withSMBG as it might be more feasible for patients with type 2 diabetes, characterized with eating andmotivation impairments [32]. The improvements, apart from the meal restriction, could be thereforealso explained by improved education regarding nutrition, physical activity, and blood glucose control.
40

Nutrients 2018, 10, 1022
A recently published review supports our approach, as it states that a rather moderate weightloss is more sufficient for the transition from metabolically unhealthy obesity to metabolically healthyobesity with a lower risk for adverse outcomes in the long run than a large amount of weight loss ina short period [33]. We chose this calorie goal per day in order to reduce the rate for dropouts andincrease the participants therapy adherence. Lifestyle interventions are always criticized in termsof their long-term effectiveness, and one possible hypothesis says that the major problem is thatpatients fail to adhere to the altered lifestyle prescriptions [34]. In contrast to many other long-termlifestyle intervention programs [35], the relatively high number of completers after 12 (83%) and52 (72%) weeks supports our study design and approach. Potential reasons for nonadherence comprise:age, perception and duration of disease, polytherapy, social and psychological factors, costs, dislikefor foods included in meal plans, education and a lack of understanding of the long-term benefitsof treatment, adverse outcomes (e.g., weight gain or hypoglycemia), as well as negative treatmentperceptions [36]. In this context, new innovative methods are needed to assist those patients. In light ofthese problems, we designed the study with almost no barriers for the participants (e.g., 1:1 personalsupport or no additional costs) and provided every participant with a personalized meal replacementand supported them in their SMBG.
Further improvements were achieved in the cardiometabolic parameters of fasting blood glucose,as well as systolic and diastolic blood pressure. These results are confirmative regarding other studieswith low-calorie diets in patients with a short- and long-duration type 2 diabetes and moderate [14]or poor glycemic control [10,15]. Our results are also confirmed by a recently published review interms of improvements of the cardiovascular risk profile in patients with type 2 diabetes showinga significant decrease in systolic and diastolic blood pressure as well as fasting blood glucose afterlow-calorie diets [37].
A further positive effect following the intervention was the improvement of eating behavior inthe intervention groups. The simple and structured formula diet reduced feelings of hunger andincreased the control regarding eating-associated actions. In patients with type 2 diabetes, a disorderedeating behavior can be present and it is associated with poor quality of life [38]. When comparedto individuals with the metabolic syndrome, type 2 diabetes participants of the present interventiongroups showed a pronounced feeling of hunger and a weaker control over their suggestibility forfood [39]. Another study supports our findings showing meaningful improvements in eating behaviorafter a three-month mindful eating intervention in non-insulin requiring patients with type 2 diabetesin a small cohort (n < 30) [40].
A previously published pilot study [12] revealed how a formula diet affects blood glucose controland weight, and how insulin is reduced or discontinued. However, it was also shown that participantssometimes found it difficult to maintain the stringent diet during the first week. Therefore, we wereinterested in whether a moderate approach also leads to success. The underlying idea was that thereplacement of all three meals in the first week would lead to some kind of “reset”. In combinationwith concomitant blood glucose self-monitoring in the following weeks, an individualized diet shouldbe gradually rebuilt. However, because of the similarity of the intervention design, we expected thatthe moderate diet regimen would lead to a significant improvement as well. We, therefore, includedthe comparison with a control group that received standard treatment.
The strengths of the present study comprise: (i) a relatively large number of patients studiedper group who had poor controlled type 2 diabetes and a long type 2 diabetes duration; (ii) a longerstudy period compared to previous studies with formula diets (52 weeks vs. ≤26 weeks); as well as(iii) a randomized trial design with two intervention groups and one observational control group.Furthermore, the (iv) chosen real-world setting with a combination of formula diet, SMBG, and dietaryeducation could be easily implemented into present health care programs. Likewise, another studywith a real-world approach could demonstrate that even the partial use of a formula diet with one packof formula diet instead of one of three daily low-caloric meals for 24 weeks was much more effective in
41

Nutrients 2018, 10, 1022
reducing body weight and improving coronary risk factors than a conventional diet with a reducedenergy intake in obese type 2 diabetic patients [41].
A limitation of our study is that we did not use food diaries to control for decreased calorieconsumption or incorrect food compositions (e.g., the amount of carbohydrate in the diet, glycemicindex, fat or protein intake) after the acute meal replacement phase from week 13 to week 52. However,the 52-week follow-up revealed that participants of both intervention groups showed no differencein maintaining the formula diet and following the dietary intervention until the study end (S-group65%; M-group 63%). Also, more profound and quantitative diagnostics, such as isotope measurements,could have been done to control for food-related study compliance. On the other side, interventionalstudies with formula diets and similar results in a real-world setting [31] support our therapeuticapproach in patients with poorly controlled type 2 diabetes.
Another factor, which should be considered, is the adjusted glucose-lowering medication dosein response to glycemic improvements due to the meal replacement intervention. It is conceivablethat the impact of our formula diet on the HbA1c reduction is underestimated due to this adjustment.Another limitation of our real-world study is that the participants of the control group were notrandomly assigned. In one of our previously published studies (NCT02066831), we found dramaticnegative effects on HbA1c and dropout rate (26%) for the participants of the control group [16].This approach, without a randomized control group with standard care, was also conducted in otherbenchmark studies for formula diet trials, like the Counterbalance Study (CS) [14] and the CounterpointStudy (CP) [15]. Both of the studies with small sample sizes (n = 11–29) reduced HbA1c (CS: −1.4%and CP: −1.1% to −0.6%) similar, as it was shown in our study after eight weeks of intervention.Furthermore, when comparing the present study results with findings from other landmark studies(DIRECT and TeLiPro study [17,21]), one can see that an assignment to the control group with standardcare is accompanied with serious and disadvantageous effects, such as high dropout rates or even anincrease in HbA1c. These findings support our approach and study design.
In sum, individualized low-carbohydrate diets can produce clinically-relevant reductions inHbA1c after 12 weeks of intervention. Furthermore, body weight, fasting blood glucose, qualityof life, eating behavior, and other cardiometabolic risk factors improved, although not all of theparameters showed statistically significant improvements. Moreover, the initiation of a weight lossprogram with one week of full meal replacement (three meals per day) resulted in a clinically relevantlong-term HbA1c reduction, when compared to an observational control group that had standard care.Our practicable and real-world setting-based approach led to relevant long-term improvements thatwere comparable with procedures of bariatric surgery without adverse events or negative side-effects.These results support the therapeutic concept of low-carbohydrate diets by formula diets in patientswith poorly controlled type 2 diabetes.
Supplementary Materials: The following are available online at http://www.mdpi.com/2072-6643/10/8/1022/s1. Table S1. Baseline characteristics of the drop-outs. Table S2. Baseline antidiabetic drugs.
Author Contributions: M.R. and K.K. wrote the manuscript, researched and collected data. M.R. and K.K.performed the statistical analysis. S.M. had the idea, initiated the study and revised the manuscript. K.N. and B.G.researched data and contributed to the manuscript. S.M. is the guarantor of this work and, as such, had full accessto all the data in the study and take responsibility for the integrity of the data and the accuracy of the data analysis.
Funding: The study was financially supported by the Almased-Wellness-GmbH and the Gesellschaft vonFreunden und Förderern der Heinrich-Heine-Universität Düsseldorf e.V. The funder had no influence on studydesign, data collection, data analysis, manuscript preparation and/or publication decisions.
Acknowledgments: We thank our study nurse Bettina Prete (West-German Centre of Diabetes and Health) forher excellent work.
Conflicts of Interest: K. Kempf and S. Martin received consultant fees from the Almased-Wellness-GmbH. M.Röhling, B. Gärtner and K. Niedermeier declare that there is no conflict of interest regarding the publication ofthis article.
42

Nutrients 2018, 10, 1022
References
1. Dunkley, A.J.; Bodicoat, D.H.; Greaves, C.J.; Russell, C.; Yates, T.; Davies, M.J.; Khunti, K. Diabetes preventionin the real world: Effectiveness of pragmatic lifestyle interventions for the prevention of type 2 diabetesand of the impact of adherence to guideline recommendations: A systematic review and meta-analysis.Diabetes Care 2014, 37, 922–933. [CrossRef] [PubMed]
2. Rise, M.B.; Pellerud, A.; Rygg, L.O.; Steinsbekk, A. Making and maintaining lifestyle changes afterparticipating in group based type 2 diabetes self-management educations: A qualitative study. PLoS ONE2013, 8, e64009. [CrossRef] [PubMed]
3. Giorgino, F.; Home, P.D.; Tuomilehto, J. Glucose Control and Vascular Outcomes in Type 2 Diabetes: Is thePicture Clear? Diabetes Care 2016, 39 (Suppl. S2), S187–S195. [CrossRef] [PubMed]
4. U.K. Prospective Diabetes Study Group. U.K. prospective diabetes study 16. Overview of 6 years’ therapy oftype II diabetes: A progressive disease. U.K. Prospective Diabetes Study Group. Diabetes 1995, 44, 1249–1258.[CrossRef]
5. Yki-Jarvinen, H.; Ryysy, L.; Kauppila, M.; Kujansuu, E.; Lahti, J.; Marjanen, T.; Niskanen, L.; Rajala, S.;Salo, S.; Seppala, P.; et al. Effect of obesity on the response to insulin therapy in noninsulin-dependentdiabetes mellitus. J. Clin. Endocrinol. Metab. 1997, 82, 4037–4043. [CrossRef] [PubMed]
6. Gloy, V.L.; Briel, M.; Bhatt, D.L.; Kashyap, S.R.; Schauer, P.R.; Mingrone, G.; Bucher, H.C.; Nordmann, A.J.Bariatric surgery versus non-surgical treatment for obesity: A systematic review and meta-analysis ofrandomised controlled trials. BMJ 2013, 347, f5934. [CrossRef] [PubMed]
7. Ackerman, N.B. Observations on the improvements in carbohydrate metabolism in diabetic and othermorbidly obese patients after jejunoileal bypass. Surg. Gynecol. Obstet. 1981, 152, 581–586. [PubMed]
8. Backman, O.; Stockeld, D.; Rasmussen, F.; Naslund, E.; Marsk, R. Alcohol and substance abuse, depressionand suicide attempts after Roux-en-Y gastric bypass surgery. Br. J. Surg. 2016, 103, 1336–1342. [CrossRef][PubMed]
9. Colquitt, J.L.; Pickett, K.; Loveman, E.; Frampton, G.K. Surgery for weight loss in adults. Cochrane DatabaseSyst. Rev. 2014, 8, Cd003641. [CrossRef] [PubMed]
10. Jackness, C.; Karmally, W.; Febres, G.; Conwell, I.M.; Ahmed, L.; Bessler, M.; McMahon, D.J.; Korner, J.Very low-calorie diet mimics the early beneficial effect of Roux-en-Y gastric bypass on insulin sensitivity andbeta-cell Function in type 2 diabetic patients. Diabetes 2013, 62, 3027–3032. [CrossRef] [PubMed]
11. Steven, S.; Hollingsworth, K.G.; Al-Mrabeh, A.; Avery, L.; Aribisala, B.; Caslake, M.; Taylor, R.Very Low-Calorie Diet and 6 Months of Weight Stability in Type 2 Diabetes: Pathophysiological Changes inResponders and Nonresponders. Diabetes Care 2016, 39, 808–815. [CrossRef] [PubMed]
12. Kempf, K.; Schloot, N.C.; Gartner, B.; Keil, R.; Schadewaldt, P.; Martin, S. Meal replacement reduces insulinrequirement, HbA1c and weight long-term in type 2 diabetes patients with >100 U insulin per day. J. Hum.Nutr. Diet. 2014, 27 (Suppl. S2), 21–27. [CrossRef] [PubMed]
13. Lean, M.E.; Leslie, W.S.; Barnes, A.C.; Brosnahan, N.; Thom, G.; McCombie, L.; Peters, C.; Zhyzhneuskaya, S.;Al-Mrabeh, A.; Hollingsworth, K.G.; et al. Primary care-led weight management for remission of type 2diabetes (DiRECT): An open-label, cluster-randomised trial. Lancet 2017. [CrossRef]
14. Lim, E.L.; Hollingsworth, K.G.; Aribisala, B.S.; Chen, M.J.; Mathers, J.C.; Taylor, R. Reversal of type 2diabetes: Normalisation of beta cell function in association with decreased pancreas and liver triacylglycerol.Diabetologia 2011, 54, 2506–2514. [CrossRef] [PubMed]
15. Steven, S.; Taylor, R. Restoring normoglycaemia by use of a very low calorie diet in long- and short-durationType 2 diabetes. Diabet. Med. 2015, 32, 1149–1155. [CrossRef] [PubMed]
16. Kempf, K.; Altpeter, B.; Berger, J.; Reuss, O.; Fuchs, M.; Schneider, M.; Gartner, B.; Niedermeier, K.; Martin, S.Efficacy of the Telemedical Lifestyle intervention Program TeLiPro in Advanced Stages of Type 2 Diabetes: ARandomized Controlled Trial. Diabetes Care 2017, 40, 863–871. [CrossRef] [PubMed]
17. Kempf, K.; Kruse, J.; Martin, S. ROSSO-in-praxi follow-up: Long-term effects of self-monitoring of bloodglucose on weight, hemoglobin A1c, and quality of life in patients with type 2 diabetes mellitus. DiabetesTechnol. Ther. 2012, 14, 59–64. [CrossRef] [PubMed]
18. Thomas, D.E.; Elliott, E.J.; Naughton, G.A. Exercise for type 2 diabetes mellitus. Cochrane Database Syst. Rev.2006, 3, Cd002968. [CrossRef] [PubMed]
43
Nutrients 2018, 10, 1022
19. den Braver, N.R.; de Vet, E.; Duijzer, G.; Ter Beek, J.; Jansen, S.C.; Hiddink, G.J.; Feskens, E.J.M.;Haveman-Nies, A. Determinants of lifestyle behavior change to prevent type 2 diabetes in high-riskindividuals. Int. J. Behav. Nutr. Phys. Act. 2017, 14, 78. [CrossRef] [PubMed]
20. Gower, B.A.; Goss, A.M. A lower-carbohydrate, higher-fat diet reduces abdominal and intermuscular fatand increases insulin sensitivity in adults at risk of type 2 diabetes. J. Nutr. 2015, 145, 177s–183s. [CrossRef][PubMed]
21. Qian, F.; Korat, A.A.; Malik, V.; Hu, F.B. Metabolic Effects of Monounsaturated Fatty Acid-Enriched DietsCompared With Carbohydrate or Polyunsaturated Fatty Acid-Enriched Diets in Patients with Type 2Diabetes: A Systematic Review and Meta-analysis of Randomized Controlled Trials. Diabetes Care 2016,39, 1448–1457. [CrossRef] [PubMed]
22. Snorgaard, O.; Poulsen, G.M.; Andersen, H.K.; Astrup, A. Systematic review and meta-analysis of dietarycarbohydrate restriction in patients with type 2 diabetes. BMJ Open Diabetes Res. Care 2017, 5, e000354.[CrossRef] [PubMed]
23. Wheeler, M.L.; Dunbar, S.A.; Jaacks, L.M.; Karmally, W.; Mayer-Davis, E.J.; Wylie-Rosett, J.; Yancy, W.S., Jr.Macronutrients, food groups, and eating patterns in the management of diabetes: A systematic review of theliterature, 2010. Diabetes Care 2012, 35, 434–445. [CrossRef] [PubMed]
24. Rubino, F.; Forgione, A.; Cummings, D.E.; Vix, M.; Gnuli, D.; Mingrone, G.; Castagneto, M.; Marescaux, J.The mechanism of diabetes control after gastrointestinal bypass surgery reveals a role of the proximal smallintestine in the pathophysiology of type 2 diabetes. Ann. Surg. 2006, 244, 741–749. [CrossRef] [PubMed]
25. Urbanova, M.; Mraz, M.; Durovcova, V.; Trachta, P.; Klouckova, J.; Kavalkova, P.; Haluzikova, D.; Lacinova, Z.;Hansikova, H.; Wenchich, L.; et al. The effect of very-low-calorie diet on mitochondrial dysfunction insubcutaneous adipose tissue and peripheral monocytes of obese subjects with type 2 diabetes mellitus.Physiol. Res. 2017, 66, 811–822. [PubMed]
26. Esposito, K.; Maiorino, M.I.; Ciotola, M.; Di Palo, C.; Scognamiglio, P.; Gicchino, M.; Petrizzo, M.;Saccomanno, F.; Beneduce, F.; Ceriello, A.; et al. Effects of a Mediterranean-style diet on the need forantihyperglycemic drug therapy in patients with newly diagnosed type 2 diabetes: A randomized trial. Ann.Intern. Med. 2009, 151, 306–314. [CrossRef] [PubMed]
27. Kahleova, H.; Belinova, L.; Malinska, H.; Oliyarnyk, O.; Trnovska, J.; Skop, V.; Kazdova, L.; Dezortova, M.;Hajek, M.; Tura, A.; et al. Eating two larger meals a day (breakfast and lunch) is more effective than sixsmaller meals in a reduced-energy regimen for patients with type 2 diabetes: A randomised crossover study.Diabetologia 2014, 57, 1552–1560. [CrossRef] [PubMed]
28. Salas-Salvado, J.; Bullo, M.; Babio, N.; Martinez-Gonzalez, M.A.; Ibarrola-Jurado, N.; Basora, J.; Estruch, R.;Covas, M.I.; Corella, D.; Aros, F.; et al. Reduction in the incidence of type 2 diabetes with the Mediterraneandiet: Results of the PREDIMED-Reus nutrition intervention randomized trial. Diabetes Care 2011, 34, 14–19.[CrossRef] [PubMed]
29. Estruch, R.; Ros, E.; Salas-Salvado, J.; Covas, M.I.; Corella, D.; Aros, F.; Gomez-Gracia, E.; Ruiz-Gutierrez, V.;Fiol, M.; Lapetra, J.; et al. Primary prevention of cardiovascular disease with a Mediterranean diet. N. Engl.J. Med. 2013, 368, 1279–1290. [CrossRef] [PubMed]
30. Estruch, R.; Martinez-Gonzalez, M.A.; Corella, D.; Salas-Salvado, J.; Fito, M.; Chiva-Blanch, G.; Fiol, M.;Gomez-Gracia, E.; Aros, F.; Lapetra, J.; et al. Effect of a high-fat Mediterranean diet on bodyweight and waistcircumference: A prespecified secondary outcomes analysis of the PREDIMED randomised controlled trial.Lancet Diabetes Endocrinol. 2016, 4, 666–676. [CrossRef]
31. Leslie, W.S.; Taylor, R.; Harris, L.; Lean, M.E. Weight losses with low-energy formula diets in obese patientswith and without type 2 diabetes: Systematic review and meta-analysis. Int. J. Obes. (Lond.) 2017, 41, 96–101.[CrossRef] [PubMed]
32. Rehackova, L.; Araujo-Soares, V.; Adamson, A.J.; Steven, S.; Taylor, R.; Sniehotta, F.F. Acceptability of avery-low-energy diet in Type 2 diabetes: Patient experiences and behaviour regulation. Diabet. Med. 2017.[CrossRef] [PubMed]
33. Stefan, N.; Haring, H.U.; Schulze, M.B. Metabolically healthy obesity: The low-hanging fruit in obesitytreatment? Lancet Diabetes Endocrinol. 2017. [CrossRef]
34. Banasik, J.L.; Walker, M.K.; Randall, J.M.; Netjes, R.B.; Foutz, M.S. Low-calorie diet induced weight lossmay alter regulatory hormones and contribute to rebound visceral adiposity in obese persons with a familyhistory of type-2 diabetes. J. Am. Assoc. Nurse Pract. 2013, 25, 440–448. [CrossRef] [PubMed]
44

Nutrients 2018, 10, 1022
35. Garcia-Perez, L.E.; Alvarez, M.; Dilla, T.; Gil-Guillen, V.; Orozco-Beltran, D. Adherence to therapies inpatients with type 2 diabetes. Diabetes Ther. 2013, 4, 175–194. [CrossRef] [PubMed]
36. Shultz, J.A.; Sprague, M.A.; Branen, L.J.; Lambeth, S. A comparison of views of individuals with type2 diabetes mellitus and diabetes educators about barriers to diet and exercise. J. Health Commun. 2001,6, 99–115. [CrossRef] [PubMed]
37. Sellahewa, L.; Khan, C.; Lakkunarajah, S.; Idris, I. A Systematic Review of Evidence on the Use of Very LowCalorie Diets in People with Diabetes. Curr. Diabetes Rev. 2017, 13, 35–46. [CrossRef] [PubMed]
38. Cerrelli, F.; Manini, R.; Forlani, G.; Baraldi, L.; Melchionda, N.; Marchesini, G. Eating behavior affects qualityof life in type 2 diabetes mellitus. Eat. Weight Disord. 2005, 10, 251–257. [CrossRef] [PubMed]
39. Carbonneau, E.; Royer, M.M.; Richard, C.; Couture, P.; Desroches, S.; Lemieux, S.; Lamarche, B. Effects ofthe Mediterranean Diet before and after Weight Loss on Eating Behavioral Traits in Men with MetabolicSyndrome. Nutrients 2017, 9, 305. [CrossRef] [PubMed]
40. Miller, C.K.; Kristeller, J.L.; Headings, A.; Nagaraja, H. Comparison of a mindful eating intervention to adiabetes self-management intervention among adults with type 2 diabetes: A randomized controlled trial.Health Educ. Behav. 2014, 41, 145–154. [CrossRef] [PubMed]
41. Shirai, K.; Saiki, A.; Oikawa, S.; Teramoto, T.; Yamada, N.; Ishibashi, S.; Tada, N.; Miyazaki, S.; Inoue, I.;Murano, S.; et al. The effects of partial use of formula diet on weight reduction and metabolic variables inobese type 2 diabetic patients-multicenter trial. Obes. Res. Clin. Pract. 2013, 7, e43–e54. [CrossRef] [PubMed]
© 2018 by the authors. Licensee MDPI, Basel, Switzerland. This article is an open accessarticle distributed under the terms and conditions of the Creative Commons Attribution(CC BY) license (http://creativecommons.org/licenses/by/4.0/).
45

nutrients
Review
Personalized Nutrition Approach in Food Allergy:Is It Prime Time Yet?
Enza D’Auria 1,*, Mariette Abrahams 2, Gian Vincenzo Zuccotti 1 and Carina Venter 3
1 Department of Pediatrics, Children’s Hospital V. Buzzi, University of Milan, Milan 20154, Italy;[email protected]
2 Faculty of Social Sciences, University of Bradford, Bradford BD7 1DP, UK; [email protected] Section of Allergy and Immunology, Children’s Hospital Colorado, University of Colorado,
Aurora, CO 80045, USA; [email protected]* Correspondence: [email protected]
Received: 27 December 2018; Accepted: 5 February 2019; Published: 9 February 2019
Abstract: The prevalence of food allergy appears to be steadily increasing in infants and youngchildren. One of the major challenges of modern clinical nutrition is the implementation ofindividualized nutritional recommendations. The management of food allergy (FA) has seen majorchanges in recent years. While strict allergen avoidance is still the key treatment principle, it isincreasingly clear that the avoidance diet should be tailored according to the patient FA phenotype.Furthermore, new insights into the gut microbiome and immune system explain the rising interest intolerance induction and immunomodulation by microbiota-targeted dietary intervention. This reviewarticle focuses on the nutritional management of IgE mediated food allergy, mainly focusing ondifferent aspects of the avoidance diet. A personalized approach to managing the food allergicindividual is becoming more feasible as we are learning more about diagnostic modalities and allergicphenotypes. However, some unmet needs should be addressed to fully attain this goal.
Keywords: food allergy; avoidance diet; nutrition; personalized nutrition; phenotype; microbiome
1. Introduction
The true prevalence of food allergy is still unclear: a systematic review of challenge proven foodallergy (FA) prevalence in Europe estimates a very low prevalence of FA of 1% [1] compared to singlecenter studies reporting challenge proven prevalence figures of up to 10%. The latest paper on theprevalence of food allergies in children in the USA reports the number of reported FA of 7.6% inchildren [2] and 10.8% in adults [3].
A small number of foods, such as milk, egg, peanut, tree nuts, wheat, soy, fish, and shellfish,are responsible of most of IgE mediated allergic reactions [4,5]. These reactions are induced byallergenic proteins in the foods and are characterized by rapid onset (usually <2 h). These foods canprovoke severe reactions, especially tree nut and peanuts [5,6]. Clinical reactivity to carbohydrates inmammalian meat is an exception—symptoms can be delayed for as long as 6 h [7].
The cornerstone of the management of FA still relies on avoiding the culprit food, since accidentalingestion of the offending food may lead to symptoms including serious and potentially life-threateningreactions, like anaphylaxis [8].
The management of food allergies has seen major transformations in the last decade. It isincreasingly clear that the avoidance diet should be tailored according to the patient FA phenotype [9].Better characterization of FA phenotypes could help to personalize the dietary management of FA bythe degree of avoidance required.
Furthermore, there is a greater focus seen on tolerance induction and immunomodulationby microbiota-targeted dietary intervention to allow for greater control of allergies. In the era of
Nutrients 2019, 11, 359; doi:10.3390/nu11020359 www.mdpi.com/journal/nutrients46

Nutrients 2019, 11, 359
precision medicine, the field of precision nutrition involves tailored nutritional recommendations tothe individual. To plan personalized nutrition advice for patients with a food allergy, many factorsincluding clinical history, type of allergen, sensitization profiles, threshold level, dietary habits, foodpreferences, physical activity, microbiome and genotype should all be considered.
In the field of food allergy, some of these factors are better-defined thanks to new diagnosticmolecular technologies [10]. Allergen-component resolved diagnostics (CRD) allows differentiatingbetween a true food allergy from pollen-food syndrome or clinically irrelevant sensitization. CRDmay predict the risk or severity of allergic reactions to specific food by identifying IgE to epitopeswithin an allergen source. However, many other components necessary for dietary guidance are poorlyunderstood and need further investigation to be incorporated into clinical practice.
In this review, we will focus on the nutritional management of IgE mediated food allergy,the avoidance diet, state of the art tools/therapies, and the remaining knowledge gap.
2. Making an Accurate Diagnosis: The First Step Required to Develop an Avoidance Diet
The first step in the diagnosis of a FA is to distinguish IgE-mediated from non–IgE-mediatedreactions. Most IgE caused reactions occur rapidly (minutes up to 2 h after ingestion) with the rareexception [11]. Anaphylaxis is the most serious allergic reaction; it is rapid in onset, life-threatening,and potentially fatal [12]. Different geographical locations show some differences in food allergentriggers for anaphylaxis. A recent one from Spain suggested milk and eggs allergies are more severethan nuts in their population [13].
Unlike IgE mediated, non IgE-mediated reactions are typically delayed from hours to weeks afteringestion of the culprit food(s) [11].
A thourough clinical history is central in diagnosing FA. Components of this history shouldideally include food recalls, as well as timing, characteristics, and severity of symptoms. If the historysuggests an IgE mediated food allergy, skin prick tests (SPT) or food-specific IgE blood tests can beused to confirm allergy diagnosis [5,14]. A positive test result does not confirm an IgE-mediatedallergic reaction, whereas a negative test, with rare exception, eliminates it [15].
In addition to the SPT and specific IgE tests, oral food challenges (OFC) and CRD are importanttools for allergy diagnosis. OFC remains the gold standard to confirm clinical reactivity, in mostcases [16,17]. Component-resolved diagnostics helps further define specific allergens and reducesmisdiagnosis due to cross-reactivity [18,19]. The usefulness of these tools can be explained throughthe classic example—wheat allergy. Wheat allergy is often over diagnosed, due to the low specificityof wheat IgE testing [20,21]. A patient with a grass pollen allergy may have elevated “wheat IgElevels” while being wheat tolerant [22]. Therefore, both CRD and OFCs should be implemented inchildren with an SPT or IgE positive wheat allergy. CRD increases the accuracy of wheat allergydiagnosis by identifying the presence of specific IgE to omega-5 gliadin, the antibody highly specificto wheat allergy [23]. Currently, oral provocation with wheat is the reference test for the diagnosis ofwheat/cereal allergy as it definitely shows if a child will tolerate wheat.
Additionally, profiling the specific IgE repertoire by CRD may help identify falsely diagnosedallergies in highly polysensitized patients. This can be explained with the case of patients with allergenextract positive but negative genuine components. In children with multiple sensitization to treenuts, including hazelnut, positive IgE extract but negative IgE genuine component are markers ofa probable cross-sensitization with grass pollen. These patients are very likely to be tolerant to hazelnutin vivo [24]. CRD has become a useful tool for diagnosing FA, though the use of these tests variesfrom country to country.; This technique has some limitations that should be considered. For instance,the allergens are in a recombinant form and not always show the same IgE reactivity that naturalallergens. This is even more relevant in food allergy testing as the allergens used in the reagentsare processed. Indeed, the oral food challenge (OFC) is the only effective method to confirm the FAdiagnosis, although the other preliminary diagnostic techniques could support the diagnosis.
47

Nutrients 2019, 11, 359
3. Risk Assessment and Individual Threshold Level
In general, for IgE mediated-food allergy it is very important to identify patients who are likely tohave severe reactions from patients with mild to moderate ones. Unfortunately, as allergy severityis multifactorial, this is difficult. Possible contributors to severe reactions are allergen bioavailability,patient habits (e.g., Exercise [25]), and history of anaphylaxis—although many people who havea history of only mild symptoms can develop anaphylaxis. Allergen-specific IgE levels and CRD mayassist in risk assessment as sensitization to some allergenic molecules is more likely to be related tosystemic rather than local reactions.
For instance, high levels of casein IgE has been shown to correlate with severe reactions, due toaccidental exposure, in cow’s milk allergic children [26]. Similarly, an association between specific IgEto omega-5 gliadin component and severity of reactions during wheat challenge has been reported [21,27]. In peanut allergic children, Eller and Bindslev–Jensen documented that symptom severity elicitedduring challenge correlated significantly with the levels of Ara h 2 (r(s) 1
4 0.60, P < 0.0001) [28]. However,patients with very low or undetectable sIgE may still experience severe allergic reactions [25,29].
The OFC allows us to ascertain information about individual threshold level can guide thenecessary level of food avoidance.
For instance, the challenge food for baked milk contains 1.3 g CM protein (equivalent to 40 mLCM), and children who react during their CM OFC should avoid it completely due to their severephenotype [30].
Lieberman et al. showed that 66% of the patients with egg allergy undergoing baked egg OFCtolerated baked egg and that most of the reactions were mild and treated with antihistamine alone,regardless of sIgE and/or SPT. [31].
In our opinion, performing OFC with baked milk or egg in a controlled-setting has the potentialto greatly improve children’s quality of life [32].
4. Avoidance Diet: Towards Personalized Nutrition Advice
Managing food allergies and avoiding food allergic reactions involves an individualized approachto food allergen avoidance while providing sufficient nutrition [33].
An avoidance diet is a complex undertaking that requires education about label reading, cooking,preventing cross-contamination, and communicating information to family, caregivers, friends,and restaurant personnel [34,35]. See Table 1
Table 1. Nutritional management according to risk assessment: What are the challenges?
Challenges of the Nutritional Management According to Risk Assessment
- local availability of food- lack of understanding about foods to be avoided- unexpected allergens in foods- prepacked foods with inadequate allergen labeling- defining “baked” milk and egg- identify the “eliciting dose”- risks of over restrictive diet- potential long-term effects on health and quality of life
The standard information that should be provided to all patients includes advice on food labelsand relevant labeling laws, hidden allergens, and suitable replacement foods [36]. However, avoidanceadvice should be individualized considering individual tolerances, cross-reactivity, and specificallergens that drive the reaction. Allergies to novel allergens such as alpha-gal will also requireindividualized avoidance advice.
48
Nutrients 2019, 11, 359
Individualized Allergen Avoidance
4.0.1. Milk and Egg
It is known that a large proportion of children with cow’s milk and egg allergies will be tolerantto baked milk and egg irrespective of the age or population studied [37]. Baked milk or egg-containingfoods typically refer to muffins, but other forms such as cookies, waffles, and pancakes have alsobeen suggested. Baked cheese (pizza) has also been suggested for baked milk challenges [38–43].No established guidelines to determine when to challenge have been established, so testing dependson combination of history, sIgE, and skin test results. There is limited consensus about the exact timeand temperature of baking/cooking that is required, the need for a wheat/starch matrix, and where thechallenge/food reintroduction should be conducted, e.g., hospital/in-office vs. at home [44–46]. It is,however, important to realize that some children who react to baked milk or baked egg may experiencesevere symptoms, requiring epinephrine. [31,32,46]. Risk factors for severe reactions to baked foodsneed further clarification but may include asthma requiring preventative treatment, multiple IgEmediated food allergies, and a history of anaphylaxis. [45,47]. Baked milk and egg-containing foodsare successfully introduced at home in most children’s diets post a negative challenge with goodcompliance; positively affecting the child’s food and texture repertoire [48]. However, as it is unclear ifcontinued and regular consumption of baked milk and egg-containing foods will speed up toleranceto uncooked milk or egg [49,50], families should not be pressured about frequent intake unnecessarily.
4.0.2. Peanut, Tree Nuts, Seeds
Previously, patients with peanut or tree nut allergies were advised to avoid all nuts, due to therisk of cross-reactivity or possible cross-contact/contamination. However, recent studies indicatethat clinical cross-reactivity may be as low as 30% [51]. For instance, walnuts and pecans are highlycross-reactive with each other, but not with peanuts, hazelnuts or almonds Sensitization or clinicalallergy may develop after a period of unnecessarily exclusion [52]. The British Society for Allergyand Clinical Immunology (BSACI) guidelines were the first food allergy management guidelinesto recommend active inclusion of tolerated nuts in diets of individuals with peanut or tree nutallergy [53,54]. Peanuts are legumes, but allergy to other legumes is generally uncommon amongthose with peanut allergy, though this does depend on geography and local diet [55,56]. Lupine, pea,and soybean show some apparent cross-reactivity for patients who are highly allergic to peanut,although it is very difficult to separate cross-reactivity from de novo sensitization. The risk ofcross-reaction may be higher for lupin than for other beans, particularly in Europe [57–59]. In the caseof lupine allergy, patients need to be informed about foods containing lupin which may include pies,certain breads, and pastries.
Seeds are being used more often in commercial and gourmet foods—most commonly flaxseed,sesame, sunflower, poppy, pumpkin, and mustard seeds [60]. Sesame and mustard seeds are amongthe 14 most prevalent allergens in the EU, but not in the US [61]. In Europe, prevalence dataindicates sesame and mustard seed allergies are geographically disproportionate: high in someareas (France and Spain), much lower in others (Germany and the Nordic countries) and unknown inEastern Europe [62]. Mustard and sesame seeds are often hidden in commercial foods, makingscrutiny of labels required at all times. Sesame seed allergy is not commonly seen outside ofIsrael and Europe [63]. In addition to scrutiny of labels, children with sesame allergy should alwaysavoid sesame oil as it is cold/expeller pressed [64].
4.0.3. Fruit and Vegetable Allergies
Allergies to fruit and vegetables, in particular, require individualized advice as symptoms rangefrom milder symptoms triggered by pollen-food syndrome (PFS, secondary IgE mediated food allergy)to more severe symptoms triggered by lipid transfer protein syndrome (LTP, primary IgE mediatedfood allergy) [65]. It is important to differentiate between these two presentations of fruit and vegetable
49

Nutrients 2019, 11, 359
allergies as that will direct the dietary advice given. With PFS, cooked, canned, baked, microwavedfruit and vegetables are allowed, whereas fruit/vegetable should be completely avoided in the case ofLTP allergies. The degree to which cross-reactive fruit and vegetables (including soy and nuts) shouldbe avoided requires careful diagnostic evaluation as blanket avoidance advice is not advocated [66–68].
4.0.4. Fish and Shellfish Allergy
It is important to distinguish between fish and shellfish (crustacean and mollusks) allergies. Fishand shellfish allergies may co-exist [69] but the main allergens differ, and cross-reactivity betweenfish and shellfish is unlikely. The main allergen in fish is β parvalbumin; in the case of shellfish,the major allergen is tropomyosin [70]. Additionally, allergy to a certain fish or shellfish does not implyallergies to all species in that particular group [71,72]. Subjects who suffer from fish allergy have onlyabout a 50% probability of being cross-reactive to another fish species. This is significantly lower thanthose with shellfish allergies, who have up to a 75% chance of cross-reactivity [15]. In additionto the allergens derived from fish themselves, fish contaminants, such as the parasite Anisakis,can also cause allergic reactions, meaning Anisakis allergy can be falsely diagnosed as a fish allergy.In particular, Anisakis allergy correlated to prevalence of parasitic infection in fish—for example,in Spain and Southern Italy, there is a higher prevalence of Anisakis allergy due to moderately frequentAnisakis infection. These allergic patients develop IgE against tropomyosin from Anisakis. As always,sensitization depends in part on the consumption pattern of fish (cooked, undercooked or raw) andthe infection pattern of fish in the local region [73].
4.0.5. Alpha-Galactosidase
Alpha galactosidase (Alpha-gal) allergy is characterized by delayed (4 to 6 h after the ingestion)hypersensitivity reactions to mammalian meats and is mediated by IgE antibodies to the oligosaccharidegalactose-alpha 1,3-galactose. It requires avoidance of mammalian meats and their organ meat. Someindividuals also need to avoid ice-cream, milk, and milk products but the degree of avoidance and foodsbeing avoided should be discussed with the allergist. This decision can be made based on past history ofreactions or tolerance [74,75]. Where the history is unclear, or the food has not been eaten in the past, an oralfood challenge can be conducted [76].
5. Nutritional Impact of Food Allergies: Growth and Nutrient Intake
There is rising concern that children with FA have an insufficient nutrient intake or nutrientimbalance leading to adverse health implications. Data published over the past few years indicatesthat children with food allergies (IgE, non-IgE, and mixed presentations of IgE and non-IgE)show growth impairment, both in weight and length. They are often underweight [77], and inthe case of chronic malnutrition, they become stunted, e.g., a child who is too short for his/herage [78,79]. However, excessive weight gain has also been reported in children with food allergies,but poorly researched [77,80,81]. A recent international survey conducted by Meyer et al. [82] included430 patients from twelve allergy centers world-wide. The pooled data indicated that 6% wereunderweight, 9% stunted, 5% undernourished, and 3–5% were overweight. In this study, growthimpairments varied by allergy profile. Children with cow’s milk allergy (CMA) had a lower weightfor age z-score, as a result of acute malnutrition or “wasting”; children with mixed IgE and non-IgEmediated FA were stunted, and children with only non-IgE FA were underweight with lower bodymass index (BMI). Very different growth patterns were observed between children from differentcountries. Atopic comorbidities did not affect growth.
Avoidance diets required for FA management place children at risk for potential inadequatenutrition. In this regard, a number of studies have investigated the nutritional adequacy of eliminationdiets. However, most of them have been conducted in young children aged six months to four years.Children with food allergies (IgE, non-IgE, and mixed presentations of IgE and non-IgE) are also athigher risk of insufficient intake of protein, calories, vitamins, and minerals [83–87]. The micronutrients
50

Nutrients 2019, 11, 359
implicated are iodine, calcium, and vitamin D, especially in children with CMA [83,88,89]. However,it has been shown that children with cow’s milk allergies or multiple food allergies are able toachieve similar mean intakes of nutrients as healthy children when receiving nutrition counselling andsubstitution of nutritionally equivalent foods [78,83,90–92].
Limited data exist on dietary intake in teenagers and adults with food allergies, with contrastingresults [93,94]. One study reports, higher intakes of calcium, iron, folate, and vitamin E have beendemonstrated in participants >20 years with food allergy [44]. Conversely, lower intakes of calciumand phosphorous have been reported in young adults with CMA, with one study reporting that 27%were at risk of osteoporosis [48]. Maslin et al. showed no significant difference between these twogroups and control groups with the intake of calcium. Iron, copper, zinc, selenium, and iodine werebelow the Recommended National Intakes (RNI) for both groups and their controls [94]. There arecurrently no data on BMI status on adults with IgE mediated food allergy. These factors need to beconsidered when providing nutrition advice to children and adults with food allergies. Althoughinformation on healthy eating is important, consideration to vitamin and mineral supplementation inhypoallergenic formulas in the case of children should be given [84,95]. Nutritional counselling andmonitoring growth and development are crucial in the management of FA, as the avoidance diet mayaffect the well-being of FA patients (see Table 2).
Table 2. Effect of avoidance diet on patients.
Effect of Avoidance Diet
- poor growth- micronutrient deficiencies- altered taste perception- long term effects on food preferences and choices- reduced quality of life
6. Food Behaviour and Preferences
In children with FA, the development of their food habits and preferences takes place in the contextof their chronic condition. Since parents have the main responsibility for the dietary management oftheir child’s food allergies [96], their parenting style and the way they interact with the child duringfeedings both have an effect on a child’s food habits [97]. A child’s food allergies add a burden toparents [98]. Food refusal has also been shown to occur in toddlers with food allergies [99] and morespecifically eosinophilic gastrointestinal disease [100]. Additionally, a study on children aged 5 to14 years in France showed that children who have outgrown their food allergies are more reluctant totry new foods than their siblings [101]. Food neophobia and refusal could result from unnecessarilyhigh dietary restrictions that parents place on their children due to increased anxiety and fear of anallergic reaction [102]. The long-term effects of avoidance diet on food behavior and preferences needsfurther investigation.
Food choice behavioral problems have been documented in older children or adults with foodallergies. Teenagers with food allergies, strive to eat the same foods as their peers, often leading torisk taking behavior. However, they reported reluctance to try new foods when away from home.In contrast to the non-food allergic teens, those with food allergies felt that parental control over foodintake was to protect them [103].
Adults with FA felt that their allergies limited them from the pleasure of eating and they oftenfound it difficult to find safe foods. They also felt that the need to be constantly organized to have safefoods available was a burden [104].
7. Microbiota-Diet and Genetic Factors: A Complex and Still Unknown Interplay
FA is thought to be the result of a disruption of mucosal immunological tolerance, due to dietaryfactors, gut microbiota, and interactions between them [105]. Different bacterial taxa may be associated
51
Nutrients 2019, 11, 359
with different food allergy subphenotyes. Differences in gut microbiome have been observed in subjectswith tree-nut allergy in respect to those with cow’s milk allergy [106,107]. The observed differencesmay however be influenced by age, population, sex and diet. Furthermore, recent data indicate thatfor cow’s milk allergy, the microbiome differs between those children who are sensitized vs. notsensitized [108], those with clinical allergy vs. those with no allergy [109], and those who developtolerance vs. those who do not [110]. Overall, these findings suggest the possibility to manipulate thegut microbiota with preventive or therapeutic purposes.
Data in pediatric studies indicate that certain pre and probiotics tested may address dysbiosis [111]and may even induce tolerance development [112]. More clinical trials regarding the use of pre andprobiotics in the management of food allergies are needed before clinical recommendations can be made.These studies should also consider genetic background and age in their design. Another importantissue to be considered is that the gut microbiome composition and diversity can be modulated by hostgenetic profiling [113]. A host’s genetic composition is able to modulate their gut microbiota, which isanother paramount area of study [114].
Whether diet diversity may improve dysbiosis and microbial diversity in those with food allergiesremains to be seen [115].
Further studies need to investigate the complex interplay between the host genetic componentsand environmental factors, including the microbiota and diet, in the pathogenesis and expression offood allergy that is still largely unknown.
8. The Technology Revolution in FA Management
Increasingly, personalized devices to aid in allergen detection have been invented, and the industryhas grown rapidly over the last decade [116]. These technologies have resulted both from increaseddemand for transparency of product information and scientific advancements. [117]. The rapid dropin the price of personalised nutrition devices has resulted in mass accessibility [118]. Deciphering foodlabels is a difficult task and for those with allergies, a daily chore that if done incorrectly, can lead tonegative and possibly fatal outcomes [119,120].
New digital technologies have started to appear on the market that attempts to address thedaily challenges families face when choosing products for a child with allergies. For a full reviewof technologies involved in portable allergy products, we refer readers to the comprehensive articleby Ross, G.M.S [121]. There have been a number of technology services advising about potentialrisks related to food composition. For concerned consumers, having instant access to information canremove the guesswork and can potentially save time. However, there are no validated, personalizedsystems for testing individual meals for specific food source products. It is also noteworthy thatsometimes component recipes change and accuracy as well of lack of clinical validation of theseproducts are issues frequently raised.
With such rapid advances in the scientific and technology industry, it is, however, importantto have comprehensive communication between consumer advocates, the food industry, and theclinicians to help improve avoidance of allergens by technical fixes, while being fully aware of thelimitations and current lack of validation of these products in a variety of matrices or in foods withmultiple ingredients (see Figure 1). What is clear, is that management of allergies will require theintervention of a specialist multidisciplinary team with registered dietitians playing a key role insupporting families while staying abreast of new technologies [122].
Some examples of products currently available on the market, outlining their pros, cons andfuture considerations, are listed below (Table 3).
52
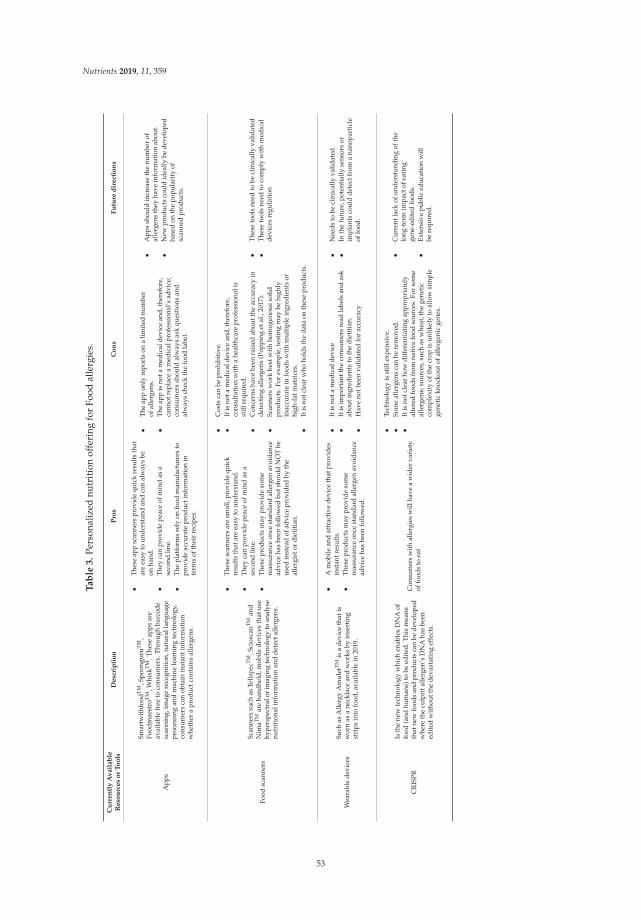
Nutrients 2019, 11, 359
Ta
ble
3.
Pers
onal
ized
nutr
itio
nof
feri
ngfo
rFo
odal
lerg
ies.
Cu
rre
ntl
yA
va
ila
ble
Re
sou
rce
so
rT
oo
lsD
esc
rip
tio
nP
ros
Co
ns
Fu
ture
dir
ect
ion
s
App
s
Smar
twit
hfoo
dTM,S
poon
guru
TM,
Food
mae
stro
TM
,Whi
skT
M.T
hese
apps
are
avai
labl
efr
eeto
cons
umer
s.Th
roug
hba
rcod
esc
anni
ng,i
mag
ere
cogn
itio
n,na
tura
llan
guag
epr
oces
sing
and
mac
hine
lear
ning
tech
nolo
gy,
cons
umer
sca
nob
tain
inst
anti
nfor
mat
ion
whe
ther
apr
oduc
tcon
tain
sal
lerg
ens.
•Th
ese
app
scan
ners
prov
ide
quic
kre
sults
that
are
easy
toun
ders
tand
and
can
alw
ays
beon
hand
.•
They
can
prov
ide
peac
eof
min
das
ase
cond
line.
•Th
epl
atfo
rms
rely
onfo
odm
anuf
actu
rers
topr
ovid
eac
cura
tepr
oduc
tinf
orm
atio
nin
term
sof
thei
rre
cipe
s.
•Th
eap
pon
lyre
port
son
alim
ited
num
ber
ofal
lerg
ens.
•Th
eap
pis
nota
med
ical
devi
cean
d,th
eref
ore,
cann
otre
plac
ea
med
ical
prof
essi
onal
’sad
vice
;co
nsum
ers
shou
ldal
way
sas
kqu
esti
ons
and
alw
ays
chec
kth
efo
odla
bel.
•A
pps
shou
ldin
crea
seth
enu
mbe
rof
alle
rgen
sth
eyha
vein
form
atio
nab
out.
•N
ewpr
oduc
tsco
uld
idea
llybe
deve
lope
dba
sed
onth
epo
pula
rity
ofsc
anne
dpr
oduc
ts.
Food
scan
ners
Scan
ners
such
asTe
llspe
cTM,S
cios
canTM
and
Nim
aTMar
eha
ndhe
ld,m
obile
devi
ces
that
use
hype
rspe
ctra
lor
imag
ing
tech
nolo
gyto
anal
yse
nutr
itio
nali
nfor
mat
ion
and
dete
ctal
lerg
ens.
•Th
ese
scan
ners
are
smal
l,pr
ovid
equ
ick
resu
lts
that
are
easy
toun
ders
tand
.•
They
can
prov
ide
peac
eof
min
das
ase
cond
line.
•Th
ese
prod
ucts
may
prov
ide
som
ere
assu
ranc
eon
cest
anda
rdal
lerg
enav
oida
nce
advi
ceha
sbe
enfo
llow
edbu
tsho
uld
NO
Tbe
used
inst
ead
ofad
vice
prov
ided
byth
eal
lerg
isto
rdi
etit
ian.
•C
osts
can
bepr
ohib
itiv
e.•
Itis
nota
med
ical
devi
cean
d,th
eref
ore,
cons
ulta
tion
wit
ha
heal
thca
repr
ofes
sion
alis
still
requ
ired
.•
Con
cern
sha
vebe
enra
ised
abou
tthe
accu
racy
inde
tect
ing
alle
rgen
s(P
oppi
nget
al.,
2017
).•
Scan
ners
wor
kbe
stw
ith
hom
ogen
ous
solid
prod
ucts
.For
exam
ple,
test
ing
may
behi
ghly
inac
cura
tein
food
sw
ith
mul
tipl
ein
gred
ient
sor
high
-fat
mat
rice
s.•
Itis
notc
lear
who
hold
sth
eda
taon
thes
epr
oduc
ts.
•Th
ese
tool
sne
edto
becl
inic
ally
valid
ated
•T
hese
tool
sne
edto
com
ply
wit
hm
edic
alde
vice
sre
gula
tion
Wea
rabl
ede
vice
sSu
chas
Alle
rgy
Am
ulet
TMis
ade
vice
that
isw
orn
asa
neck
lace
and
wor
ksby
inse
rtin
gst
rips
into
food
,ava
ilabl
ein
2019
.
•A
mob
ilean
dat
trac
tive
devi
ceth
atpr
ovid
esin
stan
tres
ults
.•
Thes
epr
oduc
tsm
aypr
ovid
eso
me
reas
sura
nce
once
stan
dard
alle
rgen
avoi
danc
ead
vice
has
been
follo
wed
.
•It
isno
tam
edic
alde
vice
•It
isim
port
antt
heco
nsum
ers
read
labe
lsan
das
kab
outi
ngre
dien
tsto
the
diet
itia
n.•
Hav
eno
tbee
nva
lidat
edfo
rac
cura
cy
•N
eeds
tobe
clin
ical
lyva
lidat
ed.
•In
the
futu
re,p
oten
tial
lyse
nsor
sor
impl
ants
coul
dde
tect
from
ana
nopa
rtic
leof
food
.
CR
ISPR
Isth
ene
wte
chno
logy
whi
chen
able
sD
NA
offo
od(a
ndhu
man
s)to
beed
ited
.Thi
sm
eans
that
new
food
san
dpr
oduc
tsca
nbe
deve
lope
dw
here
the
culp
rita
llerg
en’s
DN
Aha
sbe
ened
ited
wit
hout
the
deva
stat
ing
effe
cts.
Con
sum
ers
with
alle
rgie
sw
illha
vea
wid
erva
riet
yof
food
sto
eat
•Te
chno
logy
isst
illex
pens
ive.
•So
me
alle
rgen
sca
nbe
rem
oved
.•
Itis
notc
lear
how
diff
eren
tiat
ing
appr
opri
atel
yal
tere
dfo
ods
from
nati
vefo
odso
urce
s.Fo
rso
me
alle
rgen
icso
urce
s,su
chas
whe
at,t
hege
neti
cco
mpl
exit
yof
the
crop
isun
likel
yto
allo
wsi
mpl
ege
neti
ckn
ocko
utof
alle
rgen
icge
nes.
•C
urre
ntla
ckof
unde
rsta
ndin
gof
the
long
-ter
mim
pact
ofea
ting
gene
-edi
ted
food
s.•
Exte
nsiv
epu
blic
educ
atio
nw
illbe
requ
ired
.
53

Nutrients 2019, 11, 359
Figure 1. Nutrition approach: unmet needs.
9. Conclusions
A personalized approach to managing the food allergic individual is becoming more feasibleas we are learning more about diagnostic modalities and allergic phenotypes. The availabilityof specialized foods and technology are increasing which also enables the clinicians to providepersonalized advice. A multidisciplinary team approach, including a dietitian, is crucial to provideindividualized recommendations to patients.
Author Contributions: E.D. and C.V contributed to the conception and design of the review, drafting the review;M.A. contributed in the review drafting; G.V.Z. and C.V. contributed to revise the manuscript. All the authorsapproved the manuscript for publication.
Funding: This research received no external funding
Acknowledgments: We would like to acknowledge Miriam Ben Abdallah for editing the paper.
Conflicts of Interest: The authors declare no conflict of interests.
54

Nutrients 2019, 11, 359
References
1. Nwaru, B.I.; Hickstein, L.; Panesar, S.S.; Muraro, A.; Werfel, T.; Cardona, V.; Dubois, A.E.; Halken, S.;Hoffmann-Sommergruber, K.; Poulsen, L.K.; et al. EAACI Food Allergy and Anaphylaxis Guidelines Group.The epidemiology of food allergy in Europe: A systematic review and meta-analysis. Allergy 2014, 69, 62–75.[CrossRef]
2. Gupta, R.S.; Warren, C.M.; Smith, B.M.; Blumenstock, J.A.; Jiang, J.; Davis, M.M.; Nadeau, K.C. The PublicHealth Impact of Parent-Reported Childhood Food Allergies in the United States. Pediatrics 2018, 142,e20181235. [CrossRef] [PubMed]
3. Osborne, N.J.; Koplin, J.J.; Martin, P.E.; Gurrin, L.C.; Lowe, A.J.; Matheson, M.C.; Ponsonby, A.L.;Wake, M.; Tang, M.L.; Dharmage, S.C.; et al. HealthNuts Investigators. Prevalence of challenge-provenIgE-mediated food allergy using population-based sampling and predetermined challenge criteria in infants.J. Allergy ClinImmunol. 2011, 127, e1–e2. [CrossRef] [PubMed]
4. Chafen, J.J.; Newberry, S.J.; Riedl, M.A.; Bravata, D.M.; Maglione, M.; Suttorp, M.J.; Sundaram, V.; Paige, N.M.;Towfigh, A.; Hulley, B.J.; et al. Diagnosing and managing common food allergies: A systematic review.JAMA 2010, 303, 1848–1856. [CrossRef] [PubMed]
5. Boyce, J.A.; Assa’ad, A.; Burks, A.W.; Jones, S.M.; Sampson, H.A.; Wood, R.A.; Plaut, M.; Cooper, S.F.;Fenton, M.J.; Arshad, S.H.; et al. NIAID-sponsored expert panel. Guidelines for the diagnosisand management of food allergy in the United States: Report of the NIAID-sponsored expert panel.J. Allergy ClinImmunol. 2010, 126, S1–S58. [CrossRef] [PubMed]
6. Gupta, R.S.; Springston, E.E.; Warrier, M.R.; Smith, B.; Kumar, R.; Pongracic, J.; Holl, J.L. The prevalence,severity, and distribution of childhood food allergy in the United States. Pediatrics 2011, 128, e9–e17.[CrossRef] [PubMed]
7. Commins, S.P.; Satinover, S.M.; Hosen, J.; Mozena, J.; Borish, L.; Lewis, B.D.; Woodfolk, J.A.;Platts-Mills, T.A.E. Delayed anaphylaxis, angioedema, or urticaria after consumption of red meat in patientswith IgE antibodies specific for galactose-alpha-1,3-galactose. J. Allergy ClinImmunol. 2009, 123, 426–433.[CrossRef] [PubMed]
8. Sova, C.; Feuling, M.B.; Baumler, M.; Gleason, L.; Tam, J.S.; Zafra, H.; Goday, P.S. Systematic review ofnutrient intake and growth in children with multiple IgE-mediated food allergies. Nutr. Clin. Pract. 2013, 28,669–675. [CrossRef] [PubMed]
9. Deschildre, A.; Lejeune, S.; Cap, M.; Flammarion, S.; Jouannic, L.; Amat, F.; Just, J. Food allergy phenotypes:The key to personalized therapy. ClinExp Allergy 2017, 47, 1125–1137. [CrossRef] [PubMed]
10. Matricardi, P.M.; Kleine-tebbe, J.; Hoffmann, H.J.; Valenta, R.; Hilger, C.; Hofmaier, S.; Aalberse, R.C.;Agache, I.; Asero, R.; Ballmer-Weber, B.; et al. EAACI Molecular Allergology User’s Guide.Pediatr. Allergy Immunol. 2016, 27, 1–250. [CrossRef]
11. Sampson, H.A.; Aceves, S.; Bock, S.A.; James, J.; Jones, S.; Lang, D.; Nadeau, K.; Nowak-Wegrzyn, A.;Oppenheimer, J.; Perry, T.T.; et al. Food allergy: A practice parameter update-2014. J. Allergy Clin. Immunol.2014, 134, 1016–1025. [CrossRef] [PubMed]
12. Muraro, A.; Roberts, G.; Worm, M.; Bilo, M.B.; Brockow, K.; Fernandez-Rivas, M.; Santos, A.F.; Zolkipli, Z.Q.;Bellou, A.; Bindslev-Jensen, C.; et al. Anaphylaxis: Guidelines from the European Academy of Allergy andClinical Immunology. Allergy 2014, 69, 1026–1045. [CrossRef] [PubMed]
13. Benedé, S.; Garrido-Arandia, M.; Martín-Pedraza, L.; Bueno, C.; Díaz-Perales, A.; Villalba, M. Multifactorialmodulation of food-induced anaphylaxis. Front. Immunol. 2017, 8, 552. [CrossRef]
14. Centre for Clinical Practice at NICE (UK). Food Allergy in Children and Young People: Diagnosis and Assessmentof Food Allergy in Children and Young People in Primary Care and Community Settings; National Institute forHealth and Clinical Excellence: London, UK, 2011.
15. Sicherer, S.H.; Sampson, H.A. Food allergy. J. Allergy Clin. Immunol. 2010, 125, S116–S125. [CrossRef][PubMed]
16. Petersen, T.H.; Mortz, C.G.; Bindslev-jensen, C.; Eller, E. Cow’s milk allergic children-Can component-resolved diagnostics predict duration and severity? Pediatr. Allergy Immunol. 2018, 29, 194–199. [CrossRef][PubMed]
17. Sicherer, S.H.; Sampson, H.A. Food allergy: A review and update on epidemiology, pathogenesis, diagnosis,prevention, and management. J. Allergy ClinImmunol. 2018, 141, 41–58. [CrossRef] [PubMed]
55

Nutrients 2019, 11, 359
18. D’auria, E.; Mameli, C.; Piras, C.; Cococcioni, L.; Urbani, A.; Zuccotti, G.V.; Roncada, P. Precision medicinein cow’s milk allergy: Proteomics perspectives from allergens to patients. J. Proteomics 2018, 188, 173–180.[CrossRef]
19. Mirnezami, R.; Nicholson, J.; Darzi, A. Preparing for precision medicine. N. Engl. J. Med. 2012, 366, 489–491.[CrossRef]
20. Venter, C.; Maslin, K.; Arshad, S.H.; Patil, V.; Grundy, J.; Glasbey, G.; Twiselton, R.; Dean, T. Very lowprevalence of IgE mediated wheat allergy and high levels of cross-sensitisation between grass and wheat ina UK birth cohort. Clin. Transl. Allergy 2016, 6, 22. [CrossRef]
21. Nilsson, N.; Sjölander, S.; Baar, A.; Berthold, M.; Pahr, S.; Vrtala, S.; Valenta, R.; Morita, E.; Hedlin, G.;Borres, M.P.; et al. Wheat allergy in children evaluated with challenge and IgE antibodies to wheatcomponents. Pediatr. Allergy Immunol. 2015, 26, 119–125. [CrossRef]
22. Constantin, C.; Quirce, S.; Poorafshar, M.; Touraev, A.; Niggemann, B.; Mari, A.; Ebner, C.; Akerström, H.;Heberle-Bors, E.; Nystrand, M.; et al. Micro-arrayed wheat seed and grass pollen allergens forcomponent-resolved diagnosis. Allergy 2009, 64, 1030–1037. [CrossRef] [PubMed]
23. Palosuo, K.; Varjonen, E.; Kekki, O.M.; Klemola, T.; Kalkkinen, N.; Alenius, H.; Reunala, T. Wheat omega-5gliadin is a major allergen in children with immediate allergy to ingested wheat. J. Allergy ClinImmunol.2001, 108, 634–638. [CrossRef] [PubMed]
24. Beyer, K.; Grabenhenrich, L.; Härtl, M.; Beder, A.; Kalb, B.; Ziegert, M.; Finger, A.; Harandi, N.; Schlags, R.;Gappa, M.; et al. Predictive values of component-specific IgE for the outcome of peanut and hazelnut foodchallenges in children. Allergy 2015, 70, 90–98. [CrossRef] [PubMed]
25. Turner, P.J.; Baumert, J.L.; Beyer, K.; Boyle, R.J.; Chan, C.H.; Clark, A.T.; Crevel, R.W.; DunnGalvin, A.;Fernández-Rivas, M.; Gowland, M.H.; et al. Can we identify patients at risk of life-threatening allergicreactions to food? Allergy 2016, 71, 1241–1255. [CrossRef] [PubMed]
26. Boyano-martínez, T.; García-ara, C.; Pedrosa, M.; Díaz-pena, J.M.; Quirce, S. Accidental allergic reactions inchildren allergic to cow’s milk proteins. J. Allergy ClinImmunol. 2009, 123, 883–888. [CrossRef] [PubMed]
27. Ito, K.; Futamura, M.; Borres, M.P.; Takaoka, Y.; Dahlstrom, J.; Sakamoto, T.; Tanaka, A.; Kohno, K.; Matsuo, H.;Morita, E. IgE antibodies to omega-5 gliadin associate with immediate symptoms on oral wheat challenge inJapanese children. Allergy 2008, 63, 1536–1542. [CrossRef] [PubMed]
28. Eller, E.; Bindslev-jensen, C. Clinical value of component-resolved diagnostics in peanut-allergic patients.Allergy 2013, 68, 190–194. [CrossRef]
29. Perry, T.T.; Matsui, E.C.; Conover-walker, M.K.; Wood, R.A. The relationship of allergen-specific IgE levelsand oral food challenge outcome. J. Allergy ClinImmunol. 2004, 114, 144–149. [CrossRef]
30. Yanagida, N.; Okada, Y.; Sato, S.; Ebisawa, M. New approach for food allergy management using low-doseoral food challenges and low-dose oral immunotherapies. Allergol. Int. 2016, 65, 135–140. [CrossRef]
31. Lieberman, J.A.; Huang, F.R.; Sampson, H.A.; Nowak-wegrzyn, A. Outcomes of 100 consecutive open,baked-egg oral food challenges in the allergy office. J. Allergy ClinImmunol. 2012, 129, 1682–1684. [CrossRef]
32. Nowak-Wegrzyn, A.; Bloom, K.A.; Sicherer, S.H.; Shreffler, W.G.; Noone, S.; Wanich, N.; Sampson, H.A.Tolerance to extensively heated milk in children with cow’s milk allergy. J. Allergy ClinImmunol. 2008, 122,342–347. [CrossRef] [PubMed]
33. Venter, C.; Groetch, M.; Netting, M.; Meyer, R. A patient-specific approach to develop an exclusion diet tomanage food allergy in infants and children. Clin. Exp. Allergy 2018, 48, 121–137. [CrossRef] [PubMed]
34. Kim, J.S.; Sicherer, S.H. Living with food allergy: Allergen avoidance. Pediatr. Clin. North Am 2011, 58,459–470. [CrossRef] [PubMed]
35. Muñoz-furlong, A. Daily coping strategies for patients and their families. Pediatrics 2003, 111, 1654–1661.[PubMed]
36. Venter, C.; Meyer, R. Session 1: Allergic disease: The challenges of managing food hypersensitivity.Proc. Nutr. Soc. 2010, 69, 11–24. [CrossRef] [PubMed]
37. Savage, J.; Sicherer, S.; Wood, R. The natural history of food allergy. J. Allergy Clin. Immunol. Pract. 2016, 4,196–203. [CrossRef] [PubMed]
38. Leonard, S.A.; Caubet, J.C.; Kim, J.S.; Groetch, M.; Nowak-Wegrzyn, A. Baked milk- and egg-containingdiet in the management of milk and egg allergy. J. Allergy Clin. Immunol. Pract. 2015, 3, 13–23. [CrossRef][PubMed]
56

Nutrients 2019, 11, 359
39. Leonard, S.A.; Nowak-Wegrzyn, A.H. Baked milk and egg diets for milk and egg allergy management.Immunol. Allergy Clin. North Am 2016, 36, 147–159. [CrossRef]
40. Leonard, S.A.; Sampson, H.A.; Sicherer, S.H.; Noone, S.; Moshier, E.L.; Godbold, J.; Nowak-Wegrzyn, A.Dietary baked egg accelerates resolution of egg allergy in children. J. Allergy Clin. Immunol. 2012, 130,473–480. [CrossRef]
41. MiceliSopo, S.; Greco, M.; Cuomo, B.; Bianchi, A.; Liotti, L.; Monaco, S.; DelloIacono, I. Matrix effect onbaked egg tolerance in children with IgE-mediated hen’s egg allergy. Pediatr. Allergy Immunol. 2016, 27,465–470. [CrossRef]
42. MiceliSopo, S.; Greco, M.; Monaco, S.; Bianchi, A.; Cuomo, B.; Liotti, L.; Iacono, I.D. Matrix effect on bakedmilk tolerance in children with IgE cow milk allergy. Allergol. Immunopathol. 2016, 44, 517–523. [CrossRef][PubMed]
43. Kim, J.S.; Nowak-Wegrzyn, A.; Sicherer, S.H.; Noone, S.; Moshier, E.L.; Sampson, H.A. Dietary baked milkaccelerates the resolution of cow’s milk allergy in children. J. Allergy Clin. Immunol. 2011, 128, 125–131.[CrossRef] [PubMed]
44. Dupont, C. How to reintroduce cow’s milk? Pediatr. Allergy Immunol. 2013, 24, 627–632. [CrossRef] [PubMed]45. Luyt, D.; Ball, H.; Makwana, N.; Green, M.R.; Bravin, K.; Nasser, S.M.; Clark, A.T. Standards of Care
Committee (SOCC) of the British Society for Allergy and Clinical Immunology (BSACI). BSACI guidelinefor the diagnosis and management of cow’s milk allergy. Clin. Exp. Allergy 2014, 44, 642–672. [CrossRef][PubMed]
46. Athanasopoulou, P.; Deligianni, E.; Dean, T.; Dewey, A.; Venter, C. Use of baked milk challenges and milkladders in clinical practice: A worldwide survey of healthcare professionals. Clin. Exp. Allergy 2017, 47,430–434. [CrossRef] [PubMed]
47. Mehr, S.; Turner, P.J.; Joshi, P.; Wong, M.; Campbell, D.E. Safety and clinical predictors of reacting toextensively heated cow’s milk challenge in cow’s milk-allergic children. Ann. Allergy Asthma. Immunol. 2014,113, 425–429. [CrossRef] [PubMed]
48. Lee, E.; Mehr, S.; Turner, P.J.; Joshi, P.; Campbell, D.E. Adherence to extensively heated egg and cow’s milkafter successful oral food challenge. J. Allergy Clin. Immunol. Pract. 2015, 3, 125–127. [CrossRef]
49. Netting, M.; Gold, M.; Quinn, P.; El-Merhibi, A.; Penttila, I.; Makrides, M. Randomised controlled trial ofa baked egg intervention in young children allergic to raw egg but not baked egg. World Allergy Organ. J.2017, 10, 22. [CrossRef]
50. Lambert, R.; Grimshaw, K.E.C.; Ellis, B.; Jaitly, J.; Roberts, G. Evidence that eating baked egg or milkinfluences egg or milk allergy resolution: A systematic review. Clin. Exp. Allergy 2017, 47, 829–837.[CrossRef]
51. Couch, C.; Franxman, T.; Greenhawt, M. Characteristics of tree nut challenges in tree nut allergic and treenut sensitized individuals. Ann. Allergy Asthma. Immunol. 2017, 118, 591–596. [CrossRef]
52. Elizur, A.; Bollyky, J.B.; Block, W.M. Elimination diet and the development of multiple tree-nut allergies.Pediatr. Res. 2017, 82, 671. [CrossRef]
53. Stiefel, G.; Anagnostou, K.; Boyle, R.K.; Brathwaite, N.; Ewan, P.; Fox, A.T.; Huber, P.; Luyt, D.;Till, S.J.; Venter, C. BSACI guideline for the diagnosis and management of peanut and tree nut allergy.Clin. Exp. Allergy 2017, 47, 719–739. [CrossRef] [PubMed]
54. Eigenmann, P.A.; Lack, G.; Mazon, A.; Nieto, A.; Haddad, D.; Brough, H.A.; Caubet, J.C. Managing nutallergy: A remaining clinical challenge. J. Allergy Clin. Immunol. Pract. 2017, 5, 296–300. [CrossRef]
55. Pascual, C.Y.; Fernandez-Crespo, J.; Sanchez-Pastor, S.; Padial, M.A.; Diaz-Pena, J.M.; Martin-Munoz, F.;Martin-Esteban, M. Allergy to lentils in Mediterranean pediatric patients. J. Allergy Clin. Immunol. 1999, 103,154–158. [CrossRef]
56. Martinez San Ireneo, M.; Ibanez, M.D.; Sanchez, J.J.; Carnes, J.; Fernandez-Caldas, E. Clinical features oflegume allergy in children from a Mediterranean area. Ann. Allergy Asthma. Immunol. 2008, 101, 179–184.[CrossRef]
57. Moneret-Vautrin, D.A.; Guerin, L.; Kanny, G.; Flabbee, J.; Fremont, S.; Morisset, M. Cross-allergenicity ofpeanut and lupine: The risk of lupine allergy in patients allergic to peanuts. J. Allergy Clin. Immunol. 1999,104, 883–888. [CrossRef]
57

Nutrients 2019, 11, 359
58. Fiocchi, A.; Sarratud, P.; Terracciano, L.; Vacca, E.; Bernardini, R.; Fuggetta, D.; Ballabio, C.; Duranti, M.;Magni, C.; Restani, P. Assessment of the tolerance to lupine-enriched pasta in peanut-allergic children.Clin. Exp. Allergy 2009, 39, 1045–1051. [CrossRef] [PubMed]
59. Peeters, K.A.; Koppelman, S.J.; Penninks, A.H.; Lebens, A.; Bruijnzeel-Koomen, C.A.; Hefle, S.L.; Taylor, S.L.;van Hoffen, E.; Knulst, A.C. Clinical relevance of sensitization to lupine in peanut-sensitized adults. Allergy2009, 64, 549–555. [CrossRef]
60. Patel, A.; Bahna, S.L. Hypersensitivities to sesame and other common edible seeds. Allergy 2016, 71,1405–1413. [CrossRef] [PubMed]
61. Allen, K.J.; Turner, P.J.; Pawankar, R.; Taylor, S.; Sicherer, S.; Lack, G.; Rosario, N.; Ebisawa, M.; Wong, G.;Mills, E.N.C; et al. Precautionary labelling of foods for allergen content: Are we ready for a global framework?World Allergy Organ. J. 2014, 7, 10. [CrossRef]
62. Moonesinghe, H.; Kilburn, S.; Mackenzie, H.; Venter, C.; Lee, K.; Dean, T. The prevalence of “novel” foodallergens worldwide: a systematic review. Clin. Transl. Allergy 2015, 5, 9. [CrossRef]
63. Adatia, A.; Clarke, A.E.; Yanishevsky, Y.; Ben-Shoshan, M. Sesame allergy: Current perspectives.J. Asthma. Allergy 2017, 10, 141–151. [CrossRef] [PubMed]
64. Efsa Panel on Dietetic Products NaA. Scientific Opinion on Dietary Reference Values for fats, includingsaturated fatty acids, polyunsaturated fatty acids, monounsaturated fatty acids, trans fatty acids,and cholesterol. EFSA J. 2010, 8, 1461–1568.
65. Fernandez-Rivas, M. Fruit and vegetable allergy. Chem. Immunol. Allergy 2015, 101, 162–170. [PubMed]66. Goikoetxea, M.J.; D’Amelio, C.M.; Martinez-Aranguren, R.; Gamboa, P.; Garcia, B.E.; Gomez, F.; Fernandez, J.;
Bartra, J.; Parra, A.; Alvarado, M.I.; et al. Is microarray analysis really useful and sufficient to diagnose nutallergy in the mediterranean area? J. Investig. Allergol. Clin. Immunol. 2016, 26, 31–39. [PubMed]
67. Gomez, F.; Aranda, A.; Campo, P.; Diaz-Perales, A.; Blanca-Lopez, N.; Perkins, J.; Garrido, M.; Blanca, M.;Mayorga, C.; Torres, M.J. High prevalence of lipid transfer protein sensitization in apple allergic patientswith systemic symptoms. PLoS One 2014, 9, e107304. [CrossRef] [PubMed]
68. Haroun-Diaz, E.; Azofra, J.; Gonzalez-Mancebo, E.; de Las Heras, M.; Pastor-Vargas, C.; Esteban, V.;Villalba, M.; Diaz-Perales, A.; Cuesta-Herranz, J.I. Nut allergy in two different areas of Spain: Differences inclinical and molecular pattern. Nutrients 2017, 9, 909. [CrossRef]
69. Moonesinghe, H.; Mackenzie, H.; Venter, C.; Kilburn, S.; Turner, P.; Weir, K.; Dean, T. Prevalence of fish andshellfish allergy: A systematic review. Ann. Allergy Asthma. Immunol. 2016, 117, 264–272. [CrossRef]
70. Faber, M.A.; Pascal, M.; El Kharbouchi, O.; Sabato, V.; Hagendorens, M.M.; Decuyper, I.; Bridts, C.H.;Ebo, D.G. Shellfish allergens: Tropomyosin and beyond. Allergy 2017, 72, 842–848. [CrossRef]
71. Sharp, M.F.; Lopata, A.L. Fish allergy: In review. Clin. Rev. Allergy Immunol. 2014, 46, 258–271. [CrossRef]72. Stephen, J.N.; Sharp, M.F.; Ruethers, T.; Taki, A.; Campbell, D.E.; Lopata, A.L. Allergenicity of bony and
cartilaginous fish—Molecular and immunological properties. Clin. Exp. Allergy 2017, 47, 300–312. [CrossRef][PubMed]
73. Lopata, A.L.; Lehrer, S.B. New insights into seafood allergy. Curr. Opin. Allergy Clin. Immunol. 2009, 9,270–277. [CrossRef] [PubMed]
74. Scott, P. Commins invited commentary: Alpha-gal allergy: Tip of the iceberg to a pivotal immune response.Curr. Allergy Asthma. Rep. 2016, 16, 61.
75. Mullins, R.J.; James, H.; Platts-Mills, T.A.; Commins, S. Relationship between red meat allergy andsensitization to gelatin and galactose-α-1,3-galactose. J. Allergy Clin. Immunol. 2012, 129, 1334–1342.[CrossRef] [PubMed]
76. Steinke, J.W.; Platts-Mills, T.A.; Commins, S.P. The alpha-gal story: Lessons learned from connecting thedots. J. Allergy Clin. Immunol. 2015, 135, 589–596. [CrossRef] [PubMed]
77. Meyer, R.; De Koker, C.; Dziubak, R.; Skrapac, A.K.; Godwin, H.; Reeve, K.; Chebar-Lozinsky, A.; Shah, N. Apractical approach to vitamin and mineral supplementation in food allergic children. Clin. Transl. Allergy2015, 5, 11. [CrossRef] [PubMed]
78. Flammarion, S.; Santos, C.; Guimber, D.; Jouannic, L.; Thumerelle, C.; Gottrand, F.; Deschildre, A. Diet andnutritional status of children with food allergies. Pediatr. Allergy Immunol. 2011, 22, 161–165. [CrossRef]
79. Vieira, M.C.; Morais, M.B.; Spolidoro, J.V.; Toporovski, M.S.; Cardoso, A.L.; Araujo, G.T.; Nudelman, V.;Fonseca, M.C. A survey on clinical presentation and nutritional status of infants with suspected cow’ milkallergy. BMC Pediatr. 2010, 10, 25. [CrossRef]
58

Nutrients 2019, 11, 359
80. Fleischer, D.M.; Conover-Walker, M.K.; Christie, L.; Burks, A.W.; Wood, R.A. Peanut allergy: Recurrence andits management. J. Allergy Clin. Immunol. 2004, 114, 1195–1201. [CrossRef]
81. De Swert, L.F.A.; Gadisseur, R.; Sjolander, S.; Raes, M.; Leus, J.; Van Hoeyveld, E. Secondary soy allergy inchildren with birch pollen allergy may cause both chronic and acute symptoms. Pediat. Allerg. Imm.UK 2012,23, 118–124. [CrossRef]
82. Meyer, R.M.; Vieira, M.C.; Chong, K.W.; Chatchatee, P.; Vlieg-Boerstra, B.J.; Groetch, M.; Dominguez-Ortega, G.;Heath, S.; Lang, S.; Archibald-Durham, L.; et al. International survey on growth indices and impacting factors inchildren with food allergies. J. Hum. Nutr. Diet. 2018, in press. [CrossRef] [PubMed]
83. Christie, L.; Hine, R.J.; Parker, J.G.; Burks, W. Food allergies in children affect nutrient intake and growth.J. Am. Diet. Assoc. 2002, 102, 1648–1651. [CrossRef]
84. Meyer, R.; De Koker, C.; Dziubak, R.; Godwin, H.; Dominguez-Ortega, G.; Shah, N. Dietary eliminationof children with food protein induced gastrointestinal allergy—Micronutrient adequacy with and withouta hypoallergenic formula? Clin. Transl. Allergy 2014, 4, 31. [CrossRef] [PubMed]
85. Toyran, M.; Kaymak, M.; Vezir, E.; Harmanci, K.; Kaya, A.; Ginis, T.; Kose, G.; Kocabas, C.N. Trace elementlevels in children with atopic dermatitis. J. Investig. Allergol. Clin. Immunol. 2012, 22, 341–344. [PubMed]
86. Noimark, L.; Cox, H.E. Nutritional problems related to food allergy in childhood. Pediatr. Allergy Immunol.2008, 19, 188–195. [CrossRef] [PubMed]
87. Ojuawo, A.; Lindley, K.J.; Milla, P.J. Serum zinc, selenium and copper concentration in children with allergiccolitis. East. Afr. Med. J. 1996, 73, 236–238. [PubMed]
88. Foong, R.X.; Meyer, R.; Dziubak, R.; Lozinsky, A.C.; Godwin, H.; Reeve, K.; Hussain, S.T.; Nourzaie, R.;Shah, N. Establishing the prevalence of low vitamin D in non-immunoglobulin-E mediated gastrointestinalfood allergic children in a tertiary centre. World Allergy Organ. J. 2017, 10, 4. [CrossRef]
89. Thomassen, R.A.; Kvammen, J.A.; Eskerud, M.B.; Juliusson, P.B.; Henriksen, C.; Rugtveit, J. Iodine statusand growth in 0-2-year-old infants with cow’s milk protein allergy. J. Pediatr. Gastroenterol. Nutr. 2016, 64,806–811. [CrossRef]
90. D’Auria, E.; Fabiano, V.; Bertoli, S.; Bedogni, G.; Bosetti, A.; Pendezza, E.; Sartorio, M.U.A.; Leone, A.;Spadafranca, A.; Borsani, B.; et al. Growth Pattern, resting energy expenditure, and nutrient intake ofchildren with food allergies. Nutrients 2019, 11, 212. [CrossRef]
91. Seppo, L.; Korpela, R.; Lönnerdal, B.; Metsäniitty, L.; Juntunen-Backman, K.; Klemola, T.; Paganus, A.;Vanto, T. A follow-up study of nutrient intake, nutritional status, and growth in infants with cow milkallergy fed either a soy formula or an extensively hydrolyzed whey formula. Am. J. Clin. Nutr. 2005, 82,140–145. [CrossRef]
92. BerniCanani, R.; Leone, L.; D’auria, E.; Riva, E.; Nocerino, R.; Ruotolo, S.; Terrin, G.; Cosenza, L.;Di Costanzo, M.; Passariello, A.; et al. The effects of dietary counseling on children with food allergy:A prospective, multicenter intervention study. J. Acad. Nutr. Diet. 2014, 114, 1432–1439. [CrossRef] [PubMed]
93. Goldberg, M.R.; Nachshon, L.; Sinai, T.; Epstein-Rigbi, N.; Oren, Y.; Eisenberg, E.; Katz, Y.; Elizur, A. Riskfactors for reduced bone mineral density measurements in milk-allergic patients. Pediatr. Allergy Immunol.2018, 29, 850–856. [CrossRef] [PubMed]
94. Maslin, K.; Venter, C.; Mackenzie, H.; Vlieg-boerstra, B.; Dean, T.; Sommer, I. Comparison of nutrient intakein adolescents and adults with and without food allergies. J. Hum. Nutr. Diet. 2018, 31, 209–217. [CrossRef][PubMed]
95. Giovannini, M.; D’auria, E.; Caffarelli, C.; Verduci, E.; Barberi, S.; Indinnimeo, L.; Iacono, I.D.; Martelli, A.;Riva, E.; Bernardini, R. Nutritional management and follow up of infants and children with food allergy:Italian Society of Pediatric Nutrition/Italian Society of Pediatric Allergy and Immunology Task ForcePosition Statement. Ital. J. Pediatr. 2014, 40, 1. [CrossRef] [PubMed]
96. Mandell, D.; Curtis, R.; Gold, M.; Hardie, S. Anaphylaxis: How do you live with it? Health. Soc. Work 2005,30, 325–335. [CrossRef]
97. Sommer, I.; Chisholm, V.; Mackenzie, H.; Venter, C.; Dean, T. Relationship between maternal and childbehaviors in pediatric food allergy–an exploratory study. Ann. Allergy. Asthma. Immunol. 2016, 116, 78–80.[CrossRef]
98. Komulainen, K. Parental burden in families with a young food-allergic child. Child. Care Pract. 2010, 16,287–302. [CrossRef]
59
Nutrients 2019, 11, 359
99. Fortunato, J.E.; Scheimann, A.O. Protein-energy malnutrition and feeding refusal secondary to food allergies.Clin. Pediatr. 2008, 47, 496–499. [CrossRef]
100. Mukkada, V.A.; Haas, A.; Maune, N.C.; Capocelli, K.E.; Henry, M.; Gilman, N.; Petersburg, S.; Moore, W.;Lovell, M.A.; Fleischer, D.M.; et al. Feeding dysfunction in children with eosinophilic gastrointestinaldiseases. Pediatrics 2010, 126, e672–e677. [CrossRef]
101. Rigal, N.; Reiter, F.; Morice, C.; De boissieu, D.; Dupont, C. Food allergy in the child: An exploratory studyon the impact of the elimination diet on food neophobia. Arch. Pediatr. 2005, 12, 1714–1720. [CrossRef]
102. Ng, I.E.; Turner, P.J.; Kemp, A.S.; Campbell, D.E. Parental perceptions and dietary adherence in childrenwith seafood allergy. Pediatr. Allergy Immunol. 2011, 22, 720–728. [CrossRef] [PubMed]
103. Sommer, I.; Mackenzie, H.; Venter, C.; Dean, T. An exploratory investigation of food choice behavior ofteenagers with and without food allergies. Ann. Allergy Asthma Immunol. 2014, 112, 446–452. [CrossRef][PubMed]
104. Sommer, I.; Mackenzie, H.; Venter, C.; Dean, T. Factors influencing food choices of food-allergic consumers:Findings from focus groups. Allergy 2012, 67, 1319–1322. [CrossRef]
105. Berin, M.C.; Sampson, H.A. Mucosal immunology of food allergy. Curr. Biol. 2013, 23, 389–400. [CrossRef]106. Hua, X.; Goedert, J.J.; Pu, A.; Yu, G.; Shi, J. Allergy associations with the adult fecal microbiota: Analysis of
the American Gut Project. E. Bio. Med. 2016, 3, 172–179. [CrossRef] [PubMed]107. Berni, C.R.; Sangwan, N.; Stefka, A.T.; Nocerino, R.; Paparo, L.; Aitoro, R.; Calignano, A.; Khan, A.A.;
Gilbert, J.A.; Nagler, C.R. Lactobacillus rhamnosus GG-supplemented formula expands butyrate-producingbacterial strains in food allergic infants. ISME J. 2016, 10, 742–750. [CrossRef] [PubMed]
108. Azad, M.B.; Konya, T.; Guttman, D.S.; Field, C.J.; Sears, M.R.; HayGlass, K.T.; Mandhane, P.J.; Turvey, S.E.;Subbarao, P.; Becker, A.B.; et al. CHILD Study Investigators. Infant gut microbiota and food sensitization:Associations in the first year of life. Clin. Exp. Allergy 2015, 45, 632–643. [CrossRef] [PubMed]
109. Dong, P.; Feng, J.J.; Yan, D.Y.; Lyu, Y.J.; Xu, X. Early-life gut microbiome and cow’s milk allergy—A prospective case—Control 6-month follow-up study. Saudi. J. BiolSci. 2018, 25, 875–880. [CrossRef]
110. Bunyavanich, S.; Shen, N.; Grishin, A.; Wood, R.; Burks, W.; Dawson, P.; Jones, S.M.; Leung, D.Y.M.; Sampson, H.;Sicherer, S. Early-life gut microbiome composition and milk allergy resolution. J. Allergy ClinImmunol. 2016, 138,1122–1130. [CrossRef]
111. Candy, D.C.A.; Van Ampting, M.T.J.; Oude Nijhuis, M.M.; Wopereis, H.; Butt, A.M.; Peroni, D.G.;Vandenplas, Y.; Fox, A.T.; Shah, N.; West, C.E.; et al. A synbiotic-containing amino-acid-based formulaimproves gut microbiota in non-IgE-mediated allergic infants. Pediatr. Res. 2018, 83, 677–686. [CrossRef]
112. BerniCanani, R.; Nocerino, R.; Terrin, G.; Coruzzo, A.; Cosenza, L.; Leone, L.; Troncone, R. Effectof Lactobacillus GG on tolerance acquisition in infants with cow’s milk allergy: A randomized trial.J. Allergy ClinImmunol. 2012, 129, 580–582. [CrossRef] [PubMed]
113. Ridaura, V.K.; Faith, J.J.; Rey, F.E.; Cheng, J.; Alexis, E.; Kau, A.L.; Griffin, N.W.; Lombard, V.; Henrissat, B.;Bain, J.R.; et al. Cultured gut microbiota from twins discordant for obesity modulate adiposity and metabolicphenotypes in mice. Science 2014, 341, 1241214. [CrossRef] [PubMed]
114. Bonder, M.J.; Kurilshikov, A.; Tigchelaar, E.F.; Mujagic, Z.; Imhann, F.; Vila, A.V.; Deelen, P.; Vatanen, T.;Schirmer, M.; Smeekens, S.P.; et al. The effect of host genetics on the gut microbiome. Nat. Genet. 2016, 48,1407–1412. [CrossRef] [PubMed]
115. Claesson, M.J.; Jeffery, I.B.; Conde, S.; Power, S.E.; O’Connor, E.M.; Cusack, S.; Harris, H.M.; Coakley, M.;Lakshminarayanan, B.; O’Sullivan, O.; et al. Gut microbiota composition correlates with diet and health inthe elderly. Nature 2012, 488, 178–184. [CrossRef] [PubMed]
116. Ronteltap, A.; Van trijp, H.; Berezowska, A.; Goossens, J. Nutrigenomics-based personalised nutritionaladvice: In search of a business model? Genes Nutr. 2013, 8, 153–163. [CrossRef] [PubMed]
117. Ordovas, J.M.; Ferguson, L.R.; Tai, E.S.; Mathers, J.C. Personalised nutrition and health. BMJ 2018, 361, 2173.[CrossRef] [PubMed]
118. Van ommen, B.; Van den broek, T.; De hoogh, I.; van Erk, M.; van Someren, E.; Rouhani-Rankouhi, T.;Anthony, J.C.; Hogenelst, K.; Pasman, W.; Boorsma, A.; et al. Systems biology of personalized nutrition.Nutr. Rev. 2017, 75, 579–599. [CrossRef]
119. Miller, L.M.; Cassady, D.L. The effects of nutrition knowledge on food label use. A review of the literature.Appetite 2015, 92, 207–216. [CrossRef]
60

Nutrients 2019, 11, 359
120. Bahri, R.; Custovic, A.; Korosec, P.; Tsoumani, M.; Barron, M.; Wu, J.; Sayers, R.; Weimann, A.;Ruiz-Garcia, M.; Patel, N.; et al. Mast cell activation test in the diagnosis of allergic disease and anaphylaxis.J. Allergy ClinImmunol. 2018, 142, 485–496. [CrossRef]
121. Ross, G.M.S.; Bremer, M.G.E.G.; Nielen, M.W.F. Consumer-friendly food allergen detection: Moving towardssmartphone-based immunoassays. Anal. Bioanal.Chem. 2018, 410, 5353–5371. [CrossRef]
122. Abrahams, M.; Frewer, L.J.; Bryant, E.; Stewart-Knox, B. Perceptions and experiences of early-adoptingregistered dietitians in integrating nutrigenomics into practice. Br. Food J. 2018, 120, 763–776. [CrossRef]
© 2019 by the authors. Licensee MDPI, Basel, Switzerland. This article is an open accessarticle distributed under the terms and conditions of the Creative Commons Attribution(CC BY) license (http://creativecommons.org/licenses/by/4.0/).
61

nutrients
Article
The Differences in Postprandial SerumConcentrations of Peptides That RegulateSatiety/Hunger and Metabolism after Various MealIntake, in Men with Normal vs. Excessive BMI
Edyta Adamska-Patruno 1,*, Lucyna Ostrowska 2, Joanna Goscik 1, Joanna Fiedorczuk 1,
Monika Moroz 1, Adam Kretowski 1,3 and Maria Gorska 3
1 Clinical Research Centre, Medical University of Bialystok, MC Sklodowskiej 24A, 15-276 Bialystok, Poland;[email protected] (J.G.); [email protected] (J.F.); [email protected] (M.M.);[email protected] (A.K.)
2 Department of Dietetics and Clinical Nutrition, Medical University of Bialystok, Mieszka I-go 4B,15-054 Bialystok, Poland; [email protected]
3 Department of Endocrinology, Diabetology and Internal Medicine, Medical University of Bialystok,MC Sklodowskiej 24A, 15-276 Bialystok, Poland; [email protected]
* Correspondence: [email protected]; Tel.: +48-85-8318153
Received: 25 January 2019; Accepted: 22 February 2019; Published: 26 February 2019
Abstract: The energy balance regulation may differ in lean and obese people. The purposes of ourstudy were to evaluate the hormonal response to meals with varying macronutrient content, and thedifferences depending on body weight. Methods. The crossover study included 46 men, 21–58 yearsold, normal-weight and overweight/obese. Every subject participated in two meal-challenge-testswith high-carbohydrate (HC), and normo-carbohydrate (NC) or high-fat (HF) meals. Fasting andpostprandial blood was collected for a further 240 min, to determine adiponectin, leptin and totalghrelin concentrations. Results. In normal-weight individuals after HC-meal we observed at 60minhigher adiponectin concentrations (12,554 ± 1531 vs. 8691 ± 1070 ng/mL, p = 0.01) and significantly(p < 0.05) lower total ghrelin concentrations during the first 120 min, than after HF-meal intake.Fasting and postprandial leptin levels were significantly (p < 0.05) higher in overweigh/obesemen. Leptin concentrations in normal-weight men were higher (2.72 ± 0.8 vs. 1.56 ± 0.4 ng/mL,p = 0.01) 180 min after HC-meal than after NC-meal intake. Conclusions. Our results suggest that innormal-body weight men we can expect more beneficial leptin, adiponectin, and total ghrelin responseafter HC-meal intake, whereas, in overweight/obese men, the HC-meal intake may exacerbate thefeeling of hunger, and satiety may be induced more by meals with lower carbohydrate content.
Keywords: obesity; postprandial adiponectin; postprandial leptin; postprandial total ghrelin;high-carbohydrate meal; high-fat meal
1. Introduction
Obesity is a chronic disease resulting from excess fat accumulation. Currently, adipose tissueis recognized as a major endocrine organ and many hormones, growth factors, and cytokines aresynthesized and secreted into the circulation by the cells of subcutaneous and visceral adipose tissue.These factors (called adipokines) show auto-, endo-, and paracrine activity and regulate energyhomeostasis and insulin sensitivity, inflammatory processes, glucose and lipid metabolism, bloodpressure, blood coagulation and proliferation, cell differentiation, as well as apoptosis processes [1–3].The central nervous system receives peripheral signals through numerous receptors, especially from
Nutrients 2019, 11, 493; doi:10.3390/nu11030493 www.mdpi.com/journal/nutrients62

Nutrients 2019, 11, 493
the gastrointestinal tract and adipose tissue, in response to the current energy status and in response tochanges in the body energy status [4].
Energy balance regulation also has a short-term component and includes metabolic and hormonalchanges induced by food consumption. Current studies suggest that ghrelin and leptin and theirinteractions seem to play a key role in appetite regulation. The increase of leptin hypothalamicexpression results in a decrease in ghrelin and adiponectin concentrations [5].
The main ghrelin activity is associated with hunger stimulation and stimulation of growth hormonesecretion; it also influences energy homeostasis [4]. The highest ghrelin concentrations are observed beforea meal intake. During starvation, ghrelin concentrations increase, and they are reduced 60 to 120 min aftermeal intake [6]. Ghrelin concentrations depend also on the diet energy value, and a postprandial decreaseof ghrelin levels is proportional to the meal energy value [7]. Furthermore, ghrelin concentrations dependon the content of essential nutrients in the diet—proteins, fats and carbohydrates—but their influence is notthoroughly known. It seems that after high-carbohydrate and high-protein meals, ghrelin concentrationsmay be significantly reduced, compared to the high-fat meals [8].
Adiponectin synthesis is stimulated by insulin, insulin-like growth factor and peroxisomeproliferator-activated receptor gamma (PPARγ-receptor antagonist [9]. Decreased adiponectinsynthesis and secretion are observed in both high-energy [10] and high-fat diets [11].Decreased adiponectin concentrations in peripheral blood are also observed with increased bodymass index (BMI), and it increases with body weight reduction [12].
Taking into consideration the functions of leptin, ghrelin, and adiponectin, in obese individualswe would expect higher concentrations of ghrelin and adiponectin and lower leptin levels, but thetendencies are reversed [12]. Moreover, in obesity, the metabolic and hormonal response in thepostprandial state may differ from the changes observed in subjects with normal body weight [13–17].The mechanisms of these phenomena are not completely known. People spend most of the day inthe postprandial state; therefore, meals that induce the longest possible satiety and an advantageousmetabolic response are important in both the prevention and treatment of obesity.
The aim of our study was to evaluate the hormonal changes after meals of varying carbohydrateand fat content, in men with normal body weight and in men who are overweight/obese (in cross-overstudy design).
2. Materials and Methods
This study is a part of our larger project, which is registered at www.clinicaltrials.gov asNCT03792685, and all methods have been previously described in details [13,14,17–21].
2.1. Ethics
The study protocol was approved by the local Ethics Committee (Medical University of Bialystok,Poland, R-I-002/35/2009). All aspects of the study were performed in accordance with the ethicalstandards set forth in the Declaration of Helsinki of 1975, revised in 2013. Written informed consentwas obtained from all participants prior to inclusion in the study.
2.2. Study Participants
The study included 46 men, 23 with normal body weight (N) and 23 who were overweight/obese(O/O), ranging in age between 21 and 58 years old. Excluded from the study were any subjectssuffering from glucose metabolism disorders, endocrine disorders, liver or renal failure, digestivesystem diseases, or any other diseases that could influence the study results (including people withhistory of any gastroenterological and bariatric surgeries) as well as individuals who were receivingpharmaceutical treatment (or any other products with unknown impact on metabolism). Only menwere enrolled, since the factors to be analyzed may be characteristic of sexual dimorphism. The studypopulation characteristics are presented in Table 1.
63

Nutrients 2019, 11, 493
Table 1. The study population characteristic.
Normal-weight Men Overweight/Obese Men p-Value
Group I
n 11 12Age (years) 33 ± 2 40 ± 2 0.01
BMI 23.8 ± 0.5 31.4 ± 1.5 0.0002Body fat content (%) 17.9 ± 1.0 28.6 ± 1.7 0.00003
Group II
n 12 11Age (years) 33 ± 3 36 ± 3 0.24
BMI 23.9 ± 0.2 33.7 ± 2.2 0.000001Body fat content (%) 18.6 ± 1.5 31.9 ± 2.7 0.0002
The results are presented as mean values ± SE.
2.3. Study Procedures
Based on BMI, the men were divided into two groups (N and O/O). Subsequently, participantswere randomly assigned to one of two sub-groups: Group I comprised 11 men with normal bodyweight (N1) and 12 overweight/obese men (O/O1), while Group II comprised 12 men with normalbody weight (N2) and 11 overweight/obese men (O/O2). The crossover method was used tocarry out the study. Subjects from Group I received a standardized high-carbohydrate (HC) meal(Nutridrink Fat Free, Nutricia, Poland) and an isocaloric (450 kcal) normo-carbohydrate (NC) meal(Cubitan, Nutricia, Poland). Similarly, men from Group II received the same standardized HC-meal(Nutridrink Fat Free, Nutricia, Poland) and an isocaloric (450 kcal) HF-meal (Calogen, Nutricia, Poland).Subjects received meals in random order, at 1–2 weeks intervals. Subjects were asked to avoid coffee,alcohol, and excessive physical activity at least on the day before each test and to maintain their regularlifestyle throughout the study. The meal contents are presented in Table 2.
Table 2. The energy and macronutrients composition of meals.
High-carbohydrate Meal Normo-carbohydrate Meal High-fat Meal
Energy (kcal) 450 450 450Carbohydrate (g) 100.5 51.1 4.0
Carbohydrate (% of total energy) 89.3 45.1 4.0Fat (g) 0 12.6 47.5
Fat (% of total energy) 0 25.2 96Protein (g) 12 36 0
Protein (% of total energy) 10.7 29.7 0Fiber (g) 0 0.1 0
Subjects arrived at the laboratory between 8:00 and 8:30 in the morning, after at least 12-hfasting, Each participant’s height and weight measurements and body composition analysis (usingthe bioimpedance method, InBody 220, Biospace, Korea) were carried out. A peripheral venouscatheter was placed in the elbow crook and before receiving the standardized meal, venous bloodwas collected to determine the fasting adiponectin, leptin, and total ghrelin concentrations. Then thesubjects received a randomly assigned meal (at room temperature), with a recommendation to consumeit within 10 min. Venous blood was drawn 30, 60, 120, 180, and 240 min after meal consumption todetermine postprandial adiponectin, ghrelin, and leptin levels. The blood preparation and laboratoryprocedures were in accordance with the recommendations of the laboratory kits. The concentrationswere determined using the following methods: total adiponectin—radioimmunoassay (HumanAdiponectin RIA, Millipore, USA); leptin—immunoenzymatic method (Human Leptin ELISA,BioVendor, Czech Republic); total ghrelin—radioimmunometric method (Ghrelin (total) RIA, Millipore,USA). Biochemical analyses were performed at the Laboratory of the Department of Endocrinology,Diabetology and Internal Medicine, Medical University of Bialystok, Poland.
Statistical analysis. Descriptive statistics, including mean and its standard error (SE), werecalculated for all numerical features representing concentrations of interest, which underwent further,
64

Nutrients 2019, 11, 493
consecutive steps of the analysis. The aim of the study was to evaluate whether postprandial hormonalresponses differ significantly when the types of meals and patients’ characteristic were used asa grouping factor. We stated two main null hypotheses: (1) the type of meal has no influenceon postprandial metabolic response in normal body weight and overweight/obese men (the Is ofparticipants were analyzed separately), (2) there is no statistically significant difference in postprandialhormonal response to a particular meal in normal body weight and overweight/obese men (the mealtypes were analyzed separately). The first hypothesis was verified for the following pairs of meals: HCvs. NC in Group I, and HC vs. HF in Group II. The procedure was conducted twice—for normal bodyweight and overweight/obese subjects—and, since both meals were given to the same individuals,the lack of independence was taken into consideration, resulting in the choice of statistical tests.Either one-way ANOVA (analysis of variance) or Wilcoxon signed-rank test (both for paired samples)was carried out, depending on fulfillment of the condition of the normality of the variables’ distribution,analyzed with the Shapiro–Wilk test. The second hypothesis was verified for the investigated mealtypes: HC, NC, and HF. The goal was to investigate whether there are any statistically significantdifferences in postprandial hormonal response between normal body weight and overweight/obesemen. To test the stated hypothesis we used the one-way ANOVA or Wilcoxon rank-sum test (bothfor unpaired samples)—dependently on the fulfillment of the condition of normality of the variables’distribution and the homogeneity of variances. The homogeneity of variances was verified with theLevene test. To address the issue of multiple hypothesis testing, the false discovery rate p-valueadjustment method was used [22]. For all calculations, the alpha level was set at 0.05. The areasunder the curve (AUCs) were calculated using a trapezoidal method and underwent the same analysisschema, like the rest of the features.
3. Results
The fasting and postprandial differences in adiponectin concentrations between normal bodyweight and overweight/obese individuals were not significant (Figure 1A,B). However, in subjectswith normal body weight, we noted significantly higher (p = 0.01) adiponectin concentrations 60 minafter the HC-meal than after the HF-meal intake (Figure 1B), while in overweight/obese men,we observed significantly higher (p = 0.03) adiponectin levels 120 min after the HF-meal than after theHC-meal intake.
In normal body weight participants, we observed significantly higher (p = 0.01) leptinconcentrations 180 min after HC-meal than after NC-meal intake (Figure 2A). In overweight/obesemen, although leptin concentrations before the HC-meal were significantly higher (8.44 ± 1.68 vs. 7.07± 1.51 ng/mL, p = 0.01), postprandially we did not observe any significant differences. The AUC forpostprandial leptin levels was significantly higher after the HC-meal intake than after the NC-meal(670 ± 220 vs. 391 ± 103, p = 0.04) in the N group. When we compared the postprandial leptin levelsbetween the HC and HF-meals, we found that men with normal body weight showed a tendency,which was on the margin of significance (p = 0.05), to higher leptin concentrations 240 min afterthe HC-meal intake (Figure 2B). In overweight/obese subjects, we did not observe any significantdifferences in postprandial leptin concentrations dependent on meal type. Leptin levels in O/O menwere significantly higher than in N subjects, at fasting state and during the further 4 h of all of the mealchallenge tests (Figure 2A,B).
65

Nutrients 2019, 11, 493
Figure 1. (A) Adiponectin concentrations (ng/mL) in men with normal body weight (N, the broken line)and overweight/obese people (O/O, the solid line) in fasting state (time 0 min) and after consumption(time 30–240 min) of a high carbohydrate meal (HC) and a normal carbohydrate meal (NC). The resultsare presented as mean values ± SE. * The comparison between study groups N and O/O, p < 0.05.† The comparison between meals HC and NC, p < 0.05. (B) Adiponectin concentrations (ng/mL) inmen with normal body weight (N, the broken line) and overweight/obese people (O/O, the solid line)in fasting state (time 0 min) and after consumption (time 30–240 min) of a high carbohydrate meal (HC)and a high fat meal (HF). The results are presented as mean values ± SE. * The comparison betweenstudy groups N and O/O, p < 0.05. † The comparison between meals HC and HF, p < 0.05.
Figure 2. (A) Leptin concentrations (ng/mL) in men with normal body weight (N, the broken line) andoverweight/obese people (O/O, the solid line) in fasting state (time 0 min) and after consumption(time 30–240 min) of a high carbohydrate meal (HC) and a normal carbohydrate meal (NC). The resultsare presented as mean values ± SE. * The comparison between study groups N and O/O, p < 0.05.† The comparison between meals HC and NC, p < 0.05. (B) Leptin concentrations (ng/mL) in men withnormal body weight (N, the broken line) and overweight/obese people (O/O, the solid line) in fastingstate (time 0 min) and after consumption (time 30–240 min) of a high carbohydrate meal (HC) and ahigh fat meal (HF). The results are presented as mean values ± SE. * The comparison between studygroups N and O/O *p < 0.05. † The comparison between meals HC and HF p < 0.05.
The total ghrelin concentration analysis in Group I showed that there were not any significantdifferences dependent on meal type in N and O/O men (Figure 3A). However, in Group II, we foundthat in N subjects the total ghrelin concentrations were significantly lower after the HC-meal intakethan after the HF-meal intake (Figure 3B). Lower values were observed at fasting state (744 ± 79 vs. 884± 105 ng/mL; p = 0.02) and during the first 120 min of the test (30 min: 701 ± 56 vs. 929 ± 101 ng/mL,p = 0.0005; 60 min: 637 ± 57 vs. 787 ± 82 ng/mL, p = 0.0005; 120 min: 673 ± 64 vs. 804 ± 93 ng/mL,
66

Nutrients 2019, 11, 493
p = 0.03). At 240 min the total ghrelin levels were significantly higher after the HC-meal intake thanafter the HF-meal (860 ± 92 vs. 748 ± 79 ng/mL, p = 0.03). In addition, the AUC for postprandialghrelin levels was significantly lower after the HC-meal intake than after the HF-meal (174,263 ±15,962 vs. 202,764 ± 24,214, p = 0.007) in N men. In O/O individuals we did not find any significantdifferences between total ghrelin concentrations after the HC-meal and the HF-meal intake, exceptat 240 min of the test, when total ghrelin concentrations were significantly lower after the HF-mealconsumption (774 ± 77 vs. 586 ± 52 ng/mL, p = 0.003) (Figure 3B). In Group I, we did not notice anydifferences in total ghrelin concentrations between N men and O/O men (Figure 3A). In Group II(Figure 3B) 30 min after the HF-meal intake 30 we observed lower total ghrelin levels in O/O menthan in N individuals.
Figure 3. (A) Total ghrelin concentrations (ng/mL) in men with normal body weight (N, the broken line)and overweight/obese people (O/O, the solid line) in fasting state (time 0 min) and after consumption(time 30–240 min) of a high carbohydrate meal (HC) and a normal carbohydrate meal (NC). The resultsare presented as mean values ± SE. * The comparison between study groups N and O/O, p < 0.05.† The comparison between meals HC and NC, p < 0.05. (B). Total ghrelin concentrations (ng/mL) inmen with normal body weight (N, the broken line) and overweight/obese people (O/O, the solid line)in fasting state (time 0 min) and after consumption (time 30–240 min) of a high carbohydrate meal (HC)and a high fat meal (HF). The results are presented as mean values ± SE. * The comparison betweenstudy groups N and O/O, p < 0.05. † The comparison between meals HC and HF, p < 0.05.
4. Discussion
The conducted experiment revealed the differences in postprandial adiponectin, leptin and totalghrelin response dependently on the macronutrients meal composition, and also dependently onthe body weight. In normal-weight individuals after an HC-meal, we observed higher adiponectinand lower total ghrelin concentrations, than after an HF-meal intake. After the HC-meal intake,we noted also higher leptin concentrations than after NC-meal intake, in normal body weight men.However, higher fasting and postprandial leptin levels we observed in overweight/obese individuals.Investigated hormones and adipokines are involved in energy homeostasis regulation, and play acrucial role in body fat accumulation.
Pathological amounts of adipose tissue lead to cardiovascular diseases, lipid disorders, and type2 diabetes, which are significant medical problems [3,23–25]. Due to the dynamic nature of obesity [26],it is necessary to broaden our knowledge about the physiological mechanisms involved in energybalance regulation. Hunger and satiety are regulated by the central nervous system’s receipt of centraland peripheral signals [27–29], which are influenced by environmental factors, including diet [29,30].In our study, we have observed that the postprandial levels of investigated factors depend on themeal content and may differ in N and O/O men. In N men we noted higher adiponectin levels afterthe HC-meal intake than after the HF-meal; while in O/O subjects, adiponectin concentrations were
67

Nutrients 2019, 11, 493
significantly higher after the HF-meal intake than after the HC-meal. Our results contrast with those ofsome other studies, which showed that serum levels of adiponectin are very stable and are not acutelyaffected by oral glucose or fat load [31,32], but these differences between findings may result from thedifferent nutritional composition of the standardized meals.
We did not observe any significant differences in fasting adiponectin concentrations between Nsubjects and O/O subjects, although it is generally accepted that people with obesity are characterizedby lower adiponectin concentrations [33,34]. However, it was also shown that adiponectin levelsin obese and metabolically healthy individuals are comparable with adiponectin concentrations innormal body weight individuals [35], what may explain the lack of significant differences in fastingadiponectin concentrations in our observations.
Another hormone secreted primarily by adipose tissue that is involved in the regulation of bodyenergy homeostasis is leptin. In O/O men, we noted significantly higher leptin concentrations atfasting state and throughout the meal challenge tests. The higher levels in the postprandial periodin O/O men were undoubtedly the result of higher baseline values, which may be a consequence ofpositive energy balance and leptin resistance development [36]. In the context of hunger and satietyregulation, more important are the postprandial changes in leptin levels. In Group I, we have notedsignificantly higher postprandial leptin concentrations only after the HC-meal in N subjects. We didnot observe this effect in O/O men, even if the baseline leptin levels before the HC-meal intake weresignificantly higher. Our results are inconsistent with the results of Marzullo et al. [15], who showed aslight increase in leptin concentrations in subjects with obesity for 2 h after the HC-meal consumption,whereas, in individuals with normal body weight, authors noted lower leptin concentrations than theirbaseline values. However, other researchers [16] noticed a greater increase in leptin concentrationsafter the HC-meal in women with normal body weight, compared to women who were obese, in whomleptin concentrations started to increase just 4 h after HC-meal intake, which is in line with our results.It is worth emphasizing that, in the cited study, the authors considered the HC-meal a meal in whichcarbohydrates covered 53% of the meal energy, which corresponds better to our NC-meal composition.
After the HF-meal the observations from our study differ from the results obtained by someother researchers, who observed an increase in leptin concentrations after the HF-meal in subjectswith normal body mass, whereas in obese individuals they noted a significant decrease in leptinconcentrations [37]. However, our results seem to be comparable to the results of studies conducted byMarzullo et al. [15], who showed that postprandial leptin levels in subjects with normal body weight,after HF-meal intake, remained unchanged for 2 h into the test, while in obese individuals postprandialleptin concentrations decreased. The other authors showed that, after a mixed meal intake, leptinconcentrations in people with normal body weight were reduced, and an increase was noted from 2 to8 h after the meal intake [38]. Kim S. et al. [39] noted reduced leptin levels in women after a meal inwhich carbohydrates accounted for 60% of the energy. Other authors [40] have demonstrated that inobese individuals leptin levels are reduced for the first 2 h after a mixed meal intake, and it returns tobaseline values after the next 6 to 12 h. In men with normal body weight, we have noted an increasein postprandial leptin levels only after meals that contained carbohydrates (the difference 240 minafter meal intake was on the margin of significance), and this observation seems to be consistent withthe results of Monteleone et al. [41] and Romon et al. [42], who showed that in people with normalbody weight and BMI ≤ 27 kg/m2, leptin concentrations after an HC-meal were higher than afterconsumption of the HF-meals, while leptin levels decreased. Other researchers have shown that after ahigh-fat meal intake, leptin concentrations were reduced for the first 2 h but then a significant increasewas noticed, with a maximum concentration 8 h after meal intake [43]. A study by Raben et al. [44]showed that the decrease in leptin levels is more pronounced after the HC-meal than after the HF-meal,whereas a greater increase in leptin concentrations in relation to fasting values was observed only at195 min after the HC-meal intake.
Taken together, the results of these studies are inconsistent and it seems that comparisons of leptinconcentrations between studies make sense only with similar study protocols and similar nutrient
68

Nutrients 2019, 11, 493
contents of tested meals, but also with comparable study groups, since leptin concentrations are alsodetermined by sexual dimorphism [45].
Besides leptin, which shows anorexigenic activity (decreasing appetite) [46], also ghrelin plays animportant role, and both hormones together participate in the regulation of hunger and satiety [47].Ghrelin is a gastrointestinal hormone with a well-documented orexigenic effect [48]. In our study,despite the apparently higher mean fasting total ghrelin concentrations in subjects with normal bodyweight than in overweight/obese men, these differences were not statistically significant, probably dueto a too-small study sample, which was a major limitation of our study. Other researchers [49]have shown that people with normal body weight tend to have higher ghrelin concentrations.Moreover, in our study we did not notice any important differences in total ghrelin levels betweensubjects with normal body weight and overweight/obese subjects, except one time-point, which was30 min after HF-meal intake, when in the overweight/obese men the total ghrelin level decreased,while surprisingly in the normal body weight men it increased. Our results are in line with the studyby Heinonen M. et al. [50], who in subjects with obesity and metabolic syndrome, did not observeany decrease in ghrelin levels after HC-meal intake, compared to subjects with normal body weight.An experiment conducted by Zwirska-Korczala et al. [49] showed a more pronounced decrease inghrelin concentrations after mixed meals in normal body weight subjects than in obese participants,but the study group consisted exclusively of women and different changes depending on sex cannotbe excluded. Moreover, the investigated meals differed in essential nutrient content from the mealsused in our study, and the test lasted for 120 min.
When we compared the HC-meals with the HF-meals, we found that we could expect a morebeneficial response in lean subjects after the HC-meal intake, while after the HF-meal the total ghrelinlevels tended to be even higher than at fasting state, and started to decrease at 60 min of the test.The differences were statistically significant also at baseline before meal intake, in the same studygroup, probably due to the daily variations of total ghrelin levels. Importantly, in overweight/obesemen from Group II, we have noted that ghrelin levels decreased postprandially after both meals,but the decrease was more pronounced after the HF-meal intake than after the HC-meal consumption.These results differ from those obtained by Marzullo et al. [15], who showed that the decrease inghrelin levels after an HF-meal is more pronounced in subjects with normal body weight than insubjects with obesity. It seems that the difference in results can be caused by different compositions ofthe tested meals, which contained a lower percentage of fat than meals in our study.
The major limitations of our study are the small sample size and the fact that we could not createone study group, in which all volunteers would receive all of the three investigated meals. The mainreason is that the presented study is a part of our larger project, with very long and laborious protocolprocedures, what limited the final number of volunteers who would agree to participate in the all ofthe meal challenge tests, with various meals intake. Therefore, it was needed to divide participants intotwo groups (Group I and Group II), if we aimed to compare the postprandial responses to differentmeals in the same individuals, following a crossover study design. The other limitations includeenrolling only the male participants and the liquid form of meals. These limitations were actuallyintended and allowed us to reduce the impact of possible confounding factors, such as the influencesof sex hormones and sex differences; or to decrease the time of meal digestion and absorption, to notdiscourage volunteers with a long time spent at each visit etc. However, limitations mentionedabove could affect our results, and therefore, our observations regarding the differences in personalpostprandial hormonal response dependently on BMI and meal content need further investigation.
5. Conclusions
In conclusion, our study showed that postprandial concentrations and/or changes inconcentrations of adiponectin, leptin, and total ghrelin may differ depending on current body energystatus, as well as on meal macronutrients content. Our findings suggest that in men with normalbody weight we can expect a more beneficial hormonal response after an HC-meal intake, whereas in
69

Nutrients 2019, 11, 493
overweight/obese men, more beneficial effects we have observed after meals with lower carbohydrateand higher fat content. Thus, the practical implications of our study may be the recommendation foroverweight/obese people to limit the consumption of high-carbohydrate meals, in exchange for mealsin which less than 50% of the energy value comes from carbohydrates.
Author Contributions: Conceptualization, E.A.-P., L.O., A.K. and M.G.; methodology, E.A.-P., L.O., A.K. andM.G.; statistical analysis, J.G.; investigation and data curation, E.A.-P., J.F. and M.M.; writing—original draftpreparation, E.A.-P. and L.O.; writing—review and editing, A.K. and M.G.; visualization, E.A.-P., J.F. and M.M.;supervision, A.K. and M.G.
Funding: This study was founded by the Polish Ministry of Science and Higher Education (4774/B/P01/2009/37).
Acknowledgments: The authors would like to thank the Study Team of the Clinical Research Centre andDepartment of Endocrinology, Diabetology and Internal Medicine of Medical University of Bialystok for technicalsupport. This study was supported by grants from the Medical University of Bialystok, Poland.
Conflicts of Interest: The authors declare no conflict of interest.
References
1. Frühbeck, G.; Gómez-Ambrosi, J.; Muruzábal, F.J.; Burrell, M.A. The adipocyte: A model for integration ofendocrine and metabolic signaling in energy metabolism regulation. Am. J. Physiol. Endocrinol. Metab. 2001,280, E827–E847. [CrossRef] [PubMed]
2. Rabe, K.; Lehrke, M.; Parhofer, K.G.; Broedl, U.C. Adipokines and insulin resistance. Mol. Med. 2008, 14,741–751. [CrossRef] [PubMed]
3. Mattu, H.S.; Randeva, H.S. Role of adipokines in cardiovascular disease. J. Endocrinol. 2013, 216, T17–T36.[CrossRef] [PubMed]
4. Gil-Campos, M.; Aguilera, C.M.; Cañete, R.; Gil, A. Ghrelin: A hormone regulating food intake and energyhomeostasis. Br. J. Nutr. 2016, 96, 201–226. [CrossRef]
5. Ueno, N.; Dube, M.G.; Inui, A.; Kalra, P.S.; Kalra, S.P. Leptin modulates orexigenic effects of ghrelin andattenuates adiponectin and insulin levels and selectively the dark-phase feeding as revealed by central leptingene therapy. Endocrinology 2004, 145, 4176–4184. [CrossRef] [PubMed]
6. Cummings, D.E.; Purnell, J.Q.; Frayo, R.S.; Schmidova, K.; Wisse, B.E.; Weigle, D.S. A preprandial rise inplasma ghrelin levels suggests a role in meal initiation in humans. Diabetes 2001, 50, 1714–1719. [CrossRef][PubMed]
7. Leidy, H.J.; Williams, N.I. Meal energy content is related to features of meal-related ghrelin profiles across atypical day of eating in non-obese premenopausal women. Horm. Metab. Res. 2006, 38, 317–322. [CrossRef][PubMed]
8. Williams, D.L.; Cummings, D.E. Regulation of ghrelin in physiologic and pathophysiologic states. J. Nutr.2005, 135, 1320–1325. [CrossRef] [PubMed]
9. Kadowaki, T.; Yamauchi, T. Adiponectin and adiponectin receptors. Endocr. Rev. 2005, 26, 439–451. [CrossRef][PubMed]
10. Saltiel, A.R. You are what you secrete. Nat. Med. 2001, 7, 887–888. [CrossRef] [PubMed]11. Yamauchi, T.; Kamon, J.; Waki, H.; Terauchi, Y.; Kubota, N.; Hara, K.; Mori, Y.; Ide, T.; Murakami, K.;
Tsuboyama-Kasaoka, N.; et al. The fat-derived hormone adiponectin reverses insulin resistance associatedwith both lipoatrophy and obesity. Nat. Med. 2001, 7, 941–946. [CrossRef] [PubMed]
12. Yang, W.S.; Lee, W.J.; Funahashi, T.; Tanaka, S.; Matsuzawa, Y.; Chao, C.L.; Chen, C.L.; Tai, T.Y.; Chuang, L.M.Weight reduction increases plasma levels of an adipose-derived anti-inflammatory protein, adiponectin.J. Clin. Endocrinol. Metab. 2001, 86, 3815–3819. [CrossRef] [PubMed]
13. Adamska, E.; Ostrowska, L.; Goscik, J.; Waszczeniuk, M.; Kretowski, A.; Górska, M. Intake of MealsContaining High Levels of Carbohydrates or High Levels of Unsaturated Fatty Acids Induces PostprandialDysmetabolism in Young Overweight/Obese Men. Biomed. Res. Int. 2015, 2015. [CrossRef] [PubMed]
14. Adamska-Patruno, E.; Ostrowska, L.; Goscik, J.; Pietraszewska, B.; Kretowski, A.; Gorska, M. The relationshipbetween the leptin/ghrelin ratio and meals with various macronutrient contents in men with differentnutritional status: A randomized crossover study. Nutr. J. 2018, 17, 118. [CrossRef] [PubMed]
70

Nutrients 2019, 11, 493
15. Marzullo, P.; Caumo, A.; Savia, G.; Verti, B.; Walker, G.E.; Maestrini, S.; Tagliaferri, A.; Di Blasio, A.M.;Liuzzi, A. Predictors of postabsorptive ghrelin secretion after intake of different macronutrients. J. Clin.Endocrinol. Metab. 2006, 91, 4124–4130. [CrossRef] [PubMed]
16. Romon, M.; Lebel, P.; Fruchart, J.C.; Dallongeville, J. Postprandial leptin response to carbohydrate and fatmeals in obese women. J. Am. Coll. Nutr. 2003, 22, 247–251. [CrossRef] [PubMed]
17. Adamska-Patruno, E.; Ostrowska, L.; Golonko, A.; Pietraszewska, B.; Goscik, J.; Kretowski, A.; Gorska, M.Evaluation of Energy Expenditure and Oxidation of Energy Substrates in Adult Males after Intake of Mealswith Varying Fat and Carbohydrate Content. Nutrients 2018, 10, 5. [CrossRef] [PubMed]
18. Adamska, E.; Waszczeniuk, M.; Goscik, J.; Golonko, A.; Wilk, J.; Pliszka, J.; Maliszewska, K.; Lipinska, D.;Milewski, R.; Wasilewska, A.; et al. The usefulness of glycated hemoglobin A1c (HbA1c) for identifyingdysglycemic states in individuals without previously diagnosed diabetes. Adv. Med. Sci. 2012, 57, 296–301.[CrossRef] [PubMed]
19. Adamska, E.; Kretowski, A.; Goscik, J.; Citko, A.; Bauer, W.; Waszczeniuk, M.; Maliszewska, K.;Paczkowska-Abdulsalam, M.; Niemira, M.; Szczerbinski, L.; et al. The type 2 diabetes susceptibilityTCF7L2 gene variants affect postprandial glucose and fat utilization in non-diabetic subjects. Diabetes Metab.2018, 44, 379–382. [CrossRef] [PubMed]
20. Kretowski, A.; Adamska, E.; Maliszewska, K.; Wawrusiewicz-Kurylonek, N.; Citko, A.; Goscik, J.; Bauer, W.;Wilk, J.; Golonko, A.; Waszczeniuk, M.; et al. The rs340874 PROX1 type 2 diabetes mellitus risk variantis associated with visceral fat accumulation and alterations in postprandial glucose and lipid metabolism.Genes. Nutr. 2015, 10, 454. [CrossRef] [PubMed]
21. Ostrowska, L.; Witczak, K.; Adamska, E. Effect of nutrition and atherogenic index on the occurrence andintensity of insulin resistance. Pol. Arch. Med. Wewn. 2013, 123, 289–296. [CrossRef] [PubMed]
22. Benjamini, Y.; Hochberg, Y. Controlling the false discovery rate: A practical and powerful approach tomultiple testing. J. R. Statist. Soc. Ser. B 1995, 57, 289–300. [CrossRef]
23. Trayhurn, P.; Wood, I.S. Adipokines: Inflammation and the pleiotropic role of white adipose tissue. Br. J. Nutr.2004, 92, 347–355. [CrossRef] [PubMed]
24. Lakka, H.M.; Laaksonen, D.E.; Lakka, T.A.; Niskanen, L.K.; Kumpusalo, E.; Tuomilehto, J.; Salonen, J.T.The metabolic syndrome and total and cardiovascular disease mortality in middle-aged men. JAMA 2002,288, 2709–2716. [CrossRef] [PubMed]
25. Mottillo, S.; Filion, K.B.; Genest, J.; Joseph, L.; Pilote, L.; Poirier, P.; Rinfret, S.; Schiffrin, E.L.; Eisenberg, M.J.The metabolic syndrome and cardiovascular risk a systematic review and meta-analysis. J. Am. Coll. Cardiol.2001, 56, 1113–1132. [CrossRef] [PubMed]
26. Kelly, T.; Yang, W.; Chen, C.S.; Reynolds, K.; He, J. Global burden of obesity in 2005 and projections to 2030.Int. J. Obes. 2008, 32, 1431–1437. [CrossRef] [PubMed]
27. Gross, P.M. Circumventricular organ capillaries. Prog. Brain. Res. 1992, 91, 219–233. [PubMed]28. Briggs, D.I.; Andrews, Z.B. Metabolic status regulates ghrelin function on energy homeostasis.
Neuroendocrinology 2001, 93, 48–57. [CrossRef] [PubMed]29. Anubhuti Arora, S. Role of neuropeptides in appetite regulation and obesity–A review. Neuropeptides 2006,
40, 375–401. [CrossRef] [PubMed]30. Crowell, M.D.; Decker, G.A.; Levy, R.; Jeffrey, R.; Talley, N.J. Gut-brain neuropeptides in the regulation of
ingestive behaviors and obesity. Am. J. Gastroenterol. 2006, 101, 2848–2856. [CrossRef] [PubMed]31. Peake, P.W.; Kriketos, A.D.; Denyer, G.S.; Campbell, L.V.; Charlesworth, J.A. The postprandial response of
adiponectin to a high-fat meal in normal and insulin-resistant subjects. Int. J. Obes. Relat. Metab. Disord. 2003,27, 657–662. [CrossRef] [PubMed]
32. Heliövaara, M.K.; Strandberg, T.E.; Karonen, S.L.; Ebeling, P. Association of serum adiponectin concentrationto lipid and glucose metabolism in healthy humans. Horm. Metab. Res. 2006, 38, 336–340. [CrossRef][PubMed]
33. Haluzík, M.; Parízková, J.; Haluzík, M.M. Adiponectin and its role in the obesity-induced insulin resistanceand related complications. Physiol. Res. 2004, 53, 123–129. [PubMed]
34. Lubkowska, A.; Radecka, A.; Bryczkowska, I.; Rotter, I.; Laszczynska, M.; Dudzinska, W. Serum Adiponectinand Leptin Concentrations in Relation to Body Fat Distribution, Hematological Indices and Lipid Profile inHumans. Int. J. Environ. Res. Public Health 2015, 12, 11528–11548. [CrossRef] [PubMed]
71

Nutrients 2019, 11, 493
35. Aguilar-Salinas, C.A.; García, E.G.; Robles, L.; Riaño, D.; Ruiz-Gomez, D.G.; García-Ulloa, A.C.;Melgarejo, M.A.; Zamora, M.; Guillen-Pineda, L.E.; Mehta, R.; et al. High adiponectin concentrationsare associated with the metabolically healthy obese phenotype. J. Clin. Endocrinol. Metab. 2008, 93, 4075–4079.[CrossRef] [PubMed]
36. Kolaczynski, J.W.; Ohannesian, J.P.; Considine, R.V.; Marco, C.C.; Caro, J.F. Response of leptin to short-termand prolonged overfeeding in humans. J. Clin. Endocrinol. Metab. 1996, 81, 4162–4165. [PubMed]
37. Imbeault, P.; Doucet, E.; Mauriège, P.; St-Pierre, S.; Couillard, C.; Alméras, N.; Després, J.P.; Tremblay, A.Difference in leptin response to a high-fat meal between lean and obese men. Clin. Sci. 2001, 101, 359–365.[CrossRef] [PubMed]
38. Joannic, J.L.; Oppert, J.M.; Lahlou, N.; Basdevant, A.; Auboiron, S.; Raison, J.; Bornet, F.; Guy-Grand, B.Plasma leptin and hunger ratings in healthy humans. Appetite 1998, 30, 129–138. [CrossRef] [PubMed]
39. Kim, S.J.; Lee, H.; Choue, R. Short-term effects of ratio of energy nutrients on appetite-related hormones infemale college students. Clin. Nutr. Res. 2012, 1, 58–65. [CrossRef] [PubMed]
40. Pratley, R.E.; Nicolson, M.; Bogardus, C.; Ravussin, E. Plasma leptin responses to fasting in Pima Indians.Am. J. Physiol. 1997, 273, E644–E649. [CrossRef] [PubMed]
41. Monteleone, P.; Bencivenga, R.; Longobardi, N.; Serritella, C.; Maj, M. Differential responses of circulatingghrelin to high-fat or high-carbohydrate meal in healthy women. J. Clin. Endocrinol. Metab. 2003, 88,5510–5514. [CrossRef] [PubMed]
42. Romon, M.; Lebel, P.; Velly, C.; Marecaux, N.; Fruchart, J.C.; Dallongeville, J. Leptin response to carbohydrateor fat meal and association with subsequent satiety and energy intake. Am. J. Physiol. 1999, 277, E855–E861.[CrossRef] [PubMed]
43. Dallongeville, J.; Hecquet, B.; Lebel, P.; Edmé, J.L.; Le Fur, C.; Fruchart, J.C.; Auwerx, J.; Romon, M. Short termresponse of circulating leptin to feeding and fasting in man: Influence of circadian cycle. Int. J. Obes. Relat.Metab. Disord. 1998, 22, 728–733. [CrossRef] [PubMed]
44. Raben, A.; Agerholm-Larsen, L.; Flint, A.; Holst, J.J.; Astrup, A. Meals with similar energy densities butrich in protein, fat, carbohydrate, or alcohol have different effects on energy expenditure and substratemetabolism but not on appetite and energy intake. Am. J. Clin. Nutr. 2003, 77, 91–100. [CrossRef] [PubMed]
45. Montague, C.T.; Prins, J.B.; Sanders, L.; Digby, J.E.; O’Rahilly, S. Depot- and sex-specific differences in humanleptin mRNA expression: Implications for the control of regional fat distribution. Diabetes 1997, 46, 342–347.[CrossRef] [PubMed]
46. Belgardt, B.F.; Brüning, J.C. CNS leptin and insulin action in the control of energy homeostasis. Ann. N. Y.Acad. Sci. 2010, 1212, 97–113. [CrossRef] [PubMed]
47. Konturek, P.C.; Konturek, J.W.; Czesnikiewicz-Guzik, M.; Brzozowski, T.; Sito, E.; Konturek, S.J.Neuro-hormonal control of food intake: Basic mechanisms and clinical implications. J. Physiol. Pharmacol.2005, 56, 5–25. [PubMed]
48. Huda, M.S.; Dovey, T.; Wong, S.P.; English, P.J.; Halford, J.; McCulloch, P.; Cleator, J.; Martin, B.; Cashen, J.;Hayden, K.; et al. Ghrelin restores ‘lean-type’ hunger and energy expenditure profiles in morbidly obesesubjects but has no effect on postgastrectomy subjects. Int. J. Obes. 2009, 33, 317–325. [CrossRef] [PubMed]
49. Zwirska-Korczala, K.; Konturek, S.J.; Sodowski, M.; Wylezol, M.; Kuka, D.; Sowa, P.; Adamczyk-Sowa, M.;Kukla, M.; Berdowska, A.; Rehfeld, J.F.; et al. Basal and postprandial plasma levels of PYY, ghrelin,cholecystokinin, gastrin and insulin in women with moderate and morbid obesity and metabolic syndrome.J. Physiol. Pharmacol. 2007, 58, 13–35. [PubMed]
50. Heinonen, M.V.; Karhunen, L.J.; Chabot, E.D.; Toppinen, L.K.; Juntunen, K.S.; Laaksonen, D.E.; Siloaho, M.;Liukkonen, K.H.; Herzig, K.H.; Niskanen, L.K.; et al. Plasma ghrelin levels after two high-carbohydratemeals producing different insulin responses in patients with metabolic syndrome. Regul. Pept. 2007, 138,118–125. [CrossRef] [PubMed]
© 2019 by the authors. Licensee MDPI, Basel, Switzerland. This article is an open accessarticle distributed under the terms and conditions of the Creative Commons Attribution(CC BY) license (http://creativecommons.org/licenses/by/4.0/).
72

nutrients
Article
Pretreatment Fasting Glucose and Insulin asDeterminants of Weight Loss on Diets Varying inMacronutrients and Dietary Fibers—The POUNDSLOST Study
Mads F. Hjorth 1,*, George A. Bray 2, Yishai Zohar 3, Lorien Urban 3, Derek C. Miketinas 2,4,
Donald A. Williamson 2, Donna H. Ryan 2, Jennifer Rood 2, Catherine M. Champagne 2,
Frank M. Sacks 5 and Arne Astrup 1
1 Department of Nutrition, Exercise and Sports, Faculty of Sciences, University of Copenhagen,Rolighedsvej 26, 1958 Frederiksberg, Denmark; [email protected]
2 Pennington Biomedical Research Center of the Louisiana State University System, Baton Rouge, LA 70803,USA; [email protected] (G.A.B.); [email protected] (D.C.M.); [email protected] (D.A.W.);[email protected] (D.H.R.); [email protected] (J.R.); [email protected] (C.M.C.)
3 Gelesis, Boston, MA 02116, USA; [email protected] (Y.Z.); [email protected] (L.U.)4 School of Nutrition and Food Sciences, Texas Woman’s University, Denton, TX 76204, USA5 Nutrition Department, Harvard T.H Chan School of Public Health and Department of Medicine,
Harvard Medical School, Boston, MA 02115, USA; [email protected]* Correspondence: [email protected]; Tel.: +45-353-32489
Received: 28 January 2019; Accepted: 6 March 2019; Published: 11 March 2019
Abstract: Efforts to identify a preferable diet for weight management based on macronutrientcomposition have largely failed, but recent evidence suggests that satiety effects of carbohydratesmay depend on the individual’s insulin-mediated cellular glucose uptake. Therefore, using datafrom the POUNDS LOST trial, pre-treatment fasting plasma glucose (FPG), fasting insulin (FI), andhomeostatic model assessment of insulin resistance (HOMA-IR) were studied as prognostic markersof long-term weight loss in four diets differing in carbohydrate, fat, and protein content, whileassessing the role of dietary fiber intake. Subjects with FPG <100 mg/dL lost 2.6 (95% CI 0.9;4.4,p = 0.003) kg more on the low-fat/high-protein (n = 132) compared to the low-fat/average-proteindiet (n = 136). Subjects with HOMA-IR ≥4 lost 3.6 (95% CI 0.2;7.1, p = 0.038) kg more body weight onthe high-fat/high-protein (n = 35) compared to high-fat/average-protein diet (n = 33). Regardless ofthe randomized diet, subjects with prediabetes and FI below the median lost 5.6 kg (95% CI 0.6;10.6,p = 0.030) more when consuming ≥35 g (n = 15) compared to <35 g dietary fiber/10 MJ (n = 16).Overall, subjects with normal glycemia lost most on the low-fat/high-protein diet, subjects with highHOMA-IR lost most on the high-fat/high protein diet, and subjects with prediabetes and low FI hadparticular benefit from dietary fiber in the diet.
Keywords: glucose; insulin; weight; diet; macronutrient composition; clinical nutrition
1. Introduction
During the past 30 years, there has been a great deal of controversy about the compositionof the optimal diet for weight loss and maintenance. Some have defended the more conventionallow-fat/high-carbohydrate diet [1,2], whereas others point to a restriction in carbohydrates as beingmore effective [3]. Numerous strategies for modifying carbohydrate intake have been proposed, fromketogenic very-low-carbohydrate diets [4] to diets with increased protein and a lowered glycemicindex (GI) of the carbohydrates [5]. Efforts to identify a preferable diet for weight loss and weight loss
Nutrients 2019, 11, 586; doi:10.3390/nu11030586 www.mdpi.com/journal/nutrients73

Nutrients 2019, 11, 586
maintenance based on macronutrient composition have largely failed [6], implying that no single dietis ideal for all participants with overweight and obesity [7]. On the other hand, dietary fiber is regardedas important for weight regulation [8], as diets including more fruits, vegetables and whole grains areassociated with lower body weight in randomized dietary studies [9,10], as well as in observationalstudies [8].
The glucostatic hypothesis suggests that the central nervous system monitors blood glucose aspart of the established appetite regulatory system. As eating progresses, glucose in the blood increases,leading to increased hypothalamic glucose utilization, ultimately causing the individual to becomesatiated and to stop eating [11]. Recently, the glucose uptake in the brain during a hyperglycemicclamp, simulating postprandial levels, was found to be reduced in individuals with obesity comparedto normal weight subjects and even more so in patients with type 2 diabetes [12]. Furthermore, brainglucose uptake was positively correlated with fullness and satiety [12]. Collectively, this suggests thatwhether or not a carbohydrate-rich diet, which, in the case of high glycemic index foods, would resultin rapid increases in blood glucose, should be recommended as diets for weight loss and weight lossmaintenance depends on the degree to which glucose enters the brain. Carbohydrate-rich meals may,therefore, be satiating in insulin-sensitive individuals, but less so in more insulin-resistant individuals.Individuals with prediabetes or type 2 diabetes may instead depend more on dietary fiber intaketo stimulate satiety and improve glycemic control [13], as well as other satiety hormones, such asCCK, GLP-1, and PYY, which are released mainly in response to fats and protein reaching the smallintestine [8].
Based on stratified analysis of several studies summarized in a recent review [14], it was proposedthat diets low in fat and high in protein will work best for individuals with normal fasting glucose anddiets high in dietary fibers will work particularly well among subjects with impaired fasting glucose.The POUNDS LOST study offers the opportunity to test this hypothesis, since it randomized subjectsto four diets varying in macronutrients with a minimum of 20 g of dietary fiber per day. In the mainpaper, there were no differences in weight loss between the randomized groups [15]. However, thepotential role of pretreatment fasting plasma glucose (FPG) and fasting insulin (FI) on weight lossaccording to randomized diets and dietary fiber intake was not investigated, and is the subject ofthis paper.
The purpose of this study was to analyze data from the POUNDS LOST trial [15], to investigatewhether FPG and FI are prognostic markers for long-term weight loss in four diets differing incarbohydrate, fat, and protein content, and assess the role of dietary fiber intake. We hypothesized thatnormoglycemic subjects would lose more weight on the low-fat/high-protein diet, that dietary fiberintake would be positively associated with weight loss particularly among subjects with prediabetes,and that those being most insulin resistance would lose more weight on the high-fat/high-protein diet.
2. Materials and Methods
In the original trial, 811 overweight adults were randomized to one of four energy-reduced diets(deficit of 750 kcal per day from baseline) varying in macronutrient composition for 24 months with thegoals for all groups of having at least 20 g of dietary fiber per day while recommending carbohydrateswith a low glycemic index. The nutrient goals for the four diet groups were: 20% fat, 15% protein,and 65% carbohydrates (low-fat/average-protein); 20% fat, 25% protein, and 55% carbohydrates(low-fat/high-protein); 40% fat, 15% protein, and 45% carbohydrates (high-fat/average-protein); and40% fat, 25% protein, and 35% carbohydrates (high-fat/high-protein). At baseline, FPG and FI weremeasured from which homeostatic model assessment of insulin resistance (HOMA-IR) was calculated,and participants were asked to complete a 5-day diet record. Body weight was measured at baselineand after 24 months of intervention. After 6 and 24 months, 24-h dietary recalls were collected duringtelephone interviews on 3 nonconsecutive days in a random sample of 50% of the participants. Theproportion of attended counseling sessions for weight loss during the 24 months was calculated assessions attended divided by sessions offered and split into high and low attendance using the median
74

Nutrients 2019, 11, 586
value (0.44). Among others, the presence of diabetes was a criterion for exclusion. Detailed informationabout the study has been published [15]. The study was approved by the human subjects committeeand by the data and safety monitoring board. All participants gave written informed consent. Thestudy was registered on clinicaltrials.gov with the identifier: NCT00072995.
For this re-analysis, baseline FPG levels were used to stratify subjects as being normoglycemic(FPG < 100 mg/dL) or prediabetic (FPG ≥ 100 mg/dL, NOTE: no upper limit as diabetes was a criterionfor exclusion) through the use of the FPG cutoffs published by the American Diabetes Association [16],as pre-treatment FPG was recently shown to determine weight loss and weight loss maintenancesuccess to diets varying in macronutrient composition and fiber content [14]. Furthermore, medianFI concentration among subjects with prediabetic having dietary records (13.8 μIU/mL) was used todichotomize subjects into low and high FI in accordance with previous procedures in which cut-offsranging between 10.5 and 13 μIU/mL were used [17]. Similarly, median HOMA-IR value amongsubjects with prediabetic having dietary records (4.0) was used to dichotomize subjects into low andhigh HOMA-IR. Subjects were included in the current study if they had a baseline measure of FPGand FI as well as a 24-month measurement of body weight. Dietary fiber intake during the 24 monthswas calculated as mean intake at 6 and 24 months expressed as g/10 MJ (~2400 kcal). If the 24-h recallwas missing at either 6 or 24 months, the other constituted the mean value. Furthermore, changesin dietary fiber intake (g/10 MJ) were calculated using the mean intake during the intervention bysubtracting the baseline fiber intake.
Descriptive characteristics of the study population (completers only) are presented as mean ± SDor as proportions (%) and differences between glycemic groups was tested using one-way ANOVAor Pearson’s chi-squared test. Differences in weight change between FPG and FI groups (and thecombination of the two using an interaction term) were analyzed by means of linear mixed models.The linear mixed models comprised fixed effects including age, gender, and baseline BMI and site asrandom effect. Results are shown as 24-month mean weight change from baseline with 95% confidenceinterval (CI). Differences in weight change from baseline between diets were compared within eachblood marker group through the use of pairwise comparisons with post hoc t-tests. The 24-monthweight change according to self-reported dietary fiber intake (during the intervention and as changesfrom baseline to intervention) in the overall population, as well as in selected groups based on FPGand FI groups (and the combination of the two) were reported as Pearson correlation coefficientsand partial correlation coefficients adjusting for age, gender, and baseline BMI. Finally, the differencein 24-month weight loss between participants consuming ≥35 g fiber/10 MJ and <35 g fiber/10 MJduring the intervention was compared using t-tests. The level of significance was set at P < 0.05, withno adjustment for multiple testing, and statistical analyses were conducted using STATA/SE 14.1(Houston, TX, USA).
3. Results
The 639 subjects used for these analyses included participants who were 61% women, were52 ± 9 years of age and had a BMI of 32.7 ± 3.8 kg/m2. Differences in age, BMI, weight and genderdistribution (p ≤ 0.008), but not in completion rate (p = 0.81), were observed between the FPG/FIsubgroups (Table 1). In addition, among the 317 subjects having valid dietary records, total energyintake, dietary fat and fiber intake (p ≤ 0.035), but not carbohydrate and protein intake (p ≥ 0.22),varied slightly between FPG/FI subgroups at baseline (Table 1).
75

Nutrients 2019, 11, 586
Table 1. Baseline characteristics of the completing study populations stratified by fasting glucoseand insulin.
FPG < 100mg/dL & FI <13.8 μIU/mL
FPG < 100mg/dL & FI ≥13.8 μIU/mL
FPG ≥100mg/dL & FI <13.8 μIU/mL
FPG ≥ 100mg/dL & FI ≥13.8 μIU/mL
p-Value
All (n = 639) 386 136 50 67Completion (%) 78.6 79.5 82.0 82.7 0.81Age 50.9 ± 9.4 a 52.3 ± 8.4 ab 55.0 ± 6.9 b 53.1 ± 9.7 ab 0.008Sex, % females 68.9 53.7 46.0 43.3 <0.001Body weight, kg 88.8 ± 14.6 a 100.0 ± 14.7 bc 95.3 ± 13.3 c 101.4 ± 14.4 b <0.001BMI, kg/m2 31.6 ± 3.7 a 34.5 ± 3.6 c 32.8 ± 3.8 b 34.7 ± 3.1 c <0.001Fasting glucose, mg/dL 88 (83;92) 92 (87;96) 106 (102;115) 108 (103;115)Fasting Insulin, μIU/mL 7.9 (6.1;10.5) 17.3 (15.4;21.8) 10.3 (8.3;11.9) 19.8 (16.7;26.2)HOMA-IR 1.7 (1.3;2.3) a 3.9 (3.5;4.7) b 2.8 (2.2;3.3) c 5.4 (4.6;7.1) d <0.001
Diet record subgroup (n = 317) 179 75 31 32Age 52.3 ± 9.2 53.4 ± 8.6 55.1 ± 7.1 52.1 ± 8.8 0.38Sex, % females 62.6 49.3 48.4 28.1 0.002Body weight, kg 89.3 ± 15.8 a 100.9 ± 14.3 b 95.3 ± 14.2 b 101.5 ± 14.4 b <0.001BMI, kg/m2 31.4 ± 3.8 a 34.3 ± 3.4 b 32.6 ± 3.9 a 34.7 ± 2.7 b <0.001Fasting glucose, mg/dL 88 (83;92) 93 (87;96) 106 (103;110) 110 (106;119)Fasting Insulin, μIU/mL 8.1 (6.1;10.5) 17.2 (15.7;19.8) 10.3 (8.3;11.9) 19.1 (16.5;23.3)HOMA-IR 1.7 (1.3;2.3) a 3.9 (3.5;4.5) b 2.8 (2.2;3.3) c 5.3 (4.6;6.9) d <0.001Energy intake (kcal/day) 1976 ± 494 a 2126 ± 579 b 1856 ± 630 a 2301 ± 647 b 0.002Carbohydrate (E%) 45.1 ± 7.7 44.7 ± 7.0 45.2 ± 8.4 41.9 ± 6.6 0.17Fat (E%) 36.9 ± 6.0 ab 37.9 ± 5.4 b 35.4 ± 6.9 a 39.3 ± 5.6 bc 0.035Protein (E%) 17.9 ± 3.4 17.4 ± 3.2 18.8 ± 3.8 17.6 ± 2.5 0.22Fiber intake (g/day) 18.1 ± 7.3 16.9 ± 5.4 17.6 ± 5.4 17.9 ± 5.8 0.61Fiber intake (g/10 MJ) 22.2 ± 7.7 a 19.5 ± 5.7 b 24.5 ± 10.1 a 19.1 ± 6.3 b 0.002
Abbreviations: BMI, Body mass index; E%, Energy percentage; FI, Fasting insulin; FPG, Fasting plasma glucose;HOMA-IR, Homeostatic model assessment of insulin resistance. Data are mean ± SD, median (IQR), and proportions.Tested by one-way ANOVA with different superscript letters within a row indicate significant differences (p < 0.05)or tested for overall difference by chi-square.
Overall, the low-fat/high-protein diet (n = 157) produced a 1.8 (95% CI 0.2;3.4, p = 0.03) kg greaterweight loss compared to the low-fat/average-protein diet (n = 166) (Table 2). This difference was2.6 (95% CI 0.9;4.4, p = 0.003) kg among subjects with normoglycemic and −1.4 (95% CI −5.3;2.4,p = 0.46) kg among subjects with prediabetes [mean difference: 4.1 kg (95% CI −0.1;8.3, p = 0.057)].This indicates that glycemic status modulates the effect of a low-fat, high-protein diet on weight lossover 2 years. The diet appears more effective in those with normoglycemia than prediabetes. Furthersubdividing the normoglycemia group showed that this difference was 2.9 (95% CI 0.9;4.9, p = 0.005)kg among subjects with normoglycemia and low FI, and 2.1 (95% CI −1.4;5.6, p = 0.25) kg amongsubjects with normoglycemia and high FI [mean difference: 0.8 kg (95% CI −3.3;4.8, p = 0.71).
Furthermore, subjects with high HOMA-IR lost 3.6 (95% CI 0.2;7.1, p = 0.038) kg more body weighton the high-fat/high-protein diet compared to high-fat/average-protein diet, whereas this differencewas −0.9 (95% CI −2.7;0.9, p = 0.32) kg among subjects with low HOMA-IR [mean difference: 4.5 (95%CI 0.7;8.4, p = 0.022)].
Independent of the type of diet, subjects attending at least 44 percent (median value) of thecounseling sessions lost 5.6 (95% CI 4.5;6.6, p < 0.001) kg more compared to those attending fewersessions (−6.9 vs. −1.3 kg). Among this subgroup with attendance above the median, subjects whohad high HOMA-IR lost 4.8 kg (95% CI 0.01;9.6, p = 0.049) more body weight when randomized tothe high-fat/high-protein diet compared to the high-fat/average-protein, whereas this difference was−1.1 (95% CI −3.5;1.2, p = 0.35) kg among subjects with low HOMA-IR [mean difference: 5.9 (95% CI0.6;11.3, p = 0.029)] (Table S1).
The self-reported dietary fiber intake was 9.8 (95% CI 8.7;11.0, SD 10.4, n = 317, p < 0.001) g/10 MJhigher during the intervention compared to the baseline. The fiber intake mainly came from thecarbohydrate-rich foods, so fiber intake was highest in the low-fat/average-protein diet and lowest inthe high-fat/high-protein diet and intermediate in the two remaining diets (Table 3).
76
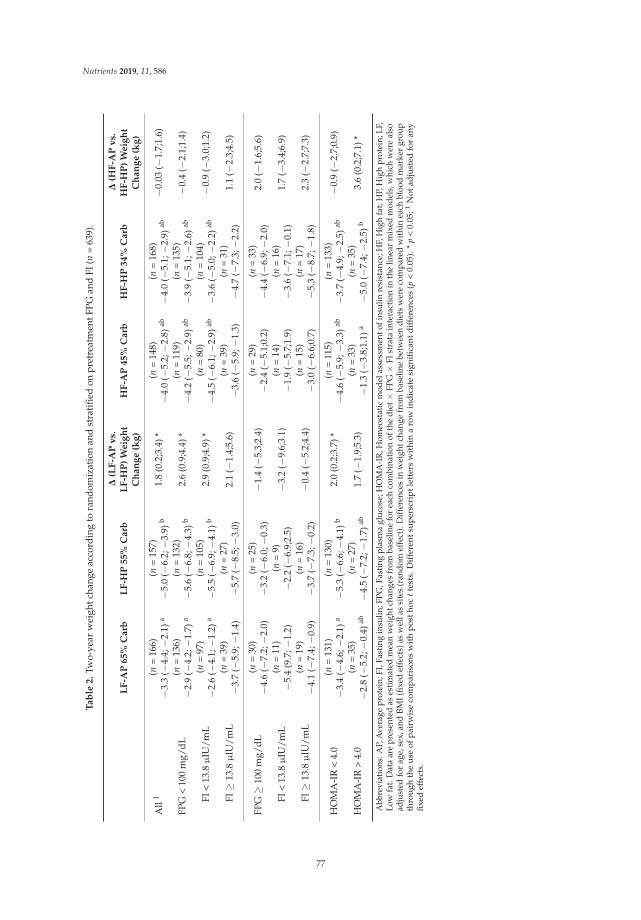
Nutrients 2019, 11, 586
Ta
ble
2.
Two-
year
wei
ghtc
hang
eac
cord
ing
tora
ndom
izat
ion
and
stra
tifie
don
pret
reat
men
tFPG
and
FI(n
=63
9).
LF
-AP
65
%C
arb
LF
-HP
55
%C
arb
Δ(L
F-A
Pv
s.L
F-H
P)
We
igh
tC
ha
ng
e(k
g)
HF
-AP
45
%C
arb
HF
-HP
34
%C
arb
Δ(H
F-A
Pv
s.H
F-H
P)
We
igh
tC
ha
ng
e(k
g)
All
1(n
=16
6)−3
.3(−
4.4;−2
.1)a
(n=
157)
−5.0
(−6.
2;−3
.9)b
1.8
(0.2
;3.4
)*(n
=14
8)−4
.0(−
5.2;−2
.8)ab
(n=
168)
−4.0
(−5.
1;−2
.9)ab
−0.0
3(−
1.7;
1.6)
FPG
<10
0m
g/dL
(n=
136)
−2.9
(−4.
2;−1
.7)a
(n=
132)
−5.6
(−6.
8;−4
.3)b
2.6
(0.9
;4.4
)*(n
=11
9)−4
.2(−
5.5;−2
.9)ab
(n=
135)
−3.9
(−5.
1;−2
.6)ab
−0.4
(−2.
1;1.
4)
FI<
13.8μ
IU/m
L(n
=97
)−2
.6(−
4.1;−1
.2)a
(n=
105)
−5.5
(−6.
9;−4
.1)b
2.9
(0.9
;4.9
)*(n
=80
)−4
.5(−
6.1;−2
.9)ab
(n=
104)
−3.6
(−5.
0;−2
.2)ab
−0.9
(−3.
0;1.
2)
FI≥
13.8μ
IU/m
L(n
=39
)−3
.7(−
5.9;−1
.4)
(n=
27)
−5.7
(−8.
5;−3
.0)
2.1
(−1.
4;5.
6)(n
=39
)−3
.6(−
5.9;−1
.3)
(n=
31)
−4.7
(−7.
3;−2
.2)
1.1
(−2.
3;4.
5)
FPG≥
100
mg/
dL(n
=30
)−4
.6(−
7.2;−2
.0)
(n=
25)
−3.2
(−6.
0;−0
.3)
−1.4
(−5.
3;2.
4)(n
=29
)−2
.4(−
5.1;
0.2)
(n=
33)
−4.4
(−6.
9;−2
.0)
2.0
(−1.
6;5.
6)
FI<
13.8μ
IU/m
L(n
=11
)−5
.4(9
.7;−
1.2)
(n=
9)−2
.2(−
6.9;
2.5)
−3.2
(−9.
6;3.
1)(n
=14
)−1
.9(−
5.7;
1.9)
(n=
16)
−3.6
(−7.
1;−0
.1)
1.7
(−3.
4;6.
9)
FI≥
13.8
μIU
/mL
(n=
19)
−4.1
(−7.
4;−0
.9)
(n=
16)
−3.7
(−7.
3;−0
.2)
−0.4
(−5.
2;4.
4)(n
=15
)−3
.0(−
6.6;
0.7)
(n=
17)
−5.3
(−8.
7;−1
.8)
2.3
(−2.
7;7.
3)
HO
MA
-IR
<4.
0(n
=13
1)−3
.4(−
4.6;−2
.1)a
(n=
130)
−5.3
(−6.
6;−4
.1)b
2.0
(0.2
;3.7
)*(n
=11
5)−4
.6(−
5.9;−3
.3)ab
(n=
133)
−3.7
(−4.
9;−2
.5)ab
−0.9
(−2.
7;0.
9)
HO
MA
-IR
>4.
0(n
=35
)−2
.8(−
5.2;−0
.4)ab
(n=
27)
−4.5
(−7.
2;−1
.7)ab
1.7
(−1.
9;5.
3)(n
=33
)−1
.3(−
3.8;
1.1)
a(n
=35
)−5
.0(−
7.4;−2
.5)b
3.6
(0.2
;7.1
)*
Abb
revi
atio
ns:A
P,A
vera
gepr
otei
n;FI
,Fas
ting
insu
lin;F
PG,F
astin
gpl
asm
agl
ucos
e;H
OM
A-I
R,H
omeo
stat
icm
odel
asse
ssm
ento
fins
ulin
resi
stan
ce;H
F,H
igh
fat;
HP,
Hig
hpr
otei
n;LF
,Lo
wfa
t.D
ata
are
pres
ente
das
estim
ated
mea
nw
eigh
tcha
nges
from
base
line
for
each
com
bina
tion
ofth
edi
et×
FPG×
FIst
rata
inte
ract
ion
inth
elin
ear
mix
edm
odel
s,w
hich
wer
eal
soad
just
edfo
rag
e,se
x,an
dBM
I(fix
edef
fect
s)as
wel
las
site
s(r
ando
mef
fect
).D
iffer
ence
sin
wei
ghtc
hang
efr
omba
selin
ebe
twee
ndi
ets
wer
eco
mpa
red
with
inea
chbl
ood
mar
ker
grou
pth
rou
ghth
eu
seof
pai
rwis
eco
mp
aris
ons
wit
hp
osth
octt
ests
.Dif
fere
ntsu
per
scri
ptl
ette
rsw
ithi
na
row
ind
icat
esi
gnifi
cant
dif
fere
nces
(p<
0.05
).*
p<
0.05
;1N
otad
just
edfo
ran
yfix
edef
fect
s.
77

Nutrients 2019, 11, 586
Table 3. Self-reported dietary fiber intake in the four randomized groups.
LF-AP65% Carb
LF-HP55% Carb
HF-AP45% Carb
HF-HP34% Carb
Fiber g/10 MJ(month 6)
n = 8036.6 ± 12.4 a
n = 7932.1 ± 10.8 b
n = 6832.1 ± 9.3 b
n = 8028.0 ± 9.9 c
Fiber g/10 MJ(month 24)
n = 4333.6 ± 12.8 a
n = 4629.1 ± 9.3 ab
n = 4128.6 ± 11.5 b
n = 3926.2 ± 10.2 b
Fiber g/10 MJ(month 6 and 24) 1
n = 8335.4 ± 11.7 a
n = 8131.4 ± 9.6 b
n = 7230.9 ± 9.2 b
n = 8127.3 ± 8.6 c
Abbreviations: AP, Average protein; Carb, Carbohydrates; HF, High fat; HP, High protein; LF, Low fat. Data aremean ± SD and tested by one-way ANOVA with different superscript letters within a row indicate significantdifferences (p < 0.05). 1 Mean dietary fiber intake from month 6 and 24. If only one measurement was present thiswas used.
Overall, differences in dietary fiber intake between baseline and intervention, as well as fiberintake during the intervention, were negatively correlated with weight change (r = −0.17 to −0.23,p ≤ 0.002). This negative correlation existed for most subgroups of FPG, FI, and HOMA-IR but wasmost pronounced among subjects with prediabetes and low FI (r = −0.45 to −0.47, p ≤ 0.011) (Table 4).This correlation remained significant (r = −0.40, p = 0.047) after additionally adjusting for fat, proteinand carbohydrate intake during the intervention.
Subjects consuming ≥35 g dietary fiber/10 MJ during the intervention lost 2.4 kg (95% CI 0.6;4.1,p = 0.008) more compared to those consuming <35 g dietary fiber/10 MJ. This difference existed formost subgroups of FPG, FI, and HOMA_IR, but was most pronounced among subjects with prediabetesand low FI [5.6 kg (95% CI 0.6;10.6, p = 0.030)] (Table 4 and Figure 1).
Figure 1. Dietary fiber intake as a function of weight change among subjects with prediabetes and lowfasting insulin. Values for fiber intake is reported as range and weight change is reported as mean(95%CI). *Analyzed using t-test. When excluding the one subject with self-reported fiber intake of60 g/10 MJ the p-value was p = 0.057.
78

Nutrients 2019, 11, 586
Ta
ble
4.
Cor
rela
tions
betw
een
self-
repo
rted
diet
ary
fiber
inta
ke(g
/10
MJ)
and
24-m
onth
wei
ghtc
hang
e(2
4-m
onth
−ba
selin
e)as
wel
las
wei
ghtc
hang
ein
grou
psof
diet
ary
fiber
inta
keac
cord
ing
toba
selin
egl
ycem
ican
din
sulin
emic
stat
us.
nC
orr
ela
tio
ns
1
(Ch
an
ge
inF
ibe
rIn
tak
e2)
Co
rre
lati
on
s1
(Fib
er
Inta
ke
du
rin
gIn
terv
en
tio
n3)
nW
eig
ht
Ch
an
ge
(kg
)[<
35
gF
ibe
r/1
0M
J3]
nW
eig
ht
Ch
an
ge
(kg
)[≥
35
gF
ibe
r/1
0M
J3]
ΔW
eig
ht
Ch
an
ge
(kg
)3
All
317
−0.2
3*/−0
.22
*−0
.17
*/−0
.18
*21
0−4
.1(−
5.1;
3.1)
107
−6.5
(−8.
0;−4
.9)
2.4
(0.6
;4.1
)*FP
G(m
g/dL
)<1
0025
4−0
.21
*/−0
.21
*−0
.15
*/−0
.15
*17
0−4
.0(−
5.1;−2
.9)
84−6
.3(−
8.1;−4
.5)
2.3
(0.3
;4.3
)*≥1
0063
−0.3
1*/−0
.27
*−0
.25
*/−0
.27
*40
−4.5
(−6.
9;−2
.0)
23−7
.1(−
10.2
;−4.
0)2.
7(−
1.3;
6.6)
FI<1
3.8
210
−0.2
8*/−0
.28
*−0
.23
*/−0
.22
*13
8−3
.3(−
4.3;−2
.3)
72−6
.0(−
7.7;−4
.3)
2.7
(0.8
;4.5
)*≥1
3.8
107
−0.1
5/−0
.15
−0.1
2/−0
.12
72−5
.6(−
7.8;−3
.5)
35−7
.5(−
10.7
;−4.
3)1.
9(−
1.9;
5.6)
FPG
&FI
<100
&<1
3.8
179
−0.2
4*/−0
.24
*−0
.17
*/−0
.16
*12
2−3
.4(−
4.5;−2
.3)
57−5
.4(−
7.3;−3
.6)
2.0
(0.0
2;4.
0)*
<100
&≥1
3.8
75−0
.15/
−0.1
7−0
.14/
−0.1
648
−5.6
(−8.
2;−2
.9)
27−8
.1(−
12.1
;−4.
1)2.
6(−
2.0;
7.2)
≥100
&<1
3.8
31−0
.47
*/−0
.47
*−0
.45
*/−0
.47
*16
−2.5
(−5.
2;0.
3)15
−8.1
(−12
.6;−
3.5)
5.6
(0.6
;10.
6)*
≥100
&≥1
3.8
32−0
.14/
−0.2
0−0
.01/
−0.0
524
−5.8
(−9.
6;−2
.0)
8−5
.4(−
9.2;−1
.6)
−0.4
(−7.
2;6.
4)H
OM
A-I
R<4
.025
1−0
.25
*/−0
.24
*−0
.19
*/−0
.19
*16
7−3
.8(−
4.9;−2
.8)
84−6
.5(−
8.2;−4
.7)
2.6
(0.7
;4.5
)*>4
.066
−0.1
7/−0
.16
−0.1
2/−0
.10
43−5
.0(−
7.8;−2
.3)
23−6
.5(−
9.7;−3
.2)
1.4
(−3.
0;5.
8)
Abb
revi
atio
n:FI
,Fas
ting
insu
lin;F
PG,F
asti
ngpl
asm
agl
ucos
e;H
OM
A-I
R,H
omeo
stat
icm
odel
asse
ssm
ento
fins
ulin
resi
stan
ce.1
Firs
tnum
ber
isPe
arso
nco
rrel
atio
nco
effic
ient
s(r
).Se
cond
num
ber
ispa
rtia
lcor
rela
tion
coef
ficie
nts
cont
rolle
dfo
rag
e,ge
nder
and
base
line
BMI.
2Ba
sed
onda
tafr
omch
ange
indi
etar
yfib
erin
take
(g/1
0M
J)(i
nter
vent
ion
–ba
selin
e).3
Base
don
data
from
diet
ary
fiber
inta
ke(g
/10
MJ)
duri
ngth
ein
terv
enti
on(n
otta
king
base
line
diet
ary
fiber
inta
kein
toco
nsid
erat
ion)
.*p
<0.
05.
79

Nutrients 2019, 11, 586
4. Discussion
As hypothesized, we found that subjects with normoglycemia lost the most body weight whenrandomized to the low-fat/high-protein diet, and that subjects with high HOMA-IR lost the moston the high-fat/high-protein diet. Furthermore, we found that participants with the highest intakeof dietary fiber lost more body weight during the 24-month dietary intervention period, which wasparticularly evident among individuals with prediabetes and having below median of FI, where a5.6 kg difference was observed among those below and above the median of fiber intake. Theseresults are in accordance with previous studies that found that participants with normal FPG loseapproximately 1 kg more during a 3–6 month period on a low fat diet [14,17,18]. Participants withimpaired fasting glucose lose approximately 4 kg more weight than participants with normal glycaemiaover 6 months when exposed to diets higher in dietary fibers [14,17,19]. Furthermore, participantswith pretreatment FPG ≥ 126 mg/dL have been found to lose approximately 2 kg more body weightafter 5 years on a Mediterranean diet compared to subjects with normoglycemia [14,20].
Satiety is a multi-factor construct that is more than just the metabolic effects of nutrients in thegut and intestine. It also includes cognitive and sensory signals generated by the sight, smell, andtaste of foods [21]. However, satiety research has typically looked at the physiological effects of foodingredients, where protein exerts satiety through gastrointestinal hormonal signaling by e.g., GLP-1and PYY, and dietary fiber (dependent of fiber type) provides satiety through increased viscosity,gelling in the stomach, replacing of energy dense foods, and fermentation in the gut are thought topositively affect satiety [13]. Recent evidence confirms the importance of fermentation of dietary fiberby the microbiota to facilitate energy homeostasis possibly through succinate and short chain fatty acidsactivating intestinal gluconeogenesis signaling to the brain by gastrointestinal nerves [22]. In addition,furthermore, different sources of dietary fiber should be matched with existing microbiota compositionof the individual in order to lower body weight [23,24] and improve glucose metabolism [25], asproposed in a recent review stratifying subjects in enterotypes [26]. Furthermore, for non-diabetics,carbohydrates are considered more satiating compared to fats, suggesting that foods should be high inproteins, carbohydrates, and dietary fibers to have the optimal effect on appetite control [21]. However,emerging evidence suggests that carbohydrates will affect satiety primarily among subjects withnormoglycemia and, to a lesser extent, among subjects with prediabetes, as less blood glucose willenter the brain (and perhaps other relevant tissues) to generate satiety signals [12]. This concept issupported by the present study, finding that a low-fat/high-protein diet is marginally better amongsubjects with normoglycemia as long as the glycemic load is keep down and fiber content kept at aminimum (recommending low GI carbohydrates and minimum 20 g/day of dietary fibers), and thata high-fat/high-protein diet is marginally better among the most insulin resistant subjects. Thesefindings support the hypothesis that people with prediabetes/insulin resistance should to a largerextent rely on satiety hormones that are released mainly in response to fats and protein [for example,cholecystokinin (CCK), glucagon-like peptide 1 (GLP-1), and peptide YY (PYY)] reaching the smallintestine dietary fat [27] and/or dietary fiber, for glycaemia control [28] and to enable weight loss andcombat weight regain [13]. Generally, higher protein intake, as assessed by urea nitrogen/creatinine,has previously been shown to produce larger weight loss after both 6 and 24 months in the presentstudy, and supports our findings that protein contents seem to be important for all phenotypes [29].
Dietary fiber was not a part of the intervention study, and we therefore used self-reported dietarydata to investigate the importance of dietary fiber in the subgroups of FPG and FI. Nevertheless, lookingat the self-reported fiber intake, it seems as if the randomized diets could have been confoundedby dietary fiber intake, as the diets with the highest amount of carbohydrate also had higher fiberintake (among the subgroup that reported their dietary intake). This was perhaps not the case forsubjects with normoglycemia as the low fat/high protein diet produced higher weight loss comparedto the low-fat/average-protein diet that contained more dietary fiber. However, among subjects withprediabetes, it seems as if dietary fiber is more important than the exact macronutrient composition ofthe diet at least when recommending low GI carbohydrates, as in the present study. This was seen
80

Nutrients 2019, 11, 586
especially among subjects with prediabetes and FI below the median, which is in good agreementwith the three studies in reference [17], but not with all studies [19]. Once the prediabetic state ismore advanced, as is likely the case for subjects with prediabetes and high FI, it seems that an adverseeffect of carbohydrates overrules the potential beneficial effect of dietary fiber intake, indicating a needto replace carbohydrates in the diet with proteins and fats. This beneficial effect of a diet higher infats and lower in carbohydrates was observed among subjects with high HOMA-IR in the presentstudy and was observed among subjects with fasting glucose ≥126 mg/dL and among type 2 diabetespatient [14,17,20,30,31].
Compliance or adherence is a general problem in long-term dietary intervention studies, asis evident from the overall weight loss and weight regain usually seen after 6 months [32]. Thesubstantial diminished adherence after the first months can also be seen in the present study as weightregain occurred after 6 months, even when being prescribed an energy-restricted diet [15]. In thepresent study, 750 kcal/day deficit diets were designed based on resting energy expenditure andactivity level at baseline. Using the prediction equation developed by Kevin Hall and colleagues [33],subjects in the present study should have lost approximately 33 kg during this 2 year period, hadthey been adherent to the energy restriction. The actual weight loss was only 4 kg among the 80%completing the study. Overall, these findings suggest that participants in weight-loss programsrevert to their customary energy intake, and most likely also macronutrient composition, over time.This lack of adherence makes it difficult to investigate predictors of weight loss from pretreatmentpersonal characteristics. Therefore, a sensitivity analysis was carried out among the half attendingthe most counseling sessions as those were expected to adhere better to the diets. Although findingthose subjects to have lost substantially more weight compared to those attending fewer sessions (asreported previously [15]) FPG, FI, and HOMA-IR were not better predictors of weight loss successon the different diets in this subgroup. Challenges with adherence to the diet were also noted in the24 month CHO-study that nevertheless found some large differences among a relatively small groupof prediabetic obese subjects [34]. Another example highlighting the importance of adherence is froma study that compared an ad libitum low-fat/medium-protein diet with a low-fat/high-protein dietfor 24 months among a group of primarily normoglycemic subjects (89% had FPG <100 mg/dL) [35].In fact, this is the same macronutrient composition found to produce marginally higher weight loss inthe present study—especially among normoglycemic subjects. The first 6 months included a strictlycontrolled dietary intervention with full provision of food from a purpose-built shop where thelow-fat/high-protein diet was found to produce a 3.5 kg (p = 0.008) greater weight loss. During thefollowing 6 months, with dietary counseling only, this difference diminished to become an insignificant1.9 kg. Finally, after an additional 12 months of follow-up, there was no difference between the diets.Therefore, food provision (or other innovative initiatives) that could increase adherence is probablythe only way to examine the true effect of different diets on health [5,10,17,19,35]. However, this isvery expensive, and cannot be sustained over prolonged periods of time. Therefore, if investigatedover a prolonged period of time, it probably needs to be a familiar and common diet in the region.An example of this could be the Mediterranean diet that in Spain was recently found to predict thebest weight loss outcome over 5 years among subjects with elevated fasting glucose at baseline [14,20].In agreement with this, the high-fat diets in the present study have previously been associated withhigher levels of dietary adherence compared to low-fat diets [36], likely because the high-fat dietsresembled the baseline/habitual diets the most.
Despite the relatively low adherence to the energy-restricted diets, the infrequent dietary reporting,and the expected day-to-day variability in fasting glucose and insulin, we found some evidence for theuse of FPG and FI as determinants of weight loss on different diets. However, evidence is still conflicted,and more research is needed. The evidence is incomplete, but it currently suggests that people withoutdiabetes but with normal fasting glucose and insulin sensitivity can achieve marginally greater successon low-fat regimens, preferably higher in protein, provided very high GLs are avoided [14,17,18,35,37].The results further suggest that people with impaired fasting glucose (especially when FI is low) should
81

Nutrients 2019, 11, 586
have their main dietary focus be the incorporation of more dietary fiber [14,17,19]. Finally, in thosewith insulin resistance, FPG ≥ 126 mg/dL, and type 2 diabetes patients could benefit from increasingprotein and fat intake at the expense of carbohydrates [14,17,20,30,31]. These different dietary patternsstill need to be compared in randomized trials where the adherence in real-life settings (behavioralsupport and cultural and social factors) should be removed to investigate the effect of the individualunderlying biology. The concepts of personalized nutrition or personalized lifestyle may drive someinnovative new research in the area of weight management.
The strengths of our study include the 2-year duration, the consistent findings for both changesand level of dietary fiber consumption during the intervention, and the post-hoc analysis of the studythat ensured a completely unbiased observation, whereby neither the investigators nor the participantsknew about the background or aim of the current re-analysis. On the other hand, the post-hoc testinginvolved a relatively large number of statistical comparisons within subgroups of the population,which increases the risk of false positives, as well as leading to an increased risk of failing to detectdifferences due to power.
5. Conclusions
This study identified modest differences in diet-specific weight loss between glycemic phenotypes,indicating that subjects with normoglycemia could benefit the most from low-fat/high-protein diets,subjects with prediabetes (and low insulin) could benefit the most from diets high in dietary fiber, andsubjects with insulin resistance (high HOMA-IR) could benefit the most from high-fat/high-proteindiets. However, these findings need to be confirmed in randomized trials with this aim as aprimary end-point.
Supplementary Materials: The following are available online at http://www.mdpi.com/2072-6643/11/3/586/s1,Table S1: Two-year weight change according to randomization and stratified on pretreatment FPG and FI amongsubjects attending at least 44% (median value) of the counseling sessions (n = 319).
Author Contributions: G.A.B., D.A.W., D.H.R., J.R., C.M.C., and F.M.S. conceived and carried out the originalexperiments. C.M.P. and D.C.M. calculated the dietary fiber intake during the intervention. M.F.H. analyzed thedata and wrote the first draft of the paper. All authors have contributed to the discussion of analyses, reviewedthe manuscript critically and approved the final manuscript.
Funding: The original study was supported by grants from the National Heart, Lung, and Blood Institute(HL073286) and the General Clinical Research Center, National Institutes of Health (RR-02635). The presentstratified analysis was supported by a grant from Gelesis, Boston, MA, USA.
Conflicts of Interest: M.F.H., Y.Z., and A.A. are co-inventers on a pending provisional patent application on theuse of biomarkers for prediction of weight-loss responses. A.A. is co-inventor of other related patents/patentapplications owned by UCPH, in accordance with Danish law. A.A. is consultant for Gelesis Inc. concerningscientific advice unrelated to the current paper. A.A. is furthermore consultant/member of advisory boardsfor Groupe Éthique et Santé, France, Nestlé Research Center, Switzerland, Weight Watchers, USA, BioCareCopenhagen, Zaluvida, Switzerland, Basic Research, USA, Novo Nordisk, Denmark, and Saniona, Denmark.M.F.H. and A.A. are co-authors of the book “Spis dig slank efter dit blodsukker” (Eat according to your bloodsugar and be slim)/Politikens Forlag, Denmark, and of other books about personalized nutrition for weight loss.A.A. is co-owner and member of the Board of the consultancy company Dentacom Aps, Denmark, and co-founderand co-owner of UCPH spin-out Mobile Fitness A/S, Flaxslim ApS. M.F.H. and A.A. are co-founder and co-ownerof UCPH spin-out Personalized Weight Management Research Consortium ApS (Gluco-diet.dk). G.B. is on theNutrition Advisory Board for Herbalife and the Scientific Advisory Board for Medifast. D.C.M. and C.M.C. andF.M.S. have no conflicts of interest.
References
1. Astrup, A.; Grunwald, G.; Melanson, E.; Saris, W.; Hill, J. The role of low-fat diets in body weight control: Ameta-analysis of ad libitum dietary intervention studies. Int. J. Obes. 2000, 24, 1545–1552. [CrossRef]
2. Hall, K.D.; Bemis, T.; Brychta, R.; Chen, K.Y.; Courville, A.; Crayner, E.J.; Goodwin, S.; Guo, J.; Howard, L.;Knuth, N.D.; et al. Calorie for Calorie, Dietary Fat Restriction Results in More Body Fat Loss thanCarbohydrate Restriction in People with Obesity. Cell Metab. 2015, 22, 427–436. [CrossRef] [PubMed]
82

Nutrients 2019, 11, 586
3. Ebbeling, C.B.; Feldman, H.A.; Klein, G.L.; Wong, J.M.W.; Bielak, L.; Steltz, S.K.; Luoto, P.K.; Wolfe, R.R.;Wong, W.W.; Ludwig, D.S. Effects of a low carbohydrate diet on energy expenditure during weight lossmaintenance: Randomized trial. BMJ 2018. [CrossRef] [PubMed]
4. Astrup, A.; Larsen, T.M.; Harper, A. Atkins and other low-carbohydrate diets: Hoax or an effective tool forweight loss? Lancet 2004, 364, 897–899. [CrossRef]
5. Larsen, T.M.; Dalskov, S.-M.; van Baak, M.; Jebb, S.A.; Papadaki, A.; Pfeiffer, A.F.H.; Martinez, J.A.;Handjieva-Darlenska, T.; Kunešová, M.; Pihlsgård, M. Diets with high or low protein content and glycemicindex for weight-loss maintenance. N. Engl. J. Med. 2010, 363, 2102–2113. [CrossRef] [PubMed]
6. Jensen, M.D.; Ryan, D.H.; Apovian, C.M.; Ard, J.D.; Comuzzie, A.G.; Donato, K.A.; Hu, F.B.; Hubbard, V.S.;Jakicic, J.M.; Kushner, R.F.; et al. 2013 AHA/ACC/TOS Guideline for the Management of Overweight andObesity in Adults. J. Am. Coll. Cardiol. 2014, 63, 2985–3023. [CrossRef] [PubMed]
7. Bray, G.A.; Heisel, W.E.; Afshin, A.; Jensen, M.D.; Dietz, W.H.; Long, M.; Kushner, R.F.; Daniels, S.R.;Wadden, T.A.; Tsai, A.G.; et al. The Science of Obesity Management: An Endocrine Society ScientificStatement. Endocr. Rev. 2018, 39, 79–132. [CrossRef] [PubMed]
8. Brownlee, I.A.; Chater, P.I.; Pearson, J.P.; Wilcox, M.D. Dietary fibre and weight loss: Where are we now?Food Hydrocoll. 2017. [CrossRef]
9. Roager, H.M.; Vogt, J.K.; Kristensen, M.; Hansen, L.B.S.; Ibrügger, S.; Mærkedahl, R.B.; Bahl, M.I.; Lind, M.V.;Nielsen, R.L.; Frøkiær, H.; et al. Whole grain-rich diet reduces body weight and systemic low-gradeinflammation without inducing major changes of the gut microbiome: A randomised cross-over trial. Gut2017. [CrossRef] [PubMed]
10. Poulsen, S.K.; Due, A.; Jordy, A.B.; Kiens, B.; Stark, K.D.; Stender, S.; Holst, C.; Astrup, A.; Larsen, T.M.Health effect of the New Nordic Diet in adults with increased waist circumference: A 6-mo randomizedcontrolled trial. Am. J. Clin. Nutr. 2014, 99, 35–45. [CrossRef] [PubMed]
11. Woods, S.C. Metabolic signals and food intake. Forty years of progress. Appetite 2013, 71, 440–444. [CrossRef][PubMed]
12. Hwang, J.J.; Jiang, L.; Hamza, M.; Sanchez Rangel, E.; Dai, F.; Belfort-DeAguiar, R.; Parikh, L.; Koo, B.B.;Rothman, D.L.; Mason, G.; et al. Blunted rise in brain glucose levels during hyperglycemia in adults withobesity and T2DM. JCI Insight 2017, 2, 95913. [CrossRef] [PubMed]
13. Slavin, J.L. Dietary fiber and body weight. Nutrition 2005, 21, 411–418. [CrossRef] [PubMed]14. Hjorth, M.F.; Zohar, Y.; Hill, J.O.; Astrup, A. Personalized Dietary Management of Overweight and Obesity
Based on Measures of Insulin and Glucose. Annu. Rev. Nutr. 2018, 38, 245–272. [CrossRef] [PubMed]15. Sacks, F.M.; Bray, G.A.; Carey, V.J.; Smith, S.R.; Ryan, D.H.; Anton, S.D.; McManus, K.; Champagne, C.M.;
Bishop, L.M.; Laranjo, N. Comparison of weight-loss diets with different compositions of fat, protein, andcarbohydrates. N. Engl. J. Med. 2009, 360, 859–873. [CrossRef] [PubMed]
16. Association, A.D. 2. Classification and Diagnosis of Diabetes. Diabetes Care 2016, 39 (Suppl. 1), S13–S22.17. Hjorth, M.F.; Ritz, C.; Blaak, E.E.; Saris, W.H.; Langin, D.; Poulsen, S.K.; Larsen, T.M.; Sørensen, T.I.; Zohar, Y.;
Astrup, A. Pretreatment fasting plasma glucose and insulin modify dietary weight loss success: Results from3 randomized clinical trials. Am. J. Clin. Nutr. 2017, 106, 499–505. [CrossRef] [PubMed]
18. Wan, Y.; Wang, F.; Yuan, J.; Li, J.; Jiang, D.; Zhang, J.; Huang, T.; Zheng, J.; Mann, J.; Li, D. Effects ofMacronutrient Distribution on Weight and Related Cardiometabolic Profile in Healthy Non-Obese Chinese:A 6-month, Randomized Controlled-Feeding Trial. EBioMedicine 2017, 22, 200–207. [CrossRef] [PubMed]
19. Hjorth, M.F.; Due, A.; Larsen, T.M.; Astrup, A. Pretreatment Fasting Plasma Glucose Modifies Dietary WeightLoss Maintenance Success: Results from a Stratified, R.C.T. Obesity 2017, 25, 2045–2048. [CrossRef] [PubMed]
20. Estruch, R.; Corella, D.; Salas-Salvado, J.; Hjorth, M.F.; Astrup, A.; Zohar, Y.; Urban, L.; Serra-Majem, L.;Lapetra, J.; Aros, F.; et al. Pretreatment fasting plasma glucose determines weight loss on high-fat diets: ThePREDIMED Study. Obesity 2017, 25, 2045–2048.
21. Chambers, L.; McCrickerd, K.; Yeomans, M.R. Optimising foods for satiety. Trends Food Sci. Technol. 2015, 41,149–160. [CrossRef]
22. de Vadder, F.; Mithieux, G. Gut-brain signaling in energy homeostasis: The unexpected role ofmicrobiota-derived succinate. J. Endocrinol. 2018, 236, R105–R108. [CrossRef] [PubMed]
83

Nutrients 2019, 11, 586
23. Hjorth, M.F.; Blædel, T.; Bendtsen, L.Q.; Lorenzen, J.K.; Holm, J.B.; Kiilerich, P.; Roager, H.M.; Kristiansen, K.;Larsen, L.H.; Astrup, A. Prevotella-to-Bacteroides ratio predicts body weight and fat loss success on 24-weekdiets varying in macronutrient composition and dietary fiber: Results from a post-hoc analysis. Int. J. Obes.2018, 43, 149–157. [CrossRef] [PubMed]
24. Hjorth, M.F.; Roager, H.M.; Larsen, T.M.; Poulsen, S.K.; Licht, T.R.; Bahl, M.I.; Zohar, Y.; Astrup, A.Pre-treatment microbial Prevotella-to-Bacteroides ratio, determines body fat loss success during a 6-monthrandomized controlled diet intervention. Int. J. Obes. 2018, 42, 580–583. [CrossRef] [PubMed]
25. Gu, Y.; Wang, X.; Li, J.; Zhang, Y.; Zhong, H.; Liu, R.; Zhang, D.; Feng, Q.; Xie, X.; Hong, J.; et al. Analyses ofgut microbiota and plasma bile acids enable stratification of patients for antidiabetic treatment. Nat. Commun.2017, 8, 1785. [CrossRef] [PubMed]
26. Christensen, L.; Roager, H.M.; Astrup, A.; Hjorth, M.F. Microbial enterotypes in personalized nutrition andobesity management. Am. J. Clin. Nutr. 2018, 108, 645–651. [CrossRef] [PubMed]
27. Belza, A.; Ritz, C.; Sørensen, M.Q.; Holst, J.J.; Rehfeld, J.F.; Astrup, A. Contribution of gastroenteropancreaticappetite hormones to protein-induced satiety. Am. J. Clin. Nutr. 2013, 97, 980–989. [CrossRef] [PubMed]
28. Goff, H.D.; Repin, N.; Fabek, H.; El Khoury, D.; Gidley, M.J. Dietary fibre for glycaemia control: Towards amechanistic understanding. Bioact. Carbohydr. Diet Fibre 2018, 14, 39–53. [CrossRef]
29. Bray, G.A.; Ryan, D.H.; Johnson, W.; Champagne, C.M.; Johnson, C.M.; Rood, J.; Williamson, D.A.; Sacks, F.M.Markers of dietary protein intake are associated with successful weight loss in the POUNDS LOST trial.Clin. Obes. 2017, 7, 166–175. [CrossRef] [PubMed]
30. Ajala, O.; English, P.; Pinkney, J. Systematic review and meta-analysis of different dietary approaches to themanagement of type 2 diabetes. Am. J. Clin. Nutr. 2013, 97, 505–516. [CrossRef] [PubMed]
31. Snorgaard, O.; Poulsen, G.M.; Andersen, H.K.; Astrup, A. Systematic review and meta-analysis of dietarycarbohydrate restriction in patients with type 2 diabetes. BMJ Open Diabetes Res. Care 2017, 5, e000354.[CrossRef] [PubMed]
32. Lean, M.E.J.; Astrup, A.; Roberts, S.B. Making progress on the global crisis of obesity and weight management.Br. Med. J. 2018, 361, k2538. [CrossRef] [PubMed]
33. Hall, K.D.; Sacks, G.; Chandramohan, D.; Chow, C.C.; Wang, Y.C.; Gortmaker, S.L.; Swinburn, B.A.Quantification of the effect of energy imbalance on bodyweight. Lancet 2011, 378, 826–837. [CrossRef]
34. Hjorth, M.F.; Astrup, A.; Zohar, Y.; Urban, L.E.; Sayer, R.D.; Patterson, B.W.; Herring, S.J.; Klein, S.; Zemel, B.S.;Foster, G.D.; et al. Personalized nutrition: Pretreatment glucose metabolism determines individual long-termweight loss responsiveness in individuals with obesity on low-carbohydrate versus low-fat diet. Int. J. Obes.2018. [CrossRef] [PubMed]
35. Due, A.; Toubro, S.; Skov, A.R.; Astrup, A. Effect of normal-fat diets, either medium or high in protein, onbody weight in overweight subjects: A randomised 1-year trial. Int. J. Obes. 2004, 28, 1283–1290. [CrossRef][PubMed]
36. Williamson, D.A.; Anton, S.D.; Han, H.; Champagne, C.M.; Allen, R.; Leblanc, E.; Ryan, D.H.; McManus, K.;Laranjo, N.; Carey, V.J.; et al. Adherence is a multi-dimensional construct in the POUNDS LOST trial.J. Behav. Med. 2010, 33, 35–46. [CrossRef] [PubMed]
37. Astrup, A.; Hjorth, M.F. Low-Fat or Low Carb for Weight Loss? It Depends on Your Glucose Metabolism.EBioMedicine 2017, 22, 20–21. [CrossRef] [PubMed]
© 2019 by the authors. Licensee MDPI, Basel, Switzerland. This article is an open accessarticle distributed under the terms and conditions of the Creative Commons Attribution(CC BY) license (http://creativecommons.org/licenses/by/4.0/).
84

nutrients
Review
A Scientific Perspective of Personalised Gene-BasedDietary Recommendations for Weight Management
Theresa Drabsch and Christina Holzapfel *
Institute for Nutritional Medicine, University Hospital Klinikum rechts der Isar, Technical University of Munich,Georg-Brauchle-Ring 62, 80992 Munich, Germany; [email protected]* Correspondence: [email protected]; Tel.: +49-89-289-249-23
Received: 31 January 2019; Accepted: 9 March 2019; Published: 14 March 2019
Abstract: Various studies showed that a “one size fits all” dietary recommendation for weightmanagement is questionable. For this reason, the focus increasingly falls on personalised nutrition.Although there is no precise and uniform definition of personalised nutrition, the inclusion of geneticvariants for personalised dietary recommendations is more and more favoured, whereas scientificevidence for gene-based dietary recommendations is rather limited. The purpose of this article is toprovide a science-based viewpoint on gene-based personalised nutrition and weight management.Most of the studies showed no clinical evidence for gene-based personalised nutrition. The Food4Mestudy, e.g., investigated four different groups of personalised dietary recommendations based ondietary guidelines, and physiological, clinical, or genetic parameters, and resulted in no difference inweight loss between the levels of personalisation. Furthermore, genetic direct-to-consumer (DTC)tests are widely spread by companies. Scientific organisations clearly point out that, to date, geneticDTC tests are without scientific evidence. To date, gene-based personalised nutrition is not yetapplicable for the treatment of obesity. Nevertheless, personalised dietary recommendations on thegenetic landscape of a person are an innovative and promising approach for the prevention andtreatment of obesity. In the future, human intervention studies are necessary to prove the clinicalevidence of gene-based dietary recommendations.
Keywords: gene-based; personalised nutrition; dietary recommendation; nutrigenetics;direct-to-consumer test; genotype; gene–diet interaction; weight loss; obesity
1. Body Weight Regulation
The regulation of body weight is of a complex nature. In addition to energy intake and expenditure,physiological parameters, feedback, and interaction systems of hormones, as well as the central nervoussystem, play a major role in body weight regulation. Signals of hunger and satiety are transmittedfrom fat tissue, muscles, and the gastrointestinal tract to brain areas. One of the satiety hormonesis leptin, which is released by the adipose tissue and regulates the neuropeptide expression in thehypothalamus [1,2]. Leptin deficiency leads to extreme obesity and presents the most popular formof monogenic obesity [3]. Another hormone of hunger and satiety is ghrelin, which is secreted inthe gastrointestinal tract after energy intake, and which is involved in glucose, lipid, and energymetabolism [4]. There are many other hormones which are involved in the regulation of hungerand satiety such as insulin, cholecystokinin, or glucagon-like peptide 1 [1,5,6]. For body weightmaintenance, a balanced energy homeostasis is necessary. Therefore, lifestyle factors leading to apositive or negative energy balance result in weight gain or loss, respectively.
2. Dietary Intervention and Weight Loss
Lifestyle changes based on increasing physical activity and reducing energy intake are the basictherapeutic approaches for weight loss and weight maintenance. It is well known that not the
Nutrients 2019, 11, 617; doi:10.3390/nu11030617 www.mdpi.com/journal/nutrients85

Nutrients 2019, 11, 617
macronutrient composition of a diet, but the energy content resulting in a negative energy balance playsthe major role for weight loss. This guarantees a higher flexibility for experts and patients in the choiceof a dietary concept in order to reach a hypocaloric diet for weight loss. Additionally, food preferencesand wishes of patients, as well as the suitability of the dietary strategy for the daily routine can be takeninto account. An evaluation of 48 studies showed that, regardless of the macronutrient composition ofa diet, the extent of weight loss was similar within six and 12 months [7]. In another study, four dietsconsisting of different macronutrient compositions were investigated. After two years, there was nosignificant difference in weight loss between the four intervention groups [8]. Another study by Shai etal. showed that weight reduction after two years was independent of the macronutrient composition ofthe diet [9]. This effect was confirmed in a study on 609 adults with a body mass index (BMI) between28 and 40 kg/m2 [10]. Gardner et al. found out that, after one year of dietary intervention, mean weightloss was not significantly different as individuals lost 6.0 kg of weight in the low-carbohydrate dietgroup and 5.3 kg of weight in the low-fat diet group [10]. A meta-analysis of 16 randomised controlledtrials including 3436 individuals suggests that a Mediterranean diet leads to a significantly higherweight loss compared to a control diet (mean difference between diet groups: −1.75 kg), especially ifdiet was energy-reduced and was associated with an increased physical activity [11]. Based on thisfinding and further studies, it might be concluded that alternative diets such as the plant-based formof the Atkins diet or the Mediterranean diet may lead to a moderate weight loss [9,12,13]. However,due to the saturation effect of protein-rich diets, an increased protein intake is also often aimed at innutritional weight loss concepts. Another aspect is the quality of fats. Studies showed that an increasedconsumption of omega-3 or omega-6 polyunsaturated fatty acids improves plasma lipid levels aswell as the risk for cardiovascular events [14,15]. In addition, new information and communicationtechnologies such as mobile applications are popular for making self-help recommendations for weightloss [16]. Due to eating preferences, as well as individual metabolic responses on dietary intake andlarge variations in weight loss success, the need of an individual nutritional recommendation insteadof a “one size fits all” is increasing. Personalised dietary recommendations are of high potentialfor an improved and more successful weight management. However, the nature and the extent ofpersonalised dietary recommendations are still unknown.
3. Individual Metabolic Response to Dietary Intervention
In the last few years, studies showed that persons individually respond to predefined mealchallenges. In the Human Metabolome (HuMet) study, 15 males were investigated for metabolicresponses to specific challenges [17]. After a fasting period of 36 h, participants underwent an oralglucose and lipid test, liquid test meals, and exercises, and they were exposed to cold. Due to deepphenotyping and the healthy nature of the participants, Krug et al. could show large variability inmetabolic responses between phenotypically similar individuals after challenges by test meals orexercise programmes [17]. Another study investigated the metabolic response to identical meals in800 participants. In this Israeli study, blood glucose levels of the participants, aged 18–70 years, wereanalysed during a standardised meal resulting likewise in a large inter-individual variability [18].The average postprandial glycaemic response (PPGR) differed largely between individuals (e.g., bread:44 ± 31 mg/dL·h (mean ± standard deviation). This inter-individual difference of glycaemic responsevalidated the fact that the same meal may lead to another or even the opposite metabolic responsewhen comparing different individuals. In a sub-study, participants were assigned to a predicted“good” or “bad” diet based on the glucose levels. The results showed that personalised dietaryinterventions can lead to improved PPGR [18]. Another study by the same research group analysedthe individual PPGR to different types of bread [19]. In that randomised cross-over trial, participantsreceived a white or sourdough-leavened bread. A large inter-individual variability in PPGR to thetwo kinds of bread was confirmed. Some subjects had a higher glycaemic response to one bread andsome to the other [19]. In a cross-over study, the metabolic response of 20 healthy male volunteersand 20 male patients with type 2 diabetes to a PhenFlex test drink or glucose drink (OGTT) was
86

Nutrients 2019, 11, 617
investigated [20]. The PhenFlex test used a drink consisting of 60 g of fat, 75 g of glucose, and 20 g ofprotein. OGTT corresponds to the commonly used drink with 75 g of glucose. A total of 132 metabolicparameters were quantified as markers for 26 different metabolic processes. The results showed asignificant difference between the two groups, indicating different phenotypic flexibility, especially inmetabolically impaired individuals [20]. The explanations for the differences in metabolic response arecomplex and widely discussed. Genetic parameters, as well as the microbiome, might play a role andare of high potential to explain a certain amount of the inter-individual metabolic differences uponmeal challenges.
4. Purpose of This Work
The purpose of this article was to provide a science-based viewpoint on gene-based personalisednutrition and weight management. This means that the scientific background of the commerciallyavailable direct-to-consumer (DTC) genetic tests was questioned. Furthermore, human interventionstudies investigating the effect of gene-based dietary recommendations on weight change aredescribed in order to present the ongoing research. This viewpoint combines different perspectives(science, clinical evidence, practical issues) and various aspects (scientific results, commerciallyavailable offers) and discusses recent issues aiming to highlight the current evidence of gene-basedpersonalised nutrition.
5. Definition of a Gene-Based Personalised Diet
To date, there is no single definition of a personalised diet. Personalised nutrition is also calledprecision or tailored nutrition [21]. Nizel et al. defined personalised nutrition with a personalconsultation of patients in order to achieve an improvement in dietary habits [22]. Subsequently,further tools were included, such as online available platforms or applications based on dietaryand behavioural habits of each patient as a kind of computer-generated personalised nutrition [23].Another concept defined as “personalised, gene-based nutrition” combines genetic information withspecific dietary recommendations. In 2013, Stewart-Knox et al. described a personalised nutrition as ahealthy dietary recommendation tailored to the health status, lifestyle, and/or the genetic informationof an individual [24]. Lifestyle data included age, gender, height, weight, and clinical facts suchas disease history, food allergies, or intolerances, as well as dietary habits and exercise behaviour.Wang and Hu included at least the microbial composition to improve dietary recommendations [25].Furthermore, personalised nutrition is directly related to nutrigenetics [26]. However, direct translationfrom a genetic profile to the phenotypic characterisation of a person is of a complex nature. Therefore,the concept of personalised dietary recommendations has to follow a multi-dimensional approachconsidering, e.g., social, lifestyle, genetic, and metabolic parameters. Different aspects of a personalisednutrition are described in Figure 1.
The major aim of a personalised nutrition, according to Daniel and Klein, should be adietary recommendation adjusted to an individual’s requirements by including, if necessary, dietaryrecommendations based on phenotype and genotype to maintain the health status and to counteractrisks for diseases or their comorbidities [27]. In a double-blinded randomised controlled trial, short-and long-term effects on dietary intake of a gene-based personalised nutrition were investigated [28].In this study, Nielsen and El-Sohemy showed that there was no significant difference in dietary intakeafter three months of intervention between the intervention group receiving information on theirgenetic background and, additionally, a corresponding gene-based dietary recommendation and thecontrol group. After 12 months, some significant improvements in dietary intake such as a reducedintake of sodium in the personalised nutrition group were observed, suggesting a long-term change indietary habits [28]. Nevertheless, the exact mechanisms and factors influencing the long-term effect ofa personalised nutrition are still unclear.
Another aspect is the psychological effect of a personalised dietary recommendation. In a survey,9381 participants from nine European countries were interviewed [29]. The questionnaire was based
87

Nutrients 2019, 11, 617
on results of an explorative analysis and data from the literature. The study showed that the greaterthe participant’s benefit of a personalised dietary recommendation is, the more positive the respectiveattitudes are and the greater the probability that such a recommendation will be accepted [29]. Theresults of this study also indicate that the provider’s presentation of the potential benefits, the efficacyof regulatory control, and the protection of consumers’ personal data are major concerns for theadoption of personalised dietary recommendations. These aspects are also in line with the Health BeliefModel [30]. This model describes that changes in health behaviour are more likely if the associatedbenefits are experienced as high, while individual burdens (“costs”) are perceived as low. Anotherpoint, suggested by Anderson, is the consideration of the social environment for personalised dietaryrecommendations to maximise the individual success and the change to healthy eating behaviour [31].The social network, e.g., contact with a partner or a group, could prevent unhealthy eating behaviourthrough regular contact, monitoring of each other’s weight change, and solving problems together.
Figure 1. Aspects of personalised nutrition.
6. Genetics and Obesity
The first studies investigating the association between a genetic background and body weightwere focused on the heritability of body weight by analysing twins or adopted children. Bouchard et al.could show that, after overfeeding, the differences in increasing body weight were higher betweentwin pairs than within one twin pair [32]. In adoption studies, the BMI of adopted children was moreassociated with the BMI of their biological parents than with the BMI of their non-biological parents [33].However, in hypothesis-driven candidate gene studies, a significant association between genetic lociand body weight was identified. The investigated genes were mainly chosen due to biologicalplausibility and had a function in regulating food intake, played a role in lipid metabolism, or wereinvolved in the excretion of intestinal hormones. For instance, the fatty-acid-binding protein 2 (FABP2)is expressed by epithelial cells of the small intestine where it is mainly related to fat absorption. Variantsin the FABP2 genetic locus lead to increased fat absorption and are associated with obesity [34,35].Another example is the peroxisome proliferator-activated receptor-gamma (PPARG) gene, which isexpressed in fat cells and, thus, plays a key role in the differentiation of adipocytes [36,37]. Deeb et al.could show that the PPARG gene is associated with BMI and insulin sensitivity [38]. In hypothesis-free,genome-wide association studies (GWAS), many genetic loci were identified for an association withbody weight [39–42]. However, only 2.7% of the variation in BMI might be explained by these geneticloci [40]. Up to now, around 500 genetic loci are described for associations with adiposity traits such
88

Nutrients 2019, 11, 617
as BMI or waist-to-hip ratio [43]. To date, the fat mass and obesity associated (FTO) locus is thegene with the strongest effect on body weight. Frayling et al. could show that carriers of two riskalleles of the single nucleotide polymorphism (SNP) rs9939609 at the FTO locus weighed up to threekilograms more than the non-risk allele carriers [44]. This finding was confirmed by Dina et al. inFrench individuals [45] but not in African Americans [46]. Scuteri et al. explained this non-significantfinding in African Americans by the ethnic-based differences of the genetic architecture of obesity.The FTO SNP rs9939609 might be quite common in Europeans but rare in African Americans [46].Claussnitzer et al. showed that the FTO SNP rs1421085 influences the expression of two proxies ofthe iroquois homeobox family, resulting in the promotion of the expression of energy-storing whiteadipocytes and in the inhibition of energy-burning beige adipocytes [47]. Therefore, weight gain maynot necessarily be the result of higher energy intake, but may be related to a reduced proportion ofenergy-burning adipocytes [47]. In addition to the FTO locus, further genetic variants at differentloci were shown to be associated with body weight. One of these is the transmembrane protein 18(TMEM18) gene. TMEM18 is expressed throughout the body and plays a role in the regulation of bodyweight, appetite, and even in the development of obesity [48,49]. Another gene on chromosome 18 isthe melanocortin-4 receptor (MC4R), whose risk allele is associated with 0.23 kg/m2 higher BMI [42].This effect might be explained by the role of MC4R in the regulation of dietary intake [50]. Moreover,a deficiency of this gene leads to the most common monogenic form of obesity [51]. However, thebiological function of most of the obesity-associated genetic loci remains unclear [43]. In the future, theidentification of rare and causal genetic variants might serve for drug development for weight loss.
7. Genetics and Weight Loss
It seems plausible that obesity-associated genetic variants are also associated with weight loss.Therefore, studies investigated the association between SNPs and weight change. In a systematicreview and meta-analysis, Xiang et al. meta-analysed 10 weight loss intervention studies [52]. In thismeta-analysis, the FTO risk allele A carriers had significantly greater weight loss than non-risk allelecarriers. However, in another systematic review and meta-analysis on the association between theFTO gene and weight loss, Livingstone et al. summarised the findings of eight randomised controlledtrials including 9563 adults [53]. Results of that meta-analysis showed that people carrying the FTOrisk allele of SNP rs9939609 achieved a similar weight loss compared to non-risk allele carriers afterdietary intervention. Livingstone et al. justified the different outcomes of the two meta-analyseswith the fact that, despite a small overlap of the included studies, the population size in the work ofLivingstone et al. was considerably larger and only randomised trials were considered for inclusion [53].This non-significant difference between risk and non-risk allele carriers is in line with an interventionstudy which investigated 26 obesity-related loci and their association with weight loss [54]. In thisrandomised controlled trial conducted in eight clinical centres in Europe, 771 adults with obesityunderwent a 10-week dietary hypocaloric intervention. There were no significant differences in weightloss when risk allele carriers were compared to non-risk allele carriers [54]. Results of the recentlypublished randomised controlled Diet Intervention Examining the Factors Interacting with TreatmentSuccess (DIETFITS) study showed again that weight reduction of 609 adults with overweight wasindependent of genotypes [10]. In addition to the non-significant findings, a pooled analysis of studiesshowed a significant positive association between the risk G allele of the mitochondrial translationalinitiation factor 3 SNP rs1885988 and weight loss [55].
8. Genetics and Dietary Intake
The regulation of food intake, selection of macronutrients, and total energy intake is very complex.Some epidemiological and intervention studies investigated associations between genetic variants anddietary intake.
A systematic review and meta-analysis analysed data from epidemiological studies whichinvestigated the association between the FTO genotype and macronutrient intake [56]. In this review,
89

Nutrients 2019, 11, 617
Livingstone et al. provided evidence for a significant association between carriers of FTO risk allelesand a reduced energy intake of around six kilocalories per day [56]. Another published systematicreview provided an overview of a wide range of genetic loci and confirmed an inconsistency of findingsconcerning the relationship between genetic variants and energy intake [57]. A recently publishedGWAS investigated the relationship between genetic loci and energy intake in 18,773 individuals ofEuropean ancestry [58]. No significant association between genetic variants of the FTO gene andenergy intake was found.
Livingstone et al. could further show a significant association between FTO risk allele carriers andan increased fat and protein intake [56]. In contrast to Livingstone et al. [56], the systematic review byDrabsch et al. [57] did not provide clear evidence of an association between FTO and carbohydrate or fatintake. This result was confirmed by Merino et al. who provided data of a large GWAS based on 91,114individuals from 24 epidemiological studies [59]. No genome-wide significance for an associationbetween the FTO SNP rs1421085 and carbohydrate or fat intake was shown. Only the associationbetween the FTO SNP rs421085 and a higher protein intake was confirmed. In addition to the FTOgenotype, further genetic loci were investigated for associations with macronutrient intake. Merino etal. identified two genetic loci, the retinoic acid receptor beta (RARB) locus and the deoxyribonucleicacid (DNA) damage regulated autophagy modulator 1 (DRAM1) locus, which showed genome-widesignificance concerning a relation to macronutrient intake. The RARB SNP rs7619139 was positivelyassociated with carbohydrate intake. Similarly, a significant association between rs77694286 at theDRAM1 locus and a higher protein intake was shown. In addition to these findings, Merino et al.confirmed that the fibroblast growth factor 21 SNP rs838133 was associated with all macronutrientintakes [59].
In addition to epidemiological findings, results from intervention studies are of interest (Table 1).In the Nutrient–Gene Interactions in Human Obesity (NUGENOB) randomised trial, 771 adults withobesity were assigned to a 10-week dietary intervention based on two different hypocaloric diets [54].A total of 42 SNPs at 26 genetic loci were examined. The results showed no significant interactionbetween genetic variants and dietary intervention on weight change [54]. This result was confirmed bythe Diet, Obesity, and Genes (DiOGenes) study [60], in which 742 participants were randomly assignedto one of five diets based on different levels of glycaemic indices. However, findings could not providesignificant evidence for 651 different SNPs and an interaction with diet on weight change [60]. In 2012,results of the randomised controlled trial Preventing Overweight Using Novel Dietary Strategies(POUNDS LOST) were published [61]. In this study, FTO risk allele carriers showed a significantlyincreased improvement in body weight change, body composition, and fat distribution comparedto carriers of the non-risk allele. However, this effect was only observed if risk allele carriers of theFTO SNP rs1558902 followed a high-protein diet [61]. In a prospective analysis of this trial, Qi et al.described that homozygous risk allele C carriers of the insulin receptor substrate 1 SNP rs2943641 hadhigher weight loss than those with the non-risk genotype in the high-carbohydrate and low-fat dietgroup [62]. Furthermore, results of the Food4Me [63] and the DIETFITS [10] study were not significant(Table 1). In conclusion, none of the selected studies presented in Table 1 could show either a significantSNP-diet interaction on weight loss or a genotype-dependent effect on weight loss.
90

Nutrients 2019, 11, 617
Ta
ble
1.
Exam
ples
ofst
udie
sin
vest
igat
ing
asso
ciat
ions
betw
een
gene
tic
vari
ants
,die
tary
inta
ke,a
ndw
eigh
tcha
nge.
Stu
dy
Inv
est
iga
ted
SN
Ps
Inte
rve
nti
on
Re
sult
Re
fere
nce
NU
GEN
OB
42SN
Psat
26ge
neti
clo
ci
Ten-
wee
kdi
etar
yin
terv
enti
onba
sed
ontw
ohy
poca
lori
cdi
ets
of60
0kc
al/d
each
and
perc
enta
geof
ener
gyde
rive
dfr
omfa
tof
20–2
5%(l
owfa
t)or
40–4
5%(h
igh
fat)
No
SNP–
diet
inte
ract
ion
onw
eigh
tch
ange
Sore
nsen
etal
.(20
06)[
54]
DiO
Gen
es65
1SN
Psat
69ge
neti
clo
ci
Five
diff
eren
tad
libit
umdi
ets
cons
isti
ngof
diff
eren
tgly
caem
icin
dice
s(G
I)an
dco
nten
tsof
diet
ary
prot
ein
(P):
low
P/lo
wG
Ivs.
low
P/hi
ghG
Ivs.
high
P/.o
wG
Ivs.
high
P/hi
ghG
Ivs.
cont
rold
iet
No
SNP–
diet
inte
ract
ion
onw
eigh
tch
ange
Lars
enet
al.(
2012
)[60
]
Food
4Me
5SN
Psat
5ge
neti
clo
ci(F
TO,
FAD
S1,T
CF7
L2,A
poE(
e4),
MTH
FR)
Four
diff
eren
tdie
tgro
ups:
(1)N
on-p
erso
nalis
eddi
etar
yre
com
men
dati
on(2
)Per
sona
lised
diet
ary
advi
ceba
sed
ondi
etar
yha
bit
(3)P
erso
nalis
eddi
etar
yad
vice
base
don
diet
ary
habi
tand
phen
otyp
icda
ta(4
)Per
sona
lised
diet
ary
advi
ceba
sed
ondi
etar
yha
bit,
phen
otyp
ican
dge
noty
pic
data
No
sign
ifica
ntdi
ffer
ence
ofw
eigh
tch
ange
betw
een
risk
and
non-
risk
alle
leca
rrie
rs;l
evel
ofpe
rson
aldi
etar
yad
vice
had
noef
fect
onw
eigh
tcha
nge
Cel
is-M
oral
eset
al.(
2015
)[6
3]
DIE
TFIT
S3
SNPs
at3
gene
tic
loci
(PPA
RG
,AD
RB2
,FA
BP2)
Low
-fat
diet
ora
low
-car
bohy
drat
edi
etSi
mila
rw
eigh
tcha
nge
betw
een
grou
psin
depe
nden
tofg
enet
icpa
tter
nG
ardn
eret
al.(
2018
)[10
]
Exam
ples
for
stud
ies
inve
stig
atin
gas
soci
atio
nsbe
twee
nge
neti
cva
rian
ts,d
ieta
ryin
take
and
wei
ghtc
hang
e.A
DR
B2,a
dren
orec
epto
rbe
ta2;
Apo
E(e4
),ap
olip
opro
tein
E(e
4);D
IETF
ITS,
the
Die
tInt
erve
ntio
nE
xam
inin
gth
eFa
ctor
sIn
tera
ctin
gw
ith
Trea
tmen
tSu
cces
sra
ndom
ised
clin
ical
tria
l;D
iOG
enes
,the
Die
t,O
besi
ty,a
ndG
enes
stu
dy;
FABP
2,fa
tty-
acid
-bin
din
gp
rote
in2;
FAD
S1,f
atty
-aci
dd
esat
ura
se1;
FTO
,fat
mas
san
dob
esit
yas
soci
ated
;MT
HFR
,met
hyle
nete
trah
ydro
fola
tere
du
ctas
e;N
UG
EN
OB
,Nu
trie
nt–G
ene
Inte
ract
ions
inH
um
anO
besi
ty:I
mpl
icat
ions
for
Die
tary
Gui
delin
es;P
PAR
G,p
erox
isom
epr
olif
erat
or-a
ctiv
ated
rece
ptor
-gam
ma;
SNP,
sing
lenu
cleo
tide
poly
mor
phis
m;T
CF7
L2,t
rans
crip
tion
fact
or7
like
2.
91

Nutrients 2019, 11, 617
9. Direct-to-Consumer Tests
Gene-based dietary recommendations represent potential for commercial purposes. A number ofcompanies already offer so-called DTC genetic tests (Table 2). The given dietary recommendation isbased on the customer’s DNA sample. The genetic profile, which is determined by the commercialproviders, is mainly based on gene variants, which were investigated in candidate gene studies and forwhich associations with metabolic functions or certain disease risks are known (Table 2). One examplemight be the PPARG locus, which is associated with insulin sensitivity and body weight [38].
In general, a DTC test is defined as genetic test which is purchased directly by the consumermostly via the internet [64]. In this case, genetic tests typically use saliva samples. Some companiesonly investigate one single genetic variant, while other DTC genetic test companies analyse severalhundred SNPs [64]. The general pattern according to which these companies proceed is shown inFigure 2. After registration (online profile), the customer receives a box with tools, with which thegenotype of each individual can be analysed using saliva samples. Based on the customer’s profile andthe genetic background, the company provides a personalised dietary recommendation. Subsequently,customers receive their specific results of the genetic test, as well as the dietary recommendation byemail or by downloading the material in the online account on the company’s website. In some cases,customers also receive a proposal for supplements that they can purchase directly from the companyand that support the compliance of the gene-based dietary recommendations. The costs of a geneticDTC test vary largely between companies. In Table 2 some companies and their concepts are listed.
Figure 2. Schematic workflow of a commercially available gene-based dietary recommendation. DNA,deoxyribonucleic acid.
Studies investigated the effect of commercially available gene-based dietary recommendationson weight loss. In a prospective study sponsored by a company providing genetic DTC tests,51 individuals with overweight or obesity were randomly assigned to a nutrigenetic guided dietor a standard control diet [65]. Focusing on the number of participants who lost 5% of body weight ateight or 24 weeks, there was no significant difference between the two diet groups [65]. This study waslimited by a small sample size and a short duration. Another study using a commercially availablegenetic test also had several methodological limitations [66].
92

Nutrients 2019, 11, 617
Ta
ble
2.
Exam
ples
ofco
mpa
nies
offe
ring
gene
-bas
eddi
etar
yre
com
men
dati
ons
for
wei
ghtl
oss.
Co
mp
an
yG
en
eti
cA
pp
roa
chD
ieta
ryR
eco
mm
en
da
tio
nB
ase
do
nH
om
ep
ag
e
Path
way
Gen
omic
s
SNPs
atge
neti
clo
cisu
chas
AD
IPO
Q(r
s173
0053
9,rs
1736
6568
),A
POA
2(r
s508
2),
FAD
S1(r
s174
547)
,FTO
(rs9
9396
09,r
s112
1980
),M
C4R
(rs1
7782
313)
,PPA
RG
(rs1
8012
82)
Gen
etic
profi
lem
atch
edto
alo
w-f
at,
low
-car
bohy
drat
e,M
edit
erra
nean
orba
lanc
eddi
et,i
nclu
ding
gene
tic
risk
sfo
rm
etab
olic
heal
thfa
ctor
s(e
.g.,
bloo
dsu
gar,
lipid
s)
http
s://
ww
w.p
athw
ay.c
om
Thin
ner
Gen
eSN
Psat
gene
ticlo
cisu
chas
FTO
,PPA
RG
,PLI
N,
AD
RB2
,AD
IPO
Q,F
ABP
2,PP
AR
G,I
RS1
,A
POA
2/5,
TCF7
L2
Gen
etic
profi
lean
dse
nsit
ivit
yfo
rca
rboh
ydra
tes,
fats
,and
prot
eins
mat
ched
with
heal
thy
food
and
fatc
ontr
olht
tp:/
/ww
w.th
inne
rgen
e.co
m
Gen
etic
Bala
nce
SNPs
atge
neti
clo
cias
soci
ated
wit
hfa
tand
carb
ohyd
rate
met
abol
ism
Gen
etic
mak
e-up
mat
ched
togo
odor
bad
burn
ing
ofca
rboh
ydra
tes
orfa
tsht
tps:
//w
ww
.gen
etic
-bal
ance
.com
Body
key
byN
UTR
ILIT
E
SNPs
atge
neti
clo
cisu
chas
FABP
2(r
s179
9883
),PP
AR
G(r
s180
1282
),A
DR
B2(r
s104
2713
),A
DR
B2(r
s104
2714
),A
DR
B3(r
s499
4)
Gen
etic
profi
lem
atch
edto
diet
sw
ith
diff
eren
tm
acro
nutr
ient
com
posi
tion
sht
tps:
//w
ww
.bod
ykey
.at
Nut
rige
nes
100
SNPs
atge
neti
clo
cisu
chas
FAD
S1G
enet
icpr
edis
posi
tion
tofo
odan
dnu
trie
ntne
eds,
into
lera
nces
and
sens
itiv
itie
sht
tp:/
/ww
w.n
utri
gene
s.ch
My
Kir
éeEi
ghtg
enet
iclo
cias
soci
ated
wit
hbo
dyw
eigh
tG
enet
icpr
ofile
for
fato
rca
rboh
ydra
tese
nsit
ivit
y,in
clud
ing
supp
lem
enta
tion
wit
hfa
tan
dca
rboh
ydra
tebl
ocke
rsht
tps:
//m
y-ki
ree.
com
All
hom
epag
esw
ere
visi
ted
on25
thJa
nuar
y20
19.A
DIP
OQ
,ad
ipon
ecti
n,C
1Q,a
ndco
llage
nd
omai
nco
ntai
ning
;AD
RB2
/3,a
dre
noce
ptor
beta
2/3;
APO
A2/
5,ap
olip
opro
tein
A2/
5;FA
BP
2,fa
tty-
acid
-bin
din
gp
rote
in2;
FAD
S1,f
atty
-aci
dd
esat
ura
se1;
FTO
,fat
mas
san
dob
esit
yas
soci
ated
;IR
S1,i
nsu
linre
cep
tor
subs
trat
e1;
LIP
C,l
ipas
eC
,hep
atic
typ
e;M
C4R
,m
elan
ocor
tin
4re
cept
or;P
LIN
,per
ilipi
n1;
PPA
RG
,per
oxis
ome
prol
ifer
ator
-act
ivat
edre
cept
or-g
amm
a;TC
F7L2
,tra
nscr
ipti
onfa
ctor
7lik
e2.
93

Nutrients 2019, 11, 617
In addition to the genetic profile, some companies also include other aspects of human metabolisminto their dietary recommendations. The company Habit (https://habit.com) investigates themetabolic response on carbohydrates, fats, and proteins (shakes) and includes this information intothe personalised dietary recommendation. Another commercially available personalised dietaryprogramme is provided by the Million Friends company (https://www.millionfriends.de), whichincludes continuous glucose monitoring and the analysis of the microbiome into the personaliseddietary recommendations.
In a systematic review by Covolo et al., different aspects of DTC tests were summarised [67].The clinical validity of the genetic tests and the benefits are still limited. Furthermore, a lack of scientificevidence is clearly pointed out. In addition, contradictions in the results of genetic tests on the sameindividuals were identified. Due to missing counselling, a high risk of misinterpretation of the geneticresult is given. Covolo et al. concluded that the practical experiences are limited, and that this marketis still in a premature state [67].
10. Current Opinions for Gene-Based Diets
As described above, there is little scientific evidence for genetic DTC tests. This is also reflected bythe opinions of nutritional and genetic societies. The German Society for Human Genetics rejects theuse of genetic tests in their positioning paper [68], and the American Society of Dietetics and Nutritiondeclined the use of gene-based dietary recommendations in clinical settings [69]. In their positionpaper they stated, “The practical application of nutritional genomics for complex chronic disease is an emergingscience and the use of nutrigenetic testing to provide dietary advice is not ready for routine dietetics practice.Registered dietitian nutritionists need basic competency in genetics as a foundation for understanding nutritionalgenomics; proficiency requires advanced knowledge and skills”. A systematic review of 17 European positionstatements, policies, guidelines, and recommendations described the concerns of societies about theDTC tests referring to the quality, genetic understanding, and protection of privacy [70]. Despite theconcerns of societies, the mentioned review points out that the concept should be strictly regulatedand that a common European regulation on the use of genetic data is crucial [70]. In addition, medicalstaff should be given the best possible training in the field of genetic DTC tests. In addition to theopinions of public societies, even the personal opinions, wishes, and concerns of individuals should betaken into account [71]. Furthermore, ethnic-based genetic differences should be considered.
11. Outlook
Bray and colleagues clearly pointed out in their article that personalised dietary recommendationsare a hot topic for future obesity therapy and that clinical studies are necessary [72]. The wholearea of personalised nutrition is very complex, and it is of urgent need to focus on several aspects(Figure 1), and not only on the person´s genetic background. Therefore, it is indispensable to conductmultidisciplinary studies in order to bring all potential factors together for a valid personaliseddietary recommendation. The topic of personalised nutrition was picked up in the framework of theenable cluster (http://www.enable-cluster.de), which is funded by the Federal Ministry of Educationand Research in Germany. The aim of the lifestyle intervention (LION) study is to identify, e.g.,genetic, epigenetic, metabolic, and psychological predictors and barriers for weight loss and weightloss maintenance.
Author Contributions: T.D. and C.H. wrote the manuscript and approved the final version of the manuscript.
Funding: This article was supported by a grant of the German Federal Ministry of Education and Research(Bundesministerium für Bildung und Forschung, BMBF) (funding code: 01EA1709, enable publication number:039). This article was written by the Junior Research Group “Personalised Nutrition & eHealth” within theNutrition Cluster enable.
Acknowledgments: The authors thank the German Federal Ministry of Education and Research (BMBF)for funding.
Conflicts of Interest: The authors declare no conflicts of interests.
94

Nutrients 2019, 11, 617
References
1. Lam, Y.Y.; Ravussin, E. Analysis of energy metabolism in humans: A review of methodologies. Mol. Metab.2016, 5, 1057–1071. [CrossRef] [PubMed]
2. Crowley, V.E. Overview of human obesity and central mechanisms regulating energy homeostasis. Ann Clin.Biochem. 2008, 45, 245–255. [CrossRef] [PubMed]
3. Montague, C.T.; Farooqi, I.S.; Whitehead, J.P.; Soos, M.A.; Rau, H.; Wareham, N.J.; Sewter, C.P.; Digby, J.E.;Mohammed, S.N.; Hurst, J.A.; et al. Congenital leptin deficiency is associated with severe early-onset obesityin humans. Nature 1997, 387, 903–908. [CrossRef] [PubMed]
4. Wiedmer, P.; Nogueiras, R.; Broglio, F.; D’Alessio, D.; Tschop, M.H. Ghrelin, obesity and diabetes. Nat. Clin.Pract. Endocrinol. Metab. 2007, 3, 705–712. [CrossRef] [PubMed]
5. Woods, S.C.; D’Alessio, D.A. Central control of body weight and appetite. J. Clin. Endocrinol. Metab. 2008, 93,S37–S50. [CrossRef] [PubMed]
6. Raybould, H.E. Mechanisms of CCK signaling from gut to brain. Curr. Opin. Pharmacol. 2007, 7, 570–574.[CrossRef] [PubMed]
7. Johnston, B.C.; Kanters, S.; Bandayrel, K.; Wu, P.; Naji, F.; Siemieniuk, R.A.; Ball, G.D.; Busse, J.W.;Thorlund, K.; Guyatt, G.; et al. Comparison of weight loss among named diet programs in overweight andobese adults: A meta-analysis. JAMA 2014, 312, 923–933. [CrossRef] [PubMed]
8. Sacks, F.M.; Bray, G.A.; Carey, V.J.; Smith, S.R.; Ryan, D.H.; Anton, S.D.; McManus, K.; Champagne, C.M.;Bishop, L.M.; Laranjo, N.; et al. Comparison of weight-loss diets with different compositions of fat, protein,and carbohydrates. N. Engl. J. Med. 2009, 360, 859–873. [CrossRef] [PubMed]
9. Shai, I.; Schwarzfuchs, D.; Henkin, Y.; Shahar, D.R.; Witkow, S.; Greenberg, I.; Golan, R.; Fraser, D.; Bolotin, A.;Vardi, H.; et al. Weight Loss with a Low-Carbohydrate, Mediterranean, or Low-Fat Diet. N. Engl. J. Med.2008, 359, 229–241. [CrossRef] [PubMed]
10. Gardner, C.D.; Trepanowski, J.F.; Del Gobbo, L.C.; Hauser, M.E.; Rigdon, J.; Ioannidis, J.P.A.; Desai, M.;King, A.C. Effect of Low-Fat vs Low-Carbohydrate Diet on 12-Month Weight Loss in Overweight Adultsand the Association with Genotype Pattern or Insulin Secretion: The DIETFITS Randomized Clinical Trial.JAMA 2018, 319, 667–679. [CrossRef] [PubMed]
11. Esposito, K.; Kastorini, C.M.; Panagiotakos, D.B.; Giugliano, D. Mediterranean diet and weight loss:Meta-analysis of randomized controlled trials. Metab. Syndr. Relat. Disord. 2011, 9, 1–12. [CrossRef]
12. Jenkins, D.J.; Wong, J.M.; Kendall, C.W.; Esfahani, A.; Ng, V.W.; Leong, T.C.; Faulkner, D.A.; Vidgen, E.;Greaves, K.A.; Paul, G.; et al. The effect of a plant-based low-carbohydrate (“Eco-Atkins”) diet on bodyweight and blood lipid concentrations in hyperlipidemic subjects. Arch. Intern. Med. 2009, 169, 1046–1054.[CrossRef]
13. Jenkins, D.J.; Wong, J.M.; Kendall, C.W.; Esfahani, A.; Ng, V.W.; Leong, T.C.; Faulkner, D.A.; Vidgen, E.;Paul, G.; Mukherjea, R.; et al. Effect of a 6-month vegan low-carbohydrate (‘Eco-Atkins’) diet oncardiovascular risk factors and body weight in hyperlipidaemic adults: A randomised controlled trial.BMJ Open 2014, 4, e003505. [CrossRef]
14. Harris, W.S.; Mozaffarian, D.; Rimm, E.; Kris-Etherton, P.; Rudel, L.L.; Appel, L.J.; Engler, M.B.; Sacks, F.Omega-6 fatty acids and risk for cardiovascular disease: A science advisory from the American HeartAssociation Nutrition Subcommittee of the Council on Nutrition, Physical Activity, and Metabolism; Councilon Cardiovascular Nursing; and Council on Epidemiology and Prevention. Circulation 2009, 119, 902–907.[CrossRef]
15. Bamberger, C.; Rossmeier, A.; Lechner, K.; Wu, L.; Waldmann, E.; Stark, R.G.; Altenhofer, J.; Henze, K.;Parhofer, K.G. A Walnut-Enriched Diet Reduces Lipids in Healthy Caucasian Subjects, Independent ofRecommended Macronutrient Replacement and Time Point of Consumption: A Prospective, Randomized,Controlled Trial. Nutrients 2017, 9, 097. [CrossRef]
16. Holzmann, S.L.; Pröll, K.; Hauner, H.; Holzapfel, C. Nutrition apps: Quality and limitations. An explorativeinvestigation on the basis of selected apps. Ernaehrungs Umsch. 2017, 64, 80–89. [CrossRef]
17. Krug, S.; Kastenmuller, G.; Stuckler, F.; Rist, M.J.; Skurk, T.; Sailer, M.; Raffler, J.; Romisch-Margl, W.;Adamski, J.; Prehn, C.; et al. The dynamic range of the human metabolome revealed by challenges. FASEB J.Off. Publ. Fed. Am. Soc. Exp. Biol. 2012, 26, 2607–2619. [CrossRef]
95
Nutrients 2019, 11, 617
18. Zeevi, D.; Korem, T.; Zmora, N.; Israeli, D.; Rothschild, D.; Weinberger, A.; Ben-Yacov, O.; Lador, D.;Avnit-Sagi, T.; Lotan-Pompan, M.; et al. Personalized Nutrition by Prediction of Glycemic Responses. Cell2015, 163, 1079–1094. [CrossRef]
19. Korem, T.; Zeevi, D.; Zmora, N.; Weissbrod, O.; Bar, N.; Lotan-Pompan, M.; Avnit-Sagi, T.; Kosower, N.;Malka, G.; Rein, M.; et al. Bread Affects Clinical Parameters and Induces Gut Microbiome-AssociatedPersonal Glycemic Responses. Cell Metab. 2017, 25, 1243.e1245–1253.e1245. [CrossRef]
20. Wopereis, S.; Stroeve, J.H.M.; Stafleu, A.; Bakker, G.C.M.; Burggraaf, J.; van Erk, M.J.; Pellis, L.; Boessen, R.;Kardinaal, A.A.F.; van Ommen, B. Multi-parameter comparison of a standardized mixed meal tolerance testin healthy and type 2 diabetic subjects: The PhenFlex challenge. Genes Nutr. 2017, 12, 21. [CrossRef]
21. De Toro-Martin, J.; Arsenault, B.J.; Despres, J.P.; Vohl, M.C. Precision Nutrition: A Review of PersonalizedNutritional Approaches for the Prevention and Management of Metabolic Syndrome. Nutrients 2017, 9, 913.[CrossRef] [PubMed]
22. Nizel, A.E. Personalized nutrition counseling. ASDC J. Dent. Child. 1972, 39, 353–360. [PubMed]23. Brug, J.; Campbell, M.; van Assema, P. The application and impact of computer-generated personalized
nutrition education: A review of the literature. Patient Educ. Couns. 1999, 36, 145–156. [CrossRef]24. Stewart-Knox, B.; Kuznesof, S.; Robinson, J.; Rankin, A.; Orr, K.; Duffy, M.; Poinhos, R.; de Almeida, M.D.;
Macready, A.; Gallagher, C.; et al. Factors influencing European consumer uptake of personalised nutrition.Results of a qualitative analysis. Appetite 2013, 66, 67–74. [CrossRef] [PubMed]
25. Wang, D.D.; Hu, F.B. Precision nutrition for prevention and management of type 2 diabetes. Lancet. DiabetesEndocrinol. 2018, 6, 416–426. [CrossRef]
26. Van Ommen, B.; van den Broek, T.; de Hoogh, I.; van Erk, M.; van Someren, E.; Rouhani-Rankouhi, T.;Anthony, J.C.; Hogenelst, K.; Pasman, W.; Boorsma, A.; et al. Systems biology of personalized nutrition. Nutr.Rev. 2017, 75, 579–599. [CrossRef] [PubMed]
27. Daniel, H.; Klein, U. Personalisierte Ernährung. J. Für Ernährungsmedizin 2016, 13, 6–9.28. Nielsen, D.E.; El-Sohemy, A. Disclosure of genetic information and change in dietary intake: A randomized
controlled trial. PLoS ONE 2014, 9, e112665. [CrossRef]29. Poinhos, R.; van der Lans, I.A.; Rankin, A.; Fischer, A.R.; Bunting, B.; Kuznesof, S.; Stewart-Knox, B.;
Frewer, L.J. Psychological determinants of consumer acceptance of personalised nutrition in 9 Europeancountries. PLoS ONE 2014, 9, e110614. [CrossRef]
30. Janz, N.K.; Becker, M.H. The Health Belief Model: A decade later. Health Educ. Q. 1984, 11, 1–47. [CrossRef]31. Anderson, A.S. How to implement dietary changes to prevent the development of metabolic syndrome. Br.
J. Nutr. 2000, 83 (Suppl. 1), S165–S168. [CrossRef]32. Bouchard, C.; Tremblay, A. Genetic influences on the response of body fat and fat distribution to positive
and negative energy balances in human identical twins. J. Nutr. 1997, 127, 943s–947s. [CrossRef]33. Stunkard, A.J.; Sorensen, T.I.; Hanis, C.; Teasdale, T.W.; Chakraborty, R.; Schull, W.J.; Schulsinger, F. An
adoption study of human obesity. N. Engl. J. Med. 1986, 314, 193–198. [CrossRef]34. Levy, E.; Menard, D.; Delvin, E.; Stan, S.; Mitchell, G.; Lambert, M.; Ziv, E.; Feoli-Fonseca, J.C.; Seidman, E.
The polymorphism at codon 54 of the FABP2 gene increases fat absorption in human intestinal explants.J. Biol. Chem. 2001, 276, 39679–39684. [CrossRef]
35. Hegele, R.A.; Harris, S.B.; Hanley, A.J.; Sadikian, S.; Connelly, P.W.; Zinman, B. Genetic variation of intestinalfatty acid-binding protein associated with variation in body mass in aboriginal Canadians. J. Clin. Endocrinol.Metab. 1996, 81, 4334–4337. [CrossRef]
36. Tontonoz, P.; Hu, E.; Graves, R.A.; Budavari, A.I.; Spiegelman, B.M. mPPAR gamma 2: Tissue-specificregulator of an adipocyte enhancer. Genes Dev. 1994, 8, 1224–1234. [CrossRef]
37. Tontonoz, P.; Hu, E.; Spiegelman, B.M. Stimulation of adipogenesis in fibroblasts by PPAR gamma 2, alipid-activated transcription factor. Cell 1994, 79, 1147–1156. [CrossRef]
38. Deeb, S.S.; Fajas, L.; Nemoto, M.; Pihlajamaki, J.; Mykkanen, L.; Kuusisto, J.; Laakso, M.; Fujimoto, W.;Auwerx, J. A Pro12Ala substitution in PPARgamma2 associated with decreased receptor activity, lower bodymass index and improved insulin sensitivity. Nat. Genet. 1998, 20, 284–287. [CrossRef]
39. Hagg, S.; Ganna, A.; Van Der Laan, S.W.; Esko, T.; Pers, T.H.; Locke, A.E.; Berndt, S.I.; Justice, A.E.; Kahali, B.;Siemelink, M.A.; et al. Gene-based meta-analysis of genome-wide association studies implicates new lociinvolved in obesity. Hum. Mol. Genet. 2015, 24, 6849–6860. [CrossRef]
96

Nutrients 2019, 11, 617
40. Locke, A.E.; Kahali, B.; Berndt, S.I.; Justice, A.E.; Pers, T.H.; Day, F.R.; Powell, C.; Vedantam, S.;Buchkovich, M.L.; Yang, J.; et al. Genetic studies of body mass index yield new insights for obesitybiology. Nature 2015, 518, 197–206. [CrossRef]
41. Thorleifsson, G.; Walters, G.B.; Gudbjartsson, D.F.; Steinthorsdottir, V.; Sulem, P.; Helgadottir, A.;Styrkarsdottir, U.; Gretarsdottir, S.; Thorlacius, S.; Jonsdottir, I.; et al. Genome-wide association yieldsnew sequence variants at seven loci that associate with measures of obesity. Nat. Genet. 2009, 41, 18–24.[CrossRef]
42. Speliotes, E.K.; Willer, C.J.; Berndt, S.I.; Monda, K.L.; Thorleifsson, G.; Jackson, A.U.; Lango Allen, H.;Lindgren, C.M.; Luan, J.; Magi, R.; et al. Association analyses of 249,796 individuals reveal 18 new lociassociated with body mass index. Nat. Genet. 2010, 42, 937–948. [CrossRef]
43. Loos, R.J. The genetics of adiposity. Curr. Opin. Genet. Dev. 2018, 50, 86–95. [CrossRef]44. Frayling, T.M.; Timpson, N.J.; Weedon, M.N.; Zeggini, E.; Freathy, R.M.; Lindgren, C.M.; Perry, J.R.;
Elliott, K.S.; Lango, H.; Rayner, N.W.; et al. A common variant in the FTO gene is associated with body massindex and predisposes to childhood and adult obesity. Science 2007, 316, 889–894. [CrossRef]
45. Dina, C.; Meyre, D.; Gallina, S.; Durand, E.; Korner, A.; Jacobson, P.; Carlsson, L.M.; Kiess, W.; Vatin, V.;Lecoeur, C.; et al. Variation in FTO contributes to childhood obesity and severe adult obesity. Nat. Genet.2007, 39, 724–726. [CrossRef]
46. Scuteri, A.; Sanna, S.; Chen, W.M.; Uda, M.; Albai, G.; Strait, J.; Najjar, S.; Nagaraja, R.; Orru, M.; Usala, G.; et al.Genome-wide association scan shows genetic variants in the FTO gene are associated with obesity-relatedtraits. PLoS Genet. 2007, 3, e115. [CrossRef] [PubMed]
47. Claussnitzer, M.; Dankel, S.N.; Kim, K.H.; Quon, G.; Meuleman, W.; Haugen, C.; Glunk, V.; Sousa, I.S.;Beaudry, J.L.; Puviindran, V.; et al. FTO Obesity Variant Circuitry and Adipocyte Browning in Humans. N.Engl. J. Med. 2015, 373, 895–907. [CrossRef]
48. Larder, R.; Sim, M.F.M.; Gulati, P.; Antrobus, R.; Tung, Y.C.L.; Rimmington, D.; Ayuso, E.; Polex-Wolf, J.;Lam, B.Y.H.; Dias, C.; et al. Obesity-associated gene TMEM18 has a role in the central control of appetite andbody weight regulation. Proc. Natl. Acad. Sci. USA 2017, 114, 9421–9426. [CrossRef]
49. Wiemerslage, L.; Gohel, P.A.; Maestri, G.; Hilmarsson, T.G.; Mickael, M.; Fredriksson, R.; Williams, M.J.;Schioth, H.B. The Drosophila ortholog of TMEM18 regulates insulin and glucagon-like signaling. J. Endocrinol.2016, 229, 233–243. [CrossRef]
50. Cone, R.D. Anatomy and regulation of the central melanocortin system. Nat. Neurosci. 2005, 8, 571–578.[CrossRef]
51. Farooqi, I.S.; Keogh, J.M.; Yeo, G.S.; Lank, E.J.; Cheetham, T.; O’Rahilly, S. Clinical spectrum of obesity andmutations in the melanocortin 4 receptor gene. N. Engl. J. Med. 2003, 348, 1085–1095. [CrossRef] [PubMed]
52. Xiang, L.; Wu, H.; Pan, A.; Patel, B.; Xiang, G.; Qi, L.; Kaplan, R.C.; Hu, F.; Wylie-Rosett, J.; Qi, Q. FTOgenotype and weight loss in diet and lifestyle interventions: A systematic review and meta-analysis. Am. J.Clin. Nutr. 2016, 103, 1162–1170. [CrossRef]
53. Livingstone, K.M.; Celis-Morales, C.; Papandonatos, G.D.; Erar, B.; Florez, J.C.; Jablonski, K.A.; Razquin, C.;Marti, A.; Heianza, Y.; Huang, T.; et al. FTO genotype and weight loss: Systematic review and meta-analysisof 9563 individual participant data from eight randomised controlled trials. BMJ 2016, 354, i4707. [CrossRef][PubMed]
54. Sorensen, T.I.; Boutin, P.; Taylor, M.A.; Larsen, L.H.; Verdich, C.; Petersen, L.; Holst, C.; Echwald, S.M.;Dina, C.; Toubro, S.; et al. Genetic polymorphisms and weight loss in obesity: A randomised trial ofhypo-energetic high- versus low-fat diets. PLoS Clin. Trials 2006, 1, e12. [CrossRef]
55. Papandonatos, G.D.; Pan, Q.; Pajewski, N.M.; Delahanty, L.M.; Peter, I.; Erar, B.; Ahmad, S.; Harden, M.;Chen, L.; Fontanillas, P.; et al. Genetic Predisposition to Weight Loss and Regain with Lifestyle Intervention:Analyses From the Diabetes Prevention Program and the Look AHEAD Randomized Controlled Trials.Diabetes 2015, 64, 4312–4321. [CrossRef]
56. Livingstone, K.M.; Celis-Morales, C.; Lara, J.; Ashor, A.W.; Lovegrove, J.A.; Martinez, J.A.; Saris, W.H.;Gibney, M.; Manios, Y.; Traczyk, I.; et al. Associations between FTO genotype and total energy andmacronutrient intake in adults: A systematic review and meta-analysis. Obes. Rev. 2015, 16, 666–678.[CrossRef] [PubMed]
97

Nutrients 2019, 11, 617
57. Drabsch, T.; Gatzemeier, J.; Pfadenhauer, L.; Hauner, H.; Holzapfel, C. Associations between SingleNucleotide Polymorphisms and Total Energy, Carbohydrate, and Fat Intakes: A Systematic Review. Adv.Nutr. 2018, 9, 425–453. [CrossRef] [PubMed]
58. Jiang, L.; Penney, K.L.; Giovannucci, E.; Kraft, P.; Wilson, K.M. A genome-wide association study of energyintake and expenditure. PLoS ONE 2018, 13, e0201555. [CrossRef]
59. Merino, J.; Dashti, H.S.; Li, S.X.; Sarnowski, C.; Justice, A.E.; Graff, M.; Papoutsakis, C.; Smith, C.E.;Dedoussis, G.V.; Lemaitre, R.N.; et al. Genome-wide meta-analysis of macronutrient intake of 91,114European ancestry participants from the cohorts for heart and aging research in genomic epidemiologyconsortium. Mol. Psychiatry 2018. [CrossRef]
60. Larsen, L.H.; Angquist, L.; Vimaleswaran, K.S.; Hager, J.; Viguerie, N.; Loos, R.J.; Handjieva-Darlenska, T.;Jebb, S.A.; Kunesova, M.; Larsen, T.M.; et al. Analyses of single nucleotide polymorphisms in selectednutrient-sensitive genes in weight-regain prevention: The DIOGENES study. Am. J. Clin. Nutr. 2012, 95,1254–1260. [CrossRef]
61. Zhang, X.; Qi, Q.; Zhang, C.; Smith, S.R.; Hu, F.B.; Sacks, F.M.; Bray, G.A.; Qi, L. FTO genotype and 2-yearchange in body composition and fat distribution in response to weight-loss diets: The POUNDS LOST Trial.Diabetes 2012, 61, 3005–3011. [CrossRef] [PubMed]
62. Qi, Q.; Bray, G.A.; Smith, S.R.; Hu, F.B.; Sacks, F.M.; Qi, L. Insulin receptor substrate 1 gene variation modifiesinsulin resistance response to weight-loss diets in a 2-year randomized trial: The Preventing OverweightUsing Novel Dietary Strategies (POUNDS LOST) trial. Circulation 2011, 124, 563–571. [CrossRef] [PubMed]
63. Celis-Morales, C.; Livingstone, K.M.; Marsaux, C.F.; Forster, H.; O’Donovan, C.B.; Woolhead, C.;Macready, A.L.; Fallaize, R.; Navas-Carretero, S.; San-Cristobal, R.; et al. Design and baseline characteristicsof the Food4Me study: A web-based randomised controlled trial of personalised nutrition in seven Europeancountries. Genes Nutr. 2015, 10, 450. [CrossRef]
64. Saukko, P. State of play in direct-to-consumer genetic testing for lifestyle-related diseases: Market, marketingcontent, user experiences and regulation. Proc. Nutr. Soc. 2013, 72, 53–60. [CrossRef]
65. Frankwich, K.A.; Egnatios, J.; Kenyon, M.L.; Rutledge, T.R.; Liao, P.S.; Gupta, S.; Herbst, K.L.; Zarrinpar, A.Differences in Weight Loss Between Persons on Standard Balanced vs Nutrigenetic Diets in a RandomizedControlled Trial. Clin. Gastroenterol. Hepatol. Off. Clin. Pract. J. Am. Gastroenterol. Assoc. 2015, 13,1625–1632.e1621. [CrossRef] [PubMed]
66. Steinberg, G.; Scott, A.; Honcz, J.; Spettell, C.; Pradhan, S. Reducing Metabolic Syndrome Risk Using aPersonalized Wellness Program. J. Occup. Environ. Med. 2015, 57, 1269–1274. [CrossRef] [PubMed]
67. Covolo, L.; Rubinelli, S.; Ceretti, E.; Gelatti, U. Internet-Based Direct-to-Consumer Genetic Testing:A Systematic Review. J. Med. Internet Res. 2015, 17, e279. [CrossRef]
68. Reis, A. Stellungnahme der Deutschen Gesellschaft fuer Humangenetik (GfH) zu “Direct-to-Consumer”(DTC)-Gentests. Dtsch. Ges. Fuer Humangenet. E.V., 2011. Available online: https://www.gfhev.de/de/leitlinien/LL_und_Stellungnahmen/2011_12_02_GfH-Stellungnahme_DTC-Gentests.pdf (accessed on 25January 2019).
69. Camp, K.M.; Trujillo, E. Position of the Academy of Nutrition and Dietetics: Nutritional genomics. J. Acad.Nutr. Diet. 2014, 114, 299–312. [CrossRef]
70. Rafiq, M.; Ianuale, C.; Ricciardi, W.; Boccia, S. Direct-to-consumer genetic testing: A systematic review ofeuropean guidelines, recommendations, and position statements. Genet. Test. Mol. Biomark. 2015, 19, 535–547.[CrossRef]
71. Bloss, C.S.; Ornowski, L.; Silver, E.; Cargill, M.; Vanier, V.; Schork, N.J.; Topol, E.J. Consumer perceptions ofdirect-to-consumer personalized genomic risk assessments. Genet. Med. Off. J. Am. Coll. Med. Genet. 2010, 12,556–566. [CrossRef]
72. Bray, M.S.; Loos, R.J.; McCaffery, J.M.; Ling, C.; Franks, P.W.; Weinstock, G.M.; Snyder, M.P.; Vassy, J.L.;Agurs-Collins, T. NIH working group report-using genomic information to guide weight management:From universal to precision treatment. Obesity 2016, 24, 14–22. [CrossRef] [PubMed]
© 2019 by the authors. Licensee MDPI, Basel, Switzerland. This article is an open accessarticle distributed under the terms and conditions of the Creative Commons Attribution(CC BY) license (http://creativecommons.org/licenses/by/4.0/).
98

nutrients
Article
Assessment of the Effectiveness of a ComputerisedDecision-Support Tool for Health Professionals forthe Prevention and Treatment of Childhood Obesity.Results from a Randomised Controlled Trial
George Moschonis 1,2,*, Maria Michalopoulou 2, Konstantina Tsoutsoulopoulou 2,
Elpis Vlachopapadopoulou 3, Stefanos Michalacos 3, Evangelia Charmandari 4,5,
George P. Chrousos 4 and Yannis Manios 2
1 Department of Dietetics, Nutrition and Sport, School of Allied Health, Human Services and Sport,La Trobe University, Melbourne, VIC 3086, Australia
2 Department of Nutrition and Dietetics, Harokopio University of Athens, 70 El Venizelou Avenue, Kallithea,17671 Athens, Greece; [email protected] (M.M.); [email protected] (K.T.); [email protected] (Y.M.)
3 Department of Endocrinology-Growth and Development, Children’s Hospital P. A. Kyriakou, 11527 Athens,Greece; [email protected] (E.V.); [email protected] (S.M.)
4 Division of Endocrinology, Metabolism, and Diabetes, First Department of Pediatrics,University of Athens Medical School, Aghia Sophia Children’s Hospital, 11527 Athens, Greece;[email protected] (E.C.); [email protected] (G.P.C.)
5 Division of Endocrinology and Metabolism, Center of Clinical, Experimental Surgery and TranslationalResearch, Biomedical Research Foundation of the Academy of Athens, 11527 Athens, Greece
* Correspondence: [email protected]; Tel.: +61-03-9479-3482
Received: 16 February 2019; Accepted: 22 March 2019; Published: 26 March 2019
Abstract: We examined the effectiveness of a computerised decision-support tool (DST), designedfor paediatric healthcare professionals, as a means to tackle childhood obesity. A randomisedcontrolled trial was conducted with 65 families of 6–12-year old overweight or obese children.Paediatricians, paediatric endocrinologists and a dietitian in two children’s hospitals implementedthe intervention. The intervention group (IG) received personalised meal plans and lifestyleoptimisation recommendations via the DST, while families in the control group (CG) received generalrecommendations. After three months of intervention, the IG had a significant change in dietaryfibre and sucrose intake by 4.1 and −4.6 g/day, respectively. In addition, the IG significantly reducedconsumption of sweets (i.e., chocolates and cakes) and salty snacks (i.e., potato chips) by −0.1 and−0.3 portions/day, respectively. Furthermore, the CG had a significant increase of body weight andwaist circumference by 1.4 kg and 2.1 cm, respectively, while Body Mass Index (BMI) decreased onlyin the IG by −0.4 kg/m2. However, the aforementioned findings did not differ significantly betweenstudy groups. In conclusion, these findings indicate the dynamics of the DST in supporting paediatrichealthcare professionals to improve the effectiveness of care in modifying obesity-related behaviours.Further research is needed to confirm these findings.
Keywords: personalised; nutrition; intervention; children; obesity; healthcare professionals
1. Introduction
A plethora of epidemiological data reports the high prevalence of obesity, an “epidemic” thatrepresents a huge public health burden for many countries. Besides the increased risk for chronicdiseases, obesity is also related to nutrient insufficiencies, a paradox that has been characterised as the“double burden of malnutrition” [1]. This “double burden” paradox can be interpreted by the existence
Nutrients 2019, 11, 706; doi:10.3390/nu11030706 www.mdpi.com/journal/nutrients99

Nutrients 2019, 11, 706
of a chronic, low-grade inflammation state that is produced and sustained in obese children [2], leadingto low blood concentration of essential micronutrients, such as iron [3] and vitamin D [4]. Consideringthe important roles of these micronutrients in several cellular, metabolic and physiological processes,their long-term insufficiency in obese individuals may become detrimental for children’s optimalgrowth and development.
Due to the huge dimensions and detrimental effects of obesity and related complications, theseconditions have been the major focus of public health research over the past decade. However, existingtools, programmes and strategies to counteract the “obesity epidemic” have only experienced limitedsuccess [5]. This is mainly due to the inadequate understanding of the complex mosaic of mechanisticpathways leading to obesity. In this regard, excess body weight is not only the product of a positiveenergy balance, but also an interaction of a plethora of other etiological factors, such as environmentalones that exert their effects even from very early life stages, such as the prenatal period and thefirst 5 years of life. By acting “in utero” (e.g., maternal obesity, smoking during pregnancy, etc.) orduring infancy (infant formula feeding, growth velocity, etc.), perinatal factors can cause permanentendocrine adaptations, usually expressed as increased hunger, adipogenesis and consequently obesityat later life stages [6,7]. Another important reason for the limited or only short-term effectivenessof weight management programs is usually their delayed implementation in already obese childrenor in adulthood, when the energy-balance-related behaviours (EBRBs) and consequently the obesityphenotype are already established [8]. As such, the implementation of intervention initiatives as earlyin life as possible, when EBRBs and their determinants are still flexible, is promising for the preventionof obesity and related cardiometabolic complications [9].
Health professionals (i.e., general practitioners, family doctors, paediatricians, dietitians,nutritionists) have a key role among health experts, in prospectively and frequently monitoringchildren [10,11]. Furthermore, this key role places them into a central position, with regards tochildhood obesity prevention and treatment, since they are also the ones guiding parents in providingthe appropriate healthcare to their children. However, these professionals on many occasions theyrequire additional and appropriate support to conduct a thorough assessment and provide tailor-madediet and lifestyle optimisation advice to families with children in need of weight management [12,13].
As such, the objective of this study was to examine the effectiveness of a computeriseddecision-support tool (DST), developed to assist paediatricians and paediatric endocrinologists indelivering personalised nutrition and lifestyle optimisation advice to children and their families,as a means of childhood obesity management.
2. Materials and Methods
2.1. Development of the Decision Support Tool
The development of the computerised DST is based on decision-tree algorithms (SupplementaryFigure S1 provides an example of these algorithms), which include five different levels, namely the“assessment of children’s current weight status” (level 1), the “assessment of the likelihood for thefuture manifestation of obesity in normal-weight children” (level 2), the “evaluation of the mostappropriate body weight management goal” (level 3), the “estimation of children’s dietary energy andmacronutrients intake needs” (level 4) and the delivery of “personalised diet and lifestyle optimisationadvice” (level 5).
The first level of the decision tree algorithms (“assessment of children’s current weight status”) isbased on the measurement of body weight in all age groups from infancy to adolescence and of therecumbent length in infants and children until the age of 2 years or standing height in all children andadolescents after the age of 2 years. The international Body Mass Index (BMI)-for-age growth curvesand the relevant reference values proposed by the WHO are further used to finalise the assessment ofchildren’s weight status [14] and categorise them into “underweight” (BMI-for-age < 5th percentile),
100

Nutrients 2019, 11, 706
“normal weight” (5th percentile ≤ BMI-for-age < 85th percentile), “overweight” (85th percentile ≤BMI-for-age < 95th percentile) and “obese” (BMI-for-age ≥ 95th percentile).
The second level of the decision tree algorithms (“assessment of the likelihood for the futuremanifestation of obesity in normal-weight children”) is important because even if a child’s currentbody weight is normal, this does not exclude the likelihood of the future manifestation of obesity,especially in children that are subjected to the combined effect of obesity risk factors. In an attemptto examine the likelihood for the future occurrence of obesity in normal weight children, due to thecombined effect of individual obesity risk factors, including socio-demographic and perinatal ones,the CORE (Childhood Obesity Risk Evaluation) index [15], was included as another component ofthe DST. More specifically, the CORE index represents a simple, easy-to-use and valid score [16],which provides an estimation of the future likelihood of obesity manifestation as early as the age of6 months. This estimation achieved through the combined use and scoring of easily collected data onspecific perinatal risk factors, such as maternal pre-pregnancy weight status, maternal smoking duringpregnancy, infant’s weight gain during the first 6 months of life, as well as simple socio-demographicindices, namely the child’s gender and mother’s educational level.
In the third level (“evaluation of the most appropriate body weight management goal”) thedecision tree algorithms use the recommendations of the American Pediatric Association as a basis forthe prevention and treatment of child and adolescent overweight and obesity [17]. More specifically,data collected on children’s age and current weight status, as well as on the presence of obesity-relatedcomorbidities (i.e., hyperglycaemia, insulin resistance, dyslipidaemia, hypertension) in children and ofobesity in one or both parents, are combined to inform each one of the following weight managementpathways: (i) body weight maintenance, which aims to the progressive reduction of BMI due tothe increase in height stemming from children’s growth, or (ii) body weight loss, whenever this isdeemed appropriate, such as in cases where comorbidities and/or parental obesity co-exist withchildhood obesity.
Following the evaluation of the most appropriate weight management goal, the fourth levelof the decision tree algorithms (“estimation of children’s dietary energy and macronutrients intakeneeds”) is necessary to facilitate weight maintenance or weight loss as well as children’s growth.The mathematical formulas provided by the Institute of Medicine (IOM) for infants, children andadolescents [18] were used to assess estimated energy requirements (EER). After the estimationof dietary energy intake requirements, the DST calculates the percent distribution of energy intomacronutrients, within the Acceptable Macronutrient Distribution Ranges (AMDRs) proposed by theIOM for carbohydrates, fat and protein for infants, children and adolescents [18].
In the fifth level (“personalised diet and lifestyle optimisation advice”), the decision treealgorithms analyse all aforementioned data and deliver a report providing the assessment of theexamined child, as well as body weight, diet and lifestyle recommendations that will support thedecision of health professionals. The report includes (a) the assessment of children’s current weightstatus and the need for body weight maintenance or loss, (b) the assessment of the likelihood forthe future manifestation of obesity in normal-weight children, (c) children’s total dietary energyrequirements based on the anticipated body weight management (i.e., weight maintenance or loss)target, (d) children’s dietary needs in carbohydrates, total fat and protein, (e) personalised meal plans,as well as (f) diet and lifestyle optimisation recommendations, tailored to the specific needs and weightmanagement goals set for each child. The recommendations include practical advice to the family onhow (i) to achieve an energy and nutrients’ balanced diet, via an increase in the consumption of foodsthat are rich sources of dietary fibre and complex carbohydrates and a reduction in the consumption offoods that have a high content of simple sugars, total and saturated dietary fat, cholesterol and sodium,(ii) to become more physically active, (iii) to reduce sedentary activities and (iv) to improve children’ssleep patterns [19].
101

Nutrients 2019, 11, 706
2.2. Operational Components of the DST
The DST comprises of two operational components, namely the data entry and the data processingcomponent. Regarding data entry, paediatric healthcare professionals collect information on the child’sgender and birth date and conduct anthropometric measurements of body weight, recumbent lengthor standing height (depending on the child’s age). Healthcare professionals also collect perinatal,socio-demographic and parental data, as well as some additional information on characteristics relatedto the child. In terms of perinatal factors, data is collected on maternal pre-pregnancy body weight(in kg), maternal smoking habits during pregnancy, while the child’s health record is used to copyinformation with regards to the child’s weight (in kg) at birth and at six months of age. Regardingsocio-demographic and parental data, information is collected on self-reported mother’s educationallevel (in years of education), and on measured mother’s and father’s body weight (in kg) and height(in cm). Furthermore, healthcare professionals use a set of validated questions [20] to collect appropriatedata that will allow them to categorise the child’s physical activity level, into light (<4 METs), moderate(4–7 METs) or vigorous (>7 METs). Lastly, information on the presence of obesity-related comorbidityindices, such as insulin resistance, dyslipidaemias and hypertension is also collected, either based onthe child’s physical examination or based on biochemical or clinical indices from the child’s medicalrecord that is available to the paediatric healthcare professionals.
As far as data processing is concerned, all data are uploaded to the DST, which processes themand extracts a report with the child’s assessment and the personalised diet and lifestyle optimisationrecommendations. More specifically, the DST uses the birth and examination dates to calculate child’sage (in months and years), it then calculates child’s BMI (in kg/m2) and consequently estimates thechild’s weight status, through its categorisation into underweight, normal-weight, overweight orobese. In normal-weight children, the DST also calculates the CORE index score, based on whichchildren with a higher (i.e., CORE index score ≥ 4) likelihood for obesity manifestation in childhoodor adolescence are identified [16]. In addition, the DST calculates the estimated dietary energyrequirement (in kcals per day) for the child, so as to achieve the desired body weight management(i.e., weight maintenance or loss) goal, while relevant calculations are also made with regards to dietaryprotein, carbohydrates and fat needs (in grams per day). Furthermore, the DST processes the datauploaded for parents, thus calculating parental BMI (in kg/m2) and categorising parents as non-obeseor obese (i.e., BMI > 30 kg/m2). Finally, the DST proposes diet and lifestyle optimisation advicerecommendations for the child and/or the entire family (Supplementary Table S1 provides examplesof the recommendations), as well as personalised weekly meal plans adjusted to the estimated energyrequirements calculated for each child (Supplementary Table S2 provides examples of the meal plans).
2.3. Personalised Lifestyle Optimisations Recommendations and Weekly Meal Plans
The DST follows five steps dictated by the decision tree algorithms (Supplementary Figure S1provides the relevant steps) to propose personalised lifestyle optimisation recommendations andweekly meal plans.
In step 1, children are categorised based on their BMI into normal-weight, overweight or obese,while in step 2 the CORE index score is calculated for normal-weight children. In normal-weightchildren with a lower likelihood for the future manifestation of obesity, the DST proposes diet andphysical activity recommendations, which support the maintenance of normal body weight and growth(recommendation 1).
In step 3, the DST focuses on normal-weight children with a higher likelihood for the futureobesity manifestation and evaluates the co-existence of clinical disorders (i.e., hyperglycaemia, insulinresistance, dyslipidaemia and/or hypertension). In normal-weight children with no clinical disordersand with non-obese parents, the DST advises health professionals to provide recommendation 1(i.e., similar to step 2 above). In normal-weight children with no clinical disorders but with at leastone obese parent, the DST advises health professionals to provide specialised recommendations,aiming to improve diet and physical activity habits for the entire family (recommendation 2).
102

Nutrients 2019, 11, 706
In normal-weight children with at least one clinical disorder but with non-obese parents, the DSTprovides recommendations, aiming at maintaining the child’s normal body weight, but also deliveringpractical advice that supports the consumption of foods rich in dietary fibre and complex carbohydrates,but simultaneously the reduction in the consumption of foods high in simple sugars, total and saturatedfat, dietary cholesterol and sodium (recommendation 3). Finally, in normal-weight children with atleast one clinical disorder and with at least one obese parent, the DST provides recommendationstargeting the entire family and aiming to improve physical activity and dietary habits for all familymembers (recommendation 4). The DST also proposes a periodic re-evaluation every 6 months forhigh-risk normal-weight children with at least one clinical disorder and/or at least one obese parentand every 12 months for children with no clinical disorders and/or non-obese parents.
In step 4 the DST focuses on overweight children. In overweight children with no clinical disordersand with non-obese parents, the DST advises health professionals to provide recommendation 1,but also an isocaloric weekly meal plan, aiming to maintain the child’s body weight (meal plan 1) andconsequently to progressively decrease its BMI (as the child grows and height increases), ideally belowthe 85th percentile. In overweight children with no clinical disorders and at least one obese parent,the DST provides recommendation 2, that targets the entire family, as well as the isocaloric meal plan1, which aims for the maintenance of the child’s body weight. In overweight children with at leastone clinical disorder and with non-obese parents, the DST proposes recommendation 3, as well asan isocaloric meal plan (meal plan 2), aiming for the maintenance of the child’s body weight via theconsumption of foods rich in dietary fibre and complex carbohydrates, but also with a lower contentof simple sugars, total and saturated fat, dietary cholesterol and sodium, compared to meal plan 1.Finally, in overweight children with at least one clinical disorder and with at least one obese parent,the DST advises health professionals to provide recommendation 4 to the entire family, as well as mealplan 2. The DST also suggests a periodic re-evaluation every 3 months for overweight children with atleast one clinical disorder and/or at least one obese parent and every 6 months for children with noclinical disorders and/or non-obese parents. If the re-evaluation shows no reduction of BMI below the85th percentile, the DST follows the same process described under Step 4. If the re-evaluation shows areduction of BMI below the 85th percentile, the DST follows the process described under Step 3.
In step 5, the DST focuses on obese children. In the case of 2–5-year-old obese children, the DSTfollows exactly the same approach dictated by Step 4 for overweight children. The main differentiationoccurs in 6–15-year-old obese children to whom mild weight loss is also prescribed. In this regard,in 6–15-year-old obese children with no clinical disorders and at least one obese parent, the DSTtargets the family and proposes recommendation 2 and a hypocaloric meal plan (meal plan 3).In 6–15-year-old obese children with at least one clinical disorder and non-obese parents, the DSTproposes recommendation 3, as well as a hypocaloric meal plan (meal plan 4), via the consumption offoods rich in dietary fibre and complex carbohydrates, but also the decrease in the consumption of foodsrich in simple sugars, total and saturated fat, dietary cholesterol and sodium. Finally, in 6–15-year-oldobese children with at least one clinical disorder and with at least one obese parent, the DST targetsthe family and proposes recommendation 4 and a hypocaloric meal plan 4. The DST also proposes aperiodic re-evaluation every 3 months for obese children with at least one clinical disorder and/or atleast one obese parent and every 6 months for children with no clinical disorders and/or non-obeseparents. If the re-evaluation shows no reduction of BMI below the 95th percentile, the DST followsthe same approach described under Step 4 or Step 5, depending the child’s age (i.e., 2–5 or 6–15 yearsold). If the re-evaluation shows a reduction of BMI below the 95th percentile, but BMI remains higherthan the 85th percentile, the DST follows the pathway dictated by Step 4. If the re-evaluation shows areduction of BMI below the 85th percentile, the DST proposes the process described under Step 3.
Table 1 summarises the target population and the behavioural change goals and lifestyleoptimisation advice provided by each level of recommendations through the DST.
103

Nutrients 2019, 11, 706
Table 1. Population and behavioural change goals of diet and lifestyle optimisation advice providedthrough the decision support tool.
Recommendation1
Recommendation2
Recommendation3
Recommendation4
Target population *:
Children �� ��Children and Family �� ��
Behavioural change goals
Keep a balanced diet,increase physical activityand Improve sleep habits
�� �� �� ��Increase consumption offoods rich in dietary fibre
and complex carbohydrates�� ��
Reduce consumption offoods rich in simple sugars,total and saturated dietaryfat, cholesterol and sodium
�� ��
* Both the content and style of recommendations were adjusted to promote behavioural change to children only orto the entire family.
2.4. Randomised Controlled Trial to Assess the Effectiveness of the Computerised DST
The effectiveness of the DST was assessed through a pilot randomised controlled interventiontrial (RCT). The RCT was initiated on May 2018 and was conducted in the Endocrinology Departmentof the “P. and A. Kyriakou” Children’s Hospital and in the Division of Endocrinology, Metabolism,and Diabetes of the “Aghia Sophia” Children’s Hospital in Athens, Greece. Before the study initiation,a statistical power calculation indicated that a total sample size of 64 children (50% females) would beadequate to observe a mean BMI difference of 1.5 kg/m2 between the two study groups (statisticalpower of 80% and level of statistical significance at 5%). Taking into account an attrition rate of 20%,a screening conducted in the premises of the aforementioned settings managed to recruit a total sampleof 80 children, who were identified as eligible to be included in the RCT. The main eligibility criteriafor inclusion in the RCT were children aged 6–12 years old, as well as overweight or obese status(i.e., BMI-for-age ≥ 85th percentile). Signed informed consent forms were obtained from all parents ofeligible children, before their participation to the study. The study was conducted in accordance withthe rules of the Declaration of Helsinki of 1975, revised in 2013 and the protocol was approved by theBioethics Committee of Harokopio University, Athens (approval no.: 61/30-3-2018). Finally, the RCTwas registered to clinicaltrials.gov (NCT03819673).
2.5. Study Groups
The 80 overweight or obese children that were eligible to participate in the RCT, were randomlyand equally allocated to two study groups. Those children that were randomly allocated to theintervention group (IG), were examined by paediatricians (i.e., general paediatricians and paediatricendocrinologists) and a dietitian, who were all trained in the use of the DST. A manual of operation withdetailed instructions on the use of the DST was prepared and distributed to medical practitioners priorto the commencement of the study. The dietitian also assisted the paediatricians to assess children’sweight status, to set appropriate weight management goals and to provide personalised meal plansand/or recommendations to children and their families. In contrast, those families whose children wererandomly allocated to the control group (CG), were provided with general recommendations of dietand physical activity and follow-up appointments were made for weight checks. The effectiveness ofthe intervention was evaluated through the collection of data at baseline and at a follow-up examinationafter 3 months.
104

Nutrients 2019, 11, 706
2.6. Data Collection: Parental Socio-Demographic and Anthropometric Characteristics
Data on specific socio-demographic characteristics were collected from parents (most preferablyfrom the mother) during the scheduled face-to-face interviews. All interviews were conducted by thepaediatricians or the dietitian with the use of a standardized questionnaire. The socio-demographicdata collected by parents included father’s and mother’s age, educational level (years of education)and occupation. In addition, parents also reported or had their body weight and height measured,from which BMI was calculated and used to categorise each parent based on their weight status.
2.7. Dietary Intake
Dietary intake data were obtained by the dietitian with the use of a 24-h recall of one typical day interms of children’s dietary intake and with a short food frequency questionnaire (FFQ), via interviewsconducted with parents of children younger than 10 years of age or directly with children older than10 years old.
According to the data recorded from the 24h-recall, all study participants were asked to describethe type and amount of foods and beverages consumed, during the previous day, provided that it wasa typical day according to the participant’s perception. To improve the accuracy of food description,standard household measures (cups, tablespoons, etc.) and food models were used to define amounts.At the end of each interview, the dietitian reviewed the collected data with the respondent in orderto clarify entries, servings and possible forgotten foods. Dietary intake data were analysed using theNutritionist V diet analysis software (version 2.1, 1999, First Databank, San Bruno, CA, USA), whichwas modified to include traditional Greek dishes and recipes [18]. Furthermore, the database wasupdated with nutritional information of processed foods provided by independent research institutes,food companies and fast-food chains.
In addition, a short semi-quantitative valid FFQ [21] was used to collect data on children’s dietaryintake of foods representing all main food groups (i.e., fruits, vegetables, grains, dairy and protein foods).The FFQ included questions that evaluate the consumption frequency of foods during the previous3 months in frequencies ranging from less than 1 portion/month to more than 4 portions per day.
2.8. Perinatal Data
Regarding perinatal data, mothers were asked to recall information on their pre-pregnancy bodyweight and smoking practices during pregnancy. Additionally, mothers were asked to report theirchild’s body weight and recumbent length at birth and 6 months of age, as this was recorded at theirchild’s health record.
2.9. Physical Activity Levels
Organised and leisure time physical activities were assessed using a standardized questionnaire,that was also used and validated in the multicentre Feel4Diabetes study that was conducted in sixEuropean countries, including Greece [20]. Respondents reported the type, time (in minutes) andfrequency (in times per week) spent by children on organised and/or leisure time physical activities.
2.10. Anthropometric Data
Body weight was measured to the nearest 0.1 kg using a digital weight scale (Seca Alpha, Model770, Hamburg, Germany). Subjects were weighed without shoes in minimal clothing. Height wasmeasured to the nearest 0.1 cm using a commercial stadiometer with subjects not wearing shoes,their shoulders in a relaxed position, their arms hanging freely and their head aligned according tothe Frankfort plane. Weight and height were converted to BMI using Quetelet’s equation (weight(kg)/height2 (m2)), while the international BMI-for-age growth curves and the relevant referencevalues proposed by the WHO [14] were issued to calculate BMI z-score. Waist circumference (WC)was also measured to the nearest 0.1 cm with the use of a non-elastic tape and with the child standing,
105

Nutrients 2019, 11, 706
at the end of a gentle expiration. The measuring tape was placed around the trunk, at the level of theumbilicus, midway between the lower rib margin and the iliac crest.
2.11. Statistical Analysis
Normality of the distribution of continuous variables was analysed using the Kolmogorov-Smirnov test. Normally distributed continuous variables were expressed as Mean values (+/−StandardError of the Mean: SEM) and categorical variables were reported as frequencies (%). Associationsbetween continuous and categorical variables were examined using Student’s t-test for normallydistributed variables or the non-parametric Mann-Whitney test for skewed variables even thoughlogarithmic transformations were made. The associations between categorical variables were assessedusing the chi square (χ2) test. Repeated-measures ANOVA was used to evaluate the significanceof the differences among study groups at baseline and at the 3-month follow-up (treatment effect),the significance of the change from baseline to follow-up observed within each group (time effect)and the treatment × time interaction effect. The between-group factor was the study groups (i.e., IGcompared to CG) and the within-group factor was the time point of measurement. Adjustments werealso made for potential possible confounding factors. All reported p-values were based on two-sidedtests. The level of statistical significance in all analyses was set at p < 0.05. The SPSS vs. 24.0 (SPSS Inc.,Chicago, IL, USA) software was used for all statistical analyses.
3. Results
From the initial total sample of 80 children randomly allocated to the two study groups, 15 children(5 from the IG and 10 from the CG) could not be re-examined at follow-up. Figure 1 provides the flowdiagram of the study according to the CONSORT guidelines.
Figure 1. Flow diagram of study participants.
106

Nutrients 2019, 11, 706
The attrition resulted in a total sample of 65 children (35 in the IG and 30 in the CG) with fulldata at baseline and follow-up. The descriptive characteristics of these children and their parents atbaseline are summarised as mean (+/−SEM) or as percentages in Table 2. Regarding demographicindices, the mean age of children participating in the study was 9.7 (0.2) years, while the mean age offathers and mothers was 46.1 (0.3) and 41.2 (0.3) years, respectively. Furthermore, 24.6% of mothershad <9 years of education, which is the compulsory education level in Greece, while 42.6% had ahigher education of >12 years. Regarding behavioural indices, the mean dietary energy intake recordedfor children was 1535.6 (81.3) kcal per day with the percentage of energy coming in a descendingorder from carbohydrates (47.4%), fat (35.4%) and protein (18.5%), while the mean daily time spentby children on physical activity was 21.6 (2.3) min. As far as perinatal indices were concerned, themean birth weight and recumbent length of children was 3.2 (0.1) kg and 50.7 (0.4) cm, respectively,while mean maternal pre-pregnancy BMI was 24.9 (0.4) kg/m2, with 15.5% of mothers being obesebefore conception. Regarding anthropometric indices, children’s mean body weight, height, BMI andWC was 51.9 (1.9) kg, 142.4 (1.4) cm, 25.1 (0.5) kg/m2 and 79.9 (1.5) cm, respectively, with 60.7% ofchildren being obese. In addition, the mean BMI of fathers was 28.6 (0.4) kg/m2, with 27.6% of thembeing obese, while the mean BMI of mothers was 27.3 (0.4) kg/m2, with 31.6% of them being obese.Regarding differences between study groups, the mean BMI of mothers of children in the CG washigher than that of mothers of children in the IG (28.9 (1.2) vs. 26.0 (0.8) kg/m2; p = 0.045). No otherstatistically significant differences were observed between study groups.
Table 2. Descriptive characteristics of children and their parents at baseline.
Total Sample(n = 65)
Intervention Group(n = 35)
Control Group(n = 30)
p-Value 2
Data 1 on childrenAge (years) 9.7 (0.2) 9.8 (0.3) 9.6 (0.2) 0.447
Dietary energy intake (kcal/day) 1535.6 (81.3) 1552.2 (65.6) 1548.3 (74.1) 0.969Dietary protein intake (% of kcal) 18.5 (0.6) 18.3 (0.9) 19.2 (1.0) 0.511
Dietary carbohydrates intake (% of kcal) 47.4 (1.5) 47.1 (1.9) 46.3 (2.3) 0.790Dietary fat intake (% of kcal) 35.4 (1.4) 36.2 (1.8) 35.6 (2.1) 0.840Physical activity (min/day) 21.6 (2.3) 22.6 (3.0) 20.4 (3.5) 0.631
Birth weight (kg) 3.2 (0.1) 3.2 (0.1) 3.2 (0.1) 0.986Recumbent length at birth (cm) 50.7 (0.4) 50.7 (0.5) 50.6 (0.6) 0.905
Body weight (kg) 51.9 (1.9) 54.3 (2.4) 48.6 (2.7) 0.127BMI (kg/m2) 25.1 (0.5) 25.6 (0.7) 25.2 (0.7) 0.172
Overweight children (%) 39.3 42.4 35.7 0.593Obese children (%) 60.7 57.6 64.3 0.593
Height (cm) 142.4 (1.4) 143.5 (1.9) 141.3 (2.0) 0.415Waist circumference (cm) 79.9 (1.5) 81.0 (2.3) 78.3 (2.1) 0.388
Data 1 on parentsMother’s pre-pregnancy BMI (kg/m2) 24.9 (0.4) 23.8 (0.7) 26.2 (1.0) 0.055Obese mothers before pregnancy (%) 15.5 9.1 24.0 0.163
Father’s age (years) 46.1 (0.3) 45.5 (0.8) 46.7 (1.0) 0.341Mother’s age (years) 41.2 (0.3) 40.9 (0.9) 41.6 (1.0) 0.656
Mother’s education < 9 years (%) 24.6 24.2 25.0 0.535Mother’s education > 12 years (%) 42.6 48.5 35.7 0.535
Father’s BMI (kg/m2) 28.6 (0.4) 29.1 (1.0) 28.1 (0.9) 0.452Obese father (%) 27.6 37.5 15.4 0.084
Mother’s BMI (kg/m2) 27.3 (0.4) 26.0 (0.8) 28.9 (1.2) 0.045
Obese mother (%) 31.6 24.2 41.7 0.3031 Data are presented as Mean (SEM) in the case of continuous variables and as percentages (%) in the case ofcategorical variables, 2 p-values derived from Student’s t-test or the non-parametric Mann-Whitney test in the caseof continues variables and the Pearson chi-square test in the case of categorical variables. Figures in bold highlightstatistically significant p-values.
107

Nutrients 2019, 11, 706
The mean (SEM) values at baseline and follow-up examination, as well as the mean (95% CI)changes from baseline to follow-up, for both study groups with regards to children’s dietary intakeof energy, macro- and micro-nutrients are presented in Table 3. Regarding dietary energy intake,no significant differences were observed between groups regarding the changes from baseline tofollow-up, despite the decrease observed in the IG and the increase in the CG. As far as macronutrientintake was concerned, the increase observed in the IG for dietary fibre intake (4.1, 95% CI: 1.4 to 6.8)was higher than the non-significant change recorded in the CG (p = 0.005). In addition, sucrose intakedecreased significantly only in the IG (−4.6, 95% CI: −8.8 to −0.3), although no significant differenceswere observed between study groups. Regarding micronutrient intake, significant increases wereobserved in the IG for iron (2.6, 95% CI: 0.2 to 5.0), zinc (1.7, 95% CI: 0.1 to 3.3) and magnesium intake(36.6, 95% CI: 9.4 to 63.8). In the case of magnesium, the significant increase observed in the IG wasalso higher than the change observed in the CG (p = 0.011). Lastly, a significant decrease was observedfor vitamin C intake in the CG (−28.4, 95% CI: −53.6 to −3.1), although no group difference was foundwith regards to the changes from baseline to follow-up. No other significant changes within groupsor differences between study groups were observed in the dietary intake of the rest of macro- andmicro-nutrients, despite the fact that some of the changes were more favourable in the IG than the CG(e.g., for calcium, potassium, sodium, vitamin A and vitamin D).
Table 3. Changes in dietary intake indices from baseline to follow-up.
BaselineMean (SEM)
Follow-UpMean (SEM)
Mean Change (95% CI)(Time Effect)
p-Value †
Dietary energy intake (kcal/day) 0.207Intervention Group (n = 35) 1552.2 (65.6) 1467.6 (73.5) −84.7 (−229.7 to 60.3)Control Group (n = 30) 1548.3 (74.1) 1605.9 (83.0) 57.6 (−106.3 to 221.5)p-value (Treatment effect) 0.969 0.225
Dietary protein intake (% of kcal) 0.712Intervention Group (n = 35) 18.3 (0.9) 17.5 (1.0) −0.8 (−3.1 to 1.5)Control Group (n = 30) 19.2 (1.0) 19.1 (1.1) −0.1 (−2.8 to 2.1)p-value 0.511 0.308
Dietary carbohydrates intake (% of kcal) 0.777Intervention Group (n = 35) 47.1 (1.9) 46.4 (1.6) −0.7 (−4.5 to 3.1)Control Group (n = 30) 46.3 (2.3) 44.7 (1.9) −1.6 (−6.1 to 2.9)p-value (Treatment effect) 0.790 0.514
Dietary fat intake (% of kcal) 0.796Intervention Group (n = 35) 37.5 (1.7) 36.2 (1.8) −1.3 (−4.8 to 2.2)Control Group (n = 30) 35.6 (2.1) 37.7 (2.0) 2.1 (−2.1 to 6.2)p-value (Treatment effect) 0.840 0.953
Saturated fat intake (% of kcal) 0.123Intervention Group (n = 35) 13.0 (0.8) 12.6 (0.7) −0.4 (−2.0 to 1.2)Control Group (n = 30) 12.9 (0.9) 14.4 (0.8) 1.5 (−0.3 to 3.3)p-value (Treatment effect) 0.887 0.099
Dietary cholesterol intake (mg/day) 0.733Intervention Group (n = 35) 288.9 (25.2) 245.1 (27.5) −43.6 (−112.7 to 25.5)Control Group (n = 30) 239.0 (22.3) 211.5 (24.4) −27.5 (−88.6 to 33.6)p-value (Treatment effect) 0.152 0.373
Dietary fibre intake (g/day) 0.047Intervention Group (n = 35) 13.0 (1.2) 17.1 (1.5) 4.1 (1.4 to 6.8)Control Group (n = 30) 11.9 (1.3) 12.0 (1.7) 0.2 (−2.9 to 3.3)p-value (Treatment effect) 0.534 0.033
Sucrose intake (g/day) 0.680Intervention Group (n = 35) 16.0 (2.4) 11.4 (1.6) −4.6 (−8.8 to −0.3)Control Group (n = 30) 11.9 (2.7) 8.7 (1.8) −3.2 (−8.0 to 1.7)p-value (Treatment effect) 0.279 0.267
108

Nutrients 2019, 11, 706
Table 3. Cont.
BaselineMean (SEM)
Follow-UpMean (SEM)
Mean Change (95% CI)(Time Effect)
p-Value †
Calcium intake (mg/day) 0.067Intervention Group (n = 35) 769.0 (143.6) 913.8 (60.1) 144.9 (−165.0 to 454.6)Control Group (n = 30) 1203.3 (162.4) 903.9 (67.9) −299.3 (−649.5 to 50.9)p-value (Treatment effect) 0.053 0.915
Iron intake (mg/day) 0.099Intervention Group (n = 35) 10.7 (0.9) 13.3 (1.0) 2.6 (0.2 to 5.0)Control Group (n = 30) 11.9 (1.3) 11.4 (1.1) −0.5 (−3.2 to 2.2)p-value (Treatment effect) 0.370 0.211
Potassium intake (mg/day) 0.116Intervention Group (n = 35) 1888.1 (141.6) 2052.6 (147.3) 169.5 (−110.4 to 449.4)Control Group (n = 30) 2119.2 (160.1) 1945.6 (166.5) −173.6 (−490.0 to 142.7)p-value (Treatment effect) 0.292 0.622
Magnesium intake (mg/day) 0.011Intervention Group (n = 35) 192.1 (13.2) 228.7 (13.4) 36.6 (9.4 to 63.8)Control Group (n = 30) 228.0 (14.9) 209.8 (15.1) −18.2 (−49.0 to 12.5)p-value (Treatment effect) 0.081 0.359
Zinc intake (mg/day) 0.066Intervention Group (n = 35) 7.6 (0.6) 9.3 (0.7) 1.7 (0.1 to 3.3)Control Group (n = 30) 9.6 (0.7) 9.0 (0.8) −0.6 (−2.3 to 1.2)p-value (Treatment effect) 0.031 0.768
Sodium intake (mg/day) 0.135Intervention Group (n = 35) 1717.1 (210.4) 1426.2 (129.2) −290.9 (−745.4 to 163.7)Control Group (n = 30) 1550.4 (237.8) 1788.3 (146.1) 238.0 (−275.9 to 751.8)p-value (Treatment effect) 0.608 0.073
Vitamin A intake (RE/day) 0.137Intervention Group (n = 35) 616.7 (122.9) 888.2 (243.5) 271.5 (−256.1 to 799.1)Control Group (n = 30) 670.4 (139.0) 330.5 (275.3) −339.9 (−936.2 to 256.5)p-value (Treatment effect) 0.777 0.141
Vitamin C intake (μg/day) 0.655Intervention Group (n = 35) 81.5 (11.3) 60.9 (8.9) −20.6 (−42.9 to 1.7)Control Group (n = 30) 70.2 (12.9) 41.9 (10.0) −28.4 (−53.6 to −3.1)p-value (Treatment effect) 0.522 0.168
Vitamin D intake (IU/day) 0.120Intervention Group (n = 35) 93.2 (21.3) 107.9 (16.6) 14.6 (−29.2 to 58.4)Control Group (n = 30) 145.2 (24.1) 106.8 (18.7) −38.4 (−87.9 to 11.1)p-value (Treatment effect) 0.117 0.965
† p-values indicate the significance of the treatment × time interaction effects; adjustments were made for maternalBMI. Figures in bold highlight statistically significant p-values or statistically significant mean changes from baselineto follow-up.
Table 4 depicts the changes in the consumption of specific food items and the relevant differencesbetween the two study groups. More specifically, children in the IG had a higher mean consumptionof cereals at follow-up than children in the CG (0.78 (0.11) vs. 0.43 (0.12), p = 0.041). In addition, theconsumption of yogurt decreased significantly only in the CG (−0.23, 95% CI: −0.42 to −0.50), whilethe consumption of chocolates (−0.32, 95% CI: −0.52 to −0.11), cakes (−0.13, 95% CI: −0.23 to −0.02)and chips (−0.08, 95% CI: −0.13 to −0.03) decreased significantly only in the IG. The changes observedfor the consumption of yogurt (p = 0.005) and chocolates (p = 0.025) were significantly different betweenthe two study groups.
109

Nutrients 2019, 11, 706
Table 4. Food intake from baseline to follow-up.
BaselineMean (SEM)
Follow-UpMean (SEM)
Mean Change (95% CI)(Time Effect)
p-Value †
Fruits intake (portions/day) 0.236Intervention Group (n = 35) 1.14 (0.15) 1.26 (0.14) 0.12 (−0.18 to 0.41)Control Group (n = 30) 1.25 (0.18) 1.09 (0.17) −0.16 (−0.52 to 0.19)p-value (Treatment effect) 0.643 0.455
Vegetables intake (portions/day) 0.941Intervention Group (n = 35) 0.94 (0.11) 0.93 (0.07) −0.01 (−0.25 to 0.23)Control Group (n = 30) 0.87 (0.13) 0.88 (0.09) 0.03 (−0.27 to 0.29)p-value (Treatment effect) 0.701 0.665
Cereals intake (portions/day) 0.446Intervention Group (n = 35) 0.62 (0.10) 0.78 (0.11) 0.16 (−0.09 to 0.41)Control Group (n = 30) 0.42 (0.12) 0.43 (0.12) −0.01 (−0.29 to 0.30)p-value (Treatment effect) 0.208 0.041
Fish intake (portions/day) 0.502Intervention Group (n = 35) 0.16 (0.02) 0.35 (0.11) 0.19 (−0.04 to 0.41)Control Group (n = 30) 0.15 (0.02) 0.22 (0.13) 0.07 (−0.20 to 0.33)p-value (Treatment effect) 0.565 0.440
Milk intake (portions/day) 0.272Intervention Group (n = 35) 1.05 (0.11) 1.17 (0.15) 0.11 (−0.21 to 0.43)Control Group (n = 30) 1.02 (0.17) 1.18 (0.13) 0.17 (−0.21 to 0.54)p-value (Treatment effect) 0.819 0.955
Yogurt intake (portions/day) 0.005Intervention Group (n = 35) 0.22 (0.07) 0.34 (0.04) 0.12 (−0.04 to 0.27)Control Group (n = 30) 0.50 (0.08) 0.26 (0.04) −0.23 (−0.42 to −0.50)p-value (Treatment effect) 0.017 0.177
Chocolates intake (portions/day) 0.025Intervention Group (n = 35) 0.70 (0.09) 0.39 (0.06) −0.32 (−0.52 to −0.11)Control Group (n = 30) 0.55 (0.10) 0.59 (0.08) 0.05 (−0.19 to 0.28)p-value (Treatment effect) 0.268 0.044
Fizzy drinks intake (portions/day) 0.707Intervention Group (n = 35) 0.08 (0.03) 0.08 (0.03) 0.004 (−0.05 to 0.06)Control Group (n = 30) 0.11 (0.03) 0.10 (0.03) −0.01 (−0.08 to 0.06)p-value (Treatment effect) 0.366 0.676
Cakes intake (portions/day) 0.317Intervention Group (n = 35) 0.18 (0.05) 0.05 (0.01) −0.13 (−0.23 to −0.02)Control Group (n = 30) 0.10 (0.07) 0.06 (0.01) −0.04 (−0.17 to 0.08)p-value (Treatment effect) 0.268 0.044
Chips intake (portions/day) 0.397Intervention Group (n = 35) 0.14 (0.03) 0.06 (0.01) −0.08 (−0.13 to −0.03)Control Group (n = 30) 0.09 (0.03) 0.04 (0.01) −0.05 (−0.11 to 0.02)p-value (Treatment effect) 0.249 0.221
† p-values indicate the significance of the treatment × time interaction effects; adjustments were made for maternalBMI. Figures in bold highlight statistically significant p-values or statistically significant mean changes from baselineto follow-up.
The changes from baseline to follow-up, as well as the differences between study groups withregards to anthropometric indices are presented in Table 5. Body weight and WC increased significantlyonly in the CG by 1.4 kg (95% CI 0.3 to 2.6) and 2.1 cm (95% CI 0.7 to 3.5), respectively, height increasedsignificantly in both study groups by 2.0 cm (95% CI 1.5 to 2.5) in the IG and by 1.6 cm (95% CI 1.0 to2.1) in the CG, while BMI and BMI z-score decreased significantly only in the IG by 0.4 kg (95% CI−0.9 to −0.1) and 0.2 standard deviations (−0.3 to 0.05). Nevertheless, these changes were not foundto differentiate significantly between the two study groups.
110

Nutrients 2019, 11, 706
Table 5. Anthropometric indices from baseline to follow-up.
BaselineMean (SEM)
Follow-UpMean (SEM)
Mean Change (95% CI)(Time Effect)
p-Value †
Body weight (kg) 0.360Intervention Group (n = 35) 54.3 (2.4) 55.0 (2.4) 0.7 (−0.3 to 1.7)Control Group (n = 30) 48.6 (2.7) 50.0 (2.7) 1.4 (0.3 to 2.6)p-value (Treatment effect) 0.127 0.174
Height (cm) 0.120Intervention Group (n = 35) 143.5 (1.9) 145.5 (1.8) 2.0 (1.5 to 2.5)Control Group (n = 30) 141.3 (2.0) 142.7 (2.0) 1.6 (1.0 to 2.1)p-value (Treatment effect) 0.415 0.304
BMI (kg/m2) 0.112Intervention Group (n = 35) 25.6 (0.7) 25.2 (0.7) −0.4 (−0.9 to −0.1)Control Group (n = 30) 24.1 (0.9) 24.3 (0.8) 0.2 (−0.4 to 0.8)p-value (Treatment effect) 0.172 0.389
BMI z-score 0.318Intervention Group (n = 35) 2.6 (0.2) 2.5 (0.1) −0.2 (−0.3 to 0.05)Control Group (n = 30) 2.8 (0.2) 2.8 (0.2) 0.1 (−0.02 to 0.2)p-value (Treatment effect)
Waist circumference (cm) 0.144Intervention Group (n = 35) 81.0 (2.3) 81.6 (2.3) 0.6 (−0.9 to 2.1)Control Group (n = 30) 78.3 (2.1) 80.4 (2.1) 2.1 (0.7 to 3.5)p-value (Treatment effect) 0.388 0.705
† p-values indicate the significance of the treatment × time interaction effects; adjustments were made for maternalBMI. Figures in bold highlight statistically significant p-values or statistically significant mean changes from baselineto follow-up.
4. Discussion
The current randomised controlled trial showed that a computerised DST designed to assistpaediatric healthcare professionals in providing personalised nutrition and lifestyle optimisationrecommendations to overweight or obese children and their parents, can result in favourable changesto certain dietary intake and anthropometric indices in the children that received the intervention.The findings of this study support the growing, although still limited, body of evidence regarding theeffectiveness of computerised or eHealth DSTs used in primary care settings for improving clinicians’performance on childhood obesity management outcomes [22,23].
Health professionals have the potential to influence large numbers of patients. Up to date therehas been little evidence on how clinical practice can be enhanced in order to assist children (and theirparents) in achieving appropriate to their weight status and sustainable weight management. The roleof new technology, through the development of appropriate computerised or e-Health tools, seems tobe the way forward. Although there are currently several computerised or e-Health tools designed topromote personalised advice on weight management in children, the vast majority of those do notinvolve health professionals in the implementation process [24]. Even in the case of e-Health toolsthat are targeting health professionals, in most of the occasions their usability has been described asdifficult [22,24]. As such, in the HopSCOTCH Shared-Care Obesity Trial in Australia, the generalpractitioners (GPs) that used the relevant e-Health tool to deliver the personalised intervention tochildren and their parents, characterised implementation as challenging and usability of the tool aspoor, mainly due to technical reasons, such as out-dated hardware, software installation difficultiesand poor internet connections [22].
Despite the scarcity of tools supporting paediatric healthcare professionals on children’s weightmanagement, Taveras et al. [23,25] developed a computerised tool very similar to the DST developed inthe current study. The effectiveness of this tool was examined in the “Study of Technology to AccelerateResearch” (STAR), which was a three-arm, cluster-randomised controlled trial that was implementedin 14 paediatric offices in Massachusetts and on 800, 6 to 12-year-old, obese children [25]. After12 months of intervention, the STAR trial reported a lower increase in BMI in children randomised in
111

Nutrients 2019, 11, 706
the study group that received the personalised advice via the use of the DST by paediatric healthcareprofessionals compared to the control group that received the usual care offered in the participatingpaediatric offices (mean adjusted BMI change difference: −0.51 kg/m2; 95% CI −0.91 to −0.11) [23].The aforementioned results of the STAR study agree with the findings of our study, which -althoughthey included a smaller sample size of 65 children and had a shorter duration of 3 months- reported amean adjusted BMI change difference of −0.6 kg/m2 in the IG, compared to the CG. Similarly to theSTAR trial, the effect of the intervention implemented in the current study on BMI also exceeded themean adjusted change difference observed in other primary-care intervention trials, such as the “Live,Eat and Play” (LEAP) study (mean adjusted BMI change difference: −0.20 after 9 months) [26],the LEAP-2 study (mean adjusted BMI change difference: −0.11 after 12 months) [27] and the“Shared-Care Obesity Trial in Children” (HopSCOTCH) study (mean adjusted BMI change difference:(−0.10 after 12 months) [28]. In addition to BMI, the significant increase in waist circumferenceobserved only in the CG is another indication of the effectiveness of the current RCT in controllingchildren’s central body fat deposition more effectively than in the CG. The mean adjusted differenceof −1.5 cm observed in this study, in the changes of WC between the IG and the CG, is similar tothe relevant difference of −1.7 cm, observed in the HopSCOTCH study. However, considering thatthe HopSCOTCH study was also conducted with a greater sample size (i.e., 107 children) and had alonger duration (i.e., 12 months), this probably highlights the promising potential of the tools that weredeveloped and tested in this study, with regards to the effective management of childhood obesity.
The changes observed in the IG on BMI and WC, could be partly a reflection of the relevantfavourable dietary changes recorded for the IG, compared to the CG. In this regard, the higher increasein dietary fibre intake in the IG than the CG and the significant decrease of dietary sucrose intake onlyin the IG are probably indicative of the effectiveness of the intervention in increasing the consumptionof high-fibre foods that promote satiety and at the same time in decreasing the consumption of foodswith a high sugar and, thus, high energy content. The aforementioned changes were also evidencedby the higher consumption of cereals at follow-up in the IG than the CG, as well as the significantdecrease in the consumption of chocolates and cakes only in the IG. The above, in conjunction withthe decrease in the consumption of chips in the IG, could possibly provide a basis that supports alower dietary energy intake and consequently the favourable anthropometric changes observed forchildren in the IG. In line with the findings of the present study, the HopSCOTCH study also reporteda higher diet quality score (reflected by the higher consumption of fruit, vegetables and water and bythe lower consumption of fatty/sugary foods and non-diet sweet drinks) among 3–10-year-old obesechildren that received dietary and lifestyle optimisation advice for their weight management througha web-based software [28]. The fact that the HopSCOTCH study reported no significant differencesbetween groups in the change of children’s physical activity levels from baseline to follow-up, indicatesthat any favourable changes observed in this study on the examined anthropometric indices are mainlyattributed to the improvement of dietary habits in the intervention compared to the control treatmentarm. To some extent, the same also applies in our study, as physical activity levels did not differentiatebetween the IG and the CG (data not shown).
Obesity in children has been strongly linked to important micronutrient insufficiencies, whichis usually the outcome of a chronic, low-grade inflammation induced by the elevated levels ofvisceral adipose tissue [2]. As such, the DST was designed to assist children that received thepersonalised advice to achieve, not only a better management of their body weight, but also a higherintake of several essential micronutrients. This was evidenced by the significant increases in thedietary intakes of iron, magnesium and zinc observed only in the IG, which can correct potentialobesity-related insufficiencies [3] and can subsequently support children’s growth, motor and cognitivefunction [29–31]. In addition, since hypertension is another common comorbidity of obesity inchildren [32], the dietary recommendations provided to children (particularly to those diagnosed withelevated blood pressure) and their parents via the DST, were also aiming to reduce the use of table salt,as well as the consumption of foods that are rich sources of salt in the diet. The significant decrease
112

Nutrients 2019, 11, 706
in dietary sodium intake observed in the present study only in the IG provides evidence that thisadditional aim of the intervention was partially achieved.
Our study has both strengths and limitations. The main strength was its randomised controlleddesign resulting in a homogeneity of children’s characteristics at baseline in both treatment arms.Another strength was the use of the DST to guide clinicians on effectively managing children’selevated body weight, by accurately assessing their nutritional status and needs and by providingappropriate dietary and lifestyle optimisation advice to children and their families, encouraging familyself-management of behavioural changes. As evidenced by the current and the STAR study [23],intervention approaches that involve self-guided behavioural changes by families may be better suitedto sustain the intensity required for effective behavioural change than those that primarily rely onhealthcare professionals to deliver the main bulk of the intervention [27]. In this context, the meal plansdelivered by the health professionals to the families in the present study were only a guide for healthiereating and not a prescriptive pathway that was compulsory for the children and their families to follow.The emphasis was given mainly to the recommendations and how families can adopt and embed asmany of these suggestions as possible to their daily life. Regarding additional strengths, accordingto qualitative feedback collected from the clinicians that used the DST, the paediatricians reportedthat the tool was quite easy to use (it runs with Microsoft Excel and/or Access) and represented awell-structured and quick procedure that helped them provide tailored advice to children and families.As far as limitations are concerned, although the study initially recruited 80 children, only 65 wereexamined at follow-up, resulting in a drop-out rate of approximately 19%. Nevertheless, the factthat only 5 out of 15 study participants that dropped out were originally allocated to the IG is anindication that the intervention was better accepted, increasing retention rates in the IG children andtheir families, compared to the CG that received only generic advice.
5. Conclusions
The current study showed that a computerised DST, designed to support paediatric healthcareprofessionals in the delivery of personalised diet and lifestyle optimisation advice to overweightor obese children and their families, resulted in improvement of the children’s dietary intake andBMI. These changes are indicative of the dynamics of the tool in supporting clinicians to improve theeffectiveness of care. Interventions of longer duration and larger sample sizes are needed to confirmthe findings of our study and to demonstrate their long-term sustainability.
Supplementary Materials: The following are available online at http://www.mdpi.com/2072-6643/11/3/706/s1,Figure S1: Decision-tree algorithms, Table S1: Dietary and Lifestyle Optimisation Recommendations, Table S2:Weekly Meal Plans.
Author Contributions: Conceptualization and project administration, G.M. and Y.M.; Methodology preparation,software preparation, statistical analyses and funding acquisition, G.M.; Investigation, G.M., M.M., E.V., S.M.,E.C., G.P.C. and Y.M.; Resources, G.M., E.V., S.M., E.C., G.P.C., K.T. and Y.M.; writing—original draft preparation,All authors; supervision, G.M., M.M., E.V., S.M., E.C., G.P.C. and Y.M.
Funding: This research is implemented through IKY scholarships programme and co-financed by the EuropeanUnion (European Social Fund—ESF) and Greek national funds through the action entitled “Reinforcement ofPostdoctoral Researchers”, in the framework of the Operational Programme “Human Resources DevelopmentProgram, Education and Lifelong Learning” of the National Strategic Reference Framework (NSRF) 2014–2020.
Acknowledgments: The authors would like to thank all research members involved in the data collectionas well as all study participants for their collaboration. The authors would also like to thank KonstantinaTsoutsoulopoulou, dietitian, and Sofia Tanagra, nutrition expert, for their contribution in the development of thepersonalised recommendations and meal plans at the different caloric levels.
Conflicts of Interest: The authors declare no conflict of interest.
References
1. Waxman, A. WHO global strategy on diet, physical activity and health. Food Nutr. Bull. 2004, 25, 292–302.[CrossRef]
113
Nutrients 2019, 11, 706
2. Subramanian, V.; Ferrante, A.W., Jr. Obesity, inflammation, and macrophages. Nestle Nutr. Workshop Ser.Pediatr. Program 2009, 63, 151–159.
3. Manios, Y.; Moschonis, G.; Chrousos, G.P.; Lionis, C.; Mougios, V.; Kantilafti, M.; Tzotzola, V.; Skenderi, K.P.;Petridou, A.; Tsalis, G.; et al. The double burden of obesity and iron deficiency on children and adolescentsin Greece: The Healthy Growth Study. J. Hum. Nutr. Diet. 2013, 26, 470–478. [CrossRef] [PubMed]
4. Moschonis, G.; Androutsos, O.; Hulshof, T.; Dracopoulou, M.; Chrousos, G.P.; Manios, Y. Vitamin Dinsufficiency is associated with insulin resistance independently of obesity in primary schoolchildren. Thehealthy growth study. Pediatr. Diabetes 2018, 19, 866–873. [CrossRef] [PubMed]
5. Dombrowski, S.U.; Knittle, K.; Avenell, A.; Araujo-Soares, V.; Sniehotta, F.F. Long term maintenance of weightloss with non-surgical interventions in obese adults: Systematic review and meta-analyses of randomisedcontrolled trials. BMJ 2014, 348, g2646. [CrossRef] [PubMed]
6. Birbilis, M.; Moschonis, G.; Mougios, V.; Manios, Y. Obesity in adolescence is associated with perinatal riskfactors, parental BMI and sociodemographic characteristics. Eur. J. Clin. Nutr. 2013, 67, 115–121. [CrossRef][PubMed]
7. Desai, M.; Beall, M.; Ross, M.G. Developmental origins of obesity: Programmed adipogenesis. Curr. Diab. Rep.2013, 13, 27–33. [CrossRef]
8. Booth, H.P.; Prevost, T.A.; Wright, A.J.; Gulliford, M.C. Effectiveness of behavioural weight loss interventionsdelivered in a primary care setting: A systematic review and meta-analysis. Fam. Pract. 2014, 31, 643–653.[CrossRef]
9. Dattilo, A.M.; Birch, L.; Krebs, N.F.; Lake, A.; Taveras, E.M.; Saavedra, J.M. Need for early interventionsin the prevention of pediatric overweight: A review and upcoming directions. J. Obes. 2012, 2012, 123023.[CrossRef] [PubMed]
10. Vignolo, M.; Rossi, F.; Bardazza, G.; Pistorio, A.; Parodi, A.; Spigno, S.; Torrisi, C.; Gremmo, M.; Veneselli, E.;Aicardi, G. Five-year follow-up of a cognitive-behavioural lifestyle multidisciplinary programme forchildhood obesity outpatient treatment. Eur. J. Clin. Nutr. 2008, 62, 1047–1057. [CrossRef]
11. Visram, S.; Hall, T.D.; Geddes, L. Getting the balance right: Qualitative evaluation of a holistic weightmanagement intervention to address childhood obesity. J. Public Health 2013, 35, 246–254. [CrossRef][PubMed]
12. Barratt, J. Diet-related knowledge, beliefs and actions of health professionals compared with the generalpopulation: An investigation in a community Trust. J. Hum. Nutr. Diet. 2001, 14, 25–32. [CrossRef] [PubMed]
13. Hankey, C.R.; Eley, S.; Leslie, W.S.; Hunter, C.M.; Lean, M.E.J. Eating habits, beliefs, attitudes and knowledgeamong health professionals regarding the links between obesity, nutrition and health. Public Health Nutr.2007, 7, 337–343. [CrossRef] [PubMed]
14. World Health Organization. Nutrition for Health and Development. In WHO Child Growth Standards:Length/Height-for-Age, Weight-for-Age, Weight-for-Length, Weight-for-Height and Body Mass Index-for-Age:Methods and Development; World Health Organization: Geneva, Switzerland, 2006.
15. Manios, Y.; Birbilis, M.; Moschonis, G.; Birbilis, G.; Mougios, V.; Lionis, C.; Chrousos, G.P.; Healthy GrowthStudy Group. Childhood Obesity Risk Evaluation based on perinatal factors and family sociodemographiccharacteristics: CORE index. Eur. J. Pediatr. 2013, 172, 551–555. [CrossRef] [PubMed]
16. Manios, Y.; Vlachopapadopoulou, E.; Moschonis, G.; Karachaliou, F.; Psaltopoulou, T.; Koutsouki, D.;Bogdanis, G.; Carayanni, V.; Hatzakis, A.; Michalacos, S. Utility and applicability of the “Childhood ObesityRisk Evaluation” (CORE)-index in predicting obesity in childhood and adolescence in Greece from early life:The “National Action Plan for Public Health”. Eur. J. Pediatr. 2016, 175, 1989–1996. [CrossRef] [PubMed]
17. Barlow, S.E.; Expert, C. Expert committee recommendations regarding the prevention, assessment, andtreatment of child and adolescent overweight and obesity: Summary report. Pediatrics 2007, 120, S164–S192.[CrossRef]
18. Institute of Medicine. Dietary Reference Intakes for Energy, Carbohydrate, Fiber, Fat, Fatty Acids, Cholesterol,Protein and Amino Acids; National Academies Press: Washington, DC, USA, 2005.
19. National Dietary Guidelines for Infants, Children and Adolescents. Available online: http://www.diatrofikoiodigoi.gr/?page=summary-children (accessed on 18 January 2018).
114

Nutrients 2019, 11, 706
20. Manios, Y.; Androutsos, O.; Lambrinou, C.P.; Cardon, G.; Lindstrom, J.; Annemans, L.; Mateo-Gallego, R.;de Sabata, M.S.; Iotova, V.; Kivela, J.; et al. A school- and community-based intervention to promote healthylifestyle and prevent type 2 diabetes in vulnerable families across Europe: Design and implementation of theFeel4Diabetes-study. Public Health Nutr. 2018, 21, 3281–3290. [CrossRef]
21. Roumelioti, M.; Leotsinidis, M. Relative validity of a semiquantitative food frequency questionnaire designedfor schoolchildren in western Greece. Nutr. J. 2009, 8, 8. [CrossRef] [PubMed]
22. Lycett, K.; Wittert, G.; Gunn, J.; Hutton, C.; Clifford, S.A.; Wake, M. The challenges of real-worldimplementation of web-based shared care software: The HopSCOTCH Shared-Care Obesity Trial in Children.BMC Med. Inform. Decis. Mak. 2014, 14, 61. [CrossRef]
23. Taveras, E.M.; Marshall, R.; Kleinman, K.P.; Gillman, M.W.; Hacker, K.; Horan, C.M.; Smith, R.L.; Price, S.;Sharifi, M.; Rifas-Shiman, S.L.; et al. Comparative effectiveness of childhood obesity interventions inpediatric primary care: A cluster-randomized clinical trial. JAMA Pediatr. 2015, 169, 535–542. [CrossRef]
24. Flodgren, G.; Goncalves-Bradley, D.C.; Summerbell, C.D. Interventions to change the behaviour of healthprofessionals and the organisation of care to promote weight reduction in children and adults withoverweight or obesity. Cochrane Database Syst. Rev. 2017, 11, CD000984. [CrossRef] [PubMed]
25. Taveras, E.M.; Marshall, R.; Horan, C.M.; Gillman, M.W.; Hacker, K.; Kleinman, K.P.; Koziol, R.; Price, S.;Simon, S.R. Rationale and design of the STAR randomized controlled trial to accelerate adoption of childhoodobesity comparative effectiveness research. Contemp. Clin. Trials 2013, 34, 101–108. [CrossRef] [PubMed]
26. McCallum, Z.; Wake, M.; Gerner, B.; Baur, L.A.; Gibbons, K.; Gold, L.; Gunn, J.; Harris, C.; Naughton, G.;Riess, C.; et al. Outcome data from the LEAP (Live, Eat and Play) trial: A randomized controlled trial of aprimary care intervention for childhood overweight/mild obesity. Int. J. Obes. 2007, 31, 630–636. [CrossRef][PubMed]
27. Wake, M.; Baur, L.A.; Gerner, B.; Gibbons, K.; Gold, L.; Gunn, J.; Levickis, P.; McCallum, Z.; Naughton, G.;Sanci, L.; et al. Outcomes and costs of primary care surveillance and intervention for overweight or obesechildren: The LEAP 2 randomised controlled trial. BMJ 2009, 339, b3308. [CrossRef] [PubMed]
28. Wake, M.; Lycett, K.; Clifford, S.A.; Sabin, M.A.; Gunn, J.; Gibbons, K.; Hutton, C.; McCallum, Z.; Arnup, S.J.;Wittert, G. Shared care obesity management in 3–10 year old children: 12 month outcomes of HopSCOTCHrandomised trial. BMJ 2013, 346, f3092. [CrossRef]
29. Huma, N.; Salim Ur, R.; Anjum, F.M.; Murtaza, M.A.; Sheikh, M.A. Food fortification strategy—Preventingiron deficiency anemia: A review. Crit. Rev. Food Sci. Nutr. 2007, 47, 259–265. [CrossRef]
30. Kawade, R. Zinc status and its association with the health of adolescents: A review of studies in India.Glob. Health Action 2012, 5, 7353. [CrossRef] [PubMed]
31. Kurpad, A.V.; Edward, B.S.; Aeberli, I. Micronutrient supply and health outcomes in children. Curr. Opin.Clin. Nutr. Metab. Care 2013, 16, 328–338. [CrossRef] [PubMed]
32. Manios, Y.; Karatzi, K.; Moschonis, G.; Ioannou, G.; Androutsos, O.; Lionis, C.; Chrousos, G. Lifestyle,anthropometric, socio-demographic and perinatal correlates of early adolescence hypertension: The HealthyGrowth Study. Nutr. Metab. Cardiovasc. Dis. 2018. [CrossRef]
© 2019 by the authors. Licensee MDPI, Basel, Switzerland. This article is an open accessarticle distributed under the terms and conditions of the Creative Commons Attribution(CC BY) license (http://creativecommons.org/licenses/by/4.0/).
115

nutrients
Article
The Type 2 Diabetes Susceptibility PROX1 GeneVariants Are Associated with Postprandial PlasmaMetabolites Profile in Non-Diabetic Men
Edyta Adamska-Patruno 1,*, Joanna Godzien 1, Michal Ciborowski 1, Paulina Samczuk 1,
Witold Bauer 1, Katarzyna Siewko 2, Maria Gorska 2, Coral Barbas 3 and Adam Kretowski 1,2
1 Clinical Research Centre, Medical University of Bialystok, 15-089 Bialystok, Poland;[email protected] (J.G.); [email protected] (M.C.); [email protected] (P.S.);[email protected] (W.B.); [email protected] (A.K.)
2 Department of Endocrinology, Diabetology and Internal Medicine, Medical University of Bialystok,15-089 Bialystok, Poland; [email protected] (K.S.); [email protected] (M.G.)
3 Center for Metabolomics and Bioanalysis (CEMBIO), Universidad CEU San Pablo, 28003 Madrid, Spain;[email protected]
* Correspondence: [email protected]; Tel.: +48-85-746-8153
Received: 11 March 2019; Accepted: 17 April 2019; Published: 19 April 2019
Abstract: The prospero homeobox 1 (PROX1) gene may show pleiotropic effects on metabolism.We evaluated postprandial metabolic alterations dependently on the rs340874 genotypes, and 28non-diabetic men were divided into two groups: high-risk (HR)-genotype (CC-genotype carriers,n = 12, 35.3 ± 9.5 years old) and low-risk (LR)-genotype (allele T carriers, n = 16, 36.3 ± 7.0 yearsold). Subjects participated in two meal-challenge-tests with high-carbohydrate (HC, carbohydrates89%) and normo-carbohydrate (NC, carbohydrates 45%) meal intake. Fasting and 30, 60, 120, and180 min after meal intake plasma samples were fingerprinted by liquid chromatography quadrupoletime-of-flight mass spectrometry (LC-QTOF-MS). In HR-genotype men, the area under the curve(AUC) of acetylcarnitine levels was higher after the HC-meal [+92%, variable importance in theprojection (VIP) = 2.88] and the NC-meal (+55%, VIP = 2.00) intake. After the NC-meal, the HR-riskgenotype carriers presented lower AUCs of oxidized fatty acids (−81–66%, VIP = 1.43–3.16) andhigher linoleic acid (+80%, VIP = 2.29), while after the HC-meal, they presented lower AUCs ofornithine (−45%, VIP = 1.83), sphingosine (−48%, VIP = 2.78), linoleamide (−45%, VIP = 1.51), andseveral lysophospholipids (−40–56%, VIP = 1.72–2.16). Moreover, lower AUC (−59%, VIP = 2.43)of taurocholate after the HC-meal and higher (+70%, VIP = 1.42) glycodeoxycholate levels afterthe NC-meal were observed. Our results revealed differences in postprandial metabolites frominflammatory and oxidative stress pathways, bile acids signaling, and lipid metabolism in PROX1HR-genotype men. Further investigations of diet–genes interactions by which PROX1 may promoteT2DM development are needed.
Keywords: nutrigenetics; nutrimetabolomics; high-carbohydrate meal; normo-carbohydrate meal;postprandial metabolic fingerprinting; ultra-high performance liquid chromatography; PROX1 gene;type 2 diabetes mellitus risk
1. Introduction
Type 2 diabetes mellitus (T2DM) is a major public health issue affecting 415 million peopleworldwide in 2015 [1], and it is expected that it will affect over 439 million people by 2030 [2] and642 million by 2040 [1]. The T2DM is characterized by impaired β-cell function and insulin resistance,which leads to chronic hyperglycemia [3].
Nutrients 2019, 11, 882; doi:10.3390/nu11040882 www.mdpi.com/journal/nutrients116

Nutrients 2019, 11, 882
The Genome-Wide Association Studies (GWAS) and other, different scale meta-analyses andstudies have indicated that the rs340874 single nucleotide polymorphism (SNP) in the prosperohomeobox 1 (PROX1) gene is a strong genetic susceptibility factor for T2DM [4–6]. It has been shownthat allele C of rs340874 is associated with reduced insulin sensitivity, β-cell function, insulin secretion,and fasting glucose levels [7–9]. PROX1 encodes a key transcription factor (TF), which is involved inthe development of tissues such as pancreas [10]. It has been also suggested that reduced expressionof PROX1 results in altered β-cell insulin secretion and thereby confers the T2DM susceptibility [5].In one of our previous studies [11], we noted that carriers of the rs340874 PROX1 CC genotypepresented higher free fatty acids levels after a high-fat meal intake and lower glucose utilization after ahigh-carbohydrate meal intake. Moreover, in subjects carrying the CC genotype, we found highervisceral fat accumulation despite lower daily food consumption, which indicates that another potentialpathway may be involved in T2DM development in people at high genetic risk. Taken together, thestudies show that PROX1 variants may have a pleiotropic effect on metabolism; however, the linkbetween PROX1 and T2DM has not been established to date. Detailed characterization of PROX1genetic variability can help to elucidate the role of PROX1 gene variations in T2DM development andto explore its potential pathways.
We hypothesize that one of the pathways involved in the T2DM development in subjects withthe PROX1 rs340874 CC genotype may be a lipid metabolism path, and its further oxidative stressconsequences can be modulated by different diets with varying macronutrients content. In our previousstudies, we found that some subtle metabolism alterations are detectable only postprandially, andsince most of the daytime people spend in the post absorptive state, the postprandial metabolism mayplay a crucial role in metabolic disorders development and/or progression [12]. We observed in ourstudied group that the differences in the postprandial metabolic response depend on many factorssuch as actual nutritional status [13–15] but also depend on genotype [11,16,17].
Studies carried out so far—as well as our own observations—indicate that the mechanismsby which the PROX1 gene affects the susceptibility to T2DM seem to be more complex. Therefore,for further investigation, we used the metabolomics approach. We used a liquid chromatographyquadrupole time-of-flight mass spectrometry (LC-QTOF-MS) to evaluate postprandial changes in serummetabolites during the high-carbohydrate (HC) and normo-carbohydrate (NC) meal-challenge-tests innon-diabetic men dependent on the PROX1 rs340874 genotypes.
2. Materials and Methods
2.1. Subjects
The volunteers for our meal test study [14–17] were recruited from the 1000PLUS cohort studyof Polish origin Caucasian population [11,18,19]. This trial was registered at www.clinicaltrials.govas NCT03792685. Only males were enrolled into the meal-challenge-tests because of the possiblesexual dimorphism of investigated factors [20]. The study participants (n = 28) were divided into2 groups dependent on the PROX1 rs340874 genotypes: the homozygous carriers of high-risk (HR)allele C (CC genotype, n = 12) and carriers of low-risk (LR) allele T (both CT and TT genotypes, n = 16).None of the participants suffered from T2DM, prediabetes, or other disorders, nor did they report anytreatments that might affect the tests results. Subjects who followed any special diet or dietary patterns(vegetarian, high-fat, etc.) were excluded from the experiment.
2.2. Ethics
The study procedures were conducted in accordance with all of the ethical standards of humanexperimentation and with the Declaration of Helsinki. The study protocol was approved by the localEthics Committee (Medical University of Bialystok, Poland, R-I-002/35/2009), and before any studyprocedures, all of the participants signed informed consent.
117

Nutrients 2019, 11, 882
2.3. Study Procedures
At the screening visit, the demographic data and anthropometric measurements, body weight,body composition analysis, oral glucose tolerance test (OGGT), and blood collections for biochemicaland genotype analyses were performed as described previously [11,18]. Only men were enrolled intothe meal-challenge-tests. Participants were instructed to maintain their regular lifestyle throughoutthe study and to avoid alcohol, coffee, and excessive physical exercise at least on the day beforeeach test. The meal-challenge-test visits were conducted as described previously [14–17,21]. Briefly,the volunteers participated in two meal-challenge-tests visits in crossover design at an interval of2–3 weeks. After an overnight fast, the participants arrived at the laboratory, and after fasting bloodcollection, they received (in random order) a standardized HC-meal (300 mL, Nutridrink Juice Style,Fat Free, Nutricia, Poland), which provided 450 kcal (89% of energy from carbohydrate, 11% fromprotein, and 0% from fat), or NC-meal (360mL, Cubitan, Nutricia, Poland), providing 450 kcal (45% ofenergy from carbohydrate, 30% from protein, and 25% from fat). During the whole experiment, menstayed in bed in a quiet room with thermoneutral conditions (22–25 ◦C). The metabolomics analyseswere performed on plasma samples from the blood collected at fasting and at 30, 60, 120, and 180 minafter meal intake.
2.4. Metabolomics Analysis
The metabolomics analysis is described in detail in the Supplementary Materials. Briefly, metabolicfingerprinting was performed on an HPLC system (1290 Infinity, Agilent Technologies, Santa Clara,CA, USA) coupled to an iFunnel Q-TOF (6550, Agilent Technologies, Santa Clara, CA, USA) massspectrometer. Plasma samples were prepared and analyzed (in positive and negative ion modes)following previously described protocols and methods [22].
Data treatment included cleaning of background noise and unrelated ions through molecularfeature extraction (MFE) tool in Mass Hunter Qualitative Analysis Software (B.06.00, Agilent,Santa Clara, CA, USA). Mass Profiler Professional (B.12.61, Agilent Technologies, Santa Clara, CA, USA)software was used to perform quality assurance (QA) procedure and data filtration. QA procedurecovered a selection of metabolic features with good repeatability. To achieve the features detectedin >80% in quality control (QC) samples and with RSD <30% (as calculated for the QC samples) inNC- and/or HC-meals, the dataset was kept for further data treatment. Additional data filtering wasperformed considering biological samples. Data were divided into ten sets with five time-points: 0, 30,60, 120, and 180 min in two meal challenge groups. Metabolic features present in ≥80% of samplesin at least one of these datasets were accepted. Moreover, a dedicated filtering for each comparisonwas performed—metabolic features present in a minimum of 80% of samples from one group wereforwarded for statistical analysis. Detailed information about analytical conditions is available in theSupplementary Materials.
2.5. Calculations
Based on the relation between time points and the signal intensity of each metabolite, the areasunder the curve (AUCs) were calculated using a trapezoid rule in R software environment (version 3.4.3,https://www.R-project.org/). The Homeostatic Model Assessment of Insulin Resistance (HOMA-IR)was calculated using the standard formula [23]:
HOMA-IR = fasting plasma glucose concentration (mmol/L)] × fasting insulin concentration (μU/mL)]/22.5
The Homeostatic Model Assessment of β-cell function (HOMA-B) was calculated using thefollowing formula [23]:
HOMA-B = 20 × fasting insulin (μU/mL)/fasting glucose (mmol/L) − 3.5
118

Nutrients 2019, 11, 882
2.6. Statistical Analysis
Statistical analysis was performed on each metabolite’s mean AUCs within different strata.Patients with the HR-genotype (CC genotype) were compared to patients with the LR-genotypecarrying the protective allele T (CT/TT genotypes) in rs340874 of the PROX1 gene. NC- and HC-mealgroups were analyzed independently. Selection of statistically significant metabolites was performedimplementing both, uni-, and multivariate analyses. For each significant metabolite, p-value wascalculated in Matlab (MathWorks Inc.). The Shapiro-Wilk test was used for normality testing and then,dependent on the data distribution, the t-test or the Mann-Whitney test were performed. Partial leastsquare discriminant analysis (PLS-DA) models were computed using the SIMCA software (Umetrics).Based on PLS-DA models, volcano plots were created plotting variable importance in the projection(VIP) against corrected p-values [p(corr), loading values scaled as correlation coefficients values].Variables with VIP >1.0 and absolute p(corr) >0.4 were considered significant.
2.7. Identification
Statistically significant metabolites were annotated by matching the spectral data from publicdatabases (HMDB, METLIN, and LIPIDMAPS) with spectral data obtained through MSMS (tandemMS—mass spectrometry) analysis for metabolites present in plasma samples. Detailed informationabout identified metabolites is included in the Supplementary Materials (Table S1).
3. Results
3.1. Baseline Characteristics
The baseline characteristic of the studied population is presented in Table 1. The studiedgenotypes groups were well matched without any between-group differences in age, anthropometricmeasurements, body mass index (BMI), body fat and fat free mass content, fasting glucose and insulinconcentrations, HOMA-IR, HOMA-B, and glycated hemoglobin (HbA1c).
Table 1. The baseline characteristic of studied population by the rs340874 PROX1 genotypes.
CC Genotype CT/TT p-Value *
Age (years) 35.3 ± 9.5 36.3 ± 7.0 0.75
Weight (kg) 93.6 ± 24.5 89.1 ± 16.1 0.95
Body mass index (BMI) (kg/m2) 29.1 ± 8.1 27.3 ± 4.2 0.74
Body fat content (%) 23.8 ± 10.1 23.2 ± 7.8 0.87
Fat free mass (%) 69.6 ± 11.0 67.6 ± 8.3 0.60
Waist (cm) 99.6 ± 21.1 95.7 ± 13.6 0.77
Hip (cm) 104.3 ± 14.8 99.6 ± 8.7 0.76
WHR 0.9 ± 0.1 1.0 ± 0.1 0.81
Fasting glucose concentration (mg/dl) 86.2 ± 8.0 86.7 ± 6.4 0.85
Fasting insulin concentration (IU/mL) 10.4 ± 9.1 8.9 ± 5.4 0.84
HOMA-IR 2.2 ± 2.0 1.9 ± 1.3 0.81
HOMA-B 188.2 ± 163.3 143.7 ± 88.9 0.78
HbA1c 5.2 ± 0.5 5.2 ± 0.2 0.90
* For quantitative variables with normal distribution, the parametric t-test was used; for the other variables,the non-parametric Mann–Whitney test was applied. The data are represented as the mean± STD, and p-values< 0.05were considered significant. * HOMA-IR = Homeostatic Model Assessment of Insulin Resistance; HOMA-B =Homeostatic Model Assessment of β-cell function; HbA1c = glycated hemoglobin; CC = high risk genotype;CT/TT = low risk genotype; WHR =waist-hip ratio.
119

Nutrients 2019, 11, 882
3.2. Genotype Effects on Metabolites Profiles
Samples were divided into two groups according to the type of meal taken, NC- and HC-meals,and then analyzed in independent analytical batches in both polarity modes. This resulted in fourdatasets, which were aligned according to their polarity: ESI+ for both meals and ESI- for both meals.After application of the QA procedure, there were 1717 metabolic features in ESI+ and 848 in ESI-past QA procedure from both data sets (NC- and HC-meals). Principal component analysis (PCA)was implemented to visualize the results of the QA procedure. For each analytical sequence, the QCsamples clustered tightly (Figure S1), which indicated the system’s stability and therefore the goodquality of the data.
Final datasets contained only features presented in ≥80% of the samples in at least one of the twostudied groups (CC versus CT/TT). It resulted in 1494 and 843 features for the NC- and HC-meals inESI+mode and the NC- and HC-meal in ESI- mode, respectively.
To select discriminating metabolites, volcano plots (Figure 1) were built based on PLS-DA models(Figure 2). Studied genotypes did not differ significantly in fasting metabolite profiles, however,metabolic profiles changed and differed between genotypes after the meal intake.
Figure 1. Volcano plots build on the Partial least square discriminant analysis (PLS-DA) modelscomputed based on the area under the curves (AUCs) of plasma metabolites after norma-carbohydrate(NC)-meal for ESI+ (A) and ESI- (B) and high carbohydrate (HC)-meal for ESI+ (C) and ESI- (D).Red color marks metabolic features significantly differenting HR-genotype (CC) and LR-genotype(CT/TT) carriers.
120

Nutrients 2019, 11, 882
Figure 2. PLS-DA models computed based on AUCs of plasma metabolites illustrating clear separationbetween men carrying CC (blue dots) and CT/TT (red triangles) genotypes after NC-meal for ESI+ (A)and ESI- (B), and HC-meal for ESI+ (C) and ESI- (D). The parameters of the models: R2 = 0.989,Q2 = 0.279 for NC-meal for ESI+; R2 = 0.989, Q2 = 0.433 for NC-meal for ESI-; R2 = 0.947, Q2 = 0.490 forHC-meal for ESI+; R2 = 0.943, Q2 = 0.109 for HC-meal for ESI-. R2 = explained variance, Q = predictivecapability of the model.
Metabolites discriminating studied genotypes after both meals are presented in Table 2. For all ofthe identified metabolites, the calculated error of the measured mass in comparison to the theoreticalmonoisotopic mass was ≤4 ppm.
Global overview of all the samples revealed that there was a difference in the metabolic responseto the meal between men carrying CC and CT/TT genotypes (Figure 3). Interestingly, the directionof these changes was different between the two polarity modes applied and therefore was related tothe type of molecules measured. In ESI+ lipids, different lipid classes were changing (in majority ofthe cases) opposite to the way they were changing between men with different genotypes. In ESI-,most of the molecules exhibited the same direction of change but with differences in the magnitude ofthe change.
We did not observe any crucial differences between studied genotypes in the fasting plasmametabolites profile, as mentioned above. Postprandially, we noted that the AUCs of the postprandialvery long chain unsaturated PC36:5 levels were lower after NC-meals, while the AUCs of PE38:6levels were significantly higher after both meal intakes in the HR-group. The HR-genotype carrierspresented lower AUCs after the HC-meal and higher AUCs after the NC-meal for postprandial levelsof polyunsaturated LysoPC and LysoPE with 18-22-carbon chain length. Conversely, the AUCs of themonounsaturated and the saturated LysoPCs postprandial levels (18 and 16 carbons in length) after theNC-meal intake in the HR-genotype men were lower compared to the LR-genotype carriers. We alsonoted higher AUCs of postprandial linoleic acid (LA) levels, lower AUCs of hydroxyeicosatetraenoicacids (HETE), and hydroxyoctadecenoic acid (HODE) levels after NC-meal intake, and after bothmeals, we noted lower AUCs of postprandial hydroxydocosahexaenoic acid (HDoHe) levels. After theHC-meal intake in HR-genotype men, we observed higher AUCs of postprandial tetradecanedioic acid.The HR-genotype men presented lower AUCs of postprandial leukotriene A4 (LTA4) and sphingosines
121

Nutrients 2019, 11, 882
levels and higher AUCs of postprandial acylcarnitines levels after both meal intakes. Lower AUCsof postprandial linoleamide levels after the HC-meal, and for dodecanamide levels, after both mealintakes, were observed. The AUCs of postprandial taurocholic acid levels were lower after the HC-mealintake, while the AUCs of deoxycholic acid glycine conjugated were higher after the NC-meal intake.Moreover, we noticed lower AUCs of postprandial ornithine levels after the HC-meal intake in theHR-genotype men.
Table 2. The percentage differences in AUCs of postprandial plasma metabolite levels after NC-mealand HC-meal intake in the PROX1 high-risk-genotype (CC) men compared to the low-risk genotypecarriers (CT/TT).
NameMolecular
Weight,Da
RT,Min
NC-Meal HC-Meal
Change,%
p-Valuep
(corr)VIP
Change,%
p-Valuep
(corr)VIP
PE 38:6 763.5152 9.40 50 0.25 0.43 1.38 62 0.18 −0.56 1.98
PC 36:5 779.5465 7.95 −4 0.93 −0.51 1.35 −48 0.19 0.30 1.43
PC O-18:0/20:4 795.6141 10.20 −0.45 1.52 −0.16 1.34
LysoPC O-18:1 507.3689 5.95 −42 0.17 −0.59 2.21 59 0.45 0.27 0.46
LysoPC O-16:0 481.3532 5.80 −34 0.50 −0.64 2.81 −22 0.61 0.34 1.30
LysoPC 18:2 sn-2 519.3325 5.40 69 0.30 0.30 1.07 −56 0.049 0.55 1.90
LysoPC 18:3 517.3168 5.05 79 0.28 0.16 0.71 −53 0.26 0.53 1.72
LysoPC 22:4 571.3638 5.85 28 0.47 0.55 1.51 −40 0.018 0.56 1.96
LysoPC 20:4 543.3325 5.40 42 0.46 0.21 1.01 −42 0.01 0.62 2.16
LysoPC 20:4 sn-2 543.3325 5.35 49 0.07 −0.50 1.43 −27 0.11 0.45 1.76
LysoPC 20:4 sn-1 543.3325 5.35 20 0.74 −0.01 0.07 −72 0.02 0.54 2.91
LysoPC 22:6 567.3325 5.40 101 0.04 0.81 2.21 −18 0.40 0.26 1.11
LysoPE 22:6 sn-2 525.2855 5.35 80 0.23 −0.54 2.35 −45 0.29 −0.34 1.26
LysoPE 22:6 sn-1 525.2855 5.35 118 0.09 −0.56 2.03 −4 0.86 −0.27 1.10
Tetradecanedioic acid 258.1831 4.35 21 0.44 −0.20 0.78 51 0.005 −0.53 2.01
Linoleic acid 280.2402 7.05 80 0.01 −0.59 2.29 −65 0.13 −0.12 0.67
HETE 320.2351 5.70 −66 0.10 0.64 2.56 −4 0.93 0.38 1.69
HETE 320.2351 5.70 −62 0.10 0.57 1.89 −65 0.13 0.43 2.15
HODE 298.2508 5.85 −33 0.09 0.51 1.43 20 0.43 −0.26 1.06
HDoHE 344.2351 5.70 −61 0.11 0.57 1.90 −28 0.53 0.43 2.15
C18:2 Sphingosine 297.2668 5.85 −37 0.25 −0.41 1.60 −48 0.01 0.65 2.78
Leukotriene A4 318.2195 5.45 −81 0.02 0.74 3.16 −43 0.21 0.16 0.79
Leukotriene A4 318.2195 5.45 −71 0.01 0.64 2.58 −15 0.71 0.24 1.14
Leukotriene A4 318.2195 5.45 −52 0.10 0.58 1.40 −41 0.14 0.41 2.03
Acetylcarnitine 203.1158 0.25 55 0.06 0.54 2.00 92 0.002 −0.60 2.88
Linoleamide 279.2562 5.30 6 0.93 −0.01 0.05 −45 0.09 0.53 1.51
Dodecanamide 199.1936 5.20 −28 0.49 −0.81 2.48 −38 0.16 0.48 1.10
Taurocholic acid 515.2917 2.30 −27 0.35 −0.39 0.39 −59 0.07 0.66 2.43
Deoxycholic acidglycine conjugate 449.3141 4.30 70 0.14 0.55 1.42 6 0.75 −0.29 0.91
Ornithine 132.0899 0.25 4 0.83 0.12 0.05 −45 0.047 0.53 1.83
VIP = variable importance in the projection, RT = retention time.
122

Nutrients 2019, 11, 882
Figure 3. PLS-DA models computed based on AUCs of plasma metabolites illustrating clear separationbetween men carrying CC (empty dots) and CT/TT (full dots) genotypes after NC- (blue color) andHC-meal (red color) for ESI+ (panel A) and ESI- (panel C) with the summary of the differentiatingsignals and their change in ESI+ (panel B) and ESI- (panel D). The parameters of the models: R2 = 0.581,Q2 = 0.318 for ESI+; R2 = 0.594, Q2 = 0.0.264 for ESI-. R2 = explained variance, Q = predictive capabilityof the model.
4. Discussion
We evaluated the metabolomics analyses at fasting and postprandial states to explore theimpacts of the rs340874 SNP in the PROX1 gene on the human metabolism. At the fasting state,we did not observe any crucial differences in metabolites levels between studied genotypes, butthe meal-challenge-tests uncovered several postprandial alterations. We noted some differences inthe postprandial phospholipid levels. Altered PCs and LPCs plasma profiles were associated withT2DM [24]. LPCs were reduced in subjects with diabetes [25] and with insulin resistance [26]. Ourparticipants were free from T2DM and prediabetes states, and HR-genotype carriers did not differin insulin sensitivity from the men carrying the LR-genotype. The changes in postprandial LPCslevels, typical for insulin resistance and T2DM, were induced mostly by the HC-meal consumption,but after the NC-meal intake, the HR-genotype carriers presented significantly higher AUCs of somepostprandial LPCs levels. Yea K. et al. [27] showed that LPCs could stimulate glucose uptake via aninsulin-independent mechanism. This is consistent with the results from our previous study, whichshowed that genotype CC carriers who presented lower AUC of postprandial LPCs after a HC-meal
123

Nutrients 2019, 11, 882
intake in this study also presented lower postprandial glucose utilization and higher blood glucoseconcentrations after the HC-meal intake in our previous experiment [11].
In HR-genotype men after the NC-meal intake, we also noticed higher AUCs of postprandial LAand lower AUCs of postprandial levels of long-chain fatty acids (LCFA) esters derived from arachidonicacid (AA), HETE, and from docosahexaenoic acid (DHA), the HDoHe, after both meal intakes. Someof the oxidized fatty acids had a biological activity and could signal through their own receptors toevoke a variety of physiological changes. It has been shown that reduced glucose-induced 20-HETEformations and release contribute to inefficient glucose-stimulated insulin secretion in islets isolatedfrom T2DM humans and mice [28]. Moreover, after NC-meal intake, we noted the HR-genotype menhad lower AUCs of postprandial levels of another hydroxy fatty acid—HODE. The HODEs are likely tobe exogenous activators and natural ligands for the nuclear receptor peroxisome proliferator-activatedreceptors α (PPARα) [29] and PPARγ [30]. The PPARα is an important mediator of metabolic responseto nutritional factors since it is involved in fasting and postprandial lipid metabolism regulation, aswell as in the mechanisms associated with body energy production. However, it also modulates thetranscription of genes involved in pathways of inflammatory responses [31]. PPARγ receptors play akey role in the insulin sensitization, adipocyte differentiation, and adipose tissue lipid metabolismdependent on nutritional state—the highest postprandial expression and activation leads to theupregulation of genes that mediate fatty acids trapping and uptake [32,33]. Adipose PPARγ protectsnonadipose tissue against lipid overload [34], and the use of PPARγ agonists has been shown tocause a shift of fat distribution from visceral to subcutaneous adipose depots, which is associatedwith improvements in hepatic and peripheral tissue insulin sensitivity [35]. It has been found thatthe activation of PPARα and PPARγ attenuates total free fatty acid and triglyceride accumulation,which may reduce the risk of obesity, diabetes, and atherosclerosis [36]. Therefore, as was noted inour study, lower postprandial HODE levels (which are natural ligands for the PPARα and PPARγreceptors) in the HR-genotype men may have disadvantageous effects. Results from our larger cohortpopulation have indicated that the PROX1 HR-genotype carriers present significantly higher visceralfat accumulation [11].
The HR-genotype men also presented higher AUCs of postprandial tetradecanedioic acid levelsafter the HC meal intake, which may suggest an altered peroxisomal beta-oxidation since the oxidationof tetradecanedioic acid has been found to be reduced by more than 75% in peroxisome deficienthepatocytes [37].
Our metabolomics analysis showed lower AUCs of postprandial leukotriene A4 (LTA4) plasmalevels in the HR-genotype carriers after both meal intakes. The LTA4 could be further metabolized toform LTB4, which plays an important role in metabolic disruptions [38]. Therefore, as was noted in ourstudy, lower LTA4 may be a beneficial symptom or may indicate the higher conversion into LTB4. Ithas been already shown that PROX1 is associated with defects affecting lymphatic vascular structureand function, which may lead to lymphedema and imbalanced eicosanoid metabolism [39,40].
After both meal intakes, the HR-risk genotype carriers presented higher AUCs of postprandialacylcarnitine levels. Increased plasma acylcarnitines levels have been reported in insulin-resistantand T2DM subjects as products of incomplete or inefficient β-oxidation, and tissue accumulation ofacylcarnitine molecules may lead to activation of proinflammatory pathways, which are implicated ininsulin resistance and T2DM development [41].
Furthermore, in the HR-genotype men, we also noticed lower AUCs of postprandial levels oftwo fatty acid amides (FAAs)—dodecanamide after both meals and linoleamide after the HC-mealintake. The FAAs may play roles as endogenous brain cannabinoid receptor ligands and may beinvolved in T2DM pathogenesis [42]. Moreover, linoleamide inhibits phospholipase A2 (PLA2) [43],the suppression of which protects against diet-induced obesity and diabetes, and PLA2-deficient micepresented increased postprandial hepatic fatty acid oxidation (FAO) [44].
We also observed lower AUCs of postprandial sphingosine levels after both meals in peoplein the HR-genotype group. Sphingosine is a breakdown product of ceramide degradation, and free
124

Nutrients 2019, 11, 882
sphingosine can be trapped for ceramide regeneration or for sphingosine-1-phosphate (S1P) formation,both of which have been associated with obesity, insulin resistance, and T2DM [45–47]. Lower plasmasphingosine levels observed in our study could have been a result of decreased release to the circulation(from ceramide degradation, etc.,) or increased rate of its intracellular acylation or phosphorylation,and both possibilities may have had a negative effect—the increase of cellular ceramide and S1P levels.Further studies are needed to elucidate the possible associations between the PROX1 HR-genotypeand the sphingomyelin pathway.
The very interesting finding of our study is that the PROX1 gene may be involved in thepostprandial bile acids signaling. After the HC-meal intake in the HR-genotype men, we noticed lowerAUCs of postprandial taurocholic acid and higher AUCs of postprandial deoxycholic acid glycineconjugate levels after the NC-meal. It has been found that PROX1 suppress the transcription of theCYP7A1 gene, which codes the key enzyme of bile acid synthesis and may negatively modulate thebile acids synthesis [48]. Bile acids are metabolic regulating factors that act as signaling moleculesthrough receptor-independent and receptor-dependent pathways, including nuclear farnesoid Xreceptor (FXR) and the membrane Takeda G protein-coupled receptor (TGR), which are implicatedin the regulation of glucose, lipid, and energy metabolism. Dysregulation of these pathways maycontribute to the metabolic disturbances and T2DM development [49–51]. The mechanisms by whichbile acids are involved in glucose homeostasis regulation remain undefined. Many different subtypesof bile acids differ widely in their chemical composition as well as in their overall impact on health.Zaborska et al. [52] found that dietary supplementation of deoxycholic acid impairs whole bodyglucose regulation in mice by disrupting hepatic endoplasmic reticulum homeostasis, and in ourexperiment, the HR-genotype carriers presented higher AUCs of postprandial deoxycholic acid glycineconjugate levels after the NC-meal intake.
The carriers of the PROX1 HR-genotype also presented lower AUCs of postprandial ornithinelevels after HC-meal intake. Increased ornithine levels as a product of arginine catabolism are associatedwith hyperglycemia and can be involved in the pathogenesis of T2DM [53,54], but lower ornithinelevels may be an effect of an increased plasma arginase activity, which is increased in diabetic subjectsand may be associated with vascular complications [54].
The PROX1 gene has been shown, thus far, to confer the susceptibility to T2DM mostly by itsassociations with fasting and glucose-stimulated insulin secretion [5] as well as fasting [9] and OGTT2-h glucose levels [55]. Our study revealed other postprandial disruptions in the high-risk PROX1genotype carriers, which may be a part of potential type 2 diabetes disease pathways. The summarizingof all metabolic alterations mentioned above is presented in Figure S2. Most of the alterations we foundwere observed after HC-meal intake, but the differences between studied genotypes in postprandiallevels of molecules involved in pathways of inflammatory and oxidative stress responses were morepronounced after NC-meal intake. Oxidative stress impacts progressive disorders and is linked tometabolic disorders such as T2DM, since the activation of stress pathways plays a key role in thedevelopment of the insulin resistance and impaired insulin secretion [56]. We observed the differencesbetween genotypes mostly by the NC-meal intake. This was perhaps due to the fact that the HC-mealsinduced a strong inflammatory response by themselves [57], and therefore the impact of the geneticrisk could have been blurred—especially with a small sample size, which was a major limitationof our study. The main reasons for the small study sample were that a non-targeted LC-MS-basedmetabolomics approach could be performed in a limited set of samples, and, moreover, the presentedstudy is a part of our larger project with very long and laborious protocol and procedures, whichlimited the number of volunteers participating.
5. Conclusions
In conclusion, our results showed an altered postprandial metabolite profile in the PROX1HR-genotype carriers. Our observations indicate that one of the pathways involved in the T2DMdevelopment in subjects with the PROX1 CC genotype may be postprandial alterations, but further
125
Nutrients 2019, 11, 882
functional studies are required to extrapolate implications from our findings for the biochemicalpathways associated with PROX1 SNPs and T2DM development. It may allow identifying thepathways and factors that interact with some dietary nutrients, leading to particular metabolicresponses that are associated with the development of metabolic diseases.
Supplementary Materials: The following are available online at http://www.mdpi.com/2072-6643/11/4/882/s1,Metabolomics analysis- methods detailed description, Figure S1: The QC of performed analyses- PCA plots withmarked QC samples, Figure S2: The summary of metabolic alterations observed after NC- and HC-meal intake,Table S1: Detailed information about compounds identification.
Author Contributions: Conceptualization and Methodology, E.A.-P., M.C., M.G., C.B., A.K.; Investigation andFormal Analysis, E.A.-P., J.G., P.S., M.C.; Writing—Original Draft Preparation, E.A.-P., J.G.; Statistical Analysis,J.G., P.S., M.C., W.B.; Supervision, M.G., K.S., C.B., A.K.; all authors approved the final version of the manuscript.
Funding: This research was funded by funds from the Medical University of Bialystok.
Acknowledgments: The authors would like to thank the Study Team of the Clinical Research Centre andDepartment of Endocrinology, Diabetology and Internal Medicine of Medical University of Bialystok fortechnical support.
Conflicts of Interest: The authors declare no conflict of interest.
References
1. International Diabetes Federation Diabetes Atlas, 7th ed. 2015. Available online: http://www.diabetesatlas.org/ (accessed on 1 December 2018).
2. Chamnan, P.; Simmons, R.K.; Forouhi, N.G.; Luben, R.N.; Khaw, K.T.; Wareham, N.J.; Griffin, S.J. Incidenceof type 2 diabetes using proposed HbA1c diagnostic criteria in the european prospective investigation ofcancer-norfolk cohort: Implications for preventive strategies. Diabetes Care 2011, 34, 950–956. [CrossRef][PubMed]
3. Ferrannini, E.; Camastra, S. Relationship between impaired glucose tolerance, non-insulin-dependentdiabetes mellitus and obesity. Eur J. Clin. Investig. 1998, 28, 3–6. [CrossRef]
4. Dupuis, J.; Langenberg, C.; Prokopenko, I.; Saxena, R.; Soranzo, N.; Jackson, A.U.; Wheeler, E.; Glazer, N.L.;Bouatia-Naji, N.; Gloyn, A.L.; et al. New genetic loci implicated in fasting glucose homeostasis and theirimpact on type 2 diabetes risk. Nat. Genet. 2010, 42, 105–116. [CrossRef] [PubMed]
5. Lecompte, S.; Pasquetti, G.; Hermant, X.; Grenier-Boley, B.; Gonzalez-Gross, M.; De Henauw, S.; Molnar, D.;Stehle, P.; Béghin, L.; Moreno, L.A.; et al. Genetic and molecular insights into the role of PROX1 in glucosemetabolism. Diabetes 2013, 62, 1738–1745. [CrossRef]
6. Hamet, P.; Haloui, M.; Harvey, F.; Marois-Blanchet, F.C.; Sylvestre, M.P.; Tahir, M.R.; Simon, P.H.; Kanzki, B.S.;Raelson, J.; Long, C.; et al. PROX1 gene CC genotype as a major determinant of early onset of type 2 diabetesin slavic study participants from Action in Diabetes and Vascular Disease: Preterax and Diamicron MRControlled Evaluation study. J. Hypertens. 2017, 35, S24–S32. [CrossRef] [PubMed]
7. Boesgaard, T.W.; Grarup, N.; Jørgensen, T.; Borch-Johnsen, K.; Hansen, T.; Pedersen, O.; Meta-Analysis ofGlucose and Insulin-Related Trait Consortium (MAGIC). Variants at DGKB/TMEM195, ADRA2A, GLIS3and C2CD4B loci are associated with reduced glucose-stimulated beta cell function in middle-aged Danishpeople. Diabetologia 2010, 53, 1647–1655. [CrossRef]
8. Wagner, R.; Dudziak, K.; Herzberg-Schäfer, S.A.; Machicao, F.; Stefan, N.; Staiger, H.; Häring, H.U.; Fritsche, A.Glucose-raising genetic variants in MADD and ADCY5 impair conversion of proinsulin to insulin. PLoSONE 2011, 6, e23639. [CrossRef]
9. Barker, A.; Sharp, S.J.; Timpson, N.J.; Bouatia-Naji, N.; Warrington, N.M.; Kanoni, S.; Beilin, L.J.; Brage, S.;Deloukas, P.; Evans, D.M.; et al. Association of genetic Loci with glucose levels in childhood and adolescence:A meta-analysis of over 6000 children. Diabetes 2011, 60, 1805–1812. [CrossRef]
10. Wang, J.; Kilic, G.; Aydin, M.; Burke, Z.; Oliver, G.; Sosa-Pineda, B. Prox1 activity controls pancreasmorphogenesis and participates in the production of “secondary transition” pancreatic endocrine cells. Dev.Biol. 2005, 286, 182–194. [CrossRef] [PubMed]
126
Nutrients 2019, 11, 882
11. Kretowski, A.; Adamska, E.; Maliszewska, K.; Wawrusiewicz-Kurylonek, N.; Citko, A.; Goscik, J.; Bauer, W.;Wilk, J.; Golonko, A.; Waszczeniuk, M.; et al. The rs340874 PROX1 type 2 diabetes mellitus risk variantis associated with visceral fat accumulation and alterations in postprandial glucose and lipid metabolism.Genes Nutr. 2015, 10, 454. [CrossRef]
12. Bell, D.S.; O’Keefe, J.H.; Jellinger, P. Postprandial dysmetabolism: The missing link between diabetes andcardiovascular events? Endocr. Pract. 2008, 14, 112–124. [CrossRef]
13. Adamska-Patruno, E.; Ostrowska, L.; Goscik, J.; Fiedorczuk, J.; Moroz, M.; Kretowski, A.; Gorska, M. TheDifferences in Postprandial Serum Concentrations of Peptides That Regulate Satiety/Hunger and Metabolismafter Various Meal Intake, in Men with Normal vs. Excessive BMI. Nutrients 2019, 11, 493. [CrossRef]
14. Adamska, E.; Ostrowska, L.; Goscik, J.; Waszczeniuk, M.; Kretowski, A.; Górska, M. Intake of MealsContaining High Levels of Carbohydrates or High Levels of Unsaturated Fatty Acids Induces PostprandialDysmetabolism in Young Overweight/Obese Men. Biomed. Res. Int. 2015, 2015, 147196. [CrossRef]
15. Adamska-Patruno, E.; Ostrowska, L.; Goscik, J.; Pietraszewska, B.; Kretowski, A.; Gorska, M. The relationshipbetween the leptin/ghrelin ratio and meals with various macronutrient contents in men with differentnutritional status: A randomized crossover study. Nutr. J. 2018, 17, 118. [CrossRef]
16. Adamska, E.; Kretowski, A.; Goscik, J.; Citko, A.; Bauer, W.; Waszczeniuk, M.; Maliszewska, K.;Paczkowska-Abdulsalam, M.; Niemira, M.; Szczerbinski, L.; et al. The type 2 diabetes susceptibilityTCF7L2 gene variants affect postprandial glucose and fat utilization in non-diabetic subjects. Diabetes Metab.2018, 44, 379–382. [CrossRef]
17. Adamska-Patruno, E.; Goscik, J.; Czajkowski, P.; Maliszewska, K.; Ciborowski, M.; Golonko, A.;Wawrusiewicz-Kurylonek, N.; Citko, A.; Waszczeniuk, M.; Kretowski, A.; et al. The MC4R geneticvariants are associated with lower visceral fat accumulation and higher postprandial relative increase incarbohydrate utilization in humans. Eur. J. Nutr. 2019. [CrossRef]
18. Adamska, E.; Waszczeniuk, M.; Goscik, J.; Golonko, A.; Wilk, J.; Pliszka, J.; Maliszewska, K.; Lipinska, D.;Milewski, R.; Wasilewska, A.; et al. The usefulness of glycated hemoglobin A1c (HbA1c) for identifyingdysglycemic states in individuals without previously diagnosed diabetes. Adv. Med. Sci. 2012, 57, 296–301.[CrossRef]
19. Ostrowska, L.; Witczak, K.; Adamska, E. Effect of nutrition and atherogenic index on the occurrence andintensity of insulin resistance. Pol. Arch. Med. Wewn. 2013, 123, 289–296. [CrossRef]
20. Lu, J.; Varghese, R.T.; Zhou, L.; Vella, A.; Jensen, M.D. Glucose tolerance and free fatty acid metabolism inadults with variations in TCF7L2 rs7903146. Metabolism 2017, 68, 55–63. [CrossRef]
21. Adamska-Patruno, E.; Ostrowska, L.; Golonko, A.; Pietraszewska, B.; Goscik, J.; Kretowski, A.; Gorska, M.Evaluation of Energy Expenditure and Oxidation of Energy Substrates in Adult Males after Intake of Mealswith Varying Fat and Carbohydrate Content. Nutrients 2018, 10, 627. [CrossRef]
22. Samczuk, P.; Luba, M.; Godzien, J.; Mastrangelo, A.; Hady, H.R.; Dadan, J.; Barbas, C.; Gorska, M.;Kretowski, A.; Ciborowski, M. “Gear mechanism” of bariatric interventions revealed by untargetedmetabolomics. J. Pharm. Biomed. Anal. 2018, 151, 219–226. [CrossRef]
23. Matthews, D.R.; Hosker, J.P.; Rudenski, A.S.; Naylor, B.A.; Treacher, D.F.; Turner, R.C. Homeostasis modelassessment: Insulin resistance and beta-cell function from fasting plasma glucose and insulin concentrationsin man. Diabetologia 1985, 28, 412–419. [CrossRef]
24. Floegel, A.; Stefan, N.; Yu, Z.; Mühlenbruch, K.; Drogan, D.; Joost, H.G.; Fritsche, A.; Häring, H.U.; Hrabe deAngelis, M.; Peters, A.; et al. Identification of serum metabolites associated with risk of type 2 diabetes usinga targeted metabolomic approach. Diabetes 2013, 62, 639–648. [CrossRef]
25. Barber, M.N.; Risis, S.; Yang, C.; Meikle, P.J.; Staples, M.; Febbraio, M.A.; Bruce, C.R. Plasmalysophosphatidylcholine levels are reduced in obesity and type 2 diabetes. PLoS ONE 2012, 7, e41456.[CrossRef]
26. Tonks, K.T.; Coster, A.C.; Christopher, M.J.; Chaudhuri, R.; Xu, A.; Gagnon-Bartsch, J.; Chisholm, D.J.;James, D.E.; Meikle, P.J.; Greenfield, J.R.; et al. Skeletal muscle and plasma lipidomic signatures of insulinresistance and overweight/obesity in humans. Obesity 2016, 24, 908–916. [CrossRef]
27. Yea, K.; Kim, J.; Yoon, J.H.; Kwon, T.; Kim, J.H.; Lee, B.D.; Lee, H.J.; Lee, S.J.; Kim, J.I.; Lee, T.G.; et al.Lysophosphatidylcholine activates adipocyte glucose uptake and lowers blood glucose levels in murinemodels of diabetes. J. Biol. Chem. 2009, 284, 33833–33840. [CrossRef]
127
Nutrients 2019, 11, 882
28. Tunaru, S.; Bonnavion, R.; Brandenburger, I.; Preussner, J.; Thomas, D.; Scholich, K.; Offermanns, S. 20-HETEpromotes glucose-stimulated insulin secretion in an autocrine manner through FFAR1. Nat. Commun. 2018,9, 177. [CrossRef]
29. Nagy, L.; Tontonoz, P.; Alvarez, J.G.; Chen, H.; Evans, R.M. Oxidized LDL regulates macrophage geneexpression through ligand activation of PPARgamma. Cell 1998, 93, 229–240. [CrossRef]
30. Itoh, T.; Fairall, L.; Amin, K.; Inaba, Y.; Szanto, A.; Balint, B.L.; Nagy, L.; Yamamoto, K.; Schwabe, J.W.Structural basis for the activation of PPARgamma by oxidized fatty acids. Nat. Struct. Mol. Biol. 2008, 15,924–931. [CrossRef]
31. Contreras, A.V.; Torres, N.; Tovar, A.R. PPAR-α as a key nutritional and environmental sensor for metabolicadaptation. Adv. Nutr. 2013, 4, 439–452. [CrossRef]
32. Semple, R.K.; Chatterjee, V.K.; O’Rahilly, S. PPAR gamma and human metabolic disease. J. Clin. Investig.2006, 116, 581–589. [CrossRef]
33. Varga, T.; Czimmerer, Z.; Nagy, L. PPARs are a unique set of fatty acid regulated transcription factorscontrolling both lipid metabolism and inflammation. Biochim. Biophys. Acta 2011, 1812, 1007–1022. [CrossRef]
34. Sharma, A.M.; Staels, B. Review: Peroxisome proliferator-activated receptor gamma and adiposetissue-understanding obesity-related changes in regulation of lipid and glucose metabolism. J. Clin.Endocrinol. Metab. 2007, 92, 386–395. [CrossRef]
35. Miyazaki, Y.; Mahankali, A.; Matsuda, M.; Mahankali, S.; Hardies, J.; Cusi, K.; Mandarino, L.J.; DeFronzo, R.A.Effect of pioglitazone on abdominal fat distribution and insulin sensitivity in type 2 diabetic patients. J. Clin.Endocrinol. Metab. 2002, 87, 2784–2791. [CrossRef]
36. Ye, G.; Gao, H.; Wang, Z.; Lin, Y.; Liao, X.; Zhang, H.; Chi, Y.; Zhu, H.; Dong, S. PPARα and PPARγ activationattenuates total free fatty acid and triglyceride accumulation in macrophages via the inhibition of Fatp1expression. Cell Death Dis. 2019, 10, 39. [CrossRef]
37. Dirkx, R.; Meyhi, E.; Asselberghs, S.; Reddy, J.; Baes, M.; Van Veldhoven, P.P. Beta-oxidation in hepatocytecultures from mice with peroxisomal gene knockouts. Biochem. Biophys. Res. Commun. 2007, 357, 718–723.[CrossRef]
38. Filgueiras, L.R.; Serezani, C.H.; Jancar, S. Leukotriene B4 as a Potential Therapeutic Target for the Treatmentof Metabolic Disorders. Front. Immunol. 2015, 6, 515. [CrossRef]
39. Escobedo, N.; Oliver, G. The Lymphatic Vasculature: Its Role in Adipose Metabolism and Obesity. Cell Metab.2017, 26, 598–609. [CrossRef]
40. Tian, W.; Rockson, S.G.; Jiang, X.; Kim, J.; Begaye, A.; Shuffle, E.M.; Tu, A.B.; Cribb, M.; Nepiyushchikh, Z.;Feroze, A.H.; et al. Leukotriene B antagonism ameliorates experimental lymphedema. Sci. Transl. Med. 2017,9. [CrossRef]
41. Adams, S.H.; Hoppel, C.L.; Lok, K.H.; Zhao, L.; Wong, S.W.; Minkler, P.E.; Hwang, D.H.; Newman, J.W.;Garvey, W.T. Plasma acylcarnitine profiles suggest incomplete long-chain fatty acid beta-oxidation andaltered tricarboxylic acid cycle activity in type 2 diabetic African-American women. J. Nutr. 2009, 139,1073–1081. [CrossRef]
42. Yamamoto, S.; Takehara, M.; Ushimaru, M. Inhibitory action of linoleamide and oleamide towardsarco/endoplasmic reticulum Ca2+-ATPase. Biochim. Biophys. Acta 2017, 1861, 3399–3405. [CrossRef]
43. Jain, M.K.; Ghomashchi, F.; Yu, B.Z.; Bayburt, T.; Murphy, D.; Houck, D.; Brownell, J.; Reid, J.C.; Solowiej, J.E.;Wong, S.M. Fatty acid amides: Scooting mode-based discovery of tight-binding competitive inhibitors ofsecreted phospholipases A2. J. Med. Chem. 1992, 35, 3584–3586. [CrossRef]
44. Hollie, N.I.; Matlib, M.A.; Hui, D.Y. Direct inhibitory effects of phospholipase A2 enzymatic productlysophosphatidylcholine (LPC) on hepatic mitochondria. Biochemistry 2011, 25, 527. [CrossRef]
45. Kitatani, K.; Idkowiak-Baldys, J.; Hannun, Y.A. The sphingolipid salvage pathway in ceramide metabolismand signaling. Cell Signal. 2008, 20, 1010–1018. [CrossRef]
46. Kowalski, G.M.; Carey, A.L.; Selathurai, A.; Kingwell, B.A.; Bruce, C.R. Plasma sphingosine-1-phosphate iselevated in obesity. PLoS ONE 2013, 8, e72449. [CrossRef]
47. Haus, J.M.; Kashyap, S.R.; Kasumov, T.; Zhang, R.; Kelly, K.R.; Defronzo, R.A.; Kirwan, J.P. Plasma ceramidesare elevated in obese subjects with type 2 diabetes and correlate with the severity of insulin resistance.Diabetes 2009, 58, 337–343. [CrossRef]
128

Nutrients 2019, 11, 882
48. Qin, J.; Gao, D.M.; Jiang, Q.F.; Zhou, Q.; Kong, Y.Y.; Wang, Y.; Xie, Y.H. Prospero-related homeobox (Prox1)is a corepressor of human liver receptor homolog-1 and suppresses the transcription of the cholesterol7-alpha-hydroxylase gene. Mol. Endocrinol. 2004, 18, 2424–2439. [CrossRef]
49. Prawitt, J.; Caron, S.; Staels, B. Bile acid metabolism and the pathogenesis of type 2 diabetes. Curr. Diab. Rep.2011, 11, 160–166. [CrossRef]
50. Tomkin, G.H.; Owens, D. Obesity diabetes and the role of bile acids in metabolism. J. Transl. Int. Med. 2016,4, 73–80. [CrossRef]
51. Kuipers, F.; Bloks, V.W.; Groen, A.K. Beyond intestinal soap–bile acids in metabolic control. Nat. Rev.Endocrinol. 2014, 10, 488–498. [CrossRef]
52. Zaborska, K.E.; Lee, S.A.; Garribay, D.; Cha, E.; Cummings, B.P. Deoxycholic acid supplementation impairsglucose homeostasis in mice. PLoS ONE 2018, 13, e0200908. [CrossRef] [PubMed]
53. Ramírez-Zamora, S.; Méndez-Rodríguez, M.L.; Olguín-Martínez, M.; Sánchez-Sevilla, L.;Quintana-Quintana, M.; García-García, N.; Hernández-Muñoz, R. Increased erythrocytes by-productsof arginine catabolism are associated with hyperglycemia and could be involved in the pathogenesis of type2 diabetes mellitus. PLoS ONE 2013, 8, e66823. [CrossRef] [PubMed]
54. Kashyap, S.R.; Lara, A.; Zhang, R.; Park, Y.M.; DeFronzo, R.A. Insulin reduces plasma arginase activity intype 2 diabetic patients. Diabetes Care 2008, 31, 134–139. [CrossRef] [PubMed]
55. Hu, C.; Zhang, R.; Wang, C.; Wang, J.; Ma, X.; Hou, X.; Lu, J.; Yu, W.; Jiang, F.; Bao, Y.; et al. Variantsfrom GIPR, TCF7L2, DGKB, MADD, CRY2, GLIS3, PROX1, SLC30A8 and IGF1 are associated with glucosemetabolism in the Chinese. PLoS ONE 2010, 5, e15542. [CrossRef] [PubMed]
56. Evans, J.L.; Goldfine, I.D.; Maddux, B.A.; Grodsky, G.M. Are oxidative stress-activated signaling pathwaysmediators of insulin resistance and beta-cell dysfunction? Diabetes 2003, 52, 1–8. [CrossRef] [PubMed]
57. Gregersen, S.; Samocha-Bonet, D.; Heilbronn, L.K.; Campbell, L.V. Inflammatory and oxidative stressresponses to high-carbohydrate and high-fat meals in healthy humans. J. Nutr. Metab. 2012, 2012, 238056.[CrossRef] [PubMed]
© 2019 by the authors. Licensee MDPI, Basel, Switzerland. This article is an open accessarticle distributed under the terms and conditions of the Creative Commons Attribution(CC BY) license (http://creativecommons.org/licenses/by/4.0/).
129

nutrients
Review
Can Gut Microbiota Composition Predict Response toDietary Treatments?
Jessica R Biesiekierski 1,*, Jonna Jalanka 2,3 and Heidi M Staudacher 4
1 Department of Dietetics, Nutrition & Sport, School of Allied Health Human Services & Sport, La TrobeUniversity, 3086 Melbourne, Australia
2 Human Microbiome Research Program, Faculty of Medicine, University of Helsinki, 00014 HY Helsinki,Finland; [email protected]
3 Nottingham Digestive Diseases Centre and NIHR Nottingham Biomedical Research Centre at NottinghamUniversity Hospitals NHS Trust, the University of Nottingham, Nottingham NG7 2RD, UK
4 Food and Mood Centre, IMPACT SRC, Deakin University, Geelong, VIC 3216, Australia;[email protected]
* Correspondence: [email protected]; Tel.: +61-3-9479-5601
Received: 18 April 2019; Accepted: 20 May 2019; Published: 22 May 2019
Abstract: Dietary intervention is a challenge in clinical practice because of inter-individual variabilityin clinical response. Gut microbiota is mechanistically relevant for a number of disease statesand consequently has been incorporated as a key variable in personalised nutrition models withinthe research context. This paper aims to review the evidence related to the predictive capacity ofbaseline microbiota for clinical response to dietary intervention in two specific health conditions,namely, obesity and irritable bowel syndrome (IBS). Clinical trials and larger predictive modellingstudies were identified and critically evaluated. The findings reveal inconsistent evidence to supportbaseline microbiota as an accurate predictor of weight loss or glycaemic response in obesity, or asa predictor of symptom improvement in irritable bowel syndrome, in dietary intervention trials.Despite advancement in quantification methodologies, research in this area remains challengingand larger scale studies are needed until personalised nutrition is realistically achievable and can betranslated to clinical practice.
Keywords: personalised nutrition; microbiota; dietary intervention; obesity; irritable bowel syndrome;gastrointestinal symptoms
1. Introduction
Diet is a modifiable risk factor for many non-communicable diseases and there is a high levelof evidence supporting the efficacy of dietary interventions for both influencing disease risk andimproving disease outcomes. For example, dietary intervention can reduce cardiovascular diseaserisk by 60% [1] and can successfully reduce gastrointestinal (GI) symptoms in at least 50% of patientswith irritable bowel syndrome (IBS) [2]. However, individual variability in response to treatment isincreasingly recognised, and this is reflected in the highly variable response rates in clinical trials ofdietary interventions, particularly in obesity [3], cardiovascular disease [4] and IBS [2].
Personalised nutrition essentially enables the tailoring of dietary advice to the individual levelthrough the incorporation of data related to specific biological pathways driving that individual’shealth or disease status, ultimately optimising the effectiveness of the advice. A comprehensiveunderstanding of clinical conditions and underlying disease mechanisms is often required, includingthe genetic variants of the patient and the extent to which these variants interact with diet to affectdisease risk and treatment in diverse populations.
Nutrients 2019, 11, 1134; doi:10.3390/nu11051134 www.mdpi.com/journal/nutrients130

Nutrients 2019, 11, 1134
Personalised nutrition models integrate a variety of host-specific variables including currentdiet, biological or phenotypical characteristics of the individual (age, stage of life, gender, body massindex (BMI), disease or health status) and genotypic characteristics. An understanding of epigenetics(regulation of gene expression) is also often included. Models will vary with the clinical conditionand its underlying mechanisms, and with the research hypothesis, where different combinationsof characteristics are possible. Most evidence supporting personalised nutrition has come fromobservational studies with disease risk factors as outcomes (e.g., postprandial glucose response).However, there are some trials using clinical endpoints that have incorporated participant informationto test prediction of responses [5] and large-scale studies collecting multi-dimensional data to predictresponse to acute diet challenges [6].
Gut microbiota is one variable shown to be mechanistically relevant for a number of diseasestates and therefore has a potential role in the development of personalised dietary advice. Microbiotahas a profound impact on our health, and alterations to its composition and its dysfunction havebeen associated with several chronic diseases [7]. Despite the lack of a clear definition of a “healthymicrobiota”, its general hallmarks include its resistance to compositional change and its responsivenessto environmental challenges [8]. This allows continuous operation of essential metabolic and immunefunctions including host nutrient metabolism, maintenance of structural integrity of the gut mucosalbarrier, immunomodulation and protection against pathogens.
Diet is well known as one of the major drivers of microbiota composition [9] and conversely,the microbiota response to dietary intervention varies between individuals [10]. In the last decade,efforts have been directed to beginning to understand how biological response may be influenced bythe baseline microbiota [11]. Much of the research investigating the predictive capacity of baselinemicrobiota for clinical response to dietary intervention has been reported in two specific healthconditions, namely, obesity and IBS.
1.1. Clinical Condition 1: Obesity
Overweight and obesity rates continue to rise worldwide. In 2013, among adults (age ≥20 years),37% of men and 30% of women were considered overweight (BMI 25–29.9) or obese (BMI ≥30) [12].Obesity is associated with numerous chronic diseases and increases the risk for type 2 diabetes,metabolic disorder and cancer [13,14]. The pathogenesis of obesity is complex, with environmental,sociocultural, behavioural, physiological, genetic and epigenetic factors known to be contributors.Treatment often requires significant behaviour modification including dietary change and physicalactivity. Common dietary approaches include a low-fat diet, a high-protein diet or the DASH (DietaryApproaches to Stop Hypertension) diet [15,16]. Pharmacotherapy, medical devices and bariatric surgeryare other treatment options for patients requiring additional intervention. Given the multifacetednature of obesity, there is no single nor simple treatment solution, and therefore novel, and most likelypersonalised, interventions may be necessary for effective treatment.
1.2. Clinical Condition 2: Irritable Bowel Syndrome
Irritable bowel syndrome (IBS), a chronic functional bowel disorder characterised by abdominalpain and altered bowel habit [17], affects 11% of individuals globally [18]. Positive diagnosis isbased on the symptom profile meeting Rome IV criteria, and patients are classified into one offour IBS subtypes (diarrhoea-predominant, constipation-predominant, mixed and unsubtyped) [17].The pathophysiology of IBS is not completely elucidated. Most factors proposed are embodied with theconcept of a disturbed bidirectional brain–gut axis, including alterations in the central nervous system(e.g., high prevalence of anxiety and depression), visceral hypersensitivity, increased gut epithelialpermeability, low grade inflammation and an altered microbiome.
Lifestyle advice, including healthy diet and exercise, is usually considered as first line therapy,followed by symptom-directed pharmacotherapies (anti-spasmodics, laxatives, pro-secretory agents)which have varying efficacy and safety profile [19]. The low FODMAP diet, an approach restricting
131

Nutrients 2019, 11, 1134
the intake of specific fermentable carbohydrates (i.e., oligo-, di-, mono-saccharides and polyols) is asecond-line dietary intervention [20] and, although successful in inducing global symptom response inmany, is often not effective for up to 50% of patients [2].
1.3. Purpose of Review
Recent research suggests that dietary advice could be revolutionised towards a more personalisedapproach for a spectrum of disease states. Accurate prediction of clinical response, such as weightloss in obesity or symptom improvement in IBS, may not only improve short-term clinical responsebut also long-term treatment efficacy and overall health outcomes in response to dietary intervention.This paper aims to review the current state of evidence related to how knowledge of gut microbiotamay facilitate personalised dietary treatments in obesity and in IBS, with a focus on human dietaryintervention trials. In addition, the article aims to identify the knowledge gaps and address theimplications of research to date. Studies were selected for inclusion if they assessed baseline microbiotacomposition as a prediction tool for the clinical response after dietary intervention in human cohortswith IBS and obesity. Can gut microbiota composition predict response to dietary treatments?
1.4. Role of Intestinal Microbiota in Obesity
Several lines of evidence support a role for microbiota in the pathophysiology of obesity. The obesemouse model is characterised by a 50% decrease in Bacteroidetes abundance, an increase in Firmicutes [21]and a lower abundance of Akkermansia muciniphila [22] compared with lean mice. Clinical research inhumans supports this, with evidence of fewer Bacteroides and more Firmicutes [21], as well as a lowerabundance of Bifidobacteria [23] compared with lean controls. Obesity is also associated with a lowerbacterial richness (where richness is defined as the number of different species in an ecosystem) andthose with a lower bacterial richness gain more weight over time [24]. Efficacy of probiotics [25] andfaecal microbiota transplantation (FMT) [26] (via colonisation with “lean microbiota”) to induce weightloss in obese individuals implies that attempts at “correcting” the microbial equilibrium can influencebody weight and adiposity in obesity.
Although the underlying mechanisms by which gut microbiota contributes to obesity are not fullyunderstood, evidence suggests contributing pathways include activity of the fermentation by-productshort-chain fatty acids (SCFAs) in regulating gut hormones and influencing energy harvest [27].Gut microbiota may also suppress the production of fasting-induced adipose factors [28] and be linkedto inflammatory responses [29], regulation of lipogenesis pathways of triglyceride synthesis [30] andimpaired innate immune interactions [31].
1.5. Impact of Dietary Treatment on the Microbiome in Obesity
Energy restriction is the staple dietary intervention in obesity. When obese humans are assigned toeither a fat-restricted or carbohydrate-restricted diet, the resulting increase in abundance of Bacteroidetescorrelates with percentage loss of body weight [21]. Others demonstrate that three months of aformula-based very low-calorie diet (800 kcal/day) in 18 obese adults led to 21 kg average weightloss with concomitant changes in microbiota and bacterial metabolism [32]. The indicative taxafor the microbial diversity change involved the increase in Acinetobacter. Furthermore, a six-weekenergy-restricted high-protein diet in 38 obese adults improved low gene richness (i.e., number ofdetected bacterial genes) and increased the abundance of most gene clusters [33]. Another studyassessed the impact of a Mediterranean diet compared with a low-fat diet in 20 obese men. Therewere no significant differences in the metabolic variables measured (weight change was not reported)between the diets after one year of dietary intervention. However, the low-fat diet group demonstratedan increased relative abundance of Prevotella and decreased Roseburia genera from baseline, whereas theMediterranean diet led to the reverse, a decreased abundance of Prevotella and increased abundancesof the Roseburia and Oscillospira genera from baseline [34]. These diets led to differential alterations ingut microbiota due to changes in food groups.
132

Nutrients 2019, 11, 1134
In addition to energy restriction, dietary interventions designed to target gut microbiota haveused a range of potential modulators and have assessed various obesity risk factors. For example, oneprebiotic supplementation study showed that a 16-week intervention of oligofructose-enriched inulinin overweight or obese children (7–12 years) led to a greater abundance of Bifidobacteria comparedwith controls who received maltodextrin [35]. Many other within-group changes were observed formicrobiota, but importantly, changes in gut microbial abundance coincided with beneficial changesin body composition and biological parameters of interleukin-6 and serum triglycerides comparedwith controls. Others have studied the effect of prebiotics through food or whole diet interventions.One uncontrolled trial delivered a diet rich in non-digestible carbohydrates (based on whole grains,traditional Chinese medicinal foods and prebiotics) via hospitalised intervention in 21 morbidlyobese children (3–16 years) for 30 days [36]. Microbiota composition, which had been enriched withpotentially pathogenic bacteria at baseline, was much higher post-intervention in beneficial groups ofbacteria, such as Bifidobacterium spp. Structural changes at the individual bacterial genome level werealso significantly associated with improvements in host metabolic health (e.g., serum antigen load,alleviation of inflammation) alongside the 9.5% loss of initial bodyweight [36].
1.6. Microbiome as a Predictor for Dietary Treatment Response in Obesity
In the last five years, there have been four relatively small dietary trials that assessed the associationof baseline microbiota with either weight response in obese cohorts or the response of postprandialhyperglycaemia in healthy individuals, an independent risk factor for obesity. Furthermore, there havebeen two studies that used microbiota as a prediction tool to model weight response in obesity cohortsand two to predict glycaemic response in healthy individuals (Table 1).
First, a summary of the studies assessing weight response in obesity is presented. Two unrandomisedtrials have demonstrated the utility of baseline microbiota in predicting bodyweight response to dietaryintervention. One showed that a higher gene richness at baseline was associated with a greaterreduction in adipose tissue and systemic inflammation after a six-week energy-restricted high-proteindiet (n = 38) [33]. The other reported that higher baseline abundance of Akkermansia muciniphila wasassociated with greater improvement in insulin sensitivity and body fat distribution after a six-weekenergy-restricted diet (n = 49) [37]. The first of two modelling studies implemented a six-weekenergy-restricted, high-protein diet followed by a six-week period of weight maintenance in obese oroverweight individuals (n = 50) [38]. A combination of biological, gut microbiota and environmentalfactors were used to predict individual weight loss trajectory using a graphical Bayesian networkframework. Those who lost the least weight and regained the most were characterised by higherabundances of Lactobacillus, Leuconostoc and Pediococcus genera. The overall microbiota compositionat baseline was not identified by the framework as a predictor for weight loss. In another modellingstudy, the likelihood of weight loss in 78 obese adults undertaking high-fibre dietary interventions wasrelated to the abundance of Firmicutes at baseline [39].
Key studies in the personalised nutrition field have investigated postprandial glycaemic responses(PPGR) to dietary intervention. One crossover randomised clinical trial (RCT) randomised 39 healthyparticipants to a three-day intervention of barley kernel-based bread or white wheat flour bread(100 g starch/day). The 10 participants demonstrating the most pronounced improvement in glucoseand insulin response after a standardised breakfast following the barley kernel-based bread interventionwere classified as responders. Responders were characterised by a higher Prevotella/Bacteroides ratio,higher relative abundance of Dorea and greater microbial potential to ferment complex oligosaccharidesat baseline compared with non-responders [40]. Also implementing a bread intervention, a secondRCT provided 20 healthy participants with three portions of 145 g sourdough-leavened whole-grainbread or 110 g white bread per day for one week. The interpersonal variability in glycaemic responseto the different bread types could be reliably predicted with baseline microbiome data (accuracy ROCcurve of 0.83) [41].
133

Nutrients 2019, 11, 1134
Ta
ble
1.
Sum
mar
yof
rece
nttr
ials
repo
rtin
gon
the
asso
ciat
ion
betw
een
base
line
gutm
icro
biot
aco
mpo
siti
onan
das
soci
atio
nw
ith
clin
ical
resp
onse
inob
esit
y.
Stu
dy
Stu
dy
De
sig
nN
o.
of
Su
bje
cts
Cli
nic
al
Co
nd
itio
nD
ieta
ryIn
terv
en
tio
nC
on
tro
lK
ey
Fin
din
gs
Re
f.
Co
ntr
oll
ed
tria
ls–
we
igh
tre
spo
nse
Cot
illar
det
al.,
2013
Non
-ran
dom
ised
clin
ical
tria
l49
(f=
41,m=
8)
Obe
sity
(n=
38,a
ndn=
11ov
erw
eigh
t)
6-w
eek
ener
gy-r
estr
icte
dhi
gh-p
rote
indi
etfo
llow
edby
a6-
wee
kw
eigh
t-m
aint
enan
cedi
et-
Res
pond
ers:
Hig
her
gene
rich
ness
(whe
rere
spon
ders
wer
eth
ose
wit
hm
arke
dim
prov
emen
tofa
dipo
seti
ssue
and
syst
emic
infla
mm
atio
n).
[33]
Dao
etal
.,20
16N
on-r
ando
mis
edcl
inic
altr
ial
49(f=
41,m=
8)O
besi
tyan
dov
erw
eigh
t3-
wee
kca
lori
ere
stri
ctio
n-
Res
pond
ers:
Hig
her
gene
rich
ness
and
Akk
erm
ansi
am
ucin
iphi
laab
unda
nce
was
asso
ciat
edw
ithm
osti
mpr
oved
body
fatd
istr
ibut
ion,
fast
ing
plas
ma
gluc
ose,
plas
ma
trig
lyce
ride
s,im
prov
emen
tin
insu
linse
nsit
ivit
y.
[37]
Mo
de
llin
gst
ud
ies
–w
eig
ht
resp
on
se
Kon
get
al.,
2013
Net
wor
km
odel
ling
50(f=
42,m=
8)O
besi
tyan
dov
erw
eigh
t
6-w
eek
ener
gy-r
estr
icte
d,hi
gh-p
rote
indi
etfo
llow
edby
mai
nten
ance
phas
e-
Res
pond
ers:
Base
line
mic
robi
ota
noti
dent
ified
asa
pred
icto
r.N
on-r
espo
nder
s:H
igh
Lact
obac
illus/L
euco
nost
oc/P
edio
cocc
us.
[38]
Kor
pela
etal
.,20
14Pr
edic
tive
mod
ellin
g78
(f=
40,
m=
38)
3co
hort
sw
ith
obes
ity
3diff
eren
ttyp
esof
diet
ary
inte
rven
tion
sva
ryin
gin
carb
ohyd
rate
qual
ity
and
quan
tity
-R
espo
nder
s:H
igh
abun
danc
eof
Firm
icut
es,w
here
the
mic
robi
ota
com
posi
tion
was
asso
ciat
edw
ith
chan
gein
seru
mch
oles
tero
llev
els.
[39]
Co
ntr
oll
ed
tria
ls–
gly
cae
mic
resp
on
se
Kov
atch
eva-
Dat
char
yet
al.,
2015
RC
T,cr
osso
ver
39(f=
33,m=
6)H
ealt
hy3-
day
barl
eyke
rnel
-bas
edbr
ead
3-da
yw
hite
whe
atflo
urbr
ead
Res
pond
ers:
Hig
her
Prev
otel
la/B
acte
roid
esra
tio
and
incr
ease
dD
orea
that
coul
dpr
edic
tPPG
Rto
barl
eyke
rnel
-bas
edbr
ead.
[40]
Kor
emet
al.,
2017
RC
T,cr
osso
ver
20(f=
11,m=
9)H
ealt
hy1
wee
kof
3×14
5g
who
le-g
rain
sour
doug
h/da
y
1w
eek
of3×
110
gre
fined
whi
tebr
ead/
day
Res
pond
ers:
Spec
ific
mic
robi
alsi
gnat
ure
(esp
ecia
llyab
unda
nces
ofC
opro
bact
erfa
stid
iosu
san
dLa
chno
spir
acea
eba
cter
ium
)cou
ldpr
edic
tPPG
Rto
eith
erbr
ead.
[41]
Mo
de
llin
gst
ud
ies
–g
lyca
em
icre
spo
nse
Zee
viet
al.,
2015
Mac
hine
lear
ning
algo
rith
m80
0(f=
480,
m=
320)
Hea
lthy
(ass
essi
nggl
ycae
mic
resp
onse
)
1-w
eek
usua
ldie
twit
hon
est
anda
rdis
edm
ealw
ith
50g
avai
labl
eca
rboh
ydra
te/d
ay-
Res
pond
ers:
Prot
eoba
cter
ia,E
nter
obac
teri
acea
ean
dA
ctin
obac
teri
aw
ere
asso
ciat
edw
ith
elev
ated
PPG
Rs.
Non
-res
pond
ers:
Clo
stri
dia
and
Prev
otel
lace
aeas
soci
ated
wit
hlo
wer
PPG
Rs.
[6]
Men
des-
Soar
eset
al.,
2019
Sam
em
odel
ling
fram
ewor
kas
Zee
viet
al.,
2015
[6]
327
(f=
255,
m=
72)
Hea
lthy
(ass
essi
nggl
ycae
mic
resp
onse
)
6-da
yus
uald
ieti
nclu
ding
four
stan
dard
ised
mea
lsw
ith
50g
avai
labl
eca
rboh
ydra
te-
Base
line
mic
robi
ota
com
bine
dw
ith
othe
rph
ysio
logi
cal
char
acte
rist
ics
was
mor
epr
edic
tive
ofPP
GR
than
usin
gon
lyca
lori
eor
carb
ohyd
rate
cont
ento
ffoo
ds.
[42]
PPG
R,p
ostp
rand
ialg
lyca
emic
resp
onse
;RC
T,ra
ndom
ised
clin
ical
tria
l.
134
Nutrients 2019, 11, 1134
The most impressive study that has investigated predictors of biological responses to diet to dateis a large predictive modelling study. Participants’ (n = 800) blood glucose was continuously monitoredfor one week whilst they recorded daily activities and dietary intake [6]. The PPGR to the first meal ofevery day, which was one of four different standardised meals (equivalent to 50 g carbohydrate), was akey component of a large dataset of clinical, anthropometric, dietary and biological information. PPGRvariability was associated with a variety of clinical factors (HbA1c%, BMI, systolic blood pressure andalanine aminotransferase (ALT) activity). However, intriguingly, Proteobacteria and Enterobacteriaceaewere positively associated with some of the PPGR to the standardised meal; associations with glycaemicresponse were also evident for certain microbial pathways at the functional level. From these data,a prediction model using thousands of decision trees based on 137 features representing meal content,daily activity, blood parameters and microbiome features was then validated in a separate 100-personcohort [6]. Similarly, others have used six-day PPGR data in 327 healthy participants to demonstratethat baseline microbiome combined with other physiological characteristics is highly predictive ofpostprandial responses. This was more predictive than standard clinical approaches that incorporatecalorie or carbohydrate content alone [42].
Together, the findings from the obesity cohorts and glycaemic response studies highlight thatmicrobiota composition and abundance of specific taxa present an exciting opportunity to enablepredicting responsiveness to diet. However, challenges in interpreting the evidence exist, includingthe heterogeneity of studies, such as the length of dietary challenge (three to six weeks in obesity, threedays to one week in PPGR), the type and intensity of intervention (level of caloric restriction, types ofcarbohydrate) and the number of taxa analysed. Most studies defined their subject cohort, includingpresence of comorbidity and medication use; however, many did not report on other external factorsthat could influence microbiota composition (e.g., probiotics), which may have contributed to theheterogeneity of findings.
1.7. Role of Intestinal Microbiota in IBS
Evidence for microbiota in the development and/or as a driving force of symptom severity in IBShas been accumulating for some 35 years. The line of evidence that is most well supported in theliterature is the observation that the faecal microbiota composition of patients differs from that of healthycontrols, although there is little consistency in findings across studies [43,44]. Reported differencesinclude a higher Firmicutes/Bacteroidetes ratio [45–49], a lower Bifidobacteria abundance [48,50–55] andinstability in response to dietary change [56] in IBS compared with healthy controls. Differenceshave not been limited to the luminal compartment; colonic mucosal microbial composition alsodeviates from healthy controls [46,51,57]. Distinct microbial profiles associated with severity of gutsymptoms [47–49,57,58] or presence of psychological morbidity [47,57–59] support a potential role formicrobiota in perpetuating symptoms. Although one of the most recent investigations of microbiota inIBS identified a distinct faecal and mucosal signature associated with categories of symptom severityin IBS [49], a unique and consistent microbial signature differentiating IBS from non-IBS has notbeen identified.
A number of other lines of evidence supporting the important role of microbiota in thepathophysiology of IBS come from animal models. The presence of transplanted microbiota fromindividuals with IBS in germ-free mice leads to the transfer of the disease state, including alteredmicrobiota composition, visceral hypersensitivity, altered transit, immune activation and behaviouralmanifestations of the condition [60,61]. Other animal data suggest microbial metabolites, such asSCFAs, induce visceral hypersensitivity, a key feature of IBS [62]. In humans, additional support for theinvolvement of microbiota in IBS aetiology is the presence of systemic and mucosal immune activation,with the altered gut microbiota a potential key driver of this dysregulation [63]. Finally, although it isstill unclear whether a divergent microbiota is a primary phenomenon, the efficacy of therapies suchas probiotics and FMT implies that attempts at “correcting” the abnormality lead to at least partialrestoration of microbial and GI equilibrium [64,65].
135

Nutrients 2019, 11, 1134
1.8. Impact of Dietary Treatment on the Microbiome in IBS
Over the past 10 years, clinical trials of the low FODMAP diet have vastly outnumbered studiesof other ”whole diet” interventions in IBS. Response rates of 50–80% are reported in RCTs in whichthe advice is dietitian-led [2]. The impact of short-term FODMAP restriction on the faecal microbiotahas been reported in a number of trials of dietary advice in free-living individuals with IBS [65–69]and in a highly controlled feeding trial [70]. A variety of taxonomic changes have been reported,of which the most consistent finding is a lower relative or absolute abundance of Bifidobacteriacompared with controls and/or pre-intervention [65–67,69–71]. Interestingly, those individuals withgreater Bifidobacteria abundance at baseline exhibit the greatest depletion in response to FODMAPrestriction [65]. Altered metabolomic profile in response to FODMAP restriction has also been reportedin IBS, suggesting there is a change in metabolic activity of microbes in response to reduced availabilityof fermentable carbohydrates or increased availability of alternative dietary substrates [67,71]. Whetherthese microbial changes are key to inducing symptomatic response to a low FODMAP diet is notknown from the current evidence. The anti-bifidogenic effect of the low FODMAP diet is inconsistentwith a “more is better” hypothesis that could be postulated from the inverse correlation betweenBifidobacteria and symptom severity [48,57] and the trend toward efficacy of Bifidobacteria-containingprobiotic supplements in IBS [72].
1.9. Microbiome as a Predictor for Dietary Treatment Response in IBS
The ability to predict symptomatic response to the low FODMAP diet has been of recent interest,particularly considering the diet is intensive to implement and requires dietetic supervision [73], andthat up to half of individuals may not benefit. There is limited but consistent evidence that baselinedemographic or clinical characteristics do not differentiate responders from non-responders to the lowFODMAP diet [68,74–76].
Five studies have investigated whether baseline microbiota could predict symptomatic responseto the low FODMAP diet (Table 2). One four-week RCT (19/33 responders, 61%) [5] and a four-weekuncontrolled trial (32/61 responders, 52%) [77] of low FODMAP dietary advice propose baselinemicrobial profile to be predictive of response, using a microbial mapping technique based on selectedDNA probes [78]. Of the 45 bacterial markers at baseline in the latter trial, 10 differentiated respondersfrom non-responders with a positive predictive value of 76.0 (95% CI 61–87) using scores based on anarbitrary microbial “response index”. A third study, a small uncontrolled one-week trial in children(4/8 responders, 50%), reported that a lower abundance of saccharolytic Bacteroides and Bacteroidaleswas predictive of dietary response [68]. This was followed by a crossover RCT (8/33 responders,24%) that reported baseline enrichment of a range of saccharolytic taxa including Bacteroides andFaecalibacterium prausnitzii in responders compared with non-responders [79]. However, not all studiesreport positive findings; one trial found no predictive value of baseline microbiota in determiningclinical response to a low FODMAP diet, although the highly controlled four-week feeding RCT inadults (11/27 responders, 41%) based findings on abundances of a select few taxa using qPCR analysis.It must also be noted that both trials of crossover design may have influenced microbial compositionof those receiving low FODMAP diet as the second intervention [68,70].
136

Nutrients 2019, 11, 1134
Ta
ble
2.
Sum
mar
yof
rece
nttr
ials
repo
rtin
gon
the
asso
ciat
ion
betw
een
base
line
gutm
icro
biot
aco
mpo
siti
onan
das
soci
atio
nw
ith
clin
ical
resp
onse
inIB
S.
Stu
dy
Stu
dy
De
sig
nN
o.
of
Su
bje
cts
IBS
Su
b-T
yp
eD
ieta
ryIn
terv
en
tio
nC
on
tro
lK
ey
Fin
din
gs
Re
f.
Chu
mpi
tazi
etal
.,20
14
Die
tary
advi
ceun
cont
rolle
dtr
ial
8ch
ildre
n(f=
4,m=
4)
Paed
iatr
icR
ome
III;
all
IBS
subt
ypes
incl
uded
Low
FOD
MA
P-
Res
pond
ers:
Gre
ater
rich
ness
and
dive
rsit
yco
mpa
red
atba
selin
eco
mpa
red
wit
hno
n-re
spon
ders
.Gre
ater
abun
danc
eof
Bact
eroi
des,
uncl
assi
fied
Rum
inoc
occa
ceae
and
Faec
alib
acte
rium
prau
snitz
iiat
base
line
com
pare
dw
ith
non-
resp
onde
rs.
[68]
Hal
mos
etal
.,20
15C
ross
over
feed
ing
RC
T27
(f=
21,
m=
6)
Rom
eII
I,al
lIB
Ssu
btyp
esin
clud
edLo
wFO
DM
AP
Typi
calA
ustr
alia
ndi
etN
oba
selin
em
icro
biot
adiff
eren
ces
iden
tifie
dbe
twee
nre
spon
ders
and
non-
resp
onde
rs.
[70]
Chu
mpi
tazi
etal
.,20
15C
ross
over
feed
ing
RC
T33
child
ren
(f=
22,m=
11)
Paed
iatr
icR
ome
III;
all
IBS
subt
ypes
incl
uded
Low
FOD
MA
PA
mer
ican
child
hood
diet
Res
pond
ers:
Gre
ater
abun
danc
esfo
ra
rang
eof
sacc
haro
lyti
cta
xain
clud
ing
wit
hin
the
fam
ilyBa
cter
oido
idac
eae
and
orde
rC
lost
ridi
ales
(e.g
.,F.
Prau
snitz
ii)co
mpa
red
wit
hno
n-re
spon
ders
.
[79]
Benn
etet
al.,
2018
Die
tary
advi
ceR
CT
61(f=
51,
m=
10),
33lo
wFO
DM
AP
Rom
eII
I;al
lIB
Ssu
btyp
esin
clud
edLo
wFO
DM
AP
Trad
itio
nalI
BSdi
et
Res
pond
ers:
Incr
ease
dab
unda
nce
ofSt
rept
ococ
cus,
Dor
eaan
dR
umin
ococ
cus
gnav
usat
base
line
com
pare
dw
ith
non-
resp
onde
rs.L
ower
dysb
iosi
sin
dex
atba
selin
eco
mpa
red
wit
hno
n-re
spon
ders
.
[5]
Val
eur
etal
.,20
18
Die
tary
advi
ceun
cont
rolle
dtr
ial
61(f=
54,
m=
7)
Rom
eII
I,al
lIB
Ssu
btyp
esin
clud
edLo
wFO
DM
AP
-
Res
pond
ers:
Gre
ater
abun
danc
eof
Bact
eroi
des
frag
ilis,
Aci
neto
bact
er,R
umin
iclo
stri
dium
,Str
epto
cocc
usan
dEu
bact
eriu
mat
base
line
com
pare
dw
ithno
n-re
spon
ders
.Lo
wer
abun
danc
eof
Clo
stri
dia,
Act
inom
ycet
ales
,A
naer
otru
ncus
and
Esch
eric
hia
atba
selin
eco
mpa
red
with
non-
resp
onde
rs.
[77]
IBS,
irri
tabl
ebo
wel
synd
rom
e;R
CT,
rand
omis
edcl
inic
altr
ial.
137

Nutrients 2019, 11, 1134
There are obvious challenges in interpreting the evidence from these trials. Pre-interventionenvironmental factors (e.g., medication, probiotic intake) that could impact on baseline microbiotacomposition are not always reported or controlled. Heterogeneity in baseline stool consistencyand psychological comorbidity, both associated with altered microbiota composition [47,80,81],also complicate the identification of a distinct “responder” microbiota. Second, the stringencyof low FODMAP dietary advice varies between studies. Insufficient FODMAP restriction could lead toan underestimation of true responders. Furthermore, clinical response criteria vary across studies,ranging from validated criteria [5,77] through to arbitrary cut-offs [70], leading to a sizable range ofsymptom severities in “responders” after low FODMAP treatment. Finally, no two studies so far haveutilised the same statistical modelling techniques to explore the potential of microbiota as a predictor;ideally, the choice of statistical approach should be made by an independent blinded researcher toenable objective and statistically rigorous findings.
Based on the literature thus far, there is inconsistent evidence to support the use of one baselinemicrobiota signature to accurately predict response to a low FODMAP diet. Evidence that a baselinebacterial volatile organic compound profile may very accurately select responders [82] suggests thepossibility that the metabolic function of bacteria may be important in determining response. Validationstudies in well-controlled studies of specific IBS subtypes are warranted.
2. General Discussion and Limitations
Few human studies (summarised in Tables 1 and 2) have been conducted investigating whetherspecific microbial signatures predict response to dietary interventions. The conditions of obesity andIBS represent the best examples of preliminary work conducted in this area. Based on this review,there is inconsistent evidence to support the existence of specific microbiota signatures to accuratelypredict clinical response to dietary intervention in obesity and IBS. A number of limitations still impedeprogress in this sphere of research.
First, microbial sampling (i.e., faecal or biopsy) and quantification methodologies applied acrossstudies thus far have been inconsistent. The increasing power and sensitivity of modern sequencingtechniques has led to the rapid development of high-throughput methods for assessing genome-widegenetic variations. However, the approaches used to characterise the human microbiota still varywidely. Furthermore, technical accuracy is crucial throughout processing and analysis. For example,the suboptimal mechanical lysis during extraction of the microbiota DNA from faecal or biopsy samples,a key step in the analysis pipeline [83], will distort the downstream analysis more than any otheranalysis step.
Second, there are several shortcomings in the predictive modelling analysis methods utilised.Therefore, it is important that consistent analysis pipelines be adopted worldwide enabling comparisonof data between studies. Studies may be limited to exploratory statistical analysis until clinical studiescan be adequately designed and powered for primary analysis.
Third, there are many problematic confounding factors that can impact on baseline microbiotacomposition. These factors include, but are not limited to, the host genetic makeup, long-term dietaryhabits, ethnicity, sanitation, geographical location, exercise and lifestyle habits, and antibiotic use. Thisfurther highlights the conclusion that any personalised predictive model incorporating gut microbialcomposition must consider multiple additional relevant individual datapoints, which may vary withdisease state. It is also acknowledged that some chronic diseases, although benefiting from dietaryintervention, may never be amenable to a microbiota-based personalised nutrition approach due toinherent heterogeneity in microbiota composition across individuals.
Finally, for ultimate translation into clinical practice, there is a need to understand if the resultsgained from short-term studies predicting host response can be translated into durable responses overtime, leading to long-term positive health outcomes. Longer duration of studies and interventionperiods are also needed.
138

Nutrients 2019, 11, 1134
3. Conclusions
Diet is one of the most important determinants of the gut microbiota composition. However, therelationship between diet and microbiota is complex and not completely understood. Consequently,personalised nutrition models that predict clinical response to dietary treatment based on the microbialcomposition are still extremely challenging to test in the research context. Some evidence of associationsbetween gut microbiota and response to dietary treatments for both obesity and IBS suggests thatlinks exist between microbiota composition and inter-individuality in host response to diet. However,personalised nutrition research is in its infancy and specific microbiota signatures that predictindividualised responses to dietary treatment are still elusive; advancements in analysis technologiesand consistent bioinformatic approaches will be important for progress.
Author Contributions: Conceptualisation, writing, draft preparation, review and editing: J.R.B., J.J. and H.M.S.
Funding: Jonna Jalanka was supported by a Fellowship from the Finnish Academy (Grant No. 0313471-7). HeidiStaudacher was supported by an Alfred Deakin Postdoctoral Fellowship.
Conflicts of Interest: The authors declare no conflict of interest.
Abbreviations
ALT Alanine aminotransferaseFMT Faecal microbiota transplantFODMAP Fermentable oligo-, di-, monosaccharides and polyolsIBS Irritable bowel syndromePPGR Postprandial glycaemic responseRCT Randomised clinical trialRNA Ribonucleic acidSCFA Short-chain fatty acid
References
1. Kris-Etherton, P.M.; Etherton, T.D.; Carlson, J.; Gardner, C. Recent discoveries in inclusive food-basedapproaches and dietary patterns for reduction in risk for cardiovascular disease. Curr. Opin. Lipidol. 2002,13, 397–407. [CrossRef]
2. Staudacher, H.M.; Whelan, K. The low FODMAP diet: Recent advances in understanding its mechanismsand efficacy in IBS. Gut 2017, 66, 1517–1527. [CrossRef]
3. Seganfredo, F.B.; Blume, C.A.; Moehlecke, M.; Giongo, A.; Casagrande, D.S.; Spolidoro, J.V.N.; Padoin, A.V.;Schaan, B.D.; Mottin, C.C. Weight-loss interventions and gut microbiota changes in overweight and obesepatients: A systematic review. Obes. Rev. 2017, 18, 832–851. [CrossRef]
4. McMillan-Price, J.; Petocz, P.; Atkinson, F.; O’Neill, K.; Samman, S.; Steinbeck, K.; Caterson, I.; Brand-Miller, J.J.Comparison of 4 diets of varying glycemic load on weight loss and cardiovascular risk reduction in overweightand obese young adults: A randomized controlled trial. Arch. Intern. Med. 2006, 166, 1466–1475. [CrossRef]
5. Bennet, S.M.P.; Bohn, L.; Storsrud, S.; Liljebo, T.; Collin, L.; Lindfors, P.; Tornblom, H.; Ohman, L.; Simren, M.Multivariate modelling of faecal bacterial profiles of patients with IBS predicts responsiveness to a diet lowin FODMAPs. Gut 2018, 67, 872–881. [CrossRef]
6. Zeevi, D.; Korem, T.; Zmora, N.; Israeli, D.; Rothschild, D.; Weinberger, A.; Ben-Yacov, O.; Lador, D.;Avnit-Sagi, T.; Lotan-Pompan, M.; et al. Personalized Nutrition by Prediction of Glycemic Responses. Cell2015, 163, 1079–1094. [CrossRef]
7. de Vos, W.M.; de Vos, E.A. Role of the intestinal microbiome in health and disease: From correlation tocausation. Nutr. Rev. 2012, 70, S45–S56. [CrossRef]
8. Gonze, D.; Coyte, K.Z.; Lahti, L.; Faust, K. Microbial communities as dynamical systems. Curr. Opin.Microbiol. 2018, 44, 41–49. [CrossRef]
9. Faith, J.J.; McNulty, N.P.; Rey, F.E.; Gordon, J.I. Predicting a human gut microbiota’s response to diet ingnotobiotic mice. Science 2011, 333, 101–104. [CrossRef]
139

Nutrients 2019, 11, 1134
10. Salonen, A.; Lahti, L.; Salojärvi, J.; Holtrop, G.; Korpela, K.; Duncan, S.H.; Date, P.; Farquharson, F.;Johnstone, A.M.; E Lobley, G.; et al. Impact of diet and individual variation on intestinal microbiotacomposition and fermentation products in obese men. ISME J. 2014, 8, 2218–2230. [CrossRef]
11. Tuohy, K.M.; Kolida, S.; Lustenberger, A.M.; Gibson, G.R.; Tuohy, K. The prebiotic effects of biscuits containingpartially hydrolysed guar gum and fructo-oligosaccharides- a human volunteer study. Br. J. Nutr. 2001, 86,341–348. [CrossRef]
12. Ng, M.; Fleming, T.; Robinson, M.; Thomson, B.; Graetz, N.; Margono, C.; Mullany, E.C.; Biryukov, S.;Abbafati, C.; Abera, S.F.; et al. Global, regional, and national prevalence of overweight and obesity in childrenand adults during 1980-2013: A systematic analysis for the Global Burden of Disease Study 2013. Lancet2014, 384, 766–781. [CrossRef]
13. Meigs, J.B.; Wilson, P.W.F.; Fox, C.S.; Vasan, R.S.; Nathan, D.M.; Sullivan, L.M.; D’Agostino, R.B. Body massindex, metabolic syndrome, and risk of type 2 diabetes or cardiovascular disease. J. Clin. Endocrinol. Metab.2006, 91, 2906–2912. [CrossRef]
14. Lauby-Secretan, B.; Grosse, Y.; Bianchini, F.; Loomis, D.; Straif, K.; Scoccianti, C. Body Fatness andCancer–Viewpoint of the IARC Working Group. N. Engl. J. Med. 2016, 375, 794–798. [CrossRef]
15. Sackner-Bernstein, J.; Kanter, D.; Kaul, S. Dietary Intervention for Overweight and Obese Adults: Comparisonof Low-Carbohydrate and Low-Fat Diets. A Meta-Analysis. PLoS ONE 2015, 10, e0139817. [CrossRef]
16. Soltani, S.; Shirani, F.; Chitsazi, M.J.; Salehi-Abargouei, A. The effect of dietary approaches to stop hypertension(DASH) diet on weight and body composition in adults: A systematic review and meta-analysis of randomizedcontrolled clinical trials. Obes. Rev. 2016, 17, 442–454. [CrossRef]
17. Lacy, B.E.; Mearin, F.; Chang, L.; Chey, W.D.; Lembo, A.J.; Simrén, M.; Spiller, R. Bowel Disorders.Gastroenterology 2016, 150, 1393–1407. [CrossRef]
18. Lovell, R.M.; Ford, A.C. Global prevalence of and risk factors for irritable bowel syndrome: A meta-analysis.Clin. Gastroenterol. Hepatol. 2012, 10, 712–721. [CrossRef]
19. Ford, A.C.; Moayyedi, P.; Chey, W.D.; Harris, L.A.; Lacy, B.E.; Saito, Y.A.; Quigley, E.M.M. American Collegeof Gastroenterology Monograph on Management of Irritable Bowel Syndrome. Am. J. Gastroenterol. 2018,113 (Suppl. S2), 1–18. [CrossRef]
20. McKenzie, Y.A.; Bowyer, R.K.; Leach, H.; Gulia, P.; Horobin, J.; O’Sullivan, N.A.; Pettitt, C.; Reeves, L.B.;Seamark, L.; Williams, M.; et al. British Dietetic Association systematic review and evidence-based practiceguidelines for the dietary management of irritable bowel syndrome in adults. J. Hum. Nutr. Diet. 2016, 29,549–575. [CrossRef]
21. Ley, R.E.; Turnbaugh, P.J.; Klein, S.; Gordon, J.I. Microbial ecology: Human gut microbes associated withobesity. Nature 2006, 444, 1022–1023. [CrossRef]
22. Plovier, H.; Everard, A.; Druart, C.; Depommier, C.; Van Hul, M.; Geurts, L.; Chilloux, J.; Ottman, N.;Duparc, T.; Lichtenstein, L.; et al. A purified membrane protein from Akkermansia muciniphila or thepasteurized bacterium improves metabolism in obese and diabetic mice. Nat. Med. 2017, 23, 107–113.[CrossRef]
23. Singh, R.K.; Chang, H.-W.; Yan, D.; Lee, K.M.; Ucmak, D.; Wong, K.; Abrouk, M.; Farahnik, B.; Nakamura, M.;Zhu, T.H.; et al. Influence of diet on the gut microbiome and implications for human health. J. Transl. Med.2017, 15, 73. [CrossRef]
24. Le Chatelier, E.; MetaHIT Consortium; Nielsen, T.; Qin, J.; Prifti, E.; Hildebrand, F.; Falony, G.; Almeida, M.;Arumugam, M.; Batto, J.-M.; et al. Richness of human gut microbiome correlates with metabolic markers.Nature 2013, 500, 541–546.
25. Borgeraas, H.; Johnson, L.K.; Skattebu, J.; Hertel, J.K.; Hjelmesaeth, J. Effects of probiotics on body weight,body mass index, fat mass and fat percentage in subjects with overweight or obesity: A systematic reviewand meta-analysis of randomized controlled trials. Obes. Rev. 2018, 19, 219–232. [CrossRef]
26. Vrieze, A.; Van Nood, E.; Holleman, F.; Salojärvi, J.; Kootte, R.S.; Bartelsman, J.F.; Dallinga–Thie, G.M.;Ackermans, M.T.; Serlie, M.J.; Oozeer, R.; et al. Transfer of Intestinal Microbiota from Lean Donors IncreasesInsulin Sensitivity in Individuals with Metabolic Syndrome. Gastroenterology 2012, 143, 913–916. [CrossRef]
27. Lin, H.V.; Frassetto, A.; Kowalik, E.J., Jr.; Nawrocki, A.R.; Lu, M.M.; Kosinski, J.R.; Hubert, J.A.; Szeto, D.;Yao, X.; Forrest, G.; et al. Butyrate and propionate protect against diet-induced obesity and regulate guthormones via free fatty acid receptor 3-independent mechanisms. PLoS ONE 2012, 7, e35240. [CrossRef]
140

Nutrients 2019, 11, 1134
28. Bäckhed, F.; Manchester, J.K.; Semenkovich, C.F.; Gordon, J.I. Mechanisms underlying the resistance todiet-induced obesity in germ-free mice. Proc. Natl. Acad. Sci. USA 2007, 104, 979–984. [CrossRef]
29. Wellen, K.E.; Hotamisligil, G.S. Inflammation, stress, and diabetes. J. Clin. Investig. 2005, 115, 1111–1119.[CrossRef]
30. Go, G.W.; Oh, S.; Park, M.; Gang, G.; McLean, D.; Yang, H.S.; Song, M.H.; Kim, Y. t10,c12 conjugated linoleicacid upregulates hepatic de novo lipogenesis and triglyceride synthesis via mTOR pathway activation.J. Microbiol. Biotechnol. 2013, 23, 1569–1576. [CrossRef]
31. Vijay-Kumar, M.; Aitken, J.D.; Carvalho, F.A.; Cullender, T.C.; Mwangi, S.; Srinivasan, S.; Sitaraman, S.V.;Knight, R.; Ley, R.E.; Gewirtz, A.T. Metabolic syndrome and altered gut microbiota in mice lacking Toll-likereceptor 5. Science 2010, 328, 228–231. [CrossRef]
32. Heinsen, F.-A.; Fangmann, D.; Müller, N.; Schulte, D.M.; Rühlemann, M.C.; Türk, K.; Settgast, U.; Lieb, W.;Baines, J.F.; Schreiber, S.; et al. Beneficial Effects of a Dietary Weight Loss Intervention on Human GutMicrobiome Diversity and Metabolism Are Not Sustained during Weight Maintenance. Obes. Facts 2016, 9,379–391. [CrossRef]
33. Cotillard, A.; ANR MicroObes Consortium; Kennedy, S.P.; Kong, L.C.; Prifti, E.; Pons, N.; Le Chatelier, E.;Almeida, M.; Quinquis, B.; Levenez, F.; et al. Dietary intervention impact on gut microbial gene richness.Nature 2013, 500, 585–588.
34. Haro, C.; Montes-Borrego, M.; Rangel-Zúñiga, O.A.; Alcala-Diaz, J.F.; Gomez-Delgado, F.; Perez-Martinez, P.;Delgado-Lista, J.; Quintana-Navarro, G.M.; Tinahones, F.J.; Landa, B.B.; et al. Two Healthy Diets ModulateGut Microbial Community Improving Insulin Sensitivity in a Human Obese Population. J. Clin. Endocrinol.Metab. 2016, 101, 233–242. [CrossRef]
35. Nicolucci, A.C.; Hume, M.P.; Martínez, I.; Mayengbam, S.; Walter, J.; Reimer, R.A. Prebiotics Reduce BodyFat and Alter Intestinal Microbiota in Children Who Are Overweight or with Obesity. Gastroenterology 2017,153, 711–722. [CrossRef]
36. Zhang, C.; Yin, A.; Li, H.; Wang, R.; Wu, G.; Shen, J.; Zhang, M.; Wang, L.; Hou, Y.; Ouyang, H.; et al. DietaryModulation of Gut Microbiota Contributes to Alleviation of Both Genetic and Simple Obesity in Children.EBioMedicine 2015, 2, 968–984. [CrossRef]
37. Dao, M.C.; Everard, A.; Aron-Wisnewsky, J.; Sokolovska, N.; Prifti, E.; Verger, E.O.; Kayser, B.D.; Levenez, F.;Chilloux, J.; Hoyles, L.; et al. Akkermansia muciniphila and improved metabolic health during a dietaryintervention in obesity: Relationship with gut microbiome richness and ecology. Gut 2016, 65, 426–436.[CrossRef]
38. Kong, L.C.; Wuillemin, P.-H.; Bastard, J.-P.; Sokolovska, N.; Gougis, S.; Fellahi, S.; Darakhshan, F.;Bonnefont-Rousselot, D.; Bittar, R.; Doré, J.; et al. Insulin resistance and inflammation predict kineticbody weight changes in response to dietary weight loss and maintenance in overweight and obese subjectsby using a Bayesian network approach. Am. J. Clin. Nutr. 2013, 98, 1385–1394. [CrossRef]
39. Korpela, K.; Flint, H.J.; Johnstone, A.M.; Lappi, J.; Poutanen, K.; Dewulf, E.; Delzenne, N.; De Vos, W.M.;Salonen, A. Gut Microbiota Signatures Predict Host and Microbiota Responses to Dietary Interventions inObese Individuals. PLoS ONE 2014, 9, e90702. [CrossRef]
40. Kovatcheva-Datchary, P.; Nilsson, A.; Akrami, R.; Lee, Y.S.; De Vadder, F.; Arora, T.; Hallén, A.; Martens, E.;Björck, I.; Bäckhed, F. Dietary Fiber-Induced Improvement in Glucose Metabolism Is Associated withIncreased Abundance of Prevotella. Cell Metab. 2015, 22, 971–982. [CrossRef]
41. Korem, T.; Zeevi, D.; Zmora, N.; Weissbrod, O.; Bar, N.; Lotan-Pompan, M.; Avnit-Sagi, T.; Kosower, N.;Malka, G.; Rein, M.; et al. Bread Affects Clinical Parameters and Induces Gut Microbiome-AssociatedPersonal Glycemic Responses. Cell Metab. 2017, 25, 1243–1253. [CrossRef]
42. Mendes-Soares, H.; Raveh-Sadka, T.; Azulay, S.; Edens, K.; Ben-Shlomo, Y.; Cohen, Y.; Ofek, T.; Bachrach, D.;Stevens, J.; Colibaseanu, D.; et al. Assessment of a Personalized Approach to Predicting PostprandialGlycemic Responses to Food Among Individuals Without Diabetes. JAMA Netw. Open 2019, 2, e188102.[CrossRef]
43. Rajilic-Stojanovic, M.; Jonkers, D.M.; Salonen, A.; Hanevik, K.; Raes, J.; Jalanka, J.; De Vos, W.M.; Manichanh, C.;Golic, N.; Enck, P.; et al. Intestinal microbiota and diet in IBS: Causes, consequences, or epiphenomena?Am. J. Gastroenterol. 2015, 110, 278–287. [CrossRef]
44. Pittayanon, R.; Lau, J.T.; Yuan, Y.; Leontiadis, G.I.; Tse, F.; Surette, M.; Moayyedi, P. Gut Microbiota in Patientswith Irritable Bowel Syndrome-a Systematic Review. Gastroenterology 2019. [CrossRef]
141
Nutrients 2019, 11, 1134
45. Sundin, J.; Rangel, I.; Fuentes, S.; Heikamp-de Jong, I.; Hultgren-Hornquist, E.; de Vos, W.M.; Brummer, R.J.Altered faecal and mucosal microbial composition in post-infectious irritable bowel syndrome patientscorrelates with mucosal lymphocyte phenotypes and psychological distress. Aliment. Pharmacol. Ther. 2015,41, 342–351. [CrossRef]
46. Rangel, I.; Sundin, J.; Fuentes, S.; Repsilber, D.; De Vos, W.M.; Brummer, R.J. The relationship betweenfaecal-associated and mucosal-associated microbiota in irritable bowel syndrome patients and healthysubjects. Aliment. Pharmacol. Ther. 2015, 42, 1211–1221. [CrossRef]
47. Jeffery, I.B.; O’Toole, P.W.; Ohman, L.; Claesson, M.J.; Deane, J.; Quigley, E.M.; Simren, M. An irritablebowel syndrome subtype defined by species-specific alterations in faecal microbiota. Gut 2012, 61, 997–1006.[CrossRef]
48. Rajilic–Stojanovic, M.; Biagi, E.; Heilig, H.G.; Kajander, K.; Kekkonen, R.A.; Tims, S.; De Vos, W.M. Globaland deep molecular analysis of microbiota signatures in fecal samples from patients with irritable bowelsyndrome. Gastroenterology 2011, 141, 1792–1801. [CrossRef]
49. Tap, J.; Derrien, M.; Törnblom, H.; Brazeilles, R.; Cools-Portier, S.; Doré, J.; Störsrud, S.; Le Nevé, B.; Öhman, L.;Simrén, M. Identification of an Intestinal Microbiota Signature Associated with Severity of Irritable BowelSyndrome. Gastroenterology 2017, 152, 111–123. [CrossRef]
50. Si, J.-M.; Yu, Y.-C.; Fan, Y.-J.; Chen, S.-J. Intestinal microecology and quality of life in irritable bowel syndromepatients. World J. Gastroenterol. 2004, 10, 1802–1805. [CrossRef]
51. Kerckhoffs, A.P.; Samsom, M.; Van Der Rest, M.E.; De Vogel, J.; Knol, J.; Ben-Amor, K.; Akkermans, L.M.Lower Bifidobacteria counts in both duodenal mucosa-associated and fecal microbiota in irritable bowelsyndrome patients. World J. Gastroenterol. 2009, 15, 2887–2892.
52. Balsari, A.; Ceccarelli, A.; Dubini, F.; Fesce, E.; Poli, G. The fecal microbial population in the irritable bowelsyndrome. Microbiologica 1982, 5, 185–194.
53. Malinen, E.; Rinttilä, T.; Kajander, K.; Mättö, J.; Kassinen, A.; Krogius, L.; Saarela, M.; Korpela, R.; Palva, A.Analysis of the fecal microbiota of irritable bowel syndrome patients and healthy controls with real-timePCR. Am. J. Gastroenterol. 2005, 100, 373–382. [CrossRef]
54. Malinen, E.; Krogius-Kurikka, L.; Lyra, A.; Nikkilä, J.; Jääskeläinen, A.; Rinttilä, T.; Vilpponen-Salmela, T.;Von Wright, A.J.; Palva, A. Association of symptoms with gastrointestinal microbiota in irritable bowelsyndrome. World J. Gastroenterol. 2010, 16, 4532–4540. [CrossRef]
55. Matto, J.; Maunuksela, L.; Kajander, K.; Palva, A.; Korpela, R.; Kassinen, A.; Saarela, M.; Mättö, J. Compositionand temporal stability of gastrointestinal microbiota in irritable bowel syndrome- a longitudinal study in IBSand control subjects. FEMS Immunol. Med. Microbiol. 2005, 43, 213–222. [CrossRef]
56. Manichanh, C.; Eck, A.; Varela, E.; Roca, J.; Clemente, J.C.; Gonzalez, A.; Knights, D.; Knight, R.; Estrella, S.;Hernandez, C.; et al. Anal gas evacuation and colonic microbiota in patients with flatulence: Effect of diet.Gut 2014, 63, 401–408. [CrossRef] [PubMed]
57. Parkes, G.C.; Rayment, N.B.; Hudspith, B.N.; Petrovska, L.; Lomer, M.C.; Brostoff, J.; Whelan, K.;Sanderson, J.D. Distinct microbial populations exist in the mucosa-associated microbiota of sub-groups ofirritable bowel syndrome. Neurogastroenterol. Motil. 2012, 24, 31–39. [CrossRef]
58. Jalanka-Tuovinen, J.; Salojarvi, J.; Salonen, A.; Immonen, O.; Garsed, K.; Kelly, F.M.; Zaitoun, A.; Palva, A.;Spiller, R.C.; de Vos, W.M. Faecal microbiota composition and host-microbe cross-talk following gastroenteritisand in postinfectious irritable bowel syndrome. Gut 2014, 63, 1737–1745. [CrossRef]
59. Peter, J.; Fournier, C.; Durdevic, M.; Knoblich, L.; Keip, B.; Dejaco, C.; Trauner, M.; Moser, G. A MicrobialSignature of Psychological Distress in Irritable Bowel Syndrome. Psychosom. Med. 2018, 80, 698–709.[CrossRef]
60. De Palma, G.; Lynch, M.D.J.; Lu, J.; Dang, V.T.; Deng, Y.; Jury, J.; Umeh, G.; Miranda, P.M.; Pastor, M.P.;Sidani, S.; et al. Transplantation of fecal microbiota from patients with irritable bowel syndrome alters gutfunction and behavior in recipient mice. Sci. Transl. Med. 2017, 9, eaaf6397. [CrossRef] [PubMed]
61. Crouzet, L.; Gaultier, E.; Del’Homme, C.; Cartier, C.; Delmas, E.; Dapoigny, M.; Fioramonti, J.;Bernalier-Donadille, A. The hypersensitivity to colonic distension of IBS patients can be transferred to ratsthrough their fecal microbiota. Neurogastroenterol. Motil. 2013, 25, e272–e282. [CrossRef]
62. Bourdu, S.; Dapoigny, M.; Chapuy, E.; Artigue, F.; Vasson, M.-P.; Déchelotte, P.; Bommelaer, G.; Eschalier, A.;Ardid, D. Rectal instillation of butyrate provides a novel clinically relevant model of noninflammatorycolonic hypersensitivity in rats. Gastroenterology 2005, 128, 1996–2008. [CrossRef]
142

Nutrients 2019, 11, 1134
63. Ohman, L.; Tornblom, H.; Simren, M. Crosstalk at the mucosal border: Importance of the gutmicroenvironment in IBS. Nat. Rev. Gastroenterol. Hepatol. 2015, 12, 36–49. [CrossRef]
64. Johnsen, P.H.; Hilpüsch, F.; Cavanagh, J.P.; Leikanger, I.S.; Kolstad, C.; Valle, P.C.; Goll, R. Faecal microbiotatransplantation versus placebo for moderate-to-severe irritable bowel syndrome: A double-blind, randomised,placebo-controlled, parallel-group, single-centre trial. Lancet Gastroenterol. Hepatol. 2018, 3, 17–24. [CrossRef]
65. Staudacher, H.M.; Lomer, M.C.E.; Anderson, J.L.; Barrett, J.S.; Muir, J.G.; Irving, P.M.; Whelan, K. Fermentablecarbohydrate restriction reduces luminal bifidobacteria and gastrointestinal symptoms in patients withirritable bowel syndrome. J. Nutr. 2012, 142, 1510–1518. [CrossRef]
66. Staudacher, H.M.; Lomer, M.C.; Farquharson, F.M.; Louis, P.; Fava, F.; Franciosi, E.; Scholz, M.; Tuohy, K.M.;Lindsay, J.O.; Irving, P.M.; et al. A Diet Low in FODMAPs Reduces Symptoms in Patients with IrritableBowel Syndrome and A Probiotic Restores Bifidobacterium Species: A Randomized Controlled Trial.Gastroenterology 2017, 153, 936–947. [CrossRef]
67. McIntosh, K.; Reed, D.E.; Schneider, T.; Dang, F.; Keshteli, A.H.; De Palma, G.; Madsen, K.; Bercik, P.;Vanner, S. FODMAPs alter symptoms and the metabolome of patients with IBS: A randomised controlledtrial. Gut 2017, 66, 1241–1251. [CrossRef]
68. Chumpitazi, B.P.; Hollister, E.B.; Oezguen, N.; Tsai, C.M.; McMeans, A.R.; A Luna, R.; Savidge, T.C.;Versalovic, J.; Shulman, R.J. Gut microbiota influences low fermentable substrate diet efficacy in childrenwith irritable bowel syndrome. Gut Microbes 2014, 5, 165–175. [CrossRef]
69. Huaman, J.-W.; Mego, M.; Manichanh, C.; Cañellas, N.; Cañueto, D.; Segurola, H.; Jansana, M.; Malagelada, C.;Accarino, A.; Vulevic, J.; et al. Effects of Prebiotics vs a Diet Low in FODMAPs in Patients with FunctionalGut Disorders. Gastroenterology 2018, 155, 1004–1007. [CrossRef]
70. Halmos, E.P.; Christophersen, C.T.; Bird, A.R.; Shepherd, S.J.; Gibson, P.R.; Muir, J.G. Diets that differ in theirFODMAP content alter the colonic luminal microenvironment. Gut 2015, 64, 93–100. [CrossRef]
71. Sloan, T.J.; Jalanka, J.; Major, G.A.D.; Krishnasamy, S.; Pritchard, S.; Abdelrazig, S.; Korpela, K.; Singh, G.;Mulvenna, C.; Hoad, C.L.; et al. A low FODMAP diet is associated with changes in the microbiota andreduction in breath hydrogen but not colonic volume in healthy subjects. PLoS ONE 2018, 13, e0201410.[CrossRef]
72. Ford, A.C.; Harris, L.A.; Lacy, B.E.; Quigley, E.M.M.; Moayyedi, P. Systematic review with meta-analysis: Theefficacy of prebiotics, probiotics, synbiotics and antibiotics in irritable bowel syndrome. Aliment. Pharmacol.Ther. 2018, 48, 1044–1060. [CrossRef]
73. O’Keeffe, M.; Lomer, M.C. Who should deliver the low FODMAP diet and what educational methods areoptimal: A review. J. Gastroenterol. Hepatol. 2017, 32, 23–26. [CrossRef]
74. Eswaran, S.L.; Chey, W.D.; Han-Markey, T.; Ball, S.; Jackson, K. A Randomized Controlled Trial Comparingthe Low FODMAP Diet vs. Modified NICE Guidelines in US Adults with IBS-D. Am. J. Gastroenterol. 2016,111, 1824–1832.
75. Wilder-Smith, C.H.; Materna, A.; Wermelinger, C.; Schuler, J. Fructose and lactose intolerance andmalabsorption testing: The relationship with symptoms in functional gastrointestinal disorders. Aliment.Pharmacol. Ther. 2013, 37, 1074–1083. [CrossRef]
76. Böhn, L.; Störsrud, S.; Liljebo, T.; Collin, L.; Lindfors, P.; Törnblom, H.; Simrén, M. Diet low in FODMAPsReduces Symptoms of Irritable Bowel Syndrome as Well as Traditional Dietary Advice: A RandomizedControlled Trial. Gastroenterology 2015, 149, 1399–1407. [CrossRef]
77. Valeur, J.; Småstuen, M.C.; Knudsen, T.; Lied, G.A.; Røseth, A.G. Exploring Gut Microbiota Composition asan Indicator of Clinical Response to Dietary FODMAP Restriction in Patients with Irritable Bowel Syndrome.Dig. Dis. Sci. 2018, 63, 429–436. [CrossRef]
78. Casén, C.; Vebø, H.C.; Sekelja, M.; Hegge, F.T.; Karlsson, M.K.; Ciemniejewska, E.; Dzankovic, S.; Frøyland, C.;Nestestog, R.; Engstrand, L.; et al. Deviations in human gut microbiota: A novel diagnostic test fordetermining dysbiosis in patients with IBS or IBD. Aliment. Pharmacol. Ther. 2015, 42, 71–83. [CrossRef]
79. Chumpitazi, B.P.; Cope, J.L.; Hollister, E.B.; Tsai, C.M.; McMeans, A.R.; Luna, R.A.; Versalovic, J.; Shulman, R.J.Randomised clinical trial: Gut microbiome biomarkers are associated with clinical response to a low FODMAPdiet in children with the irritable bowel syndrome. Aliment. Pharmacol. Ther. 2015, 42, 418–427. [CrossRef]
80. Liu, Y.; Zhang, L.; Wang, X.; Jiang, R.; Xia, Z.; Xu, Z.; Nie, Y.; Lv, X.; Wu, X.; Zhu, H.; et al. Similar FecalMicrobiota Signatures in Patients with Diarrhea-Predominant Irritable Bowel Syndrome and Patients withDepression. Clin. Gastroenterol. Hepatol. 2016, 14, 1602–1611. [CrossRef]
143

Nutrients 2019, 11, 1134
81. Vandeputte, D.; Falony, G.; Vieira-Silva, S.; Tito, R.Y.; Joossens, M.; Raes, J. Stool Stool consistency is stronglyassociated with gut microbiota richness and composition, enterotypes and bacterial growth rates. Gut 2016,65, 57–62. [CrossRef]
82. Rossi, M.; Aggio, R.; Staudacher, H.M.; Lomer, M.C.; Lindsay, J.O.; Irving, P.; Probert, C.; Whelan, K. VolatileOrganic Compounds in Feces Associate with Response to Dietary Intervention in Patients with IrritableBowel Syndrome. Clin. Gastroenterol. Hepatol. 2017, 16, 385–391. [CrossRef]
83. Costea, P.I.; Zeller, G.; Sunagawa, S.; Pelletier, E.; Alberti, A.; Levenez, F.; Tramontano, M.; Driessen, M.;Hercog, R.; Jung, F.-E.; et al. Towards standards for human fecal sample processing in metagenomic studies.Nat. Biotechnol. 2017, 35, 1069–1076. [CrossRef]
© 2019 by the authors. Licensee MDPI, Basel, Switzerland. This article is an open accessarticle distributed under the terms and conditions of the Creative Commons Attribution(CC BY) license (http://creativecommons.org/licenses/by/4.0/).
144

MDPISt. Alban-Anlage 66
4052 BaselSwitzerland
Tel. +41 61 683 77 34Fax +41 61 302 89 18
www.mdpi.com
Nutrients Editorial OfficeE-mail: [email protected]
www.mdpi.com/journal/nutrients


MDPI St. Alban-Anlage 66 4052 Basel Switzerland
Tel: +41 61 683 77 34 Fax: +41 61 302 89 18
www.mdpi.com ISBN 978-3-03921-446-4