A VizRec: Recommending Personalized Visualizations
40
A VizRec: Recommending Personalized Visualizations BELGIN MUTLU, Know Center GmbH EDUARDO VEAS, National University of Cuyo CHRISTOPH TRATTNER, Norwegian University of Science and Technology Visualizations have a distinctive advantage when dealing with the information overload problem: since they are grounded in basic visual cognition, many people understand them. However, creating the appropriate representation requires specific expertise of the domain and underlying data. Our quest in this paper is to study methods to suggest appropriate visualizations autonomously. To be appropriate, a visualization has to follow studied guidelines to find and distinguish patterns visually, and encode data therein. Thus, a visu- alization tells a story of the underlying data; yet, to be appropriate, it has to clearly represent those aspects of the data the viewer is interested in. Which aspects of a visualization are important to the viewer? Can we capture and use those aspects to recommend visualizations? This paper investigates strategies to recom- mend visualizations considering different aspects of user preferences. A multi-dimensional scale is used to estimate aspects of quality for charts for collaborative filtering. Alternatively, tag vectors describing charts are used to recommend potentially interesting charts based on content. Finally, a hybrid approach combines information on what a chart is about (tags) and how good it is (ratings). We present the design principles behind VizRec, our visual recommender. We describe its architecture, the data acquisition approach with a crowd sourced study, and the analysis of strategies for visualization recommendation. CCS Concepts: r Information systems ! Content ranking; Personalization; Personalization; r Human-centered computing ! Collaborative filtering; Graphical user interfaces; Empirical studies in visualization; Visualization design and evaluation methods; General Terms: recommendation, visualization, preference, crowd studies Additional Key Words and Phrases: Personalized Visualizations, Visualization Recommender, Recommender Systems, Collaborative Filtering, Crowd-Sourcing ACM Reference Format: Belgin Mutlu, Eduardo Veas, and Christoph Trattner 2015. VizRec: Recommending Personalized Visualiza- tions. ACM Trans. Interact. Intell. Syst. V, N, Article A (January 2016), 41 pages. DOI: 0000001.0000001 1. INTRODUCTION Despite recent technical advances in search engines and content provider services, in- formation overload still remains a crucial problem of many application fields. Finding the right piece of information in huge information spaces is a tedious, time consum- ing task. Visualizations have shown to be an effective way to deal with the overload problem with the opportunity to display and explore a huge set of data points simulta- neously. However, creating useful visual representations of data typically requires expert knowledge. It requires knowledge of the shape and structure of the data. It also re- quires expertise about visualization design to apply the right visual encodings. An- Author’s addresses: Belgin Mutlu, Knowledge Visualization Group, Know Center GmbH; Eduardo Veas, Fac- ulty of Exact and Natural Sciences, National University of Cuyo; Christoph Trattner, Norwegian University of Science and Technology. Permission to make digital or hard copies of all or part of this work for personal or classroom use is granted without fee provided that copies are not made or distributed for profit or commercial advantage and that copies bear this notice and the full citation on the first page. Copyrights for components of this work owned by others than ACM must be honored. Abstracting with credit is permitted. To copy otherwise, or repub- lish, to post on servers or to redistribute to lists, requires prior specific permission and/or a fee. Request permissions from [email protected]. c 2016 ACM. 2160-6455/2016/01-ARTA $15.00 DOI: 0000001.0000001 ACM Transactions on Interactive Intelligent Systems, Vol. V, No. N, Article A, Pub. date: January 2016.
-
Upload
khangminh22 -
Category
Documents
-
view
0 -
download
0
Transcript of A VizRec: Recommending Personalized Visualizations

A
VizRec: Recommending Personalized Visualizations
BELGIN MUTLU, Know Center GmbHEDUARDO VEAS, National University of CuyoCHRISTOPH TRATTNER, Norwegian University of Science and Technology
Visualizations have a distinctive advantage when dealing with the information overload problem: since theyare grounded in basic visual cognition, many people understand them. However, creating the appropriaterepresentation requires specific expertise of the domain and underlying data. Our quest in this paper is tostudy methods to suggest appropriate visualizations autonomously. To be appropriate, a visualization hasto follow studied guidelines to find and distinguish patterns visually, and encode data therein. Thus, a visu-alization tells a story of the underlying data; yet, to be appropriate, it has to clearly represent those aspectsof the data the viewer is interested in. Which aspects of a visualization are important to the viewer? Canwe capture and use those aspects to recommend visualizations? This paper investigates strategies to recom-mend visualizations considering different aspects of user preferences. A multi-dimensional scale is used toestimate aspects of quality for charts for collaborative filtering. Alternatively, tag vectors describing chartsare used to recommend potentially interesting charts based on content. Finally, a hybrid approach combinesinformation on what a chart is about (tags) and how good it is (ratings). We present the design principlesbehind VizRec, our visual recommender. We describe its architecture, the data acquisition approach with acrowd sourced study, and the analysis of strategies for visualization recommendation.
CCS Concepts: rInformation systems ! Content ranking; Personalization; Personalization;rHuman-centered computing ! Collaborative filtering; Graphical user interfaces; Empirical studiesin visualization; Visualization design and evaluation methods;
General Terms: recommendation, visualization, preference, crowd studies
Additional Key Words and Phrases: Personalized Visualizations, Visualization Recommender, RecommenderSystems, Collaborative Filtering, Crowd-Sourcing
ACM Reference Format:Belgin Mutlu, Eduardo Veas, and Christoph Trattner 2015. VizRec: Recommending Personalized Visualiza-tions. ACM Trans. Interact. Intell. Syst. V, N, Article A (January 2016), 41 pages.DOI: 0000001.0000001
1. INTRODUCTIONDespite recent technical advances in search engines and content provider services, in-formation overload still remains a crucial problem of many application fields. Findingthe right piece of information in huge information spaces is a tedious, time consum-ing task. Visualizations have shown to be an effective way to deal with the overloadproblem with the opportunity to display and explore a huge set of data points simulta-neously.
However, creating useful visual representations of data typically requires expertknowledge. It requires knowledge of the shape and structure of the data. It also re-quires expertise about visualization design to apply the right visual encodings. An-
Author’s addresses: Belgin Mutlu, Knowledge Visualization Group, Know Center GmbH; Eduardo Veas, Fac-ulty of Exact and Natural Sciences, National University of Cuyo; Christoph Trattner, Norwegian Universityof Science and Technology.Permission to make digital or hard copies of all or part of this work for personal or classroom use is grantedwithout fee provided that copies are not made or distributed for profit or commercial advantage and thatcopies bear this notice and the full citation on the first page. Copyrights for components of this work ownedby others than ACM must be honored. Abstracting with credit is permitted. To copy otherwise, or repub-lish, to post on servers or to redistribute to lists, requires prior specific permission and/or a fee. Requestpermissions from [email protected]� 2016 ACM. 2160-6455/2016/01-ARTA $15.00DOI: 0000001.0000001
ACM Transactions on Interactive Intelligent Systems, Vol. V, No. N, Article A, Pub. date: January 2016.

A:2 Mutlu, Veas, Trattner
alysts rarely have knowledge of both data and visualization principles and, most of-ten, novices lack both. Still, popular visualization tools require manual specification ofvisual information, which involves: selecting variables of interest, selecting transfor-mations, designing visual encodings [Stolte and Hanrahan 2002; Wickham 2009]; alltogether a tedious task that interrupts the exploration flow [Wongsuphasawat et al.2015]. To date, only a few approaches attempted to automatically generate visual rep-resentations starting just from the data [Mutlu et al. 2014; Nazemi et al. 2013], al-beit with limited success. Despite their usefulness, these approaches are ineffective interms of dealing with highly heterogeneous data and ignore the fact that the choiceof visual representation involves as much user preferences and needs: the methods inpopular visualization tools involved several human choices that tailor the end resultto their preferences. Beyond visualization, Recommender systems have been appliedto resolve the issue basing on knowledge about interests and previous choices of users.A number of questions arise to this respect. Which aspects of the visualization andunderlying data are important for the user? How should these aspects be captured?Which strategies should be used to recommend visualizations based on them?
This paper presents our research on recommendation methods and strategies to au-tomatically generate and suggest personalized visualizations. We introduce a novelapproach –called VizRec–, that automatically generates and suggests charts accordingto perceptual guidelines. Arbitrary selection of data fields and subsequent naıve choiceof visual encoding inevitably lead to a combinatorial explosion. Considering just visualencoding rules proposed in the literature [Mutlu et al. 2014] reduces the combinatorialproblem, but still leads to a large set of possibilities, valid in terms of representing thedata visually, but without considering which type serves the user’s needs best. To pro-mote just the relevant views, appropriate filtering and recommendation strategies areneeded [Wongsuphasawat et al. 2015]. Our goal is to suggest those visualizations thata user would select as part of her analysis workflow. Therefore, we investigate whichinformation lets us anticipate the choice of chart for data analysis, and how to repre-sent such information and use it for recommendation. We investigate a collaborativefiltering approach based on a multidimensional scale to gauge different aspects of qual-ity of the charts suggested. We analyze the effects these aspects have on the filteringof charts. Content based filtering is analyzed as a means to suggest charts according tothe information needs of the user, by collecting vectors of tags describing what aspectsof the data each chart represents. A combination of both aspects, what a chart is about(tags) and how good it is (ratings) is studied using a hybrid recommendation strategy.
This work contributes fundamentals on the design of a visualization recommender(see Section 3). In particular, the design of recommendations based on perceptualguidelines to prune the number of combinations to a manageable size, the informa-tion design to represent user’s needs and preferences, and the studies validating dif-ferent recommendation strategies therewith. Furthermore, an extensive evaluation ofvisualization types in the context of three data repositories was conducted in AmazonMechanical Turk (see Section 4). The evaluation serves multiple purposes, to under-stand the variability in choice of preferred charts, to analyze assessments of quality ofcharts and their descriptions, and to study different recommendation methods.
It is our hope that these results provide motivation to contemplate these personal-ization aspects as part of the design of visualization recommendation.
2. BACKGROUND AND RELATED WORKRecommending visualizations is a relatively new strand of research and only few ef-forts have been made so far to tackle the challenge. However, a broad body of researchformulates perceptual guidelines for visual communication that an expert uses to cre-ate a visualization. Section 2.1 summarizes the visual encoding principles behind our
ACM Transactions on Interactive Intelligent Systems, Vol. V, No. N, Article A, Pub. date: January 2016.

VizRec: Recommending Personalized Visualizations A:3
approach. Rule-based systems have been developed to generate visualizations, for ex-ample based on correspondence of data attributes and visualization properties [Stolteand Hanrahan 2002; Cammarano et al. 2007; Mackinlay et al. 2007]. Although par-tially successful, these systems fall short of automating the whole process and leavedecisions that require certain expertise to the user (e.g., mapping of variables to data).Yet, the greatest flaw of these methods is not accounting for user preferences or task.
Alternatively, methods aiming for adaptive visualization build a user context to con-figure the visual display [Nazemi et al. 2013; Ahn and Brusilovsky 2009]. These meth-ods work bottom-up, analyzing user actions to determine her behaviour, and therebypredict the desired configuration of the visual display. In contrast, established meth-ods in recommender systems personalize suggestions relying on users to express pref-erences by rating items, while tagging drives content-based recommendations. Our ap-proach extends recommender system methods to visualization, building personalizedand content-based stages for a visualization recommender. A large number of prefer-ences and annotations for our empirical methods were acquired with a crowd-sourcedstudy. Crowd sourcing studies offer the possibility to reach a high participation rate.They have been applied in a handful of occasions to study aspects of visualization.Section 2.5 highlights crowd based works that illuminated our study design.
2.1. Visualization Compositing GuidelinesVisualization can be considered from information theory as visually coding and com-municating information [Chen and Janicke 2010]. Bertin’s work on semiology offersa systematic study of visual representations [Bertin 1983]. It defines and character-izes visual variables that compose visualizations. Carpendale analyzes visual vari-ables for computational information visualization [M. S. T. 2003]. Building on semiol-ogy, Mackinlay developed a formal language to generate graphical presentations forrelational information and defined expressiveness: whether a graphical language canexpress the desired information, and effectiveness: whether the graphical languageexploits the capabilities of the output medium and the human visual system [Mackin-lay 1986]. Card and Mackinlay categorized data in terms of its attributes (e.g., nomi-nal, ordinal, quantitative) and analyzed their mapping to visual variables in scientificvisualizations [Stuart and Jock 1997]. Engelhardt systematically analyzed syntacticstructure and information type in graphic representations [von Engelhardt 2002]. Thestructure and design of any graphical representation have a perceptual connotationwith cognitive implications [Ware 2012]. These contributions build our understandingof the visual encoding principles that help us design visualizations [Munzner 2014].Voigt et al. documented these principles in a descriptive ontology [Voigt et al. 2013a].
2.2. Rule-Based ApproachesThe evolution in the formalization of visual encoding theory and principles not only im-proves our understanding of the process, it also contributes to the formulation of gen-erative methods for visualization. Following Mackinlay [Mackinlay 1986], the initialreferent for the automated generation of visualizations is Polaris, the backbone enginein the early version of Tableau [Stolte and Hanrahan 2002]. The system automaticallysuggests visualizations for tables in relational databases, and coordinates the interac-tion between them. But, the mapping of data onto visual properties of a visualizationis not performed automatically, instead it has to be formulated by the user. Conversely,Cammarano et al. describe a method for automatic mapping of data attributes to visu-al attributes based on schema matching [Cammarano et al. 2007]. Using this systemthe user formulates a query and obtains a result set of visualizations including map,time or scatterplot. Once selected a type of visualization, the system searches for theattributes in the data space that best fit the requirements of the chosen visualization.
ACM Transactions on Interactive Intelligent Systems, Vol. V, No. N, Article A, Pub. date: January 2016.

A:4 Mutlu, Veas, Trattner
Mackinlay et al. propose an influential, albeit conceptually different approach, inthe ShowMe [Mackinlay et al. 2007] system. It integrates a set of user interface com-mands and functions aiming at automatically generating visualizations for Tableau.1ShowMe attempts to help the user by searching for graphical presentations that mayaddress her task. Appropriate visualizations are selected based on the data properties,such as data type (text, date, time, numeric, boolean), data role (measure or dimen-sion) and data interpretation (discrete or continuous). We follow a similar approachand select visualizations based on visual encoding rules instrumented in a functionalontology with mapping algorithm to suggest visualizations for published data [Mutluet al. 2014]. VizRec identifies all possible visualizations for the current data in advanceand guarantees in this way the effective graphical presentation of the data based ontheir characteristics.
Generative approaches fulfill the requirements of expressiveness, expressing the in-formation in a dataset visually. Section 3.2 illustrates how visual encoding rules nar-row down the combinatorial of visual variables to a manageable number. Effectivenesshowever not only depends on the syntax and semantics of the graphical language, asMackinlay puts it, but also on the capabilities of the perceiver [Mackinlay 1986]. Informative studies by Mutlu et al., users found that the initially suggested visualiza-tions did not sufficiently emphasize the aspects they were interested in [Mutlu et al.2014; Sabol et al. 2014]. What aspects of the data are important for the user at a giventime? And which visualization preferably represents them?
ShowMe introduces a ranking of visualizations based on static ratings (scores) glob-ally defined for every supported chart type [Mackinlay et al. 2007]. Rather then usingglobal ratings, our method allows us to personalize the resulting visualizations ac-cording to the interests of the individual user using a collaborative filtering (CF) basedapproach.
The closest approach to our suggestion is a system described by Voigt et al. [Voigtet al. 2013b], which uses a knowledge base of numerous ontologies to recommend vi-sualizations. It is essentially a rule-based system that pre-selects visualizations basedon the device, data properties and task involved. Subsequently, the system ranks visu-alizations following the rules concerning visualization facts, domain assignments, anduser context. One disadvantage of Voigt et al.’s approach is that both visualizationsand data inputs have to be annotated semantically beforehand. Furthermore, the pre-selection and the ranking stages are rule-based. More importantly, a large theoreticalpart of the work completely lacks empirical support. While user preferences, such asgraphical representations and visualization literacy are outlined as required in theirapproach, the actual collection and validation of user preferences are tasks for futurework. In contrast, we present a complete approach using different recommendationstrategies and supported by the collection of user preferences for personalization in alarge study involving the general public, validated in an offline experiment and draw-ing conclusions based on the empirical evidence.
2.3. Behavioral ApproachesNazemi et al.’s system suggests visualizations based on user preferences [Nazemi et al.2013] incrementally gathered during interaction with the visualization system in theform of usage profiles for particular charts. Nazemi et al. follow a bottom-up approach,analyzing user interaction via visualization to describe user behavior. In contrast, weapply a top-down method to elicit user preferences by collecting ratings. These methodsare complementary and can be deployed together. Similar to us, Nazemi et al. utilize
1http://www.tableausoftware.com/
ACM Transactions on Interactive Intelligent Systems, Vol. V, No. N, Article A, Pub. date: January 2016.

VizRec: Recommending Personalized Visualizations A:5
a personalized approach to suggest visualizations but only target the content fromdigital libraries (i.e., bibliographical notes, publications).
Ahn et al.’s work on adaptive visualization attempts to provide user-adapted visualrepresentation of their search results [Ahn and Brusilovsky 2009]. The user context isa collection of user actions accumulated over time, such as the issued search queries, s-elected documents from the search results and traversed links. The collection capturesuser interests beyond the query and in turn defines a user model, which is appliedto visually highlight the relevance of a particular result set. In contrast, VizRec aug-ments user queries with preferences in order to find the best representation of theinformation behind the queried content instead of only displaying relevant results asclusters.
Similar to Ahn et al., building preferences to adapt visualizations to user interestshas also been practiced in specific domains, for instance Vartak et al. [Vartak et al.2014] obtain preferences by capturing user interactions with the visualization systemfor digital libraries. Before recommending visualizations, the system runs analytics,looking for behavior patterns in the output of the user and then selects the visualiza-tions which might be interesting or useful for the active user.
Despite these notable efforts, the problem of recommending visualizations is stillinsufficiently explored, especially little research has been performed on generatingand suggesting useful visualizations for heterogeneous multidimensional data.
Moreover there seems to be a gap in the literature on doing this in a personalizedmanner, since previous work on recommender systems has shown that the one-size-fits-it-all principle typically does not hold. To contribute to this small body of researchwe developed and evaluated VizRec, a novel visual recommender engine capable ofrecommending various types of visualizations in a personalized manner.
2.4. Generating Personalized RecommendationsOne of the the most successful and prominent approaches to generate recommenda-tions is collaborative filtering (CF) [Schafer et al. 2007; Su and Khoshgoftaar 2009]which uses a collection of user preferences to generate recommendations. Basically,the preferences are collections of either explicit ratings on a 1-7 scale given by userto catalog items, or implicit ratings, which are automatically inferred from a user’sbehavior. CF uses this repository of known preferences of a group of users to definepredictions of unknown preferences for other users. Hence, the basic idea behind it is:users that had similar tastes or behaviors (e.g., reading, watching, buying etc.) in thepast will have similar tastes or behaviors in the future.
The CF algorithms represents the entire m x n user ratings as an matrix A. Eachentry ai,j in the Matrix A represents ratings of the ith user on the jth item. To gen-erate a top-N recommendations for the active user u it is necessary to calculate the kmost similar users or items (nearest neighbors) to user u. There are two different CFapproaches to obtain the nearest neighbors, namely (1) memory-based (user-based) CFand (2) model based (item-based) CF .
Given matrix A as input, the memory-based CF algorithms generate for the activeuser u prediction based on the ratings from similar user v, who rated the same items.The prediction will be defined using the average ratings made by user u and user v andis a numerical value within the same scale like user’s ratings, i.e., from 1 to 7. Modelbased CF algorithms pursue the same idea, but use the similarity between items i andj rated by the active user u. Summarized, the prediction will be defined using (1) theaverage ratings made by user u and user v and using (2) the average ratings of similaritems rated by the active user u. In both cases the prediction is a numerical value andis within the same scale like user’s ratings, i.e., from 1 to 7.
ACM Transactions on Interactive Intelligent Systems, Vol. V, No. N, Article A, Pub. date: January 2016.

A:6 Mutlu, Veas, Trattner
A popular similarity measure in CF is the Pearson correlation which measures thestrength of the linear association between two variables and defines the direction (pos-itive +1 or negative -1) of the association. To make a prediction the memory-based al-gorithms add and subtract the neighbor’s bias from the active user’s average and usethis as a prediction for the item i, in contrast, the model-based algorithms make a pre-diction by averaging the rating of similar items rated by the active user u. After thepredictions are calculated, the items will be sorted in decreasing order based on theirprediction value, put in so called top-n list, and recommended to the active user.
In contrast to the collaborative filtering based recommender systems (CF-RS) that s-elect items based on the similarity of user preferences, the content-based recommendersystems (CB-RS) select items based on the correlation between the content of the itemsand the user’s profile [Lops et al. 2011]. In CB-RS the item content can be representedwith a set of extracted terms or features. However, the personal comments and tagsof a user can define her profile. It is assumed that the tags, user uses to annotate theitems, describe her taste, needs and interest. For VizRec, the items are chart descrip-tions in terms of visual encoding. Chart descriptions that a neighbor found useful willbe promoted by the algorithm.
Usually, CB-RS uses keyword based Vector Space Model (VSM) together with basicTF-IDF weighting to determine the correlation between items and users. Transportedin VSM, each item is represented as a vector of term weights, where each weight in-dicates the degree of association between the item and the term. Similar to this, userprofiles can be represented by profile vectors. Thus, using cosine measure the systemcan reveal the similarity between a profile vector and an item. Summarized, the gen-eration of recommendations using content-based recommender systems is based onthe matching of the attributes of an user profile (tags, comments etc.) with the con-tent properties (extracted terms, keywords, features etc.) of an item. The goal of theCB-RS is to select items which are similar to those the active user liked in the past.As opposed to CF that generates recommendations based on the ratings from simi-lar users, the CB-RS focus on the similarity of items in their properties. For VizRec,tags describe the contents of charts, e.g., what data fields it represents, what aspectscan be compared. Keywords extracted from the user’s query describe the user’s profileor interests. Intuitively, CB-RS can match user interests with contents of a chart forrecommendation.
However, the two presented recommender techniques, collaborative and contentbased filtering, have both advantages and shortcomings. The advantages of the CFinclude the content independency of the items being recommended, the low cost forknowledge acquisition and maintenance (no knowledge engineering is required) andthe ease of use. However, this recommendation techniques suffer from so-called coldstart problem [Schein et al. 2002]. The term cold start in the context of recommendersystems generally characterizes the situations where user have not yet provided herfeedback to the system or when there is a new item transferred into the system, i.e., nopast information is available. Even though there is some feedback provided, the collab-orative filtering mechanisms in particular sometimes fail to provide the results, sincethey become unable to find the corresponding user with similar tastes. This is oftenreferred as data sparsity problem [Good et al. 1999] implying the collaborative filter-ing algorithm might be unable to form recommendations due to lack of informationon user or item. In contrast, CB-RS do not require a direct user involvement in termsof e.g., providing ratings. Furthermore, these recommender techniques are capable ofrecommending items not yet rated by any user. However, the recommendations gener-ated using content based recommender systems can be too general since the systemsmight capture only a certain aspect of the content. In this case the user might be rec-ommended items similar to those she already rated or tagged without considering her
ACM Transactions on Interactive Intelligent Systems, Vol. V, No. N, Article A, Pub. date: January 2016.

VizRec: Recommending Personalized Visualizations A:7
interest changing over the time. One obvious solution for these problems is to combinedifferent recommender systems to a hybrid recommender which uses the strength ofall available recommender techniques. There are different methods for a hybrid de-sign [Burke 2002; Dietmar et al. 2010], including (i) weighted hybrids, (ii) switchinghybrids, (iii) mixed hybrids, (iv) feature combination hybrids, (v) cascade hybrids, (vi)feature augmentation hybrids, and (vii) meta-level hybrids. Intuitively, for VizRec, ahybrid design combines data of what a chart is about (tags) and how good it is at rep-resenting it (ratings) to propose between recommendations. We investigate the effectsof three approaches: CF-RS, CB-RS, and Hybrid in section 4.
2.5. Crowd Sourcing Visualization StudiesMuch of the data used in the studies of section 4 were collected in a crowd-sourced visu-alization study. A concern with crowd-sourced studies is the lack of control over manyexperimental conditions, which may impact ecological validity. Nevertheless, percep-tion studies in crowd-sourced platforms are viable, as evidenced by a growing numberof successful studies in visualization and related fields [Kittur et al. 2008; Heer andBostock 2010; Borkin et al. 2013; Lin et al. 2013]. Borkin et al. [Borkin et al. 2013]investigated memorability of visualizations. Considering visualizations much like astatic picture, they performed a crowd-sourced study to determine which types of visu-alizations are better recalled. Investigating perceptual aspects of visualizations, Heeret al. replicated the influential experiments of Cleveland and McGill in the format of acrowd-sourced study [Heer and Bostock 2010]. Lin et al. performed a crowd-sourced ex-periment to determine semantically resonant colors, that is colors that people associatewith entities or effects, and derive guidelines for visualization [Lin et al. 2013]. Care-fully designed tasks are mandatory to elicit vaild data from crowd platforms. Kitturet al. discuss several design considerations for developing the tasks in crowd-sourcedstudies [Kittur et al. 2008]. One design recommendation is to have explicitly verifi-able questions as part of a task. They found that asking tags for the content is usefulbecause it requires users to process the content. Our intention was for participantsto first analyze a visualization and then provide a rating for it. Hence, we used thisguideline to setup a preparatory task where participants had to accurately study achart and prevent rash rating. Section 4 describes a crowd-sourced study designedto elicit user preferences related to automatically generated visualizations followingaforementioned design recommendations.
3. THE VIZREC APPROACHVizRec responds to a query with a list of personalized visualizations ordered in a top-nsorted manner. The query is a typical free-form text common in search engines. Theresponse to the query is a dataset (containing relevant documents) compiled by a fed-erated system from various associated sources, each with its proprietary data model.Before passing the data to VizRec, they must be structured after a common data mod-el with a predefined schema. Within VizRec, two recommendation stages take place.First, a rule-based system applies visual encoding guidelines to generate a collectionof visualizations appropriate for the data. Second, to obtain a top-n sorted list, thecollection is sorted and filtered according to user preferences using a recommenda-tion strategy. This study in section 4 investigates the strategies applied in the secondrecommendation stage.
Visual encoding guidelines are generic principles that establish relations betweenvisual components of a visualization (e.g., x � axis of a bar chart) and elements of thedata (e.g., whether a field is numeric, categorical, a location, see Section 2.1). A prepro-cessing unit analyzes the data to structure them in terms of interesting data elementsso that visual encoding can take place. The three steps to generating personalized vi-
ACM Transactions on Interactive Intelligent Systems, Vol. V, No. N, Article A, Pub. date: January 2016.
A:8 Mutlu, Veas, Trattner
Visual Patterns
Bar chart pattern (1)Star Wars, Home Alone, etc.
Visual Component: x-AxisSupported types: string
Visual Component: y-AxisSupported types: number
Timeline pattern (3)Visual Component: x-Axis
Visual Component: y-AxisSupported types: date
...
key: name
type: string , nominal
1980, 1990, etc.key: year
type: date
name:Star Wars
genre: Sci-Fi
year:1980
Metadata Model Preprocessed Data
Element
...
Relevant Documents
...
18.000.000, 15.000.000 etc.
key: budget
type: number
budget: 18.000.000
Sci-Fi, Comedy, etc.
key: genre
type: string , categorical
Supported types: number
Visual Component: colorSupported types: string
name:Home Alone
year:1990
budget: 15.000.000
genre: Comedy
(a) (b) (c) (d) (e)
Mapping CombinationsBarchart:1. mapping combinationx-axis: namey-axis:budget
2. mapping combinationx-axis: genrey-axis:budget
Timeline:1. mapping combinationx-axis: yeary-axis:budgetcolor:name2.mapping combinationx-axis:yeary-axis:budgetcolor:genre
...
Preprocessing Visual Mapping User Preference Filtering
Top-n List of Recommended Visualizations
(f)
Item
Item
Item
Content Based Filtering
Collaborative Filtering
(g)
User Profile Item Profiles
Item
Item
Item
...
...
Recommended Visualizations
...
User s selected Visualization
Tags: Budget, Movies, Box office , Hollywood
Query
Data Sources
Mendeley, Europeana, ZBW, Dbpedia,etc.
Ratings:
Hybrid Filtering
¦
M
jjj iurecw
1),(
...
Element
),(2 iurec
...
),(1 iurec
(f)
...
...
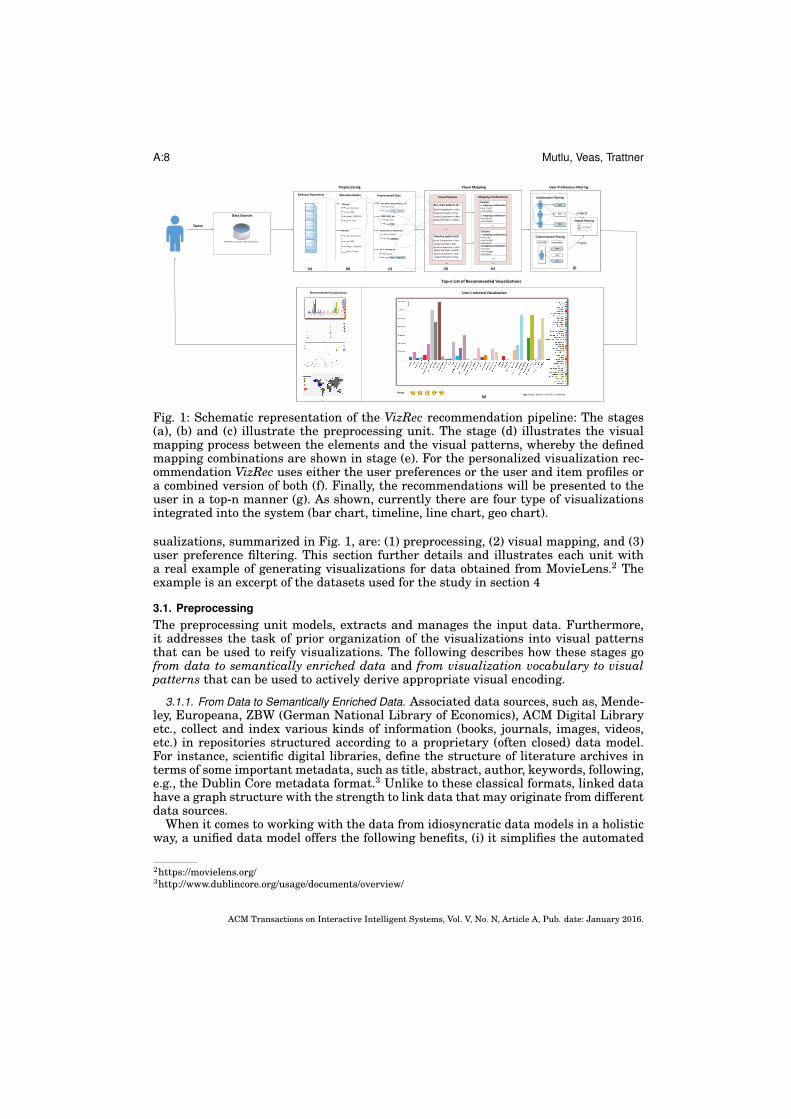
Fig. 1: Schematic representation of the VizRec recommendation pipeline: The stages(a), (b) and (c) illustrate the preprocessing unit. The stage (d) illustrates the visualmapping process between the elements and the visual patterns, whereby the definedmapping combinations are shown in stage (e). For the personalized visualization rec-ommendation VizRec uses either the user preferences or the user and item profiles ora combined version of both (f). Finally, the recommendations will be presented to theuser in a top-n manner (g). As shown, currently there are four type of visualizationsintegrated into the system (bar chart, timeline, line chart, geo chart).
sualizations, summarized in Fig. 1, are: (1) preprocessing, (2) visual mapping, and (3)user preference filtering. This section further details and illustrates each unit witha real example of generating visualizations for data obtained from MovieLens.2 Theexample is an excerpt of the datasets used for the study in section 4
3.1. PreprocessingThe preprocessing unit models, extracts and manages the input data. Furthermore,it addresses the task of prior organization of the visualizations into visual patternsthat can be used to reify visualizations. The following describes how these stages gofrom data to semantically enriched data and from visualization vocabulary to visualpatterns that can be used to actively derive appropriate visual encoding.
3.1.1. From Data to Semantically Enriched Data. Associated data sources, such as, Mende-ley, Europeana, ZBW (German National Library of Economics), ACM Digital Libraryetc., collect and index various kinds of information (books, journals, images, videos,etc.) in repositories structured according to a proprietary (often closed) data model.For instance, scientific digital libraries, define the structure of literature archives interms of some important metadata, such as title, abstract, author, keywords, following,e.g., the Dublin Core metadata format.3 Unlike to these classical formats, linked datahave a graph structure with the strength to link data that may originate from differentdata sources.
When it comes to working with the data from idiosyncratic data models in a holisticway, a unified data model offers the following benefits, (i) it simplifies the automated
2https://movielens.org/3http://www.dublincore.org/usage/documents/overview/
ACM Transactions on Interactive Intelligent Systems, Vol. V, No. N, Article A, Pub. date: January 2016.
VizRec: Recommending Personalized Visualizations A:9
Star Wars, Home Alone, etc.
key: nametype: string , nominal
1980, 1990, etc.key: yeartype: date
...
name:Star Wars
genre: Sci-Fi
year:1980
...
Element
Metadata Model Preprocessed Data
Element
...
Relevant Documents
...
18.000.000, 15.000.000 etc.key: budgettype: number
budget: 18.000.000
Sci-Fi, Comedy, etc.key: genretype: string , categorical
name:Home Aloneyear:1990
budget: 15.000.000genre: Comedy
(a) (b) (c)
...
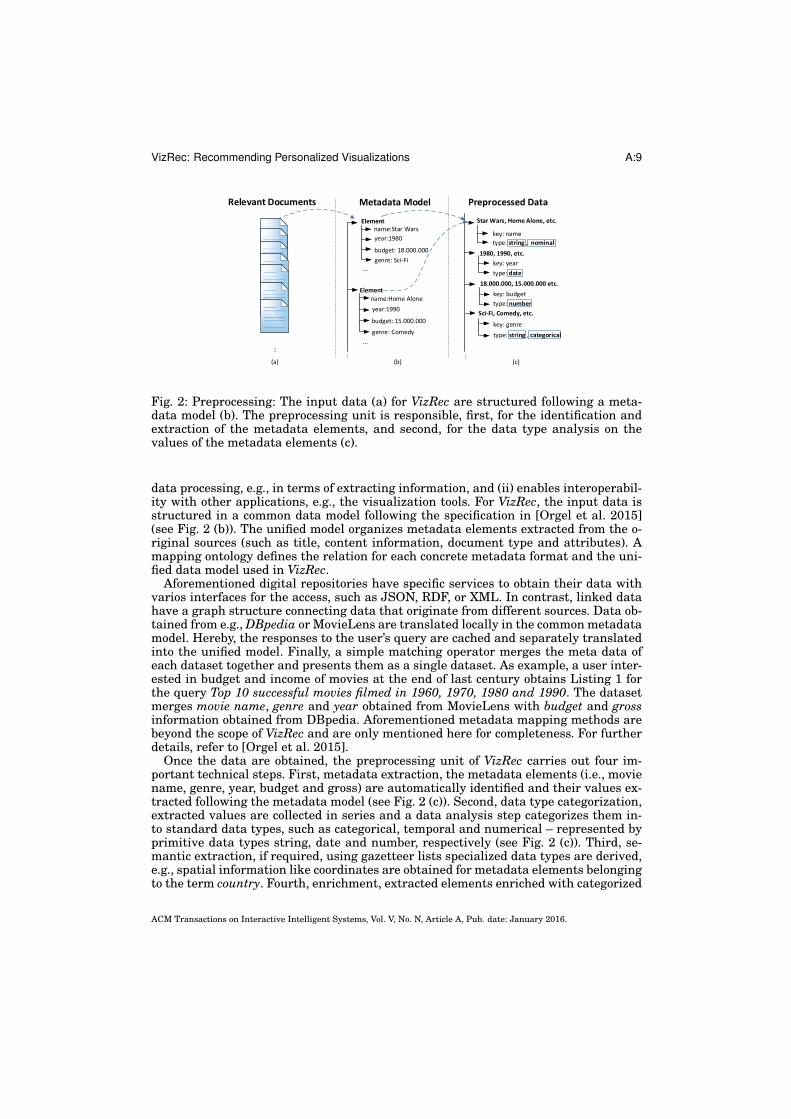
Fig. 2: Preprocessing: The input data (a) for VizRec are structured following a meta-data model (b). The preprocessing unit is responsible, first, for the identification andextraction of the metadata elements, and second, for the data type analysis on thevalues of the metadata elements (c).
data processing, e.g., in terms of extracting information, and (ii) enables interoperabil-ity with other applications, e.g., the visualization tools. For VizRec, the input data isstructured in a common data model following the specification in [Orgel et al. 2015](see Fig. 2 (b)). The unified model organizes metadata elements extracted from the o-riginal sources (such as title, content information, document type and attributes). Amapping ontology defines the relation for each concrete metadata format and the uni-fied data model used in VizRec.
Aforementioned digital repositories have specific services to obtain their data withvarios interfaces for the access, such as JSON, RDF, or XML. In contrast, linked datahave a graph structure connecting data that originate from different sources. Data ob-tained from e.g., DBpedia or MovieLens are translated locally in the common metadatamodel. Hereby, the responses to the user’s query are cached and separately translatedinto the unified model. Finally, a simple matching operator merges the meta data ofeach dataset together and presents them as a single dataset. As example, a user inter-ested in budget and income of movies at the end of last century obtains Listing 1 forthe query Top 10 successful movies filmed in 1960, 1970, 1980 and 1990. The datasetmerges movie name, genre and year obtained from MovieLens with budget and grossinformation obtained from DBpedia. Aforementioned metadata mapping methods arebeyond the scope of VizRec and are only mentioned here for completeness. For furtherdetails, refer to [Orgel et al. 2015].
Once the data are obtained, the preprocessing unit of VizRec carries out four im-portant technical steps. First, metadata extraction, the metadata elements (i.e., moviename, genre, year, budget and gross) are automatically identified and their values ex-tracted following the metadata model (see Fig. 2 (c)). Second, data type categorization,extracted values are collected in series and a data analysis step categorizes them in-to standard data types, such as categorical, temporal and numerical – represented byprimitive data types string, date and number, respectively (see Fig. 2 (c)). Third, se-mantic extraction, if required, using gazetteer lists specialized data types are derived,e.g., spatial information like coordinates are obtained for metadata elements belongingto the term country. Fourth, enrichment, extracted elements enriched with categorized
ACM Transactions on Interactive Intelligent Systems, Vol. V, No. N, Article A, Pub. date: January 2016.
A:10 Mutlu, Veas, Trattner
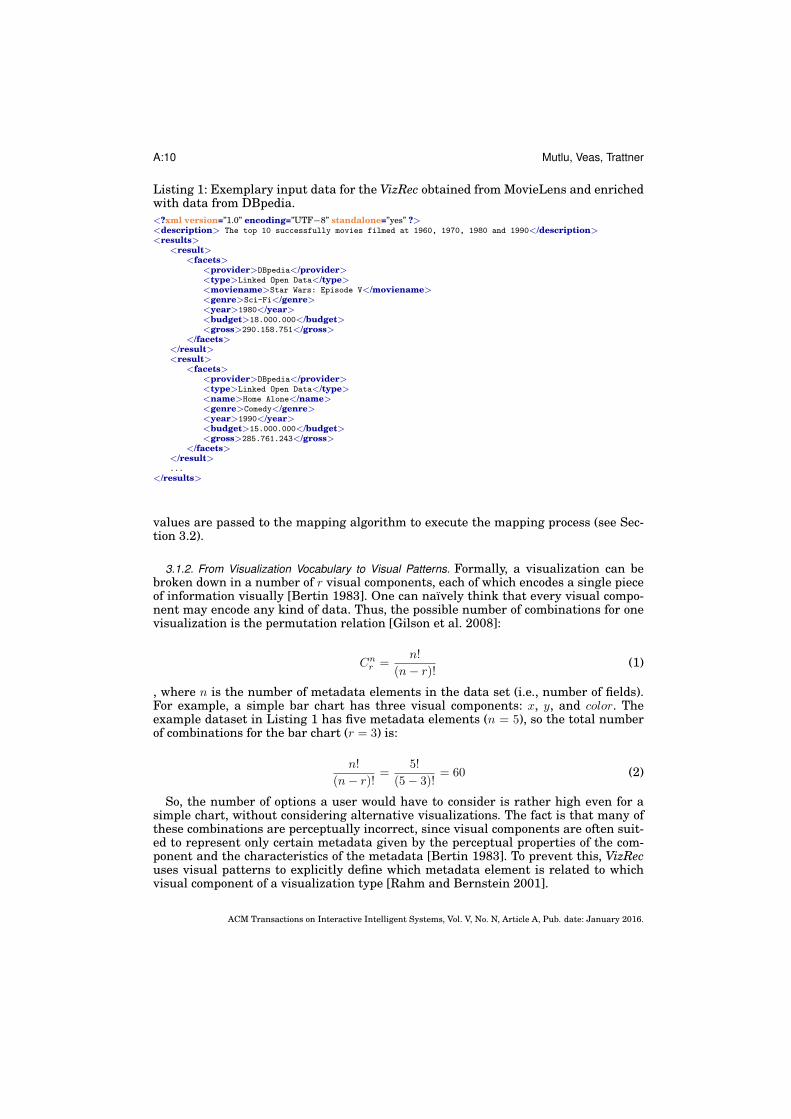
Listing 1: Exemplary input data for the VizRec obtained from MovieLens and enrichedwith data from DBpedia.<?xml version=”1.0” encoding=”UTF�8” standalone=”yes” ?><description> The top 10 successfully movies filmed at 1960, 1970, 1980 and 1990</description><results>
<result><facets>
<provider>DBpedia</provider><type>Linked Open Data</type><moviename>Star Wars: Episode V</moviename><genre>Sci-Fi</genre><year>1980</year><budget>18.000.000</budget><gross>290.158.751</gross>
</facets></result><result>
<facets><provider>DBpedia</provider><type>Linked Open Data</type><name>Home Alone</name><genre>Comedy</genre><year>1990</year><budget>15.000.000</budget><gross>285.761.243</gross>
</facets></result>...
</results>
values are passed to the mapping algorithm to execute the mapping process (see Sec-tion 3.2).
3.1.2. From Visualization Vocabulary to Visual Patterns. Formally, a visualization can bebroken down in a number of r visual components, each of which encodes a single pieceof information visually [Bertin 1983]. One can naıvely think that every visual compo-nent may encode any kind of data. Thus, the possible number of combinations for onevisualization is the permutation relation [Gilson et al. 2008]:
C
nr =
n!
(n� r)!(1)
, where n is the number of metadata elements in the data set (i.e., number of fields).For example, a simple bar chart has three visual components: x, y, and color. Theexample dataset in Listing 1 has five metadata elements (n = 5), so the total numberof combinations for the bar chart (r = 3) is:
n!
(n� r)!=
5!
(5� 3)!= 60 (2)
So, the number of options a user would have to consider is rather high even for asimple chart, without considering alternative visualizations. The fact is that many ofthese combinations are perceptually incorrect, since visual components are often suit-ed to represent only certain metadata given by the perceptual properties of the com-ponent and the characteristics of the metadata [Bertin 1983]. To prevent this, VizRecuses visual patterns to explicitly define which metadata element is related to whichvisual component of a visualization type [Rahm and Bernstein 2001].
ACM Transactions on Interactive Intelligent Systems, Vol. V, No. N, Article A, Pub. date: January 2016.
VizRec: Recommending Personalized Visualizations A:11
VA Vocabulary Components
Bar chartVisual Component: x-Axis
Supported types: string, date
Visual Component: y-AxisSupported types: number
TimelineVisual Component: x-Axis
Supported types: date
Visual Component: y-AxisSupported types: string, number
Bar chart
Visual Patterns
(1) {x-Axis: string, y-Axis: number}
(2) {x-Axis: date, y-Axis: number}
Timeline(1) {x-Axis: date, y-Axis: string, color: string}
Visual Component: color
Supported types: string, location
(2) {x-Axis: date, y-Axis: string, color: location}
(3) {x-Axis: date, y-Axis: number, color: string}
(4) {x-Axis: date, y-Axis: number, color: location}
Visual Component: colorSupported types: string
(3) {x-Axis: string, y-Axis: number, color:string}
(4) {x-Axis: date, y-Axis: number, color:string}
(5) {x-Axis: date, y-Axis: string, color: location}
......
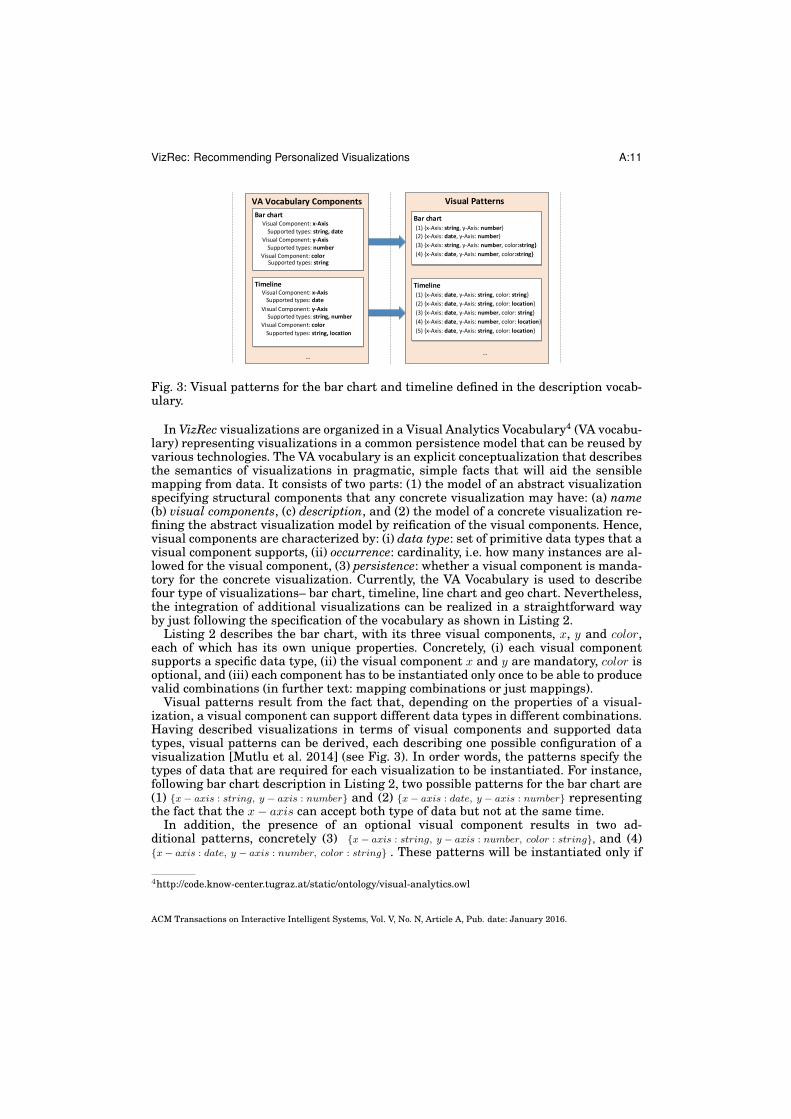
Fig. 3: Visual patterns for the bar chart and timeline defined in the description vocab-ulary.
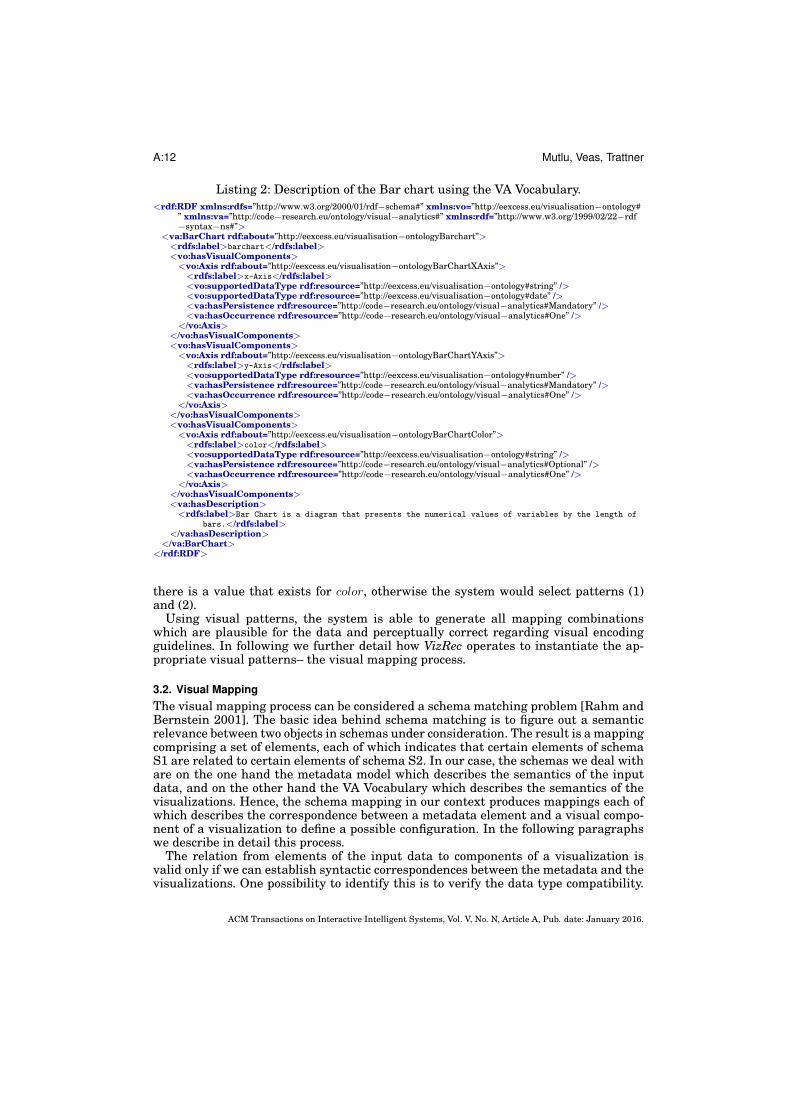
In VizRec visualizations are organized in a Visual Analytics Vocabulary4 (VA vocabu-lary) representing visualizations in a common persistence model that can be reused byvarious technologies. The VA vocabulary is an explicit conceptualization that describesthe semantics of visualizations in pragmatic, simple facts that will aid the sensiblemapping from data. It consists of two parts: (1) the model of an abstract visualizationspecifying structural components that any concrete visualization may have: (a) name(b) visual components, (c) description, and (2) the model of a concrete visualization re-fining the abstract visualization model by reification of the visual components. Hence,visual components are characterized by: (i) data type: set of primitive data types that avisual component supports, (ii) occurrence: cardinality, i.e. how many instances are al-lowed for the visual component, (3) persistence: whether a visual component is manda-tory for the concrete visualization. Currently, the VA Vocabulary is used to describefour type of visualizations– bar chart, timeline, line chart and geo chart. Nevertheless,the integration of additional visualizations can be realized in a straightforward wayby just following the specification of the vocabulary as shown in Listing 2.
Listing 2 describes the bar chart, with its three visual components, x, y and color,each of which has its own unique properties. Concretely, (i) each visual componentsupports a specific data type, (ii) the visual component x and y are mandatory, color isoptional, and (iii) each component has to be instantiated only once to be able to producevalid combinations (in further text: mapping combinations or just mappings).
Visual patterns result from the fact that, depending on the properties of a visual-ization, a visual component can support different data types in different combinations.Having described visualizations in terms of visual components and supported datatypes, visual patterns can be derived, each describing one possible configuration of avisualization [Mutlu et al. 2014] (see Fig. 3). In order words, the patterns specify thetypes of data that are required for each visualization to be instantiated. For instance,following bar chart description in Listing 2, two possible patterns for the bar chart are(1) {x� axis : string, y � axis : number} and (2) {x� axis : date, y � axis : number} representingthe fact that the x� axis can accept both type of data but not at the same time.
In addition, the presence of an optional visual component results in two ad-ditional patterns, concretely (3) {x� axis : string, y � axis : number, color : string}, and (4){x� axis : date, y � axis : number, color : string} . These patterns will be instantiated only if
4http://code.know-center.tugraz.at/static/ontology/visual-analytics.owl
ACM Transactions on Interactive Intelligent Systems, Vol. V, No. N, Article A, Pub. date: January 2016.
A:12 Mutlu, Veas, Trattner
Listing 2: Description of the Bar chart using the VA Vocabulary.<rdf:RDF xmlns:rdfs=”http://www.w3.org/2000/01/rdf�schema#” xmlns:vo=”http://eexcess.eu/visualisation�ontology#
” xmlns:va=”http://code�research.eu/ontology/visual�analytics#” xmlns:rdf=”http://www.w3.org/1999/02/22�rdf�syntax�ns#”>
<va:BarChart rdf:about=”http://eexcess.eu/visualisation�ontologyBarchart”><rdfs:label>barchart</rdfs:label><vo:hasVisualComponents><vo:Axis rdf:about=”http://eexcess.eu/visualisation�ontologyBarChartXAxis”><rdfs:label>x-Axis</rdfs:label><vo:supportedDataType rdf:resource=”http://eexcess.eu/visualisation�ontology#string” /><vo:supportedDataType rdf:resource=”http://eexcess.eu/visualisation�ontology#date” /><va:hasPersistence rdf:resource=”http://code�research.eu/ontology/visual�analytics#Mandatory” /><va:hasOccurrence rdf:resource=”http://code�research.eu/ontology/visual�analytics#One” />
</vo:Axis></vo:hasVisualComponents><vo:hasVisualComponents><vo:Axis rdf:about=”http://eexcess.eu/visualisation�ontologyBarChartYAxis”><rdfs:label>y-Axis</rdfs:label><vo:supportedDataType rdf:resource=”http://eexcess.eu/visualisation�ontology#number” /><va:hasPersistence rdf:resource=”http://code�research.eu/ontology/visual�analytics#Mandatory” /><va:hasOccurrence rdf:resource=”http://code�research.eu/ontology/visual�analytics#One” />
</vo:Axis></vo:hasVisualComponents><vo:hasVisualComponents><vo:Axis rdf:about=”http://eexcess.eu/visualisation�ontologyBarChartColor”><rdfs:label>color</rdfs:label><vo:supportedDataType rdf:resource=”http://eexcess.eu/visualisation�ontology#string” /><va:hasPersistence rdf:resource=”http://code�research.eu/ontology/visual�analytics#Optional” /><va:hasOccurrence rdf:resource=”http://code�research.eu/ontology/visual�analytics#One” />
</vo:Axis></vo:hasVisualComponents><va:hasDescription><rdfs:label>Bar Chart is a diagram that presents the numerical values of variables by the length of
bars.</rdfs:label></va:hasDescription>
</va:BarChart></rdf:RDF>
there is a value that exists for color, otherwise the system would select patterns (1)and (2).
Using visual patterns, the system is able to generate all mapping combinationswhich are plausible for the data and perceptually correct regarding visual encodingguidelines. In following we further detail how VizRec operates to instantiate the ap-propriate visual patterns– the visual mapping process.
3.2. Visual MappingThe visual mapping process can be considered a schema matching problem [Rahm andBernstein 2001]. The basic idea behind schema matching is to figure out a semanticrelevance between two objects in schemas under consideration. The result is a mappingcomprising a set of elements, each of which indicates that certain elements of schemaS1 are related to certain elements of schema S2. In our case, the schemas we deal withare on the one hand the metadata model which describes the semantics of the inputdata, and on the other hand the VA Vocabulary which describes the semantics of thevisualizations. Hence, the schema mapping in our context produces mappings each ofwhich describes the correspondence between a metadata element and a visual compo-nent of a visualization to define a possible configuration. In the following paragraphswe describe in detail this process.
The relation from elements of the input data to components of a visualization isvalid only if we can establish syntactic correspondences between the metadata and thevisualizations. One possibility to identify this is to verify the data type compatibility.
ACM Transactions on Interactive Intelligent Systems, Vol. V, No. N, Article A, Pub. date: January 2016.

VizRec: Recommending Personalized Visualizations A:13
Visual PatternsBar chart s pattern (1)Star Wars, Home Alone, etc.
Visual Component: x-AxisSupported types: string
Visual Component: y-AxisSupported types: number
Bar chart s pattern (2)Visual Component: x-Axis
Visual Component: y-Axis
Supported types: date
...
key: name
type: string , nominal1980, 1990, etc.
key: year
type: date
...
Preprocessed Data
18.000.000, 15.000.000 etc.key: budget
type: number Sci-Fi, Comedy, etc.
key: genre
type: string , categorical Supported types: number
(c) (d) (e)
Mapping CombinationsBarchart:1. mapping combinationx-axis: namey-axis:budget
2. mapping combinationx-axis: genrey-axis:budget
Bachart:1. mapping combinationx-axis: yeary-axis:budget
2. mapping combinationx-axis: yeary-axis:budget
Visualizations
......
...
Fig. 4: Visual mapping process.
Data type compatibility in our context means having exactly the same data types,conforming to the XSD data type definition.5 The preprocessing unit provides patternsfor visualizations and a common model for the input data both including the data typesof their elements. From the specifications of the visual patterns, the mapping operatorcompares the data types of the visual components and metadata with each other andbuilds a list of plausible mappings (see Fig. 4 (c) and (d)).
Beyond the data type compatibility, a valid mapping needs to account for structuralcompatibility, since visualizations have either fixed or varying number of visual com-ponents. To generate a visualization, the mapping operator has to instantiate everymandatory visual component while the pattern(s) including optional components canbe ignored if there is no corresponding data element therefor. Formally, each patterni defines for each visual component j which rj metadata element should be selectedfrom nj metadata elements:
nj !
rj !(nj � rj)!=
✓nj
rj
◆= C
njrj (3)
Note that nj is a subset of n that complies with data type compatibility for the j
visual component. To obtain the total number of combinations Mi, generated for aparticular pattern i, we multiply every suitable
�nj
rj
�notation of a pattern:
Mi =Y
C
njrj (4)
Thus, the final number of combinations M for a visualization is nothing else thenthe sum of every Mi:
M =X
{Mi} (5)
Continuing the example about successful movies, VizRec considers the following fact-s: (i) the underlying dataset contains two string values (movie name, genre), one date(creation year), and two numbers (budget and gross), (ii) only the patterns, which ac-cept categorical/nominal (string), temporal (date) and numerical values (number) areappropriate. Thus, geographical visualizations will not be further considered by thesystem.
5http://www.w3.org/TR/2001/REC-xmlschema-2-20010502/
ACM Transactions on Interactive Intelligent Systems, Vol. V, No. N, Article A, Pub. date: January 2016.

A:14 Mutlu, Veas, Trattner
(a) Generated using Bar chart s pattern 1
(c) Generated using Bar chart s pattern 3 (d) Generated using Bar chart s pattern 4
(b) Generated using Bar chart s pattern 2
Fig. 5: Some of the bar chart combinations generated for the dataset movies using thebar chart patterns (1), (2), (3) and (4). The patterns are listed in Table I.
According to the pattern description from Listing 2, bar chart complies with facts(i) and (ii). Using visual patterns, the system selects bar chart pattern (1) countingexactly one element with data type string and one with data type number, producing:
M1 = C
21 ⇥ C
21 =
✓2
1
◆⇥
✓2
1
◆= 4 (6)
mapping combinations, containing e.g., {x� axis : movie name, y � axis : budget} (seeFig. 5 a). For pattern (2) the system selects one metadata element with the data typedate and one with datatype number, obtaining
M2 = C
11 ⇥ C
21 =
✓1
1
◆⇥
✓2
1
◆= 2 (7)
mapping combinations containing e.g., {x� axis : creation year, y � axis : budget} (seeFig. 5 b). For pattern (3) VizRec selects one element with data type string, one withdata type number and another one with data type string, so that
M3 = C
21 ⇥ C
21 ⇥ C
21 =
✓2
1
◆⇥
✓2
1
◆⇥
✓2
1
◆= 8 (8)
mapping combinations are determined containing e.g.,{x� axis : movie name, y � axis : budget, color : genre} (see Fig. 5 c). Note, thesemappings contain redundant mapping, that is, an element can be selected for morethan one visual component. For instance, for this pattern the element movie name canbe mapped once on the x � axis and once on the color (see Table I Pat.num (3)) sinceboth components support the datatype string. The benefit of this mapping condition isthe definition of more customized legends for the visualizations then those generatedby default.
ACM Transactions on Interactive Intelligent Systems, Vol. V, No. N, Article A, Pub. date: January 2016.
VizRec: Recommending Personalized Visualizations A:15
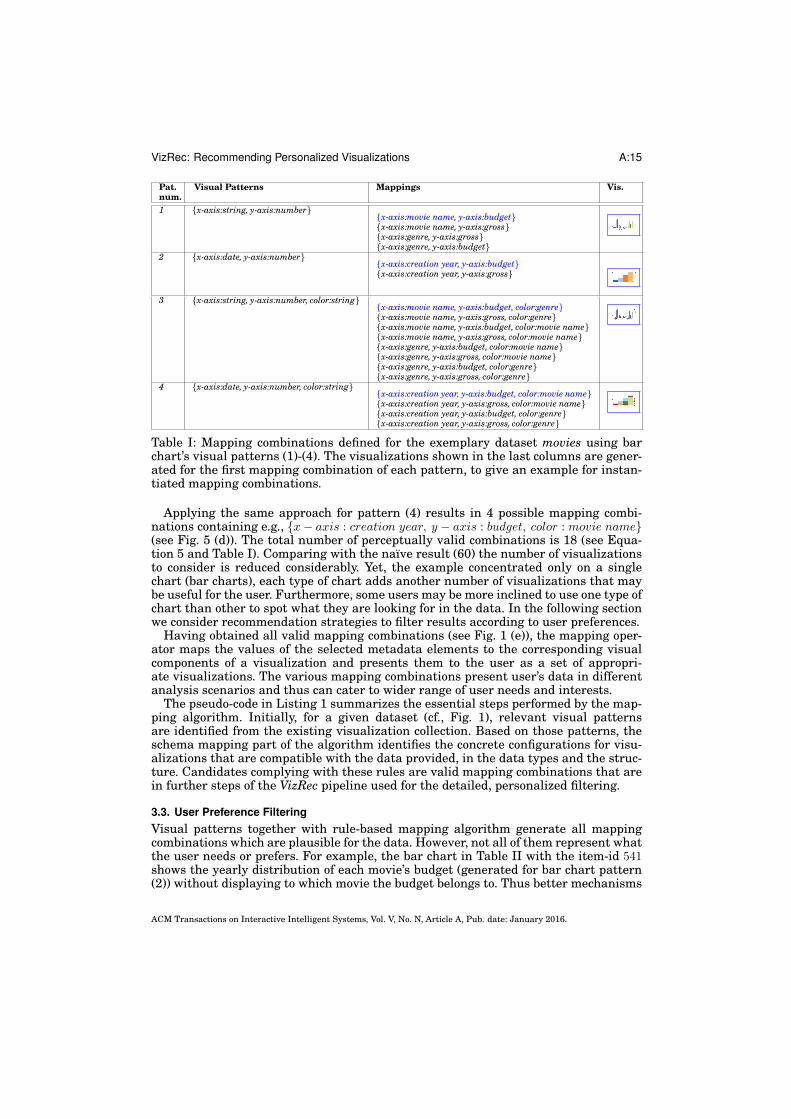
Pat.num.
Visual Patterns Mappings Vis.
1 {x-axis:string, y-axis:number}{x-axis:movie name, y-axis:budget}{x-axis:movie name, y-axis:gross}{x-axis:genre, y-axis:gross}{x-axis:genre, y-axis:budget}
2 {x-axis:date, y-axis:number}{x-axis:creation year, y-axis:budget}{x-axis:creation year, y-axis:gross}
3 {x-axis:string, y-axis:number, color:string}{x-axis:movie name, y-axis:budget, color:genre}{x-axis:movie name, y-axis:gross, color:genre}{x-axis:movie name, y-axis:budget, color:movie name}{x-axis:movie name, y-axis:gross, color:movie name}{x-axis:genre, y-axis:budget, color:movie name}{x-axis:genre, y-axis:gross, color:movie name}{x-axis:genre, y-axis:budget, color:genre}{x-axis:genre, y-axis:gross, color:genre}
4 {x-axis:date, y-axis:number, color:string}{x-axis:creation year, y-axis:budget, color:movie name}{x-axis:creation year, y-axis:gross, color:movie name}{x-axis:creation year, y-axis:budget, color:genre}{x-axis:creation year, y-axis:gross, color:genre}
Table I: Mapping combinations defined for the exemplary dataset movies using barchart’s visual patterns (1)-(4). The visualizations shown in the last columns are gener-ated for the first mapping combination of each pattern, to give an example for instan-tiated mapping combinations.
Applying the same approach for pattern (4) results in 4 possible mapping combi-nations containing e.g., {x� axis : creation year, y � axis : budget, color : movie name}(see Fig. 5 (d)). The total number of perceptually valid combinations is 18 (see Equa-tion 5 and Table I). Comparing with the naıve result (60) the number of visualizationsto consider is reduced considerably. Yet, the example concentrated only on a singlechart (bar charts), each type of chart adds another number of visualizations that maybe useful for the user. Furthermore, some users may be more inclined to use one type ofchart than other to spot what they are looking for in the data. In the following sectionwe consider recommendation strategies to filter results according to user preferences.
Having obtained all valid mapping combinations (see Fig. 1 (e)), the mapping oper-ator maps the values of the selected metadata elements to the corresponding visualcomponents of a visualization and presents them to the user as a set of appropri-ate visualizations. The various mapping combinations present user’s data in differentanalysis scenarios and thus can cater to wider range of user needs and interests.
The pseudo-code in Listing 1 summarizes the essential steps performed by the map-ping algorithm. Initially, for a given dataset (cf., Fig. 1), relevant visual patternsare identified from the existing visualization collection. Based on those patterns, theschema mapping part of the algorithm identifies the concrete configurations for visu-alizations that are compatible with the data provided, in the data types and the struc-ture. Candidates complying with these rules are valid mapping combinations that arein further steps of the VizRec pipeline used for the detailed, personalized filtering.
3.3. User Preference FilteringVisual patterns together with rule-based mapping algorithm generate all mappingcombinations which are plausible for the data. However, not all of them represent whatthe user needs or prefers. For example, the bar chart in Table II with the item-id 541shows the yearly distribution of each movie’s budget (generated for bar chart pattern(2)) without displaying to which movie the budget belongs to. Thus better mechanisms
ACM Transactions on Interactive Intelligent Systems, Vol. V, No. N, Article A, Pub. date: January 2016.

A:16 Mutlu, Veas, Trattner
ALGORITHM 1: Simplified algorithm for determining appropriate mapping combinationsData: set(data element) // retrieved and preprocessed content from data sources
Result: set(mapping combination)// result set
set(mapping combination) empty set;
// map containing visualizations and their visual patterns
map(visualization, set(visual pattern)) empty map;
// first step: collect all available visual patterns
set(visualization) get all visualizations from repository;while set(visualization) not empty do
visualization take current visualization from the set;set(visual components) get visual components from visualization;
// The generation is based on component attributes: occurrence, persistence
set(visual pattern) generate patterns out of set(visual components);
// Store generated patterns
map(visualization, set(visual pattern)) append pair (visualization,set(visual pattern));
// second step: identify mappings based on visual patterns
while map(visualization, set(visual pattern)) not empty dovisualization take current vis. pair (visualization, set(visual pattern)) from set;while set(visual pattern) not empty do
visual pattern take current pattern from set;while set(data element) not empty do
// The structure is evaluated based on a number of visual components
// within a pattern
if structural match between (visual pattern) and (data elements) then// Datatype match is performed between visual components
// and individual elements of the current data
if datatype match between (visual pattern) and (data elements) then// Elements of the current data are mapped (linked)
// to the corresponding visual components of the current pattern
mapping combination map elements to visual components;set(mapping combination) append mapping combination;
elsecontinue;
elsecontinue;
for selecting the visualization are required. The first approach we investigate is collab-orative filtering (CF) [Schafer et al. 2007], which relies on explicit feedback providedby the user in form of ratings. Ratings alone do not tell much about the content of thedata that a visualization represents. To take this aspect into account, we investigatea method that is known as content-based filtering [Lops et al. 2011] in the literature.Content-based filtering requires meta-data information, e.g., in the form of keyword-s or tags applied by the user describing each visualization. In the VizRec approach,we relay on tags, as they have been shown to be useful in many recommender or in-formation retrieval scenarios [Larrain et al. 2015]. Finally, a VizRec includes a hybrid
ACM Transactions on Interactive Intelligent Systems, Vol. V, No. N, Article A, Pub. date: January 2016.

VizRec: Recommending Personalized Visualizations A:17
Item-id User-id Rating Item254 1
610
4.04.55.5
960 1610
6.55.54.0
541 1610
2.53.03.5
721 1610
1.02.52.0
360 610
5.56.5
... ... ... ...
Table II: Input data for calculation of the k-nearest neighbors and generating predic-tions for the active user, including item-id, user-id and ratings.
recommendation approach, that combines information on what a visualization is about(tags) and how good it is (ratings). This section further provides technical details of therecommendation strategies included into ViZRec.
3.3.1. Collaborative Filtering. To filter the mapping combinations M based on the userpreferences (see Fig. 1 (f)), we employ a simple user-based collaborative filtering (CF)approach utilizing ratings [Su and Khoshgoftaar 2009]. The basic idea behind CF is tofind a user with similar preferences to the active user, who has rated the item x thatthe active user has not seen yet. Hence, the average ratings of the similar users areapplied to predict if the active user will prefer the item x. In a nutshell, the algorithmneeds to identify users similar to the active user, k-nearest neighbors respectively, whoshare active user’s tastes. To calculate the k-nearest neighbors, we construct a m ⇥ n
matrix A where each entry ai,j represents the rating of the ith user on the jth item(mapping combination). Each rating is a numerical scale, e.g., from 1 to 7. Havingconstructed the matrix A we employ Pearson nearest neighbor algorithm to calculatethe similarity between the active user u and the user v using the Equation 9:
ACM Transactions on Interactive Intelligent Systems, Vol. V, No. N, Article A, Pub. date: January 2016.
A:18 Mutlu, Veas, Trattner
sim(u, v) =⌃i2I(ru,i � ru)(rv,i � rv)p
⌃i2I(ru,i � ru)2p
⌃i2I(rv,i � rv)2(9)
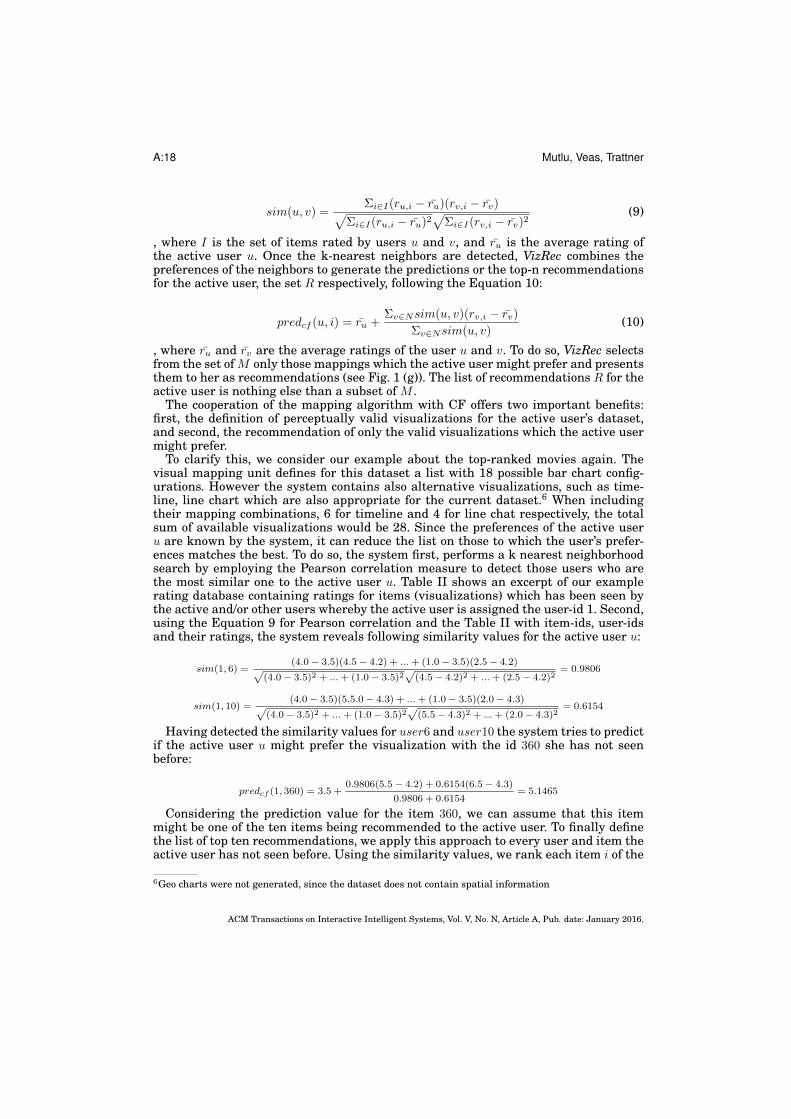
, where I is the set of items rated by users u and v, and ru is the average rating ofthe active user u. Once the k-nearest neighbors are detected, VizRec combines thepreferences of the neighbors to generate the predictions or the top-n recommendationsfor the active user, the set R respectively, following the Equation 10:
predcf (u, i) = ru +⌃v2Nsim(u, v)(rv,i � rv)
⌃v2Nsim(u, v)(10)
, where ru and rv are the average ratings of the user u and v. To do so, VizRec selectsfrom the set of M only those mappings which the active user might prefer and presentsthem to her as recommendations (see Fig. 1 (g)). The list of recommendations R for theactive user is nothing else than a subset of M .
The cooperation of the mapping algorithm with CF offers two important benefits:first, the definition of perceptually valid visualizations for the active user’s dataset,and second, the recommendation of only the valid visualizations which the active usermight prefer.
To clarify this, we consider our example about the top-ranked movies again. Thevisual mapping unit defines for this dataset a list with 18 possible bar chart config-urations. However the system contains also alternative visualizations, such as time-line, line chart which are also appropriate for the current dataset.6 When includingtheir mapping combinations, 6 for timeline and 4 for line chat respectively, the totalsum of available visualizations would be 28. Since the preferences of the active useru are known by the system, it can reduce the list on those to which the user’s prefer-ences matches the best. To do so, the system first, performs a k nearest neighborhoodsearch by employing the Pearson correlation measure to detect those users who arethe most similar one to the active user u. Table II shows an excerpt of our examplerating database containing ratings for items (visualizations) which has been seen bythe active and/or other users whereby the active user is assigned the user-id 1. Second,using the Equation 9 for Pearson correlation and the Table II with item-ids, user-idsand their ratings, the system reveals following similarity values for the active user u:
sim(1, 6) =(4.0� 3.5)(4.5� 4.2) + ...+ (1.0� 3.5)(2.5� 4.2)
p(4.0� 3.5)2 + ...+ (1.0� 3.5)2
p(4.5� 4.2)2 + ...+ (2.5� 4.2)2
= 0.9806
sim(1, 10) =(4.0� 3.5)(5.5.0� 4.3) + ...+ (1.0� 3.5)(2.0� 4.3)
p(4.0� 3.5)2 + ...+ (1.0� 3.5)2
p(5.5� 4.3)2 + ...+ (2.0� 4.3)2
= 0.6154
Having detected the similarity values for user6 and user10 the system tries to predictif the active user u might prefer the visualization with the id 360 she has not seenbefore:
predcf (1, 360) = 3.5 +0.9806(5.5� 4.2) + 0.6154(6.5� 4.3)
0.9806 + 0.6154= 5.1465
Considering the prediction value for the item 360, we can assume that this itemmight be one of the ten items being recommended to the active user. To finally definethe list of top ten recommendations, we apply this approach to every user and item theactive user has not seen before. Using the similarity values, we rank each item i of the
6Geo charts were not generated, since the dataset does not contain spatial information
ACM Transactions on Interactive Intelligent Systems, Vol. V, No. N, Article A, Pub. date: January 2016.

VizRec: Recommending Personalized Visualizations A:19
k most similar users to the active user and present her only the visualizations withthe highest ranking.
3.3.2. Content-based Filtering. The CF recommendation strategy (CF-RS) needs theuser’s interests beforehand, which should be in common to at least a few other user.When CF-RS cannot find similar users, that is for instance the case when the useror the item is new to the system a content-based recommender (CB-RS) is a suitablealternative. The simplified workflow of the VizRec CB-RS is illustrated in the mainFigure 1 (g). In a nutshell, the VizRec CB-RS generates recommendations by analyzingthe relevant content, concretely, the information we know about the active user andthe information we collected to date (other users and their tags in repository) for someitems. Following the basic principles of CB-RS, the recommendations are producedbased on the content similarity, in our case between the interests of the active user –i.e., her profile, and already tagged items (visualizations).
User and Item Profiles: Usually, a user annotates items with tags which describethe content of the items and thus serve as appropriate inputs to define the itemprofile [Bogers and van den Bosch 2009; Lin et al. 2015]. In a nutshell, the item profilecontains information about visualizations in form of tags supplied by users in thepast. In the case of VizRec tags describe visualizations and the content they visualize.
For an unknown user, who has not rated or annotated any visualization, the onlyinformation available is the meta-data of the dataset result. The user profile is thenbuilt as follows: Each visualization generated is described with a mapping from meta-data to visual components, meta-data elements provide basic information about thecontents of the visualization, if a user has provided tags already, they are also includedin her profile. In summary, we build a profile of an active user based on (i) the currentset of mapping combinations (visualizations) she observes from the Visual Mappingstage, including (if it exists) (ii) the visualizations the user tagged in the past. Forinstance, when the user’s dataset is about the movies and the mapping combination{x� axis : movie name, y � axis : budget, color : genre} (cf. Figure 5 (c)) is suggestedfor the current dataset, VizRec would use the related meta-data elements as input todefine the active user’s profile, i.e., in this case movie name, budget and genre for theelements x-axis, y-axis and color respectively and the tags most popular, Hollywoodand comedy given by the active user in the past.
To relate the active user profile with the content in the repository, we build an itemprofile by aggregating the tags of all user per item (visualization). The benefits of thetag aggregation among all users is (i) to obtain more valuable information about indi-vidual items than focusing just on information from a single source and (ii) to considerthe preferences of the community and not just those of a single user which in turnincreases the likelihood that we select items which are relevant for the active user(cf., [Bogers and Van den Bosch 2009]).
One important concern regarding tags for the user and item profiles is a normal-ization process which is executed before storing tag information in repository. Thisprocess involves, (i) removing of commoner morphological and inflectional endingsfrom English words (e.g., movies �! movie, comedies&comedy �! comedi) usingthe Porter stemmer algorithm [Karaa and Gribaa 2013], (ii) removing of stop words(standard tokenizer) and punctuations (keyword tokenizer), and finally (iii) thelowercase filtering. This step helps to avoid that the words represented in variouslanguage forms are interpreted differently [Lops et al. 2011].
Similarity Estimation and Item Ranking: To determine the correlation betweenvisualizations and users, we transform the content of the user profiles and item
ACM Transactions on Interactive Intelligent Systems, Vol. V, No. N, Article A, Pub. date: January 2016.

A:20 Mutlu, Veas, Trattner
profiles into the Vector Space Model (VSM) with the TF-IDF (Term Frequency-InverseDocument Frequency) weighting schema. As mentioned in section 2.4, VSM is acommon technique to vectorize the content, concretely the visualizations, and in thisway to enable their analysis, such as classification and clustering for example. In ourcase, VSM consists of user profile (mapping combinations) and item profile (tags),both represented in form of vectors. Using this scheme, each mapping combination(e.g., movie name, budget, genre) is defined as an n-dimensional vector, where eachdimension corresponds to a tag, or more precisely, to the TF-IDF weight of thatparticular tag. To clarify this, let M = {m1, m2, m3, ..., mN} be a set of mappingcombinations for the current dataset and T = {t1, t2, t3, ..., tn} a set of tag collections.Each mapping combination mi is represented as a vector in a n-dimensional vectorspace, i.e., mi = w1,i, w1,i, w3,i, ..., wn,i, where wk,i denotes the weight for the tag tk in amapping combination mi, i.e.:
wk,i = tf � idftk,mi = tftk,mi ⇥ idft = tftk,mi ⇥loge
✓N
dft + 1
◆+ 1
�(11)
, where the former factor of the product is an occurrence frequency of the tag tk withina mapping combination mi, and the later indicates the distribution of the tag amongall considered mapping combinations from both profiles (i.e., so that particular andcommonly occurring tags can be discriminated from each other). With this weightingscheme, it is now possible to estimate how similar are the contents of the individualmapping combinations, and more importantly, how similar are the profiles. We use theweighting information in vectors to estimate this similarity. For the comparison, weapply the cosine similarity measure [Lops et al. 2011], defined as follows:
sim(mi,mj) =
Pk wk,iwk,jpP
k (wk,i)2pP
k (wk,j)2(12)
The result of this measure is a cosine value of the angle between two vectors, in ourcase between two mapping combinations. To identify which of the mapping combina-tions from the item profile are relevant for the active user’s profile, we compare theircontaining vectors with each other using the equation above. The retrieved values arethen used as scores to rank the relevant mapping combinations.
Returning to the example about top-ranked movies filmed in certain period of time.When now including the shooting location (country) and the population of each coun-try into the results, the mapping algorithm would produce a total of 55 visualizationsfor 4 types of visualizations for the active user– incl. geo chart. Subsequently, VizRecgenerates the user profile by extracting relevant tags (meta-data elements) from theindividual visualizations – an excerpt of this profile is shown in the left column ofTable III. The summarized terms represent here the actual content in each particu-lar visualization – for instance, genre, movie and gross dimensions of the dataset aredisplayed in the bar chart (the second row). Note that this profile information can beaugmented by additional tags, for example, when user is annotating visualizations7.An excerpt of the item profile generated from aggregated user tags is shown in bot-tom part of Table III. The TF-IDF vectors are shown next to the tags in Table III. Forexample, the tag genre in the first mapping combination from the table has a TF-IDFweight of 1.606. The term occurs only once in this mapping, i.e., tfgenre,mapping38 = 1,and in 59 other mappings out of 110 overall mappings in repository, i.e., dfgenre = 59
7find further information about annotating visualizations in Section 4.
ACM Transactions on Interactive Intelligent Systems, Vol. V, No. N, Article A, Pub. date: January 2016.

VizRec: Recommending Personalized Visualizations A:21
User profileID Tags (frequency) TF-IDF Vector (weight).. ... ...
38
genre(1), movie(1), gross(1), barchart(1) genr:(1.606), movi:(1.306), gross:(1.916), barchart:(2.204)
.. ... ...
46
genre(1), year(1), gross(1), barchart(1) genr:(1.606), year:(1.542), gross:(1.916), barchart:(2.204),
47
genre(1), year(1), budget(1), barchart(1) genr:(1.606), year:(1.542), udget:(2.090), barchart:(2.204)
.. ... ...Item profile
ID Tags (frequency) TF-IDF Vector (weight).. ... ...
23
movie(6), genre(7), budget(9), film(2), mul-ti(1), line(1), chart(3), progressive(1), bud-gets(4), gross(1), sales(1), years(2), produc-tion(1), costs(1), films(1), action(1), sci-fi(1),decade(1), genres(3), movies(3), year(2),timeline(1)
movi:(3.918), genr:(5.079), budget:(7.534), film:(3.030),multi:(3.398), line:(4.091), chart:(3.205), progress:(4.602),gross:(1.916), sale:(3.398), year:(3.083), product:(2.705),cost:(3.398), fi:(4.091), action:(3.621), sci:(4.091),decad:(2.481), timelin:(2.117)
.. ... ...
25
movie(5), revenue(2), genre(12), gross(8),collections(2), films(2), most(1), success-ful(1), film(2), top(1), grosser(1), movies(5),years(1), earnings(1), year(2), money(1),decades(2), profit(1), box(1), office(1), profit-s(1), decade(1), genres(2)
movi:(4.130), revenu:(3.974), genr:(5.791), gross:(5.420),collect:(4.548), film:(3.498), most:(3.216), success:(4.602),top:(3.061), grosser:(4.314), year:(2.670), earn:(2.928),monei:(3.503), decad:(4.298), profit:(4.232), box:(2.810), off-ic:(2.810)
.. ... ...
48
movie(4), genre(7), revenue(1), top(1), gross-ing(1), cinemas(1), box(1), office(1), gross(9),collections(1), cinema(1), numbers(1),movies(4), categories(1), budget(1), prefer-ence(1), earnings(1), popular(1), profit(1),comedy(1), drama(1), genres(1)
movi:(3.694), genr:(4.543), revenu:(2.810), top:(3.061),gross:(6.060), cinema:(6.101), box:(2.810), offic:(2.810),collect:(3.216), number:(4.091), categori:(2.928), bud-get:(2.090), prefer:(2.992), earn:(2.928), popular:(2.442),profit:(2.992) comedi:(3.503), drama:(4.314)
.. ... ...
Table III: An excerpt of the movies dataset with generated user and item profiles.
and N = 110 respectively, so that tf � idfgenre,mapping38 = 1⇥ (loge(11059+1 ) + 1) = 1.606.
Note that here stemmed words are used instead of original ones (i.e., movie �! movi).In the final step, scores are assigned to individual mapping combinations by com-
paring vectors of those mappings with vectors from the item profile using Equation 12.Concretely in this example, the best matching could be found between mappings 46(user profile) and 25 (item profile). In a nutshell, their cosine value would be estimatedas follows:
sim(
2
64
1.5421.606...
1.916
3
75 ,
2
64
4.3142.928...
2.810
3
75) =1.542 · 4.314 + 1.606 · 2.928 + ...+ 1.916 · 2.810p1.5422 + ...+ 1.9162 ·
p4.3142 + ...+ 2.8102
= 0.398
Hence the mapping combination 46 with the tags genre, movie, gross, and barchartmight be in this case one of the 10 preferred visualizations for the active user. Finally,
ACM Transactions on Interactive Intelligent Systems, Vol. V, No. N, Article A, Pub. date: January 2016.
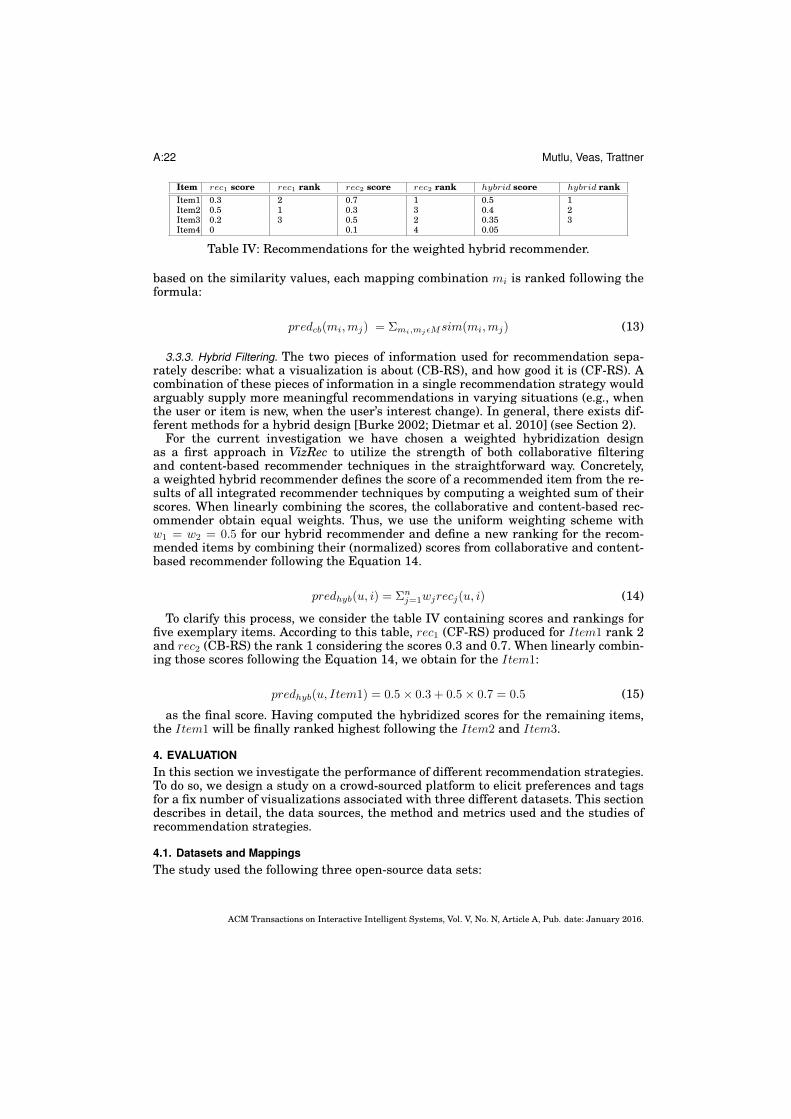
A:22 Mutlu, Veas, Trattner
Item rec1 score rec1 rank rec2 score rec2 rank hybrid score hybrid rankItem1 0.3 2 0.7 1 0.5 1Item2 0.5 1 0.3 3 0.4 2Item3 0.2 3 0.5 2 0.35 3Item4 0 0.1 4 0.05
Table IV: Recommendations for the weighted hybrid recommender.
based on the similarity values, each mapping combination mi is ranked following theformula:
predcb(mi,mj) = ⌃mi,mj✏Msim(mi,mj) (13)
3.3.3. Hybrid Filtering. The two pieces of information used for recommendation sepa-rately describe: what a visualization is about (CB-RS), and how good it is (CF-RS). Acombination of these pieces of information in a single recommendation strategy wouldarguably supply more meaningful recommendations in varying situations (e.g., whenthe user or item is new, when the user’s interest change). In general, there exists dif-ferent methods for a hybrid design [Burke 2002; Dietmar et al. 2010] (see Section 2).
For the current investigation we have chosen a weighted hybridization designas a first approach in VizRec to utilize the strength of both collaborative filteringand content-based recommender techniques in the straightforward way. Concretely,a weighted hybrid recommender defines the score of a recommended item from the re-sults of all integrated recommender techniques by computing a weighted sum of theirscores. When linearly combining the scores, the collaborative and content-based rec-ommender obtain equal weights. Thus, we use the uniform weighting scheme withw1 = w2 = 0.5 for our hybrid recommender and define a new ranking for the recom-mended items by combining their (normalized) scores from collaborative and content-based recommender following the Equation 14.
predhyb(u, i) = ⌃nj=1wjrecj(u, i) (14)
To clarify this process, we consider the table IV containing scores and rankings forfive exemplary items. According to this table, rec1 (CF-RS) produced for Item1 rank 2and rec2 (CB-RS) the rank 1 considering the scores 0.3 and 0.7. When linearly combin-ing those scores following the Equation 14, we obtain for the Item1:
predhyb(u, Item1) = 0.5⇥ 0.3 + 0.5⇥ 0.7 = 0.5 (15)
as the final score. Having computed the hybridized scores for the remaining items,the Item1 will be finally ranked highest following the Item2 and Item3.
4. EVALUATIONIn this section we investigate the performance of different recommendation strategies.To do so, we design a study on a crowd-sourced platform to elicit preferences and tagsfor a fix number of visualizations associated with three different datasets. This sectiondescribes in detail, the data sources, the method and metrics used and the studies ofrecommendation strategies.
4.1. Datasets and MappingsThe study used the following three open-source data sets:
ACM Transactions on Interactive Intelligent Systems, Vol. V, No. N, Article A, Pub. date: January 2016.

VizRec: Recommending Personalized Visualizations A:23
MovieLens8 data set (Movies): This data set comprises information about thetop-ranked movies for the years 1960, 1970, 1980, and 1990. It has 40 entries, whichare selected from items of the respective data set and are characterized by theelements (movie) name, genre, budget, gross, creation year, shooting location (country)and population of the country. Based on this, the mapping unit produced four types ofvisualizations using the method described in Section 3.2 with the following mappingfrequencies: 32 bar charts, 9 line charts, 13 timelines and 1 geo-chart. Hence, a totalof 55 mapping combinations were generated.
EU Open Linked Data Portal9 data set (Eu): The Eu data set collects the per-centage of the population looking for educational information online in the years2009–2011 for 28 EU countries. It has 91 entries characterized by elements (country)name, year, language, population, constitutional form and value (in percent) of thepopulation looking for educational information. The mapping unit suggested 30possible mapping combinations, concretely 15 bar charts, 6 line charts, 8 timeline and1 geo chart.
Book-Crossing data set10 (Books): This data set contained 41 randomly chosenbooks published between 1960 and 2003 and characterized by the elements name,country, publisher, and year. The mapping unit suggested 3 visualization types:bar chart with 2 combinations, geo chart with 1 combination and timeline with 3combinations, the total of 7 mapping combinations.
4.2. ProcedureOur experimental approach was to gather user preferences for visualizations obtainedfrom the rule-based system and to test different recommendation approaches to sug-gest visualizations. A crowd-sourced study was designed to obtain personalized scoresfor each visualization suggested by the visual recommender. Before giving a score, aparticipant had to perform some cognitively demanding task with the visualization(i.e., a minimal analysis). Based on the experiments conducted by Kittur et al. [Kit-tur et al. 2008], this preparatory task should bring participants to accurately studythe chart and prevent a random or rash rating. We designed the task as follows: 1)a participant was given a one line description of a data set originating the visualiza-tion, 2) looking at the visualization she had to write tags (at most five) and 3) rate thevisualization, Fig. 6 shows an example of a HIT. The score system used a multidimen-sional scale adapted from a list of usability factors presented in [Seffah et al. 2006]and [Zheng et al. 2007]. Providing multidimensional rating scale should assist user inconsidering various aspects of a visualization and thus to specify the subjective ratingsfor the considered visualization. The rating scale contained the following factors: (1)cluttered, (2) organized, (3) confusing, (4) easy to understand, (5) boring, (6) exciting,(7) useful, (8) effective and (9) satisfying. Note that dimensions 1–6 are duplicated withopposing sentiment (e.g., cluttered vs. organized). Opposing dimensions were used toensure meaningful ratings for scales with complex meaning. Dimensions were ratedon a 7-point Likert scale (1=not applicable – 7=very applicable).
Since the visualization scores were intended for the offline experiment, each partic-ipant had to rate more than one visualization. We experimented with varying sizes ofHITs (Human Intelligent Task), collecting ten (10) and five (5) tasks. After a pilot studythese turned out to take overly long (around 15mins), sof we settled for three (3) charts
8https://movielens.org/9https://open-data.europa.eu/en/linked-data10http://www2.informatik.uni-freiburg.de/ cziegler/BX/
ACM Transactions on Interactive Intelligent Systems, Vol. V, No. N, Article A, Pub. date: January 2016.

A:24 Mutlu, Veas, Trattner
Fig. 6: Crowd-sourced Experiment Task (HIT). Participants were motivated to care-fully observe the visualization with the study task, in terms of writing tags for thisvisualization. Thereafter, they had to rate it in a multidimensional scale.
per HIT. Suggested combinations were distributed in 32 HITs, each of which contained3 randomly chosen mapping combinations. Pilot studies also helped to streamline da-ta set descriptions, task descriptions and instructions across the study. After acceptinga HIT, the participant (worker or turker) received a tour to complete a task, whichshowed a visualization and corresponding tags and ratings in the exact same formatas the subsequent study. When ready, the worker started the first task in the HIT bypressing a button. Workers were allowed to write not applicable or NA for tags butwere alerted if they failed to write any tags. The rating dimensions were not assigneda score until the worker did it. Workers could only proceed if they had rated all dimen-sions. A HIT with three visualizations/combinations was compensated with $1.00. Aworker rated a minimum of three visualization, but to ensure a more realistic trainingset for the CF-RS, workers were allowed to perform more than one HIT. Only expertworkers who consistently achieved a high degree of accuracy by completing HITs wereallowed to take part in the study.
4.3. Evaluation ProtocolA set of studies was carried out to analyze the variability in preference scores. Tocompute the overall score for a visualization for each worker, the scores in opposingdimensions (clutter, confusing, boring) were inverted and then all dimensions were
ACM Transactions on Interactive Intelligent Systems, Vol. V, No. N, Article A, Pub. date: January 2016.
VizRec: Recommending Personalized Visualizations A:25
averaged together according to the following equation: SC =⇣Pk
i=1 ⇢kDk
⌘/k. Where
k = 9 is the number of dimensions, ⇢k is the coefficient 1 and Dk is k dimension score.The visualization score was obtained by averaging the worker scores.
In the second part of our evaluation, we performed an offline experiment to estimatethe quality of personal preferences for visualization recommendations. To this end, weused the preferences collected from the Amazon study as input data to train our rec-ommender. For the CF-RS, we maintain a list of items (visualizations), each having theinformation about user and provided rating. Similarly, CB-RS uses the tags per item.Finally, for the hybrid approach we combine the results of both recommender tech-niques. Following the method described in [Trattner et al. 2015], we split the prefer-ence model into the two distinct sets, one for training the recommender (training-set),and another one for testing (test-set). The test-set acts here as a reference value that,in an ideal case, has to be fully predicted for the given training-set. From each of thedatasets in the preference model, we randomly selected a certain percent (more detailsare given in Section 5.3) of user-rated or user-tagged mapping combinations (visual-izations) and entered them into the training-set performing 5-fold cross validation.The recommendations produced out of the training-set are further used to evaluatethe performance of VizRec. The performance of VizRec depends generally on how goodit predicts the test-set. We compared the generated recommendations (prediction-set)and the test-set by applying a variety of well-known evaluation metrics in informa-tion retrieval [Herlocker et al. 2004]: Recall (R), Precision (P ), F-Measure (F ), MeanAverage Precision (MAP ) and the Normalized Discounted Cumulative Gain (nDCG).The first three metrics basically express the quantity of relevant recommended results,whereas MAP and nDCG quantify the concrete ordering of the results (i.e., penalizingresults which are not on the top but are relevant for the user). Concretely, the metricsare defined as follows:
Recall (R@k) is calculated as the number of correctly recommended visualizationsdivided by the number of relevant visualizations, where r
ku denotes the top k recom-
mended visualizations and Ru the list of relevant visualizations of a user u in the setof all users U . Recall is given by [Rijsbergen 1974]:
R@k =1
|U |X
u2U
(|rku \Ru|
|Ru|) (16)
Precision (P@k) is calculated as the number of correctly recommended visualizationsdivided by the number of recommended visualizations k. Precision is defined as [Rijs-bergen 1974]:
P@k =1
|U |X
u2U
(|rku \Ru|
k
) (17)
F1-score (F1) combines precision and recall into one score [Rijsbergen 1974]:
F1@k = 2 · P@k ·R@k
P@k +R@k
(18)
Mean average precision (MAP) is an extension of the precision metric that addi-tionally looks at the ranking of recommended visualizations. MAP is described in thesubsequent equation, where Bj is 1 if the recommended visualization at position j is
ACM Transactions on Interactive Intelligent Systems, Vol. V, No. N, Article A, Pub. date: January 2016.

A:26 Mutlu, Veas, Trattner
Movies EU Books#visualizations 55 30 7#users 36 19 15#ratings 4.950 2.700 630#tags 1.835 976 226#unique tags 520 243 118Avg. #tags per visualization 33.36 32.53 32.28Avg. #unique tags per visualization 22.45 20.30 23.85Avg. #tags per user per visualization 3.23 3.24 3.23Avg. #unique tags per user per visualization 2.18 1.74 2.61Avg. #tags per user 50.97 39.04 15.06Avg. #unique tags per user 22.44 17.24 11.13Avg. #users per visualization 10.00 10.00 10.00Avg. #visualisations rated/tagged 15.27 12.00 4.66
Table V: Basic statistics of the the three rating and tag datasets collected via thecrowd-sourced experiment.
among the relevant visualizations and 0 otherwise [Rawashdeh et al. 2013]:
MAP@k =1
|U |X
u2U
1
k
kX
j=1
Bj · P@j (19)
Normalized Discounted Cumulative Gain (nDCG@k) is a ranking-dependent metricthat not only measures how many visualizations can be correctly predicted but alsotakes the position of the visualizations in the recommended list with length k intoaccount. The nDCG metric is based on the Discounted Cummulative Gain (DCG@k)which is given by [Parra and Sahebi 2013]:
DCG@k =
|rku|X
k=1
(2B(k) � 1
log2(1 + k)) (20)
where B(k) is a function that returns 1 if the recommended product at position i in therecommended list is relevant. nDCG@k is calculated as DCG@k divided by the idealDCG value iDCG@k which is the highest possible DCG value that can be achievedif all the relevant visualizations would be recommended in the correct order. Takentogether, it is given by the following equation [Parra and Sahebi 2013]:
nDCG@k =1
|U |X
u2U
(DCG@k
iDCG@k
) (21)
5. RESULTS5.1. ParticipantsEach HIT was completed by ten workers. For 92 visualizations, 8280 ratings across 9dimensions and 3068 tags were collected from 70 participants. Participants completedon average 4.7 HITs. The experiment started on November 26, 2014 and ended onDecember 3, 2014. The allotted working time per HIT was 900 sec and the averageworking time of workers was 570 sec per HIT. Table V summarizes the details aboutthe study. As an example the Figure 7 presents the three (in average) highest ratedvisualizations in each dataset whereby the Figure 8 the three (in average) lowest ratedvisualizations in each dataset. Finally, Table VI lists the top-10 tags in each of the threedatasets.
ACM Transactions on Interactive Intelligent Systems, Vol. V, No. N, Article A, Pub. date: January 2016.

VizRec: Recommending Personalized Visualizations A:27
Rank tag #tags #visuals #usersMovies
1 movies 216 55 202 genre 103 30 153 budget 86 18 174 population 86 18 185 gross 57 18 106 countries 54 18 137 year 46 29 78 country 39 16 99 years 37 24 710 genres 34 24 8
EU1 population 115 25 182 republic 65 15 173 countries 57 20 164 education 46 15 105 constitutional monarchy 44 15 126 year 30 16 117 language 29 8 98 constitutional form 27 11 89 government 24 12 710 monarchy 24 13 8
Books1 books 32 7 92 publishers 14 5 103 publisher 13 4 94 countries 7 3 55 book publishers 6 4 36 count 6 2 47 year 6 4 48 book titles 4 3 49 timeline 4 4 110 book information 4 4 1
Table VI: Top-10 tags in each of the three datasets.
5.2. Visual QualityThe heatmap in Fig. 9 shows the mean rating for every dimension for each visualiza-tion. The results confirm a clear understanding of the opposing dimensions. Negativedimensions in the lower case received opposite scores to corresponding positive ones(UN-co, OR-cl, EX-bo, in Fig. 9 top). The aggregated score for each visualization in thebottom row of the heat map (SC) shows that only a handful of visualizations achievedclearly high scores, whereas for each type there were high scoring visualizations. Moreimportantly, the violin plot at the bottom explains these scores: there is a broad vari-ability in scores for most visualization instances. The violin plot shows the density ofscores; variability is visible in the different shapes as in the spread of the shapes. Thecoefficient of variation computed for each chart confirmed this assumption (M = .36,SD = .12) the minimum variation was .07 and the maximum was .64, see Fig. 10.A Levene test on scores confirmed significant differences in variances accross charts(F = 1.64, p < .001). This supports our assumption that user preferences matter whenchoosing the right representation. The results confirm that only a very small numberof visualizations achieved high scores and the rest were variable.
From the heatmap individual top-scoring visualizations can be identified. To es-tablish differences in the visualization categories and data sets, we performed afactorial ANOVA with the visualization type and data set as factors (visualization-type: bar, line, time, geo and data set: Movies, Books, Eu). Homogeneity of variancewas confirmed by a Levene test. The factorial ANOVA revealed a significant effec-t of data set F (2, 908) = 21.19, p < 0.0001, a significant effect of visualization typeF (3, 908) = 38.98, p < 0.001 and significant interaction effect data set visualization
ACM Transactions on Interactive Intelligent Systems, Vol. V, No. N, Article A, Pub. date: January 2016.

A:28 Mutlu, Veas, Trattner
Movies EU Books
Avg. rating: 5.934Mf. tags: Budget, Genre, Movie, Categories, Film production
Avg. rating: 5.517Mf. tags: Gross income, Movie titles, Box office, Popular movies, Name of movies
Avg. rating: 5.5Mf. tags: Genre, Gross, Profit, Revenues, Popular movies
Avg. rating: 5.709Mf. tags: Language, Monarchy, Republic, Constitutional form, Government
Avg. rating:: 5.157Mf. tags: Government type, Constitutional form vs. Republic form, Decades, Value by year, Education
Avg. rating: 4.325Mf. tags: Countries, Year, Value, Educational assessment, EU
Avg. rating: 4.368Mf. tags: Country of origin , Novel , Release year, Book information, Publication date
Avg. rating:4.224Mf. tags: Books, Years, Titles, Publisher, Literature
Avg. rating:: 3.6Mf. tags: Books, Book publisher, Favorite books, Common publishers, Count
Fig. 7: Three (in average) highest rated visualizations for the datasets Movies, EU andBooks including the five most frequently used tags.
type F (5, 908) = 3.81, p < 0.01. TukeyHSD multiple comparisons revealed a significantdifference in scores between Movies (M = 4.86) and Books (M = 3.82) p < 0.05, aswell as between Movies and Eu data (M = 3.68), p < 0.001. For the visualization type,there was a significant difference in scores between bar (M = 4.60) and geo (M = 3.06)p < 0.001, bar and line (M = 3.29) p < 0.001, bar and time (M = 3.72) p < 0.001, as wellas between time and line, p < 0.02. The significant effects of multiple comparisons forinteraction are shown in Fig. 11.
The main outcomes are the information about user preferences and the clear differ-ences among them. The interaction effects illustrate several differences amongst vi-sualization type. For instance, the majority of the users preferred bar chart, probablysince it is familiar to most people. Another reason may be that it is easier to comparethe values of several numbers at once using bar chart. Yet these results merely in-dicate that there are varied preferences. Looking at each data set, visualization andvisualization type in the heatmap of Fig 9, it is clear that while a small number ofvisualizations are generally preferred, in most cases the ratings vary widely and apersonalized approach would accommodate those user preferences better.
5.3. Recommendation QualityIn this section, we summarize the results of the offline evaluation. As defined in theprotocol, first, we show how VizRec performs with regard to user preferences collectedin Amazon Turk experiment. We analyse here how the recommender performs usingindividual rating dimensions compared to the performance with the aggregated rat-
ACM Transactions on Interactive Intelligent Systems, Vol. V, No. N, Article A, Pub. date: January 2016.

VizRec: Recommending Personalized Visualizations A:29
Movies EU Books
Avg.rating: 2.308Mf. tags: Movies, Profit, Box office, Genre, Gross
Avg.rating: 2.474Mf. tags: Highest budget, Films, Film budgets by decade, Film budgets by genres, Film budgets
Avg.rating: 2.675Mf. tags:: Budget bar chart, Movie budget, Decades, Timeline, Years
Avg.rating: 1.509Mf. tags: Country populations , National populations , Population statistics, Population, Years
Avg.rating: 1.593Mf. tags:: Constitutional monarchy, Republic , Population, Years, EU government
Avg.rating: 1.776Mf. tags:: Population percent, Language, Year, Yearly eduction statistics, EU
Avg.rating: 2.491Mf. tags: Publication country, World, Countries, Map, Nord America
Avg.rating: 2.533Mf. tags: Publishers, Books, Books sales, Publisher groups, Publishers
Avg.rating: 3.416Mf. tags:: Books, Publishers, Year, Books by year, Decades
Fig. 8: Three (in average) lowest rated visualizations for the datasets Movies, EU andBooks including the five most frequently used tags.
ings (overall score). Second, we show what kind of user feedback, rating values orannotations via tags, would be more adequate for recommending visualizations. In ad-dition, we compare the performance of collaborative filtering based recommender andcontent-based recommender techniques with their hybridized version (hybrid recom-mender).
5.3.1. Using Each Rating Dimension Separately. This part of the experiment was intendedto compare VizRec’s recommender performance when using a single rating vs. usinga multidimensional scale. To do so we estimated the quality metric values Recall (R),Precision (P ), F-Measure (F ), Mean Average Precision (MAP ) and the NormalizedDiscounted Cumulative Gain (nDCG), for each of the individual ratings and for theoverall score. Table VII summarizes the results.
The results show that recommendations generated with O.a (overall score) are moreaccurate than those obtained with either of the nine dimensions separately. For in-stance, when comparing by dataset Movies the recommendation accuracy (F@3) fordimension UN with the value for the overall score, the dependent t � test reveal-s that VizRec’s CF performs, on average, significantly better for the overall rating(M = .1137, SE = .0077) than for the dimension UN (M = .0632, SE = .0036),t(35) = 2.5204, p > .01, r = .400. Subsequently, MAP@3 ascertains that when usingthe overall rating (M = .1011, SE = .0063) VizRec can sort individual recommenda-
ACM Transactions on Interactive Intelligent Systems, Vol. V, No. N, Article A, Pub. date: January 2016.
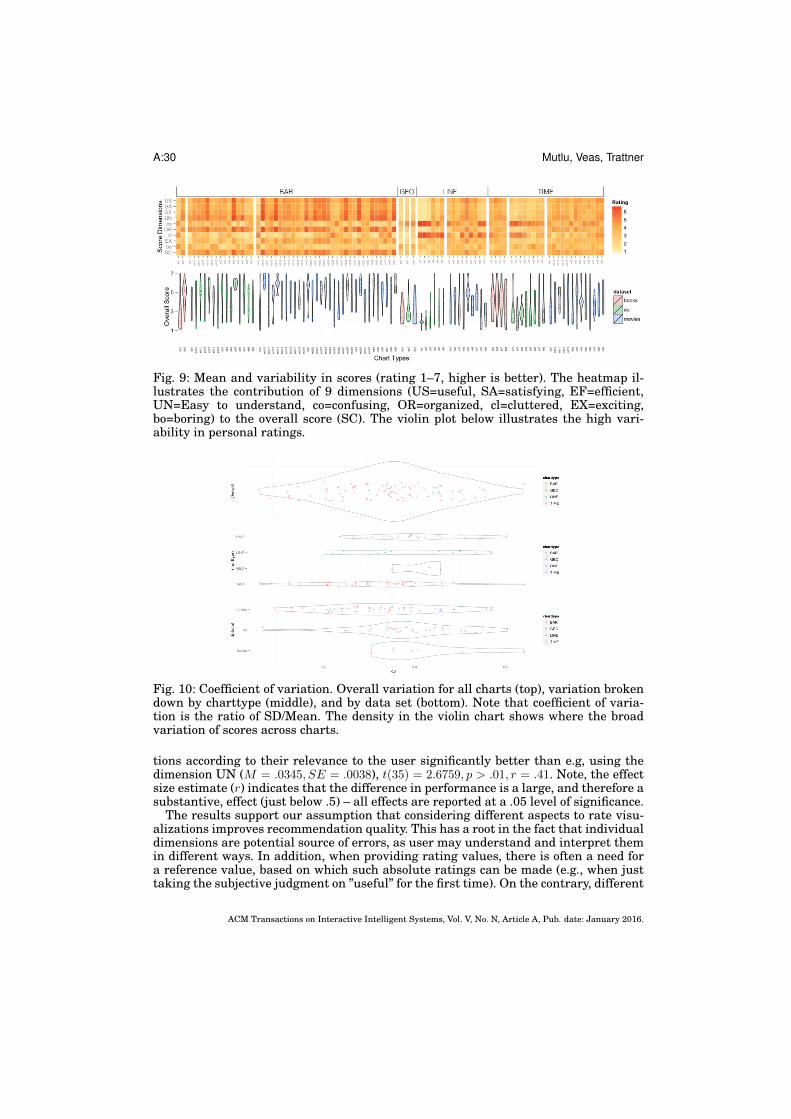
A:30 Mutlu, Veas, Trattner
Fig. 9: Mean and variability in scores (rating 1–7, higher is better). The heatmap il-lustrates the contribution of 9 dimensions (US=useful, SA=satisfying, EF=efficient,UN=Easy to understand, co=confusing, OR=organized, cl=cluttered, EX=exciting,bo=boring) to the overall score (SC). The violin plot below illustrates the high vari-ability in personal ratings.
Fig. 10: Coefficient of variation. Overall variation for all charts (top), variation brokendown by charttype (middle), and by data set (bottom). Note that coefficient of varia-tion is the ratio of SD/Mean. The density in the violin chart shows where the broadvariation of scores across charts.
tions according to their relevance to the user significantly better than e.g, using thedimension UN (M = .0345, SE = .0038), t(35) = 2.6759, p > .01, r = .41. Note, the effectsize estimate (r) indicates that the difference in performance is a large, and therefore asubstantive, effect (just below .5) – all effects are reported at a .05 level of significance.
The results support our assumption that considering different aspects to rate visu-alizations improves recommendation quality. This has a root in the fact that individualdimensions are potential source of errors, as user may understand and interpret themin different ways. In addition, when providing rating values, there is often a need fora reference value, based on which such absolute ratings can be made (e.g., when justtaking the subjective judgment on ”useful” for the first time). On the contrary, different
ACM Transactions on Interactive Intelligent Systems, Vol. V, No. N, Article A, Pub. date: January 2016.
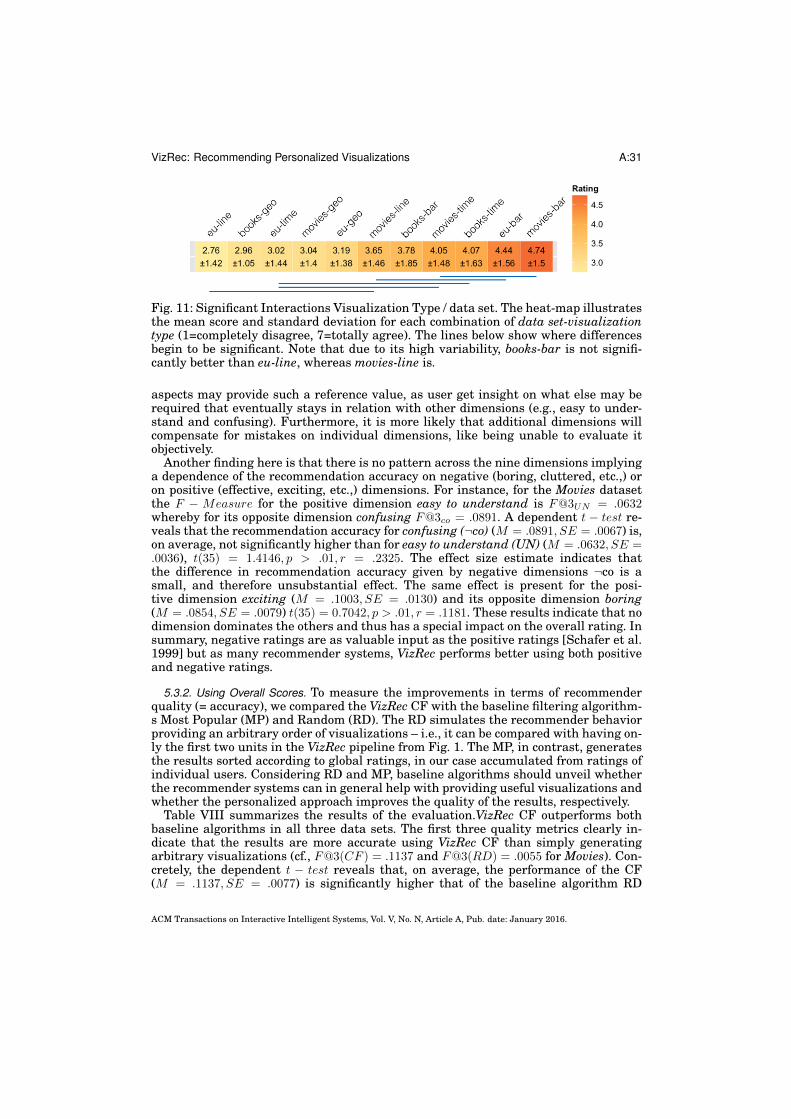
VizRec: Recommending Personalized Visualizations A:31
Fig. 11: Significant Interactions Visualization Type / data set. The heat-map illustratesthe mean score and standard deviation for each combination of data set-visualizationtype (1=completely disagree, 7=totally agree). The lines below show where differencesbegin to be significant. Note that due to its high variability, books-bar is not signifi-cantly better than eu-line, whereas movies-line is.
aspects may provide such a reference value, as user get insight on what else may berequired that eventually stays in relation with other dimensions (e.g., easy to under-stand and confusing). Furthermore, it is more likely that additional dimensions willcompensate for mistakes on individual dimensions, like being unable to evaluate itobjectively.
Another finding here is that there is no pattern across the nine dimensions implyinga dependence of the recommendation accuracy on negative (boring, cluttered, etc.,) oron positive (effective, exciting, etc.,) dimensions. For instance, for the Movies datasetthe F � Measure for the positive dimension easy to understand is F@3UN = .0632whereby for its opposite dimension confusing F@3co = .0891. A dependent t � test re-veals that the recommendation accuracy for confusing (¬co) (M = .0891, SE = .0067) is,on average, not significantly higher than for easy to understand (UN) (M = .0632, SE =.0036), t(35) = 1.4146, p > .01, r = .2325. The effect size estimate indicates thatthe difference in recommendation accuracy given by negative dimensions ¬co is asmall, and therefore unsubstantial effect. The same effect is present for the posi-tive dimension exciting (M = .1003, SE = .0130) and its opposite dimension boring(M = .0854, SE = .0079) t(35) = 0.7042, p > .01, r = .1181. These results indicate that nodimension dominates the others and thus has a special impact on the overall rating. Insummary, negative ratings are as valuable input as the positive ratings [Schafer et al.1999] but as many recommender systems, VizRec performs better using both positiveand negative ratings.
5.3.2. Using Overall Scores. To measure the improvements in terms of recommenderquality (= accuracy), we compared the VizRec CF with the baseline filtering algorithm-s Most Popular (MP) and Random (RD). The RD simulates the recommender behaviorproviding an arbitrary order of visualizations – i.e., it can be compared with having on-ly the first two units in the VizRec pipeline from Fig. 1. The MP, in contrast, generatesthe results sorted according to global ratings, in our case accumulated from ratings ofindividual users. Considering RD and MP, baseline algorithms should unveil whetherthe recommender systems can in general help with providing useful visualizations andwhether the personalized approach improves the quality of the results, respectively.
Table VIII summarizes the results of the evaluation.VizRec CF outperforms bothbaseline algorithms in all three data sets. The first three quality metrics clearly in-dicate that the results are more accurate using VizRec CF than simply generatingarbitrary visualizations (cf., F@3(CF ) = .1137 and F@3(RD) = .0055 for Movies). Con-cretely, the dependent t � test reveals that, on average, the performance of the CF(M = .1137, SE = .0077) is significantly higher that of the baseline algorithm RD
ACM Transactions on Interactive Intelligent Systems, Vol. V, No. N, Article A, Pub. date: January 2016.
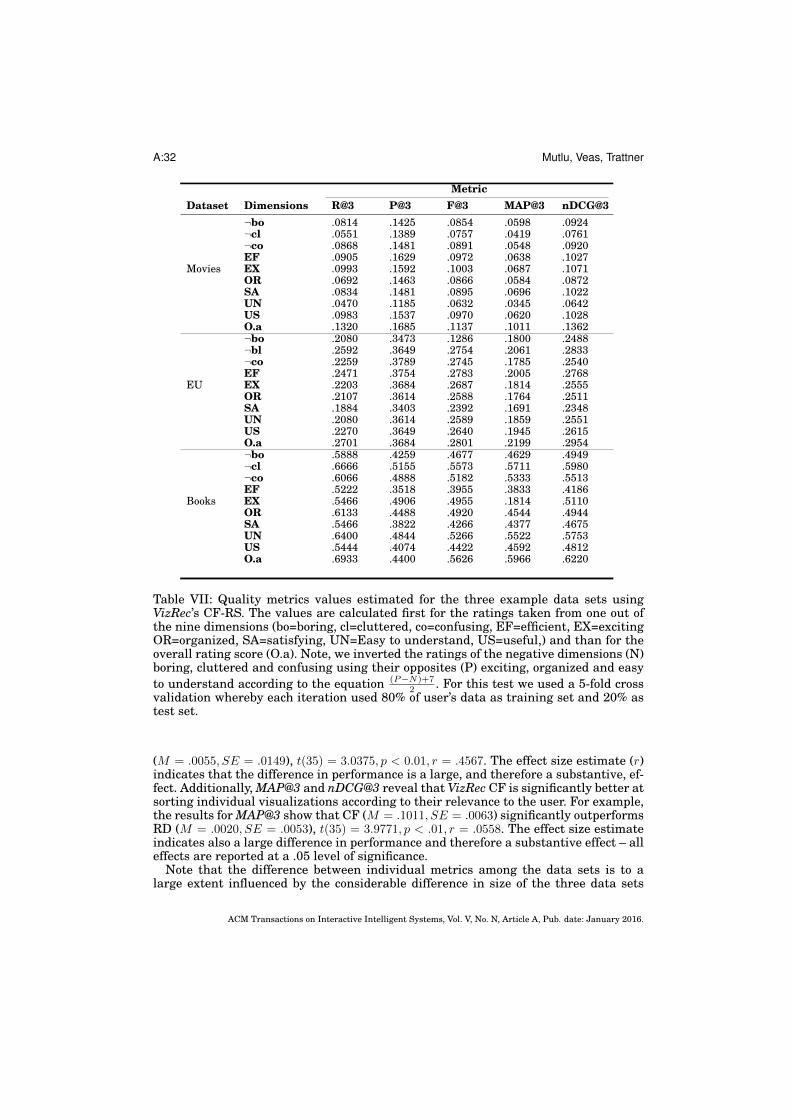
A:32 Mutlu, Veas, Trattner
MetricDataset Dimensions R@3 P@3 F@3 MAP@3 nDCG@3
¬bo .0814 .1425 .0854 .0598 .0924¬cl .0551 .1389 .0757 .0419 .0761¬co .0868 .1481 .0891 .0548 .0920EF .0905 .1629 .0972 .0638 .1027
Movies EX .0993 .1592 .1003 .0687 .1071OR .0692 .1463 .0866 .0584 .0872SA .0834 .1481 .0895 .0696 .1022UN .0470 .1185 .0632 .0345 .0642US .0983 .1537 .0970 .0620 .1028O.a .1320 .1685 .1137 .1011 .1362¬bo .2080 .3473 .1286 .1800 .2488¬bl .2592 .3649 .2754 .2061 .2833¬co .2259 .3789 .2745 .1785 .2540EF .2471 .3754 .2783 .2005 .2768
EU EX .2203 .3684 .2687 .1814 .2555OR .2107 .3614 .2588 .1764 .2511SA .1884 .3403 .2392 .1691 .2348UN .2080 .3614 .2589 .1859 .2551US .2270 .3649 .2640 .1945 .2615O.a .2701 .3684 .2801 .2199 .2954¬bo .5888 .4259 .4677 .4629 .4949¬cl .6666 .5155 .5573 .5711 .5980¬co .6066 .4888 .5182 .5333 .5513EF .5222 .3518 .3955 .3833 .4186
Books EX .5466 .4906 .4955 .1814 .5110OR .6133 .4488 .4920 .4544 .4944SA .5466 .3822 .4266 .4377 .4675UN .6400 .4844 .5266 .5522 .5753US .5444 .4074 .4422 .4592 .4812O.a .6933 .4400 .5626 .5966 .6220
Table VII: Quality metrics values estimated for the three example data sets usingVizRec’s CF-RS. The values are calculated first for the ratings taken from one out ofthe nine dimensions (bo=boring, cl=cluttered, co=confusing, EF=efficient, EX=excitingOR=organized, SA=satisfying, UN=Easy to understand, US=useful,) and than for theoverall rating score (O.a). Note, we inverted the ratings of the negative dimensions (N)boring, cluttered and confusing using their opposites (P) exciting, organized and easyto understand according to the equation (P�N)+7
2 . For this test we used a 5-fold crossvalidation whereby each iteration used 80% of user’s data as training set and 20% astest set.
(M = .0055, SE = .0149), t(35) = 3.0375, p < 0.01, r = .4567. The effect size estimate (r)indicates that the difference in performance is a large, and therefore a substantive, ef-fect. Additionally, MAP@3 and nDCG@3 reveal that VizRec CF is significantly better atsorting individual visualizations according to their relevance to the user. For example,the results for MAP@3 show that CF (M = .1011, SE = .0063) significantly outperformsRD (M = .0020, SE = .0053), t(35) = 3.9771, p < .01, r = .0558. The effect size estimateindicates also a large difference in performance and therefore a substantive effect – alleffects are reported at a .05 level of significance.
Note that the difference between individual metrics among the data sets is to alarge extent influenced by the considerable difference in size of the three data sets
ACM Transactions on Interactive Intelligent Systems, Vol. V, No. N, Article A, Pub. date: January 2016.

VizRec: Recommending Personalized Visualizations A:33
MetricDataset Alg. R@3 P@3 F@3 MAP@3 nDCG@3
CF .1320 .1685 .1137 .1011 .1362Movies MP .0488 .0926 .0591 .0163 .0419
RD .0039 .0093 .0055 .0020 .0048CF .2701 .3684 .2801 .2199 .2954
EU MP .0263 .0175 .0211 .0088 .0161RD .0132 .0175 .0150 .0044 .0103CF .6933 .4400 .5626 .5966 .6220
Books MP .1333 .0444 .0667 .0444 .0667RD .0667 .0222 .0333 .0333 .0420
Table VIII: Quality metrics values R@3, P@3, F@3, MAP@3, nDCG@3 estimated forthe three datasets using the baseline algorithms MP and RD (k = 3). Note, for this testwe executed a 5-fold cross validation whereby each iteration used 80% of user’s dataas training set and 20% as test set.
(e.g., Books has only 7 different visualizations – F@3(CF ) = .5626, whereas Movieshas 55 – F@3(CF ) = .1137, see Fig. 9).
Another interesting finding is that the recommender strategy based on global rat-ings (MP) generated less accurate results than VizRec CF, both with regard to provid-ing relevant visualizations and their ranking order. This supports our main assump-tion that in terms of the wide variability in user preference ratings, the personalizedapproach performs better recommendations.
5.3.3. Collaborative Filtering vs. Content-Based Recommendations. For the sake of compar-ing both VizRec recommenders, we extended the comparison using the same qualitymetrics to rating-based (CF) and tag-based (CB) recommender techniques. The esti-mation was performed in five runs using random splitting of training/test data, asdescribed in the procedure of the experiment. Each iteration uses 80%, 60%, 40% and20% of user’s data as training and the rest as test set. Table IX summarizes the re-sults Figure 12 illustrates them. The first observation reveals that both approachesshow relatively comparable performance in all three datasets, particularly for small-er training data (i.e., cases with 20% and 40% of the users’ data). For the majorityof the quality measures in these two cases the CB outperforms the rating-based (CF)recommender technique, both in providing expected recommendations and in sorting.However, in few exceptional cases, mostly for 40% of the users’ data, CF shows slightlybetter results (cf. Figure 12 (b), (d), (e) and (f)).
The results also reveal that the relative improvement in recommendation perfor-mance depends to some extent on characteristics of the dataset. For example, for Booksthe F-score measure for CB is about 5 times better than CF, while for Movies andEU datasets the relative improvement in performance lies at about 8% and 9% re-spectively. Concretely, when considering the recommendation quality (F@3) for thedataset Movies with 20% of users’ data, the dependent t � test reveals that, CB (M =.0399, SE = .0018) does not perform significantly better that CF (M = .0368, SE =.0069), t(35) = .5879, p > .01, r = .0988. For the dataset EU the test reveals similarresults – CB (M = .1294, SE = .0082) does not perform significantly better that CF(M = .1188, SE = .0061), t(18) = .5800, p > .01, r = .1354. On the other hand for the thedataset Books we can observe that the performance of CB (M = .1622, SE = .0091) issignificantly better than CF (M = .0253, SE = .0125), t(14) = 2.8789, p > .01, r = .5965.The effect size estimate (r) indicates that the difference in performance is a large, andtherefore a substantive, effect.
ACM Transactions on Interactive Intelligent Systems, Vol. V, No. N, Article A, Pub. date: January 2016.

A:34 Mutlu, Veas, Trattner
MetricR@3 P@3 F@3 MAP@3 nDCG@3
Dataset Alg. ts20 ts40 ts20 ts40 ts20 ts40 ts20 ts40 ts20 ts40
CB .0226 .0595 .2111 .1925 .0399 .0693 .0189 .0399 .0514 .0782Movies CF .0207 .0289 .2018 .1944 .0368 .0482 .0175 .0241 .0467 .0571
Hybrid .0434 .1145 .3407 .4370 .0751 .1658 .0434 .1145 .0916 .1873CB .0694 .0694 .4561 .3859 .1294 .1617 .0663 .0983 .1472 .1832
EU CF .0687 .1012 .4491 .4491 .1188 .1584 .0658 .0906 .1382 .1746Hybrid .0821 .2043 .4842 .6842 .1372 .2961 .0714 .2043 .1550 .3113CB .1226 .2371 .2400 .3066 .1622 .2730 .0822 .2093 .1462 .2750
Books CF .0177 .2093 .0533 .3600 .0253 .2633 .0177 .1768 .0252 .2536Hybrid .1408 .2800 .4400 .5733 .2074 .3177 .1408 .2371 .2060 .3154
ts60 ts80 ts60 ts80 ts60 ts80 ts60 ts80 ts60 ts80
CB .0296 .0310 .1018 .0574 .0400 .0367 .0185 .0186 .0418 .0348Movies CF .0401 .1320 .1684 .1685 .0600 .1137 .0305 .1011 .0641 .1362
Hybrid .1495 .3988 .4166 .3962 .1998 .3246 .1495 .3988 .2196 .4640CB .0694 .0778 .2105 .1087 .1104 .0867 .0643 .0583 .1206 .0965
EU CF .1322 .2701 .4245 .3684 .1975 .2801 .1167 .2199 .2016 .2954Hybrid .2903 .5303 .6982 .6561 .3901 .5444 .2903 .5303 .3979 .6073CB .2800 .2800 .2400 .1644 .2568 .2160 .1788 .2144 .2612 .2690
Books CF .4822 .6933 .4488 .4400 .4551 .5626 .4477 .5966 .4623 .6220Hybrid .6088 .8600 .5511 .5155 .5742 .5680 .5811 .8600 .6048 .8615
Table IX: Comparing VizRec Hybrid approach with rating-based and tag-based ap-proaches: quality metric values considering the first three recommendations in the list(k = 3). The results are distributed over four sets, each containing different number ofitems (visualizations) in the training set ts. Note, for this test we used a 5-fold crossvalidation.
Conversely, the last case of the experiment–with the 80% of the users’ data–,the dependent t � test for Movies reveals that the recommendation quality (F@3)with CF (M = .1137, SE = .0077) is, on average, significantly higher than with CB(M = .0367, SE = .0033), t(35) = 3.1604, p < .01, r = .4711. The effect size estimate(r) indicates that the difference in performance is a large, and therefore a substan-tive, effect. For this training-set configuration, the user has more data (i.e., rated ortagged items) and specific preferences are of more importance than in previous cas-es with 20% and 40% of the training data. Since the CF looks at other user to findrecommendations, more specific results could be observed compared to CB.
In a nutshell, an important finding in this study was that both algorithms behave d-ifferently in response to size of user preferences/profiles. With small user profiles/pref-erences, the tag-based recommender performs better recommendation quality than therating-based filtering approach, especially for the larger datasets (e.g., Movies with 55items), where the results remain stable for almost all quality metrics. With smallertraining sets, the tag-based filtering seems to be a method of choice.
5.3.4. Hybrid Recommendations. To evaluate the performance of our hybrid recom-mender, we use the same quality metrics and compare the results with those previ-ously estimated for CF and CB. Again, we run the recommender using a 5-fold crossvalidation. The results are summarized in Table IX and illustrated in Figure 12.
Considering recommendation accuracy for all four training/test sets and all threedatasets, the hybrid recommender outperforms both CF and tag-based CB. For in-stance, for Movies@t80, the dependent t � test between Hybrid and rating-based (CF)recommender reveals, that, on average, the recommendation accuracy for Hybrid(M = .3988, SE = .0202) is significantly higher than for CF (M = .1137, SE = .0077),
ACM Transactions on Interactive Intelligent Systems, Vol. V, No. N, Article A, Pub. date: January 2016.

VizRec: Recommending Personalized Visualizations A:35
(a) Movies R@3 (b) EU R@3 (c) Books R@3
(d) Movies P@3 (e) EU P@3 (f) Books P@3
(g) Movies F@3 (h) EU F@3 (i) Books F@3
(j) Movies MAP@3 (k) EU MAP@3 (l) Books MAP@3
(m) Movies nDCG@3 (n) EU nDCG@3 (o) Books nDCG@3
Fig. 12: Performance plots for rating-based, tag-based, and hybrid approaches consid-ering the first three recommendations in the result list (k = 3).
t(35) = 6.6380, p < .01, r = .7465. The effect size estimate (r) indicates that the dif-ference in performance is a large, and therefore a substantive, effect (r > .5). Fur-thermore, the dependent t � test between Hybrid and tag-based (CB) recommenderfor Movies@t80 delivers similar results. Concretely, the recommendation accuracy forHybrid (M = .3988, SE = .0202) is significantly higher than for CB (M = .0367, SE =
ACM Transactions on Interactive Intelligent Systems, Vol. V, No. N, Article A, Pub. date: January 2016.

A:36 Mutlu, Veas, Trattner
.0033), t(35) = 9.6200, p < .01, r = .8518. The effect size estimate (r) also indicates alarge difference in performance, and therefore a substantive, effect (r > .5).
For the sake of evaluating the performance of Hybrid recommender for more thanone dataset, we consider now the recommendation accuracy for the dataset [email protected] dependent t � test between Hybrid and rating-based (CF) recommender revealsthat, on average, the recommendation accuracy for Hybrid (M = .5444, SE = .0151) issignificantly higher than for CF (M = .2801, SE = .0076), t(18) = 3.1960, p < .01, r =.6016. The effect size estimate (r) for this test indicates that the difference in per-formance is a large, and therefore a substantive, effect (r > .5). Furthermore, thedependent t � test between Hybrid and tag-based (CB) recommender for Movies@t80
delivers similar results. Concretely, the recommendation accuracy for Hybrid (M =.5444, SE = .0151) is significantly higher than for CB (M = .0867, SE = .0141),t(18) = 8.1385, p < .01, r = .8867. Similar to the previous test, the effect size estimate(r) indicates that the difference in performance is a large, and therefore a substantive,effect (r > .5).
Subsequently, MAP@3 and nDCG@3 values @ts80 ascertain that the hybrid recom-mender can sort individual recommendations according to their relevance to the userbetter. Concretely, the dependent t � test for Movies@t80 between Hybrid and CF (onnDCG@3 values) reveals that Hybrid (M = .4640, SE = .0333) recommender performssignificantly better than CF (M = .1362, SE = .0081), t(35) = 7.7978, p < .01, r = .7966.Finally, the effect size estimate (r) indicates that the difference in performance is alarge, and therefore a substantive, effect (r > .5).
An interesting finding here is that the more data exist about the user the better thehybrid recommender performs (cf., Movies@ts80: F@3Hybrid = .3246, nDCG@3Hybrid =.4640, Movies@ts20:F@3Hybrid = .0751, nDCG@3Hybrid = .0916). As already shown inthe previous study this finding does hold for the CB. On the other side, CF recom-mender behaves similar to the hybrid recommender but not in the same volume (cf.,Movies@ts80: F@3Rate = .1137, F@3Hybrid = .3246).
In summary, our studies reveal that combining users’ tags and ratings improves thequality of recommendations significantly. The ratings and tags are user specific, i.e.,ratings present user’s general tastes and tags user’s topic of interest. When combiningboth, a recommender system has more detailed information stored in user preferencesand can respond more accurately. Concretely, the system can consider larger diversityof item types for defining the prediction, which in turn increases the likelihood thatuser will be recommend items which match her preferences the best. When now con-sidering our second evaluation goal – investigate what kind of feedback is more useful,in terms of recommendation quality, we can finally say that ratings and tags togetherhelp to build more accurate recommender system for personalized visualizations.
6. CONCLUSIONSCreating and proposing just the relevant visualizations requires appropriate filteringand recommendation strategies. Our investigations build on the premise that prefer-ence of a visual representation for data is a personal matter. We set out to investigatewhich information lets us anticipate the choice of chart, how to represent such informa-tion and use it for recommendation. Through a crowd-based experiment we collectedempirical evidence supporting the assumption that preferences vary widely for visualrepresentations generated automatically. Beyond visual perception guidelines, thereare other reasons that lead people to choose a particular representation. It may be ha-bituation, as a user may be comfortable with using a particular representation for dataanalysis, though this has to be validated in future studies. Our research tries to unveilwhich aspects have to be present to recommend relevant visualizations. We outlineda rating scale comprising nine dimensions built upon established usability factors. S-
ACM Transactions on Interactive Intelligent Systems, Vol. V, No. N, Article A, Pub. date: January 2016.

VizRec: Recommending Personalized Visualizations A:37
cores for charts obtained in each of these dimensions were used to train a CF-RS andcompared to an aggregated score averaging all nine dimensions. The overall score per-formed better recommendations than just using visualization guidelines and also thanthe top-scoring, confirming our assumptions that personalization is important.
These metrics are only based on assessed quality of a chart. However, the choice ofrepresentation is also tied to the task or question to be answered. To represent theseaspects, we used tags elicited through the crowd based experiment to train a CB-RS.Comparing both CF and CB leads to the conclusion that tags are good descriptorswhen there is little knowledge about user preferences. Yet, as tags contribute a greatdeal of knowledge about the user, we combined both pieces of information in a hybridrecommender approach. The studies revealed that the hybrid approach significantlyoutperformed both CF and CB in most occasions.
A major contribution of our work is that it is based on the empirical evidence col-lected via a methodical study involving the general public. Our approach to generatingand suggesting visualizations, the process of elicitation of users’ preferences and theinsights described in this paper are to the best of our knowledge, novel. The rule-basedrecommender was developed for the web-based tool, VisWizard, to automatically sug-gests appropriate visualizations for Linked open data.11 Furthermore, the Recommen-dation dashboard12, a tool that organizes recommended items and helps their visualanalysis benefits from the mapping algorithm to generate appropriate visualizationsfor the recommendations.
Our research did not concentrate on whether users are willing to provide informa-tion (tags/ratings) for visualizations. This is a valid research question for future work.Relevant works [Viegas et al. 2007; Wright et al. 2006] reveal the benefit of annotatingvisualizations in context of information retrieval. When annotating the user providesher insights and her interpretation on the data being visualized. Hence, they serve asanalysis finding records and personal reminder [Elias and Bezerianos 2012] for lat-er data discovering and analysis tasks. In the current work, we simply used knowninformation such as the user query and the dataset fields as part of the tag vectordescribing the user’s needs and visualization respectively, but clearly better interfacesare needed to make sure that the needed information is there for the recommendationstrategy to work. In the future, we will investigate interfaces to elicit such informationwith minimal effort making it part of the analysis process whenever possible.
ACKNOWLEDGMENTS
This work is funded by the EC 7th Framework project EEXCESS (grant 600601). The Know-Center GmbHis funded within the Austrian COMET Program - managed by the Austrian Research Promotion Agency(FFG). The study was carried out during the tenure of an ERCIM “Alain Bensoussan” fellowship programby the third author. This work is partially funded by CONICET.
REFERENCESJae-wook Ahn and Peter Brusilovsky. 2009. Adaptive Visualization of Search Results: Bringing User Models
to Visual Analytics. Information Visualization 8, 3 (June 2009), 167–179.Jacques Bertin. 1983. Semiology of graphics. University of Wisconsin Press.Toine Bogers and Antal van den Bosch. 2009. Collaborative and Content-based Filtering for Item Recom-
mendation on Social Bookmarking Websites. (2009).Toine Bogers and Antal Van den Bosch. 2009. Collaborative and content-based filtering for item recom-
mendation on social bookmarking websites. In Proceedings of the ACM RecSys ‘09 workshop on Recom-mender Systems and the Social Web, Vol. 9. 9–16.
11http://code.know-center.tugraz.at/search12https://github.com/EEXCESS/hackathon
ACM Transactions on Interactive Intelligent Systems, Vol. V, No. N, Article A, Pub. date: January 2016.

A:38 Mutlu, Veas, Trattner
Michelle A. Borkin, Azalea A. Vo, Zoya Bylinskii, Phillip Isola, Shashank Sunkavalli, Aude Oliva, andHanspeter Pfister. 2013. What Makes a Visualization Memorable? IEEE Transactions on Visualizationand Computer Graphics 19, 12 (2013), 2306–2315. DOI:http://dx.doi.org/10.1109/TVCG.2013.234
Robin Burke. 2002. Hybrid Recommender Systems: Survey and Experiments. User Modeling and User-Adapted Interaction 12, 4 (Nov. 2002), 331–370. DOI:http://dx.doi.org/10.1023/A:1021240730564
Mike Cammarano, Xin (Luna) Dong, Bryan Chan, Jeff Klingner, Justin Talbot, Alon Halevey, and Pat Han-rahan. 2007. Visualization of Heterogeneous Data. In IEEE Information Visualization.
Min Chen and Heike Janicke. 2010. An Information-theoretic Framework for Visualization. Visualizationand Computer Graphics, IEEE Transactions on 16, 6 (Nov 2010), 1206–1215.
Jannach Dietmar, Zanker Markus, Felfernig Alexander, and Friedrich Gerhard. 2010. Recommender System-s. Cambridge University Press. http://dx.doi.org/10.1017/CBO9780511763113 Cambridge Books Online.
Micheline Elias and Anastasia Bezerianos. 2012. Annotating BI Visualization Dashboards: Needs &Challenges. In Proceedings of the SIGCHI Conference on Human Factors in Computing Systems (CHI’12). ACM, New York, NY, USA, 1641–1650. DOI:http://dx.doi.org/10.1145/2207676.2208288
O. Gilson, N. Silva, P.W. Grant, and M. Chen. 2008. From Web Data to Visual-ization via Ontology Mapping. Computer Graphics Forum 27, 3 (2008), 959–966.DOI:http://dx.doi.org/10.1111/j.1467-8659.2008.01230.x
Nathaniel Good, J. Ben Schafer, Joseph A. Konstan, Al Borchers, Badrul Sarwar, Jon Herlocker, and JohnRiedl. 1999. Combining Collaborative Filtering with Personal Agents for Better Recommendations. InProceedings of the Sixteenth National Conference on Artificial Intelligence and the Eleventh InnovativeApplications of Artificial Intelligence Conference Innovative Applications of Artificial Intelligence (AAAI’99/IAAI ’99). American Association for Artificial Intelligence, Menlo Park, CA, USA, 439–446. http://dl.acm.org/citation.cfm?id=315149.315352
Jeffrey Heer and Michael Bostock. 2010. Crowdsourcing Graphical Perception: Using Mechanical Turk toAssess Visualization Design. In ACM Human Factors in Computing Systems (CHI). 203–212. http://vis.stanford.edu/papers/crowdsourcing-graphical-perception
Jonathan L. Herlocker, Joseph A. Konstan, Loren G. Terveen, and John T. Riedl. 2004. Evaluating Collabo-rative Filtering Recommender Systems. ACM Trans. Inf. Syst. 22, 1 (Jan. 2004), 5–53.
WahibaBenAbdessalem Karaa and Nidhal Gribaa. 2013. Information Retrieval with Porter Stemmer:A New Version for English. In Advances in Computational Science, Engineering and Informa-tion Technology, Dhinaharan Nagamalai, Ashok Kumar, and Annamalai Annamalai (Eds.). Ad-vances in Intelligent Systems and Computing, Vol. 225. Springer International Publishing, 243–254.DOI:http://dx.doi.org/10.1007/978-3-319-00951-3 24
Aniket Kittur, Ed H. Chi, and Bongwon Suh. 2008. Crowdsourcing User Studies with Mechanical Turk. InProceedings of the SIGCHI Conference on Human Factors in Computing Systems (CHI ’08). ACM, NewYork, NY, USA, 453–456.
Santiago Larrain, Christoph Trattner, Denis Parra, Eduardo Graells-Garrido, and Kjetil Nørvag. 2015. GoodTimes Bad Times: A Study on Recency Effects in Collaborative Filtering for Social Tagging. In Proceed-ings of the 9th ACM Conference on Recommender Systems (RecSys ’15). ACM, New York, NY, USA,269–272. DOI:http://dx.doi.org/10.1145/2792838.2799682
Sharon Lin, Julie Fortuna, Chinmay Kulkarni, Maureen Stone, and Jeffrey Heer. 2013. SelectingSemantically-Resonant Colors for Data Visualization. Computer Graphics Forum (Proc. EuroVis) (2013).http://vis.stanford.edu/papers/semantically-resonant-colors
Yi-Ling Lin, Christoph Trattner, Peter Brusilovsky, and Daqing He. 2015. The impact of image descriptionson user tagging behavior: A study of the nature and functionality of crowdsourced tags. JASIST 66, 9(2015), 1785–1798. DOI:http://dx.doi.org/10.1002/asi.23292
Pasquale Lops, Marco de Gemmis, and Giovanni Semeraro. 2011. Content-based Recommender Sys-tems: State of the Art and Trends. In Recommender Systems Handbook. Springer US, 73–105.DOI:http://dx.doi.org/10.1007/978-0-387-85820-3 3
Carpendale M. S. T. 2003. Considering Visual Variables as a Basis for Information Visualisation. TechnicalReport. University of Calgary, Calgary, AB. http://pharos.cpsc.ucalgary.ca/Dienst/UI/2.0/Describe/ncstrl.ucalgary\ cs/2001-693-16
Jock Mackinlay. 1986. Automating the design of graphical presentations of relational information. ACMTrans. Graph. 5, 2 (April 1986), 110–141.
Jock Mackinlay, Pat Hanrahan, and Chris Stolte. 2007. Show Me: Automatic Presentation for Visual Anal-ysis. Visualization and Computer Graphics, IEEE Transactions on 13, 6 (Nov 2007), 1137–1144.
Tamara Munzner. 2014. Visualization Analysis and Design. A K Peters. http://www.crcpress.com/product/isbn/9781466508910
ACM Transactions on Interactive Intelligent Systems, Vol. V, No. N, Article A, Pub. date: January 2016.

VizRec: Recommending Personalized Visualizations A:39
Belgin Mutlu, Patrick Hoefler, Gerwald Tschinkel, Eduardo Veas, Vedran Sabol, Florian Stegmaier, andMichael Granitzer. 2014. Suggesting Visualizations for Published Data. In Proc. of the 5th Int. Conf. onInformation Visualization Theory and Applications, IVAPP. SCITEPRESS, 41–47.
Kawa Nazemi, Reimond Retz, Jurgen Bernard, Jorn Kohlhammer, and Dieter Fellner. 2013. Adaptive Se-mantic Visualization for Bibliographic Entries. In Advances in Visual Computing. Lecture Notes inComputer Science, Vol. 8034. Springer Berlin Heidelberg, 13–24.
Thomas Orgel, Martin Hoffernig, Werner Bailer, and Silvia Russegger. 2015. A metadata model and map-ping approach for facilitating access to heterogeneous cultural heritage assets. International Journalon Digital Libraries 15, 2-4 (2015), 189–207. DOI:http://dx.doi.org/10.1007/s00799-015-0138-2
Denis Parra and Shaghayegh Sahebi. 2013. Recommender Systems: Sources of Knowledge and EvaluationMetrics. In Advanced Techniques in Web Intelligence-2, Juan D. Velasquez, Vasile Palade, and Lakh-mi C. Jain (Eds.). Studies in Computational Intelligence, Vol. 452. Springer Berlin Heidelberg, 149–175.DOI:http://dx.doi.org/10.1007/978-3-642-33326-2 7
Erhard Rahm and Philip A. Bernstein. 2001. A Survey of Approaches to Automatic Schema Matching. TheVLDB Journal 10, 4 (Dec. 2001), 334–350. DOI:http://dx.doi.org/10.1007/s007780100057
Majdi Rawashdeh, Heung-Nam Kim, JihadMohamad Alja’am, and Abdulmotaleb El Saddik. 2013. Folkson-omy link prediction based on a tripartite graph for tag recommendation. Journal of Intelligent Informa-tion Systems 40, 2 (2013), 307–325. DOI:http://dx.doi.org/10.1007/s10844-012-0227-2
C.J. Van Rijsbergen. 1974. Foundation of Evaluation. Journal of Documentation 30, 4 (1974), 365–373.DOI:http://dx.doi.org/10.1108/eb026584
Vedran Sabol, Gerwald Tschinkel, Eduardo Veas, Patrick Hoefler, Belgin Mutlu, and Michael Granitzer.2014. Discovery and Visual Analysis of Linked Data for Humans. In The Semantic Web – ISWC2014. Lecture Notes in Computer Science, Vol. 8796. Springer International Publishing, 309–324.DOI:http://dx.doi.org/10.1007/978-3-319-11964-9 20
J. Ben Schafer, Dan Frankowski, Jon Herlocker, and Shilad Sen. 2007. The Adaptive Web. Springer-Verlag,Berlin, Heidelberg, Chapter Collaborative Filtering Recommender Systems, 291–324.
J. Ben Schafer, Joseph Konstan, and John Riedl. 1999. Recommender Systems in e-Commerce. In Proceed-ings of the 1st ACM Conference on Electronic Commerce (EC ’99). ACM, New York, NY, USA, 158–166.DOI:http://dx.doi.org/10.1145/336992.337035
Andrew I. Schein, Alexandrin Popescul, Lyle H. Ungar, and David M. Pennock. 2002. Methods and Metricsfor Cold-start Recommendations. In Proceedings of the 25th Annual International ACM SIGIR Confer-ence on Research and Development in Information Retrieval (SIGIR ’02). ACM, New York, NY, USA,253–260. DOI:http://dx.doi.org/10.1145/564376.564421
Ahmed Seffah, Mohammad Donyaee, Rex B. Kline, and Harkirat K. Padda. 2006. Usability Measurementand Metrics: A Consolidated Model. Software Quality Control 14, 2 (June 2006), 159–178.
Chris Stolte and Pat Hanrahan. 2002. Polaris: A System for Query, Analysis and Visualization of Multi-dimensional Relational Databases. IEEE Transactions on Visualization and Computer Graphics 8(2002), 52–65.
Card Stuart and Mackinlay Jock. 1997. The Structure of the Information Visualization Design Space. InProceedings of the 1997 IEEE Symposium on Information Visualization (InfoVis ’97) (INFOVIS ’97).IEEE Computer Society, Washington, DC, USA, 92–. http://dl.acm.org/citation.cfm?id=857188.857632
Xiaoyuan Su and Taghi M. Khoshgoftaar. 2009. A Survey of Collaborative Filtering Techniques. Adv. inArtif. Intell. 2009, Article 4 (jan 2009), 1 pages.
Christoph Trattner, Dominik Kowald, and Emanuel Lacic. 2015. TagRec: Towards a Toolkit for ReproducibleEvaluation and Development of Tag-based Recommender Algorithms. SIGWEB Newsl. Winter, Article3 (Feb. 2015), 10 pages.
Manasi Vartak, Samuel Madden, Aditya Parameswaran, and Neoklis Polyzotis. 2014. SeeDB: AutomaticallyGenerating Query Visualizations. Proc. VLDB Endow. 7, 13 (Aug. 2014), 1581–1584.
Fernanda B. Viegas, Martin Wattenberg, Frank van Ham, Jesse Kriss, and Matt McKeon. 2007. ManyEyes:A Site for Visualization at Internet Scale. IEEE Transactions on Visualization and Computer Graphics13, 6 (Nov. 2007), 1121–1128. DOI:http://dx.doi.org/10.1109/TVCG.2007.70577
Martin Voigt, Martin Franke, and Klaus Meißner. 2013a. Capturing and Reusing Empirical VisualizationKnowledge. In 1st International Workshop on User-Adaptive Visualization.
Martin Voigt, Martin Franke, and Klaus Meissner. 2013b. Using Expert and Empirical Knowledge forContext-aware Recommendation of Visualization Components. IARIA Int. Jour. on Advances in LifeSciences 5, 1 (2013), 27–41.
Jorg von Engelhardt. 2002. The Language of Graphics: A Framework for the Analysis of Syntax and Meaningin Maps, Charts and Diagrams. Yuri Engelhardt.
ACM Transactions on Interactive Intelligent Systems, Vol. V, No. N, Article A, Pub. date: January 2016.

A:40 Mutlu, Veas, Trattner
Colin Ware. 2012. Information Visualization: Perception for Design (3rd ed.). Morgan Kaufmann Publishers.Hadley Wickham. 2009. ggplot2: elegant graphics for data analysis. Springer New York. http://had.co.nz/
ggplot2/bookKanit Wongsuphasawat, Dominik Moritz, Anushka Anand, Jock Mackinlay, Bill Howe, and Jeffrey Heer.
2015. Voyager: Exploratory Analysis via Faceted Browsing of Visualization Recommendations. IEEETrans. Visualization & Comp. Graphics (Proc. InfoVis) (2015). http://idl.cs.washington.edu/papers/voyager
William Wright, David Schroh, Pascale Proulx, Alex Skaburskis, and Brian Cort. 2006. TheSandbox for Analysis: Concepts and Methods. In Proceedings of the SIGCHI Conference onHuman Factors in Computing Systems (CHI ’06). ACM, New York, NY, USA, 801–810.DOI:http://dx.doi.org/10.1145/1124772.1124890
Xianjun Sam Zheng, James j W. Lin, Salome Zapf, and Claus Knapheide. 2007. Visualizing User ExperienceThrough ”Perceptual Maps”: Concurrent Assessment of Perceived Usability and Subjective Appearancein Car Infotainment Systems. In Proceedings of the 1st International Conference on Digital HumanModeling (ICDHM’07). Springer-Verlag, Berlin, Heidelberg, 536–545.
ACM Transactions on Interactive Intelligent Systems, Vol. V, No. N, Article A, Pub. date: January 2016.