BlueFinder: recommending wikipedia links using DBpedia properties
Upload
khangminh22Category
view
1download
0
Information Sciences 239 (2013) 18–30
Contents lists available at SciVer se ScienceD irect
Infor mation Sciences
journal homepage: www.elsevier .com/locate / ins
Recommending social network applications via social filteringmechanisms
0020-0255/$ - see front matter � 2013 Elsevier Inc. All rights reserved.http://dx.doi.org/10.1016/j.ins.2013.03.041
⇑ Corresponding author.E-mail addresses: [email protected] (Y.-M. Li), [email protected] (H.-W. Hsiao), [email protected] (Y.-L. Lee).
Yung-Ming Li ⇑, Han-Wen Hsiao, Yi-Lin Lee Institute of Information Management, National Chiao Tung University, Hsinchu 300, Taiwan
a r t i c l e i n f o
Article history:Received 2 April 2011 Received in revised form 23 February 2012 Accepted 20 March 2013 Available online 27 March 2013
Keywords:Social network Social application Recommendation system Artificial neural network Analytic hierarchy process
a b s t r a c t
Social applications have been growing in popularity in recent years. In order to recommend suitable and attractive social applications, an efficient recommendation system, consider- ing the popularity and reputation of an application as well as the preferences and social relation ships of a user, is proposed. By using Facebook as a test platform, the experiment shows that our model outperforms other methodologies and indicates that social relation- ships play a more important role than the preferences of a user and the popularity of anapplication.
� 2013 Elsevier Inc. All rights reserved.
1. Introduction
In a survey in 2011, Alexa.com uncovere d that 4 out of the 10 most popular websites are social networking sites (SNS) [6].These sites have been emerging as an important medium for creating and maintaining social connections or sharing infor- mation and knowledge among individuals [29]. In the beginning, these sites were built to help people establish an online presence. However, over time it has shifted to exploit the user base for commercial purposes [5]. Diverse social networking services have attracted attention in recent years, and one of the most representative services is social applicati ons.
Social applications are different from conventi onal software applications because they take relationshi p among users into account to support social activities [4]. Gartner Group defines social applications as ‘‘Social applications encourage, capture and share data among users, ceding levels of control to a communi ty by user-controlled organization mechanisms . These applications share characteristics, such as open application programmin g interfaces, service-o riented design, and the ability to upload data and media’’ [55]. As of 2011, entrepreneur s and developers from more than 190 countries have built a number of applications with Facebook platform [16], and people on Facebook install 20 million applications every day [16]. This extensive use ofsocial applications indicates a large business opportun ity.
The problem with the business model of social application is twofold: on the one hand, users find it difficult to choose (efficiently and appropriately) interesting applications available to them; on the other hand, social application developers find it difficult to locate potential users. Consequentl y it is important to deal with the social application visibility issue byproposing a sophistic ated recommend ation service based on users’ social relationship s and application usage. It is expected that with the help of a recommend ation service, users might reduce search costs and increase application usage.
Since one of the purposes of social applications is to interact with people, a desired recommendati on mechanism should be different from recommend ing books, movies or any other digital goods. However, relatively little research has been done

Y.-M. Li et al. / Information Sciences 239 (2013) 18–30 19
to develop such a mechanism . Hence, in our research we designed a recommendati on mechanism for social applications based on users’ objective and subject views. A statistical survey was utilized to extract the weight of social applications’ pop- ularity and reputatio n, and users’ preference was calculated based on personal profiles. To examine the social attraction power contributed by the users’ friends, an evaluation of users’ social relations, such as social similarity and interaction fre- quency, was also necessary. To model the decision making of choosing social applications, these factors were aggregat ed to- gether, with the weights calculated from the artificial neural network (ANN). By comparing our mechanism with the analytic hierarchy process (AHP) and linear regression, our system outperformed the other methods .
The rest of the paper is organized as follows. Section 2 presents related works. Section 3 demonstrat es the system frame- work of social application recomme ndations. Section 4 describes the experiments , along with the data collection and data analysis, followed by the experime ntal results and evaluation in Section 5. Finally, the conclusions and proposals for future work are discussed in Section 6.
2. Related literature
2.1. Online social networks
A social network models a group of individuals and their relationshi ps and the graph theory has been widely used in anal- ysis of social networks [43]. With the rapid growth of online social network sites, researchers have analyzed the character- istics of online communitie s and their structures. Distinctiv e features of a social network, such as linkage, taste, and subgroup differences are studied in [32,39], which reveal the reality of user behavior and network features. Furthermore,topology analyses of online social structures are also studied [17,22], and the popularity of user-gen erated content is de- scribed [11]. In addition to empirical studies, simulation issues including methods for networking sampling and the effects of missing data in a social network are also discussed [28,30]. Still, privacy concerns about sharing informat ion on social net- works have raised scholars’ interests [2,15]. Social networks can be analyzed by various techniques that compute metrics such as centrality, position and density, and the discovery of rules can also be used [53]. Compare d to previous research,studies on social applications are relatively rare. Recently, published studies focus on summarizing the characteristics ofthe Facebook applications at a higher level [18], as well as analyzing the statistical data of the growth patterns [3] or the activities of applications [42]. However, among those works, little research systematical ly deals with the social application recommend ation problem.
2.2. Recommend ation mechanisms
The issues of recommendati on have aroused much academic interest for decades. The purpose of recommendati on is todeal with informat ion overload by presenting suitable items to targeted users based on collected or inference informat ion [35]. Recommendati on mechanism s are usually categorized into three types [7]: (1) content-bas ed mechanis ms that suggest items based on the similarity to the users’ previous preference profiles, (2) collaborativ e-based mechanis ms that recommend items based on the general tastes of similar users’ profiles, and (3) hybrid mechanisms that combine both content and col- laborative approaches. Content-based recomme ndation uses historical preferenc e data, while collaborative filtering uses information on the general tastes of similar users. Content-bas ed methods recommend items because they are similar toitems a user liked in the past. That is, it computes the similarity of the items. Collaborativ e filtering, on the other hand, rec- ommends items other similar users like. Rather than compute the similarity of the items, this method computes the simi- larity of the users. Although improvements such as better rating or similarity calculating techniques in collabora tive filtering can be made to meet new requirements [25,31], these recomme ndation mechanisms still have limitation to be ap- plied in social recommend ation since social relation is omitted.
To design a recommendati on mechanism for an online social networking environment, we have to learn from classical methods and take social relationship s into consideration. The aspect of social relationships, including trust, intimacy, and social similarity, has been implemented in a number of academic research studies, such as blog recommend ation [34]and social media recomme ndation [41]. With the supported information of social relations, we can design a better mecha- nism that integrates the advantages of these three dimensions . Two types of collaborative filtering approach have been widely studied: memory-based and model-bas ed. The memory-based approach is the most popular prediction method and is widely adopted in commercial collaborativ e filtering systems [36]. The most analyzed examples of memory-based col- laborative filtering include user-based [57] and item-based [14]. User-based approaches predict ratings based on similar users’ rating results; whereas item-based approaches predict ratings based on the computed information of items similar to those chosen by the active user. User-based and item-based approaches use the Pearson correlation coefficient (PCC)[48] and vector space Similarity (VSS) [9] as the similarity computati on methods . Examples of model-based approach include the clustering model [57], aspect model [10], and the latent factor model [21].
Trust forms the basis of social interaction in any society, including virtual ones [1]. Trust and similarity may be treated independen tly in recommendati on systems [38], but O’Donovan and Smyth suggested that the simplest way to incorporate trust into the recommendati on process is to combine trust and similarity to produce a compound weighting [44]. Since apositive relationship between trust and similarity has been shown [59], and trust is the basis of social interaction, it would
20 Y.-M. Li et al. / Information Sciences 239 (2013) 18–30
be reasonabl e to measure the value of trust by using similarity and interactio n. Inspired by trust value computation in [19],our work followed a similar formulation and proposed a new metric to replace the trust value.
2.3. Social recommendatio n systems
Conventional recommendati on systems assume that users are independen t; under the circumstanc es, their social connec- tions are ignored. Without relying on social relation, they accept informat ion describing the nature of an item, and learn topredict which items the users may be interested in based on a sample of users’ preferences [45]. Social recommendati on is aninformation filtering technique that attempts to suggest useful information other users like (e.g. blogs, news, music, travel plans, web pages, images, tags, etc.) [26]. This technique involves the investigatio n of collective intelligence by analyzing so- cial behavior. In some social recommend ation systems, the users provide ratings of artifacts or items and the systems make informed guesses about what other items the users may like based on the ratings that other users have provided [20,33].Besides, some recommend ation systems use social media as an operating platform, but the users are connected based oncommon interests rather than social relation [50]. Even though similarity is included in some systems, but recommend ation is made based on linguistic [46,47] or user profile similarity [40] rather than social relation. Although a hybrid mechanism can extend the applications of traditional recomme ndation methods [47], social relation is still missing.
Friends are seen as more qualified to make better and useful recommend ations compare d to traditional recommend ation systems [8]. Various measures have been designed for measuring the importance of users and identifyin g the influencerswithin a network [27]. Sinha et al. [52] have shown that given a choice between recomme ndations from friends and systems,friends’ recommendati ons are preferred . From this point of view, traditional recommendati on systems, which ignore the so- cial network structure of users, may no longer be suitable.
By analyzing the ‘‘who talks to whom’’ social network on the MSN instant messenger, Singla and Richards on [51] revealedthat people who chat with each other are more likely to share interests. Therefore, to improve the recommendati on accuracy,both the social network structure and user-item rating should be taken into consideration. To overcome the weaknesses mentioned, we proposed an approach to make more accurate recommend ations. While various types of recomme ndation system have been developed for different products/ser vices, relatively little work focuses on analyzing the characteristics of social network related services and on examining the impact of social relations and interactio ns during the filtering pro- cess. In this paper, combining both the analysis of objective factors–the applications ’ popularity and reputation–and the sub- jective factors–the users’ preference, social similarity, and interaction–we develop a recomme ndation mechanism for social applications .
3. The system framework
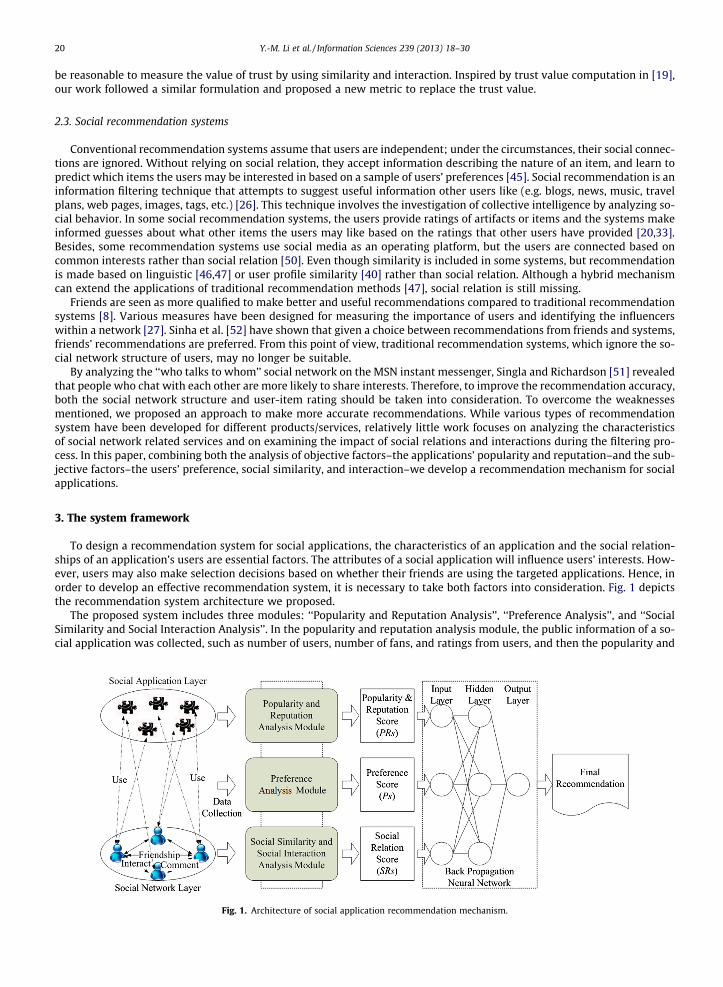
To design a recommend ation system for social applications, the characterist ics of an application and the social relation- ships of an application’s users are essential factors. The attributes of a social applicati on will influence users’ interests. How- ever, users may also make selection decisions based on whether their friends are using the targeted applicati ons. Hence, inorder to develop an effective recommendati on system, it is necessary to take both factors into considerati on. Fig. 1 depictsthe recommend ation system architectur e we proposed.
The proposed system includes three modules: ‘‘Popularity and Reputation Analysis’’, ‘‘Preference Analysis’’, and ‘‘Social Similarity and Social Interaction Analysis’’. In the popularity and reputatio n analysis module, the public information of a so- cial applicati on was collected, such as number of users, number of fans, and ratings from users, and then the popularity and
Fig. 1. Architecture of social application recommendation mechanism.

Y.-M. Li et al. / Information Sciences 239 (2013) 18–30 21
reputation score was calculated. In the preference analysis module, the user profile data related to our research was collected to discover individual interests. The social similarity and social interaction analysis module was developed to evaluate the social attraction degree based on social relationships, comments and interactions among friends. In order to combine the scores generate d by these three modules, an artificial intelligence method was utilized. The computing processes in these modules are detailed in the following sections.
3.1. Popularity and reputation analysis
It is reasonable to presume that the higher the popularit y and reputation of a social application, the more valuable and attractive a social application may be. Commonly available popularit y and reputation informat ion includes number of users,number of fans, number of friends using the application, and feedback (such as reviews, discussion threads, and ratings). This type of informat ion is useful when choosing between applicati ons, however , in order to reduce computati onal complexity,we reduce the analysis factors to include only three representat ive attributes: ‘‘Number ‘of Users’’, ‘‘Number of Fans’’, and ‘‘Rating’’.
‘‘Fan’’ expresse s a feeling of admirati on or fondness for somethin g. When users make themselves a fan of a social appli- cation, they are more likely to use it. It is intuitive to regard the ‘‘Number of Users’’ as a factor for evaluating popularity, and ‘‘Rating’’ for estimating reputatio n. In this research, popularit y and reputation are merged together. The attributes that con- tribute to the popularity and reputatio n measure are illustrated in Fig. 2.
Although we can obtain the statistical data of a social applicati on from the websites , it is still unknown whether they are meaningful to users during the application selection process. The relative importance levels of popularity and reputation are subjective. For example, some people might feel the popularity of an applicati on is more important, as they might want toexpand their social boundaries by meeting new people, while others might focus more on the reputation of an application asit might reflect the user’s experience of social applications. Therefore, considering the relative importance levels of all factors,in our research, the popularity and reputation score (PRs) is calculated as:
PRsðakÞ ¼X3
j¼1
akjwj; ð1Þ
where aij is the values of ‘‘Number of Users’’ (j = 1), ‘‘Number of Fans’’ (j = 2), and ‘‘Rating’’ (j = 3) of application i, and wj is the weight of factor j. Notice that PRs quantifies the public characterist ics of an application ak and the score is identical for all users.
3.2. Users’ preference analysis
By analyzing the users’ historical social application usage records, we can better understand their preferenc es and recom- mend appropriate social applicati ons that may be interesting to them. Suppose an application belongs to a specific category,the user preference for each category could be inferred as follows. To understand the preference weight for a user ui on acategory, the application usage history should be collected . Denote C = {c1,. . .,cm} as a set of predefined categories and FSum(ui,cj), is a summation of user ui’s usage frequency of social applications belonging to category cj, and U(cj) stands for a set ofapplications belonging to category cj. The formula is defined as:
FSumðui; cjÞ ¼X
ak2UðcjÞFQðui; akÞ; ð2Þ
where FQ(ui, ak) is ui’s usage frequency of an application ak. The preference weight (PW) of category cj for user ui is formulated as:
PWðui; cjÞ ¼FSumðui; cjÞPmr¼1FSumðui; crÞ
: ð3Þ
The preferenc e weight of the correspondi ng category stands for the attractive strength. Thus the preference score (Ps) with respect to user ui is formulated as:
Fig. 2. Three attributes of popularity and reputation of a social application.

22 Y.-M. Li et al. / Information Sciences 239 (2013) 18–30
Psðui; akÞ ¼ PWðui;U�1ðakÞÞ; ð4Þ
where U�1(ak) stands for the category that applicati on ak belongs to.
3.3. Social similarity and social interaction analysis
In this research, social similarity and social interaction are two essential factors utilized to analyze human behavior.People who use the same social applications are more likely to have similar preferences, thus these social applications used by friends can be regarded as recommend ation candidates. Compared with social similarity, social interaction is a more dynamic relationship that contains all kinds of people’s activities [13], and these activities can be analyzed to discover social closeness information .
Social similarity and social interaction are retrieved to calculate an overall social relation score (SRs). To calculate the SRs,we first define two terms (Definitions 1 and 2) concerning the structura l pattern of the social network and social applicati on.
Definition 1. (Social network layer ). Social network layer, SNL is defined as:
SNL ¼ hU;NU�U ; Pi; ð5Þ
where U = {u1, . . ., um} is a set of users on the social network, and NU�U # U � U is a set of friendship links between users.P ¼ Pu1 [ � � � [ Pum , where Pui
is a set of correspondi ng pages on the social network website displaying posts, comments,and all kinds of interactions related to user ui 2 U.
Definition 2. (Social application layer ). A social application layer SAL is defined as:
SAL ¼ hA; NU�Ai; ð6Þ
where A = {a1,. . .,an} is a set of applications available on a social network and elements in NU�A # U � A are links representing the usage relationships between users and applications .
The Social Relation (SR) between a user ui and his/her friend, fj is composed of their Social Similarity (SS) and Social Interaction (SI):
SRðui; fjÞ ¼ SSðui; fjÞ þ SIðui; fjÞ: ð7Þ
Given a user, ui and one of his/her friends, fj, the Social Similarity (SS) between them is defined as:
SSðui; fjÞ ¼ SimTðui; fjÞ þ SimFCðui; fjÞ; ð8Þ
where SimT(ui, fj) represents the similarity level of their social application tastes and SimFC(ui, fj) indicates their similarity level evaluated based on their friends in common. The similarity of taste SimT(ui, fj) is formulated as:
SimTðui; fjÞ ¼jAðuiÞ \ AðfjÞj
MaxðjAðuiÞj; jAðfjÞjÞ; ð9Þ
where AðuiÞ ¼ fakjhui; aki 2 Nui�AðuiÞg is the set of applications used by user ui and AðfjÞ ¼ fakjhfj; aki 2 Nuj�AðujÞg is the set ofapplications used by user fj. The similarity of a friend SimFC(ui, fj) is evaluated as:
SimFCðui; fjÞ ¼jFðuiÞ \ FðfjÞj
MaxðjFðuiÞj; jFðfjÞjÞ; ð10Þ
where F(ui) = {fkjhui, fki 2 NU�U} and F(fi) = {fkjhfi, fki 2 NU�U} denote a set of ui’s and fj’s friends, respectively .The Social Interaction (SI) between users ui and fj is denoted as:
SIðui; fjÞ ¼jCommentðui; fjÞj þ jInteractionðui; fjÞj
Maxfk2FðuiÞðjCommentðui; fkÞj þ jInteractionðui; fkÞjÞ; ð11Þ
where Commentðui; fjÞ# Puiis a set of posted comments between users ui and fj, and Interactionðui; fjÞ# Pui
represents a set ofinteractions between users ui and fj. The denomin ator is the maximum value among all the total numbers of comments and interactions associated with the friends of ui. It is notable that interactio ns used in our research contain all the activities supported by any application on the social network, such as giving, taking, sending, and receiving activities.
After social relations (SR) are estimated, we can utilize them to calculate the social relation score (SRs) of applications torecommend applications with a high social attraction. The social relation score of user ui is defined as:
SRsðui; akÞ ¼X
fj2FUAðakÞSRðui; fjÞ; ð12Þ
where FUA(ak) = {fjjak 2 A(fj)} is the set of ui’s friends using application ak. Notice that all of the values should be normalized before being computed in the formulation .

Y.-M. Li et al. / Information Sciences 239 (2013) 18–30 23
3.4. Neural network-based recommendatio n mechanism
The recommend ation score of a social application ak for user ui is defined RAs(ui, ak) and formulated as:
RAsðui; akÞ ¼ aPRNs ðakÞ þ bPN
s ðui; akÞ þ cSRNs ðui; akÞ; ð13Þ
where PRNs ðakÞ; PN
s ðui; akÞ; and SRNs ðui; akÞ are the results of PRs(ak), Ps(ui, ak) and SRs (ui, ak) after normalizing to be in interval
(0, 1), and a, b, c are the correspondi ng weights. In the real world, it is not easy to know what these weights really are. So inthe proposed mechanism , we predict these weights based on historical data so that we can proceed to the recommendati onprocess of social applications.
The back-propagat ion neural network (BPNN) is one of the most frequent ly used techniques for predictio n [56]. It has the capability of accommodating complex data and learning implicit relations. Research ers have shown that BPNN is a good tool for prediction in many domains [54]. Considering the complexity of human decision-making processes when choosing social applications , we used this method in this paper to deal with the weighting problem. The implementation procedures ofBPNN are detailed in the following section.
4. Experiments
To empirica lly examine the effectiven ess of our mechanism , we selected Facebook as the experime nt platform, which isthe second most popular site social networking as of September 2011 [6], with over 750 million active users and more than 80,000 available applications [16]. In total, 445 users, aged between 23 and 32, were invited to participate in our experiment,and the qualifying users were selected as participants. Besides, the social applicati ons which had been installed by the par- ticipants were used as our recommend ation candidat es; the recomme ndation lists generated by our system were based onthem.
The experiment was divided into three stages. In stage 1, the popularity and reputation score (PRs), preference score (Ps)and social relation score (SRs) were calculated . They were then used as training and test data for our BPNN in stage 2. In stage 3, the trained neural network was used to generate recommendati on lists and the application recomme ndation results were delivered to participa nts for evaluation. The experimental processes are described below.
4.1. Profile of participants and social application s
The qualified participants were filtered by the number of friends and social applications used. Only active users with more than 50 friends and 30 social applications installed were included in our experiment. Moreover, users who had not used any social applications within the past three months were also excluded. After the filtering process a total of 121 users were se- lected as participants. Table 1 shows the profile options related to our research.
In our experiment, the 121 participants were divided into two groups: a model building group with 35 participa nts and amodel evaluation group with 86 participa nts. The model building group was used to provide the data required for building our model, and the model evaluation group received the recommendati on lists generated by our system and evaluated them.
In our research, these factors were considered in the social similarity and social interactio n analysis module. However,before proceeding to the next step, we had to make sure that these factors were correlate d to each other. The correlation between two variables reflects the degree to which the variables are related. The most common measure of correlation isthe Pearson’s correlation coefficient, so this was used to test whether these factors were correlate d. Table 2 outlines the re- sults of the Pearson’s correlation analysis between the variables. A positive value for the correlation implies a positive asso- ciation. As we can see, three variables are positively correlate d to each other. This implies that the more friends a user has,the higher the possibility that the user will be influenced by friends. Conseque ntly, a user may use a specific social applica- tion which has been installed by friends with higher interaction. Therefore, to recommend social applications to potential users, it would be necessary to consider their social relationships.
According to the application usage data collected from participants , they were categorized into eight types, and Fig. 3 dis-plays the percentage of each category. This informat ion potentially revealed a market tendency and the users’ requirements for applicati ons. This is evidenced by comparing it with the average distribution of preferenc es calculated based on the his- torical usage data of our participants. As shown in Fig. 4, users’ preference weights of particular categories reflect the per- centages shown in Fig. 3.
Table 1Average numbers of users’ data attributes.
No. of social applications
No. offriends
No. of comment and interaction
33.49 55.02 90.04

Table 2Correlation of variables in user profiles.
No. social applications No. friends No. comts and interactions
Pearson correlation No. social applications 1 0.641 ⁄⁄ 0.490⁄⁄
No. friends 0.641 ⁄⁄ 1 0.764 ⁄⁄
No. comts and interactions 0.490 ⁄⁄ 0.764⁄⁄ 1
⁄⁄ Correlation is significant at the 0.01 level (2-tailed).
Fig. 3. Types and distribution of Facebook category.
Fig. 4. Users’ average preference of application categories.
24 Y.-M. Li et al. / Information Sciences 239 (2013) 18–30
4.2. Recommend ation strategies
In this research, we used different recommendati on strategies to evaluate the performanc e of our designed framework.We compared our framework with neural networks (Strategy 1), multi-criter ia decision making (Strategy 2), and linear mod- el methods (Strategies 3–7). All the data required by these strategies were gathered from the model building group and eval- uated by the model evaluation group. The following are the strategies we used:

Y.-M. Li et al. / Information Sciences 239 (2013) 18–30 25
Strategy 1. All (SRs + Ps + PRs) + BPNN: This method utilized a back-propagat ion neural network model to combine the popularity and reputatio n scores of the social applications and the preference and social relationship scores of the users to recommend social applicati ons. The training and testing data required for the training BPNN was gathered from the model building group.Strategy 2. All (SRs + Ps + PRs) + AHP: Although the artificial neural network has been proven as an effective method todeal with unknown weighting problems, it reveals little informat ion about the weights of the decision criteria. Therefore,for the purpose of comparison, we used the AHP method to infer users’ decision-making preference on social applications.In this strategy, the weights of PRs, Ps and SRs were also derived from the model building group.Strategy 3. All (SRs + Ps + PRs): Regression analysis is a popular tool used for investigatin g the relationship s between vari- ables, and its major use is for prediction or forecasting. To compare our results with statistics methodology , a simple lin- ear regression model was used to deal with the weights of these factors.Strategy 4. Ps + SRs: The strategy examined the effect of taking only personal subjective preference and social relation- ship information as the recommend ation criteria. Therefore, in this strategy, we set a = 0, b = 0.5 and c = 0.5.Strategy 5. SRs : The strategy only considered the influence of social relationships. In this study, we tried to test the impact of social similarity and social intimacy by setting a = 0, b = 0 and c = 1.Strategy 6. PRs : This strategy only considered the characteri stics of the social applications themselves, so a merged score of ‘‘Number of Users’’, ‘‘Number of Fans’’ and ‘‘Rating’’ was used. The strategy was implemented by setting a = 1, b = 0 and c = 0.Strategy 7. Pop : ‘‘Pop’’ is the abbreviati on for popularity, and is widely used in most of the recommend ation systems. For example, Facebook temporarily ranks their applications by the number of monthly active users. Thus, we selected ‘‘Pop’’as the basic recommendati on benchmark.
4.3. Experiment process
The experiment contains three stages. In the first two stages, the data required for model building was collected and the neural network was trained. In the third stage, the system-gener ated recommendati on lists from the different strategies were delivered to the evaluation group and the evaluation results were compare d. The detailed processes are described as follows.
Stage one (data collection ): In this stage, the popularity and reputation score (PRs), preference score (Ps) and social rela- tion score (SRs) were calculated to be the input of our neural network in the next stage. PRs consists of the number of users,number of fans and rating. The first two can be easily accessed since they are public information , but the last one required extra effort to collect in our experiment. Because our system utilized social networks and users’ relationship , the publicly available rating data of social applications was replaced by the ratings from the model building group users (35 users).The data required for computing Ps and SRs can be obtained by accessing personal profiles, so they can be calculated directly.
To gather the rating data of social applicati ons installed by the model building group members, a list with randomly se- lected applications was delivered to the model building group. Then the group was asked to rate the applications with a five-point ranking scale (‘‘Strongly willing to use’’, ‘‘Willing to use’’, ‘‘Ok to use’’, ‘‘Not willing to use’’, ‘‘Strongly not willing touse’’). The rating results were hidden from other participants to avoid any bias. To avoid problems caused by inaccurate data,the following steps are used. After the rating results were collected from individual users, their personal profiles were ac- cessed to check whether they really had installed the applicati ons with higher rating score. For example, if a user rated an application as ‘‘Strongly willing to use’’ but did not install this application at all, then this rating result was considered to be invalid. All the invalid data were filtered out to ensure the quality of our experiment. PRs, Ps and SRs were generated after all the data was inputted into analysis modules in Fig. 1, and these scores were used to train our BPNN in stage two.
Stage two (neural network training, AHP weighting and linear regression modelin g): The data collected was divided into training and test sets, where 20% was training data and 80% was testing data. It is customar y to arrange a BPNN into aninput layer, one or more hidden layers, and an output layer. The scores generated from the analysis modules in stage one were used in the input layer to train our neural networks in order to learn the users’ decision preferenc es on installing social applications . As for the hidden layers, it is known that a back-propagat ion neural network with one or more hidden layers can form arbitrary decision boundari es if sufficient neurons are used in the hidden layers [12]. By trying iteratively we found that a network with two hidden layers outperformed one with only one hidden layer. Under the two hidden layer networks,we tested (PEs1, PEs2) for pairs of (10, 5), (20, 10), (30, 15), (40, 20), (30, 20) and (15, 5) where PEs1 stands for the processing elements in the first hidden layer and PEs2 represents the second. Finally, we discovered that (15, 5) had the lowest mean squared error for both testing data and cross-validation testing data. Finally, the recommendati on scores RAs were generated in the output layer, and we could then construct recommend ation applicati ons based on the output.
AHP is one of the best-known methods to treat multi-criteria decision- making (MCDM) problems [49]. It uses mathemat- ical pair-wise comparis on and determines the relative importance or weight of criteria to support decision making, and this method has been applied in many research fields [24,37,58]. In this paper, we manipulate d an AHP method to infer the weights of PRs, Ps and SRs based on the data collected in stage one. First, a decision matrix including the weight of each cri- terion for each alternative was constructed. Second, normalization was applied to eliminate the dimensional effect of multi- ple attributes in an alternative. Third, historical data of the usage of social applicati ons was used to construct the initial value

Table 3Weights of PRs, Ps and SRs developed by AHP.
Weight of PRs (a) Weight of Ps(b) Weight of SRs (c)
0.318 0.329 0.353
26 Y.-M. Li et al. / Information Sciences 239 (2013) 18–30
of the preference weights, instead of requiring experts or users to personally define their preferenc e weights of the criteria inthe pair-wise comparison matrix. The resulting weights are presente d in Table 3.
In our experime nt, we found that social relationship has a relatively high weight. This might imply that when choosing between various applications, the fact that an application is being used by close friends is considered to be much more important than other factors.
Besides the neural network and AHP approaches, we also included a linear regression model to be one of recommend ation strategies for the purpose of evaluation. So the required linear model was also built based on the data collected in stage one.Linear regressio n attempts to model the relationship between two variables by fitting a linear equation to the observed data.One variable is considered to be an explanatory variable, and the other is considered to be a dependent variable. A general linear regression model can be formulated as:
Y ¼ aiXi þ b; i ¼ 1;2; . . . ; n; ð14Þ
where X is the explanatory variable and a is the weight of X, and b is a constant. Since linear least squares regressio n is by far the most widely used modeling method, in this research it was used to construct our linear regressio n model. Our model used in strategy 3 was formulated as:
RAsðui; akÞ ¼ aPRNs ðakÞ þ bPN
s ðui; akÞ þ cSRNs ðui; akÞ þ b: ð15Þ
By applying the data collected in stage one, our regression model was formulated as:
RAsðui; akÞ ¼ 0:316 � PRNs ðakÞ þ 0:295 � PN
s ðui; akÞ þ 0:386 � SRNs ðui; akÞ þ 0:071: ð16Þ
After all the tasks were complete d, BPNN, AHP and linear regression models were built and used for recommend ing social applications to the model evaluation group.
Stage three (model evaluation ): When performing an Internet search, users usually access the first two pages, with 10results in each page [23]. Taking this characterist ic of user behavior into consideration, in our experiment we tried to keep the number of social applications contained in a recommend ation list as close to 20 as possible. In this stage, a recomme n-dation list was generate d by our system based on the seven strategies described previousl y. The first three applications with the highest recommendati on score in each strategy were selected, and they were randomly ordered into a recommend ation
Fig. 5. Average rating results of recommendation strategies.
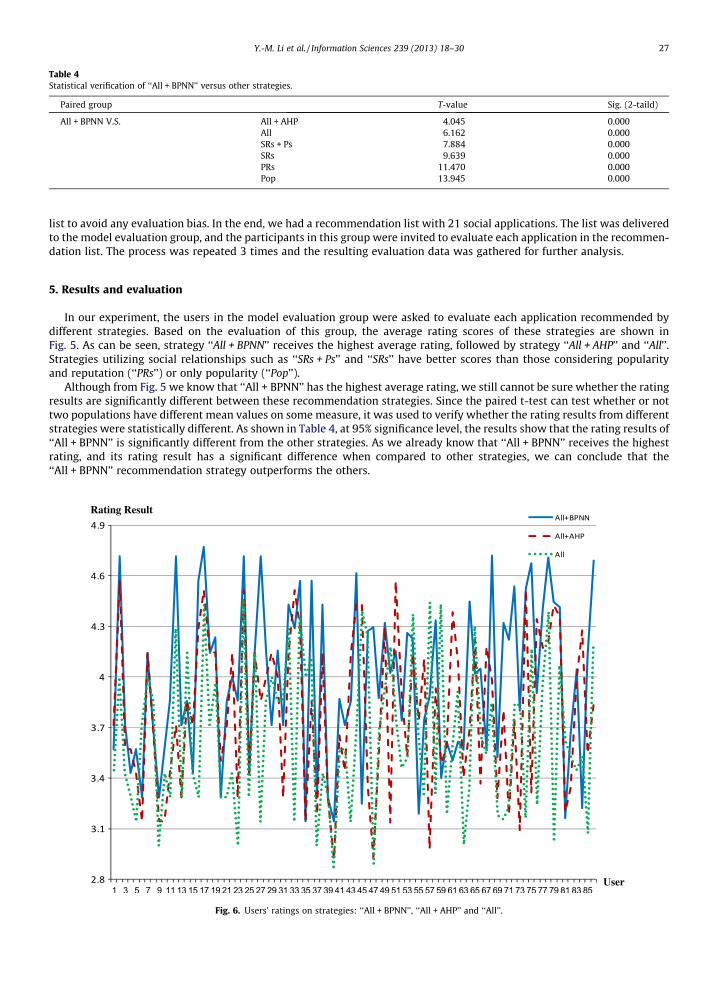
Table 4Statistical verification of ‘‘All + BPNN’’ versus other strategies.
Paired group T-value Sig. (2-taild)
All + BPNN V.S. All + AHP 4.045 0.000 All 6.162 0.000 SRs + Ps 7.884 0.000 SRs 9.639 0.000 PRs 11.470 0.000 Pop 13.945 0.000
Y.-M. Li et al. / Information Sciences 239 (2013) 18–30 27
list to avoid any evaluation bias. In the end, we had a recommendati on list with 21 social applications . The list was delivered to the model evaluation group, and the participants in this group were invited to evaluate each application in the recommen- dation list. The process was repeated 3 times and the resulting evaluation data was gathered for further analysis.
5. Results and evaluation
In our experime nt, the users in the model evaluation group were asked to evaluate each application recomme nded bydifferent strategies. Based on the evaluation of this group, the average rating scores of these strategies are shown inFig. 5. As can be seen, strategy ‘‘All + BPNN ’’ receives the highest average rating, followed by strategy ‘‘All + AHP ’’ and ‘‘All’’.Strategies utilizing social relationships such as ‘‘SRs + Ps’’ and ‘‘SRs’’ have better scores than those consideri ng popularit yand reputation (‘‘PRs’’) or only popularit y (‘‘Pop’’).
Although from Fig. 5 we know that ‘‘All + BPNN’’ has the highest average rating, we still cannot be sure whether the rating results are significantly different between these recommend ation strategies. Since the paired t-test can test whether or not two populations have different mean values on some measure, it was used to verify whether the rating results from different strategies were statistically different. As shown in Table 4, at 95% significance level, the results show that the rating results of‘‘All + BPNN’’ is significantly different from the other strategies. As we already know that ‘‘All + BPNN’’ receives the highest rating, and its rating result has a significant difference when compared to other strategies, we can conclude that the ‘‘All + BPNN’’ recommendati on strategy outperform s the others.
Rating Result
User
Fig. 6. Users’ ratings on strategies: ‘‘All + BPNN’’, ‘‘All + AHP’’ and ‘‘All’’.

28 Y.-M. Li et al. / Information Sciences 239 (2013) 18–30
In our experiment, a weighting mechanism was incorporate d in the ‘‘All + BPNN’’, ‘‘All + AHP’’, and ‘‘All’’ strategies. The first recommendati on strategy utilized BPNN, while the second one used AHP and the last one used a linear regression model to generate the weights of SRs, Ps and PRs. So we further analyzed the influence of the weighting mechanism. Detailed rating data of these three strategies collected from the model evaluation group is provided in Fig. 6.
As we can see from Fig. 6, most of the time both ‘‘All + BPNN’’ and ‘‘All + AHP’’ outperform ‘‘All’’. It suggests that these two recommend ation strategie s can better capture users’ decision preferences and concerns, and a simple linear regression mod- el does not capture the diversity of human decision-ma king in our experime nt. Furthermore, by comparing ‘‘All + BPNN’’with ‘‘All + AHP’’, we observe that BPNN generally does a better job in dealing with weighting than AHP. This indicates that in our experime nt, BPNN can better model the decision patterns of choosing social applications than the other models used.
6. Conclusion
With the prosperity of social networking websites, more people have been using social applications and have become in- volved in developing them. This tremendous growth in social applications leads to some issues. However, for users, it is not easy to discover items attractive from the numerous social applications . For practitioners , no good channels are available toextensively promote applications to potential users. As little systemati c research has been carried out to study the field ofrecommend ing social applications , in this paper, we proposed a social application recommend ation system that considers the factors in the aspects of social applications (such as popularity and reputation), users’ preferences and the social relation- ships between users. According to the experiments conducted in Facebook, we justify that the proposed mechanism outper- forms other benchmark methods .
The experime ntal results verify several interesting findings. First, it has been shown that during the decision-making pro- cess, users consider that popularity and reputation informat ion are much more important than popularity alone. Second, so- cial relationship is justified as being more important than popularity and reputation, and social network based recommend ation strategies perform better. When users make decisions, they regard the potential of a specific social appli- cation to create or maintain their social relationship s as an important factor. Third, it is more appropriate to use a BPNN model to extract users’ decision criteria weights than to use AHP. This implies that simply applying a linear model to rec- ommend social applicati ons is not enough, and any individual factor mentioned in our research may not dominate the deci- sion of choosing social applications . The results reveal several useful implications for users and practitioners. For users, when searching social applicati ons for some purpose, it may be an easy and quick way to see whether their close friends have in- stalled an application which will meet their requiremen ts. For practitioners , promoting social applications through the friend networks may be a feasible approach . Practitioner s can select users who have installed their products and are well-con- nected to others to be a celebrity endorser. By utilizing their social relations, a social application would have a better chance to be installed , instead of just being published and waiting to be searched.
Nevertheles s, there are some limitations in our research. The methodology of calculating a user’s preference weights isrestricted to one category per application due to the limitation of the experime ntal platform. It is notewort hy that the cat- egory design might be different among service platforms. It would be more effective if the social network platform used mul- tiple categories to tag each application. Moreover, in practice, due to time restrictio ns, there is little possibility for every target user to try every single category. Thus, to deal with the problem of an empty preference weight for a specific category,a transmitti ng method might be suggested. In spite of depending on the service platform’s pre-defined categories alone, itwould be more accurate if the ontology is constructed to describe social applications or service attributes.
Several factors could improve the research. First, to further analyze a social applicati on’s reputation, review mining should be undertak en so that users’ comments can be identified. The research would also be more complete and powerful if popularit y, reputation and review mining were combined. Also, in order to recommend social applicati ons with high qual- ities, a QoS investiga tion and generalizati on might be required. Second, to enforce the ability to model users’ interests and tastes, we need to collect and analyze more personal informat ion to enrich the user profile, such as identifying the cyber communitie s that users join, and the subjects in which they are most interested. Finally, in addition to studying one layer of interactio n between two people, an analysis of the user’s social relationship s might be effectively expanded to the user’s communitie s to extend the influence of the network structure and to consider interactio ns with other peers.
Acknowled gement
This research was supported by the National Science Council of Taiwan (Republic of China) under Grant NSC 97-2410-H- 009-035-MY2.
References
[1] A. Abdul-Rahman, S. Hailes, Supporting trust in virtual communities, in: R.H. Sprague (Ed.), Proceedings of the 33rd Annual Hawaii International Conference on System Sciences, IEEE, Maui, Hawaii, USA, 2000, pp. 1–9.
[2] A. Acquisti, R. Gross, Imagined communities: awareness, information sharing, and privacy on the Facebook, Lecture Notes in Computer Science 4258 (2006) 36–58.
[3] Adonomics, Adonomics Facebook Analytics and Developer Services. <http://www.adonomics.com> (accessed 17.10.09).

Y.-M. Li et al. / Information Sciences 239 (2013) 18–30 29
[4] N. Ahmadi, M. Jazayeri, F. Lelli, S. Nesic, A survey of social software engineering, in: Proceedings of the 23rd IEEE/ACM International Conference onAutomated Software Engineering, IEEE, L’Aquila, Italy, 2008, pp. 1–12.
[5] Y. Ahn, S. Han, H. Kwak, S. Moon, H. Jeong, Analysis of topological characteristics of huge online social networking services, in: Proceedings of the 16th International Conference on World Wide Web, ACM, Banff, Alberta, Canada, 2007, pp. 835–844.
[6] Alexa.com, The top sites on the web. <http://www.alexa.com/topsites> (accessed 18.09.11).[7] M. Balabanovi, Y. Shoham, Fab: content-based, collaborative recommendation, Communications of the ACM 40 (1997) 66–72.[8] P. Bedi, H. Kaur, S. Marwaha, Trust based recommender system for semantic web, in: Proceedings of the 2007 International Joint Conferences on
Artificial Intelligence, IJCAI, Hyderabad, India, 2007, pp. 2677–2682.[9] J. Breese, D. Heckerman, C. Kadie, Empirical analysis of predictive algorithms for collaborative filtering, in: Proceedings of the 14th Conference on
Uncertainty in Artificial Intelligence, Madison, San Francisco, CA, USA, 1998, pp. 43–52.[10] J. Canny, Collaborative filtering with privacy via factor analysis, in: Proceedings of the 25th Annual International ACM SIGIR Conference on Research
and Development in Information Retrieval, ACM, New York, NY, USA, Tampere, Finland, 2002, pp. 238–245.[11] M. Cha, H. Kwak, P. Rodriguez, Y. Ahn, S. Moon, I tube, you tube, everybody tubes: analyzing the world’s largest user generated content video system,
in: Proceedings of the 7th ACM SIGCOMM Conference on Internet Measurement, ACM, San Diego, CA, USA, 2007, pp. 1–14.[12] D. Chester, Why two hidden layers are better than one, in: Proceedings of the 1990 International Joint Conference on Neural Networks, Washington,
DC, 1990, pp. 1265–1268.[13] P. De Meo, A. Nocera, G. Terracina, D. Ursino, Recommendation of similar users, resources and social networks in a social internetworking scenario,
Information Sciences 181 (2010) 1285–1305.[14] M. Deshpande, G. Karypis, Item-based top-n recommendation algorithms, ACM Transactions on Information Systems 22 (2004) 143–177.[15] C. Dwyer, S. Hiltz, Designing privacy into online communities, in: Proceedings of the 9th Annual Internet Research Conference, Association of Internet
Researchers, Copenhagen, Denmark, 2008, pp. 1–8.[16] Facebook, Facebook Statistics. <http://www.facebook.com/press/info.php?sta tistics > (accessed 17.10.09).[17] F. Fu, L. Liu, L. Wang, Empirical analysis of online social networks in the age of Web 2.0, Physica A: Statistical Mechanics and its Applications 387 (2007)
675–684.[18] M. Gjoka, M. Sirivianos, A. Markopoulou, X. Yang, Poking facebook: characterization of osn applications, in: Proceedings of the 1st Workshop on Online
Social Networks, ACM, Seattle, WA, USA, 2008, pp. 31–36.[19] J. Golbeck, J. Hendler, FilmTrust: movie recommendations using trust in web-based social networks, in: Proceedings of the 3rd IEEE Consumer
Communications and Networking Conference, IEEE, Las Vegas, Nevada, USA, 2006, pp. 282–286.[20] W. Hill, L. Stead, M. Rosenstein, G. Furnas, Recommending and evaluating choices in a virtual community of use, in: Proceedings of the SIGCHI
Conference on Human Factors in Computing Systems, ACM, Denver, Colorado, USA, 1995, pp. 194–201.[21] T. Hofmann, Latent semantic models for collaborative filtering, ACM Transactions on Information Systems 22 (2004) 89–115.[22] P. Holme, C. Edling, F. Liljeros, Structure and time evolution of an Internet dating community, Social Networks 26 (2004) 155–174.[23] C. Holscher, G. Strube, Web search behavior of Internet experts and newbies, Computer Networks 33 (2000) 337–346.[24] Y. Huang, L. Bian, A Bayesian network and analytic hierarchy process based personalized recommendations for tourist attractions over the Internet,
Expert Systems with Applications 36 (2009) 933–943.[25] B. Jeong, J. Lee, H. Cho, Improving memory-based collaborative filtering via similarity updating and prediction modulation, Information Sciences 180
(2010) 602–612.[26] I. King, M. Lyu, H. Ma, Introduction to social recommendation, in: Proceedings of the 19th International Conference on World Wide Web, ACM, Raleigh,
North Carolina, USA, 2010, pp. 1355–1356.[27] C. Kiss, M. Bichler, Identification of influencers – measuring influence in customer networks, Decision Support Systems 46 (2008) 233–253.[28] G. Kossinets, Effects of missing data in social networks, Social Networks 28 (2006) 247–268.[29] R. Kwai, P. Fun, C. Wagner, Weblogging: a study of social computing and its impact on organizations, Decision Support Systems 45 (2008) 242–250.[30] S. Lee, P. Kim, H. Jeong, Statistical properties of sampled networks, Physical Review E 73 (2006) 0161021–0161027.[31] S.K. Lee, Y.H. Cho, S.H. Kim, Collaborative filtering with ordinal scale-based implicit ratings for mobile music recommendations, Information Sciences
180 (2010) 2142–2155.[32] K. Lewis, J. Kaufman, M. Gonzalez, A. Wimmer, N. Christakis, Tastes, ties, and time: A new social network dataset using Facebook. com, Social Networks
30 (2008) 330–342.[33] Q. Li, J. Wang, Y.P. Chen, Z. Lin, User comments for news recommendation in forum-based social media, Information Sciences 180 (2010) 4929–4939.[34] Y. Li, C. Chen, A synthetical approach for blog recommendation: combining trust, social relation, and semantic analysis, Expert Systems with
Applications 36 (2009) 6536–6547.[35] Y. Li, L. Lu, L. Xuefeng, A hybrid collaborative filtering method for multiple-interests and multiple-content recommendation in e-commerce, Expert
Systems with Applications 28 (2005) 67–77.[36] G. Linden, B. Smith, J. York, Amazon.com recommendations: item-to-item collaborative filtering, IEEE Internet Computing (2003) 76–80.[37] D. Liu, Y. Shih, Integrating AHP and data mining for product recommendation based on customer lifetime value, Information & Management 42 (2005)
387–400.[38] P. Massa, P. Avesani, Trust-aware recommender systems, in: Proceedings of the 2007 ACM Conference on Recommender Systems, ACM, Minneapolis,
Minnesota, USA, 2007, pp. 17–24.[39] A. Mislove, M. Marcon, K. Gummadi, P. Druschel, B. Bhattacharjee, Measurement and analysis of online social networks, in: Proceedings of the 7th ACM
SIGCOMM Conference on Internet Measurement, ACM, San Diego, CA, USA, 2007, pp. 29–42.[40] J. Morales-del-Castillo, E. Peis, A.A. Ruiz, E. HerreraViedma, Recommending biomedical resources: a fuzzy linguistic approach based on semantic web,
International Journal of Intelligent Systems 25 (2010) 1143–1157.[41] K. Musia, P. Kazienko, T. Kajdanowicz, Social recommendations within the multimedia sharing systems, Lecture Notes in Computer Science 5288
(2008) 364–372.[42] A. Nazir, S. Raza, C. Chuah, Unveiling facebook: a measurement study of social network based applications, in: Proceedings of the 8th ACM SIGCOMM
Conference on Internet Measurement, ACM, Vouliagmeni, Greece, 2008, pp. 43–56.[43] Y. Ni, L. Xie, Z.Q. Liu, Minimizing the expected complete influence time of a social network, Information Sciences 180 (2010) 2514–2527.[44] J. O’Donovan, B. Smyth, Trust in recommender systems, in: Proceedings of the 10th International Conference on Intelligent User Interfaces, ACM, San
Diego, CA, USA, 2005, pp. 167–174.[45] M. Pazzani, J. Muramatsu, D. Billsus, Syskill & Webert: identifying interesting web sites, in: Proceedings of the 13th National Conference on Artificial
Intelligence, Portland, OR, USA, 1996, pp. 54–61.[46] C. Porcel, E. Herrera-Viedma, Dealing with incomplete information in a fuzzy linguistic recommender system to disseminate information in university
digital libraries, Knowledge-Based Systems 23 (2010) 32–39.[47] C. Porcel, A. Tejeda-Lorente, M. Martı́nez, E. Herrera-Viedma, A hybrid recommender system for the selective dissemination of research resources in a
technology transfer office, Information Sciences 184 (2012) 1–19.[48] P. Resnick, N. Iacovou, M. Suchak, P. Bergstrom, J. Riedl, GroupLens: an open architecture for collaborative filtering of netnews, in: Proceedings of the
1994 ACM Conference on Computer Supported Cooperative Work, ACM, Chapel Hill, North Carolina, USA, 1994, pp. 175–186.[49] T. Saaty, Decision Making with Dependence and Feedback: The Analytic Network Process, RWS Publications, Pittsburgh, PA, USA, 1996.[50] J. Serrano-Guerrero, E. Herrera-Viedma, J.A. Olivas, A. Cerezo, F.P. Romero, A google wave-based fuzzy recommender system to disseminate
information in University Digital Libraries 2.0, Information Sciences 181 (2011) 1503–1516.

30 Y.-M. Li et al. / Information Sciences 239 (2013) 18–30
[51] P. Singla, M. Richardson, Yes, there is a correlation: from social networks to personal behavior on the web, in: 17th International Conference on World Wide Web, ACM, Beijing, China, 2008, pp. 655–664.
[52] R. Sinha, K. Swearingen, Comparing recommendations made by online systems and friends, in: Proceedings of the Joint DELOS-NSF Workshop onPersonalisation and Recommender Systems in Digital Libraries, ACM, Dublin, Ireland, 2001, pp. 73–78.
[53] M. Song, W. van der Aalst, Towards comprehensive support for organizational mining, Decision Support Systems 46 (2008) 300–317.[54] W. Song, V. Phoha, X. Xu, An adaptive recommendation trust model in multiagent system, in: Proceedings of the 2004 IEEE/WIC/ACM International
Conference on Intelligent Agent Technology, IEEE, Beijing, China, 2004, pp. 462–465.[55] H. Stevens, C. Pettey, Gartner Says Companies Need to Pursue Four Steps to Harness Social Computing in CRM. <http://www.gartner.com/it/
page.jsp?id=889712> (accessed 30.08.10).[56] D. Wu, Z. Yang, L. Liang, Using DEA-neural network approach to evaluate branch efficiency of a large Canadian bank, Expert Systems with Applications
31 (2006) 108–115.[57] G. Xue, C. Lin, Q. Yang, W. Xi, H. Zeng, Y. Yu, Z. Chen, Scalable collaborative filtering using cluster-based smoothing, in: Proceedings of the 28th Annual
International ACM SIGIR Conference on Research and Development in Information Retrieval, ACM, Salvador, Brazil, 2005, pp. 114–121.[58] H. Yim, H. Ahn, J. Kim, S. Park, Agent-based adaptive travel planning system in peak seasons, Expert Systems with Applications 27 (2004) 211–222.[59] C.N. Ziegler, J. Golbeck, Investigating interactions of trust and interest similarity, Decision Support Systems 43 (2007) 460–475.
Copyright © 2022 FDOKUMEN